River Park, FL Map & Demographics
River Park Map
River Park Overview
$26,002
PER CAPITA INCOME
$58,311
AVG FAMILY INCOME
$49,514
AVG HOUSEHOLD INCOME
18.5%
WAGE / INCOME GAP [ % ]
81.5¢/ $1
WAGE / INCOME GAP [ $ ]
0.41
INEQUALITY / GINI INDEX
6,186
TOTAL POPULATION
3,105
MALE POPULATION
3,081
FEMALE POPULATION
100.78
MALES / 100 FEMALES
99.23
FEMALES / 100 MALES
45.4
MEDIAN AGE
3.2
AVG FAMILY SIZE
2.5
AVG HOUSEHOLD SIZE
2,854
LABOR FORCE [ PEOPLE ]
56.6%
PERCENT IN LABOR FORCE
8.3%
UNEMPLOYMENT RATE
Income in River Park
Income Overview in River Park
Per Capita Income in River Park is $26,002, while median incomes of families and households are $58,311 and $49,514 respectively.
| Characteristic | Number | Measure |
| Per Capita Income | 6,186 | $26,002 |
| Median Family Income | 1,429 | $58,311 |
| Mean Family Income | 1,429 | $71,148 |
| Median Household Income | 2,455 | $49,514 |
| Mean Household Income | 2,455 | $62,959 |
| Income Deficit | 1,429 | $0 |
| Wage / Income Gap (%) | 6,186 | 18.47% |
| Wage / Income Gap ($) | 6,186 | 81.53¢ per $1 |
| Gini / Inequality Index | 6,186 | 0.41 |
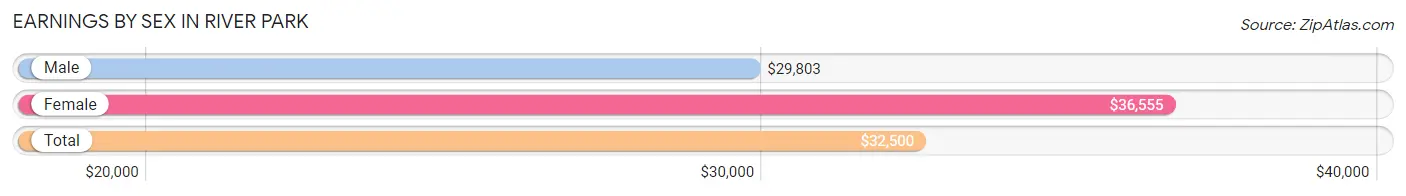
Earnings by Sex in River Park
Average Earnings in River Park are $32,500, $29,803 for men and $36,555 for women, a difference of 18.5%.
| Sex | Number | Average Earnings |
| Male | 1,613 (57.3%) | $29,803 |
| Female | 1,203 (42.7%) | $36,555 |
| Total | 2,816 (100.0%) | $32,500 |
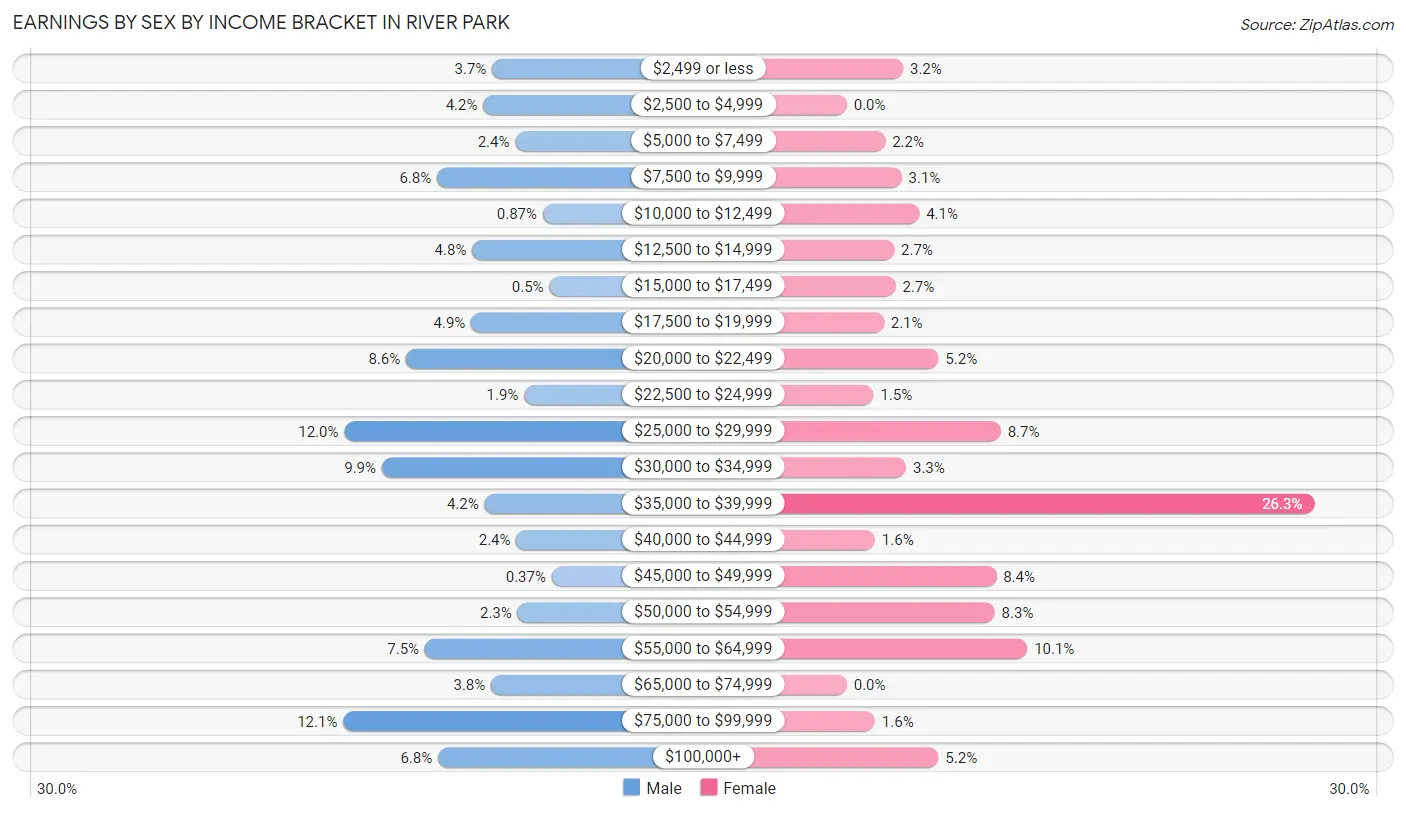
Earnings by Sex by Income Bracket in River Park
The most common earnings brackets in River Park are $75,000 to $99,999 for men (195 | 12.1%) and $35,000 to $39,999 for women (316 | 26.3%).
| Income | Male | Female |
| $2,499 or less | 60 (3.7%) | 38 (3.2%) |
| $2,500 to $4,999 | 68 (4.2%) | 0 (0.0%) |
| $5,000 to $7,499 | 39 (2.4%) | 26 (2.2%) |
| $7,500 to $9,999 | 110 (6.8%) | 37 (3.1%) |
| $10,000 to $12,499 | 14 (0.9%) | 49 (4.1%) |
| $12,500 to $14,999 | 78 (4.8%) | 32 (2.7%) |
| $15,000 to $17,499 | 8 (0.5%) | 33 (2.7%) |
| $17,500 to $19,999 | 79 (4.9%) | 25 (2.1%) |
| $20,000 to $22,499 | 138 (8.6%) | 62 (5.1%) |
| $22,500 to $24,999 | 31 (1.9%) | 18 (1.5%) |
| $25,000 to $29,999 | 194 (12.0%) | 104 (8.6%) |
| $30,000 to $34,999 | 160 (9.9%) | 40 (3.3%) |
| $35,000 to $39,999 | 67 (4.2%) | 316 (26.3%) |
| $40,000 to $44,999 | 38 (2.4%) | 19 (1.6%) |
| $45,000 to $49,999 | 6 (0.4%) | 101 (8.4%) |
| $50,000 to $54,999 | 37 (2.3%) | 100 (8.3%) |
| $55,000 to $64,999 | 121 (7.5%) | 122 (10.1%) |
| $65,000 to $74,999 | 61 (3.8%) | 0 (0.0%) |
| $75,000 to $99,999 | 195 (12.1%) | 19 (1.6%) |
| $100,000+ | 109 (6.8%) | 62 (5.1%) |
| Total | 1,613 (100.0%) | 1,203 (100.0%) |
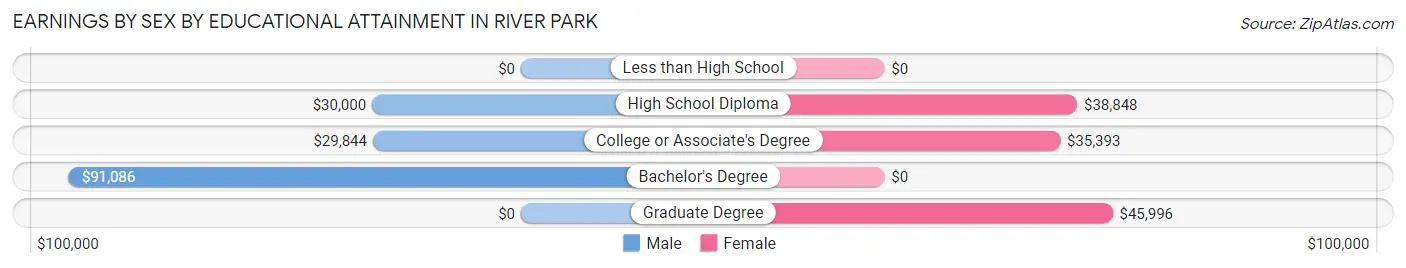
Earnings by Sex by Educational Attainment in River Park
Average earnings in River Park are $30,445 for men and $36,934 for women, a difference of 17.6%. Men with an educational attainment of bachelor's degree enjoy the highest average annual earnings of $91,086, while those with college or associate's degree education earn the least with $29,844. Women with an educational attainment of graduate degree earn the most with the average annual earnings of $45,996, while those with college or associate's degree education have the smallest earnings of $35,393.
| Educational Attainment | Male Income | Female Income |
| Less than High School | - | - |
| High School Diploma | $30,000 | $38,848 |
| College or Associate's Degree | $29,844 | $35,393 |
| Bachelor's Degree | $91,086 | $0 |
| Graduate Degree | - | - |
| Total | $30,445 | $36,934 |
Family Income in River Park
Family Income Brackets in River Park
According to the River Park family income data, there are 422 families falling into the $50,000 to $74,999 income range, which is the most common income bracket and makes up 29.5% of all families. Conversely, the $10,000 to $14,999 income bracket is the least frequent group with only 9 families (0.6%) belonging to this category.
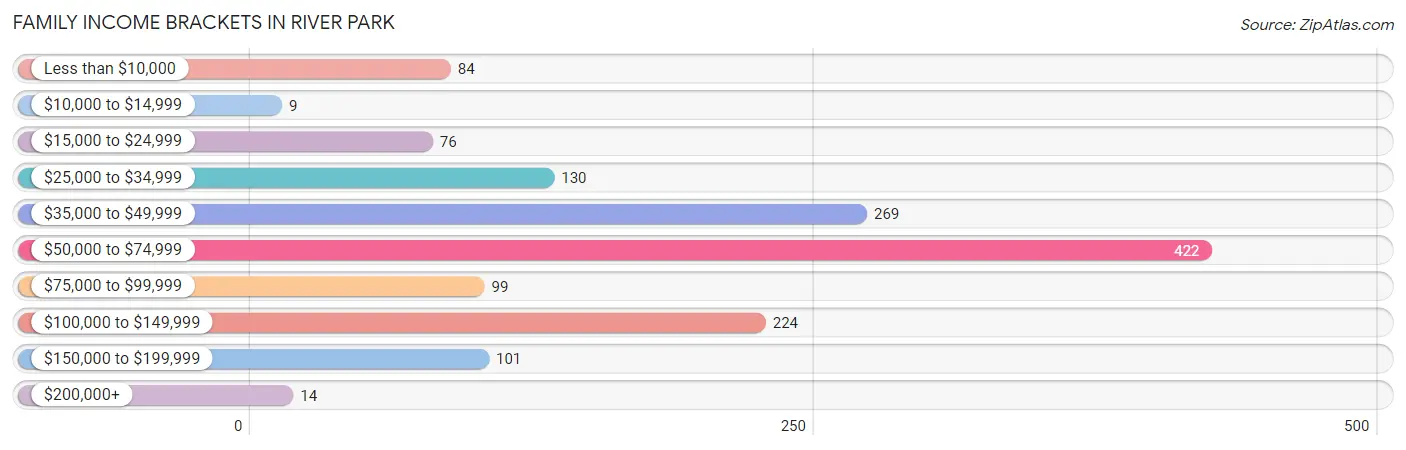
| Income Bracket | # Families | % Families |
| Less than $10,000 | 84 | 5.9% |
| $10,000 to $14,999 | 9 | 0.6% |
| $15,000 to $24,999 | 76 | 5.3% |
| $25,000 to $34,999 | 130 | 9.1% |
| $35,000 to $49,999 | 269 | 18.8% |
| $50,000 to $74,999 | 422 | 29.5% |
| $75,000 to $99,999 | 99 | 6.9% |
| $100,000 to $149,999 | 224 | 15.7% |
| $150,000 to $199,999 | 101 | 7.1% |
| $200,000+ | 14 | 1.0% |
Family Income by Famaliy Size in River Park
5-person families (71 | 5.0%) account for the highest median family income in River Park with $108,071 per family, while 2-person families (722 | 50.5%) have the highest median income of $28,233 per family member.
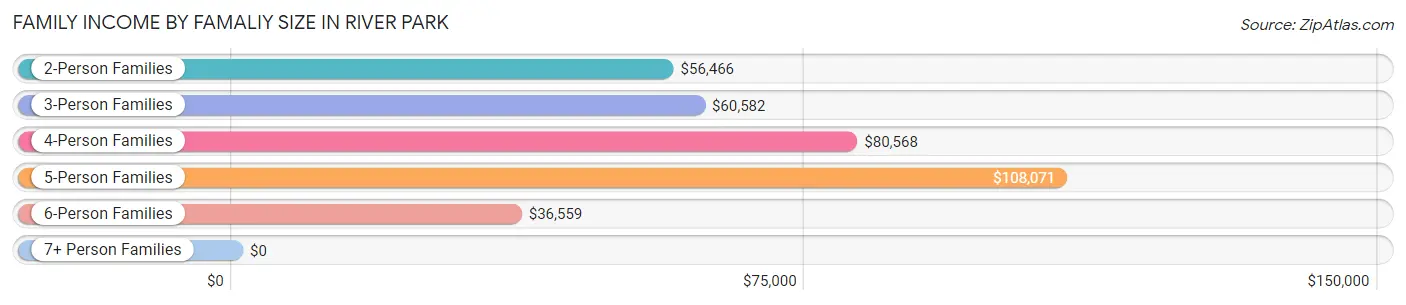
| Income Bracket | # Families | Median Income |
| 2-Person Families | 722 (50.5%) | $56,466 |
| 3-Person Families | 370 (25.9%) | $60,582 |
| 4-Person Families | 155 (10.8%) | $80,568 |
| 5-Person Families | 71 (5.0%) | $108,071 |
| 6-Person Families | 111 (7.8%) | $36,559 |
| 7+ Person Families | 0 (0.0%) | $0 |
| Total | 1,429 (100.0%) | $58,311 |
Family Income by Number of Earners in River Park
The median family income in River Park is $58,311, with families comprising 3+ earners (122) having the highest median family income of $108,641, while families with no earners (214) have the lowest median family income of $32,375, accounting for 8.5% and 15.0% of families, respectively.
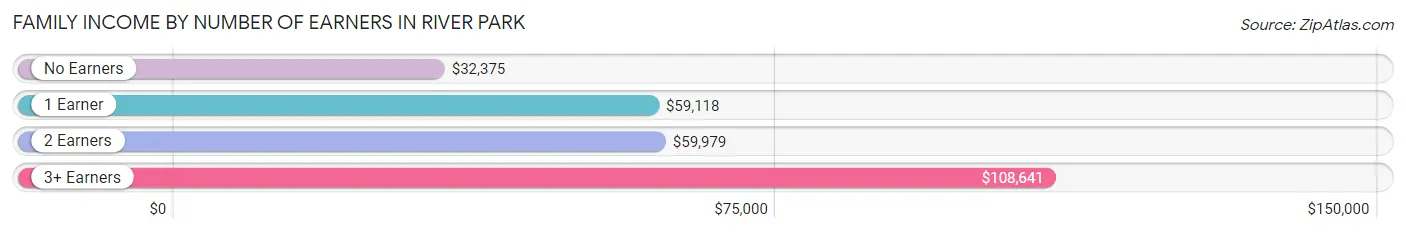
| Number of Earners | # Families | Median Income |
| No Earners | 214 (15.0%) | $32,375 |
| 1 Earner | 758 (53.0%) | $59,118 |
| 2 Earners | 335 (23.4%) | $59,979 |
| 3+ Earners | 122 (8.5%) | $108,641 |
| Total | 1,429 (100.0%) | $58,311 |
Household Income in River Park
Household Income Brackets in River Park
With 486 households falling in the category, the $35,000 to $49,999 income range is the most frequent in River Park, accounting for 19.8% of all households. In contrast, only 27 households (1.1%) fall into the $200,000+ income bracket, making it the least populous group.
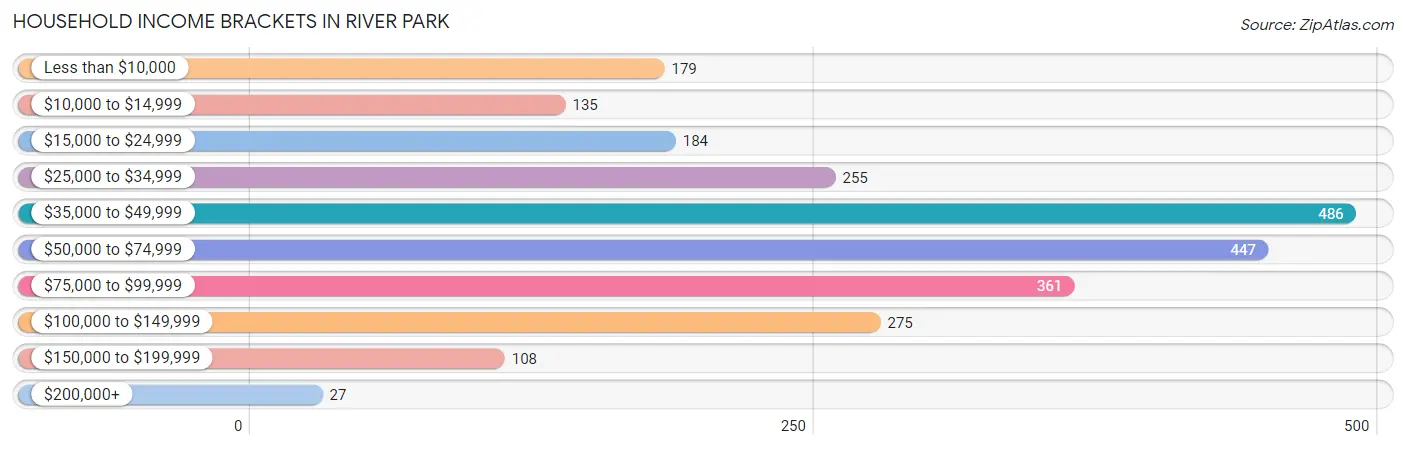
| Income Bracket | # Households | % Households |
| Less than $10,000 | 179 | 7.3% |
| $10,000 to $14,999 | 135 | 5.5% |
| $15,000 to $24,999 | 184 | 7.5% |
| $25,000 to $34,999 | 255 | 10.4% |
| $35,000 to $49,999 | 486 | 19.8% |
| $50,000 to $74,999 | 447 | 18.2% |
| $75,000 to $99,999 | 361 | 14.7% |
| $100,000 to $149,999 | 275 | 11.2% |
| $150,000 to $199,999 | 108 | 4.4% |
| $200,000+ | 27 | 1.1% |
Household Income by Householder Age in River Park
The median household income in River Park is $49,514, with the highest median household income of $63,966 found in the 25 to 44 years age bracket for the primary householder. A total of 538 households (21.9%) fall into this category. Meanwhile, the 15 to 24 years age bracket for the primary householder has the lowest median household income of $0, with 5 households (0.2%) in this group.
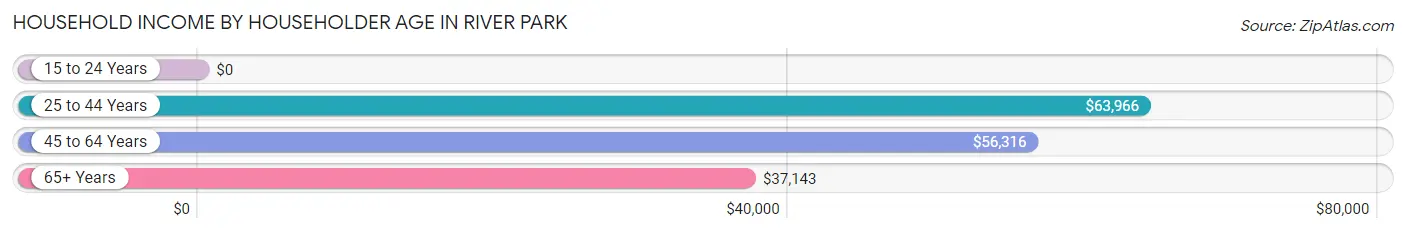
| Income Bracket | # Households | Median Income |
| 15 to 24 Years | 5 (0.2%) | $0 |
| 25 to 44 Years | 538 (21.9%) | $63,966 |
| 45 to 64 Years | 870 (35.4%) | $56,316 |
| 65+ Years | 1,042 (42.4%) | $37,143 |
| Total | 2,455 (100.0%) | $49,514 |
Poverty in River Park
Income Below Poverty by Sex and Age in River Park
With 13.5% poverty level for males and 30.6% for females among the residents of River Park, 35 to 44 year old males and 16 and 17 year old females are the most vulnerable to poverty, with 113 males (49.1%) and 84 females (89.4%) in their respective age groups living below the poverty level.
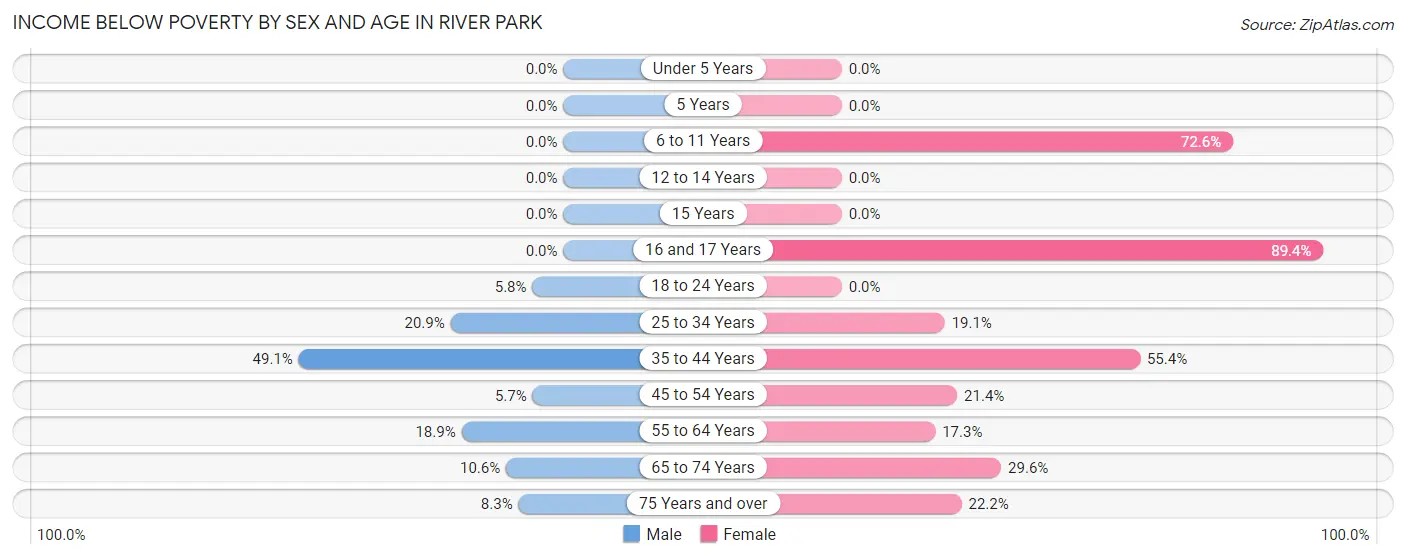
| Age Bracket | Male | Female |
| Under 5 Years | 0 (0.0%) | 0 (0.0%) |
| 5 Years | 0 (0.0%) | 0 (0.0%) |
| 6 to 11 Years | 0 (0.0%) | 297 (72.6%) |
| 12 to 14 Years | 0 (0.0%) | 0 (0.0%) |
| 15 Years | 0 (0.0%) | 0 (0.0%) |
| 16 and 17 Years | 0 (0.0%) | 84 (89.4%) |
| 18 to 24 Years | 10 (5.8%) | 0 (0.0%) |
| 25 to 34 Years | 133 (20.9%) | 76 (19.1%) |
| 35 to 44 Years | 113 (49.1%) | 119 (55.3%) |
| 45 to 54 Years | 23 (5.7%) | 67 (21.4%) |
| 55 to 64 Years | 73 (18.9%) | 121 (17.3%) |
| 65 to 74 Years | 49 (10.6%) | 105 (29.6%) |
| 75 Years and over | 18 (8.3%) | 62 (22.2%) |
| Total | 419 (13.5%) | 931 (30.6%) |
Income Above Poverty by Sex and Age in River Park
According to the poverty statistics in River Park, males aged under 5 years and females aged under 5 years are the age groups that are most secure financially, with 100.0% of males and 100.0% of females in these age groups living above the poverty line.
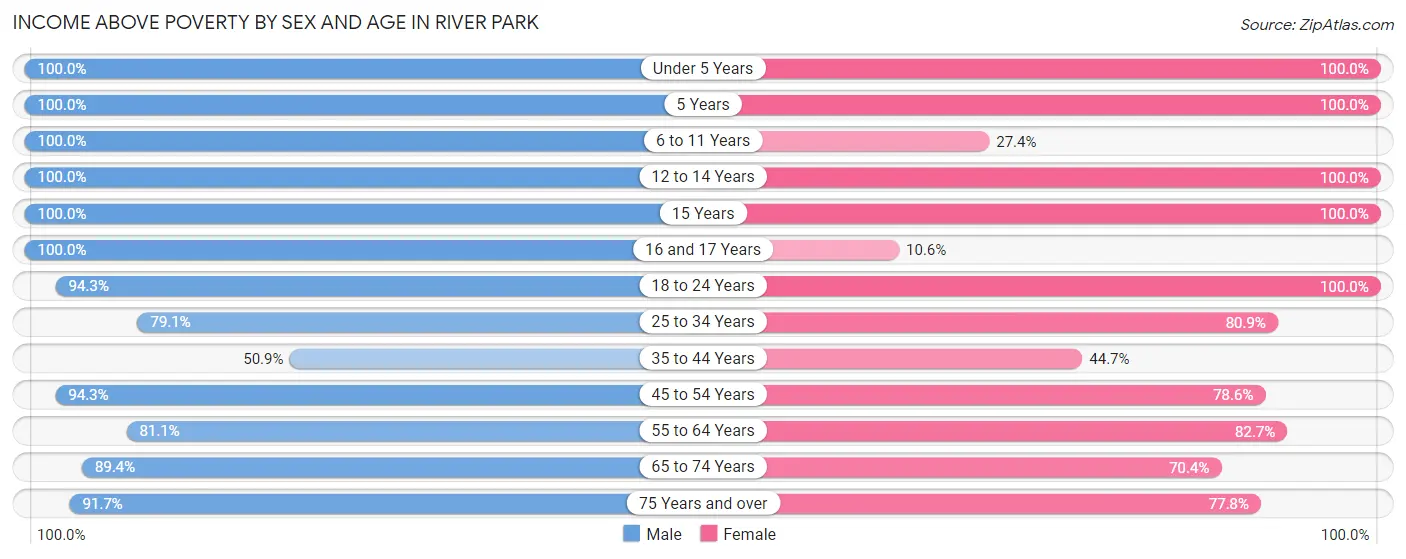
| Age Bracket | Male | Female |
| Under 5 Years | 318 (100.0%) | 55 (100.0%) |
| 5 Years | 7 (100.0%) | 19 (100.0%) |
| 6 to 11 Years | 142 (100.0%) | 112 (27.4%) |
| 12 to 14 Years | 62 (100.0%) | 69 (100.0%) |
| 15 Years | 25 (100.0%) | 38 (100.0%) |
| 16 and 17 Years | 47 (100.0%) | 10 (10.6%) |
| 18 to 24 Years | 164 (94.3%) | 99 (100.0%) |
| 25 to 34 Years | 502 (79.1%) | 322 (80.9%) |
| 35 to 44 Years | 117 (50.9%) | 96 (44.7%) |
| 45 to 54 Years | 379 (94.3%) | 246 (78.6%) |
| 55 to 64 Years | 313 (81.1%) | 577 (82.7%) |
| 65 to 74 Years | 412 (89.4%) | 250 (70.4%) |
| 75 Years and over | 198 (91.7%) | 217 (77.8%) |
| Total | 2,686 (86.5%) | 2,110 (69.4%) |
Income Below Poverty Among Married-Couple Families in River Park
The poverty statistics for married-couple families in River Park show that 18.7% or 163 of the total 873 families live below the poverty line. Families with 3 or 4 children have the highest poverty rate of 90.8%, comprising of 89 families. On the other hand, families with no children have the lowest poverty rate of 5.6%, which includes 32 families.
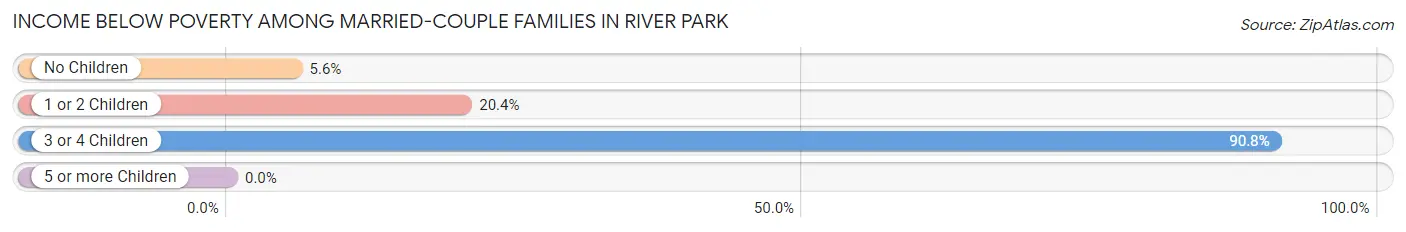
| Children | Above Poverty | Below Poverty |
| No Children | 537 (94.4%) | 32 (5.6%) |
| 1 or 2 Children | 164 (79.6%) | 42 (20.4%) |
| 3 or 4 Children | 9 (9.2%) | 89 (90.8%) |
| 5 or more Children | 0 (0.0%) | 0 (0.0%) |
| Total | 710 (81.3%) | 163 (18.7%) |
Income Below Poverty Among Single-Parent Households in River Park
According to the poverty data in River Park, 4.8% or 12 single-father households and 20.3% or 62 single-mother households are living below the poverty line. Among single-father households, those with no children have the highest poverty rate, with 12 households (13.0%) experiencing poverty. Likewise, among single-mother households, those with no children have the highest poverty rate, with 42 households (26.3%) falling below the poverty line.
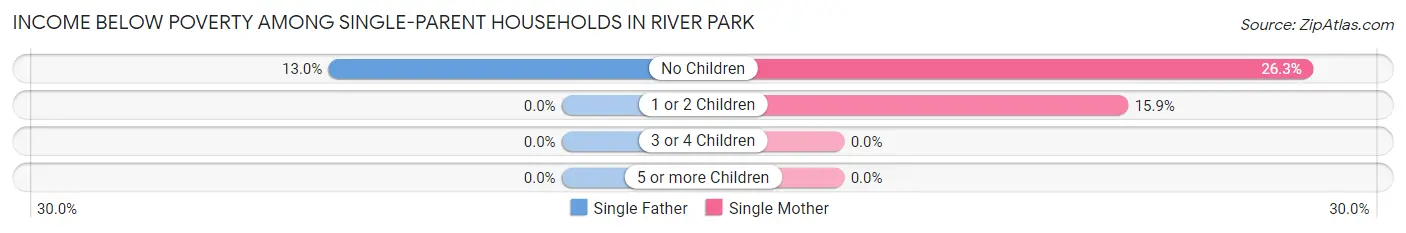
| Children | Single Father | Single Mother |
| No Children | 12 (13.0%) | 42 (26.3%) |
| 1 or 2 Children | 0 (0.0%) | 20 (15.9%) |
| 3 or 4 Children | 0 (0.0%) | 0 (0.0%) |
| 5 or more Children | 0 (0.0%) | 0 (0.0%) |
| Total | 12 (4.8%) | 62 (20.3%) |
Income Below Poverty Among Married-Couple vs Single-Parent Households in River Park
The poverty data for River Park shows that 163 of the married-couple family households (18.7%) and 74 of the single-parent households (13.3%) are living below the poverty level. Within the married-couple family households, those with 3 or 4 children have the highest poverty rate, with 89 households (90.8%) falling below the poverty line. Among the single-parent households, those with no children have the highest poverty rate, with 54 household (21.4%) living below poverty.
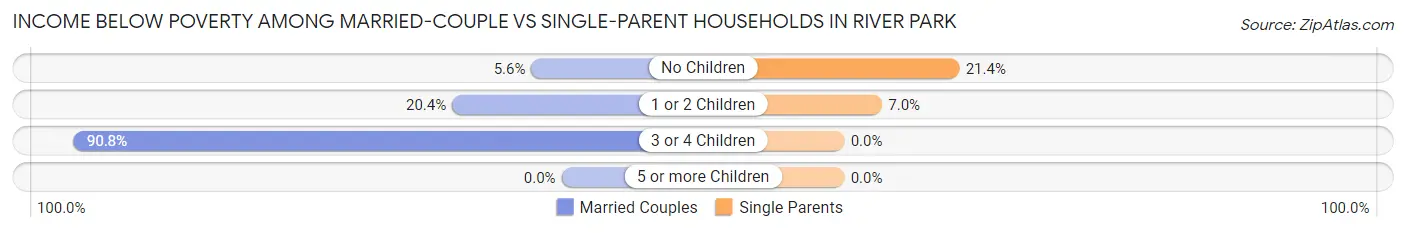
| Children | Married-Couple Families | Single-Parent Households |
| No Children | 32 (5.6%) | 54 (21.4%) |
| 1 or 2 Children | 42 (20.4%) | 20 (7.0%) |
| 3 or 4 Children | 89 (90.8%) | 0 (0.0%) |
| 5 or more Children | 0 (0.0%) | 0 (0.0%) |
| Total | 163 (18.7%) | 74 (13.3%) |
Race in River Park
The most populous races in River Park are White / Caucasian (4,617 | 74.6%), Hispanic or Latino (1,934 | 31.3%), and Two or more Races (770 | 12.4%).
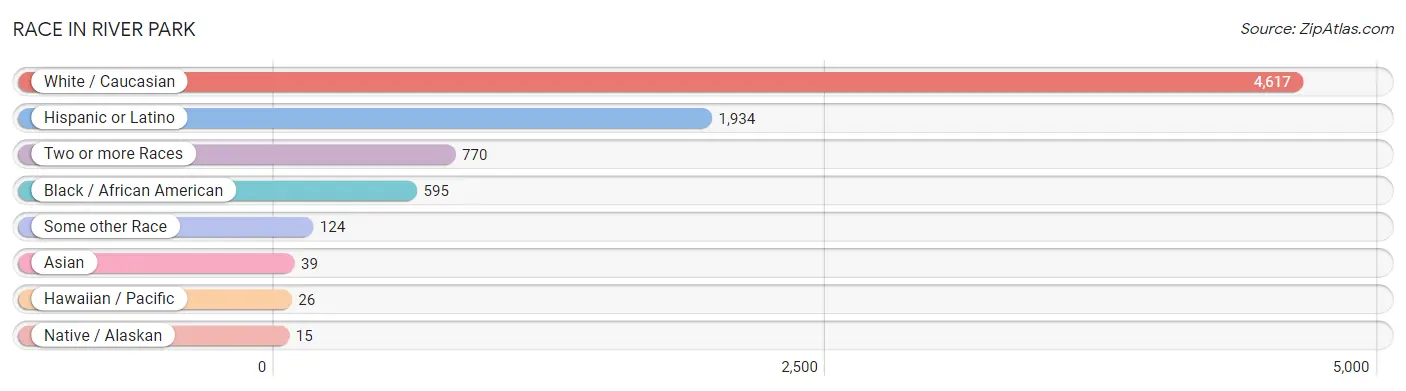
| Race | # Population | % Population |
| Asian | 39 | 0.6% |
| Black / African American | 595 | 9.6% |
| Hawaiian / Pacific | 26 | 0.4% |
| Hispanic or Latino | 1,934 | 31.3% |
| Native / Alaskan | 15 | 0.2% |
| White / Caucasian | 4,617 | 74.6% |
| Two or more Races | 770 | 12.4% |
| Some other Race | 124 | 2.0% |
| Total | 6,186 | 100.0% |
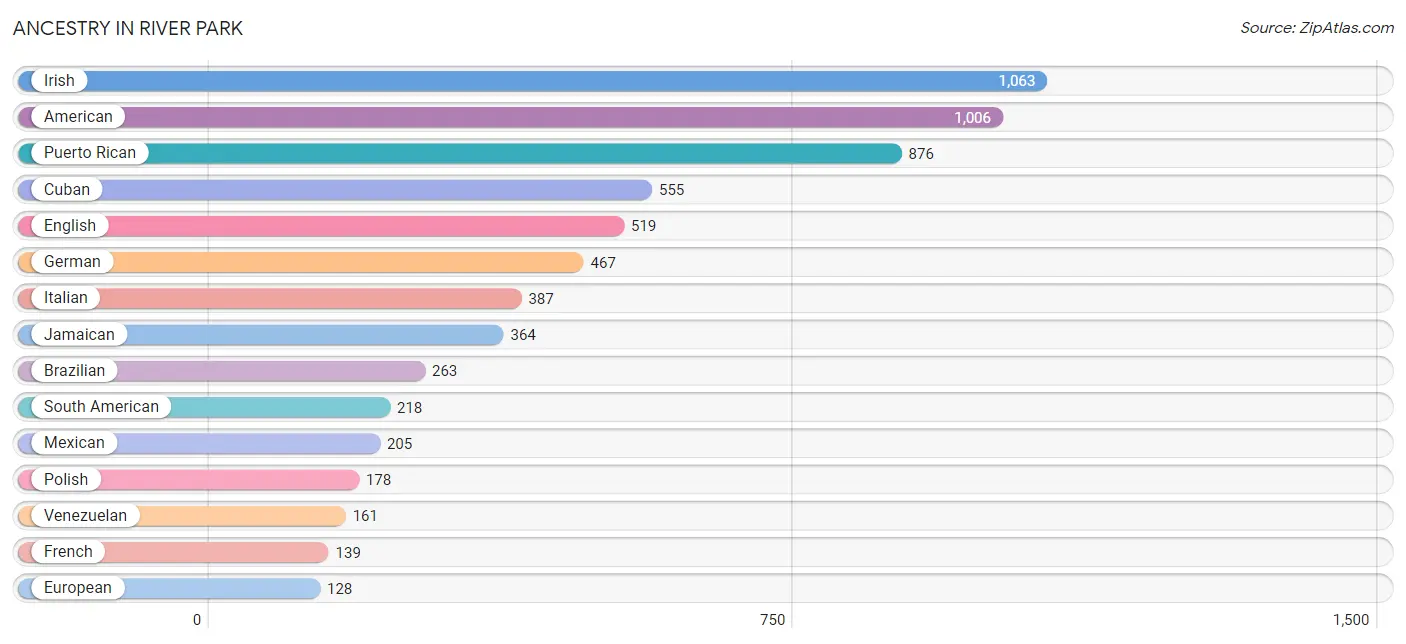
Ancestry in River Park
The most populous ancestries reported in River Park are Irish (1,063 | 17.2%), American (1,006 | 16.3%), Puerto Rican (876 | 14.2%), Cuban (555 | 9.0%), and English (519 | 8.4%), together accounting for 65.0% of all River Park residents.
| Ancestry | # Population | % Population |
| American | 1,006 | 16.3% |
| Arab | 5 | 0.1% |
| Brazilian | 263 | 4.3% |
| British | 12 | 0.2% |
| British West Indian | 6 | 0.1% |
| Canadian | 5 | 0.1% |
| Central American Indian | 6 | 0.1% |
| Cherokee | 22 | 0.4% |
| Cuban | 555 | 9.0% |
| Czechoslovakian | 12 | 0.2% |
| Danish | 11 | 0.2% |
| Dominican | 59 | 0.9% |
| Eastern European | 5 | 0.1% |
| Ecuadorian | 57 | 0.9% |
| English | 519 | 8.4% |
| European | 128 | 2.1% |
| French | 139 | 2.2% |
| French Canadian | 50 | 0.8% |
| German | 467 | 7.5% |
| Ghanaian | 18 | 0.3% |
| Greek | 19 | 0.3% |
| Houma | 9 | 0.2% |
| Hungarian | 6 | 0.1% |
| Indian (Asian) | 28 | 0.4% |
| Irish | 1,063 | 17.2% |
| Iroquois | 11 | 0.2% |
| Italian | 387 | 6.3% |
| Jamaican | 364 | 5.9% |
| Korean | 6 | 0.1% |
| Lebanese | 5 | 0.1% |
| Lithuanian | 4 | 0.1% |
| Mexican | 205 | 3.3% |
| Native Hawaiian | 1 | 0.0% |
| Norwegian | 76 | 1.2% |
| Polish | 178 | 2.9% |
| Portuguese | 21 | 0.3% |
| Puerto Rican | 876 | 14.2% |
| Russian | 4 | 0.1% |
| Scandinavian | 28 | 0.4% |
| Scotch-Irish | 55 | 0.9% |
| Scottish | 69 | 1.1% |
| South American | 218 | 3.5% |
| Spaniard | 21 | 0.3% |
| Subsaharan African | 18 | 0.3% |
| Swedish | 10 | 0.2% |
| Swiss | 5 | 0.1% |
| Ukrainian | 54 | 0.9% |
| Venezuelan | 161 | 2.6% |
| Welsh | 32 | 0.5% | View All 49 Rows |
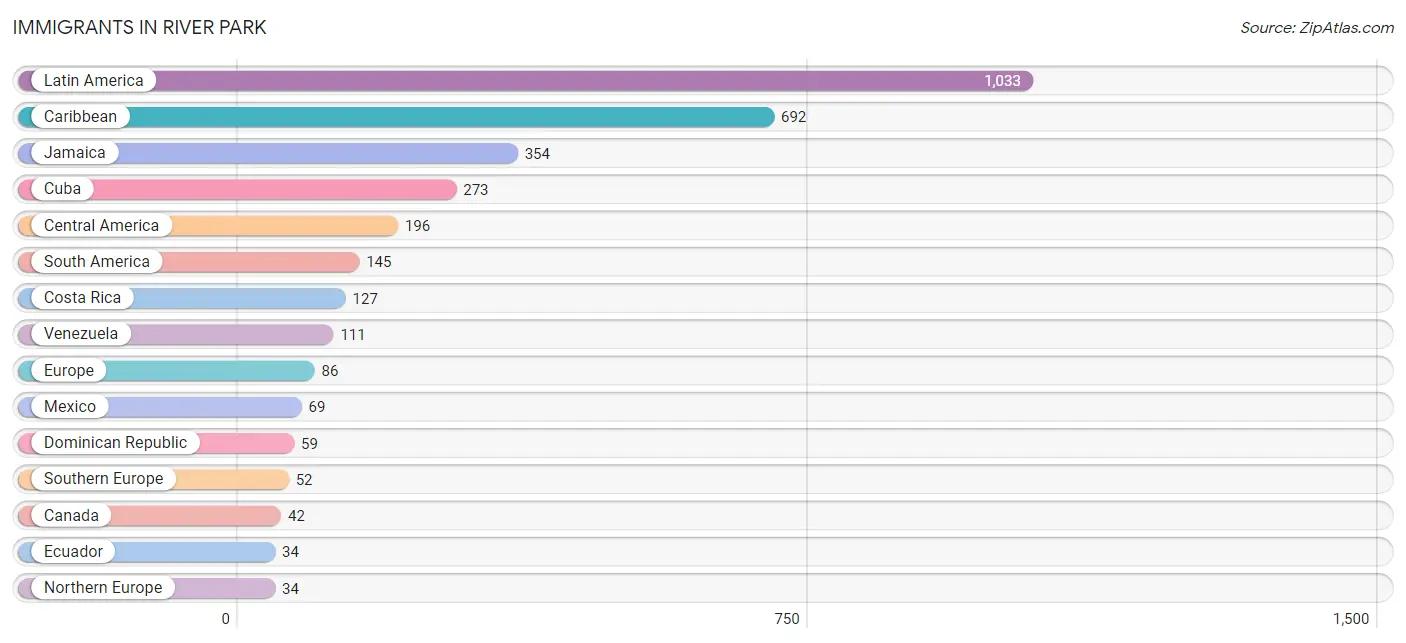
Immigrants in River Park
The most numerous immigrant groups reported in River Park came from Latin America (1,033 | 16.7%), Caribbean (692 | 11.2%), Jamaica (354 | 5.7%), Cuba (273 | 4.4%), and Central America (196 | 3.2%), together accounting for 41.2% of all River Park residents.
| Immigration Origin | # Population | % Population |
| Africa | 18 | 0.3% |
| Asia | 26 | 0.4% |
| Canada | 42 | 0.7% |
| Caribbean | 692 | 11.2% |
| Central America | 196 | 3.2% |
| Costa Rica | 127 | 2.1% |
| Cuba | 273 | 4.4% |
| Dominican Republic | 59 | 0.9% |
| Ecuador | 34 | 0.5% |
| England | 19 | 0.3% |
| Europe | 86 | 1.4% |
| Ghana | 18 | 0.3% |
| Greece | 14 | 0.2% |
| Ireland | 5 | 0.1% |
| Italy | 6 | 0.1% |
| Jamaica | 354 | 5.7% |
| Latin America | 1,033 | 16.7% |
| Mexico | 69 | 1.1% |
| Micronesia | 26 | 0.4% |
| Northern Europe | 34 | 0.5% |
| Oceania | 26 | 0.4% |
| Pakistan | 20 | 0.3% |
| Philippines | 6 | 0.1% |
| Portugal | 11 | 0.2% |
| Scotland | 10 | 0.2% |
| South America | 145 | 2.3% |
| South Central Asia | 20 | 0.3% |
| South Eastern Asia | 6 | 0.1% |
| Southern Europe | 52 | 0.8% |
| Spain | 21 | 0.3% |
| St. Vincent and the Grenadines | 6 | 0.1% |
| Venezuela | 111 | 1.8% |
| Western Africa | 18 | 0.3% | View All 33 Rows |
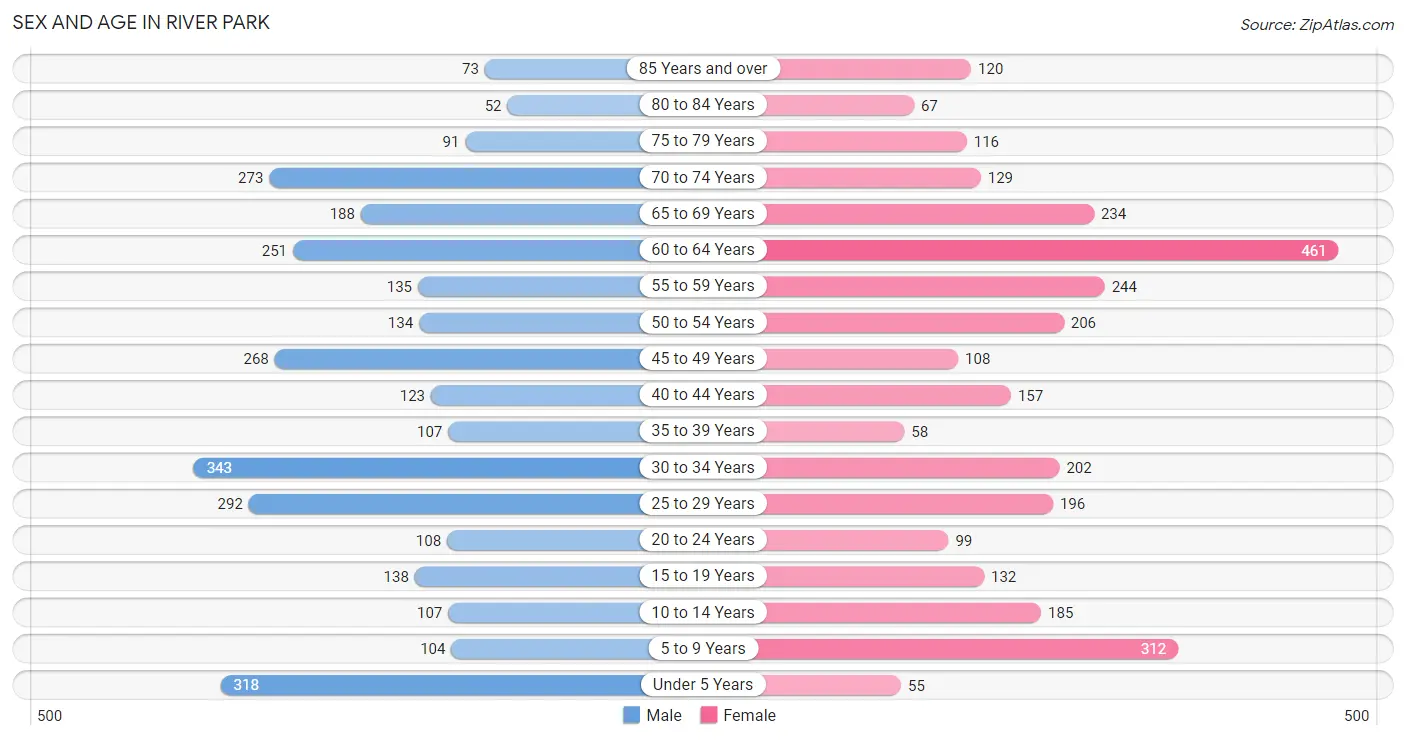
Sex and Age in River Park
Sex and Age in River Park
The most populous age groups in River Park are 30 to 34 Years (343 | 11.1%) for men and 60 to 64 Years (461 | 15.0%) for women.
| Age Bracket | Male | Female |
| Under 5 Years | 318 (10.2%) | 55 (1.8%) |
| 5 to 9 Years | 104 (3.4%) | 312 (10.1%) |
| 10 to 14 Years | 107 (3.5%) | 185 (6.0%) |
| 15 to 19 Years | 138 (4.4%) | 132 (4.3%) |
| 20 to 24 Years | 108 (3.5%) | 99 (3.2%) |
| 25 to 29 Years | 292 (9.4%) | 196 (6.4%) |
| 30 to 34 Years | 343 (11.1%) | 202 (6.6%) |
| 35 to 39 Years | 107 (3.5%) | 58 (1.9%) |
| 40 to 44 Years | 123 (4.0%) | 157 (5.1%) |
| 45 to 49 Years | 268 (8.6%) | 108 (3.5%) |
| 50 to 54 Years | 134 (4.3%) | 206 (6.7%) |
| 55 to 59 Years | 135 (4.3%) | 244 (7.9%) |
| 60 to 64 Years | 251 (8.1%) | 461 (15.0%) |
| 65 to 69 Years | 188 (6.0%) | 234 (7.6%) |
| 70 to 74 Years | 273 (8.8%) | 129 (4.2%) |
| 75 to 79 Years | 91 (2.9%) | 116 (3.8%) |
| 80 to 84 Years | 52 (1.7%) | 67 (2.2%) |
| 85 Years and over | 73 (2.4%) | 120 (3.9%) |
| Total | 3,105 (100.0%) | 3,081 (100.0%) |
Families and Households in River Park
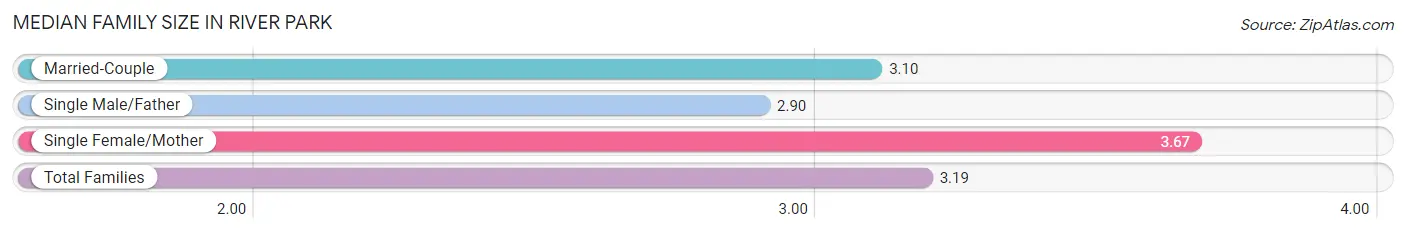
Median Family Size in River Park
The median family size in River Park is 3.19 persons per family, with single female/mother families (305 | 21.3%) accounting for the largest median family size of 3.67 persons per family. On the other hand, single male/father families (251 | 17.6%) represent the smallest median family size with 2.90 persons per family.
| Family Type | # Families | Family Size |
| Married-Couple | 873 (61.1%) | 3.10 |
| Single Male/Father | 251 (17.6%) | 2.90 |
| Single Female/Mother | 305 (21.3%) | 3.67 |
| Total Families | 1,429 (100.0%) | 3.19 |
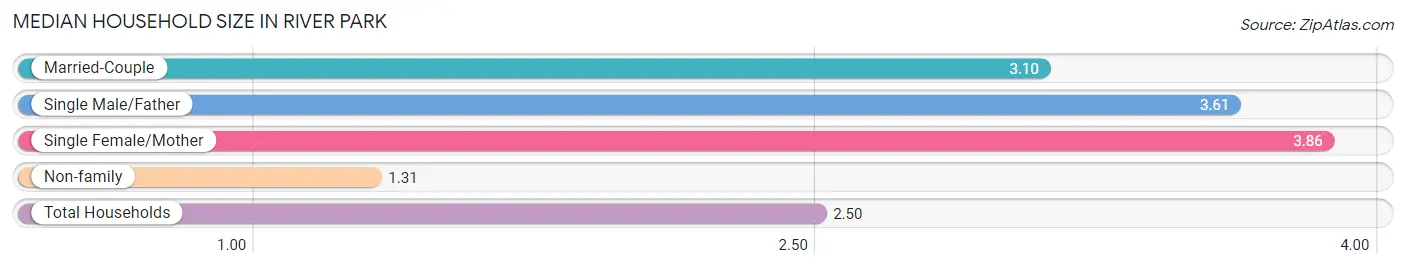
Median Household Size in River Park
The median household size in River Park is 2.50 persons per household, with single female/mother households (305 | 12.4%) accounting for the largest median household size of 3.86 persons per household. non-family households (1,026 | 41.8%) represent the smallest median household size with 1.31 persons per household.
| Household Type | # Households | Household Size |
| Married-Couple | 873 (35.6%) | 3.10 |
| Single Male/Father | 251 (10.2%) | 3.61 |
| Single Female/Mother | 305 (12.4%) | 3.86 |
| Non-family | 1,026 (41.8%) | 1.31 |
| Total Households | 2,455 (100.0%) | 2.50 |
Household Size by Marriage Status in River Park
Out of a total of 2,455 households in River Park, 1,429 (58.2%) are family households, while 1,026 (41.8%) are nonfamily households. The most numerous type of family households are 2-person households, comprising 641, and the most common type of nonfamily households are 1-person households, comprising 829.
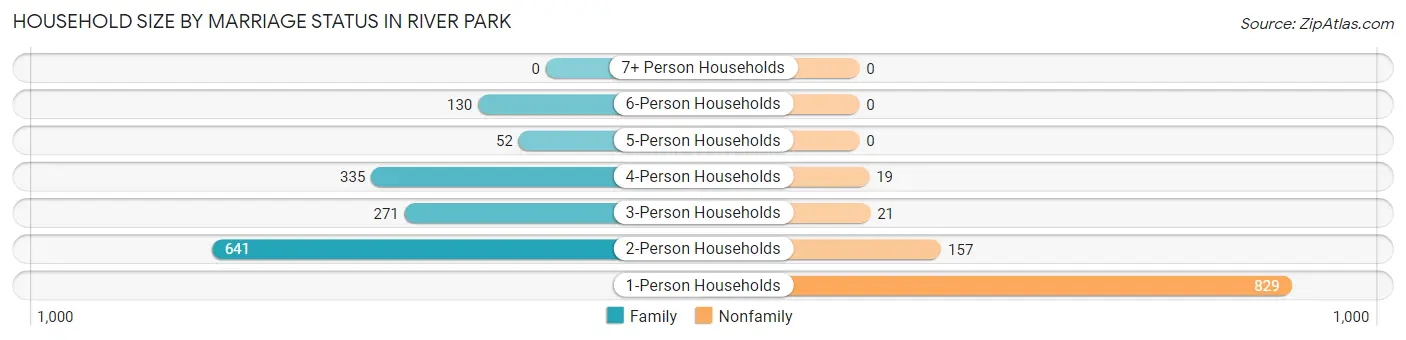
| Household Size | Family Households | Nonfamily Households |
| 1-Person Households | - | 829 (33.8%) |
| 2-Person Households | 641 (26.1%) | 157 (6.4%) |
| 3-Person Households | 271 (11.0%) | 21 (0.9%) |
| 4-Person Households | 335 (13.7%) | 19 (0.8%) |
| 5-Person Households | 52 (2.1%) | 0 (0.0%) |
| 6-Person Households | 130 (5.3%) | 0 (0.0%) |
| 7+ Person Households | 0 (0.0%) | 0 (0.0%) |
| Total | 1,429 (58.2%) | 1,026 (41.8%) |
Female Fertility in River Park
Fertility by Age in River Park
Average fertility rate in River Park is 53.0 births per 1,000 women. Women in the age bracket of 20 to 34 years have the highest fertility rate with 105.0 births per 1,000 women. Women in the age bracket of 20 to 34 years acount for 100.0% of all women with births.
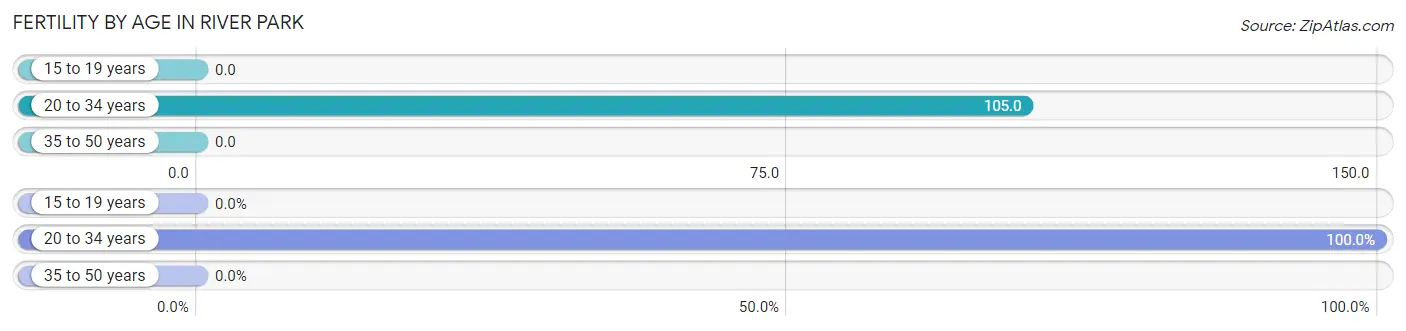
| Age Bracket | Women with Births | Births / 1,000 Women |
| 15 to 19 years | 0 (0.0%) | 0.0 |
| 20 to 34 years | 52 (100.0%) | 105.0 |
| 35 to 50 years | 0 (0.0%) | 0.0 |
| Total | 52 (100.0%) | 53.0 |
Fertility by Age by Marriage Status in River Park
63.5% of women with births (52) in River Park are married. The highest percentage of unmarried women with births falls into 20 to 34 years age bracket with 36.5% of them unmarried at the time of birth, while the lowest percentage of unmarried women with births belong to 20 to 34 years age bracket with 36.5% of them unmarried.
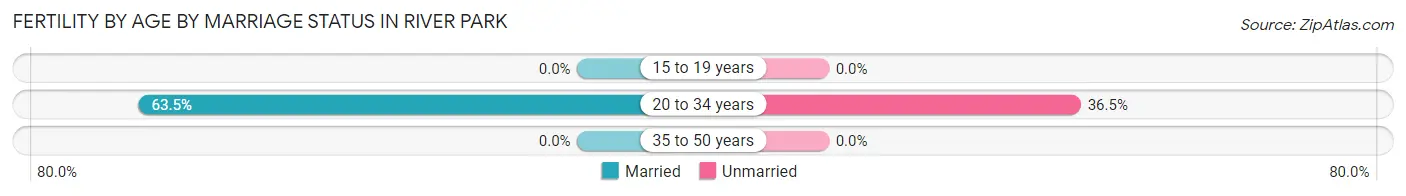
| Age Bracket | Married | Unmarried |
| 15 to 19 years | 0 (0.0%) | 0 (0.0%) |
| 20 to 34 years | 33 (63.5%) | 19 (36.5%) |
| 35 to 50 years | 0 (0.0%) | 0 (0.0%) |
| Total | 33 (63.5%) | 19 (36.5%) |
Fertility by Education in River Park
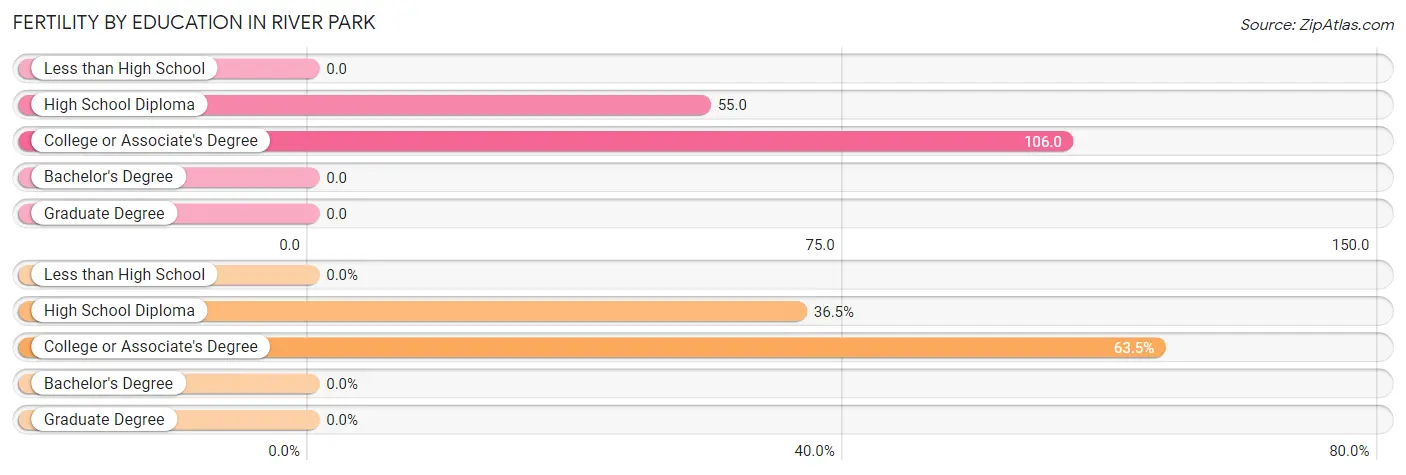
| Educational Attainment | Women with Births | Births / 1,000 Women |
| Less than High School | 0 (0.0%) | 0.0 |
| High School Diploma | 19 (36.5%) | 55.0 |
| College or Associate's Degree | 33 (63.5%) | 106.0 |
| Bachelor's Degree | 0 (0.0%) | 0.0 |
| Graduate Degree | 0 (0.0%) | 0.0 |
| Total | 52 (100.0%) | 53.0 |
Fertility by Education by Marriage Status in River Park
36.5% of women with births in River Park are unmarried. Women with the educational attainment of college or associate's degree are most likely to be married with 100.0% of them married at childbirth, while women with the educational attainment of high school diploma are least likely to be married with 100.0% of them unmarried at childbirth.
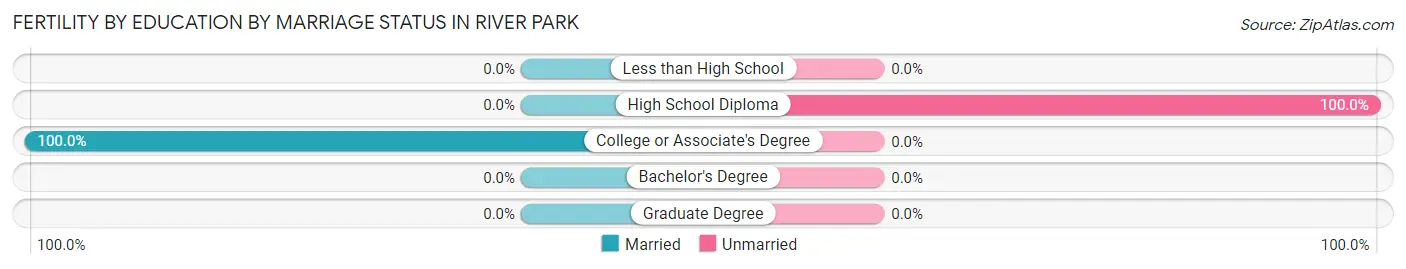
| Educational Attainment | Married | Unmarried |
| Less than High School | 0 (0.0%) | 0 (0.0%) |
| High School Diploma | 0 (0.0%) | 19 (100.0%) |
| College or Associate's Degree | 33 (100.0%) | 0 (0.0%) |
| Bachelor's Degree | 0 (0.0%) | 0 (0.0%) |
| Graduate Degree | 0 (0.0%) | 0 (0.0%) |
| Total | 33 (63.5%) | 19 (36.5%) |
Employment Characteristics in River Park
Employment by Class of Employer in River Park
Among the 2,548 employed individuals in River Park, private company employees (1,760 | 69.1%), self-employed (not incorporated) (269 | 10.6%), and self-employed (incorporated) (183 | 7.2%) make up the most common classes of employment.
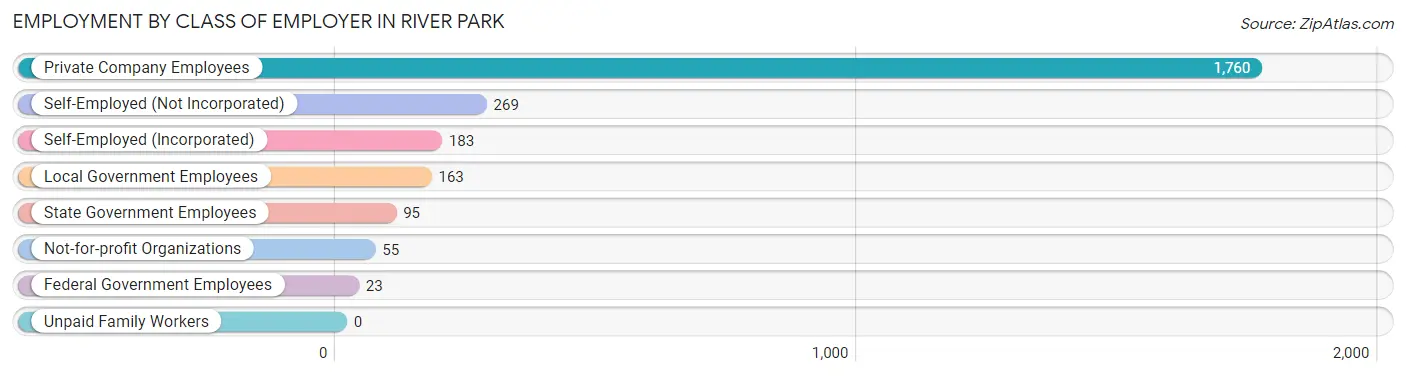
| Employer Class | # Employees | % Employees |
| Private Company Employees | 1,760 | 69.1% |
| Self-Employed (Incorporated) | 183 | 7.2% |
| Self-Employed (Not Incorporated) | 269 | 10.6% |
| Not-for-profit Organizations | 55 | 2.2% |
| Local Government Employees | 163 | 6.4% |
| State Government Employees | 95 | 3.7% |
| Federal Government Employees | 23 | 0.9% |
| Unpaid Family Workers | 0 | 0.0% |
| Total | 2,548 | 100.0% |
Employment Status by Age in River Park
According to the labor force statistics for River Park, out of the total population over 16 years of age (5,042), 56.6% or 2,854 individuals are in the labor force, with 8.3% or 237 of them unemployed. The age group with the highest labor force participation rate is 25 to 29 years, with 92.0% or 449 individuals in the labor force. Within the labor force, the 16 to 19 years age range has the highest percentage of unemployed individuals, with 100.0% or 12 of them being unemployed.
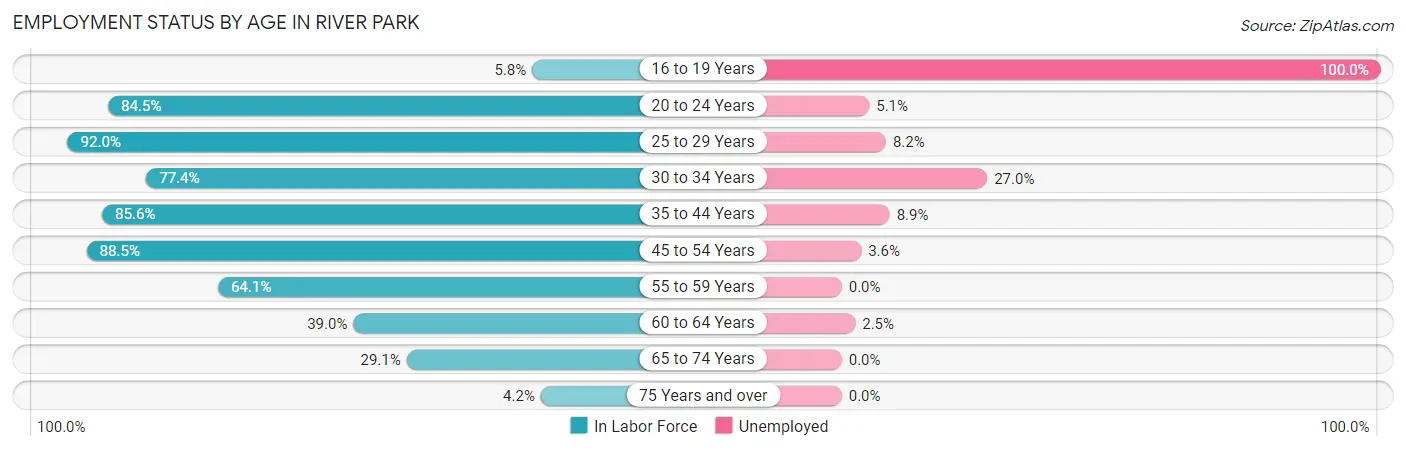
| Age Bracket | In Labor Force | Unemployed |
| 16 to 19 Years | 12 (5.8%) | 12 (100.0%) |
| 20 to 24 Years | 175 (84.5%) | 9 (5.1%) |
| 25 to 29 Years | 449 (92.0%) | 37 (8.2%) |
| 30 to 34 Years | 422 (77.4%) | 114 (27.0%) |
| 35 to 44 Years | 381 (85.6%) | 34 (8.9%) |
| 45 to 54 Years | 634 (88.5%) | 23 (3.6%) |
| 55 to 59 Years | 243 (64.1%) | 0 (0.0%) |
| 60 to 64 Years | 278 (39.0%) | 7 (2.5%) |
| 65 to 74 Years | 240 (29.1%) | 0 (0.0%) |
| 75 Years and over | 22 (4.2%) | 0 (0.0%) |
| Total | 2,854 (56.6%) | 237 (8.3%) |
Employment Status by Educational Attainment in River Park
According to labor force statistics for River Park, 73.3% of individuals (2,408) out of the total population between 25 and 64 years of age (3,285) are in the labor force, with 8.9% or 214 of them being unemployed. The group with the highest labor force participation rate are those with the educational attainment of bachelor's degree or higher, with 95.5% or 358 individuals in the labor force. Within the labor force, individuals with bachelor's degree or higher education have the highest percentage of unemployment, with 18.2% or 65 of them being unemployed.
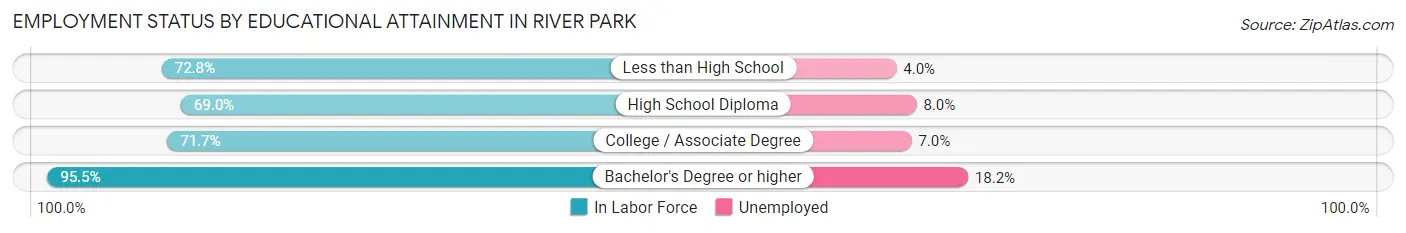
| Educational Attainment | In Labor Force | Unemployed |
| Less than High School | 126 (72.8%) | 7 (4.0%) |
| High School Diploma | 1,009 (69.0%) | 117 (8.0%) |
| College / Associate Degree | 913 (71.7%) | 89 (7.0%) |
| Bachelor's Degree or higher | 358 (95.5%) | 68 (18.2%) |
| Total | 2,408 (73.3%) | 292 (8.9%) |
Employment Occupations by Sex in River Park
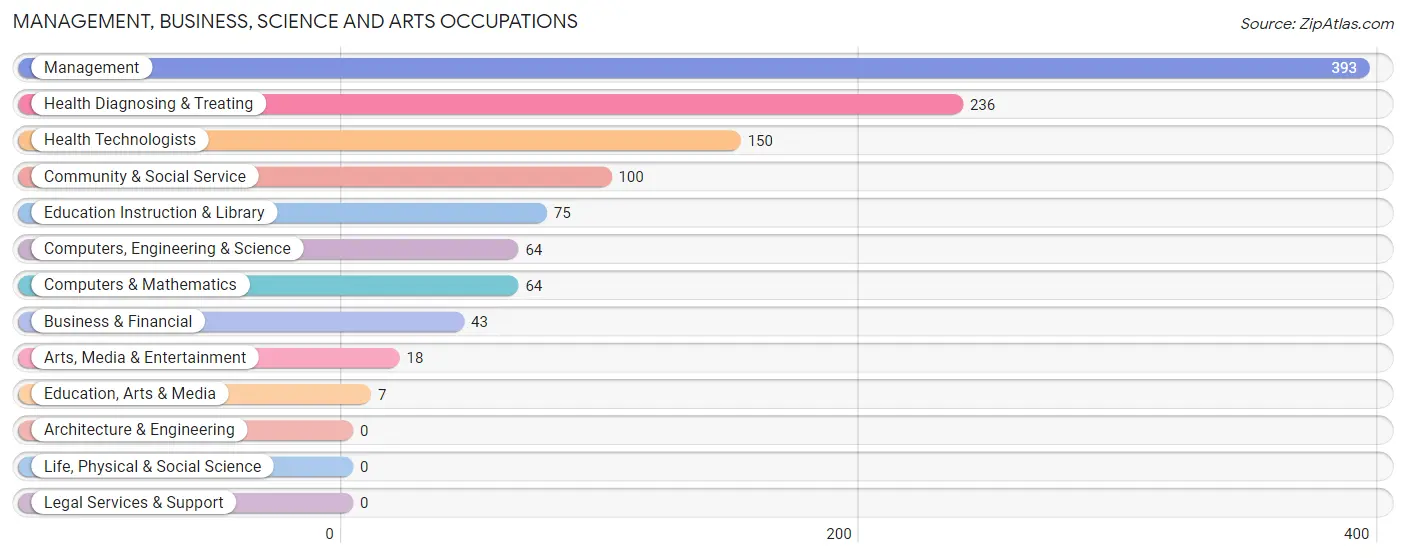
Management, Business, Science and Arts Occupations
The most common Management, Business, Science and Arts occupations in River Park are Management (393 | 15.0%), Health Diagnosing & Treating (236 | 9.0%), Health Technologists (150 | 5.7%), Community & Social Service (100 | 3.8%), and Education Instruction & Library (75 | 2.9%).
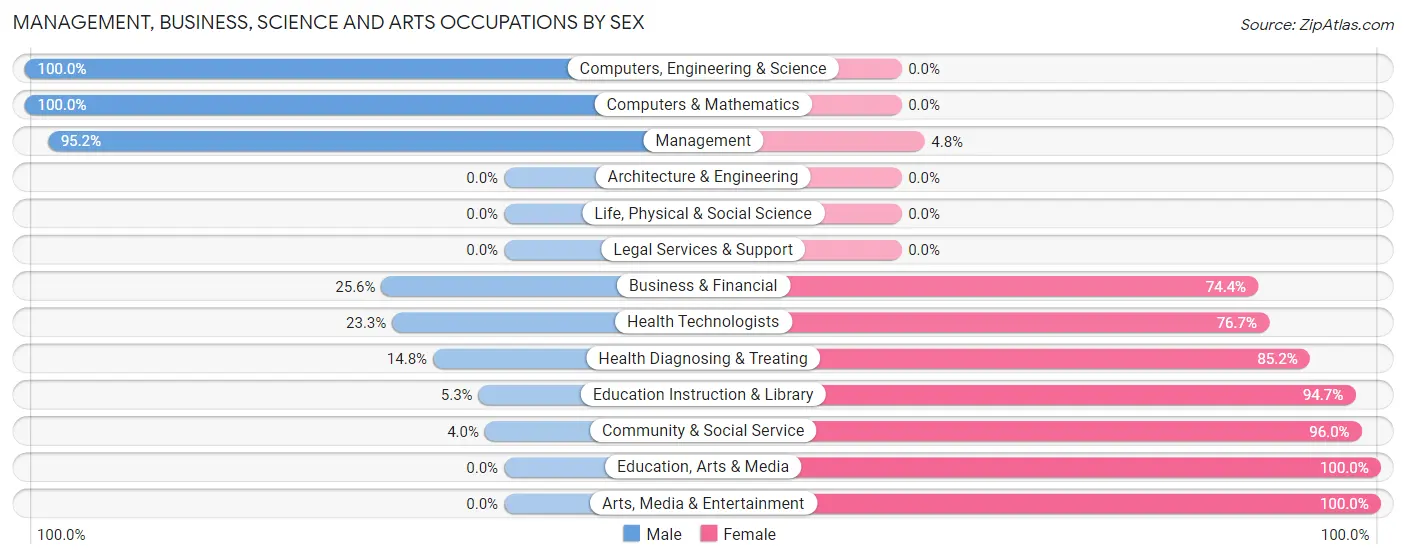
Management, Business, Science and Arts Occupations by Sex
Within the Management, Business, Science and Arts occupations in River Park, the most male-oriented occupations are Computers, Engineering & Science (100.0%), Computers & Mathematics (100.0%), and Management (95.2%), while the most female-oriented occupations are Education, Arts & Media (100.0%), Arts, Media & Entertainment (100.0%), and Community & Social Service (96.0%).
| Occupation | Male | Female |
| Management | 374 (95.2%) | 19 (4.8%) |
| Business & Financial | 11 (25.6%) | 32 (74.4%) |
| Computers, Engineering & Science | 64 (100.0%) | 0 (0.0%) |
| Computers & Mathematics | 64 (100.0%) | 0 (0.0%) |
| Architecture & Engineering | 0 (0.0%) | 0 (0.0%) |
| Life, Physical & Social Science | 0 (0.0%) | 0 (0.0%) |
| Community & Social Service | 4 (4.0%) | 96 (96.0%) |
| Education, Arts & Media | 0 (0.0%) | 7 (100.0%) |
| Legal Services & Support | 0 (0.0%) | 0 (0.0%) |
| Education Instruction & Library | 4 (5.3%) | 71 (94.7%) |
| Arts, Media & Entertainment | 0 (0.0%) | 18 (100.0%) |
| Health Diagnosing & Treating | 35 (14.8%) | 201 (85.2%) |
| Health Technologists | 35 (23.3%) | 115 (76.7%) |
| Total (Category) | 488 (58.4%) | 348 (41.6%) |
| Total (Overall) | 1,486 (56.7%) | 1,134 (43.3%) |
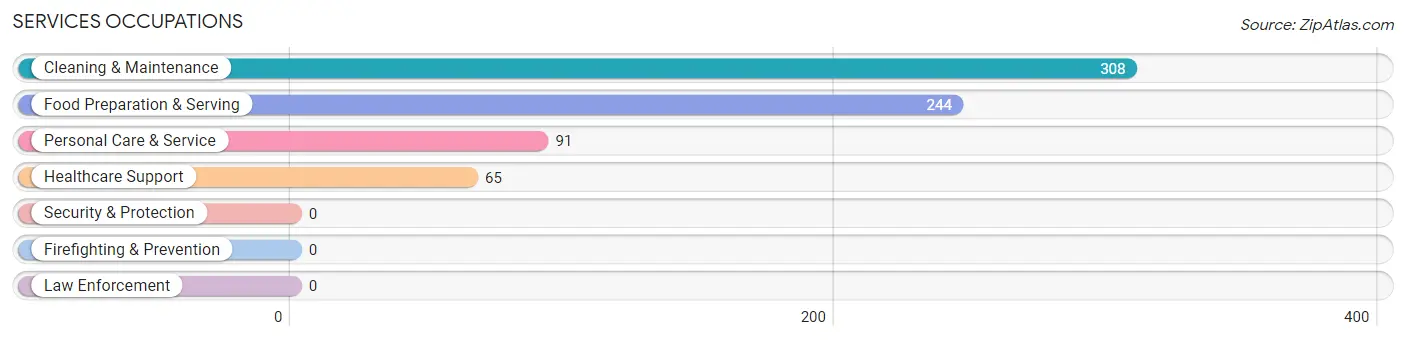
Services Occupations
The most common Services occupations in River Park are Cleaning & Maintenance (308 | 11.8%), Food Preparation & Serving (244 | 9.3%), Personal Care & Service (91 | 3.5%), and Healthcare Support (65 | 2.5%).
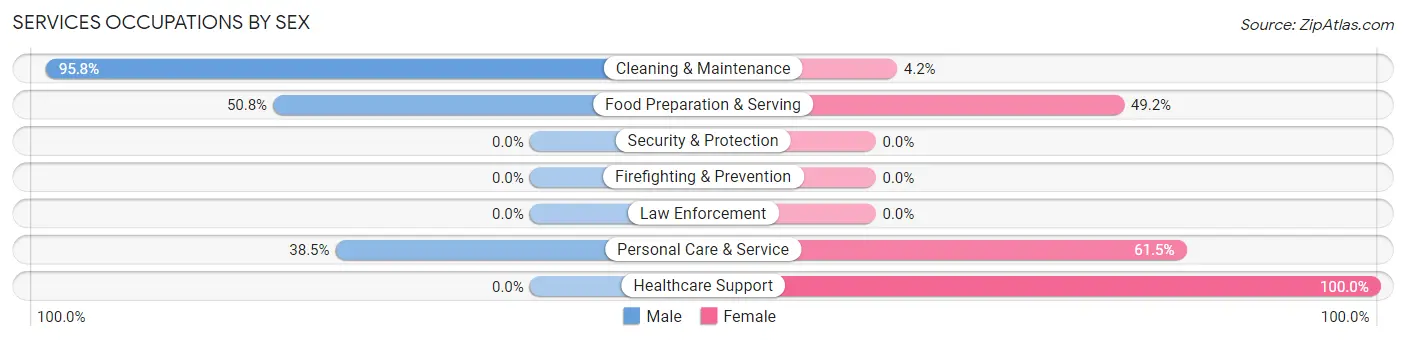
Services Occupations by Sex
Within the Services occupations in River Park, the most male-oriented occupations are Cleaning & Maintenance (95.8%), Food Preparation & Serving (50.8%), and Personal Care & Service (38.5%), while the most female-oriented occupations are Healthcare Support (100.0%), Personal Care & Service (61.5%), and Food Preparation & Serving (49.2%).
| Occupation | Male | Female |
| Healthcare Support | 0 (0.0%) | 65 (100.0%) |
| Security & Protection | 0 (0.0%) | 0 (0.0%) |
| Firefighting & Prevention | 0 (0.0%) | 0 (0.0%) |
| Law Enforcement | 0 (0.0%) | 0 (0.0%) |
| Food Preparation & Serving | 124 (50.8%) | 120 (49.2%) |
| Cleaning & Maintenance | 295 (95.8%) | 13 (4.2%) |
| Personal Care & Service | 35 (38.5%) | 56 (61.5%) |
| Total (Category) | 454 (64.1%) | 254 (35.9%) |
| Total (Overall) | 1,486 (56.7%) | 1,134 (43.3%) |
Sales and Office Occupations
The most common Sales and Office occupations in River Park are Office & Administration (425 | 16.2%), and Sales & Related (173 | 6.6%).
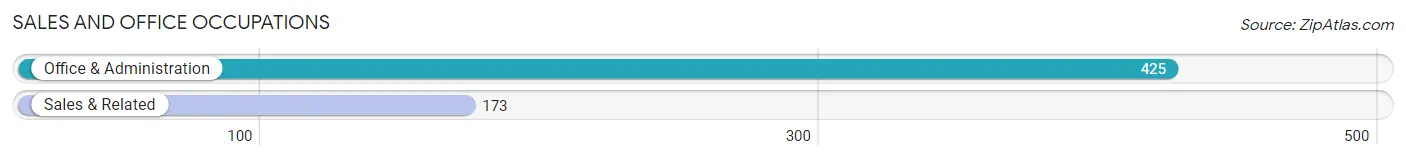
Sales and Office Occupations by Sex
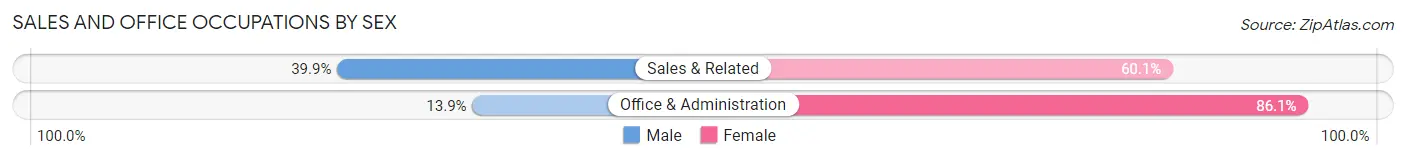
| Occupation | Male | Female |
| Sales & Related | 69 (39.9%) | 104 (60.1%) |
| Office & Administration | 59 (13.9%) | 366 (86.1%) |
| Total (Category) | 128 (21.4%) | 470 (78.6%) |
| Total (Overall) | 1,486 (56.7%) | 1,134 (43.3%) |
Natural Resources, Construction and Maintenance Occupations
The most common Natural Resources, Construction and Maintenance occupations in River Park are Installation, Maintenance & Repair (128 | 4.9%), and Construction & Extraction (80 | 3.0%).
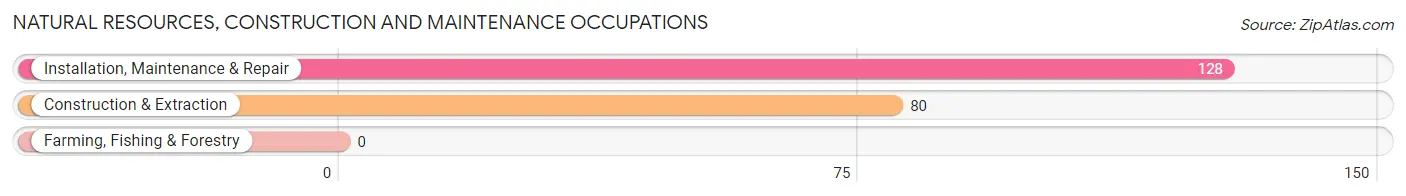
Natural Resources, Construction and Maintenance Occupations by Sex
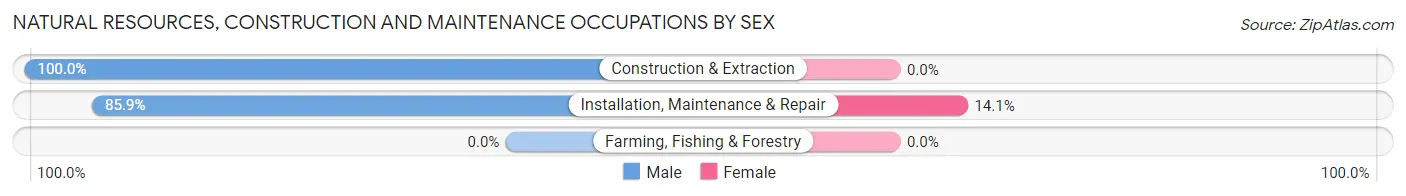
| Occupation | Male | Female |
| Farming, Fishing & Forestry | 0 (0.0%) | 0 (0.0%) |
| Construction & Extraction | 80 (100.0%) | 0 (0.0%) |
| Installation, Maintenance & Repair | 110 (85.9%) | 18 (14.1%) |
| Total (Category) | 190 (91.3%) | 18 (8.6%) |
| Total (Overall) | 1,486 (56.7%) | 1,134 (43.3%) |
Production, Transportation and Moving Occupations
The most common Production, Transportation and Moving occupations in River Park are Production (144 | 5.5%), Material Moving (91 | 3.5%), and Transportation (35 | 1.3%).
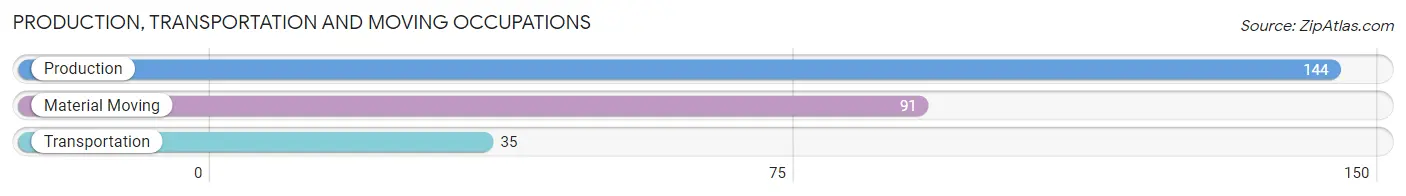
Production, Transportation and Moving Occupations by Sex
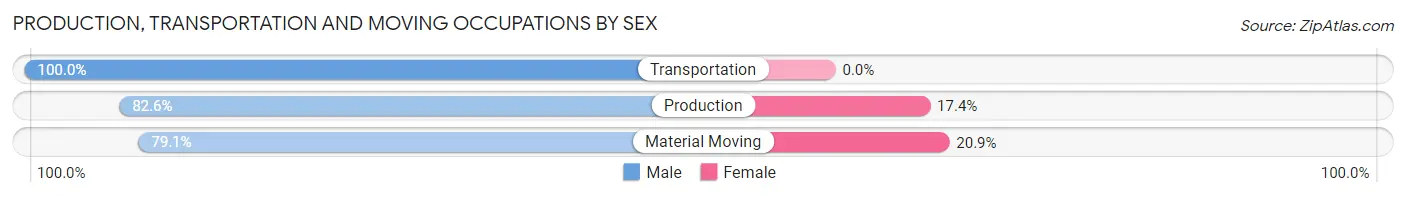
| Occupation | Male | Female |
| Production | 119 (82.6%) | 25 (17.4%) |
| Transportation | 35 (100.0%) | 0 (0.0%) |
| Material Moving | 72 (79.1%) | 19 (20.9%) |
| Total (Category) | 226 (83.7%) | 44 (16.3%) |
| Total (Overall) | 1,486 (56.7%) | 1,134 (43.3%) |
Employment Industries by Sex in River Park
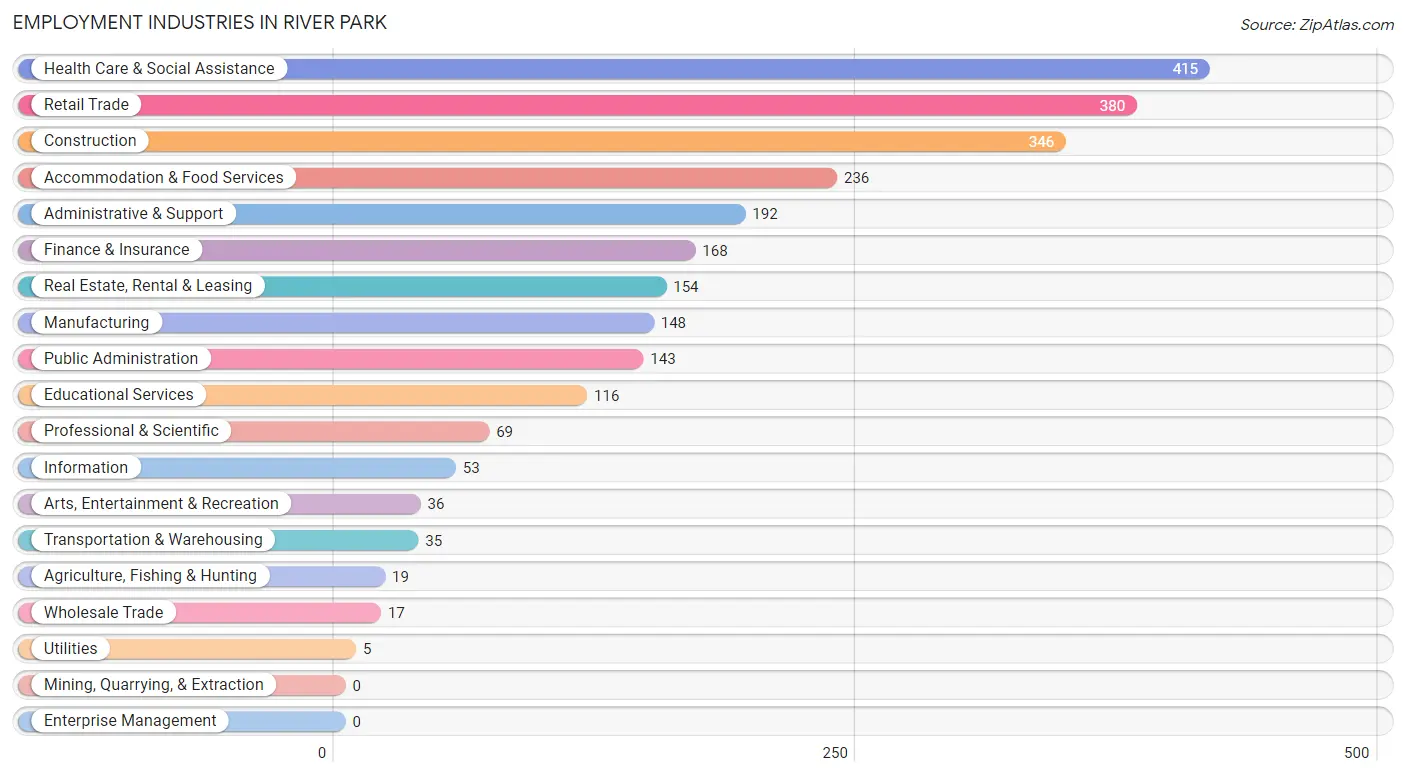
Employment Industries in River Park
The major employment industries in River Park include Health Care & Social Assistance (415 | 15.8%), Retail Trade (380 | 14.5%), Construction (346 | 13.2%), Accommodation & Food Services (236 | 9.0%), and Administrative & Support (192 | 7.3%).
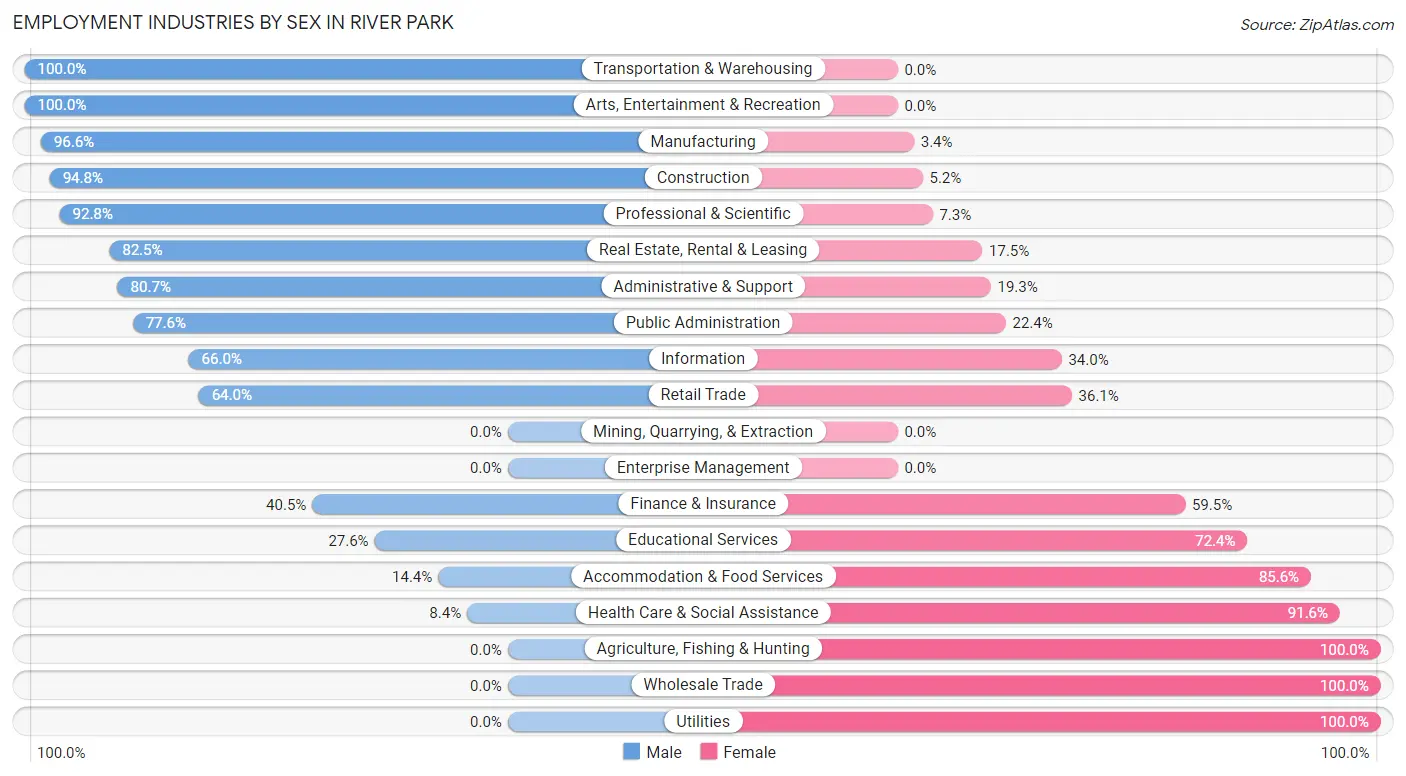
Employment Industries by Sex in River Park
The River Park industries that see more men than women are Transportation & Warehousing (100.0%), Arts, Entertainment & Recreation (100.0%), and Manufacturing (96.6%), whereas the industries that tend to have a higher number of women are Agriculture, Fishing & Hunting (100.0%), Wholesale Trade (100.0%), and Utilities (100.0%).
| Industry | Male | Female |
| Agriculture, Fishing & Hunting | 0 (0.0%) | 19 (100.0%) |
| Mining, Quarrying, & Extraction | 0 (0.0%) | 0 (0.0%) |
| Construction | 328 (94.8%) | 18 (5.2%) |
| Manufacturing | 143 (96.6%) | 5 (3.4%) |
| Wholesale Trade | 0 (0.0%) | 17 (100.0%) |
| Retail Trade | 243 (63.9%) | 137 (36.0%) |
| Transportation & Warehousing | 35 (100.0%) | 0 (0.0%) |
| Utilities | 0 (0.0%) | 5 (100.0%) |
| Information | 35 (66.0%) | 18 (34.0%) |
| Finance & Insurance | 68 (40.5%) | 100 (59.5%) |
| Real Estate, Rental & Leasing | 127 (82.5%) | 27 (17.5%) |
| Professional & Scientific | 64 (92.7%) | 5 (7.2%) |
| Enterprise Management | 0 (0.0%) | 0 (0.0%) |
| Administrative & Support | 155 (80.7%) | 37 (19.3%) |
| Educational Services | 32 (27.6%) | 84 (72.4%) |
| Health Care & Social Assistance | 35 (8.4%) | 380 (91.6%) |
| Arts, Entertainment & Recreation | 36 (100.0%) | 0 (0.0%) |
| Accommodation & Food Services | 34 (14.4%) | 202 (85.6%) |
| Public Administration | 111 (77.6%) | 32 (22.4%) |
| Total | 1,486 (56.7%) | 1,134 (43.3%) |
Education in River Park
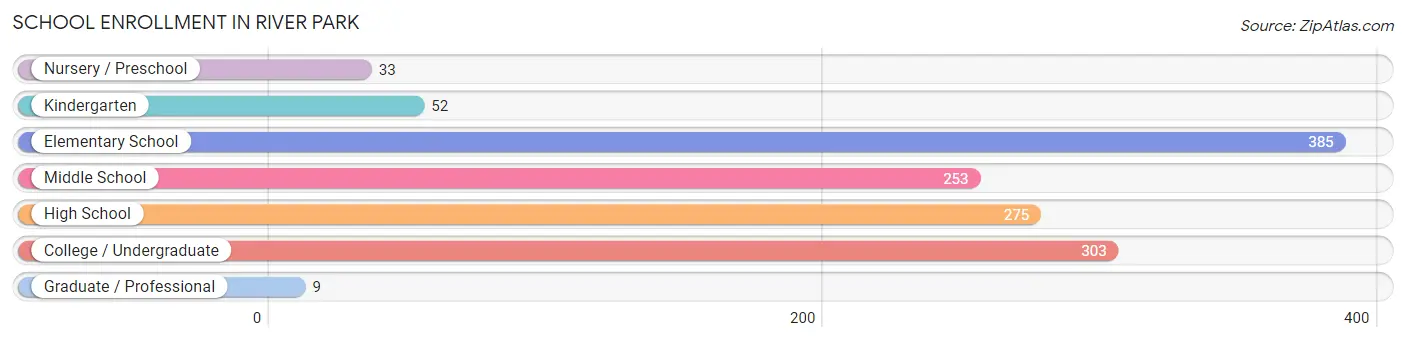
School Enrollment in River Park
The most common levels of schooling among the 1,310 students in River Park are elementary school (385 | 29.4%), college / undergraduate (303 | 23.1%), and high school (275 | 21.0%).
| School Level | # Students | % Students |
| Nursery / Preschool | 33 | 2.5% |
| Kindergarten | 52 | 4.0% |
| Elementary School | 385 | 29.4% |
| Middle School | 253 | 19.3% |
| High School | 275 | 21.0% |
| College / Undergraduate | 303 | 23.1% |
| Graduate / Professional | 9 | 0.7% |
| Total | 1,310 | 100.0% |
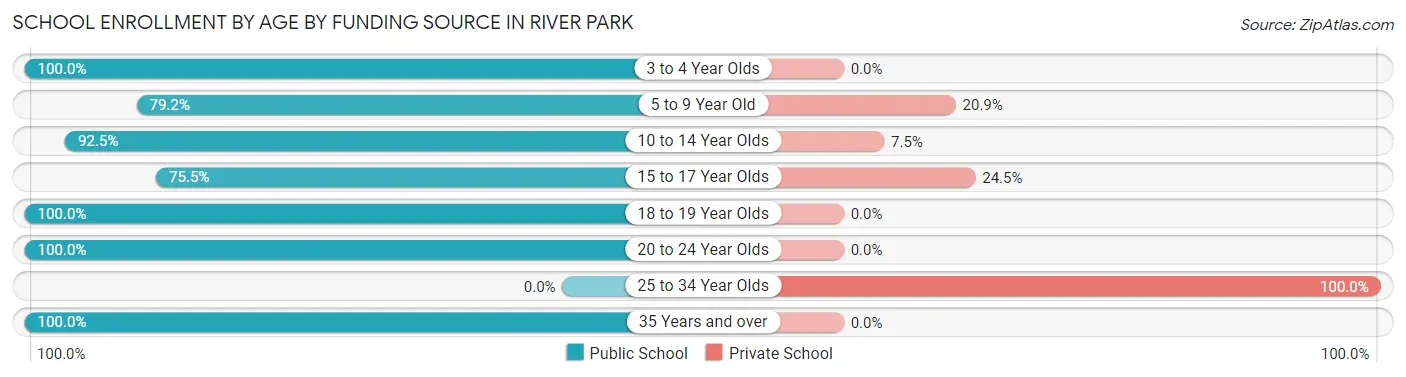
School Enrollment by Age by Funding Source in River Park
Out of a total of 1,310 students who are enrolled in schools in River Park, 183 (14.0%) attend a private institution, while the remaining 1,127 (86.0%) are enrolled in public schools. The age group of 25 to 34 year olds has the highest likelihood of being enrolled in private schools, with 29 (100.0% in the age bracket) enrolled. Conversely, the age group of 3 to 4 year olds has the lowest likelihood of being enrolled in a private school, with 33 (100.0% in the age bracket) attending a public institution.
| Age Bracket | Public School | Private School |
| 3 to 4 Year Olds | 33 (100.0%) | 0 (0.0%) |
| 5 to 9 Year Old | 315 (79.1%) | 83 (20.8%) |
| 10 to 14 Year Olds | 270 (92.5%) | 22 (7.5%) |
| 15 to 17 Year Olds | 154 (75.5%) | 50 (24.5%) |
| 18 to 19 Year Olds | 66 (100.0%) | 0 (0.0%) |
| 20 to 24 Year Olds | 125 (100.0%) | 0 (0.0%) |
| 25 to 34 Year Olds | 0 (0.0%) | 29 (100.0%) |
| 35 Years and over | 163 (100.0%) | 0 (0.0%) |
| Total | 1,127 (86.0%) | 183 (14.0%) |
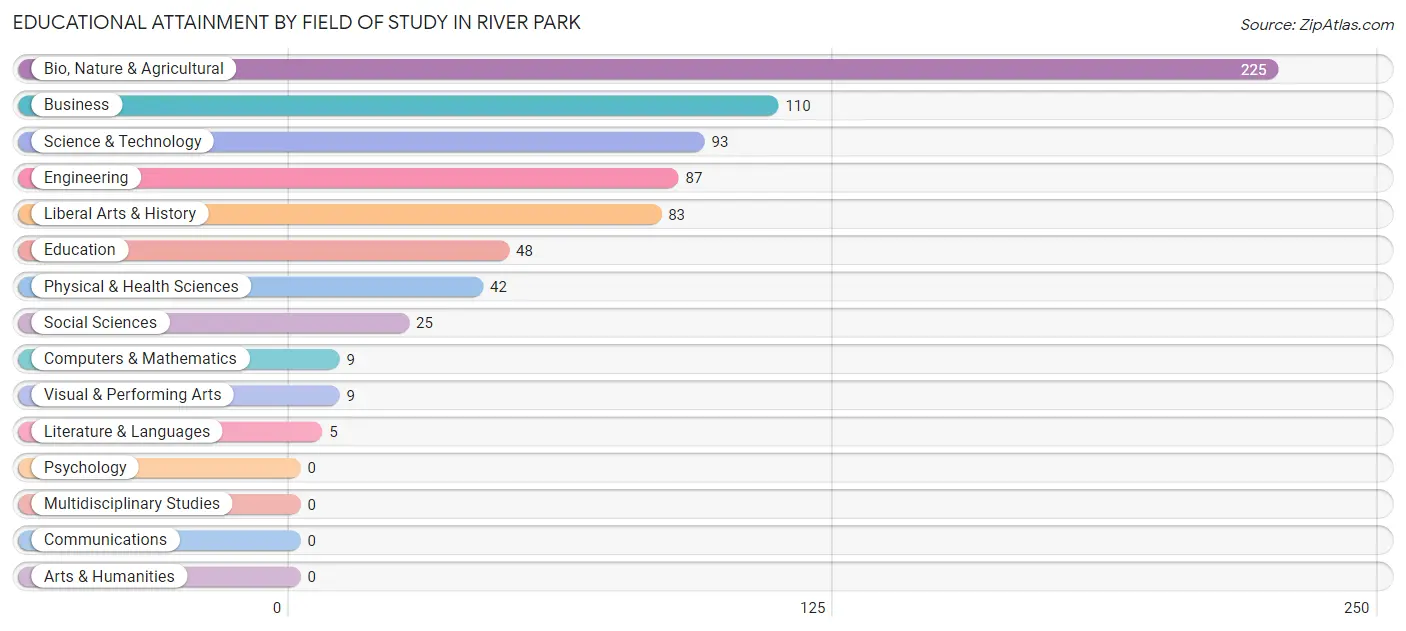
Educational Attainment by Field of Study in River Park
Bio, nature & agricultural (225 | 30.6%), business (110 | 14.9%), science & technology (93 | 12.6%), engineering (87 | 11.8%), and liberal arts & history (83 | 11.3%) are the most common fields of study among 736 individuals in River Park who have obtained a bachelor's degree or higher.
| Field of Study | # Graduates | % Graduates |
| Computers & Mathematics | 9 | 1.2% |
| Bio, Nature & Agricultural | 225 | 30.6% |
| Physical & Health Sciences | 42 | 5.7% |
| Psychology | 0 | 0.0% |
| Social Sciences | 25 | 3.4% |
| Engineering | 87 | 11.8% |
| Multidisciplinary Studies | 0 | 0.0% |
| Science & Technology | 93 | 12.6% |
| Business | 110 | 14.9% |
| Education | 48 | 6.5% |
| Literature & Languages | 5 | 0.7% |
| Liberal Arts & History | 83 | 11.3% |
| Visual & Performing Arts | 9 | 1.2% |
| Communications | 0 | 0.0% |
| Arts & Humanities | 0 | 0.0% |
| Total | 736 | 100.0% |
Transportation & Commute in River Park
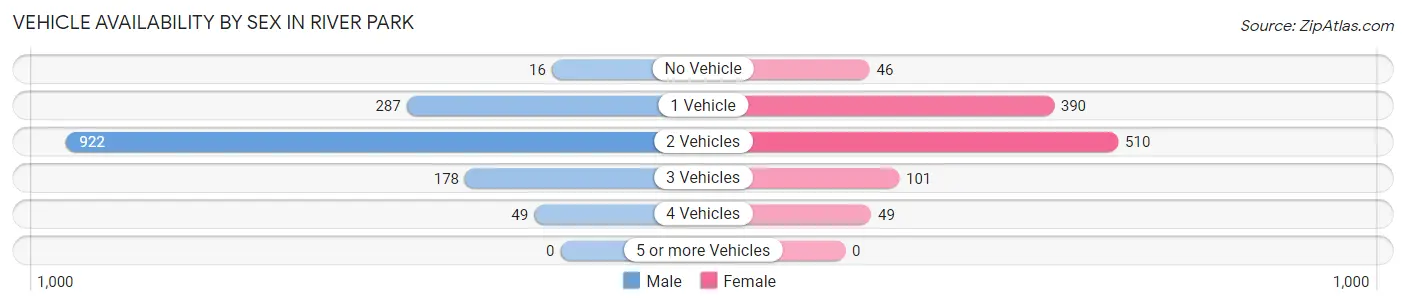
Vehicle Availability by Sex in River Park
The most prevalent vehicle ownership categories in River Park are males with 2 vehicles (922, accounting for 63.5%) and females with 2 vehicles (510, making up 84.1%).
| Vehicles Available | Male | Female |
| No Vehicle | 16 (1.1%) | 46 (4.2%) |
| 1 Vehicle | 287 (19.8%) | 390 (35.6%) |
| 2 Vehicles | 922 (63.5%) | 510 (46.5%) |
| 3 Vehicles | 178 (12.3%) | 101 (9.2%) |
| 4 Vehicles | 49 (3.4%) | 49 (4.5%) |
| 5 or more Vehicles | 0 (0.0%) | 0 (0.0%) |
| Total | 1,452 (100.0%) | 1,096 (100.0%) |
Commute Time in River Park
The most frequently occuring commute durations in River Park are 15 to 19 minutes (573 commuters, 24.1%), 20 to 24 minutes (444 commuters, 18.7%), and 30 to 34 minutes (441 commuters, 18.5%).
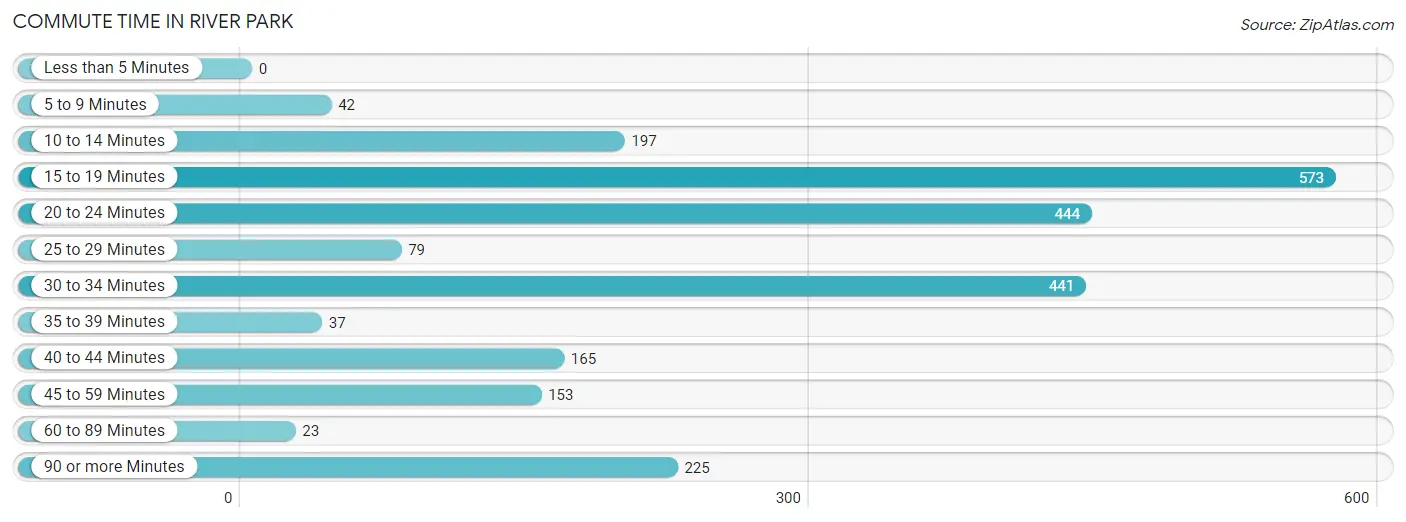
| Commute Time | # Commuters | % Commuters |
| Less than 5 Minutes | 0 | 0.0% |
| 5 to 9 Minutes | 42 | 1.8% |
| 10 to 14 Minutes | 197 | 8.3% |
| 15 to 19 Minutes | 573 | 24.1% |
| 20 to 24 Minutes | 444 | 18.7% |
| 25 to 29 Minutes | 79 | 3.3% |
| 30 to 34 Minutes | 441 | 18.5% |
| 35 to 39 Minutes | 37 | 1.6% |
| 40 to 44 Minutes | 165 | 6.9% |
| 45 to 59 Minutes | 153 | 6.4% |
| 60 to 89 Minutes | 23 | 1.0% |
| 90 or more Minutes | 225 | 9.5% |
Commute Time by Sex in River Park
The most common commute times in River Park are 15 to 19 minutes (463 commuters, 32.3%) for males and 20 to 24 minutes (302 commuters, 31.9%) for females.
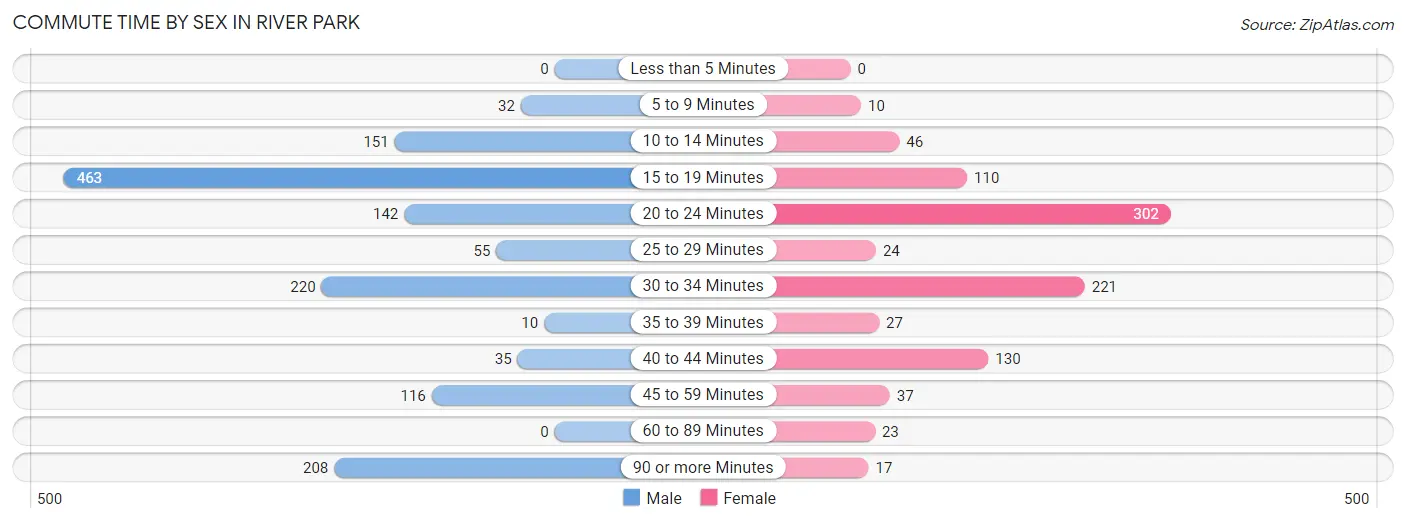
| Commute Time | Male | Female |
| Less than 5 Minutes | 0 (0.0%) | 0 (0.0%) |
| 5 to 9 Minutes | 32 (2.2%) | 10 (1.1%) |
| 10 to 14 Minutes | 151 (10.5%) | 46 (4.9%) |
| 15 to 19 Minutes | 463 (32.3%) | 110 (11.6%) |
| 20 to 24 Minutes | 142 (9.9%) | 302 (31.9%) |
| 25 to 29 Minutes | 55 (3.8%) | 24 (2.5%) |
| 30 to 34 Minutes | 220 (15.4%) | 221 (23.3%) |
| 35 to 39 Minutes | 10 (0.7%) | 27 (2.9%) |
| 40 to 44 Minutes | 35 (2.4%) | 130 (13.7%) |
| 45 to 59 Minutes | 116 (8.1%) | 37 (3.9%) |
| 60 to 89 Minutes | 0 (0.0%) | 23 (2.4%) |
| 90 or more Minutes | 208 (14.5%) | 17 (1.8%) |
Time of Departure to Work by Sex in River Park
The most frequent times of departure to work in River Park are 7:00 AM to 7:29 AM (415, 29.0%) for males and 12:00 PM to 3:59 PM (201, 21.2%) for females.
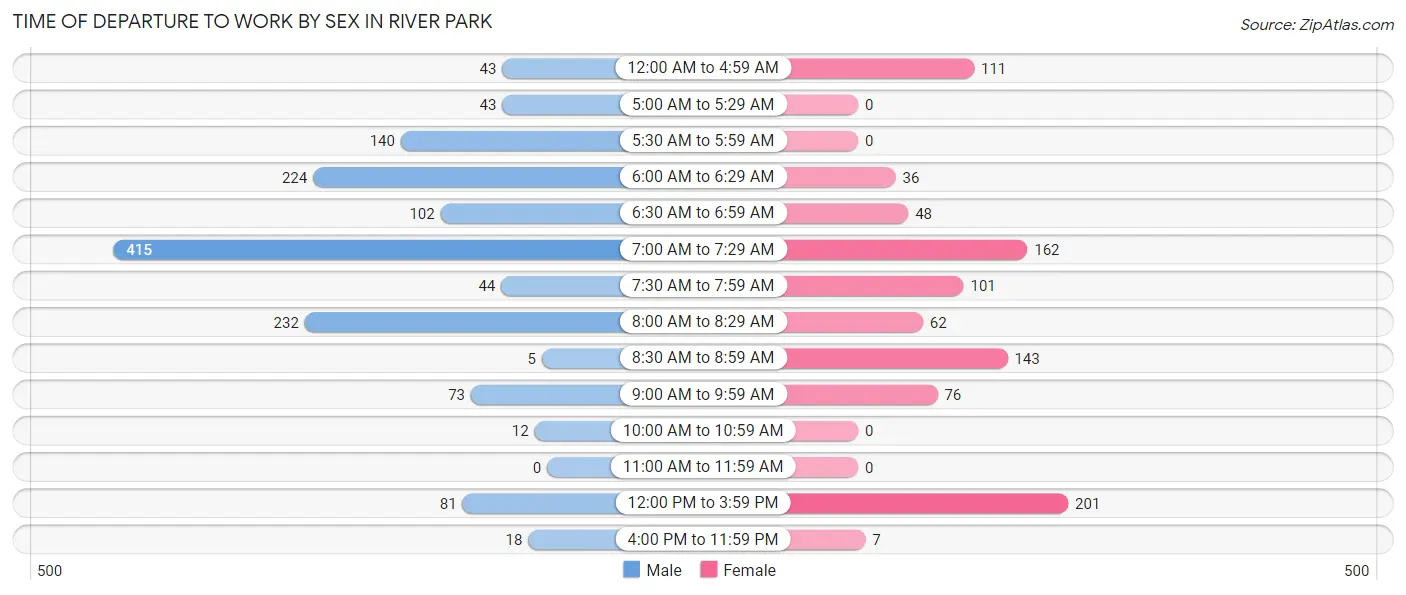
| Time of Departure | Male | Female |
| 12:00 AM to 4:59 AM | 43 (3.0%) | 111 (11.7%) |
| 5:00 AM to 5:29 AM | 43 (3.0%) | 0 (0.0%) |
| 5:30 AM to 5:59 AM | 140 (9.8%) | 0 (0.0%) |
| 6:00 AM to 6:29 AM | 224 (15.6%) | 36 (3.8%) |
| 6:30 AM to 6:59 AM | 102 (7.1%) | 48 (5.1%) |
| 7:00 AM to 7:29 AM | 415 (29.0%) | 162 (17.1%) |
| 7:30 AM to 7:59 AM | 44 (3.1%) | 101 (10.7%) |
| 8:00 AM to 8:29 AM | 232 (16.2%) | 62 (6.6%) |
| 8:30 AM to 8:59 AM | 5 (0.4%) | 143 (15.1%) |
| 9:00 AM to 9:59 AM | 73 (5.1%) | 76 (8.0%) |
| 10:00 AM to 10:59 AM | 12 (0.8%) | 0 (0.0%) |
| 11:00 AM to 11:59 AM | 0 (0.0%) | 0 (0.0%) |
| 12:00 PM to 3:59 PM | 81 (5.7%) | 201 (21.2%) |
| 4:00 PM to 11:59 PM | 18 (1.3%) | 7 (0.7%) |
| Total | 1,432 (100.0%) | 947 (100.0%) |
Housing Occupancy in River Park
Occupancy by Ownership in River Park
Of the total 2,455 dwellings in River Park, owner-occupied units account for 1,774 (72.3%), while renter-occupied units make up 681 (27.7%).
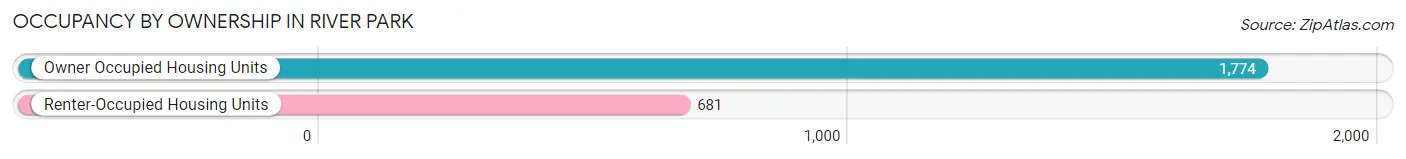
| Occupancy | # Housing Units | % Housing Units |
| Owner Occupied Housing Units | 1,774 | 72.3% |
| Renter-Occupied Housing Units | 681 | 27.7% |
| Total Occupied Housing Units | 2,455 | 100.0% |
Occupancy by Household Size in River Park
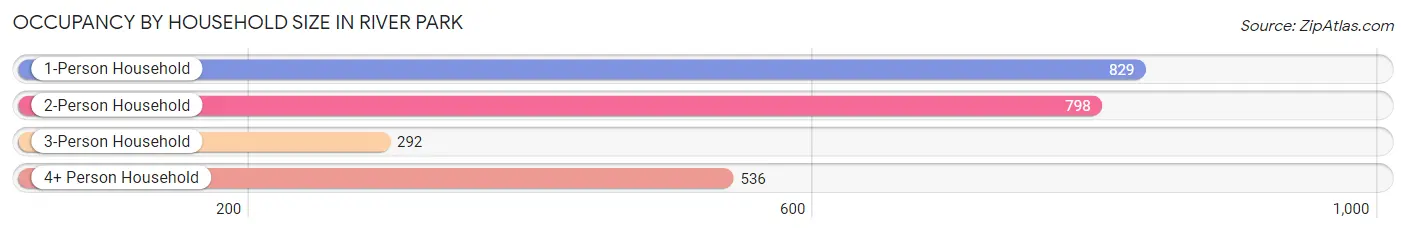
| Household Size | # Housing Units | % Housing Units |
| 1-Person Household | 829 | 33.8% |
| 2-Person Household | 798 | 32.5% |
| 3-Person Household | 292 | 11.9% |
| 4+ Person Household | 536 | 21.8% |
| Total Housing Units | 2,455 | 100.0% |
Occupancy by Ownership by Household Size in River Park
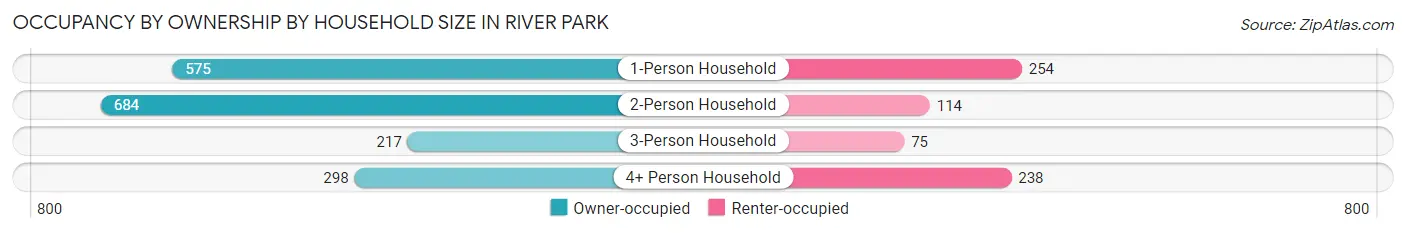
| Household Size | Owner-occupied | Renter-occupied |
| 1-Person Household | 575 (69.4%) | 254 (30.6%) |
| 2-Person Household | 684 (85.7%) | 114 (14.3%) |
| 3-Person Household | 217 (74.3%) | 75 (25.7%) |
| 4+ Person Household | 298 (55.6%) | 238 (44.4%) |
| Total Housing Units | 1,774 (72.3%) | 681 (27.7%) |
Occupancy by Educational Attainment in River Park
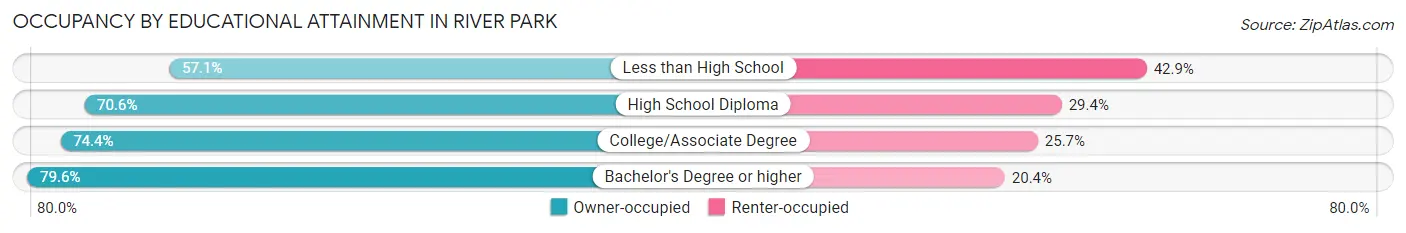
| Household Size | Owner-occupied | Renter-occupied |
| Less than High School | 145 (57.1%) | 109 (42.9%) |
| High School Diploma | 566 (70.6%) | 236 (29.4%) |
| College/Associate Degree | 716 (74.4%) | 247 (25.7%) |
| Bachelor's Degree or higher | 347 (79.6%) | 89 (20.4%) |
Occupancy by Age of Householder in River Park
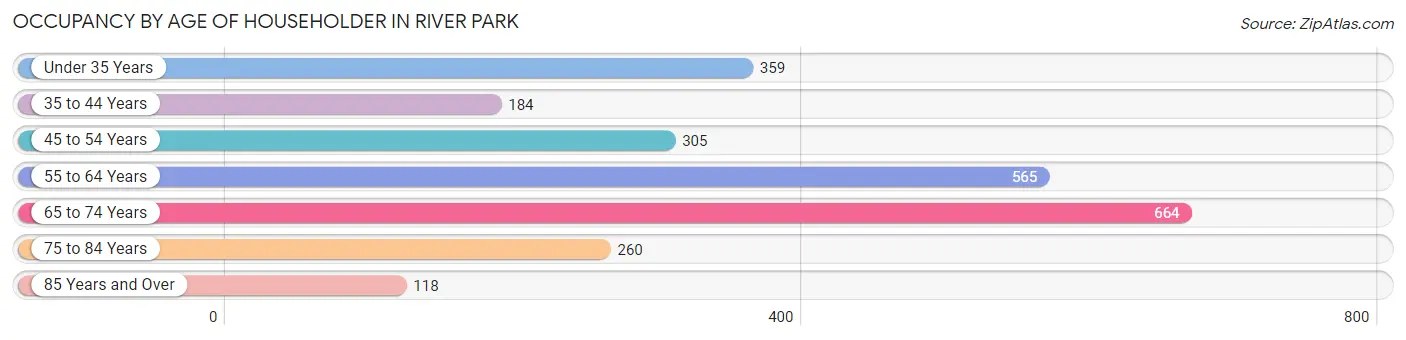
| Age Bracket | # Households | % Households |
| Under 35 Years | 359 | 14.6% |
| 35 to 44 Years | 184 | 7.5% |
| 45 to 54 Years | 305 | 12.4% |
| 55 to 64 Years | 565 | 23.0% |
| 65 to 74 Years | 664 | 27.1% |
| 75 to 84 Years | 260 | 10.6% |
| 85 Years and Over | 118 | 4.8% |
| Total | 2,455 | 100.0% |
Housing Finances in River Park
Median Income by Occupancy in River Park
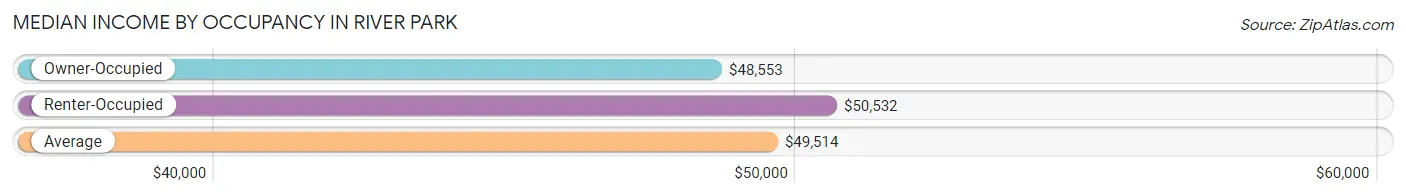
| Occupancy Type | # Households | Median Income |
| Owner-Occupied | 1,774 (72.3%) | $48,553 |
| Renter-Occupied | 681 (27.7%) | $50,532 |
| Average | 2,455 (100.0%) | $49,514 |
Occupancy by Householder Income Bracket in River Park
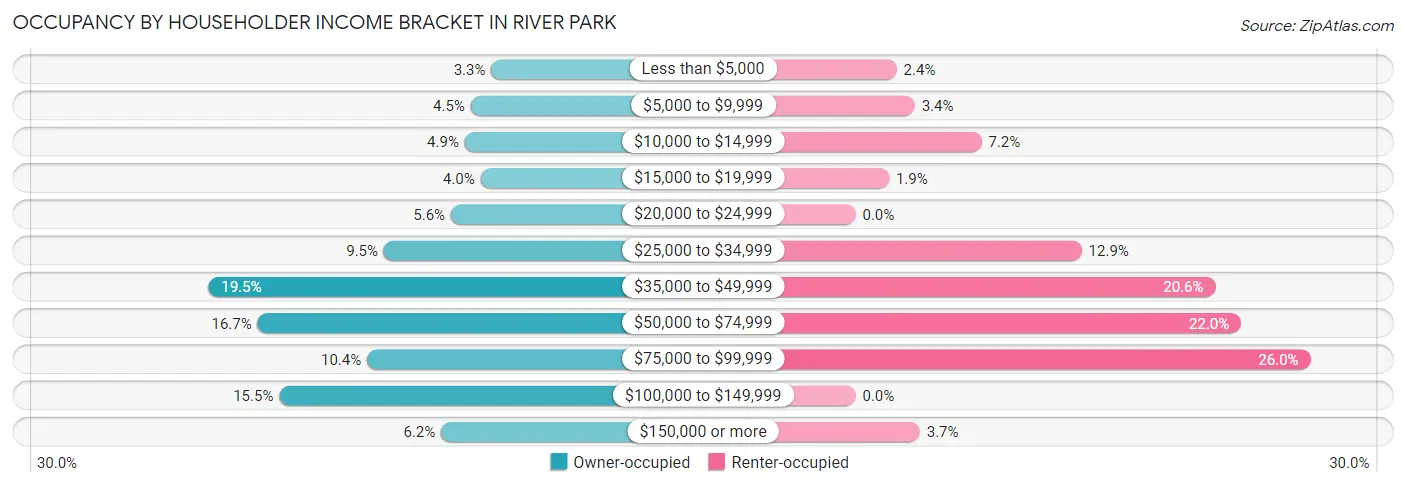
| Income Bracket | Owner-occupied | Renter-occupied |
| Less than $5,000 | 59 (3.3%) | 16 (2.4%) |
| $5,000 to $9,999 | 80 (4.5%) | 23 (3.4%) |
| $10,000 to $14,999 | 86 (4.9%) | 49 (7.2%) |
| $15,000 to $19,999 | 70 (4.0%) | 13 (1.9%) |
| $20,000 to $24,999 | 100 (5.6%) | 0 (0.0%) |
| $25,000 to $34,999 | 168 (9.5%) | 88 (12.9%) |
| $35,000 to $49,999 | 346 (19.5%) | 140 (20.6%) |
| $50,000 to $74,999 | 296 (16.7%) | 150 (22.0%) |
| $75,000 to $99,999 | 185 (10.4%) | 177 (26.0%) |
| $100,000 to $149,999 | 274 (15.4%) | 0 (0.0%) |
| $150,000 or more | 110 (6.2%) | 25 (3.7%) |
| Total | 1,774 (100.0%) | 681 (100.0%) |
Monthly Housing Cost Tiers in River Park
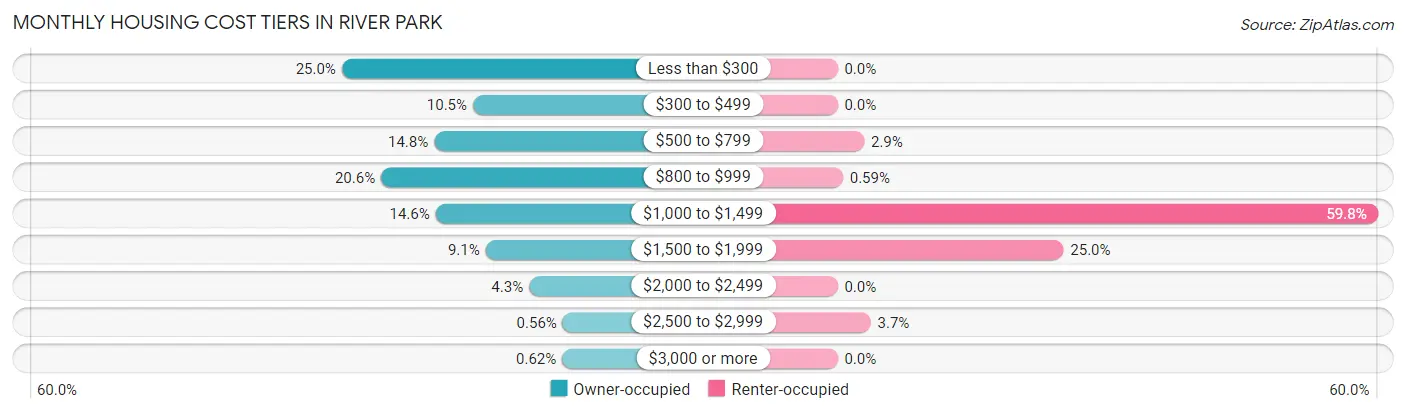
| Monthly Cost | Owner-occupied | Renter-occupied |
| Less than $300 | 443 (25.0%) | 0 (0.0%) |
| $300 to $499 | 186 (10.5%) | 0 (0.0%) |
| $500 to $799 | 262 (14.8%) | 20 (2.9%) |
| $800 to $999 | 366 (20.6%) | 4 (0.6%) |
| $1,000 to $1,499 | 259 (14.6%) | 407 (59.8%) |
| $1,500 to $1,999 | 161 (9.1%) | 170 (25.0%) |
| $2,000 to $2,499 | 76 (4.3%) | 0 (0.0%) |
| $2,500 to $2,999 | 10 (0.6%) | 25 (3.7%) |
| $3,000 or more | 11 (0.6%) | 0 (0.0%) |
| Total | 1,774 (100.0%) | 681 (100.0%) |
Physical Housing Characteristics in River Park
Housing Structures in River Park
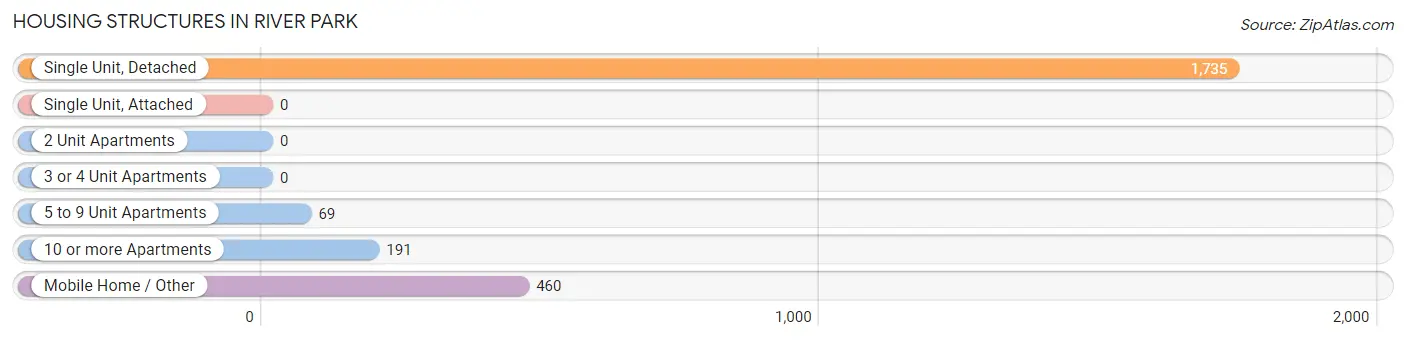
| Structure Type | # Housing Units | % Housing Units |
| Single Unit, Detached | 1,735 | 70.7% |
| Single Unit, Attached | 0 | 0.0% |
| 2 Unit Apartments | 0 | 0.0% |
| 3 or 4 Unit Apartments | 0 | 0.0% |
| 5 to 9 Unit Apartments | 69 | 2.8% |
| 10 or more Apartments | 191 | 7.8% |
| Mobile Home / Other | 460 | 18.7% |
| Total | 2,455 | 100.0% |
Housing Structures by Occupancy in River Park
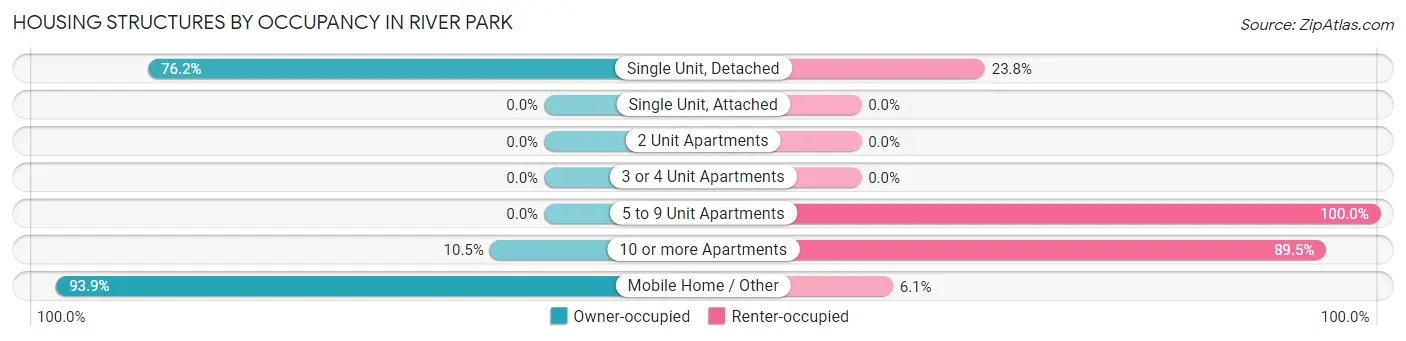
| Structure Type | Owner-occupied | Renter-occupied |
| Single Unit, Detached | 1,322 (76.2%) | 413 (23.8%) |
| Single Unit, Attached | 0 (0.0%) | 0 (0.0%) |
| 2 Unit Apartments | 0 (0.0%) | 0 (0.0%) |
| 3 or 4 Unit Apartments | 0 (0.0%) | 0 (0.0%) |
| 5 to 9 Unit Apartments | 0 (0.0%) | 69 (100.0%) |
| 10 or more Apartments | 20 (10.5%) | 171 (89.5%) |
| Mobile Home / Other | 432 (93.9%) | 28 (6.1%) |
| Total | 1,774 (72.3%) | 681 (27.7%) |
Housing Structures by Number of Rooms in River Park
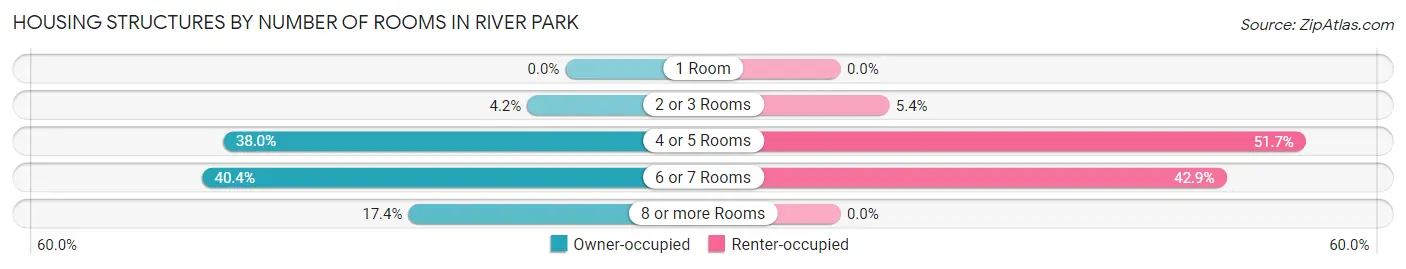
| Number of Rooms | Owner-occupied | Renter-occupied |
| 1 Room | 0 (0.0%) | 0 (0.0%) |
| 2 or 3 Rooms | 75 (4.2%) | 37 (5.4%) |
| 4 or 5 Rooms | 674 (38.0%) | 352 (51.7%) |
| 6 or 7 Rooms | 716 (40.4%) | 292 (42.9%) |
| 8 or more Rooms | 309 (17.4%) | 0 (0.0%) |
| Total | 1,774 (100.0%) | 681 (100.0%) |
Housing Structure by Heating Type in River Park
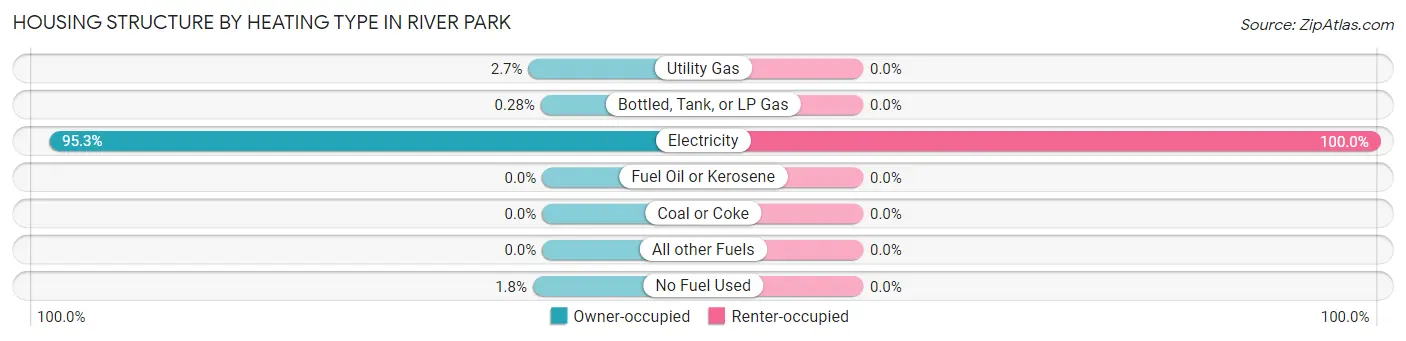
| Heating Type | Owner-occupied | Renter-occupied |
| Utility Gas | 47 (2.6%) | 0 (0.0%) |
| Bottled, Tank, or LP Gas | 5 (0.3%) | 0 (0.0%) |
| Electricity | 1,690 (95.3%) | 681 (100.0%) |
| Fuel Oil or Kerosene | 0 (0.0%) | 0 (0.0%) |
| Coal or Coke | 0 (0.0%) | 0 (0.0%) |
| All other Fuels | 0 (0.0%) | 0 (0.0%) |
| No Fuel Used | 32 (1.8%) | 0 (0.0%) |
| Total | 1,774 (100.0%) | 681 (100.0%) |
Household Vehicle Usage in River Park
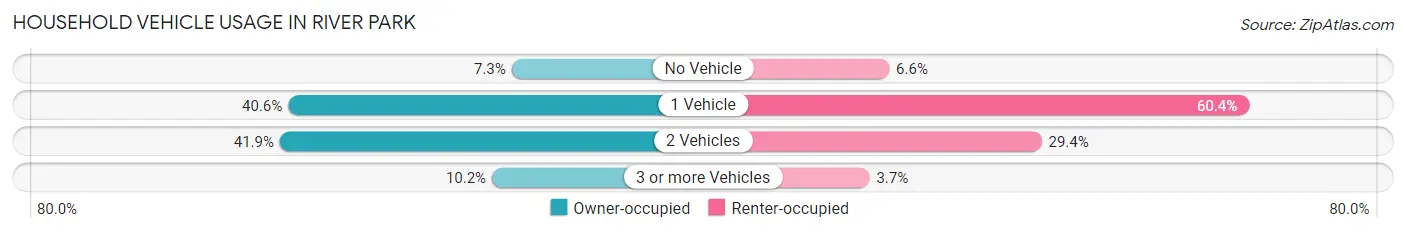
| Vehicles per Household | Owner-occupied | Renter-occupied |
| No Vehicle | 129 (7.3%) | 45 (6.6%) |
| 1 Vehicle | 721 (40.6%) | 411 (60.4%) |
| 2 Vehicles | 743 (41.9%) | 200 (29.4%) |
| 3 or more Vehicles | 181 (10.2%) | 25 (3.7%) |
| Total | 1,774 (100.0%) | 681 (100.0%) |
Real Estate & Mortgages in River Park
Real Estate and Mortgage Overview in River Park
| Characteristic | Without Mortgage | With Mortgage |
| Housing Units | 1,128 | 646 |
| Median Property Value | $152,700 | $196,200 |
| Median Household Income | $36,513 | $66 |
| Monthly Housing Costs | $426 | $11 |
| Real Estate Taxes | $1,654 | $18 |
Property Value by Mortgage Status in River Park
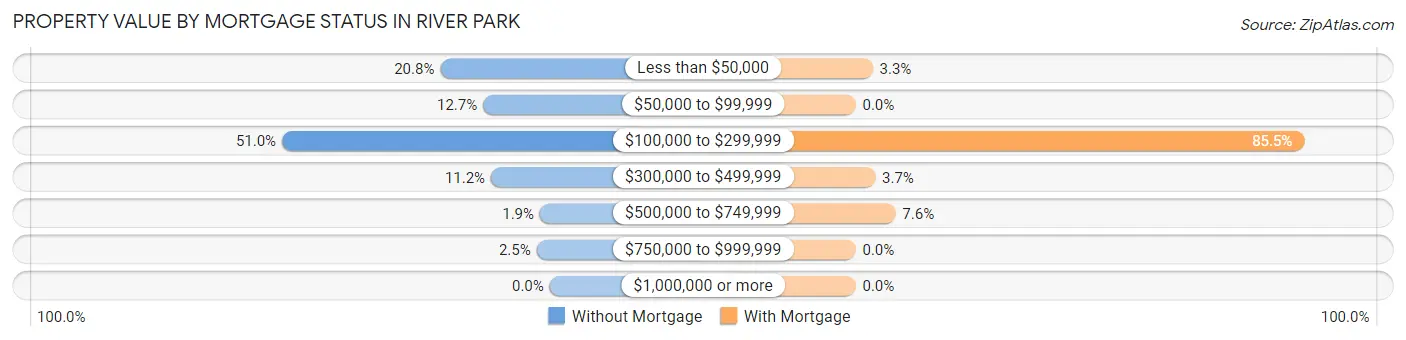
| Property Value | Without Mortgage | With Mortgage |
| Less than $50,000 | 235 (20.8%) | 21 (3.3%) |
| $50,000 to $99,999 | 143 (12.7%) | 0 (0.0%) |
| $100,000 to $299,999 | 575 (51.0%) | 552 (85.5%) |
| $300,000 to $499,999 | 126 (11.2%) | 24 (3.7%) |
| $500,000 to $749,999 | 21 (1.9%) | 49 (7.6%) |
| $750,000 to $999,999 | 28 (2.5%) | 0 (0.0%) |
| $1,000,000 or more | 0 (0.0%) | 0 (0.0%) |
| Total | 1,128 (100.0%) | 646 (100.0%) |
Household Income by Mortgage Status in River Park
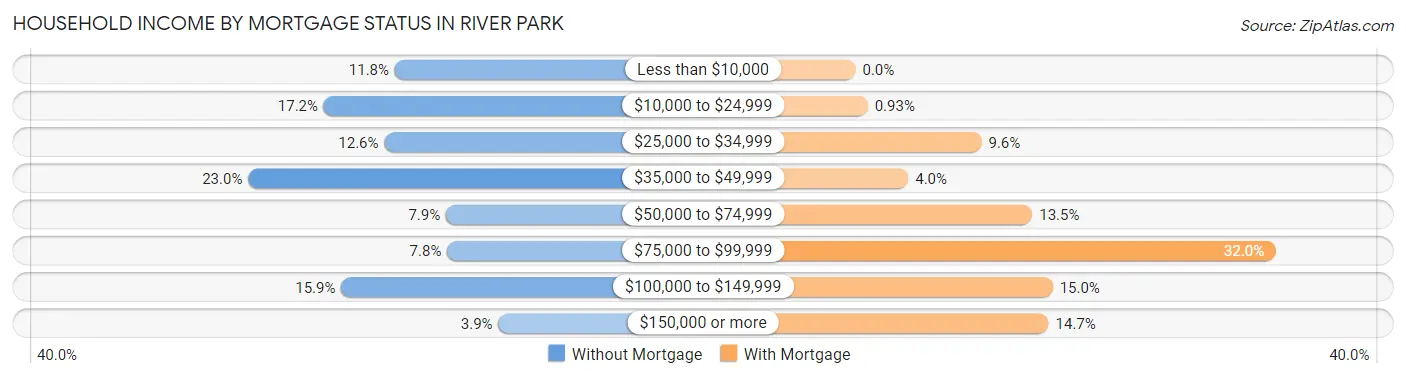
| Household Income | Without Mortgage | With Mortgage |
| Less than $10,000 | 133 (11.8%) | 0 (0.0%) |
| $10,000 to $24,999 | 194 (17.2%) | 6 (0.9%) |
| $25,000 to $34,999 | 142 (12.6%) | 62 (9.6%) |
| $35,000 to $49,999 | 259 (23.0%) | 26 (4.0%) |
| $50,000 to $74,999 | 89 (7.9%) | 87 (13.5%) |
| $75,000 to $99,999 | 88 (7.8%) | 207 (32.0%) |
| $100,000 to $149,999 | 179 (15.9%) | 97 (15.0%) |
| $150,000 or more | 44 (3.9%) | 95 (14.7%) |
| Total | 1,128 (100.0%) | 646 (100.0%) |
Property Value to Household Income Ratio in River Park
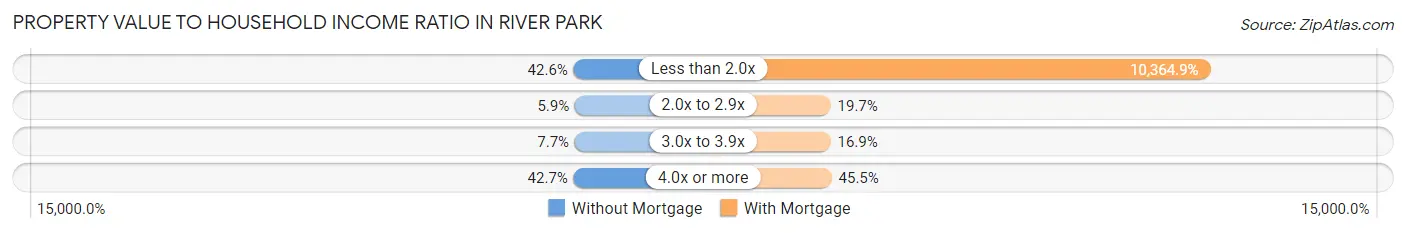
| Value-to-Income Ratio | Without Mortgage | With Mortgage |
| Less than 2.0x | 480 (42.5%) | 66,957 (10,364.9%) |
| 2.0x to 2.9x | 66 (5.9%) | 127 (19.7%) |
| 3.0x to 3.9x | 87 (7.7%) | 109 (16.9%) |
| 4.0x or more | 482 (42.7%) | 294 (45.5%) |
| Total | 1,128 (100.0%) | 646 (100.0%) |
Real Estate Taxes by Mortgage Status in River Park
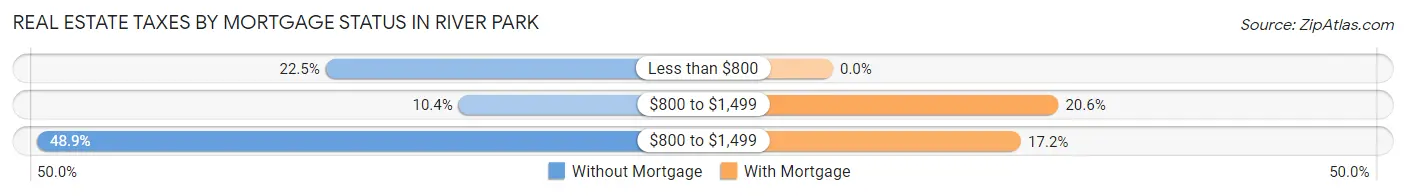
| Property Taxes | Without Mortgage | With Mortgage |
| Less than $800 | 254 (22.5%) | 0 (0.0%) |
| $800 to $1,499 | 117 (10.4%) | 133 (20.6%) |
| $800 to $1,499 | 551 (48.8%) | 111 (17.2%) |
| Total | 1,128 (100.0%) | 646 (100.0%) |
Health & Disability in River Park
Health Insurance Coverage by Age in River Park
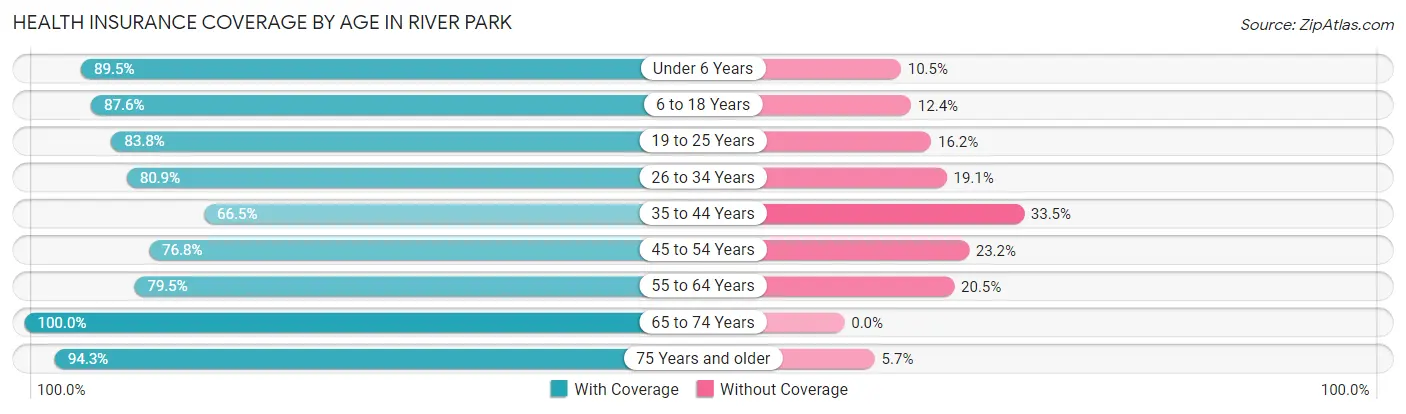
| Age Bracket | With Coverage | Without Coverage |
| Under 6 Years | 357 (89.5%) | 42 (10.5%) |
| 6 to 18 Years | 776 (87.6%) | 110 (12.4%) |
| 19 to 25 Years | 352 (83.8%) | 68 (16.2%) |
| 26 to 34 Years | 717 (80.9%) | 169 (19.1%) |
| 35 to 44 Years | 296 (66.5%) | 149 (33.5%) |
| 45 to 54 Years | 549 (76.8%) | 166 (23.2%) |
| 55 to 64 Years | 862 (79.5%) | 222 (20.5%) |
| 65 to 74 Years | 816 (100.0%) | 0 (0.0%) |
| 75 Years and older | 467 (94.3%) | 28 (5.7%) |
| Total | 5,192 (84.5%) | 954 (15.5%) |
Health Insurance Coverage by Citizenship Status in River Park
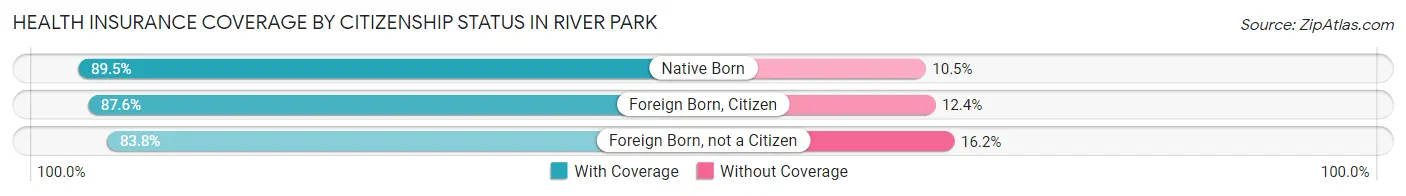
| Citizenship Status | With Coverage | Without Coverage |
| Native Born | 357 (89.5%) | 42 (10.5%) |
| Foreign Born, Citizen | 776 (87.6%) | 110 (12.4%) |
| Foreign Born, not a Citizen | 352 (83.8%) | 68 (16.2%) |
Health Insurance Coverage by Household Income in River Park
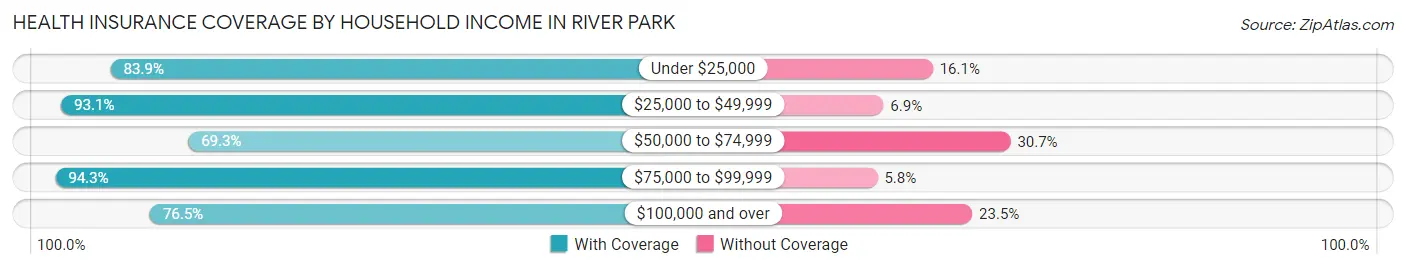
| Household Income | With Coverage | Without Coverage |
| Under $25,000 | 672 (83.9%) | 129 (16.1%) |
| $25,000 to $49,999 | 1,712 (93.1%) | 126 (6.9%) |
| $50,000 to $74,999 | 805 (69.3%) | 356 (30.7%) |
| $75,000 to $99,999 | 1,098 (94.3%) | 67 (5.8%) |
| $100,000 and over | 899 (76.5%) | 276 (23.5%) |
Public vs Private Health Insurance Coverage by Age in River Park
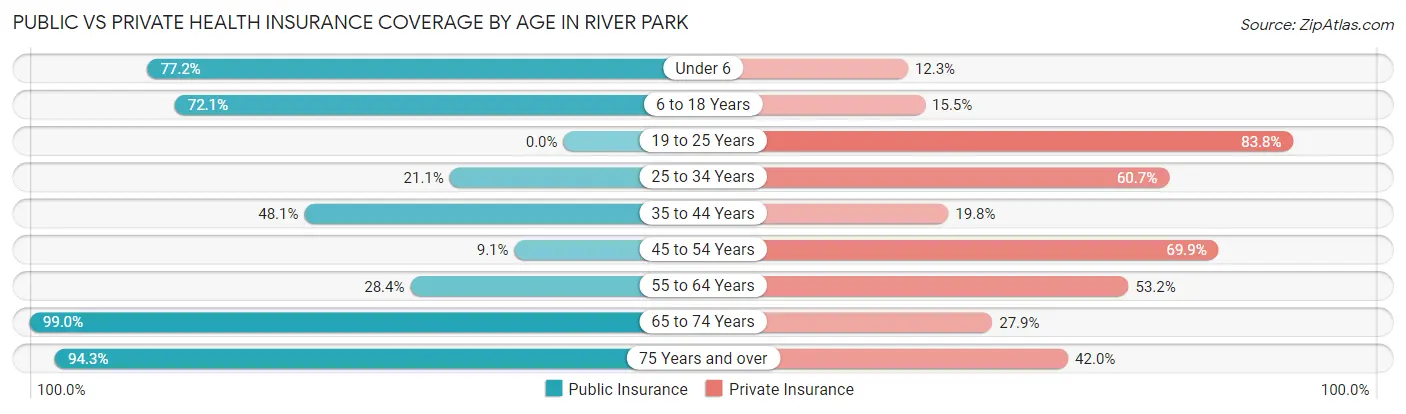
| Age Bracket | Public Insurance | Private Insurance |
| Under 6 | 308 (77.2%) | 49 (12.3%) |
| 6 to 18 Years | 639 (72.1%) | 137 (15.5%) |
| 19 to 25 Years | 0 (0.0%) | 352 (83.8%) |
| 25 to 34 Years | 187 (21.1%) | 538 (60.7%) |
| 35 to 44 Years | 214 (48.1%) | 88 (19.8%) |
| 45 to 54 Years | 65 (9.1%) | 500 (69.9%) |
| 55 to 64 Years | 308 (28.4%) | 577 (53.2%) |
| 65 to 74 Years | 808 (99.0%) | 228 (27.9%) |
| 75 Years and over | 467 (94.3%) | 208 (42.0%) |
| Total | 2,996 (48.7%) | 2,677 (43.6%) |
Disability Status by Sex by Age in River Park
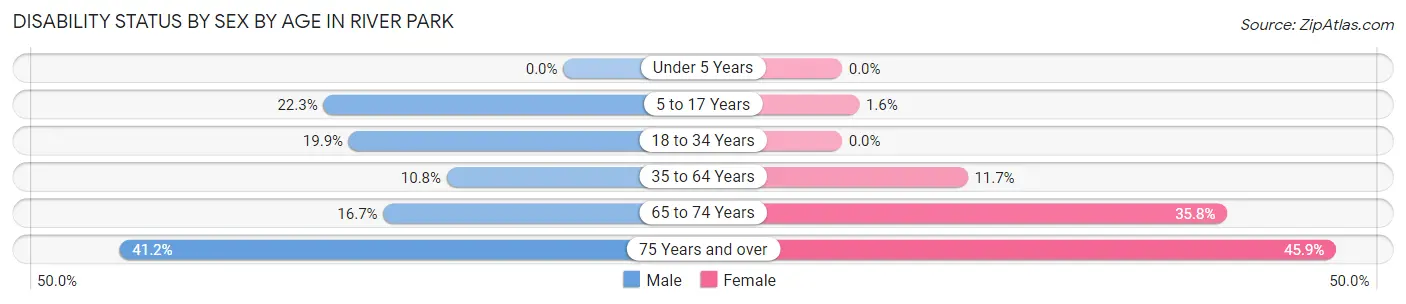
| Age Bracket | Male | Female |
| Under 5 Years | 0 (0.0%) | 0 (0.0%) |
| 5 to 17 Years | 63 (22.3%) | 10 (1.6%) |
| 18 to 34 Years | 161 (19.9%) | 0 (0.0%) |
| 35 to 64 Years | 110 (10.8%) | 143 (11.7%) |
| 65 to 74 Years | 77 (16.7%) | 127 (35.8%) |
| 75 Years and over | 89 (41.2%) | 128 (45.9%) |
Disability Class by Sex by Age in River Park
Disability Class: Hearing Difficulty
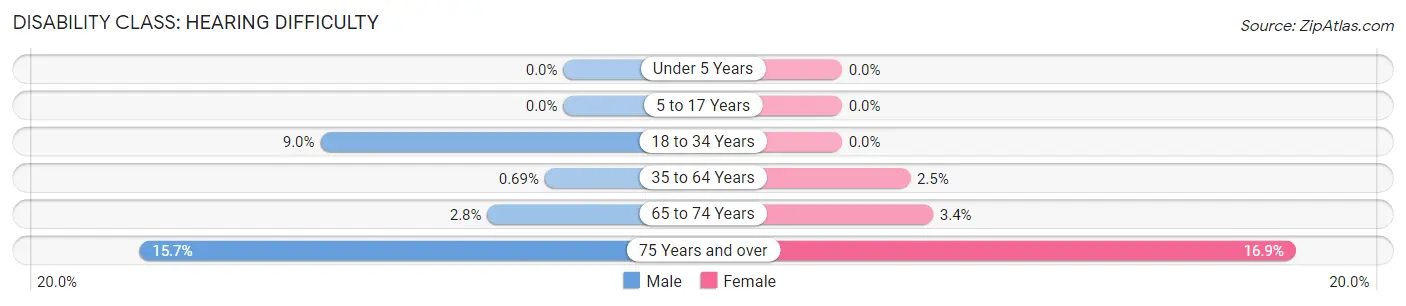
| Age Bracket | Male | Female |
| Under 5 Years | 0 (0.0%) | 0 (0.0%) |
| 5 to 17 Years | 0 (0.0%) | 0 (0.0%) |
| 18 to 34 Years | 73 (9.0%) | 0 (0.0%) |
| 35 to 64 Years | 7 (0.7%) | 31 (2.5%) |
| 65 to 74 Years | 13 (2.8%) | 12 (3.4%) |
| 75 Years and over | 34 (15.7%) | 47 (16.9%) |
Disability Class: Vision Difficulty
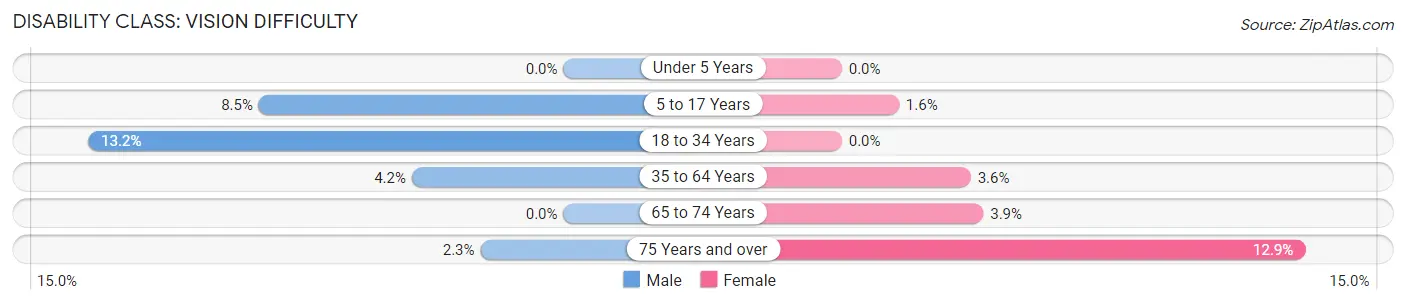
| Age Bracket | Male | Female |
| Under 5 Years | 0 (0.0%) | 0 (0.0%) |
| 5 to 17 Years | 24 (8.5%) | 10 (1.6%) |
| 18 to 34 Years | 107 (13.2%) | 0 (0.0%) |
| 35 to 64 Years | 43 (4.2%) | 44 (3.6%) |
| 65 to 74 Years | 0 (0.0%) | 14 (3.9%) |
| 75 Years and over | 5 (2.3%) | 36 (12.9%) |
Disability Class: Cognitive Difficulty
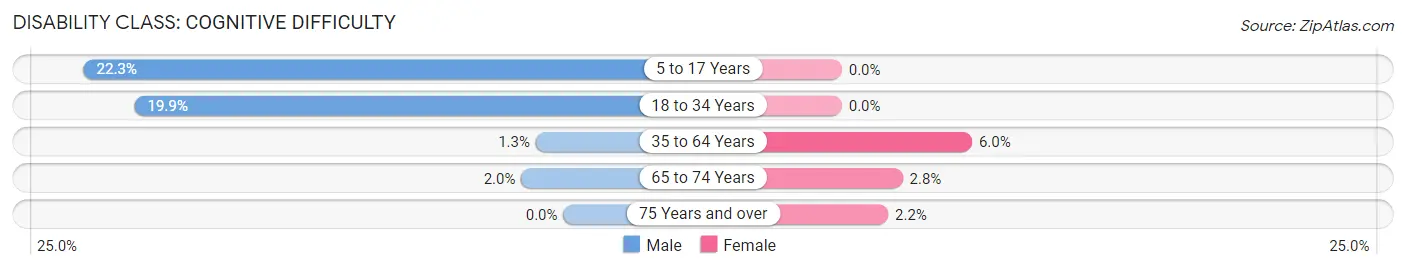
| Age Bracket | Male | Female |
| 5 to 17 Years | 63 (22.3%) | 0 (0.0%) |
| 18 to 34 Years | 161 (19.9%) | 0 (0.0%) |
| 35 to 64 Years | 13 (1.3%) | 74 (6.0%) |
| 65 to 74 Years | 9 (1.9%) | 10 (2.8%) |
| 75 Years and over | 0 (0.0%) | 6 (2.1%) |
Disability Class: Ambulatory Difficulty
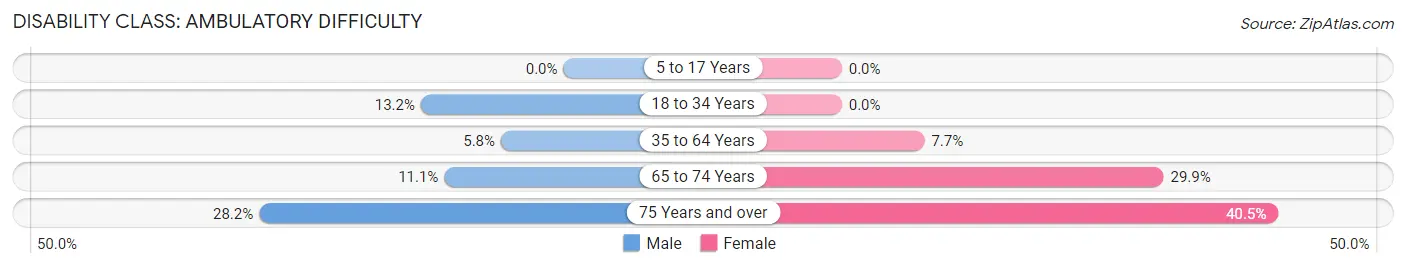
| Age Bracket | Male | Female |
| 5 to 17 Years | 0 (0.0%) | 0 (0.0%) |
| 18 to 34 Years | 107 (13.2%) | 0 (0.0%) |
| 35 to 64 Years | 59 (5.8%) | 94 (7.7%) |
| 65 to 74 Years | 51 (11.1%) | 106 (29.9%) |
| 75 Years and over | 61 (28.2%) | 113 (40.5%) |
Disability Class: Self-Care Difficulty
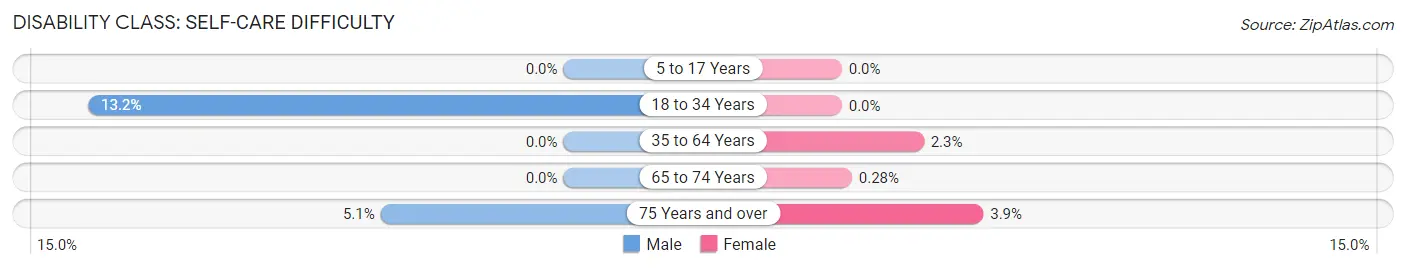
| Age Bracket | Male | Female |
| 5 to 17 Years | 0 (0.0%) | 0 (0.0%) |
| 18 to 34 Years | 107 (13.2%) | 0 (0.0%) |
| 35 to 64 Years | 0 (0.0%) | 28 (2.3%) |
| 65 to 74 Years | 0 (0.0%) | 1 (0.3%) |
| 75 Years and over | 11 (5.1%) | 11 (3.9%) |
Technology Access in River Park
Computing Device Access in River Park
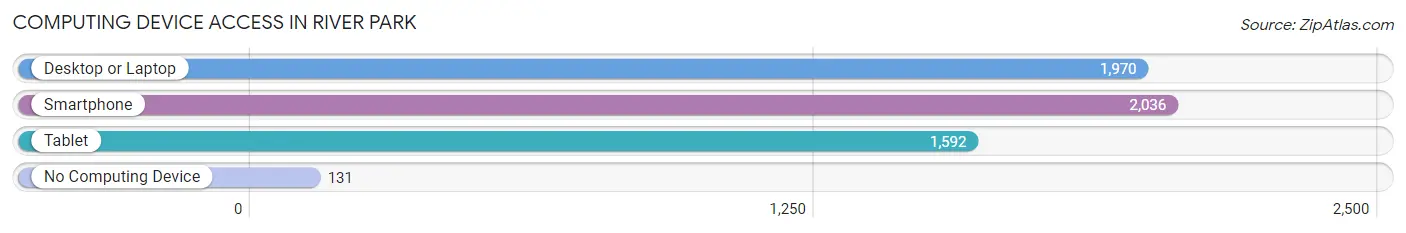
| Device Type | # Households | % Households |
| Desktop or Laptop | 1,970 | 80.2% |
| Smartphone | 2,036 | 82.9% |
| Tablet | 1,592 | 64.8% |
| No Computing Device | 131 | 5.3% |
| Total | 2,455 | 100.0% |
Internet Access in River Park
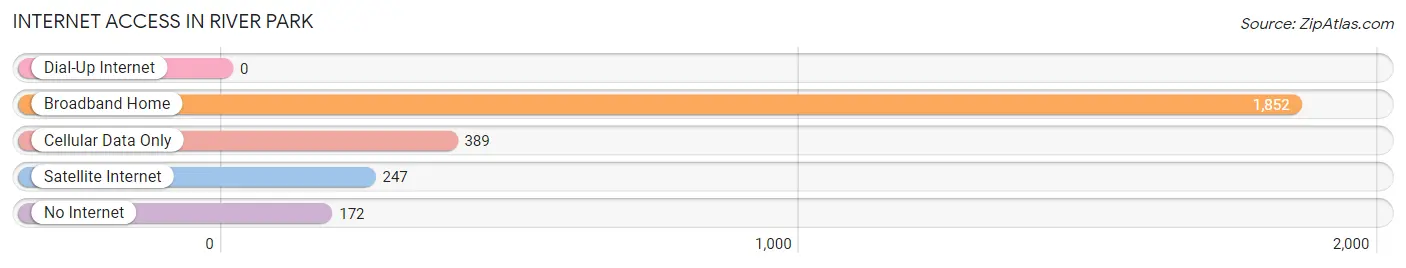
| Internet Type | # Households | % Households |
| Dial-Up Internet | 0 | 0.0% |
| Broadband Home | 1,852 | 75.4% |
| Cellular Data Only | 389 | 15.9% |
| Satellite Internet | 247 | 10.1% |
| No Internet | 172 | 7.0% |
| Total | 2,455 | 100.0% |
River Park Summary
Park River is a small town located in the state of Florida, United States. It is situated in the northern part of the state, in the county of Hillsborough. The town has a population of approximately 1,000 people, and is located near the Tampa Bay area.
History
Park River was founded in the late 19th century by a group of settlers from the nearby town of Tampa. The settlers were looking for a place to settle and start a new life, and Park River seemed to fit the bill. The town was named after the nearby river, which was used as a source of water for the settlers.
The town grew slowly over the years, and by the early 20th century, it had become a small but thriving community. The town was home to a variety of businesses, including a general store, a post office, a blacksmith shop, and a few other small businesses.
In the mid-20th century, Park River began to experience a period of growth and development. The town was home to a number of new businesses, including a grocery store, a hardware store, and a few other small businesses. The town also saw the construction of a new school, which was built in the 1950s.
Geography
Park River is located in the northern part of the state of Florida, in the county of Hillsborough. The town is situated on the banks of the Hillsborough River, which is a tributary of the Tampa Bay. The town is located approximately 25 miles north of Tampa, and is bordered by the towns of Brandon, Valrico, and Plant City.
The town is situated in a flat, low-lying area, and is surrounded by a number of small lakes and ponds. The town is also home to a number of parks and recreational areas, including the Hillsborough River State Park, which is located just outside of town.
Economy
The economy of Park River is largely based on agriculture and tourism. The town is home to a number of farms, which produce a variety of crops, including citrus fruits, vegetables, and hay. The town is also home to a number of tourist attractions, including the Hillsborough River State Park, which is a popular destination for fishing, boating, and camping.
The town is also home to a number of small businesses, including a grocery store, a hardware store, and a few other small businesses. The town is also home to a number of restaurants, which serve a variety of local and international cuisine.
Demographics
As of the 2010 census, the population of Park River was 1,000 people. The town is predominantly white, with approximately 90% of the population being white. The town is also home to a small Hispanic population, which makes up approximately 5% of the population. The town is also home to a small African American population, which makes up approximately 2% of the population. The town is also home to a small Asian population, which makes up approximately 1% of the population.
Common Questions
What is Per Capita Income in River Park?
Per Capita income in River Park is $26,002.
What is the Median Family Income in River Park?
Median Family Income in River Park is $58,311.
What is the Median Household income in River Park?
Median Household Income in River Park is $49,514.
What is Income or Wage Gap in River Park?
Income or Wage Gap in River Park is 18.5%.
Women in River Park earn 81.5 cents for every dollar earned by a man.
What is Inequality or Gini Index in River Park?
Inequality or Gini Index in River Park is 0.41.
What is the Total Population of River Park?
Total Population of River Park is 6,186.
What is the Total Male Population of River Park?
Total Male Population of River Park is 3,105.
What is the Total Female Population of River Park?
Total Female Population of River Park is 3,081.
What is the Ratio of Males per 100 Females in River Park?
There are 100.78 Males per 100 Females in River Park.
What is the Ratio of Females per 100 Males in River Park?
There are 99.23 Females per 100 Males in River Park.
What is the Median Population Age in River Park?
Median Population Age in River Park is 45.4 Years.
What is the Average Family Size in River Park
Average Family Size in River Park is 3.2 People.
What is the Average Household Size in River Park
Average Household Size in River Park is 2.5 People.
How Large is the Labor Force in River Park?
There are 2,854 People in the Labor Forcein in River Park.
What is the Percentage of People in the Labor Force in River Park?
56.6% of People are in the Labor Force in River Park.
What is the Unemployment Rate in River Park?
Unemployment Rate in River Park is 8.3%.