Bon Aqua Junction, TN Map & Demographics
Bon Aqua Junction Map
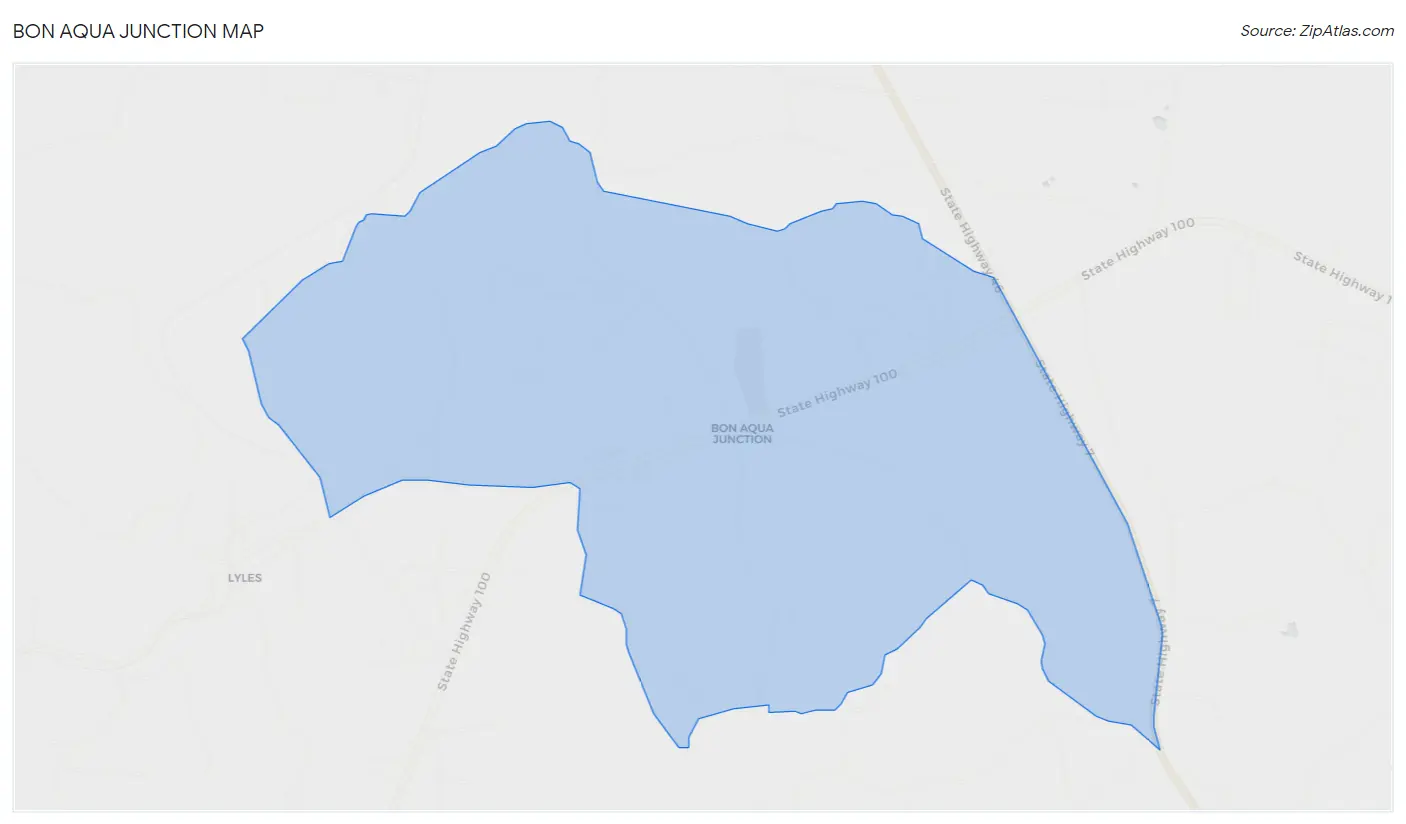
Bon Aqua Junction Overview
$18,920
PER CAPITA INCOME
$34,821
AVG FAMILY INCOME
$33,321
AVG HOUSEHOLD INCOME
14.4%
WAGE / INCOME GAP [ % ]
85.6¢/ $1
WAGE / INCOME GAP [ $ ]
0.45
INEQUALITY / GINI INDEX
1,677
TOTAL POPULATION
883
MALE POPULATION
794
FEMALE POPULATION
111.21
MALES / 100 FEMALES
89.92
FEMALES / 100 MALES
28.4
MEDIAN AGE
3.3
AVG FAMILY SIZE
3.0
AVG HOUSEHOLD SIZE
604
LABOR FORCE [ PEOPLE ]
54.2%
PERCENT IN LABOR FORCE
1.5%
UNEMPLOYMENT RATE
Income in Bon Aqua Junction
Income Overview in Bon Aqua Junction
Per Capita Income in Bon Aqua Junction is $18,920, while median incomes of families and households are $34,821 and $33,321 respectively.
| Characteristic | Number | Measure |
| Per Capita Income | 1,677 | $18,920 |
| Median Family Income | 381 | $34,821 |
| Mean Family Income | 381 | $56,940 |
| Median Household Income | 559 | $33,321 |
| Mean Household Income | 559 | $50,690 |
| Income Deficit | 381 | $0 |
| Wage / Income Gap (%) | 1,677 | 14.44% |
| Wage / Income Gap ($) | 1,677 | 85.56¢ per $1 |
| Gini / Inequality Index | 1,677 | 0.45 |
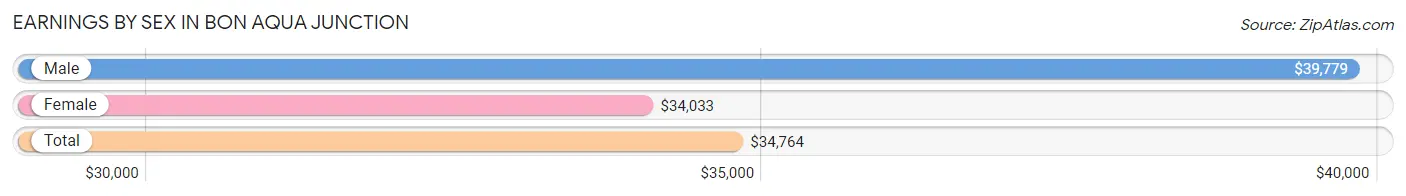
Earnings by Sex in Bon Aqua Junction
Average Earnings in Bon Aqua Junction are $34,764, $39,779 for men and $34,033 for women, a difference of 14.4%.
| Sex | Number | Average Earnings |
| Male | 289 (47.8%) | $39,779 |
| Female | 315 (52.1%) | $34,033 |
| Total | 604 (100.0%) | $34,764 |
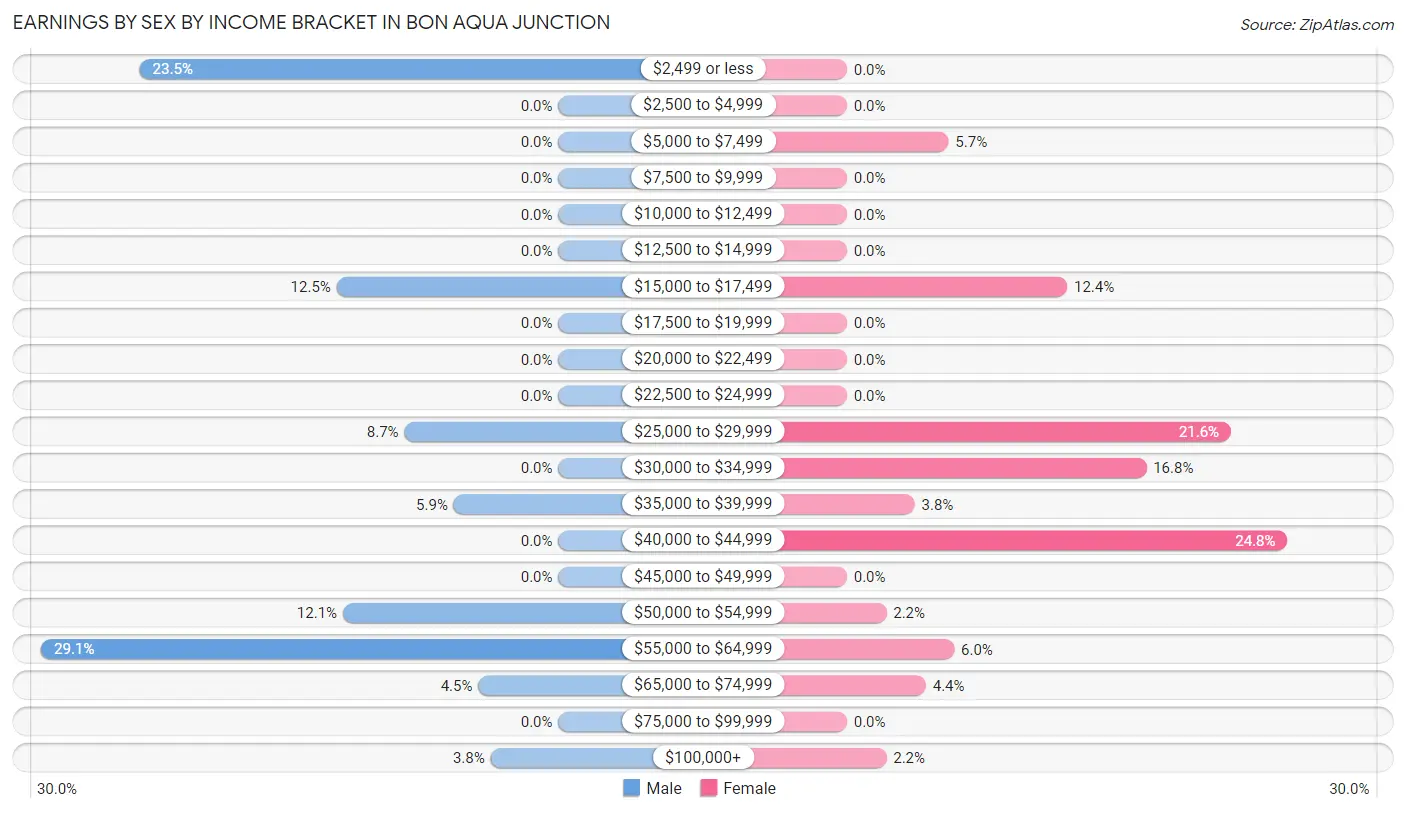
Earnings by Sex by Income Bracket in Bon Aqua Junction
The most common earnings brackets in Bon Aqua Junction are $55,000 to $64,999 for men (84 | 29.1%) and $40,000 to $44,999 for women (78 | 24.8%).
| Income | Male | Female |
| $2,499 or less | 68 (23.5%) | 0 (0.0%) |
| $2,500 to $4,999 | 0 (0.0%) | 0 (0.0%) |
| $5,000 to $7,499 | 0 (0.0%) | 18 (5.7%) |
| $7,500 to $9,999 | 0 (0.0%) | 0 (0.0%) |
| $10,000 to $12,499 | 0 (0.0%) | 0 (0.0%) |
| $12,500 to $14,999 | 0 (0.0%) | 0 (0.0%) |
| $15,000 to $17,499 | 36 (12.5%) | 39 (12.4%) |
| $17,500 to $19,999 | 0 (0.0%) | 0 (0.0%) |
| $20,000 to $22,499 | 0 (0.0%) | 0 (0.0%) |
| $22,500 to $24,999 | 0 (0.0%) | 0 (0.0%) |
| $25,000 to $29,999 | 25 (8.6%) | 68 (21.6%) |
| $30,000 to $34,999 | 0 (0.0%) | 53 (16.8%) |
| $35,000 to $39,999 | 17 (5.9%) | 12 (3.8%) |
| $40,000 to $44,999 | 0 (0.0%) | 78 (24.8%) |
| $45,000 to $49,999 | 0 (0.0%) | 0 (0.0%) |
| $50,000 to $54,999 | 35 (12.1%) | 7 (2.2%) |
| $55,000 to $64,999 | 84 (29.1%) | 19 (6.0%) |
| $65,000 to $74,999 | 13 (4.5%) | 14 (4.4%) |
| $75,000 to $99,999 | 0 (0.0%) | 0 (0.0%) |
| $100,000+ | 11 (3.8%) | 7 (2.2%) |
| Total | 289 (100.0%) | 315 (100.0%) |
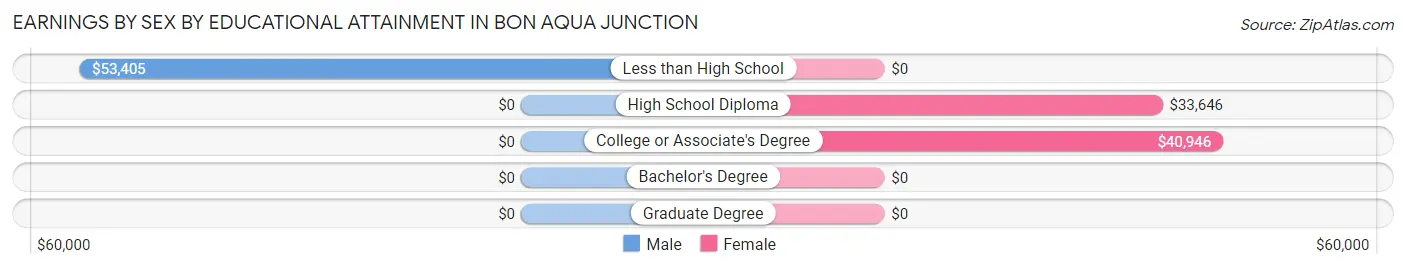
Earnings by Sex by Educational Attainment in Bon Aqua Junction
| Educational Attainment | Male Income | Female Income |
| Less than High School | $53,405 | $0 |
| High School Diploma | - | - |
| College or Associate's Degree | - | - |
| Bachelor's Degree | - | - |
| Graduate Degree | - | - |
| Total | - | - |
Family Income in Bon Aqua Junction
Family Income Brackets in Bon Aqua Junction
According to the Bon Aqua Junction family income data, there are 94 families falling into the $25,000 to $34,999 income range, which is the most common income bracket and makes up 24.7% of all families.
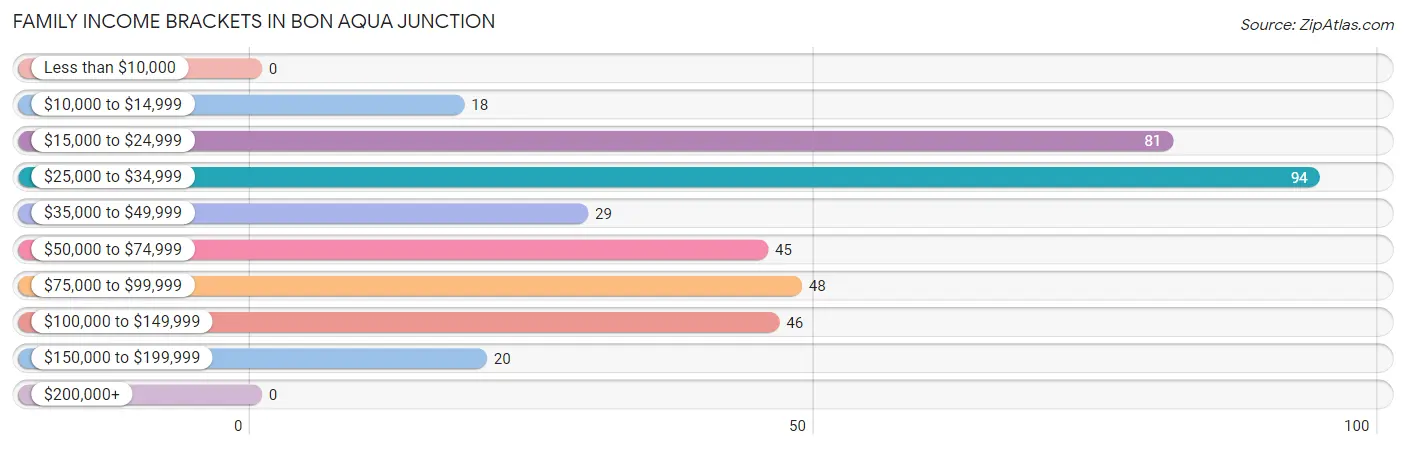
| Income Bracket | # Families | % Families |
| Less than $10,000 | 0 | 0.0% |
| $10,000 to $14,999 | 18 | 4.7% |
| $15,000 to $24,999 | 81 | 21.3% |
| $25,000 to $34,999 | 94 | 24.7% |
| $35,000 to $49,999 | 29 | 7.6% |
| $50,000 to $74,999 | 45 | 11.8% |
| $75,000 to $99,999 | 48 | 12.6% |
| $100,000 to $149,999 | 46 | 12.1% |
| $150,000 to $199,999 | 20 | 5.2% |
| $200,000+ | 0 | 0.0% |
Family Income by Famaliy Size in Bon Aqua Junction
4-person families (33 | 8.7%) account for the highest median family income in Bon Aqua Junction with $167,938 per family, while 4-person families (33 | 8.7%) have the highest median income of $41,984 per family member.
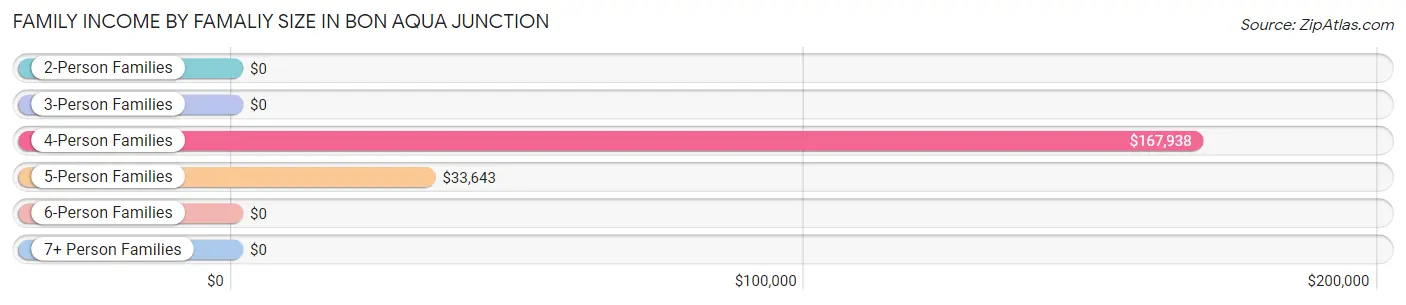
| Income Bracket | # Families | Median Income |
| 2-Person Families | 244 (64.0%) | $0 |
| 3-Person Families | 0 (0.0%) | $0 |
| 4-Person Families | 33 (8.7%) | $167,938 |
| 5-Person Families | 104 (27.3%) | $33,643 |
| 6-Person Families | 0 (0.0%) | $0 |
| 7+ Person Families | 0 (0.0%) | $0 |
| Total | 381 (100.0%) | $34,821 |
Family Income by Number of Earners in Bon Aqua Junction
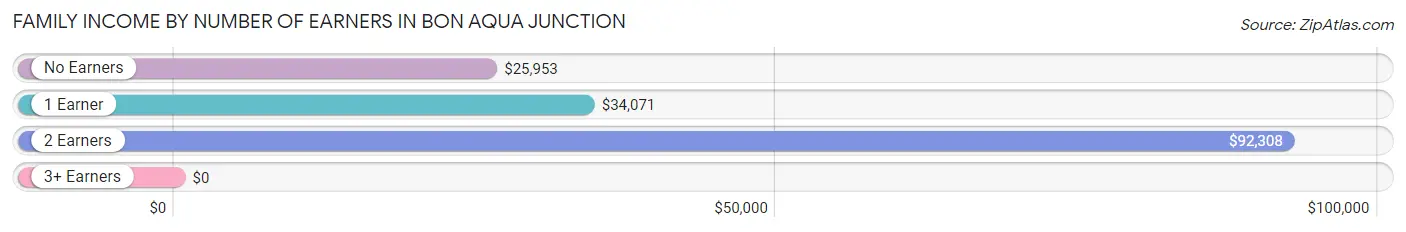
| Number of Earners | # Families | Median Income |
| No Earners | 135 (35.4%) | $25,953 |
| 1 Earner | 152 (39.9%) | $34,071 |
| 2 Earners | 94 (24.7%) | $92,308 |
| 3+ Earners | 0 (0.0%) | $0 |
| Total | 381 (100.0%) | $34,821 |
Household Income in Bon Aqua Junction
Household Income Brackets in Bon Aqua Junction
With 128 households falling in the category, the $15,000 to $24,999 income range is the most frequent in Bon Aqua Junction, accounting for 22.9% of all households.
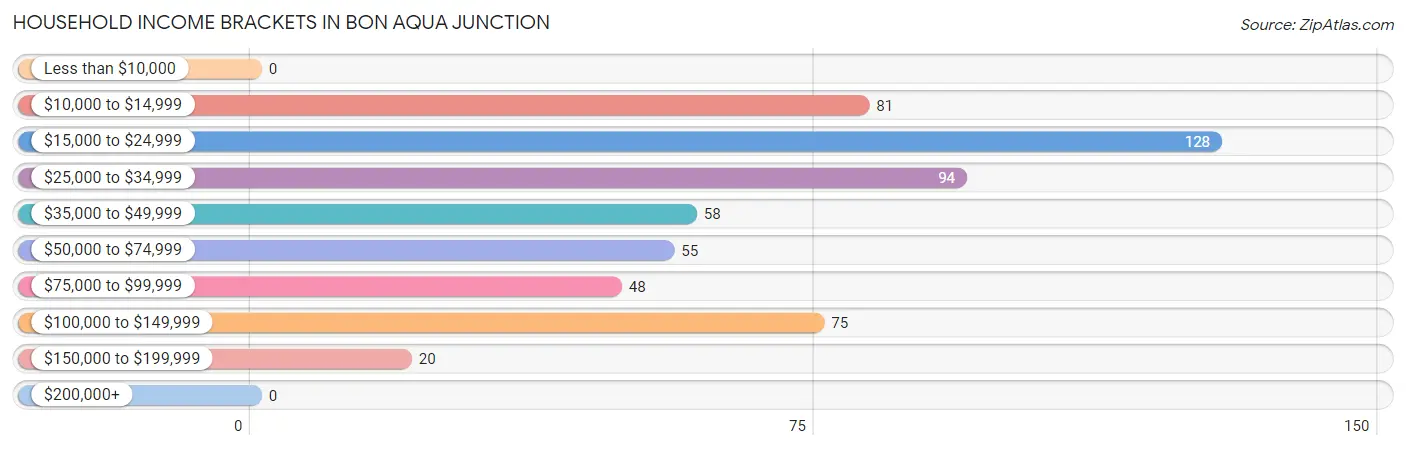
| Income Bracket | # Households | % Households |
| Less than $10,000 | 0 | 0.0% |
| $10,000 to $14,999 | 81 | 14.5% |
| $15,000 to $24,999 | 128 | 22.9% |
| $25,000 to $34,999 | 94 | 16.8% |
| $35,000 to $49,999 | 58 | 10.4% |
| $50,000 to $74,999 | 55 | 9.8% |
| $75,000 to $99,999 | 48 | 8.6% |
| $100,000 to $149,999 | 75 | 13.4% |
| $150,000 to $199,999 | 20 | 3.6% |
| $200,000+ | 0 | 0.0% |
Household Income by Householder Age in Bon Aqua Junction
| Income Bracket | # Households | Median Income |
| 15 to 24 Years | 35 (6.3%) | $0 |
| 25 to 44 Years | 221 (39.5%) | $0 |
| 45 to 64 Years | 175 (31.3%) | $0 |
| 65+ Years | 128 (22.9%) | $0 |
| Total | 559 (100.0%) | $33,321 |
Poverty in Bon Aqua Junction
Income Below Poverty by Sex and Age in Bon Aqua Junction
With 44.6% poverty level for males and 28.3% for females among the residents of Bon Aqua Junction, under 5 year old males and 25 to 34 year old females are the most vulnerable to poverty, with 33 males (100.0%) and 108 females (59.0%) in their respective age groups living below the poverty level.
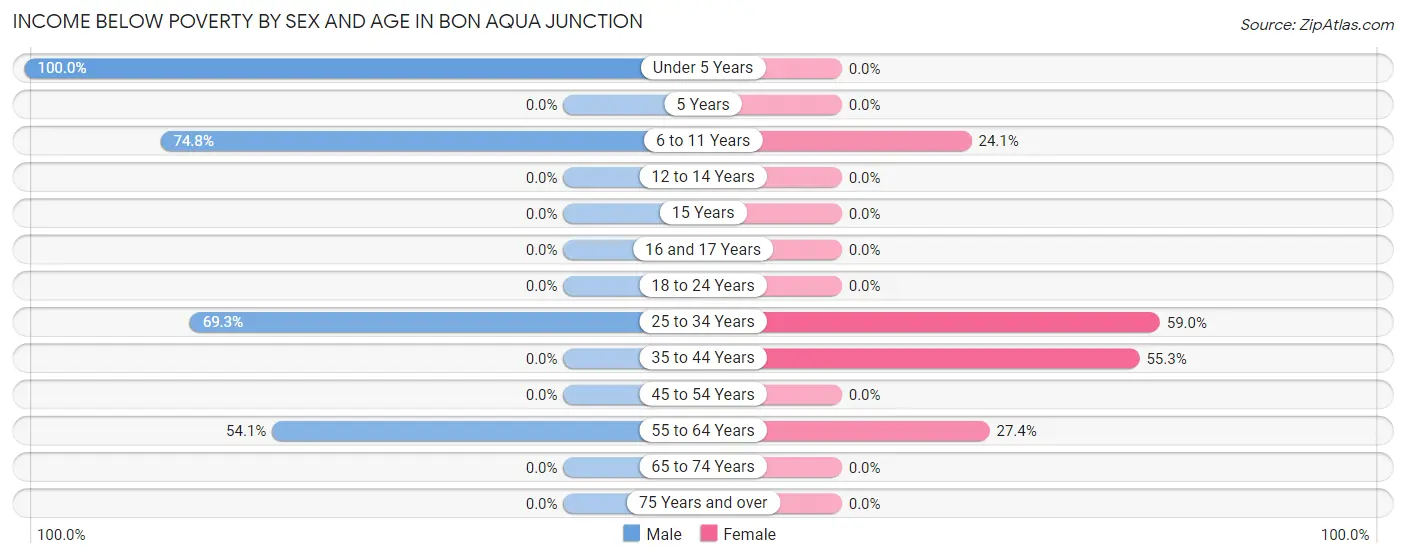
| Age Bracket | Male | Female |
| Under 5 Years | 33 (100.0%) | 0 (0.0%) |
| 5 Years | 0 (0.0%) | 0 (0.0%) |
| 6 to 11 Years | 231 (74.8%) | 33 (24.1%) |
| 12 to 14 Years | 0 (0.0%) | 0 (0.0%) |
| 15 Years | 0 (0.0%) | 0 (0.0%) |
| 16 and 17 Years | 0 (0.0%) | 0 (0.0%) |
| 18 to 24 Years | 0 (0.0%) | 0 (0.0%) |
| 25 to 34 Years | 104 (69.3%) | 108 (59.0%) |
| 35 to 44 Years | 0 (0.0%) | 63 (55.3%) |
| 45 to 54 Years | 0 (0.0%) | 0 (0.0%) |
| 55 to 64 Years | 20 (54.0%) | 17 (27.4%) |
| 65 to 74 Years | 0 (0.0%) | 0 (0.0%) |
| 75 Years and over | 0 (0.0%) | 0 (0.0%) |
| Total | 388 (44.6%) | 221 (28.3%) |
Income Above Poverty by Sex and Age in Bon Aqua Junction
According to the poverty statistics in Bon Aqua Junction, males aged 5 years and females aged under 5 years are the age groups that are most secure financially, with 100.0% of males and 100.0% of females in these age groups living above the poverty line.
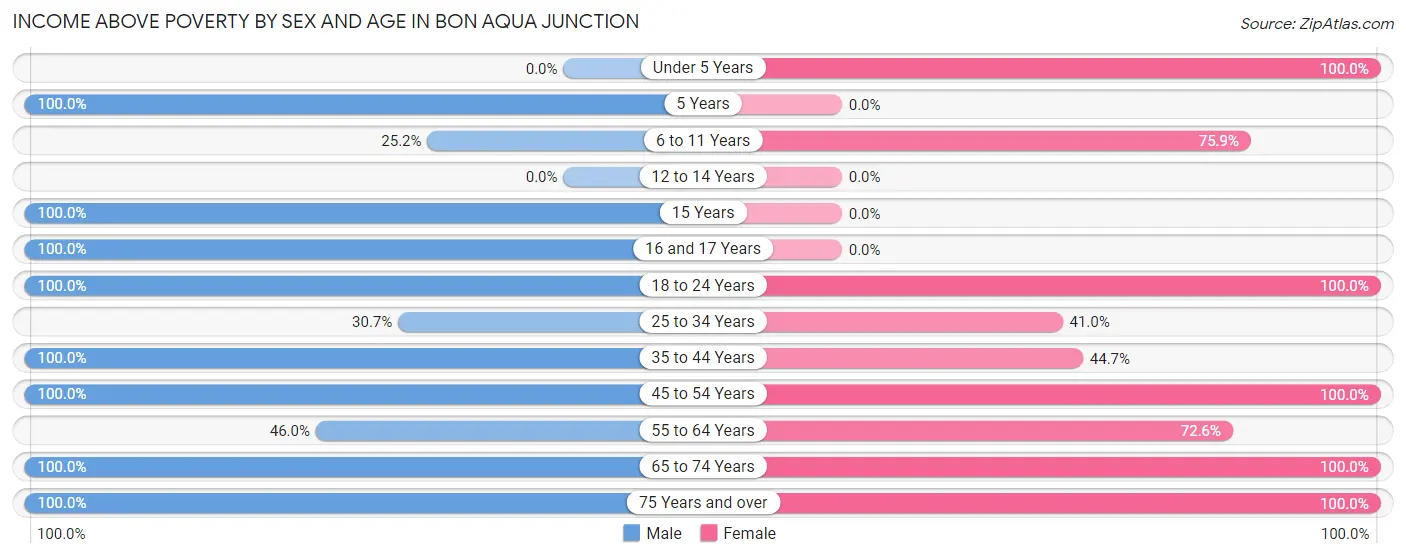
| Age Bracket | Male | Female |
| Under 5 Years | 0 (0.0%) | 7 (100.0%) |
| 5 Years | 10 (100.0%) | 0 (0.0%) |
| 6 to 11 Years | 78 (25.2%) | 104 (75.9%) |
| 12 to 14 Years | 0 (0.0%) | 0 (0.0%) |
| 15 Years | 40 (100.0%) | 0 (0.0%) |
| 16 and 17 Years | 6 (100.0%) | 0 (0.0%) |
| 18 to 24 Years | 85 (100.0%) | 35 (100.0%) |
| 25 to 34 Years | 46 (30.7%) | 75 (41.0%) |
| 35 to 44 Years | 96 (100.0%) | 51 (44.7%) |
| 45 to 54 Years | 66 (100.0%) | 127 (100.0%) |
| 55 to 64 Years | 17 (46.0%) | 45 (72.6%) |
| 65 to 74 Years | 20 (100.0%) | 36 (100.0%) |
| 75 Years and over | 19 (100.0%) | 79 (100.0%) |
| Total | 483 (55.4%) | 559 (71.7%) |
Income Below Poverty Among Married-Couple Families in Bon Aqua Junction
The poverty statistics for married-couple families in Bon Aqua Junction show that 22.4% or 36 of the total 161 families live below the poverty line. Families with 3 or 4 children have the highest poverty rate of 100.0%, comprising of 36 families. On the other hand, families with no children have the lowest poverty rate of 0.0%, which includes 0 families.
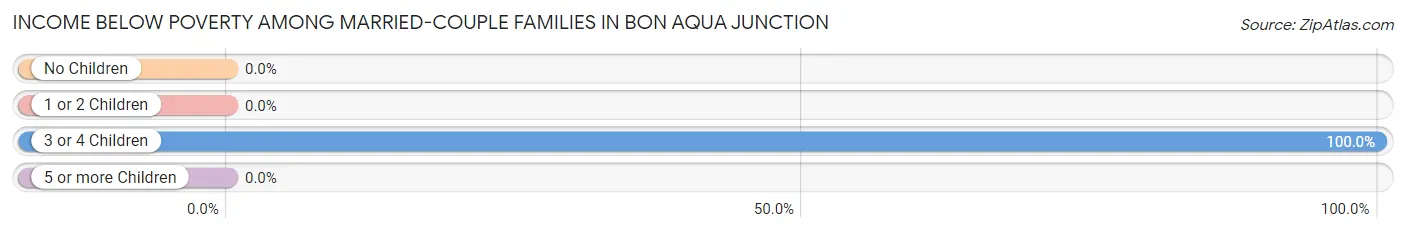
| Children | Above Poverty | Below Poverty |
| No Children | 112 (100.0%) | 0 (0.0%) |
| 1 or 2 Children | 13 (100.0%) | 0 (0.0%) |
| 3 or 4 Children | 0 (0.0%) | 36 (100.0%) |
| 5 or more Children | 0 (0.0%) | 0 (0.0%) |
| Total | 125 (77.6%) | 36 (22.4%) |
Income Below Poverty Among Single-Parent Households in Bon Aqua Junction
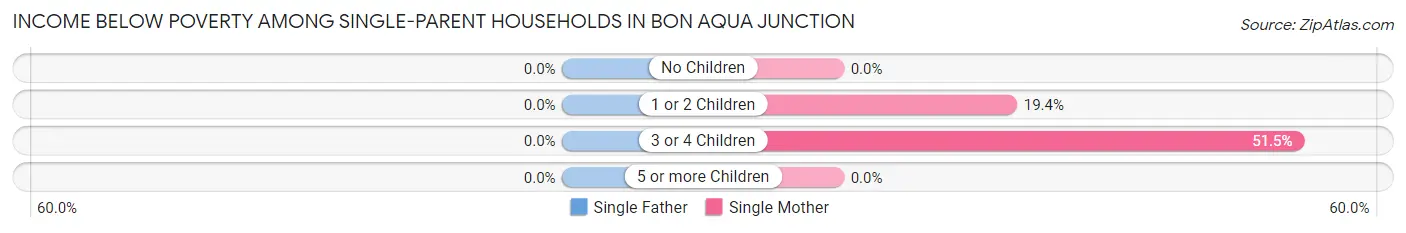
| Children | Single Father | Single Mother |
| No Children | 0 (0.0%) | 0 (0.0%) |
| 1 or 2 Children | 0 (0.0%) | 18 (19.4%) |
| 3 or 4 Children | 0 (0.0%) | 35 (51.5%) |
| 5 or more Children | 0 (0.0%) | 0 (0.0%) |
| Total | 0 (0.0%) | 53 (24.1%) |
Income Below Poverty Among Married-Couple vs Single-Parent Households in Bon Aqua Junction
The poverty data for Bon Aqua Junction shows that 36 of the married-couple family households (22.4%) and 53 of the single-parent households (24.1%) are living below the poverty level. Within the married-couple family households, those with 3 or 4 children have the highest poverty rate, with 36 households (100.0%) falling below the poverty line. Among the single-parent households, those with 3 or 4 children have the highest poverty rate, with 35 household (51.5%) living below poverty.
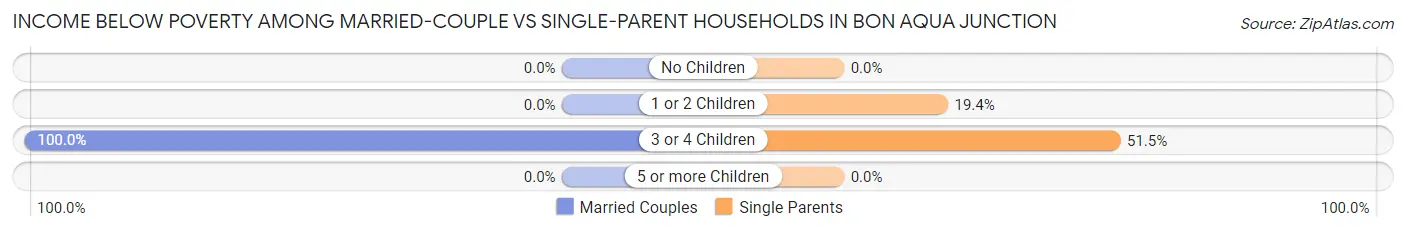
| Children | Married-Couple Families | Single-Parent Households |
| No Children | 0 (0.0%) | 0 (0.0%) |
| 1 or 2 Children | 0 (0.0%) | 18 (19.4%) |
| 3 or 4 Children | 36 (100.0%) | 35 (51.5%) |
| 5 or more Children | 0 (0.0%) | 0 (0.0%) |
| Total | 36 (22.4%) | 53 (24.1%) |
Race in Bon Aqua Junction
The most populous races in Bon Aqua Junction are White / Caucasian (1,448 | 86.3%), Two or more Races (207 | 12.3%), and Hispanic or Latino (68 | 4.1%).
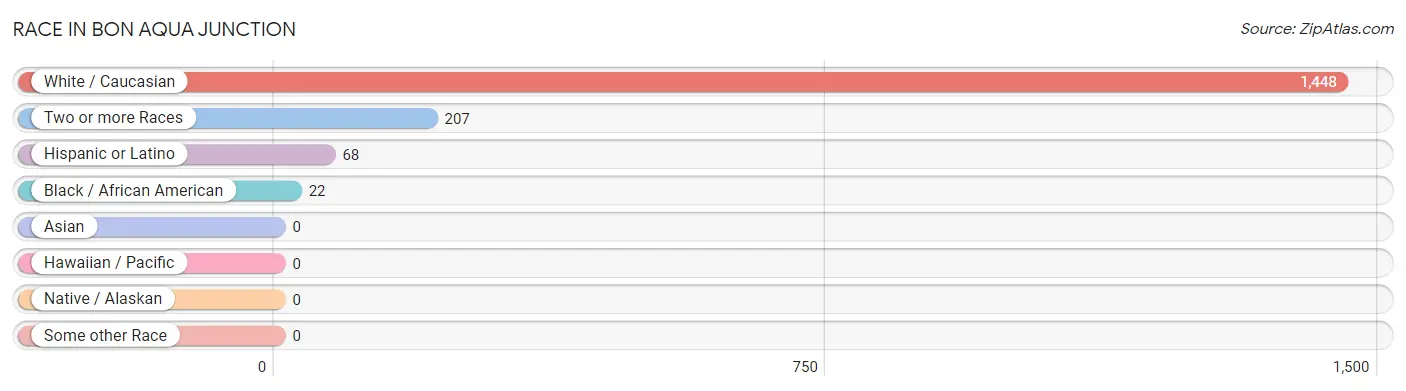
| Race | # Population | % Population |
| Asian | 0 | 0.0% |
| Black / African American | 22 | 1.3% |
| Hawaiian / Pacific | 0 | 0.0% |
| Hispanic or Latino | 68 | 4.1% |
| Native / Alaskan | 0 | 0.0% |
| White / Caucasian | 1,448 | 86.3% |
| Two or more Races | 207 | 12.3% |
| Some other Race | 0 | 0.0% |
| Total | 1,677 | 100.0% |
Ancestry in Bon Aqua Junction
The most populous ancestries reported in Bon Aqua Junction are American (218 | 13.0%), German (185 | 11.0%), Irish (149 | 8.9%), Cherokee (139 | 8.3%), and Brazilian (68 | 4.1%), together accounting for 45.3% of all Bon Aqua Junction residents.
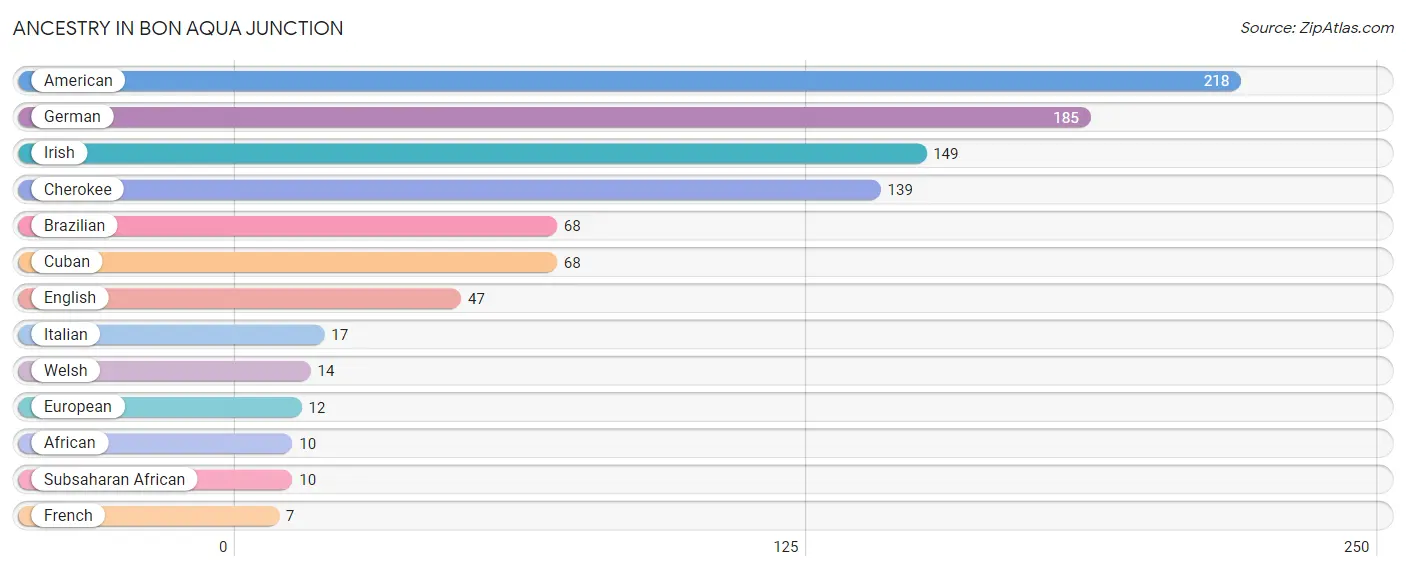
| Ancestry | # Population | % Population |
| African | 10 | 0.6% |
| American | 218 | 13.0% |
| Brazilian | 68 | 4.1% |
| Cherokee | 139 | 8.3% |
| Cuban | 68 | 4.1% |
| English | 47 | 2.8% |
| European | 12 | 0.7% |
| French | 7 | 0.4% |
| German | 185 | 11.0% |
| Irish | 149 | 8.9% |
| Italian | 17 | 1.0% |
| Subsaharan African | 10 | 0.6% |
| Welsh | 14 | 0.8% | View All 13 Rows |
Immigrants in Bon Aqua Junction
The most numerous immigrant groups reported in Bon Aqua Junction came from Europe (33 | 2.0%), Germany (33 | 2.0%), and Western Europe (33 | 2.0%), together accounting for 5.9% of all Bon Aqua Junction residents.
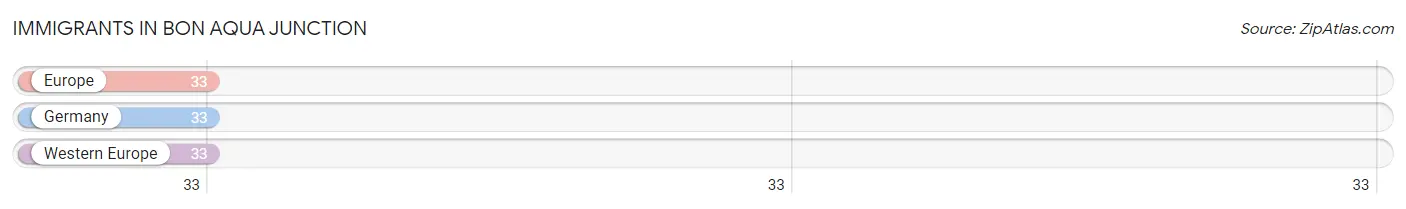
| Immigration Origin | # Population | % Population |
| Europe | 33 | 2.0% |
| Germany | 33 | 2.0% |
| Western Europe | 33 | 2.0% | View All 3 Rows |
Sex and Age in Bon Aqua Junction
Sex and Age in Bon Aqua Junction
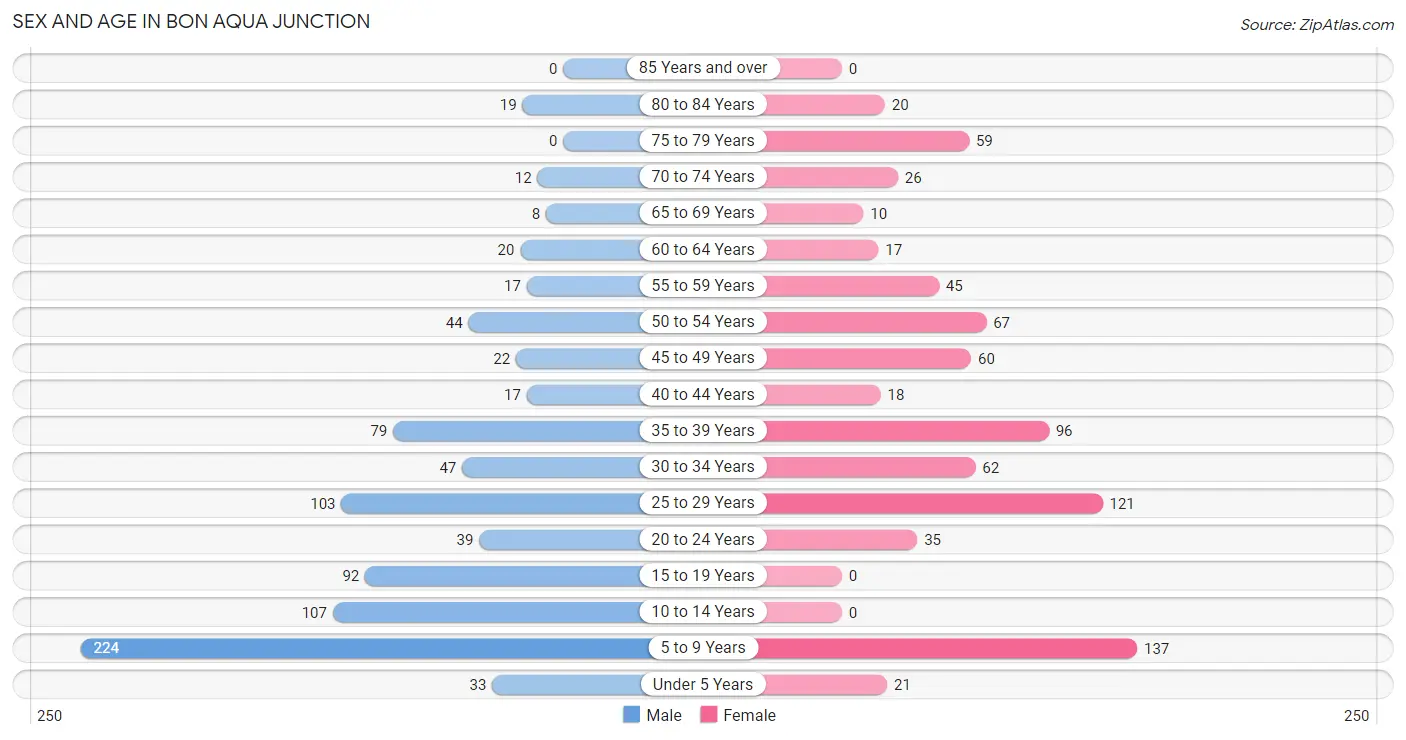
The most populous age groups in Bon Aqua Junction are 5 to 9 Years (224 | 25.4%) for men and 5 to 9 Years (137 | 17.2%) for women.
| Age Bracket | Male | Female |
| Under 5 Years | 33 (3.7%) | 21 (2.6%) |
| 5 to 9 Years | 224 (25.4%) | 137 (17.2%) |
| 10 to 14 Years | 107 (12.1%) | 0 (0.0%) |
| 15 to 19 Years | 92 (10.4%) | 0 (0.0%) |
| 20 to 24 Years | 39 (4.4%) | 35 (4.4%) |
| 25 to 29 Years | 103 (11.7%) | 121 (15.2%) |
| 30 to 34 Years | 47 (5.3%) | 62 (7.8%) |
| 35 to 39 Years | 79 (8.9%) | 96 (12.1%) |
| 40 to 44 Years | 17 (1.9%) | 18 (2.3%) |
| 45 to 49 Years | 22 (2.5%) | 60 (7.6%) |
| 50 to 54 Years | 44 (5.0%) | 67 (8.4%) |
| 55 to 59 Years | 17 (1.9%) | 45 (5.7%) |
| 60 to 64 Years | 20 (2.3%) | 17 (2.1%) |
| 65 to 69 Years | 8 (0.9%) | 10 (1.3%) |
| 70 to 74 Years | 12 (1.4%) | 26 (3.3%) |
| 75 to 79 Years | 0 (0.0%) | 59 (7.4%) |
| 80 to 84 Years | 19 (2.1%) | 20 (2.5%) |
| 85 Years and over | 0 (0.0%) | 0 (0.0%) |
| Total | 883 (100.0%) | 794 (100.0%) |
Families and Households in Bon Aqua Junction
Median Family Size in Bon Aqua Junction
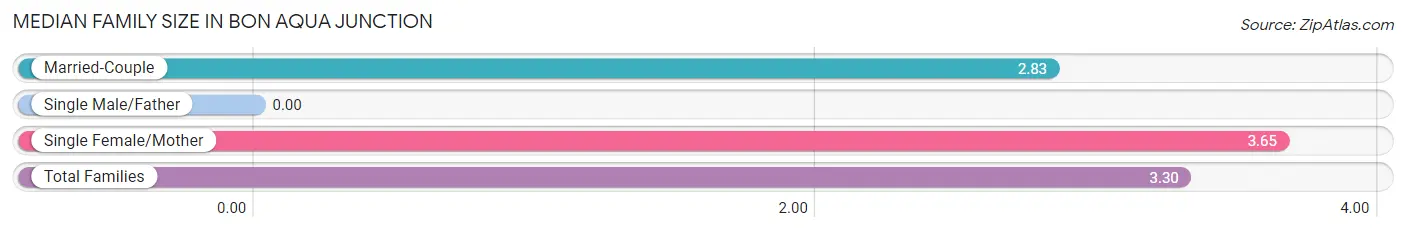
| Family Type | # Families | Family Size |
| Married-Couple | 161 (42.3%) | 2.83 |
| Single Male/Father | 0 (0.0%) | - |
| Single Female/Mother | 220 (57.7%) | 3.65 |
| Total Families | 381 (100.0%) | 3.30 |
Median Household Size in Bon Aqua Junction
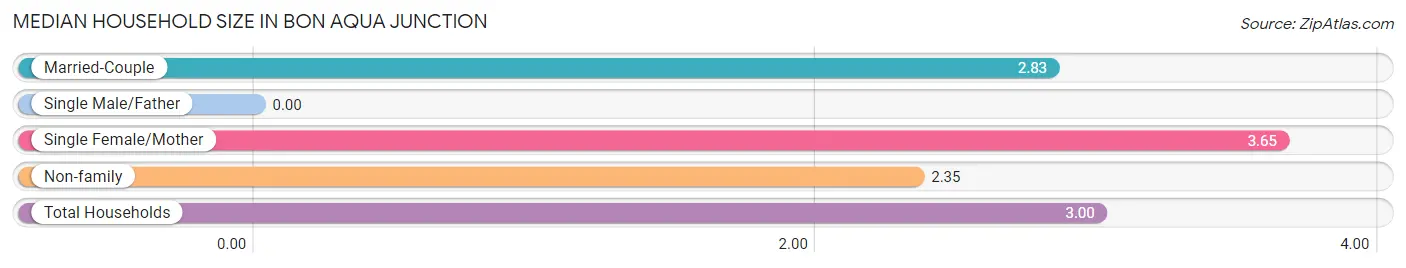
| Household Type | # Households | Household Size |
| Married-Couple | 161 (28.8%) | 2.83 |
| Single Male/Father | 0 (0.0%) | - |
| Single Female/Mother | 220 (39.4%) | 3.65 |
| Non-family | 178 (31.8%) | 2.35 |
| Total Households | 559 (100.0%) | 3.00 |
Household Size by Marriage Status in Bon Aqua Junction
Out of a total of 559 households in Bon Aqua Junction, 381 (68.2%) are family households, while 178 (31.8%) are nonfamily households. The most numerous type of family households are 2-person households, comprising 244, and the most common type of nonfamily households are 1-person households, comprising 87.
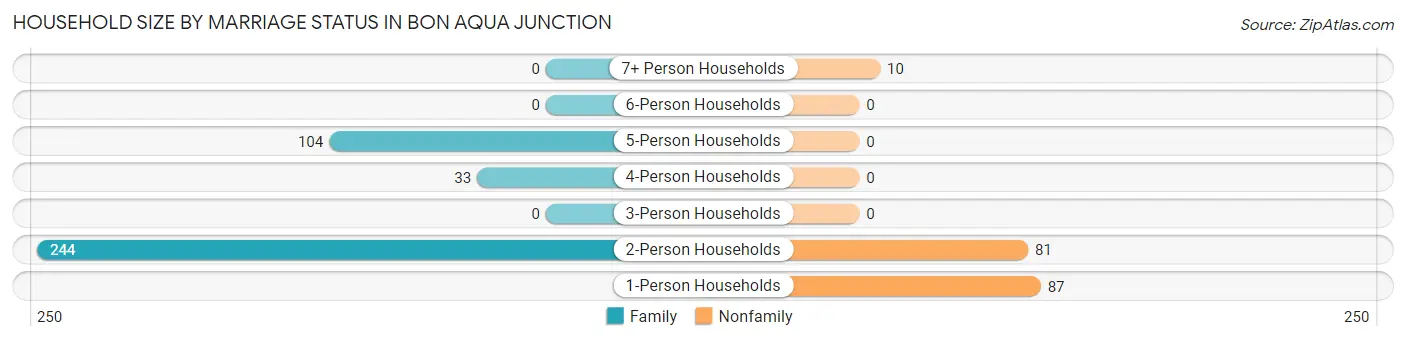
| Household Size | Family Households | Nonfamily Households |
| 1-Person Households | - | 87 (15.6%) |
| 2-Person Households | 244 (43.6%) | 81 (14.5%) |
| 3-Person Households | 0 (0.0%) | 0 (0.0%) |
| 4-Person Households | 33 (5.9%) | 0 (0.0%) |
| 5-Person Households | 104 (18.6%) | 0 (0.0%) |
| 6-Person Households | 0 (0.0%) | 0 (0.0%) |
| 7+ Person Households | 0 (0.0%) | 10 (1.8%) |
| Total | 381 (68.2%) | 178 (31.8%) |
Female Fertility in Bon Aqua Junction
Fertility by Age in Bon Aqua Junction
| Age Bracket | Women with Births | Births / 1,000 Women |
| 15 to 19 years | 0 (0.0%) | 0.0 |
| 20 to 34 years | 0 (0.0%) | 0.0 |
| 35 to 50 years | 0 (0.0%) | 0.0 |
| Total | 0 (0.0%) | 0.0 |
Fertility by Age by Marriage Status in Bon Aqua Junction
| Age Bracket | Married | Unmarried |
| 15 to 19 years | 0 (0.0%) | 0 (0.0%) |
| 20 to 34 years | 0 (0.0%) | 0 (0.0%) |
| 35 to 50 years | 0 (0.0%) | 0 (0.0%) |
| Total | 0 (0.0%) | 0 (0.0%) |
Fertility by Education in Bon Aqua Junction
| Educational Attainment | Women with Births | Births / 1,000 Women |
| Less than High School | 0 (0.0%) | 0.0 |
| High School Diploma | 0 (0.0%) | 0.0 |
| College or Associate's Degree | 0 (0.0%) | 0.0 |
| Bachelor's Degree | 0 (0.0%) | 0.0 |
| Graduate Degree | 0 (0.0%) | 0.0 |
| Total | 0 (0.0%) | 0.0 |
Fertility by Education by Marriage Status in Bon Aqua Junction
| Educational Attainment | Married | Unmarried |
| Less than High School | 0 (0.0%) | 0 (0.0%) |
| High School Diploma | 0 (0.0%) | 0 (0.0%) |
| College or Associate's Degree | 0 (0.0%) | 0 (0.0%) |
| Bachelor's Degree | 0 (0.0%) | 0 (0.0%) |
| Graduate Degree | 0 (0.0%) | 0 (0.0%) |
| Total | 0 (0.0%) | 0 (0.0%) |
Employment Characteristics in Bon Aqua Junction
Employment by Class of Employer in Bon Aqua Junction
Among the 566 employed individuals in Bon Aqua Junction, private company employees (311 | 54.9%), self-employed (not incorporated) (75 | 13.3%), and self-employed (incorporated) (68 | 12.0%) make up the most common classes of employment.
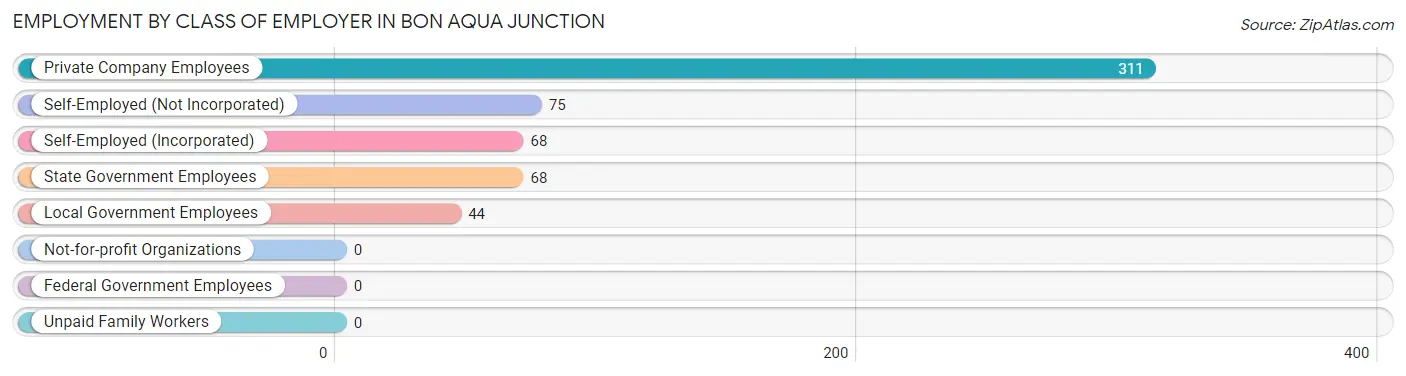
| Employer Class | # Employees | % Employees |
| Private Company Employees | 311 | 54.9% |
| Self-Employed (Incorporated) | 68 | 12.0% |
| Self-Employed (Not Incorporated) | 75 | 13.3% |
| Not-for-profit Organizations | 0 | 0.0% |
| Local Government Employees | 44 | 7.8% |
| State Government Employees | 68 | 12.0% |
| Federal Government Employees | 0 | 0.0% |
| Unpaid Family Workers | 0 | 0.0% |
| Total | 566 | 100.0% |
Employment Status by Age in Bon Aqua Junction
According to the labor force statistics for Bon Aqua Junction, out of the total population over 16 years of age (1,115), 54.2% or 604 individuals are in the labor force, with 1.5% or 9 of them unemployed. The age group with the highest labor force participation rate is 20 to 24 years, with 100.0% or 74 individuals in the labor force. Within the labor force, the 45 to 54 years age range has the highest percentage of unemployed individuals, with 6.1% or 9 of them being unemployed.
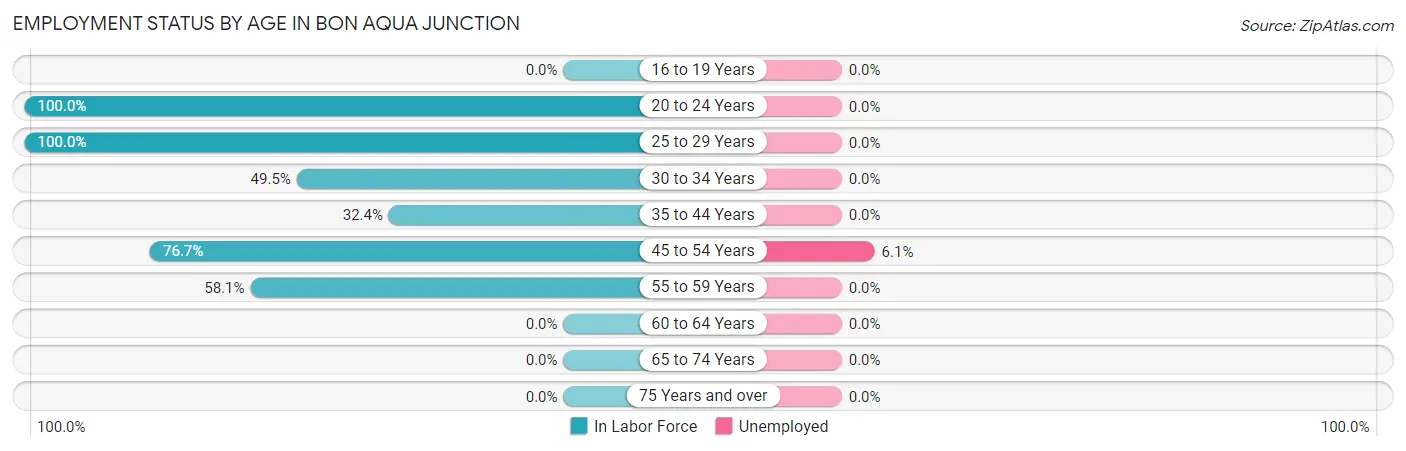
| Age Bracket | In Labor Force | Unemployed |
| 16 to 19 Years | 0 (0.0%) | 0 (0.0%) |
| 20 to 24 Years | 74 (100.0%) | 0 (0.0%) |
| 25 to 29 Years | 224 (100.0%) | 0 (0.0%) |
| 30 to 34 Years | 54 (49.5%) | 0 (0.0%) |
| 35 to 44 Years | 68 (32.4%) | 0 (0.0%) |
| 45 to 54 Years | 148 (76.7%) | 9 (6.1%) |
| 55 to 59 Years | 36 (58.1%) | 0 (0.0%) |
| 60 to 64 Years | 0 (0.0%) | 0 (0.0%) |
| 65 to 74 Years | 0 (0.0%) | 0 (0.0%) |
| 75 Years and over | 0 (0.0%) | 0 (0.0%) |
| Total | 604 (54.2%) | 9 (1.5%) |
Employment Status by Educational Attainment in Bon Aqua Junction
According to labor force statistics for Bon Aqua Junction, 63.5% of individuals (530) out of the total population between 25 and 64 years of age (835) are in the labor force, with 1.7% or 9 of them being unemployed. The group with the highest labor force participation rate are those with the educational attainment of college / associate degree, with 100.0% or 160 individuals in the labor force. Within the labor force, individuals with high school diploma education have the highest percentage of unemployment, with 3.4% or 9 of them being unemployed.
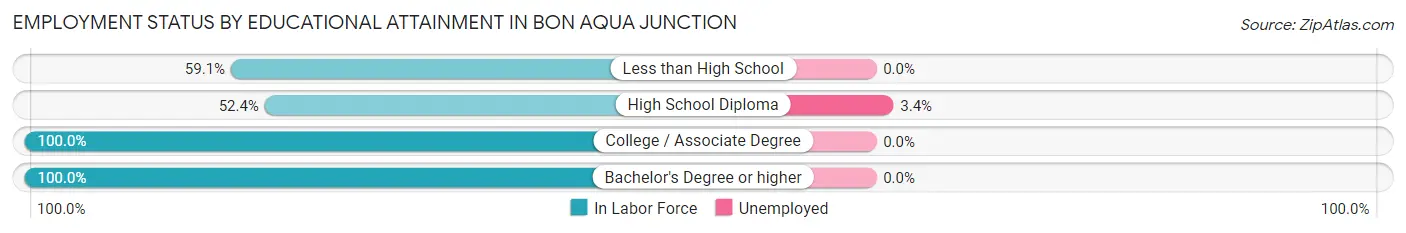
| Educational Attainment | In Labor Force | Unemployed |
| Less than High School | 94 (59.1%) | 0 (0.0%) |
| High School Diploma | 264 (52.4%) | 17 (3.4%) |
| College / Associate Degree | 160 (100.0%) | 0 (0.0%) |
| Bachelor's Degree or higher | 12 (100.0%) | 0 (0.0%) |
| Total | 530 (63.5%) | 14 (1.7%) |
Employment Occupations by Sex in Bon Aqua Junction
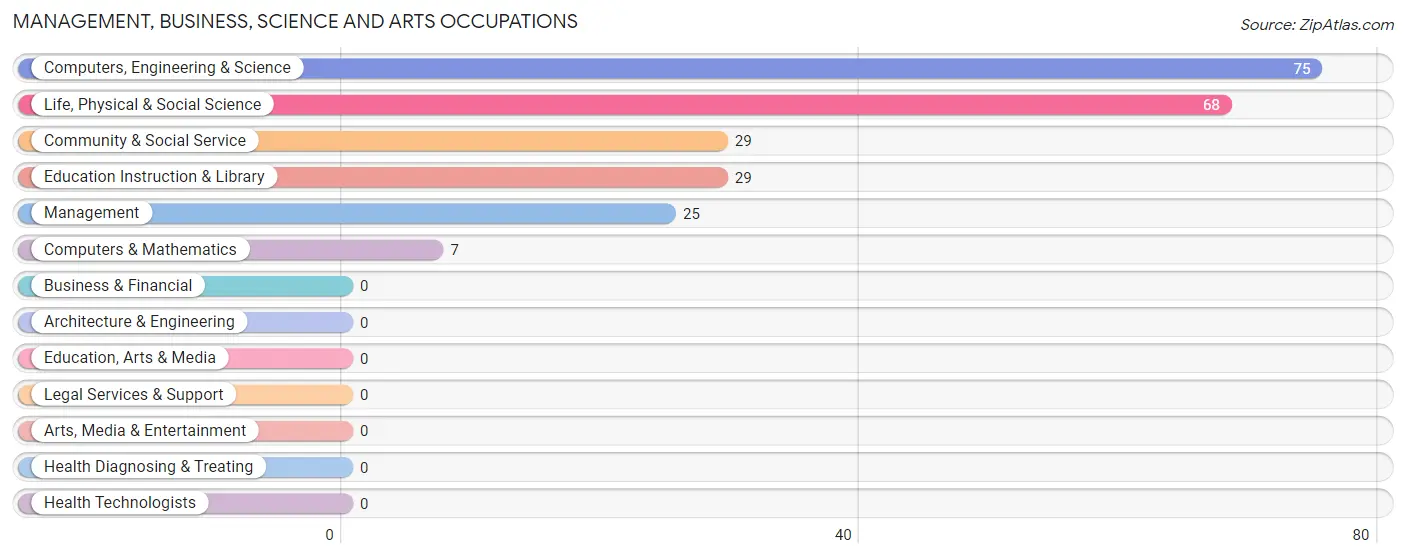
Management, Business, Science and Arts Occupations
The most common Management, Business, Science and Arts occupations in Bon Aqua Junction are Computers, Engineering & Science (75 | 12.6%), Life, Physical & Social Science (68 | 11.4%), Community & Social Service (29 | 4.9%), Education Instruction & Library (29 | 4.9%), and Management (25 | 4.2%).
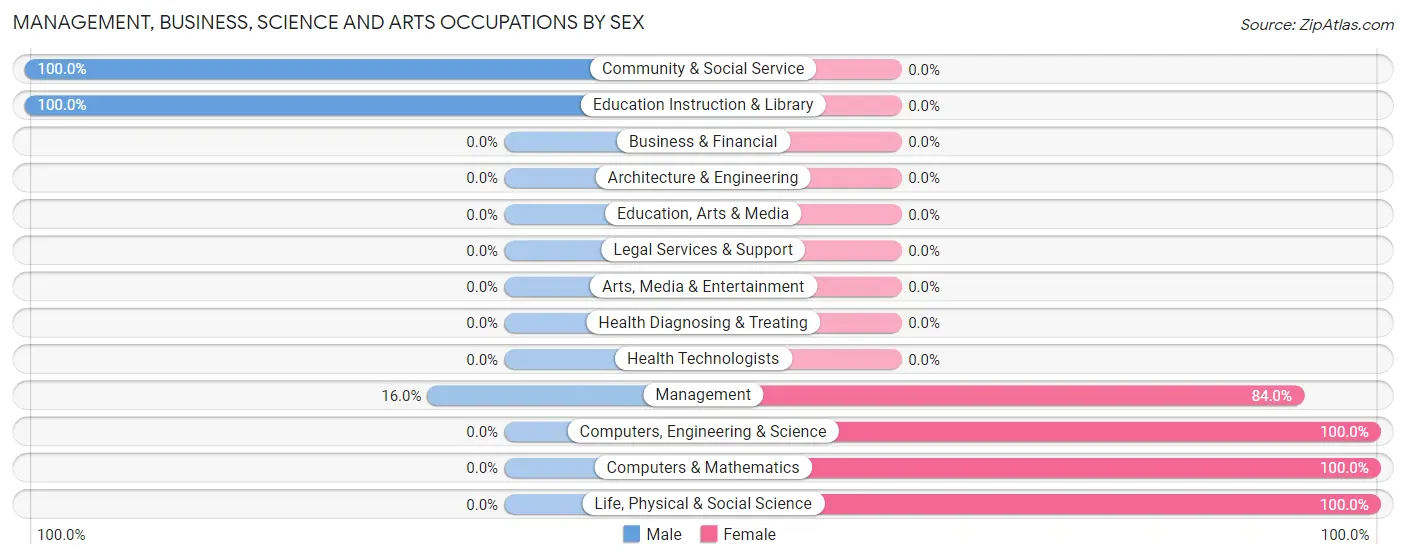
Management, Business, Science and Arts Occupations by Sex
Within the Management, Business, Science and Arts occupations in Bon Aqua Junction, the most male-oriented occupations are Community & Social Service (100.0%), Education Instruction & Library (100.0%), and Management (16.0%), while the most female-oriented occupations are Computers, Engineering & Science (100.0%), Computers & Mathematics (100.0%), and Life, Physical & Social Science (100.0%).
| Occupation | Male | Female |
| Management | 4 (16.0%) | 21 (84.0%) |
| Business & Financial | 0 (0.0%) | 0 (0.0%) |
| Computers, Engineering & Science | 0 (0.0%) | 75 (100.0%) |
| Computers & Mathematics | 0 (0.0%) | 7 (100.0%) |
| Architecture & Engineering | 0 (0.0%) | 0 (0.0%) |
| Life, Physical & Social Science | 0 (0.0%) | 68 (100.0%) |
| Community & Social Service | 29 (100.0%) | 0 (0.0%) |
| Education, Arts & Media | 0 (0.0%) | 0 (0.0%) |
| Legal Services & Support | 0 (0.0%) | 0 (0.0%) |
| Education Instruction & Library | 29 (100.0%) | 0 (0.0%) |
| Arts, Media & Entertainment | 0 (0.0%) | 0 (0.0%) |
| Health Diagnosing & Treating | 0 (0.0%) | 0 (0.0%) |
| Health Technologists | 0 (0.0%) | 0 (0.0%) |
| Total (Category) | 33 (25.6%) | 96 (74.4%) |
| Total (Overall) | 280 (47.1%) | 315 (52.9%) |
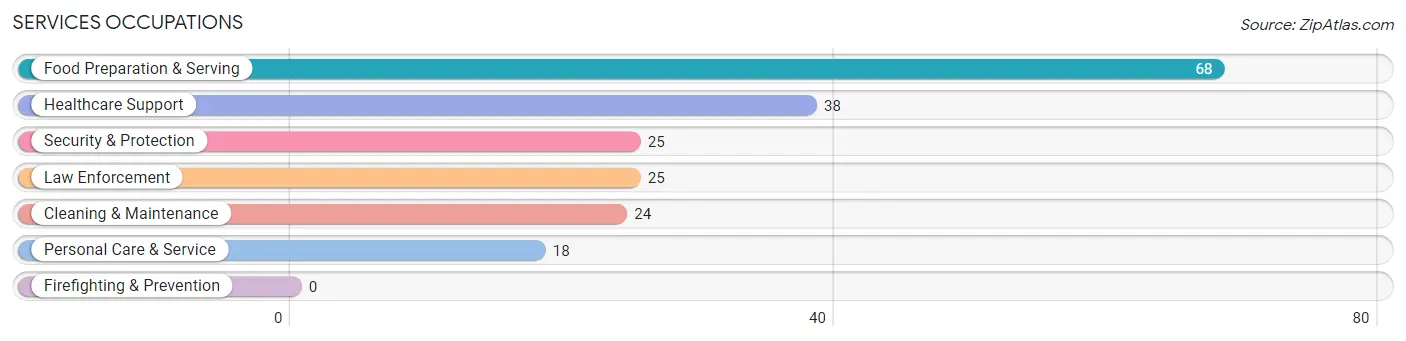
Services Occupations
The most common Services occupations in Bon Aqua Junction are Food Preparation & Serving (68 | 11.4%), Healthcare Support (38 | 6.4%), Security & Protection (25 | 4.2%), Law Enforcement (25 | 4.2%), and Cleaning & Maintenance (24 | 4.0%).
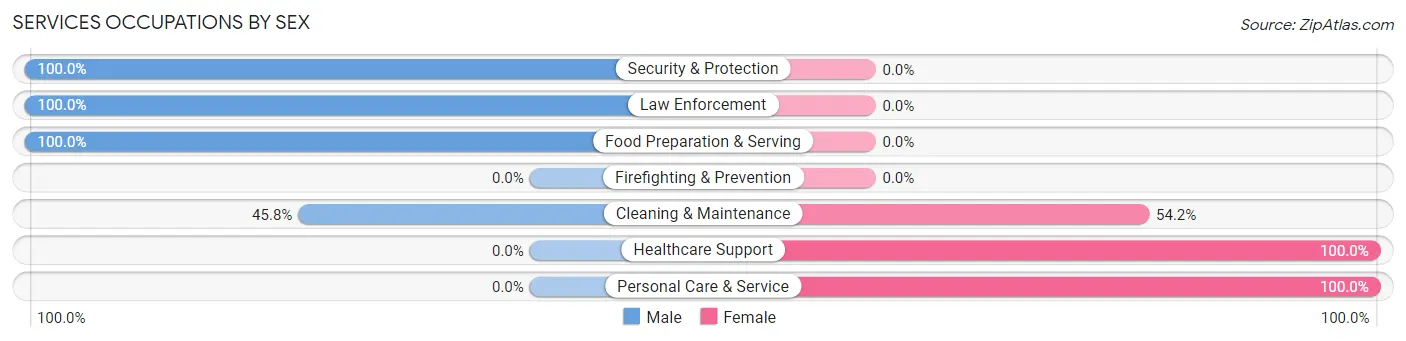
Services Occupations by Sex
Within the Services occupations in Bon Aqua Junction, the most male-oriented occupations are Security & Protection (100.0%), Law Enforcement (100.0%), and Food Preparation & Serving (100.0%), while the most female-oriented occupations are Healthcare Support (100.0%), Personal Care & Service (100.0%), and Cleaning & Maintenance (54.2%).
| Occupation | Male | Female |
| Healthcare Support | 0 (0.0%) | 38 (100.0%) |
| Security & Protection | 25 (100.0%) | 0 (0.0%) |
| Firefighting & Prevention | 0 (0.0%) | 0 (0.0%) |
| Law Enforcement | 25 (100.0%) | 0 (0.0%) |
| Food Preparation & Serving | 68 (100.0%) | 0 (0.0%) |
| Cleaning & Maintenance | 11 (45.8%) | 13 (54.2%) |
| Personal Care & Service | 0 (0.0%) | 18 (100.0%) |
| Total (Category) | 104 (60.1%) | 69 (39.9%) |
| Total (Overall) | 280 (47.1%) | 315 (52.9%) |
Sales and Office Occupations
The most common Sales and Office occupations in Bon Aqua Junction are Sales & Related (96 | 16.1%), and Office & Administration (19 | 3.2%).
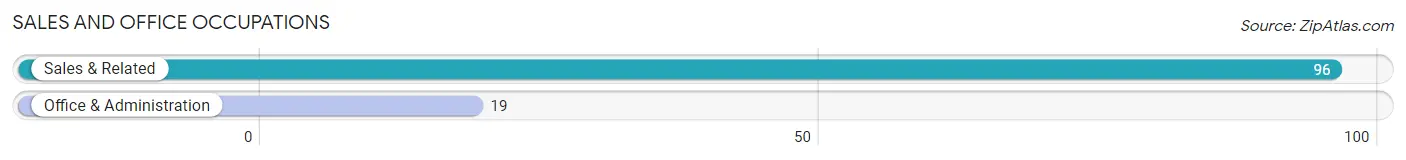
Sales and Office Occupations by Sex
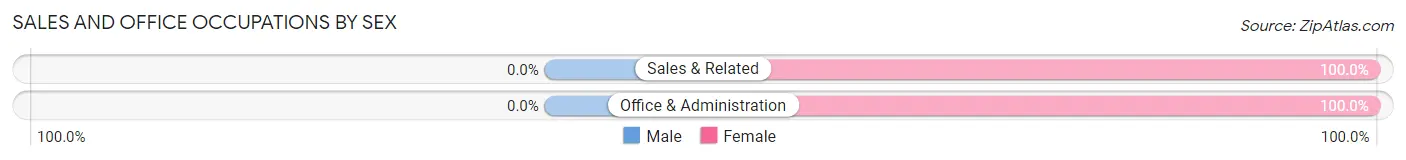
| Occupation | Male | Female |
| Sales & Related | 0 (0.0%) | 96 (100.0%) |
| Office & Administration | 0 (0.0%) | 19 (100.0%) |
| Total (Category) | 0 (0.0%) | 115 (100.0%) |
| Total (Overall) | 280 (47.1%) | 315 (52.9%) |
Natural Resources, Construction and Maintenance Occupations
The most common Natural Resources, Construction and Maintenance occupations in Bon Aqua Junction are Installation, Maintenance & Repair (39 | 6.6%), and Construction & Extraction (23 | 3.9%).
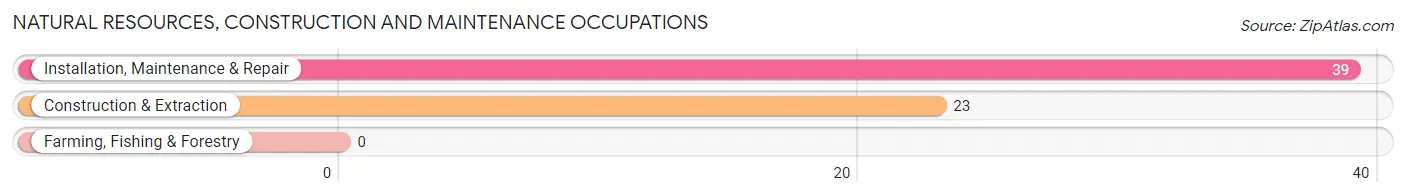
Natural Resources, Construction and Maintenance Occupations by Sex
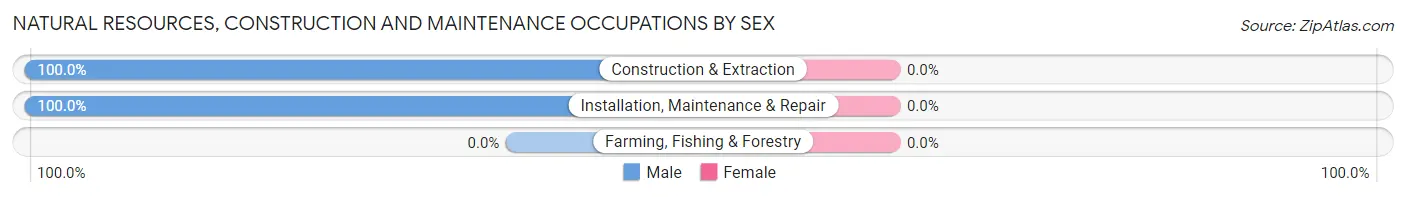
| Occupation | Male | Female |
| Farming, Fishing & Forestry | 0 (0.0%) | 0 (0.0%) |
| Construction & Extraction | 23 (100.0%) | 0 (0.0%) |
| Installation, Maintenance & Repair | 39 (100.0%) | 0 (0.0%) |
| Total (Category) | 62 (100.0%) | 0 (0.0%) |
| Total (Overall) | 280 (47.1%) | 315 (52.9%) |
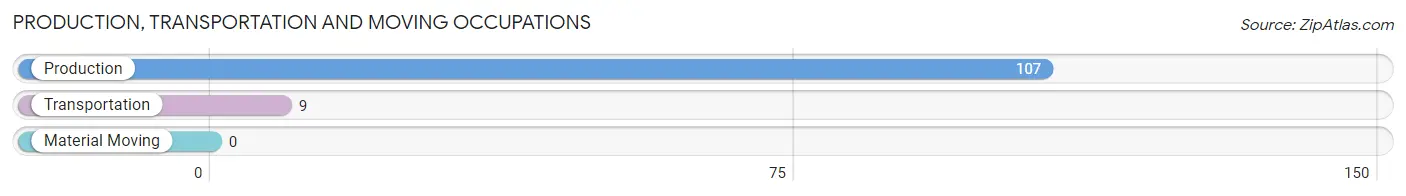
Production, Transportation and Moving Occupations
The most common Production, Transportation and Moving occupations in Bon Aqua Junction are Production (107 | 18.0%), and Transportation (9 | 1.5%).
Production, Transportation and Moving Occupations by Sex
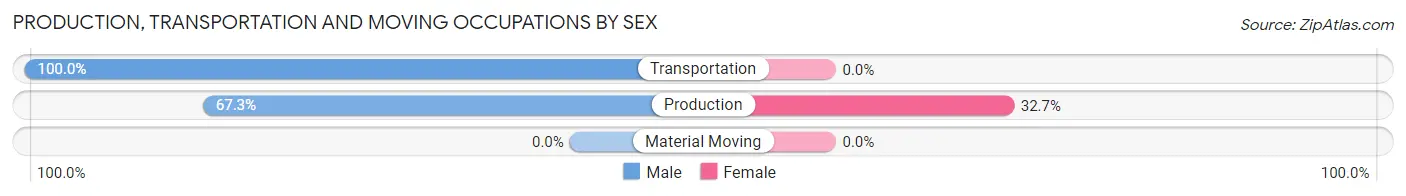
| Occupation | Male | Female |
| Production | 72 (67.3%) | 35 (32.7%) |
| Transportation | 9 (100.0%) | 0 (0.0%) |
| Material Moving | 0 (0.0%) | 0 (0.0%) |
| Total (Category) | 81 (69.8%) | 35 (30.2%) |
| Total (Overall) | 280 (47.1%) | 315 (52.9%) |
Employment Industries by Sex in Bon Aqua Junction
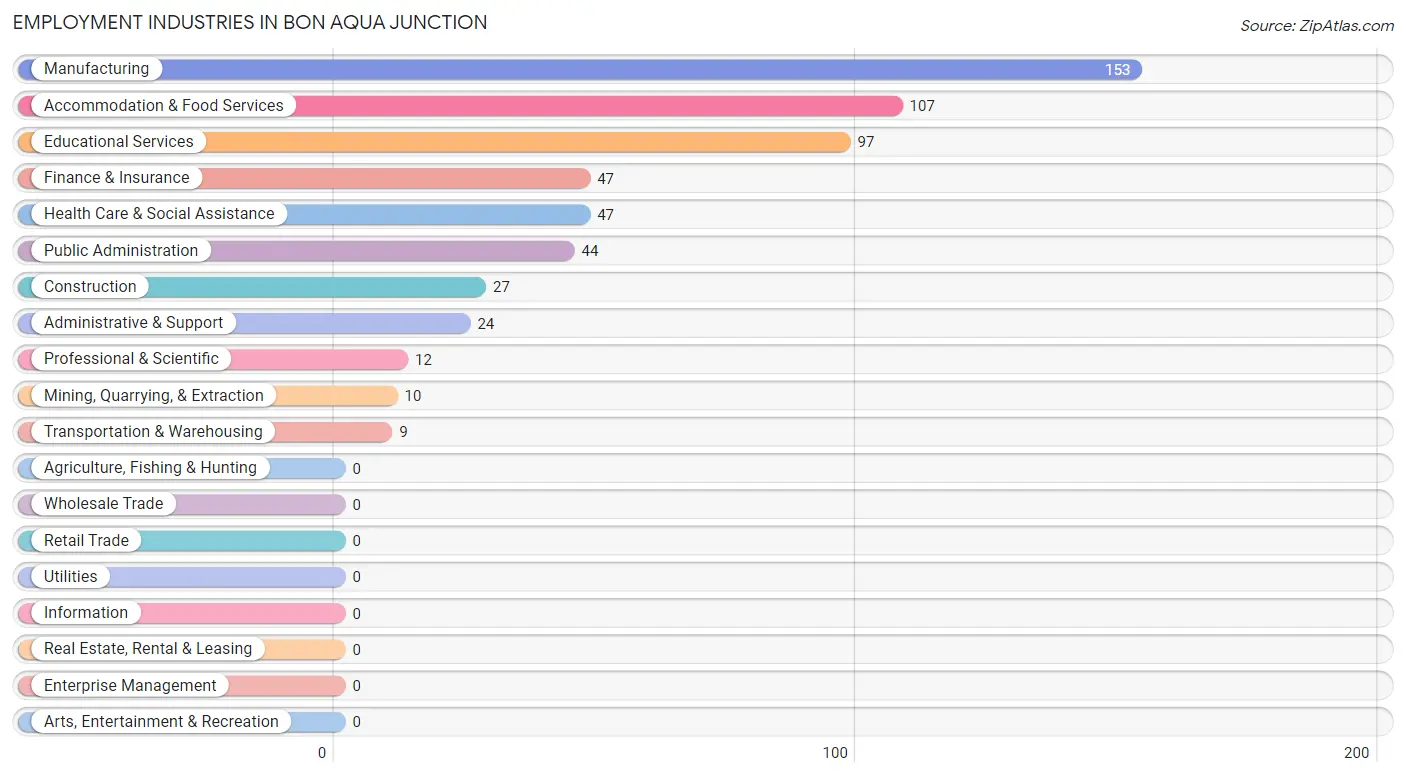
Employment Industries in Bon Aqua Junction
The major employment industries in Bon Aqua Junction include Manufacturing (153 | 25.7%), Accommodation & Food Services (107 | 18.0%), Educational Services (97 | 16.3%), Finance & Insurance (47 | 7.9%), and Health Care & Social Assistance (47 | 7.9%).
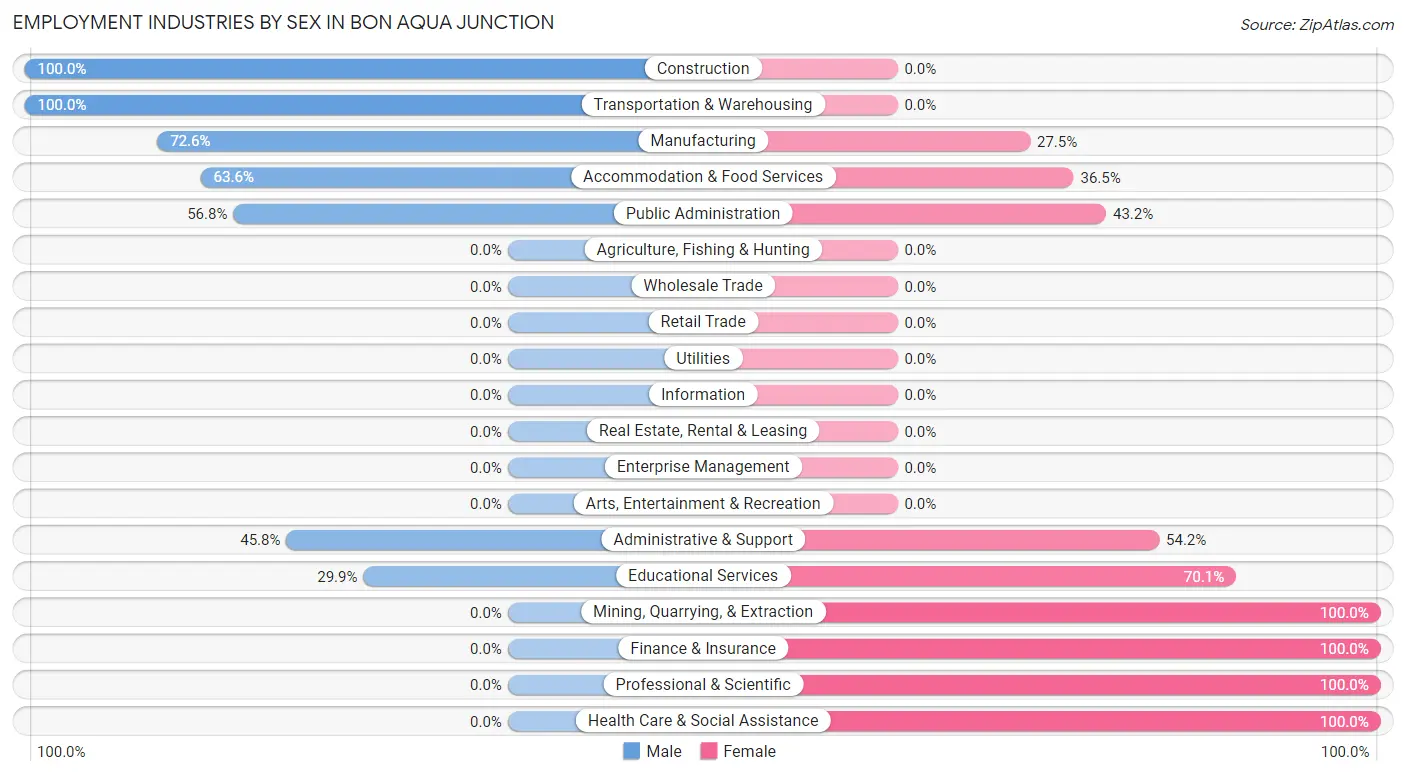
Employment Industries by Sex in Bon Aqua Junction
The Bon Aqua Junction industries that see more men than women are Construction (100.0%), Transportation & Warehousing (100.0%), and Manufacturing (72.6%), whereas the industries that tend to have a higher number of women are Mining, Quarrying, & Extraction (100.0%), Finance & Insurance (100.0%), and Professional & Scientific (100.0%).
| Industry | Male | Female |
| Agriculture, Fishing & Hunting | 0 (0.0%) | 0 (0.0%) |
| Mining, Quarrying, & Extraction | 0 (0.0%) | 10 (100.0%) |
| Construction | 27 (100.0%) | 0 (0.0%) |
| Manufacturing | 111 (72.6%) | 42 (27.5%) |
| Wholesale Trade | 0 (0.0%) | 0 (0.0%) |
| Retail Trade | 0 (0.0%) | 0 (0.0%) |
| Transportation & Warehousing | 9 (100.0%) | 0 (0.0%) |
| Utilities | 0 (0.0%) | 0 (0.0%) |
| Information | 0 (0.0%) | 0 (0.0%) |
| Finance & Insurance | 0 (0.0%) | 47 (100.0%) |
| Real Estate, Rental & Leasing | 0 (0.0%) | 0 (0.0%) |
| Professional & Scientific | 0 (0.0%) | 12 (100.0%) |
| Enterprise Management | 0 (0.0%) | 0 (0.0%) |
| Administrative & Support | 11 (45.8%) | 13 (54.2%) |
| Educational Services | 29 (29.9%) | 68 (70.1%) |
| Health Care & Social Assistance | 0 (0.0%) | 47 (100.0%) |
| Arts, Entertainment & Recreation | 0 (0.0%) | 0 (0.0%) |
| Accommodation & Food Services | 68 (63.5%) | 39 (36.4%) |
| Public Administration | 25 (56.8%) | 19 (43.2%) |
| Total | 280 (47.1%) | 315 (52.9%) |
Education in Bon Aqua Junction
School Enrollment in Bon Aqua Junction
The most common levels of schooling among the 659 students in Bon Aqua Junction are elementary school (389 | 59.0%), college / undergraduate (109 | 16.5%), and high school (92 | 14.0%).
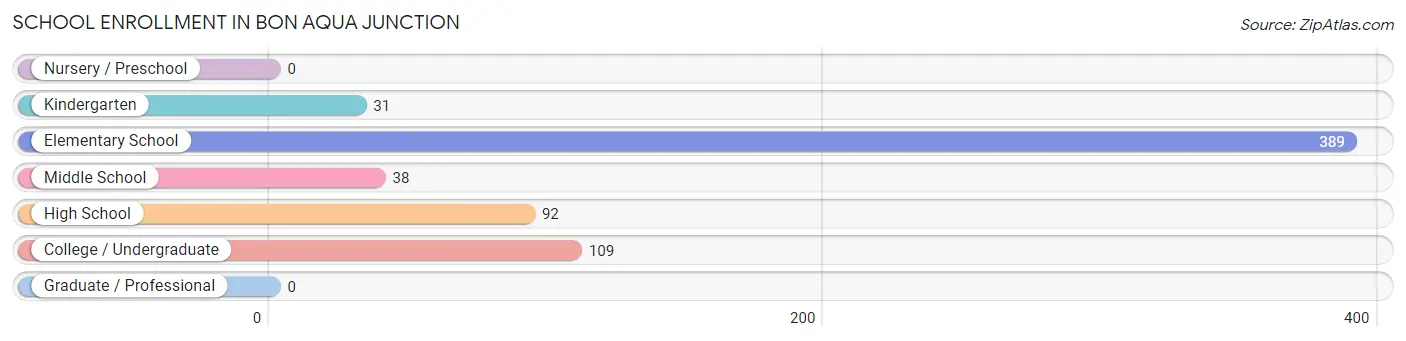
| School Level | # Students | % Students |
| Nursery / Preschool | 0 | 0.0% |
| Kindergarten | 31 | 4.7% |
| Elementary School | 389 | 59.0% |
| Middle School | 38 | 5.8% |
| High School | 92 | 14.0% |
| College / Undergraduate | 109 | 16.5% |
| Graduate / Professional | 0 | 0.0% |
| Total | 659 | 100.0% |
School Enrollment by Age by Funding Source in Bon Aqua Junction
Out of a total of 659 students who are enrolled in schools in Bon Aqua Junction, 33 (5.0%) attend a private institution, while the remaining 626 (95.0%) are enrolled in public schools. The age group of 35 years and over has the highest likelihood of being enrolled in private schools, with 33 (80.5% in the age bracket) enrolled. Conversely, the age group of 5 to 9 year old has the lowest likelihood of being enrolled in a private school, with 351 (100.0% in the age bracket) attending a public institution.
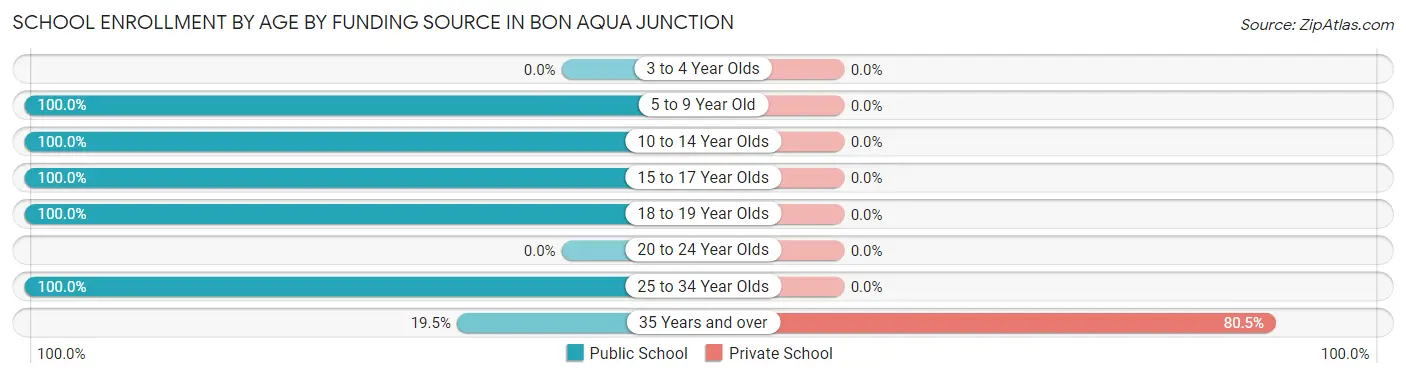
| Age Bracket | Public School | Private School |
| 3 to 4 Year Olds | 0 (0.0%) | 0 (0.0%) |
| 5 to 9 Year Old | 351 (100.0%) | 0 (0.0%) |
| 10 to 14 Year Olds | 107 (100.0%) | 0 (0.0%) |
| 15 to 17 Year Olds | 46 (100.0%) | 0 (0.0%) |
| 18 to 19 Year Olds | 46 (100.0%) | 0 (0.0%) |
| 20 to 24 Year Olds | 0 (0.0%) | 0 (0.0%) |
| 25 to 34 Year Olds | 68 (100.0%) | 0 (0.0%) |
| 35 Years and over | 8 (19.5%) | 33 (80.5%) |
| Total | 626 (95.0%) | 33 (5.0%) |
Educational Attainment by Field of Study in Bon Aqua Junction
Education (34 | 58.6%), bio, nature & agricultural (17 | 29.3%), and business (7 | 12.1%) are the most common fields of study among 58 individuals in Bon Aqua Junction who have obtained a bachelor's degree or higher.
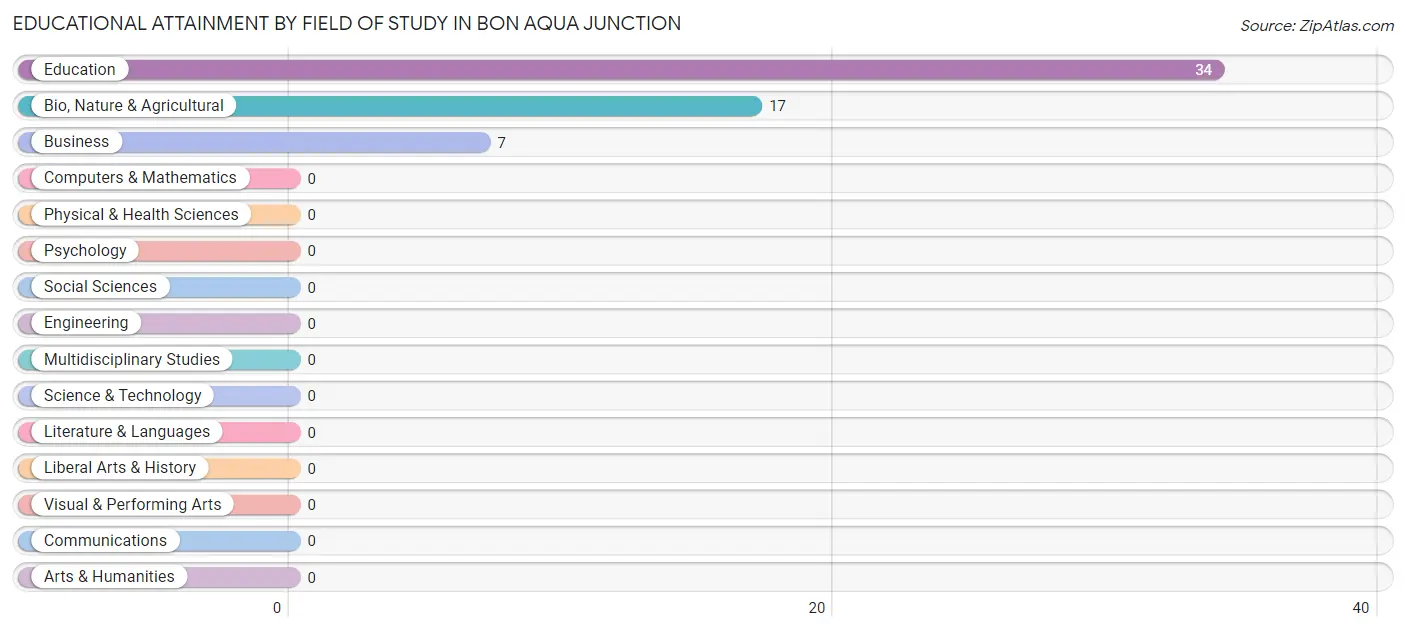
| Field of Study | # Graduates | % Graduates |
| Computers & Mathematics | 0 | 0.0% |
| Bio, Nature & Agricultural | 17 | 29.3% |
| Physical & Health Sciences | 0 | 0.0% |
| Psychology | 0 | 0.0% |
| Social Sciences | 0 | 0.0% |
| Engineering | 0 | 0.0% |
| Multidisciplinary Studies | 0 | 0.0% |
| Science & Technology | 0 | 0.0% |
| Business | 7 | 12.1% |
| Education | 34 | 58.6% |
| Literature & Languages | 0 | 0.0% |
| Liberal Arts & History | 0 | 0.0% |
| Visual & Performing Arts | 0 | 0.0% |
| Communications | 0 | 0.0% |
| Arts & Humanities | 0 | 0.0% |
| Total | 58 | 100.0% |
Transportation & Commute in Bon Aqua Junction
Vehicle Availability by Sex in Bon Aqua Junction
The most prevalent vehicle ownership categories in Bon Aqua Junction are males with 2 vehicles (143, accounting for 57.0%) and females with 2 vehicles (211, making up 45.4%).
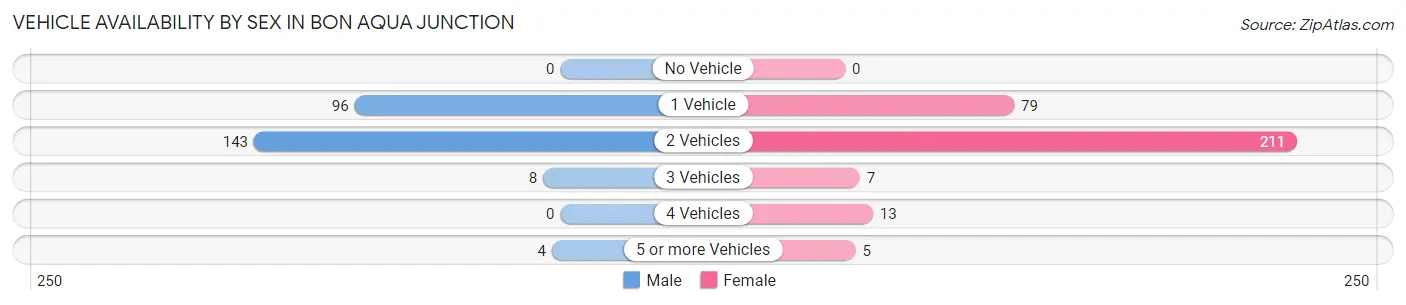
| Vehicles Available | Male | Female |
| No Vehicle | 0 (0.0%) | 0 (0.0%) |
| 1 Vehicle | 96 (38.3%) | 79 (25.1%) |
| 2 Vehicles | 143 (57.0%) | 211 (67.0%) |
| 3 Vehicles | 8 (3.2%) | 7 (2.2%) |
| 4 Vehicles | 0 (0.0%) | 13 (4.1%) |
| 5 or more Vehicles | 4 (1.6%) | 5 (1.6%) |
| Total | 251 (100.0%) | 315 (100.0%) |
Commute Time in Bon Aqua Junction
The most frequently occuring commute durations in Bon Aqua Junction are 45 to 59 minutes (94 commuters, 17.7%), 15 to 19 minutes (83 commuters, 15.6%), and 5 to 9 minutes (68 commuters, 12.8%).
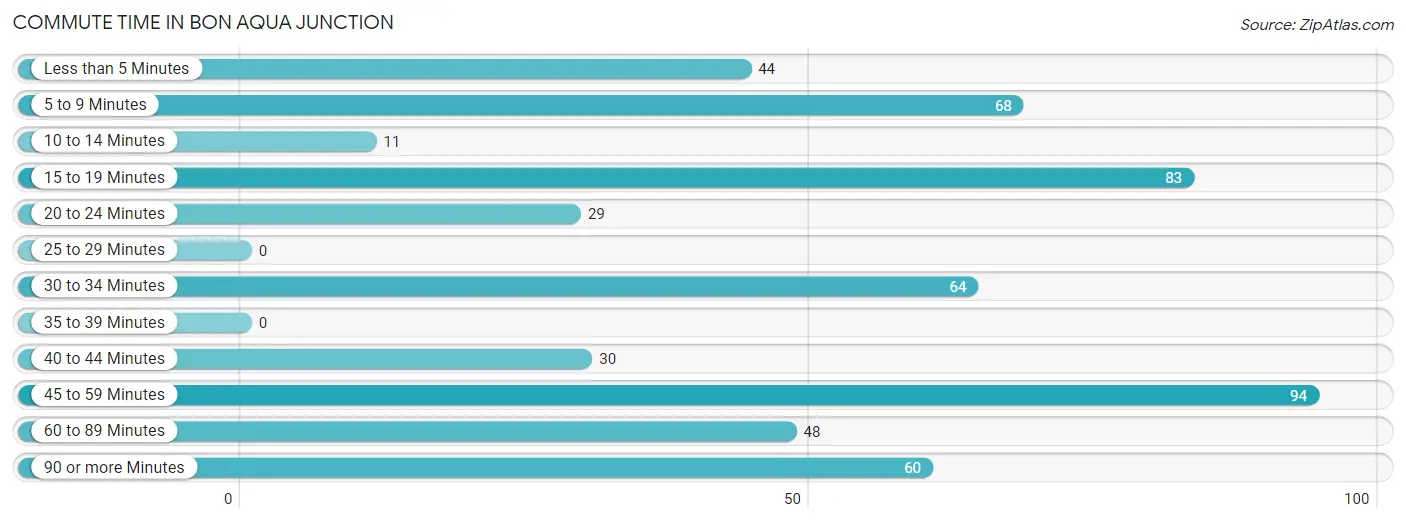
| Commute Time | # Commuters | % Commuters |
| Less than 5 Minutes | 44 | 8.3% |
| 5 to 9 Minutes | 68 | 12.8% |
| 10 to 14 Minutes | 11 | 2.1% |
| 15 to 19 Minutes | 83 | 15.6% |
| 20 to 24 Minutes | 29 | 5.5% |
| 25 to 29 Minutes | 0 | 0.0% |
| 30 to 34 Minutes | 64 | 12.0% |
| 35 to 39 Minutes | 0 | 0.0% |
| 40 to 44 Minutes | 30 | 5.7% |
| 45 to 59 Minutes | 94 | 17.7% |
| 60 to 89 Minutes | 48 | 9.0% |
| 90 or more Minutes | 60 | 11.3% |
Commute Time by Sex in Bon Aqua Junction
The most common commute times in Bon Aqua Junction are 5 to 9 minutes (68 commuters, 27.1%) for males and 15 to 19 minutes (83 commuters, 29.6%) for females.
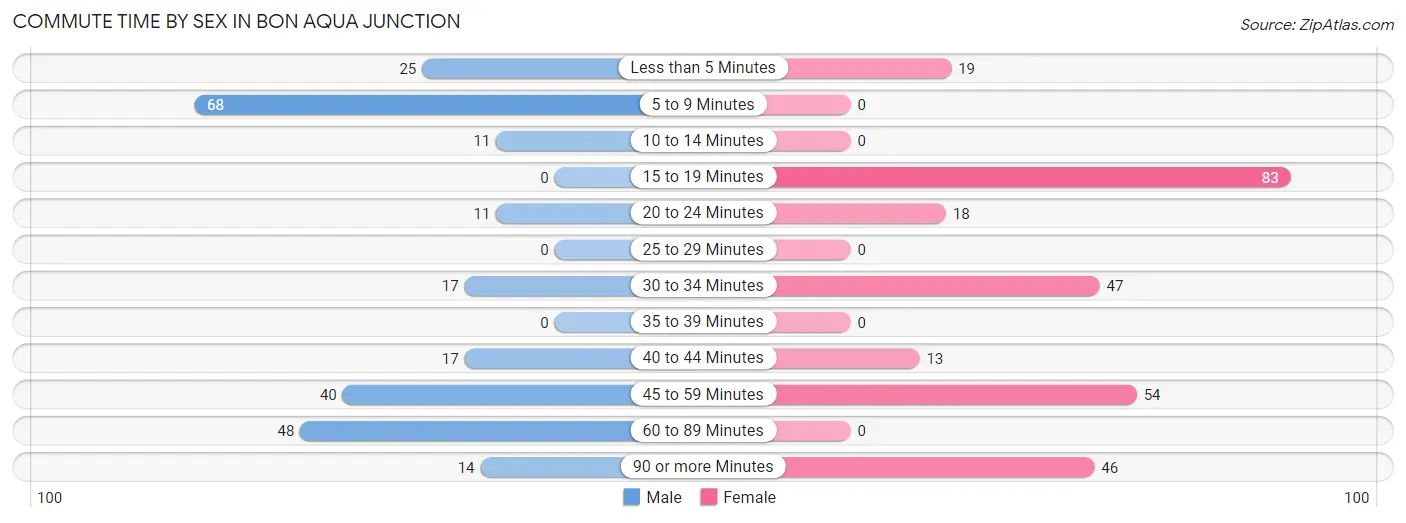
| Commute Time | Male | Female |
| Less than 5 Minutes | 25 (10.0%) | 19 (6.8%) |
| 5 to 9 Minutes | 68 (27.1%) | 0 (0.0%) |
| 10 to 14 Minutes | 11 (4.4%) | 0 (0.0%) |
| 15 to 19 Minutes | 0 (0.0%) | 83 (29.6%) |
| 20 to 24 Minutes | 11 (4.4%) | 18 (6.4%) |
| 25 to 29 Minutes | 0 (0.0%) | 0 (0.0%) |
| 30 to 34 Minutes | 17 (6.8%) | 47 (16.8%) |
| 35 to 39 Minutes | 0 (0.0%) | 0 (0.0%) |
| 40 to 44 Minutes | 17 (6.8%) | 13 (4.6%) |
| 45 to 59 Minutes | 40 (15.9%) | 54 (19.3%) |
| 60 to 89 Minutes | 48 (19.1%) | 0 (0.0%) |
| 90 or more Minutes | 14 (5.6%) | 46 (16.4%) |
Time of Departure to Work by Sex in Bon Aqua Junction
The most frequent times of departure to work in Bon Aqua Junction are 10:00 AM to 10:59 AM (68, 27.1%) for males and 6:00 AM to 6:29 AM (103, 36.8%) for females.
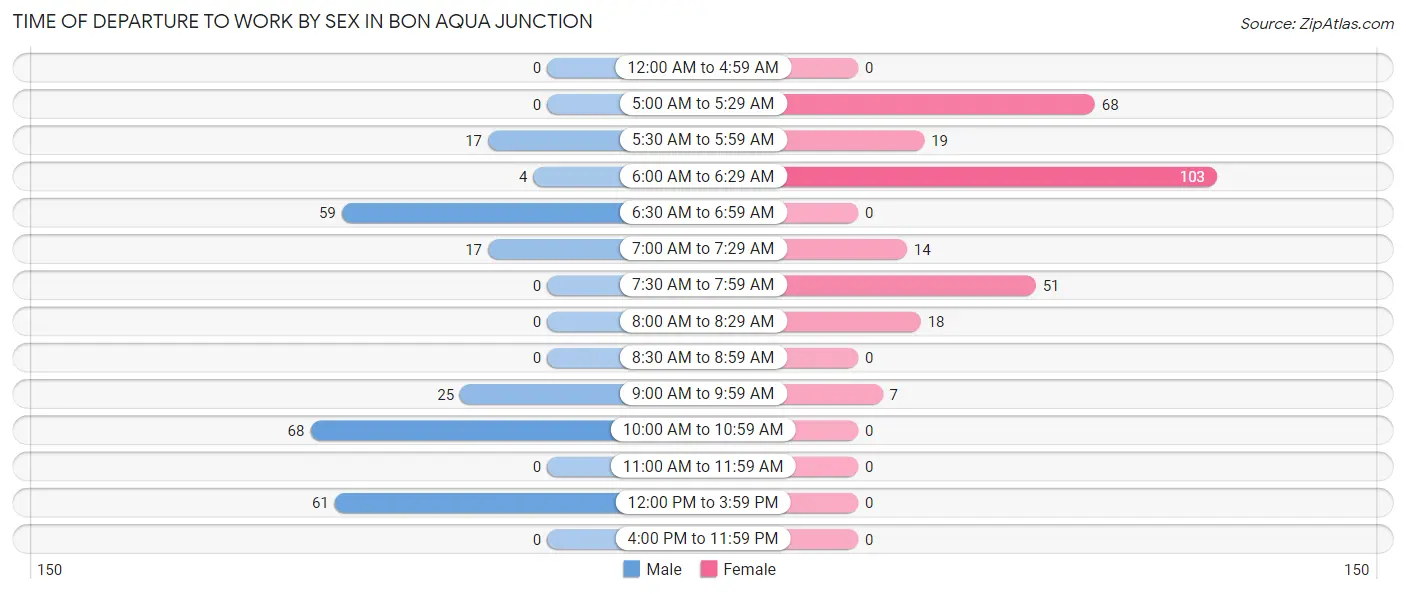
| Time of Departure | Male | Female |
| 12:00 AM to 4:59 AM | 0 (0.0%) | 0 (0.0%) |
| 5:00 AM to 5:29 AM | 0 (0.0%) | 68 (24.3%) |
| 5:30 AM to 5:59 AM | 17 (6.8%) | 19 (6.8%) |
| 6:00 AM to 6:29 AM | 4 (1.6%) | 103 (36.8%) |
| 6:30 AM to 6:59 AM | 59 (23.5%) | 0 (0.0%) |
| 7:00 AM to 7:29 AM | 17 (6.8%) | 14 (5.0%) |
| 7:30 AM to 7:59 AM | 0 (0.0%) | 51 (18.2%) |
| 8:00 AM to 8:29 AM | 0 (0.0%) | 18 (6.4%) |
| 8:30 AM to 8:59 AM | 0 (0.0%) | 0 (0.0%) |
| 9:00 AM to 9:59 AM | 25 (10.0%) | 7 (2.5%) |
| 10:00 AM to 10:59 AM | 68 (27.1%) | 0 (0.0%) |
| 11:00 AM to 11:59 AM | 0 (0.0%) | 0 (0.0%) |
| 12:00 PM to 3:59 PM | 61 (24.3%) | 0 (0.0%) |
| 4:00 PM to 11:59 PM | 0 (0.0%) | 0 (0.0%) |
| Total | 251 (100.0%) | 280 (100.0%) |
Housing Occupancy in Bon Aqua Junction
Occupancy by Ownership in Bon Aqua Junction
Of the total 559 dwellings in Bon Aqua Junction, owner-occupied units account for 327 (58.5%), while renter-occupied units make up 232 (41.5%).
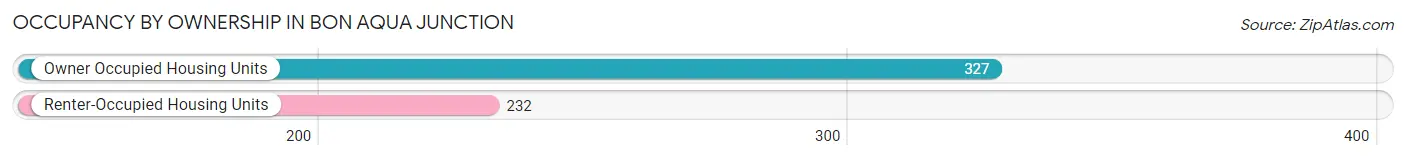
| Occupancy | # Housing Units | % Housing Units |
| Owner Occupied Housing Units | 327 | 58.5% |
| Renter-Occupied Housing Units | 232 | 41.5% |
| Total Occupied Housing Units | 559 | 100.0% |
Occupancy by Household Size in Bon Aqua Junction
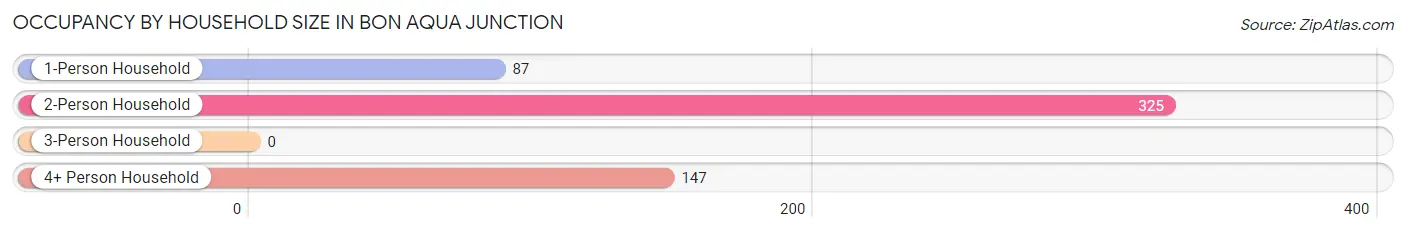
| Household Size | # Housing Units | % Housing Units |
| 1-Person Household | 87 | 15.6% |
| 2-Person Household | 325 | 58.1% |
| 3-Person Household | 0 | 0.0% |
| 4+ Person Household | 147 | 26.3% |
| Total Housing Units | 559 | 100.0% |
Occupancy by Ownership by Household Size in Bon Aqua Junction
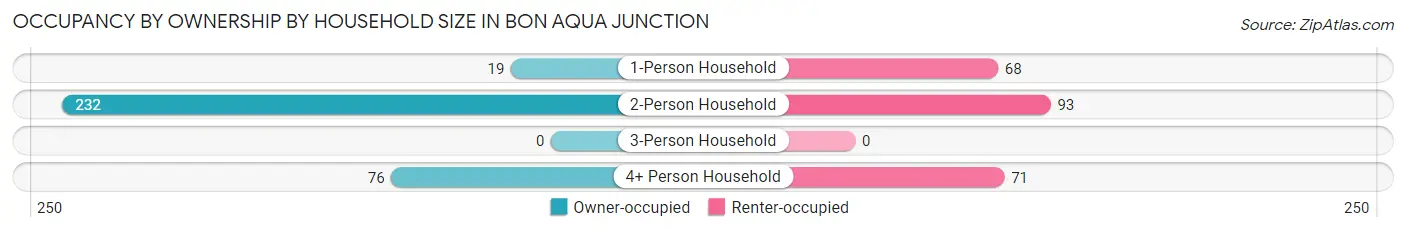
| Household Size | Owner-occupied | Renter-occupied |
| 1-Person Household | 19 (21.8%) | 68 (78.2%) |
| 2-Person Household | 232 (71.4%) | 93 (28.6%) |
| 3-Person Household | 0 (0.0%) | 0 (0.0%) |
| 4+ Person Household | 76 (51.7%) | 71 (48.3%) |
| Total Housing Units | 327 (58.5%) | 232 (41.5%) |
Occupancy by Educational Attainment in Bon Aqua Junction
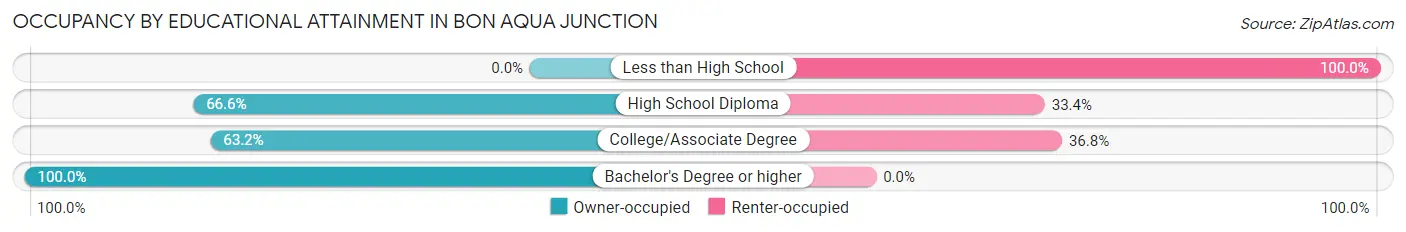
| Household Size | Owner-occupied | Renter-occupied |
| Less than High School | 0 (0.0%) | 84 (100.0%) |
| High School Diploma | 211 (66.6%) | 106 (33.4%) |
| College/Associate Degree | 72 (63.2%) | 42 (36.8%) |
| Bachelor's Degree or higher | 44 (100.0%) | 0 (0.0%) |
Occupancy by Age of Householder in Bon Aqua Junction
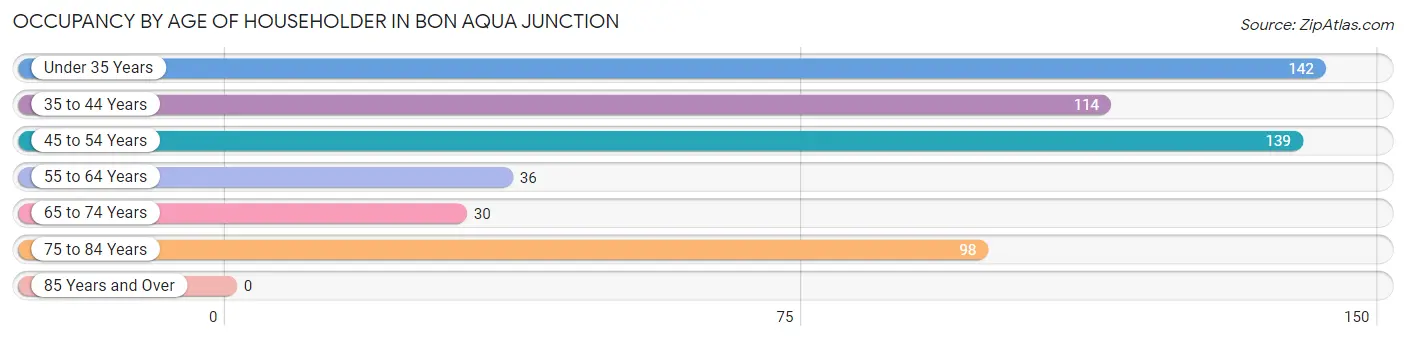
| Age Bracket | # Households | % Households |
| Under 35 Years | 142 | 25.4% |
| 35 to 44 Years | 114 | 20.4% |
| 45 to 54 Years | 139 | 24.9% |
| 55 to 64 Years | 36 | 6.4% |
| 65 to 74 Years | 30 | 5.4% |
| 75 to 84 Years | 98 | 17.5% |
| 85 Years and Over | 0 | 0.0% |
| Total | 559 | 100.0% |
Housing Finances in Bon Aqua Junction
Median Income by Occupancy in Bon Aqua Junction
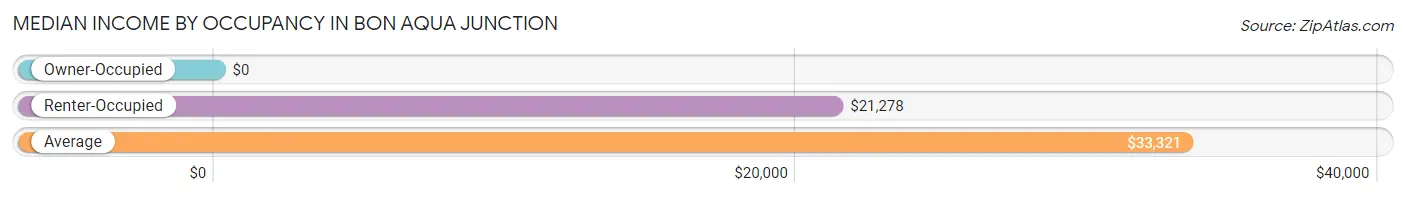
| Occupancy Type | # Households | Median Income |
| Owner-Occupied | 327 (58.5%) | $0 |
| Renter-Occupied | 232 (41.5%) | $21,278 |
| Average | 559 (100.0%) | $33,321 |
Occupancy by Householder Income Bracket in Bon Aqua Junction
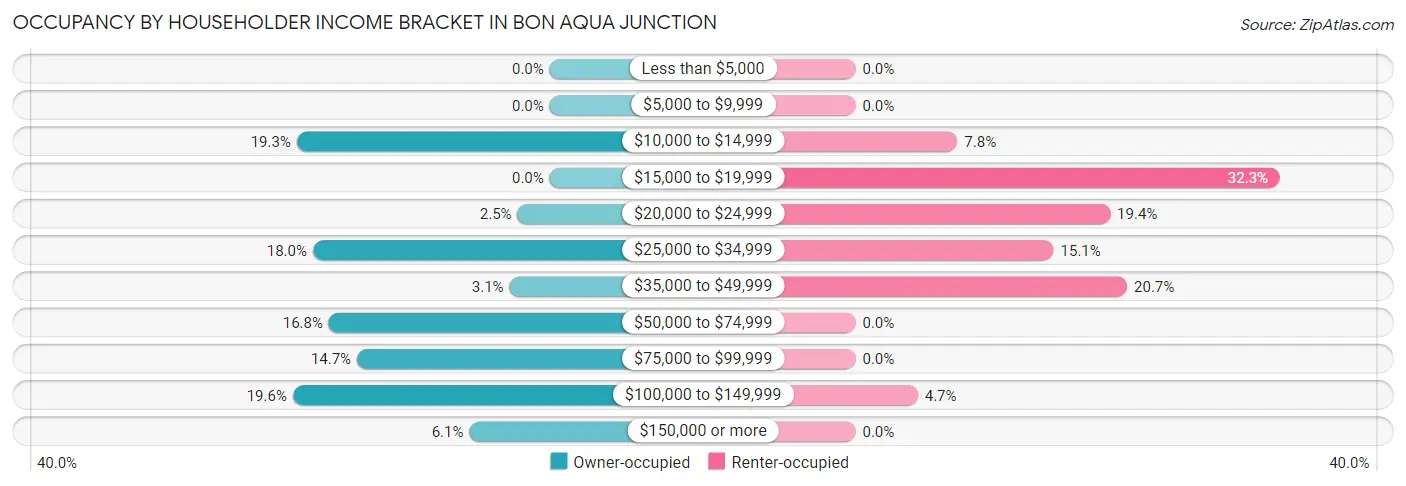
| Income Bracket | Owner-occupied | Renter-occupied |
| Less than $5,000 | 0 (0.0%) | 0 (0.0%) |
| $5,000 to $9,999 | 0 (0.0%) | 0 (0.0%) |
| $10,000 to $14,999 | 63 (19.3%) | 18 (7.8%) |
| $15,000 to $19,999 | 0 (0.0%) | 75 (32.3%) |
| $20,000 to $24,999 | 8 (2.5%) | 45 (19.4%) |
| $25,000 to $34,999 | 59 (18.0%) | 35 (15.1%) |
| $35,000 to $49,999 | 10 (3.1%) | 48 (20.7%) |
| $50,000 to $74,999 | 55 (16.8%) | 0 (0.0%) |
| $75,000 to $99,999 | 48 (14.7%) | 0 (0.0%) |
| $100,000 to $149,999 | 64 (19.6%) | 11 (4.7%) |
| $150,000 or more | 20 (6.1%) | 0 (0.0%) |
| Total | 327 (100.0%) | 232 (100.0%) |
Monthly Housing Cost Tiers in Bon Aqua Junction
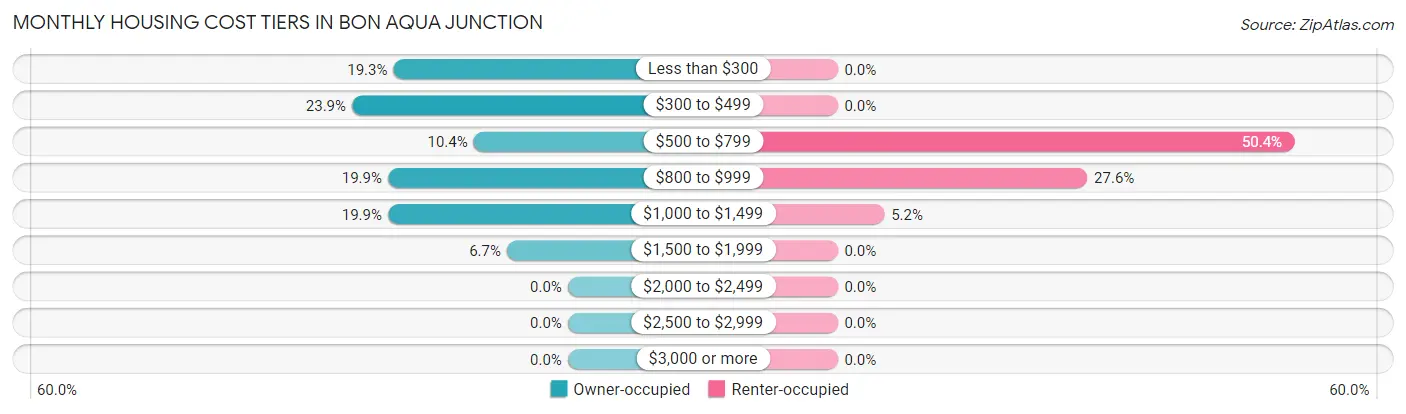
| Monthly Cost | Owner-occupied | Renter-occupied |
| Less than $300 | 63 (19.3%) | 0 (0.0%) |
| $300 to $499 | 78 (23.8%) | 0 (0.0%) |
| $500 to $799 | 34 (10.4%) | 117 (50.4%) |
| $800 to $999 | 65 (19.9%) | 64 (27.6%) |
| $1,000 to $1,499 | 65 (19.9%) | 12 (5.2%) |
| $1,500 to $1,999 | 22 (6.7%) | 0 (0.0%) |
| $2,000 to $2,499 | 0 (0.0%) | 0 (0.0%) |
| $2,500 to $2,999 | 0 (0.0%) | 0 (0.0%) |
| $3,000 or more | 0 (0.0%) | 0 (0.0%) |
| Total | 327 (100.0%) | 232 (100.0%) |
Physical Housing Characteristics in Bon Aqua Junction
Housing Structures in Bon Aqua Junction
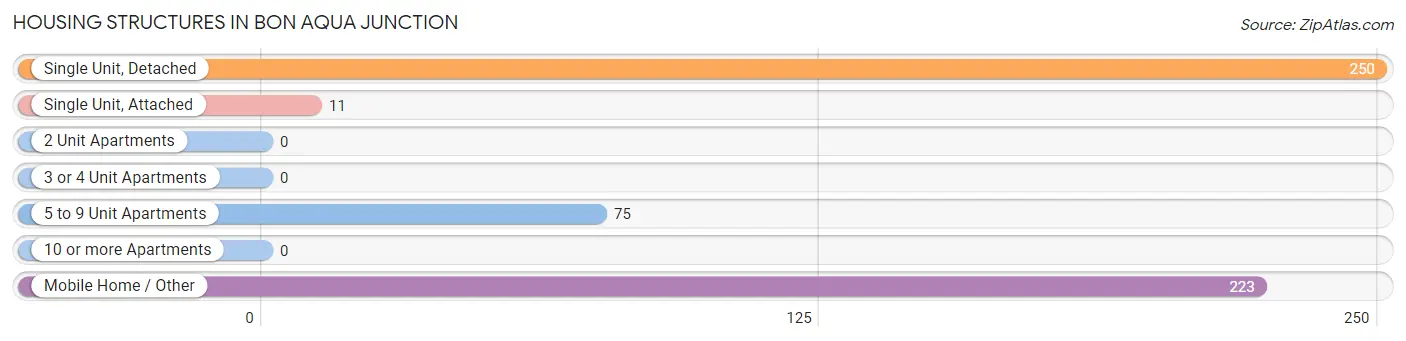
| Structure Type | # Housing Units | % Housing Units |
| Single Unit, Detached | 250 | 44.7% |
| Single Unit, Attached | 11 | 2.0% |
| 2 Unit Apartments | 0 | 0.0% |
| 3 or 4 Unit Apartments | 0 | 0.0% |
| 5 to 9 Unit Apartments | 75 | 13.4% |
| 10 or more Apartments | 0 | 0.0% |
| Mobile Home / Other | 223 | 39.9% |
| Total | 559 | 100.0% |
Housing Structures by Occupancy in Bon Aqua Junction
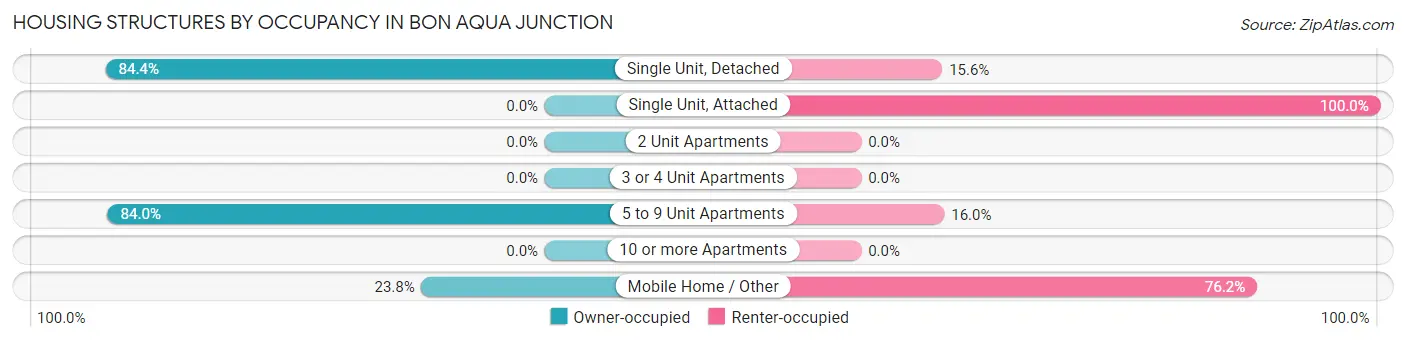
| Structure Type | Owner-occupied | Renter-occupied |
| Single Unit, Detached | 211 (84.4%) | 39 (15.6%) |
| Single Unit, Attached | 0 (0.0%) | 11 (100.0%) |
| 2 Unit Apartments | 0 (0.0%) | 0 (0.0%) |
| 3 or 4 Unit Apartments | 0 (0.0%) | 0 (0.0%) |
| 5 to 9 Unit Apartments | 63 (84.0%) | 12 (16.0%) |
| 10 or more Apartments | 0 (0.0%) | 0 (0.0%) |
| Mobile Home / Other | 53 (23.8%) | 170 (76.2%) |
| Total | 327 (58.5%) | 232 (41.5%) |
Housing Structures by Number of Rooms in Bon Aqua Junction
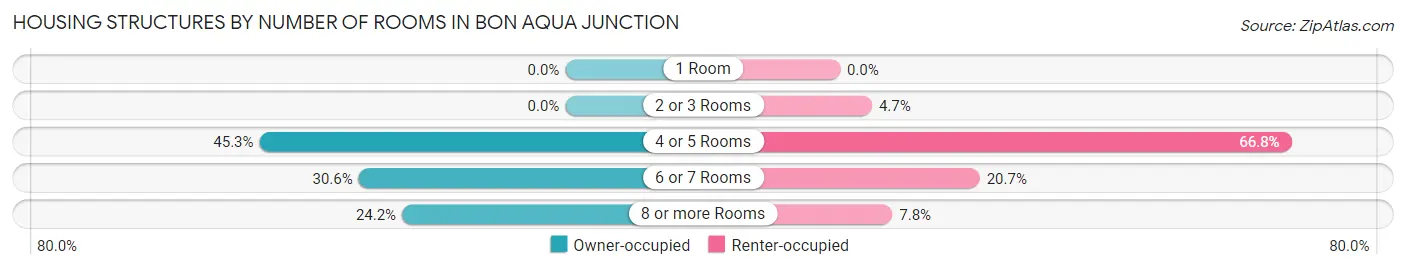
| Number of Rooms | Owner-occupied | Renter-occupied |
| 1 Room | 0 (0.0%) | 0 (0.0%) |
| 2 or 3 Rooms | 0 (0.0%) | 11 (4.7%) |
| 4 or 5 Rooms | 148 (45.3%) | 155 (66.8%) |
| 6 or 7 Rooms | 100 (30.6%) | 48 (20.7%) |
| 8 or more Rooms | 79 (24.2%) | 18 (7.8%) |
| Total | 327 (100.0%) | 232 (100.0%) |
Housing Structure by Heating Type in Bon Aqua Junction
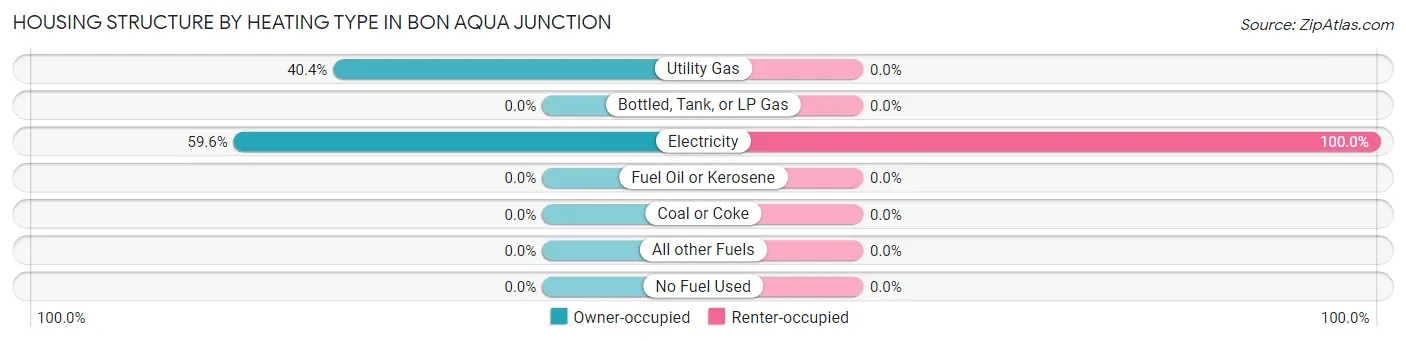
| Heating Type | Owner-occupied | Renter-occupied |
| Utility Gas | 132 (40.4%) | 0 (0.0%) |
| Bottled, Tank, or LP Gas | 0 (0.0%) | 0 (0.0%) |
| Electricity | 195 (59.6%) | 232 (100.0%) |
| Fuel Oil or Kerosene | 0 (0.0%) | 0 (0.0%) |
| Coal or Coke | 0 (0.0%) | 0 (0.0%) |
| All other Fuels | 0 (0.0%) | 0 (0.0%) |
| No Fuel Used | 0 (0.0%) | 0 (0.0%) |
| Total | 327 (100.0%) | 232 (100.0%) |
Household Vehicle Usage in Bon Aqua Junction
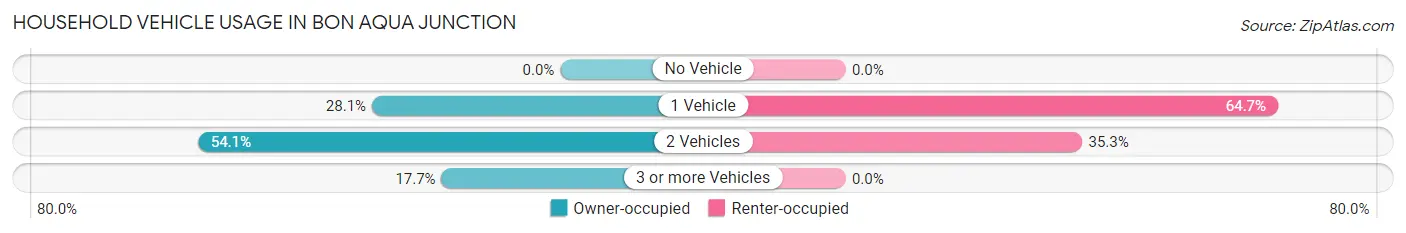
| Vehicles per Household | Owner-occupied | Renter-occupied |
| No Vehicle | 0 (0.0%) | 0 (0.0%) |
| 1 Vehicle | 92 (28.1%) | 150 (64.7%) |
| 2 Vehicles | 177 (54.1%) | 82 (35.3%) |
| 3 or more Vehicles | 58 (17.7%) | 0 (0.0%) |
| Total | 327 (100.0%) | 232 (100.0%) |
Real Estate & Mortgages in Bon Aqua Junction
Real Estate and Mortgage Overview in Bon Aqua Junction
| Characteristic | Without Mortgage | With Mortgage |
| Housing Units | 158 | 169 |
| Median Property Value | - | - |
| Median Household Income | - | - |
| Monthly Housing Costs | $314 | $0 |
| Real Estate Taxes | $914 | $0 |
Property Value by Mortgage Status in Bon Aqua Junction
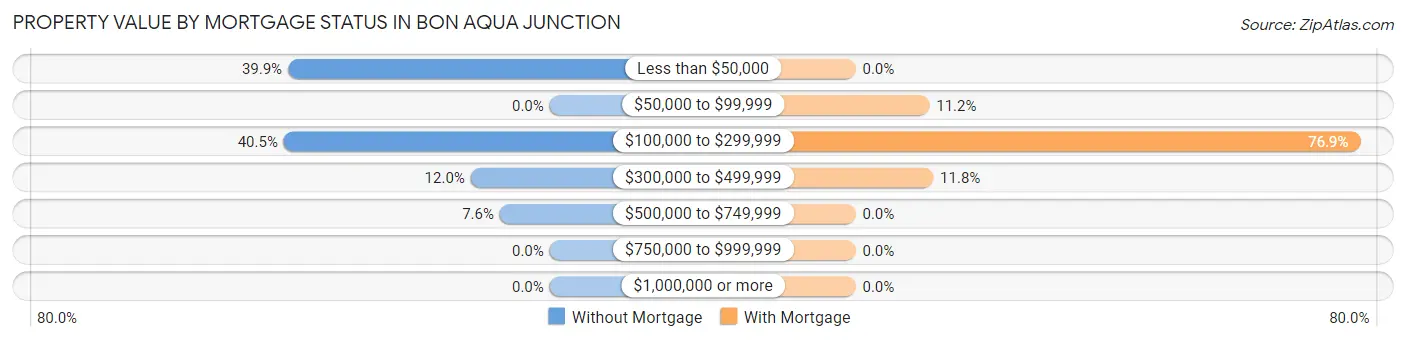
| Property Value | Without Mortgage | With Mortgage |
| Less than $50,000 | 63 (39.9%) | 0 (0.0%) |
| $50,000 to $99,999 | 0 (0.0%) | 19 (11.2%) |
| $100,000 to $299,999 | 64 (40.5%) | 130 (76.9%) |
| $300,000 to $499,999 | 19 (12.0%) | 20 (11.8%) |
| $500,000 to $749,999 | 12 (7.6%) | 0 (0.0%) |
| $750,000 to $999,999 | 0 (0.0%) | 0 (0.0%) |
| $1,000,000 or more | 0 (0.0%) | 0 (0.0%) |
| Total | 158 (100.0%) | 169 (100.0%) |
Household Income by Mortgage Status in Bon Aqua Junction
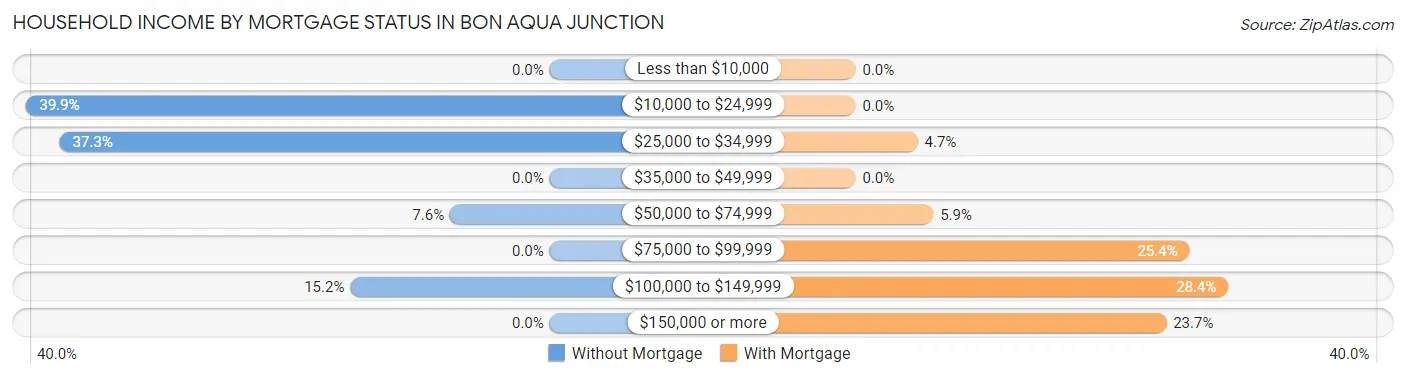
| Household Income | Without Mortgage | With Mortgage |
| Less than $10,000 | 0 (0.0%) | 0 (0.0%) |
| $10,000 to $24,999 | 63 (39.9%) | 0 (0.0%) |
| $25,000 to $34,999 | 59 (37.3%) | 8 (4.7%) |
| $35,000 to $49,999 | 0 (0.0%) | 0 (0.0%) |
| $50,000 to $74,999 | 12 (7.6%) | 10 (5.9%) |
| $75,000 to $99,999 | 0 (0.0%) | 43 (25.4%) |
| $100,000 to $149,999 | 24 (15.2%) | 48 (28.4%) |
| $150,000 or more | 0 (0.0%) | 40 (23.7%) |
| Total | 158 (100.0%) | 169 (100.0%) |
Property Value to Household Income Ratio in Bon Aqua Junction
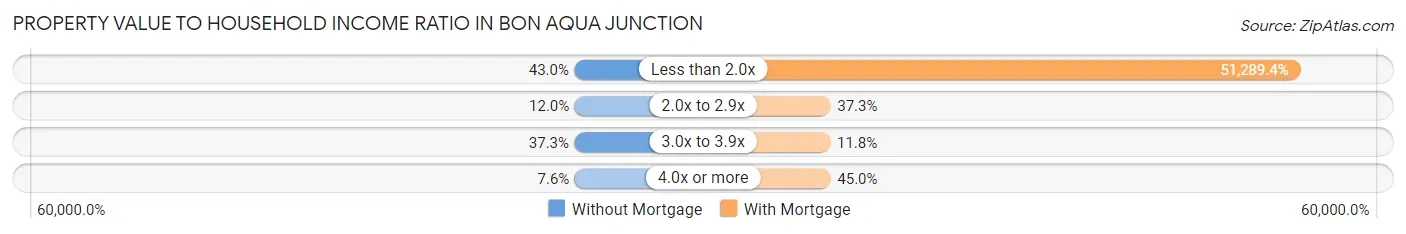
| Value-to-Income Ratio | Without Mortgage | With Mortgage |
| Less than 2.0x | 68 (43.0%) | 86,679 (51,289.4%) |
| 2.0x to 2.9x | 19 (12.0%) | 63 (37.3%) |
| 3.0x to 3.9x | 59 (37.3%) | 20 (11.8%) |
| 4.0x or more | 12 (7.6%) | 76 (45.0%) |
| Total | 158 (100.0%) | 169 (100.0%) |
Real Estate Taxes by Mortgage Status in Bon Aqua Junction
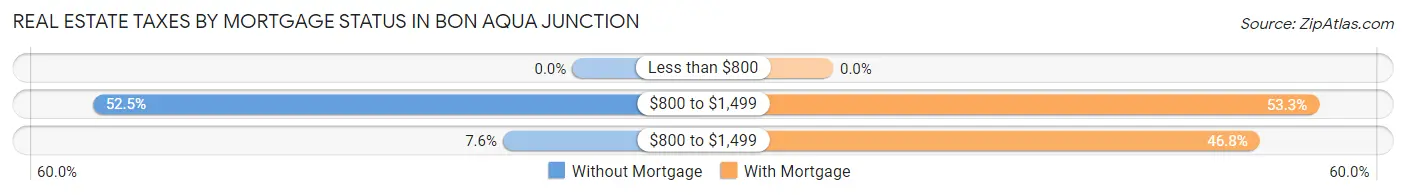
| Property Taxes | Without Mortgage | With Mortgage |
| Less than $800 | 0 (0.0%) | 0 (0.0%) |
| $800 to $1,499 | 83 (52.5%) | 90 (53.2%) |
| $800 to $1,499 | 12 (7.6%) | 79 (46.8%) |
| Total | 158 (100.0%) | 169 (100.0%) |
Health & Disability in Bon Aqua Junction
Health Insurance Coverage by Age in Bon Aqua Junction
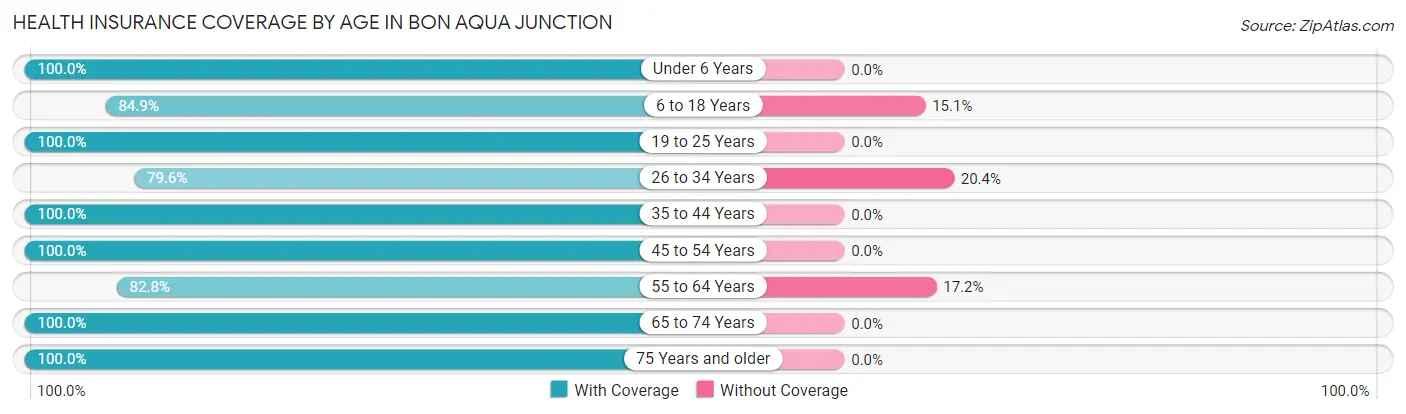
| Age Bracket | With Coverage | Without Coverage |
| Under 6 Years | 64 (100.0%) | 0 (0.0%) |
| 6 to 18 Years | 467 (84.9%) | 83 (15.1%) |
| 19 to 25 Years | 74 (100.0%) | 0 (0.0%) |
| 26 to 34 Years | 265 (79.6%) | 68 (20.4%) |
| 35 to 44 Years | 210 (100.0%) | 0 (0.0%) |
| 45 to 54 Years | 193 (100.0%) | 0 (0.0%) |
| 55 to 64 Years | 82 (82.8%) | 17 (17.2%) |
| 65 to 74 Years | 56 (100.0%) | 0 (0.0%) |
| 75 Years and older | 98 (100.0%) | 0 (0.0%) |
| Total | 1,509 (90.0%) | 168 (10.0%) |
Health Insurance Coverage by Citizenship Status in Bon Aqua Junction
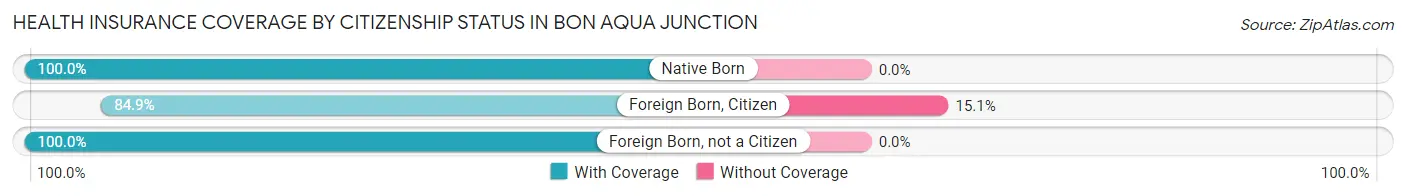
| Citizenship Status | With Coverage | Without Coverage |
| Native Born | 64 (100.0%) | 0 (0.0%) |
| Foreign Born, Citizen | 467 (84.9%) | 83 (15.1%) |
| Foreign Born, not a Citizen | 74 (100.0%) | 0 (0.0%) |
Health Insurance Coverage by Household Income in Bon Aqua Junction
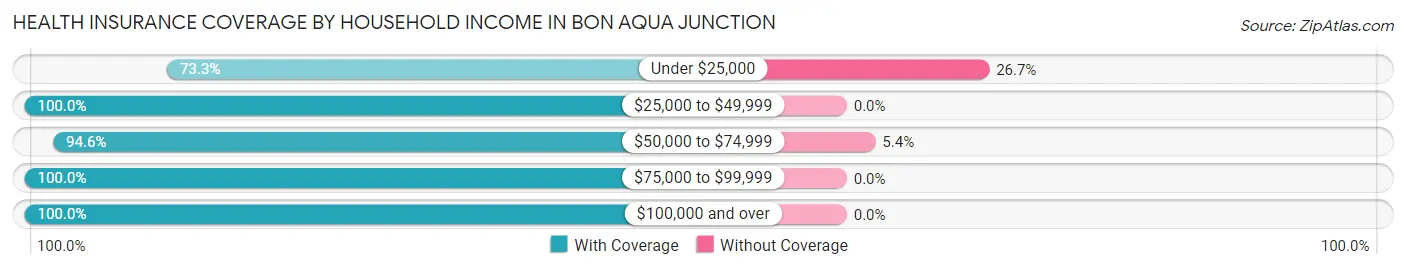
| Household Income | With Coverage | Without Coverage |
| Under $25,000 | 415 (73.3%) | 151 (26.7%) |
| $25,000 to $49,999 | 383 (100.0%) | 0 (0.0%) |
| $50,000 to $74,999 | 300 (94.6%) | 17 (5.4%) |
| $75,000 to $99,999 | 96 (100.0%) | 0 (0.0%) |
| $100,000 and over | 315 (100.0%) | 0 (0.0%) |
Public vs Private Health Insurance Coverage by Age in Bon Aqua Junction
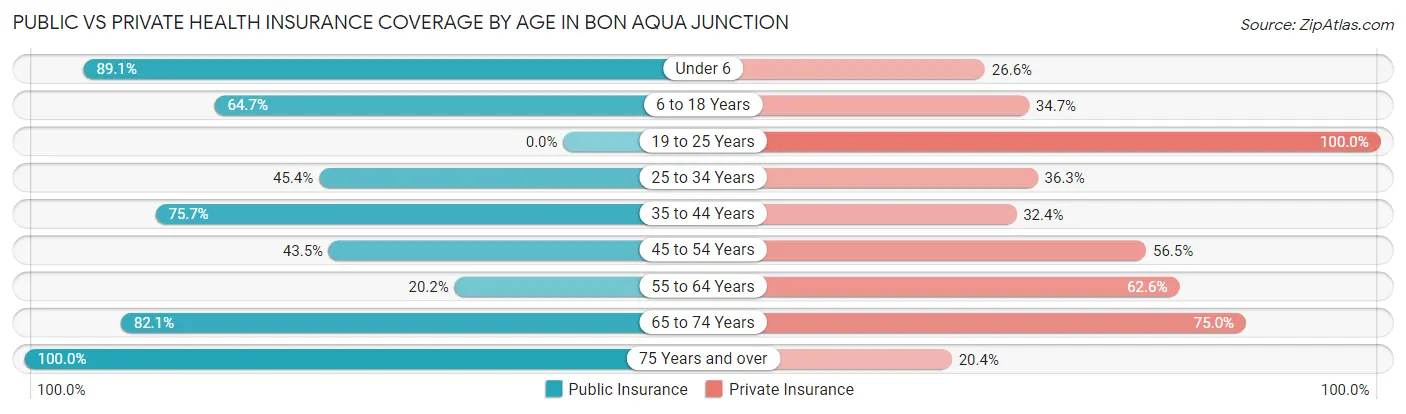
| Age Bracket | Public Insurance | Private Insurance |
| Under 6 | 57 (89.1%) | 17 (26.6%) |
| 6 to 18 Years | 356 (64.7%) | 191 (34.7%) |
| 19 to 25 Years | 0 (0.0%) | 74 (100.0%) |
| 25 to 34 Years | 151 (45.4%) | 121 (36.3%) |
| 35 to 44 Years | 159 (75.7%) | 68 (32.4%) |
| 45 to 54 Years | 84 (43.5%) | 109 (56.5%) |
| 55 to 64 Years | 20 (20.2%) | 62 (62.6%) |
| 65 to 74 Years | 46 (82.1%) | 42 (75.0%) |
| 75 Years and over | 98 (100.0%) | 20 (20.4%) |
| Total | 971 (57.9%) | 704 (42.0%) |
Disability Status by Sex by Age in Bon Aqua Junction
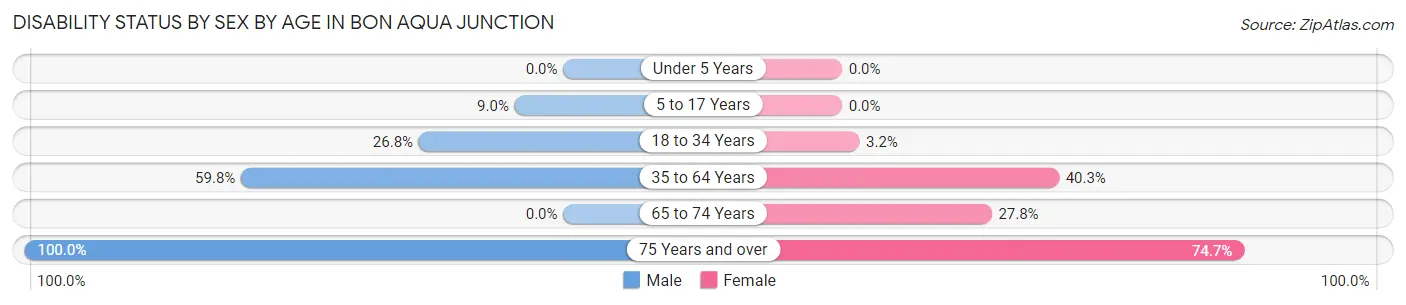
| Age Bracket | Male | Female |
| Under 5 Years | 0 (0.0%) | 0 (0.0%) |
| 5 to 17 Years | 34 (9.0%) | 0 (0.0%) |
| 18 to 34 Years | 63 (26.8%) | 7 (3.2%) |
| 35 to 64 Years | 119 (59.8%) | 122 (40.3%) |
| 65 to 74 Years | 0 (0.0%) | 10 (27.8%) |
| 75 Years and over | 19 (100.0%) | 59 (74.7%) |
Disability Class by Sex by Age in Bon Aqua Junction
Disability Class: Hearing Difficulty
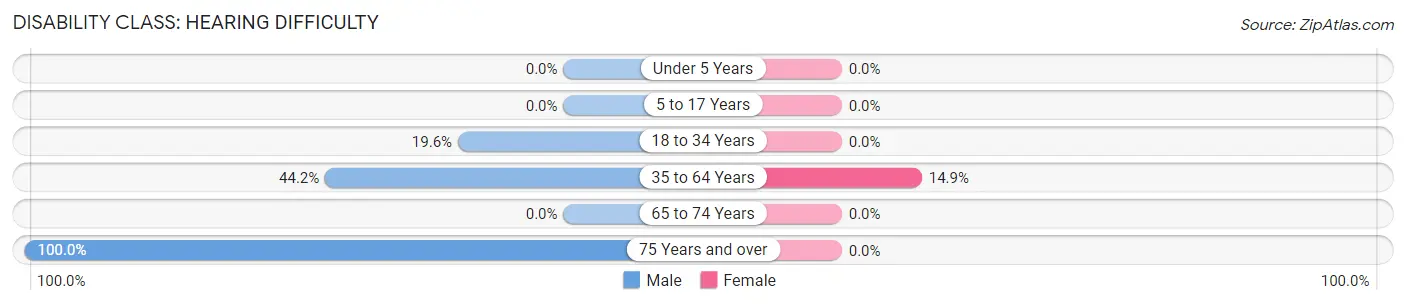
| Age Bracket | Male | Female |
| Under 5 Years | 0 (0.0%) | 0 (0.0%) |
| 5 to 17 Years | 0 (0.0%) | 0 (0.0%) |
| 18 to 34 Years | 46 (19.6%) | 0 (0.0%) |
| 35 to 64 Years | 88 (44.2%) | 45 (14.8%) |
| 65 to 74 Years | 0 (0.0%) | 0 (0.0%) |
| 75 Years and over | 19 (100.0%) | 0 (0.0%) |
Disability Class: Vision Difficulty
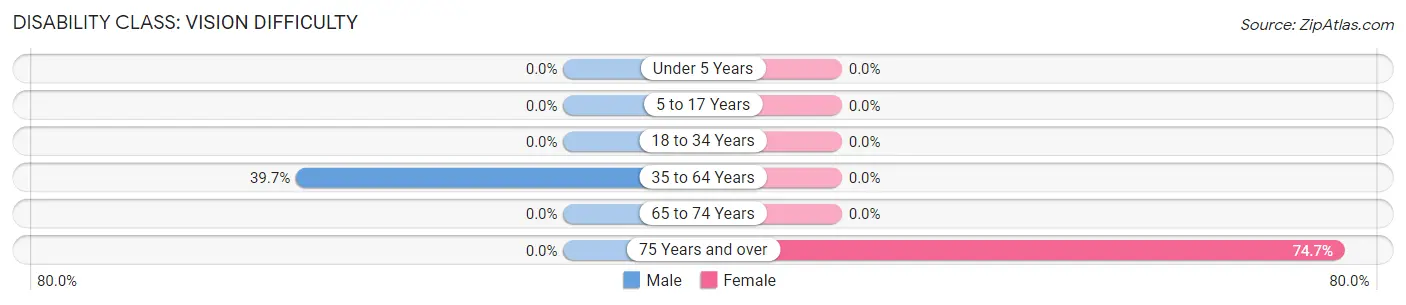
| Age Bracket | Male | Female |
| Under 5 Years | 0 (0.0%) | 0 (0.0%) |
| 5 to 17 Years | 0 (0.0%) | 0 (0.0%) |
| 18 to 34 Years | 0 (0.0%) | 0 (0.0%) |
| 35 to 64 Years | 79 (39.7%) | 0 (0.0%) |
| 65 to 74 Years | 0 (0.0%) | 0 (0.0%) |
| 75 Years and over | 0 (0.0%) | 59 (74.7%) |
Disability Class: Cognitive Difficulty
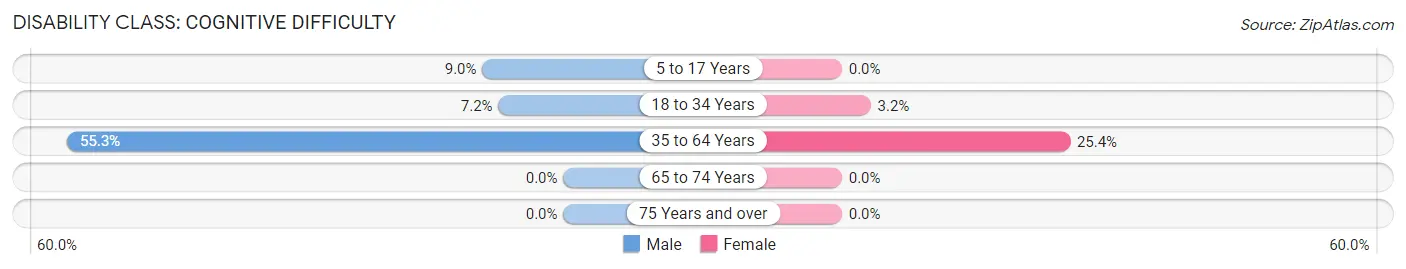
| Age Bracket | Male | Female |
| 5 to 17 Years | 34 (9.0%) | 0 (0.0%) |
| 18 to 34 Years | 17 (7.2%) | 7 (3.2%) |
| 35 to 64 Years | 110 (55.3%) | 77 (25.4%) |
| 65 to 74 Years | 0 (0.0%) | 0 (0.0%) |
| 75 Years and over | 0 (0.0%) | 0 (0.0%) |
Disability Class: Ambulatory Difficulty
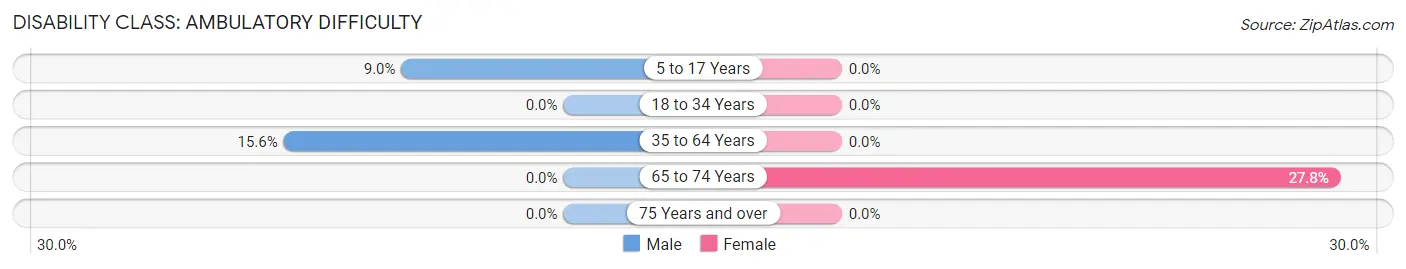
| Age Bracket | Male | Female |
| 5 to 17 Years | 34 (9.0%) | 0 (0.0%) |
| 18 to 34 Years | 0 (0.0%) | 0 (0.0%) |
| 35 to 64 Years | 31 (15.6%) | 0 (0.0%) |
| 65 to 74 Years | 0 (0.0%) | 10 (27.8%) |
| 75 Years and over | 0 (0.0%) | 0 (0.0%) |
Disability Class: Self-Care Difficulty
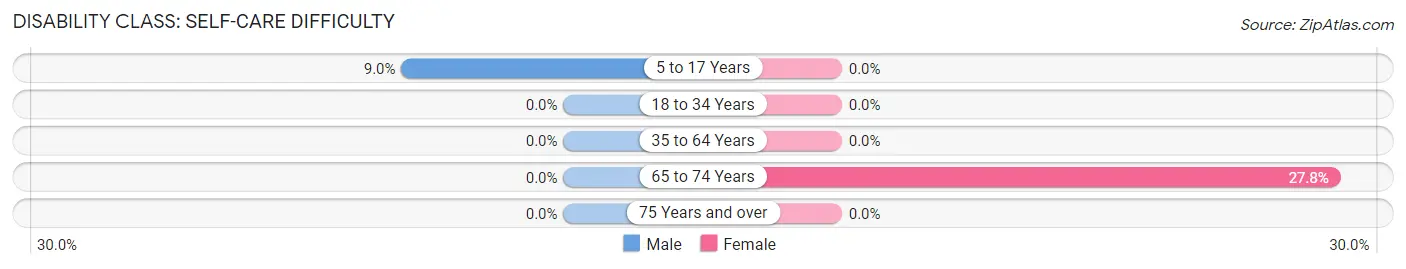
| Age Bracket | Male | Female |
| 5 to 17 Years | 34 (9.0%) | 0 (0.0%) |
| 18 to 34 Years | 0 (0.0%) | 0 (0.0%) |
| 35 to 64 Years | 0 (0.0%) | 0 (0.0%) |
| 65 to 74 Years | 0 (0.0%) | 10 (27.8%) |
| 75 Years and over | 0 (0.0%) | 0 (0.0%) |
Technology Access in Bon Aqua Junction
Computing Device Access in Bon Aqua Junction
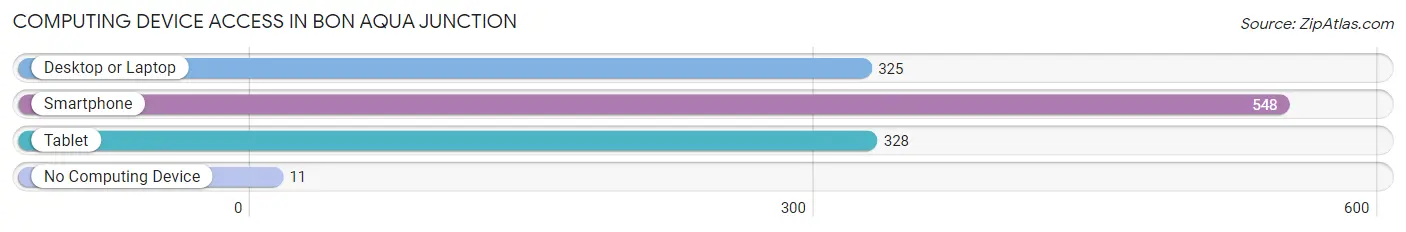
| Device Type | # Households | % Households |
| Desktop or Laptop | 325 | 58.1% |
| Smartphone | 548 | 98.0% |
| Tablet | 328 | 58.7% |
| No Computing Device | 11 | 2.0% |
| Total | 559 | 100.0% |
Internet Access in Bon Aqua Junction
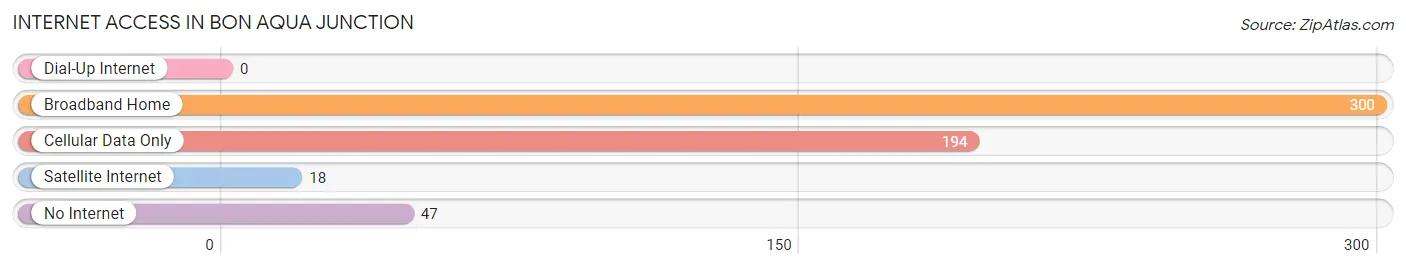
| Internet Type | # Households | % Households |
| Dial-Up Internet | 0 | 0.0% |
| Broadband Home | 300 | 53.7% |
| Cellular Data Only | 194 | 34.7% |
| Satellite Internet | 18 | 3.2% |
| No Internet | 47 | 8.4% |
| Total | 559 | 100.0% |
Bon Aqua Junction Summary
Baq Aqua Junction is a small town located in Hickman County, Tennessee. It is situated on the banks of the Duck River, approximately 40 miles southwest of Nashville. The town was founded in 1820 and is named after the nearby Baq Aqua Springs. The population of Baq Aqua Junction was estimated to be 1,072 in 2019.
History
Baq Aqua Junction was founded in 1820 by a group of settlers from North Carolina. The town was originally known as “Baq Aqua Springs”, named after the nearby Baq Aqua Springs. The springs were a popular destination for travelers and settlers, and the town quickly grew in size.
In 1836, the town was officially incorporated as “Baq Aqua Junction”. The name was chosen to reflect the town’s location at the junction of the Duck River and the Baq Aqua Springs.
The town was an important stop on the Nashville and Decatur Railroad, which ran through the town from 1854 to 1871. The railroad brought new settlers and businesses to the area, and the town continued to grow.
In the late 19th century, Baq Aqua Junction became a popular tourist destination. The town was known for its mineral springs, which were believed to have healing properties. The town also had several hotels and resorts, which attracted visitors from all over the country.
In the early 20th century, the town began to decline. The railroad was abandoned in the 1920s, and the mineral springs were no longer believed to have healing properties. The town’s population began to decline, and by the 1950s, the town was nearly abandoned.
In the late 20th century, the town began to experience a resurgence. The town was designated as a historic district in the 1980s, and several of the town’s historic buildings were restored. The town also began to attract new businesses and residents, and the population began to grow again.
Geography
Baq Aqua Junction is located in Hickman County, Tennessee. The town is situated on the banks of the Duck River, approximately 40 miles southwest of Nashville. The town is surrounded by rolling hills and farmland, and is located in a rural area.
The climate in Baq Aqua Junction is humid subtropical, with hot summers and mild winters. The average annual temperature is around 65°F, and the average annual precipitation is around 45 inches.
Economy
The economy of Baq Aqua Junction is largely based on agriculture and tourism. The town is home to several farms, which produce a variety of crops, including corn, soybeans, and wheat. The town is also home to several tourist attractions, including the Baq Aqua Springs, which attract visitors from all over the country.
The town is also home to several small businesses, including restaurants, shops, and a local newspaper. The town is served by the Duck River Electric Cooperative, which provides electricity to the area.
Demographics
The population of Baq Aqua Junction was estimated to be 1,072 in 2019. The town is predominantly white, with a small African American population. The median household income is around $37,000, and the median home value is around $90,000. The town has a low unemployment rate, and the poverty rate is below the national average.
Common Questions
What is Per Capita Income in Bon Aqua Junction?
Per Capita income in Bon Aqua Junction is $18,920.
What is the Median Family Income in Bon Aqua Junction?
Median Family Income in Bon Aqua Junction is $34,821.
What is the Median Household income in Bon Aqua Junction?
Median Household Income in Bon Aqua Junction is $33,321.
What is Income or Wage Gap in Bon Aqua Junction?
Income or Wage Gap in Bon Aqua Junction is 14.4%.
Women in Bon Aqua Junction earn 85.6 cents for every dollar earned by a man.
What is Inequality or Gini Index in Bon Aqua Junction?
Inequality or Gini Index in Bon Aqua Junction is 0.45.
What is the Total Population of Bon Aqua Junction?
Total Population of Bon Aqua Junction is 1,677.
What is the Total Male Population of Bon Aqua Junction?
Total Male Population of Bon Aqua Junction is 883.
What is the Total Female Population of Bon Aqua Junction?
Total Female Population of Bon Aqua Junction is 794.
What is the Ratio of Males per 100 Females in Bon Aqua Junction?
There are 111.21 Males per 100 Females in Bon Aqua Junction.
What is the Ratio of Females per 100 Males in Bon Aqua Junction?
There are 89.92 Females per 100 Males in Bon Aqua Junction.
What is the Median Population Age in Bon Aqua Junction?
Median Population Age in Bon Aqua Junction is 28.4 Years.
What is the Average Family Size in Bon Aqua Junction
Average Family Size in Bon Aqua Junction is 3.3 People.
What is the Average Household Size in Bon Aqua Junction
Average Household Size in Bon Aqua Junction is 3.0 People.
How Large is the Labor Force in Bon Aqua Junction?
There are 604 People in the Labor Forcein in Bon Aqua Junction.
What is the Percentage of People in the Labor Force in Bon Aqua Junction?
54.2% of People are in the Labor Force in Bon Aqua Junction.
What is the Unemployment Rate in Bon Aqua Junction?
Unemployment Rate in Bon Aqua Junction is 1.5%.