South Royalton, VT Map & Demographics
South Royalton Map
South Royalton Overview
$27,517
PER CAPITA INCOME
$92,885
AVG FAMILY INCOME
$44,423
AVG HOUSEHOLD INCOME
0.44
INEQUALITY / GINI INDEX
475
TOTAL POPULATION
158
MALE POPULATION
317
FEMALE POPULATION
49.84
MALES / 100 FEMALES
200.63
FEMALES / 100 MALES
49.2
MEDIAN AGE
3.9
AVG FAMILY SIZE
2.5
AVG HOUSEHOLD SIZE
282
LABOR FORCE [ PEOPLE ]
75.6%
PERCENT IN LABOR FORCE
South Royalton Zip Codes
South Royalton Area Codes
Income in South Royalton
Income Overview in South Royalton
Per Capita Income in South Royalton is $27,517, while median incomes of families and households are $92,885 and $44,423 respectively.
| Characteristic | Number | Measure |
| Per Capita Income | 475 | $27,517 |
| Median Family Income | 86 | $92,885 |
| Mean Family Income | 86 | $78,872 |
| Median Household Income | 192 | $44,423 |
| Mean Household Income | 192 | $51,369 |
| Income Deficit | 86 | $0 |
| Wage / Income Gap (%) | 475 | 0.00% |
| Wage / Income Gap ($) | 475 | 100.00¢ per $1 |
| Gini / Inequality Index | 475 | 0.44 |
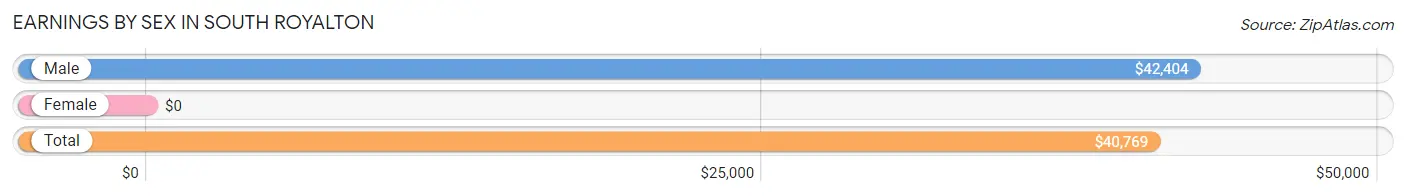
Earnings by Sex in South Royalton
| Sex | Number | Average Earnings |
| Male | 83 (29.4%) | $42,404 |
| Female | 199 (70.6%) | $0 |
| Total | 282 (100.0%) | $40,769 |
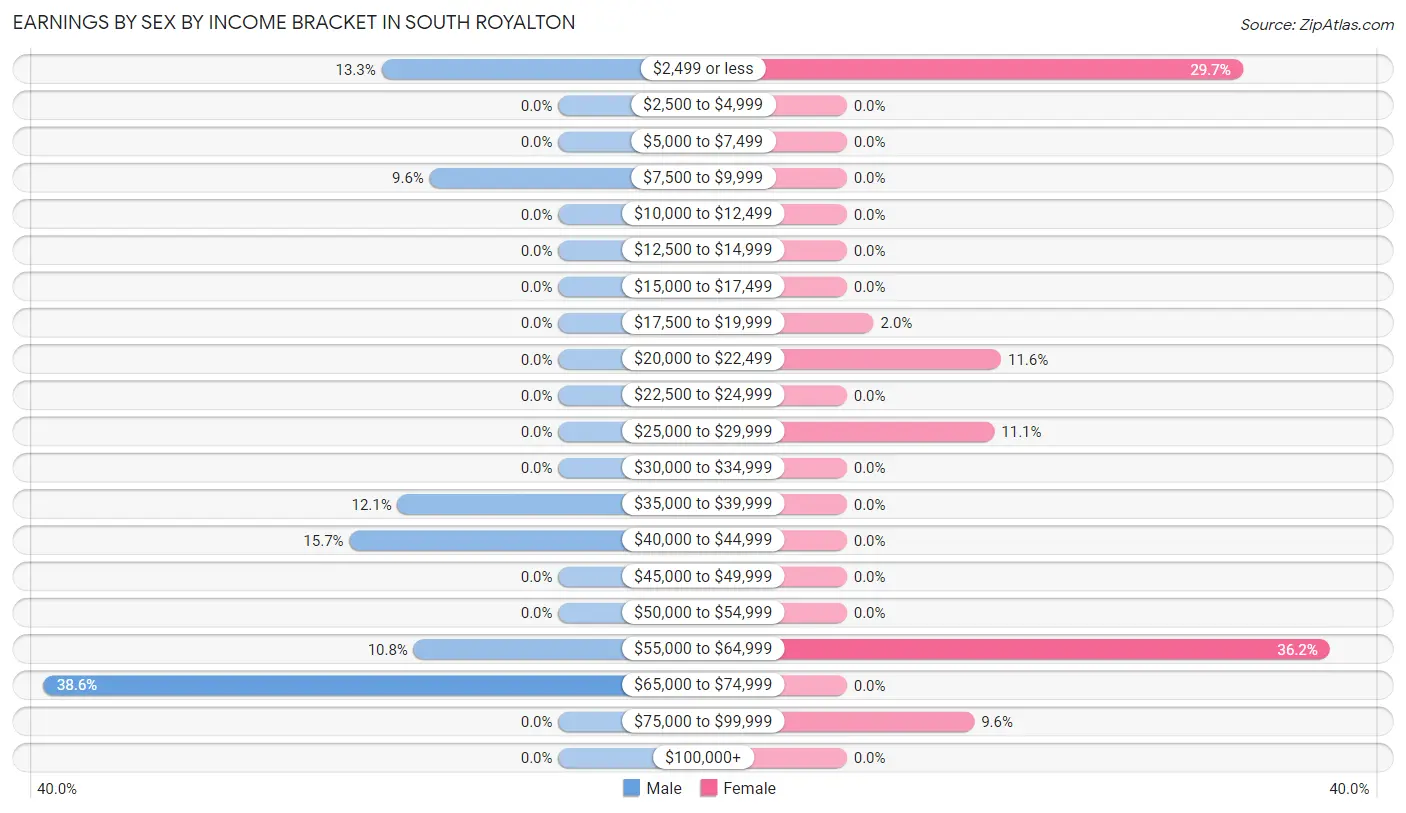
Earnings by Sex by Income Bracket in South Royalton
The most common earnings brackets in South Royalton are $65,000 to $74,999 for men (32 | 38.6%) and $55,000 to $64,999 for women (72 | 36.2%).
| Income | Male | Female |
| $2,499 or less | 11 (13.3%) | 59 (29.6%) |
| $2,500 to $4,999 | 0 (0.0%) | 0 (0.0%) |
| $5,000 to $7,499 | 0 (0.0%) | 0 (0.0%) |
| $7,500 to $9,999 | 8 (9.6%) | 0 (0.0%) |
| $10,000 to $12,499 | 0 (0.0%) | 0 (0.0%) |
| $12,500 to $14,999 | 0 (0.0%) | 0 (0.0%) |
| $15,000 to $17,499 | 0 (0.0%) | 0 (0.0%) |
| $17,500 to $19,999 | 0 (0.0%) | 4 (2.0%) |
| $20,000 to $22,499 | 0 (0.0%) | 23 (11.6%) |
| $22,500 to $24,999 | 0 (0.0%) | 0 (0.0%) |
| $25,000 to $29,999 | 0 (0.0%) | 22 (11.1%) |
| $30,000 to $34,999 | 0 (0.0%) | 0 (0.0%) |
| $35,000 to $39,999 | 10 (12.0%) | 0 (0.0%) |
| $40,000 to $44,999 | 13 (15.7%) | 0 (0.0%) |
| $45,000 to $49,999 | 0 (0.0%) | 0 (0.0%) |
| $50,000 to $54,999 | 0 (0.0%) | 0 (0.0%) |
| $55,000 to $64,999 | 9 (10.8%) | 72 (36.2%) |
| $65,000 to $74,999 | 32 (38.6%) | 0 (0.0%) |
| $75,000 to $99,999 | 0 (0.0%) | 19 (9.6%) |
| $100,000+ | 0 (0.0%) | 0 (0.0%) |
| Total | 83 (100.0%) | 199 (100.0%) |
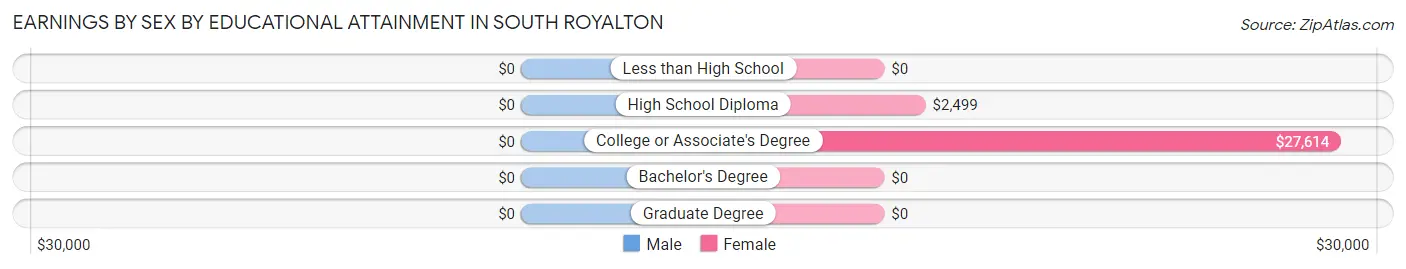
Earnings by Sex by Educational Attainment in South Royalton
| Educational Attainment | Male Income | Female Income |
| Less than High School | - | - |
| High School Diploma | - | - |
| College or Associate's Degree | - | - |
| Bachelor's Degree | - | - |
| Graduate Degree | - | - |
| Total | $58,472 | $0 |
Family Income in South Royalton
Family Income Brackets in South Royalton
According to the South Royalton family income data, there are 26 families falling into the $75,000 to $99,999 income range, which is the most common income bracket and makes up 30.2% of all families.
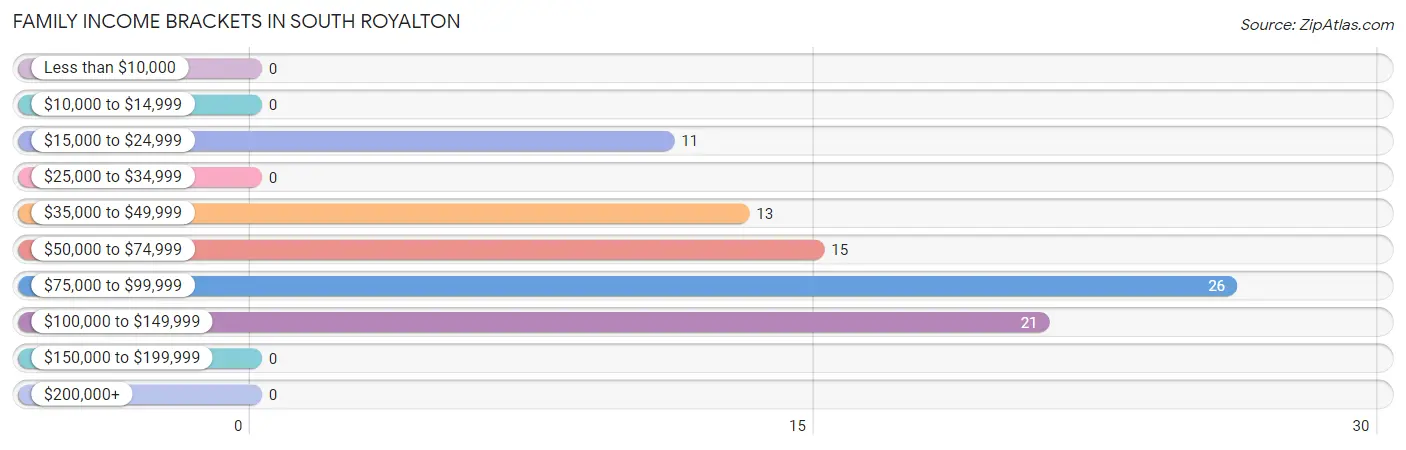
| Income Bracket | # Families | % Families |
| Less than $10,000 | 0 | 0.0% |
| $10,000 to $14,999 | 0 | 0.0% |
| $15,000 to $24,999 | 11 | 12.8% |
| $25,000 to $34,999 | 0 | 0.0% |
| $35,000 to $49,999 | 13 | 15.1% |
| $50,000 to $74,999 | 15 | 17.4% |
| $75,000 to $99,999 | 26 | 30.2% |
| $100,000 to $149,999 | 21 | 24.4% |
| $150,000 to $199,999 | 0 | 0.0% |
| $200,000+ | 0 | 0.0% |
Family Income by Famaliy Size in South Royalton
2-person families (60 | 69.8%) account for the highest median family income in South Royalton with $94,135 per family, while 2-person families (60 | 69.8%) have the highest median income of $47,068 per family member.
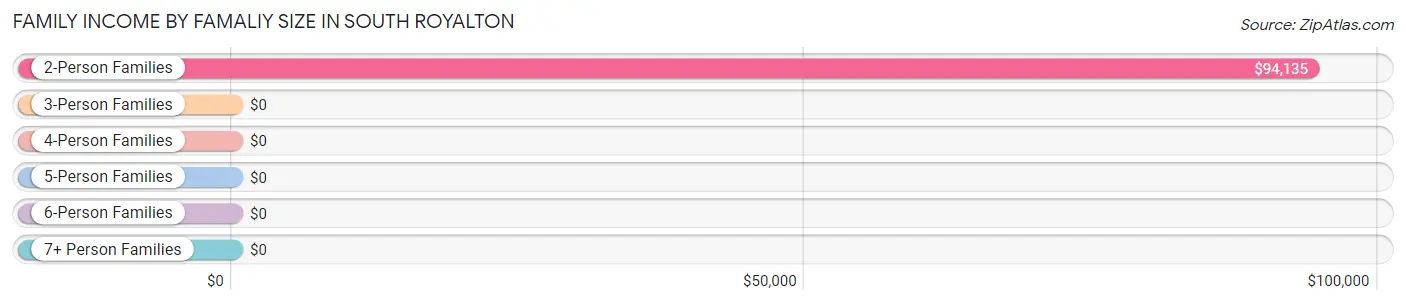
| Income Bracket | # Families | Median Income |
| 2-Person Families | 60 (69.8%) | $94,135 |
| 3-Person Families | 0 (0.0%) | $0 |
| 4-Person Families | 13 (15.1%) | $0 |
| 5-Person Families | 0 (0.0%) | $0 |
| 6-Person Families | 13 (15.1%) | $0 |
| 7+ Person Families | 0 (0.0%) | $0 |
| Total | 86 (100.0%) | $92,885 |
Family Income by Number of Earners in South Royalton
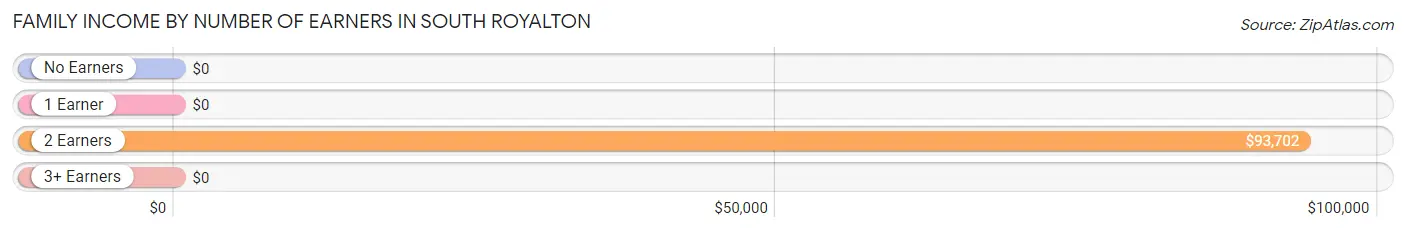
| Number of Earners | # Families | Median Income |
| No Earners | 13 (15.1%) | $0 |
| 1 Earner | 4 (4.6%) | $0 |
| 2 Earners | 69 (80.2%) | $93,702 |
| 3+ Earners | 0 (0.0%) | $0 |
| Total | 86 (100.0%) | $92,885 |
Household Income in South Royalton
Household Income Brackets in South Royalton
With 42 households falling in the category, the $50,000 to $74,999 income range is the most frequent in South Royalton, accounting for 21.9% of all households.
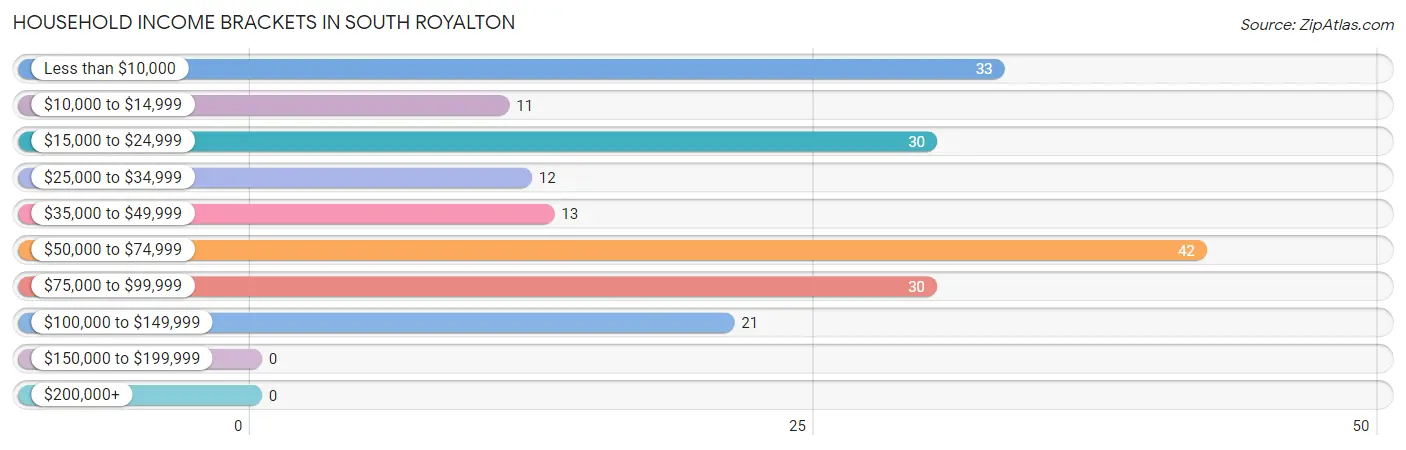
| Income Bracket | # Households | % Households |
| Less than $10,000 | 33 | 17.2% |
| $10,000 to $14,999 | 11 | 5.7% |
| $15,000 to $24,999 | 30 | 15.6% |
| $25,000 to $34,999 | 12 | 6.3% |
| $35,000 to $49,999 | 13 | 6.8% |
| $50,000 to $74,999 | 42 | 21.9% |
| $75,000 to $99,999 | 30 | 15.6% |
| $100,000 to $149,999 | 21 | 10.9% |
| $150,000 to $199,999 | 0 | 0.0% |
| $200,000+ | 0 | 0.0% |
Household Income by Householder Age in South Royalton
The median household income in South Royalton is $44,423, with the highest median household income of $92,692 found in the 65+ years age bracket for the primary householder. A total of 48 households (25.0%) fall into this category. Meanwhile, the 15 to 24 years age bracket for the primary householder has the lowest median household income of $0, with 33 households (17.2%) in this group.
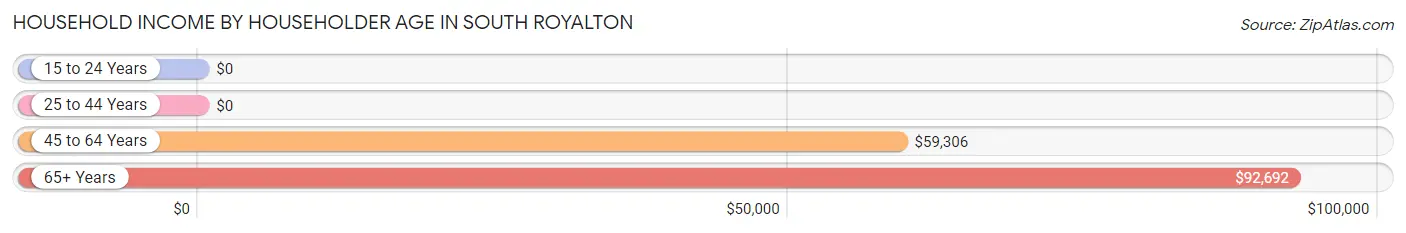
| Income Bracket | # Households | Median Income |
| 15 to 24 Years | 33 (17.2%) | $0 |
| 25 to 44 Years | 28 (14.6%) | $0 |
| 45 to 64 Years | 83 (43.2%) | $59,306 |
| 65+ Years | 48 (25.0%) | $92,692 |
| Total | 192 (100.0%) | $44,423 |
Poverty in South Royalton
Income Below Poverty by Sex and Age in South Royalton
With 30.4% poverty level for males and 11.0% for females among the residents of South Royalton, under 5 year old males and 18 to 24 year old females are the most vulnerable to poverty, with 10 males (100.0%) and 25 females (100.0%) in their respective age groups living below the poverty level.
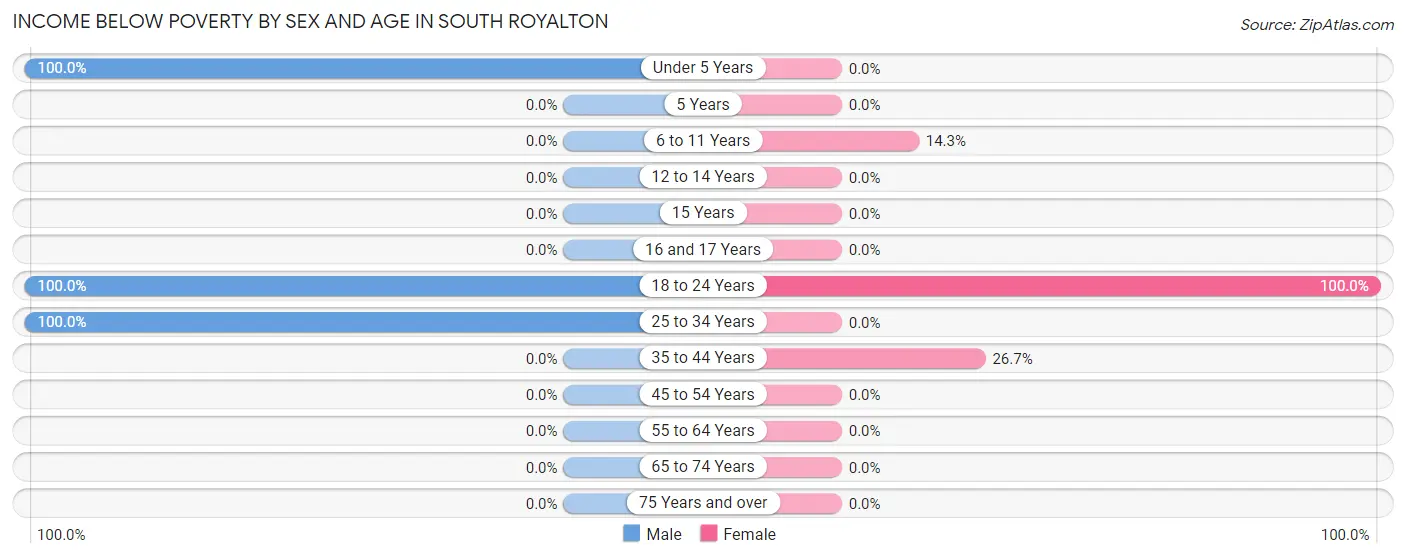
| Age Bracket | Male | Female |
| Under 5 Years | 10 (100.0%) | 0 (0.0%) |
| 5 Years | 0 (0.0%) | 0 (0.0%) |
| 6 to 11 Years | 0 (0.0%) | 5 (14.3%) |
| 12 to 14 Years | 0 (0.0%) | 0 (0.0%) |
| 15 Years | 0 (0.0%) | 0 (0.0%) |
| 16 and 17 Years | 0 (0.0%) | 0 (0.0%) |
| 18 to 24 Years | 27 (100.0%) | 25 (100.0%) |
| 25 to 34 Years | 11 (100.0%) | 0 (0.0%) |
| 35 to 44 Years | 0 (0.0%) | 4 (26.7%) |
| 45 to 54 Years | 0 (0.0%) | 0 (0.0%) |
| 55 to 64 Years | 0 (0.0%) | 0 (0.0%) |
| 65 to 74 Years | 0 (0.0%) | 0 (0.0%) |
| 75 Years and over | 0 (0.0%) | 0 (0.0%) |
| Total | 48 (30.4%) | 34 (11.0%) |
Income Above Poverty by Sex and Age in South Royalton
According to the poverty statistics in South Royalton, males aged 6 to 11 years and females aged 12 to 14 years are the age groups that are most secure financially, with 100.0% of males and 100.0% of females in these age groups living above the poverty line.
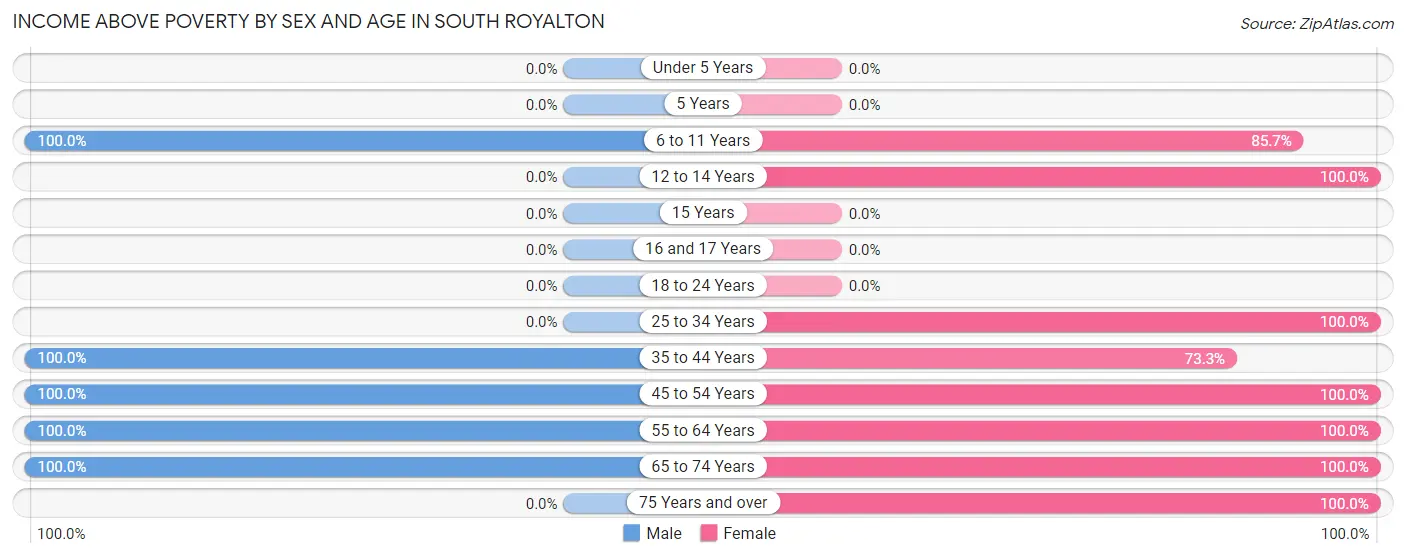
| Age Bracket | Male | Female |
| Under 5 Years | 0 (0.0%) | 0 (0.0%) |
| 5 Years | 0 (0.0%) | 0 (0.0%) |
| 6 to 11 Years | 33 (100.0%) | 30 (85.7%) |
| 12 to 14 Years | 0 (0.0%) | 16 (100.0%) |
| 15 Years | 0 (0.0%) | 0 (0.0%) |
| 16 and 17 Years | 0 (0.0%) | 0 (0.0%) |
| 18 to 24 Years | 0 (0.0%) | 0 (0.0%) |
| 25 to 34 Years | 0 (0.0%) | 22 (100.0%) |
| 35 to 44 Years | 13 (100.0%) | 11 (73.3%) |
| 45 to 54 Years | 32 (100.0%) | 106 (100.0%) |
| 55 to 64 Years | 19 (100.0%) | 42 (100.0%) |
| 65 to 74 Years | 13 (100.0%) | 13 (100.0%) |
| 75 Years and over | 0 (0.0%) | 35 (100.0%) |
| Total | 110 (69.6%) | 275 (89.0%) |
Income Below Poverty Among Married-Couple Families in South Royalton
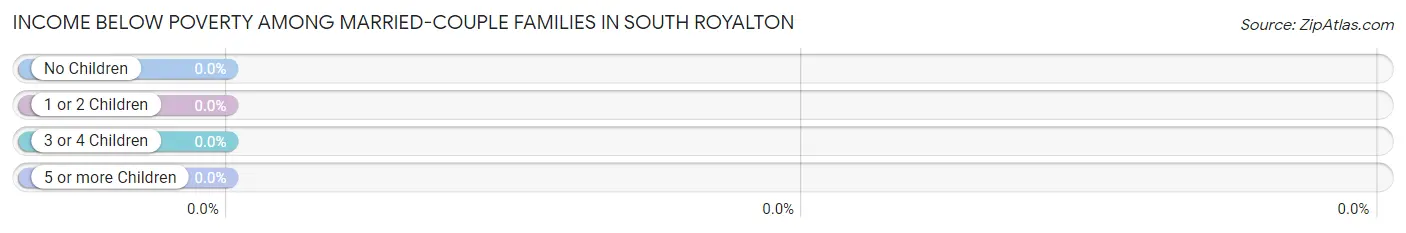
| Children | Above Poverty | Below Poverty |
| No Children | 34 (100.0%) | 0 (0.0%) |
| 1 or 2 Children | 0 (0.0%) | 0 (0.0%) |
| 3 or 4 Children | 13 (100.0%) | 0 (0.0%) |
| 5 or more Children | 0 (0.0%) | 0 (0.0%) |
| Total | 47 (100.0%) | 0 (0.0%) |
Income Below Poverty Among Single-Parent Households in South Royalton
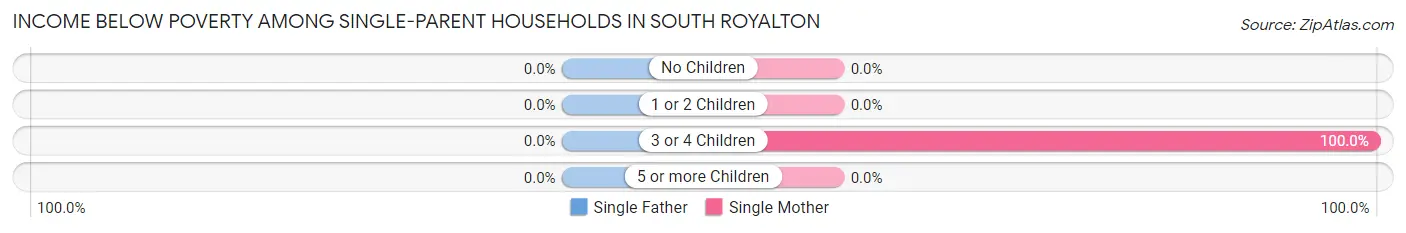
| Children | Single Father | Single Mother |
| No Children | 0 (0.0%) | 0 (0.0%) |
| 1 or 2 Children | 0 (0.0%) | 0 (0.0%) |
| 3 or 4 Children | 0 (0.0%) | 4 (100.0%) |
| 5 or more Children | 0 (0.0%) | 0 (0.0%) |
| Total | 0 (0.0%) | 4 (10.3%) |
Income Below Poverty Among Married-Couple vs Single-Parent Households in South Royalton
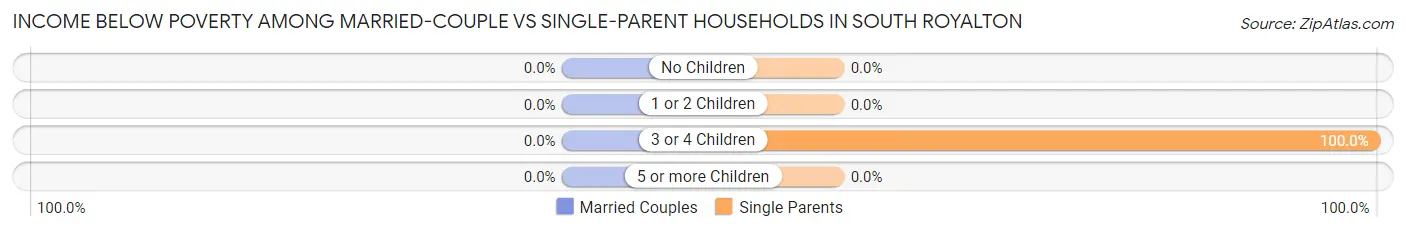
| Children | Married-Couple Families | Single-Parent Households |
| No Children | 0 (0.0%) | 0 (0.0%) |
| 1 or 2 Children | 0 (0.0%) | 0 (0.0%) |
| 3 or 4 Children | 0 (0.0%) | 4 (100.0%) |
| 5 or more Children | 0 (0.0%) | 0 (0.0%) |
| Total | 0 (0.0%) | 4 (10.3%) |
Race in South Royalton
The most populous races in South Royalton are White / Caucasian (404 | 85.1%), Black / African American (30 | 6.3%), and Two or more Races (23 | 4.8%).
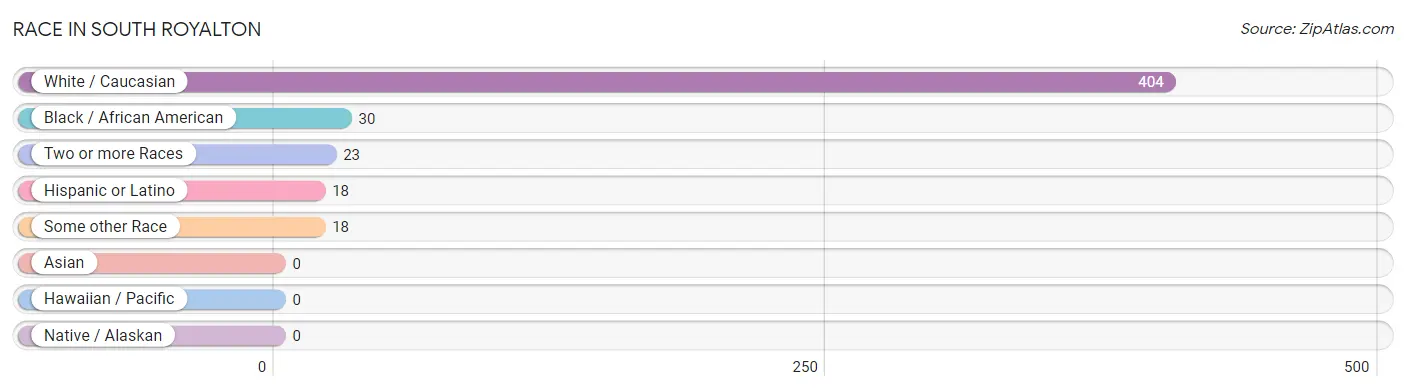
| Race | # Population | % Population |
| Asian | 0 | 0.0% |
| Black / African American | 30 | 6.3% |
| Hawaiian / Pacific | 0 | 0.0% |
| Hispanic or Latino | 18 | 3.8% |
| Native / Alaskan | 0 | 0.0% |
| White / Caucasian | 404 | 85.1% |
| Two or more Races | 23 | 4.8% |
| Some other Race | 18 | 3.8% |
| Total | 475 | 100.0% |
Ancestry in South Royalton
The most populous ancestries reported in South Royalton are American (72 | 15.2%), Irish (52 | 11.0%), French (50 | 10.5%), Russian (37 | 7.8%), and English (28 | 5.9%), together accounting for 50.3% of all South Royalton residents.
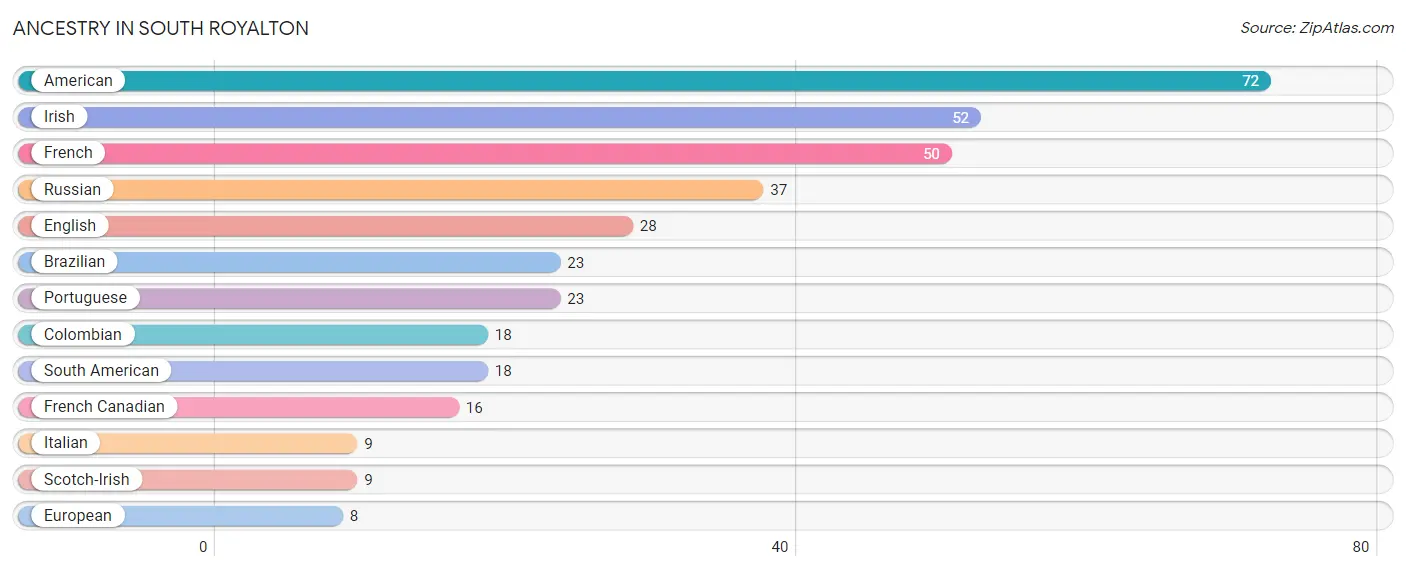
| Ancestry | # Population | % Population |
| American | 72 | 15.2% |
| Brazilian | 23 | 4.8% |
| Colombian | 18 | 3.8% |
| English | 28 | 5.9% |
| European | 8 | 1.7% |
| French | 50 | 10.5% |
| French Canadian | 16 | 3.4% |
| Irish | 52 | 11.0% |
| Italian | 9 | 1.9% |
| Portuguese | 23 | 4.8% |
| Russian | 37 | 7.8% |
| Scotch-Irish | 9 | 1.9% |
| South American | 18 | 3.8% | View All 13 Rows |
Immigrants in South Royalton
The most numerous immigrant groups reported in South Royalton came from Eastern Europe (25 | 5.3%), Europe (25 | 5.3%), and Russia (25 | 5.3%), together accounting for 15.8% of all South Royalton residents.
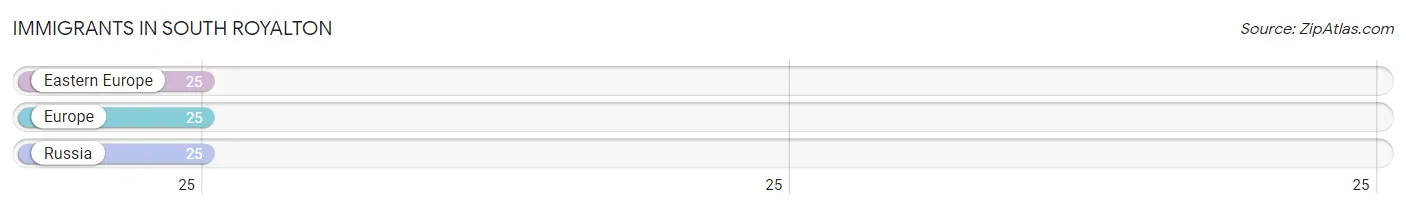
| Immigration Origin | # Population | % Population |
| Eastern Europe | 25 | 5.3% |
| Europe | 25 | 5.3% |
| Russia | 25 | 5.3% | View All 3 Rows |
Sex and Age in South Royalton
Sex and Age in South Royalton
The most populous age groups in South Royalton are 5 to 9 Years (33 | 20.9%) for men and 45 to 49 Years (72 | 22.7%) for women.
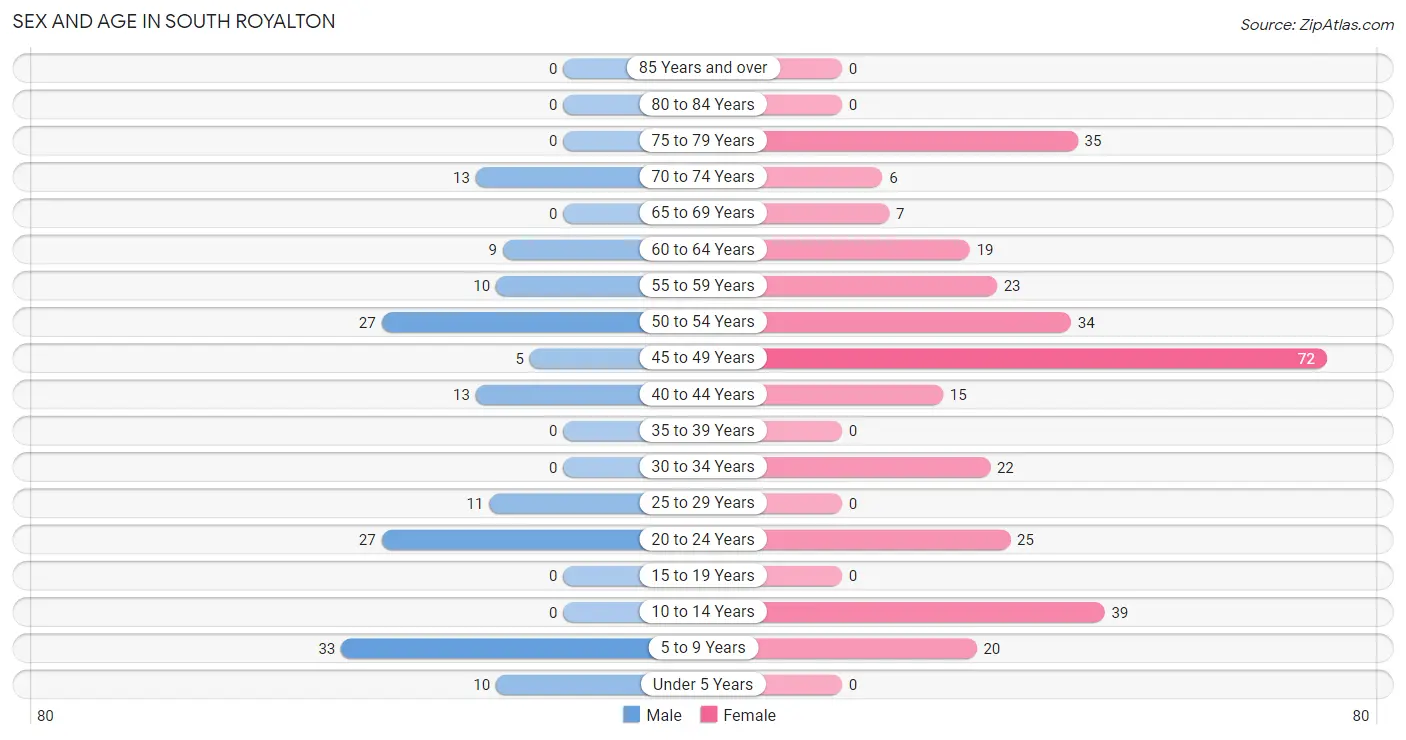
| Age Bracket | Male | Female |
| Under 5 Years | 10 (6.3%) | 0 (0.0%) |
| 5 to 9 Years | 33 (20.9%) | 20 (6.3%) |
| 10 to 14 Years | 0 (0.0%) | 39 (12.3%) |
| 15 to 19 Years | 0 (0.0%) | 0 (0.0%) |
| 20 to 24 Years | 27 (17.1%) | 25 (7.9%) |
| 25 to 29 Years | 11 (7.0%) | 0 (0.0%) |
| 30 to 34 Years | 0 (0.0%) | 22 (6.9%) |
| 35 to 39 Years | 0 (0.0%) | 0 (0.0%) |
| 40 to 44 Years | 13 (8.2%) | 15 (4.7%) |
| 45 to 49 Years | 5 (3.2%) | 72 (22.7%) |
| 50 to 54 Years | 27 (17.1%) | 34 (10.7%) |
| 55 to 59 Years | 10 (6.3%) | 23 (7.3%) |
| 60 to 64 Years | 9 (5.7%) | 19 (6.0%) |
| 65 to 69 Years | 0 (0.0%) | 7 (2.2%) |
| 70 to 74 Years | 13 (8.2%) | 6 (1.9%) |
| 75 to 79 Years | 0 (0.0%) | 35 (11.0%) |
| 80 to 84 Years | 0 (0.0%) | 0 (0.0%) |
| 85 Years and over | 0 (0.0%) | 0 (0.0%) |
| Total | 158 (100.0%) | 317 (100.0%) |
Families and Households in South Royalton
Median Family Size in South Royalton
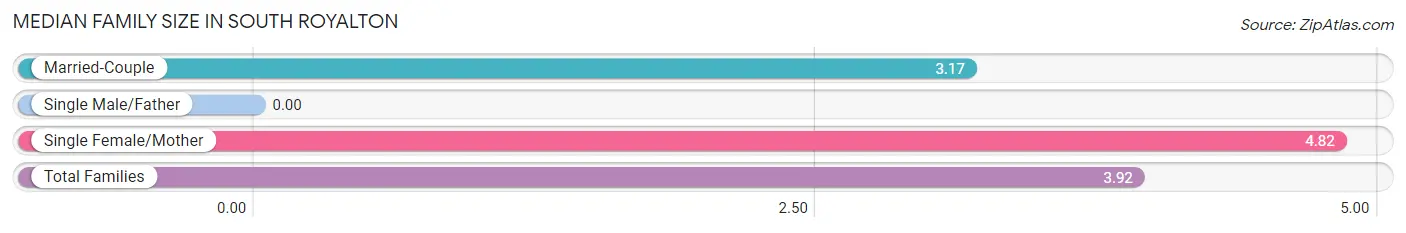
| Family Type | # Families | Family Size |
| Married-Couple | 47 (54.6%) | 3.17 |
| Single Male/Father | 0 (0.0%) | - |
| Single Female/Mother | 39 (45.4%) | 4.82 |
| Total Families | 86 (100.0%) | 3.92 |
Median Household Size in South Royalton
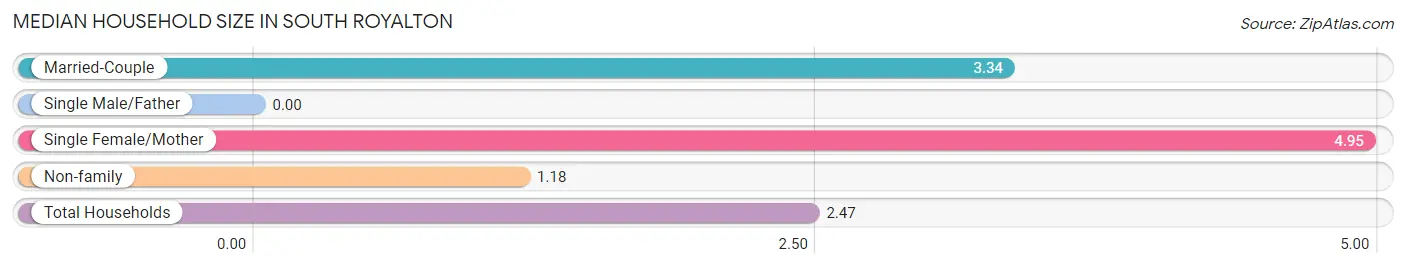
| Household Type | # Households | Household Size |
| Married-Couple | 47 (24.5%) | 3.34 |
| Single Male/Father | 0 (0.0%) | - |
| Single Female/Mother | 39 (20.3%) | 4.95 |
| Non-family | 106 (55.2%) | 1.18 |
| Total Households | 192 (100.0%) | 2.47 |
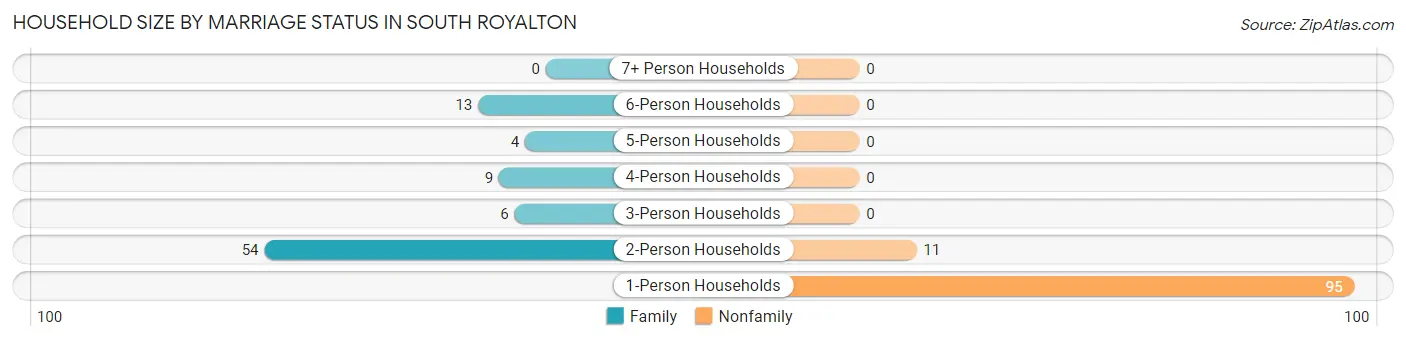
Household Size by Marriage Status in South Royalton
Out of a total of 192 households in South Royalton, 86 (44.8%) are family households, while 106 (55.2%) are nonfamily households. The most numerous type of family households are 2-person households, comprising 54, and the most common type of nonfamily households are 1-person households, comprising 95.
| Household Size | Family Households | Nonfamily Households |
| 1-Person Households | - | 95 (49.5%) |
| 2-Person Households | 54 (28.1%) | 11 (5.7%) |
| 3-Person Households | 6 (3.1%) | 0 (0.0%) |
| 4-Person Households | 9 (4.7%) | 0 (0.0%) |
| 5-Person Households | 4 (2.1%) | 0 (0.0%) |
| 6-Person Households | 13 (6.8%) | 0 (0.0%) |
| 7+ Person Households | 0 (0.0%) | 0 (0.0%) |
| Total | 86 (44.8%) | 106 (55.2%) |
Female Fertility in South Royalton
Fertility by Age in South Royalton
| Age Bracket | Women with Births | Births / 1,000 Women |
| 15 to 19 years | 0 (0.0%) | 0.0 |
| 20 to 34 years | 0 (0.0%) | 0.0 |
| 35 to 50 years | 0 (0.0%) | 0.0 |
| Total | 0 (0.0%) | 0.0 |
Fertility by Age by Marriage Status in South Royalton
| Age Bracket | Married | Unmarried |
| 15 to 19 years | 0 (0.0%) | 0 (0.0%) |
| 20 to 34 years | 0 (0.0%) | 0 (0.0%) |
| 35 to 50 years | 0 (0.0%) | 0 (0.0%) |
| Total | 0 (0.0%) | 0 (0.0%) |
Fertility by Education in South Royalton
| Educational Attainment | Women with Births | Births / 1,000 Women |
| Less than High School | 0 (0.0%) | 0.0 |
| High School Diploma | 0 (0.0%) | 0.0 |
| College or Associate's Degree | 0 (0.0%) | 0.0 |
| Bachelor's Degree | 0 (0.0%) | 0.0 |
| Graduate Degree | 0 (0.0%) | 0.0 |
| Total | 0 (0.0%) | 0.0 |
Fertility by Education by Marriage Status in South Royalton
| Educational Attainment | Married | Unmarried |
| Less than High School | 0 (0.0%) | 0 (0.0%) |
| High School Diploma | 0 (0.0%) | 0 (0.0%) |
| College or Associate's Degree | 0 (0.0%) | 0 (0.0%) |
| Bachelor's Degree | 0 (0.0%) | 0 (0.0%) |
| Graduate Degree | 0 (0.0%) | 0 (0.0%) |
| Total | 0 (0.0%) | 0 (0.0%) |
Employment Characteristics in South Royalton
Employment by Class of Employer in South Royalton
Among the 282 employed individuals in South Royalton, private company employees (121 | 42.9%), self-employed (not incorporated) (98 | 34.7%), and not-for-profit organizations (40 | 14.2%) make up the most common classes of employment.
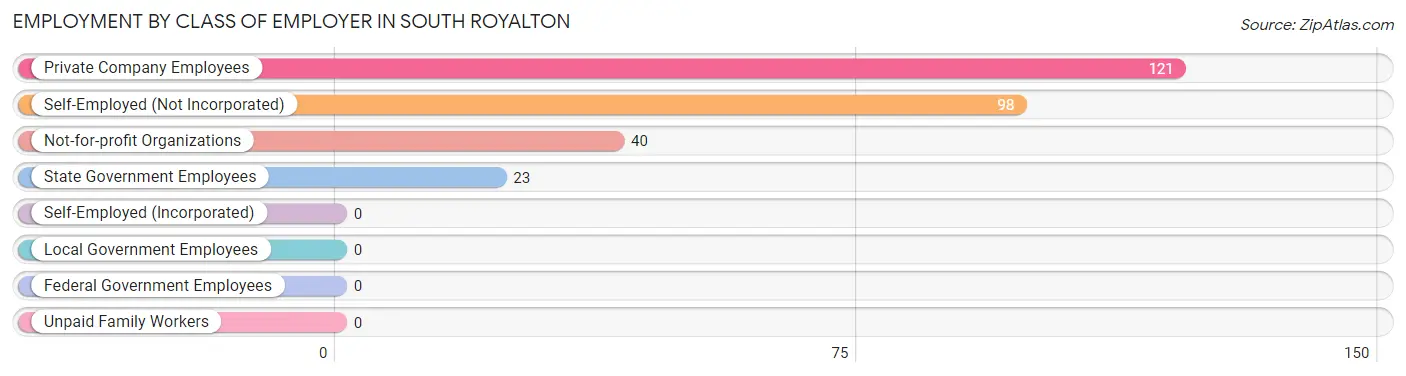
| Employer Class | # Employees | % Employees |
| Private Company Employees | 121 | 42.9% |
| Self-Employed (Incorporated) | 0 | 0.0% |
| Self-Employed (Not Incorporated) | 98 | 34.7% |
| Not-for-profit Organizations | 40 | 14.2% |
| Local Government Employees | 0 | 0.0% |
| State Government Employees | 23 | 8.2% |
| Federal Government Employees | 0 | 0.0% |
| Unpaid Family Workers | 0 | 0.0% |
| Total | 282 | 100.0% |
Employment Status by Age in South Royalton
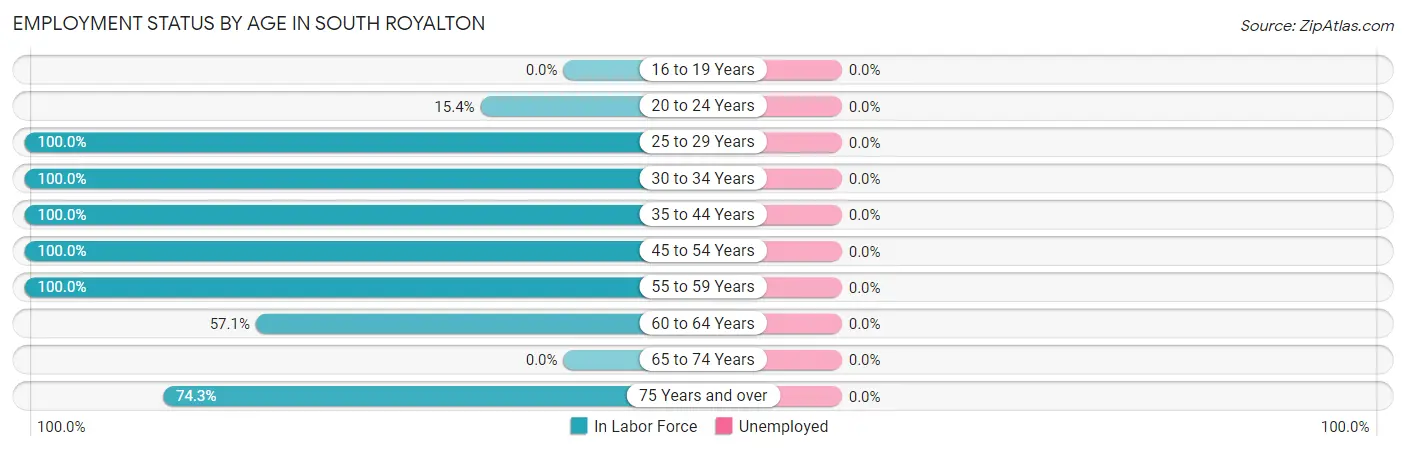
| Age Bracket | In Labor Force | Unemployed |
| 16 to 19 Years | 0 (0.0%) | 0 (0.0%) |
| 20 to 24 Years | 8 (15.4%) | 0 (0.0%) |
| 25 to 29 Years | 11 (100.0%) | 0 (0.0%) |
| 30 to 34 Years | 22 (100.0%) | 0 (0.0%) |
| 35 to 44 Years | 28 (100.0%) | 0 (0.0%) |
| 45 to 54 Years | 138 (100.0%) | 0 (0.0%) |
| 55 to 59 Years | 33 (100.0%) | 0 (0.0%) |
| 60 to 64 Years | 16 (57.1%) | 0 (0.0%) |
| 65 to 74 Years | 0 (0.0%) | 0 (0.0%) |
| 75 Years and over | 26 (74.3%) | 0 (0.0%) |
| Total | 282 (75.6%) | 0 (0.0%) |
Employment Status by Educational Attainment in South Royalton
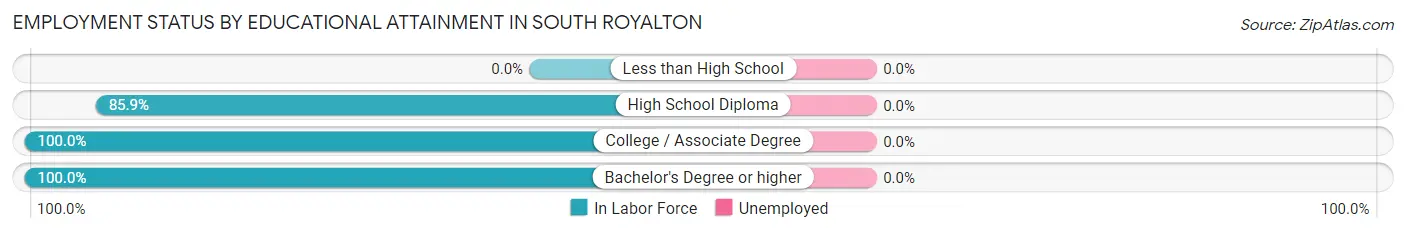
| Educational Attainment | In Labor Force | Unemployed |
| Less than High School | 0 (0.0%) | 0 (0.0%) |
| High School Diploma | 73 (85.9%) | 0 (0.0%) |
| College / Associate Degree | 65 (100.0%) | 0 (0.0%) |
| Bachelor's Degree or higher | 110 (100.0%) | 0 (0.0%) |
| Total | 248 (95.4%) | 0 (0.0%) |
Employment Occupations by Sex in South Royalton
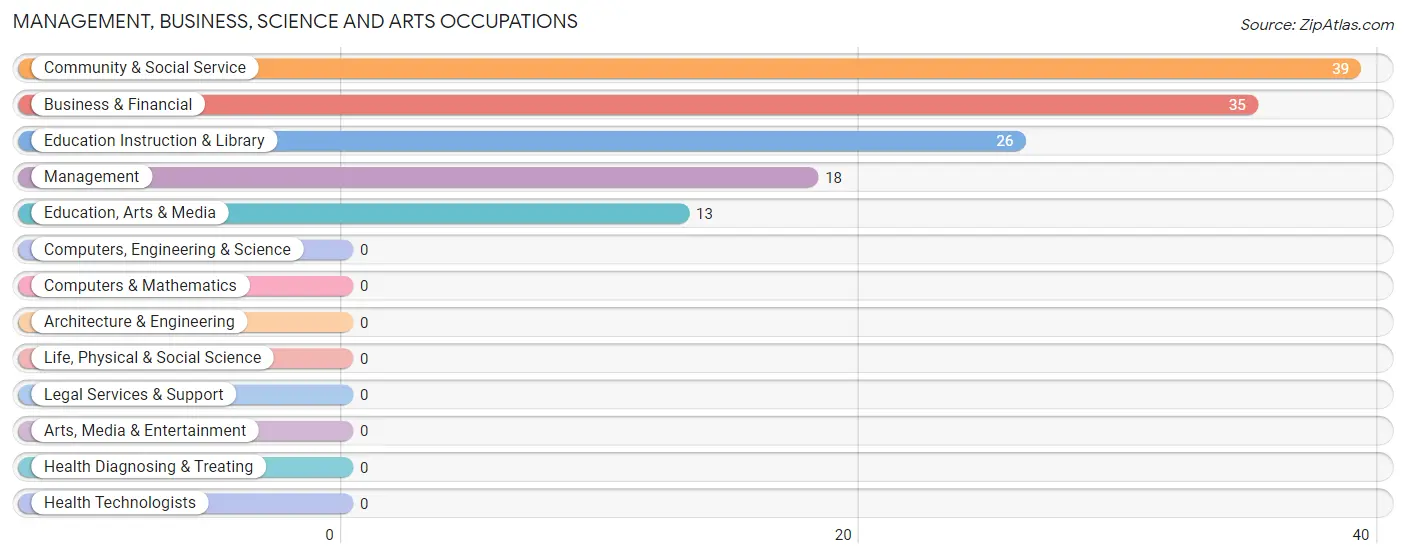
Management, Business, Science and Arts Occupations
The most common Management, Business, Science and Arts occupations in South Royalton are Community & Social Service (39 | 13.8%), Business & Financial (35 | 12.4%), Education Instruction & Library (26 | 9.2%), Management (18 | 6.4%), and Education, Arts & Media (13 | 4.6%).
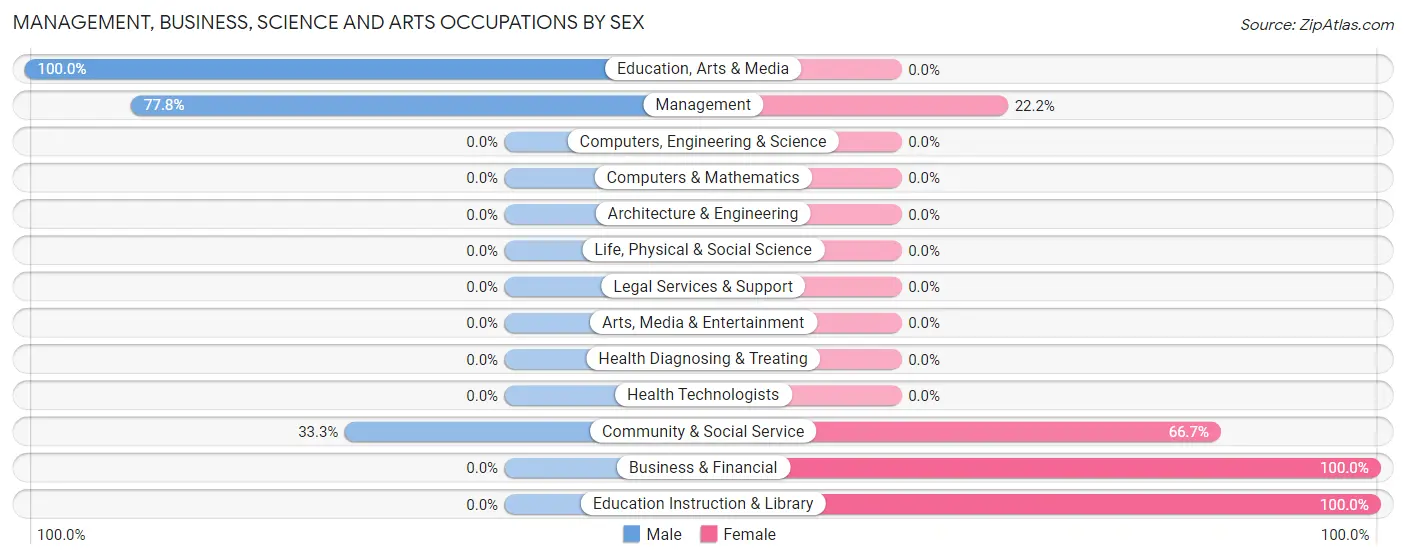
Management, Business, Science and Arts Occupations by Sex
Within the Management, Business, Science and Arts occupations in South Royalton, the most male-oriented occupations are Education, Arts & Media (100.0%), Management (77.8%), and Community & Social Service (33.3%), while the most female-oriented occupations are Business & Financial (100.0%), Education Instruction & Library (100.0%), and Community & Social Service (66.7%).
| Occupation | Male | Female |
| Management | 14 (77.8%) | 4 (22.2%) |
| Business & Financial | 0 (0.0%) | 35 (100.0%) |
| Computers, Engineering & Science | 0 (0.0%) | 0 (0.0%) |
| Computers & Mathematics | 0 (0.0%) | 0 (0.0%) |
| Architecture & Engineering | 0 (0.0%) | 0 (0.0%) |
| Life, Physical & Social Science | 0 (0.0%) | 0 (0.0%) |
| Community & Social Service | 13 (33.3%) | 26 (66.7%) |
| Education, Arts & Media | 13 (100.0%) | 0 (0.0%) |
| Legal Services & Support | 0 (0.0%) | 0 (0.0%) |
| Education Instruction & Library | 0 (0.0%) | 26 (100.0%) |
| Arts, Media & Entertainment | 0 (0.0%) | 0 (0.0%) |
| Health Diagnosing & Treating | 0 (0.0%) | 0 (0.0%) |
| Health Technologists | 0 (0.0%) | 0 (0.0%) |
| Total (Category) | 27 (29.3%) | 65 (70.7%) |
| Total (Overall) | 83 (29.4%) | 199 (70.6%) |
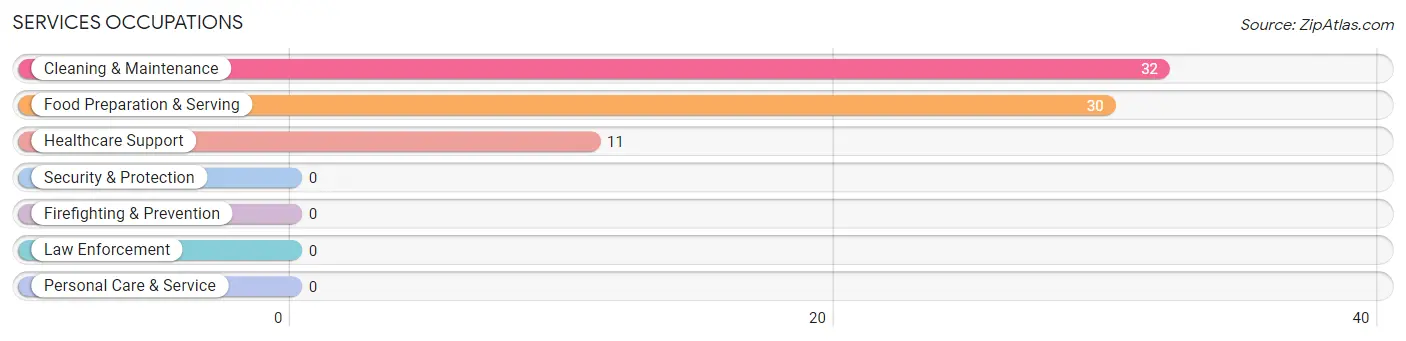
Services Occupations
The most common Services occupations in South Royalton are Cleaning & Maintenance (32 | 11.4%), Food Preparation & Serving (30 | 10.6%), and Healthcare Support (11 | 3.9%).
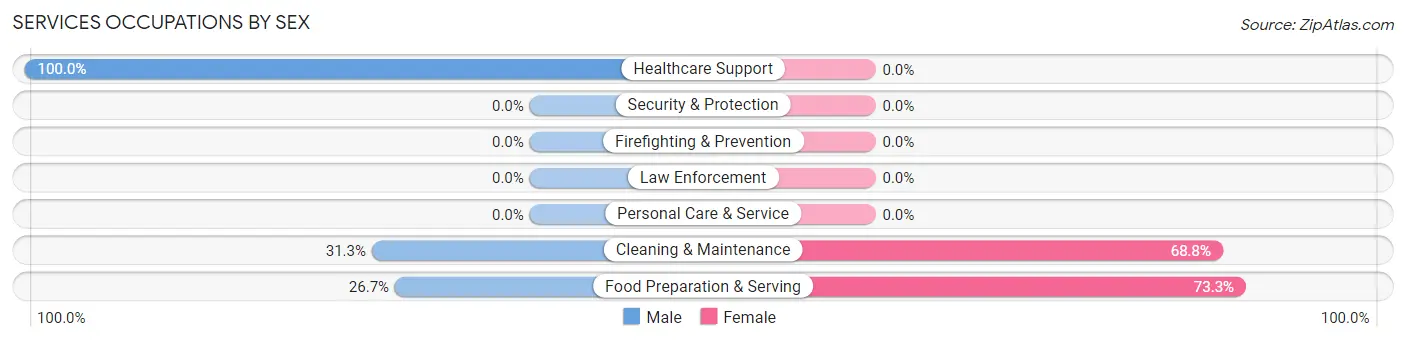
Services Occupations by Sex
Within the Services occupations in South Royalton, the most male-oriented occupations are Healthcare Support (100.0%), Cleaning & Maintenance (31.2%), and Food Preparation & Serving (26.7%), while the most female-oriented occupations are Food Preparation & Serving (73.3%), and Cleaning & Maintenance (68.8%).
| Occupation | Male | Female |
| Healthcare Support | 11 (100.0%) | 0 (0.0%) |
| Security & Protection | 0 (0.0%) | 0 (0.0%) |
| Firefighting & Prevention | 0 (0.0%) | 0 (0.0%) |
| Law Enforcement | 0 (0.0%) | 0 (0.0%) |
| Food Preparation & Serving | 8 (26.7%) | 22 (73.3%) |
| Cleaning & Maintenance | 10 (31.2%) | 22 (68.8%) |
| Personal Care & Service | 0 (0.0%) | 0 (0.0%) |
| Total (Category) | 29 (39.7%) | 44 (60.3%) |
| Total (Overall) | 83 (29.4%) | 199 (70.6%) |
Sales and Office Occupations
The most common Sales and Office occupations in South Royalton are Sales & Related (81 | 28.7%), and Office & Administration (18 | 6.4%).
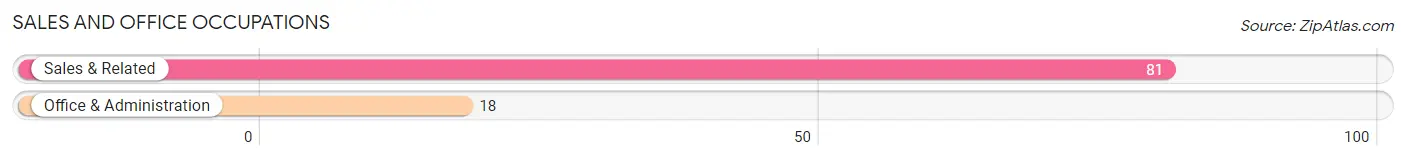
Sales and Office Occupations by Sex
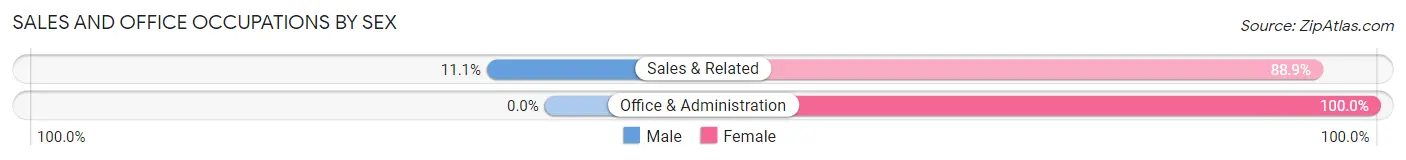
| Occupation | Male | Female |
| Sales & Related | 9 (11.1%) | 72 (88.9%) |
| Office & Administration | 0 (0.0%) | 18 (100.0%) |
| Total (Category) | 9 (9.1%) | 90 (90.9%) |
| Total (Overall) | 83 (29.4%) | 199 (70.6%) |
Natural Resources, Construction and Maintenance Occupations
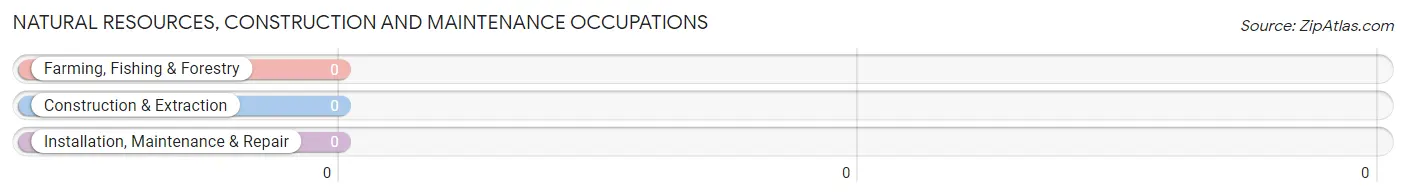
Natural Resources, Construction and Maintenance Occupations by Sex
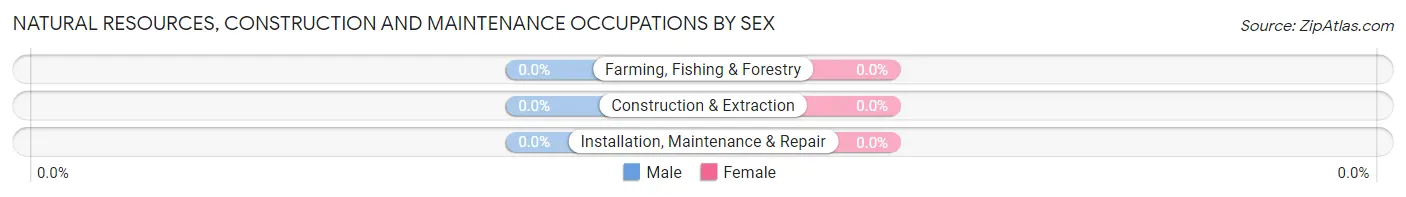
| Occupation | Male | Female |
| Farming, Fishing & Forestry | 0 (0.0%) | 0 (0.0%) |
| Construction & Extraction | 0 (0.0%) | 0 (0.0%) |
| Installation, Maintenance & Repair | 0 (0.0%) | 0 (0.0%) |
| Total (Category) | 0 (0.0%) | 0 (0.0%) |
| Total (Overall) | 83 (29.4%) | 199 (70.6%) |
Production, Transportation and Moving Occupations
The most common Production, Transportation and Moving occupations in South Royalton are , and Transportation (18 | 6.4%).
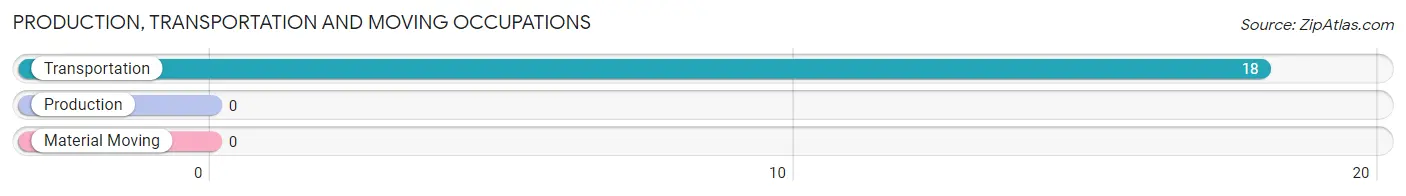
Production, Transportation and Moving Occupations by Sex
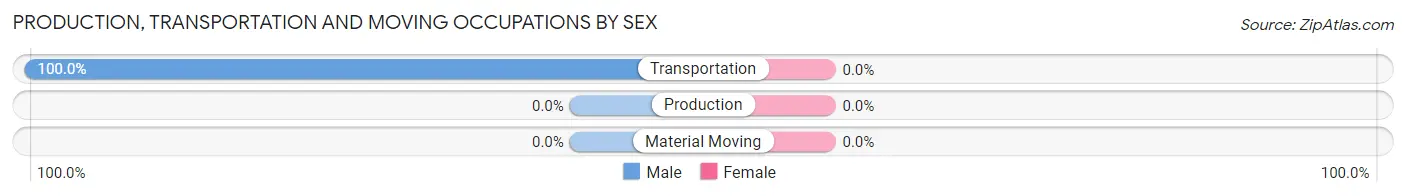
| Occupation | Male | Female |
| Production | 0 (0.0%) | 0 (0.0%) |
| Transportation | 18 (100.0%) | 0 (0.0%) |
| Material Moving | 0 (0.0%) | 0 (0.0%) |
| Total (Category) | 18 (100.0%) | 0 (0.0%) |
| Total (Overall) | 83 (29.4%) | 199 (70.6%) |
Employment Industries by Sex in South Royalton
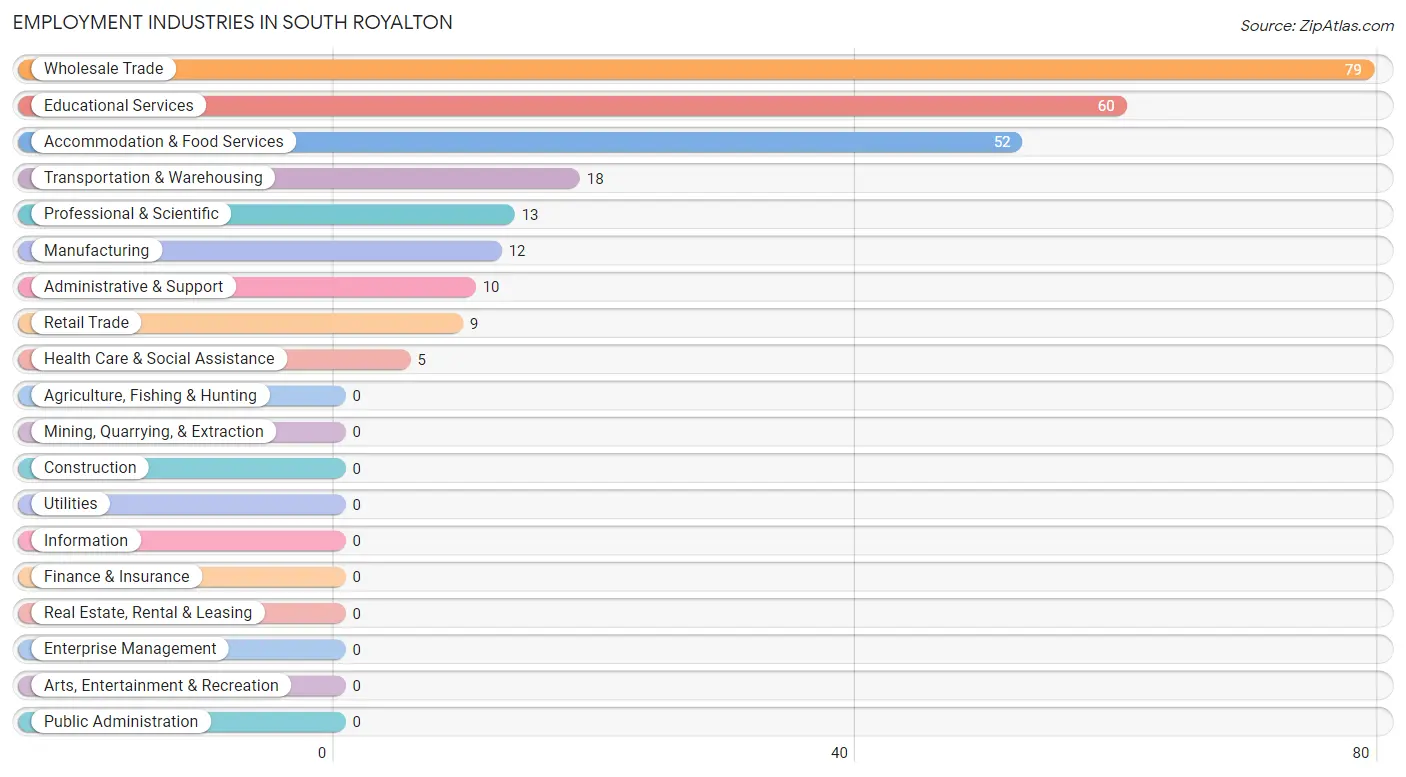
Employment Industries in South Royalton
The major employment industries in South Royalton include Wholesale Trade (79 | 28.0%), Educational Services (60 | 21.3%), Accommodation & Food Services (52 | 18.4%), Transportation & Warehousing (18 | 6.4%), and Professional & Scientific (13 | 4.6%).
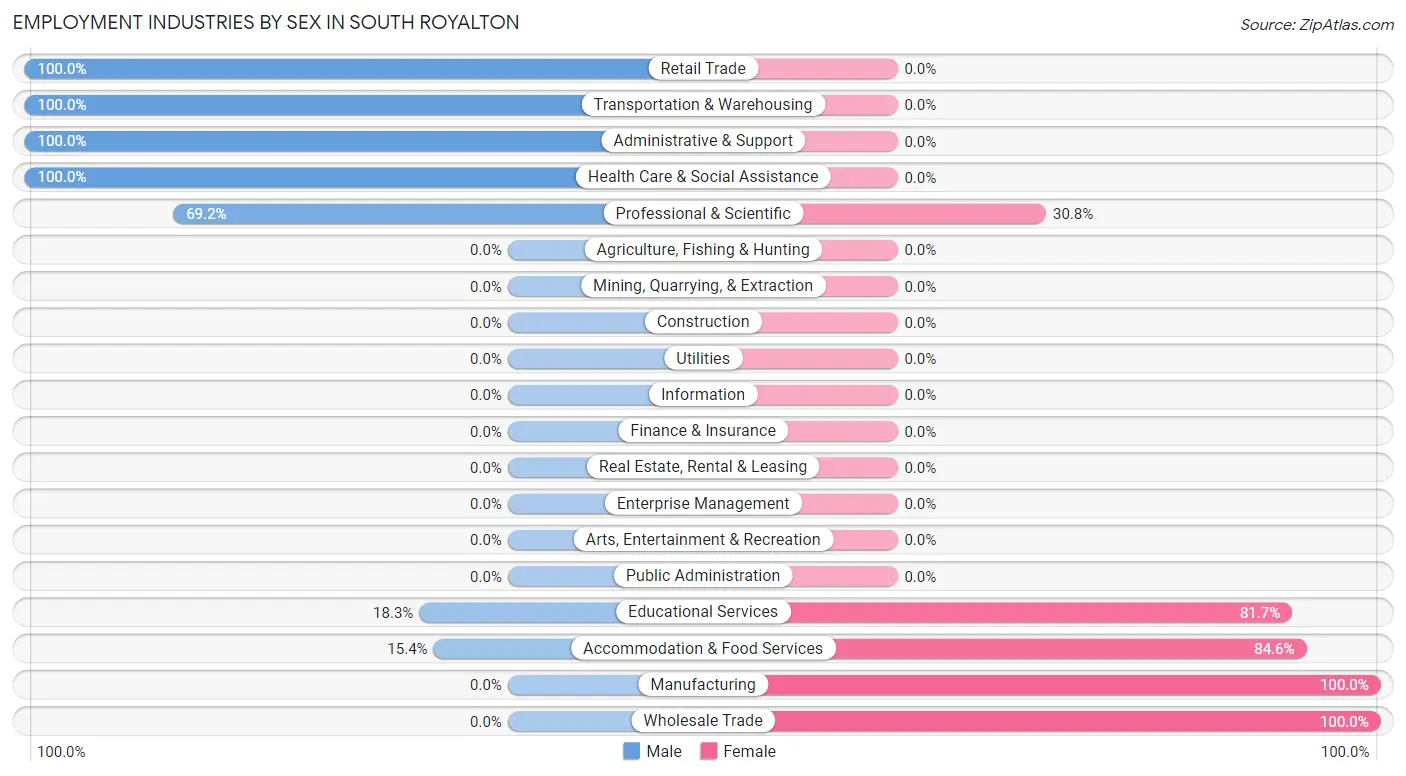
Employment Industries by Sex in South Royalton
The South Royalton industries that see more men than women are Retail Trade (100.0%), Transportation & Warehousing (100.0%), and Administrative & Support (100.0%), whereas the industries that tend to have a higher number of women are Manufacturing (100.0%), Wholesale Trade (100.0%), and Accommodation & Food Services (84.6%).
| Industry | Male | Female |
| Agriculture, Fishing & Hunting | 0 (0.0%) | 0 (0.0%) |
| Mining, Quarrying, & Extraction | 0 (0.0%) | 0 (0.0%) |
| Construction | 0 (0.0%) | 0 (0.0%) |
| Manufacturing | 0 (0.0%) | 12 (100.0%) |
| Wholesale Trade | 0 (0.0%) | 79 (100.0%) |
| Retail Trade | 9 (100.0%) | 0 (0.0%) |
| Transportation & Warehousing | 18 (100.0%) | 0 (0.0%) |
| Utilities | 0 (0.0%) | 0 (0.0%) |
| Information | 0 (0.0%) | 0 (0.0%) |
| Finance & Insurance | 0 (0.0%) | 0 (0.0%) |
| Real Estate, Rental & Leasing | 0 (0.0%) | 0 (0.0%) |
| Professional & Scientific | 9 (69.2%) | 4 (30.8%) |
| Enterprise Management | 0 (0.0%) | 0 (0.0%) |
| Administrative & Support | 10 (100.0%) | 0 (0.0%) |
| Educational Services | 11 (18.3%) | 49 (81.7%) |
| Health Care & Social Assistance | 5 (100.0%) | 0 (0.0%) |
| Arts, Entertainment & Recreation | 0 (0.0%) | 0 (0.0%) |
| Accommodation & Food Services | 8 (15.4%) | 44 (84.6%) |
| Public Administration | 0 (0.0%) | 0 (0.0%) |
| Total | 83 (29.4%) | 199 (70.6%) |
Education in South Royalton
School Enrollment in South Royalton
The most common levels of schooling among the 156 students in South Royalton are graduate / professional (55 | 35.3%), elementary school (53 | 34.0%), and middle school (39 | 25.0%).
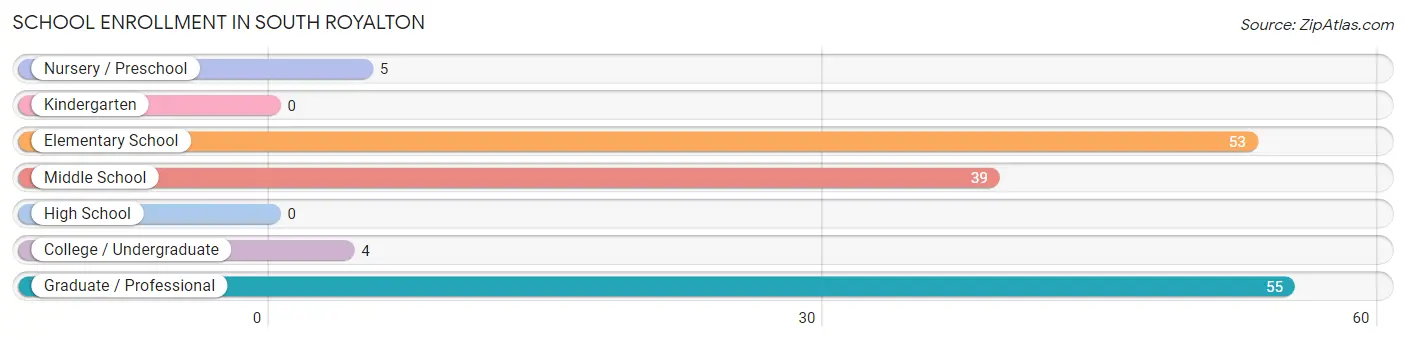
| School Level | # Students | % Students |
| Nursery / Preschool | 5 | 3.2% |
| Kindergarten | 0 | 0.0% |
| Elementary School | 53 | 34.0% |
| Middle School | 39 | 25.0% |
| High School | 0 | 0.0% |
| College / Undergraduate | 4 | 2.6% |
| Graduate / Professional | 55 | 35.3% |
| Total | 156 | 100.0% |
School Enrollment by Age by Funding Source in South Royalton
Out of a total of 156 students who are enrolled in schools in South Royalton, 116 (74.4%) attend a private institution, while the remaining 40 (25.6%) are enrolled in public schools. The age group of 20 to 24 year olds has the highest likelihood of being enrolled in private schools, with 44 (100.0% in the age bracket) enrolled. Conversely, the age group of 3 to 4 year olds has the lowest likelihood of being enrolled in a private school, with 5 (100.0% in the age bracket) attending a public institution.
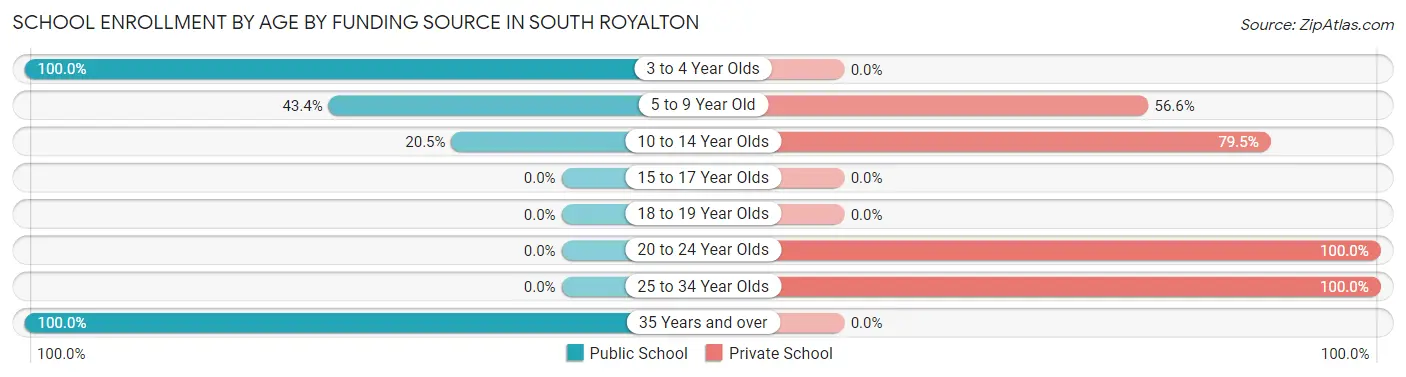
| Age Bracket | Public School | Private School |
| 3 to 4 Year Olds | 5 (100.0%) | 0 (0.0%) |
| 5 to 9 Year Old | 23 (43.4%) | 30 (56.6%) |
| 10 to 14 Year Olds | 8 (20.5%) | 31 (79.5%) |
| 15 to 17 Year Olds | 0 (0.0%) | 0 (0.0%) |
| 18 to 19 Year Olds | 0 (0.0%) | 0 (0.0%) |
| 20 to 24 Year Olds | 0 (0.0%) | 44 (100.0%) |
| 25 to 34 Year Olds | 0 (0.0%) | 11 (100.0%) |
| 35 Years and over | 4 (100.0%) | 0 (0.0%) |
| Total | 40 (25.6%) | 116 (74.4%) |
Educational Attainment by Field of Study in South Royalton
Business (72 | 52.9%), education (26 | 19.1%), computers & mathematics (13 | 9.6%), arts & humanities (11 | 8.1%), and communications (9 | 6.6%) are the most common fields of study among 136 individuals in South Royalton who have obtained a bachelor's degree or higher.
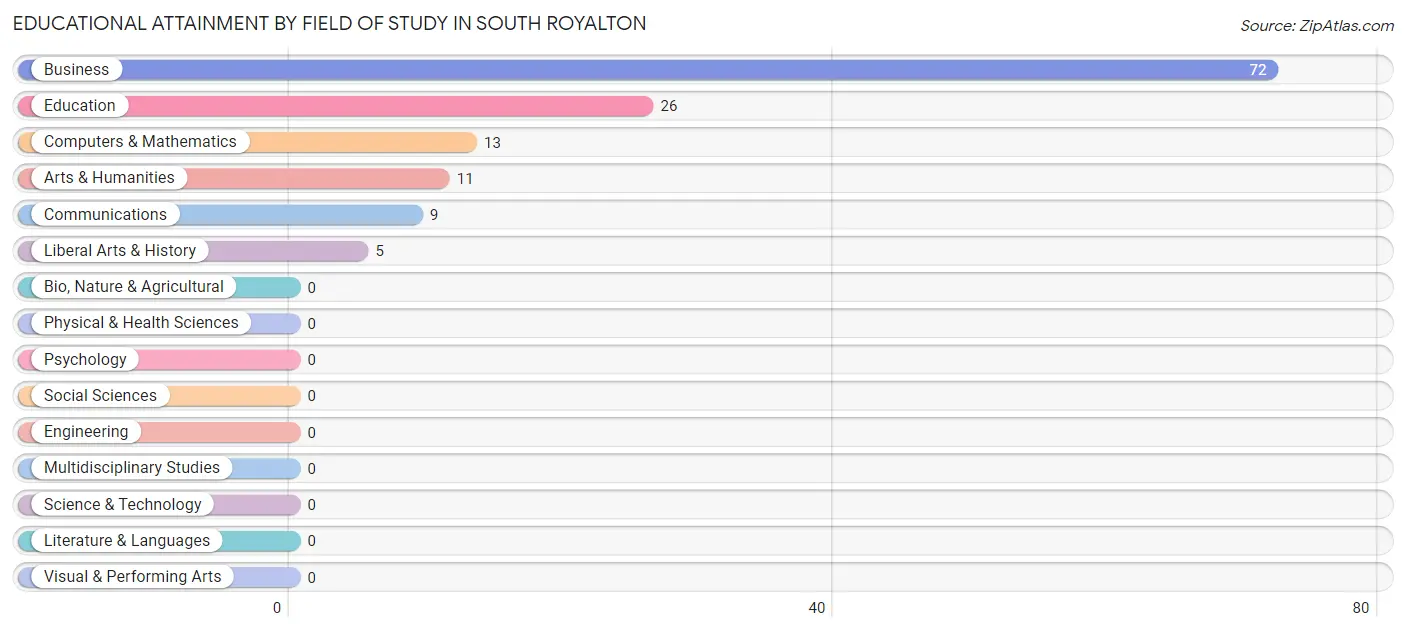
| Field of Study | # Graduates | % Graduates |
| Computers & Mathematics | 13 | 9.6% |
| Bio, Nature & Agricultural | 0 | 0.0% |
| Physical & Health Sciences | 0 | 0.0% |
| Psychology | 0 | 0.0% |
| Social Sciences | 0 | 0.0% |
| Engineering | 0 | 0.0% |
| Multidisciplinary Studies | 0 | 0.0% |
| Science & Technology | 0 | 0.0% |
| Business | 72 | 52.9% |
| Education | 26 | 19.1% |
| Literature & Languages | 0 | 0.0% |
| Liberal Arts & History | 5 | 3.7% |
| Visual & Performing Arts | 0 | 0.0% |
| Communications | 9 | 6.6% |
| Arts & Humanities | 11 | 8.1% |
| Total | 136 | 100.0% |
Transportation & Commute in South Royalton
Vehicle Availability by Sex in South Royalton
The most prevalent vehicle ownership categories in South Royalton are males with 2 vehicles (36, accounting for 43.4%) and females with 2 vehicles (169, making up 18.1%).
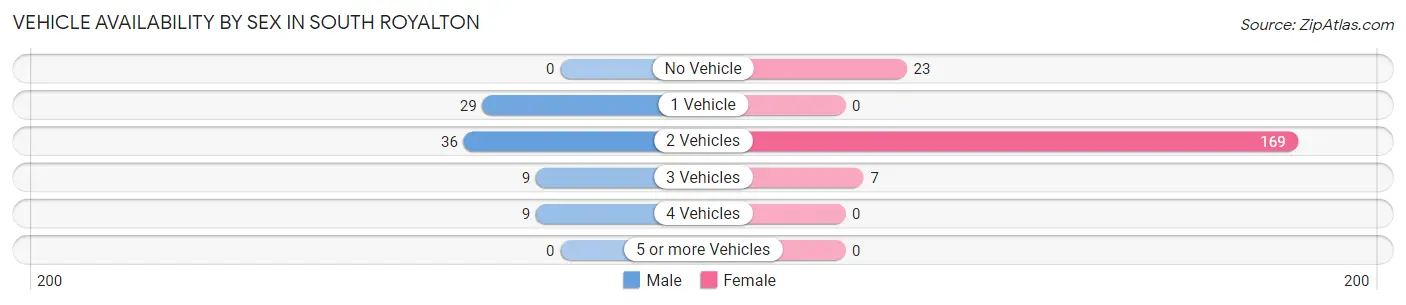
| Vehicles Available | Male | Female |
| No Vehicle | 0 (0.0%) | 23 (11.6%) |
| 1 Vehicle | 29 (34.9%) | 0 (0.0%) |
| 2 Vehicles | 36 (43.4%) | 169 (84.9%) |
| 3 Vehicles | 9 (10.8%) | 7 (3.5%) |
| 4 Vehicles | 9 (10.8%) | 0 (0.0%) |
| 5 or more Vehicles | 0 (0.0%) | 0 (0.0%) |
| Total | 83 (100.0%) | 199 (100.0%) |
Commute Time in South Royalton
The most frequently occuring commute durations in South Royalton are 60 to 89 minutes (72 commuters, 31.0%), less than 5 minutes (58 commuters, 25.0%), and 30 to 34 minutes (29 commuters, 12.5%).
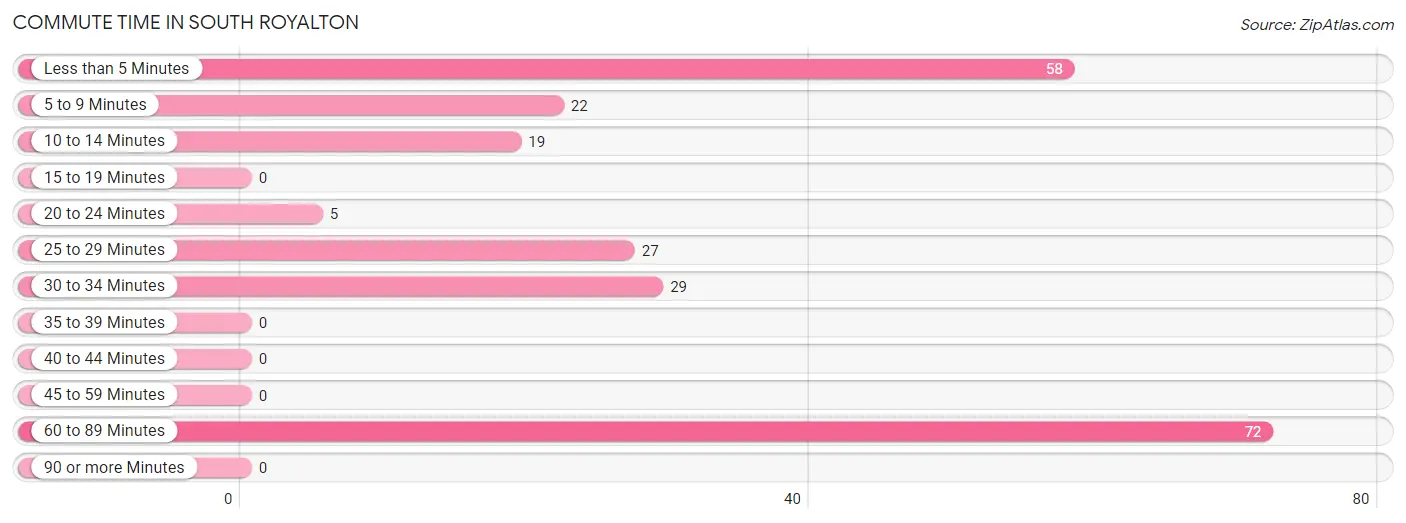
| Commute Time | # Commuters | % Commuters |
| Less than 5 Minutes | 58 | 25.0% |
| 5 to 9 Minutes | 22 | 9.5% |
| 10 to 14 Minutes | 19 | 8.2% |
| 15 to 19 Minutes | 0 | 0.0% |
| 20 to 24 Minutes | 5 | 2.2% |
| 25 to 29 Minutes | 27 | 11.6% |
| 30 to 34 Minutes | 29 | 12.5% |
| 35 to 39 Minutes | 0 | 0.0% |
| 40 to 44 Minutes | 0 | 0.0% |
| 45 to 59 Minutes | 0 | 0.0% |
| 60 to 89 Minutes | 72 | 31.0% |
| 90 or more Minutes | 0 | 0.0% |
Commute Time by Sex in South Royalton
The most common commute times in South Royalton are 25 to 29 minutes (27 commuters, 36.0%) for males and 60 to 89 minutes (72 commuters, 45.9%) for females.
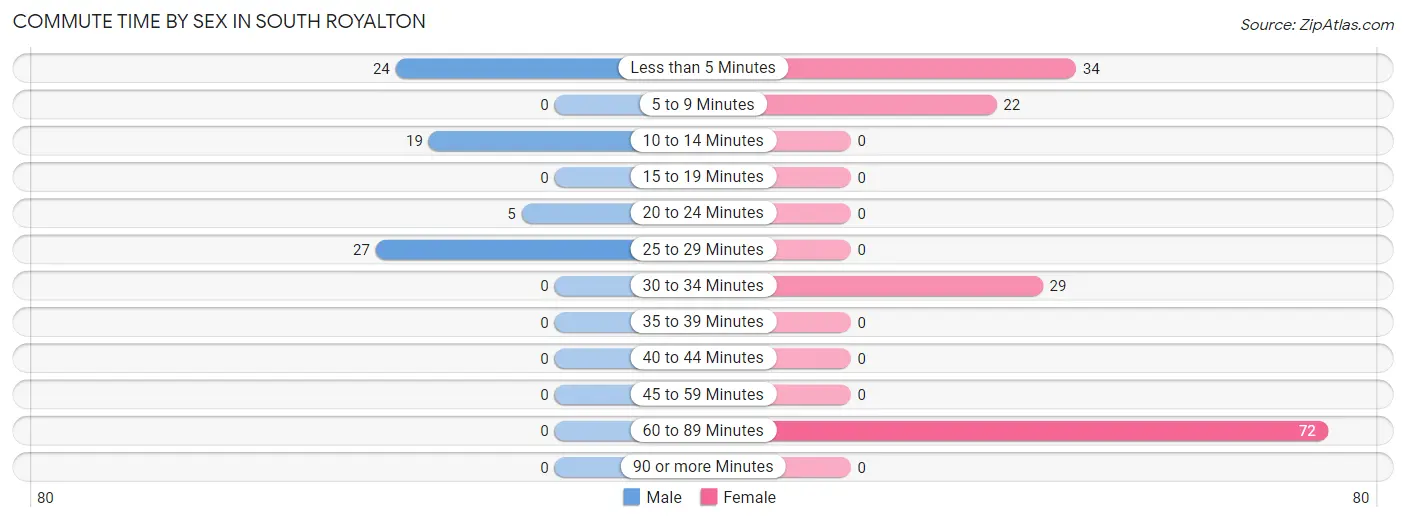
| Commute Time | Male | Female |
| Less than 5 Minutes | 24 (32.0%) | 34 (21.7%) |
| 5 to 9 Minutes | 0 (0.0%) | 22 (14.0%) |
| 10 to 14 Minutes | 19 (25.3%) | 0 (0.0%) |
| 15 to 19 Minutes | 0 (0.0%) | 0 (0.0%) |
| 20 to 24 Minutes | 5 (6.7%) | 0 (0.0%) |
| 25 to 29 Minutes | 27 (36.0%) | 0 (0.0%) |
| 30 to 34 Minutes | 0 (0.0%) | 29 (18.5%) |
| 35 to 39 Minutes | 0 (0.0%) | 0 (0.0%) |
| 40 to 44 Minutes | 0 (0.0%) | 0 (0.0%) |
| 45 to 59 Minutes | 0 (0.0%) | 0 (0.0%) |
| 60 to 89 Minutes | 0 (0.0%) | 72 (45.9%) |
| 90 or more Minutes | 0 (0.0%) | 0 (0.0%) |
Time of Departure to Work by Sex in South Royalton
The most frequent times of departure to work in South Royalton are 6:00 AM to 6:29 AM (27, 36.0%) for males and 8:00 AM to 8:29 AM (94, 59.9%) for females.
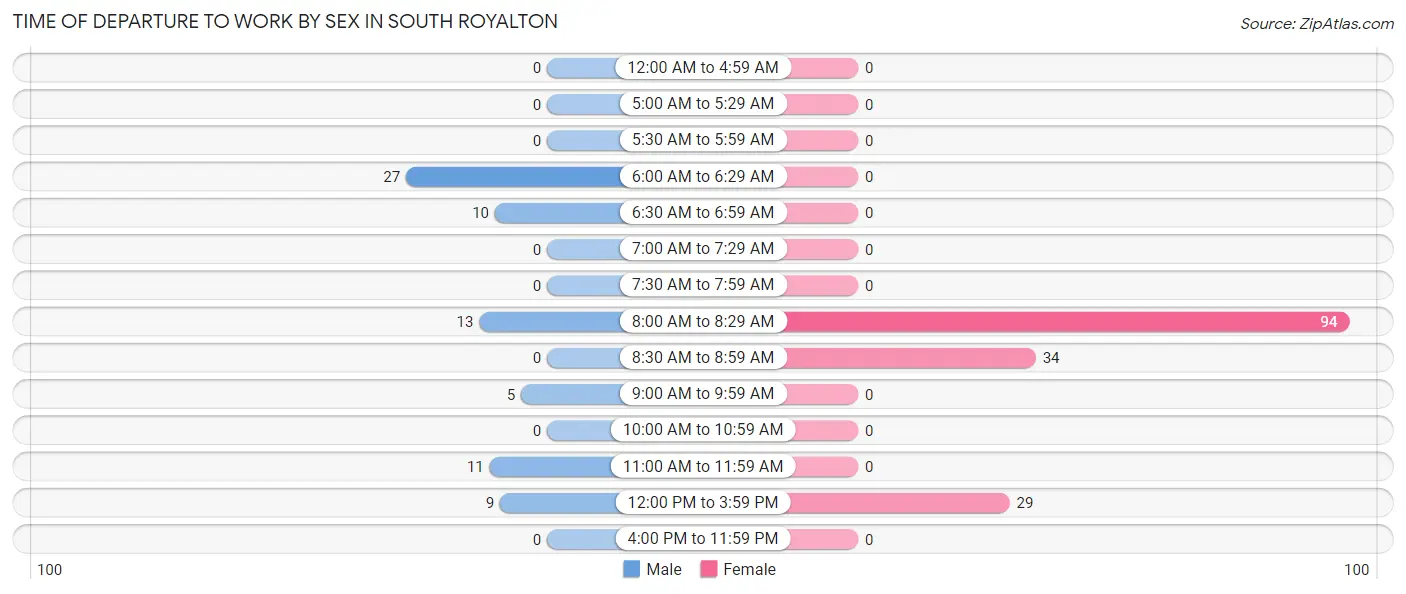
| Time of Departure | Male | Female |
| 12:00 AM to 4:59 AM | 0 (0.0%) | 0 (0.0%) |
| 5:00 AM to 5:29 AM | 0 (0.0%) | 0 (0.0%) |
| 5:30 AM to 5:59 AM | 0 (0.0%) | 0 (0.0%) |
| 6:00 AM to 6:29 AM | 27 (36.0%) | 0 (0.0%) |
| 6:30 AM to 6:59 AM | 10 (13.3%) | 0 (0.0%) |
| 7:00 AM to 7:29 AM | 0 (0.0%) | 0 (0.0%) |
| 7:30 AM to 7:59 AM | 0 (0.0%) | 0 (0.0%) |
| 8:00 AM to 8:29 AM | 13 (17.3%) | 94 (59.9%) |
| 8:30 AM to 8:59 AM | 0 (0.0%) | 34 (21.7%) |
| 9:00 AM to 9:59 AM | 5 (6.7%) | 0 (0.0%) |
| 10:00 AM to 10:59 AM | 0 (0.0%) | 0 (0.0%) |
| 11:00 AM to 11:59 AM | 11 (14.7%) | 0 (0.0%) |
| 12:00 PM to 3:59 PM | 9 (12.0%) | 29 (18.5%) |
| 4:00 PM to 11:59 PM | 0 (0.0%) | 0 (0.0%) |
| Total | 75 (100.0%) | 157 (100.0%) |
Housing Occupancy in South Royalton
Occupancy by Ownership in South Royalton
Of the total 192 dwellings in South Royalton, owner-occupied units account for 100 (52.1%), while renter-occupied units make up 92 (47.9%).
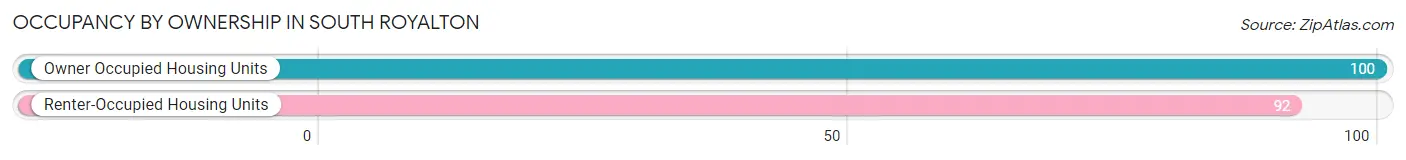
| Occupancy | # Housing Units | % Housing Units |
| Owner Occupied Housing Units | 100 | 52.1% |
| Renter-Occupied Housing Units | 92 | 47.9% |
| Total Occupied Housing Units | 192 | 100.0% |
Occupancy by Household Size in South Royalton
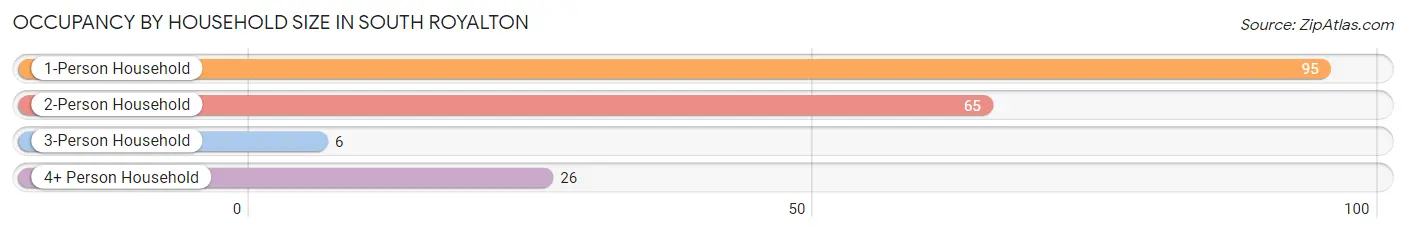
| Household Size | # Housing Units | % Housing Units |
| 1-Person Household | 95 | 49.5% |
| 2-Person Household | 65 | 33.9% |
| 3-Person Household | 6 | 3.1% |
| 4+ Person Household | 26 | 13.5% |
| Total Housing Units | 192 | 100.0% |
Occupancy by Ownership by Household Size in South Royalton
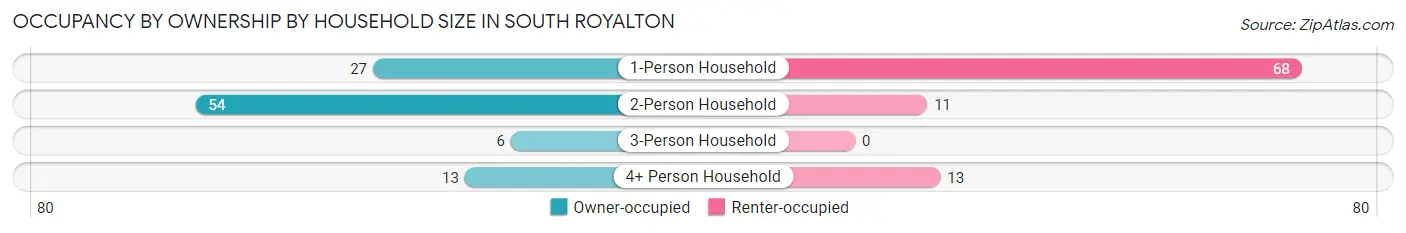
| Household Size | Owner-occupied | Renter-occupied |
| 1-Person Household | 27 (28.4%) | 68 (71.6%) |
| 2-Person Household | 54 (83.1%) | 11 (16.9%) |
| 3-Person Household | 6 (100.0%) | 0 (0.0%) |
| 4+ Person Household | 13 (50.0%) | 13 (50.0%) |
| Total Housing Units | 100 (52.1%) | 92 (47.9%) |
Occupancy by Educational Attainment in South Royalton
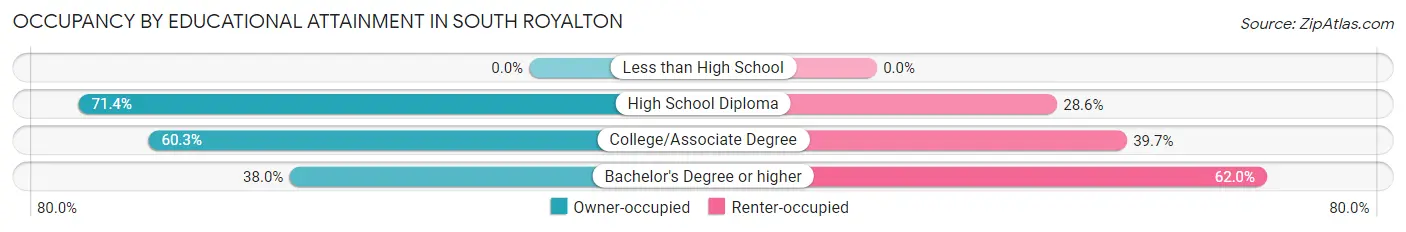
| Household Size | Owner-occupied | Renter-occupied |
| Less than High School | 0 (0.0%) | 0 (0.0%) |
| High School Diploma | 30 (71.4%) | 12 (28.6%) |
| College/Associate Degree | 35 (60.3%) | 23 (39.7%) |
| Bachelor's Degree or higher | 35 (38.0%) | 57 (62.0%) |
Occupancy by Age of Householder in South Royalton
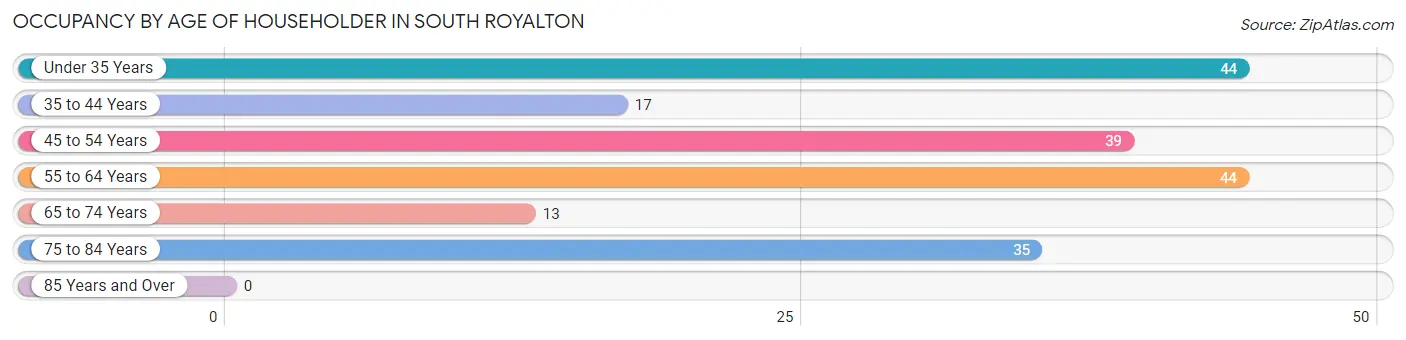
| Age Bracket | # Households | % Households |
| Under 35 Years | 44 | 22.9% |
| 35 to 44 Years | 17 | 8.8% |
| 45 to 54 Years | 39 | 20.3% |
| 55 to 64 Years | 44 | 22.9% |
| 65 to 74 Years | 13 | 6.8% |
| 75 to 84 Years | 35 | 18.2% |
| 85 Years and Over | 0 | 0.0% |
| Total | 192 | 100.0% |
Housing Finances in South Royalton
Median Income by Occupancy in South Royalton
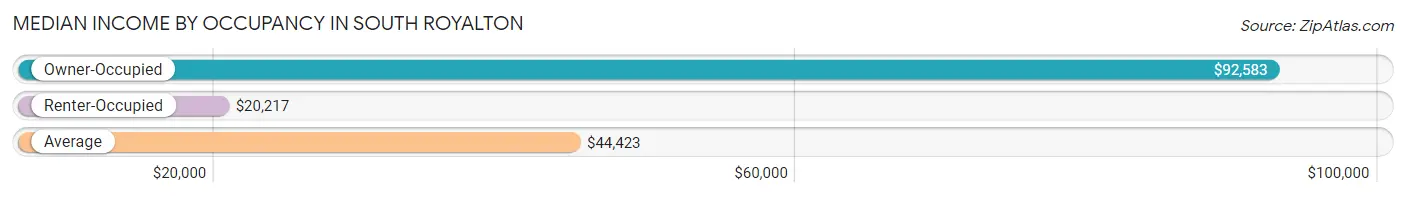
| Occupancy Type | # Households | Median Income |
| Owner-Occupied | 100 (52.1%) | $92,583 |
| Renter-Occupied | 92 (47.9%) | $20,217 |
| Average | 192 (100.0%) | $44,423 |
Occupancy by Householder Income Bracket in South Royalton
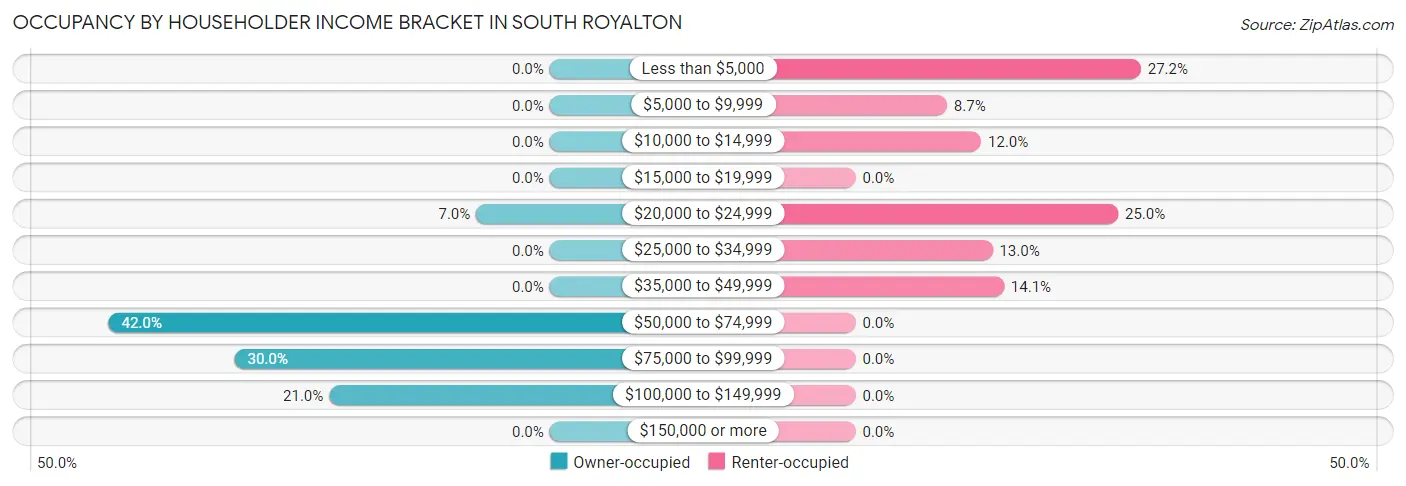
| Income Bracket | Owner-occupied | Renter-occupied |
| Less than $5,000 | 0 (0.0%) | 25 (27.2%) |
| $5,000 to $9,999 | 0 (0.0%) | 8 (8.7%) |
| $10,000 to $14,999 | 0 (0.0%) | 11 (12.0%) |
| $15,000 to $19,999 | 0 (0.0%) | 0 (0.0%) |
| $20,000 to $24,999 | 7 (7.0%) | 23 (25.0%) |
| $25,000 to $34,999 | 0 (0.0%) | 12 (13.0%) |
| $35,000 to $49,999 | 0 (0.0%) | 13 (14.1%) |
| $50,000 to $74,999 | 42 (42.0%) | 0 (0.0%) |
| $75,000 to $99,999 | 30 (30.0%) | 0 (0.0%) |
| $100,000 to $149,999 | 21 (21.0%) | 0 (0.0%) |
| $150,000 or more | 0 (0.0%) | 0 (0.0%) |
| Total | 100 (100.0%) | 92 (100.0%) |
Monthly Housing Cost Tiers in South Royalton
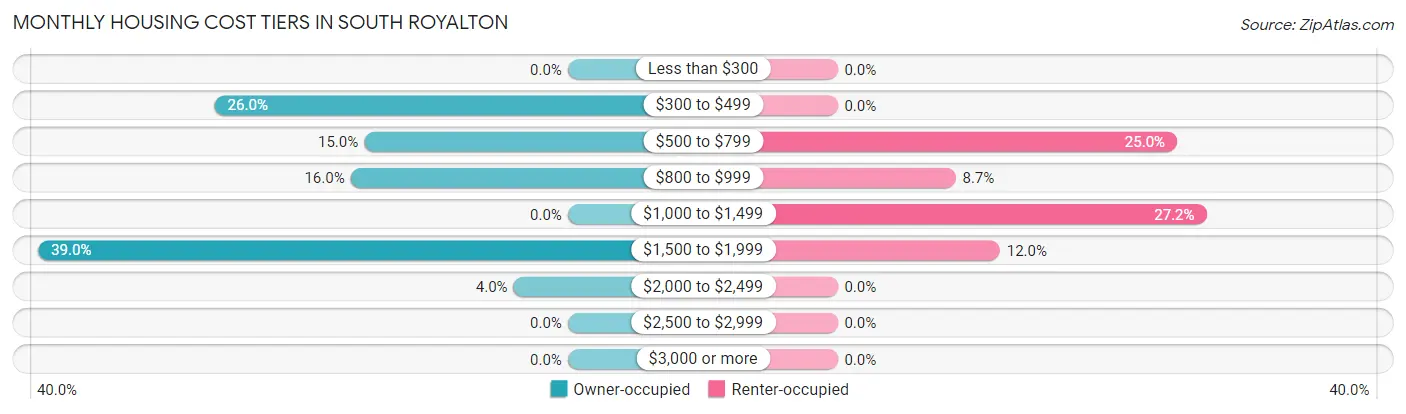
| Monthly Cost | Owner-occupied | Renter-occupied |
| Less than $300 | 0 (0.0%) | 0 (0.0%) |
| $300 to $499 | 26 (26.0%) | 0 (0.0%) |
| $500 to $799 | 15 (15.0%) | 23 (25.0%) |
| $800 to $999 | 16 (16.0%) | 8 (8.7%) |
| $1,000 to $1,499 | 0 (0.0%) | 25 (27.2%) |
| $1,500 to $1,999 | 39 (39.0%) | 11 (12.0%) |
| $2,000 to $2,499 | 4 (4.0%) | 0 (0.0%) |
| $2,500 to $2,999 | 0 (0.0%) | 0 (0.0%) |
| $3,000 or more | 0 (0.0%) | 0 (0.0%) |
| Total | 100 (100.0%) | 92 (100.0%) |
Physical Housing Characteristics in South Royalton
Housing Structures in South Royalton
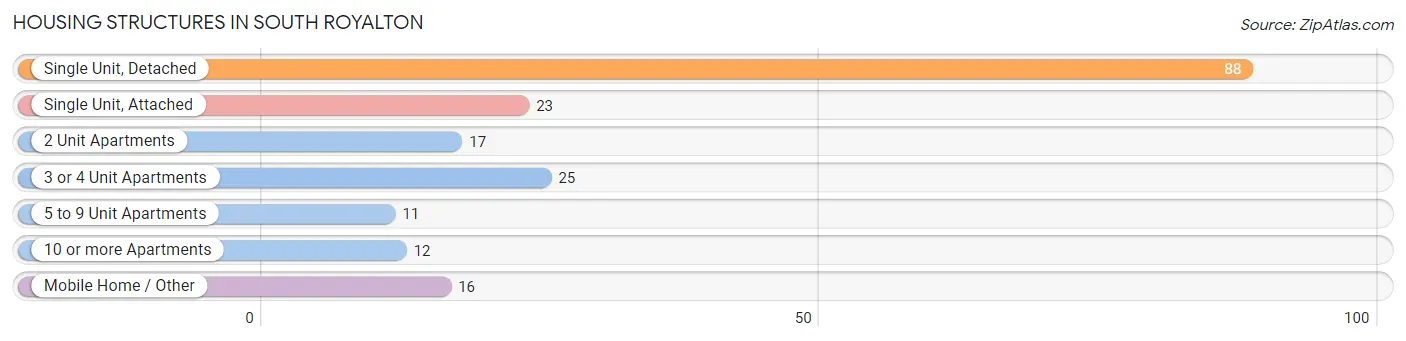
| Structure Type | # Housing Units | % Housing Units |
| Single Unit, Detached | 88 | 45.8% |
| Single Unit, Attached | 23 | 12.0% |
| 2 Unit Apartments | 17 | 8.8% |
| 3 or 4 Unit Apartments | 25 | 13.0% |
| 5 to 9 Unit Apartments | 11 | 5.7% |
| 10 or more Apartments | 12 | 6.2% |
| Mobile Home / Other | 16 | 8.3% |
| Total | 192 | 100.0% |
Housing Structures by Occupancy in South Royalton
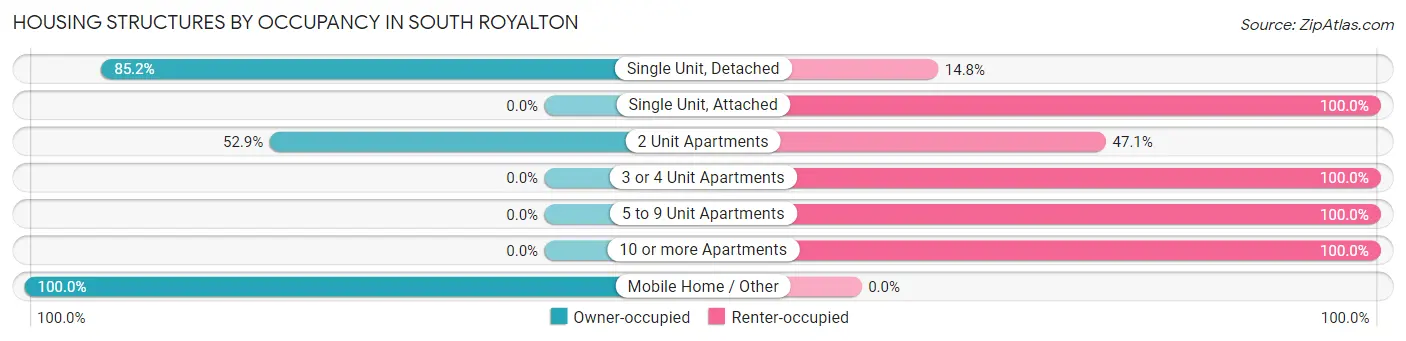
| Structure Type | Owner-occupied | Renter-occupied |
| Single Unit, Detached | 75 (85.2%) | 13 (14.8%) |
| Single Unit, Attached | 0 (0.0%) | 23 (100.0%) |
| 2 Unit Apartments | 9 (52.9%) | 8 (47.1%) |
| 3 or 4 Unit Apartments | 0 (0.0%) | 25 (100.0%) |
| 5 to 9 Unit Apartments | 0 (0.0%) | 11 (100.0%) |
| 10 or more Apartments | 0 (0.0%) | 12 (100.0%) |
| Mobile Home / Other | 16 (100.0%) | 0 (0.0%) |
| Total | 100 (52.1%) | 92 (47.9%) |
Housing Structures by Number of Rooms in South Royalton
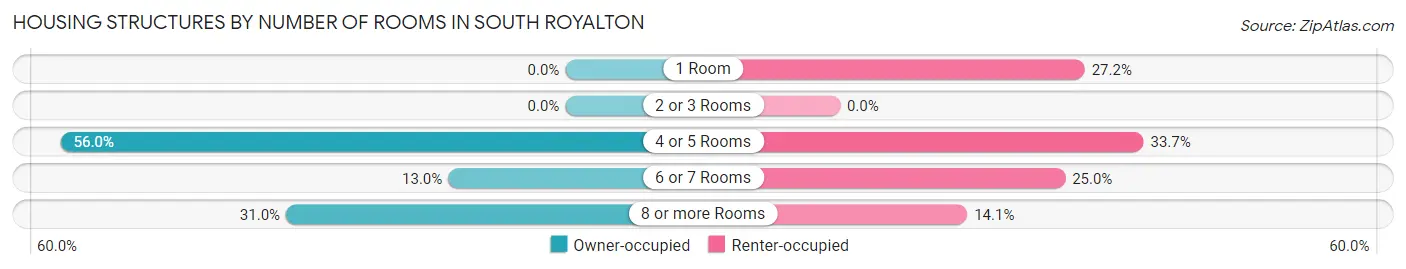
| Number of Rooms | Owner-occupied | Renter-occupied |
| 1 Room | 0 (0.0%) | 25 (27.2%) |
| 2 or 3 Rooms | 0 (0.0%) | 0 (0.0%) |
| 4 or 5 Rooms | 56 (56.0%) | 31 (33.7%) |
| 6 or 7 Rooms | 13 (13.0%) | 23 (25.0%) |
| 8 or more Rooms | 31 (31.0%) | 13 (14.1%) |
| Total | 100 (100.0%) | 92 (100.0%) |
Housing Structure by Heating Type in South Royalton
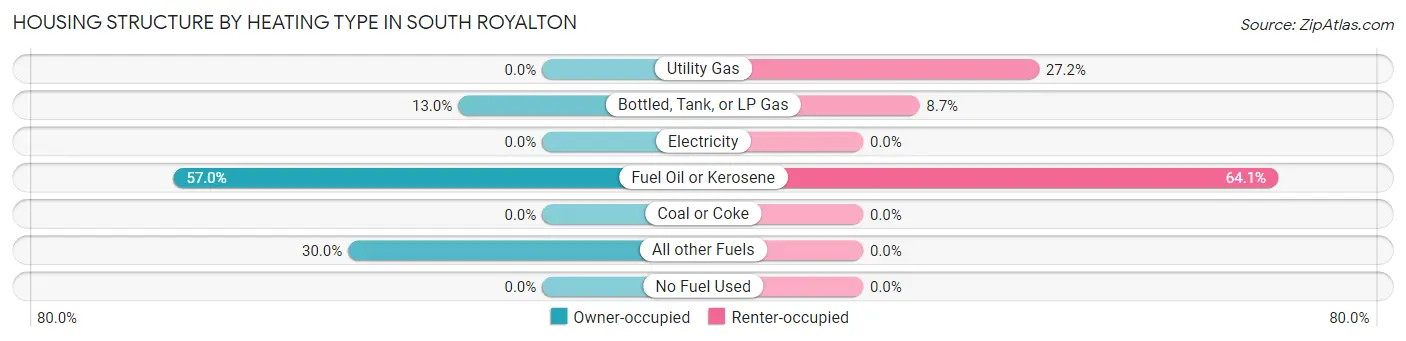
| Heating Type | Owner-occupied | Renter-occupied |
| Utility Gas | 0 (0.0%) | 25 (27.2%) |
| Bottled, Tank, or LP Gas | 13 (13.0%) | 8 (8.7%) |
| Electricity | 0 (0.0%) | 0 (0.0%) |
| Fuel Oil or Kerosene | 57 (57.0%) | 59 (64.1%) |
| Coal or Coke | 0 (0.0%) | 0 (0.0%) |
| All other Fuels | 30 (30.0%) | 0 (0.0%) |
| No Fuel Used | 0 (0.0%) | 0 (0.0%) |
| Total | 100 (100.0%) | 92 (100.0%) |
Household Vehicle Usage in South Royalton
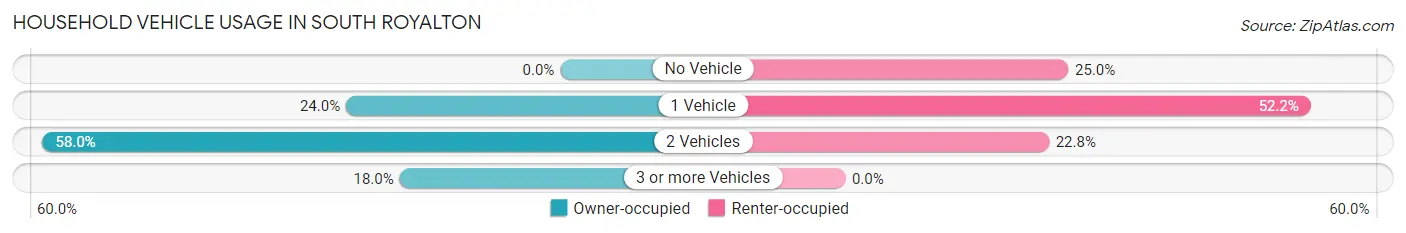
| Vehicles per Household | Owner-occupied | Renter-occupied |
| No Vehicle | 0 (0.0%) | 23 (25.0%) |
| 1 Vehicle | 24 (24.0%) | 48 (52.2%) |
| 2 Vehicles | 58 (58.0%) | 21 (22.8%) |
| 3 or more Vehicles | 18 (18.0%) | 0 (0.0%) |
| Total | 100 (100.0%) | 92 (100.0%) |
Real Estate & Mortgages in South Royalton
Real Estate and Mortgage Overview in South Royalton
| Characteristic | Without Mortgage | With Mortgage |
| Housing Units | 50 | 50 |
| Median Property Value | $140,400 | $158,300 |
| Median Household Income | $92,596 | $0 |
| Monthly Housing Costs | $496 | $0 |
| Real Estate Taxes | $4,390 | $0 |
Property Value by Mortgage Status in South Royalton
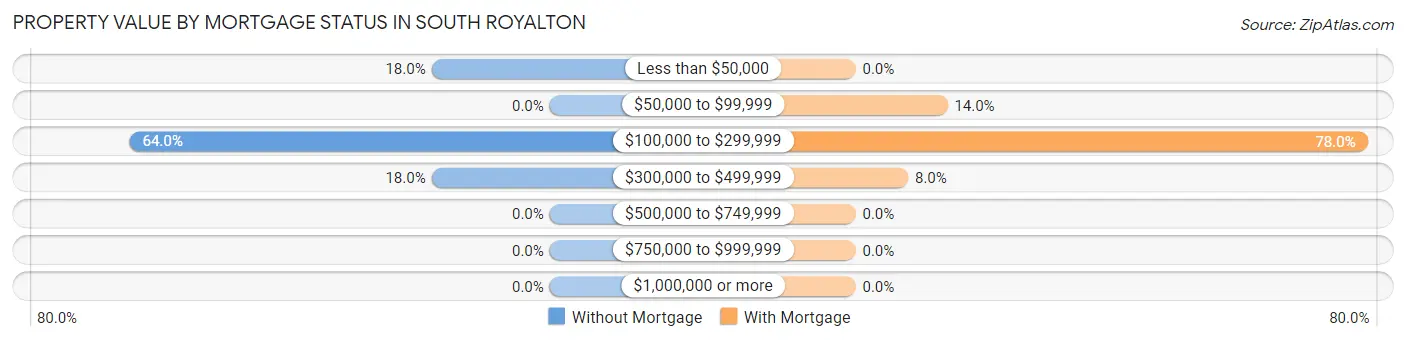
| Property Value | Without Mortgage | With Mortgage |
| Less than $50,000 | 9 (18.0%) | 0 (0.0%) |
| $50,000 to $99,999 | 0 (0.0%) | 7 (14.0%) |
| $100,000 to $299,999 | 32 (64.0%) | 39 (78.0%) |
| $300,000 to $499,999 | 9 (18.0%) | 4 (8.0%) |
| $500,000 to $749,999 | 0 (0.0%) | 0 (0.0%) |
| $750,000 to $999,999 | 0 (0.0%) | 0 (0.0%) |
| $1,000,000 or more | 0 (0.0%) | 0 (0.0%) |
| Total | 50 (100.0%) | 50 (100.0%) |
Household Income by Mortgage Status in South Royalton
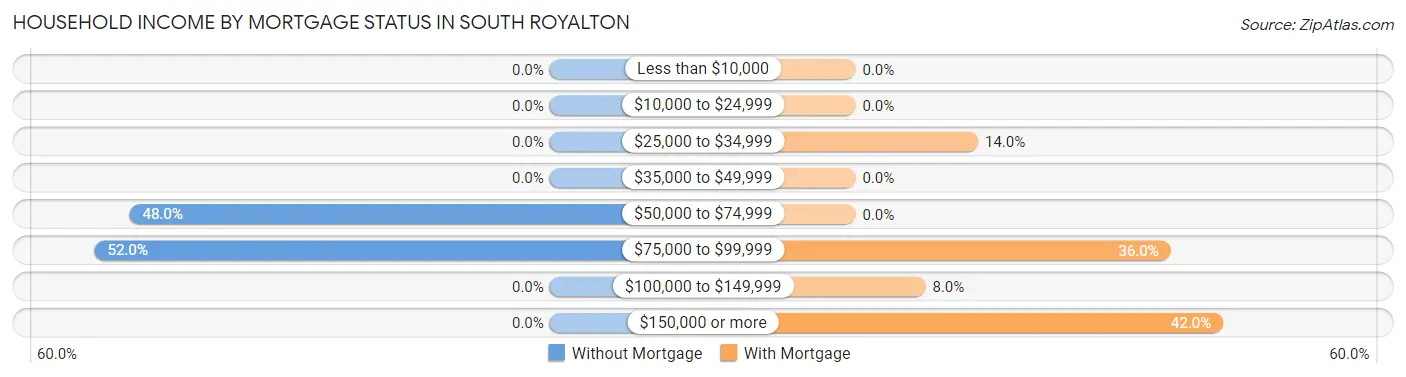
| Household Income | Without Mortgage | With Mortgage |
| Less than $10,000 | 0 (0.0%) | 0 (0.0%) |
| $10,000 to $24,999 | 0 (0.0%) | 0 (0.0%) |
| $25,000 to $34,999 | 0 (0.0%) | 7 (14.0%) |
| $35,000 to $49,999 | 0 (0.0%) | 0 (0.0%) |
| $50,000 to $74,999 | 24 (48.0%) | 0 (0.0%) |
| $75,000 to $99,999 | 26 (52.0%) | 18 (36.0%) |
| $100,000 to $149,999 | 0 (0.0%) | 4 (8.0%) |
| $150,000 or more | 0 (0.0%) | 21 (42.0%) |
| Total | 50 (100.0%) | 50 (100.0%) |
Property Value to Household Income Ratio in South Royalton
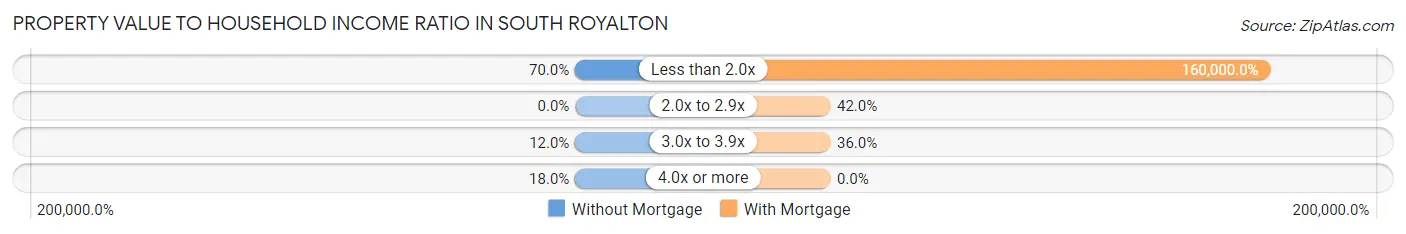
| Value-to-Income Ratio | Without Mortgage | With Mortgage |
| Less than 2.0x | 35 (70.0%) | 80,000 (160,000.0%) |
| 2.0x to 2.9x | 0 (0.0%) | 21 (42.0%) |
| 3.0x to 3.9x | 6 (12.0%) | 18 (36.0%) |
| 4.0x or more | 9 (18.0%) | 0 (0.0%) |
| Total | 50 (100.0%) | 50 (100.0%) |
Real Estate Taxes by Mortgage Status in South Royalton
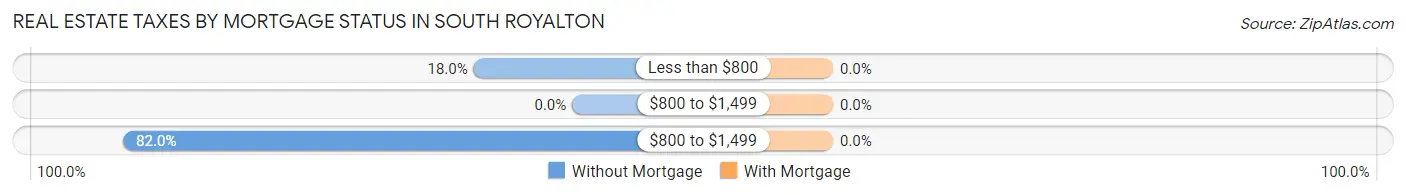
| Property Taxes | Without Mortgage | With Mortgage |
| Less than $800 | 9 (18.0%) | 0 (0.0%) |
| $800 to $1,499 | 0 (0.0%) | 0 (0.0%) |
| $800 to $1,499 | 41 (82.0%) | 0 (0.0%) |
| Total | 50 (100.0%) | 50 (100.0%) |
Health & Disability in South Royalton
Health Insurance Coverage by Age in South Royalton
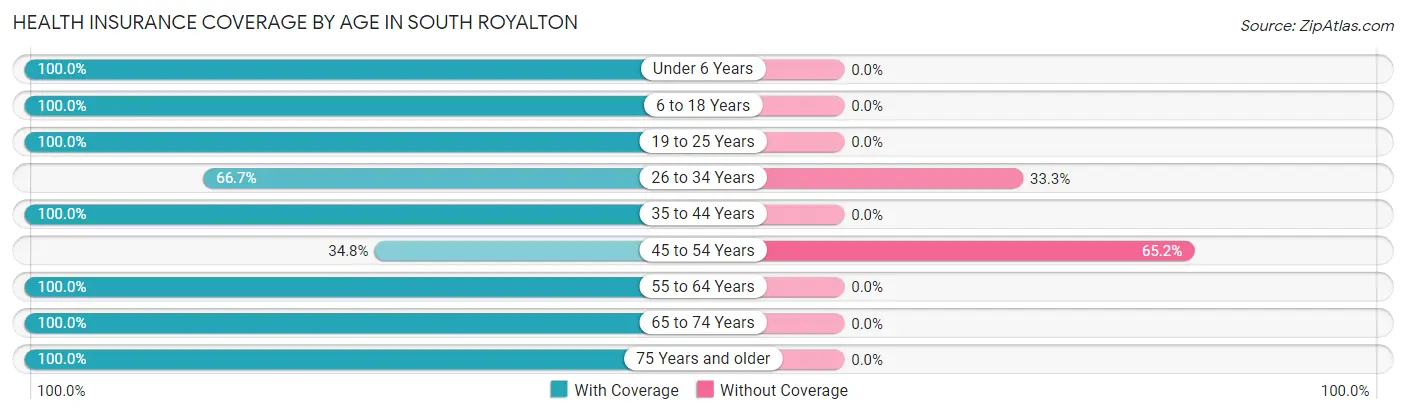
| Age Bracket | With Coverage | Without Coverage |
| Under 6 Years | 10 (100.0%) | 0 (0.0%) |
| 6 to 18 Years | 92 (100.0%) | 0 (0.0%) |
| 19 to 25 Years | 52 (100.0%) | 0 (0.0%) |
| 26 to 34 Years | 22 (66.7%) | 11 (33.3%) |
| 35 to 44 Years | 28 (100.0%) | 0 (0.0%) |
| 45 to 54 Years | 48 (34.8%) | 90 (65.2%) |
| 55 to 64 Years | 61 (100.0%) | 0 (0.0%) |
| 65 to 74 Years | 26 (100.0%) | 0 (0.0%) |
| 75 Years and older | 35 (100.0%) | 0 (0.0%) |
| Total | 374 (78.7%) | 101 (21.3%) |
Health Insurance Coverage by Citizenship Status in South Royalton
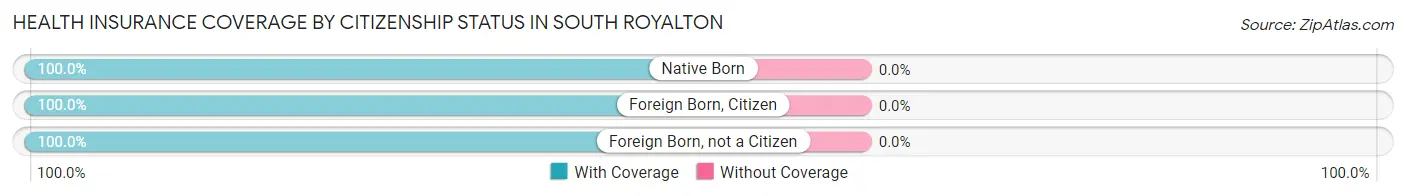
| Citizenship Status | With Coverage | Without Coverage |
| Native Born | 10 (100.0%) | 0 (0.0%) |
| Foreign Born, Citizen | 92 (100.0%) | 0 (0.0%) |
| Foreign Born, not a Citizen | 52 (100.0%) | 0 (0.0%) |
Health Insurance Coverage by Household Income in South Royalton
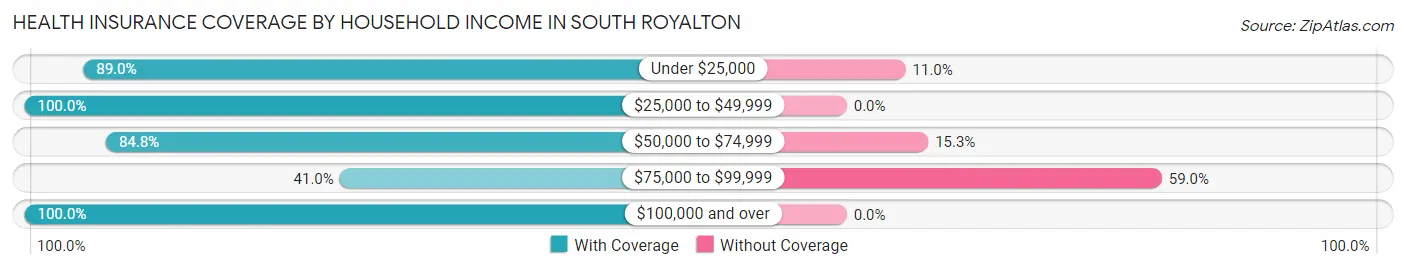
| Household Income | With Coverage | Without Coverage |
| Under $25,000 | 89 (89.0%) | 11 (11.0%) |
| $25,000 to $49,999 | 97 (100.0%) | 0 (0.0%) |
| $50,000 to $74,999 | 100 (84.8%) | 18 (15.2%) |
| $75,000 to $99,999 | 50 (41.0%) | 72 (59.0%) |
| $100,000 and over | 38 (100.0%) | 0 (0.0%) |
Public vs Private Health Insurance Coverage by Age in South Royalton
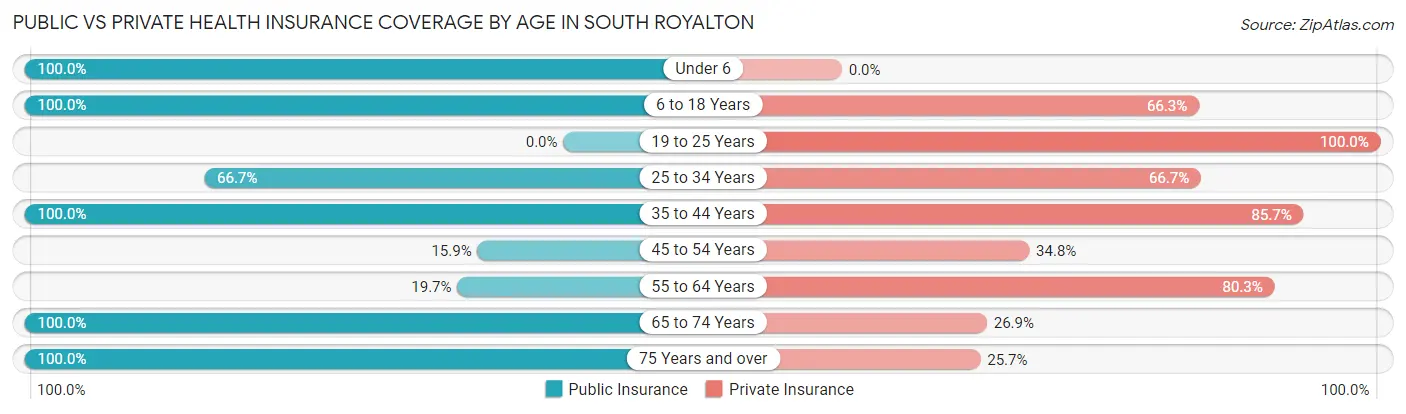
| Age Bracket | Public Insurance | Private Insurance |
| Under 6 | 10 (100.0%) | 0 (0.0%) |
| 6 to 18 Years | 92 (100.0%) | 61 (66.3%) |
| 19 to 25 Years | 0 (0.0%) | 52 (100.0%) |
| 25 to 34 Years | 22 (66.7%) | 22 (66.7%) |
| 35 to 44 Years | 28 (100.0%) | 24 (85.7%) |
| 45 to 54 Years | 22 (15.9%) | 48 (34.8%) |
| 55 to 64 Years | 12 (19.7%) | 49 (80.3%) |
| 65 to 74 Years | 26 (100.0%) | 7 (26.9%) |
| 75 Years and over | 35 (100.0%) | 9 (25.7%) |
| Total | 247 (52.0%) | 272 (57.3%) |
Disability Status by Sex by Age in South Royalton
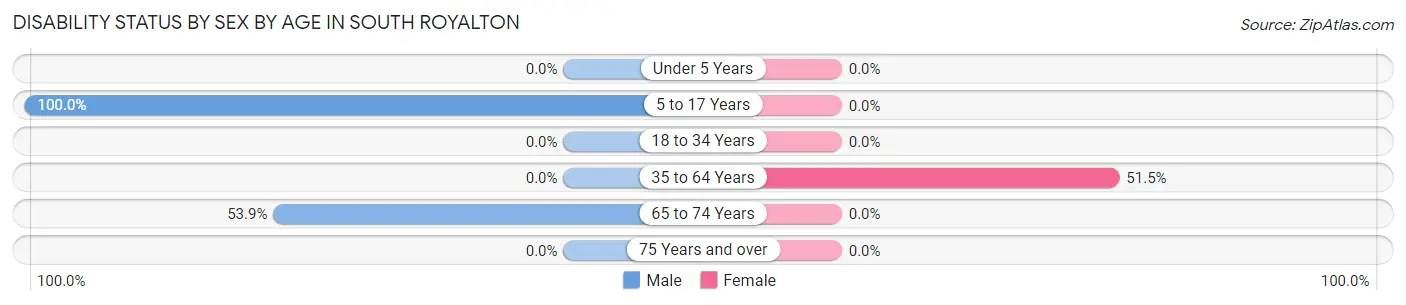
| Age Bracket | Male | Female |
| Under 5 Years | 0 (0.0%) | 0 (0.0%) |
| 5 to 17 Years | 33 (100.0%) | 0 (0.0%) |
| 18 to 34 Years | 0 (0.0%) | 0 (0.0%) |
| 35 to 64 Years | 0 (0.0%) | 84 (51.5%) |
| 65 to 74 Years | 7 (53.8%) | 0 (0.0%) |
| 75 Years and over | 0 (0.0%) | 0 (0.0%) |
Disability Class by Sex by Age in South Royalton
Disability Class: Hearing Difficulty
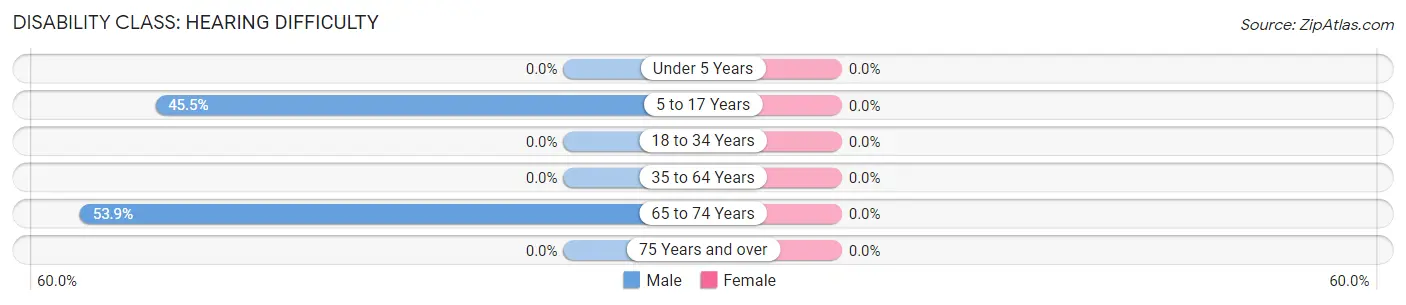
| Age Bracket | Male | Female |
| Under 5 Years | 0 (0.0%) | 0 (0.0%) |
| 5 to 17 Years | 15 (45.5%) | 0 (0.0%) |
| 18 to 34 Years | 0 (0.0%) | 0 (0.0%) |
| 35 to 64 Years | 0 (0.0%) | 0 (0.0%) |
| 65 to 74 Years | 7 (53.8%) | 0 (0.0%) |
| 75 Years and over | 0 (0.0%) | 0 (0.0%) |
Disability Class: Vision Difficulty
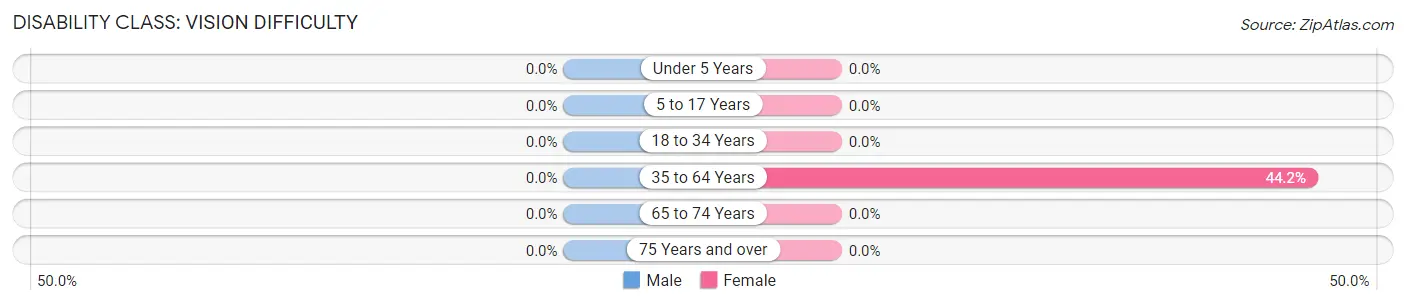
| Age Bracket | Male | Female |
| Under 5 Years | 0 (0.0%) | 0 (0.0%) |
| 5 to 17 Years | 0 (0.0%) | 0 (0.0%) |
| 18 to 34 Years | 0 (0.0%) | 0 (0.0%) |
| 35 to 64 Years | 0 (0.0%) | 72 (44.2%) |
| 65 to 74 Years | 0 (0.0%) | 0 (0.0%) |
| 75 Years and over | 0 (0.0%) | 0 (0.0%) |
Disability Class: Cognitive Difficulty
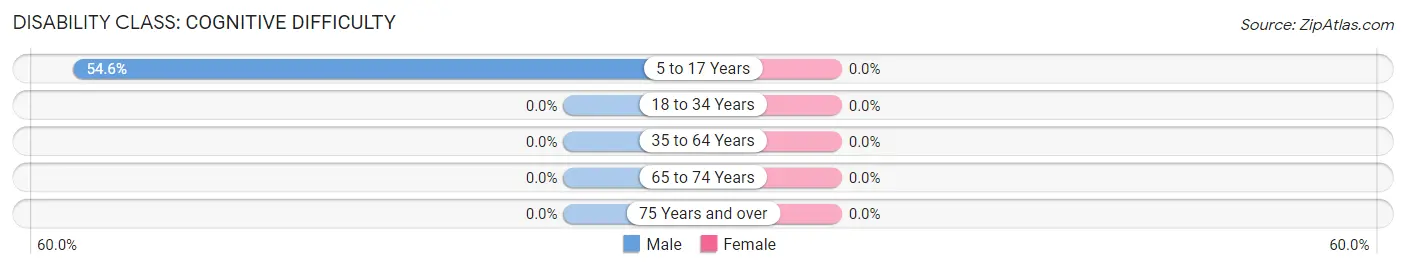
| Age Bracket | Male | Female |
| 5 to 17 Years | 18 (54.5%) | 0 (0.0%) |
| 18 to 34 Years | 0 (0.0%) | 0 (0.0%) |
| 35 to 64 Years | 0 (0.0%) | 0 (0.0%) |
| 65 to 74 Years | 0 (0.0%) | 0 (0.0%) |
| 75 Years and over | 0 (0.0%) | 0 (0.0%) |
Disability Class: Ambulatory Difficulty
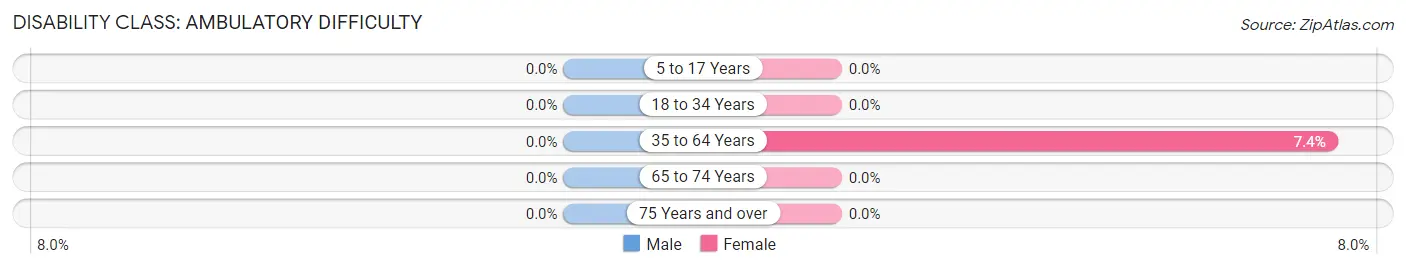
| Age Bracket | Male | Female |
| 5 to 17 Years | 0 (0.0%) | 0 (0.0%) |
| 18 to 34 Years | 0 (0.0%) | 0 (0.0%) |
| 35 to 64 Years | 0 (0.0%) | 12 (7.4%) |
| 65 to 74 Years | 0 (0.0%) | 0 (0.0%) |
| 75 Years and over | 0 (0.0%) | 0 (0.0%) |
Disability Class: Self-Care Difficulty
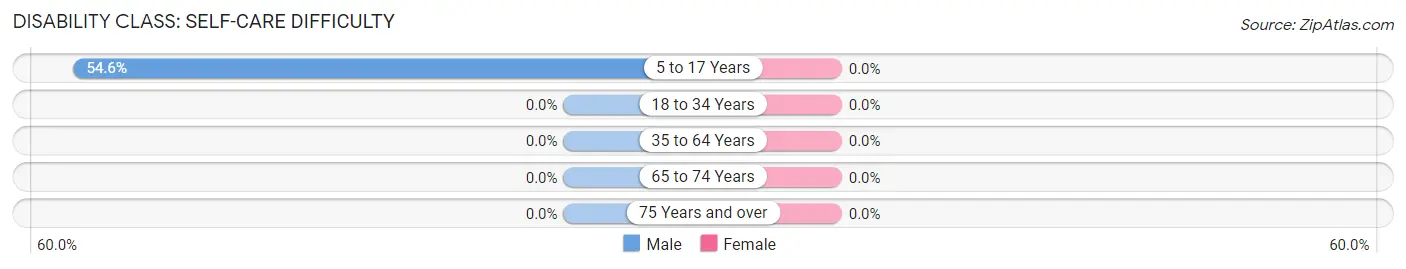
| Age Bracket | Male | Female |
| 5 to 17 Years | 18 (54.5%) | 0 (0.0%) |
| 18 to 34 Years | 0 (0.0%) | 0 (0.0%) |
| 35 to 64 Years | 0 (0.0%) | 0 (0.0%) |
| 65 to 74 Years | 0 (0.0%) | 0 (0.0%) |
| 75 Years and over | 0 (0.0%) | 0 (0.0%) |
Technology Access in South Royalton
Computing Device Access in South Royalton
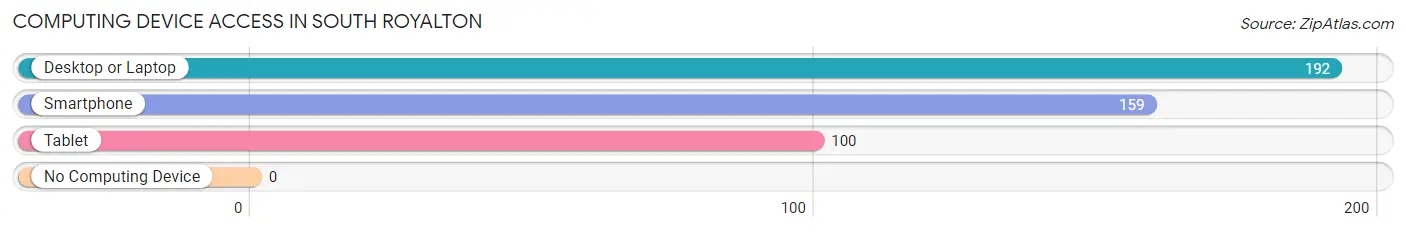
| Device Type | # Households | % Households |
| Desktop or Laptop | 192 | 100.0% |
| Smartphone | 159 | 82.8% |
| Tablet | 100 | 52.1% |
| No Computing Device | 0 | 0.0% |
| Total | 192 | 100.0% |
Internet Access in South Royalton
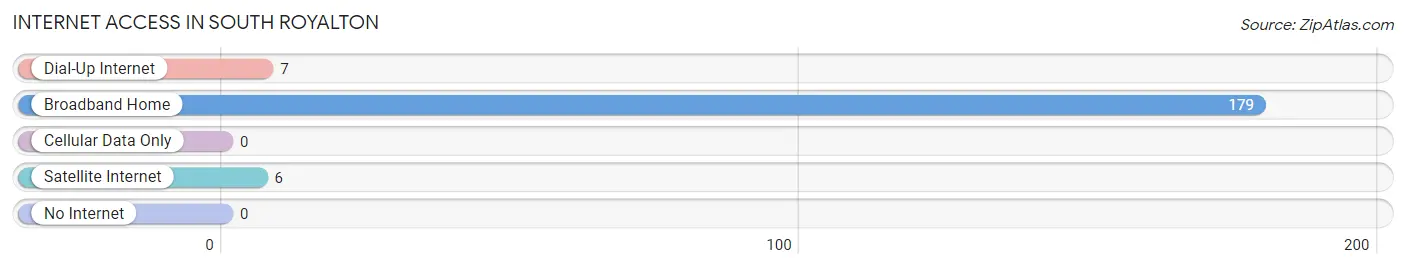
| Internet Type | # Households | % Households |
| Dial-Up Internet | 7 | 3.6% |
| Broadband Home | 179 | 93.2% |
| Cellular Data Only | 0 | 0.0% |
| Satellite Internet | 6 | 3.1% |
| No Internet | 0 | 0.0% |
| Total | 192 | 100.0% |
South Royalton Summary
Royalton, Vermont is a small town located in the White River Valley of the Green Mountains in central Vermont. It is the county seat of Windsor County and is home to a population of 1,822 people as of the 2010 census. The town was first settled in 1769 and was incorporated in 1781.
History
The first settlers of Royalton were a group of families from Connecticut who arrived in 1769. The town was named after Royalton, Connecticut, the hometown of the settlers. The town was officially incorporated in 1781 and was the first town in the state to be incorporated after the Revolutionary War.
The town was an important center of commerce and industry in the early 19th century. It was home to several mills, including a gristmill, a sawmill, and a woolen mill. The town was also home to a number of small businesses, including a blacksmith shop, a tannery, and a general store.
In the mid-19th century, the town was a major stop on the Central Vermont Railroad. The railroad brought a great deal of economic activity to the town, and it was home to several hotels and inns.
Geography
Royalton is located in the White River Valley of the Green Mountains in central Vermont. The town is bordered by the towns of Sharon, Bethel, and Tunbridge to the north, Randolph to the east, and South Royalton to the south. The White River runs through the town, and the town is home to several small lakes, including Lake Champlain, Lake Memphremagog, and Lake Willoughby.
The town has a total area of 24.2 square miles, of which 24.1 square miles is land and 0.1 square miles is water. The town is located at an elevation of 890 feet above sea level.
Economy
The economy of Royalton is largely based on agriculture and tourism. The town is home to several small farms, and the surrounding area is known for its dairy and maple syrup production. The town is also home to several small businesses, including restaurants, shops, and inns.
The town is also home to several educational institutions, including the Vermont Law School, the Vermont Technical College, and the Royalton Academy.
Demographics
As of the 2010 census, the population of Royalton was 1,822 people. The racial makeup of the town was 97.3% White, 0.7% African American, 0.3% Native American, 0.2% Asian, 0.1% Pacific Islander, 0.2% from other races, and 1.3% from two or more races. Hispanic or Latino of any race were 1.2% of the population.
The median household income in Royalton was $45,938, and the median family income was $54,375. The per capita income for the town was $22,945. About 8.3% of families and 11.2% of the population were below the poverty line, including 14.2% of those under age 18 and 8.2% of those age 65 or over.
Common Questions
What is Per Capita Income in South Royalton?
Per Capita income in South Royalton is $27,517.
What is the Median Family Income in South Royalton?
Median Family Income in South Royalton is $92,885.
What is the Median Household income in South Royalton?
Median Household Income in South Royalton is $44,423.
What is Inequality or Gini Index in South Royalton?
Inequality or Gini Index in South Royalton is 0.44.
What is the Total Population of South Royalton?
Total Population of South Royalton is 475.
What is the Total Male Population of South Royalton?
Total Male Population of South Royalton is 158.
What is the Total Female Population of South Royalton?
Total Female Population of South Royalton is 317.
What is the Ratio of Males per 100 Females in South Royalton?
There are 49.84 Males per 100 Females in South Royalton.
What is the Ratio of Females per 100 Males in South Royalton?
There are 200.63 Females per 100 Males in South Royalton.
What is the Median Population Age in South Royalton?
Median Population Age in South Royalton is 49.2 Years.
What is the Average Family Size in South Royalton
Average Family Size in South Royalton is 3.9 People.
What is the Average Household Size in South Royalton
Average Household Size in South Royalton is 2.5 People.
How Large is the Labor Force in South Royalton?
There are 282 People in the Labor Forcein in South Royalton.
What is the Percentage of People in the Labor Force in South Royalton?
75.6% of People are in the Labor Force in South Royalton.