Greenwood, MN Map & Demographics
Greenwood Map
Greenwood Overview
$143,541
PER CAPITA INCOME
$250,001
AVG FAMILY INCOME
$197,000
AVG HOUSEHOLD INCOME
34.7%
WAGE / INCOME GAP [ % ]
65.3¢/ $1
WAGE / INCOME GAP [ $ ]
0.54
INEQUALITY / GINI INDEX
742
TOTAL POPULATION
384
MALE POPULATION
358
FEMALE POPULATION
107.26
MALES / 100 FEMALES
93.23
FEMALES / 100 MALES
48.6
MEDIAN AGE
3.0
AVG FAMILY SIZE
2.7
AVG HOUSEHOLD SIZE
425
LABOR FORCE [ PEOPLE ]
70.1%
PERCENT IN LABOR FORCE
3.8%
UNEMPLOYMENT RATE
Income in Greenwood
Income Overview in Greenwood
Per Capita Income in Greenwood is $143,541, while median incomes of families and households are $250,001 and $197,000 respectively.
| Characteristic | Number | Measure |
| Per Capita Income | 742 | $143,541 |
| Median Family Income | 227 | $250,001 |
| Mean Family Income | 227 | $424,030 |
| Median Household Income | 276 | $197,000 |
| Mean Household Income | 276 | $363,791 |
| Income Deficit | 227 | $0 |
| Wage / Income Gap (%) | 742 | 34.67% |
| Wage / Income Gap ($) | 742 | 65.33¢ per $1 |
| Gini / Inequality Index | 742 | 0.54 |
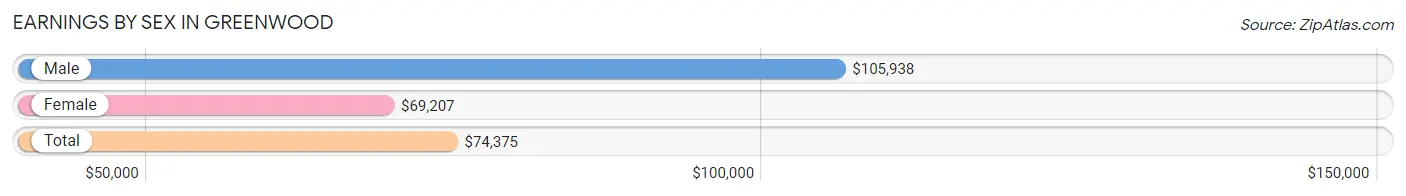
Earnings by Sex in Greenwood
Average Earnings in Greenwood are $74,375, $105,938 for men and $69,207 for women, a difference of 34.7%.
| Sex | Number | Average Earnings |
| Male | 263 (59.6%) | $105,938 |
| Female | 178 (40.4%) | $69,207 |
| Total | 441 (100.0%) | $74,375 |
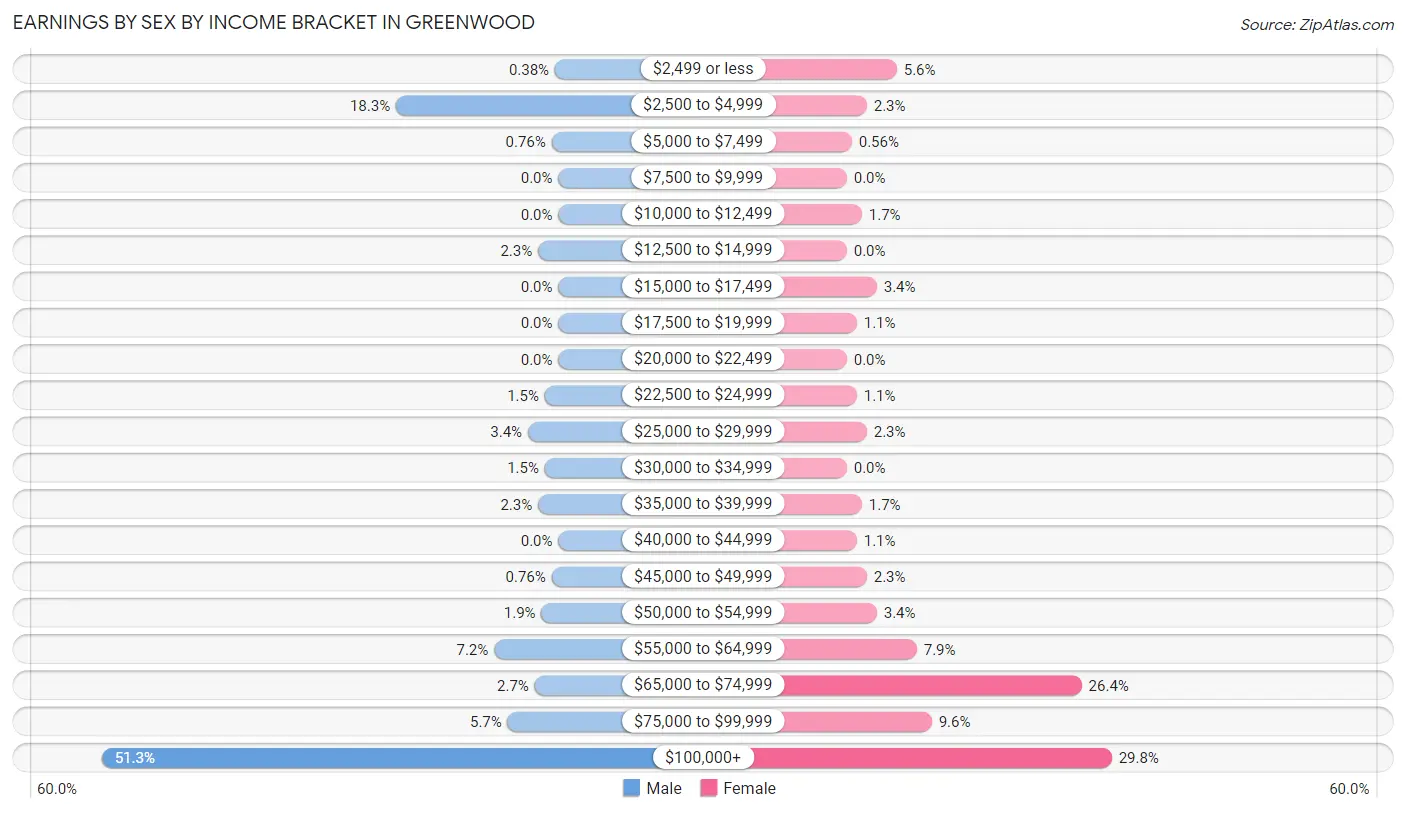
Earnings by Sex by Income Bracket in Greenwood
The most common earnings brackets in Greenwood are $100,000+ for men (135 | 51.3%) and $100,000+ for women (53 | 29.8%).
| Income | Male | Female |
| $2,499 or less | 1 (0.4%) | 10 (5.6%) |
| $2,500 to $4,999 | 48 (18.2%) | 4 (2.2%) |
| $5,000 to $7,499 | 2 (0.8%) | 1 (0.6%) |
| $7,500 to $9,999 | 0 (0.0%) | 0 (0.0%) |
| $10,000 to $12,499 | 0 (0.0%) | 3 (1.7%) |
| $12,500 to $14,999 | 6 (2.3%) | 0 (0.0%) |
| $15,000 to $17,499 | 0 (0.0%) | 6 (3.4%) |
| $17,500 to $19,999 | 0 (0.0%) | 2 (1.1%) |
| $20,000 to $22,499 | 0 (0.0%) | 0 (0.0%) |
| $22,500 to $24,999 | 4 (1.5%) | 2 (1.1%) |
| $25,000 to $29,999 | 9 (3.4%) | 4 (2.2%) |
| $30,000 to $34,999 | 4 (1.5%) | 0 (0.0%) |
| $35,000 to $39,999 | 6 (2.3%) | 3 (1.7%) |
| $40,000 to $44,999 | 0 (0.0%) | 2 (1.1%) |
| $45,000 to $49,999 | 2 (0.8%) | 4 (2.2%) |
| $50,000 to $54,999 | 5 (1.9%) | 6 (3.4%) |
| $55,000 to $64,999 | 19 (7.2%) | 14 (7.9%) |
| $65,000 to $74,999 | 7 (2.7%) | 47 (26.4%) |
| $75,000 to $99,999 | 15 (5.7%) | 17 (9.6%) |
| $100,000+ | 135 (51.3%) | 53 (29.8%) |
| Total | 263 (100.0%) | 178 (100.0%) |
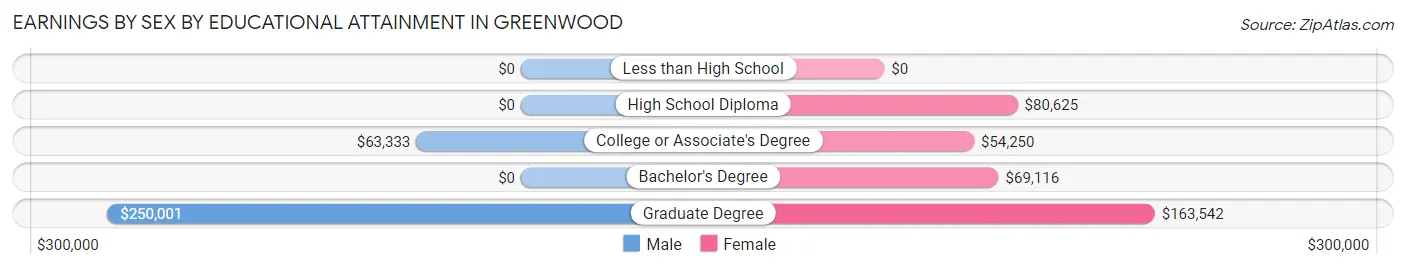
Earnings by Sex by Educational Attainment in Greenwood
Average earnings in Greenwood are $109,167 for men and $69,451 for women, a difference of 36.4%. Men with an educational attainment of graduate degree enjoy the highest average annual earnings of $250,001, while those with college or associate's degree education earn the least with $63,333. Women with an educational attainment of graduate degree earn the most with the average annual earnings of $163,542, while those with college or associate's degree education have the smallest earnings of $54,250.
| Educational Attainment | Male Income | Female Income |
| Less than High School | - | - |
| High School Diploma | - | - |
| College or Associate's Degree | $63,333 | $54,250 |
| Bachelor's Degree | - | - |
| Graduate Degree | $250,001 | $163,542 |
| Total | $109,167 | $69,451 |
Family Income in Greenwood
Family Income Brackets in Greenwood
According to the Greenwood family income data, there are 133 families falling into the $200,000+ income range, which is the most common income bracket and makes up 58.6% of all families.
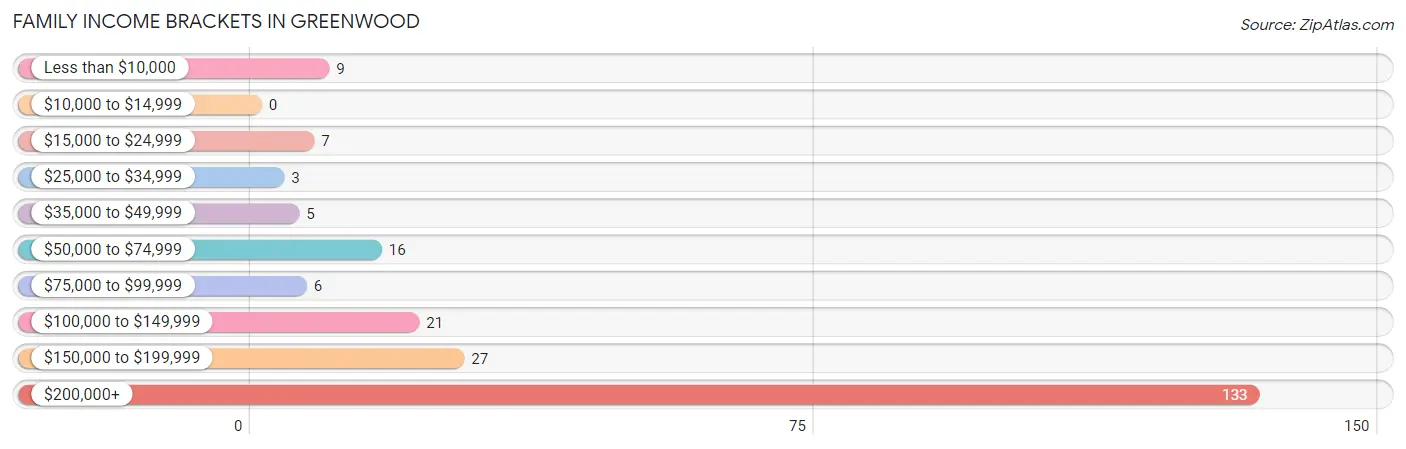
| Income Bracket | # Families | % Families |
| Less than $10,000 | 9 | 4.0% |
| $10,000 to $14,999 | 0 | 0.0% |
| $15,000 to $24,999 | 7 | 3.1% |
| $25,000 to $34,999 | 3 | 1.3% |
| $35,000 to $49,999 | 5 | 2.2% |
| $50,000 to $74,999 | 16 | 7.0% |
| $75,000 to $99,999 | 6 | 2.6% |
| $100,000 to $149,999 | 21 | 9.3% |
| $150,000 to $199,999 | 27 | 11.9% |
| $200,000+ | 133 | 58.6% |
Family Income by Famaliy Size in Greenwood
3-person families (59 | 26.0%) account for the highest median family income in Greenwood with $250,001 per family, while 2-person families (112 | 49.3%) have the highest median income of $93,125 per family member.
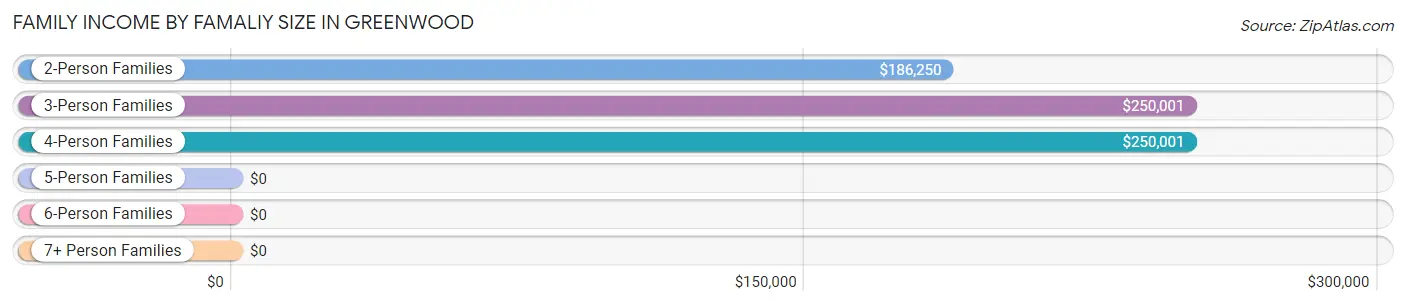
| Income Bracket | # Families | Median Income |
| 2-Person Families | 112 (49.3%) | $186,250 |
| 3-Person Families | 59 (26.0%) | $250,001 |
| 4-Person Families | 43 (18.9%) | $250,001 |
| 5-Person Families | 13 (5.7%) | $0 |
| 6-Person Families | 0 (0.0%) | $0 |
| 7+ Person Families | 0 (0.0%) | $0 |
| Total | 227 (100.0%) | $250,001 |
Family Income by Number of Earners in Greenwood
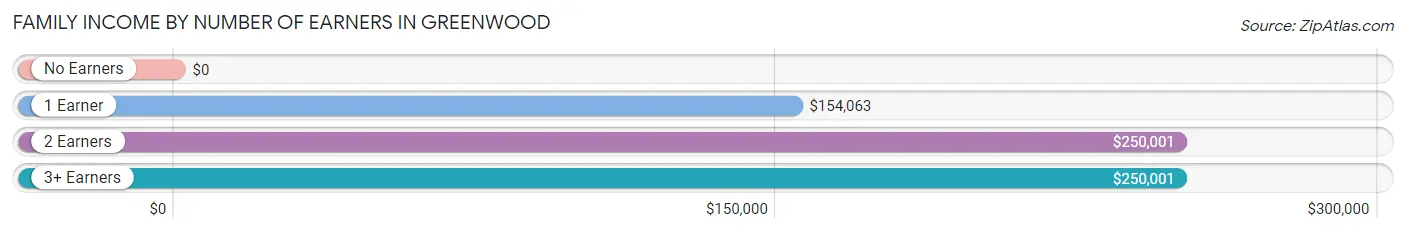
| Number of Earners | # Families | Median Income |
| No Earners | 38 (16.7%) | $0 |
| 1 Earner | 63 (27.8%) | $154,063 |
| 2 Earners | 83 (36.6%) | $250,001 |
| 3+ Earners | 43 (18.9%) | $250,001 |
| Total | 227 (100.0%) | $250,001 |
Household Income in Greenwood
Household Income Brackets in Greenwood
With 137 households falling in the category, the $200,000+ income range is the most frequent in Greenwood, accounting for 49.6% of all households. In contrast, only 2 households (0.7%) fall into the $10,000 to $14,999 income bracket, making it the least populous group.
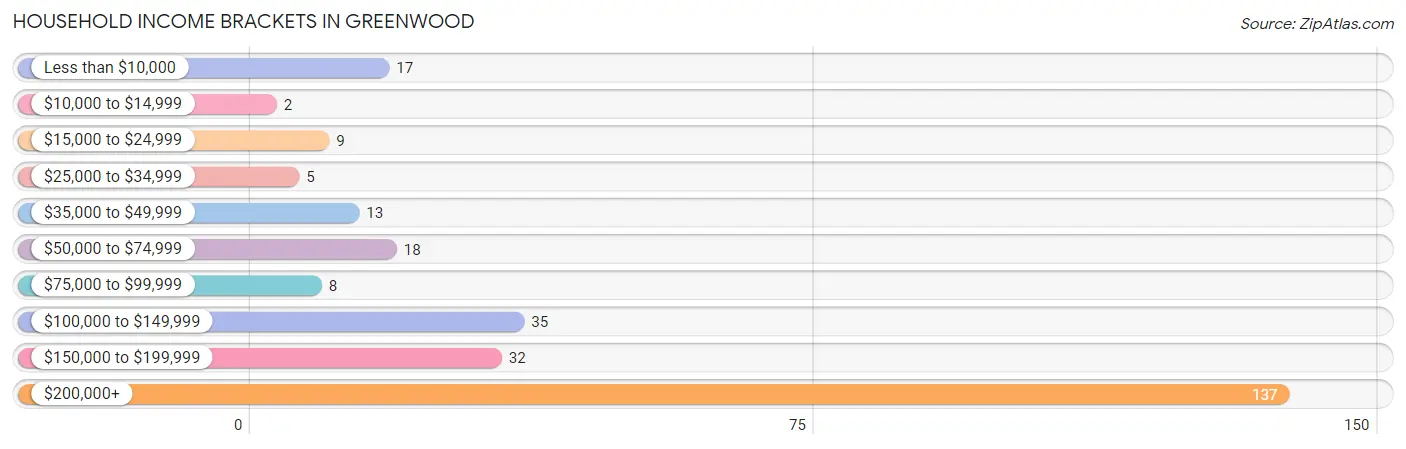
| Income Bracket | # Households | % Households |
| Less than $10,000 | 17 | 6.2% |
| $10,000 to $14,999 | 2 | 0.7% |
| $15,000 to $24,999 | 9 | 3.3% |
| $25,000 to $34,999 | 5 | 1.8% |
| $35,000 to $49,999 | 13 | 4.7% |
| $50,000 to $74,999 | 18 | 6.5% |
| $75,000 to $99,999 | 8 | 2.9% |
| $100,000 to $149,999 | 35 | 12.7% |
| $150,000 to $199,999 | 32 | 11.6% |
| $200,000+ | 137 | 49.6% |
Household Income by Householder Age in Greenwood
The median household income in Greenwood is $197,000, with the highest median household income of $250,001 found in the 45 to 64 years age bracket for the primary householder. A total of 153 households (55.4%) fall into this category.
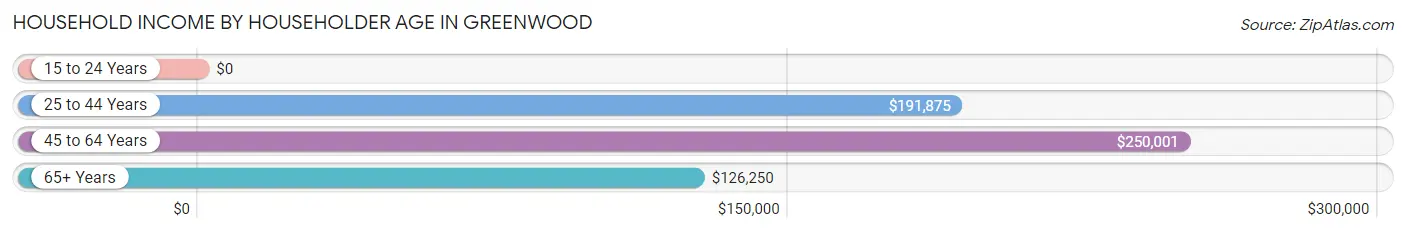
| Income Bracket | # Households | Median Income |
| 15 to 24 Years | 0 (0.0%) | $0 |
| 25 to 44 Years | 47 (17.0%) | $191,875 |
| 45 to 64 Years | 153 (55.4%) | $250,001 |
| 65+ Years | 76 (27.5%) | $126,250 |
| Total | 276 (100.0%) | $197,000 |
Poverty in Greenwood
Income Below Poverty by Sex and Age in Greenwood
With 7.8% poverty level for males and 8.1% for females among the residents of Greenwood, 12 to 14 year old males and under 5 year old females are the most vulnerable to poverty, with 6 males (50.0%) and 7 females (24.1%) in their respective age groups living below the poverty level.
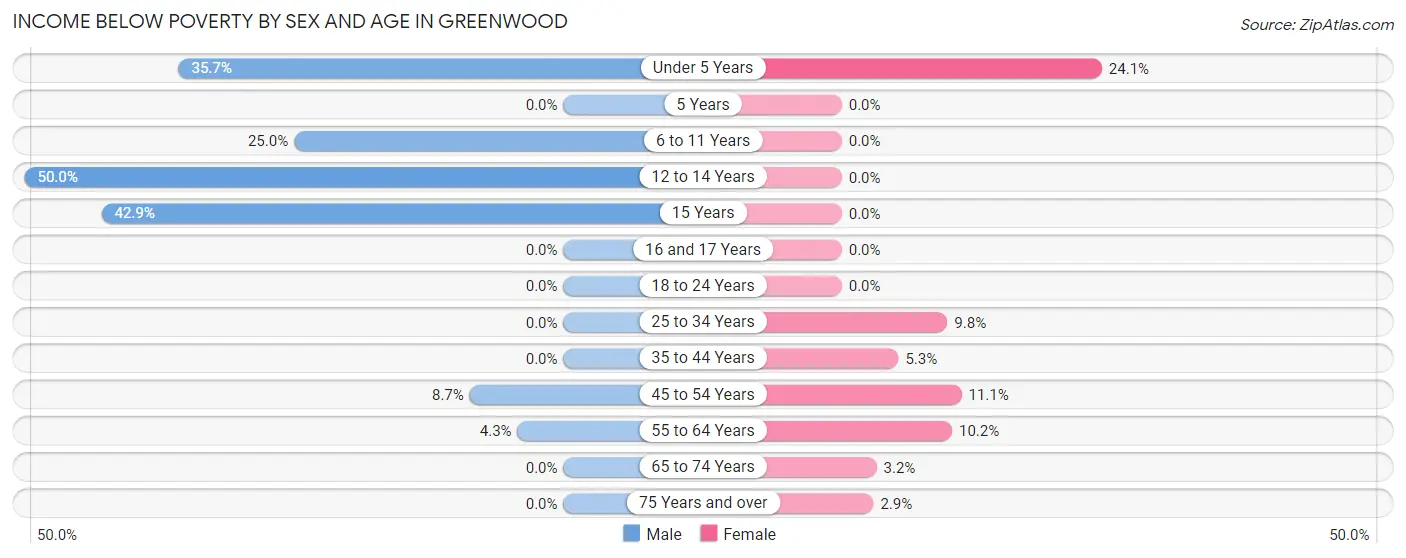
| Age Bracket | Male | Female |
| Under 5 Years | 5 (35.7%) | 7 (24.1%) |
| 5 Years | 0 (0.0%) | 0 (0.0%) |
| 6 to 11 Years | 8 (25.0%) | 0 (0.0%) |
| 12 to 14 Years | 6 (50.0%) | 0 (0.0%) |
| 15 Years | 3 (42.9%) | 0 (0.0%) |
| 16 and 17 Years | 0 (0.0%) | 0 (0.0%) |
| 18 to 24 Years | 0 (0.0%) | 0 (0.0%) |
| 25 to 34 Years | 0 (0.0%) | 5 (9.8%) |
| 35 to 44 Years | 0 (0.0%) | 2 (5.3%) |
| 45 to 54 Years | 4 (8.7%) | 4 (11.1%) |
| 55 to 64 Years | 4 (4.3%) | 9 (10.2%) |
| 65 to 74 Years | 0 (0.0%) | 1 (3.2%) |
| 75 Years and over | 0 (0.0%) | 1 (2.9%) |
| Total | 30 (7.8%) | 29 (8.1%) |
Income Above Poverty by Sex and Age in Greenwood
According to the poverty statistics in Greenwood, males aged 5 years and females aged 5 years are the age groups that are most secure financially, with 100.0% of males and 100.0% of females in these age groups living above the poverty line.
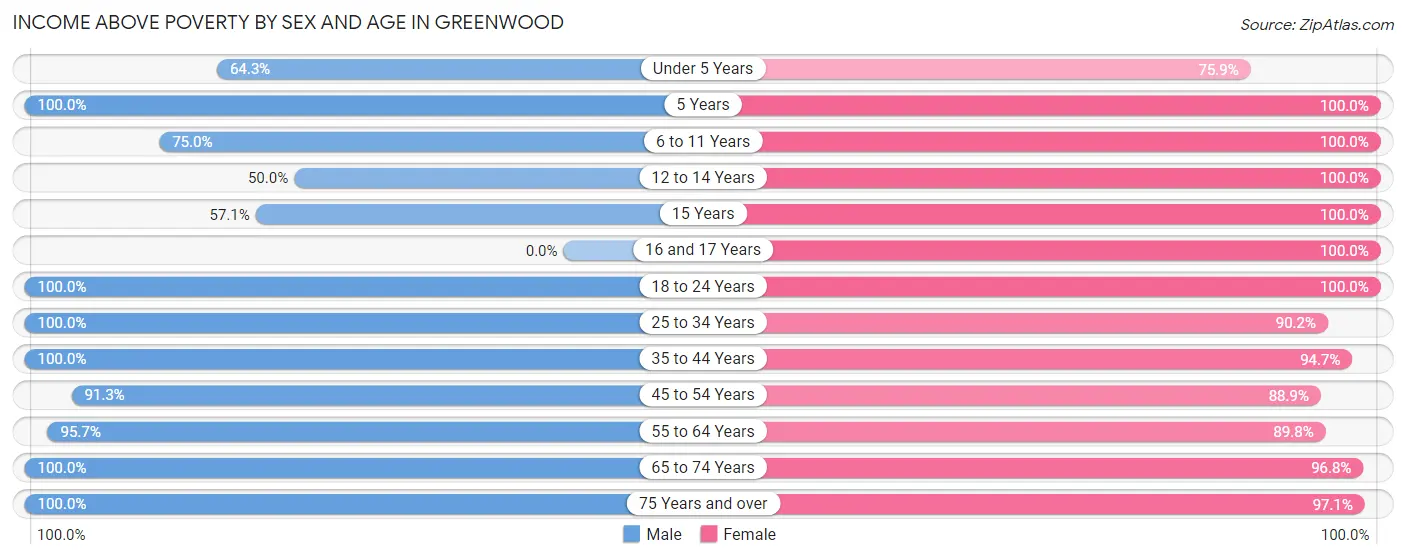
| Age Bracket | Male | Female |
| Under 5 Years | 9 (64.3%) | 22 (75.9%) |
| 5 Years | 1 (100.0%) | 4 (100.0%) |
| 6 to 11 Years | 24 (75.0%) | 20 (100.0%) |
| 12 to 14 Years | 6 (50.0%) | 10 (100.0%) |
| 15 Years | 4 (57.1%) | 7 (100.0%) |
| 16 and 17 Years | 0 (0.0%) | 8 (100.0%) |
| 18 to 24 Years | 9 (100.0%) | 2 (100.0%) |
| 25 to 34 Years | 53 (100.0%) | 46 (90.2%) |
| 35 to 44 Years | 52 (100.0%) | 36 (94.7%) |
| 45 to 54 Years | 42 (91.3%) | 32 (88.9%) |
| 55 to 64 Years | 90 (95.7%) | 79 (89.8%) |
| 65 to 74 Years | 37 (100.0%) | 30 (96.8%) |
| 75 Years and over | 27 (100.0%) | 33 (97.1%) |
| Total | 354 (92.2%) | 329 (91.9%) |
Income Below Poverty Among Married-Couple Families in Greenwood
The poverty statistics for married-couple families in Greenwood show that 2.4% or 4 of the total 165 families live below the poverty line. Families with no children have the highest poverty rate of 3.7%, comprising of 4 families. On the other hand, families with 1 or 2 children have the lowest poverty rate of 0.0%, which includes 0 families.
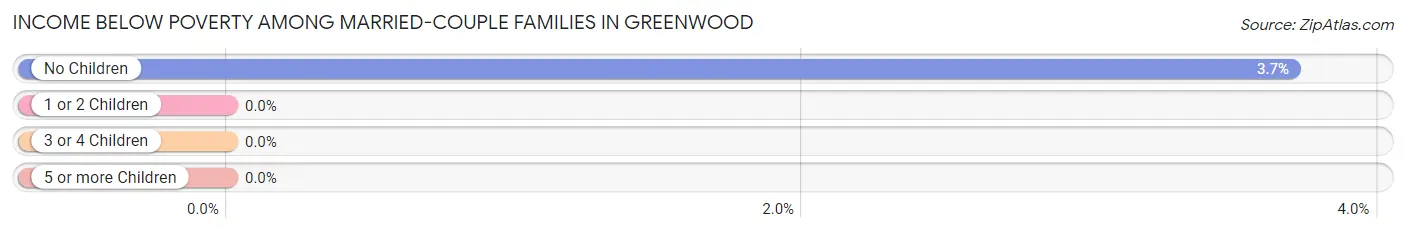
| Children | Above Poverty | Below Poverty |
| No Children | 104 (96.3%) | 4 (3.7%) |
| 1 or 2 Children | 49 (100.0%) | 0 (0.0%) |
| 3 or 4 Children | 8 (100.0%) | 0 (0.0%) |
| 5 or more Children | 0 (0.0%) | 0 (0.0%) |
| Total | 161 (97.6%) | 4 (2.4%) |
Income Below Poverty Among Single-Parent Households in Greenwood
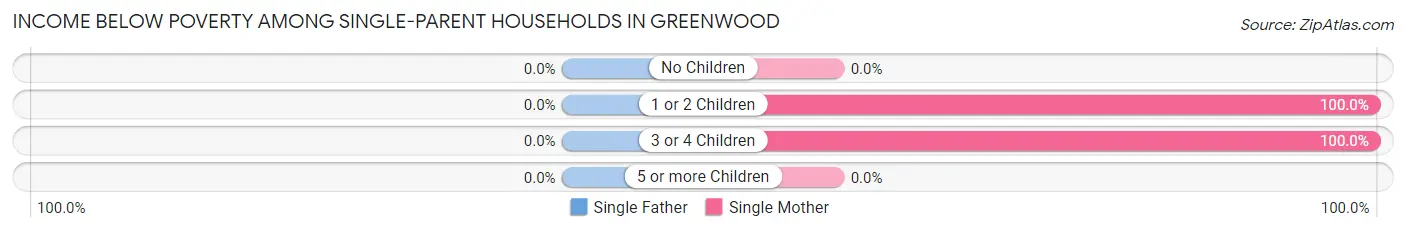
| Children | Single Father | Single Mother |
| No Children | 0 (0.0%) | 0 (0.0%) |
| 1 or 2 Children | 0 (0.0%) | 4 (100.0%) |
| 3 or 4 Children | 0 (0.0%) | 5 (100.0%) |
| 5 or more Children | 0 (0.0%) | 0 (0.0%) |
| Total | 0 (0.0%) | 9 (37.5%) |
Income Below Poverty Among Married-Couple vs Single-Parent Households in Greenwood
The poverty data for Greenwood shows that 4 of the married-couple family households (2.4%) and 9 of the single-parent households (14.5%) are living below the poverty level. Within the married-couple family households, those with no children have the highest poverty rate, with 4 households (3.7%) falling below the poverty line. Among the single-parent households, those with 3 or 4 children have the highest poverty rate, with 5 household (100.0%) living below poverty.
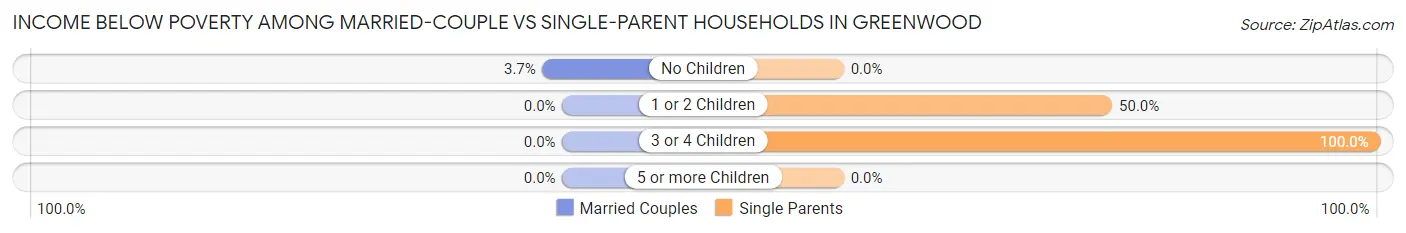
| Children | Married-Couple Families | Single-Parent Households |
| No Children | 4 (3.7%) | 0 (0.0%) |
| 1 or 2 Children | 0 (0.0%) | 4 (50.0%) |
| 3 or 4 Children | 0 (0.0%) | 5 (100.0%) |
| 5 or more Children | 0 (0.0%) | 0 (0.0%) |
| Total | 4 (2.4%) | 9 (14.5%) |
Race in Greenwood
The most populous races in Greenwood are White / Caucasian (713 | 96.1%), Two or more Races (25 | 3.4%), and Black / African American (3 | 0.4%).
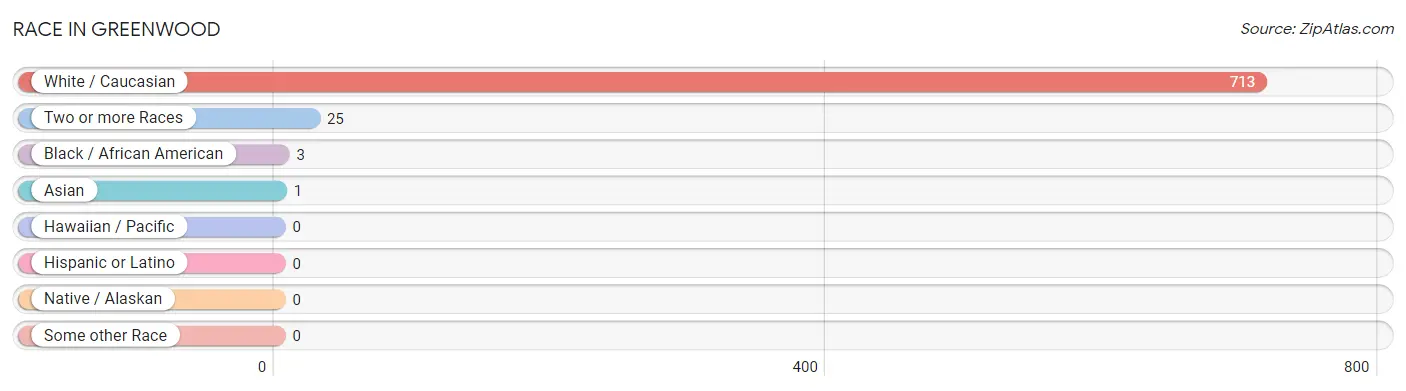
| Race | # Population | % Population |
| Asian | 1 | 0.1% |
| Black / African American | 3 | 0.4% |
| Hawaiian / Pacific | 0 | 0.0% |
| Hispanic or Latino | 0 | 0.0% |
| Native / Alaskan | 0 | 0.0% |
| White / Caucasian | 713 | 96.1% |
| Two or more Races | 25 | 3.4% |
| Some other Race | 0 | 0.0% |
| Total | 742 | 100.0% |
Ancestry in Greenwood
The most populous ancestries reported in Greenwood are Irish (195 | 26.3%), German (180 | 24.3%), Swedish (173 | 23.3%), Norwegian (101 | 13.6%), and English (68 | 9.2%), together accounting for 96.6% of all Greenwood residents.
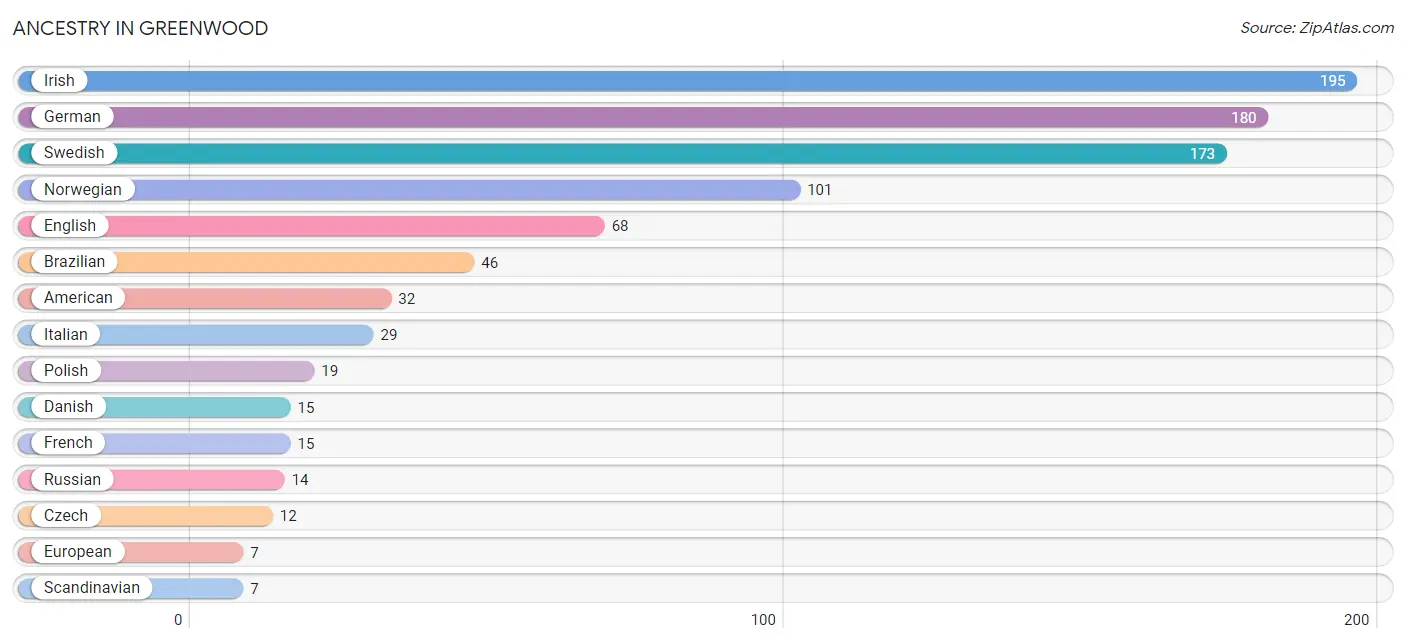
| Ancestry | # Population | % Population |
| American | 32 | 4.3% |
| Armenian | 2 | 0.3% |
| Austrian | 6 | 0.8% |
| Brazilian | 46 | 6.2% |
| Burmese | 3 | 0.4% |
| Canadian | 1 | 0.1% |
| Czech | 12 | 1.6% |
| Danish | 15 | 2.0% |
| Dutch | 4 | 0.5% |
| Eastern European | 2 | 0.3% |
| English | 68 | 9.2% |
| European | 7 | 0.9% |
| Finnish | 2 | 0.3% |
| French | 15 | 2.0% |
| French Canadian | 2 | 0.3% |
| German | 180 | 24.3% |
| Greek | 3 | 0.4% |
| Irish | 195 | 26.3% |
| Italian | 29 | 3.9% |
| Japanese | 3 | 0.4% |
| Lithuanian | 2 | 0.3% |
| Malaysian | 2 | 0.3% |
| Northern European | 4 | 0.5% |
| Norwegian | 101 | 13.6% |
| Polish | 19 | 2.6% |
| Russian | 14 | 1.9% |
| Scandinavian | 7 | 0.9% |
| Scotch-Irish | 2 | 0.3% |
| Scottish | 1 | 0.1% |
| Swedish | 173 | 23.3% |
| Welsh | 4 | 0.5% | View All 31 Rows |
Immigrants in Greenwood
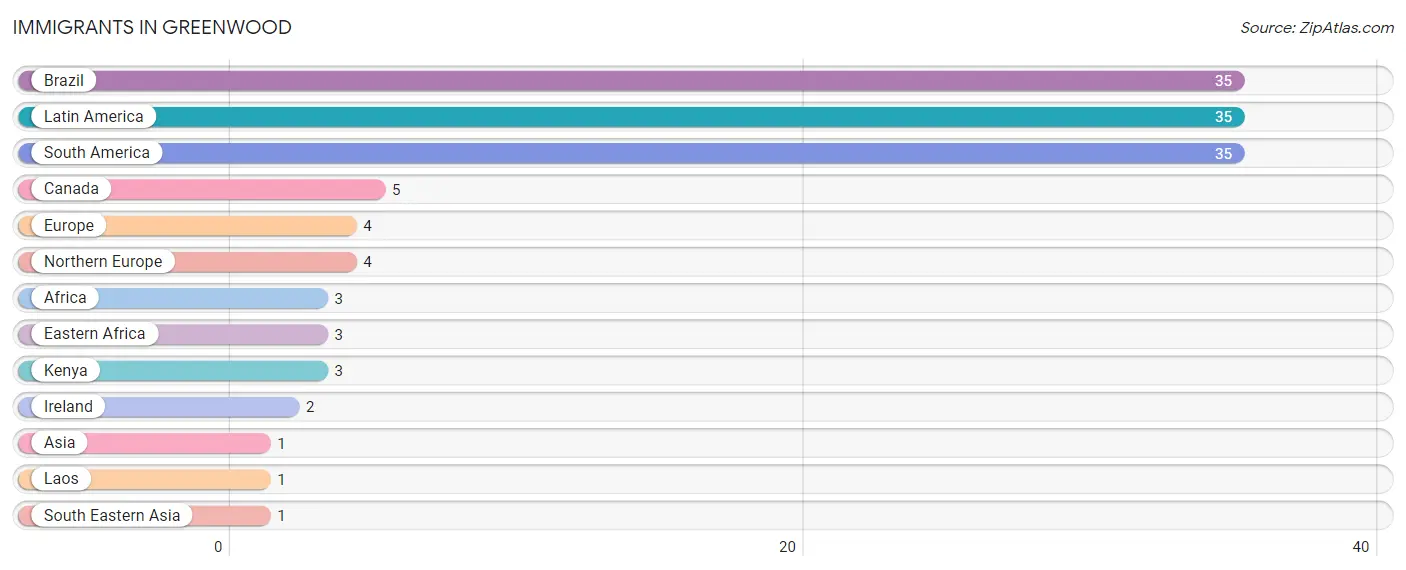
The most numerous immigrant groups reported in Greenwood came from Brazil (35 | 4.7%), Latin America (35 | 4.7%), South America (35 | 4.7%), Canada (5 | 0.7%), and Europe (4 | 0.5%), together accounting for 15.4% of all Greenwood residents.
| Immigration Origin | # Population | % Population |
| Africa | 3 | 0.4% |
| Asia | 1 | 0.1% |
| Brazil | 35 | 4.7% |
| Canada | 5 | 0.7% |
| Eastern Africa | 3 | 0.4% |
| Europe | 4 | 0.5% |
| Ireland | 2 | 0.3% |
| Kenya | 3 | 0.4% |
| Laos | 1 | 0.1% |
| Latin America | 35 | 4.7% |
| Northern Europe | 4 | 0.5% |
| South America | 35 | 4.7% |
| South Eastern Asia | 1 | 0.1% | View All 13 Rows |
Sex and Age in Greenwood
Sex and Age in Greenwood
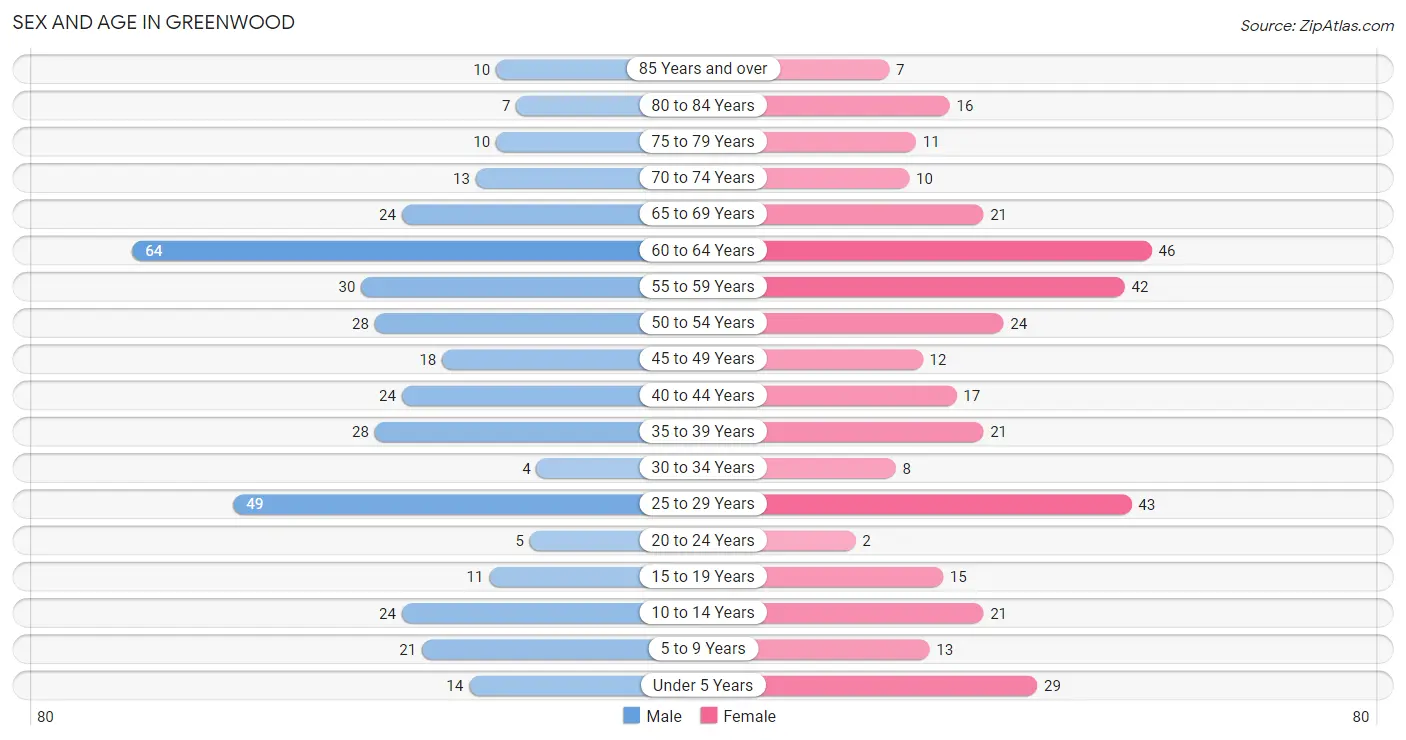
The most populous age groups in Greenwood are 60 to 64 Years (64 | 16.7%) for men and 60 to 64 Years (46 | 12.9%) for women.
| Age Bracket | Male | Female |
| Under 5 Years | 14 (3.6%) | 29 (8.1%) |
| 5 to 9 Years | 21 (5.5%) | 13 (3.6%) |
| 10 to 14 Years | 24 (6.2%) | 21 (5.9%) |
| 15 to 19 Years | 11 (2.9%) | 15 (4.2%) |
| 20 to 24 Years | 5 (1.3%) | 2 (0.6%) |
| 25 to 29 Years | 49 (12.8%) | 43 (12.0%) |
| 30 to 34 Years | 4 (1.0%) | 8 (2.2%) |
| 35 to 39 Years | 28 (7.3%) | 21 (5.9%) |
| 40 to 44 Years | 24 (6.2%) | 17 (4.8%) |
| 45 to 49 Years | 18 (4.7%) | 12 (3.4%) |
| 50 to 54 Years | 28 (7.3%) | 24 (6.7%) |
| 55 to 59 Years | 30 (7.8%) | 42 (11.7%) |
| 60 to 64 Years | 64 (16.7%) | 46 (12.9%) |
| 65 to 69 Years | 24 (6.2%) | 21 (5.9%) |
| 70 to 74 Years | 13 (3.4%) | 10 (2.8%) |
| 75 to 79 Years | 10 (2.6%) | 11 (3.1%) |
| 80 to 84 Years | 7 (1.8%) | 16 (4.5%) |
| 85 Years and over | 10 (2.6%) | 7 (2.0%) |
| Total | 384 (100.0%) | 358 (100.0%) |
Families and Households in Greenwood
Median Family Size in Greenwood
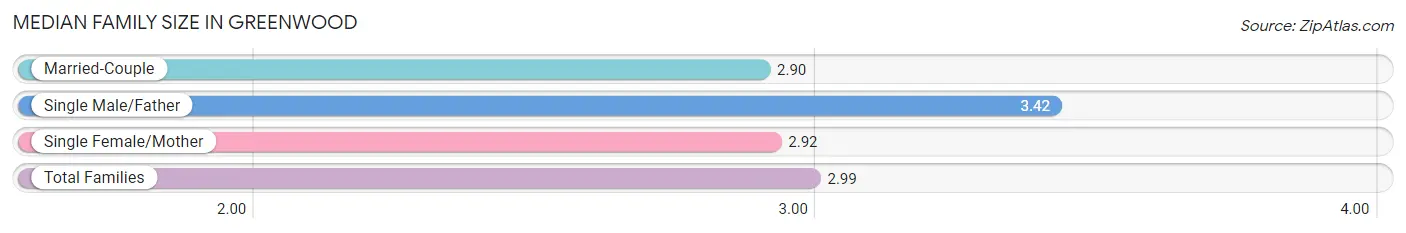
The median family size in Greenwood is 2.99 persons per family, with single male/father families (38 | 16.7%) accounting for the largest median family size of 3.42 persons per family. On the other hand, married-couple families (165 | 72.7%) represent the smallest median family size with 2.90 persons per family.
| Family Type | # Families | Family Size |
| Married-Couple | 165 (72.7%) | 2.90 |
| Single Male/Father | 38 (16.7%) | 3.42 |
| Single Female/Mother | 24 (10.6%) | 2.92 |
| Total Families | 227 (100.0%) | 2.99 |
Median Household Size in Greenwood
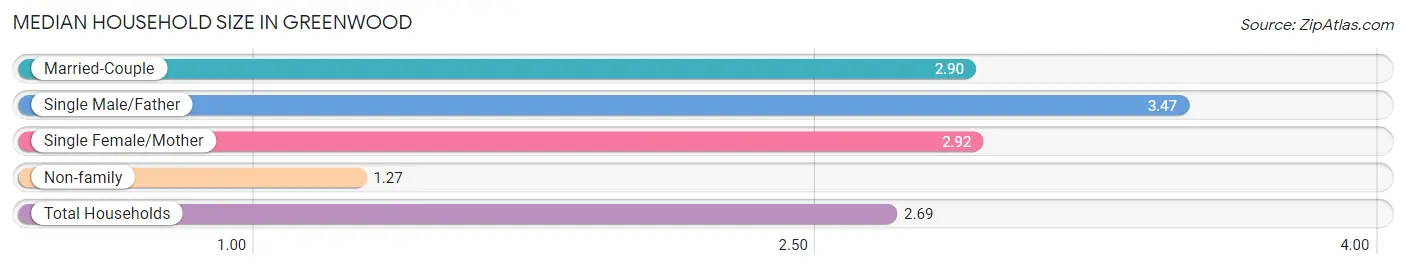
The median household size in Greenwood is 2.69 persons per household, with single male/father households (38 | 13.8%) accounting for the largest median household size of 3.47 persons per household. non-family households (49 | 17.7%) represent the smallest median household size with 1.27 persons per household.
| Household Type | # Households | Household Size |
| Married-Couple | 165 (59.8%) | 2.90 |
| Single Male/Father | 38 (13.8%) | 3.47 |
| Single Female/Mother | 24 (8.7%) | 2.92 |
| Non-family | 49 (17.7%) | 1.27 |
| Total Households | 276 (100.0%) | 2.69 |
Household Size by Marriage Status in Greenwood
Out of a total of 276 households in Greenwood, 227 (82.3%) are family households, while 49 (17.7%) are nonfamily households. The most numerous type of family households are 2-person households, comprising 112, and the most common type of nonfamily households are 1-person households, comprising 39.
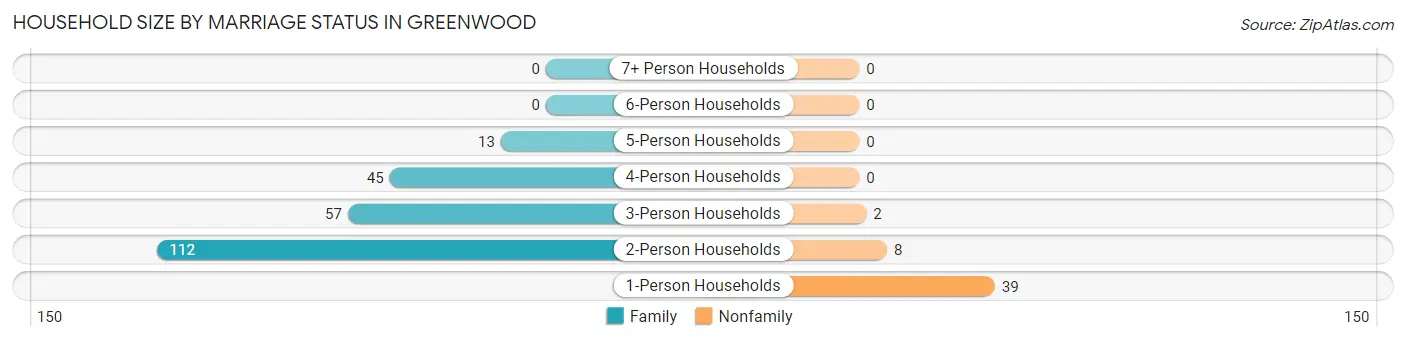
| Household Size | Family Households | Nonfamily Households |
| 1-Person Households | - | 39 (14.1%) |
| 2-Person Households | 112 (40.6%) | 8 (2.9%) |
| 3-Person Households | 57 (20.6%) | 2 (0.7%) |
| 4-Person Households | 45 (16.3%) | 0 (0.0%) |
| 5-Person Households | 13 (4.7%) | 0 (0.0%) |
| 6-Person Households | 0 (0.0%) | 0 (0.0%) |
| 7+ Person Households | 0 (0.0%) | 0 (0.0%) |
| Total | 227 (82.3%) | 49 (17.7%) |
Female Fertility in Greenwood
Fertility by Age in Greenwood
Average fertility rate in Greenwood is 41.0 births per 1,000 women. Women in the age bracket of 20 to 34 years have the highest fertility rate with 57.0 births per 1,000 women. Women in the age bracket of 20 to 34 years acount for 60.0% of all women with births.
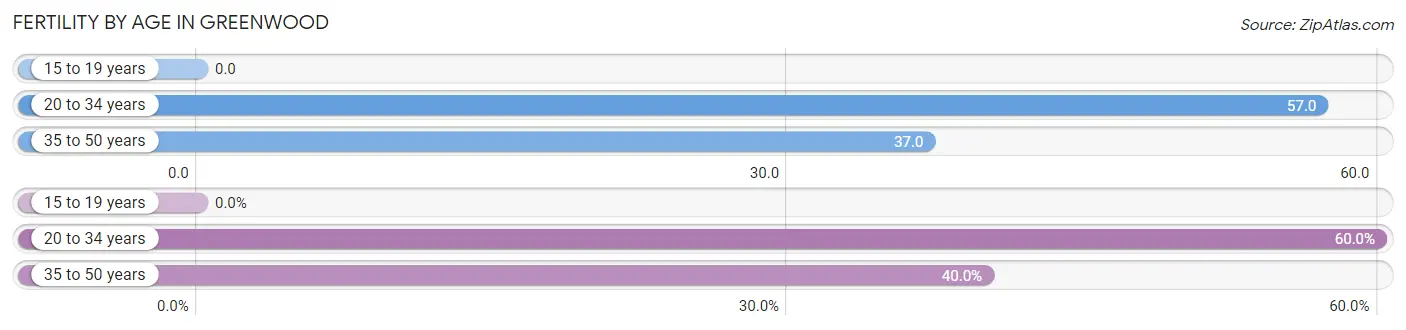
| Age Bracket | Women with Births | Births / 1,000 Women |
| 15 to 19 years | 0 (0.0%) | 0.0 |
| 20 to 34 years | 3 (60.0%) | 57.0 |
| 35 to 50 years | 2 (40.0%) | 37.0 |
| Total | 5 (100.0%) | 41.0 |
Fertility by Age by Marriage Status in Greenwood
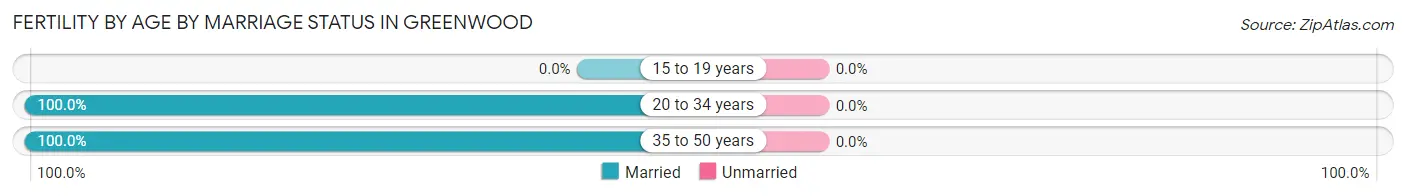
| Age Bracket | Married | Unmarried |
| 15 to 19 years | 0 (0.0%) | 0 (0.0%) |
| 20 to 34 years | 3 (100.0%) | 0 (0.0%) |
| 35 to 50 years | 2 (100.0%) | 0 (0.0%) |
| Total | 5 (100.0%) | 0 (0.0%) |
Fertility by Education in Greenwood
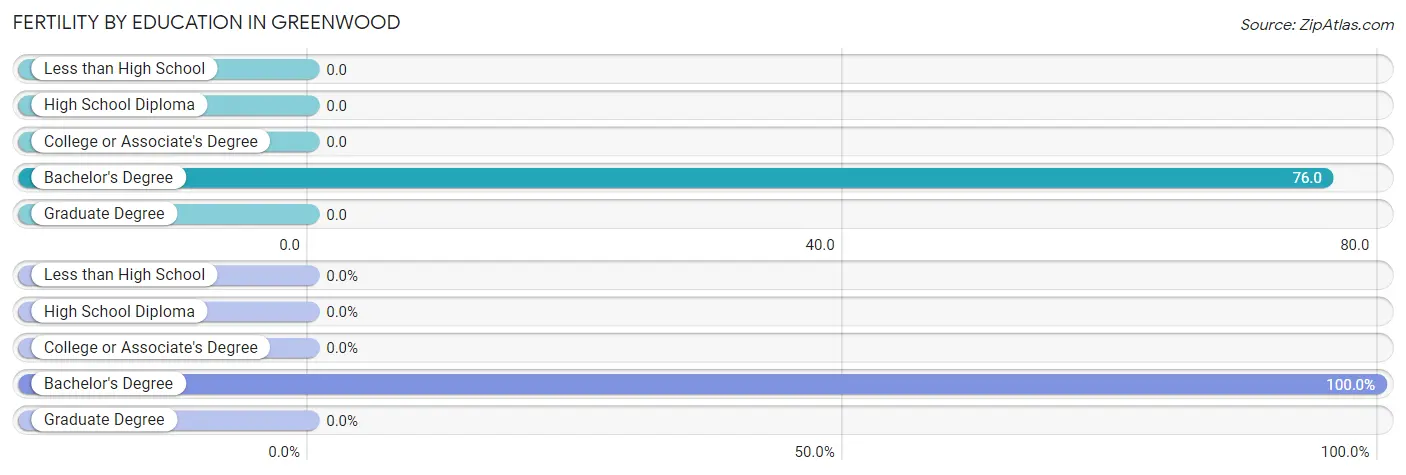
| Educational Attainment | Women with Births | Births / 1,000 Women |
| Less than High School | 0 (0.0%) | 0.0 |
| High School Diploma | 0 (0.0%) | 0.0 |
| College or Associate's Degree | 0 (0.0%) | 0.0 |
| Bachelor's Degree | 5 (100.0%) | 76.0 |
| Graduate Degree | 0 (0.0%) | 0.0 |
| Total | 5 (100.0%) | 41.0 |
Fertility by Education by Marriage Status in Greenwood
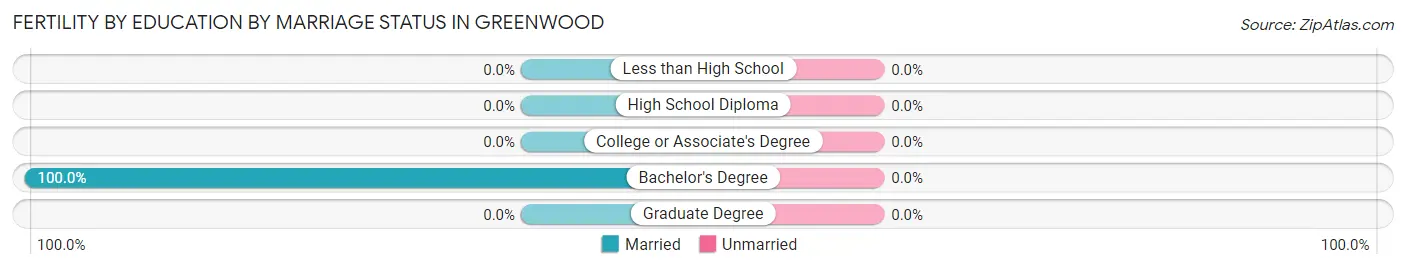
| Educational Attainment | Married | Unmarried |
| Less than High School | 0 (0.0%) | 0 (0.0%) |
| High School Diploma | 0 (0.0%) | 0 (0.0%) |
| College or Associate's Degree | 0 (0.0%) | 0 (0.0%) |
| Bachelor's Degree | 5 (100.0%) | 0 (0.0%) |
| Graduate Degree | 0 (0.0%) | 0 (0.0%) |
| Total | 5 (100.0%) | 0 (0.0%) |
Employment Characteristics in Greenwood
Employment by Class of Employer in Greenwood
Among the 407 employed individuals in Greenwood, private company employees (306 | 75.2%), self-employed (incorporated) (29 | 7.1%), and not-for-profit organizations (25 | 6.1%) make up the most common classes of employment.
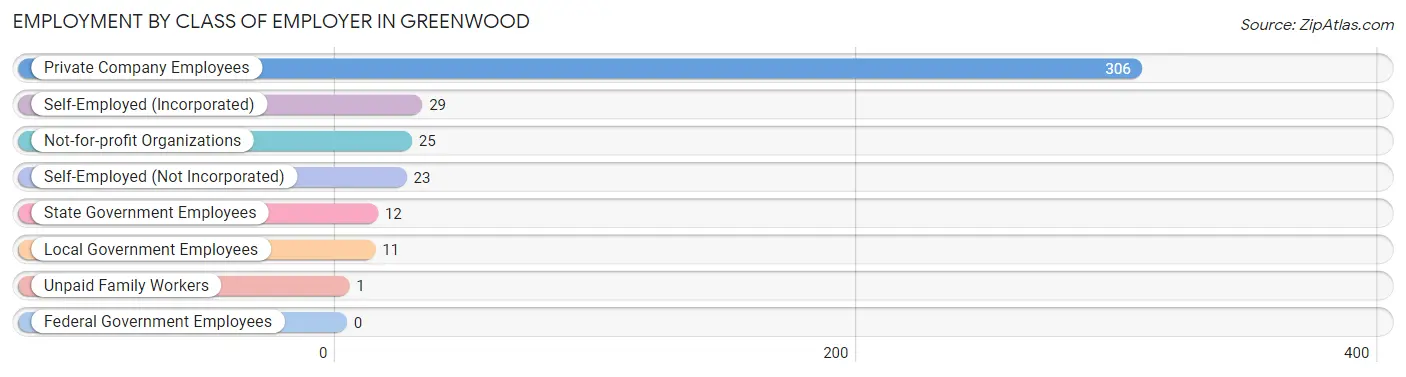
| Employer Class | # Employees | % Employees |
| Private Company Employees | 306 | 75.2% |
| Self-Employed (Incorporated) | 29 | 7.1% |
| Self-Employed (Not Incorporated) | 23 | 5.7% |
| Not-for-profit Organizations | 25 | 6.1% |
| Local Government Employees | 11 | 2.7% |
| State Government Employees | 12 | 2.9% |
| Federal Government Employees | 0 | 0.0% |
| Unpaid Family Workers | 1 | 0.3% |
| Total | 407 | 100.0% |
Employment Status by Age in Greenwood
According to the labor force statistics for Greenwood, out of the total population over 16 years of age (606), 70.1% or 425 individuals are in the labor force, with 3.8% or 16 of them unemployed. The age group with the highest labor force participation rate is 20 to 24 years, with 100.0% or 7 individuals in the labor force. Within the labor force, the 20 to 24 years age range has the highest percentage of unemployed individuals, with 28.6% or 2 of them being unemployed.
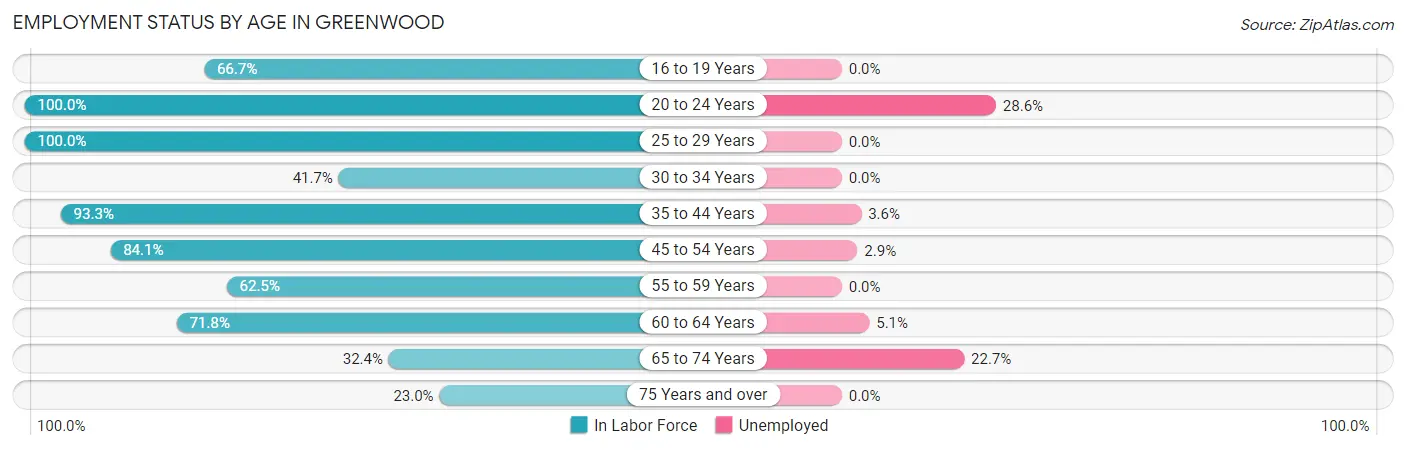
| Age Bracket | In Labor Force | Unemployed |
| 16 to 19 Years | 8 (66.7%) | 0 (0.0%) |
| 20 to 24 Years | 7 (100.0%) | 2 (28.6%) |
| 25 to 29 Years | 92 (100.0%) | 0 (0.0%) |
| 30 to 34 Years | 5 (41.7%) | 0 (0.0%) |
| 35 to 44 Years | 84 (93.3%) | 3 (3.6%) |
| 45 to 54 Years | 69 (84.1%) | 2 (2.9%) |
| 55 to 59 Years | 45 (62.5%) | 0 (0.0%) |
| 60 to 64 Years | 79 (71.8%) | 4 (5.1%) |
| 65 to 74 Years | 22 (32.4%) | 5 (22.7%) |
| 75 Years and over | 14 (23.0%) | 0 (0.0%) |
| Total | 425 (70.1%) | 16 (3.8%) |
Employment Status by Educational Attainment in Greenwood
According to labor force statistics for Greenwood, 81.7% of individuals (374) out of the total population between 25 and 64 years of age (458) are in the labor force, with 2.4% or 9 of them being unemployed. The group with the highest labor force participation rate are those with the educational attainment of bachelor's degree or higher, with 86.2% or 332 individuals in the labor force. Within the labor force, individuals with college / associate degree education have the highest percentage of unemployment, with 10.7% or 3 of them being unemployed.
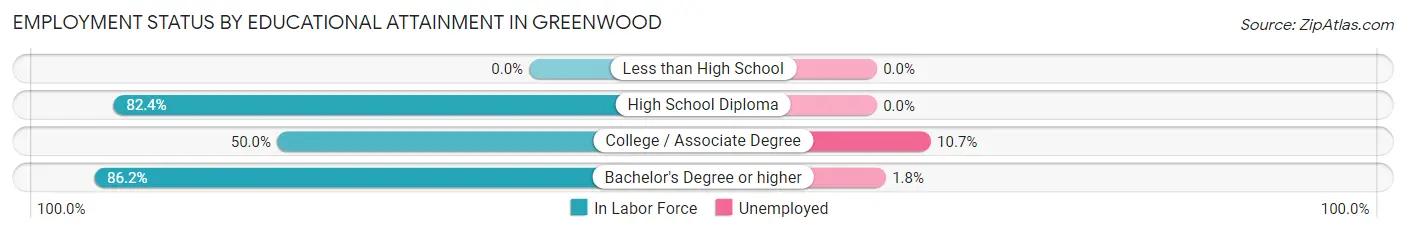
| Educational Attainment | In Labor Force | Unemployed |
| Less than High School | 0 (0.0%) | 0 (0.0%) |
| High School Diploma | 14 (82.4%) | 0 (0.0%) |
| College / Associate Degree | 28 (50.0%) | 6 (10.7%) |
| Bachelor's Degree or higher | 332 (86.2%) | 7 (1.8%) |
| Total | 374 (81.7%) | 11 (2.4%) |
Employment Occupations by Sex in Greenwood
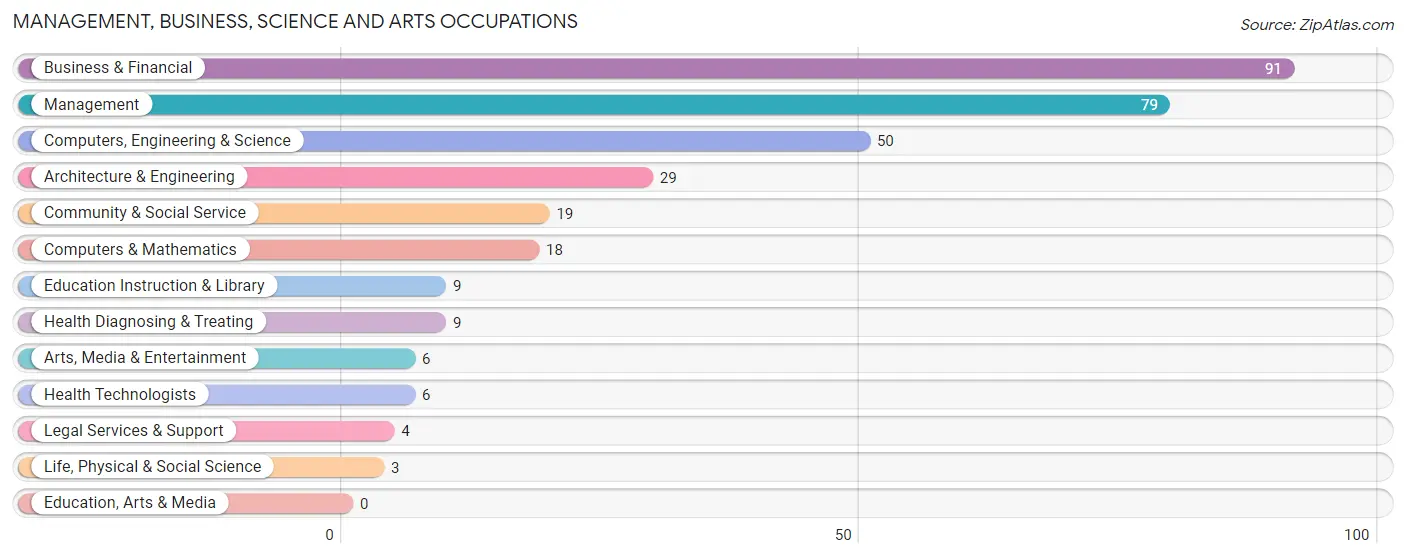
Management, Business, Science and Arts Occupations
The most common Management, Business, Science and Arts occupations in Greenwood are Business & Financial (91 | 22.3%), Management (79 | 19.3%), Computers, Engineering & Science (50 | 12.2%), Architecture & Engineering (29 | 7.1%), and Community & Social Service (19 | 4.6%).
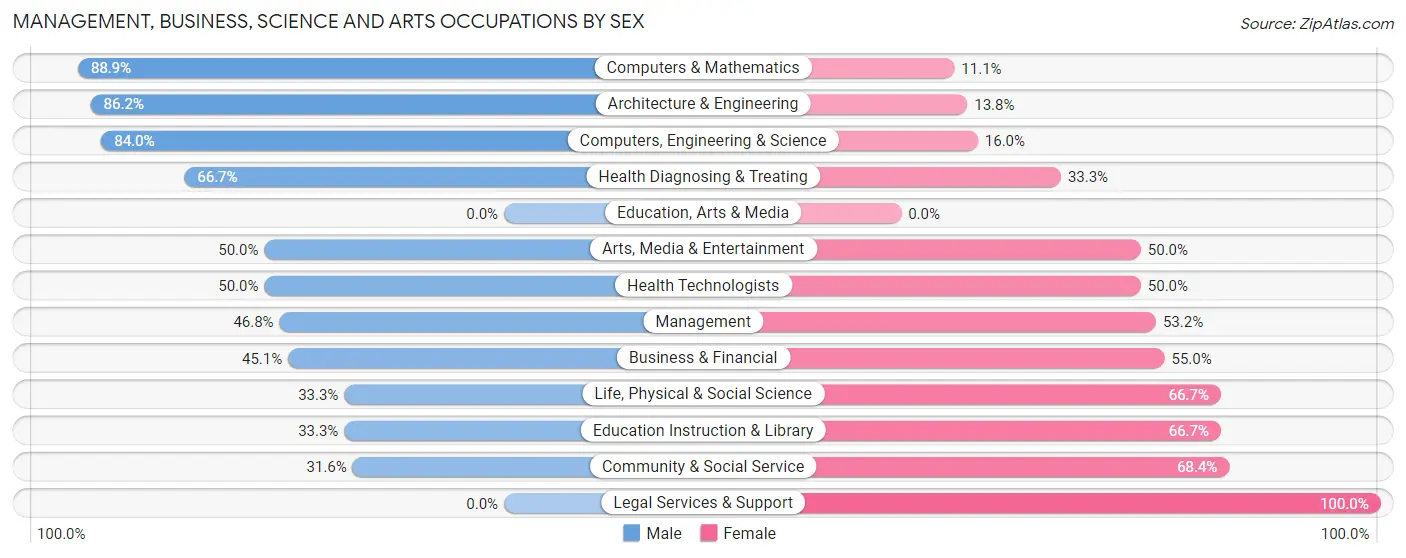
Management, Business, Science and Arts Occupations by Sex
Within the Management, Business, Science and Arts occupations in Greenwood, the most male-oriented occupations are Computers & Mathematics (88.9%), Architecture & Engineering (86.2%), and Computers, Engineering & Science (84.0%), while the most female-oriented occupations are Legal Services & Support (100.0%), Community & Social Service (68.4%), and Life, Physical & Social Science (66.7%).
| Occupation | Male | Female |
| Management | 37 (46.8%) | 42 (53.2%) |
| Business & Financial | 41 (45.1%) | 50 (54.9%) |
| Computers, Engineering & Science | 42 (84.0%) | 8 (16.0%) |
| Computers & Mathematics | 16 (88.9%) | 2 (11.1%) |
| Architecture & Engineering | 25 (86.2%) | 4 (13.8%) |
| Life, Physical & Social Science | 1 (33.3%) | 2 (66.7%) |
| Community & Social Service | 6 (31.6%) | 13 (68.4%) |
| Education, Arts & Media | 0 (0.0%) | 0 (0.0%) |
| Legal Services & Support | 0 (0.0%) | 4 (100.0%) |
| Education Instruction & Library | 3 (33.3%) | 6 (66.7%) |
| Arts, Media & Entertainment | 3 (50.0%) | 3 (50.0%) |
| Health Diagnosing & Treating | 6 (66.7%) | 3 (33.3%) |
| Health Technologists | 3 (50.0%) | 3 (50.0%) |
| Total (Category) | 132 (53.2%) | 116 (46.8%) |
| Total (Overall) | 243 (59.4%) | 166 (40.6%) |
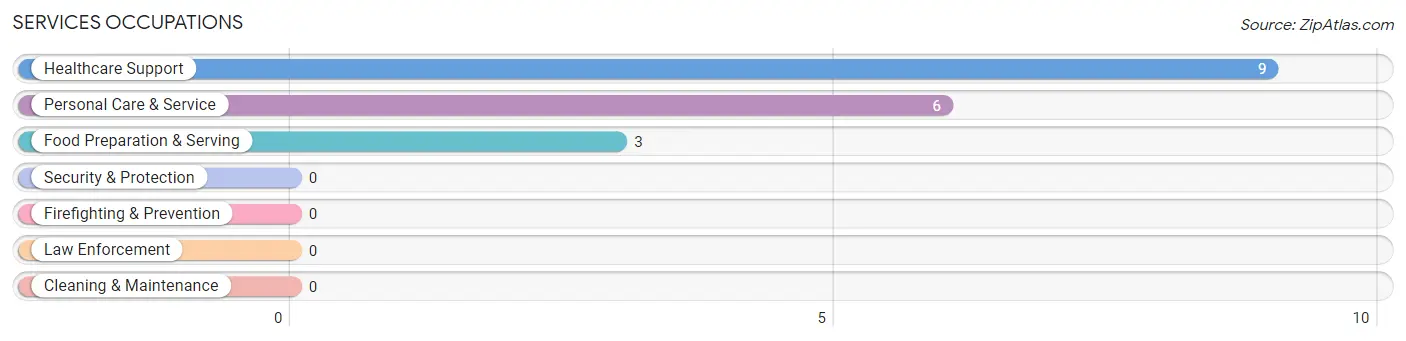
Services Occupations
The most common Services occupations in Greenwood are Healthcare Support (9 | 2.2%), Personal Care & Service (6 | 1.5%), and Food Preparation & Serving (3 | 0.7%).
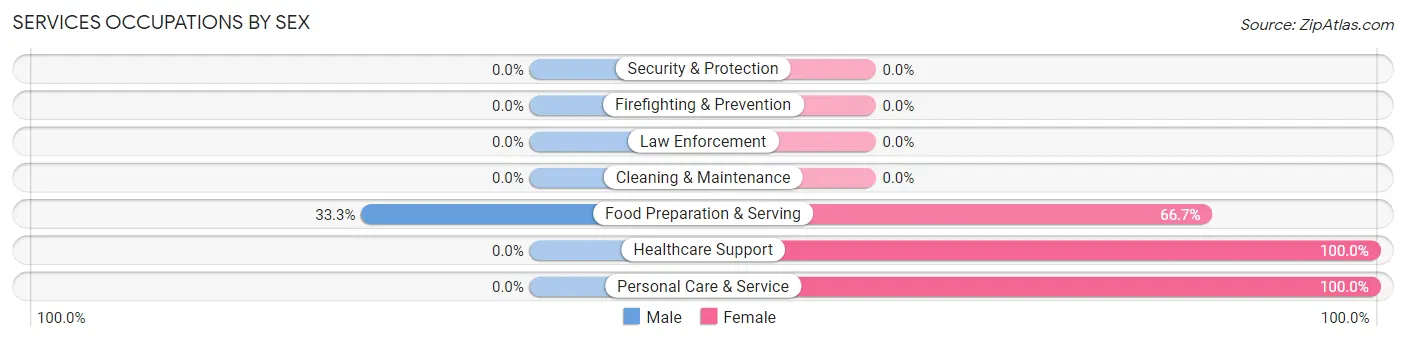
Services Occupations by Sex
| Occupation | Male | Female |
| Healthcare Support | 0 (0.0%) | 9 (100.0%) |
| Security & Protection | 0 (0.0%) | 0 (0.0%) |
| Firefighting & Prevention | 0 (0.0%) | 0 (0.0%) |
| Law Enforcement | 0 (0.0%) | 0 (0.0%) |
| Food Preparation & Serving | 1 (33.3%) | 2 (66.7%) |
| Cleaning & Maintenance | 0 (0.0%) | 0 (0.0%) |
| Personal Care & Service | 0 (0.0%) | 6 (100.0%) |
| Total (Category) | 1 (5.6%) | 17 (94.4%) |
| Total (Overall) | 243 (59.4%) | 166 (40.6%) |
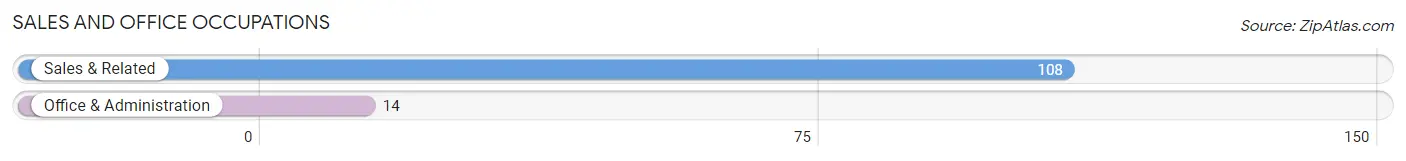
Sales and Office Occupations
The most common Sales and Office occupations in Greenwood are Sales & Related (108 | 26.4%), and Office & Administration (14 | 3.4%).
Sales and Office Occupations by Sex
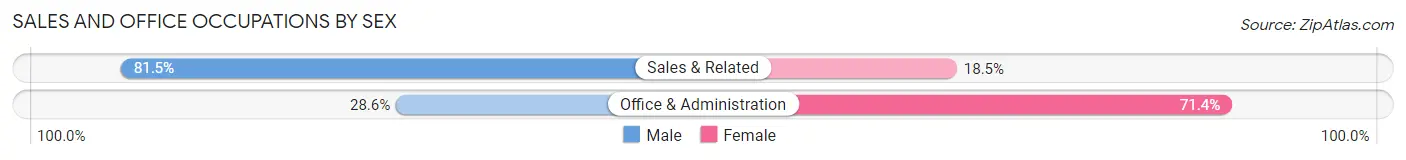
| Occupation | Male | Female |
| Sales & Related | 88 (81.5%) | 20 (18.5%) |
| Office & Administration | 4 (28.6%) | 10 (71.4%) |
| Total (Category) | 92 (75.4%) | 30 (24.6%) |
| Total (Overall) | 243 (59.4%) | 166 (40.6%) |
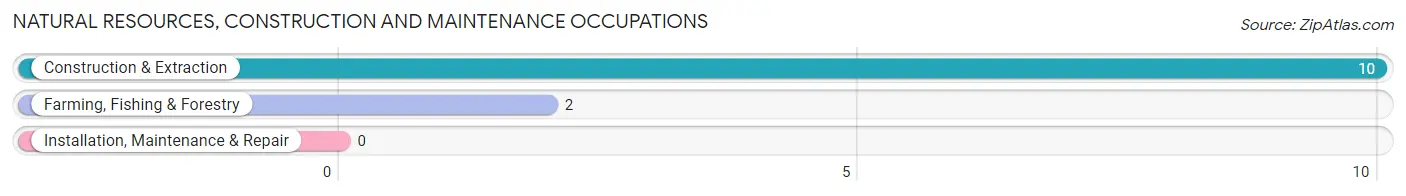
Natural Resources, Construction and Maintenance Occupations
The most common Natural Resources, Construction and Maintenance occupations in Greenwood are Construction & Extraction (10 | 2.4%), and Farming, Fishing & Forestry (2 | 0.5%).
Natural Resources, Construction and Maintenance Occupations by Sex
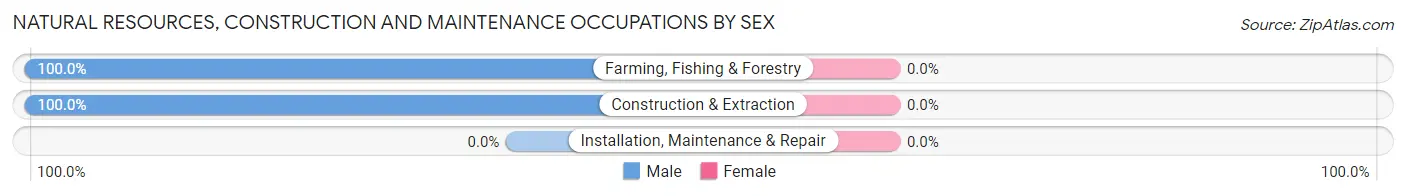
| Occupation | Male | Female |
| Farming, Fishing & Forestry | 2 (100.0%) | 0 (0.0%) |
| Construction & Extraction | 10 (100.0%) | 0 (0.0%) |
| Installation, Maintenance & Repair | 0 (0.0%) | 0 (0.0%) |
| Total (Category) | 12 (100.0%) | 0 (0.0%) |
| Total (Overall) | 243 (59.4%) | 166 (40.6%) |
Production, Transportation and Moving Occupations
The most common Production, Transportation and Moving occupations in Greenwood are , and Production (9 | 2.2%).
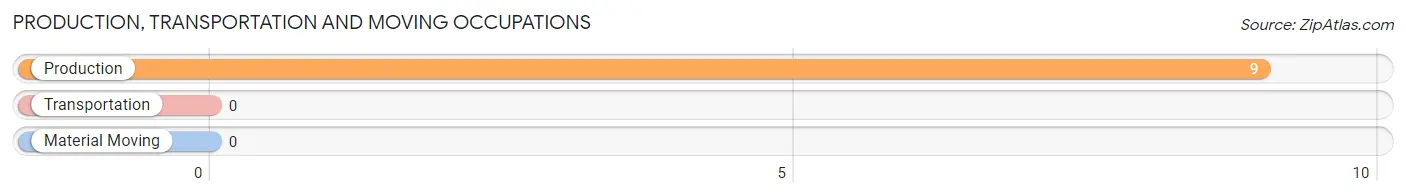
Production, Transportation and Moving Occupations by Sex
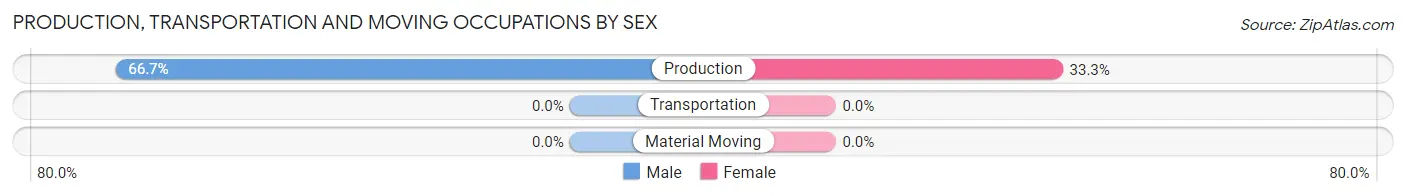
| Occupation | Male | Female |
| Production | 6 (66.7%) | 3 (33.3%) |
| Transportation | 0 (0.0%) | 0 (0.0%) |
| Material Moving | 0 (0.0%) | 0 (0.0%) |
| Total (Category) | 6 (66.7%) | 3 (33.3%) |
| Total (Overall) | 243 (59.4%) | 166 (40.6%) |
Employment Industries by Sex in Greenwood
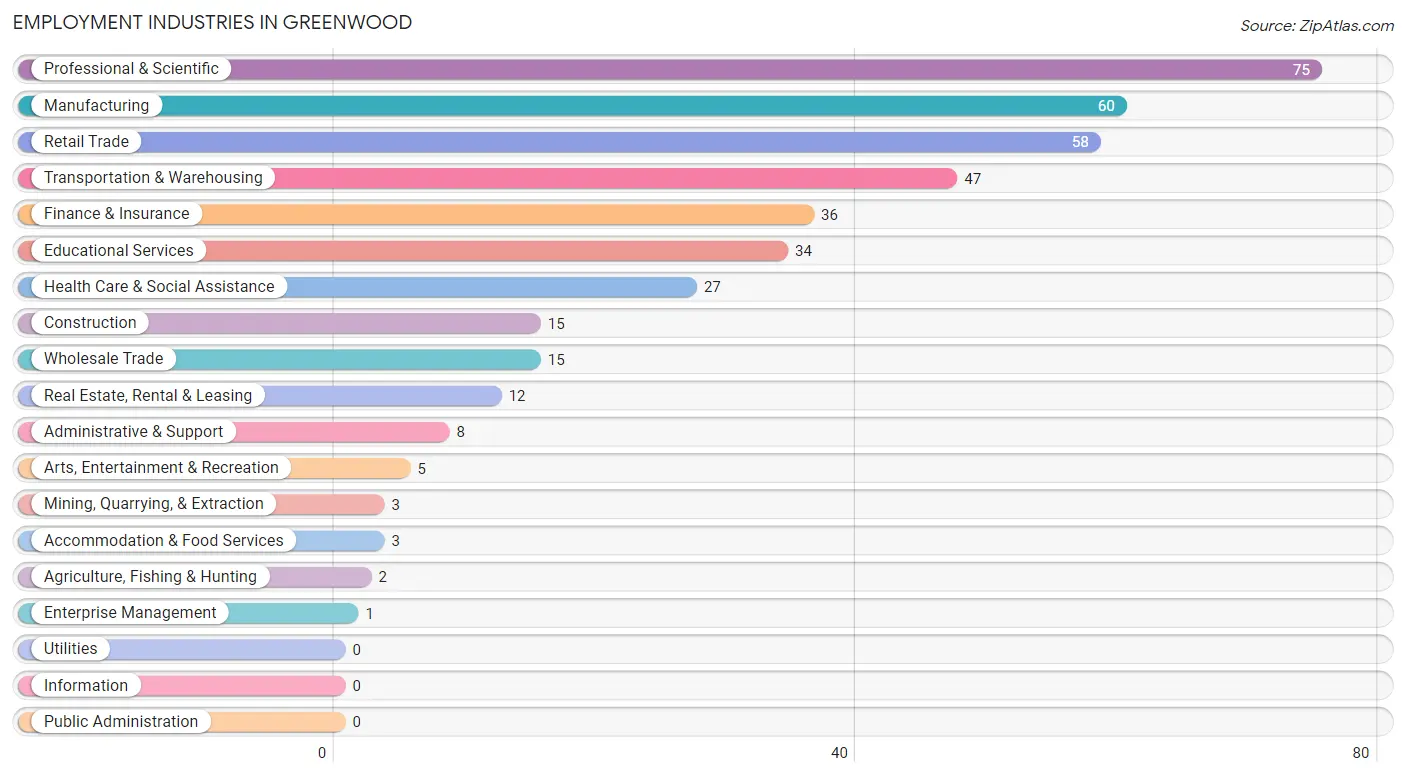
Employment Industries in Greenwood
The major employment industries in Greenwood include Professional & Scientific (75 | 18.3%), Manufacturing (60 | 14.7%), Retail Trade (58 | 14.2%), Transportation & Warehousing (47 | 11.5%), and Finance & Insurance (36 | 8.8%).
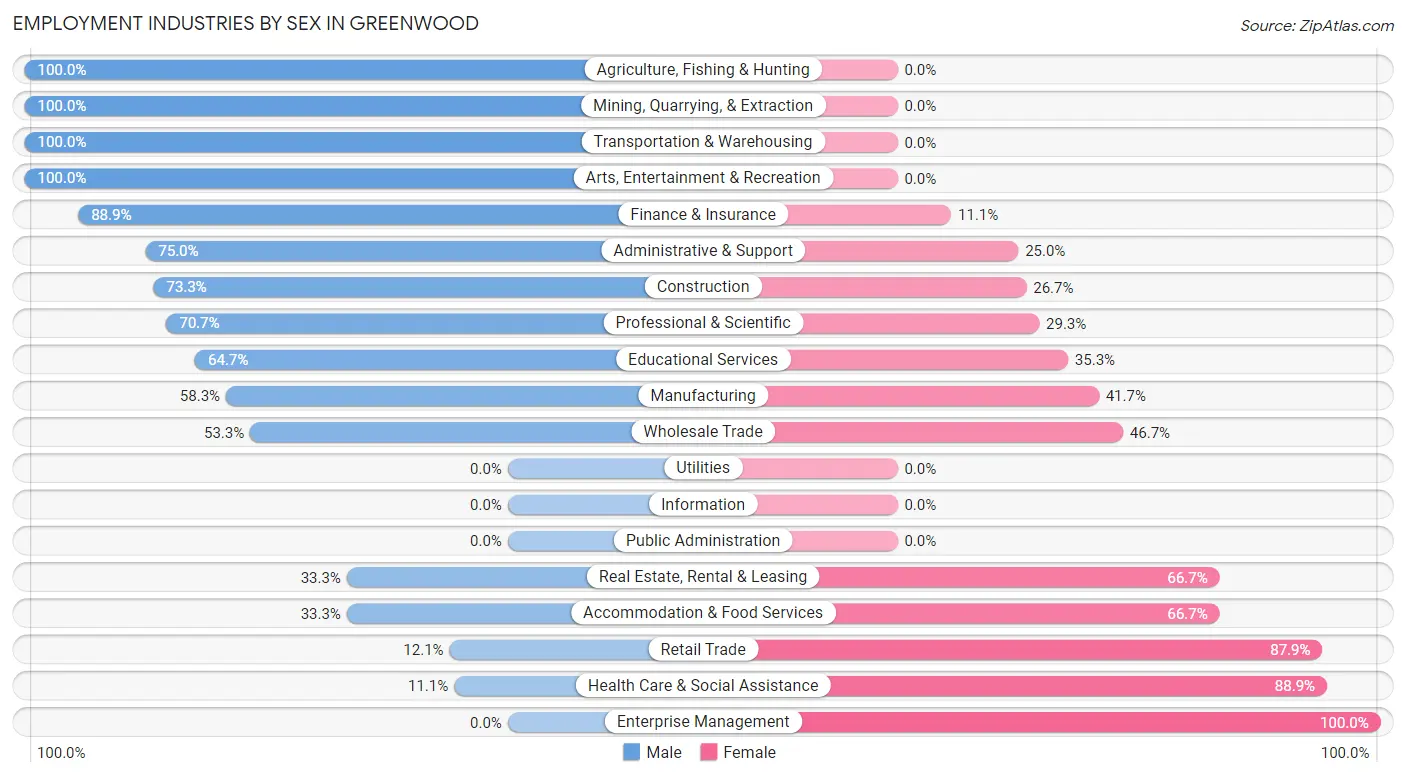
Employment Industries by Sex in Greenwood
The Greenwood industries that see more men than women are Agriculture, Fishing & Hunting (100.0%), Mining, Quarrying, & Extraction (100.0%), and Transportation & Warehousing (100.0%), whereas the industries that tend to have a higher number of women are Enterprise Management (100.0%), Health Care & Social Assistance (88.9%), and Retail Trade (87.9%).
| Industry | Male | Female |
| Agriculture, Fishing & Hunting | 2 (100.0%) | 0 (0.0%) |
| Mining, Quarrying, & Extraction | 3 (100.0%) | 0 (0.0%) |
| Construction | 11 (73.3%) | 4 (26.7%) |
| Manufacturing | 35 (58.3%) | 25 (41.7%) |
| Wholesale Trade | 8 (53.3%) | 7 (46.7%) |
| Retail Trade | 7 (12.1%) | 51 (87.9%) |
| Transportation & Warehousing | 47 (100.0%) | 0 (0.0%) |
| Utilities | 0 (0.0%) | 0 (0.0%) |
| Information | 0 (0.0%) | 0 (0.0%) |
| Finance & Insurance | 32 (88.9%) | 4 (11.1%) |
| Real Estate, Rental & Leasing | 4 (33.3%) | 8 (66.7%) |
| Professional & Scientific | 53 (70.7%) | 22 (29.3%) |
| Enterprise Management | 0 (0.0%) | 1 (100.0%) |
| Administrative & Support | 6 (75.0%) | 2 (25.0%) |
| Educational Services | 22 (64.7%) | 12 (35.3%) |
| Health Care & Social Assistance | 3 (11.1%) | 24 (88.9%) |
| Arts, Entertainment & Recreation | 5 (100.0%) | 0 (0.0%) |
| Accommodation & Food Services | 1 (33.3%) | 2 (66.7%) |
| Public Administration | 0 (0.0%) | 0 (0.0%) |
| Total | 243 (59.4%) | 166 (40.6%) |
Education in Greenwood
School Enrollment in Greenwood
The most common levels of schooling among the 124 students in Greenwood are elementary school (44 | 35.5%), middle school (27 | 21.8%), and high school (26 | 21.0%).
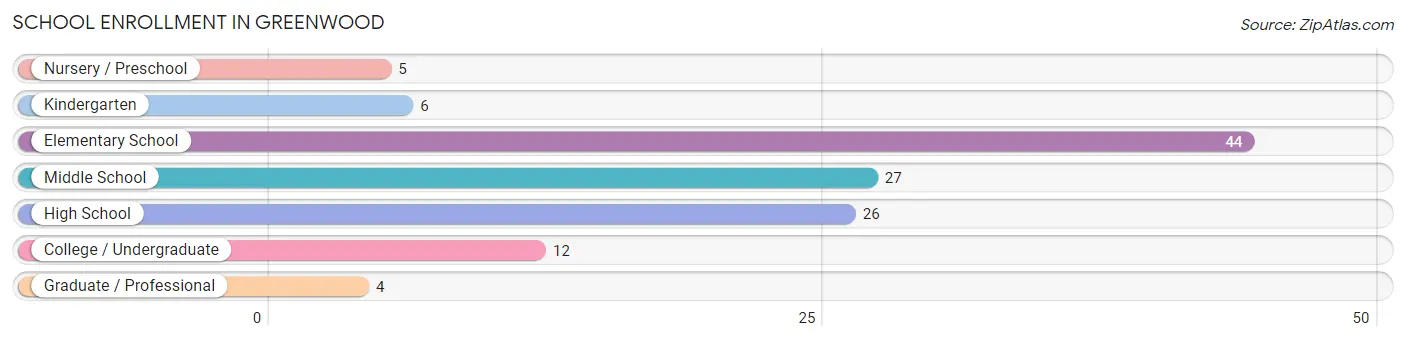
| School Level | # Students | % Students |
| Nursery / Preschool | 5 | 4.0% |
| Kindergarten | 6 | 4.8% |
| Elementary School | 44 | 35.5% |
| Middle School | 27 | 21.8% |
| High School | 26 | 21.0% |
| College / Undergraduate | 12 | 9.7% |
| Graduate / Professional | 4 | 3.2% |
| Total | 124 | 100.0% |
School Enrollment by Age by Funding Source in Greenwood
Out of a total of 124 students who are enrolled in schools in Greenwood, 16 (12.9%) attend a private institution, while the remaining 108 (87.1%) are enrolled in public schools. The age group of 18 to 19 year olds has the highest likelihood of being enrolled in private schools, with 4 (100.0% in the age bracket) enrolled. Conversely, the age group of 5 to 9 year old has the lowest likelihood of being enrolled in a private school, with 34 (100.0% in the age bracket) attending a public institution.
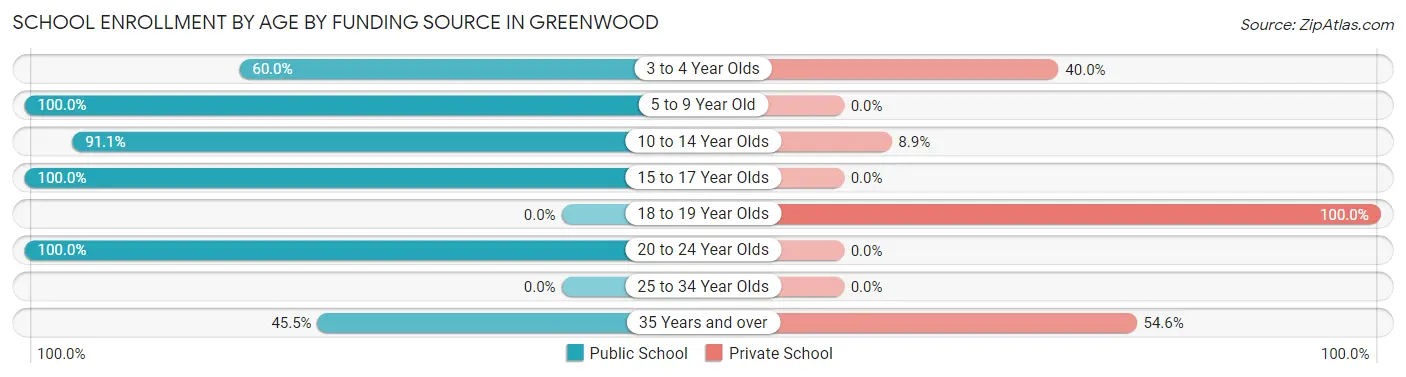
| Age Bracket | Public School | Private School |
| 3 to 4 Year Olds | 3 (60.0%) | 2 (40.0%) |
| 5 to 9 Year Old | 34 (100.0%) | 0 (0.0%) |
| 10 to 14 Year Olds | 41 (91.1%) | 4 (8.9%) |
| 15 to 17 Year Olds | 22 (100.0%) | 0 (0.0%) |
| 18 to 19 Year Olds | 0 (0.0%) | 4 (100.0%) |
| 20 to 24 Year Olds | 3 (100.0%) | 0 (0.0%) |
| 25 to 34 Year Olds | 0 (0.0%) | 0 (0.0%) |
| 35 Years and over | 5 (45.5%) | 6 (54.5%) |
| Total | 108 (87.1%) | 16 (12.9%) |
Educational Attainment by Field of Study in Greenwood
Business (171 | 33.5%), engineering (68 | 13.3%), social sciences (53 | 10.4%), bio, nature & agricultural (33 | 6.5%), and science & technology (33 | 6.5%) are the most common fields of study among 510 individuals in Greenwood who have obtained a bachelor's degree or higher.
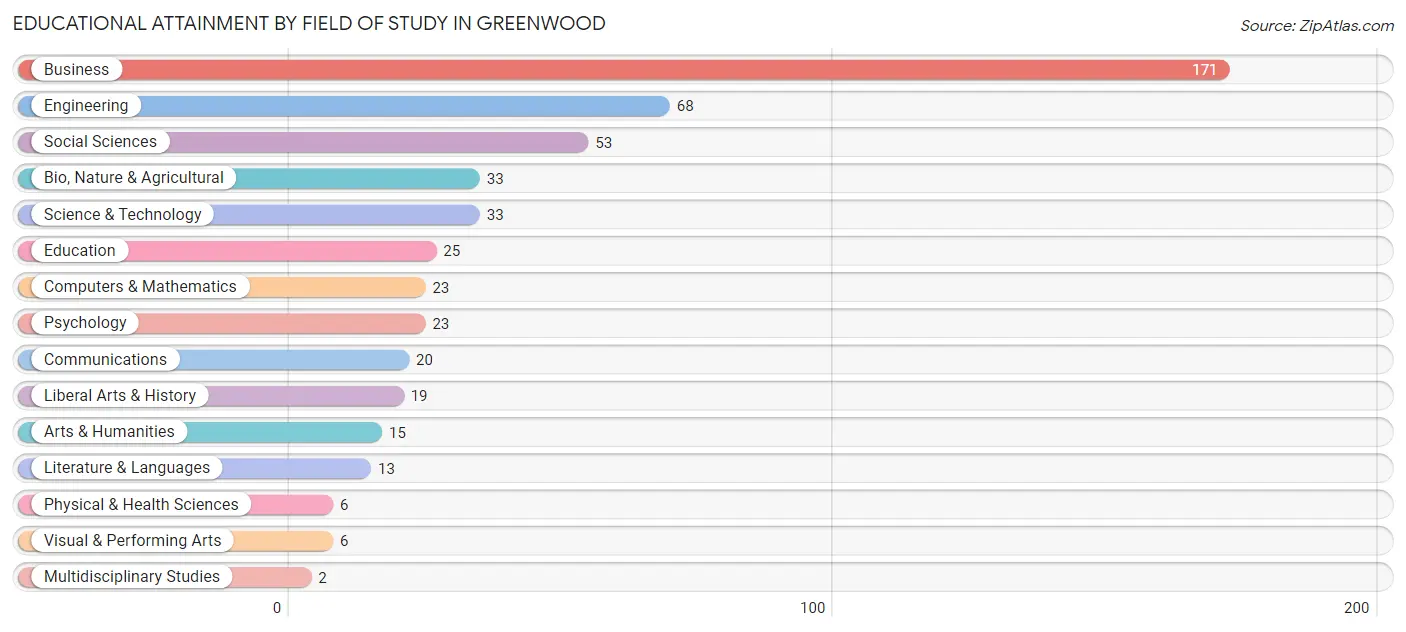
| Field of Study | # Graduates | % Graduates |
| Computers & Mathematics | 23 | 4.5% |
| Bio, Nature & Agricultural | 33 | 6.5% |
| Physical & Health Sciences | 6 | 1.2% |
| Psychology | 23 | 4.5% |
| Social Sciences | 53 | 10.4% |
| Engineering | 68 | 13.3% |
| Multidisciplinary Studies | 2 | 0.4% |
| Science & Technology | 33 | 6.5% |
| Business | 171 | 33.5% |
| Education | 25 | 4.9% |
| Literature & Languages | 13 | 2.5% |
| Liberal Arts & History | 19 | 3.7% |
| Visual & Performing Arts | 6 | 1.2% |
| Communications | 20 | 3.9% |
| Arts & Humanities | 15 | 2.9% |
| Total | 510 | 100.0% |
Transportation & Commute in Greenwood
Vehicle Availability by Sex in Greenwood
The most prevalent vehicle ownership categories in Greenwood are males with 2 vehicles (86, accounting for 35.4%) and females with 2 vehicles (64, making up 52.4%).
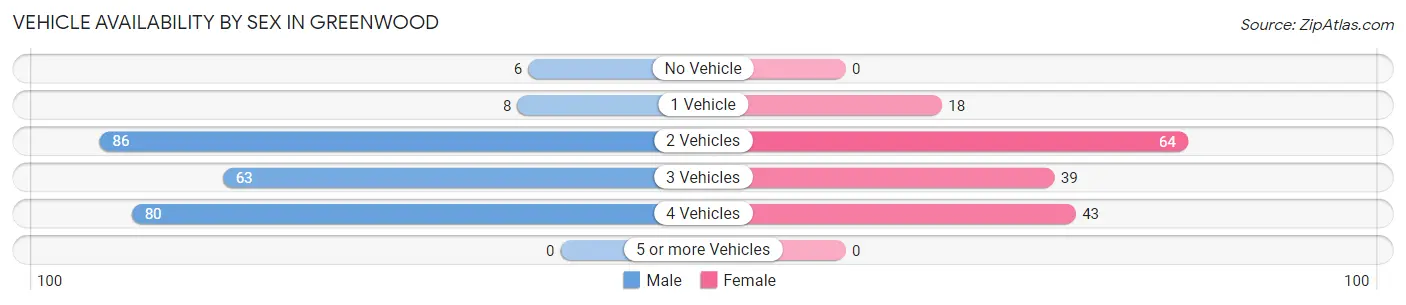
| Vehicles Available | Male | Female |
| No Vehicle | 6 (2.5%) | 0 (0.0%) |
| 1 Vehicle | 8 (3.3%) | 18 (11.0%) |
| 2 Vehicles | 86 (35.4%) | 64 (39.0%) |
| 3 Vehicles | 63 (25.9%) | 39 (23.8%) |
| 4 Vehicles | 80 (32.9%) | 43 (26.2%) |
| 5 or more Vehicles | 0 (0.0%) | 0 (0.0%) |
| Total | 243 (100.0%) | 164 (100.0%) |
Commute Time in Greenwood
The most frequently occuring commute durations in Greenwood are 20 to 24 minutes (49 commuters, 21.1%), 30 to 34 minutes (37 commuters, 16.0%), and 45 to 59 minutes (33 commuters, 14.2%).
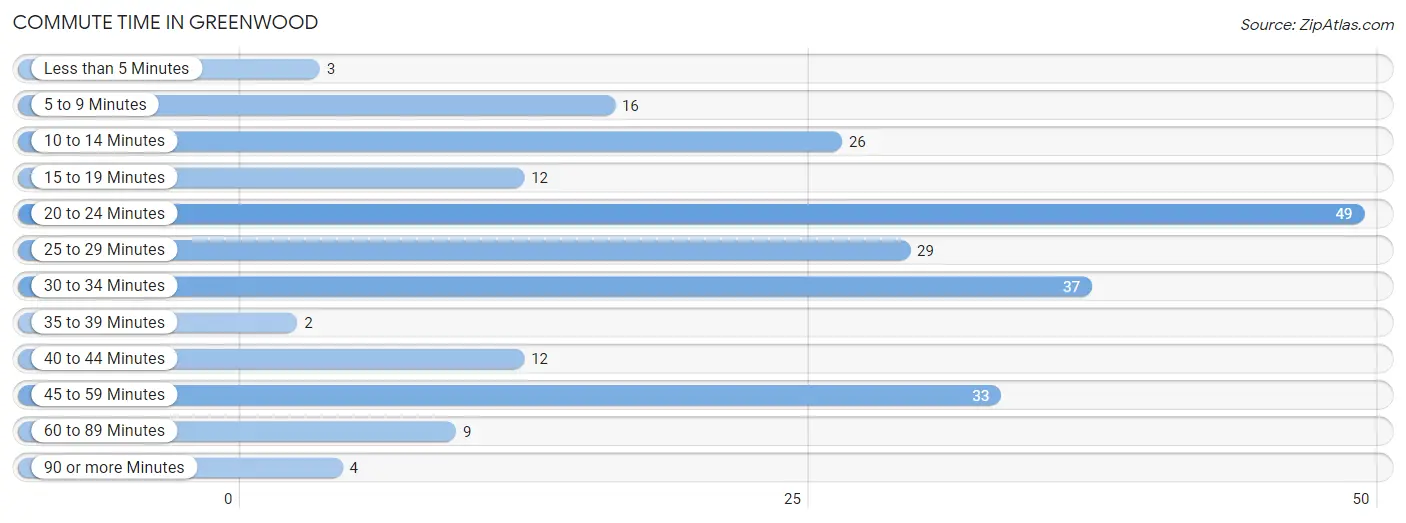
| Commute Time | # Commuters | % Commuters |
| Less than 5 Minutes | 3 | 1.3% |
| 5 to 9 Minutes | 16 | 6.9% |
| 10 to 14 Minutes | 26 | 11.2% |
| 15 to 19 Minutes | 12 | 5.2% |
| 20 to 24 Minutes | 49 | 21.1% |
| 25 to 29 Minutes | 29 | 12.5% |
| 30 to 34 Minutes | 37 | 16.0% |
| 35 to 39 Minutes | 2 | 0.9% |
| 40 to 44 Minutes | 12 | 5.2% |
| 45 to 59 Minutes | 33 | 14.2% |
| 60 to 89 Minutes | 9 | 3.9% |
| 90 or more Minutes | 4 | 1.7% |
Commute Time by Sex in Greenwood
The most common commute times in Greenwood are 20 to 24 minutes (26 commuters, 19.3%) for males and 20 to 24 minutes (23 commuters, 23.7%) for females.
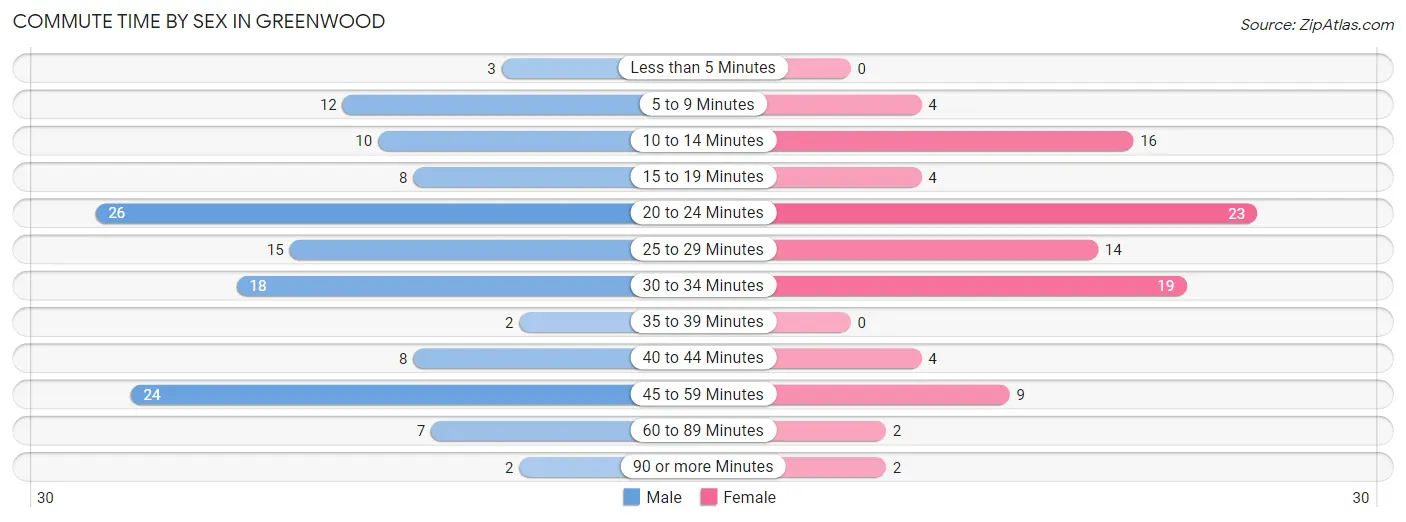
| Commute Time | Male | Female |
| Less than 5 Minutes | 3 (2.2%) | 0 (0.0%) |
| 5 to 9 Minutes | 12 (8.9%) | 4 (4.1%) |
| 10 to 14 Minutes | 10 (7.4%) | 16 (16.5%) |
| 15 to 19 Minutes | 8 (5.9%) | 4 (4.1%) |
| 20 to 24 Minutes | 26 (19.3%) | 23 (23.7%) |
| 25 to 29 Minutes | 15 (11.1%) | 14 (14.4%) |
| 30 to 34 Minutes | 18 (13.3%) | 19 (19.6%) |
| 35 to 39 Minutes | 2 (1.5%) | 0 (0.0%) |
| 40 to 44 Minutes | 8 (5.9%) | 4 (4.1%) |
| 45 to 59 Minutes | 24 (17.8%) | 9 (9.3%) |
| 60 to 89 Minutes | 7 (5.2%) | 2 (2.1%) |
| 90 or more Minutes | 2 (1.5%) | 2 (2.1%) |
Time of Departure to Work by Sex in Greenwood
The most frequent times of departure to work in Greenwood are 7:00 AM to 7:29 AM (44, 32.6%) for males and 7:00 AM to 7:29 AM (38, 39.2%) for females.
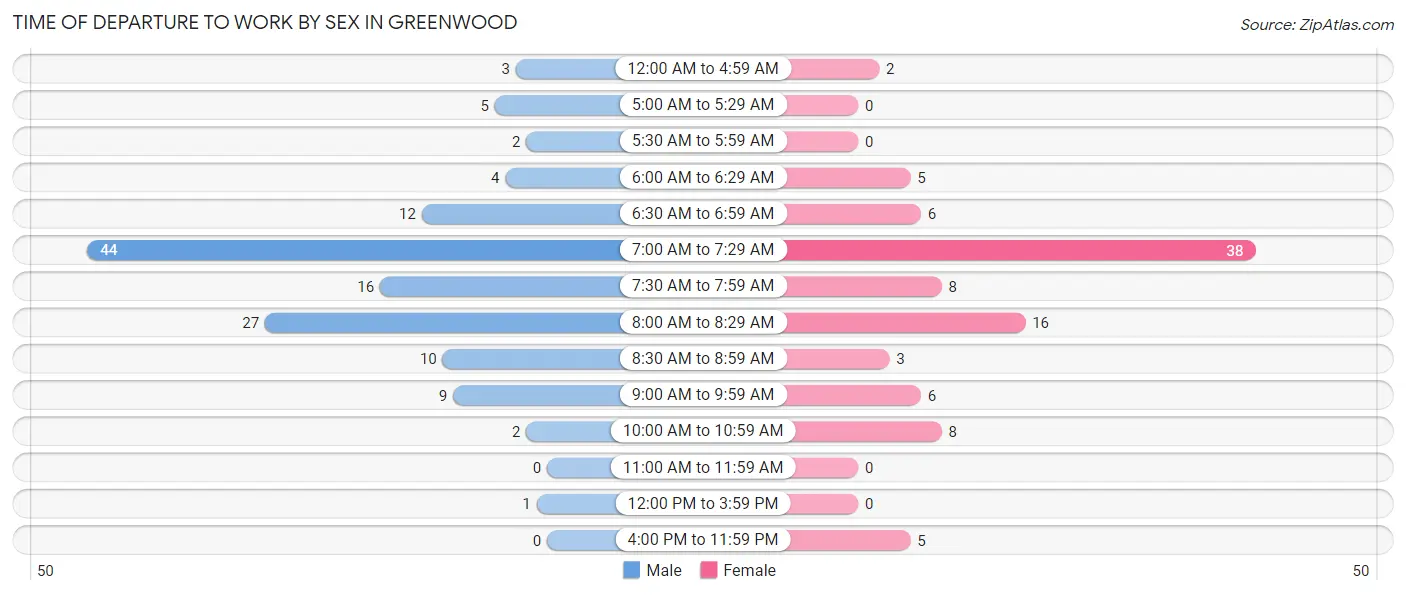
| Time of Departure | Male | Female |
| 12:00 AM to 4:59 AM | 3 (2.2%) | 2 (2.1%) |
| 5:00 AM to 5:29 AM | 5 (3.7%) | 0 (0.0%) |
| 5:30 AM to 5:59 AM | 2 (1.5%) | 0 (0.0%) |
| 6:00 AM to 6:29 AM | 4 (3.0%) | 5 (5.1%) |
| 6:30 AM to 6:59 AM | 12 (8.9%) | 6 (6.2%) |
| 7:00 AM to 7:29 AM | 44 (32.6%) | 38 (39.2%) |
| 7:30 AM to 7:59 AM | 16 (11.8%) | 8 (8.3%) |
| 8:00 AM to 8:29 AM | 27 (20.0%) | 16 (16.5%) |
| 8:30 AM to 8:59 AM | 10 (7.4%) | 3 (3.1%) |
| 9:00 AM to 9:59 AM | 9 (6.7%) | 6 (6.2%) |
| 10:00 AM to 10:59 AM | 2 (1.5%) | 8 (8.3%) |
| 11:00 AM to 11:59 AM | 0 (0.0%) | 0 (0.0%) |
| 12:00 PM to 3:59 PM | 1 (0.7%) | 0 (0.0%) |
| 4:00 PM to 11:59 PM | 0 (0.0%) | 5 (5.1%) |
| Total | 135 (100.0%) | 97 (100.0%) |
Housing Occupancy in Greenwood
Occupancy by Ownership in Greenwood
Of the total 276 dwellings in Greenwood, owner-occupied units account for 252 (91.3%), while renter-occupied units make up 24 (8.7%).
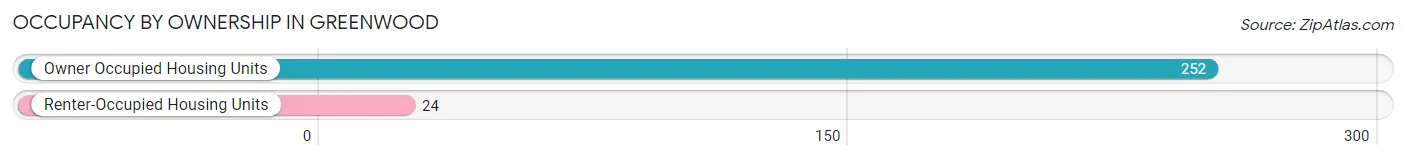
| Occupancy | # Housing Units | % Housing Units |
| Owner Occupied Housing Units | 252 | 91.3% |
| Renter-Occupied Housing Units | 24 | 8.7% |
| Total Occupied Housing Units | 276 | 100.0% |
Occupancy by Household Size in Greenwood
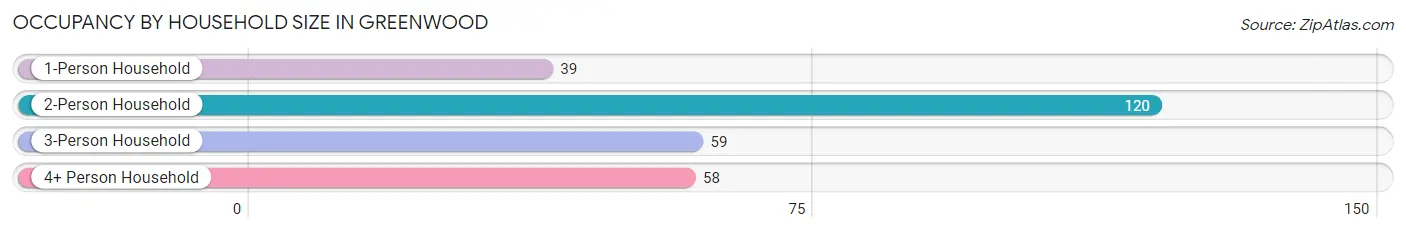
| Household Size | # Housing Units | % Housing Units |
| 1-Person Household | 39 | 14.1% |
| 2-Person Household | 120 | 43.5% |
| 3-Person Household | 59 | 21.4% |
| 4+ Person Household | 58 | 21.0% |
| Total Housing Units | 276 | 100.0% |
Occupancy by Ownership by Household Size in Greenwood
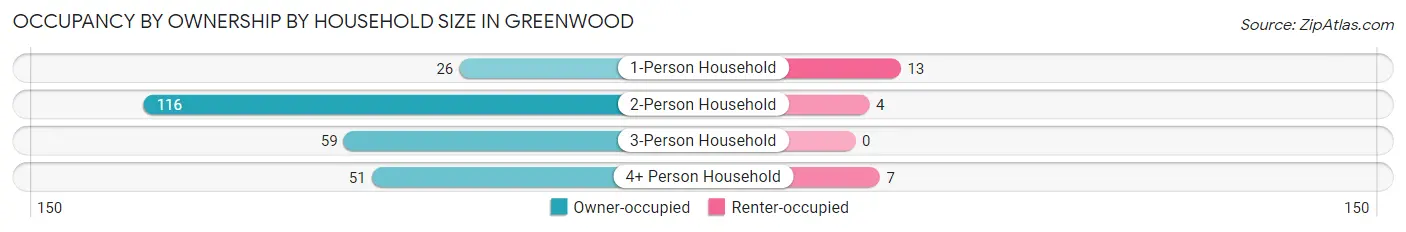
| Household Size | Owner-occupied | Renter-occupied |
| 1-Person Household | 26 (66.7%) | 13 (33.3%) |
| 2-Person Household | 116 (96.7%) | 4 (3.3%) |
| 3-Person Household | 59 (100.0%) | 0 (0.0%) |
| 4+ Person Household | 51 (87.9%) | 7 (12.1%) |
| Total Housing Units | 252 (91.3%) | 24 (8.7%) |
Occupancy by Educational Attainment in Greenwood
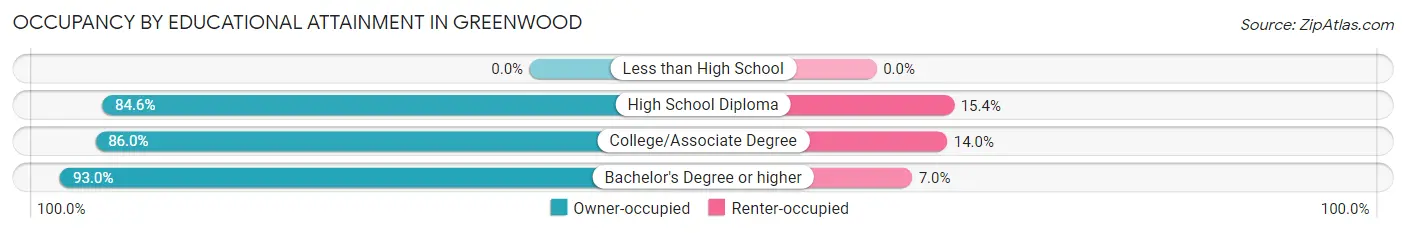
| Household Size | Owner-occupied | Renter-occupied |
| Less than High School | 0 (0.0%) | 0 (0.0%) |
| High School Diploma | 11 (84.6%) | 2 (15.4%) |
| College/Associate Degree | 43 (86.0%) | 7 (14.0%) |
| Bachelor's Degree or higher | 198 (93.0%) | 15 (7.0%) |
Occupancy by Age of Householder in Greenwood
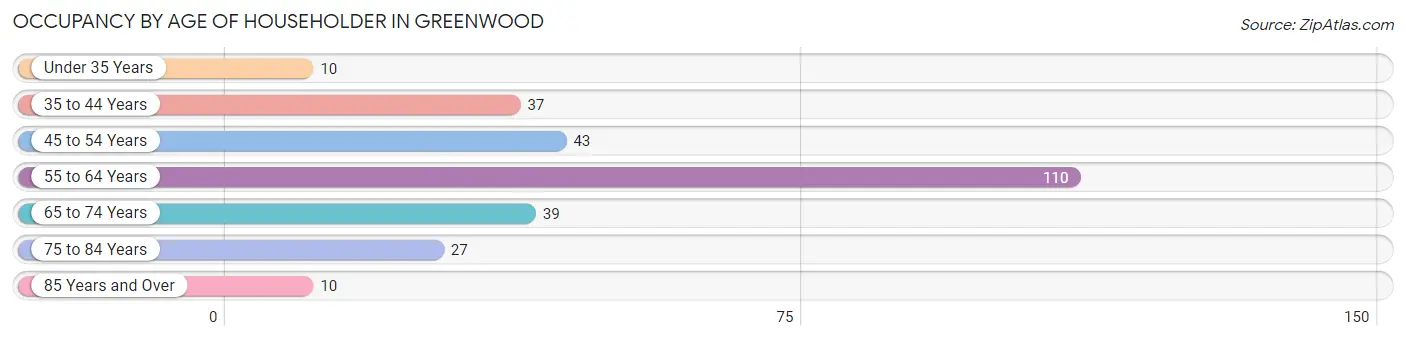
| Age Bracket | # Households | % Households |
| Under 35 Years | 10 | 3.6% |
| 35 to 44 Years | 37 | 13.4% |
| 45 to 54 Years | 43 | 15.6% |
| 55 to 64 Years | 110 | 39.9% |
| 65 to 74 Years | 39 | 14.1% |
| 75 to 84 Years | 27 | 9.8% |
| 85 Years and Over | 10 | 3.6% |
| Total | 276 | 100.0% |
Housing Finances in Greenwood
Median Income by Occupancy in Greenwood
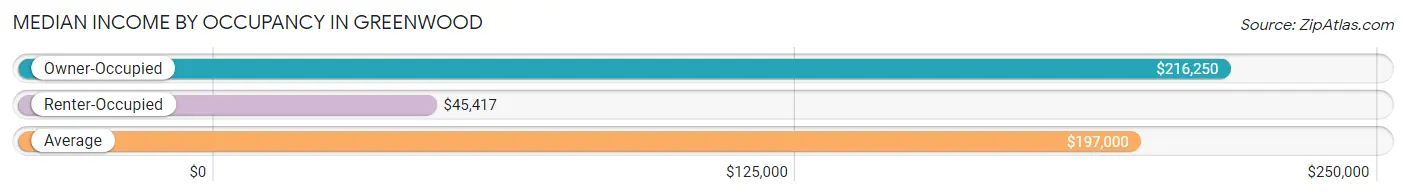
| Occupancy Type | # Households | Median Income |
| Owner-Occupied | 252 (91.3%) | $216,250 |
| Renter-Occupied | 24 (8.7%) | $45,417 |
| Average | 276 (100.0%) | $197,000 |
Occupancy by Householder Income Bracket in Greenwood
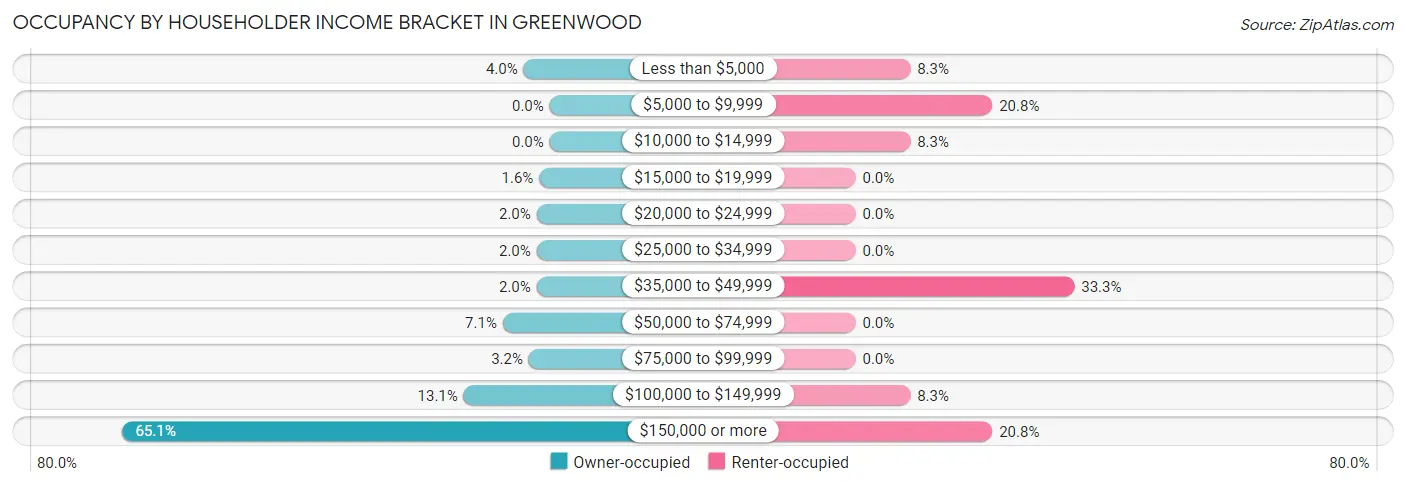
| Income Bracket | Owner-occupied | Renter-occupied |
| Less than $5,000 | 10 (4.0%) | 2 (8.3%) |
| $5,000 to $9,999 | 0 (0.0%) | 5 (20.8%) |
| $10,000 to $14,999 | 0 (0.0%) | 2 (8.3%) |
| $15,000 to $19,999 | 4 (1.6%) | 0 (0.0%) |
| $20,000 to $24,999 | 5 (2.0%) | 0 (0.0%) |
| $25,000 to $34,999 | 5 (2.0%) | 0 (0.0%) |
| $35,000 to $49,999 | 5 (2.0%) | 8 (33.3%) |
| $50,000 to $74,999 | 18 (7.1%) | 0 (0.0%) |
| $75,000 to $99,999 | 8 (3.2%) | 0 (0.0%) |
| $100,000 to $149,999 | 33 (13.1%) | 2 (8.3%) |
| $150,000 or more | 164 (65.1%) | 5 (20.8%) |
| Total | 252 (100.0%) | 24 (100.0%) |
Monthly Housing Cost Tiers in Greenwood
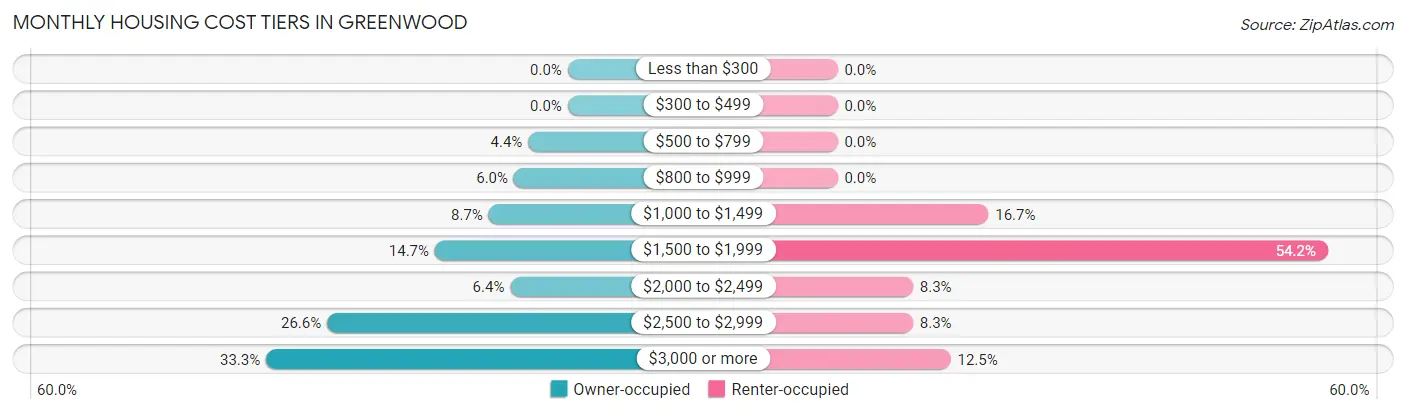
| Monthly Cost | Owner-occupied | Renter-occupied |
| Less than $300 | 0 (0.0%) | 0 (0.0%) |
| $300 to $499 | 0 (0.0%) | 0 (0.0%) |
| $500 to $799 | 11 (4.4%) | 0 (0.0%) |
| $800 to $999 | 15 (5.9%) | 0 (0.0%) |
| $1,000 to $1,499 | 22 (8.7%) | 4 (16.7%) |
| $1,500 to $1,999 | 37 (14.7%) | 13 (54.2%) |
| $2,000 to $2,499 | 16 (6.4%) | 2 (8.3%) |
| $2,500 to $2,999 | 67 (26.6%) | 2 (8.3%) |
| $3,000 or more | 84 (33.3%) | 3 (12.5%) |
| Total | 252 (100.0%) | 24 (100.0%) |
Physical Housing Characteristics in Greenwood
Housing Structures in Greenwood
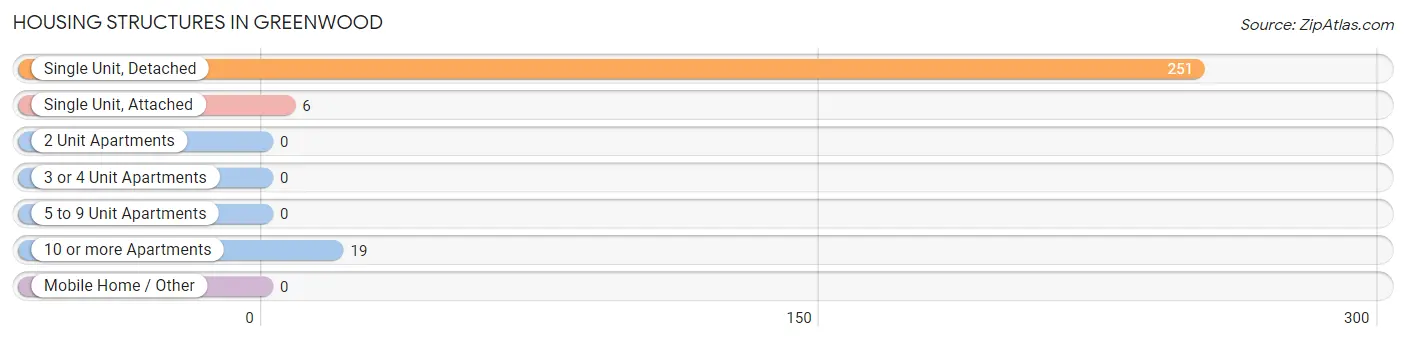
| Structure Type | # Housing Units | % Housing Units |
| Single Unit, Detached | 251 | 90.9% |
| Single Unit, Attached | 6 | 2.2% |
| 2 Unit Apartments | 0 | 0.0% |
| 3 or 4 Unit Apartments | 0 | 0.0% |
| 5 to 9 Unit Apartments | 0 | 0.0% |
| 10 or more Apartments | 19 | 6.9% |
| Mobile Home / Other | 0 | 0.0% |
| Total | 276 | 100.0% |
Housing Structures by Occupancy in Greenwood
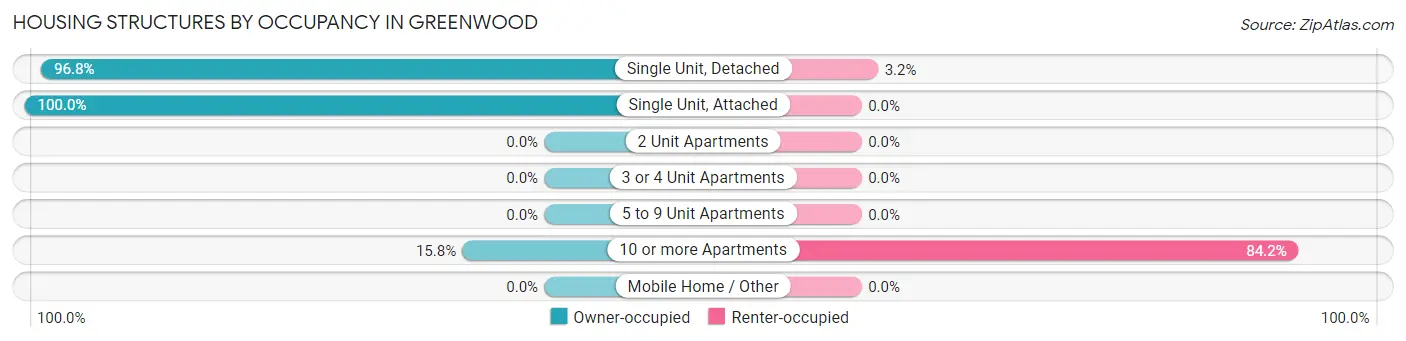
| Structure Type | Owner-occupied | Renter-occupied |
| Single Unit, Detached | 243 (96.8%) | 8 (3.2%) |
| Single Unit, Attached | 6 (100.0%) | 0 (0.0%) |
| 2 Unit Apartments | 0 (0.0%) | 0 (0.0%) |
| 3 or 4 Unit Apartments | 0 (0.0%) | 0 (0.0%) |
| 5 to 9 Unit Apartments | 0 (0.0%) | 0 (0.0%) |
| 10 or more Apartments | 3 (15.8%) | 16 (84.2%) |
| Mobile Home / Other | 0 (0.0%) | 0 (0.0%) |
| Total | 252 (91.3%) | 24 (8.7%) |
Housing Structures by Number of Rooms in Greenwood
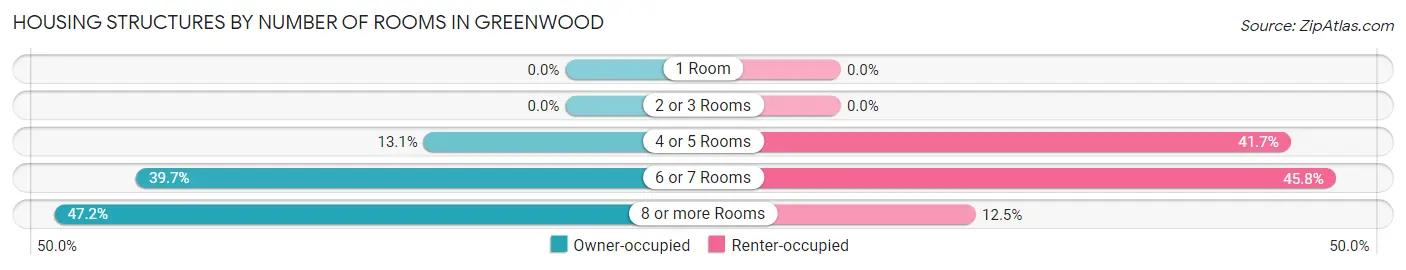
| Number of Rooms | Owner-occupied | Renter-occupied |
| 1 Room | 0 (0.0%) | 0 (0.0%) |
| 2 or 3 Rooms | 0 (0.0%) | 0 (0.0%) |
| 4 or 5 Rooms | 33 (13.1%) | 10 (41.7%) |
| 6 or 7 Rooms | 100 (39.7%) | 11 (45.8%) |
| 8 or more Rooms | 119 (47.2%) | 3 (12.5%) |
| Total | 252 (100.0%) | 24 (100.0%) |
Housing Structure by Heating Type in Greenwood
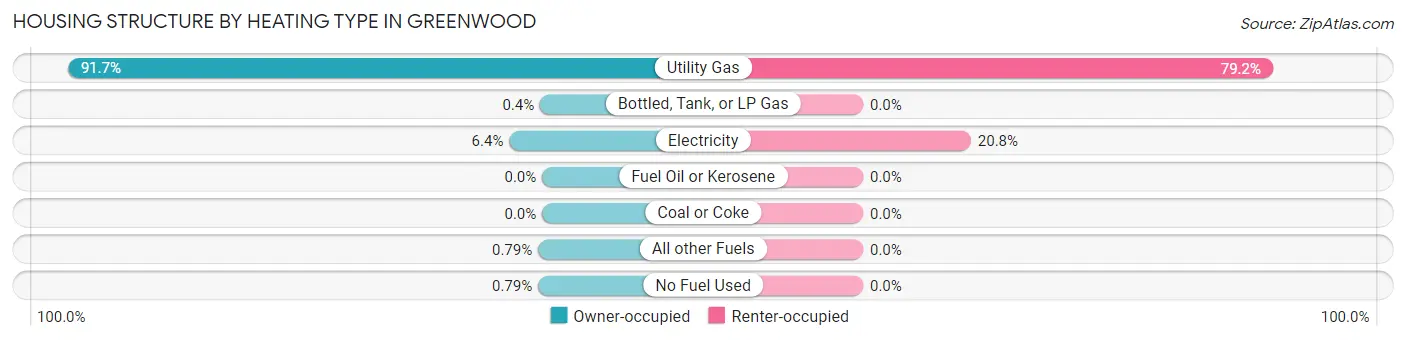
| Heating Type | Owner-occupied | Renter-occupied |
| Utility Gas | 231 (91.7%) | 19 (79.2%) |
| Bottled, Tank, or LP Gas | 1 (0.4%) | 0 (0.0%) |
| Electricity | 16 (6.4%) | 5 (20.8%) |
| Fuel Oil or Kerosene | 0 (0.0%) | 0 (0.0%) |
| Coal or Coke | 0 (0.0%) | 0 (0.0%) |
| All other Fuels | 2 (0.8%) | 0 (0.0%) |
| No Fuel Used | 2 (0.8%) | 0 (0.0%) |
| Total | 252 (100.0%) | 24 (100.0%) |
Household Vehicle Usage in Greenwood
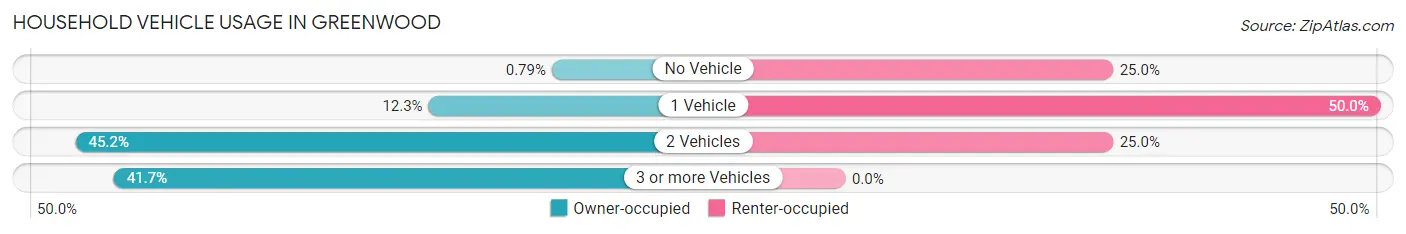
| Vehicles per Household | Owner-occupied | Renter-occupied |
| No Vehicle | 2 (0.8%) | 6 (25.0%) |
| 1 Vehicle | 31 (12.3%) | 12 (50.0%) |
| 2 Vehicles | 114 (45.2%) | 6 (25.0%) |
| 3 or more Vehicles | 105 (41.7%) | 0 (0.0%) |
| Total | 252 (100.0%) | 24 (100.0%) |
Real Estate & Mortgages in Greenwood
Real Estate and Mortgage Overview in Greenwood
| Characteristic | Without Mortgage | With Mortgage |
| Housing Units | 88 | 164 |
| Median Property Value | $1,159,100 | $1,027,800 |
| Median Household Income | $178,125 | $114 |
| Monthly Housing Costs | $1,501 | $71 |
| Real Estate Taxes | $10,001 | $0 |
Property Value by Mortgage Status in Greenwood
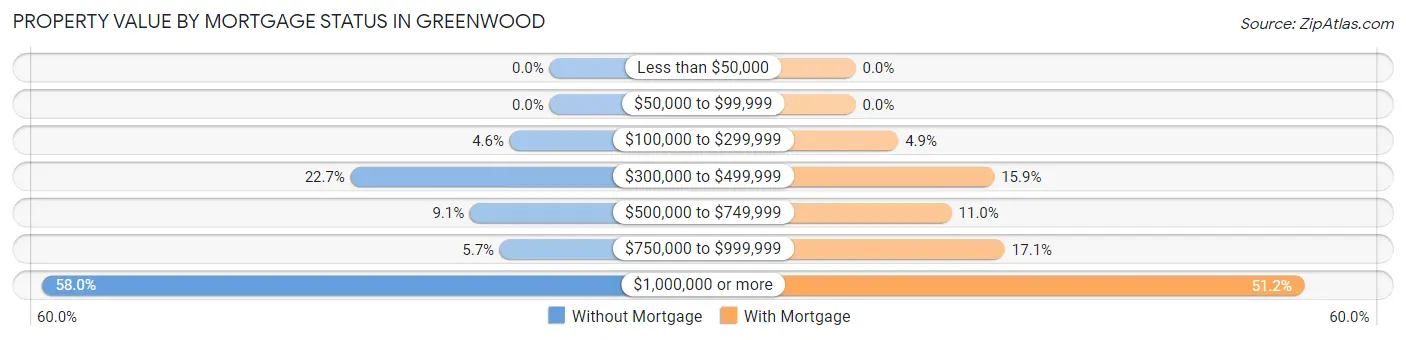
| Property Value | Without Mortgage | With Mortgage |
| Less than $50,000 | 0 (0.0%) | 0 (0.0%) |
| $50,000 to $99,999 | 0 (0.0%) | 0 (0.0%) |
| $100,000 to $299,999 | 4 (4.5%) | 8 (4.9%) |
| $300,000 to $499,999 | 20 (22.7%) | 26 (15.9%) |
| $500,000 to $749,999 | 8 (9.1%) | 18 (11.0%) |
| $750,000 to $999,999 | 5 (5.7%) | 28 (17.1%) |
| $1,000,000 or more | 51 (58.0%) | 84 (51.2%) |
| Total | 88 (100.0%) | 164 (100.0%) |
Household Income by Mortgage Status in Greenwood
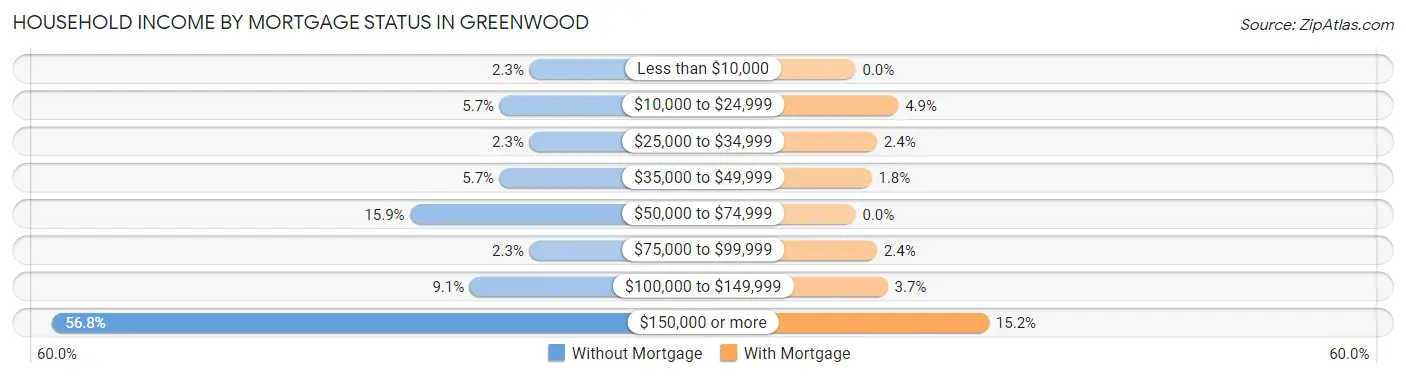
| Household Income | Without Mortgage | With Mortgage |
| Less than $10,000 | 2 (2.3%) | 0 (0.0%) |
| $10,000 to $24,999 | 5 (5.7%) | 8 (4.9%) |
| $25,000 to $34,999 | 2 (2.3%) | 4 (2.4%) |
| $35,000 to $49,999 | 5 (5.7%) | 3 (1.8%) |
| $50,000 to $74,999 | 14 (15.9%) | 0 (0.0%) |
| $75,000 to $99,999 | 2 (2.3%) | 4 (2.4%) |
| $100,000 to $149,999 | 8 (9.1%) | 6 (3.7%) |
| $150,000 or more | 50 (56.8%) | 25 (15.2%) |
| Total | 88 (100.0%) | 164 (100.0%) |
Property Value to Household Income Ratio in Greenwood
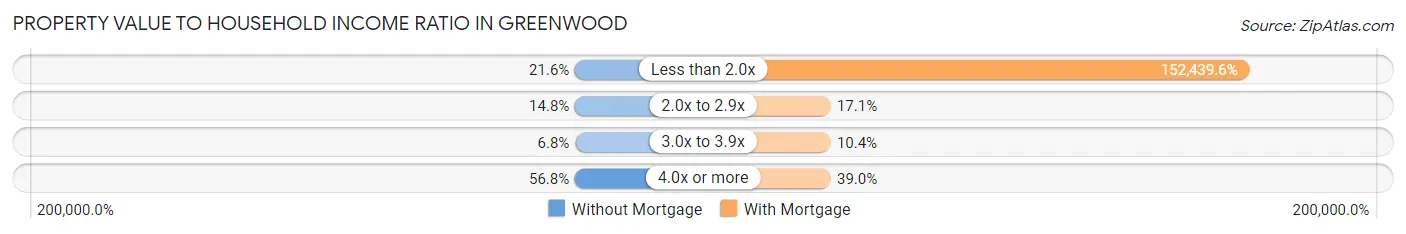
| Value-to-Income Ratio | Without Mortgage | With Mortgage |
| Less than 2.0x | 19 (21.6%) | 250,001 (152,439.6%) |
| 2.0x to 2.9x | 13 (14.8%) | 28 (17.1%) |
| 3.0x to 3.9x | 6 (6.8%) | 17 (10.4%) |
| 4.0x or more | 50 (56.8%) | 64 (39.0%) |
| Total | 88 (100.0%) | 164 (100.0%) |
Real Estate Taxes by Mortgage Status in Greenwood
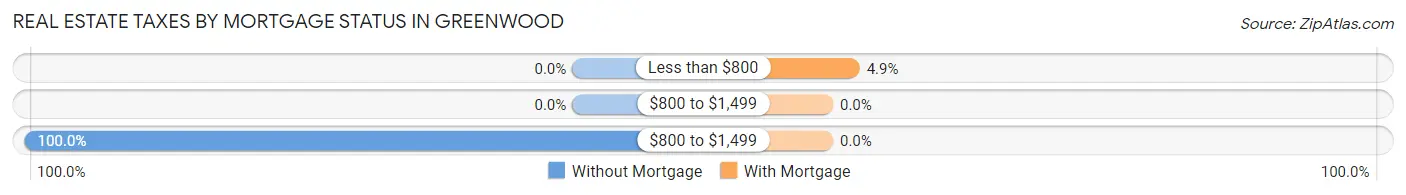
| Property Taxes | Without Mortgage | With Mortgage |
| Less than $800 | 0 (0.0%) | 8 (4.9%) |
| $800 to $1,499 | 0 (0.0%) | 0 (0.0%) |
| $800 to $1,499 | 88 (100.0%) | 0 (0.0%) |
| Total | 88 (100.0%) | 164 (100.0%) |
Health & Disability in Greenwood
Health Insurance Coverage by Age in Greenwood
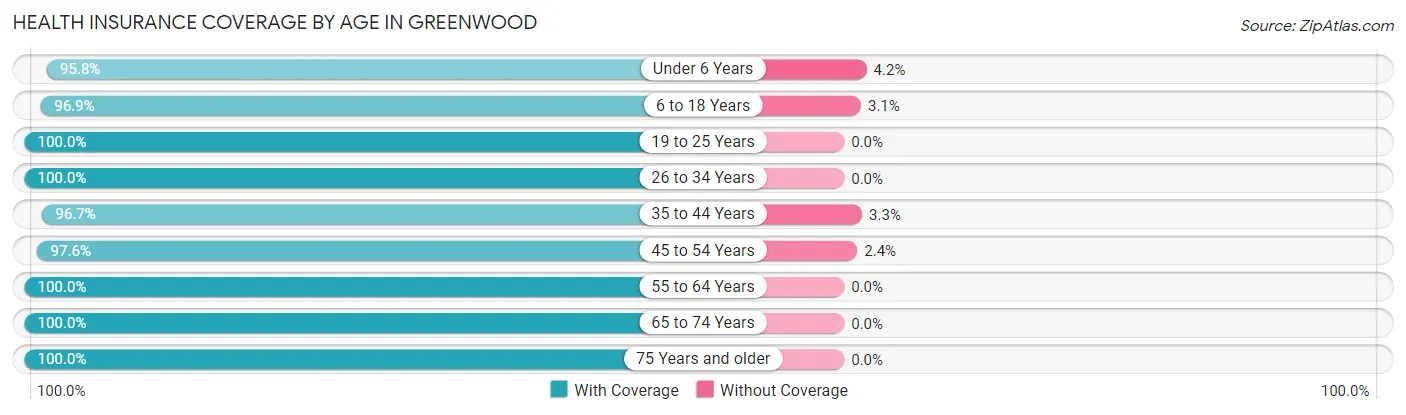
| Age Bracket | With Coverage | Without Coverage |
| Under 6 Years | 46 (95.8%) | 2 (4.2%) |
| 6 to 18 Years | 93 (96.9%) | 3 (3.1%) |
| 19 to 25 Years | 57 (100.0%) | 0 (0.0%) |
| 26 to 34 Years | 58 (100.0%) | 0 (0.0%) |
| 35 to 44 Years | 87 (96.7%) | 3 (3.3%) |
| 45 to 54 Years | 80 (97.6%) | 2 (2.4%) |
| 55 to 64 Years | 182 (100.0%) | 0 (0.0%) |
| 65 to 74 Years | 68 (100.0%) | 0 (0.0%) |
| 75 Years and older | 61 (100.0%) | 0 (0.0%) |
| Total | 732 (98.7%) | 10 (1.3%) |
Health Insurance Coverage by Citizenship Status in Greenwood
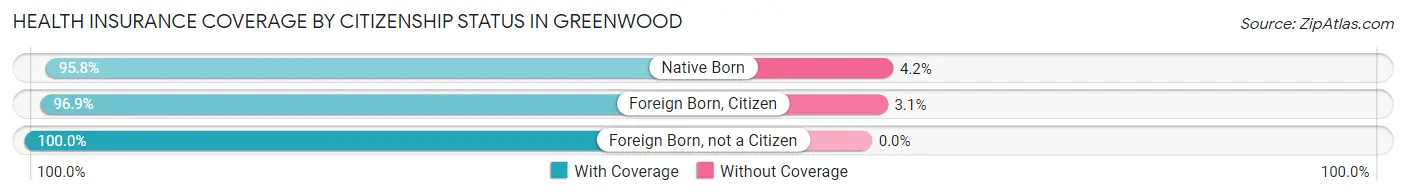
| Citizenship Status | With Coverage | Without Coverage |
| Native Born | 46 (95.8%) | 2 (4.2%) |
| Foreign Born, Citizen | 93 (96.9%) | 3 (3.1%) |
| Foreign Born, not a Citizen | 57 (100.0%) | 0 (0.0%) |
Health Insurance Coverage by Household Income in Greenwood
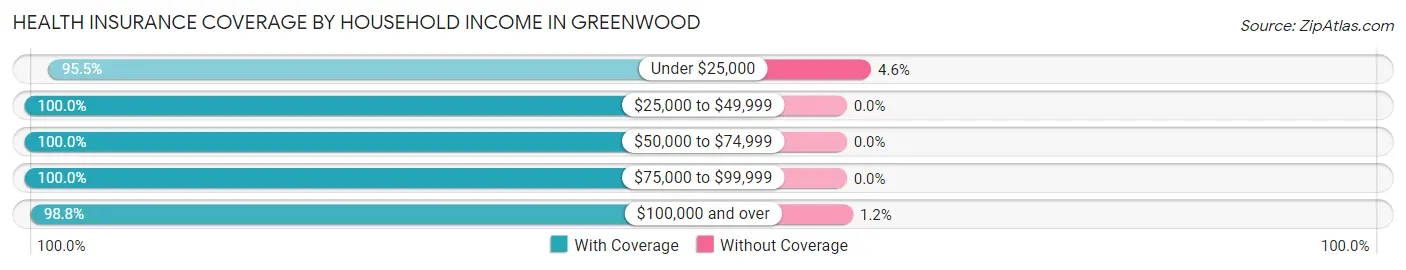
| Household Income | With Coverage | Without Coverage |
| Under $25,000 | 63 (95.5%) | 3 (4.5%) |
| $25,000 to $49,999 | 25 (100.0%) | 0 (0.0%) |
| $50,000 to $74,999 | 41 (100.0%) | 0 (0.0%) |
| $75,000 to $99,999 | 14 (100.0%) | 0 (0.0%) |
| $100,000 and over | 589 (98.8%) | 7 (1.2%) |
Public vs Private Health Insurance Coverage by Age in Greenwood
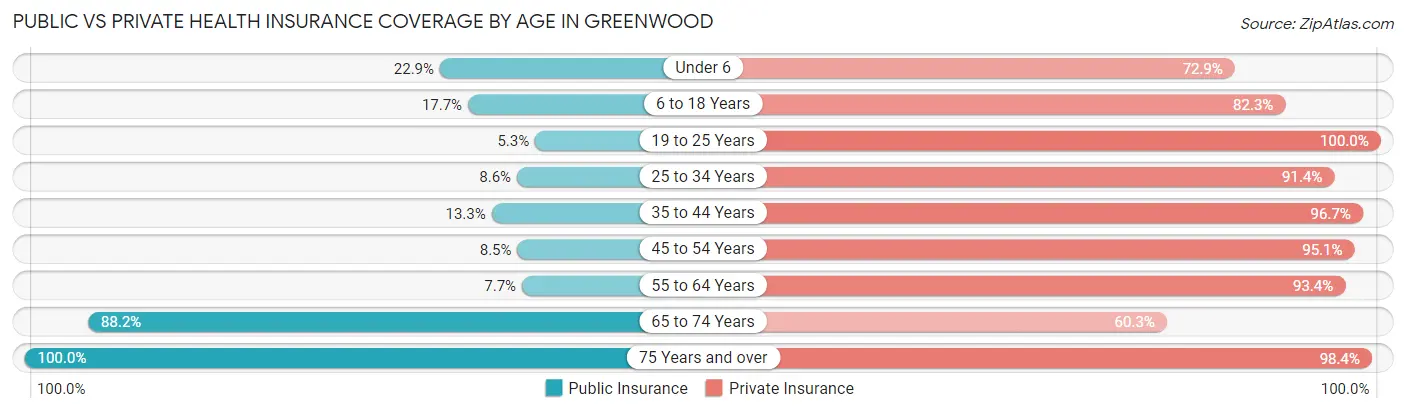
| Age Bracket | Public Insurance | Private Insurance |
| Under 6 | 11 (22.9%) | 35 (72.9%) |
| 6 to 18 Years | 17 (17.7%) | 79 (82.3%) |
| 19 to 25 Years | 3 (5.3%) | 57 (100.0%) |
| 25 to 34 Years | 5 (8.6%) | 53 (91.4%) |
| 35 to 44 Years | 12 (13.3%) | 87 (96.7%) |
| 45 to 54 Years | 7 (8.5%) | 78 (95.1%) |
| 55 to 64 Years | 14 (7.7%) | 170 (93.4%) |
| 65 to 74 Years | 60 (88.2%) | 41 (60.3%) |
| 75 Years and over | 61 (100.0%) | 60 (98.4%) |
| Total | 190 (25.6%) | 660 (88.9%) |
Disability Status by Sex by Age in Greenwood
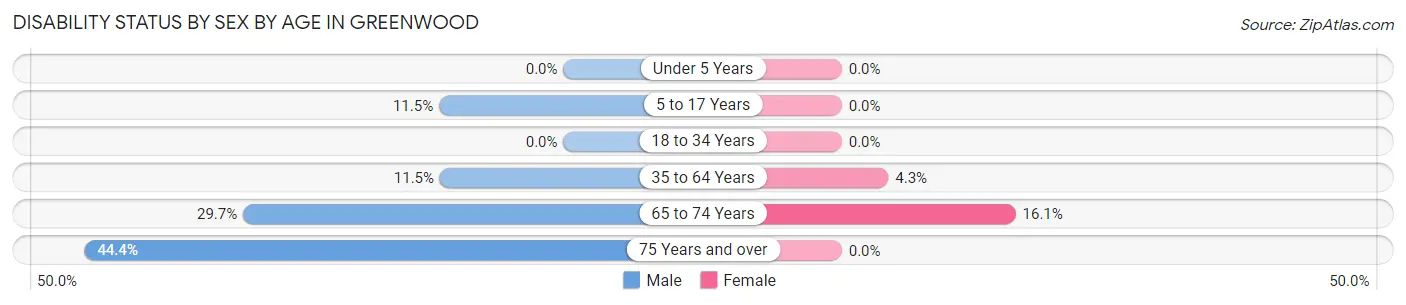
| Age Bracket | Male | Female |
| Under 5 Years | 0 (0.0%) | 0 (0.0%) |
| 5 to 17 Years | 6 (11.5%) | 0 (0.0%) |
| 18 to 34 Years | 0 (0.0%) | 0 (0.0%) |
| 35 to 64 Years | 22 (11.5%) | 7 (4.3%) |
| 65 to 74 Years | 11 (29.7%) | 5 (16.1%) |
| 75 Years and over | 12 (44.4%) | 0 (0.0%) |
Disability Class by Sex by Age in Greenwood
Disability Class: Hearing Difficulty
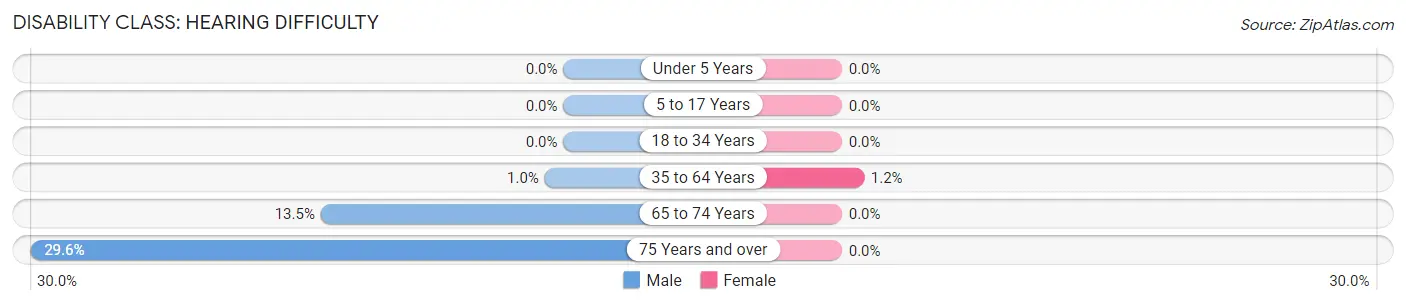
| Age Bracket | Male | Female |
| Under 5 Years | 0 (0.0%) | 0 (0.0%) |
| 5 to 17 Years | 0 (0.0%) | 0 (0.0%) |
| 18 to 34 Years | 0 (0.0%) | 0 (0.0%) |
| 35 to 64 Years | 2 (1.0%) | 2 (1.2%) |
| 65 to 74 Years | 5 (13.5%) | 0 (0.0%) |
| 75 Years and over | 8 (29.6%) | 0 (0.0%) |
Disability Class: Vision Difficulty
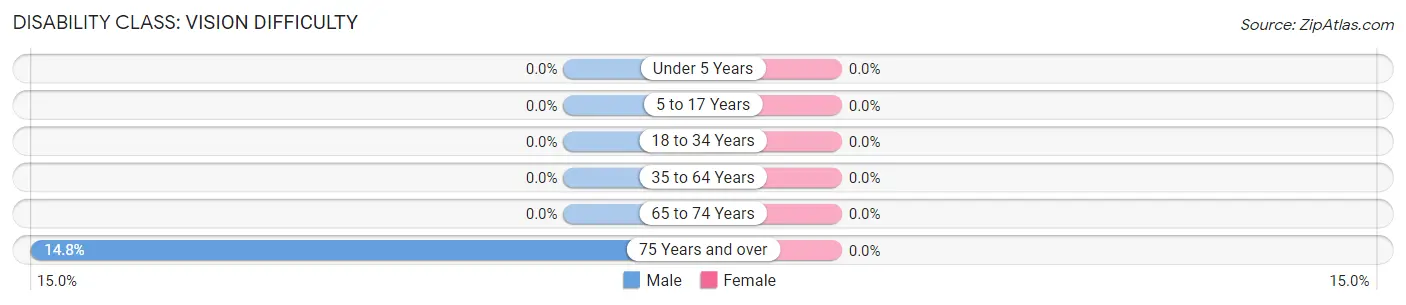
| Age Bracket | Male | Female |
| Under 5 Years | 0 (0.0%) | 0 (0.0%) |
| 5 to 17 Years | 0 (0.0%) | 0 (0.0%) |
| 18 to 34 Years | 0 (0.0%) | 0 (0.0%) |
| 35 to 64 Years | 0 (0.0%) | 0 (0.0%) |
| 65 to 74 Years | 0 (0.0%) | 0 (0.0%) |
| 75 Years and over | 4 (14.8%) | 0 (0.0%) |
Disability Class: Cognitive Difficulty
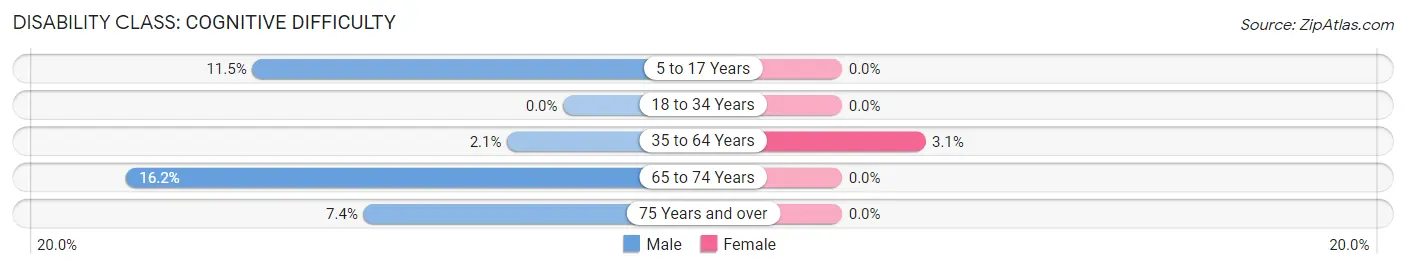
| Age Bracket | Male | Female |
| 5 to 17 Years | 6 (11.5%) | 0 (0.0%) |
| 18 to 34 Years | 0 (0.0%) | 0 (0.0%) |
| 35 to 64 Years | 4 (2.1%) | 5 (3.1%) |
| 65 to 74 Years | 6 (16.2%) | 0 (0.0%) |
| 75 Years and over | 2 (7.4%) | 0 (0.0%) |
Disability Class: Ambulatory Difficulty
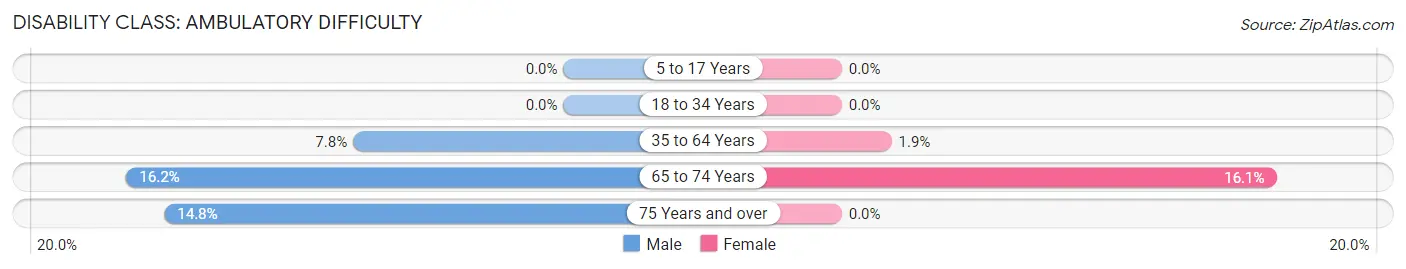
| Age Bracket | Male | Female |
| 5 to 17 Years | 0 (0.0%) | 0 (0.0%) |
| 18 to 34 Years | 0 (0.0%) | 0 (0.0%) |
| 35 to 64 Years | 15 (7.8%) | 3 (1.8%) |
| 65 to 74 Years | 6 (16.2%) | 5 (16.1%) |
| 75 Years and over | 4 (14.8%) | 0 (0.0%) |
Disability Class: Self-Care Difficulty
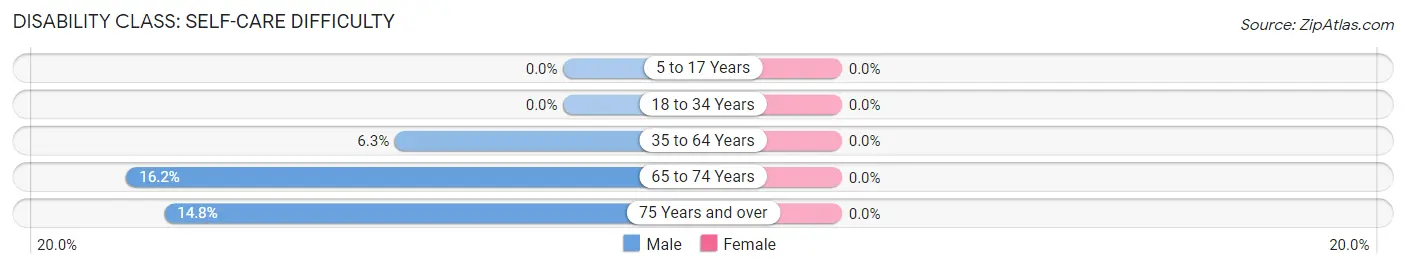
| Age Bracket | Male | Female |
| 5 to 17 Years | 0 (0.0%) | 0 (0.0%) |
| 18 to 34 Years | 0 (0.0%) | 0 (0.0%) |
| 35 to 64 Years | 12 (6.2%) | 0 (0.0%) |
| 65 to 74 Years | 6 (16.2%) | 0 (0.0%) |
| 75 Years and over | 4 (14.8%) | 0 (0.0%) |
Technology Access in Greenwood
Computing Device Access in Greenwood
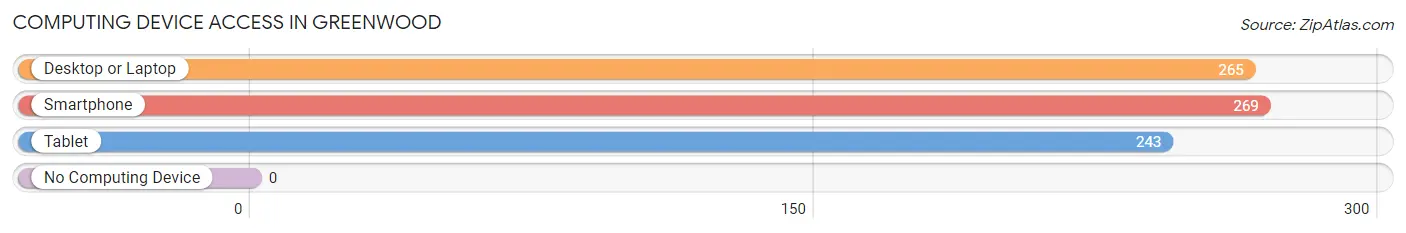
| Device Type | # Households | % Households |
| Desktop or Laptop | 265 | 96.0% |
| Smartphone | 269 | 97.5% |
| Tablet | 243 | 88.0% |
| No Computing Device | 0 | 0.0% |
| Total | 276 | 100.0% |
Internet Access in Greenwood
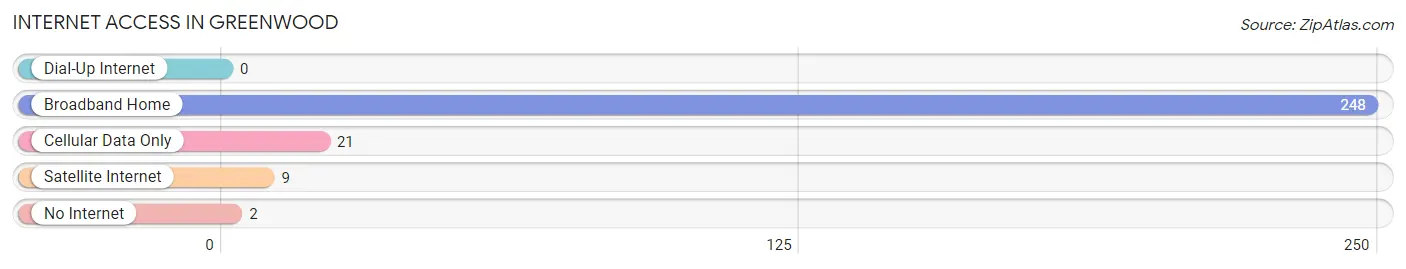
| Internet Type | # Households | % Households |
| Dial-Up Internet | 0 | 0.0% |
| Broadband Home | 248 | 89.9% |
| Cellular Data Only | 21 | 7.6% |
| Satellite Internet | 9 | 3.3% |
| No Internet | 2 | 0.7% |
| Total | 276 | 100.0% |
Greenwood Summary
Greenwood, Minnesota is a small city located in the southwestern corner of the state, just north of the Iowa border. It is part of the Mankato-North Mankato Metropolitan Statistical Area and is home to a population of just over 1,000 people. The city is known for its rural charm and its close proximity to the Minnesota River.
Geography
Greenwood is located in the southwestern corner of Minnesota, just north of the Iowa border. It is situated in Blue Earth County, and is part of the Mankato-North Mankato Metropolitan Statistical Area. The city is located on the Minnesota River, and is surrounded by rolling hills and farmland. The city is located approximately 50 miles south of the Twin Cities, and is accessible via Interstate 90.
History
Greenwood was founded in 1856 by a group of settlers from New York. The city was named after the nearby Greenwood Lake, which was named after the nearby town of Greenwood, New York. The city was originally a farming community, and the first settlers were primarily of German and Scandinavian descent.
In the late 19th century, Greenwood began to grow and develop. The city was incorporated in 1887, and the first mayor was elected in 1888. The city was home to a variety of businesses, including a flour mill, a creamery, a sawmill, and a brickyard.
In the early 20th century, Greenwood continued to grow and develop. The city was home to a variety of businesses, including a bank, a hotel, a movie theater, and a variety of stores. The city was also home to a variety of churches, including the First Presbyterian Church, which was founded in 1887.
Economy
Greenwood’s economy is primarily based on agriculture and tourism. The city is home to a variety of farms, including dairy farms, beef farms, and vegetable farms. The city is also home to a variety of tourist attractions, including the Minnesota River Valley Scenic Byway, which runs through the city.
The city is also home to a variety of businesses, including a variety of restaurants, retail stores, and service businesses. The city is also home to a variety of manufacturing businesses, including a furniture factory and a printing company.
Demographics
As of the 2010 census, Greenwood had a population of 1,072 people. The racial makeup of the city was 97.2% White, 0.7% African American, 0.3% Native American, 0.2% Asian, 0.1% Pacific Islander, 0.7% from other races, and 0.9% from two or more races. Hispanic or Latino of any race were 1.7% of the population.
The median income for a household in the city was $45,000, and the median income for a family was $50,000. The per capita income for the city was $20,000. About 8.3% of families and 10.2% of the population were below the poverty line, including 11.7% of those under age 18 and 8.3% of those age 65 or over.
Conclusion
Greenwood, Minnesota is a small city located in the southwestern corner of the state, just north of the Iowa border. It is part of the Mankato-North Mankato Metropolitan Statistical Area and is home to a population of just over 1,000 people. The city is known for its rural charm and its close proximity to the Minnesota River. The city’s economy is primarily based on agriculture and tourism, and the city is home to a variety of businesses, including a variety of restaurants, retail stores, and service businesses. The city’s population is primarily White, with a small percentage of African American, Native American, Asian, and Pacific Islander residents. The median income for a household in the city is $45,000, and the median income for a family is $50,000.
Common Questions
What is Per Capita Income in Greenwood?
Per Capita income in Greenwood is $143,541.
What is the Median Family Income in Greenwood?
Median Family Income in Greenwood is $250,001.
What is the Median Household income in Greenwood?
Median Household Income in Greenwood is $197,000.
What is Income or Wage Gap in Greenwood?
Income or Wage Gap in Greenwood is 34.7%.
Women in Greenwood earn 65.3 cents for every dollar earned by a man.
What is Inequality or Gini Index in Greenwood?
Inequality or Gini Index in Greenwood is 0.54.
What is the Total Population of Greenwood?
Total Population of Greenwood is 742.
What is the Total Male Population of Greenwood?
Total Male Population of Greenwood is 384.
What is the Total Female Population of Greenwood?
Total Female Population of Greenwood is 358.
What is the Ratio of Males per 100 Females in Greenwood?
There are 107.26 Males per 100 Females in Greenwood.
What is the Ratio of Females per 100 Males in Greenwood?
There are 93.23 Females per 100 Males in Greenwood.
What is the Median Population Age in Greenwood?
Median Population Age in Greenwood is 48.6 Years.
What is the Average Family Size in Greenwood
Average Family Size in Greenwood is 3.0 People.
What is the Average Household Size in Greenwood
Average Household Size in Greenwood is 2.7 People.
How Large is the Labor Force in Greenwood?
There are 425 People in the Labor Forcein in Greenwood.
What is the Percentage of People in the Labor Force in Greenwood?
70.1% of People are in the Labor Force in Greenwood.
What is the Unemployment Rate in Greenwood?
Unemployment Rate in Greenwood is 3.8%.