Tyhee, ID Map & Demographics
Tyhee Map
Tyhee Overview
$32,364
PER CAPITA INCOME
$91,198
AVG FAMILY INCOME
$90,677
AVG HOUSEHOLD INCOME
36.7%
WAGE / INCOME GAP [ % ]
63.3¢/ $1
WAGE / INCOME GAP [ $ ]
$4,605
FAMILY INCOME DEFICIT
0.42
INEQUALITY / GINI INDEX
1,469
TOTAL POPULATION
660
MALE POPULATION
809
FEMALE POPULATION
81.58
MALES / 100 FEMALES
122.58
FEMALES / 100 MALES
34.7
MEDIAN AGE
3.7
AVG FAMILY SIZE
3.2
AVG HOUSEHOLD SIZE
633
LABOR FORCE [ PEOPLE ]
62.4%
PERCENT IN LABOR FORCE
9.6%
UNEMPLOYMENT RATE
Income in Tyhee
Income Overview in Tyhee
Per Capita Income in Tyhee is $32,364, while median incomes of families and households are $91,198 and $90,677 respectively.
| Characteristic | Number | Measure |
| Per Capita Income | 1,469 | $32,364 |
| Median Family Income | 367 | $91,198 |
| Mean Family Income | 367 | $102,955 |
| Median Household Income | 463 | $90,677 |
| Mean Household Income | 463 | $102,673 |
| Income Deficit | 367 | $4,605 |
| Wage / Income Gap (%) | 1,469 | 36.69% |
| Wage / Income Gap ($) | 1,469 | 63.31¢ per $1 |
| Gini / Inequality Index | 1,469 | 0.42 |
Earnings by Sex in Tyhee
Average Earnings in Tyhee are $27,964, $35,179 for men and $22,273 for women, a difference of 36.7%.
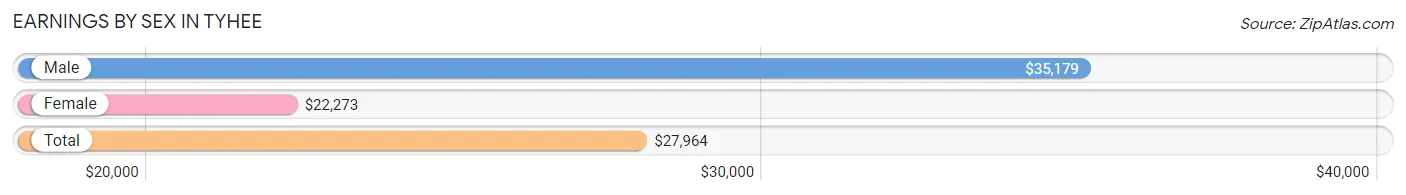
| Sex | Number | Average Earnings |
| Male | 323 (44.1%) | $35,179 |
| Female | 410 (55.9%) | $22,273 |
| Total | 733 (100.0%) | $27,964 |
Earnings by Sex by Income Bracket in Tyhee
The most common earnings brackets in Tyhee are $100,000+ for men (63 | 19.5%) and $5,000 to $7,499 for women (49 | 11.9%).
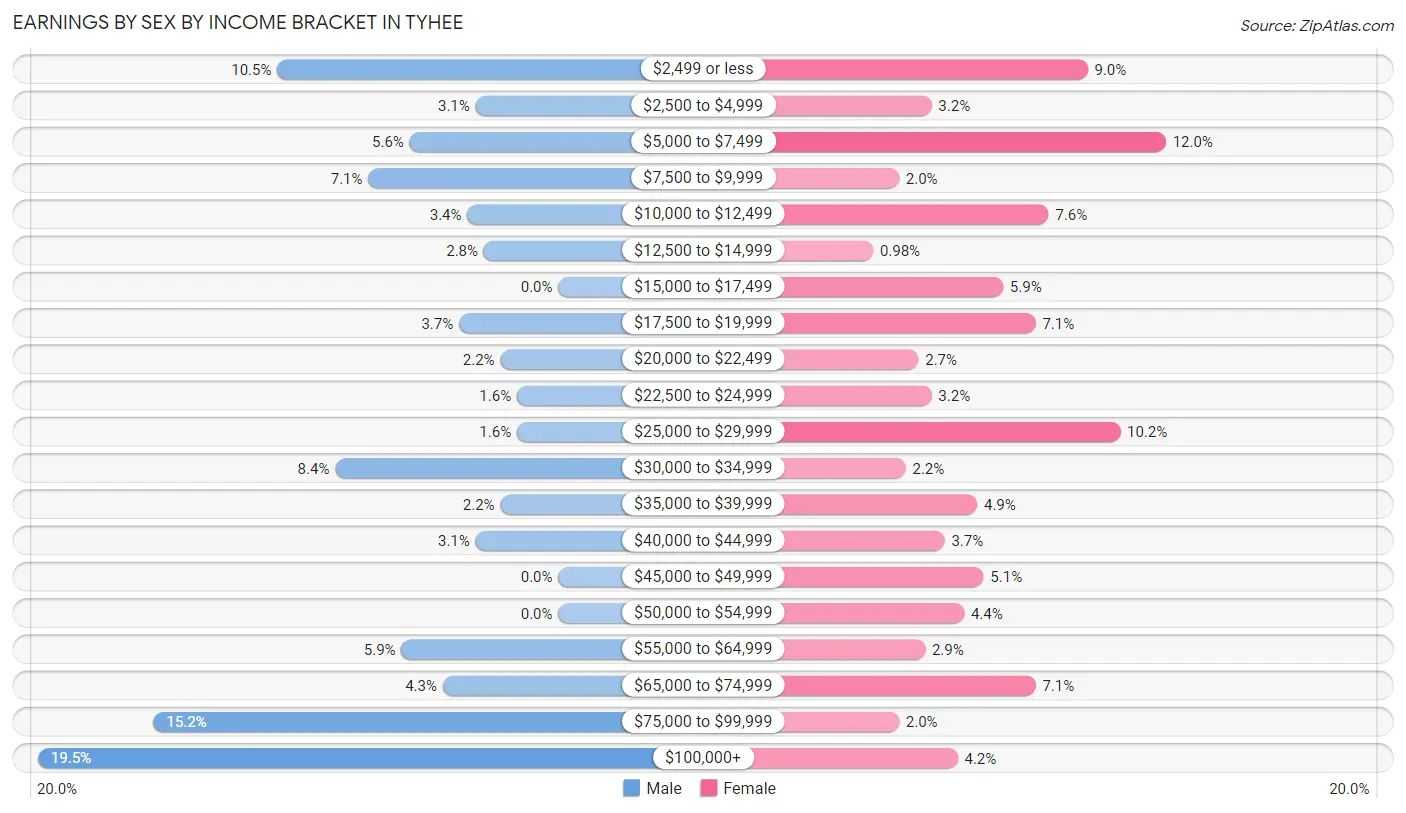
| Income | Male | Female |
| $2,499 or less | 34 (10.5%) | 37 (9.0%) |
| $2,500 to $4,999 | 10 (3.1%) | 13 (3.2%) |
| $5,000 to $7,499 | 18 (5.6%) | 49 (11.9%) |
| $7,500 to $9,999 | 23 (7.1%) | 8 (1.9%) |
| $10,000 to $12,499 | 11 (3.4%) | 31 (7.6%) |
| $12,500 to $14,999 | 9 (2.8%) | 4 (1.0%) |
| $15,000 to $17,499 | 0 (0.0%) | 24 (5.9%) |
| $17,500 to $19,999 | 12 (3.7%) | 29 (7.1%) |
| $20,000 to $22,499 | 7 (2.2%) | 11 (2.7%) |
| $22,500 to $24,999 | 5 (1.5%) | 13 (3.2%) |
| $25,000 to $29,999 | 5 (1.5%) | 42 (10.2%) |
| $30,000 to $34,999 | 27 (8.4%) | 9 (2.2%) |
| $35,000 to $39,999 | 7 (2.2%) | 20 (4.9%) |
| $40,000 to $44,999 | 10 (3.1%) | 15 (3.7%) |
| $45,000 to $49,999 | 0 (0.0%) | 21 (5.1%) |
| $50,000 to $54,999 | 0 (0.0%) | 18 (4.4%) |
| $55,000 to $64,999 | 19 (5.9%) | 12 (2.9%) |
| $65,000 to $74,999 | 14 (4.3%) | 29 (7.1%) |
| $75,000 to $99,999 | 49 (15.2%) | 8 (1.9%) |
| $100,000+ | 63 (19.5%) | 17 (4.2%) |
| Total | 323 (100.0%) | 410 (100.0%) |
Earnings by Sex by Educational Attainment in Tyhee
Average earnings in Tyhee are $78,125 for men and $28,929 for women, a difference of 63.0%. Men with an educational attainment of graduate degree enjoy the highest average annual earnings of $143,636, while those with high school diploma education earn the least with $33,977. Women with an educational attainment of graduate degree earn the most with the average annual earnings of $66,319, while those with bachelor's degree education have the smallest earnings of $23,750.
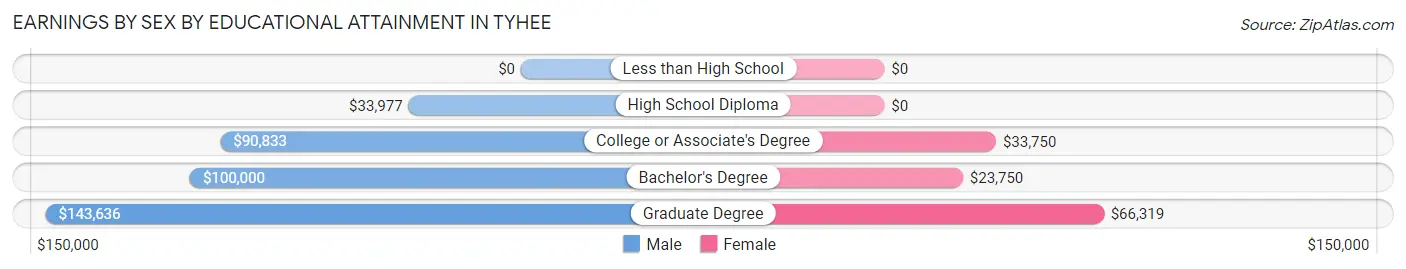
| Educational Attainment | Male Income | Female Income |
| Less than High School | - | - |
| High School Diploma | $33,977 | $0 |
| College or Associate's Degree | $90,833 | $33,750 |
| Bachelor's Degree | $100,000 | $23,750 |
| Graduate Degree | $143,636 | $66,319 |
| Total | $78,125 | $28,929 |
Family Income in Tyhee
Family Income Brackets in Tyhee
According to the Tyhee family income data, there are 107 families falling into the $100,000 to $149,999 income range, which is the most common income bracket and makes up 29.2% of all families.
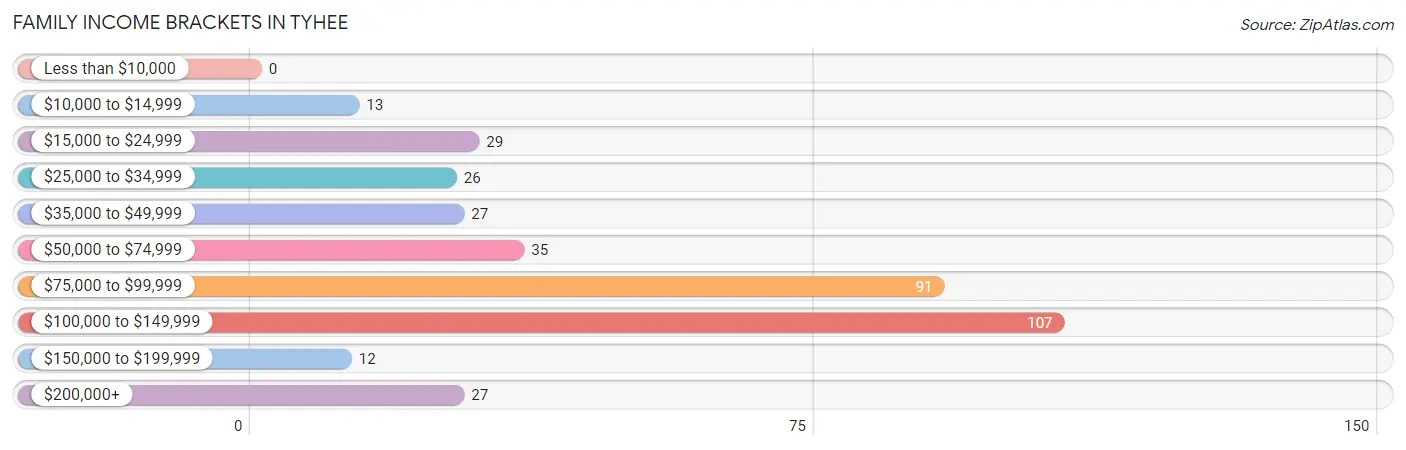
| Income Bracket | # Families | % Families |
| Less than $10,000 | 0 | 0.0% |
| $10,000 to $14,999 | 13 | 3.5% |
| $15,000 to $24,999 | 29 | 7.9% |
| $25,000 to $34,999 | 26 | 7.1% |
| $35,000 to $49,999 | 27 | 7.4% |
| $50,000 to $74,999 | 35 | 9.5% |
| $75,000 to $99,999 | 91 | 24.8% |
| $100,000 to $149,999 | 107 | 29.2% |
| $150,000 to $199,999 | 12 | 3.3% |
| $200,000+ | 27 | 7.4% |
Family Income by Famaliy Size in Tyhee
6-person families (27 | 7.4%) account for the highest median family income in Tyhee with $229,375 per family, while 2-person families (156 | 42.5%) have the highest median income of $44,000 per family member.
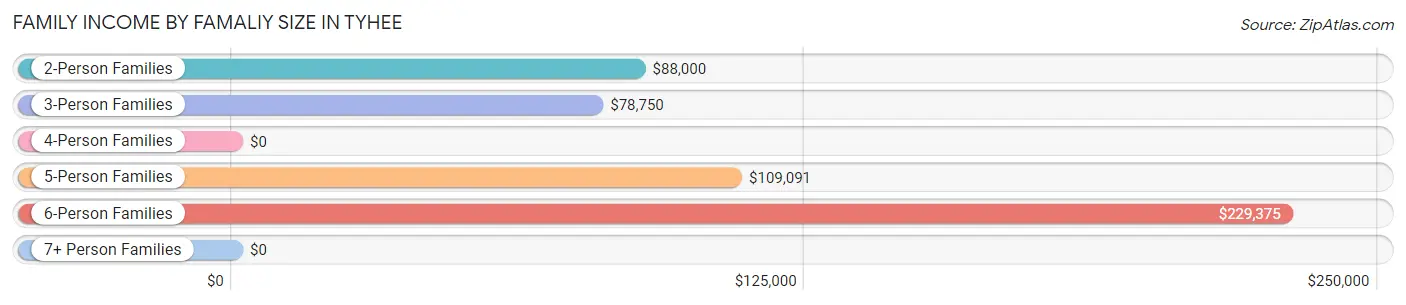
| Income Bracket | # Families | Median Income |
| 2-Person Families | 156 (42.5%) | $88,000 |
| 3-Person Families | 45 (12.3%) | $78,750 |
| 4-Person Families | 91 (24.8%) | $0 |
| 5-Person Families | 32 (8.7%) | $109,091 |
| 6-Person Families | 27 (7.4%) | $229,375 |
| 7+ Person Families | 16 (4.4%) | $0 |
| Total | 367 (100.0%) | $91,198 |
Family Income by Number of Earners in Tyhee
The median family income in Tyhee is $91,198, with families comprising 3+ earners (51) having the highest median family income of $156,563, while families with 1 earner (85) have the lowest median family income of $83,750, accounting for 13.9% and 23.2% of families, respectively.
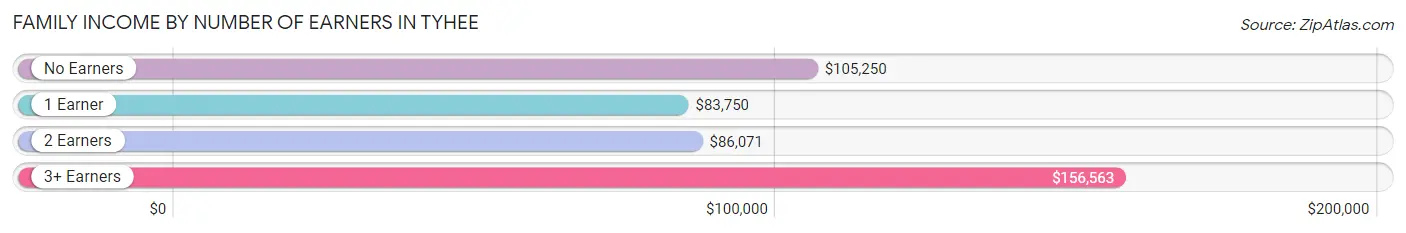
| Number of Earners | # Families | Median Income |
| No Earners | 41 (11.2%) | $105,250 |
| 1 Earner | 85 (23.2%) | $83,750 |
| 2 Earners | 190 (51.8%) | $86,071 |
| 3+ Earners | 51 (13.9%) | $156,563 |
| Total | 367 (100.0%) | $91,198 |
Household Income in Tyhee
Household Income Brackets in Tyhee
With 127 households falling in the category, the $100,000 to $149,999 income range is the most frequent in Tyhee, accounting for 27.4% of all households. In contrast, only 4 households (0.9%) fall into the less than $10,000 income bracket, making it the least populous group.
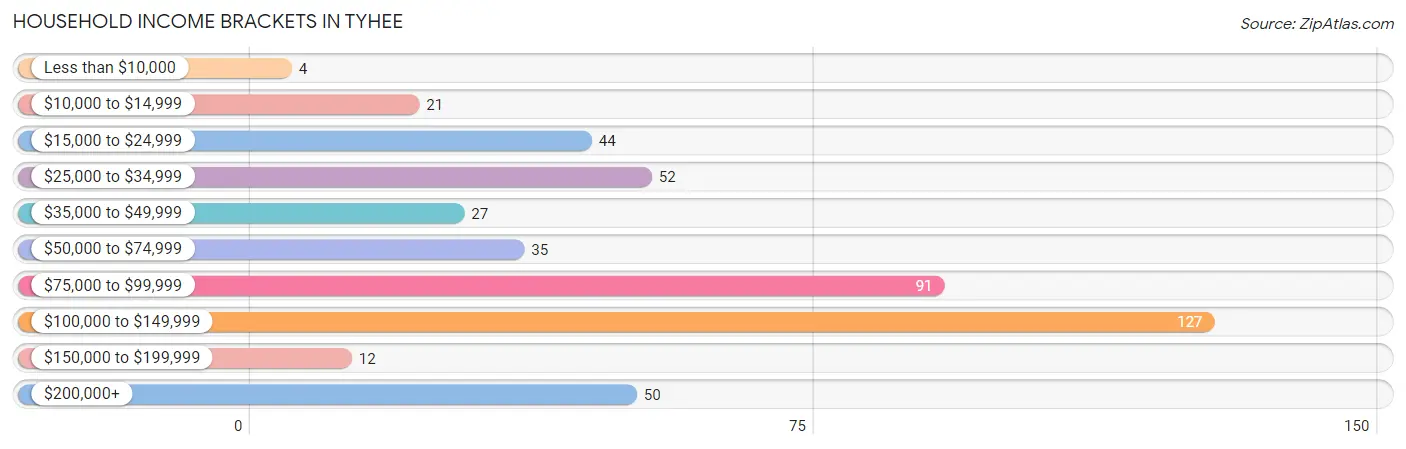
| Income Bracket | # Households | % Households |
| Less than $10,000 | 4 | 0.9% |
| $10,000 to $14,999 | 21 | 4.5% |
| $15,000 to $24,999 | 44 | 9.5% |
| $25,000 to $34,999 | 52 | 11.2% |
| $35,000 to $49,999 | 27 | 5.8% |
| $50,000 to $74,999 | 35 | 7.6% |
| $75,000 to $99,999 | 91 | 19.7% |
| $100,000 to $149,999 | 127 | 27.4% |
| $150,000 to $199,999 | 12 | 2.6% |
| $200,000+ | 50 | 10.8% |
Household Income by Householder Age in Tyhee
The median household income in Tyhee is $90,677, with the highest median household income of $107,813 found in the 45 to 64 years age bracket for the primary householder. A total of 160 households (34.6%) fall into this category. Meanwhile, the 15 to 24 years age bracket for the primary householder has the lowest median household income of $0, with 13 households (2.8%) in this group.
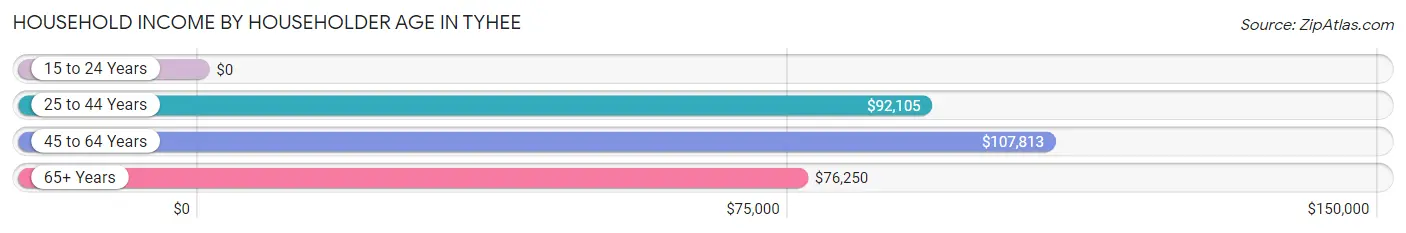
| Income Bracket | # Households | Median Income |
| 15 to 24 Years | 13 (2.8%) | $0 |
| 25 to 44 Years | 178 (38.4%) | $92,105 |
| 45 to 64 Years | 160 (34.6%) | $107,813 |
| 65+ Years | 112 (24.2%) | $76,250 |
| Total | 463 (100.0%) | $90,677 |
Poverty in Tyhee
Income Below Poverty by Sex and Age in Tyhee
With 8.6% poverty level for males and 18.0% for females among the residents of Tyhee, 15 year old males and 6 to 11 year old females are the most vulnerable to poverty, with 31 males (72.1%) and 66 females (71.0%) in their respective age groups living below the poverty level.
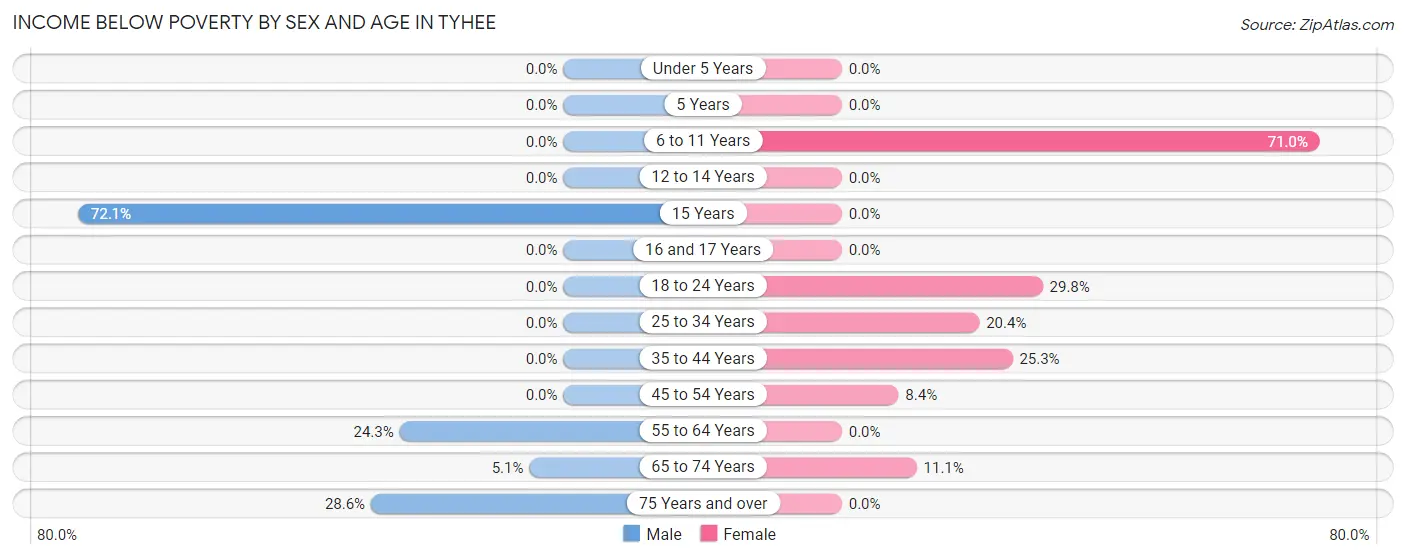
| Age Bracket | Male | Female |
| Under 5 Years | 0 (0.0%) | 0 (0.0%) |
| 5 Years | 0 (0.0%) | 0 (0.0%) |
| 6 to 11 Years | 0 (0.0%) | 66 (71.0%) |
| 12 to 14 Years | 0 (0.0%) | 0 (0.0%) |
| 15 Years | 31 (72.1%) | 0 (0.0%) |
| 16 and 17 Years | 0 (0.0%) | 0 (0.0%) |
| 18 to 24 Years | 0 (0.0%) | 17 (29.8%) |
| 25 to 34 Years | 0 (0.0%) | 10 (20.4%) |
| 35 to 44 Years | 0 (0.0%) | 37 (25.3%) |
| 45 to 54 Years | 0 (0.0%) | 9 (8.4%) |
| 55 to 64 Years | 18 (24.3%) | 0 (0.0%) |
| 65 to 74 Years | 4 (5.1%) | 7 (11.1%) |
| 75 Years and over | 4 (28.6%) | 0 (0.0%) |
| Total | 57 (8.6%) | 146 (18.0%) |
Income Above Poverty by Sex and Age in Tyhee
According to the poverty statistics in Tyhee, males aged under 5 years and females aged under 5 years are the age groups that are most secure financially, with 100.0% of males and 100.0% of females in these age groups living above the poverty line.
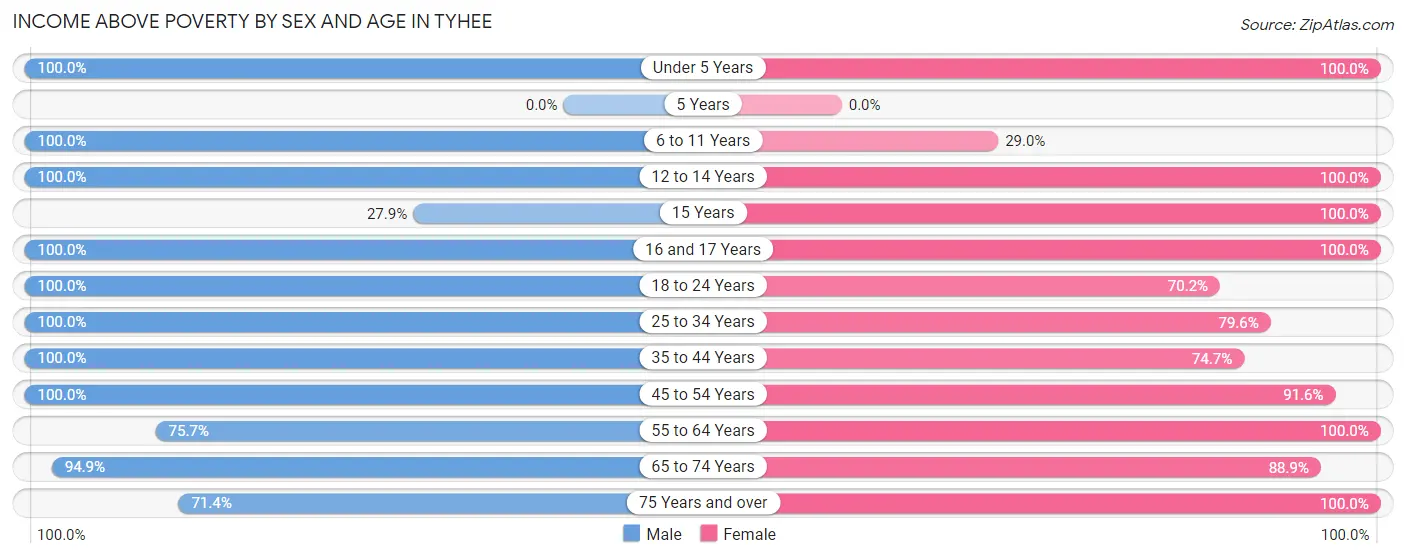
| Age Bracket | Male | Female |
| Under 5 Years | 51 (100.0%) | 32 (100.0%) |
| 5 Years | 0 (0.0%) | 0 (0.0%) |
| 6 to 11 Years | 95 (100.0%) | 27 (29.0%) |
| 12 to 14 Years | 22 (100.0%) | 76 (100.0%) |
| 15 Years | 12 (27.9%) | 43 (100.0%) |
| 16 and 17 Years | 26 (100.0%) | 31 (100.0%) |
| 18 to 24 Years | 79 (100.0%) | 40 (70.2%) |
| 25 to 34 Years | 41 (100.0%) | 39 (79.6%) |
| 35 to 44 Years | 84 (100.0%) | 109 (74.7%) |
| 45 to 54 Years | 52 (100.0%) | 98 (91.6%) |
| 55 to 64 Years | 56 (75.7%) | 58 (100.0%) |
| 65 to 74 Years | 75 (94.9%) | 56 (88.9%) |
| 75 Years and over | 10 (71.4%) | 54 (100.0%) |
| Total | 603 (91.4%) | 663 (82.0%) |
Income Below Poverty Among Married-Couple Families in Tyhee
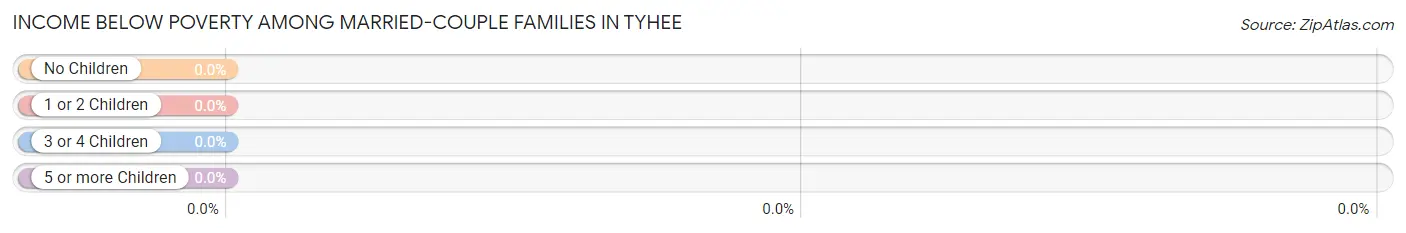
| Children | Above Poverty | Below Poverty |
| No Children | 128 (100.0%) | 0 (0.0%) |
| 1 or 2 Children | 76 (100.0%) | 0 (0.0%) |
| 3 or 4 Children | 41 (100.0%) | 0 (0.0%) |
| 5 or more Children | 10 (100.0%) | 0 (0.0%) |
| Total | 255 (100.0%) | 0 (0.0%) |
Income Below Poverty Among Single-Parent Households in Tyhee
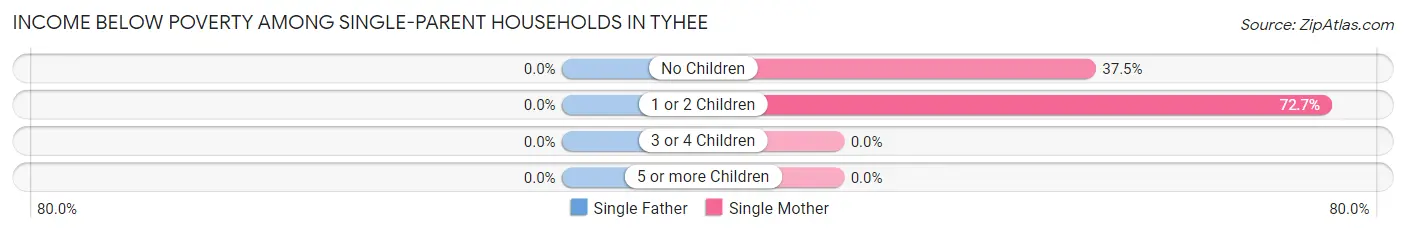
| Children | Single Father | Single Mother |
| No Children | 0 (0.0%) | 18 (37.5%) |
| 1 or 2 Children | 0 (0.0%) | 24 (72.7%) |
| 3 or 4 Children | 0 (0.0%) | 0 (0.0%) |
| 5 or more Children | 0 (0.0%) | 0 (0.0%) |
| Total | 0 (0.0%) | 42 (41.6%) |
Income Below Poverty Among Married-Couple vs Single-Parent Households in Tyhee
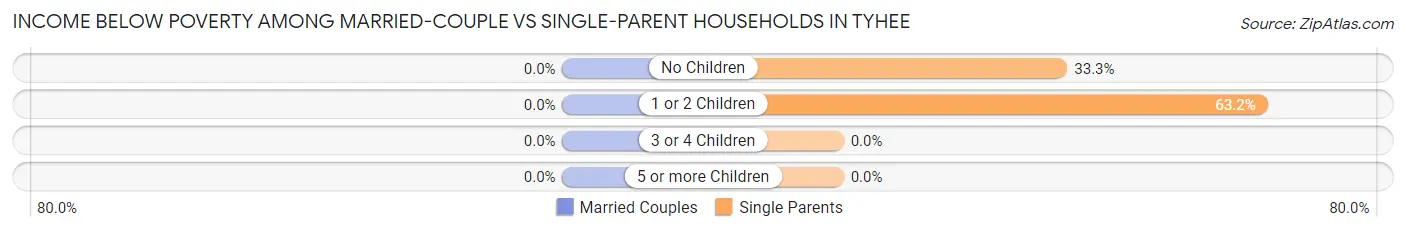
| Children | Married-Couple Families | Single-Parent Households |
| No Children | 0 (0.0%) | 18 (33.3%) |
| 1 or 2 Children | 0 (0.0%) | 24 (63.2%) |
| 3 or 4 Children | 0 (0.0%) | 0 (0.0%) |
| 5 or more Children | 0 (0.0%) | 0 (0.0%) |
| Total | 0 (0.0%) | 42 (37.5%) |
Race in Tyhee
The most populous races in Tyhee are White / Caucasian (1,275 | 86.8%), Hispanic or Latino (174 | 11.8%), and Some other Race (74 | 5.0%).
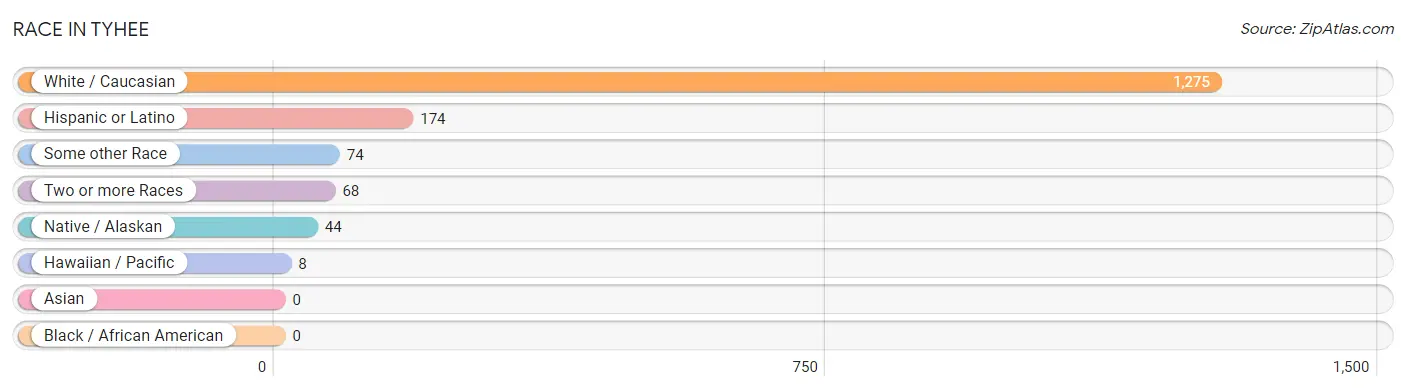
| Race | # Population | % Population |
| Asian | 0 | 0.0% |
| Black / African American | 0 | 0.0% |
| Hawaiian / Pacific | 8 | 0.5% |
| Hispanic or Latino | 174 | 11.8% |
| Native / Alaskan | 44 | 3.0% |
| White / Caucasian | 1,275 | 86.8% |
| Two or more Races | 68 | 4.6% |
| Some other Race | 74 | 5.0% |
| Total | 1,469 | 100.0% |
Ancestry in Tyhee
The most populous ancestries reported in Tyhee are English (302 | 20.6%), German (245 | 16.7%), Irish (239 | 16.3%), Italian (187 | 12.7%), and Mexican (141 | 9.6%), together accounting for 75.8% of all Tyhee residents.
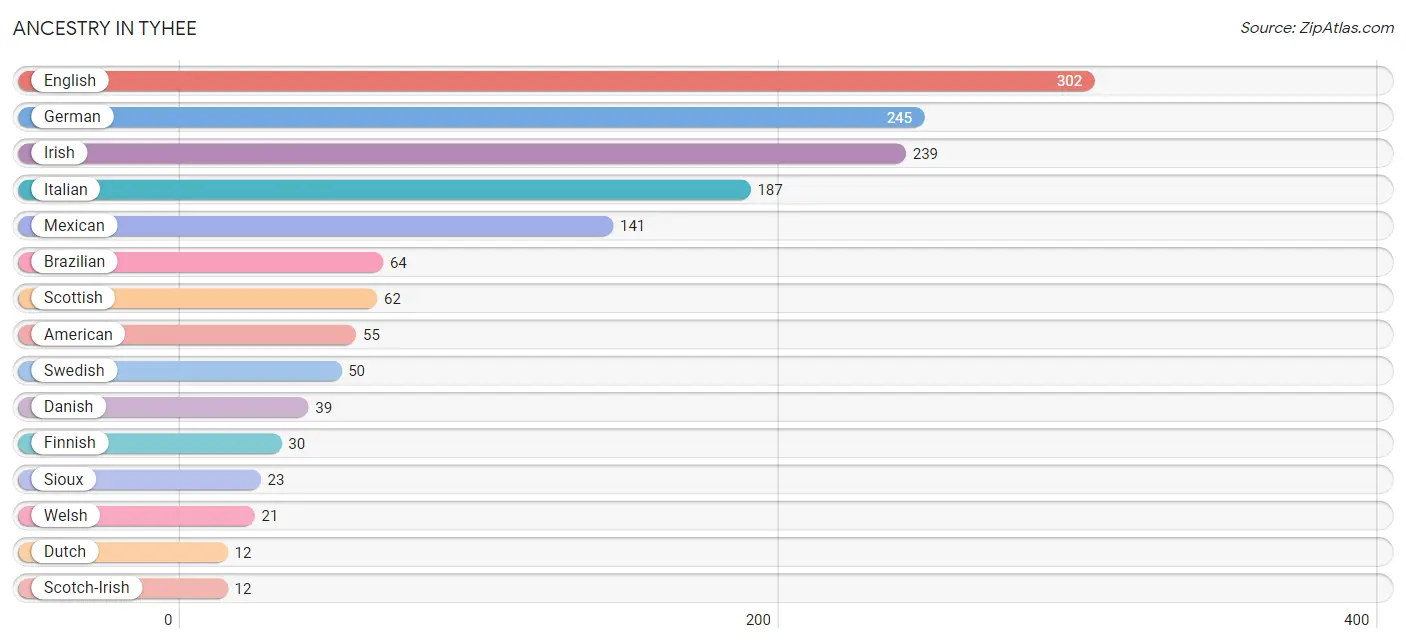
| Ancestry | # Population | % Population |
| American | 55 | 3.7% |
| Austrian | 11 | 0.7% |
| Brazilian | 64 | 4.4% |
| Central American | 6 | 0.4% |
| Danish | 39 | 2.6% |
| Dutch | 12 | 0.8% |
| English | 302 | 20.6% |
| Finnish | 30 | 2.0% |
| German | 245 | 16.7% |
| Hungarian | 5 | 0.3% |
| Irish | 239 | 16.3% |
| Italian | 187 | 12.7% |
| Mexican | 141 | 9.6% |
| Native Hawaiian | 8 | 0.5% |
| Norwegian | 9 | 0.6% |
| Puerto Rican | 5 | 0.3% |
| Salvadoran | 6 | 0.4% |
| Scotch-Irish | 12 | 0.8% |
| Scottish | 62 | 4.2% |
| Sioux | 23 | 1.6% |
| Slovak | 5 | 0.3% |
| Swedish | 50 | 3.4% |
| Swiss | 10 | 0.7% |
| Welsh | 21 | 1.4% | View All 24 Rows |
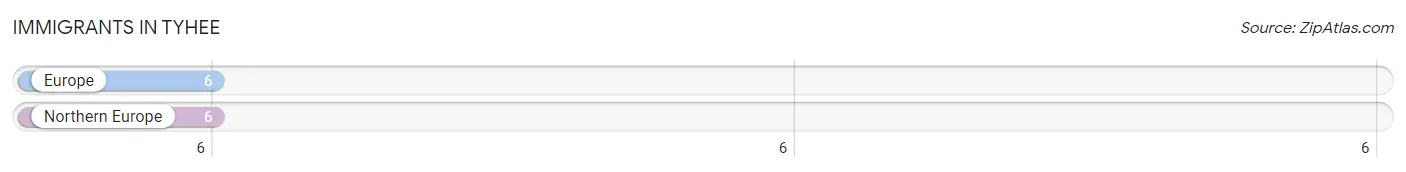
Immigrants in Tyhee
The most numerous immigrant groups reported in Tyhee came from Europe (6 | 0.4%), and Northern Europe (6 | 0.4%), together accounting for 0.8% of all Tyhee residents.
| Immigration Origin | # Population | % Population |
| Europe | 6 | 0.4% |
| Northern Europe | 6 | 0.4% | View All 2 Rows |
Sex and Age in Tyhee
Sex and Age in Tyhee
The most populous age groups in Tyhee are 15 to 19 Years (101 | 15.3%) for men and 15 to 19 Years (118 | 14.6%) for women.
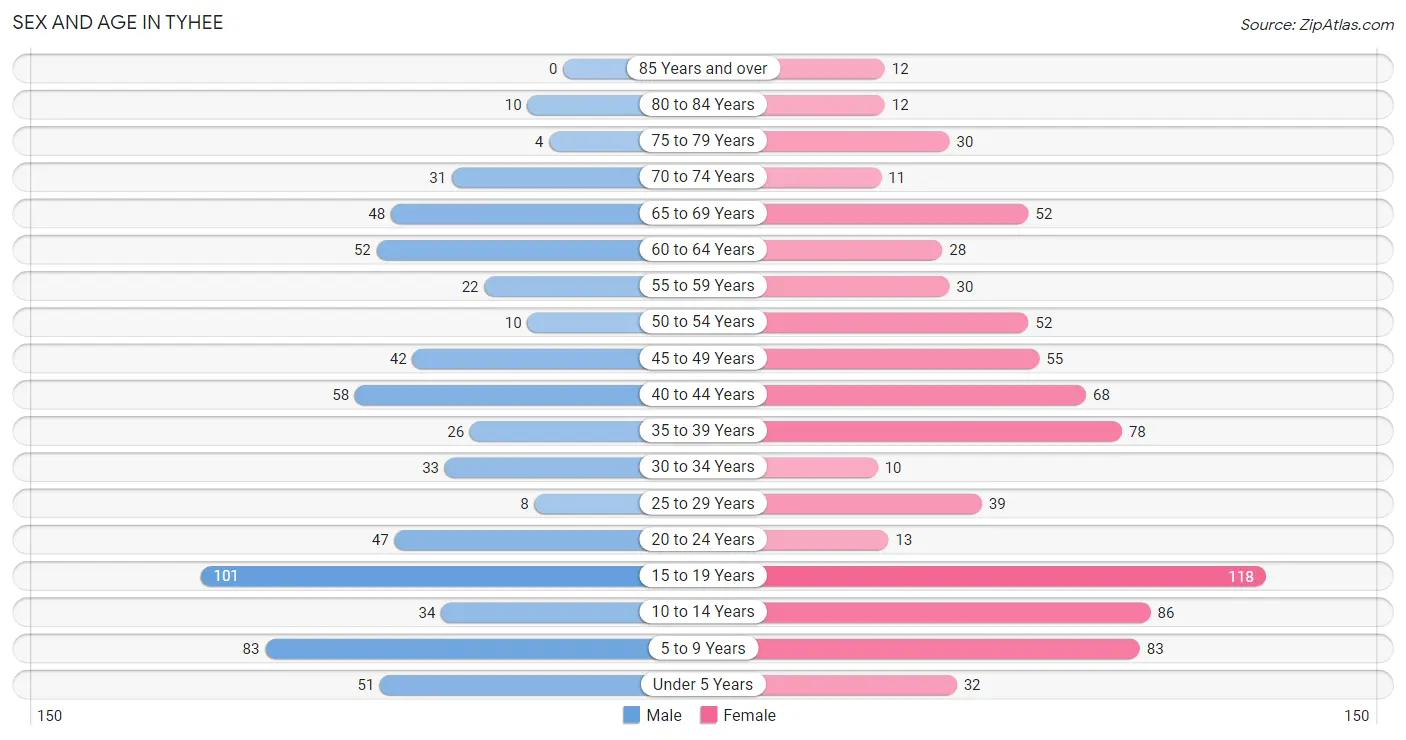
| Age Bracket | Male | Female |
| Under 5 Years | 51 (7.7%) | 32 (4.0%) |
| 5 to 9 Years | 83 (12.6%) | 83 (10.3%) |
| 10 to 14 Years | 34 (5.1%) | 86 (10.6%) |
| 15 to 19 Years | 101 (15.3%) | 118 (14.6%) |
| 20 to 24 Years | 47 (7.1%) | 13 (1.6%) |
| 25 to 29 Years | 8 (1.2%) | 39 (4.8%) |
| 30 to 34 Years | 33 (5.0%) | 10 (1.2%) |
| 35 to 39 Years | 26 (3.9%) | 78 (9.6%) |
| 40 to 44 Years | 58 (8.8%) | 68 (8.4%) |
| 45 to 49 Years | 42 (6.4%) | 55 (6.8%) |
| 50 to 54 Years | 10 (1.5%) | 52 (6.4%) |
| 55 to 59 Years | 22 (3.3%) | 30 (3.7%) |
| 60 to 64 Years | 52 (7.9%) | 28 (3.5%) |
| 65 to 69 Years | 48 (7.3%) | 52 (6.4%) |
| 70 to 74 Years | 31 (4.7%) | 11 (1.4%) |
| 75 to 79 Years | 4 (0.6%) | 30 (3.7%) |
| 80 to 84 Years | 10 (1.5%) | 12 (1.5%) |
| 85 Years and over | 0 (0.0%) | 12 (1.5%) |
| Total | 660 (100.0%) | 809 (100.0%) |
Families and Households in Tyhee
Median Family Size in Tyhee
The median family size in Tyhee is 3.67 persons per family, with single male/father families (11 | 3.0%) accounting for the largest median family size of 4.27 persons per family. On the other hand, single female/mother families (101 | 27.5%) represent the smallest median family size with 3.55 persons per family.
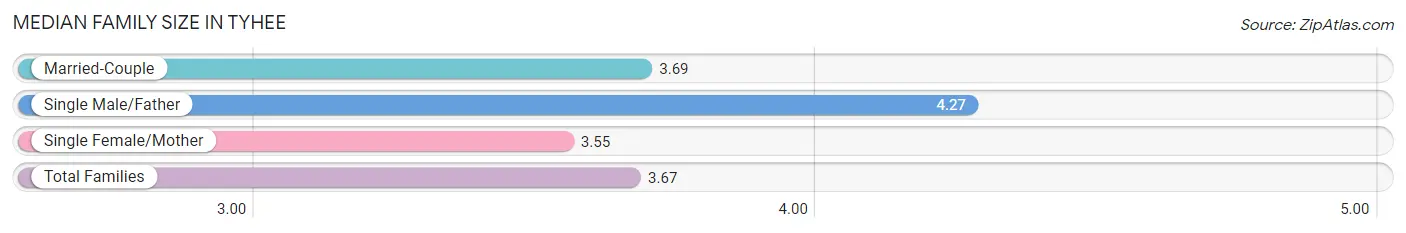
| Family Type | # Families | Family Size |
| Married-Couple | 255 (69.5%) | 3.69 |
| Single Male/Father | 11 (3.0%) | 4.27 |
| Single Female/Mother | 101 (27.5%) | 3.55 |
| Total Families | 367 (100.0%) | 3.67 |
Median Household Size in Tyhee
The median household size in Tyhee is 3.17 persons per household, with single male/father households (11 | 2.4%) accounting for the largest median household size of 4.82 persons per household. non-family households (96 | 20.7%) represent the smallest median household size with 1.14 persons per household.
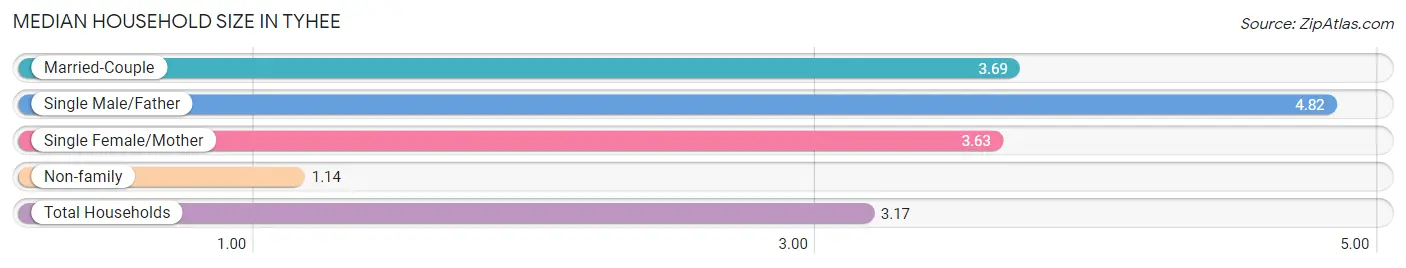
| Household Type | # Households | Household Size |
| Married-Couple | 255 (55.1%) | 3.69 |
| Single Male/Father | 11 (2.4%) | 4.82 |
| Single Female/Mother | 101 (21.8%) | 3.63 |
| Non-family | 96 (20.7%) | 1.14 |
| Total Households | 463 (100.0%) | 3.17 |
Household Size by Marriage Status in Tyhee
Out of a total of 463 households in Tyhee, 367 (79.3%) are family households, while 96 (20.7%) are nonfamily households. The most numerous type of family households are 2-person households, comprising 151, and the most common type of nonfamily households are 1-person households, comprising 81.
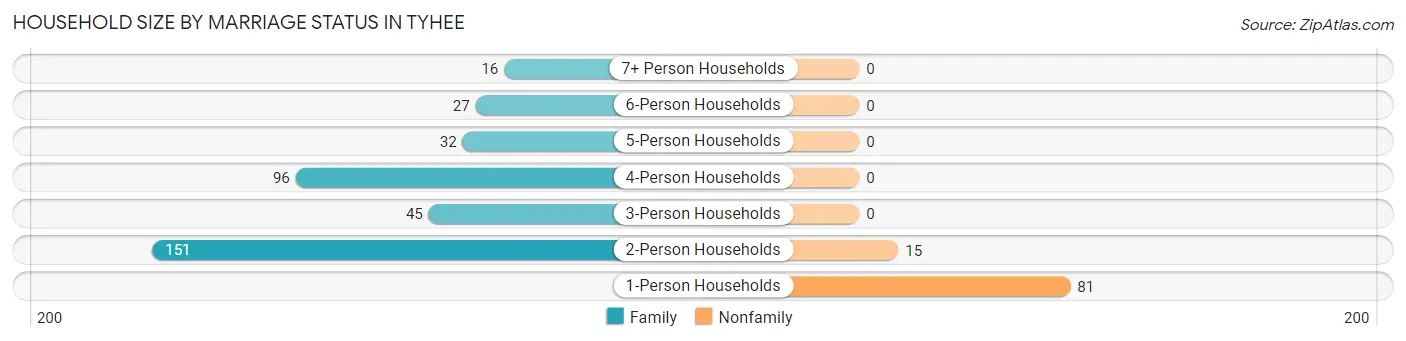
| Household Size | Family Households | Nonfamily Households |
| 1-Person Households | - | 81 (17.5%) |
| 2-Person Households | 151 (32.6%) | 15 (3.2%) |
| 3-Person Households | 45 (9.7%) | 0 (0.0%) |
| 4-Person Households | 96 (20.7%) | 0 (0.0%) |
| 5-Person Households | 32 (6.9%) | 0 (0.0%) |
| 6-Person Households | 27 (5.8%) | 0 (0.0%) |
| 7+ Person Households | 16 (3.5%) | 0 (0.0%) |
| Total | 367 (79.3%) | 96 (20.7%) |
Female Fertility in Tyhee
Fertility by Age in Tyhee
Average fertility rate in Tyhee is 63.0 births per 1,000 women. Women in the age bracket of 20 to 34 years have the highest fertility rate with 403.0 births per 1,000 women. Women in the age bracket of 20 to 34 years acount for 100.0% of all women with births.
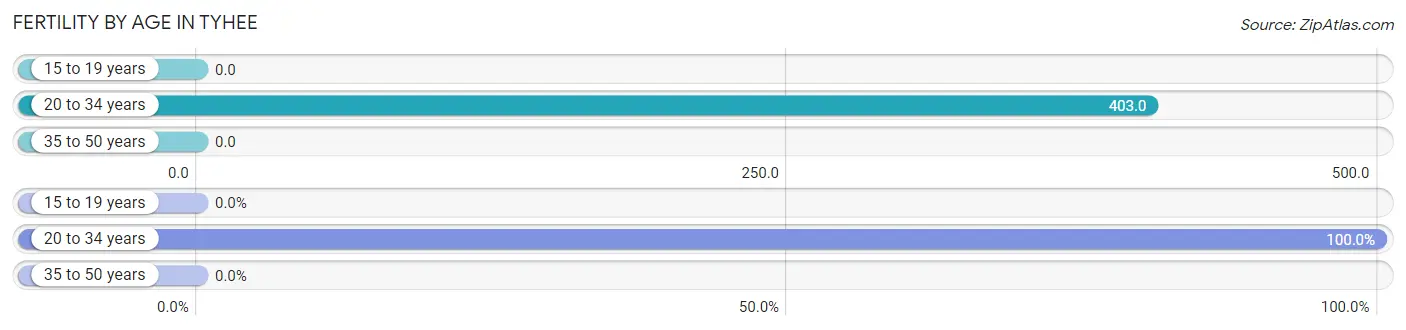
| Age Bracket | Women with Births | Births / 1,000 Women |
| 15 to 19 years | 0 (0.0%) | 0.0 |
| 20 to 34 years | 25 (100.0%) | 403.0 |
| 35 to 50 years | 0 (0.0%) | 0.0 |
| Total | 25 (100.0%) | 63.0 |
Fertility by Age by Marriage Status in Tyhee
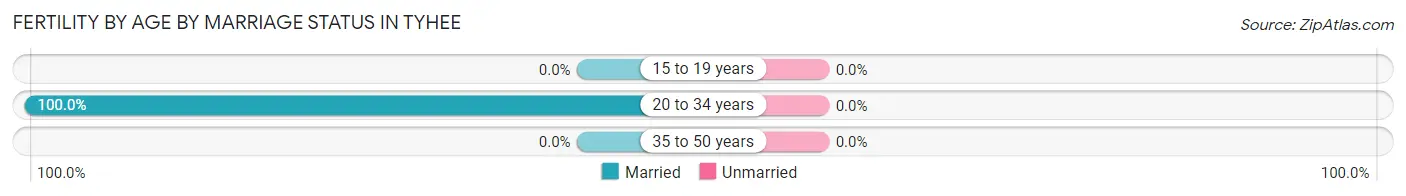
| Age Bracket | Married | Unmarried |
| 15 to 19 years | 0 (0.0%) | 0 (0.0%) |
| 20 to 34 years | 25 (100.0%) | 0 (0.0%) |
| 35 to 50 years | 0 (0.0%) | 0 (0.0%) |
| Total | 25 (100.0%) | 0 (0.0%) |
Fertility by Education in Tyhee
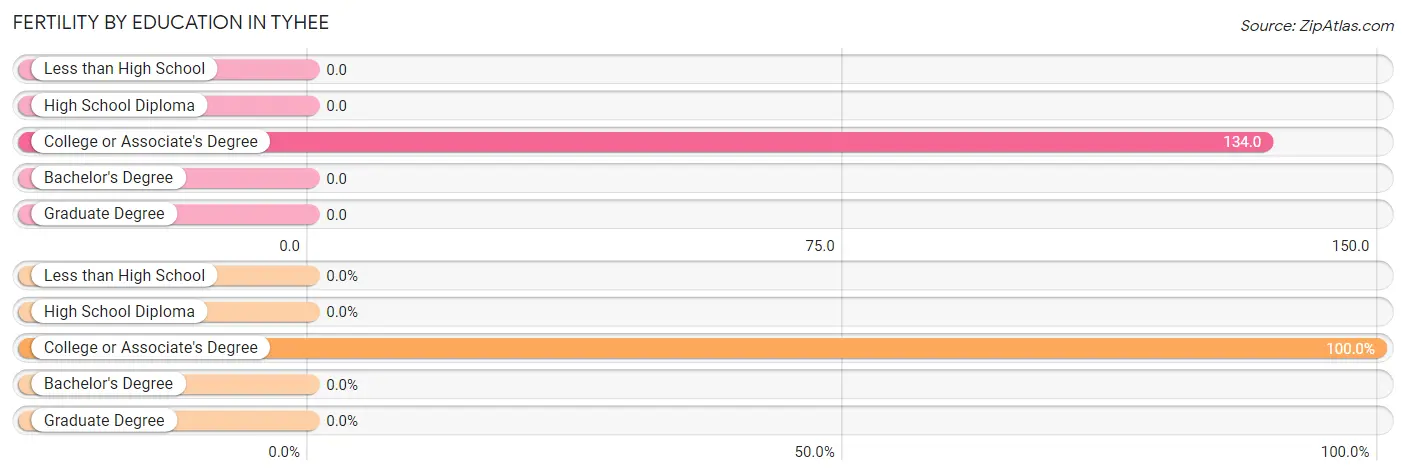
| Educational Attainment | Women with Births | Births / 1,000 Women |
| Less than High School | 0 (0.0%) | 0.0 |
| High School Diploma | 0 (0.0%) | 0.0 |
| College or Associate's Degree | 25 (100.0%) | 134.0 |
| Bachelor's Degree | 0 (0.0%) | 0.0 |
| Graduate Degree | 0 (0.0%) | 0.0 |
| Total | 25 (100.0%) | 63.0 |
Fertility by Education by Marriage Status in Tyhee
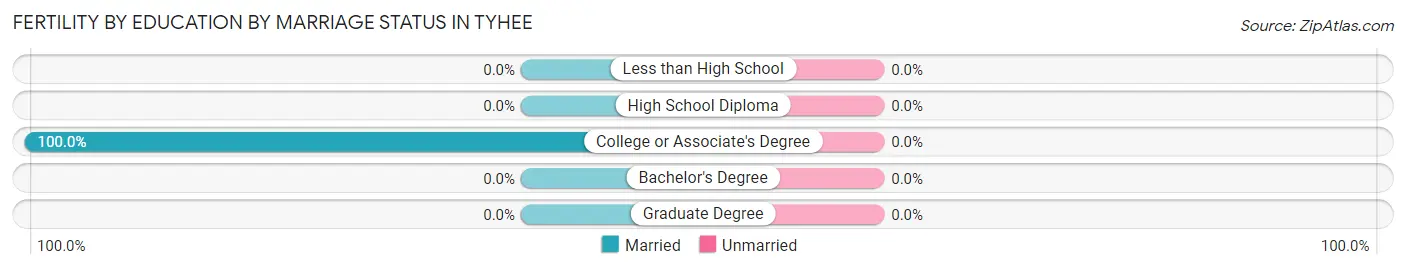
| Educational Attainment | Married | Unmarried |
| Less than High School | 0 (0.0%) | 0 (0.0%) |
| High School Diploma | 0 (0.0%) | 0 (0.0%) |
| College or Associate's Degree | 25 (100.0%) | 0 (0.0%) |
| Bachelor's Degree | 0 (0.0%) | 0 (0.0%) |
| Graduate Degree | 0 (0.0%) | 0 (0.0%) |
| Total | 25 (100.0%) | 0 (0.0%) |
Employment Characteristics in Tyhee
Employment by Class of Employer in Tyhee
Among the 568 employed individuals in Tyhee, private company employees (346 | 60.9%), state government employees (90 | 15.9%), and self-employed (incorporated) (44 | 7.7%) make up the most common classes of employment.
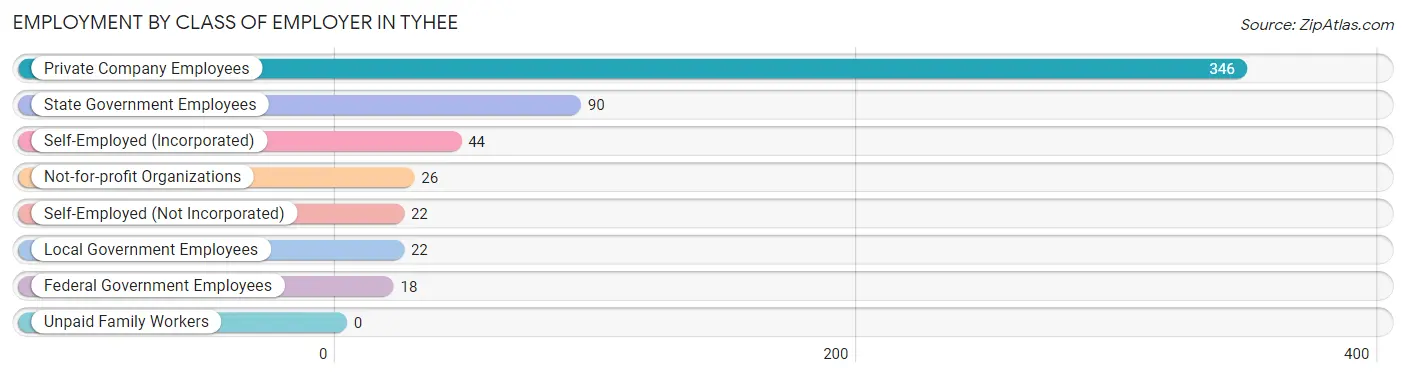
| Employer Class | # Employees | % Employees |
| Private Company Employees | 346 | 60.9% |
| Self-Employed (Incorporated) | 44 | 7.7% |
| Self-Employed (Not Incorporated) | 22 | 3.9% |
| Not-for-profit Organizations | 26 | 4.6% |
| Local Government Employees | 22 | 3.9% |
| State Government Employees | 90 | 15.9% |
| Federal Government Employees | 18 | 3.2% |
| Unpaid Family Workers | 0 | 0.0% |
| Total | 568 | 100.0% |
Employment Status by Age in Tyhee
According to the labor force statistics for Tyhee, out of the total population over 16 years of age (1,014), 62.4% or 633 individuals are in the labor force, with 9.6% or 61 of them unemployed. The age group with the highest labor force participation rate is 20 to 24 years, with 100.0% or 60 individuals in the labor force. Within the labor force, the 16 to 19 years age range has the highest percentage of unemployed individuals, with 39.1% or 25 of them being unemployed.
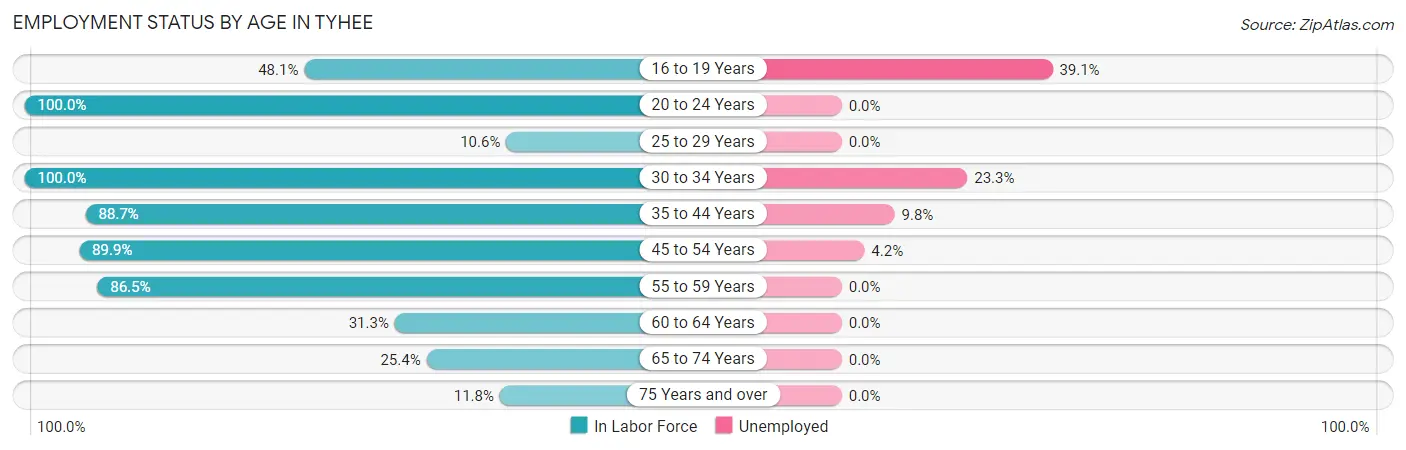
| Age Bracket | In Labor Force | Unemployed |
| 16 to 19 Years | 64 (48.1%) | 25 (39.1%) |
| 20 to 24 Years | 60 (100.0%) | 0 (0.0%) |
| 25 to 29 Years | 5 (10.6%) | 0 (0.0%) |
| 30 to 34 Years | 43 (100.0%) | 10 (23.3%) |
| 35 to 44 Years | 204 (88.7%) | 20 (9.8%) |
| 45 to 54 Years | 143 (89.9%) | 6 (4.2%) |
| 55 to 59 Years | 45 (86.5%) | 0 (0.0%) |
| 60 to 64 Years | 25 (31.3%) | 0 (0.0%) |
| 65 to 74 Years | 36 (25.4%) | 0 (0.0%) |
| 75 Years and over | 8 (11.8%) | 0 (0.0%) |
| Total | 633 (62.4%) | 61 (9.6%) |
Employment Status by Educational Attainment in Tyhee
According to labor force statistics for Tyhee, 76.1% of individuals (465) out of the total population between 25 and 64 years of age (611) are in the labor force, with 7.7% or 36 of them being unemployed. The group with the highest labor force participation rate are those with the educational attainment of less than high school, with 80.5% or 33 individuals in the labor force. Within the labor force, individuals with high school diploma education have the highest percentage of unemployment, with 42.4% or 36 of them being unemployed.
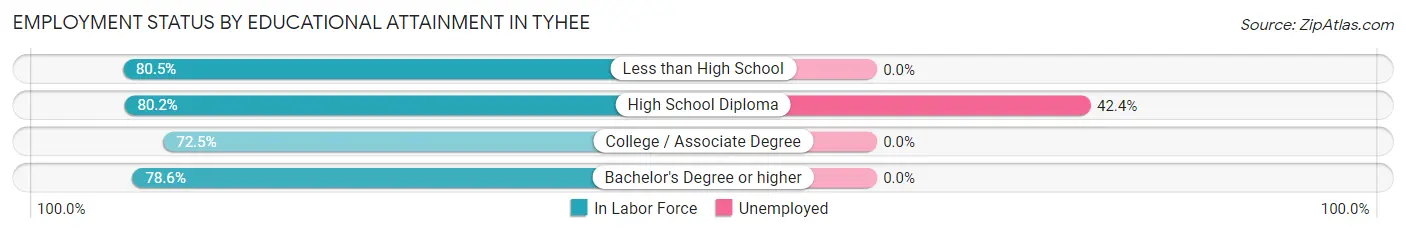
| Educational Attainment | In Labor Force | Unemployed |
| Less than High School | 33 (80.5%) | 0 (0.0%) |
| High School Diploma | 85 (80.2%) | 45 (42.4%) |
| College / Associate Degree | 211 (72.5%) | 0 (0.0%) |
| Bachelor's Degree or higher | 136 (78.6%) | 0 (0.0%) |
| Total | 465 (76.1%) | 47 (7.7%) |
Employment Occupations by Sex in Tyhee
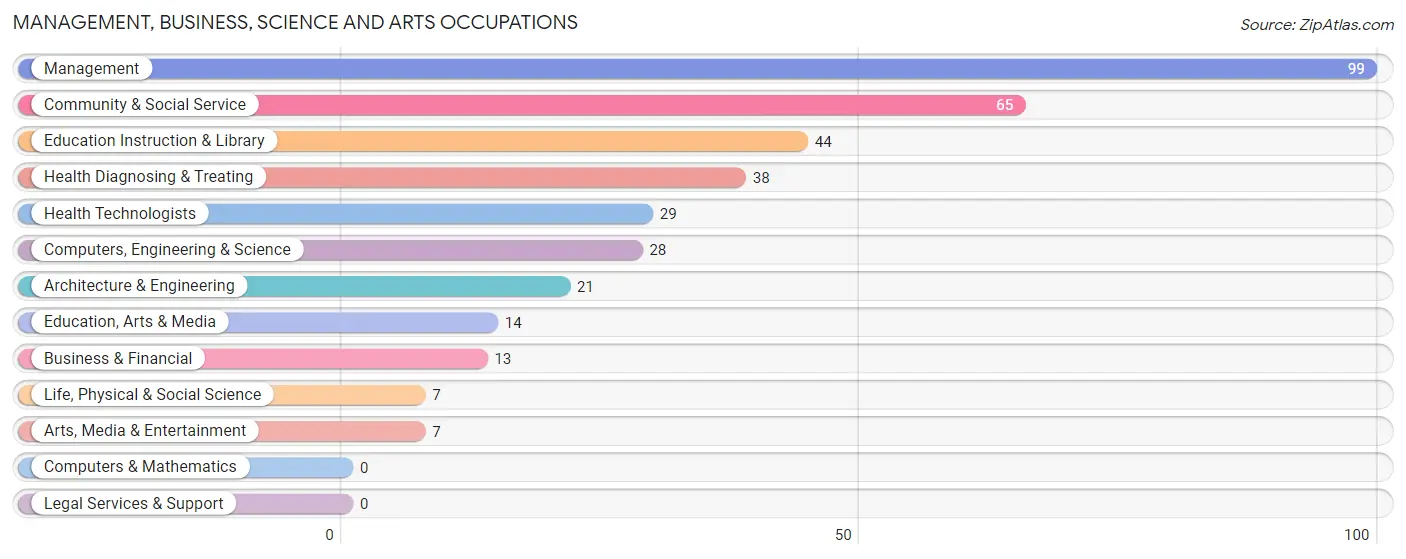
Management, Business, Science and Arts Occupations
The most common Management, Business, Science and Arts occupations in Tyhee are Management (99 | 17.3%), Community & Social Service (65 | 11.4%), Education Instruction & Library (44 | 7.7%), Health Diagnosing & Treating (38 | 6.6%), and Health Technologists (29 | 5.1%).
Management, Business, Science and Arts Occupations by Sex
Within the Management, Business, Science and Arts occupations in Tyhee, the most male-oriented occupations are Business & Financial (100.0%), Architecture & Engineering (100.0%), and Arts, Media & Entertainment (100.0%), while the most female-oriented occupations are Life, Physical & Social Science (100.0%), Education Instruction & Library (88.6%), and Community & Social Service (69.2%).
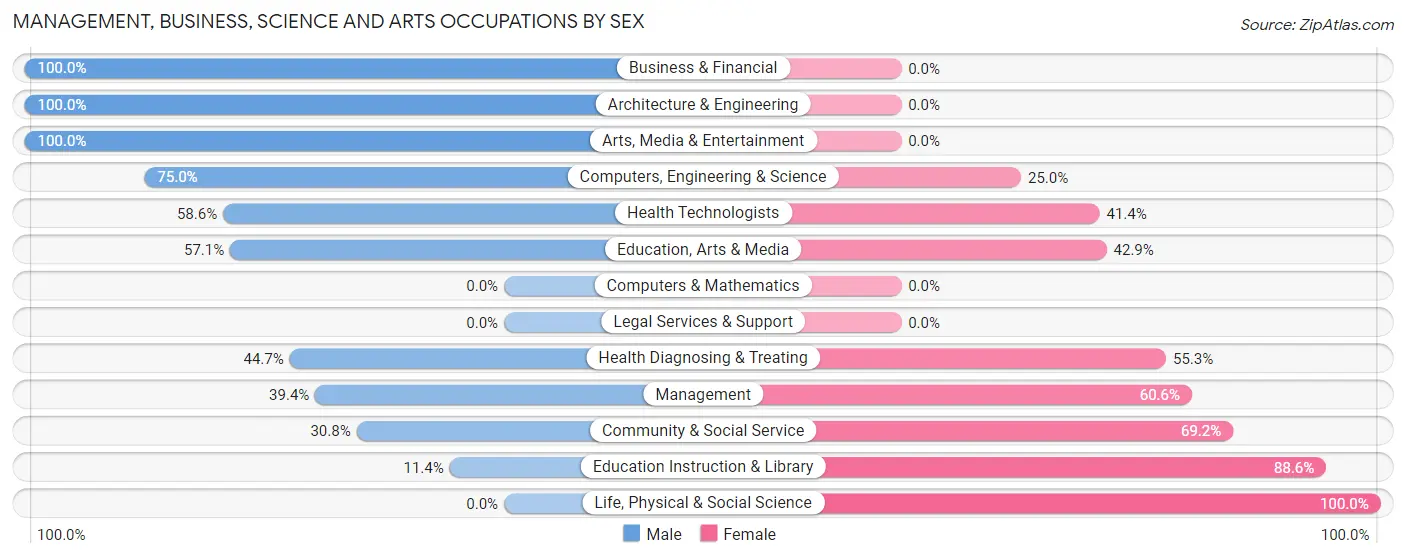
| Occupation | Male | Female |
| Management | 39 (39.4%) | 60 (60.6%) |
| Business & Financial | 13 (100.0%) | 0 (0.0%) |
| Computers, Engineering & Science | 21 (75.0%) | 7 (25.0%) |
| Computers & Mathematics | 0 (0.0%) | 0 (0.0%) |
| Architecture & Engineering | 21 (100.0%) | 0 (0.0%) |
| Life, Physical & Social Science | 0 (0.0%) | 7 (100.0%) |
| Community & Social Service | 20 (30.8%) | 45 (69.2%) |
| Education, Arts & Media | 8 (57.1%) | 6 (42.9%) |
| Legal Services & Support | 0 (0.0%) | 0 (0.0%) |
| Education Instruction & Library | 5 (11.4%) | 39 (88.6%) |
| Arts, Media & Entertainment | 7 (100.0%) | 0 (0.0%) |
| Health Diagnosing & Treating | 17 (44.7%) | 21 (55.3%) |
| Health Technologists | 17 (58.6%) | 12 (41.4%) |
| Total (Category) | 110 (45.3%) | 133 (54.7%) |
| Total (Overall) | 270 (47.2%) | 302 (52.8%) |
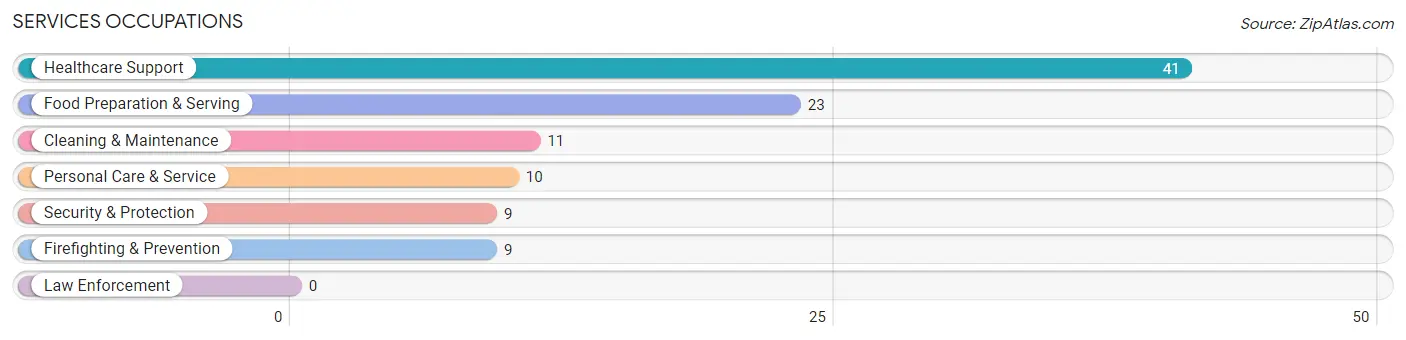
Services Occupations
The most common Services occupations in Tyhee are Healthcare Support (41 | 7.2%), Food Preparation & Serving (23 | 4.0%), Cleaning & Maintenance (11 | 1.9%), Personal Care & Service (10 | 1.8%), and Security & Protection (9 | 1.6%).
Services Occupations by Sex
Within the Services occupations in Tyhee, the most male-oriented occupations are Security & Protection (100.0%), Firefighting & Prevention (100.0%), and Cleaning & Maintenance (100.0%), while the most female-oriented occupations are Healthcare Support (100.0%), Personal Care & Service (100.0%), and Food Preparation & Serving (56.5%).
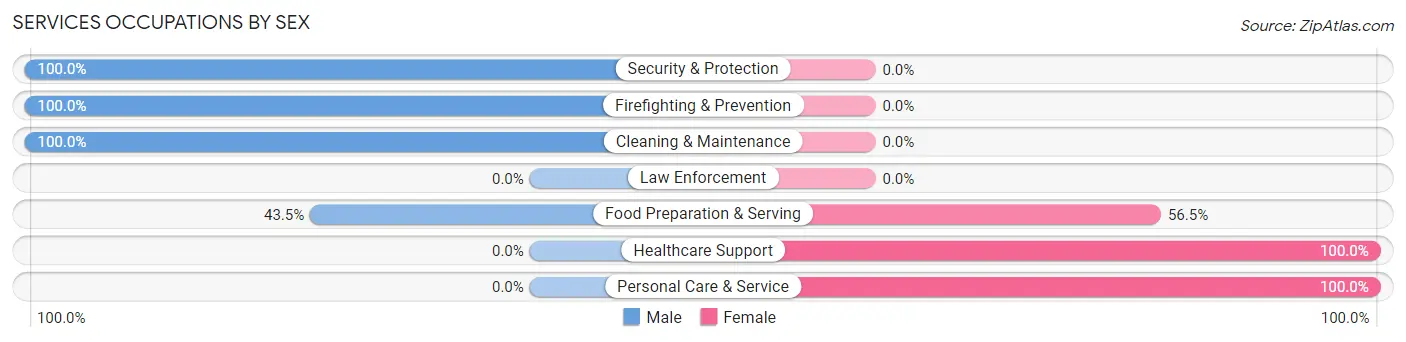
| Occupation | Male | Female |
| Healthcare Support | 0 (0.0%) | 41 (100.0%) |
| Security & Protection | 9 (100.0%) | 0 (0.0%) |
| Firefighting & Prevention | 9 (100.0%) | 0 (0.0%) |
| Law Enforcement | 0 (0.0%) | 0 (0.0%) |
| Food Preparation & Serving | 10 (43.5%) | 13 (56.5%) |
| Cleaning & Maintenance | 11 (100.0%) | 0 (0.0%) |
| Personal Care & Service | 0 (0.0%) | 10 (100.0%) |
| Total (Category) | 30 (31.9%) | 64 (68.1%) |
| Total (Overall) | 270 (47.2%) | 302 (52.8%) |
Sales and Office Occupations
The most common Sales and Office occupations in Tyhee are Office & Administration (89 | 15.6%), and Sales & Related (37 | 6.5%).

Sales and Office Occupations by Sex
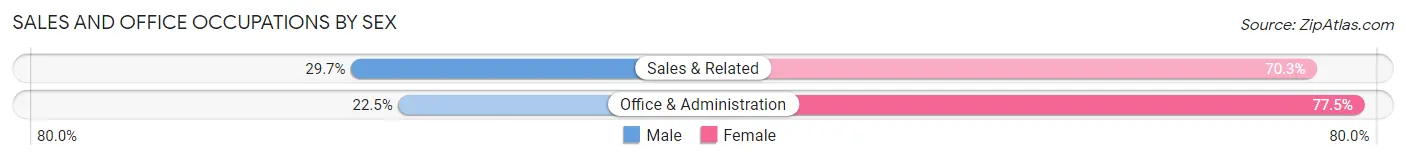
| Occupation | Male | Female |
| Sales & Related | 11 (29.7%) | 26 (70.3%) |
| Office & Administration | 20 (22.5%) | 69 (77.5%) |
| Total (Category) | 31 (24.6%) | 95 (75.4%) |
| Total (Overall) | 270 (47.2%) | 302 (52.8%) |
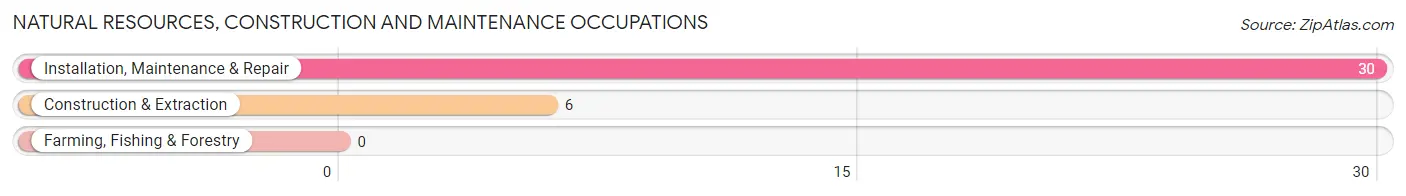
Natural Resources, Construction and Maintenance Occupations
The most common Natural Resources, Construction and Maintenance occupations in Tyhee are Installation, Maintenance & Repair (30 | 5.2%), and Construction & Extraction (6 | 1.1%).
Natural Resources, Construction and Maintenance Occupations by Sex
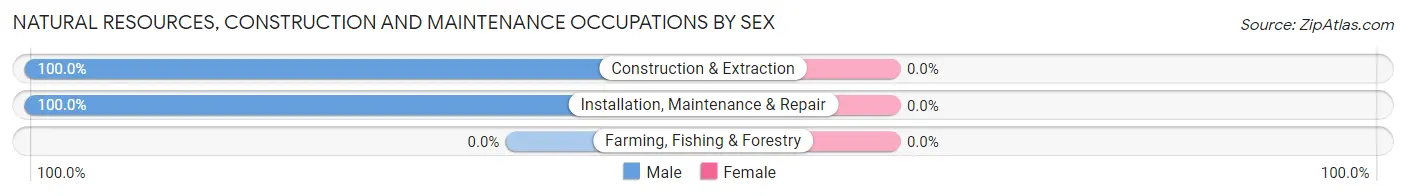
| Occupation | Male | Female |
| Farming, Fishing & Forestry | 0 (0.0%) | 0 (0.0%) |
| Construction & Extraction | 6 (100.0%) | 0 (0.0%) |
| Installation, Maintenance & Repair | 30 (100.0%) | 0 (0.0%) |
| Total (Category) | 36 (100.0%) | 0 (0.0%) |
| Total (Overall) | 270 (47.2%) | 302 (52.8%) |
Production, Transportation and Moving Occupations
The most common Production, Transportation and Moving occupations in Tyhee are Material Moving (38 | 6.6%), Transportation (18 | 3.2%), and Production (17 | 3.0%).
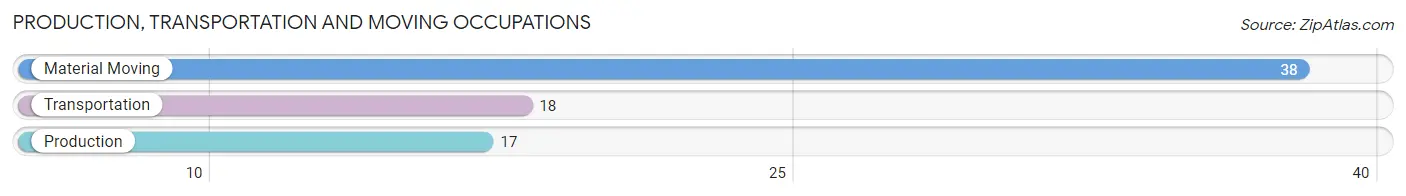
Production, Transportation and Moving Occupations by Sex
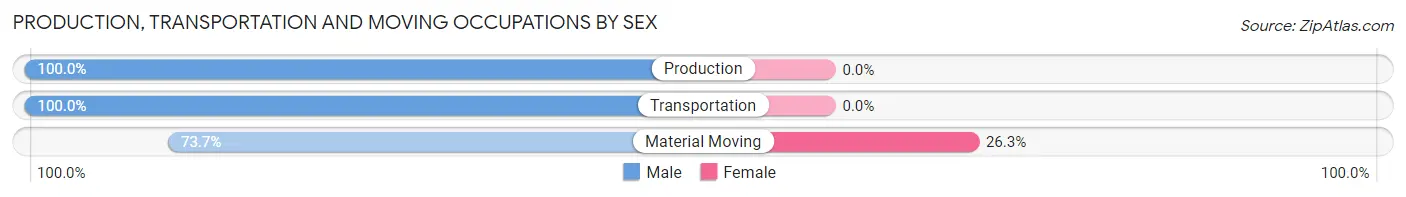
| Occupation | Male | Female |
| Production | 17 (100.0%) | 0 (0.0%) |
| Transportation | 18 (100.0%) | 0 (0.0%) |
| Material Moving | 28 (73.7%) | 10 (26.3%) |
| Total (Category) | 63 (86.3%) | 10 (13.7%) |
| Total (Overall) | 270 (47.2%) | 302 (52.8%) |
Employment Industries by Sex in Tyhee
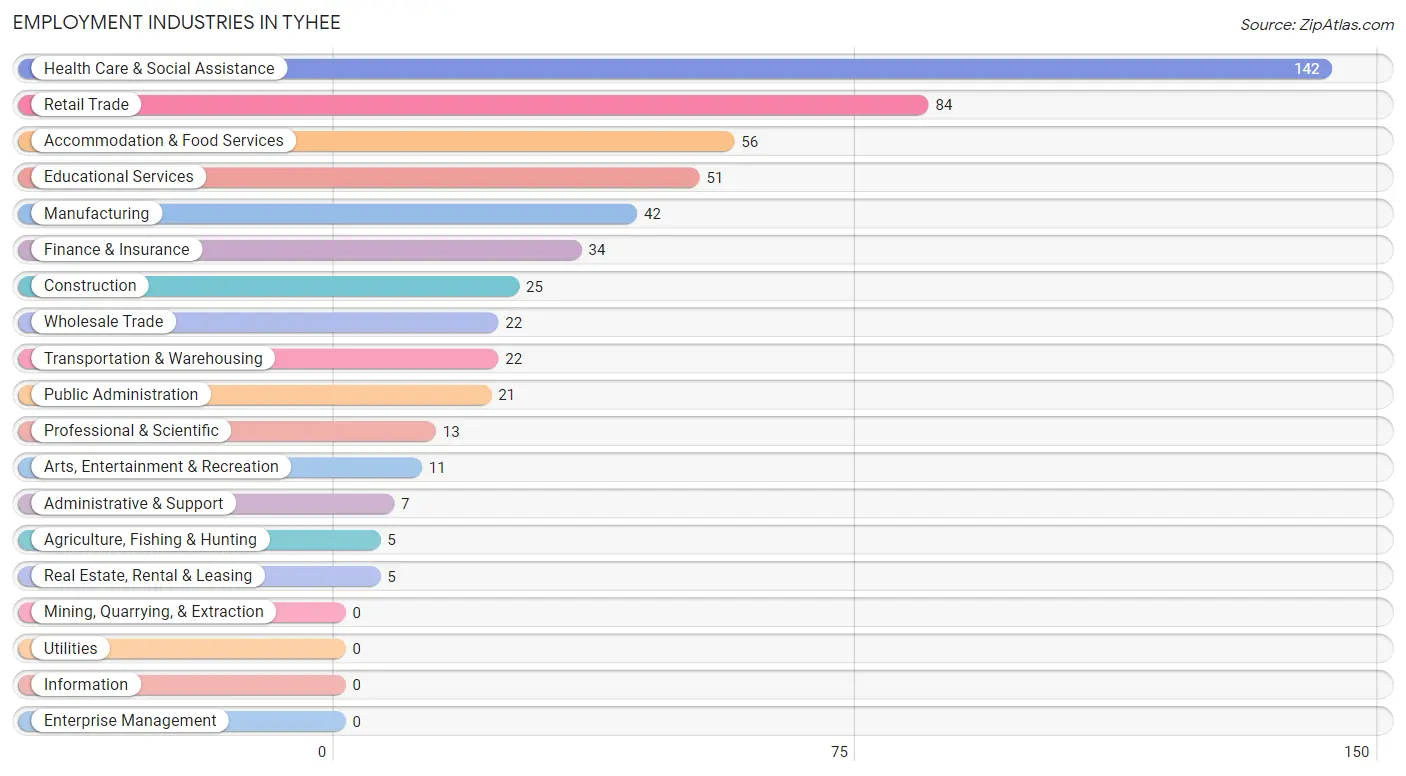
Employment Industries in Tyhee
The major employment industries in Tyhee include Health Care & Social Assistance (142 | 24.8%), Retail Trade (84 | 14.7%), Accommodation & Food Services (56 | 9.8%), Educational Services (51 | 8.9%), and Manufacturing (42 | 7.3%).
Employment Industries by Sex in Tyhee
The Tyhee industries that see more men than women are Agriculture, Fishing & Hunting (100.0%), Construction (100.0%), and Manufacturing (100.0%), whereas the industries that tend to have a higher number of women are Wholesale Trade (100.0%), Public Administration (100.0%), and Educational Services (92.2%).
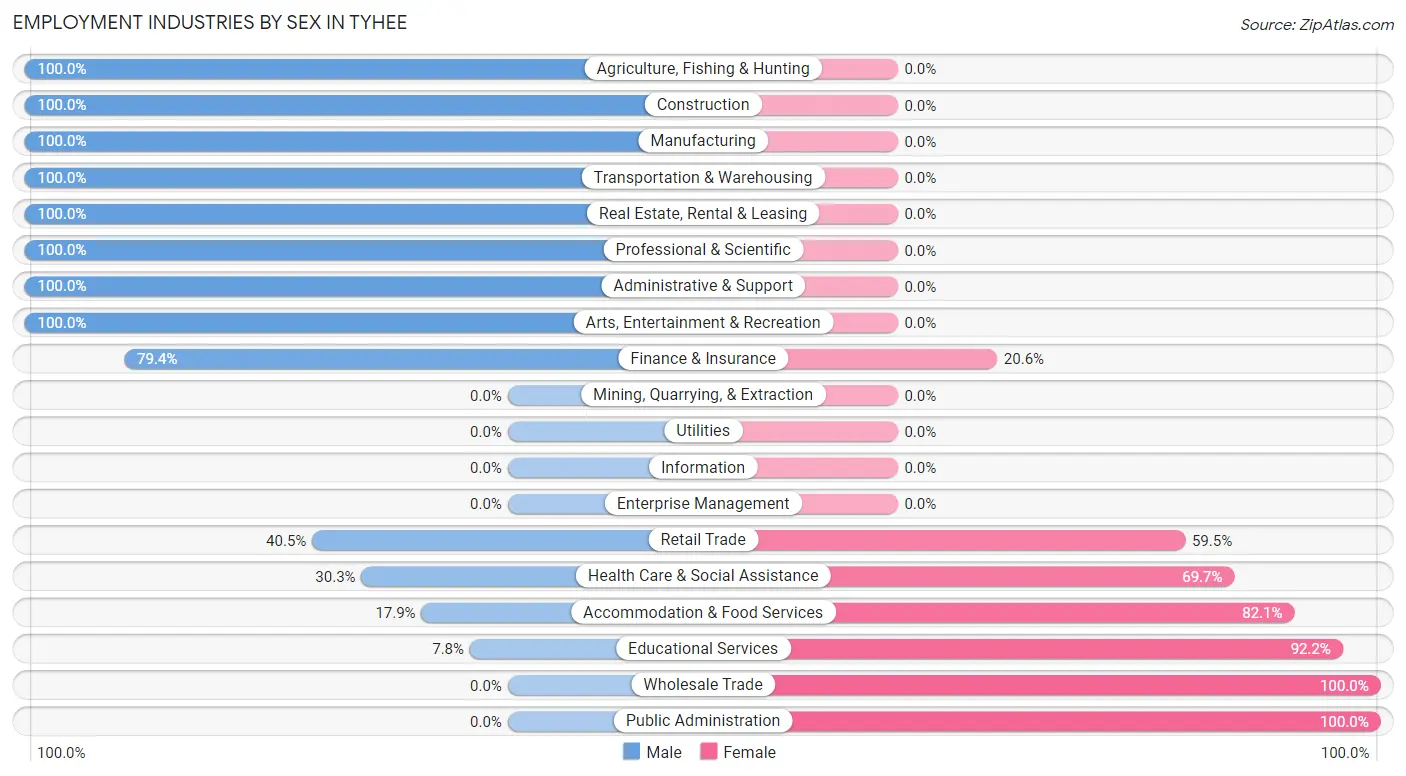
| Industry | Male | Female |
| Agriculture, Fishing & Hunting | 5 (100.0%) | 0 (0.0%) |
| Mining, Quarrying, & Extraction | 0 (0.0%) | 0 (0.0%) |
| Construction | 25 (100.0%) | 0 (0.0%) |
| Manufacturing | 42 (100.0%) | 0 (0.0%) |
| Wholesale Trade | 0 (0.0%) | 22 (100.0%) |
| Retail Trade | 34 (40.5%) | 50 (59.5%) |
| Transportation & Warehousing | 22 (100.0%) | 0 (0.0%) |
| Utilities | 0 (0.0%) | 0 (0.0%) |
| Information | 0 (0.0%) | 0 (0.0%) |
| Finance & Insurance | 27 (79.4%) | 7 (20.6%) |
| Real Estate, Rental & Leasing | 5 (100.0%) | 0 (0.0%) |
| Professional & Scientific | 13 (100.0%) | 0 (0.0%) |
| Enterprise Management | 0 (0.0%) | 0 (0.0%) |
| Administrative & Support | 7 (100.0%) | 0 (0.0%) |
| Educational Services | 4 (7.8%) | 47 (92.2%) |
| Health Care & Social Assistance | 43 (30.3%) | 99 (69.7%) |
| Arts, Entertainment & Recreation | 11 (100.0%) | 0 (0.0%) |
| Accommodation & Food Services | 10 (17.9%) | 46 (82.1%) |
| Public Administration | 0 (0.0%) | 21 (100.0%) |
| Total | 270 (47.2%) | 302 (52.8%) |
Education in Tyhee
School Enrollment in Tyhee
The most common levels of schooling among the 602 students in Tyhee are high school (181 | 30.1%), elementary school (172 | 28.6%), and middle school (122 | 20.3%).
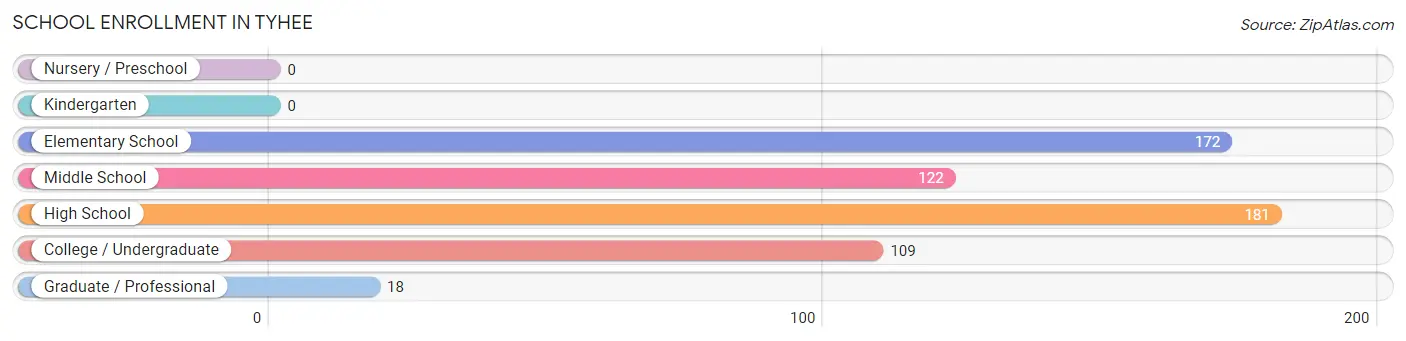
| School Level | # Students | % Students |
| Nursery / Preschool | 0 | 0.0% |
| Kindergarten | 0 | 0.0% |
| Elementary School | 172 | 28.6% |
| Middle School | 122 | 20.3% |
| High School | 181 | 30.1% |
| College / Undergraduate | 109 | 18.1% |
| Graduate / Professional | 18 | 3.0% |
| Total | 602 | 100.0% |
School Enrollment by Age by Funding Source in Tyhee
Out of a total of 602 students who are enrolled in schools in Tyhee, 24 (4.0%) attend a private institution, while the remaining 578 (96.0%) are enrolled in public schools. The age group of 35 years and over has the highest likelihood of being enrolled in private schools, with 18 (41.9% in the age bracket) enrolled. Conversely, the age group of 5 to 9 year old has the lowest likelihood of being enrolled in a private school, with 166 (100.0% in the age bracket) attending a public institution.
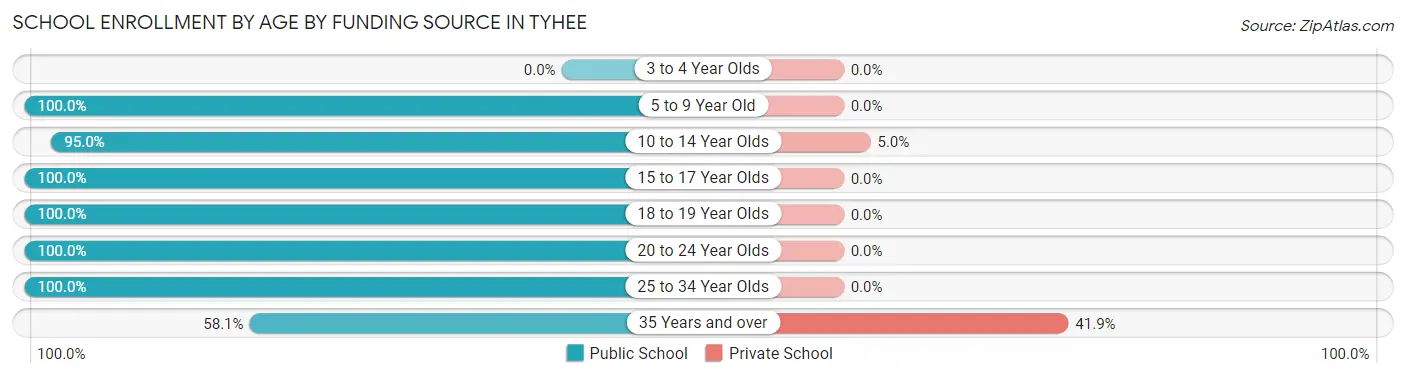
| Age Bracket | Public School | Private School |
| 3 to 4 Year Olds | 0 (0.0%) | 0 (0.0%) |
| 5 to 9 Year Old | 166 (100.0%) | 0 (0.0%) |
| 10 to 14 Year Olds | 114 (95.0%) | 6 (5.0%) |
| 15 to 17 Year Olds | 143 (100.0%) | 0 (0.0%) |
| 18 to 19 Year Olds | 54 (100.0%) | 0 (0.0%) |
| 20 to 24 Year Olds | 51 (100.0%) | 0 (0.0%) |
| 25 to 34 Year Olds | 25 (100.0%) | 0 (0.0%) |
| 35 Years and over | 25 (58.1%) | 18 (41.9%) |
| Total | 578 (96.0%) | 24 (4.0%) |
Educational Attainment by Field of Study in Tyhee
Science & technology (74 | 29.8%), education (54 | 21.8%), arts & humanities (30 | 12.1%), engineering (20 | 8.1%), and social sciences (16 | 6.5%) are the most common fields of study among 248 individuals in Tyhee who have obtained a bachelor's degree or higher.
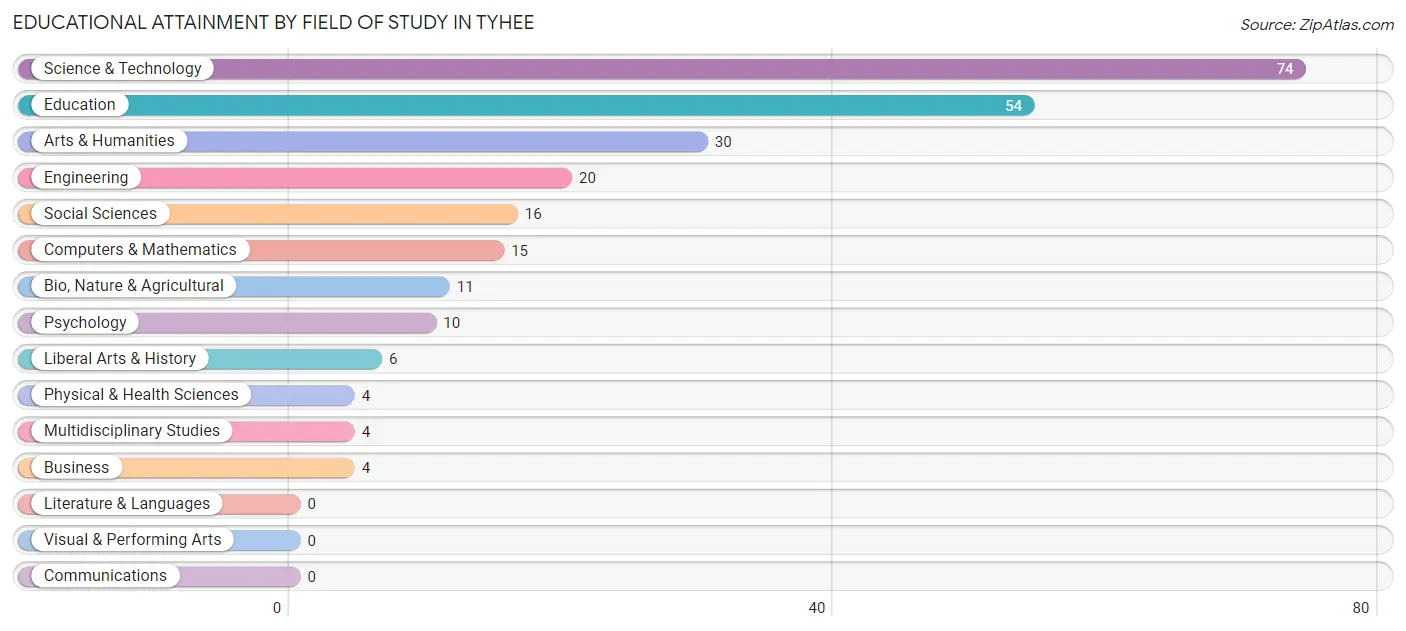
| Field of Study | # Graduates | % Graduates |
| Computers & Mathematics | 15 | 6.0% |
| Bio, Nature & Agricultural | 11 | 4.4% |
| Physical & Health Sciences | 4 | 1.6% |
| Psychology | 10 | 4.0% |
| Social Sciences | 16 | 6.5% |
| Engineering | 20 | 8.1% |
| Multidisciplinary Studies | 4 | 1.6% |
| Science & Technology | 74 | 29.8% |
| Business | 4 | 1.6% |
| Education | 54 | 21.8% |
| Literature & Languages | 0 | 0.0% |
| Liberal Arts & History | 6 | 2.4% |
| Visual & Performing Arts | 0 | 0.0% |
| Communications | 0 | 0.0% |
| Arts & Humanities | 30 | 12.1% |
| Total | 248 | 100.0% |
Transportation & Commute in Tyhee
Vehicle Availability by Sex in Tyhee
The most prevalent vehicle ownership categories in Tyhee are males with 3 vehicles (94, accounting for 35.3%) and females with 3 vehicles (84, making up 31.1%).
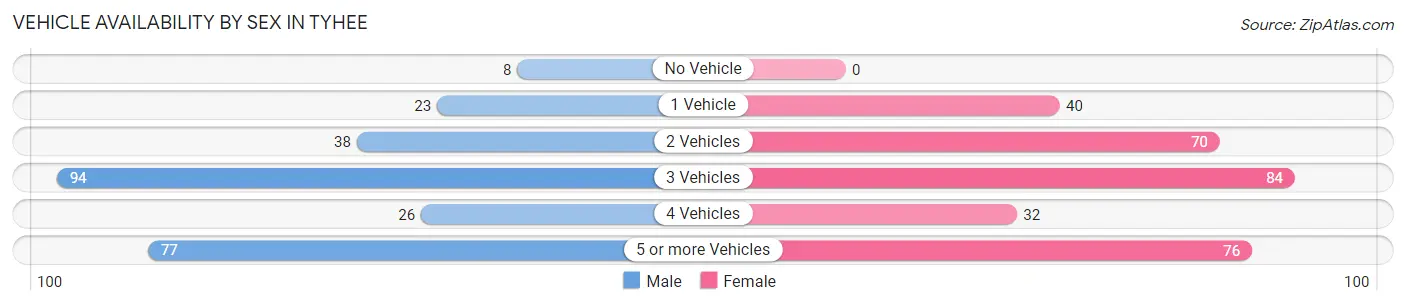
| Vehicles Available | Male | Female |
| No Vehicle | 8 (3.0%) | 0 (0.0%) |
| 1 Vehicle | 23 (8.6%) | 40 (13.3%) |
| 2 Vehicles | 38 (14.3%) | 70 (23.2%) |
| 3 Vehicles | 94 (35.3%) | 84 (27.8%) |
| 4 Vehicles | 26 (9.8%) | 32 (10.6%) |
| 5 or more Vehicles | 77 (28.9%) | 76 (25.2%) |
| Total | 266 (100.0%) | 302 (100.0%) |
Commute Time in Tyhee
The most frequently occuring commute durations in Tyhee are 10 to 14 minutes (191 commuters, 36.0%), 15 to 19 minutes (128 commuters, 24.1%), and 20 to 24 minutes (74 commuters, 14.0%).
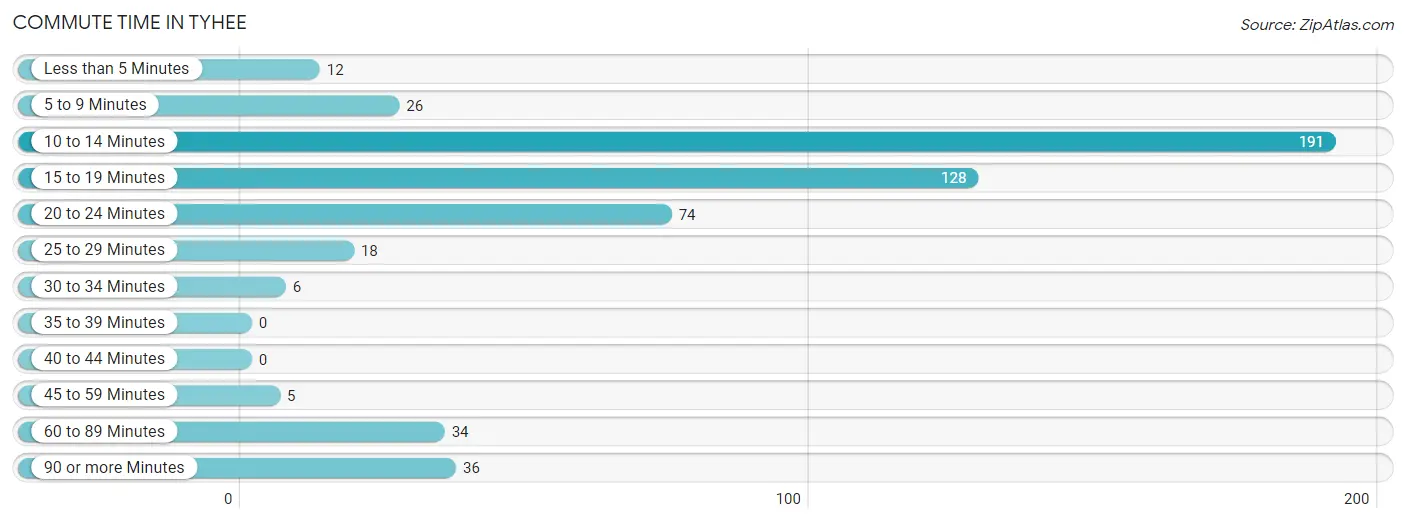
| Commute Time | # Commuters | % Commuters |
| Less than 5 Minutes | 12 | 2.3% |
| 5 to 9 Minutes | 26 | 4.9% |
| 10 to 14 Minutes | 191 | 36.0% |
| 15 to 19 Minutes | 128 | 24.1% |
| 20 to 24 Minutes | 74 | 14.0% |
| 25 to 29 Minutes | 18 | 3.4% |
| 30 to 34 Minutes | 6 | 1.1% |
| 35 to 39 Minutes | 0 | 0.0% |
| 40 to 44 Minutes | 0 | 0.0% |
| 45 to 59 Minutes | 5 | 0.9% |
| 60 to 89 Minutes | 34 | 6.4% |
| 90 or more Minutes | 36 | 6.8% |
Commute Time by Sex in Tyhee
The most common commute times in Tyhee are 10 to 14 minutes (120 commuters, 47.2%) for males and 15 to 19 minutes (76 commuters, 27.5%) for females.
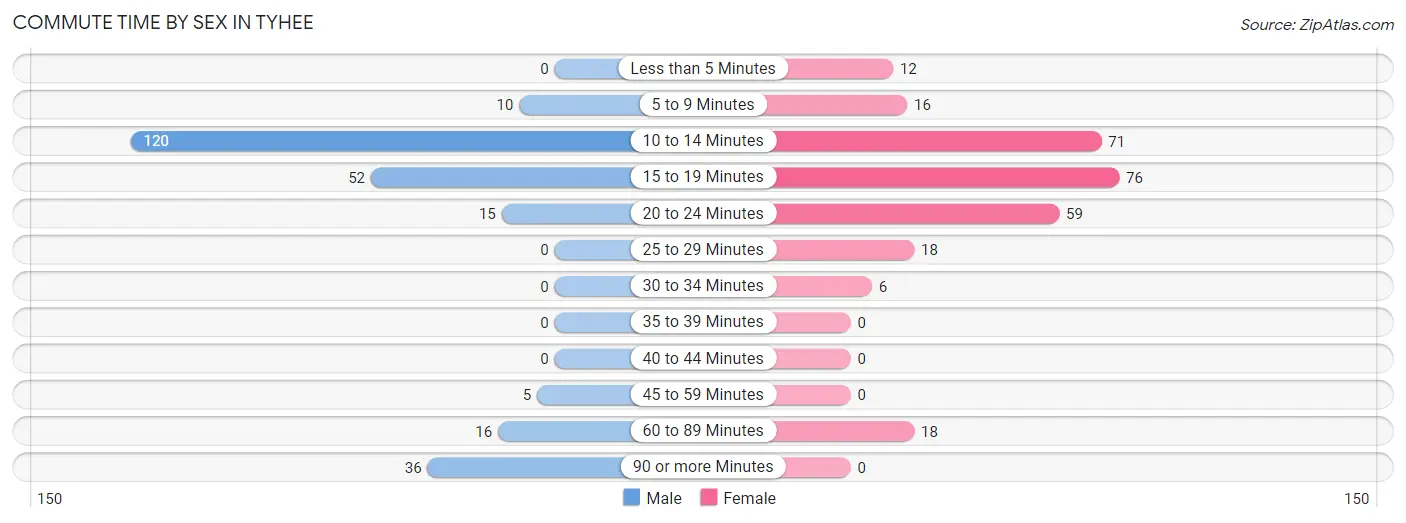
| Commute Time | Male | Female |
| Less than 5 Minutes | 0 (0.0%) | 12 (4.3%) |
| 5 to 9 Minutes | 10 (3.9%) | 16 (5.8%) |
| 10 to 14 Minutes | 120 (47.2%) | 71 (25.7%) |
| 15 to 19 Minutes | 52 (20.5%) | 76 (27.5%) |
| 20 to 24 Minutes | 15 (5.9%) | 59 (21.4%) |
| 25 to 29 Minutes | 0 (0.0%) | 18 (6.5%) |
| 30 to 34 Minutes | 0 (0.0%) | 6 (2.2%) |
| 35 to 39 Minutes | 0 (0.0%) | 0 (0.0%) |
| 40 to 44 Minutes | 0 (0.0%) | 0 (0.0%) |
| 45 to 59 Minutes | 5 (2.0%) | 0 (0.0%) |
| 60 to 89 Minutes | 16 (6.3%) | 18 (6.5%) |
| 90 or more Minutes | 36 (14.2%) | 0 (0.0%) |
Time of Departure to Work by Sex in Tyhee
The most frequent times of departure to work in Tyhee are 5:30 AM to 5:59 AM (48, 18.9%) for males and 7:30 AM to 7:59 AM (56, 20.3%) for females.
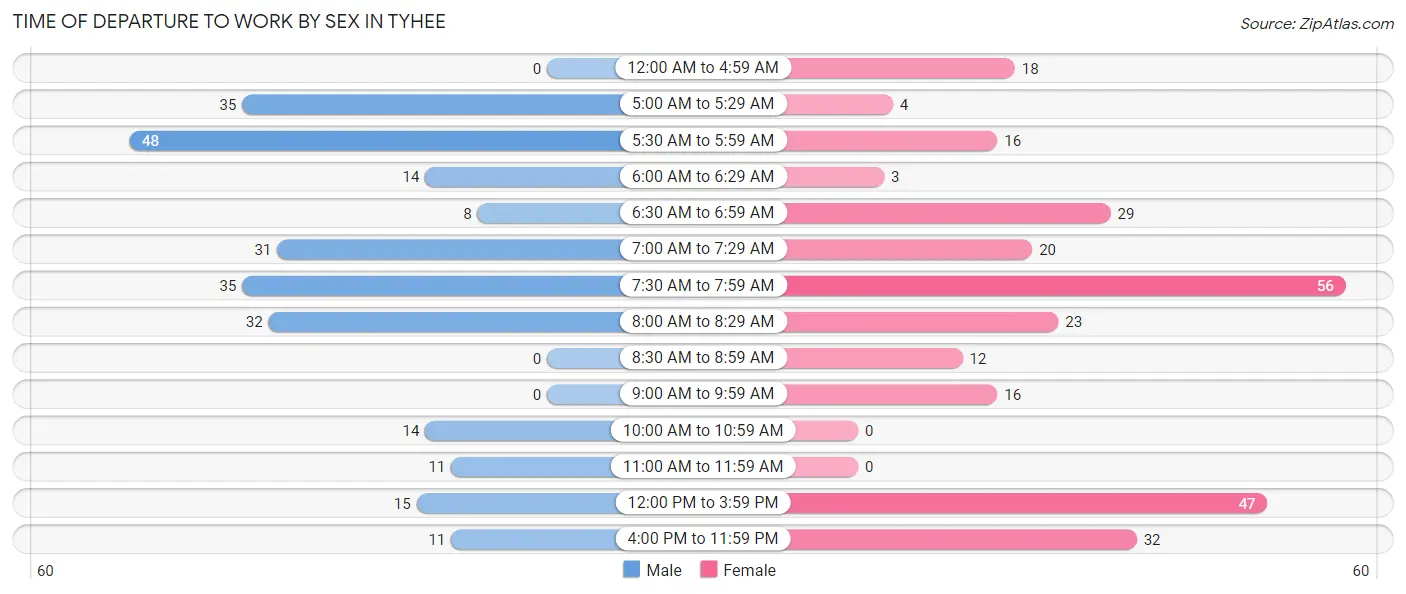
| Time of Departure | Male | Female |
| 12:00 AM to 4:59 AM | 0 (0.0%) | 18 (6.5%) |
| 5:00 AM to 5:29 AM | 35 (13.8%) | 4 (1.5%) |
| 5:30 AM to 5:59 AM | 48 (18.9%) | 16 (5.8%) |
| 6:00 AM to 6:29 AM | 14 (5.5%) | 3 (1.1%) |
| 6:30 AM to 6:59 AM | 8 (3.2%) | 29 (10.5%) |
| 7:00 AM to 7:29 AM | 31 (12.2%) | 20 (7.2%) |
| 7:30 AM to 7:59 AM | 35 (13.8%) | 56 (20.3%) |
| 8:00 AM to 8:29 AM | 32 (12.6%) | 23 (8.3%) |
| 8:30 AM to 8:59 AM | 0 (0.0%) | 12 (4.3%) |
| 9:00 AM to 9:59 AM | 0 (0.0%) | 16 (5.8%) |
| 10:00 AM to 10:59 AM | 14 (5.5%) | 0 (0.0%) |
| 11:00 AM to 11:59 AM | 11 (4.3%) | 0 (0.0%) |
| 12:00 PM to 3:59 PM | 15 (5.9%) | 47 (17.0%) |
| 4:00 PM to 11:59 PM | 11 (4.3%) | 32 (11.6%) |
| Total | 254 (100.0%) | 276 (100.0%) |
Housing Occupancy in Tyhee
Occupancy by Ownership in Tyhee
Of the total 463 dwellings in Tyhee, owner-occupied units account for 352 (76.0%), while renter-occupied units make up 111 (24.0%).
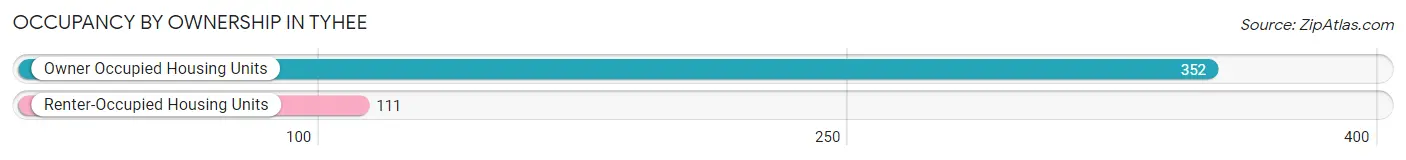
| Occupancy | # Housing Units | % Housing Units |
| Owner Occupied Housing Units | 352 | 76.0% |
| Renter-Occupied Housing Units | 111 | 24.0% |
| Total Occupied Housing Units | 463 | 100.0% |
Occupancy by Household Size in Tyhee
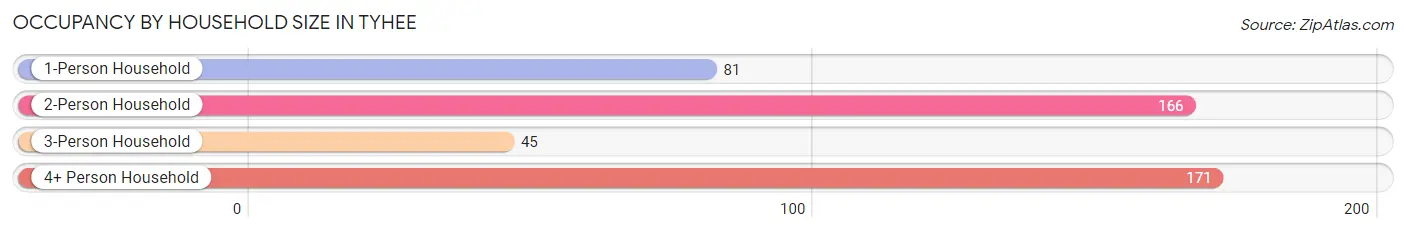
| Household Size | # Housing Units | % Housing Units |
| 1-Person Household | 81 | 17.5% |
| 2-Person Household | 166 | 35.8% |
| 3-Person Household | 45 | 9.7% |
| 4+ Person Household | 171 | 36.9% |
| Total Housing Units | 463 | 100.0% |
Occupancy by Ownership by Household Size in Tyhee
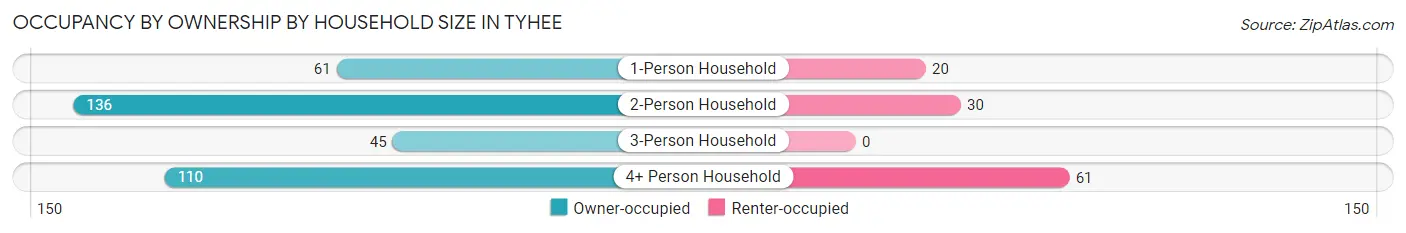
| Household Size | Owner-occupied | Renter-occupied |
| 1-Person Household | 61 (75.3%) | 20 (24.7%) |
| 2-Person Household | 136 (81.9%) | 30 (18.1%) |
| 3-Person Household | 45 (100.0%) | 0 (0.0%) |
| 4+ Person Household | 110 (64.3%) | 61 (35.7%) |
| Total Housing Units | 352 (76.0%) | 111 (24.0%) |
Occupancy by Educational Attainment in Tyhee
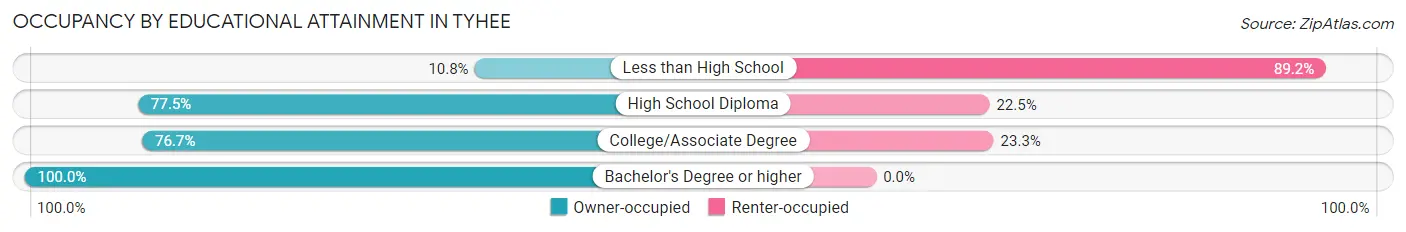
| Household Size | Owner-occupied | Renter-occupied |
| Less than High School | 4 (10.8%) | 33 (89.2%) |
| High School Diploma | 69 (77.5%) | 20 (22.5%) |
| College/Associate Degree | 191 (76.7%) | 58 (23.3%) |
| Bachelor's Degree or higher | 88 (100.0%) | 0 (0.0%) |
Occupancy by Age of Householder in Tyhee
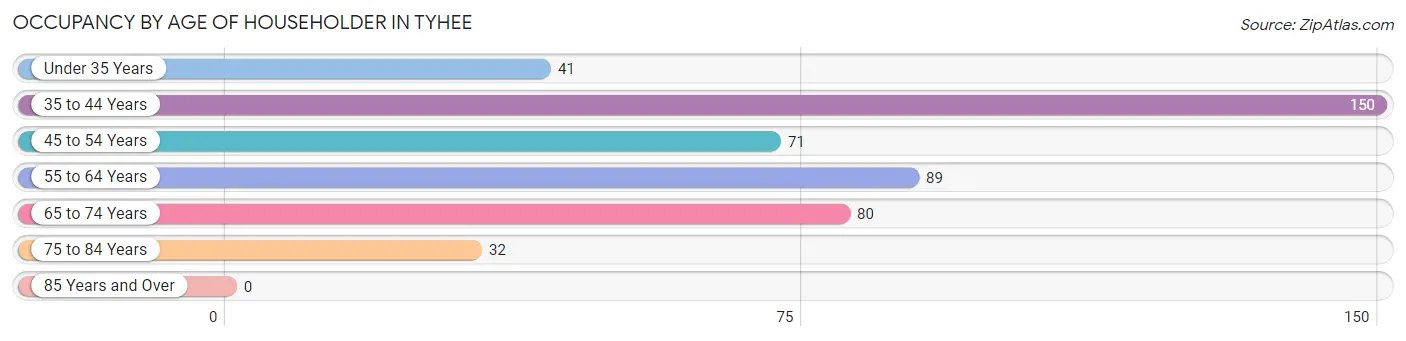
| Age Bracket | # Households | % Households |
| Under 35 Years | 41 | 8.9% |
| 35 to 44 Years | 150 | 32.4% |
| 45 to 54 Years | 71 | 15.3% |
| 55 to 64 Years | 89 | 19.2% |
| 65 to 74 Years | 80 | 17.3% |
| 75 to 84 Years | 32 | 6.9% |
| 85 Years and Over | 0 | 0.0% |
| Total | 463 | 100.0% |
Housing Finances in Tyhee
Median Income by Occupancy in Tyhee
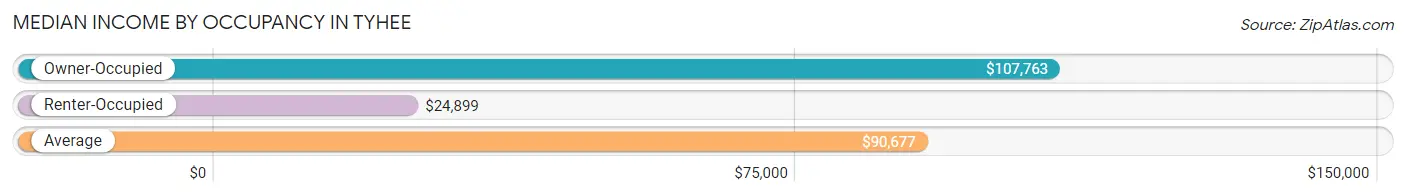
| Occupancy Type | # Households | Median Income |
| Owner-Occupied | 352 (76.0%) | $107,763 |
| Renter-Occupied | 111 (24.0%) | $24,899 |
| Average | 463 (100.0%) | $90,677 |
Occupancy by Householder Income Bracket in Tyhee
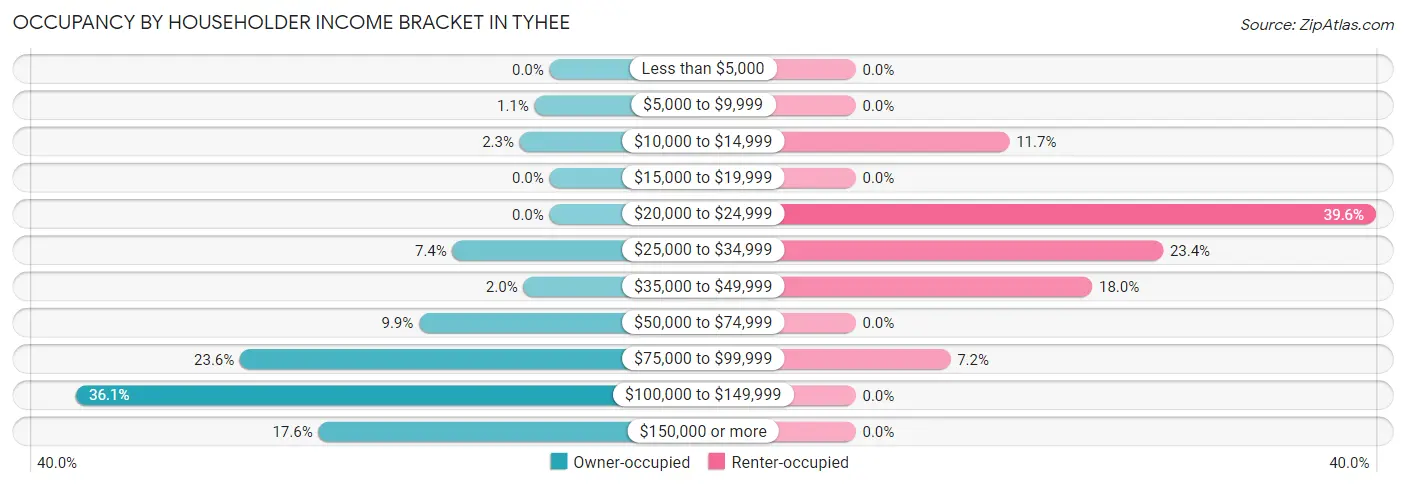
| Income Bracket | Owner-occupied | Renter-occupied |
| Less than $5,000 | 0 (0.0%) | 0 (0.0%) |
| $5,000 to $9,999 | 4 (1.1%) | 0 (0.0%) |
| $10,000 to $14,999 | 8 (2.3%) | 13 (11.7%) |
| $15,000 to $19,999 | 0 (0.0%) | 0 (0.0%) |
| $20,000 to $24,999 | 0 (0.0%) | 44 (39.6%) |
| $25,000 to $34,999 | 26 (7.4%) | 26 (23.4%) |
| $35,000 to $49,999 | 7 (2.0%) | 20 (18.0%) |
| $50,000 to $74,999 | 35 (9.9%) | 0 (0.0%) |
| $75,000 to $99,999 | 83 (23.6%) | 8 (7.2%) |
| $100,000 to $149,999 | 127 (36.1%) | 0 (0.0%) |
| $150,000 or more | 62 (17.6%) | 0 (0.0%) |
| Total | 352 (100.0%) | 111 (100.0%) |
Monthly Housing Cost Tiers in Tyhee
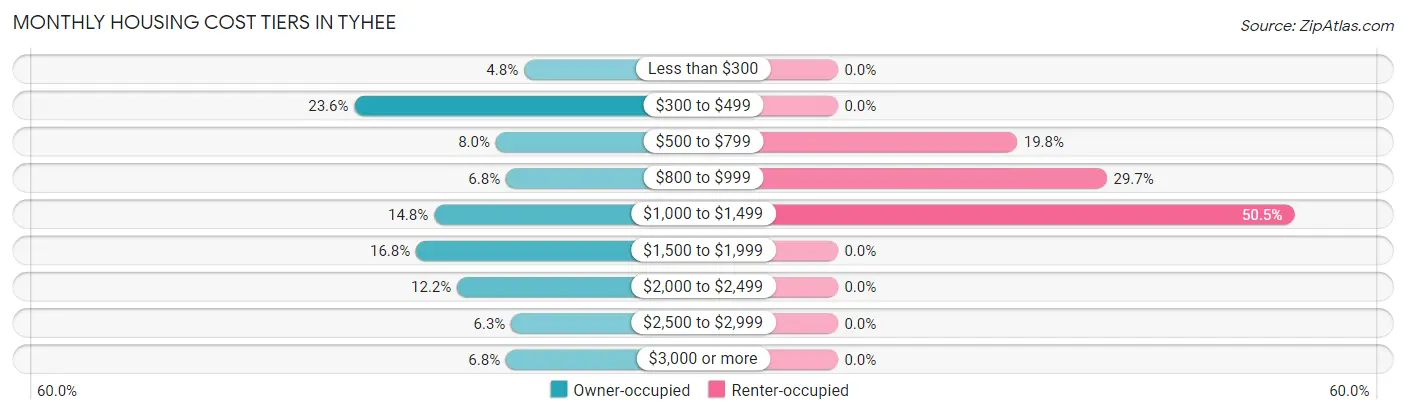
| Monthly Cost | Owner-occupied | Renter-occupied |
| Less than $300 | 17 (4.8%) | 0 (0.0%) |
| $300 to $499 | 83 (23.6%) | 0 (0.0%) |
| $500 to $799 | 28 (8.0%) | 22 (19.8%) |
| $800 to $999 | 24 (6.8%) | 33 (29.7%) |
| $1,000 to $1,499 | 52 (14.8%) | 56 (50.4%) |
| $1,500 to $1,999 | 59 (16.8%) | 0 (0.0%) |
| $2,000 to $2,499 | 43 (12.2%) | 0 (0.0%) |
| $2,500 to $2,999 | 22 (6.2%) | 0 (0.0%) |
| $3,000 or more | 24 (6.8%) | 0 (0.0%) |
| Total | 352 (100.0%) | 111 (100.0%) |
Physical Housing Characteristics in Tyhee
Housing Structures in Tyhee
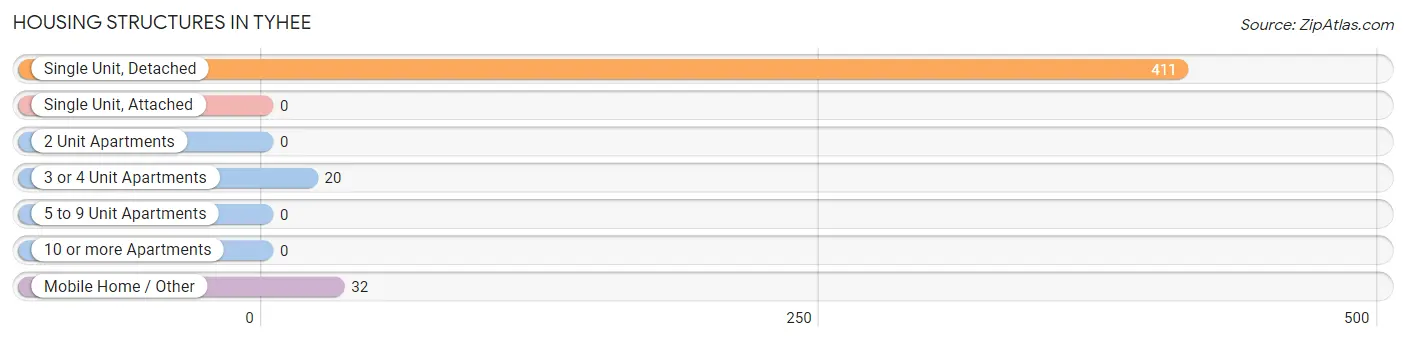
| Structure Type | # Housing Units | % Housing Units |
| Single Unit, Detached | 411 | 88.8% |
| Single Unit, Attached | 0 | 0.0% |
| 2 Unit Apartments | 0 | 0.0% |
| 3 or 4 Unit Apartments | 20 | 4.3% |
| 5 to 9 Unit Apartments | 0 | 0.0% |
| 10 or more Apartments | 0 | 0.0% |
| Mobile Home / Other | 32 | 6.9% |
| Total | 463 | 100.0% |
Housing Structures by Occupancy in Tyhee
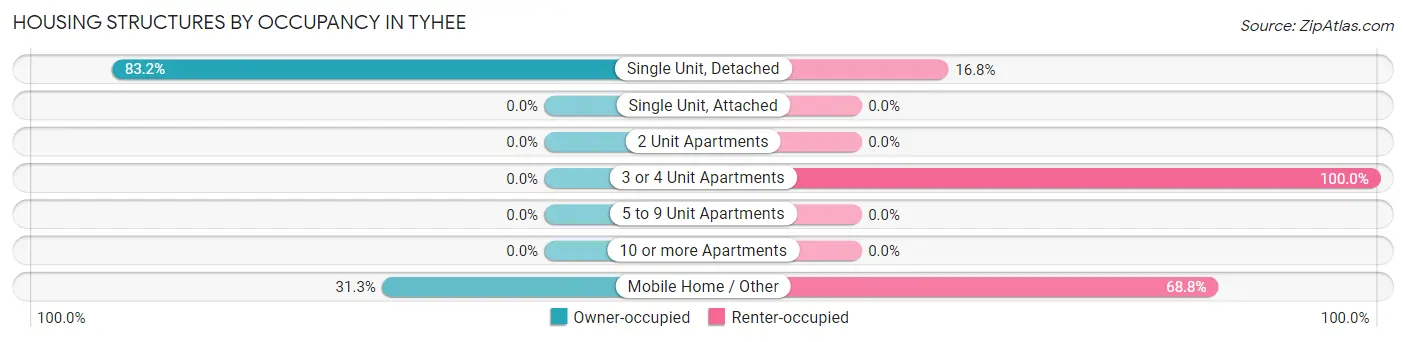
| Structure Type | Owner-occupied | Renter-occupied |
| Single Unit, Detached | 342 (83.2%) | 69 (16.8%) |
| Single Unit, Attached | 0 (0.0%) | 0 (0.0%) |
| 2 Unit Apartments | 0 (0.0%) | 0 (0.0%) |
| 3 or 4 Unit Apartments | 0 (0.0%) | 20 (100.0%) |
| 5 to 9 Unit Apartments | 0 (0.0%) | 0 (0.0%) |
| 10 or more Apartments | 0 (0.0%) | 0 (0.0%) |
| Mobile Home / Other | 10 (31.2%) | 22 (68.8%) |
| Total | 352 (76.0%) | 111 (24.0%) |
Housing Structures by Number of Rooms in Tyhee
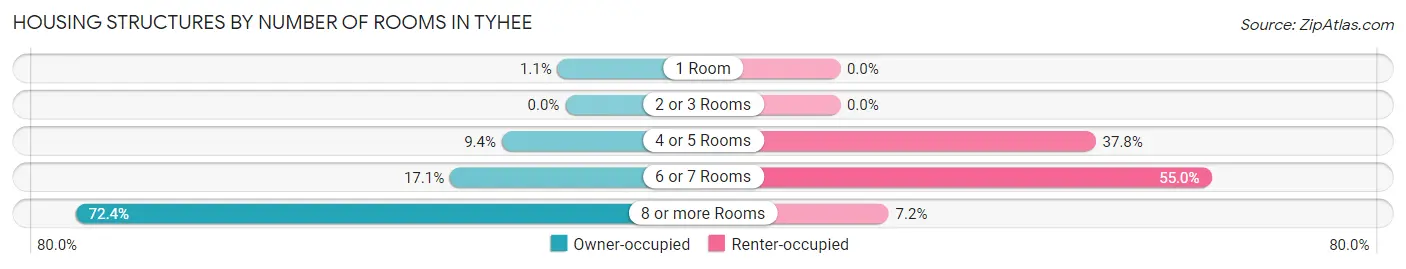
| Number of Rooms | Owner-occupied | Renter-occupied |
| 1 Room | 4 (1.1%) | 0 (0.0%) |
| 2 or 3 Rooms | 0 (0.0%) | 0 (0.0%) |
| 4 or 5 Rooms | 33 (9.4%) | 42 (37.8%) |
| 6 or 7 Rooms | 60 (17.1%) | 61 (54.9%) |
| 8 or more Rooms | 255 (72.4%) | 8 (7.2%) |
| Total | 352 (100.0%) | 111 (100.0%) |
Housing Structure by Heating Type in Tyhee
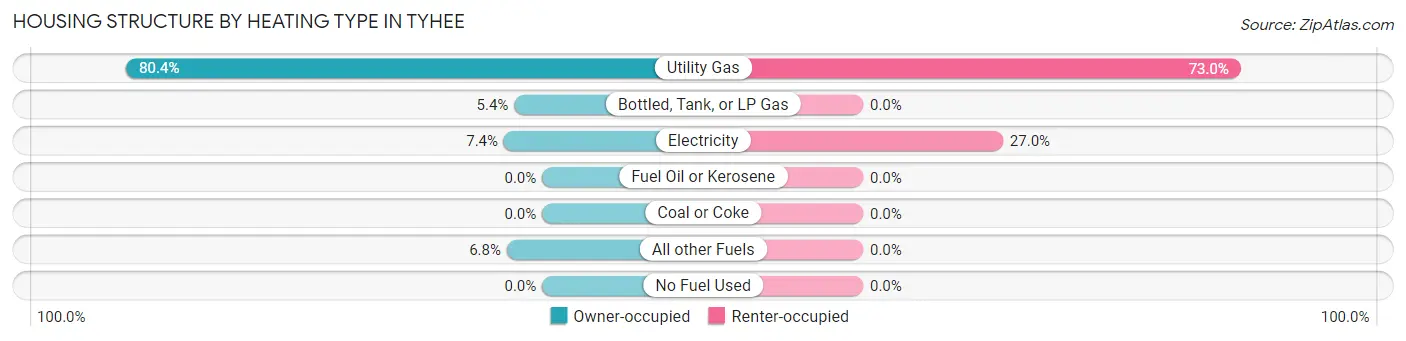
| Heating Type | Owner-occupied | Renter-occupied |
| Utility Gas | 283 (80.4%) | 81 (73.0%) |
| Bottled, Tank, or LP Gas | 19 (5.4%) | 0 (0.0%) |
| Electricity | 26 (7.4%) | 30 (27.0%) |
| Fuel Oil or Kerosene | 0 (0.0%) | 0 (0.0%) |
| Coal or Coke | 0 (0.0%) | 0 (0.0%) |
| All other Fuels | 24 (6.8%) | 0 (0.0%) |
| No Fuel Used | 0 (0.0%) | 0 (0.0%) |
| Total | 352 (100.0%) | 111 (100.0%) |
Household Vehicle Usage in Tyhee
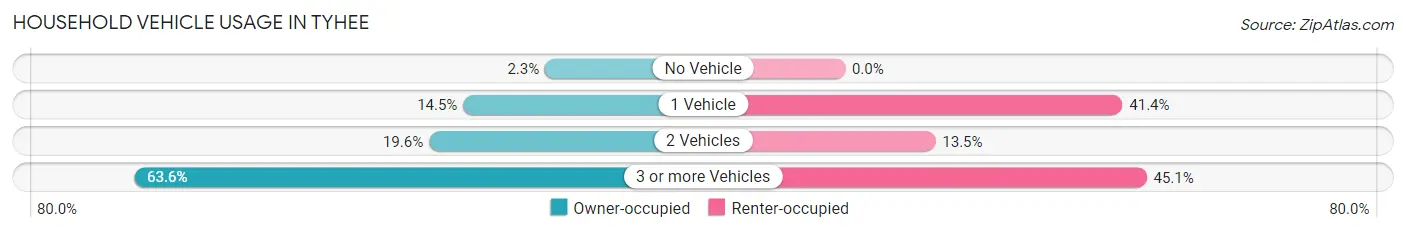
| Vehicles per Household | Owner-occupied | Renter-occupied |
| No Vehicle | 8 (2.3%) | 0 (0.0%) |
| 1 Vehicle | 51 (14.5%) | 46 (41.4%) |
| 2 Vehicles | 69 (19.6%) | 15 (13.5%) |
| 3 or more Vehicles | 224 (63.6%) | 50 (45.1%) |
| Total | 352 (100.0%) | 111 (100.0%) |
Real Estate & Mortgages in Tyhee
Real Estate and Mortgage Overview in Tyhee
| Characteristic | Without Mortgage | With Mortgage |
| Housing Units | 130 | 222 |
| Median Property Value | $282,100 | $439,000 |
| Median Household Income | $86,607 | $50 |
| Monthly Housing Costs | $380 | $24 |
| Real Estate Taxes | $1,726 | $7 |
Property Value by Mortgage Status in Tyhee
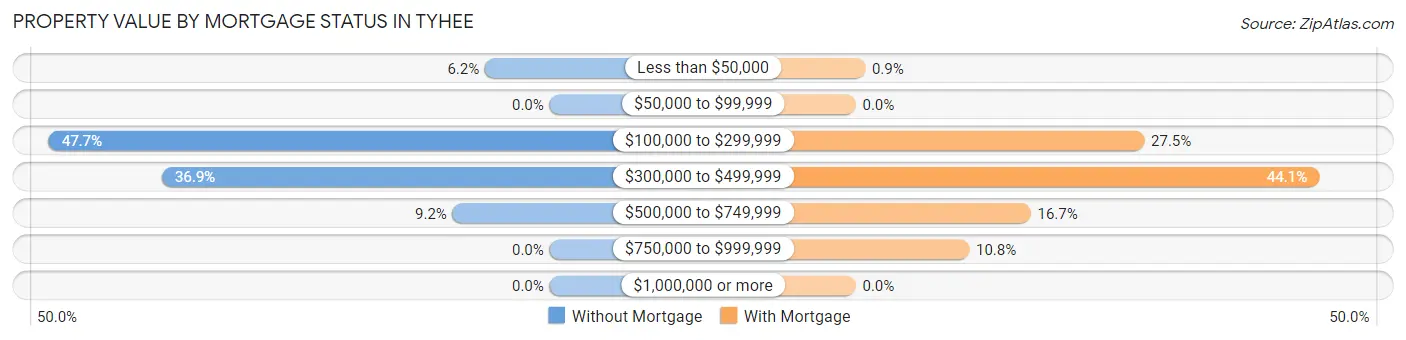
| Property Value | Without Mortgage | With Mortgage |
| Less than $50,000 | 8 (6.1%) | 2 (0.9%) |
| $50,000 to $99,999 | 0 (0.0%) | 0 (0.0%) |
| $100,000 to $299,999 | 62 (47.7%) | 61 (27.5%) |
| $300,000 to $499,999 | 48 (36.9%) | 98 (44.1%) |
| $500,000 to $749,999 | 12 (9.2%) | 37 (16.7%) |
| $750,000 to $999,999 | 0 (0.0%) | 24 (10.8%) |
| $1,000,000 or more | 0 (0.0%) | 0 (0.0%) |
| Total | 130 (100.0%) | 222 (100.0%) |
Household Income by Mortgage Status in Tyhee
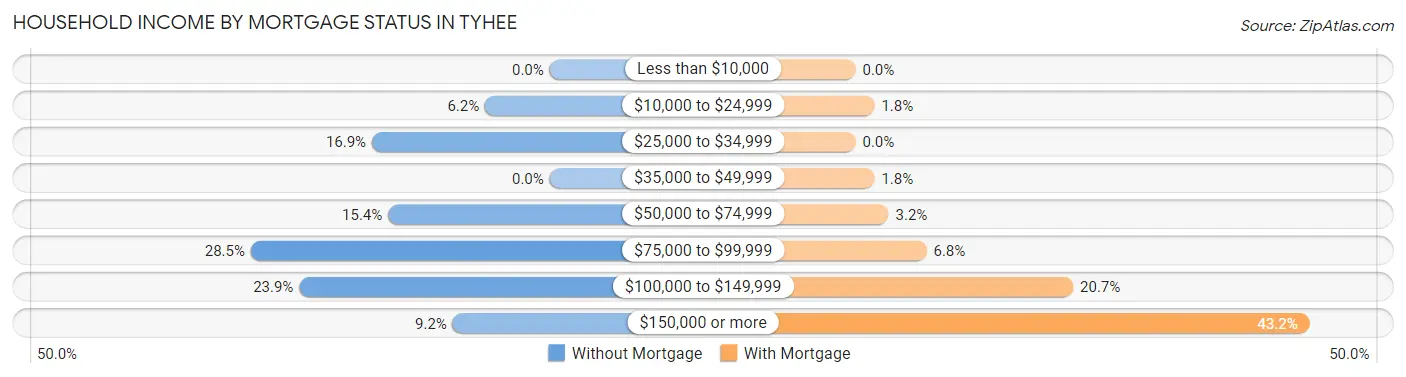
| Household Income | Without Mortgage | With Mortgage |
| Less than $10,000 | 0 (0.0%) | 0 (0.0%) |
| $10,000 to $24,999 | 8 (6.1%) | 4 (1.8%) |
| $25,000 to $34,999 | 22 (16.9%) | 0 (0.0%) |
| $35,000 to $49,999 | 0 (0.0%) | 4 (1.8%) |
| $50,000 to $74,999 | 20 (15.4%) | 7 (3.2%) |
| $75,000 to $99,999 | 37 (28.5%) | 15 (6.8%) |
| $100,000 to $149,999 | 31 (23.8%) | 46 (20.7%) |
| $150,000 or more | 12 (9.2%) | 96 (43.2%) |
| Total | 130 (100.0%) | 222 (100.0%) |
Property Value to Household Income Ratio in Tyhee
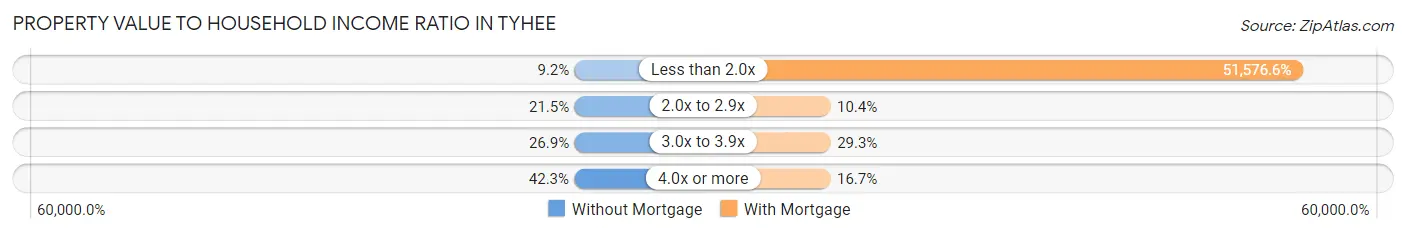
| Value-to-Income Ratio | Without Mortgage | With Mortgage |
| Less than 2.0x | 12 (9.2%) | 114,500 (51,576.6%) |
| 2.0x to 2.9x | 28 (21.5%) | 23 (10.4%) |
| 3.0x to 3.9x | 35 (26.9%) | 65 (29.3%) |
| 4.0x or more | 55 (42.3%) | 37 (16.7%) |
| Total | 130 (100.0%) | 222 (100.0%) |
Real Estate Taxes by Mortgage Status in Tyhee
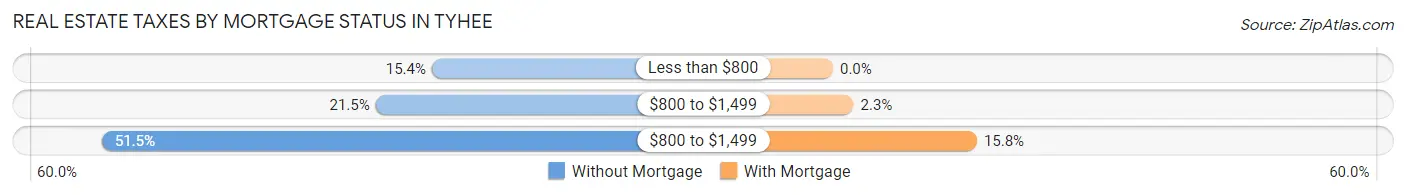
| Property Taxes | Without Mortgage | With Mortgage |
| Less than $800 | 20 (15.4%) | 0 (0.0%) |
| $800 to $1,499 | 28 (21.5%) | 5 (2.2%) |
| $800 to $1,499 | 67 (51.5%) | 35 (15.8%) |
| Total | 130 (100.0%) | 222 (100.0%) |
Health & Disability in Tyhee
Health Insurance Coverage by Age in Tyhee
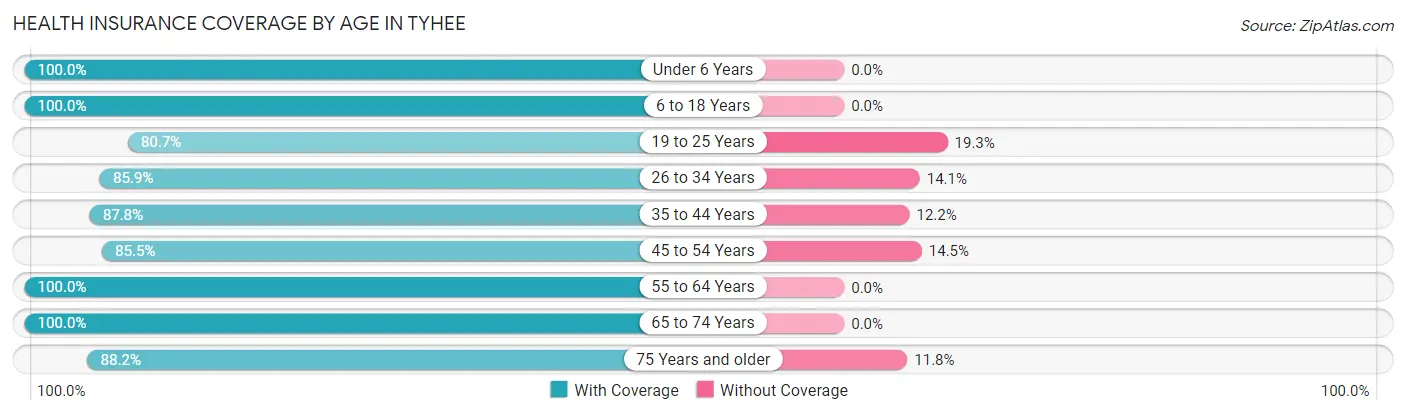
| Age Bracket | With Coverage | Without Coverage |
| Under 6 Years | 83 (100.0%) | 0 (0.0%) |
| 6 to 18 Years | 475 (100.0%) | 0 (0.0%) |
| 19 to 25 Years | 88 (80.7%) | 21 (19.3%) |
| 26 to 34 Years | 61 (85.9%) | 10 (14.1%) |
| 35 to 44 Years | 202 (87.8%) | 28 (12.2%) |
| 45 to 54 Years | 136 (85.5%) | 23 (14.5%) |
| 55 to 64 Years | 132 (100.0%) | 0 (0.0%) |
| 65 to 74 Years | 142 (100.0%) | 0 (0.0%) |
| 75 Years and older | 60 (88.2%) | 8 (11.8%) |
| Total | 1,379 (93.9%) | 90 (6.1%) |
Health Insurance Coverage by Citizenship Status in Tyhee
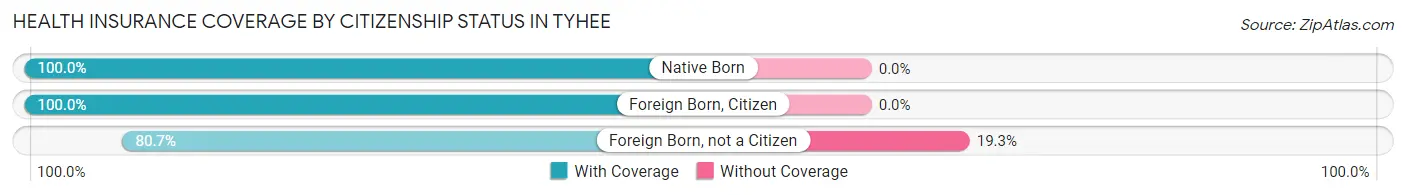
| Citizenship Status | With Coverage | Without Coverage |
| Native Born | 83 (100.0%) | 0 (0.0%) |
| Foreign Born, Citizen | 475 (100.0%) | 0 (0.0%) |
| Foreign Born, not a Citizen | 88 (80.7%) | 21 (19.3%) |
Health Insurance Coverage by Household Income in Tyhee
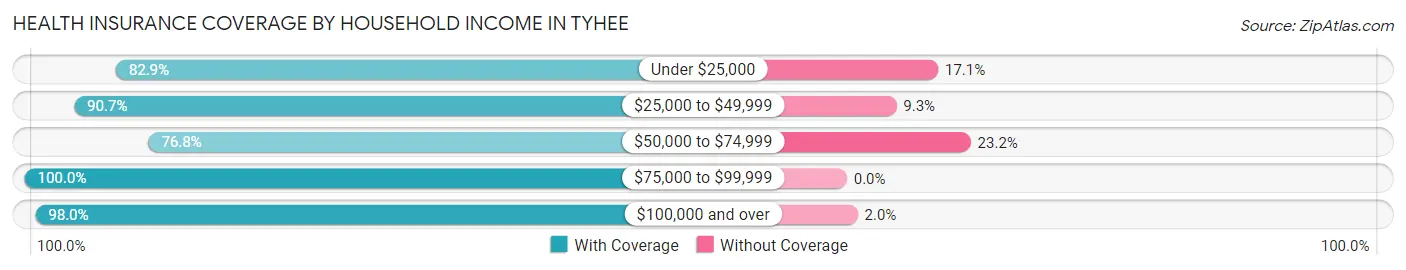
| Household Income | With Coverage | Without Coverage |
| Under $25,000 | 160 (82.9%) | 33 (17.1%) |
| $25,000 to $49,999 | 166 (90.7%) | 17 (9.3%) |
| $50,000 to $74,999 | 86 (76.8%) | 26 (23.2%) |
| $75,000 to $99,999 | 288 (100.0%) | 0 (0.0%) |
| $100,000 and over | 679 (98.0%) | 14 (2.0%) |
Public vs Private Health Insurance Coverage by Age in Tyhee
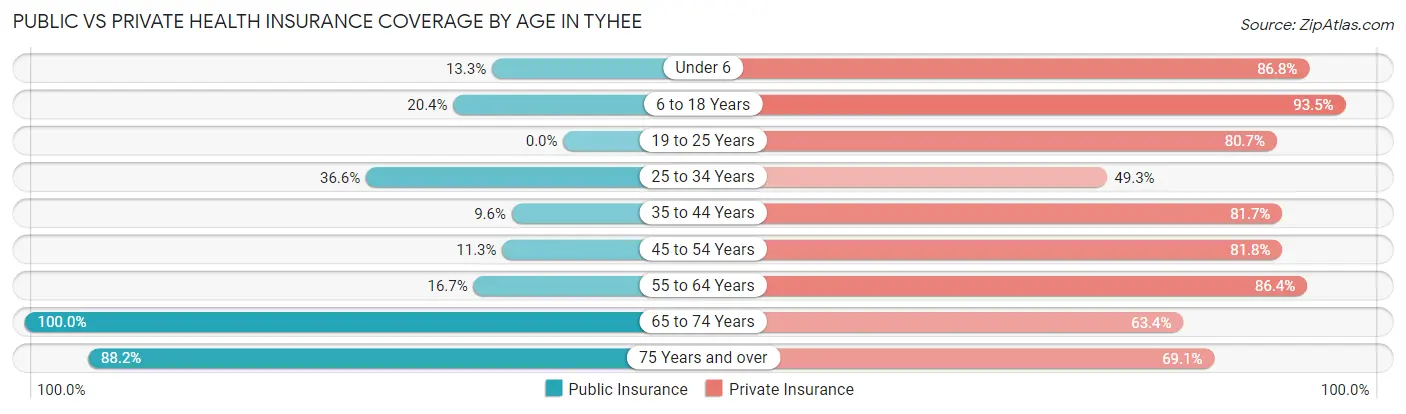
| Age Bracket | Public Insurance | Private Insurance |
| Under 6 | 11 (13.3%) | 72 (86.8%) |
| 6 to 18 Years | 97 (20.4%) | 444 (93.5%) |
| 19 to 25 Years | 0 (0.0%) | 88 (80.7%) |
| 25 to 34 Years | 26 (36.6%) | 35 (49.3%) |
| 35 to 44 Years | 22 (9.6%) | 188 (81.7%) |
| 45 to 54 Years | 18 (11.3%) | 130 (81.8%) |
| 55 to 64 Years | 22 (16.7%) | 114 (86.4%) |
| 65 to 74 Years | 142 (100.0%) | 90 (63.4%) |
| 75 Years and over | 60 (88.2%) | 47 (69.1%) |
| Total | 398 (27.1%) | 1,208 (82.2%) |
Disability Status by Sex by Age in Tyhee
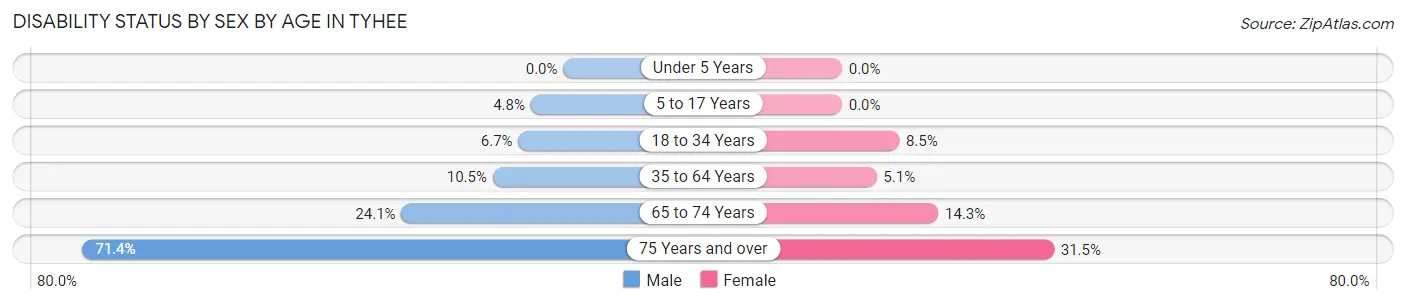
| Age Bracket | Male | Female |
| Under 5 Years | 0 (0.0%) | 0 (0.0%) |
| 5 to 17 Years | 9 (4.8%) | 0 (0.0%) |
| 18 to 34 Years | 8 (6.7%) | 9 (8.5%) |
| 35 to 64 Years | 22 (10.5%) | 16 (5.1%) |
| 65 to 74 Years | 19 (24.0%) | 9 (14.3%) |
| 75 Years and over | 10 (71.4%) | 17 (31.5%) |
Disability Class by Sex by Age in Tyhee
Disability Class: Hearing Difficulty
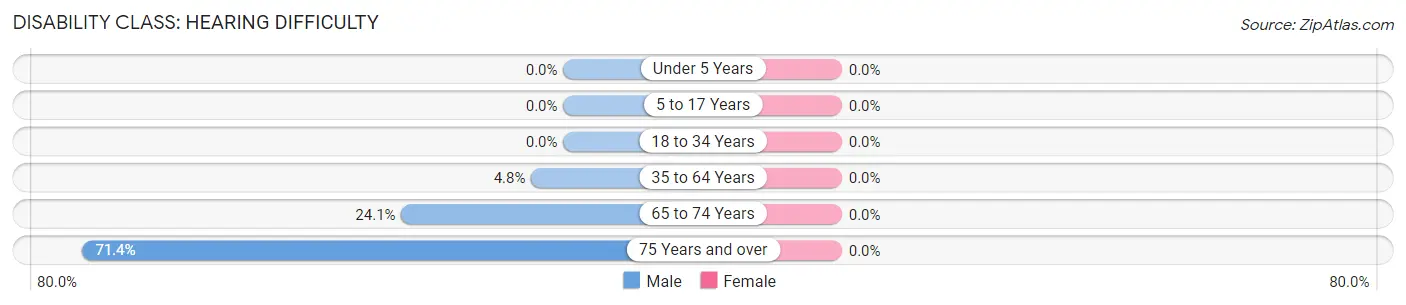
| Age Bracket | Male | Female |
| Under 5 Years | 0 (0.0%) | 0 (0.0%) |
| 5 to 17 Years | 0 (0.0%) | 0 (0.0%) |
| 18 to 34 Years | 0 (0.0%) | 0 (0.0%) |
| 35 to 64 Years | 10 (4.8%) | 0 (0.0%) |
| 65 to 74 Years | 19 (24.0%) | 0 (0.0%) |
| 75 Years and over | 10 (71.4%) | 0 (0.0%) |
Disability Class: Vision Difficulty
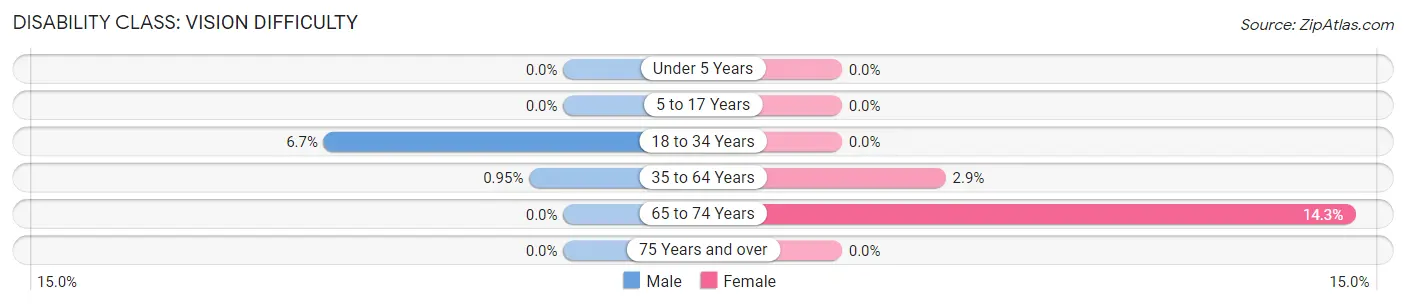
| Age Bracket | Male | Female |
| Under 5 Years | 0 (0.0%) | 0 (0.0%) |
| 5 to 17 Years | 0 (0.0%) | 0 (0.0%) |
| 18 to 34 Years | 8 (6.7%) | 0 (0.0%) |
| 35 to 64 Years | 2 (0.9%) | 9 (2.9%) |
| 65 to 74 Years | 0 (0.0%) | 9 (14.3%) |
| 75 Years and over | 0 (0.0%) | 0 (0.0%) |
Disability Class: Cognitive Difficulty
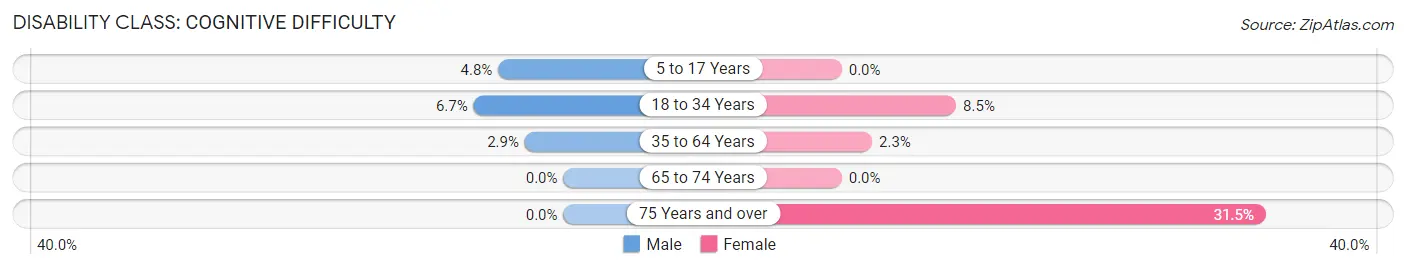
| Age Bracket | Male | Female |
| 5 to 17 Years | 9 (4.8%) | 0 (0.0%) |
| 18 to 34 Years | 8 (6.7%) | 9 (8.5%) |
| 35 to 64 Years | 6 (2.9%) | 7 (2.2%) |
| 65 to 74 Years | 0 (0.0%) | 0 (0.0%) |
| 75 Years and over | 0 (0.0%) | 17 (31.5%) |
Disability Class: Ambulatory Difficulty
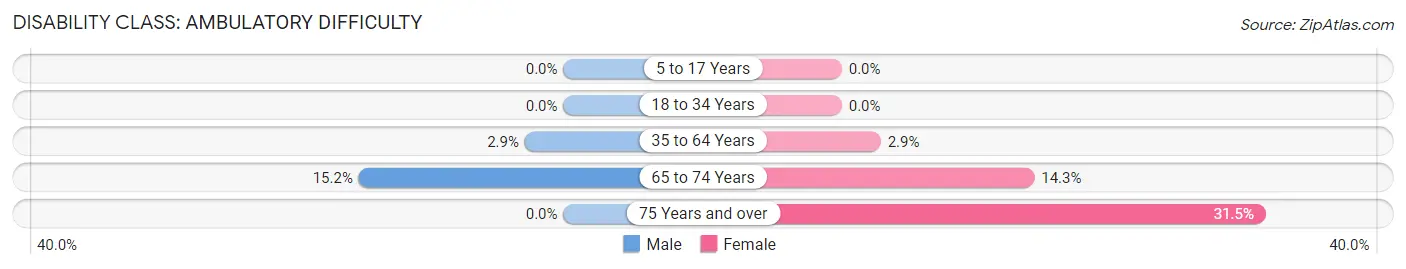
| Age Bracket | Male | Female |
| 5 to 17 Years | 0 (0.0%) | 0 (0.0%) |
| 18 to 34 Years | 0 (0.0%) | 0 (0.0%) |
| 35 to 64 Years | 6 (2.9%) | 9 (2.9%) |
| 65 to 74 Years | 12 (15.2%) | 9 (14.3%) |
| 75 Years and over | 0 (0.0%) | 17 (31.5%) |
Disability Class: Self-Care Difficulty
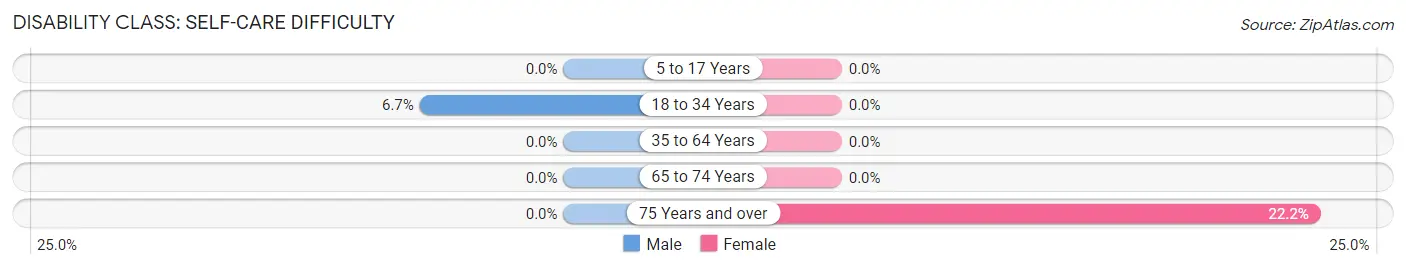
| Age Bracket | Male | Female |
| 5 to 17 Years | 0 (0.0%) | 0 (0.0%) |
| 18 to 34 Years | 8 (6.7%) | 0 (0.0%) |
| 35 to 64 Years | 0 (0.0%) | 0 (0.0%) |
| 65 to 74 Years | 0 (0.0%) | 0 (0.0%) |
| 75 Years and over | 0 (0.0%) | 12 (22.2%) |
Technology Access in Tyhee
Computing Device Access in Tyhee
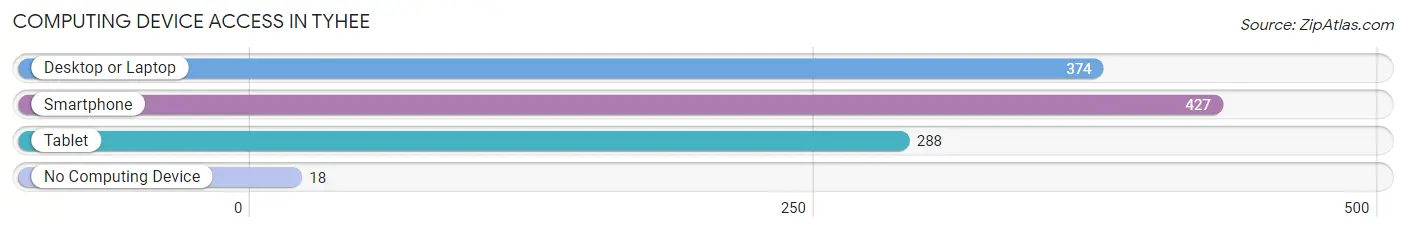
| Device Type | # Households | % Households |
| Desktop or Laptop | 374 | 80.8% |
| Smartphone | 427 | 92.2% |
| Tablet | 288 | 62.2% |
| No Computing Device | 18 | 3.9% |
| Total | 463 | 100.0% |
Internet Access in Tyhee
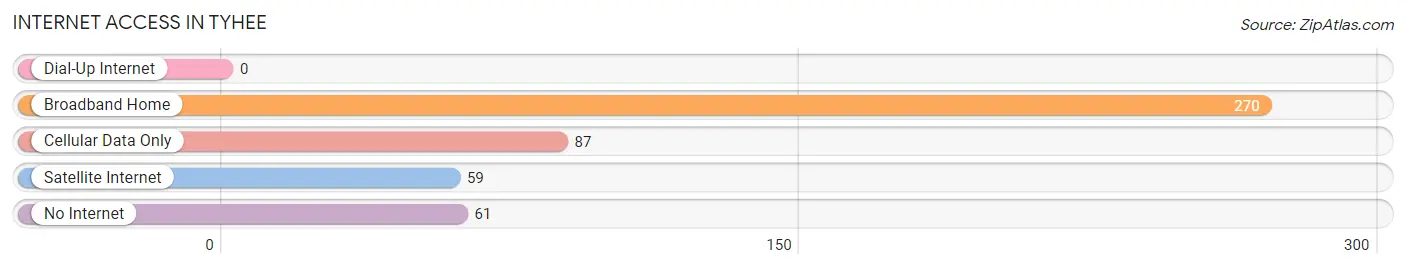
| Internet Type | # Households | % Households |
| Dial-Up Internet | 0 | 0.0% |
| Broadband Home | 270 | 58.3% |
| Cellular Data Only | 87 | 18.8% |
| Satellite Internet | 59 | 12.7% |
| No Internet | 61 | 13.2% |
| Total | 463 | 100.0% |
Tyhee Summary
Idaho is a state located in the northwestern region of the United States. It is bordered by Montana to the east, Wyoming to the east, Nevada and Utah to the south, and Washington and Oregon to the west. Idaho is the 14th largest state in the United States, with an area of 83,574 square miles, and the 11th most populous, with a population of 1.7 million as of 2019. Idaho is known for its rugged terrain, diverse wildlife, and abundant natural resources.
History
The area that is now Idaho has been inhabited by Native American tribes for thousands of years. The first Europeans to explore the area were members of the Lewis and Clark Expedition, who arrived in 1805. The area was part of the Oregon Territory until 1863, when it became part of the Idaho Territory. Idaho became the 43rd state in the Union on July 3, 1890.
Geography
Idaho is located in the northwestern region of the United States. It is bordered by Montana to the east, Wyoming to the east, Nevada and Utah to the south, and Washington and Oregon to the west. Idaho is the 14th largest state in the United States, with an area of 83,574 square miles.
Idaho is divided into two distinct regions: the Rocky Mountains and the Great Plains. The Rocky Mountains cover the northern and eastern parts of the state, while the Great Plains cover the southern and western parts. The highest point in Idaho is Borah Peak, which stands at 12,662 feet above sea level. The lowest point is the Snake River, which is 710 feet above sea level.
The climate of Idaho is generally dry and semi-arid, with cold winters and hot summers. The average annual temperature is 44°F, and the average annual precipitation is 16 inches.
Economy
Idaho’s economy is largely based on agriculture, forestry, and mining. The state’s major agricultural products include potatoes, wheat, barley, hay, and dairy products. Idaho is also a major producer of timber, and the state’s forests are home to a variety of wildlife. Mining is also an important part of the state’s economy, with silver, lead, zinc, and phosphate being the most important minerals.
Idaho is also home to a number of technology companies, including Micron Technology, Hewlett-Packard, and Microsoft. Tourism is also an important part of the state’s economy, with visitors coming to Idaho to enjoy its natural beauty and outdoor recreation opportunities.
Demographics
As of 2019, the population of Idaho was estimated to be 1.7 million. The state’s population is predominantly white (90.2%), with smaller percentages of Hispanic (7.2%), Native American (1.7%), and African American (0.7%) populations. The largest cities in Idaho are Boise, Nampa, and Idaho Falls.
Idaho is a predominantly rural state, with most of its population living in small towns and rural areas. The state’s largest metropolitan area is the Boise metropolitan area, which is home to over 700,000 people.
Idaho is also home to a number of religious groups, including Mormons, Catholics, and Protestants. The state is also home to a number of Native American tribes, including the Nez Perce, Shoshone-Bannock, and Coeur d’Alene.
Conclusion
Idaho is a state located in the northwestern region of the United States. It is bordered by Montana to the east, Wyoming to the east, Nevada and Utah to the south, and Washington and Oregon to the west. Idaho is the 14th largest state in the United States, with an area of 83,574 square miles, and the 11th most populous, with a population of 1.7 million as of 2019. Idaho is known for its rugged terrain, diverse wildlife, and abundant natural resources. The state’s economy is largely based on agriculture, forestry, and mining, and it is also home to a number of technology companies and a thriving tourism industry. The population of Idaho is predominantly white, with smaller percentages of Hispanic, Native American, and African American populations. Idaho is a predominantly rural state, with most of its population living in small towns and rural areas.
Common Questions
What is Per Capita Income in Tyhee?
Per Capita income in Tyhee is $32,364.
What is the Median Family Income in Tyhee?
Median Family Income in Tyhee is $91,198.
What is the Median Household income in Tyhee?
Median Household Income in Tyhee is $90,677.
What is Income or Wage Gap in Tyhee?
Income or Wage Gap in Tyhee is 36.7%.
Women in Tyhee earn 63.3 cents for every dollar earned by a man.
What is Family Income Deficit in Tyhee?
Family Income Deficit in Tyhee is $4,605.
Families that are below poverty line in Tyhee earn $4,605 less on average than the poverty threshold level.
What is Inequality or Gini Index in Tyhee?
Inequality or Gini Index in Tyhee is 0.42.
What is the Total Population of Tyhee?
Total Population of Tyhee is 1,469.
What is the Total Male Population of Tyhee?
Total Male Population of Tyhee is 660.
What is the Total Female Population of Tyhee?
Total Female Population of Tyhee is 809.
What is the Ratio of Males per 100 Females in Tyhee?
There are 81.58 Males per 100 Females in Tyhee.
What is the Ratio of Females per 100 Males in Tyhee?
There are 122.58 Females per 100 Males in Tyhee.
What is the Median Population Age in Tyhee?
Median Population Age in Tyhee is 34.7 Years.
What is the Average Family Size in Tyhee
Average Family Size in Tyhee is 3.7 People.
What is the Average Household Size in Tyhee
Average Household Size in Tyhee is 3.2 People.
How Large is the Labor Force in Tyhee?
There are 633 People in the Labor Forcein in Tyhee.
What is the Percentage of People in the Labor Force in Tyhee?
62.4% of People are in the Labor Force in Tyhee.
What is the Unemployment Rate in Tyhee?
Unemployment Rate in Tyhee is 9.6%.