Hildebran, NC Map & Demographics
Hildebran Map
Hildebran Overview
$29,969
PER CAPITA INCOME
$58,018
AVG FAMILY INCOME
$51,680
AVG HOUSEHOLD INCOME
19.6%
WAGE / INCOME GAP [ % ]
80.4¢/ $1
WAGE / INCOME GAP [ $ ]
0.46
INEQUALITY / GINI INDEX
1,843
TOTAL POPULATION
966
MALE POPULATION
877
FEMALE POPULATION
110.15
MALES / 100 FEMALES
90.79
FEMALES / 100 MALES
42.7
MEDIAN AGE
2.9
AVG FAMILY SIZE
2.4
AVG HOUSEHOLD SIZE
964
LABOR FORCE [ PEOPLE ]
62.5%
PERCENT IN LABOR FORCE
5.0%
UNEMPLOYMENT RATE
Hildebran Zip Codes
Income in Hildebran
Income Overview in Hildebran
Per Capita Income in Hildebran is $29,969, while median incomes of families and households are $58,018 and $51,680 respectively.
| Characteristic | Number | Measure |
| Per Capita Income | 1,843 | $29,969 |
| Median Family Income | 549 | $58,018 |
| Mean Family Income | 549 | $84,034 |
| Median Household Income | 769 | $51,680 |
| Mean Household Income | 769 | $70,778 |
| Income Deficit | 549 | $0 |
| Wage / Income Gap (%) | 1,843 | 19.62% |
| Wage / Income Gap ($) | 1,843 | 80.38¢ per $1 |
| Gini / Inequality Index | 1,843 | 0.46 |
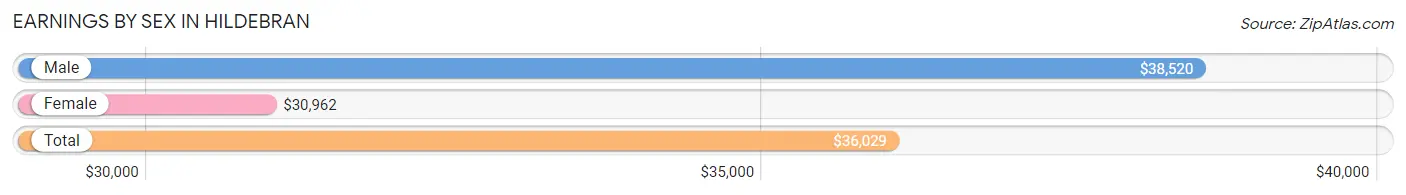
Earnings by Sex in Hildebran
Average Earnings in Hildebran are $36,029, $38,520 for men and $30,962 for women, a difference of 19.6%.
| Sex | Number | Average Earnings |
| Male | 532 (54.8%) | $38,520 |
| Female | 438 (45.2%) | $30,962 |
| Total | 970 (100.0%) | $36,029 |
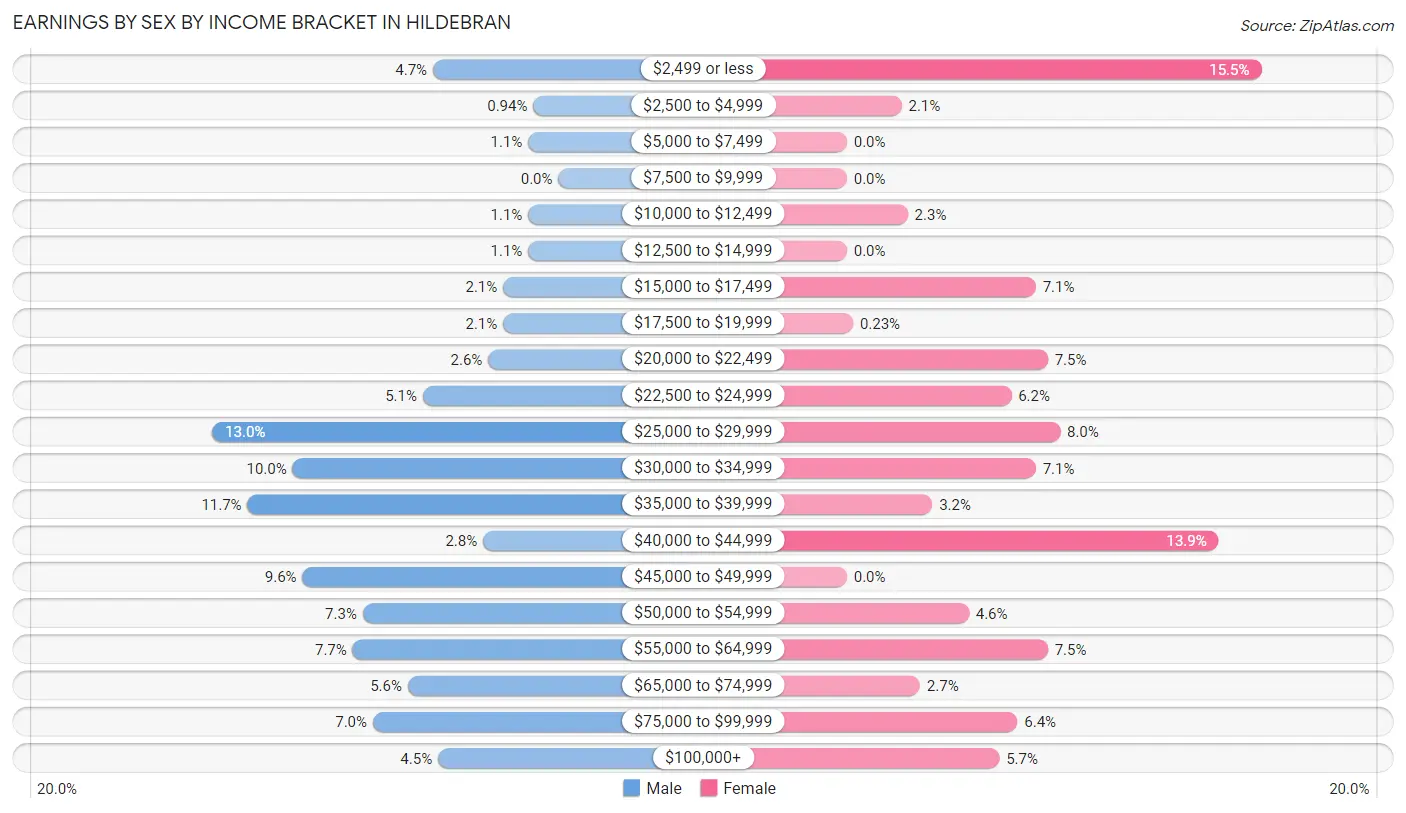
Earnings by Sex by Income Bracket in Hildebran
The most common earnings brackets in Hildebran are $25,000 to $29,999 for men (69 | 13.0%) and $2,499 or less for women (68 | 15.5%).
| Income | Male | Female |
| $2,499 or less | 25 (4.7%) | 68 (15.5%) |
| $2,500 to $4,999 | 5 (0.9%) | 9 (2.1%) |
| $5,000 to $7,499 | 6 (1.1%) | 0 (0.0%) |
| $7,500 to $9,999 | 0 (0.0%) | 0 (0.0%) |
| $10,000 to $12,499 | 6 (1.1%) | 10 (2.3%) |
| $12,500 to $14,999 | 6 (1.1%) | 0 (0.0%) |
| $15,000 to $17,499 | 11 (2.1%) | 31 (7.1%) |
| $17,500 to $19,999 | 11 (2.1%) | 1 (0.2%) |
| $20,000 to $22,499 | 14 (2.6%) | 33 (7.5%) |
| $22,500 to $24,999 | 27 (5.1%) | 27 (6.2%) |
| $25,000 to $29,999 | 69 (13.0%) | 35 (8.0%) |
| $30,000 to $34,999 | 53 (10.0%) | 31 (7.1%) |
| $35,000 to $39,999 | 62 (11.7%) | 14 (3.2%) |
| $40,000 to $44,999 | 15 (2.8%) | 61 (13.9%) |
| $45,000 to $49,999 | 51 (9.6%) | 0 (0.0%) |
| $50,000 to $54,999 | 39 (7.3%) | 20 (4.6%) |
| $55,000 to $64,999 | 41 (7.7%) | 33 (7.5%) |
| $65,000 to $74,999 | 30 (5.6%) | 12 (2.7%) |
| $75,000 to $99,999 | 37 (7.0%) | 28 (6.4%) |
| $100,000+ | 24 (4.5%) | 25 (5.7%) |
| Total | 532 (100.0%) | 438 (100.0%) |
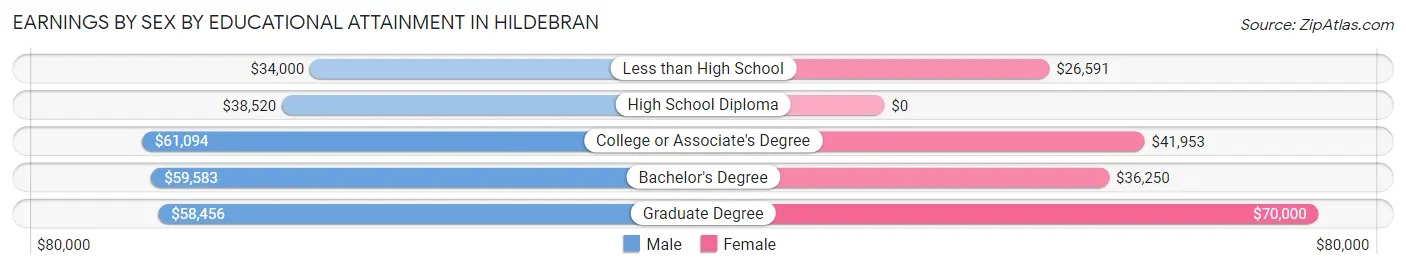
Earnings by Sex by Educational Attainment in Hildebran
Average earnings in Hildebran are $41,750 for men and $40,000 for women, a difference of 4.2%. Men with an educational attainment of college or associate's degree enjoy the highest average annual earnings of $61,094, while those with less than high school education earn the least with $34,000. Women with an educational attainment of graduate degree earn the most with the average annual earnings of $70,000, while those with less than high school education have the smallest earnings of $26,591.
| Educational Attainment | Male Income | Female Income |
| Less than High School | $34,000 | $26,591 |
| High School Diploma | $38,520 | $0 |
| College or Associate's Degree | $61,094 | $41,953 |
| Bachelor's Degree | $59,583 | $36,250 |
| Graduate Degree | $58,456 | $70,000 |
| Total | $41,750 | $40,000 |
Family Income in Hildebran
Family Income Brackets in Hildebran
According to the Hildebran family income data, there are 135 families falling into the $35,000 to $49,999 income range, which is the most common income bracket and makes up 24.6% of all families. Conversely, the $10,000 to $14,999 income bracket is the least frequent group with only 7 families (1.3%) belonging to this category.
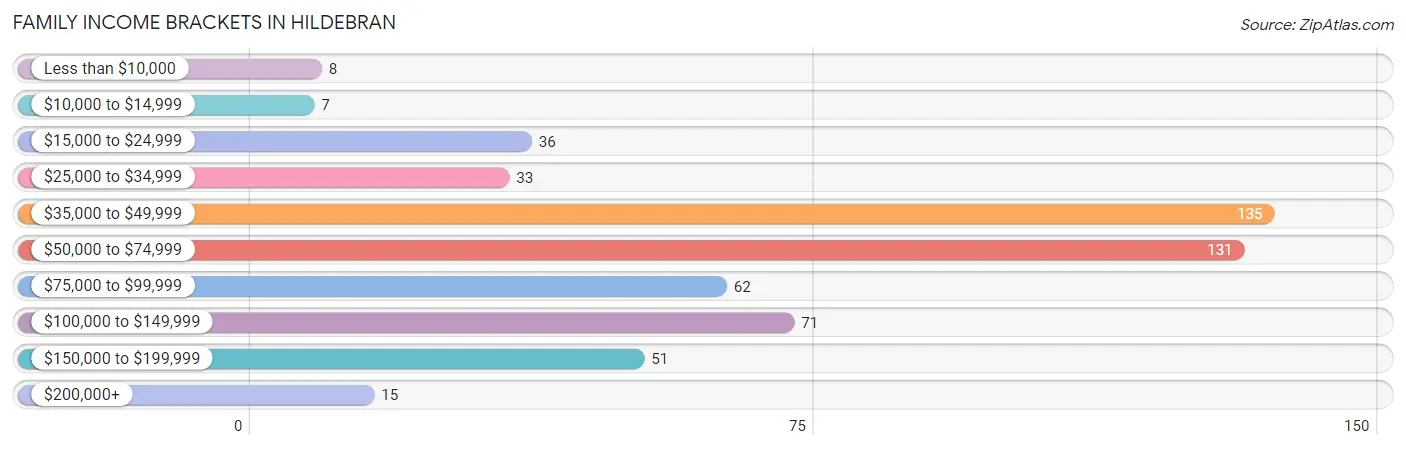
| Income Bracket | # Families | % Families |
| Less than $10,000 | 8 | 1.5% |
| $10,000 to $14,999 | 7 | 1.3% |
| $15,000 to $24,999 | 36 | 6.6% |
| $25,000 to $34,999 | 33 | 6.0% |
| $35,000 to $49,999 | 135 | 24.6% |
| $50,000 to $74,999 | 131 | 23.9% |
| $75,000 to $99,999 | 62 | 11.3% |
| $100,000 to $149,999 | 71 | 12.9% |
| $150,000 to $199,999 | 51 | 9.3% |
| $200,000+ | 15 | 2.7% |
Family Income by Famaliy Size in Hildebran
6-person families (44 | 8.0%) account for the highest median family income in Hildebran with $88,676 per family, while 2-person families (259 | 47.2%) have the highest median income of $32,422 per family member.
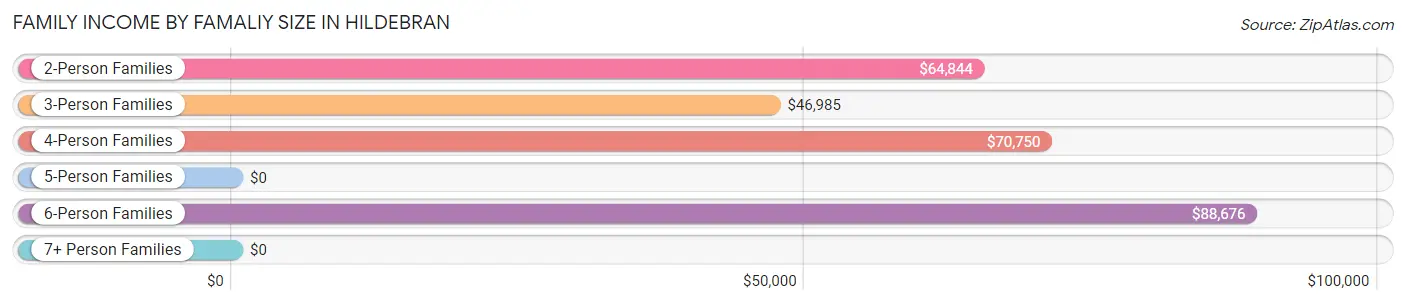
| Income Bracket | # Families | Median Income |
| 2-Person Families | 259 (47.2%) | $64,844 |
| 3-Person Families | 191 (34.8%) | $46,985 |
| 4-Person Families | 37 (6.7%) | $70,750 |
| 5-Person Families | 18 (3.3%) | $0 |
| 6-Person Families | 44 (8.0%) | $88,676 |
| 7+ Person Families | 0 (0.0%) | $0 |
| Total | 549 (100.0%) | $58,018 |
Family Income by Number of Earners in Hildebran
The median family income in Hildebran is $58,018, with families comprising 3+ earners (38) having the highest median family income of $150,714, while families with no earners (87) have the lowest median family income of $43,785, accounting for 6.9% and 15.9% of families, respectively.
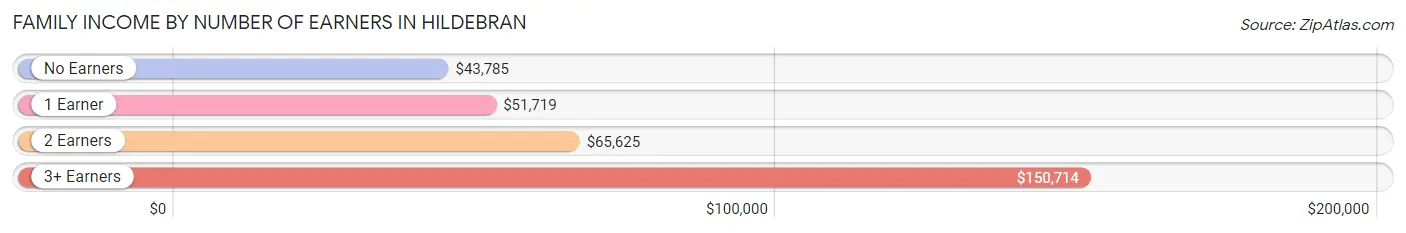
| Number of Earners | # Families | Median Income |
| No Earners | 87 (15.9%) | $43,785 |
| 1 Earner | 149 (27.1%) | $51,719 |
| 2 Earners | 275 (50.1%) | $65,625 |
| 3+ Earners | 38 (6.9%) | $150,714 |
| Total | 549 (100.0%) | $58,018 |
Household Income in Hildebran
Household Income Brackets in Hildebran
With 179 households falling in the category, the $50,000 to $74,999 income range is the most frequent in Hildebran, accounting for 23.3% of all households. In contrast, only 15 households (1.9%) fall into the $200,000+ income bracket, making it the least populous group.
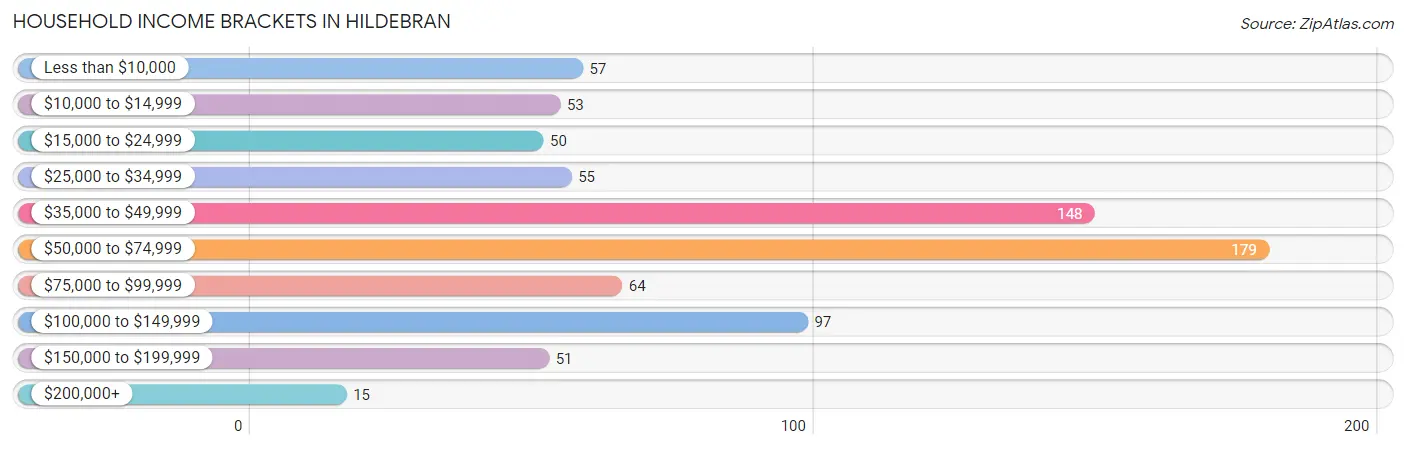
| Income Bracket | # Households | % Households |
| Less than $10,000 | 57 | 7.4% |
| $10,000 to $14,999 | 53 | 6.9% |
| $15,000 to $24,999 | 50 | 6.5% |
| $25,000 to $34,999 | 55 | 7.2% |
| $35,000 to $49,999 | 148 | 19.2% |
| $50,000 to $74,999 | 179 | 23.3% |
| $75,000 to $99,999 | 64 | 8.3% |
| $100,000 to $149,999 | 97 | 12.6% |
| $150,000 to $199,999 | 51 | 6.6% |
| $200,000+ | 15 | 2.0% |
Household Income by Householder Age in Hildebran
The median household income in Hildebran is $51,680, with the highest median household income of $57,125 found in the 45 to 64 years age bracket for the primary householder. A total of 295 households (38.4%) fall into this category. Meanwhile, the 15 to 24 years age bracket for the primary householder has the lowest median household income of $0, with 3 households (0.4%) in this group.
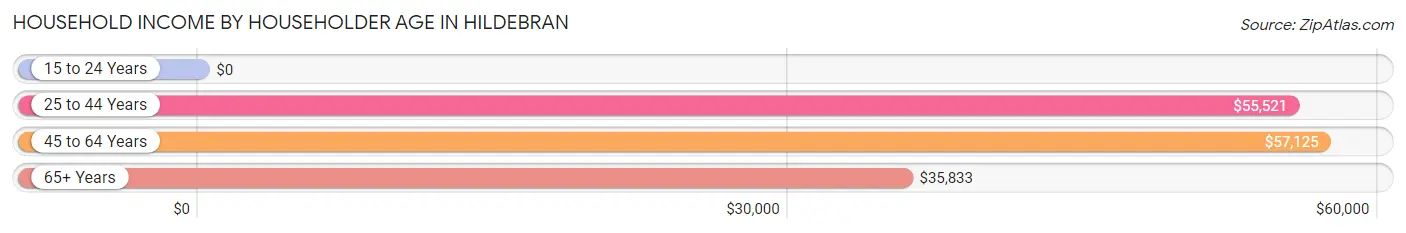
| Income Bracket | # Households | Median Income |
| 15 to 24 Years | 3 (0.4%) | $0 |
| 25 to 44 Years | 231 (30.0%) | $55,521 |
| 45 to 64 Years | 295 (38.4%) | $57,125 |
| 65+ Years | 240 (31.2%) | $35,833 |
| Total | 769 (100.0%) | $51,680 |
Poverty in Hildebran
Income Below Poverty by Sex and Age in Hildebran
With 10.6% poverty level for males and 11.2% for females among the residents of Hildebran, 12 to 14 year old males and 12 to 14 year old females are the most vulnerable to poverty, with 5 males (45.5%) and 6 females (75.0%) in their respective age groups living below the poverty level.
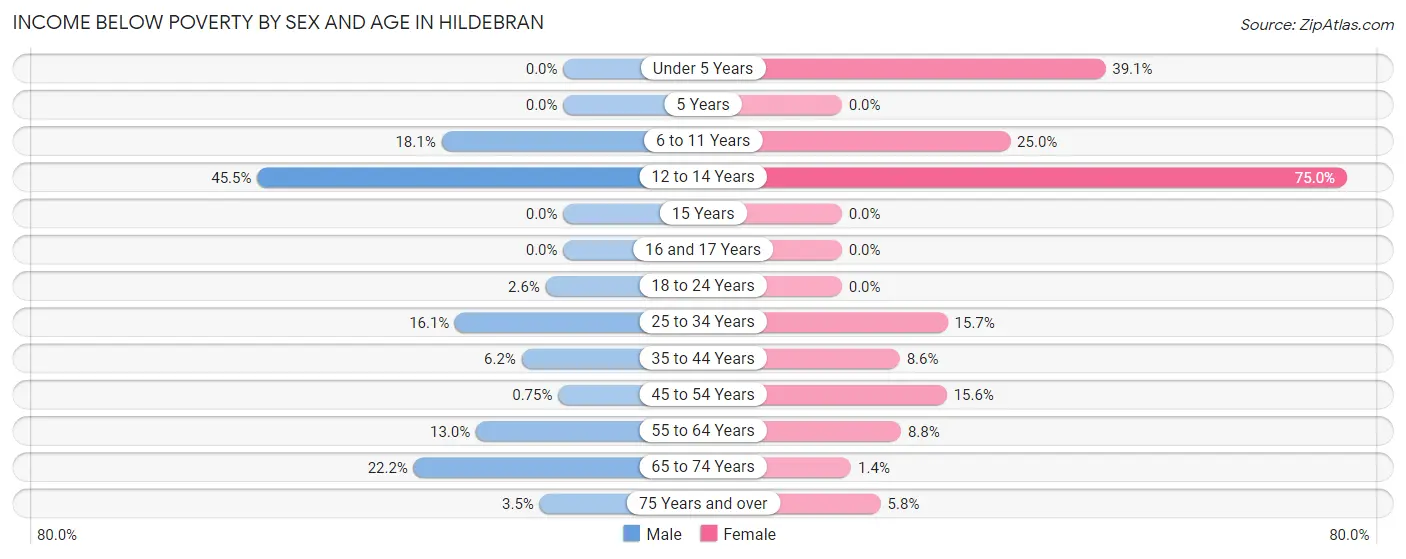
| Age Bracket | Male | Female |
| Under 5 Years | 0 (0.0%) | 9 (39.1%) |
| 5 Years | 0 (0.0%) | 0 (0.0%) |
| 6 to 11 Years | 21 (18.1%) | 17 (25.0%) |
| 12 to 14 Years | 5 (45.5%) | 6 (75.0%) |
| 15 Years | 0 (0.0%) | 0 (0.0%) |
| 16 and 17 Years | 0 (0.0%) | 0 (0.0%) |
| 18 to 24 Years | 2 (2.6%) | 0 (0.0%) |
| 25 to 34 Years | 22 (16.1%) | 11 (15.7%) |
| 35 to 44 Years | 7 (6.2%) | 16 (8.6%) |
| 45 to 54 Years | 1 (0.7%) | 24 (15.6%) |
| 55 to 64 Years | 14 (13.0%) | 8 (8.8%) |
| 65 to 74 Years | 28 (22.2%) | 1 (1.4%) |
| 75 Years and over | 2 (3.5%) | 6 (5.8%) |
| Total | 102 (10.6%) | 98 (11.2%) |
Income Above Poverty by Sex and Age in Hildebran
According to the poverty statistics in Hildebran, males aged under 5 years and females aged 15 years are the age groups that are most secure financially, with 100.0% of males and 100.0% of females in these age groups living above the poverty line.
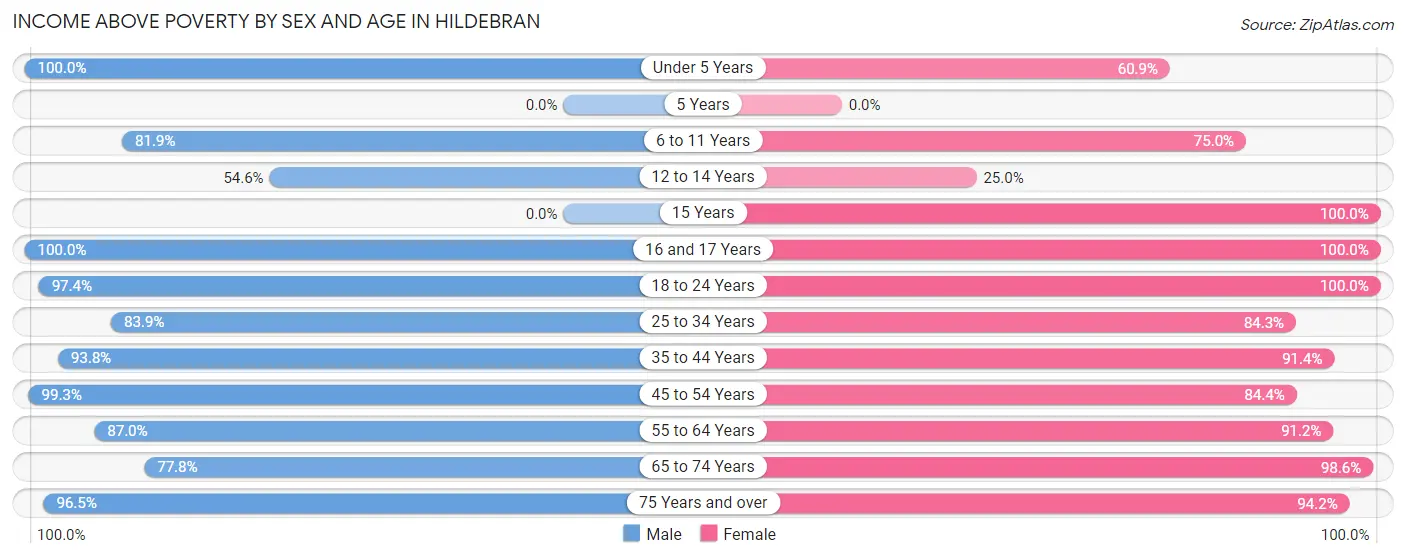
| Age Bracket | Male | Female |
| Under 5 Years | 59 (100.0%) | 14 (60.9%) |
| 5 Years | 0 (0.0%) | 0 (0.0%) |
| 6 to 11 Years | 95 (81.9%) | 51 (75.0%) |
| 12 to 14 Years | 6 (54.5%) | 2 (25.0%) |
| 15 Years | 0 (0.0%) | 15 (100.0%) |
| 16 and 17 Years | 29 (100.0%) | 65 (100.0%) |
| 18 to 24 Years | 74 (97.4%) | 21 (100.0%) |
| 25 to 34 Years | 115 (83.9%) | 59 (84.3%) |
| 35 to 44 Years | 106 (93.8%) | 170 (91.4%) |
| 45 to 54 Years | 133 (99.3%) | 130 (84.4%) |
| 55 to 64 Years | 94 (87.0%) | 83 (91.2%) |
| 65 to 74 Years | 98 (77.8%) | 71 (98.6%) |
| 75 Years and over | 55 (96.5%) | 98 (94.2%) |
| Total | 864 (89.4%) | 779 (88.8%) |
Income Below Poverty Among Married-Couple Families in Hildebran
The poverty statistics for married-couple families in Hildebran show that 6.3% or 27 of the total 428 families live below the poverty line. Families with 3 or 4 children have the highest poverty rate of 34.4%, comprising of 11 families. On the other hand, families with no children have the lowest poverty rate of 3.4%, which includes 9 families.
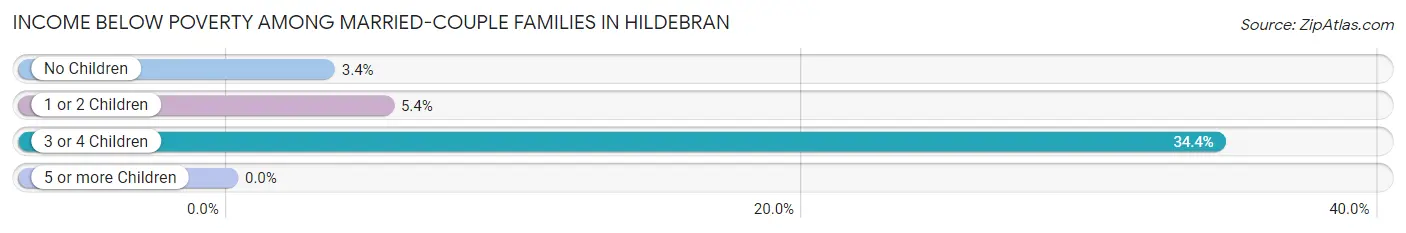
| Children | Above Poverty | Below Poverty |
| No Children | 258 (96.6%) | 9 (3.4%) |
| 1 or 2 Children | 122 (94.6%) | 7 (5.4%) |
| 3 or 4 Children | 21 (65.6%) | 11 (34.4%) |
| 5 or more Children | 0 (0.0%) | 0 (0.0%) |
| Total | 401 (93.7%) | 27 (6.3%) |
Income Below Poverty Among Single-Parent Households in Hildebran
According to the poverty data in Hildebran, 68.8% or 11 single-father households and 6.7% or 7 single-mother households are living below the poverty line. Among single-father households, those with 1 or 2 children have the highest poverty rate, with 11 households (68.8%) experiencing poverty. Likewise, among single-mother households, those with 1 or 2 children have the highest poverty rate, with 6 households (9.0%) falling below the poverty line.
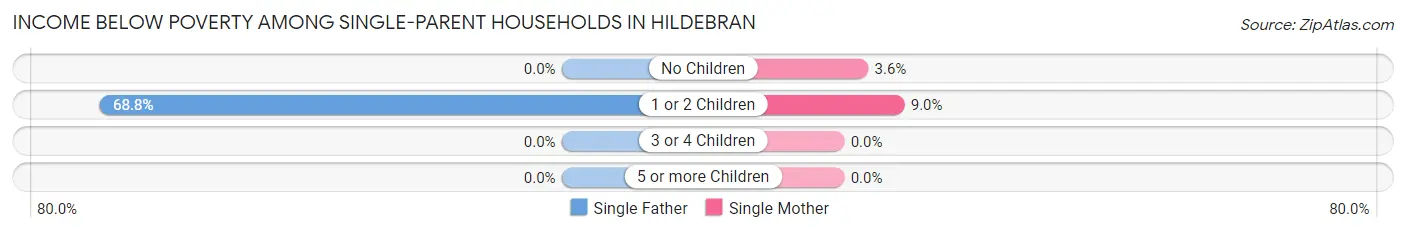
| Children | Single Father | Single Mother |
| No Children | 0 (0.0%) | 1 (3.6%) |
| 1 or 2 Children | 11 (68.8%) | 6 (9.0%) |
| 3 or 4 Children | 0 (0.0%) | 0 (0.0%) |
| 5 or more Children | 0 (0.0%) | 0 (0.0%) |
| Total | 11 (68.8%) | 7 (6.7%) |
Income Below Poverty Among Married-Couple vs Single-Parent Households in Hildebran
The poverty data for Hildebran shows that 27 of the married-couple family households (6.3%) and 18 of the single-parent households (14.9%) are living below the poverty level. Within the married-couple family households, those with 3 or 4 children have the highest poverty rate, with 11 households (34.4%) falling below the poverty line. Among the single-parent households, those with 1 or 2 children have the highest poverty rate, with 17 household (20.5%) living below poverty.
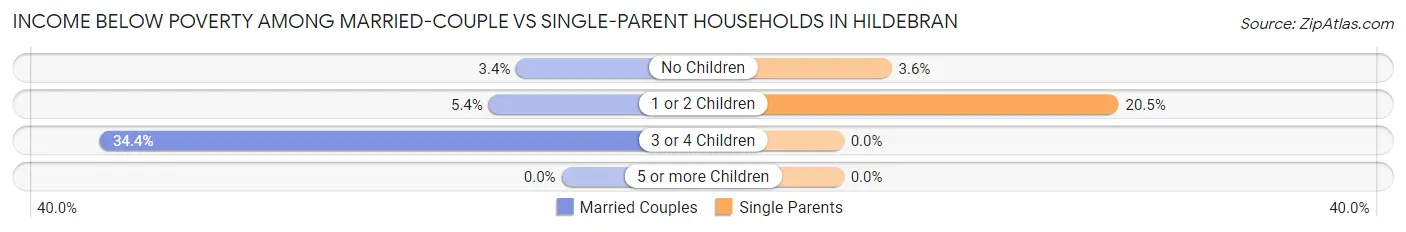
| Children | Married-Couple Families | Single-Parent Households |
| No Children | 9 (3.4%) | 1 (3.6%) |
| 1 or 2 Children | 7 (5.4%) | 17 (20.5%) |
| 3 or 4 Children | 11 (34.4%) | 0 (0.0%) |
| 5 or more Children | 0 (0.0%) | 0 (0.0%) |
| Total | 27 (6.3%) | 18 (14.9%) |
Race in Hildebran
The most populous races in Hildebran are White / Caucasian (1,500 | 81.4%), Asian (137 | 7.4%), and Some other Race (107 | 5.8%).
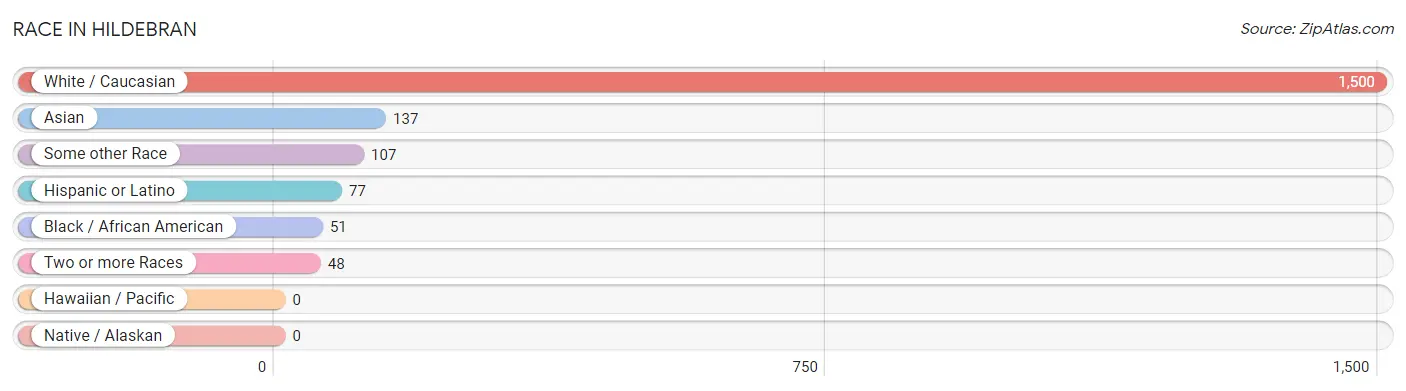
| Race | # Population | % Population |
| Asian | 137 | 7.4% |
| Black / African American | 51 | 2.8% |
| Hawaiian / Pacific | 0 | 0.0% |
| Hispanic or Latino | 77 | 4.2% |
| Native / Alaskan | 0 | 0.0% |
| White / Caucasian | 1,500 | 81.4% |
| Two or more Races | 48 | 2.6% |
| Some other Race | 107 | 5.8% |
| Total | 1,843 | 100.0% |
Ancestry in Hildebran
The most populous ancestries reported in Hildebran are American (545 | 29.6%), German (244 | 13.2%), Bangladeshi (137 | 7.4%), Irish (132 | 7.2%), and English (95 | 5.1%), together accounting for 62.6% of all Hildebran residents.
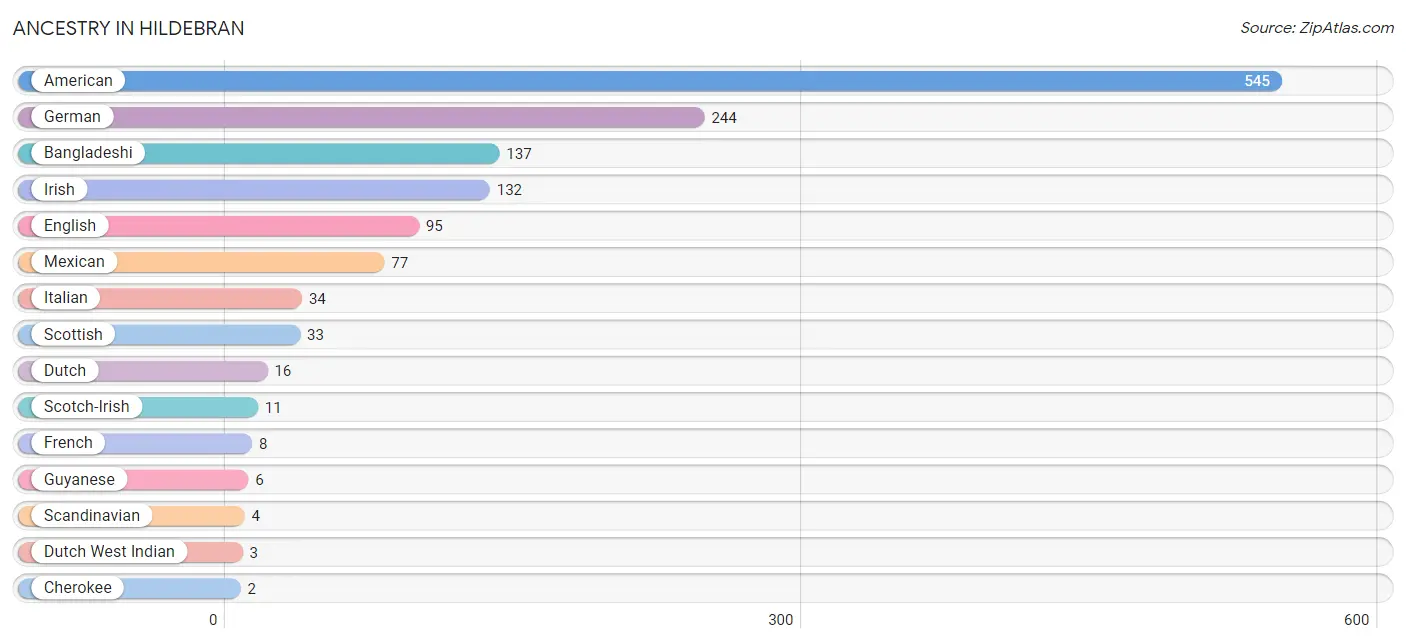
| Ancestry | # Population | % Population |
| American | 545 | 29.6% |
| Bangladeshi | 137 | 7.4% |
| Cherokee | 2 | 0.1% |
| Dutch | 16 | 0.9% |
| Dutch West Indian | 3 | 0.2% |
| English | 95 | 5.1% |
| European | 2 | 0.1% |
| French | 8 | 0.4% |
| German | 244 | 13.2% |
| Guyanese | 6 | 0.3% |
| Irish | 132 | 7.2% |
| Italian | 34 | 1.8% |
| Mexican | 77 | 4.2% |
| Scandinavian | 4 | 0.2% |
| Scotch-Irish | 11 | 0.6% |
| Scottish | 33 | 1.8% |
| Sioux | 2 | 0.1% |
| Swiss | 2 | 0.1% |
| Welsh | 1 | 0.1% | View All 19 Rows |
Immigrants in Hildebran
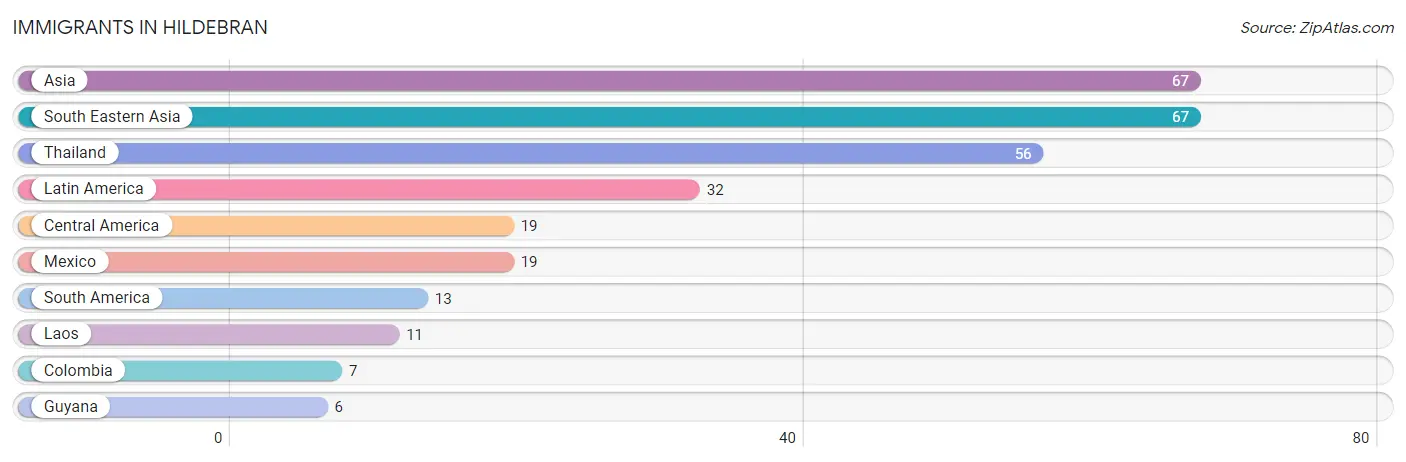
The most numerous immigrant groups reported in Hildebran came from Asia (67 | 3.6%), South Eastern Asia (67 | 3.6%), Thailand (56 | 3.0%), Latin America (32 | 1.7%), and Central America (19 | 1.0%), together accounting for 13.1% of all Hildebran residents.
| Immigration Origin | # Population | % Population |
| Asia | 67 | 3.6% |
| Central America | 19 | 1.0% |
| Colombia | 7 | 0.4% |
| Guyana | 6 | 0.3% |
| Laos | 11 | 0.6% |
| Latin America | 32 | 1.7% |
| Mexico | 19 | 1.0% |
| South America | 13 | 0.7% |
| South Eastern Asia | 67 | 3.6% |
| Thailand | 56 | 3.0% | View All 10 Rows |
Sex and Age in Hildebran
Sex and Age in Hildebran
The most populous age groups in Hildebran are 65 to 69 Years (89 | 9.2%) for men and 40 to 44 Years (114 | 13.0%) for women.
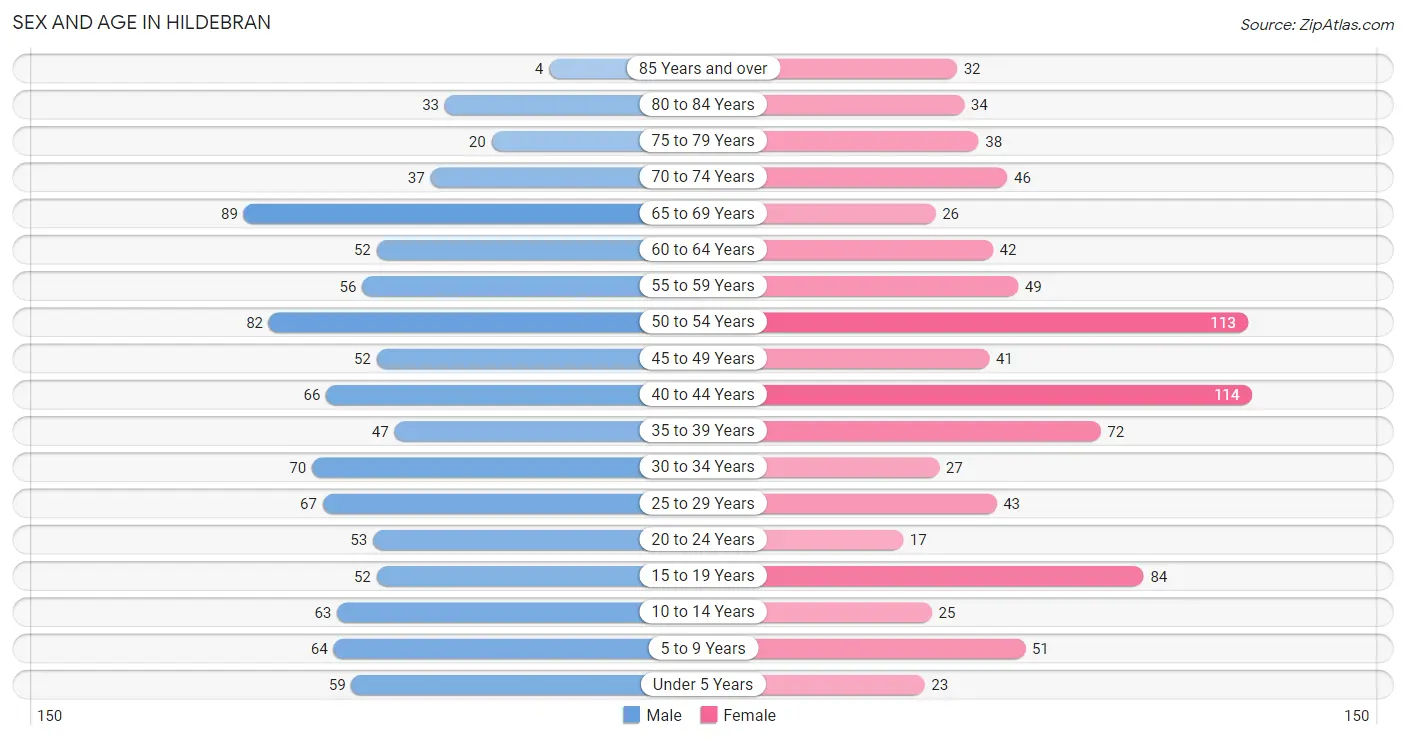
| Age Bracket | Male | Female |
| Under 5 Years | 59 (6.1%) | 23 (2.6%) |
| 5 to 9 Years | 64 (6.6%) | 51 (5.8%) |
| 10 to 14 Years | 63 (6.5%) | 25 (2.9%) |
| 15 to 19 Years | 52 (5.4%) | 84 (9.6%) |
| 20 to 24 Years | 53 (5.5%) | 17 (1.9%) |
| 25 to 29 Years | 67 (6.9%) | 43 (4.9%) |
| 30 to 34 Years | 70 (7.2%) | 27 (3.1%) |
| 35 to 39 Years | 47 (4.9%) | 72 (8.2%) |
| 40 to 44 Years | 66 (6.8%) | 114 (13.0%) |
| 45 to 49 Years | 52 (5.4%) | 41 (4.7%) |
| 50 to 54 Years | 82 (8.5%) | 113 (12.9%) |
| 55 to 59 Years | 56 (5.8%) | 49 (5.6%) |
| 60 to 64 Years | 52 (5.4%) | 42 (4.8%) |
| 65 to 69 Years | 89 (9.2%) | 26 (3.0%) |
| 70 to 74 Years | 37 (3.8%) | 46 (5.2%) |
| 75 to 79 Years | 20 (2.1%) | 38 (4.3%) |
| 80 to 84 Years | 33 (3.4%) | 34 (3.9%) |
| 85 Years and over | 4 (0.4%) | 32 (3.6%) |
| Total | 966 (100.0%) | 877 (100.0%) |
Families and Households in Hildebran
Median Family Size in Hildebran
The median family size in Hildebran is 2.87 persons per family, with single female/mother families (105 | 19.1%) accounting for the largest median family size of 2.92 persons per family. On the other hand, single male/father families (16 | 2.9%) represent the smallest median family size with 2.38 persons per family.
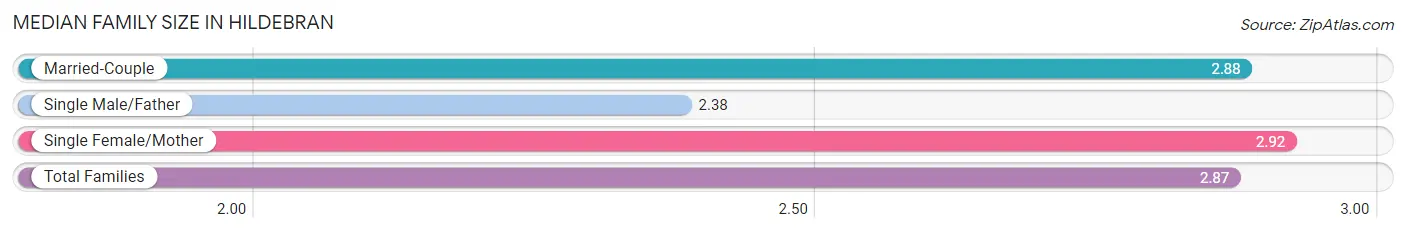
| Family Type | # Families | Family Size |
| Married-Couple | 428 (78.0%) | 2.88 |
| Single Male/Father | 16 (2.9%) | 2.38 |
| Single Female/Mother | 105 (19.1%) | 2.92 |
| Total Families | 549 (100.0%) | 2.87 |
Median Household Size in Hildebran
The median household size in Hildebran is 2.40 persons per household, with single male/father households (16 | 2.1%) accounting for the largest median household size of 3.31 persons per household. non-family households (220 | 28.6%) represent the smallest median household size with 1.03 persons per household.
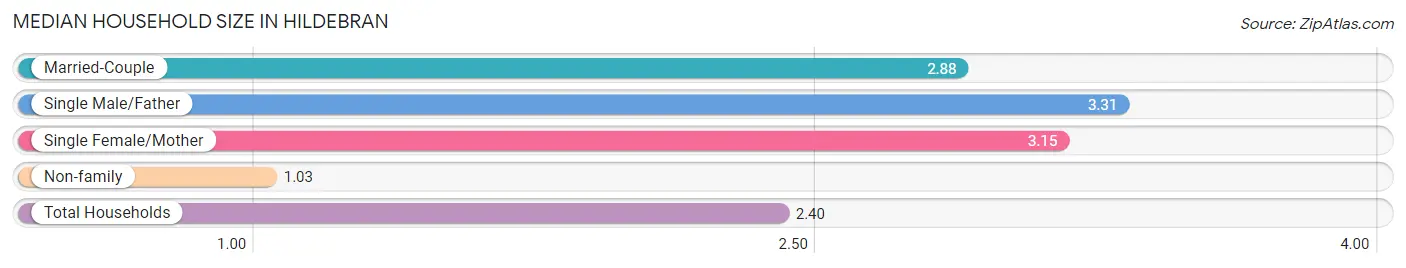
| Household Type | # Households | Household Size |
| Married-Couple | 428 (55.7%) | 2.88 |
| Single Male/Father | 16 (2.1%) | 3.31 |
| Single Female/Mother | 105 (13.7%) | 3.15 |
| Non-family | 220 (28.6%) | 1.03 |
| Total Households | 769 (100.0%) | 2.40 |
Household Size by Marriage Status in Hildebran
Out of a total of 769 households in Hildebran, 549 (71.4%) are family households, while 220 (28.6%) are nonfamily households. The most numerous type of family households are 2-person households, comprising 248, and the most common type of nonfamily households are 1-person households, comprising 214.
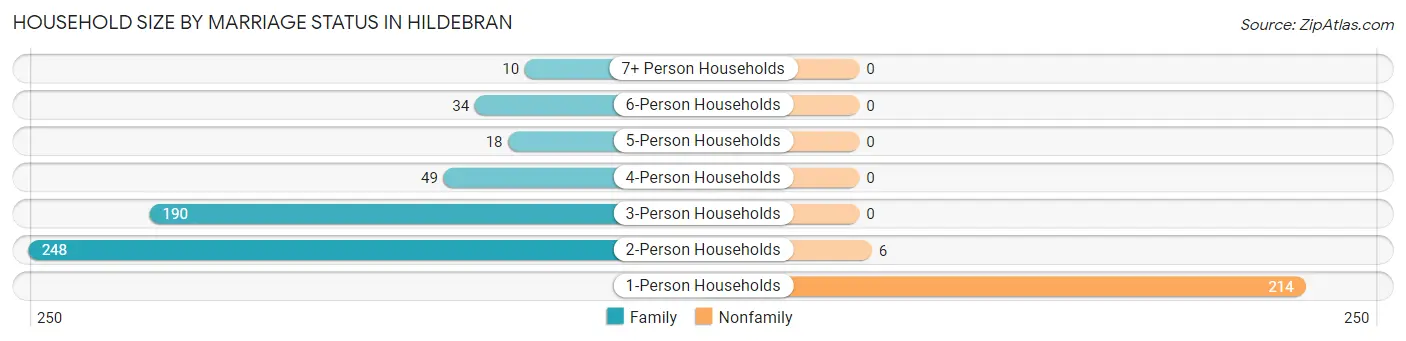
| Household Size | Family Households | Nonfamily Households |
| 1-Person Households | - | 214 (27.8%) |
| 2-Person Households | 248 (32.3%) | 6 (0.8%) |
| 3-Person Households | 190 (24.7%) | 0 (0.0%) |
| 4-Person Households | 49 (6.4%) | 0 (0.0%) |
| 5-Person Households | 18 (2.3%) | 0 (0.0%) |
| 6-Person Households | 34 (4.4%) | 0 (0.0%) |
| 7+ Person Households | 10 (1.3%) | 0 (0.0%) |
| Total | 549 (71.4%) | 220 (28.6%) |
Female Fertility in Hildebran
Fertility by Age in Hildebran
Average fertility rate in Hildebran is 35.0 births per 1,000 women. Women in the age bracket of 20 to 34 years have the highest fertility rate with 172.0 births per 1,000 women. Women in the age bracket of 20 to 34 years acount for 100.0% of all women with births.
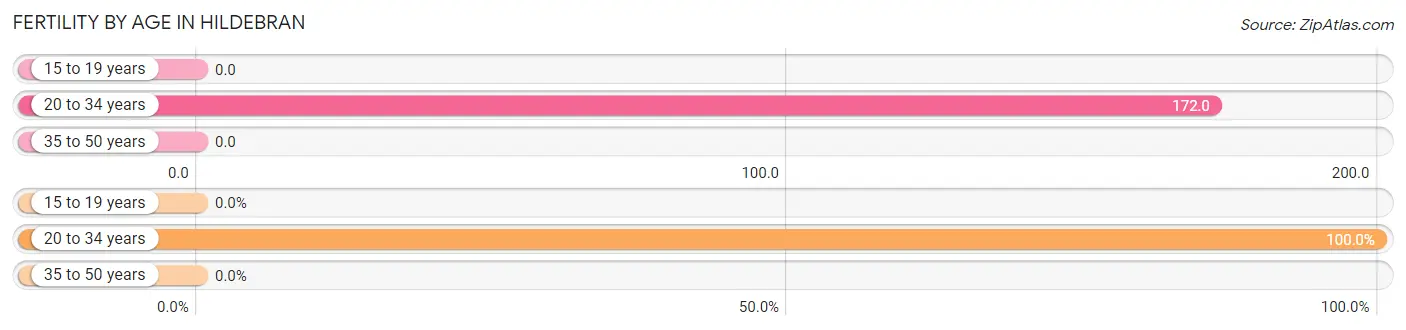
| Age Bracket | Women with Births | Births / 1,000 Women |
| 15 to 19 years | 0 (0.0%) | 0.0 |
| 20 to 34 years | 15 (100.0%) | 172.0 |
| 35 to 50 years | 0 (0.0%) | 0.0 |
| Total | 15 (100.0%) | 35.0 |
Fertility by Age by Marriage Status in Hildebran
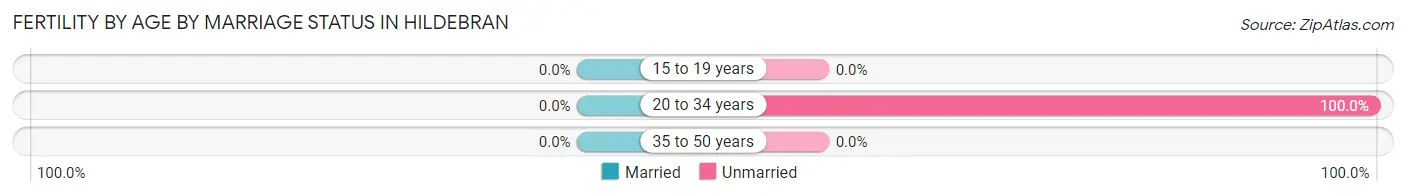
| Age Bracket | Married | Unmarried |
| 15 to 19 years | 0 (0.0%) | 0 (0.0%) |
| 20 to 34 years | 0 (0.0%) | 15 (100.0%) |
| 35 to 50 years | 0 (0.0%) | 0 (0.0%) |
| Total | 0 (0.0%) | 15 (100.0%) |
Fertility by Education in Hildebran
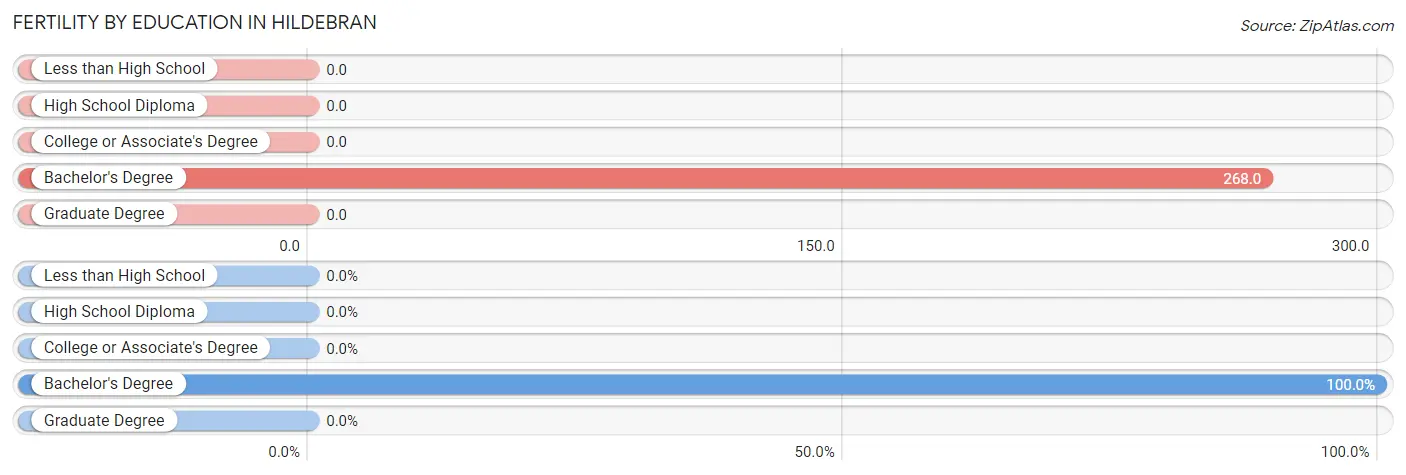
| Educational Attainment | Women with Births | Births / 1,000 Women |
| Less than High School | 0 (0.0%) | 0.0 |
| High School Diploma | 0 (0.0%) | 0.0 |
| College or Associate's Degree | 0 (0.0%) | 0.0 |
| Bachelor's Degree | 15 (100.0%) | 268.0 |
| Graduate Degree | 0 (0.0%) | 0.0 |
| Total | 15 (100.0%) | 35.0 |
Fertility by Education by Marriage Status in Hildebran
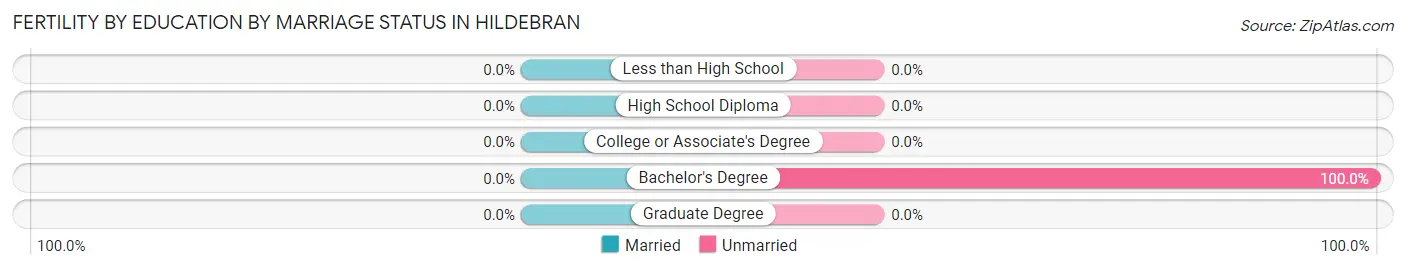
| Educational Attainment | Married | Unmarried |
| Less than High School | 0 (0.0%) | 0 (0.0%) |
| High School Diploma | 0 (0.0%) | 0 (0.0%) |
| College or Associate's Degree | 0 (0.0%) | 0 (0.0%) |
| Bachelor's Degree | 0 (0.0%) | 15 (100.0%) |
| Graduate Degree | 0 (0.0%) | 0 (0.0%) |
| Total | 0 (0.0%) | 15 (100.0%) |
Employment Characteristics in Hildebran
Employment by Class of Employer in Hildebran
Among the 796 employed individuals in Hildebran, private company employees (603 | 75.7%), local government employees (61 | 7.7%), and not-for-profit organizations (34 | 4.3%) make up the most common classes of employment.
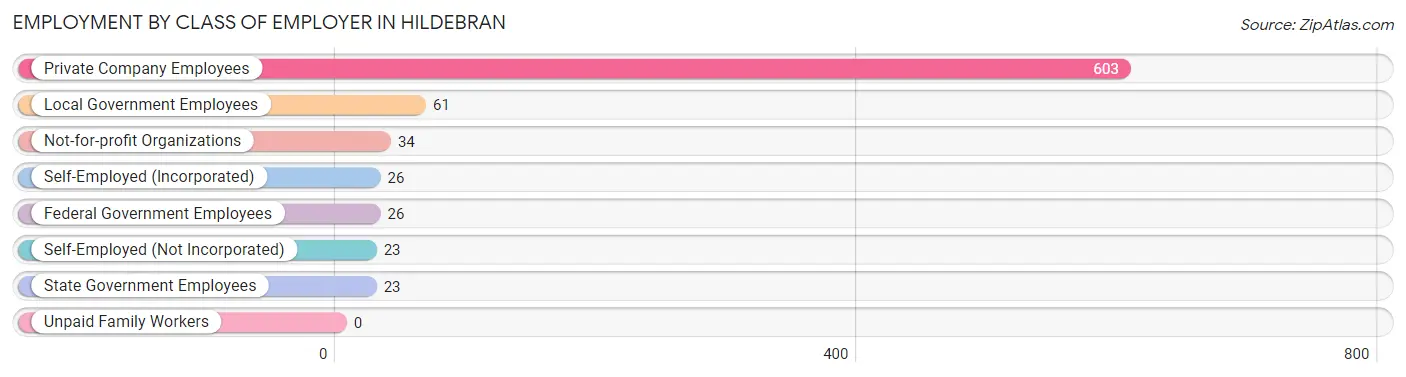
| Employer Class | # Employees | % Employees |
| Private Company Employees | 603 | 75.7% |
| Self-Employed (Incorporated) | 26 | 3.3% |
| Self-Employed (Not Incorporated) | 23 | 2.9% |
| Not-for-profit Organizations | 34 | 4.3% |
| Local Government Employees | 61 | 7.7% |
| State Government Employees | 23 | 2.9% |
| Federal Government Employees | 26 | 3.3% |
| Unpaid Family Workers | 0 | 0.0% |
| Total | 796 | 100.0% |
Employment Status by Age in Hildebran
According to the labor force statistics for Hildebran, out of the total population over 16 years of age (1,543), 62.5% or 964 individuals are in the labor force, with 5.0% or 48 of them unemployed. The age group with the highest labor force participation rate is 30 to 34 years, with 100.0% or 97 individuals in the labor force. Within the labor force, the 16 to 19 years age range has the highest percentage of unemployed individuals, with 14.8% or 13 of them being unemployed.
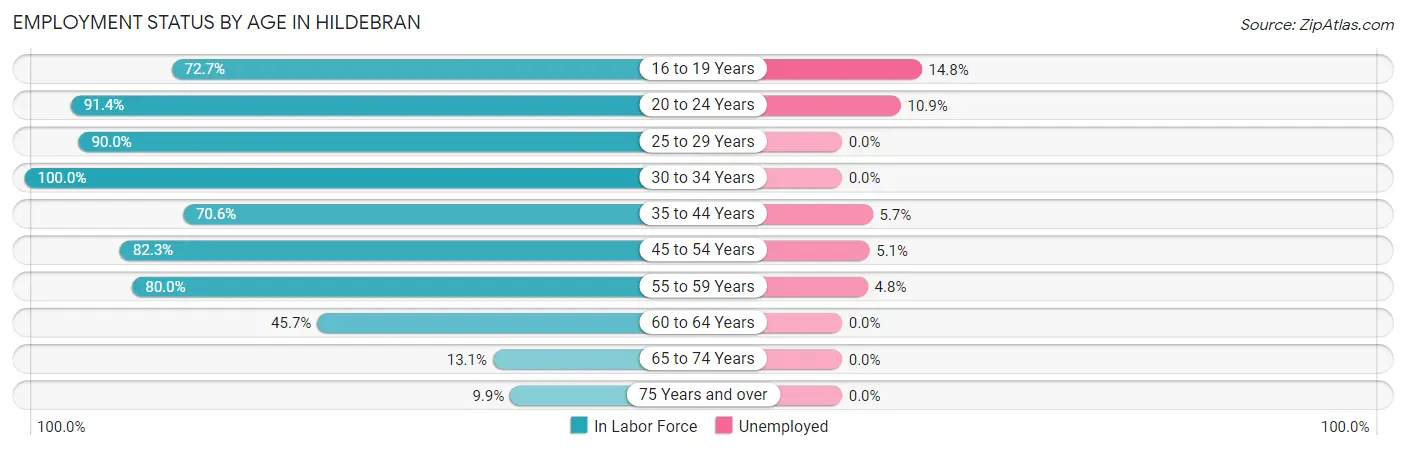
| Age Bracket | In Labor Force | Unemployed |
| 16 to 19 Years | 88 (72.7%) | 13 (14.8%) |
| 20 to 24 Years | 64 (91.4%) | 7 (10.9%) |
| 25 to 29 Years | 99 (90.0%) | 0 (0.0%) |
| 30 to 34 Years | 97 (100.0%) | 0 (0.0%) |
| 35 to 44 Years | 211 (70.6%) | 12 (5.7%) |
| 45 to 54 Years | 237 (82.3%) | 12 (5.1%) |
| 55 to 59 Years | 84 (80.0%) | 4 (4.8%) |
| 60 to 64 Years | 43 (45.7%) | 0 (0.0%) |
| 65 to 74 Years | 26 (13.1%) | 0 (0.0%) |
| 75 Years and over | 16 (9.9%) | 0 (0.0%) |
| Total | 964 (62.5%) | 48 (5.0%) |
Employment Status by Educational Attainment in Hildebran
According to labor force statistics for Hildebran, 77.6% of individuals (771) out of the total population between 25 and 64 years of age (993) are in the labor force, with 3.7% or 29 of them being unemployed. The group with the highest labor force participation rate are those with the educational attainment of bachelor's degree or higher, with 89.2% or 132 individuals in the labor force. Within the labor force, individuals with high school diploma education have the highest percentage of unemployment, with 8.0% or 25 of them being unemployed.
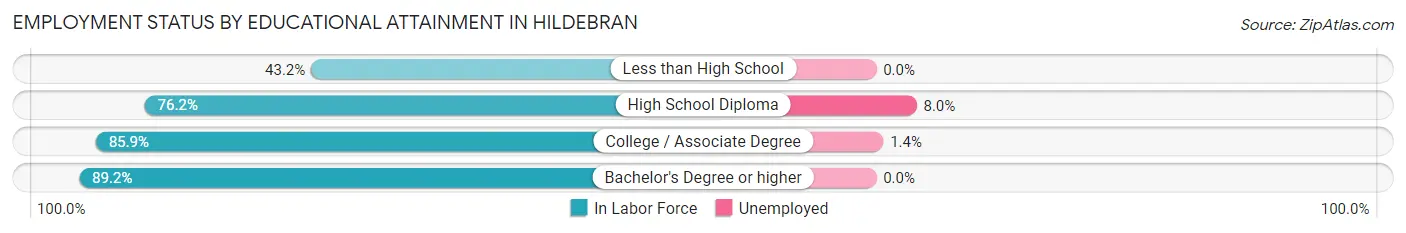
| Educational Attainment | In Labor Force | Unemployed |
| Less than High School | 48 (43.2%) | 0 (0.0%) |
| High School Diploma | 310 (76.2%) | 33 (8.0%) |
| College / Associate Degree | 281 (85.9%) | 5 (1.4%) |
| Bachelor's Degree or higher | 132 (89.2%) | 0 (0.0%) |
| Total | 771 (77.6%) | 37 (3.7%) |
Employment Occupations by Sex in Hildebran
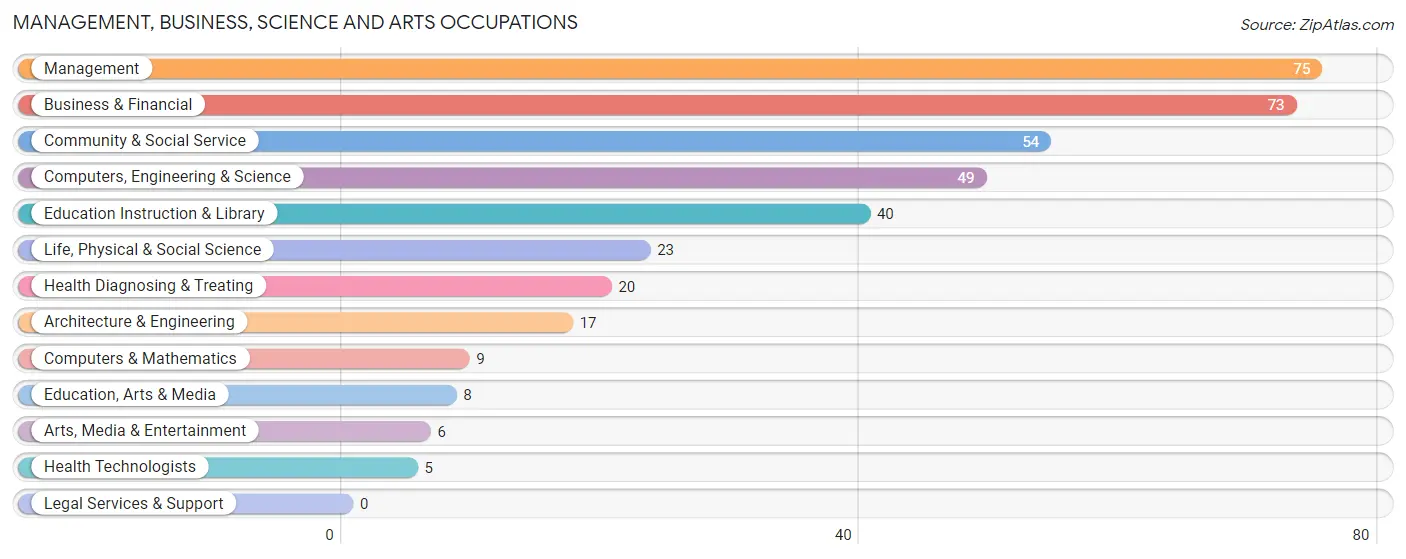
Management, Business, Science and Arts Occupations
The most common Management, Business, Science and Arts occupations in Hildebran are Management (75 | 8.3%), Business & Financial (73 | 8.1%), Community & Social Service (54 | 6.0%), Computers, Engineering & Science (49 | 5.4%), and Education Instruction & Library (40 | 4.4%).
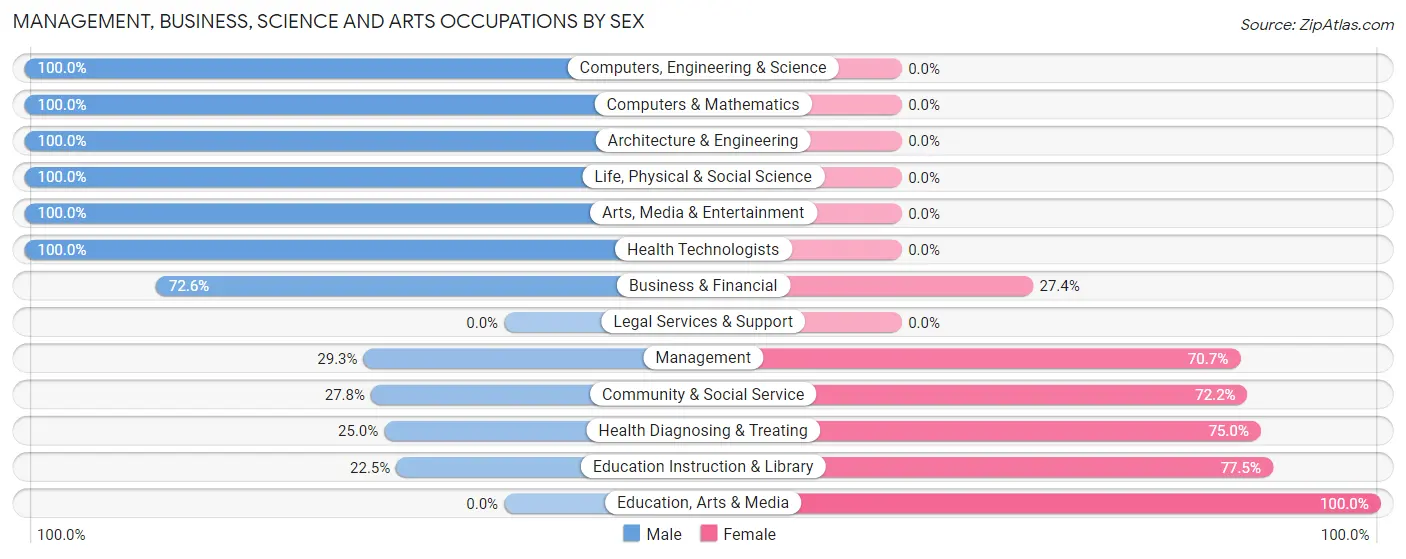
Management, Business, Science and Arts Occupations by Sex
Within the Management, Business, Science and Arts occupations in Hildebran, the most male-oriented occupations are Computers, Engineering & Science (100.0%), Computers & Mathematics (100.0%), and Architecture & Engineering (100.0%), while the most female-oriented occupations are Education, Arts & Media (100.0%), Education Instruction & Library (77.5%), and Health Diagnosing & Treating (75.0%).
| Occupation | Male | Female |
| Management | 22 (29.3%) | 53 (70.7%) |
| Business & Financial | 53 (72.6%) | 20 (27.4%) |
| Computers, Engineering & Science | 49 (100.0%) | 0 (0.0%) |
| Computers & Mathematics | 9 (100.0%) | 0 (0.0%) |
| Architecture & Engineering | 17 (100.0%) | 0 (0.0%) |
| Life, Physical & Social Science | 23 (100.0%) | 0 (0.0%) |
| Community & Social Service | 15 (27.8%) | 39 (72.2%) |
| Education, Arts & Media | 0 (0.0%) | 8 (100.0%) |
| Legal Services & Support | 0 (0.0%) | 0 (0.0%) |
| Education Instruction & Library | 9 (22.5%) | 31 (77.5%) |
| Arts, Media & Entertainment | 6 (100.0%) | 0 (0.0%) |
| Health Diagnosing & Treating | 5 (25.0%) | 15 (75.0%) |
| Health Technologists | 5 (100.0%) | 0 (0.0%) |
| Total (Category) | 144 (53.1%) | 127 (46.9%) |
| Total (Overall) | 490 (54.1%) | 416 (45.9%) |
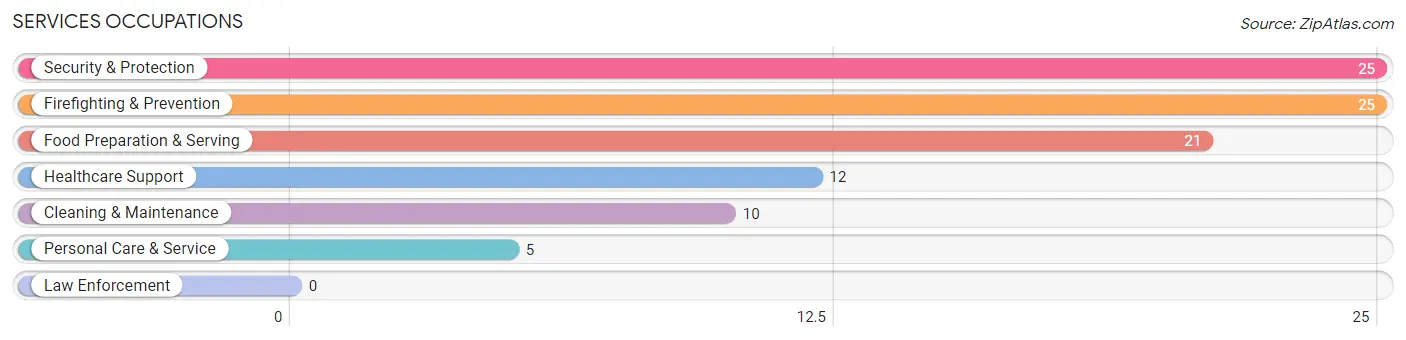
Services Occupations
The most common Services occupations in Hildebran are Security & Protection (25 | 2.8%), Firefighting & Prevention (25 | 2.8%), Food Preparation & Serving (21 | 2.3%), Healthcare Support (12 | 1.3%), and Cleaning & Maintenance (10 | 1.1%).
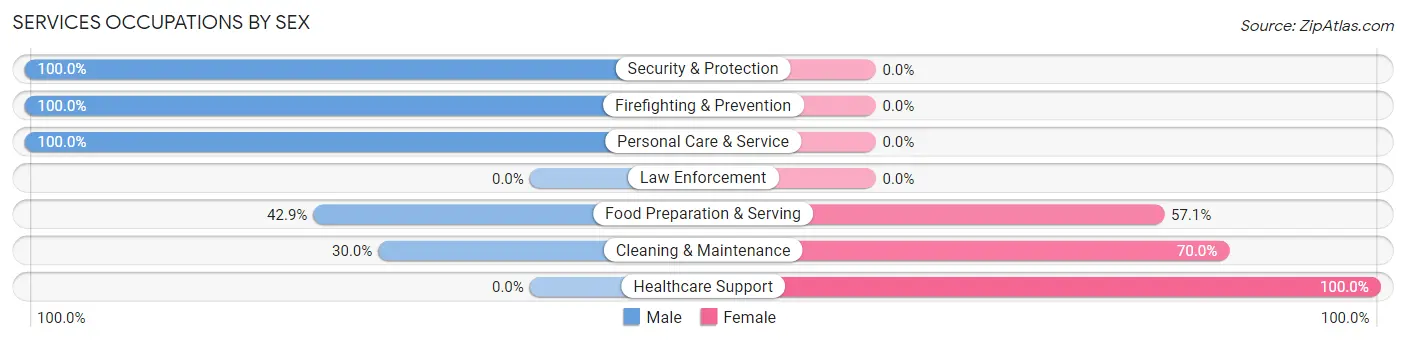
Services Occupations by Sex
Within the Services occupations in Hildebran, the most male-oriented occupations are Security & Protection (100.0%), Firefighting & Prevention (100.0%), and Personal Care & Service (100.0%), while the most female-oriented occupations are Healthcare Support (100.0%), Cleaning & Maintenance (70.0%), and Food Preparation & Serving (57.1%).
| Occupation | Male | Female |
| Healthcare Support | 0 (0.0%) | 12 (100.0%) |
| Security & Protection | 25 (100.0%) | 0 (0.0%) |
| Firefighting & Prevention | 25 (100.0%) | 0 (0.0%) |
| Law Enforcement | 0 (0.0%) | 0 (0.0%) |
| Food Preparation & Serving | 9 (42.9%) | 12 (57.1%) |
| Cleaning & Maintenance | 3 (30.0%) | 7 (70.0%) |
| Personal Care & Service | 5 (100.0%) | 0 (0.0%) |
| Total (Category) | 42 (57.5%) | 31 (42.5%) |
| Total (Overall) | 490 (54.1%) | 416 (45.9%) |
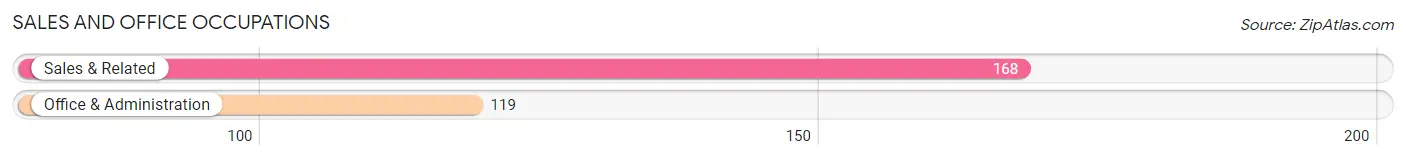
Sales and Office Occupations
The most common Sales and Office occupations in Hildebran are Sales & Related (168 | 18.5%), and Office & Administration (119 | 13.1%).
Sales and Office Occupations by Sex
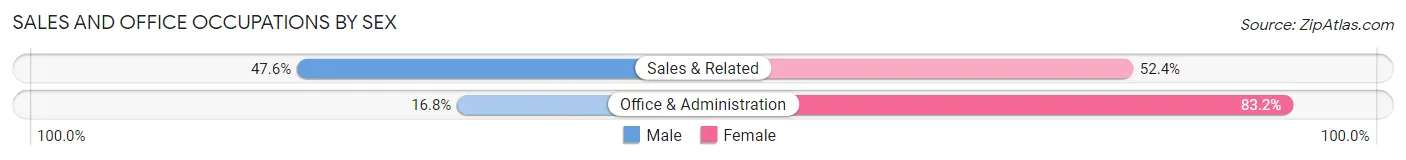
| Occupation | Male | Female |
| Sales & Related | 80 (47.6%) | 88 (52.4%) |
| Office & Administration | 20 (16.8%) | 99 (83.2%) |
| Total (Category) | 100 (34.8%) | 187 (65.2%) |
| Total (Overall) | 490 (54.1%) | 416 (45.9%) |
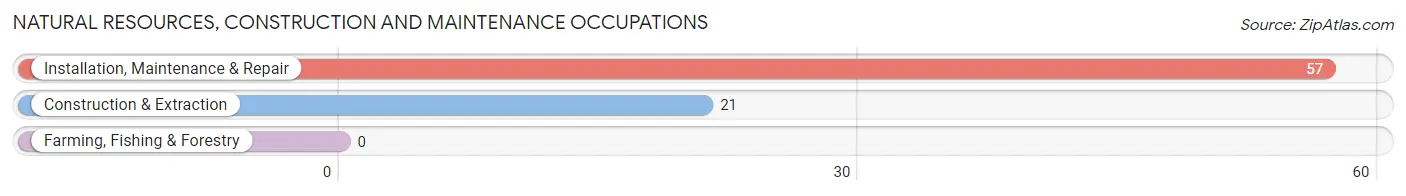
Natural Resources, Construction and Maintenance Occupations
The most common Natural Resources, Construction and Maintenance occupations in Hildebran are Installation, Maintenance & Repair (57 | 6.3%), and Construction & Extraction (21 | 2.3%).
Natural Resources, Construction and Maintenance Occupations by Sex
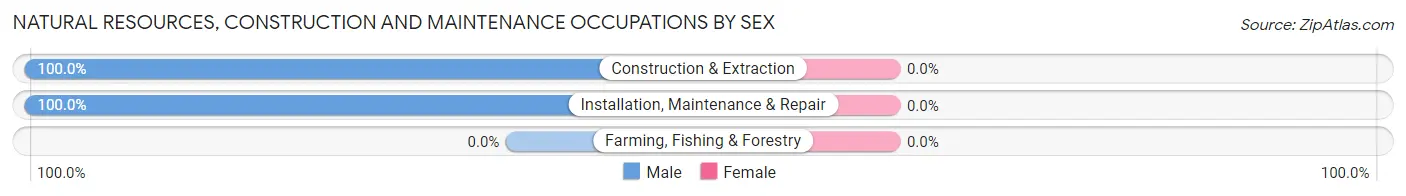
| Occupation | Male | Female |
| Farming, Fishing & Forestry | 0 (0.0%) | 0 (0.0%) |
| Construction & Extraction | 21 (100.0%) | 0 (0.0%) |
| Installation, Maintenance & Repair | 57 (100.0%) | 0 (0.0%) |
| Total (Category) | 78 (100.0%) | 0 (0.0%) |
| Total (Overall) | 490 (54.1%) | 416 (45.9%) |
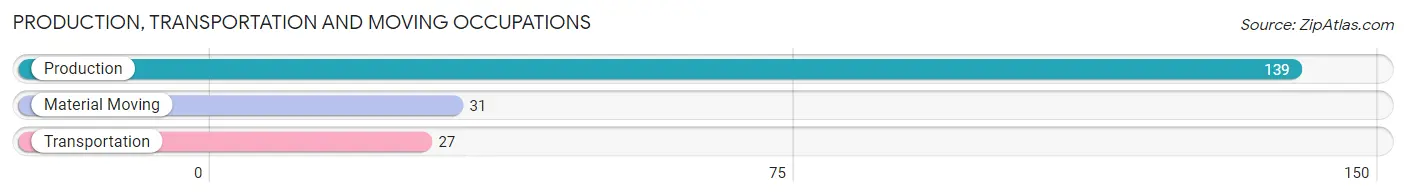
Production, Transportation and Moving Occupations
The most common Production, Transportation and Moving occupations in Hildebran are Production (139 | 15.3%), Material Moving (31 | 3.4%), and Transportation (27 | 3.0%).
Production, Transportation and Moving Occupations by Sex
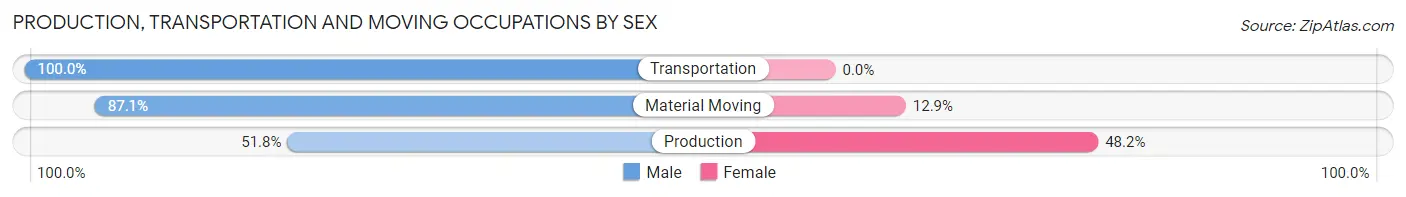
| Occupation | Male | Female |
| Production | 72 (51.8%) | 67 (48.2%) |
| Transportation | 27 (100.0%) | 0 (0.0%) |
| Material Moving | 27 (87.1%) | 4 (12.9%) |
| Total (Category) | 126 (64.0%) | 71 (36.0%) |
| Total (Overall) | 490 (54.1%) | 416 (45.9%) |
Employment Industries by Sex in Hildebran
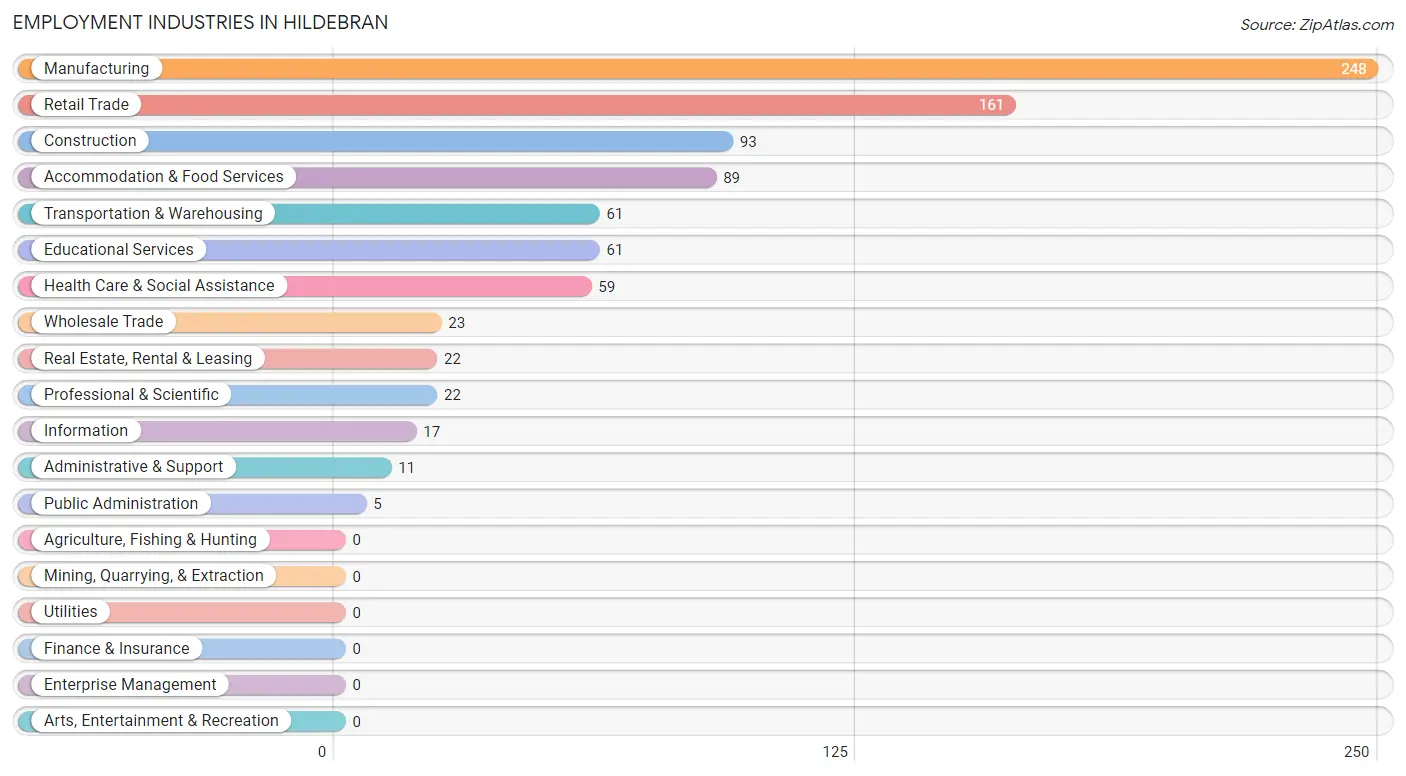
Employment Industries in Hildebran
The major employment industries in Hildebran include Manufacturing (248 | 27.4%), Retail Trade (161 | 17.8%), Construction (93 | 10.3%), Accommodation & Food Services (89 | 9.8%), and Transportation & Warehousing (61 | 6.7%).
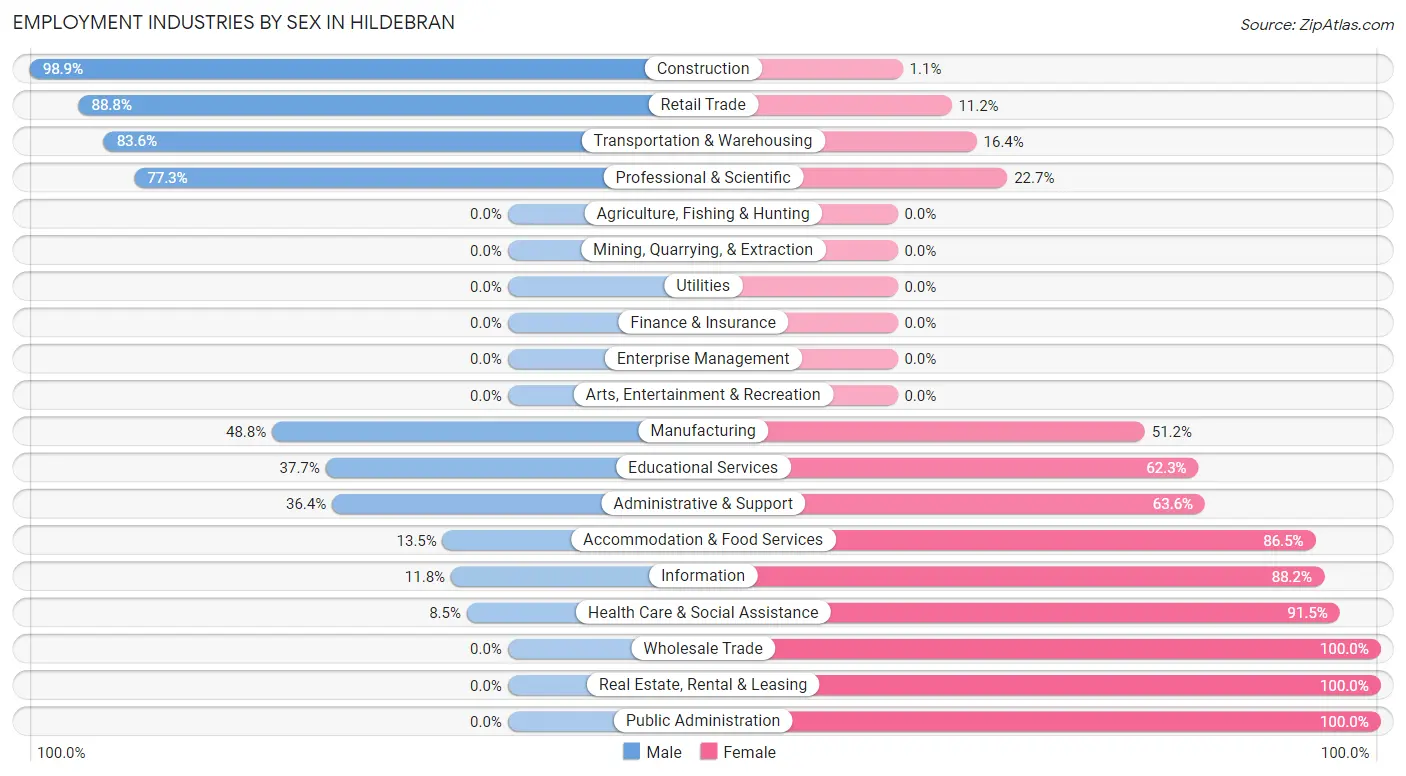
Employment Industries by Sex in Hildebran
The Hildebran industries that see more men than women are Construction (98.9%), Retail Trade (88.8%), and Transportation & Warehousing (83.6%), whereas the industries that tend to have a higher number of women are Wholesale Trade (100.0%), Real Estate, Rental & Leasing (100.0%), and Public Administration (100.0%).
| Industry | Male | Female |
| Agriculture, Fishing & Hunting | 0 (0.0%) | 0 (0.0%) |
| Mining, Quarrying, & Extraction | 0 (0.0%) | 0 (0.0%) |
| Construction | 92 (98.9%) | 1 (1.1%) |
| Manufacturing | 121 (48.8%) | 127 (51.2%) |
| Wholesale Trade | 0 (0.0%) | 23 (100.0%) |
| Retail Trade | 143 (88.8%) | 18 (11.2%) |
| Transportation & Warehousing | 51 (83.6%) | 10 (16.4%) |
| Utilities | 0 (0.0%) | 0 (0.0%) |
| Information | 2 (11.8%) | 15 (88.2%) |
| Finance & Insurance | 0 (0.0%) | 0 (0.0%) |
| Real Estate, Rental & Leasing | 0 (0.0%) | 22 (100.0%) |
| Professional & Scientific | 17 (77.3%) | 5 (22.7%) |
| Enterprise Management | 0 (0.0%) | 0 (0.0%) |
| Administrative & Support | 4 (36.4%) | 7 (63.6%) |
| Educational Services | 23 (37.7%) | 38 (62.3%) |
| Health Care & Social Assistance | 5 (8.5%) | 54 (91.5%) |
| Arts, Entertainment & Recreation | 0 (0.0%) | 0 (0.0%) |
| Accommodation & Food Services | 12 (13.5%) | 77 (86.5%) |
| Public Administration | 0 (0.0%) | 5 (100.0%) |
| Total | 490 (54.1%) | 416 (45.9%) |
Education in Hildebran
School Enrollment in Hildebran
The most common levels of schooling among the 360 students in Hildebran are high school (115 | 31.9%), elementary school (111 | 30.8%), and middle school (73 | 20.3%).
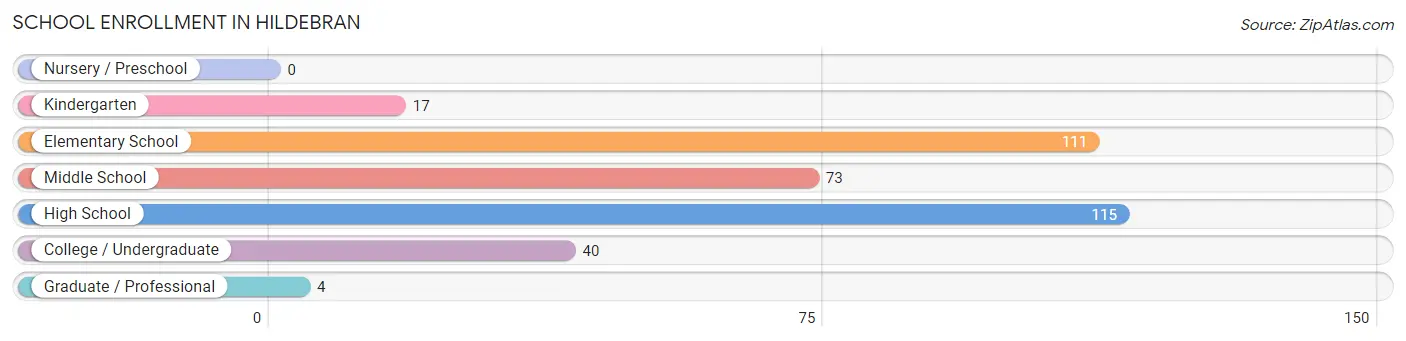
| School Level | # Students | % Students |
| Nursery / Preschool | 0 | 0.0% |
| Kindergarten | 17 | 4.7% |
| Elementary School | 111 | 30.8% |
| Middle School | 73 | 20.3% |
| High School | 115 | 31.9% |
| College / Undergraduate | 40 | 11.1% |
| Graduate / Professional | 4 | 1.1% |
| Total | 360 | 100.0% |
School Enrollment by Age by Funding Source in Hildebran
Out of a total of 360 students who are enrolled in schools in Hildebran, 11 (3.1%) attend a private institution, while the remaining 349 (96.9%) are enrolled in public schools. The age group of 10 to 14 year olds has the highest likelihood of being enrolled in private schools, with 6 (6.8% in the age bracket) enrolled. Conversely, the age group of 15 to 17 year olds has the lowest likelihood of being enrolled in a private school, with 109 (100.0% in the age bracket) attending a public institution.
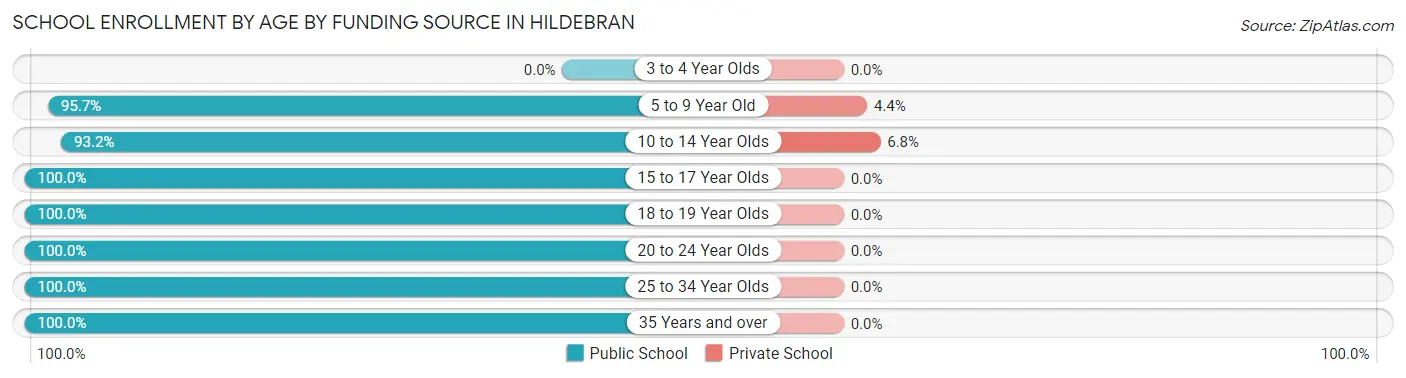
| Age Bracket | Public School | Private School |
| 3 to 4 Year Olds | 0 (0.0%) | 0 (0.0%) |
| 5 to 9 Year Old | 110 (95.7%) | 5 (4.3%) |
| 10 to 14 Year Olds | 82 (93.2%) | 6 (6.8%) |
| 15 to 17 Year Olds | 109 (100.0%) | 0 (0.0%) |
| 18 to 19 Year Olds | 4 (100.0%) | 0 (0.0%) |
| 20 to 24 Year Olds | 23 (100.0%) | 0 (0.0%) |
| 25 to 34 Year Olds | 13 (100.0%) | 0 (0.0%) |
| 35 Years and over | 8 (100.0%) | 0 (0.0%) |
| Total | 349 (96.9%) | 11 (3.1%) |
Educational Attainment by Field of Study in Hildebran
Education (66 | 30.4%), science & technology (63 | 29.0%), liberal arts & history (20 | 9.2%), business (17 | 7.8%), and arts & humanities (14 | 6.5%) are the most common fields of study among 217 individuals in Hildebran who have obtained a bachelor's degree or higher.
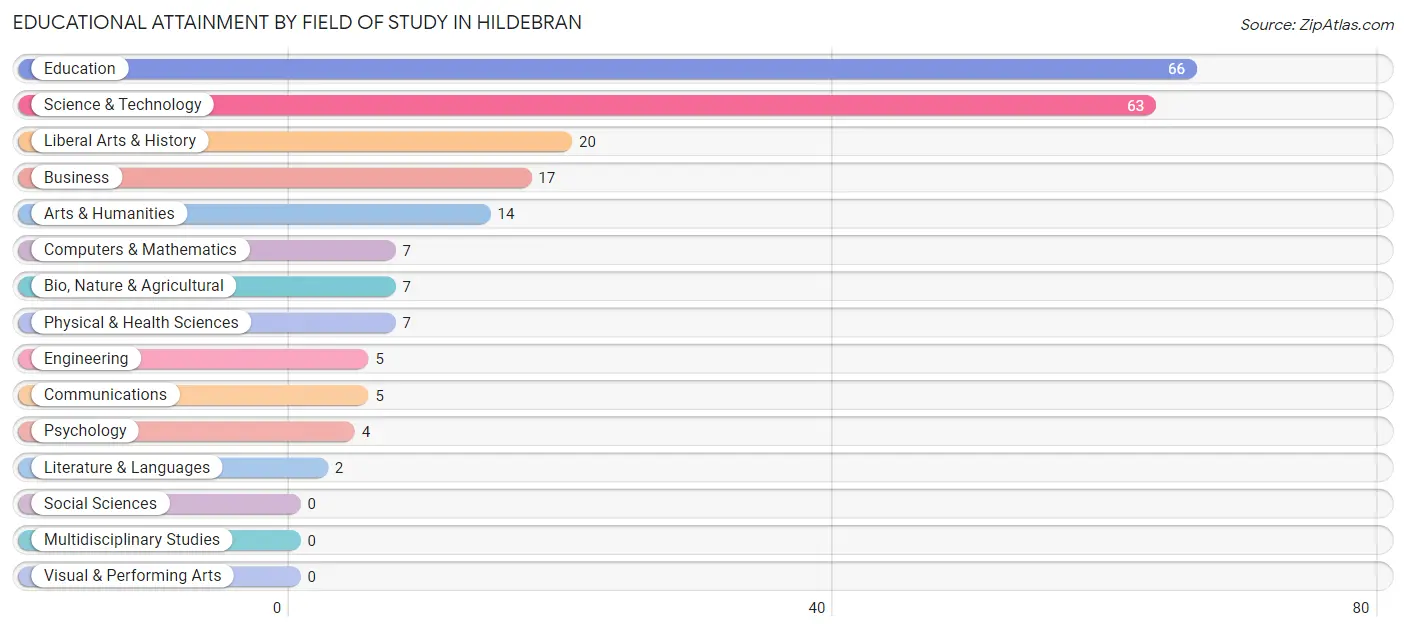
| Field of Study | # Graduates | % Graduates |
| Computers & Mathematics | 7 | 3.2% |
| Bio, Nature & Agricultural | 7 | 3.2% |
| Physical & Health Sciences | 7 | 3.2% |
| Psychology | 4 | 1.8% |
| Social Sciences | 0 | 0.0% |
| Engineering | 5 | 2.3% |
| Multidisciplinary Studies | 0 | 0.0% |
| Science & Technology | 63 | 29.0% |
| Business | 17 | 7.8% |
| Education | 66 | 30.4% |
| Literature & Languages | 2 | 0.9% |
| Liberal Arts & History | 20 | 9.2% |
| Visual & Performing Arts | 0 | 0.0% |
| Communications | 5 | 2.3% |
| Arts & Humanities | 14 | 6.5% |
| Total | 217 | 100.0% |
Transportation & Commute in Hildebran
Vehicle Availability by Sex in Hildebran
The most prevalent vehicle ownership categories in Hildebran are males with 3 vehicles (154, accounting for 31.3%) and females with 3 vehicles (110, making up 50.7%).
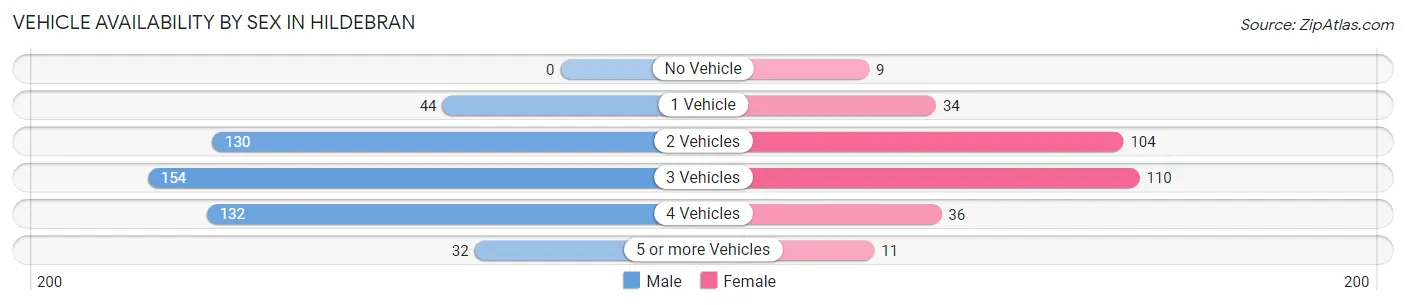
| Vehicles Available | Male | Female |
| No Vehicle | 0 (0.0%) | 9 (3.0%) |
| 1 Vehicle | 44 (8.9%) | 34 (11.2%) |
| 2 Vehicles | 130 (26.4%) | 104 (34.2%) |
| 3 Vehicles | 154 (31.3%) | 110 (36.2%) |
| 4 Vehicles | 132 (26.8%) | 36 (11.8%) |
| 5 or more Vehicles | 32 (6.5%) | 11 (3.6%) |
| Total | 492 (100.0%) | 304 (100.0%) |
Commute Time in Hildebran
The most frequently occuring commute durations in Hildebran are 20 to 24 minutes (242 commuters, 31.4%), 10 to 14 minutes (145 commuters, 18.8%), and 15 to 19 minutes (143 commuters, 18.6%).
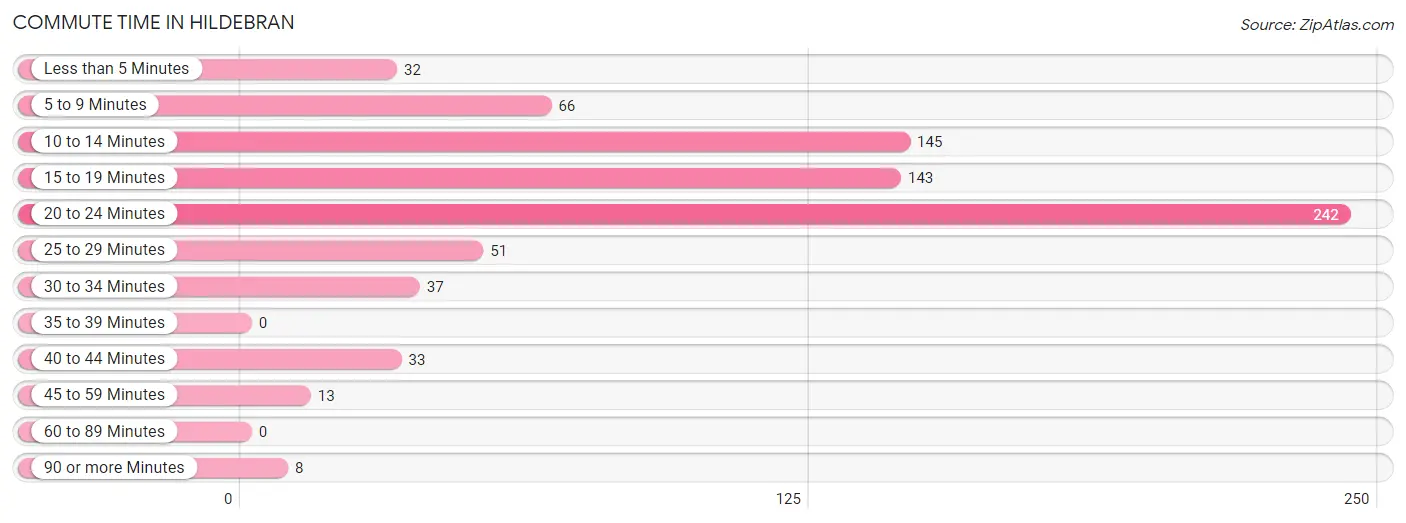
| Commute Time | # Commuters | % Commuters |
| Less than 5 Minutes | 32 | 4.2% |
| 5 to 9 Minutes | 66 | 8.6% |
| 10 to 14 Minutes | 145 | 18.8% |
| 15 to 19 Minutes | 143 | 18.6% |
| 20 to 24 Minutes | 242 | 31.4% |
| 25 to 29 Minutes | 51 | 6.6% |
| 30 to 34 Minutes | 37 | 4.8% |
| 35 to 39 Minutes | 0 | 0.0% |
| 40 to 44 Minutes | 33 | 4.3% |
| 45 to 59 Minutes | 13 | 1.7% |
| 60 to 89 Minutes | 0 | 0.0% |
| 90 or more Minutes | 8 | 1.0% |
Commute Time by Sex in Hildebran
The most common commute times in Hildebran are 20 to 24 minutes (160 commuters, 33.1%) for males and 20 to 24 minutes (82 commuters, 28.6%) for females.
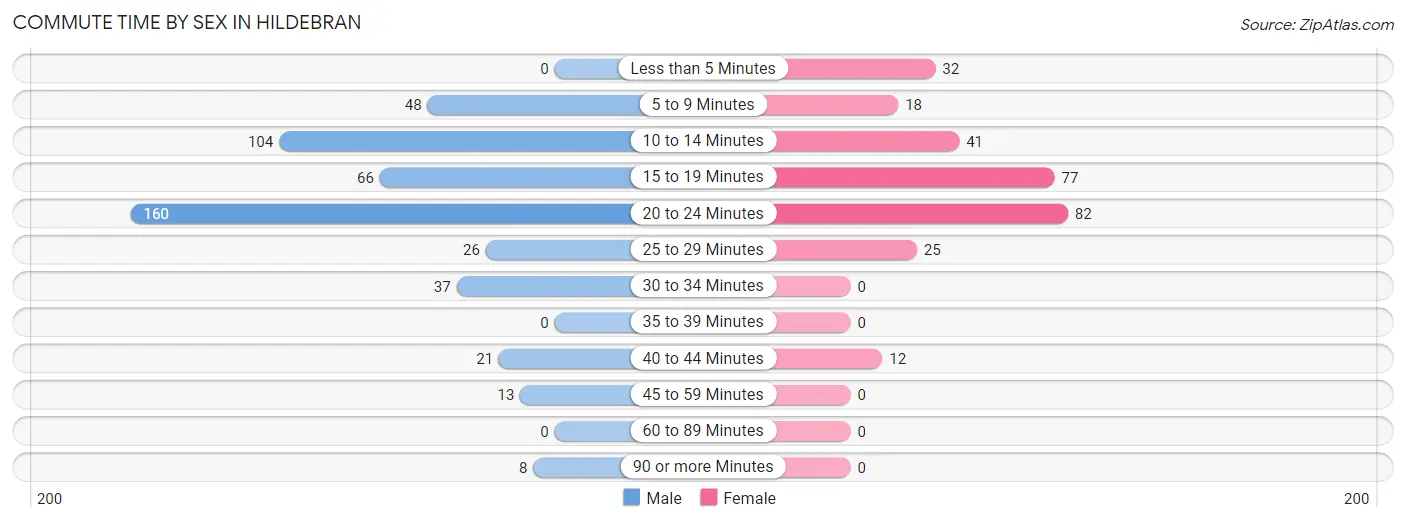
| Commute Time | Male | Female |
| Less than 5 Minutes | 0 (0.0%) | 32 (11.2%) |
| 5 to 9 Minutes | 48 (9.9%) | 18 (6.3%) |
| 10 to 14 Minutes | 104 (21.5%) | 41 (14.3%) |
| 15 to 19 Minutes | 66 (13.7%) | 77 (26.8%) |
| 20 to 24 Minutes | 160 (33.1%) | 82 (28.6%) |
| 25 to 29 Minutes | 26 (5.4%) | 25 (8.7%) |
| 30 to 34 Minutes | 37 (7.7%) | 0 (0.0%) |
| 35 to 39 Minutes | 0 (0.0%) | 0 (0.0%) |
| 40 to 44 Minutes | 21 (4.3%) | 12 (4.2%) |
| 45 to 59 Minutes | 13 (2.7%) | 0 (0.0%) |
| 60 to 89 Minutes | 0 (0.0%) | 0 (0.0%) |
| 90 or more Minutes | 8 (1.7%) | 0 (0.0%) |
Time of Departure to Work by Sex in Hildebran
The most frequent times of departure to work in Hildebran are 7:00 AM to 7:29 AM (139, 28.8%) for males and 7:00 AM to 7:29 AM (93, 32.4%) for females.
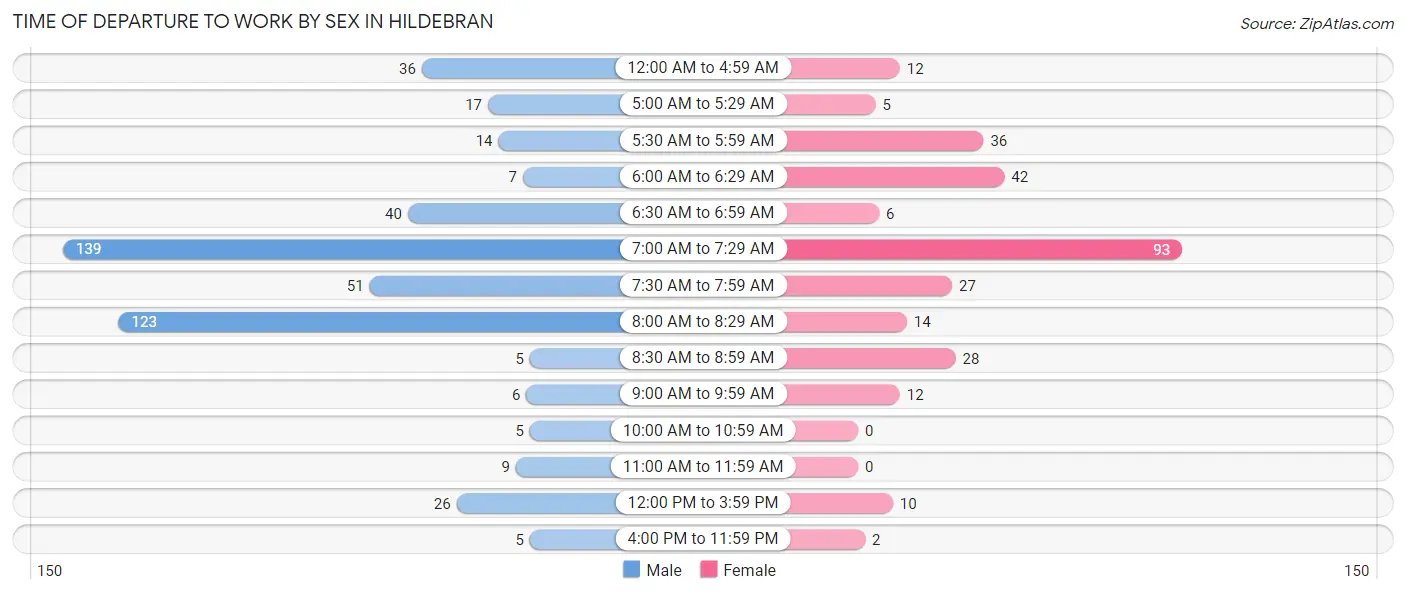
| Time of Departure | Male | Female |
| 12:00 AM to 4:59 AM | 36 (7.4%) | 12 (4.2%) |
| 5:00 AM to 5:29 AM | 17 (3.5%) | 5 (1.7%) |
| 5:30 AM to 5:59 AM | 14 (2.9%) | 36 (12.5%) |
| 6:00 AM to 6:29 AM | 7 (1.5%) | 42 (14.6%) |
| 6:30 AM to 6:59 AM | 40 (8.3%) | 6 (2.1%) |
| 7:00 AM to 7:29 AM | 139 (28.8%) | 93 (32.4%) |
| 7:30 AM to 7:59 AM | 51 (10.6%) | 27 (9.4%) |
| 8:00 AM to 8:29 AM | 123 (25.5%) | 14 (4.9%) |
| 8:30 AM to 8:59 AM | 5 (1.0%) | 28 (9.8%) |
| 9:00 AM to 9:59 AM | 6 (1.2%) | 12 (4.2%) |
| 10:00 AM to 10:59 AM | 5 (1.0%) | 0 (0.0%) |
| 11:00 AM to 11:59 AM | 9 (1.9%) | 0 (0.0%) |
| 12:00 PM to 3:59 PM | 26 (5.4%) | 10 (3.5%) |
| 4:00 PM to 11:59 PM | 5 (1.0%) | 2 (0.7%) |
| Total | 483 (100.0%) | 287 (100.0%) |
Housing Occupancy in Hildebran
Occupancy by Ownership in Hildebran
Of the total 769 dwellings in Hildebran, owner-occupied units account for 532 (69.2%), while renter-occupied units make up 237 (30.8%).
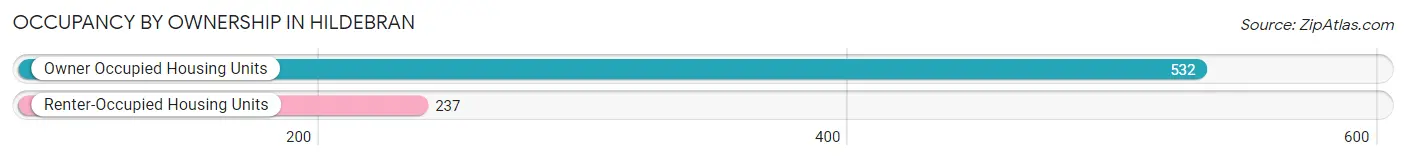
| Occupancy | # Housing Units | % Housing Units |
| Owner Occupied Housing Units | 532 | 69.2% |
| Renter-Occupied Housing Units | 237 | 30.8% |
| Total Occupied Housing Units | 769 | 100.0% |
Occupancy by Household Size in Hildebran
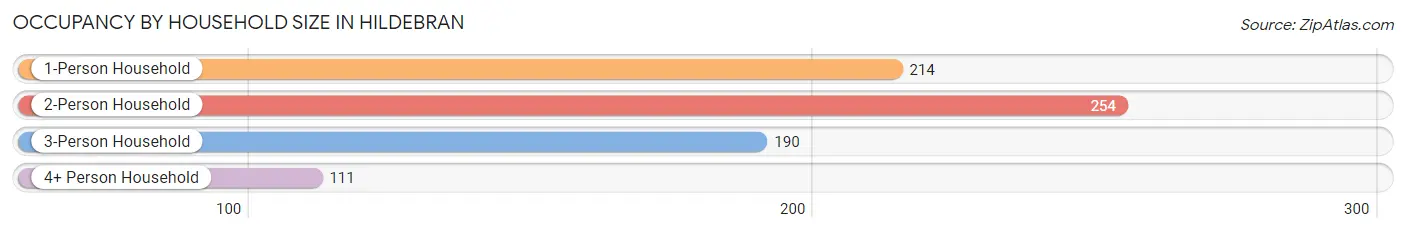
| Household Size | # Housing Units | % Housing Units |
| 1-Person Household | 214 | 27.8% |
| 2-Person Household | 254 | 33.0% |
| 3-Person Household | 190 | 24.7% |
| 4+ Person Household | 111 | 14.4% |
| Total Housing Units | 769 | 100.0% |
Occupancy by Ownership by Household Size in Hildebran
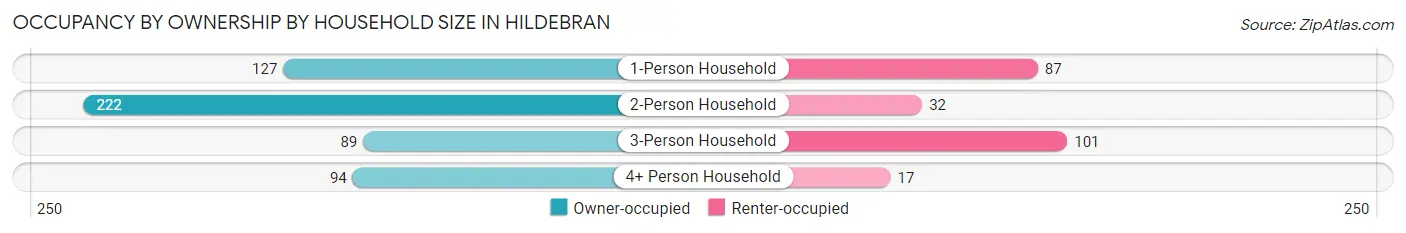
| Household Size | Owner-occupied | Renter-occupied |
| 1-Person Household | 127 (59.4%) | 87 (40.6%) |
| 2-Person Household | 222 (87.4%) | 32 (12.6%) |
| 3-Person Household | 89 (46.8%) | 101 (53.2%) |
| 4+ Person Household | 94 (84.7%) | 17 (15.3%) |
| Total Housing Units | 532 (69.2%) | 237 (30.8%) |
Occupancy by Educational Attainment in Hildebran
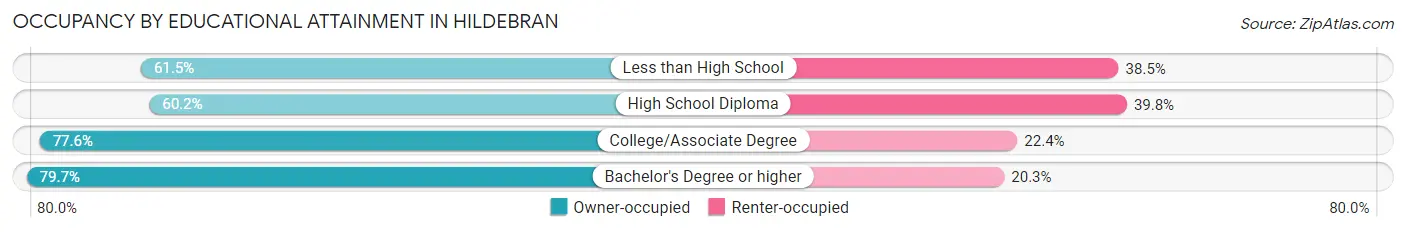
| Household Size | Owner-occupied | Renter-occupied |
| Less than High School | 72 (61.5%) | 45 (38.5%) |
| High School Diploma | 168 (60.2%) | 111 (39.8%) |
| College/Associate Degree | 194 (77.6%) | 56 (22.4%) |
| Bachelor's Degree or higher | 98 (79.7%) | 25 (20.3%) |
Occupancy by Age of Householder in Hildebran
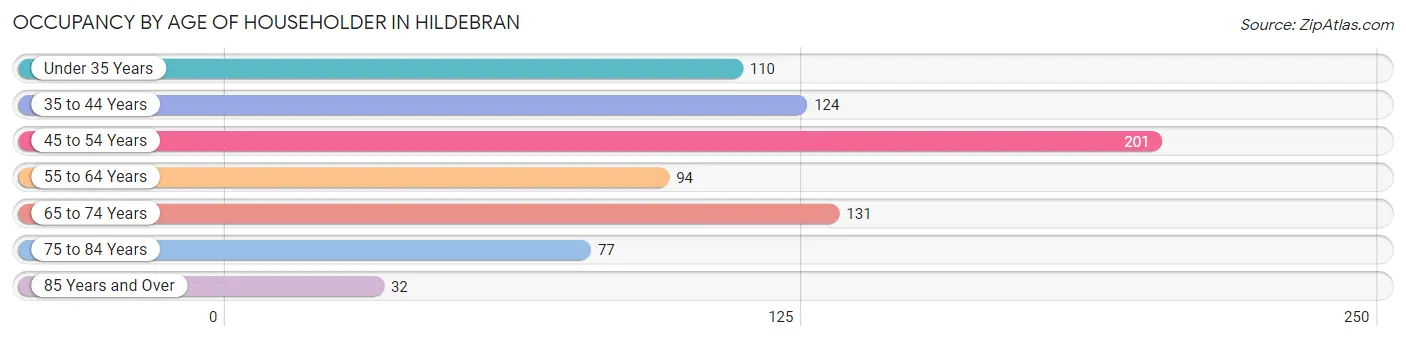
| Age Bracket | # Households | % Households |
| Under 35 Years | 110 | 14.3% |
| 35 to 44 Years | 124 | 16.1% |
| 45 to 54 Years | 201 | 26.1% |
| 55 to 64 Years | 94 | 12.2% |
| 65 to 74 Years | 131 | 17.0% |
| 75 to 84 Years | 77 | 10.0% |
| 85 Years and Over | 32 | 4.2% |
| Total | 769 | 100.0% |
Housing Finances in Hildebran
Median Income by Occupancy in Hildebran
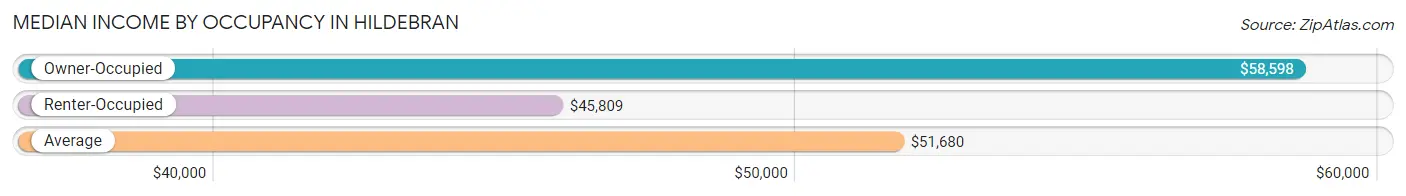
| Occupancy Type | # Households | Median Income |
| Owner-Occupied | 532 (69.2%) | $58,598 |
| Renter-Occupied | 237 (30.8%) | $45,809 |
| Average | 769 (100.0%) | $51,680 |
Occupancy by Householder Income Bracket in Hildebran
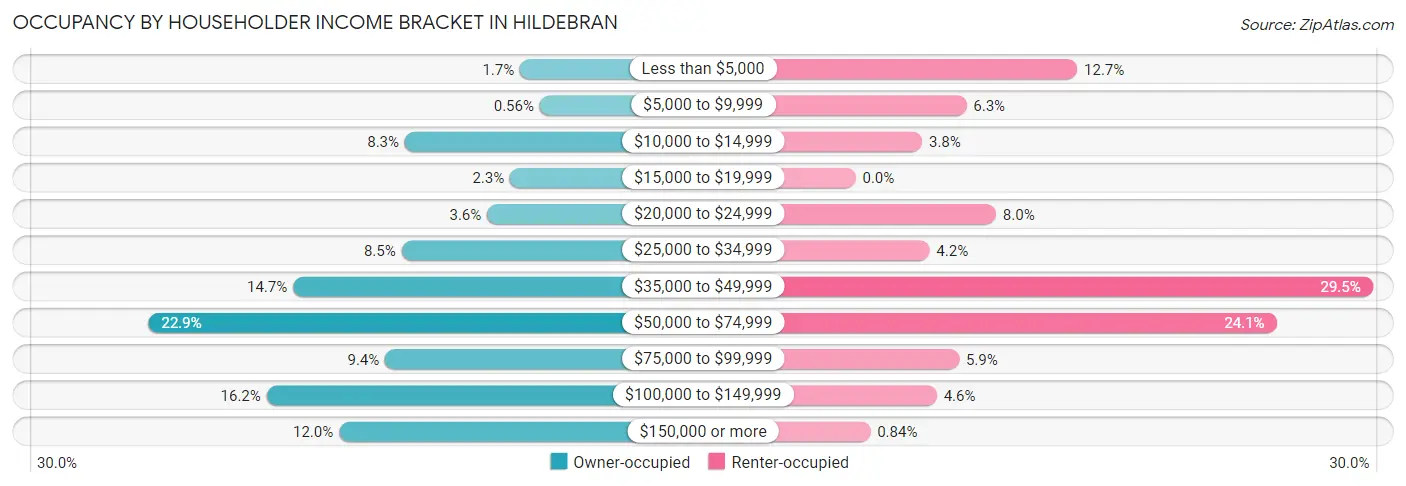
| Income Bracket | Owner-occupied | Renter-occupied |
| Less than $5,000 | 9 (1.7%) | 30 (12.7%) |
| $5,000 to $9,999 | 3 (0.6%) | 15 (6.3%) |
| $10,000 to $14,999 | 44 (8.3%) | 9 (3.8%) |
| $15,000 to $19,999 | 12 (2.3%) | 0 (0.0%) |
| $20,000 to $24,999 | 19 (3.6%) | 19 (8.0%) |
| $25,000 to $34,999 | 45 (8.5%) | 10 (4.2%) |
| $35,000 to $49,999 | 78 (14.7%) | 70 (29.5%) |
| $50,000 to $74,999 | 122 (22.9%) | 57 (24.0%) |
| $75,000 to $99,999 | 50 (9.4%) | 14 (5.9%) |
| $100,000 to $149,999 | 86 (16.2%) | 11 (4.6%) |
| $150,000 or more | 64 (12.0%) | 2 (0.8%) |
| Total | 532 (100.0%) | 237 (100.0%) |
Monthly Housing Cost Tiers in Hildebran
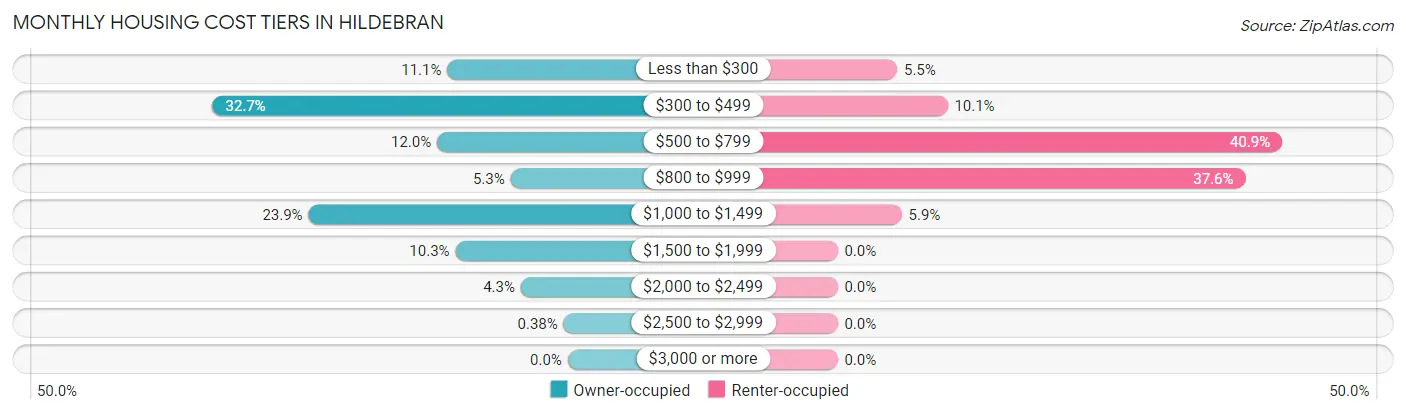
| Monthly Cost | Owner-occupied | Renter-occupied |
| Less than $300 | 59 (11.1%) | 13 (5.5%) |
| $300 to $499 | 174 (32.7%) | 24 (10.1%) |
| $500 to $799 | 64 (12.0%) | 97 (40.9%) |
| $800 to $999 | 28 (5.3%) | 89 (37.6%) |
| $1,000 to $1,499 | 127 (23.9%) | 14 (5.9%) |
| $1,500 to $1,999 | 55 (10.3%) | 0 (0.0%) |
| $2,000 to $2,499 | 23 (4.3%) | 0 (0.0%) |
| $2,500 to $2,999 | 2 (0.4%) | 0 (0.0%) |
| $3,000 or more | 0 (0.0%) | 0 (0.0%) |
| Total | 532 (100.0%) | 237 (100.0%) |
Physical Housing Characteristics in Hildebran
Housing Structures in Hildebran
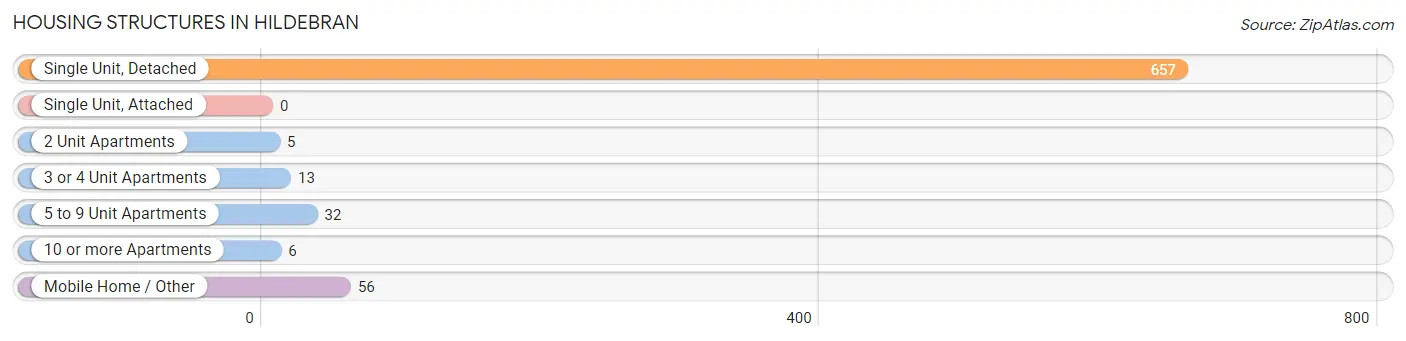
| Structure Type | # Housing Units | % Housing Units |
| Single Unit, Detached | 657 | 85.4% |
| Single Unit, Attached | 0 | 0.0% |
| 2 Unit Apartments | 5 | 0.6% |
| 3 or 4 Unit Apartments | 13 | 1.7% |
| 5 to 9 Unit Apartments | 32 | 4.2% |
| 10 or more Apartments | 6 | 0.8% |
| Mobile Home / Other | 56 | 7.3% |
| Total | 769 | 100.0% |
Housing Structures by Occupancy in Hildebran
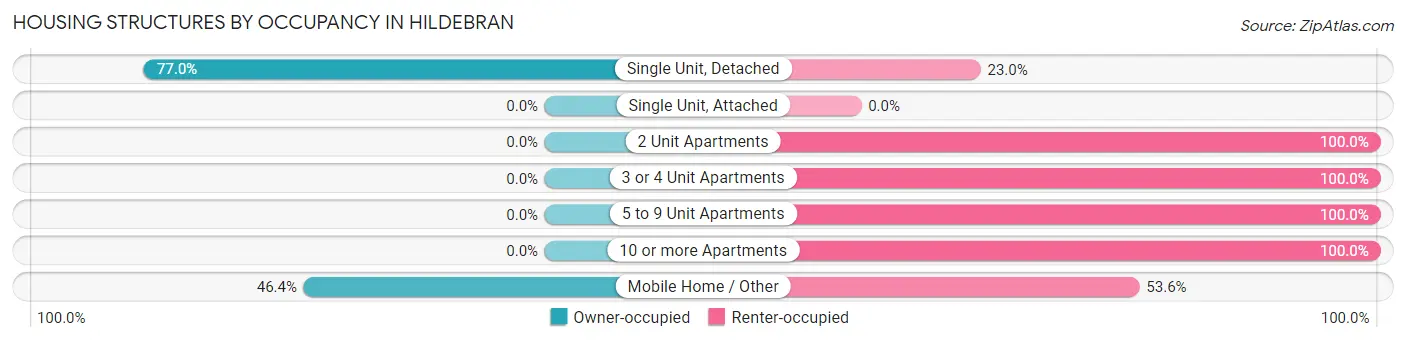
| Structure Type | Owner-occupied | Renter-occupied |
| Single Unit, Detached | 506 (77.0%) | 151 (23.0%) |
| Single Unit, Attached | 0 (0.0%) | 0 (0.0%) |
| 2 Unit Apartments | 0 (0.0%) | 5 (100.0%) |
| 3 or 4 Unit Apartments | 0 (0.0%) | 13 (100.0%) |
| 5 to 9 Unit Apartments | 0 (0.0%) | 32 (100.0%) |
| 10 or more Apartments | 0 (0.0%) | 6 (100.0%) |
| Mobile Home / Other | 26 (46.4%) | 30 (53.6%) |
| Total | 532 (69.2%) | 237 (30.8%) |
Housing Structures by Number of Rooms in Hildebran
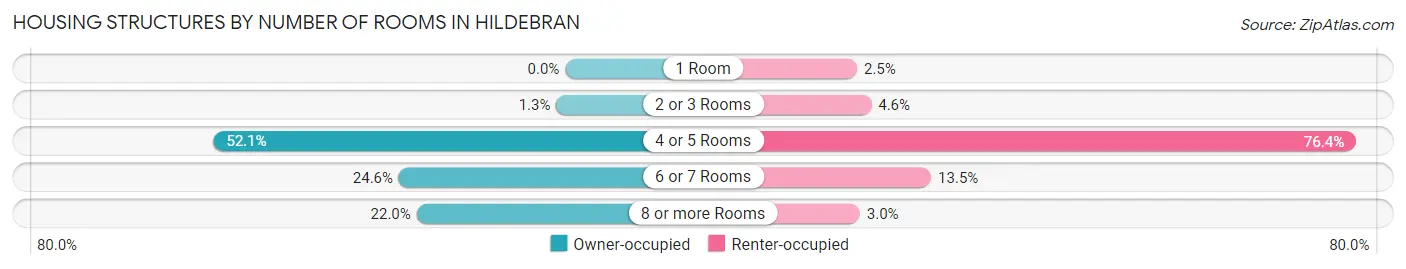
| Number of Rooms | Owner-occupied | Renter-occupied |
| 1 Room | 0 (0.0%) | 6 (2.5%) |
| 2 or 3 Rooms | 7 (1.3%) | 11 (4.6%) |
| 4 or 5 Rooms | 277 (52.1%) | 181 (76.4%) |
| 6 or 7 Rooms | 131 (24.6%) | 32 (13.5%) |
| 8 or more Rooms | 117 (22.0%) | 7 (2.9%) |
| Total | 532 (100.0%) | 237 (100.0%) |
Housing Structure by Heating Type in Hildebran
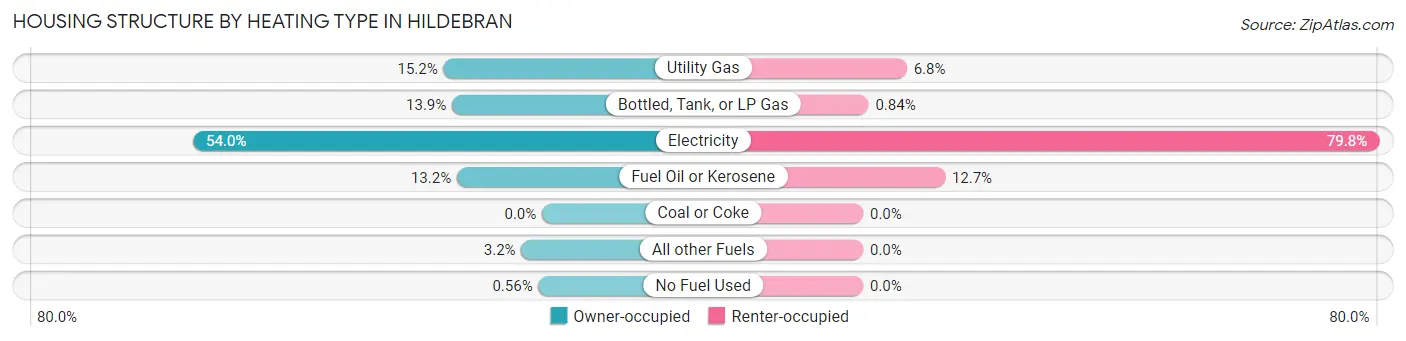
| Heating Type | Owner-occupied | Renter-occupied |
| Utility Gas | 81 (15.2%) | 16 (6.8%) |
| Bottled, Tank, or LP Gas | 74 (13.9%) | 2 (0.8%) |
| Electricity | 287 (53.9%) | 189 (79.7%) |
| Fuel Oil or Kerosene | 70 (13.2%) | 30 (12.7%) |
| Coal or Coke | 0 (0.0%) | 0 (0.0%) |
| All other Fuels | 17 (3.2%) | 0 (0.0%) |
| No Fuel Used | 3 (0.6%) | 0 (0.0%) |
| Total | 532 (100.0%) | 237 (100.0%) |
Household Vehicle Usage in Hildebran
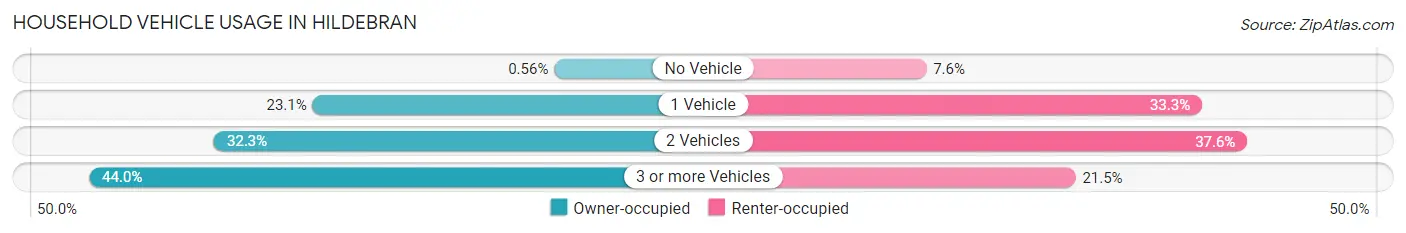
| Vehicles per Household | Owner-occupied | Renter-occupied |
| No Vehicle | 3 (0.6%) | 18 (7.6%) |
| 1 Vehicle | 123 (23.1%) | 79 (33.3%) |
| 2 Vehicles | 172 (32.3%) | 89 (37.6%) |
| 3 or more Vehicles | 234 (44.0%) | 51 (21.5%) |
| Total | 532 (100.0%) | 237 (100.0%) |
Real Estate & Mortgages in Hildebran
Real Estate and Mortgage Overview in Hildebran
| Characteristic | Without Mortgage | With Mortgage |
| Housing Units | 261 | 271 |
| Median Property Value | $149,000 | $192,200 |
| Median Household Income | $44,132 | $41 |
| Monthly Housing Costs | $358 | $0 |
| Real Estate Taxes | $1,303 | $0 |
Property Value by Mortgage Status in Hildebran
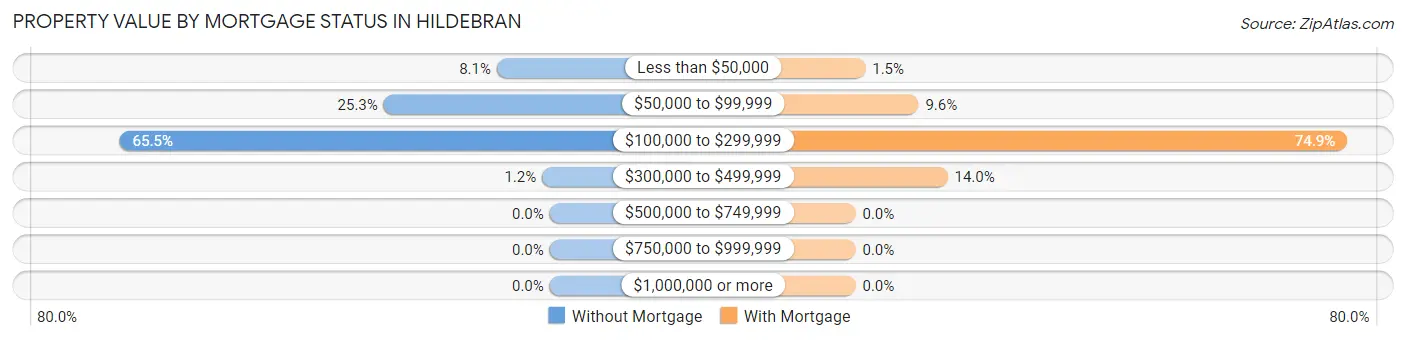
| Property Value | Without Mortgage | With Mortgage |
| Less than $50,000 | 21 (8.1%) | 4 (1.5%) |
| $50,000 to $99,999 | 66 (25.3%) | 26 (9.6%) |
| $100,000 to $299,999 | 171 (65.5%) | 203 (74.9%) |
| $300,000 to $499,999 | 3 (1.1%) | 38 (14.0%) |
| $500,000 to $749,999 | 0 (0.0%) | 0 (0.0%) |
| $750,000 to $999,999 | 0 (0.0%) | 0 (0.0%) |
| $1,000,000 or more | 0 (0.0%) | 0 (0.0%) |
| Total | 261 (100.0%) | 271 (100.0%) |
Household Income by Mortgage Status in Hildebran
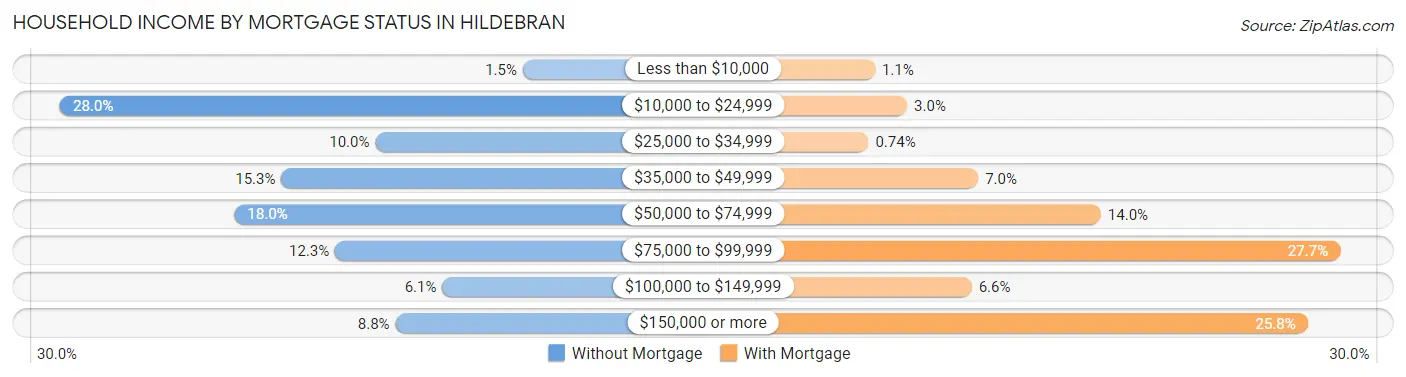
| Household Income | Without Mortgage | With Mortgage |
| Less than $10,000 | 4 (1.5%) | 3 (1.1%) |
| $10,000 to $24,999 | 73 (28.0%) | 8 (2.9%) |
| $25,000 to $34,999 | 26 (10.0%) | 2 (0.7%) |
| $35,000 to $49,999 | 40 (15.3%) | 19 (7.0%) |
| $50,000 to $74,999 | 47 (18.0%) | 38 (14.0%) |
| $75,000 to $99,999 | 32 (12.3%) | 75 (27.7%) |
| $100,000 to $149,999 | 16 (6.1%) | 18 (6.6%) |
| $150,000 or more | 23 (8.8%) | 70 (25.8%) |
| Total | 261 (100.0%) | 271 (100.0%) |
Property Value to Household Income Ratio in Hildebran
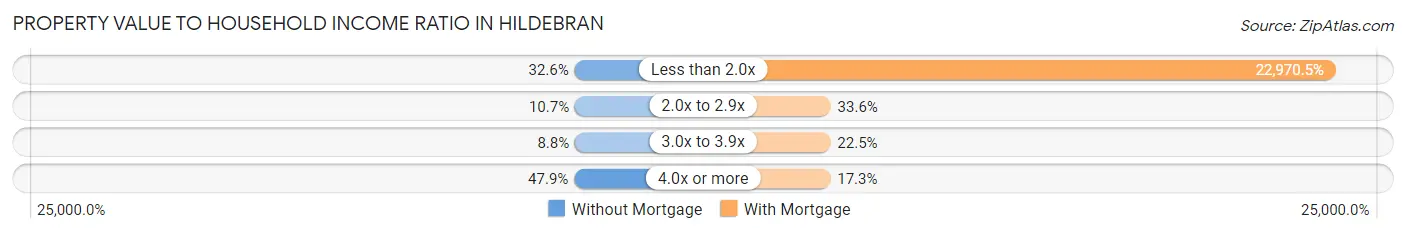
| Value-to-Income Ratio | Without Mortgage | With Mortgage |
| Less than 2.0x | 85 (32.6%) | 62,250 (22,970.5%) |
| 2.0x to 2.9x | 28 (10.7%) | 91 (33.6%) |
| 3.0x to 3.9x | 23 (8.8%) | 61 (22.5%) |
| 4.0x or more | 125 (47.9%) | 47 (17.3%) |
| Total | 261 (100.0%) | 271 (100.0%) |
Real Estate Taxes by Mortgage Status in Hildebran
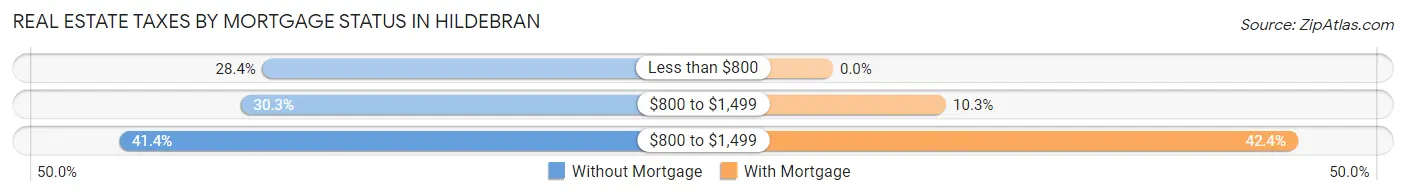
| Property Taxes | Without Mortgage | With Mortgage |
| Less than $800 | 74 (28.3%) | 0 (0.0%) |
| $800 to $1,499 | 79 (30.3%) | 28 (10.3%) |
| $800 to $1,499 | 108 (41.4%) | 115 (42.4%) |
| Total | 261 (100.0%) | 271 (100.0%) |
Health & Disability in Hildebran
Health Insurance Coverage by Age in Hildebran
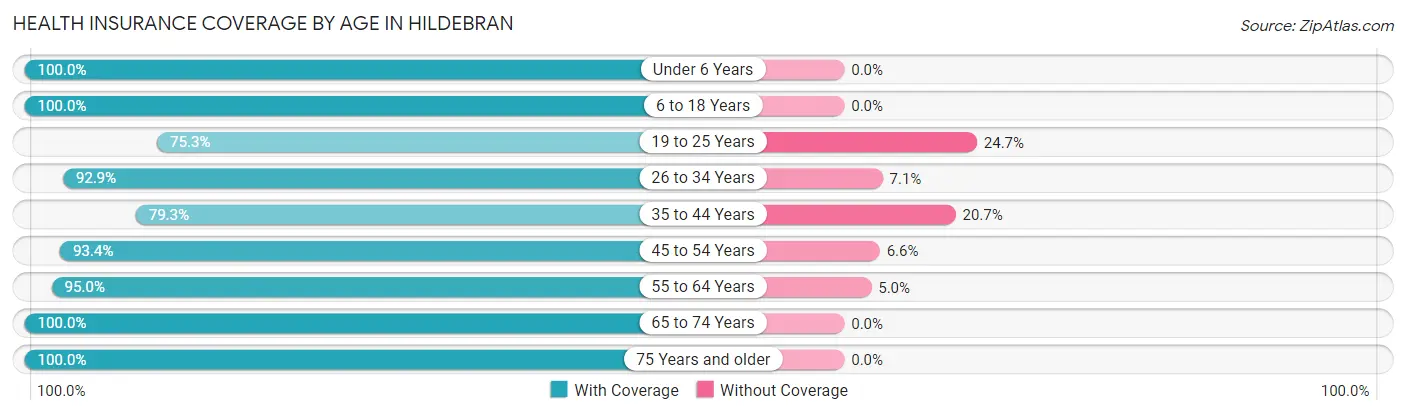
| Age Bracket | With Coverage | Without Coverage |
| Under 6 Years | 82 (100.0%) | 0 (0.0%) |
| 6 to 18 Years | 320 (100.0%) | 0 (0.0%) |
| 19 to 25 Years | 67 (75.3%) | 22 (24.7%) |
| 26 to 34 Years | 182 (92.9%) | 14 (7.1%) |
| 35 to 44 Years | 237 (79.3%) | 62 (20.7%) |
| 45 to 54 Years | 269 (93.4%) | 19 (6.6%) |
| 55 to 64 Years | 189 (95.0%) | 10 (5.0%) |
| 65 to 74 Years | 198 (100.0%) | 0 (0.0%) |
| 75 Years and older | 161 (100.0%) | 0 (0.0%) |
| Total | 1,705 (93.1%) | 127 (6.9%) |
Health Insurance Coverage by Citizenship Status in Hildebran
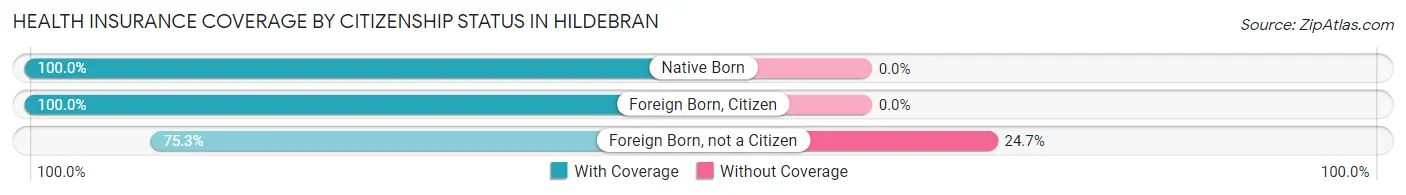
| Citizenship Status | With Coverage | Without Coverage |
| Native Born | 82 (100.0%) | 0 (0.0%) |
| Foreign Born, Citizen | 320 (100.0%) | 0 (0.0%) |
| Foreign Born, not a Citizen | 67 (75.3%) | 22 (24.7%) |
Health Insurance Coverage by Household Income in Hildebran
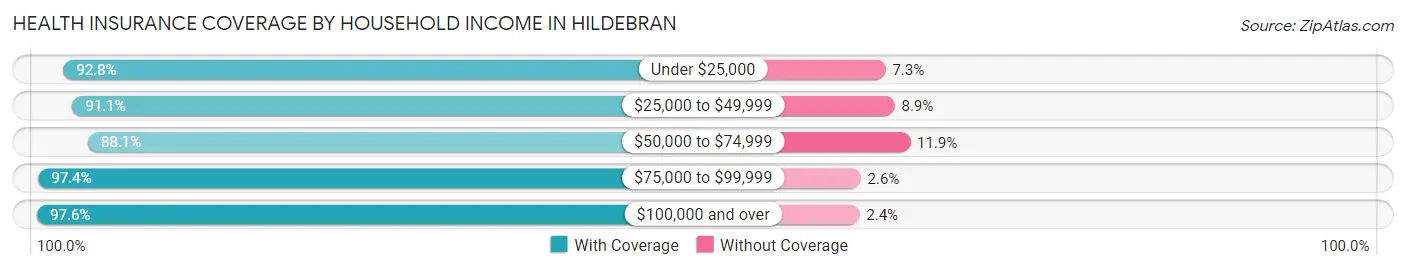
| Household Income | With Coverage | Without Coverage |
| Under $25,000 | 192 (92.7%) | 15 (7.2%) |
| $25,000 to $49,999 | 448 (91.1%) | 44 (8.9%) |
| $50,000 to $74,999 | 379 (88.1%) | 51 (11.9%) |
| $75,000 to $99,999 | 189 (97.4%) | 5 (2.6%) |
| $100,000 and over | 497 (97.6%) | 12 (2.4%) |
Public vs Private Health Insurance Coverage by Age in Hildebran
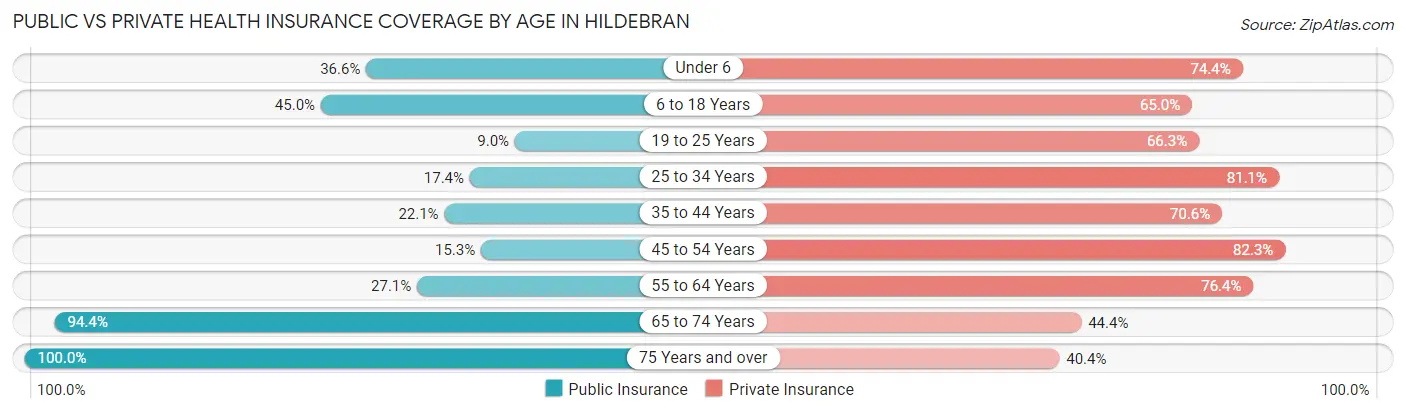
| Age Bracket | Public Insurance | Private Insurance |
| Under 6 | 30 (36.6%) | 61 (74.4%) |
| 6 to 18 Years | 144 (45.0%) | 208 (65.0%) |
| 19 to 25 Years | 8 (9.0%) | 59 (66.3%) |
| 25 to 34 Years | 34 (17.3%) | 159 (81.1%) |
| 35 to 44 Years | 66 (22.1%) | 211 (70.6%) |
| 45 to 54 Years | 44 (15.3%) | 237 (82.3%) |
| 55 to 64 Years | 54 (27.1%) | 152 (76.4%) |
| 65 to 74 Years | 187 (94.4%) | 88 (44.4%) |
| 75 Years and over | 161 (100.0%) | 65 (40.4%) |
| Total | 728 (39.7%) | 1,240 (67.7%) |
Disability Status by Sex by Age in Hildebran
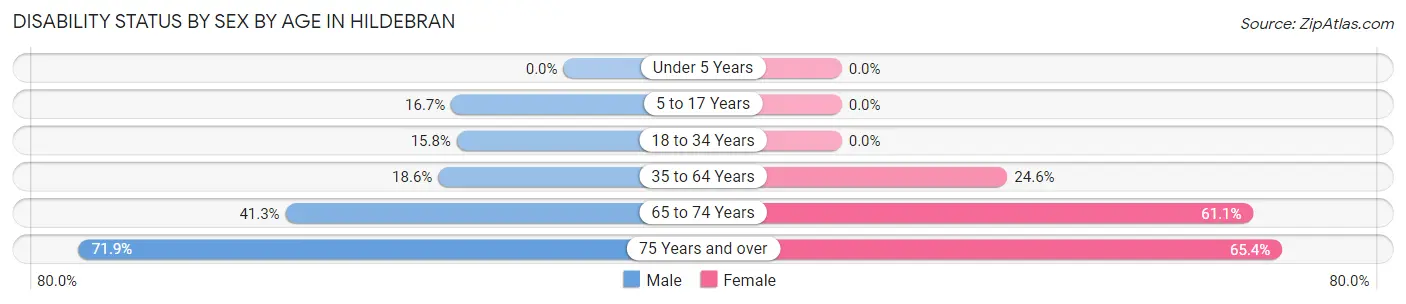
| Age Bracket | Male | Female |
| Under 5 Years | 0 (0.0%) | 0 (0.0%) |
| 5 to 17 Years | 26 (16.7%) | 0 (0.0%) |
| 18 to 34 Years | 32 (15.8%) | 0 (0.0%) |
| 35 to 64 Years | 66 (18.6%) | 106 (24.6%) |
| 65 to 74 Years | 52 (41.3%) | 44 (61.1%) |
| 75 Years and over | 41 (71.9%) | 68 (65.4%) |
Disability Class by Sex by Age in Hildebran
Disability Class: Hearing Difficulty
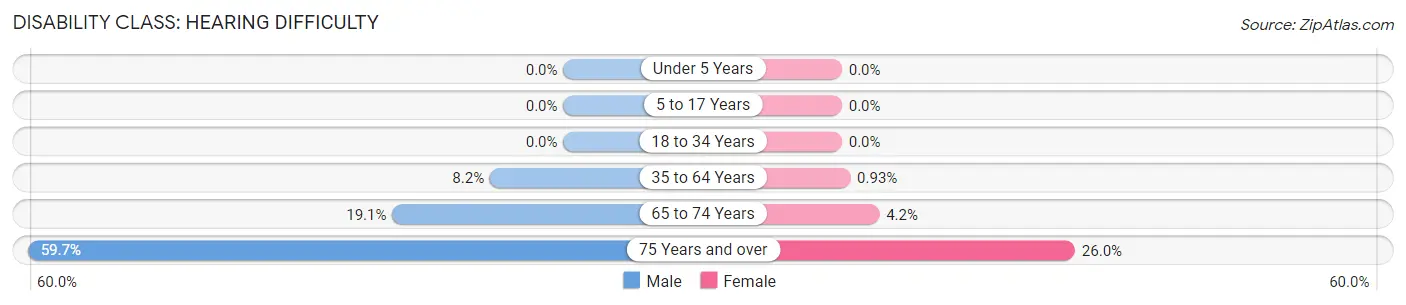
| Age Bracket | Male | Female |
| Under 5 Years | 0 (0.0%) | 0 (0.0%) |
| 5 to 17 Years | 0 (0.0%) | 0 (0.0%) |
| 18 to 34 Years | 0 (0.0%) | 0 (0.0%) |
| 35 to 64 Years | 29 (8.2%) | 4 (0.9%) |
| 65 to 74 Years | 24 (19.1%) | 3 (4.2%) |
| 75 Years and over | 34 (59.7%) | 27 (26.0%) |
Disability Class: Vision Difficulty
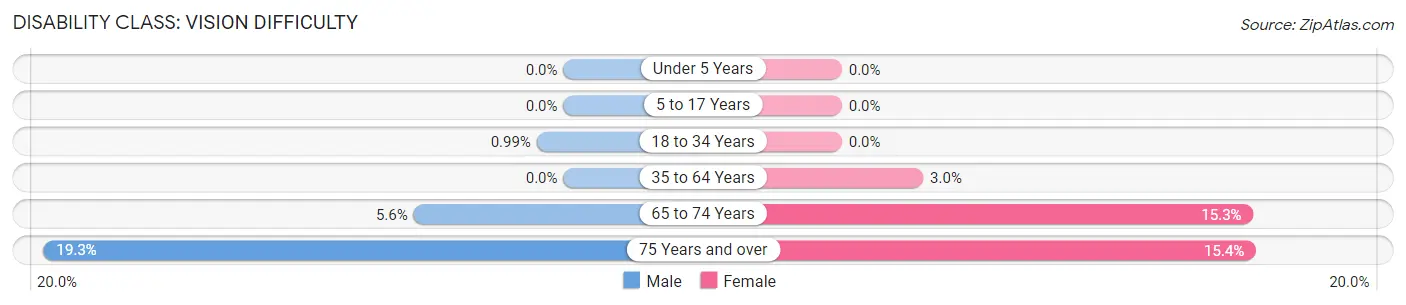
| Age Bracket | Male | Female |
| Under 5 Years | 0 (0.0%) | 0 (0.0%) |
| 5 to 17 Years | 0 (0.0%) | 0 (0.0%) |
| 18 to 34 Years | 2 (1.0%) | 0 (0.0%) |
| 35 to 64 Years | 0 (0.0%) | 13 (3.0%) |
| 65 to 74 Years | 7 (5.6%) | 11 (15.3%) |
| 75 Years and over | 11 (19.3%) | 16 (15.4%) |
Disability Class: Cognitive Difficulty
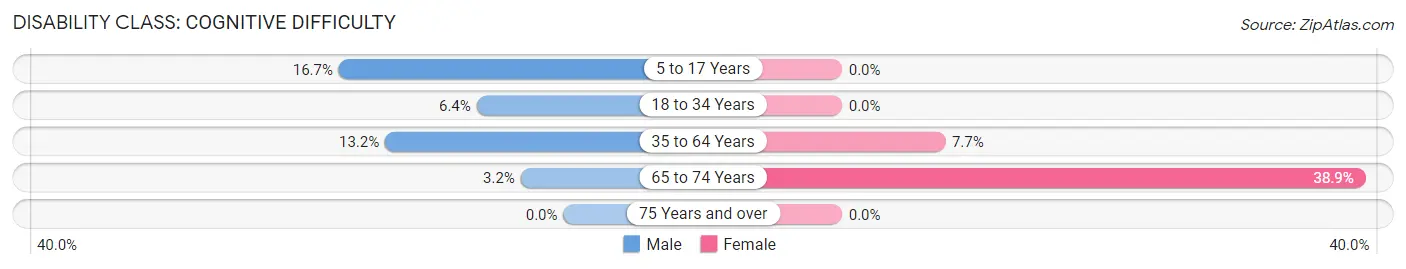
| Age Bracket | Male | Female |
| 5 to 17 Years | 26 (16.7%) | 0 (0.0%) |
| 18 to 34 Years | 13 (6.4%) | 0 (0.0%) |
| 35 to 64 Years | 47 (13.2%) | 33 (7.7%) |
| 65 to 74 Years | 4 (3.2%) | 28 (38.9%) |
| 75 Years and over | 0 (0.0%) | 0 (0.0%) |
Disability Class: Ambulatory Difficulty
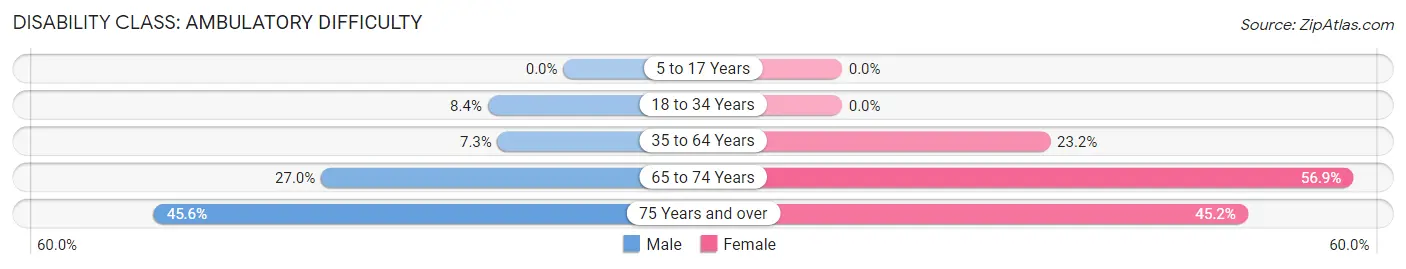
| Age Bracket | Male | Female |
| 5 to 17 Years | 0 (0.0%) | 0 (0.0%) |
| 18 to 34 Years | 17 (8.4%) | 0 (0.0%) |
| 35 to 64 Years | 26 (7.3%) | 100 (23.2%) |
| 65 to 74 Years | 34 (27.0%) | 41 (56.9%) |
| 75 Years and over | 26 (45.6%) | 47 (45.2%) |
Disability Class: Self-Care Difficulty
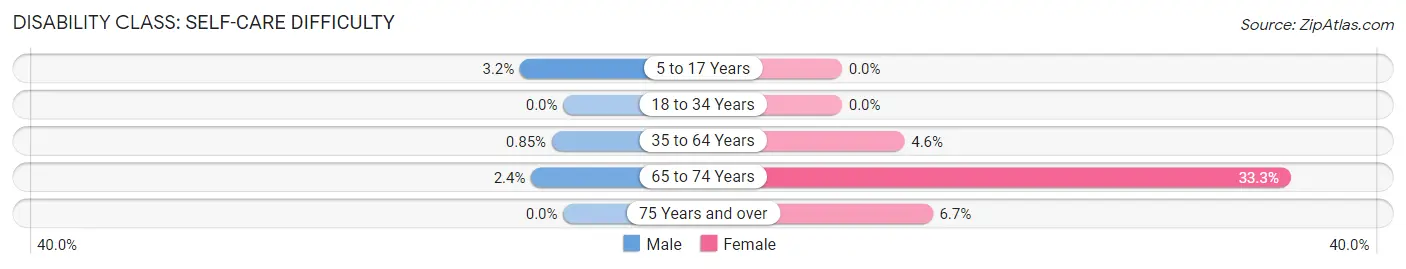
| Age Bracket | Male | Female |
| 5 to 17 Years | 5 (3.2%) | 0 (0.0%) |
| 18 to 34 Years | 0 (0.0%) | 0 (0.0%) |
| 35 to 64 Years | 3 (0.9%) | 20 (4.6%) |
| 65 to 74 Years | 3 (2.4%) | 24 (33.3%) |
| 75 Years and over | 0 (0.0%) | 7 (6.7%) |
Technology Access in Hildebran
Computing Device Access in Hildebran
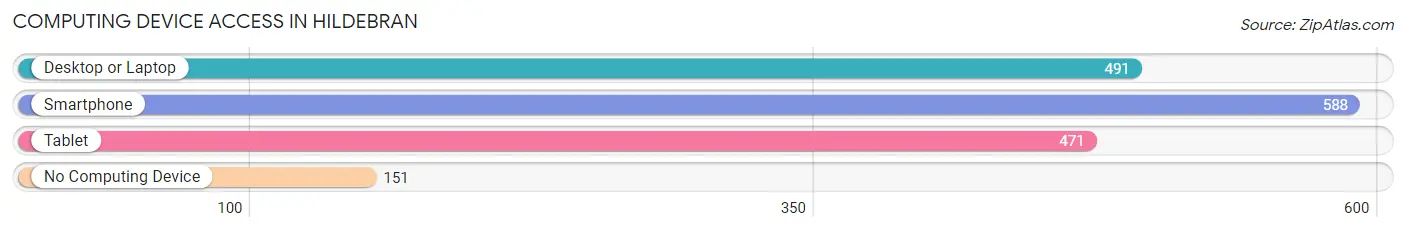
| Device Type | # Households | % Households |
| Desktop or Laptop | 491 | 63.8% |
| Smartphone | 588 | 76.5% |
| Tablet | 471 | 61.3% |
| No Computing Device | 151 | 19.6% |
| Total | 769 | 100.0% |
Internet Access in Hildebran
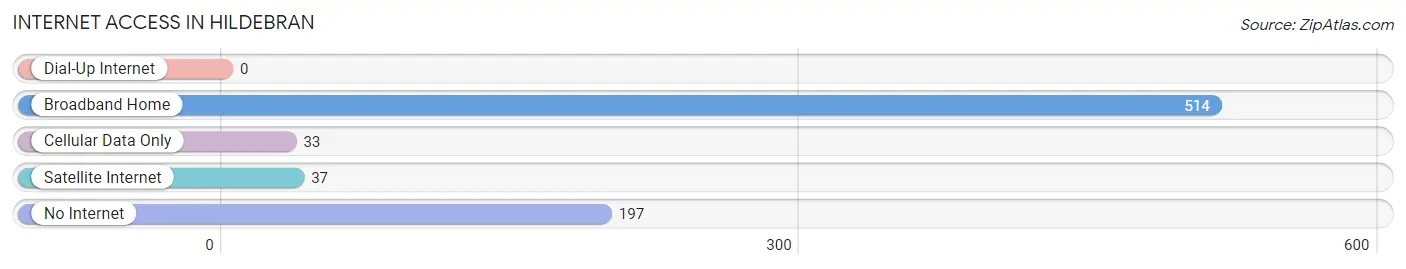
| Internet Type | # Households | % Households |
| Dial-Up Internet | 0 | 0.0% |
| Broadband Home | 514 | 66.8% |
| Cellular Data Only | 33 | 4.3% |
| Satellite Internet | 37 | 4.8% |
| No Internet | 197 | 25.6% |
| Total | 769 | 100.0% |
Hildebran Summary
Hildebran is a small town located in Burke County, North Carolina. It is situated in the foothills of the Blue Ridge Mountains, about 25 miles east of Asheville. The town was founded in 1887 and named after the Hildebrand family, who were early settlers in the area. The population of Hildebran was 2,845 as of the 2010 census.
Geography
Hildebran is located at 35°45'25"N 81°30'45"W. It is situated in the foothills of the Blue Ridge Mountains, about 25 miles east of Asheville. The town is located in the Catawba River Valley, which is part of the larger Piedmont region of North Carolina. The town is situated at an elevation of 1,068 feet above sea level.
The town is located in Burke County, which is part of the Hickory-Lenoir-Morganton Metropolitan Statistical Area. The town is bordered by the towns of Connelly Springs to the north, Rhodhiss to the east, and Drexel to the south.
Climate
Hildebran has a humid subtropical climate, with hot, humid summers and mild winters. The average annual temperature is 61°F, with an average high of 79°F in July and an average low of 43°F in January. The average annual precipitation is 44.5 inches, with an average of 4.5 inches of snowfall per year.
Demographics
As of the 2010 census, the population of Hildebran was 2,845. The racial makeup of the town was 92.3% White, 4.3% African American, 0.7% Native American, 0.3% Asian, 0.1% Pacific Islander, 1.2% from other races, and 1.2% from two or more races. Hispanic or Latino of any race were 3.2% of the population.
Economy
Hildebran is a small town with a largely agricultural economy. The town is home to several small businesses, including a grocery store, a hardware store, and a few restaurants. The town is also home to several manufacturing companies, including a furniture manufacturer, a textile manufacturer, and a plastics manufacturer.
The town is also home to several educational institutions, including a community college, a technical college, and a vocational school. The town is also home to a hospital and several medical clinics.
The town is served by the Burke County Public Schools system, which includes four elementary schools, two middle schools, and one high school.
Conclusion
Hildebran is a small town located in Burke County, North Carolina. It is situated in the foothills of the Blue Ridge Mountains, about 25 miles east of Asheville. The town was founded in 1887 and named after the Hildebrand family, who were early settlers in the area. The population of Hildebran was 2,845 as of the 2010 census. The town has a humid subtropical climate, with hot, humid summers and mild winters. The town has a largely agricultural economy, with several small businesses, manufacturing companies, educational institutions, and medical facilities.
Common Questions
What is Per Capita Income in Hildebran?
Per Capita income in Hildebran is $29,969.
What is the Median Family Income in Hildebran?
Median Family Income in Hildebran is $58,018.
What is the Median Household income in Hildebran?
Median Household Income in Hildebran is $51,680.
What is Income or Wage Gap in Hildebran?
Income or Wage Gap in Hildebran is 19.6%.
Women in Hildebran earn 80.4 cents for every dollar earned by a man.
What is Inequality or Gini Index in Hildebran?
Inequality or Gini Index in Hildebran is 0.46.
What is the Total Population of Hildebran?
Total Population of Hildebran is 1,843.
What is the Total Male Population of Hildebran?
Total Male Population of Hildebran is 966.
What is the Total Female Population of Hildebran?
Total Female Population of Hildebran is 877.
What is the Ratio of Males per 100 Females in Hildebran?
There are 110.15 Males per 100 Females in Hildebran.
What is the Ratio of Females per 100 Males in Hildebran?
There are 90.79 Females per 100 Males in Hildebran.
What is the Median Population Age in Hildebran?
Median Population Age in Hildebran is 42.7 Years.
What is the Average Family Size in Hildebran
Average Family Size in Hildebran is 2.9 People.
What is the Average Household Size in Hildebran
Average Household Size in Hildebran is 2.4 People.
How Large is the Labor Force in Hildebran?
There are 964 People in the Labor Forcein in Hildebran.
What is the Percentage of People in the Labor Force in Hildebran?
62.5% of People are in the Labor Force in Hildebran.
What is the Unemployment Rate in Hildebran?
Unemployment Rate in Hildebran is 5.0%.