Midway, MN Map & Demographics
Midway Map
Midway Overview
$11,694
PER CAPITA INCOME
$31,250
AVG FAMILY INCOME
$33,750
AVG HOUSEHOLD INCOME
0.26
INEQUALITY / GINI INDEX
32
TOTAL POPULATION
24
MALE POPULATION
8
FEMALE POPULATION
300.00
MALES / 100 FEMALES
33.33
FEMALES / 100 MALES
13.7
MEDIAN AGE
4.1
AVG FAMILY SIZE
4.0
AVG HOUSEHOLD SIZE
9
LABOR FORCE [ PEOPLE ]
60.0%
PERCENT IN LABOR FORCE
22.2%
UNEMPLOYMENT RATE
Income in Midway
Income Overview in Midway
Per Capita Income in Midway is $11,694, while median incomes of families and households are $31,250 and $33,750 respectively.
| Characteristic | Number | Measure |
| Per Capita Income | 32 | $11,694 |
| Median Family Income | 7 | $31,250 |
| Mean Family Income | 7 | $27,986 |
| Median Household Income | 8 | $33,750 |
| Mean Household Income | 8 | $45,288 |
| Income Deficit | 7 | $0 |
| Wage / Income Gap (%) | 32 | 0.00% |
| Wage / Income Gap ($) | 32 | 100.00¢ per $1 |
| Gini / Inequality Index | 32 | 0.26 |
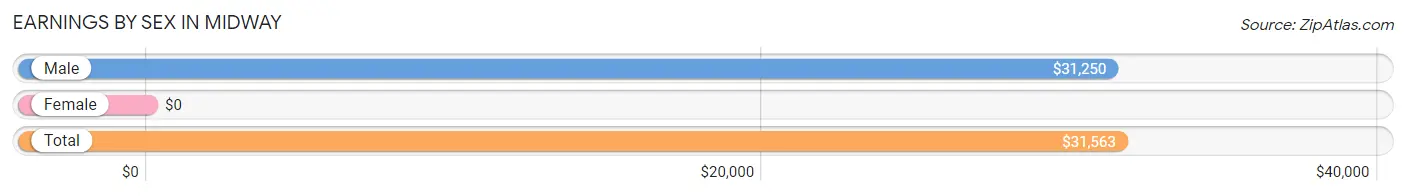
Earnings by Sex in Midway
| Sex | Number | Average Earnings |
| Male | 7 (77.8%) | $31,250 |
| Female | 2 (22.2%) | $0 |
| Total | 9 (100.0%) | $31,563 |
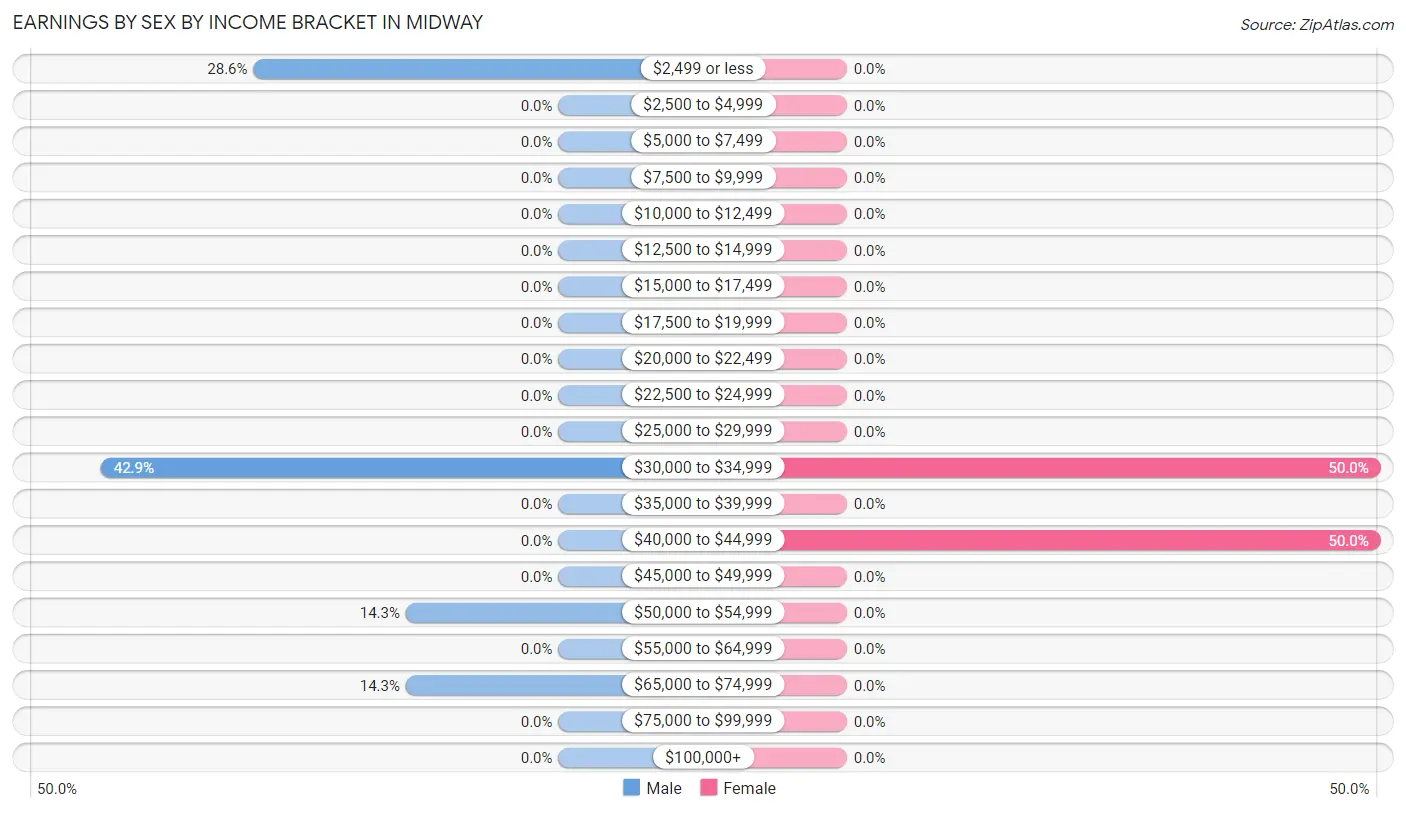
Earnings by Sex by Income Bracket in Midway
The most common earnings brackets in Midway are $30,000 to $34,999 for men (3 | 42.9%) and $30,000 to $34,999 for women (1 | 50.0%).
| Income | Male | Female |
| $2,499 or less | 2 (28.6%) | 0 (0.0%) |
| $2,500 to $4,999 | 0 (0.0%) | 0 (0.0%) |
| $5,000 to $7,499 | 0 (0.0%) | 0 (0.0%) |
| $7,500 to $9,999 | 0 (0.0%) | 0 (0.0%) |
| $10,000 to $12,499 | 0 (0.0%) | 0 (0.0%) |
| $12,500 to $14,999 | 0 (0.0%) | 0 (0.0%) |
| $15,000 to $17,499 | 0 (0.0%) | 0 (0.0%) |
| $17,500 to $19,999 | 0 (0.0%) | 0 (0.0%) |
| $20,000 to $22,499 | 0 (0.0%) | 0 (0.0%) |
| $22,500 to $24,999 | 0 (0.0%) | 0 (0.0%) |
| $25,000 to $29,999 | 0 (0.0%) | 0 (0.0%) |
| $30,000 to $34,999 | 3 (42.9%) | 1 (50.0%) |
| $35,000 to $39,999 | 0 (0.0%) | 0 (0.0%) |
| $40,000 to $44,999 | 0 (0.0%) | 1 (50.0%) |
| $45,000 to $49,999 | 0 (0.0%) | 0 (0.0%) |
| $50,000 to $54,999 | 1 (14.3%) | 0 (0.0%) |
| $55,000 to $64,999 | 0 (0.0%) | 0 (0.0%) |
| $65,000 to $74,999 | 1 (14.3%) | 0 (0.0%) |
| $75,000 to $99,999 | 0 (0.0%) | 0 (0.0%) |
| $100,000+ | 0 (0.0%) | 0 (0.0%) |
| Total | 7 (100.0%) | 2 (100.0%) |
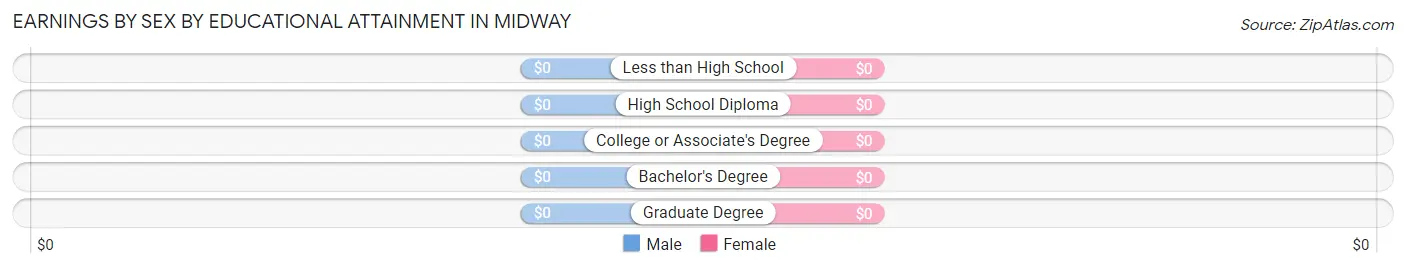
Earnings by Sex by Educational Attainment in Midway
| Educational Attainment | Male Income | Female Income |
| Less than High School | - | - |
| High School Diploma | - | - |
| College or Associate's Degree | - | - |
| Bachelor's Degree | - | - |
| Graduate Degree | - | - |
| Total | $32,083 | $0 |
Family Income in Midway
Family Income Brackets in Midway
According to the Midway family income data, there are 3 families falling into the $25,000 to $34,999 income range, which is the most common income bracket and makes up 42.9% of all families.
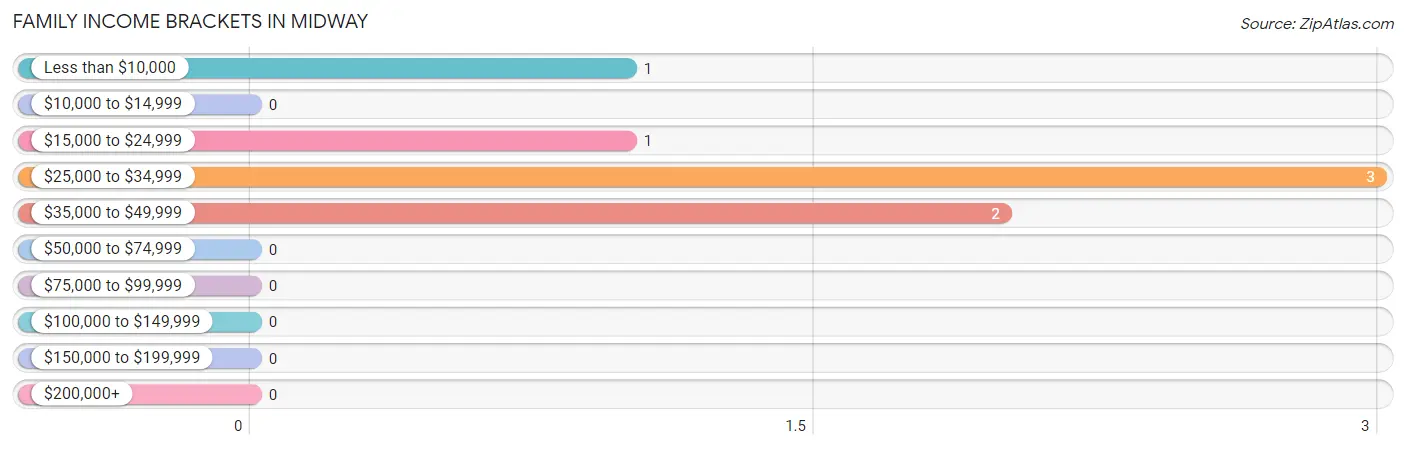
| Income Bracket | # Families | % Families |
| Less than $10,000 | 1 | 14.3% |
| $10,000 to $14,999 | 0 | 0.0% |
| $15,000 to $24,999 | 1 | 14.3% |
| $25,000 to $34,999 | 3 | 42.9% |
| $35,000 to $49,999 | 2 | 28.6% |
| $50,000 to $74,999 | 0 | 0.0% |
| $75,000 to $99,999 | 0 | 0.0% |
| $100,000 to $149,999 | 0 | 0.0% |
| $150,000 to $199,999 | 0 | 0.0% |
| $200,000+ | 0 | 0.0% |
Family Income by Famaliy Size in Midway
3-person families (6 | 85.7%) account for the highest median family income in Midway with $31,667 per family, while 3-person families (6 | 85.7%) have the highest median income of $10,556 per family member.
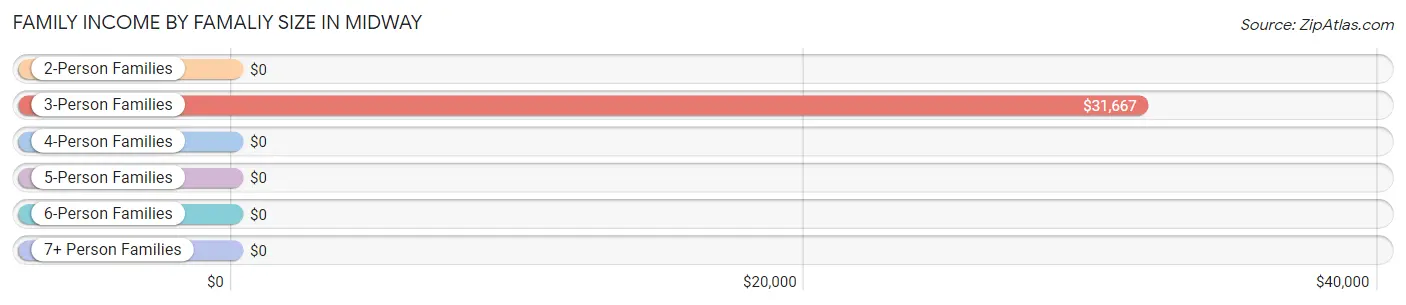
| Income Bracket | # Families | Median Income |
| 2-Person Families | 0 (0.0%) | $0 |
| 3-Person Families | 6 (85.7%) | $31,667 |
| 4-Person Families | 1 (14.3%) | $0 |
| 5-Person Families | 0 (0.0%) | $0 |
| 6-Person Families | 0 (0.0%) | $0 |
| 7+ Person Families | 0 (0.0%) | $0 |
| Total | 7 (100.0%) | $31,250 |
Family Income by Number of Earners in Midway
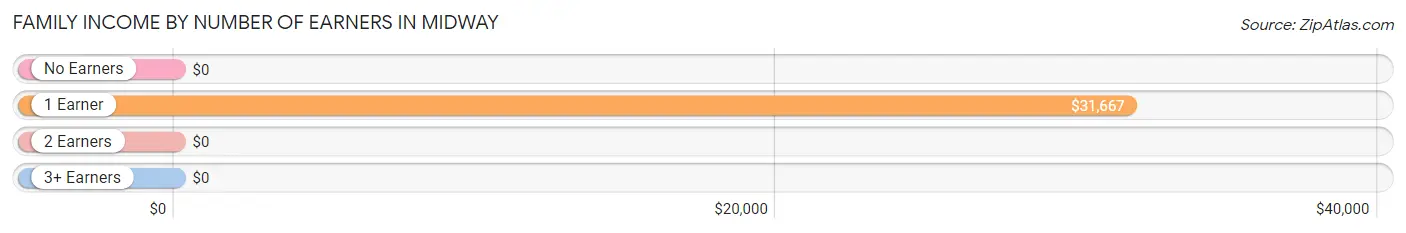
| Number of Earners | # Families | Median Income |
| No Earners | 1 (14.3%) | $0 |
| 1 Earner | 6 (85.7%) | $31,667 |
| 2 Earners | 0 (0.0%) | $0 |
| 3+ Earners | 0 (0.0%) | $0 |
| Total | 7 (100.0%) | $31,250 |
Household Income in Midway
Household Income Brackets in Midway
With 3 households falling in the category, the $25,000 to $34,999 income range is the most frequent in Midway, accounting for 37.5% of all households.
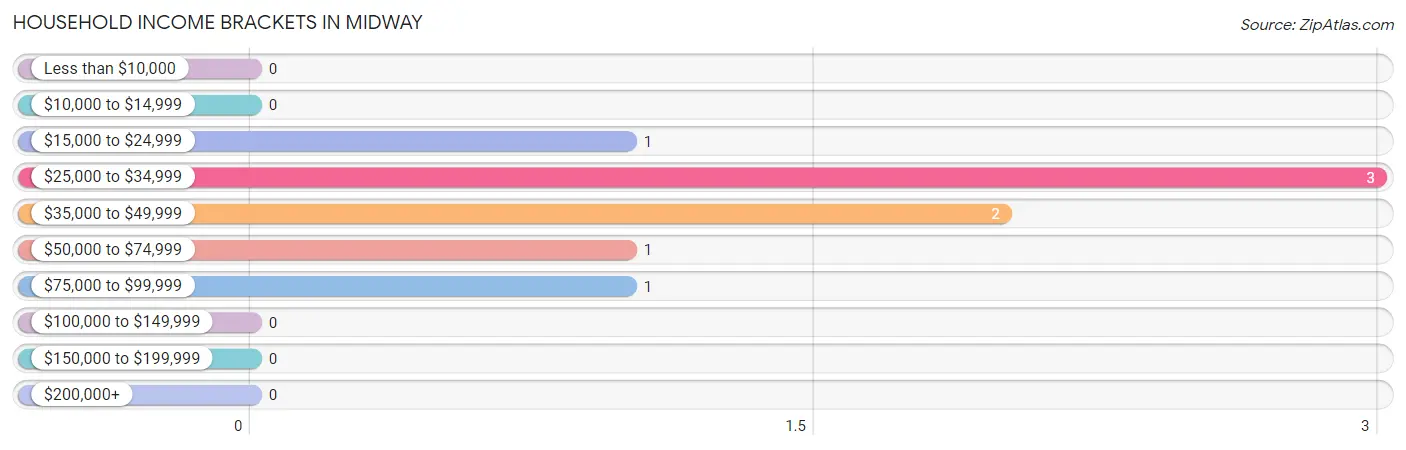
| Income Bracket | # Households | % Households |
| Less than $10,000 | 0 | 0.0% |
| $10,000 to $14,999 | 0 | 0.0% |
| $15,000 to $24,999 | 1 | 12.5% |
| $25,000 to $34,999 | 3 | 37.5% |
| $35,000 to $49,999 | 2 | 25.0% |
| $50,000 to $74,999 | 1 | 12.5% |
| $75,000 to $99,999 | 1 | 12.5% |
| $100,000 to $149,999 | 0 | 0.0% |
| $150,000 to $199,999 | 0 | 0.0% |
| $200,000+ | 0 | 0.0% |
Household Income by Householder Age in Midway
The median household income in Midway is $33,750, with the highest median household income of $32,083 found in the 25 to 44 years age bracket for the primary householder. A total of 5 households (62.5%) fall into this category.
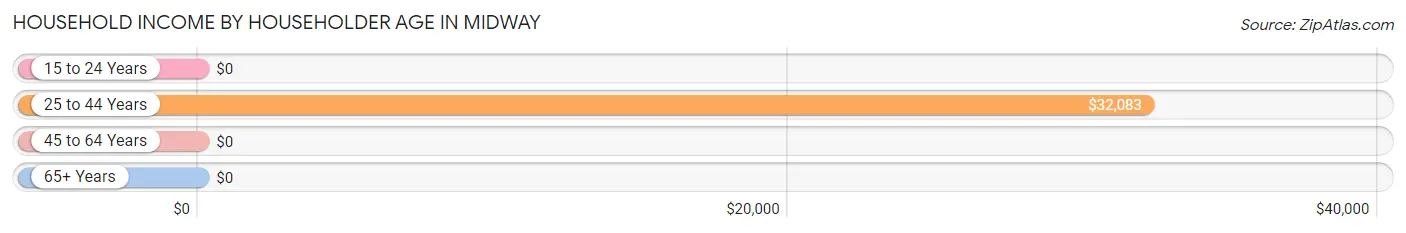
| Income Bracket | # Households | Median Income |
| 15 to 24 Years | 0 (0.0%) | $0 |
| 25 to 44 Years | 5 (62.5%) | $32,083 |
| 45 to 64 Years | 3 (37.5%) | $0 |
| 65+ Years | 0 (0.0%) | $0 |
| Total | 8 (100.0%) | $33,750 |
Poverty in Midway
Income Below Poverty by Sex and Age in Midway
With 39.1% poverty level for males and 25.0% for females among the residents of Midway, 18 to 24 year old males and 12 to 14 year old females are the most vulnerable to poverty, with 2 males (100.0%) and 1 females (100.0%) in their respective age groups living below the poverty level.
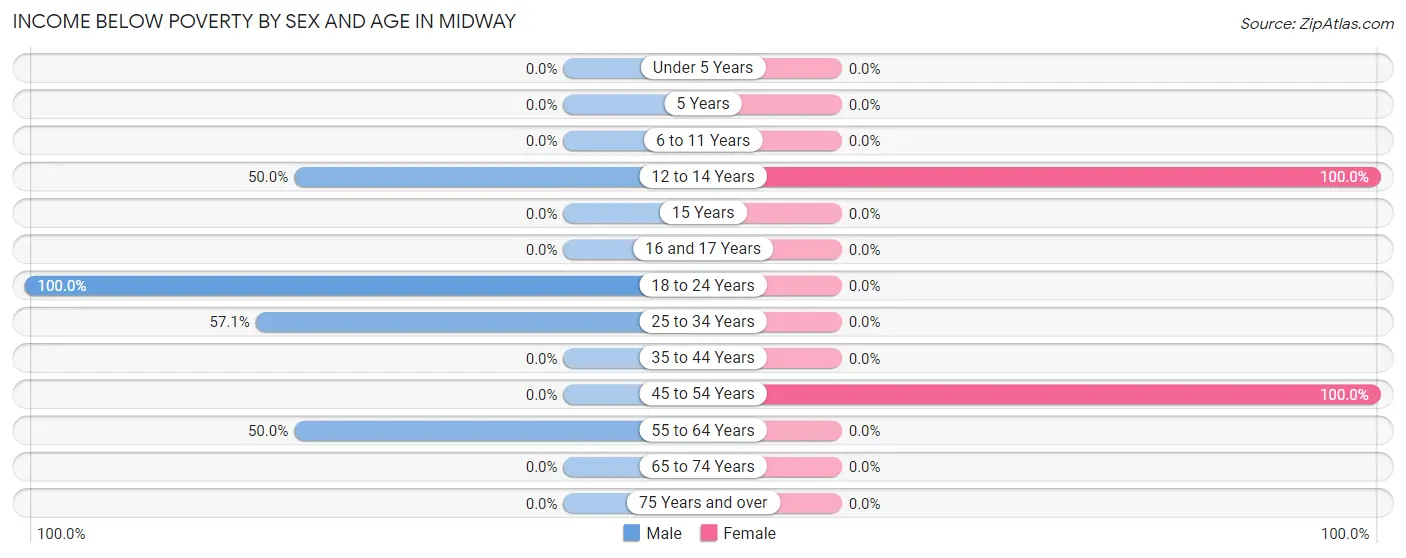
| Age Bracket | Male | Female |
| Under 5 Years | 0 (0.0%) | 0 (0.0%) |
| 5 Years | 0 (0.0%) | 0 (0.0%) |
| 6 to 11 Years | 0 (0.0%) | 0 (0.0%) |
| 12 to 14 Years | 2 (50.0%) | 1 (100.0%) |
| 15 Years | 0 (0.0%) | 0 (0.0%) |
| 16 and 17 Years | 0 (0.0%) | 0 (0.0%) |
| 18 to 24 Years | 2 (100.0%) | 0 (0.0%) |
| 25 to 34 Years | 4 (57.1%) | 0 (0.0%) |
| 35 to 44 Years | 0 (0.0%) | 0 (0.0%) |
| 45 to 54 Years | 0 (0.0%) | 1 (100.0%) |
| 55 to 64 Years | 1 (50.0%) | 0 (0.0%) |
| 65 to 74 Years | 0 (0.0%) | 0 (0.0%) |
| 75 Years and over | 0 (0.0%) | 0 (0.0%) |
| Total | 9 (39.1%) | 2 (25.0%) |
Income Above Poverty by Sex and Age in Midway
According to the poverty statistics in Midway, males aged 6 to 11 years and females aged under 5 years are the age groups that are most secure financially, with 100.0% of males and 100.0% of females in these age groups living above the poverty line.
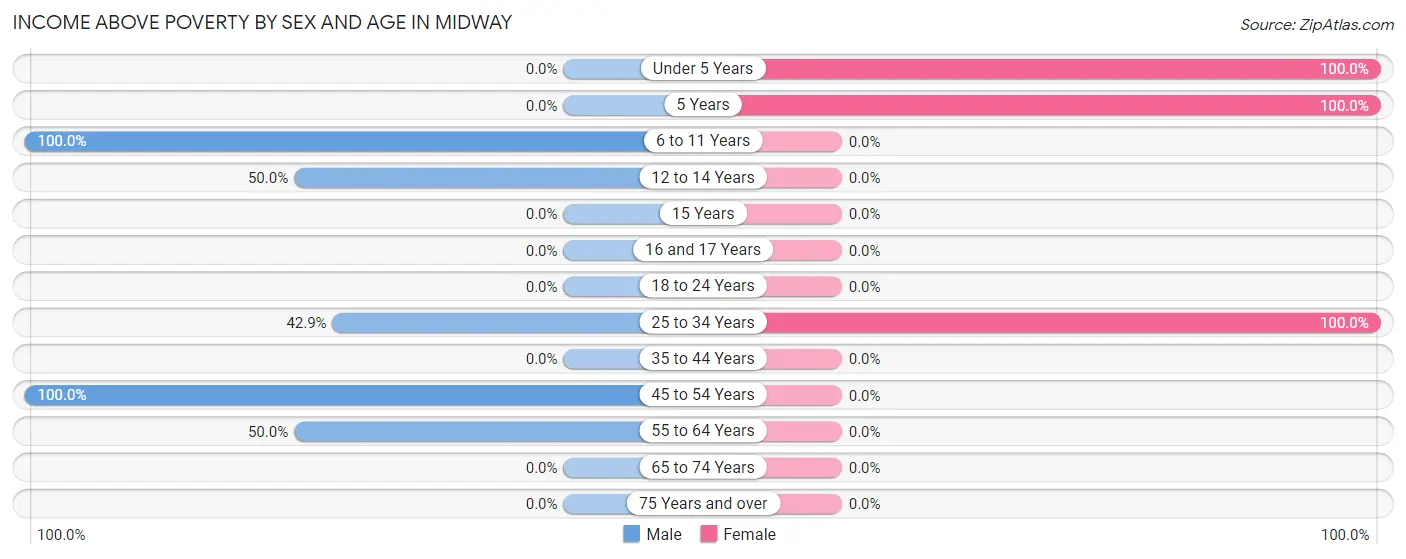
| Age Bracket | Male | Female |
| Under 5 Years | 0 (0.0%) | 2 (100.0%) |
| 5 Years | 0 (0.0%) | 2 (100.0%) |
| 6 to 11 Years | 7 (100.0%) | 0 (0.0%) |
| 12 to 14 Years | 2 (50.0%) | 0 (0.0%) |
| 15 Years | 0 (0.0%) | 0 (0.0%) |
| 16 and 17 Years | 0 (0.0%) | 0 (0.0%) |
| 18 to 24 Years | 0 (0.0%) | 0 (0.0%) |
| 25 to 34 Years | 3 (42.9%) | 2 (100.0%) |
| 35 to 44 Years | 0 (0.0%) | 0 (0.0%) |
| 45 to 54 Years | 1 (100.0%) | 0 (0.0%) |
| 55 to 64 Years | 1 (50.0%) | 0 (0.0%) |
| 65 to 74 Years | 0 (0.0%) | 0 (0.0%) |
| 75 Years and over | 0 (0.0%) | 0 (0.0%) |
| Total | 14 (60.9%) | 6 (75.0%) |
Income Below Poverty Among Married-Couple Families in Midway
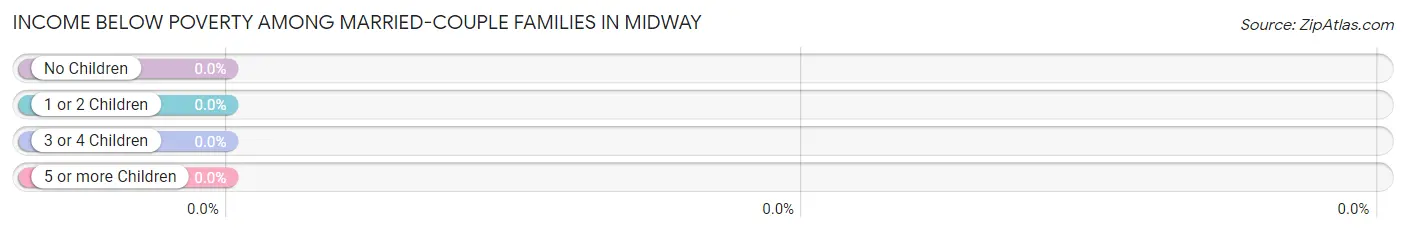
| Children | Above Poverty | Below Poverty |
| No Children | 0 (0.0%) | 0 (0.0%) |
| 1 or 2 Children | 0 (0.0%) | 0 (0.0%) |
| 3 or 4 Children | 0 (0.0%) | 0 (0.0%) |
| 5 or more Children | 0 (0.0%) | 0 (0.0%) |
| Total | 0 (0.0%) | 0 (0.0%) |
Income Below Poverty Among Single-Parent Households in Midway
According to the poverty data in Midway, 25.0% or 1 single-father households and 33.3% or 1 single-mother households are living below the poverty line. Among single-father households, those with no children have the highest poverty rate, with 1 households (100.0%) experiencing poverty. Likewise, among single-mother households, those with 1 or 2 children have the highest poverty rate, with 1 households (33.3%) falling below the poverty line.
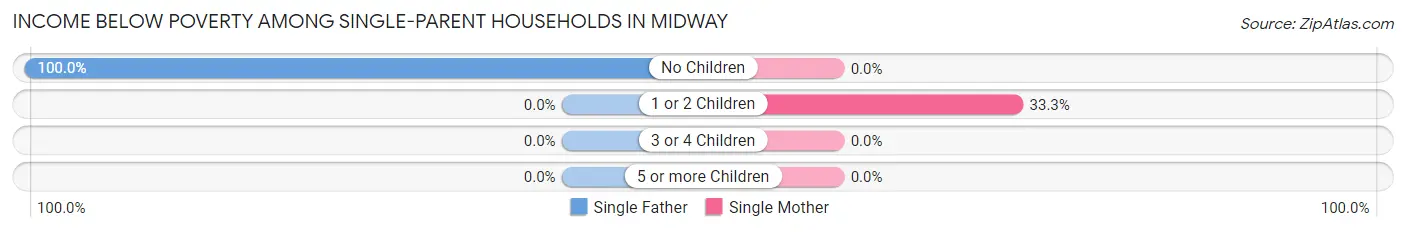
| Children | Single Father | Single Mother |
| No Children | 1 (100.0%) | 0 (0.0%) |
| 1 or 2 Children | 0 (0.0%) | 1 (33.3%) |
| 3 or 4 Children | 0 (0.0%) | 0 (0.0%) |
| 5 or more Children | 0 (0.0%) | 0 (0.0%) |
| Total | 1 (25.0%) | 1 (33.3%) |
Income Below Poverty Among Married-Couple vs Single-Parent Households in Midway
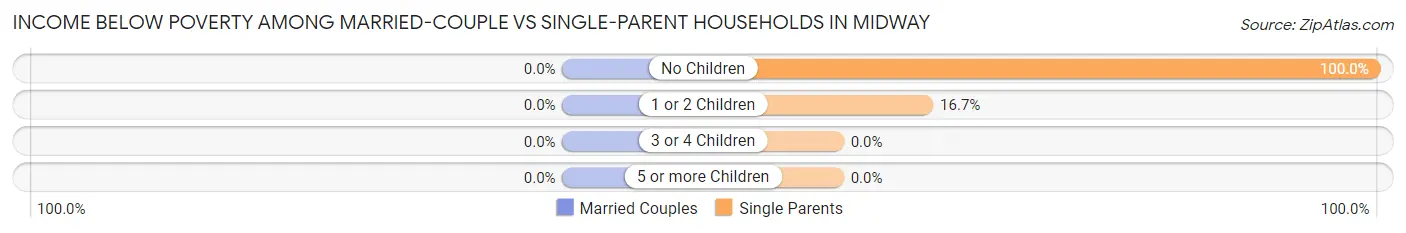
| Children | Married-Couple Families | Single-Parent Households |
| No Children | 0 (0.0%) | 1 (100.0%) |
| 1 or 2 Children | 0 (0.0%) | 1 (16.7%) |
| 3 or 4 Children | 0 (0.0%) | 0 (0.0%) |
| 5 or more Children | 0 (0.0%) | 0 (0.0%) |
| Total | 0 (0.0%) | 2 (28.6%) |
Race in Midway
The most populous races in Midway are Two or more Races (19 | 59.4%), Hispanic or Latino (9 | 28.1%), and Native / Alaskan (7 | 21.9%).
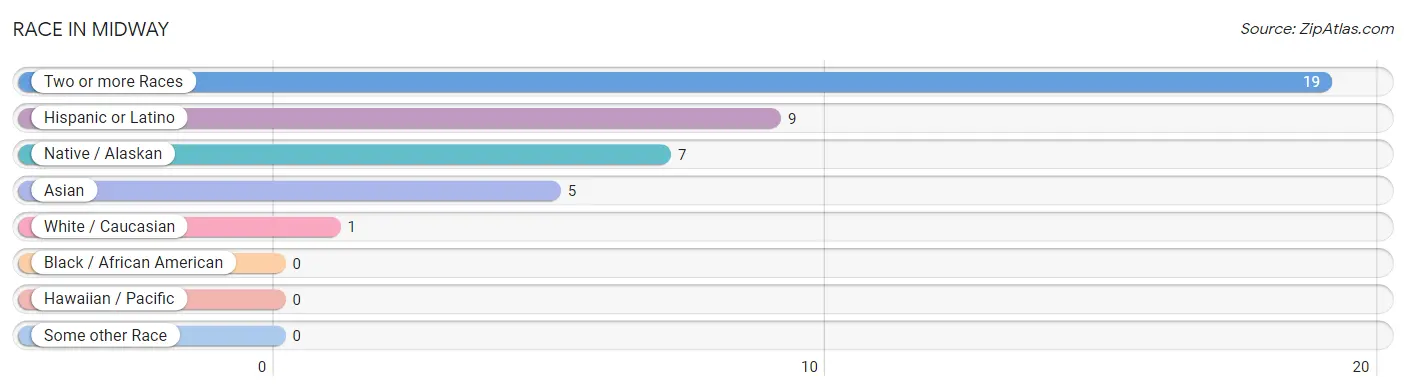
| Race | # Population | % Population |
| Asian | 5 | 15.6% |
| Black / African American | 0 | 0.0% |
| Hawaiian / Pacific | 0 | 0.0% |
| Hispanic or Latino | 9 | 28.1% |
| Native / Alaskan | 7 | 21.9% |
| White / Caucasian | 1 | 3.1% |
| Two or more Races | 19 | 59.4% |
| Some other Race | 0 | 0.0% |
| Total | 32 | 100.0% |
Ancestry in Midway
The most populous ancestries reported in Midway are Chippewa (17 | 53.1%), Mexican (9 | 28.1%), Bangladeshi (5 | 15.6%), Italian (5 | 15.6%), and Irish (4 | 12.5%), together accounting for 125.0% of all Midway residents.
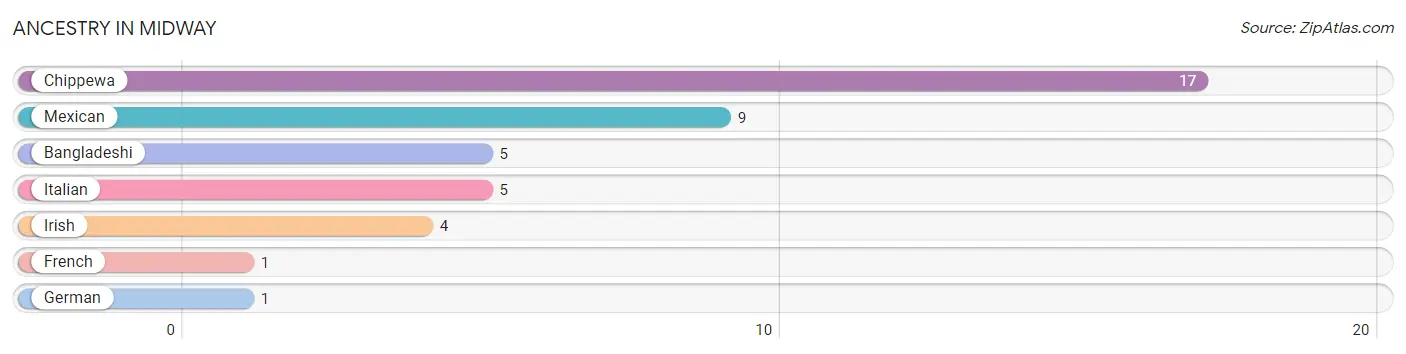
| Ancestry | # Population | % Population |
| Bangladeshi | 5 | 15.6% |
| Chippewa | 17 | 53.1% |
| French | 1 | 3.1% |
| German | 1 | 3.1% |
| Irish | 4 | 12.5% |
| Italian | 5 | 15.6% |
| Mexican | 9 | 28.1% | View All 7 Rows |
Immigrants in Midway
The most numerous immigrant groups reported in Midway came from Asia (5 | 15.6%), South Eastern Asia (5 | 15.6%), Thailand (4 | 12.5%), and Laos (1 | 3.1%), together accounting for 46.9% of all Midway residents.
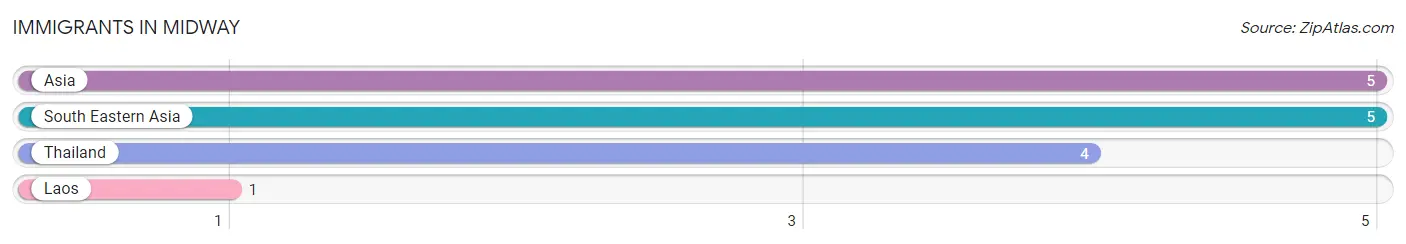
| Immigration Origin | # Population | % Population |
| Asia | 5 | 15.6% |
| Laos | 1 | 3.1% |
| South Eastern Asia | 5 | 15.6% |
| Thailand | 4 | 12.5% | View All 4 Rows |
Sex and Age in Midway
Sex and Age in Midway
The most populous age groups in Midway are 5 to 9 Years (7 | 29.2%) for men and Under 5 Years (2 | 25.0%) for women.
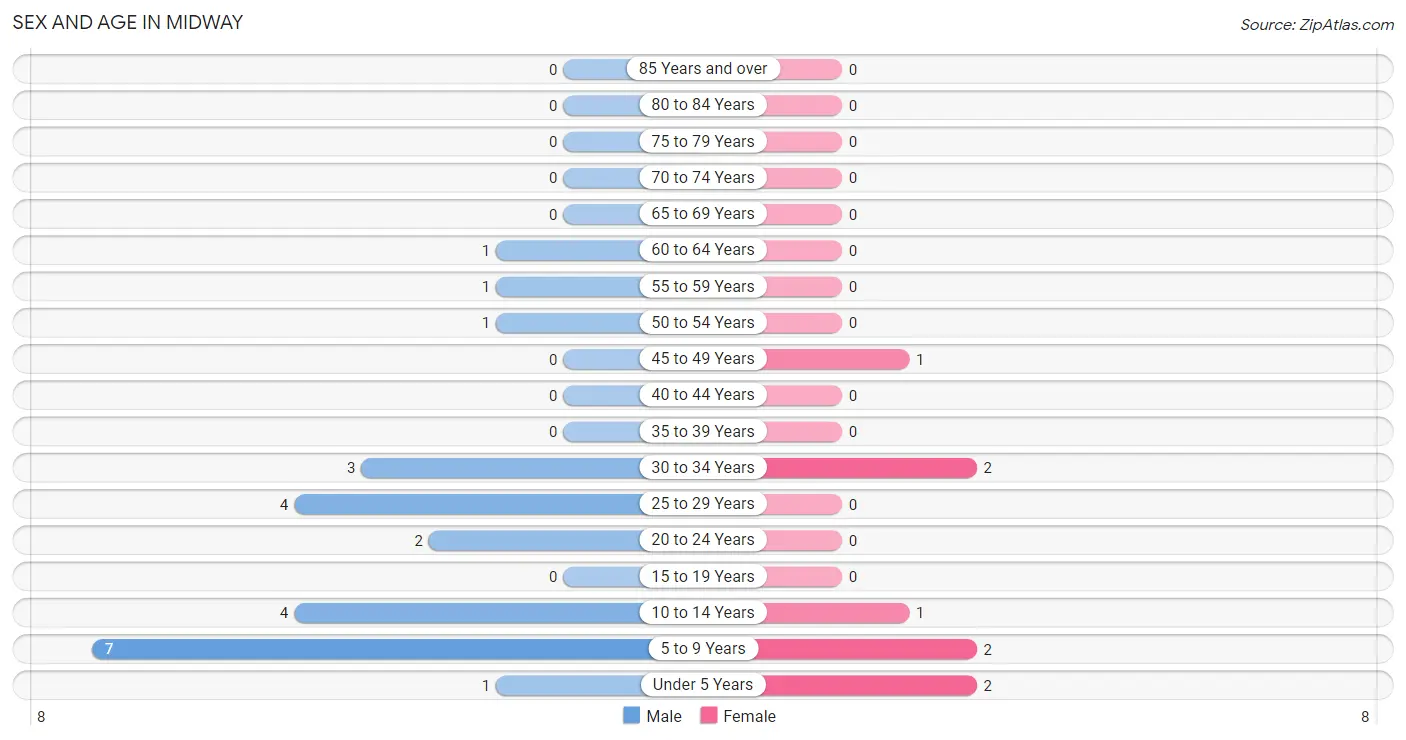
| Age Bracket | Male | Female |
| Under 5 Years | 1 (4.2%) | 2 (25.0%) |
| 5 to 9 Years | 7 (29.2%) | 2 (25.0%) |
| 10 to 14 Years | 4 (16.7%) | 1 (12.5%) |
| 15 to 19 Years | 0 (0.0%) | 0 (0.0%) |
| 20 to 24 Years | 2 (8.3%) | 0 (0.0%) |
| 25 to 29 Years | 4 (16.7%) | 0 (0.0%) |
| 30 to 34 Years | 3 (12.5%) | 2 (25.0%) |
| 35 to 39 Years | 0 (0.0%) | 0 (0.0%) |
| 40 to 44 Years | 0 (0.0%) | 0 (0.0%) |
| 45 to 49 Years | 0 (0.0%) | 1 (12.5%) |
| 50 to 54 Years | 1 (4.2%) | 0 (0.0%) |
| 55 to 59 Years | 1 (4.2%) | 0 (0.0%) |
| 60 to 64 Years | 1 (4.2%) | 0 (0.0%) |
| 65 to 69 Years | 0 (0.0%) | 0 (0.0%) |
| 70 to 74 Years | 0 (0.0%) | 0 (0.0%) |
| 75 to 79 Years | 0 (0.0%) | 0 (0.0%) |
| 80 to 84 Years | 0 (0.0%) | 0 (0.0%) |
| 85 Years and over | 0 (0.0%) | 0 (0.0%) |
| Total | 24 (100.0%) | 8 (100.0%) |
Families and Households in Midway
Median Family Size in Midway
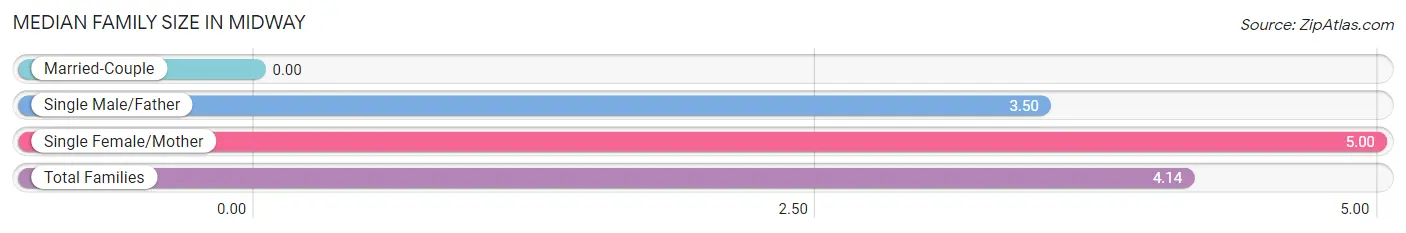
| Family Type | # Families | Family Size |
| Married-Couple | 0 (0.0%) | - |
| Single Male/Father | 4 (57.1%) | 3.50 |
| Single Female/Mother | 3 (42.9%) | 5.00 |
| Total Families | 7 (100.0%) | 4.14 |
Median Household Size in Midway
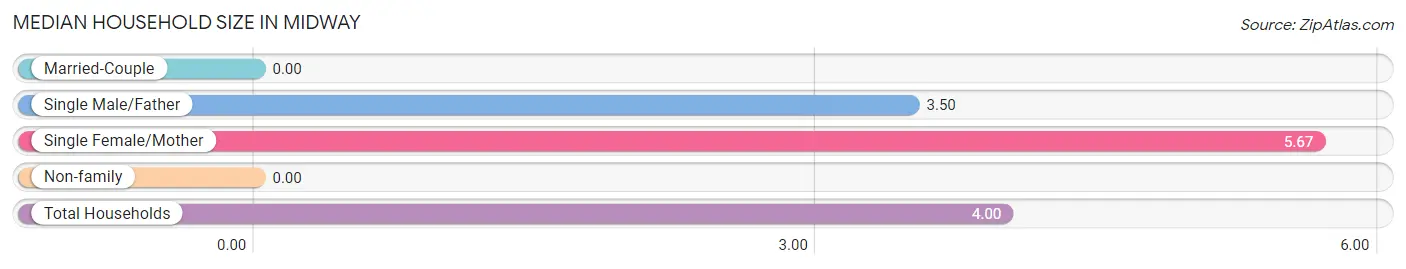
| Household Type | # Households | Household Size |
| Married-Couple | 0 (0.0%) | - |
| Single Male/Father | 4 (50.0%) | 3.50 |
| Single Female/Mother | 3 (37.5%) | 5.67 |
| Non-family | 1 (12.5%) | - |
| Total Households | 8 (100.0%) | 4.00 |
Household Size by Marriage Status in Midway
Out of a total of 8 households in Midway, 7 (87.5%) are family households, while 1 (12.5%) are nonfamily households. The most numerous type of family households are 3-person households, comprising 5, and the most common type of nonfamily households are 1-person households, comprising 1.
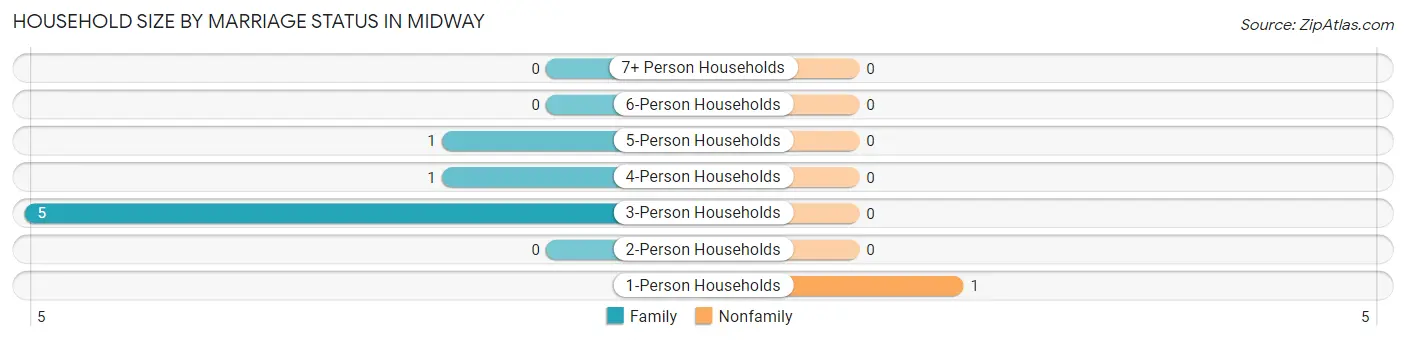
| Household Size | Family Households | Nonfamily Households |
| 1-Person Households | - | 1 (12.5%) |
| 2-Person Households | 0 (0.0%) | 0 (0.0%) |
| 3-Person Households | 5 (62.5%) | 0 (0.0%) |
| 4-Person Households | 1 (12.5%) | 0 (0.0%) |
| 5-Person Households | 1 (12.5%) | 0 (0.0%) |
| 6-Person Households | 0 (0.0%) | 0 (0.0%) |
| 7+ Person Households | 0 (0.0%) | 0 (0.0%) |
| Total | 7 (87.5%) | 1 (12.5%) |
Female Fertility in Midway
Fertility by Age in Midway
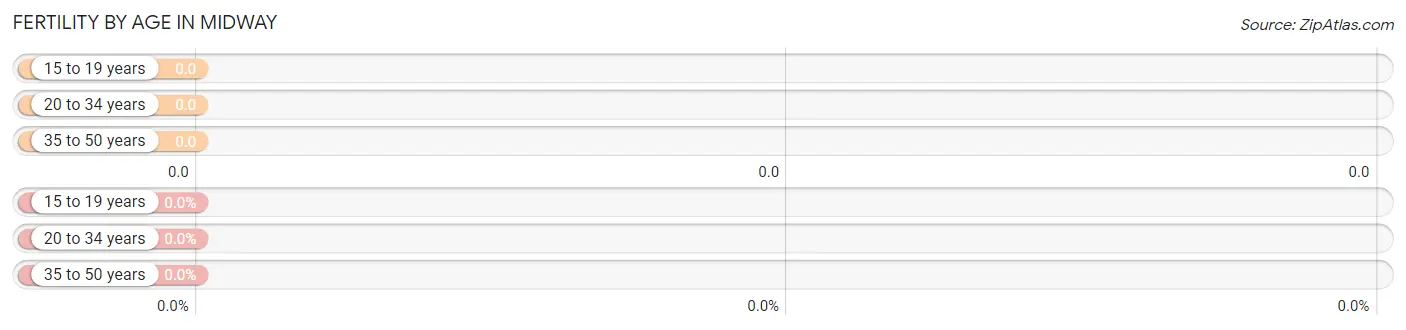
| Age Bracket | Women with Births | Births / 1,000 Women |
| 15 to 19 years | 0 (0.0%) | 0.0 |
| 20 to 34 years | 0 (0.0%) | 0.0 |
| 35 to 50 years | 0 (0.0%) | 0.0 |
| Total | 0 (0.0%) | 0.0 |
Fertility by Age by Marriage Status in Midway
| Age Bracket | Married | Unmarried |
| 15 to 19 years | 0 (0.0%) | 0 (0.0%) |
| 20 to 34 years | 0 (0.0%) | 0 (0.0%) |
| 35 to 50 years | 0 (0.0%) | 0 (0.0%) |
| Total | 0 (0.0%) | 0 (0.0%) |
Fertility by Education in Midway
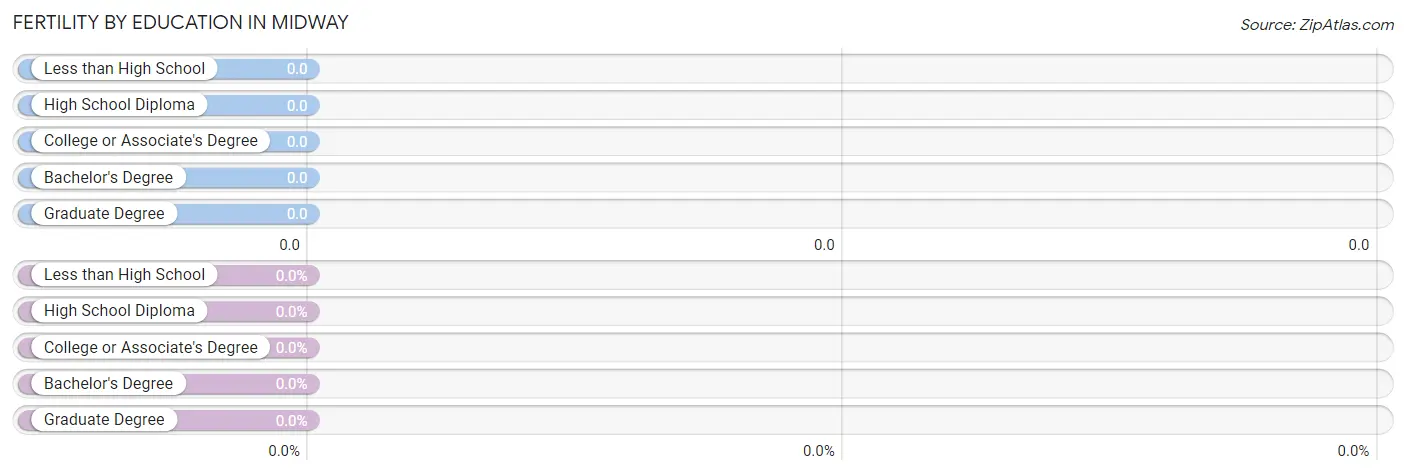
| Educational Attainment | Women with Births | Births / 1,000 Women |
| Less than High School | 0 (0.0%) | 0.0 |
| High School Diploma | 0 (0.0%) | 0.0 |
| College or Associate's Degree | 0 (0.0%) | 0.0 |
| Bachelor's Degree | 0 (0.0%) | 0.0 |
| Graduate Degree | 0 (0.0%) | 0.0 |
| Total | 0 (0.0%) | 0.0 |
Fertility by Education by Marriage Status in Midway
| Educational Attainment | Married | Unmarried |
| Less than High School | 0 (0.0%) | 0 (0.0%) |
| High School Diploma | 0 (0.0%) | 0 (0.0%) |
| College or Associate's Degree | 0 (0.0%) | 0 (0.0%) |
| Bachelor's Degree | 0 (0.0%) | 0 (0.0%) |
| Graduate Degree | 0 (0.0%) | 0 (0.0%) |
| Total | 0 (0.0%) | 0 (0.0%) |
Employment Characteristics in Midway
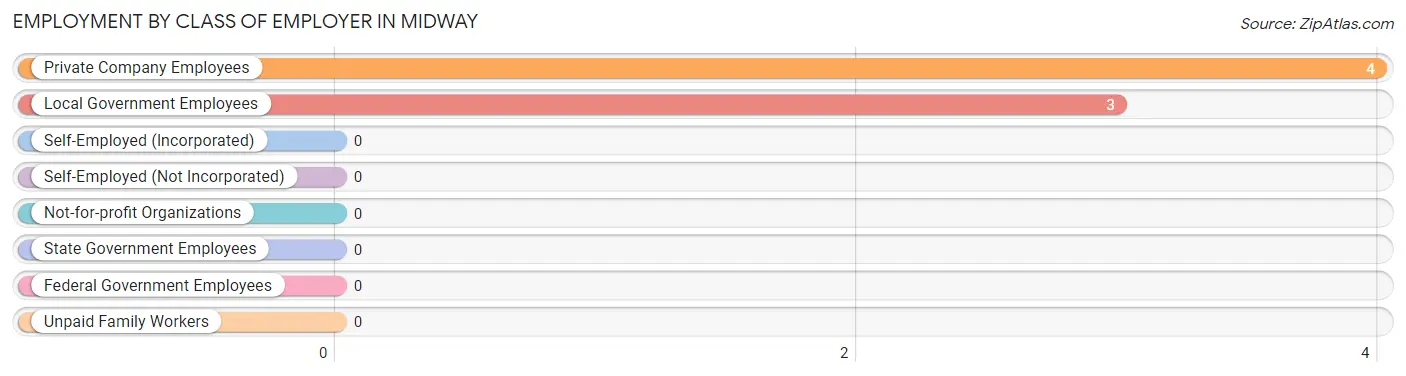
Employment by Class of Employer in Midway
Among the 7 employed individuals in Midway, private company employees (4 | 57.1%), and local government employees (3 | 42.9%) make up the most common classes of employment.
| Employer Class | # Employees | % Employees |
| Private Company Employees | 4 | 57.1% |
| Self-Employed (Incorporated) | 0 | 0.0% |
| Self-Employed (Not Incorporated) | 0 | 0.0% |
| Not-for-profit Organizations | 0 | 0.0% |
| Local Government Employees | 3 | 42.9% |
| State Government Employees | 0 | 0.0% |
| Federal Government Employees | 0 | 0.0% |
| Unpaid Family Workers | 0 | 0.0% |
| Total | 7 | 100.0% |
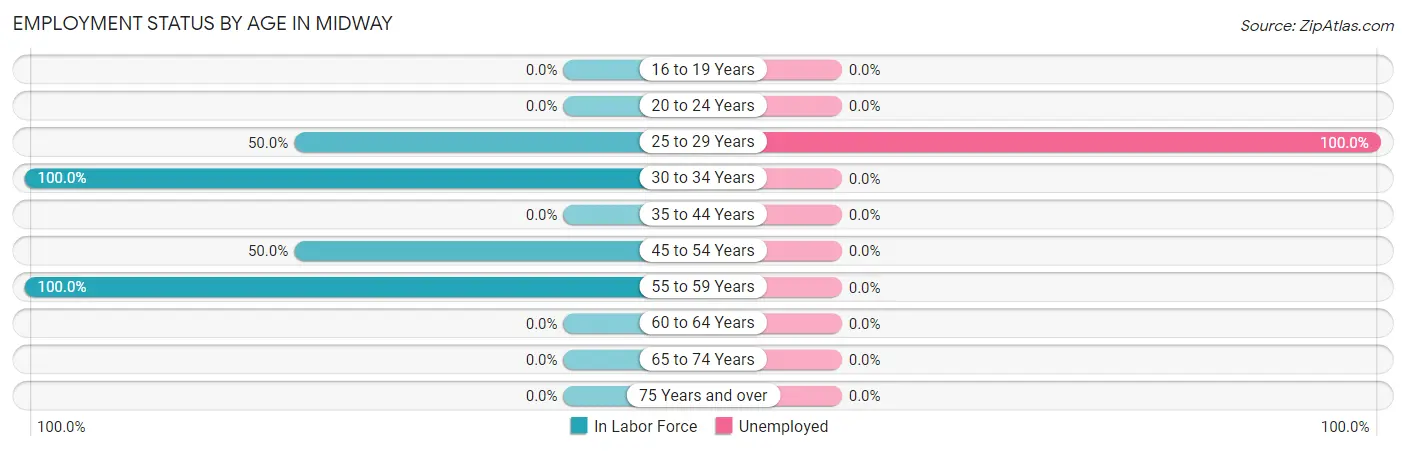
Employment Status by Age in Midway
According to the labor force statistics for Midway, out of the total population over 16 years of age (15), 60.0% or 9 individuals are in the labor force, with 22.2% or 2 of them unemployed. The age group with the highest labor force participation rate is 30 to 34 years, with 100.0% or 5 individuals in the labor force. Within the labor force, the 25 to 29 years age range has the highest percentage of unemployed individuals, with 100.0% or 2 of them being unemployed.
| Age Bracket | In Labor Force | Unemployed |
| 16 to 19 Years | 0 (0.0%) | 0 (0.0%) |
| 20 to 24 Years | 0 (0.0%) | 0 (0.0%) |
| 25 to 29 Years | 2 (50.0%) | 2 (100.0%) |
| 30 to 34 Years | 5 (100.0%) | 0 (0.0%) |
| 35 to 44 Years | 0 (0.0%) | 0 (0.0%) |
| 45 to 54 Years | 1 (50.0%) | 0 (0.0%) |
| 55 to 59 Years | 1 (100.0%) | 0 (0.0%) |
| 60 to 64 Years | 0 (0.0%) | 0 (0.0%) |
| 65 to 74 Years | 0 (0.0%) | 0 (0.0%) |
| 75 Years and over | 0 (0.0%) | 0 (0.0%) |
| Total | 9 (60.0%) | 2 (22.2%) |
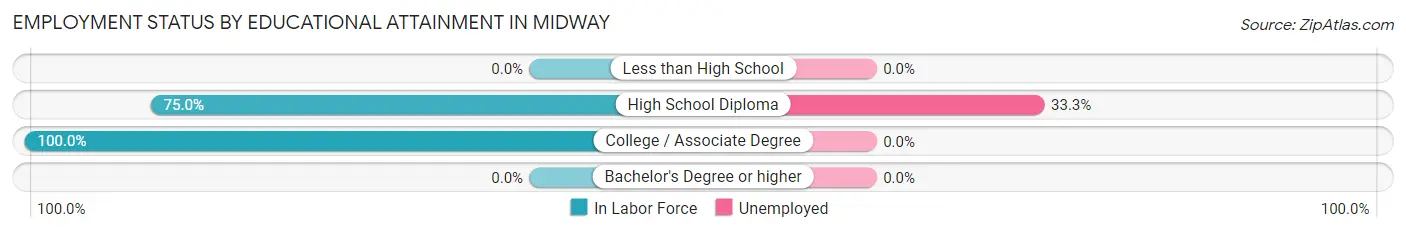
Employment Status by Educational Attainment in Midway
According to labor force statistics for Midway, 69.2% of individuals (9) out of the total population between 25 and 64 years of age (13) are in the labor force, with 22.2% or 2 of them being unemployed. The group with the highest labor force participation rate are those with the educational attainment of college / associate degree, with 100.0% or 3 individuals in the labor force. Within the labor force, individuals with high school diploma education have the highest percentage of unemployment, with 33.3% or 2 of them being unemployed.
| Educational Attainment | In Labor Force | Unemployed |
| Less than High School | 0 (0.0%) | 0 (0.0%) |
| High School Diploma | 6 (75.0%) | 3 (33.3%) |
| College / Associate Degree | 3 (100.0%) | 0 (0.0%) |
| Bachelor's Degree or higher | 0 (0.0%) | 0 (0.0%) |
| Total | 9 (69.2%) | 3 (22.2%) |
Employment Occupations by Sex in Midway
Management, Business, Science and Arts Occupations
The most common Management, Business, Science and Arts occupations in Midway are Management (3 | 42.9%), Community & Social Service (1 | 14.3%), and Education, Arts & Media (1 | 14.3%).
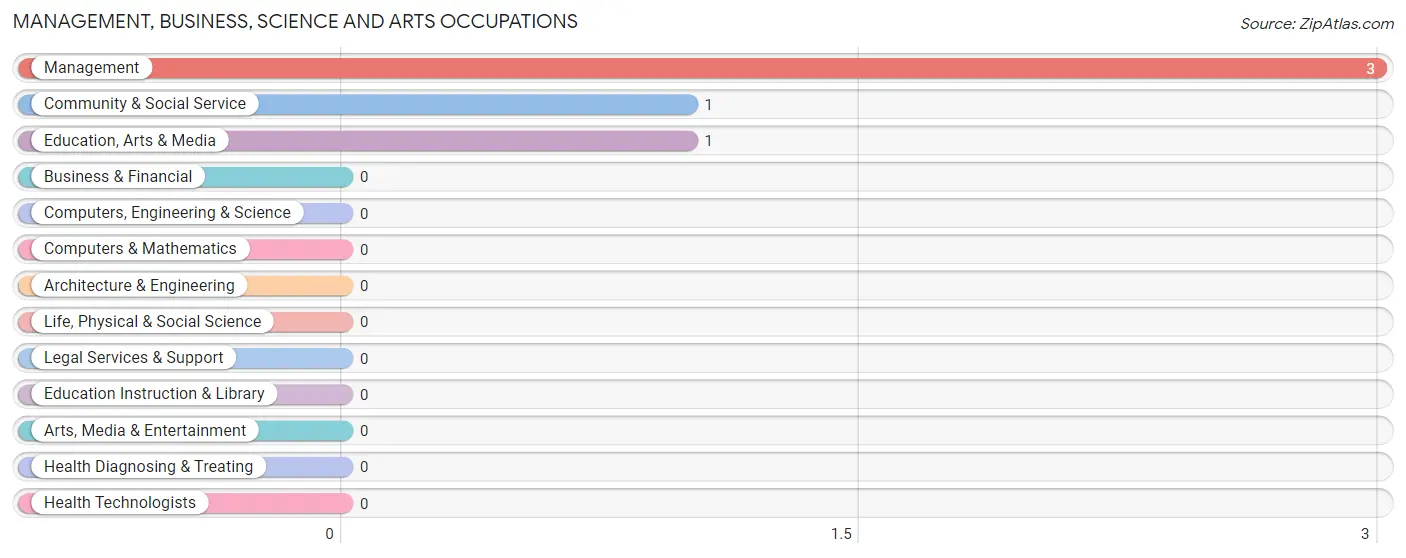
Management, Business, Science and Arts Occupations by Sex
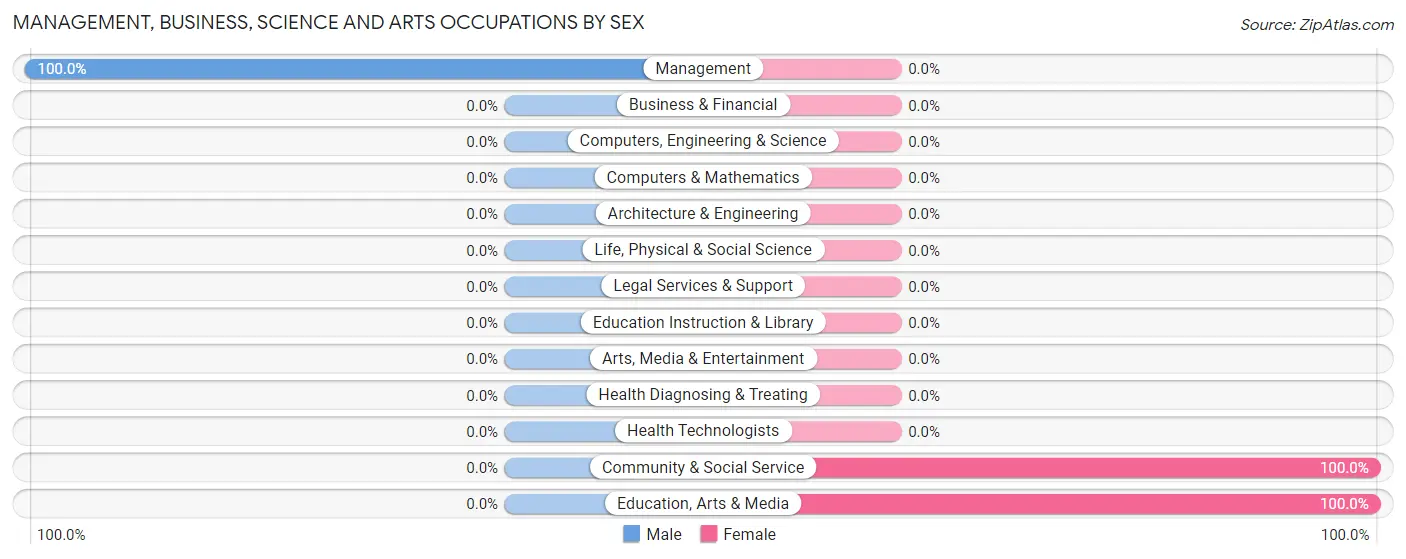
| Occupation | Male | Female |
| Management | 3 (100.0%) | 0 (0.0%) |
| Business & Financial | 0 (0.0%) | 0 (0.0%) |
| Computers, Engineering & Science | 0 (0.0%) | 0 (0.0%) |
| Computers & Mathematics | 0 (0.0%) | 0 (0.0%) |
| Architecture & Engineering | 0 (0.0%) | 0 (0.0%) |
| Life, Physical & Social Science | 0 (0.0%) | 0 (0.0%) |
| Community & Social Service | 0 (0.0%) | 1 (100.0%) |
| Education, Arts & Media | 0 (0.0%) | 1 (100.0%) |
| Legal Services & Support | 0 (0.0%) | 0 (0.0%) |
| Education Instruction & Library | 0 (0.0%) | 0 (0.0%) |
| Arts, Media & Entertainment | 0 (0.0%) | 0 (0.0%) |
| Health Diagnosing & Treating | 0 (0.0%) | 0 (0.0%) |
| Health Technologists | 0 (0.0%) | 0 (0.0%) |
| Total (Category) | 3 (75.0%) | 1 (25.0%) |
| Total (Overall) | 5 (71.4%) | 2 (28.6%) |
Services Occupations
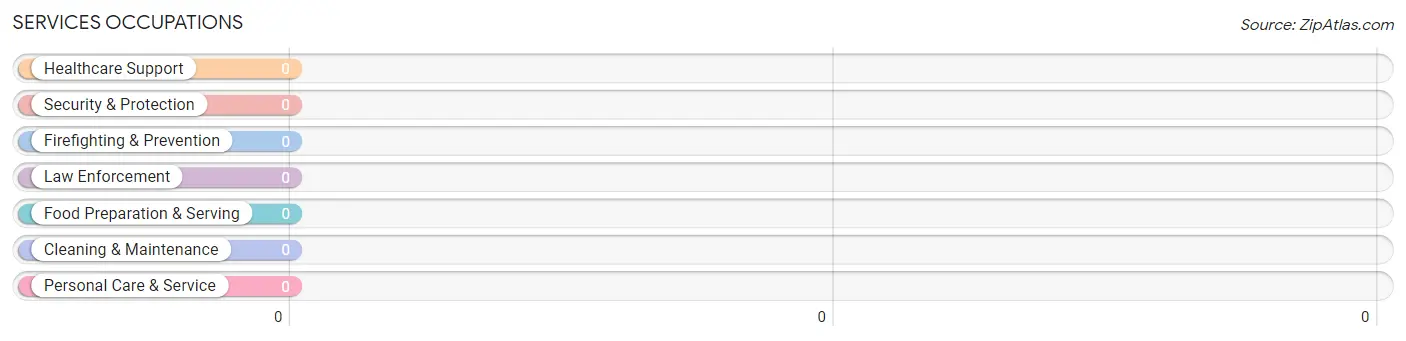
Services Occupations by Sex
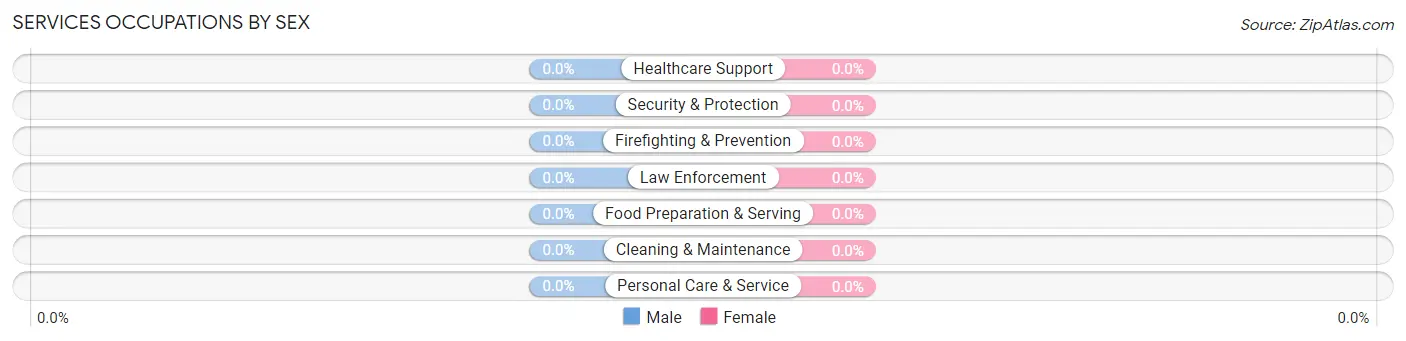
| Occupation | Male | Female |
| Healthcare Support | 0 (0.0%) | 0 (0.0%) |
| Security & Protection | 0 (0.0%) | 0 (0.0%) |
| Firefighting & Prevention | 0 (0.0%) | 0 (0.0%) |
| Law Enforcement | 0 (0.0%) | 0 (0.0%) |
| Food Preparation & Serving | 0 (0.0%) | 0 (0.0%) |
| Cleaning & Maintenance | 0 (0.0%) | 0 (0.0%) |
| Personal Care & Service | 0 (0.0%) | 0 (0.0%) |
| Total (Category) | 0 (0.0%) | 0 (0.0%) |
| Total (Overall) | 5 (71.4%) | 2 (28.6%) |
Sales and Office Occupations
The most common Sales and Office occupations in Midway are , and Office & Administration (1 | 14.3%).

Sales and Office Occupations by Sex

| Occupation | Male | Female |
| Sales & Related | 0 (0.0%) | 0 (0.0%) |
| Office & Administration | 0 (0.0%) | 1 (100.0%) |
| Total (Category) | 0 (0.0%) | 1 (100.0%) |
| Total (Overall) | 5 (71.4%) | 2 (28.6%) |
Natural Resources, Construction and Maintenance Occupations
The most common Natural Resources, Construction and Maintenance occupations in Midway are Construction & Extraction (1 | 14.3%), and Installation, Maintenance & Repair (1 | 14.3%).
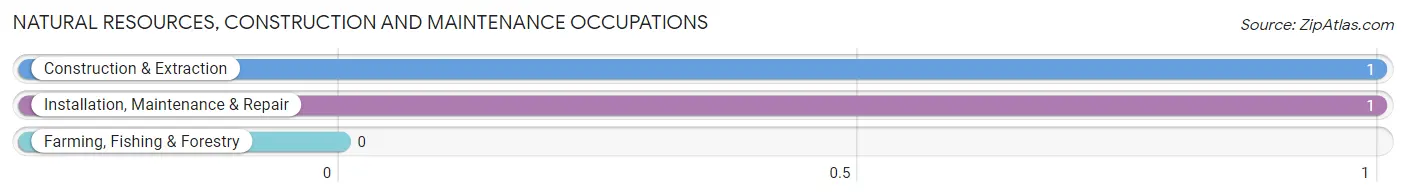
Natural Resources, Construction and Maintenance Occupations by Sex

| Occupation | Male | Female |
| Farming, Fishing & Forestry | 0 (0.0%) | 0 (0.0%) |
| Construction & Extraction | 1 (100.0%) | 0 (0.0%) |
| Installation, Maintenance & Repair | 1 (100.0%) | 0 (0.0%) |
| Total (Category) | 2 (100.0%) | 0 (0.0%) |
| Total (Overall) | 5 (71.4%) | 2 (28.6%) |
Production, Transportation and Moving Occupations
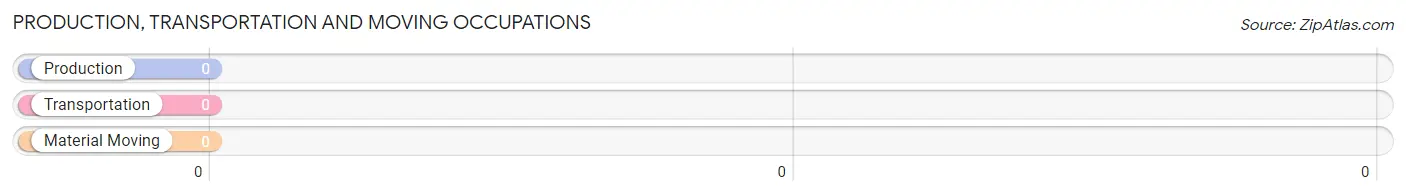
Production, Transportation and Moving Occupations by Sex
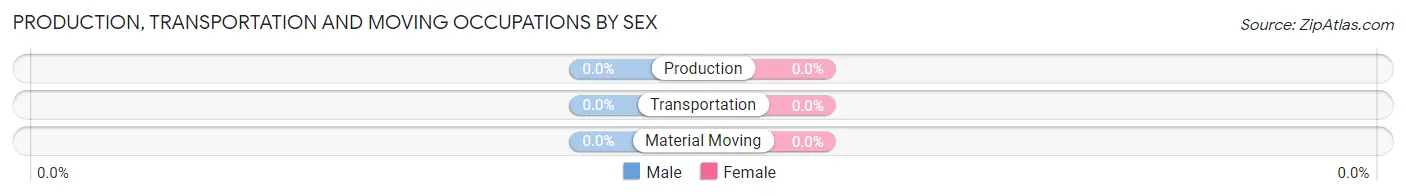
| Occupation | Male | Female |
| Production | 0 (0.0%) | 0 (0.0%) |
| Transportation | 0 (0.0%) | 0 (0.0%) |
| Material Moving | 0 (0.0%) | 0 (0.0%) |
| Total (Category) | 0 (0.0%) | 0 (0.0%) |
| Total (Overall) | 5 (71.4%) | 2 (28.6%) |
Employment Industries by Sex in Midway
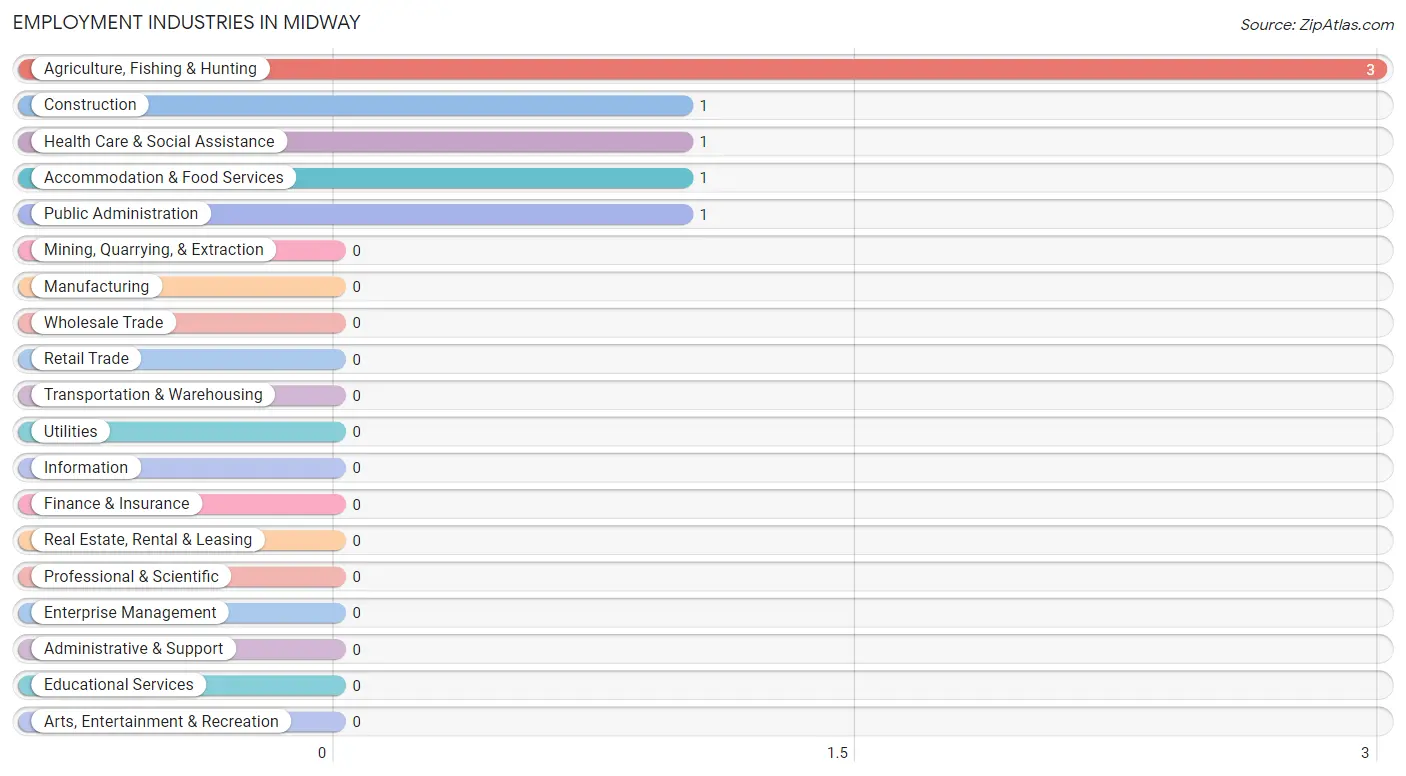
Employment Industries in Midway
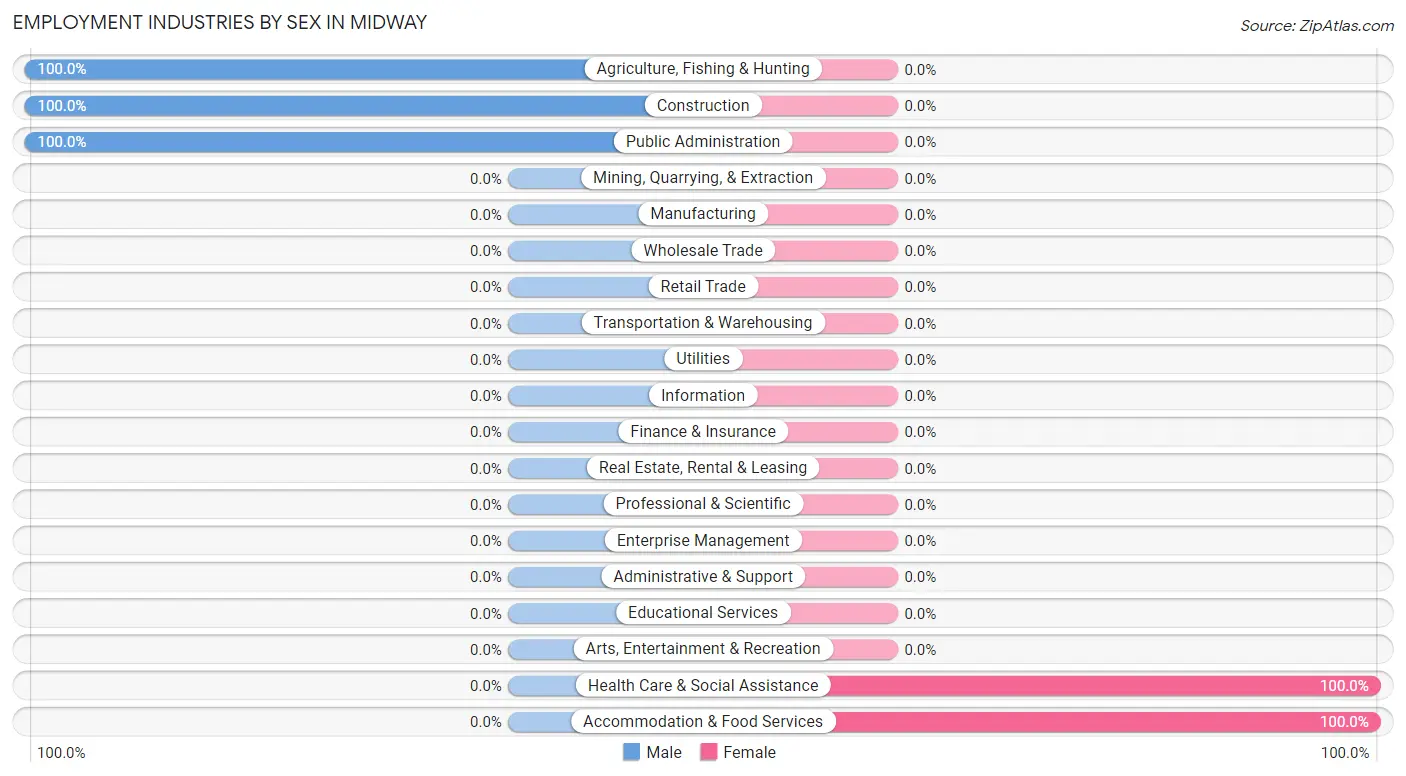
The major employment industries in Midway include Agriculture, Fishing & Hunting (3 | 42.9%), Construction (1 | 14.3%), Health Care & Social Assistance (1 | 14.3%), Accommodation & Food Services (1 | 14.3%), and Public Administration (1 | 14.3%).
Employment Industries by Sex in Midway
The Midway industries that see more men than women are Agriculture, Fishing & Hunting (100.0%), Construction (100.0%), and Public Administration (100.0%), whereas the industries that tend to have a higher number of women are Health Care & Social Assistance (100.0%), and Accommodation & Food Services (100.0%).
| Industry | Male | Female |
| Agriculture, Fishing & Hunting | 3 (100.0%) | 0 (0.0%) |
| Mining, Quarrying, & Extraction | 0 (0.0%) | 0 (0.0%) |
| Construction | 1 (100.0%) | 0 (0.0%) |
| Manufacturing | 0 (0.0%) | 0 (0.0%) |
| Wholesale Trade | 0 (0.0%) | 0 (0.0%) |
| Retail Trade | 0 (0.0%) | 0 (0.0%) |
| Transportation & Warehousing | 0 (0.0%) | 0 (0.0%) |
| Utilities | 0 (0.0%) | 0 (0.0%) |
| Information | 0 (0.0%) | 0 (0.0%) |
| Finance & Insurance | 0 (0.0%) | 0 (0.0%) |
| Real Estate, Rental & Leasing | 0 (0.0%) | 0 (0.0%) |
| Professional & Scientific | 0 (0.0%) | 0 (0.0%) |
| Enterprise Management | 0 (0.0%) | 0 (0.0%) |
| Administrative & Support | 0 (0.0%) | 0 (0.0%) |
| Educational Services | 0 (0.0%) | 0 (0.0%) |
| Health Care & Social Assistance | 0 (0.0%) | 1 (100.0%) |
| Arts, Entertainment & Recreation | 0 (0.0%) | 0 (0.0%) |
| Accommodation & Food Services | 0 (0.0%) | 1 (100.0%) |
| Public Administration | 1 (100.0%) | 0 (0.0%) |
| Total | 5 (71.4%) | 2 (28.6%) |
Education in Midway
School Enrollment in Midway
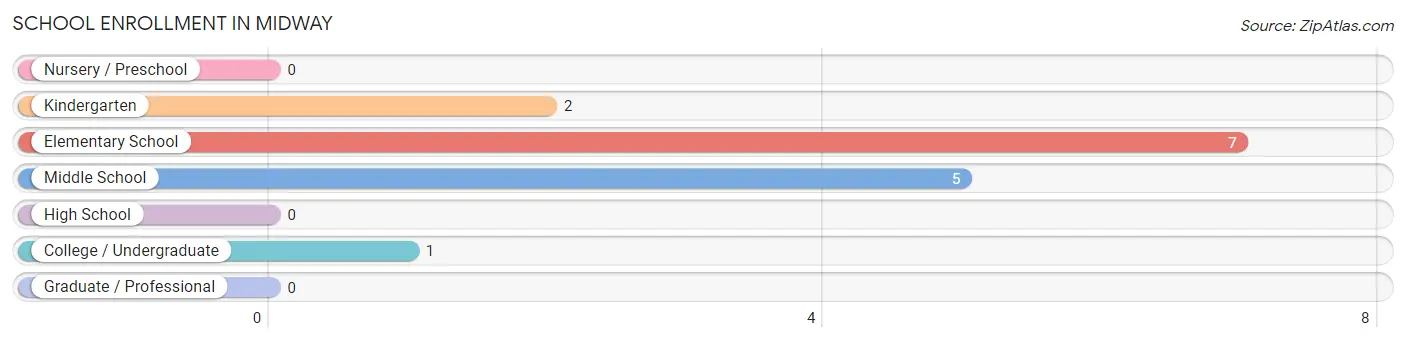
The most common levels of schooling among the 15 students in Midway are elementary school (7 | 46.7%), middle school (5 | 33.3%), and kindergarten (2 | 13.3%).
| School Level | # Students | % Students |
| Nursery / Preschool | 0 | 0.0% |
| Kindergarten | 2 | 13.3% |
| Elementary School | 7 | 46.7% |
| Middle School | 5 | 33.3% |
| High School | 0 | 0.0% |
| College / Undergraduate | 1 | 6.7% |
| Graduate / Professional | 0 | 0.0% |
| Total | 15 | 100.0% |
School Enrollment by Age by Funding Source in Midway
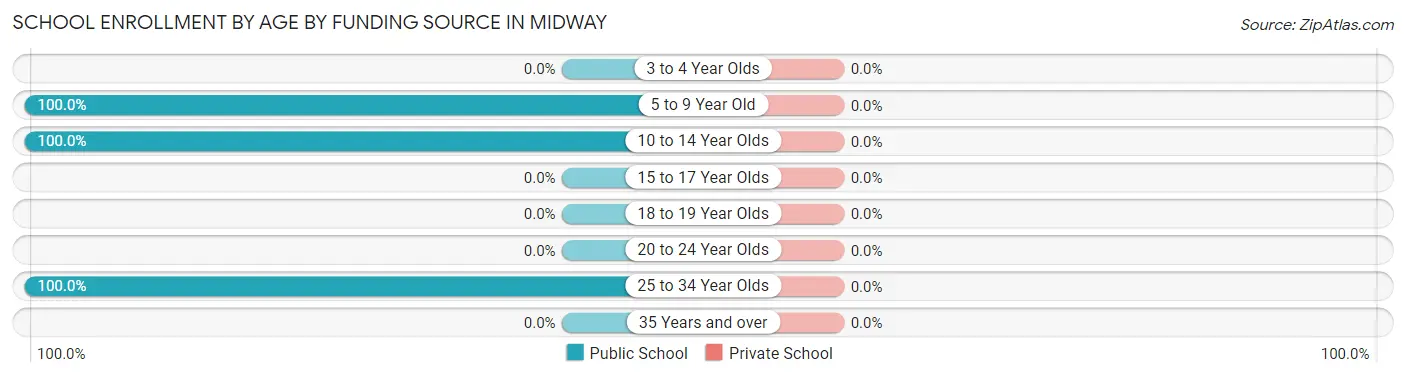
| Age Bracket | Public School | Private School |
| 3 to 4 Year Olds | 0 (0.0%) | 0 (0.0%) |
| 5 to 9 Year Old | 9 (100.0%) | 0 (0.0%) |
| 10 to 14 Year Olds | 5 (100.0%) | 0 (0.0%) |
| 15 to 17 Year Olds | 0 (0.0%) | 0 (0.0%) |
| 18 to 19 Year Olds | 0 (0.0%) | 0 (0.0%) |
| 20 to 24 Year Olds | 0 (0.0%) | 0 (0.0%) |
| 25 to 34 Year Olds | 1 (100.0%) | 0 (0.0%) |
| 35 Years and over | 0 (0.0%) | 0 (0.0%) |
| Total | 15 (100.0%) | 0 (0.0%) |
Educational Attainment by Field of Study in Midway
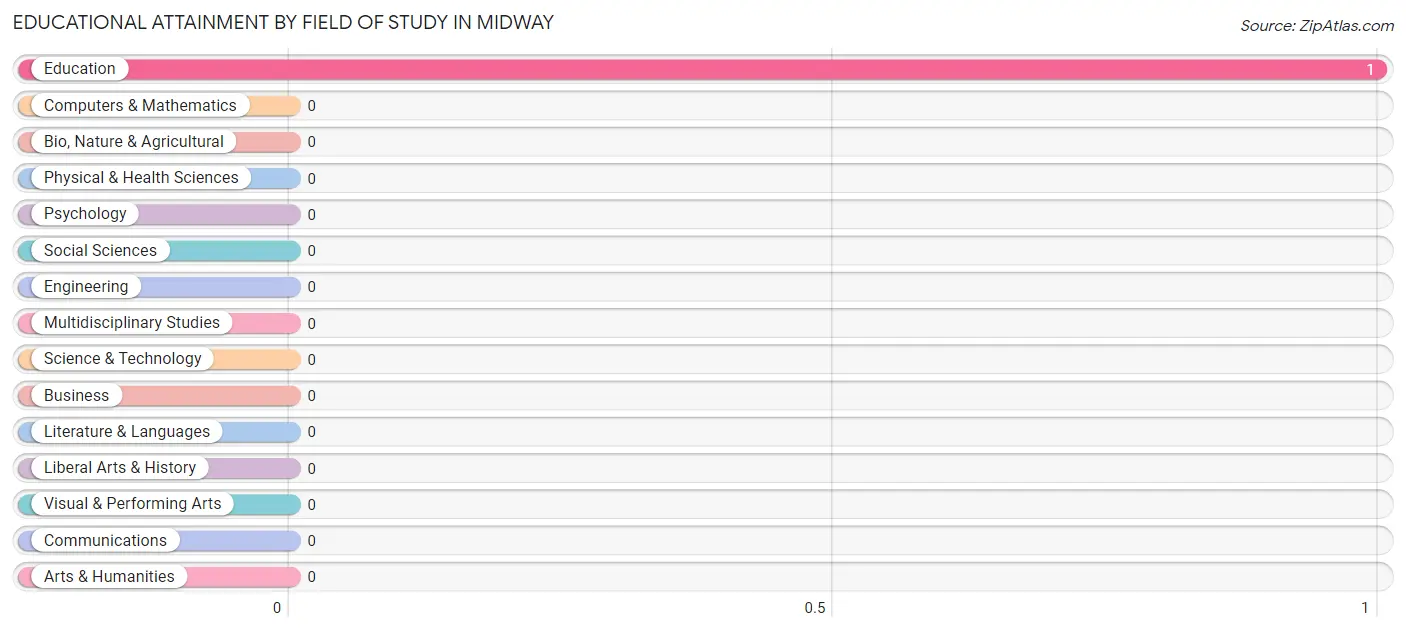
, and education (1 | 100.0%) are the most common fields of study among 1 individuals in Midway who have obtained a bachelor's degree or higher.
| Field of Study | # Graduates | % Graduates |
| Computers & Mathematics | 0 | 0.0% |
| Bio, Nature & Agricultural | 0 | 0.0% |
| Physical & Health Sciences | 0 | 0.0% |
| Psychology | 0 | 0.0% |
| Social Sciences | 0 | 0.0% |
| Engineering | 0 | 0.0% |
| Multidisciplinary Studies | 0 | 0.0% |
| Science & Technology | 0 | 0.0% |
| Business | 0 | 0.0% |
| Education | 1 | 100.0% |
| Literature & Languages | 0 | 0.0% |
| Liberal Arts & History | 0 | 0.0% |
| Visual & Performing Arts | 0 | 0.0% |
| Communications | 0 | 0.0% |
| Arts & Humanities | 0 | 0.0% |
| Total | 1 | 100.0% |
Transportation & Commute in Midway
Vehicle Availability by Sex in Midway
The most prevalent vehicle ownership categories in Midway are males with 1 vehicle (4, accounting for 80.0%) and females with 1 vehicle (1, making up 200.0%).
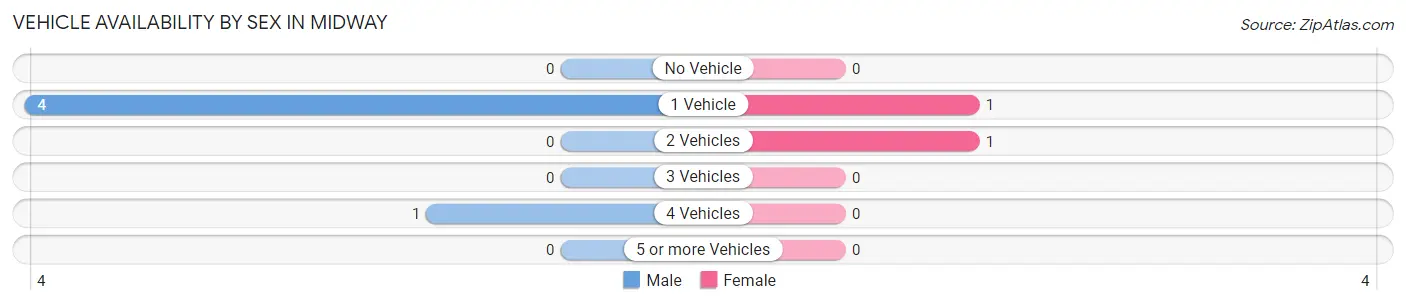
| Vehicles Available | Male | Female |
| No Vehicle | 0 (0.0%) | 0 (0.0%) |
| 1 Vehicle | 4 (80.0%) | 1 (50.0%) |
| 2 Vehicles | 0 (0.0%) | 1 (50.0%) |
| 3 Vehicles | 0 (0.0%) | 0 (0.0%) |
| 4 Vehicles | 1 (20.0%) | 0 (0.0%) |
| 5 or more Vehicles | 0 (0.0%) | 0 (0.0%) |
| Total | 5 (100.0%) | 2 (100.0%) |
Commute Time in Midway
The most frequently occuring commute durations in Midway are 10 to 14 minutes (5 commuters, 71.4%), 20 to 24 minutes (1 commuters, 14.3%), and 90 or more minutes (1 commuters, 14.3%).
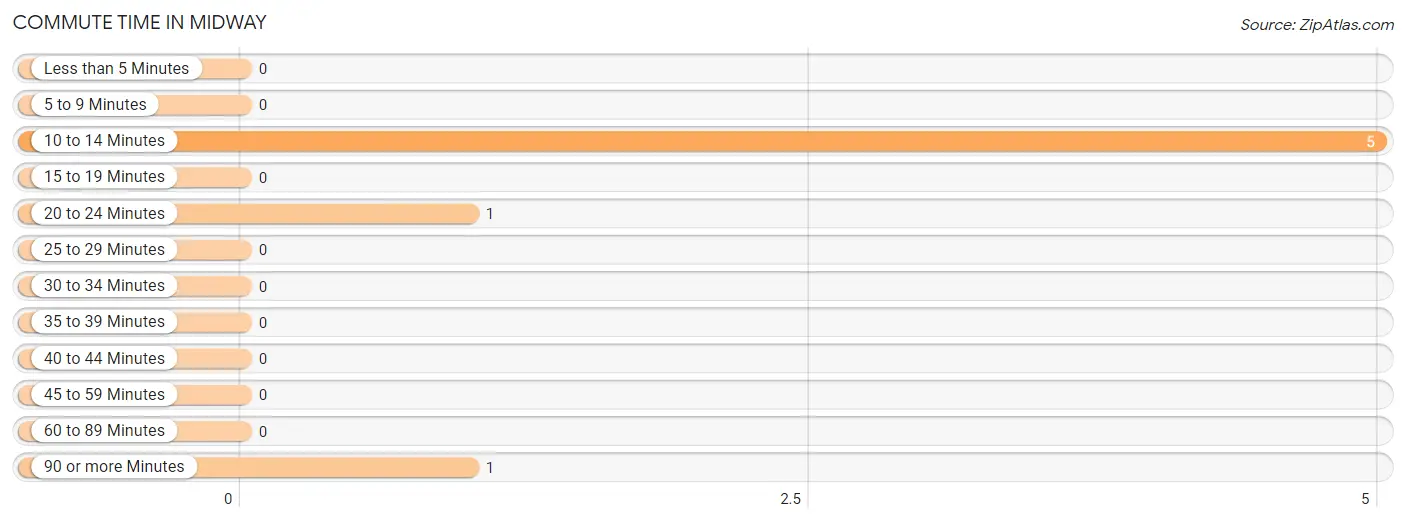
| Commute Time | # Commuters | % Commuters |
| Less than 5 Minutes | 0 | 0.0% |
| 5 to 9 Minutes | 0 | 0.0% |
| 10 to 14 Minutes | 5 | 71.4% |
| 15 to 19 Minutes | 0 | 0.0% |
| 20 to 24 Minutes | 1 | 14.3% |
| 25 to 29 Minutes | 0 | 0.0% |
| 30 to 34 Minutes | 0 | 0.0% |
| 35 to 39 Minutes | 0 | 0.0% |
| 40 to 44 Minutes | 0 | 0.0% |
| 45 to 59 Minutes | 0 | 0.0% |
| 60 to 89 Minutes | 0 | 0.0% |
| 90 or more Minutes | 1 | 14.3% |
Commute Time by Sex in Midway
The most common commute times in Midway are 10 to 14 minutes (4 commuters, 80.0%) for males and 10 to 14 minutes (1 commuters, 50.0%) for females.
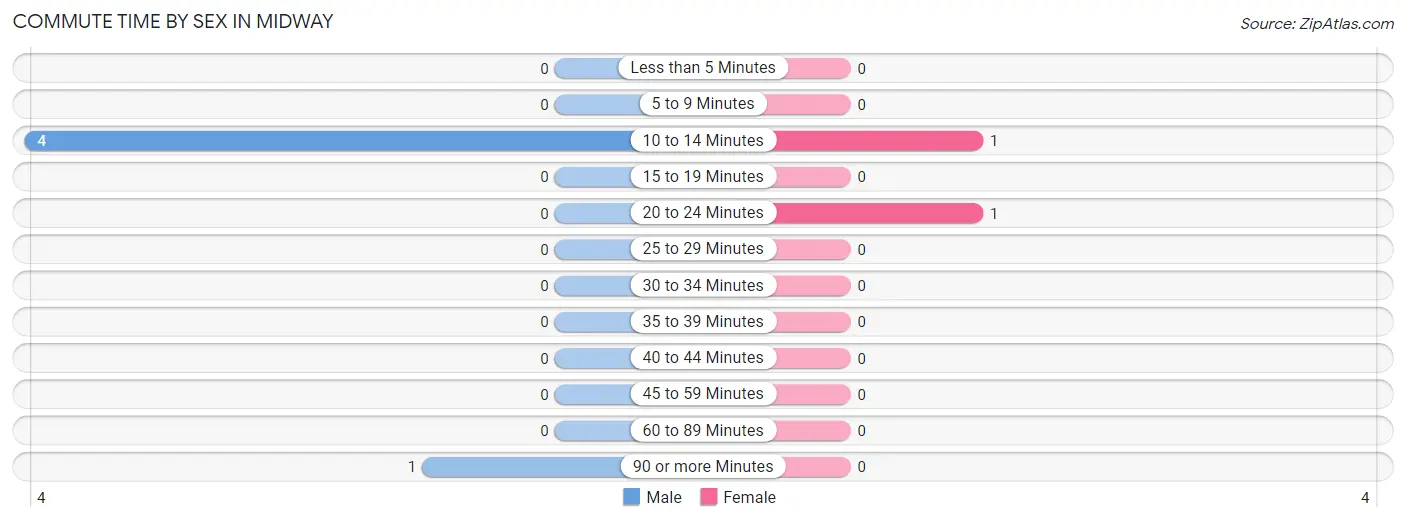
| Commute Time | Male | Female |
| Less than 5 Minutes | 0 (0.0%) | 0 (0.0%) |
| 5 to 9 Minutes | 0 (0.0%) | 0 (0.0%) |
| 10 to 14 Minutes | 4 (80.0%) | 1 (50.0%) |
| 15 to 19 Minutes | 0 (0.0%) | 0 (0.0%) |
| 20 to 24 Minutes | 0 (0.0%) | 1 (50.0%) |
| 25 to 29 Minutes | 0 (0.0%) | 0 (0.0%) |
| 30 to 34 Minutes | 0 (0.0%) | 0 (0.0%) |
| 35 to 39 Minutes | 0 (0.0%) | 0 (0.0%) |
| 40 to 44 Minutes | 0 (0.0%) | 0 (0.0%) |
| 45 to 59 Minutes | 0 (0.0%) | 0 (0.0%) |
| 60 to 89 Minutes | 0 (0.0%) | 0 (0.0%) |
| 90 or more Minutes | 1 (20.0%) | 0 (0.0%) |
Time of Departure to Work by Sex in Midway
The most frequent times of departure to work in Midway are 6:30 AM to 6:59 AM (3, 60.0%) for males and 6:30 AM to 6:59 AM (1, 50.0%) for females.
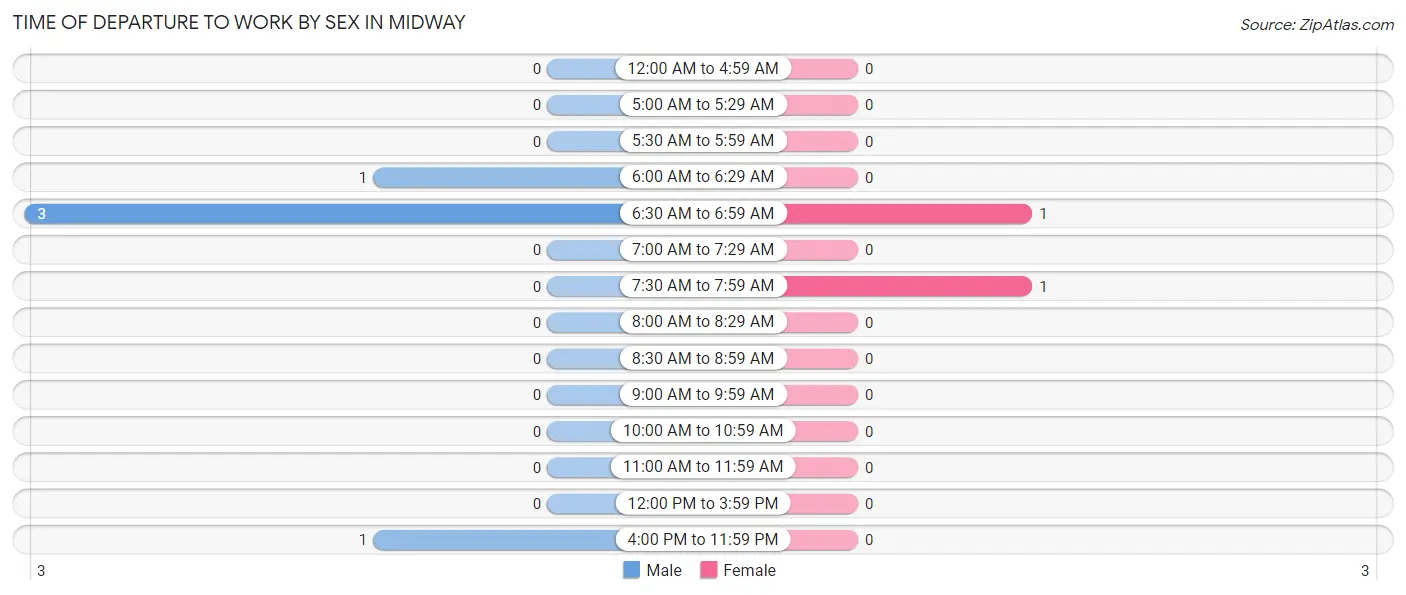
| Time of Departure | Male | Female |
| 12:00 AM to 4:59 AM | 0 (0.0%) | 0 (0.0%) |
| 5:00 AM to 5:29 AM | 0 (0.0%) | 0 (0.0%) |
| 5:30 AM to 5:59 AM | 0 (0.0%) | 0 (0.0%) |
| 6:00 AM to 6:29 AM | 1 (20.0%) | 0 (0.0%) |
| 6:30 AM to 6:59 AM | 3 (60.0%) | 1 (50.0%) |
| 7:00 AM to 7:29 AM | 0 (0.0%) | 0 (0.0%) |
| 7:30 AM to 7:59 AM | 0 (0.0%) | 1 (50.0%) |
| 8:00 AM to 8:29 AM | 0 (0.0%) | 0 (0.0%) |
| 8:30 AM to 8:59 AM | 0 (0.0%) | 0 (0.0%) |
| 9:00 AM to 9:59 AM | 0 (0.0%) | 0 (0.0%) |
| 10:00 AM to 10:59 AM | 0 (0.0%) | 0 (0.0%) |
| 11:00 AM to 11:59 AM | 0 (0.0%) | 0 (0.0%) |
| 12:00 PM to 3:59 PM | 0 (0.0%) | 0 (0.0%) |
| 4:00 PM to 11:59 PM | 1 (20.0%) | 0 (0.0%) |
| Total | 5 (100.0%) | 2 (100.0%) |
Housing Occupancy in Midway
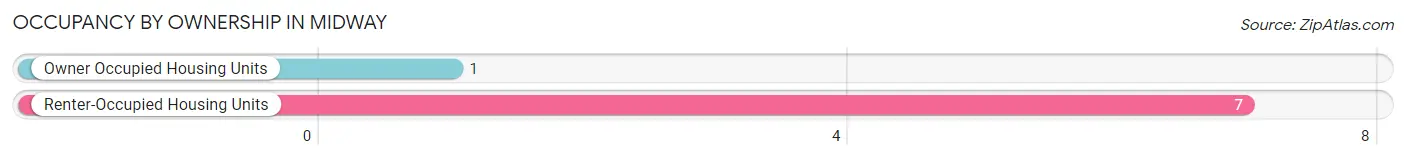
Occupancy by Ownership in Midway
Of the total 8 dwellings in Midway, owner-occupied units account for 1 (12.5%), while renter-occupied units make up 7 (87.5%).
| Occupancy | # Housing Units | % Housing Units |
| Owner Occupied Housing Units | 1 | 12.5% |
| Renter-Occupied Housing Units | 7 | 87.5% |
| Total Occupied Housing Units | 8 | 100.0% |
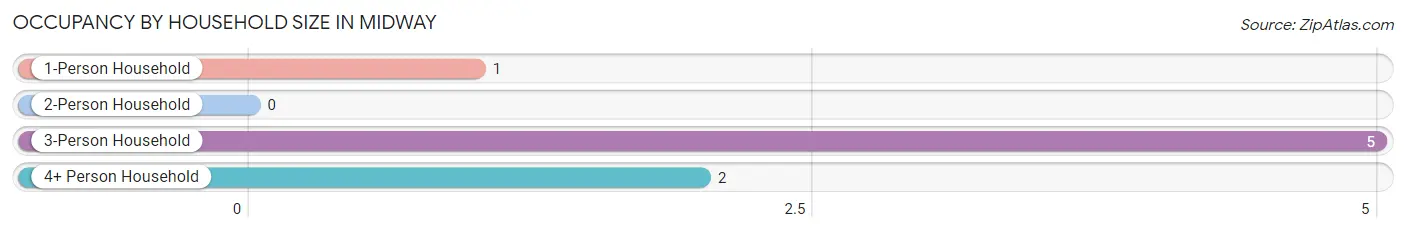
Occupancy by Household Size in Midway
| Household Size | # Housing Units | % Housing Units |
| 1-Person Household | 1 | 12.5% |
| 2-Person Household | 0 | 0.0% |
| 3-Person Household | 5 | 62.5% |
| 4+ Person Household | 2 | 25.0% |
| Total Housing Units | 8 | 100.0% |
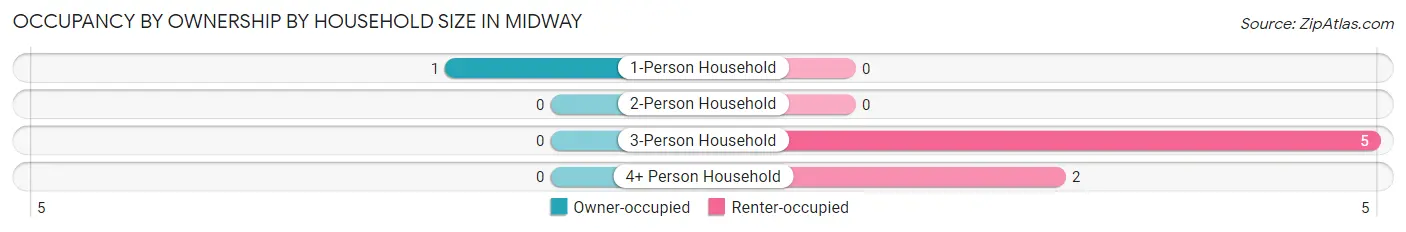
Occupancy by Ownership by Household Size in Midway
| Household Size | Owner-occupied | Renter-occupied |
| 1-Person Household | 1 (100.0%) | 0 (0.0%) |
| 2-Person Household | 0 (0.0%) | 0 (0.0%) |
| 3-Person Household | 0 (0.0%) | 5 (100.0%) |
| 4+ Person Household | 0 (0.0%) | 2 (100.0%) |
| Total Housing Units | 1 (12.5%) | 7 (87.5%) |
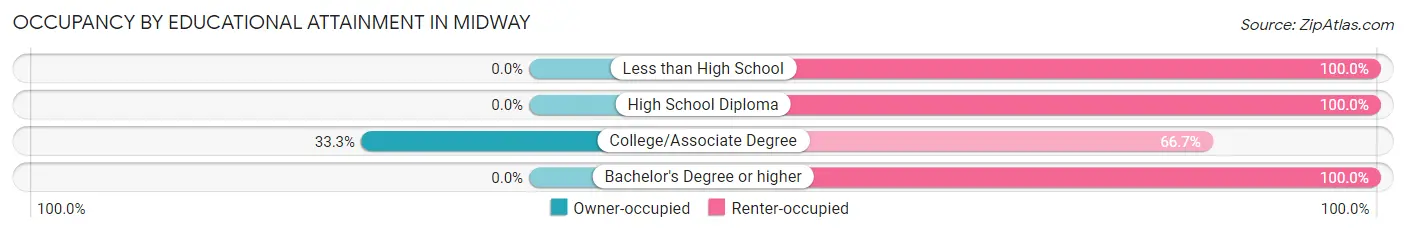
Occupancy by Educational Attainment in Midway
| Household Size | Owner-occupied | Renter-occupied |
| Less than High School | 0 (0.0%) | 1 (100.0%) |
| High School Diploma | 0 (0.0%) | 3 (100.0%) |
| College/Associate Degree | 1 (33.3%) | 2 (66.7%) |
| Bachelor's Degree or higher | 0 (0.0%) | 1 (100.0%) |
Occupancy by Age of Householder in Midway
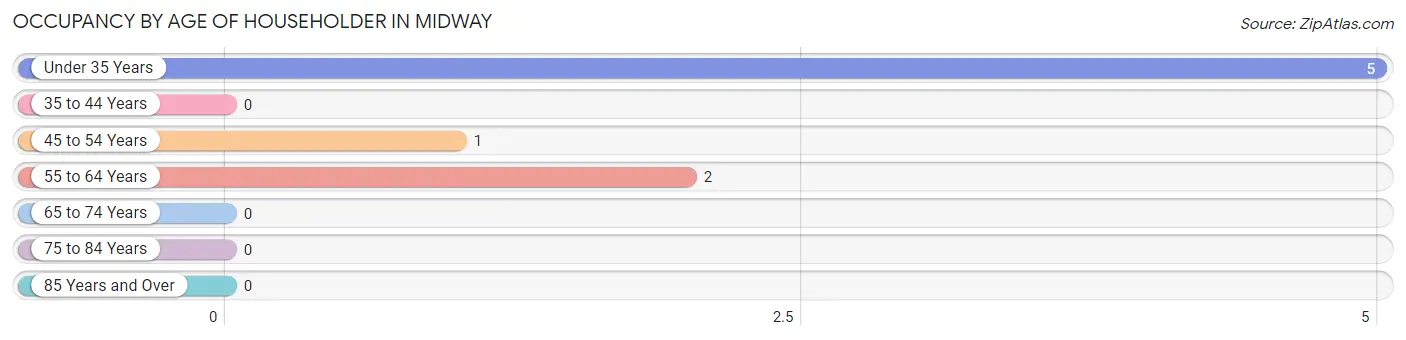
| Age Bracket | # Households | % Households |
| Under 35 Years | 5 | 62.5% |
| 35 to 44 Years | 0 | 0.0% |
| 45 to 54 Years | 1 | 12.5% |
| 55 to 64 Years | 2 | 25.0% |
| 65 to 74 Years | 0 | 0.0% |
| 75 to 84 Years | 0 | 0.0% |
| 85 Years and Over | 0 | 0.0% |
| Total | 8 | 100.0% |
Housing Finances in Midway
Median Income by Occupancy in Midway
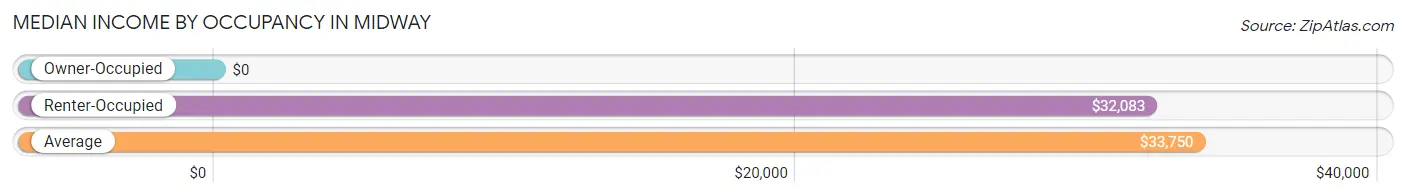
| Occupancy Type | # Households | Median Income |
| Owner-Occupied | 1 (12.5%) | $0 |
| Renter-Occupied | 7 (87.5%) | $32,083 |
| Average | 8 (100.0%) | $33,750 |
Occupancy by Householder Income Bracket in Midway
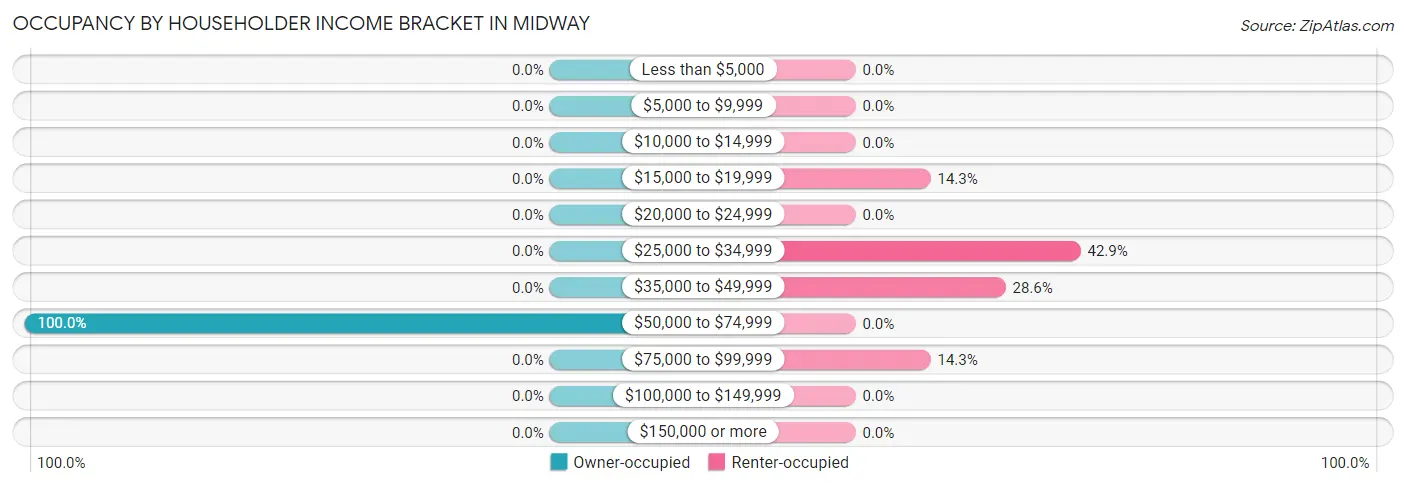
| Income Bracket | Owner-occupied | Renter-occupied |
| Less than $5,000 | 0 (0.0%) | 0 (0.0%) |
| $5,000 to $9,999 | 0 (0.0%) | 0 (0.0%) |
| $10,000 to $14,999 | 0 (0.0%) | 0 (0.0%) |
| $15,000 to $19,999 | 0 (0.0%) | 1 (14.3%) |
| $20,000 to $24,999 | 0 (0.0%) | 0 (0.0%) |
| $25,000 to $34,999 | 0 (0.0%) | 3 (42.9%) |
| $35,000 to $49,999 | 0 (0.0%) | 2 (28.6%) |
| $50,000 to $74,999 | 1 (100.0%) | 0 (0.0%) |
| $75,000 to $99,999 | 0 (0.0%) | 1 (14.3%) |
| $100,000 to $149,999 | 0 (0.0%) | 0 (0.0%) |
| $150,000 or more | 0 (0.0%) | 0 (0.0%) |
| Total | 1 (100.0%) | 7 (100.0%) |
Monthly Housing Cost Tiers in Midway
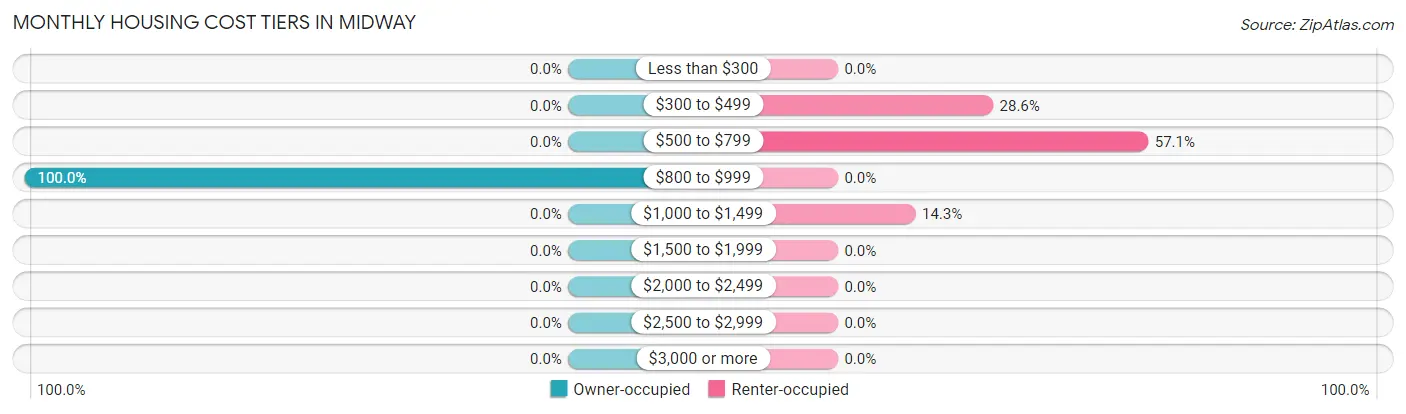
| Monthly Cost | Owner-occupied | Renter-occupied |
| Less than $300 | 0 (0.0%) | 0 (0.0%) |
| $300 to $499 | 0 (0.0%) | 2 (28.6%) |
| $500 to $799 | 0 (0.0%) | 4 (57.1%) |
| $800 to $999 | 1 (100.0%) | 0 (0.0%) |
| $1,000 to $1,499 | 0 (0.0%) | 1 (14.3%) |
| $1,500 to $1,999 | 0 (0.0%) | 0 (0.0%) |
| $2,000 to $2,499 | 0 (0.0%) | 0 (0.0%) |
| $2,500 to $2,999 | 0 (0.0%) | 0 (0.0%) |
| $3,000 or more | 0 (0.0%) | 0 (0.0%) |
| Total | 1 (100.0%) | 7 (100.0%) |
Physical Housing Characteristics in Midway
Housing Structures in Midway
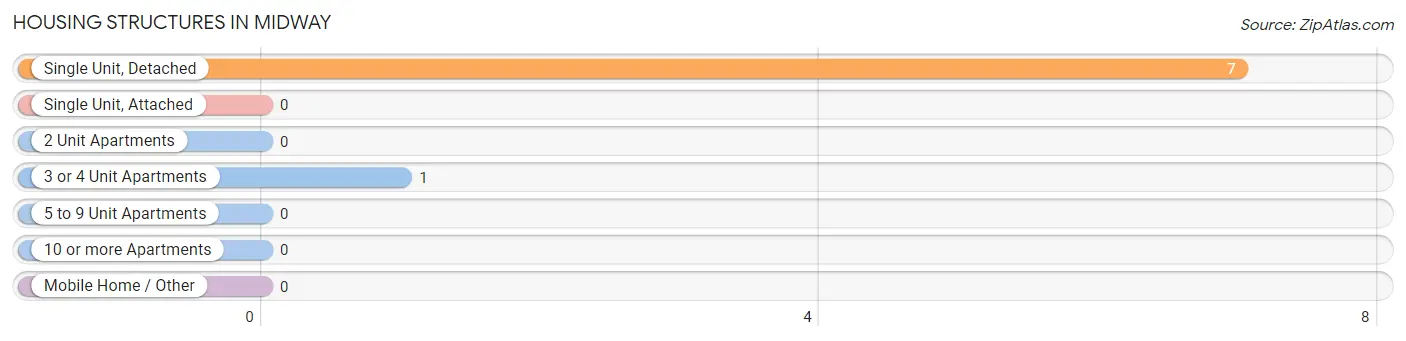
| Structure Type | # Housing Units | % Housing Units |
| Single Unit, Detached | 7 | 87.5% |
| Single Unit, Attached | 0 | 0.0% |
| 2 Unit Apartments | 0 | 0.0% |
| 3 or 4 Unit Apartments | 1 | 12.5% |
| 5 to 9 Unit Apartments | 0 | 0.0% |
| 10 or more Apartments | 0 | 0.0% |
| Mobile Home / Other | 0 | 0.0% |
| Total | 8 | 100.0% |
Housing Structures by Occupancy in Midway
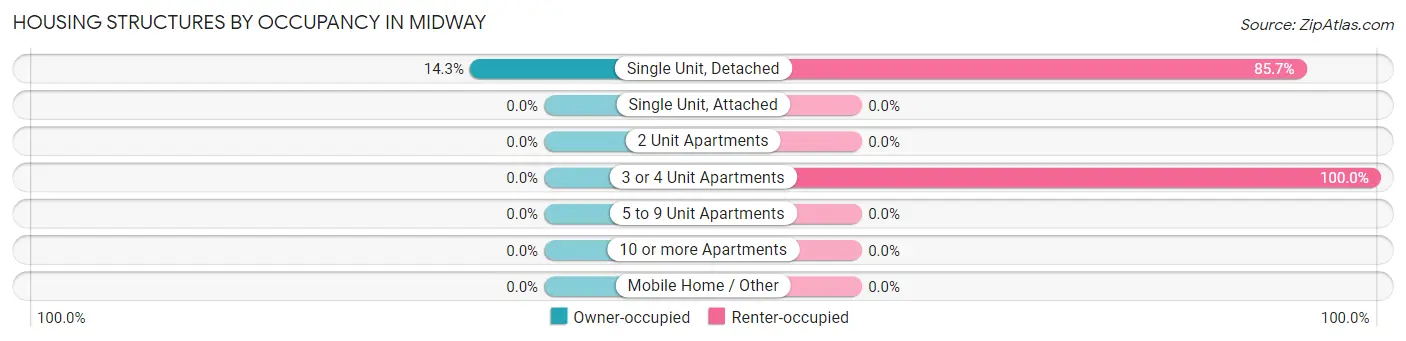
| Structure Type | Owner-occupied | Renter-occupied |
| Single Unit, Detached | 1 (14.3%) | 6 (85.7%) |
| Single Unit, Attached | 0 (0.0%) | 0 (0.0%) |
| 2 Unit Apartments | 0 (0.0%) | 0 (0.0%) |
| 3 or 4 Unit Apartments | 0 (0.0%) | 1 (100.0%) |
| 5 to 9 Unit Apartments | 0 (0.0%) | 0 (0.0%) |
| 10 or more Apartments | 0 (0.0%) | 0 (0.0%) |
| Mobile Home / Other | 0 (0.0%) | 0 (0.0%) |
| Total | 1 (12.5%) | 7 (87.5%) |
Housing Structures by Number of Rooms in Midway
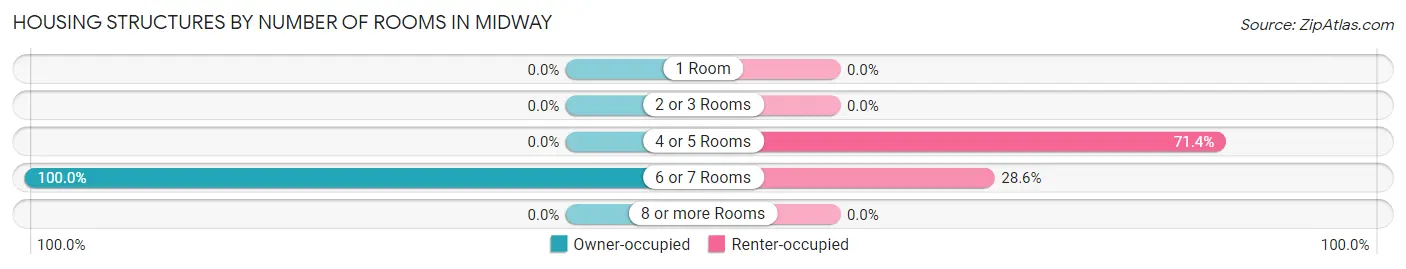
| Number of Rooms | Owner-occupied | Renter-occupied |
| 1 Room | 0 (0.0%) | 0 (0.0%) |
| 2 or 3 Rooms | 0 (0.0%) | 0 (0.0%) |
| 4 or 5 Rooms | 0 (0.0%) | 5 (71.4%) |
| 6 or 7 Rooms | 1 (100.0%) | 2 (28.6%) |
| 8 or more Rooms | 0 (0.0%) | 0 (0.0%) |
| Total | 1 (100.0%) | 7 (100.0%) |
Housing Structure by Heating Type in Midway
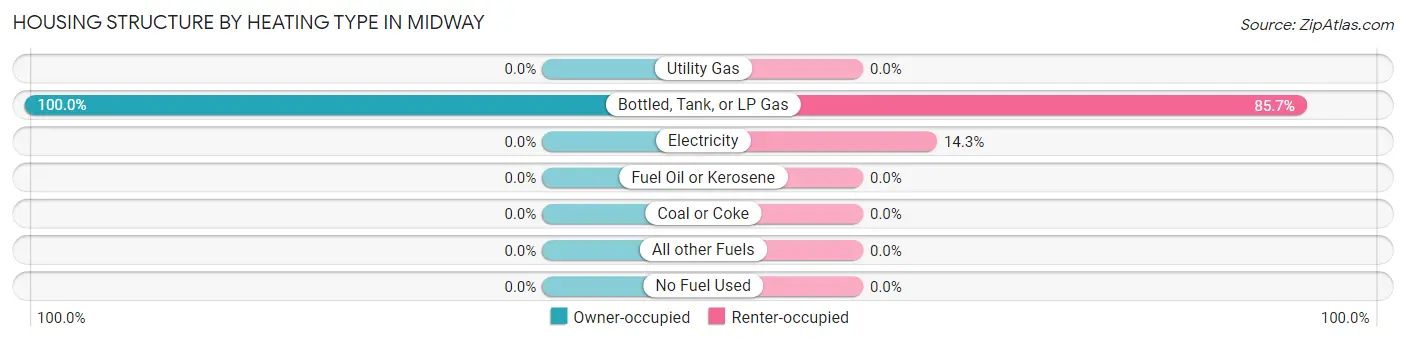
| Heating Type | Owner-occupied | Renter-occupied |
| Utility Gas | 0 (0.0%) | 0 (0.0%) |
| Bottled, Tank, or LP Gas | 1 (100.0%) | 6 (85.7%) |
| Electricity | 0 (0.0%) | 1 (14.3%) |
| Fuel Oil or Kerosene | 0 (0.0%) | 0 (0.0%) |
| Coal or Coke | 0 (0.0%) | 0 (0.0%) |
| All other Fuels | 0 (0.0%) | 0 (0.0%) |
| No Fuel Used | 0 (0.0%) | 0 (0.0%) |
| Total | 1 (100.0%) | 7 (100.0%) |
Household Vehicle Usage in Midway
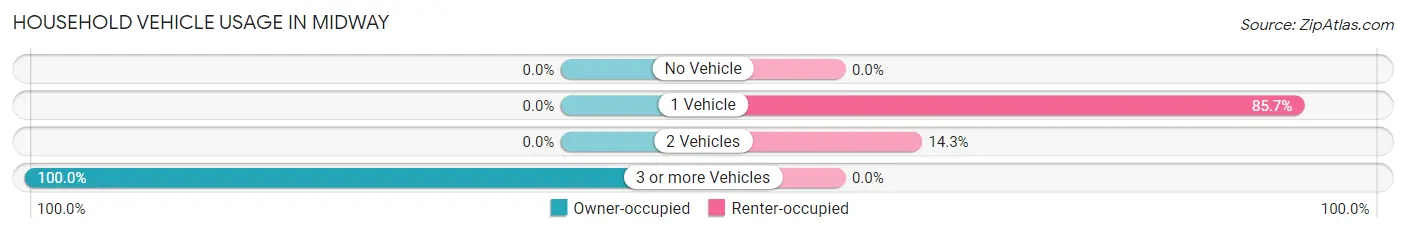
| Vehicles per Household | Owner-occupied | Renter-occupied |
| No Vehicle | 0 (0.0%) | 0 (0.0%) |
| 1 Vehicle | 0 (0.0%) | 6 (85.7%) |
| 2 Vehicles | 0 (0.0%) | 1 (14.3%) |
| 3 or more Vehicles | 1 (100.0%) | 0 (0.0%) |
| Total | 1 (100.0%) | 7 (100.0%) |
Real Estate & Mortgages in Midway
Real Estate and Mortgage Overview in Midway
| Characteristic | Without Mortgage | With Mortgage |
| Housing Units | 1 | 0 |
| Median Property Value | - | - |
| Median Household Income | - | - |
| Monthly Housing Costs | - | - |
| Real Estate Taxes | - | - |
Property Value by Mortgage Status in Midway
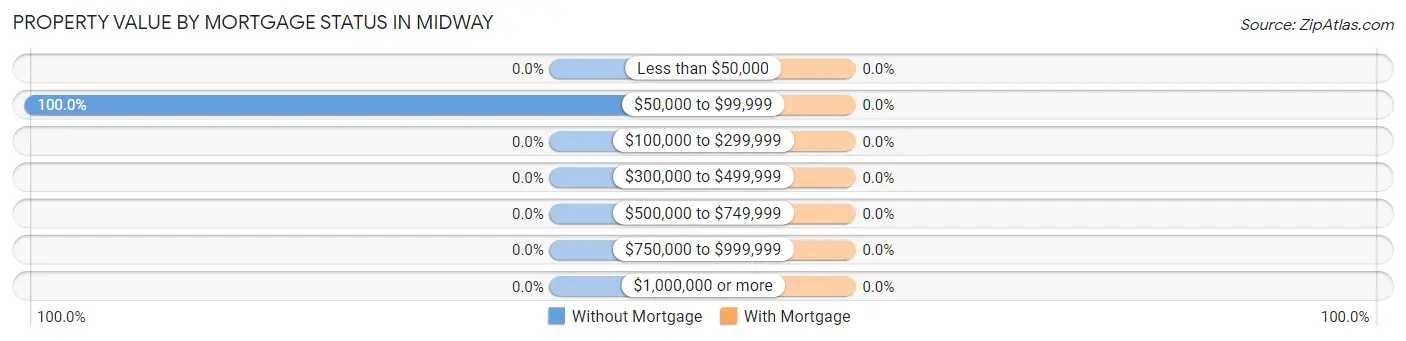
| Property Value | Without Mortgage | With Mortgage |
| Less than $50,000 | 0 (0.0%) | 0 (0.0%) |
| $50,000 to $99,999 | 1 (100.0%) | 0 (0.0%) |
| $100,000 to $299,999 | 0 (0.0%) | 0 (0.0%) |
| $300,000 to $499,999 | 0 (0.0%) | 0 (0.0%) |
| $500,000 to $749,999 | 0 (0.0%) | 0 (0.0%) |
| $750,000 to $999,999 | 0 (0.0%) | 0 (0.0%) |
| $1,000,000 or more | 0 (0.0%) | 0 (0.0%) |
| Total | 1 (100.0%) | 0 (0.0%) |
Household Income by Mortgage Status in Midway
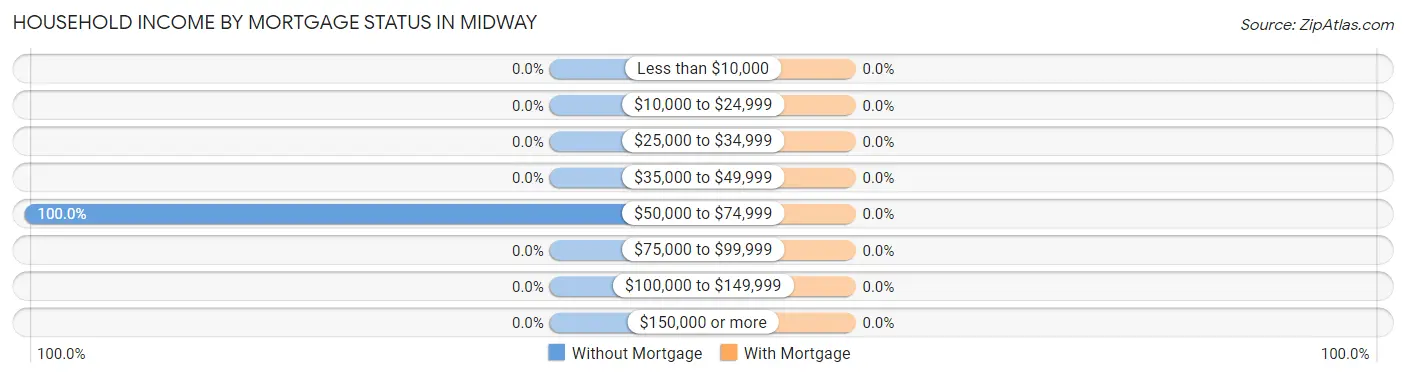
| Household Income | Without Mortgage | With Mortgage |
| Less than $10,000 | 0 (0.0%) | 0 (0.0%) |
| $10,000 to $24,999 | 0 (0.0%) | 0 (0.0%) |
| $25,000 to $34,999 | 0 (0.0%) | 0 (0.0%) |
| $35,000 to $49,999 | 0 (0.0%) | 0 (0.0%) |
| $50,000 to $74,999 | 1 (100.0%) | 0 (0.0%) |
| $75,000 to $99,999 | 0 (0.0%) | 0 (0.0%) |
| $100,000 to $149,999 | 0 (0.0%) | 0 (0.0%) |
| $150,000 or more | 0 (0.0%) | 0 (0.0%) |
| Total | 1 (100.0%) | 0 (0.0%) |
Property Value to Household Income Ratio in Midway

| Value-to-Income Ratio | Without Mortgage | With Mortgage |
| Less than 2.0x | 1 (100.0%) | 0 (0.0%) |
| 2.0x to 2.9x | 0 (0.0%) | 0 (0.0%) |
| 3.0x to 3.9x | 0 (0.0%) | 0 (0.0%) |
| 4.0x or more | 0 (0.0%) | 0 (0.0%) |
| Total | 1 (100.0%) | 0 (0.0%) |
Real Estate Taxes by Mortgage Status in Midway
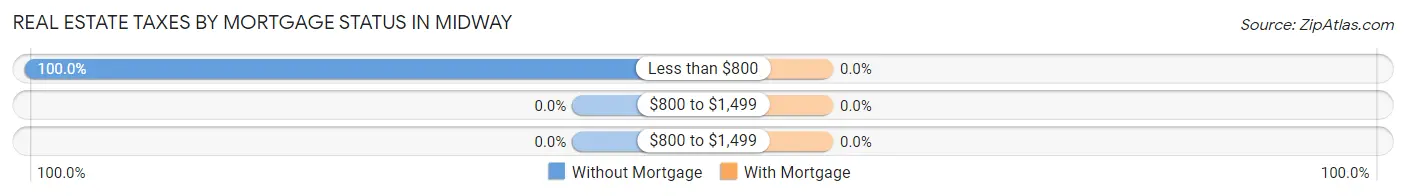
| Property Taxes | Without Mortgage | With Mortgage |
| Less than $800 | 1 (100.0%) | 0 (0.0%) |
| $800 to $1,499 | 0 (0.0%) | 0 (0.0%) |
| $800 to $1,499 | 0 (0.0%) | 0 (0.0%) |
| Total | 1 (100.0%) | 0 (0.0%) |
Health & Disability in Midway
Health Insurance Coverage by Age in Midway
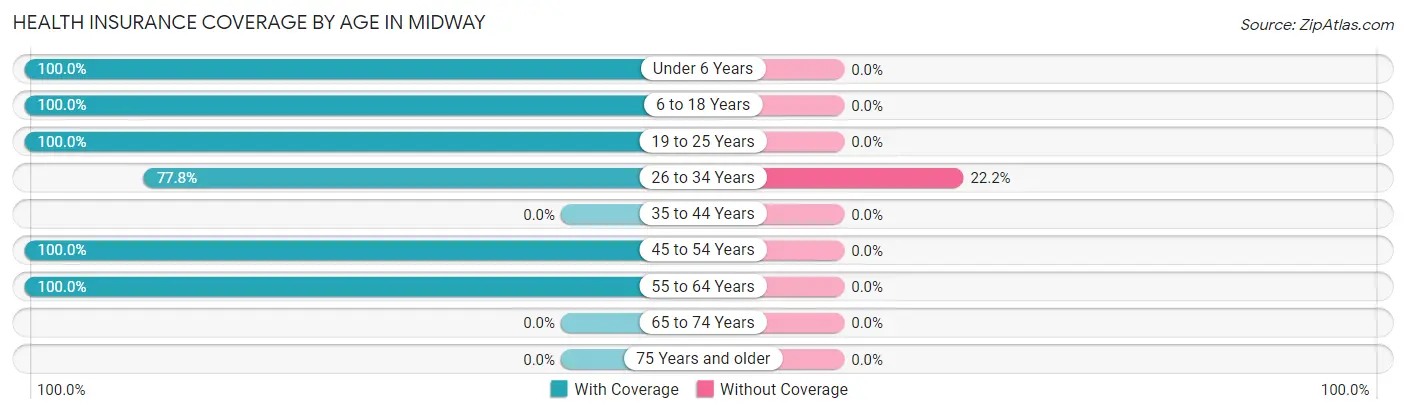
| Age Bracket | With Coverage | Without Coverage |
| Under 6 Years | 5 (100.0%) | 0 (0.0%) |
| 6 to 18 Years | 12 (100.0%) | 0 (0.0%) |
| 19 to 25 Years | 2 (100.0%) | 0 (0.0%) |
| 26 to 34 Years | 7 (77.8%) | 2 (22.2%) |
| 35 to 44 Years | 0 (0.0%) | 0 (0.0%) |
| 45 to 54 Years | 2 (100.0%) | 0 (0.0%) |
| 55 to 64 Years | 2 (100.0%) | 0 (0.0%) |
| 65 to 74 Years | 0 (0.0%) | 0 (0.0%) |
| 75 Years and older | 0 (0.0%) | 0 (0.0%) |
| Total | 30 (93.8%) | 2 (6.2%) |
Health Insurance Coverage by Citizenship Status in Midway
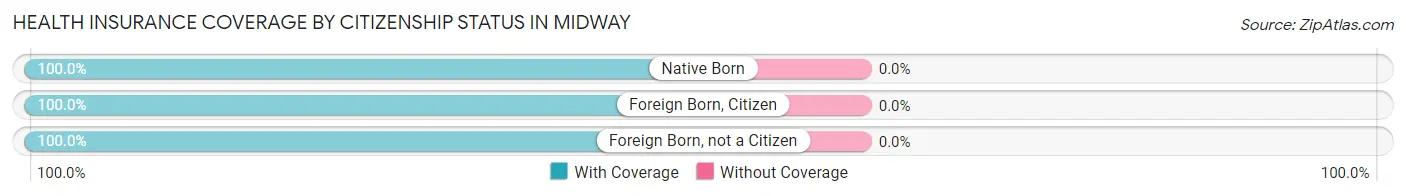
| Citizenship Status | With Coverage | Without Coverage |
| Native Born | 5 (100.0%) | 0 (0.0%) |
| Foreign Born, Citizen | 12 (100.0%) | 0 (0.0%) |
| Foreign Born, not a Citizen | 2 (100.0%) | 0 (0.0%) |
Health Insurance Coverage by Household Income in Midway
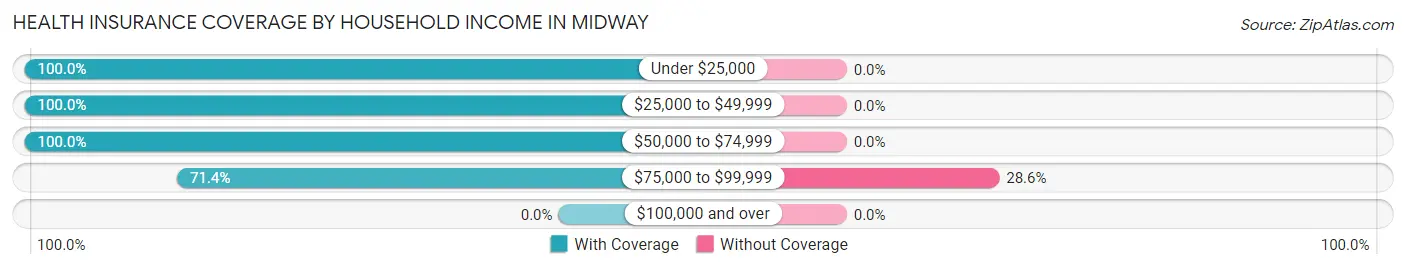
| Household Income | With Coverage | Without Coverage |
| Under $25,000 | 5 (100.0%) | 0 (0.0%) |
| $25,000 to $49,999 | 19 (100.0%) | 0 (0.0%) |
| $50,000 to $74,999 | 1 (100.0%) | 0 (0.0%) |
| $75,000 to $99,999 | 5 (71.4%) | 2 (28.6%) |
| $100,000 and over | 0 (0.0%) | 0 (0.0%) |
Public vs Private Health Insurance Coverage by Age in Midway
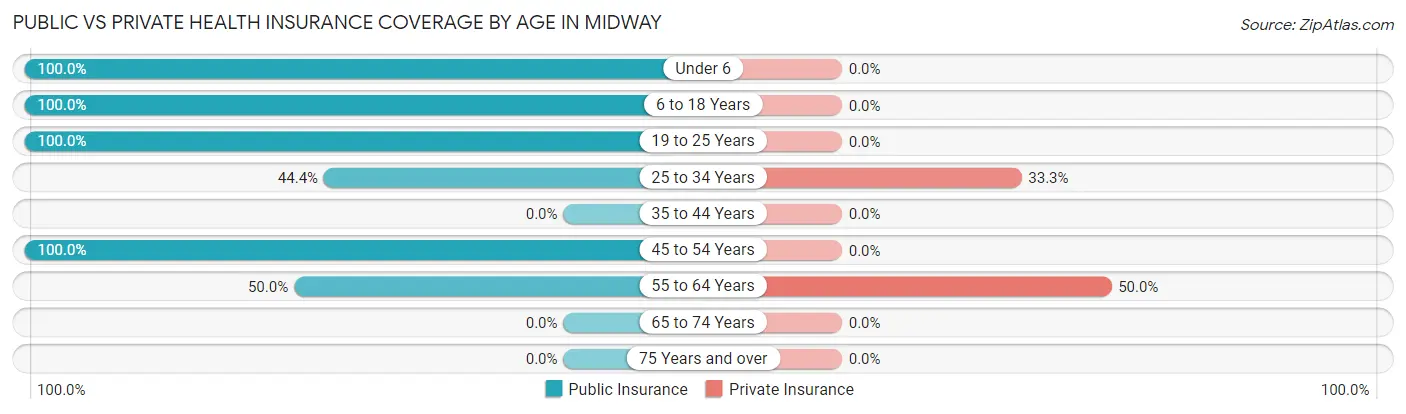
| Age Bracket | Public Insurance | Private Insurance |
| Under 6 | 5 (100.0%) | 0 (0.0%) |
| 6 to 18 Years | 12 (100.0%) | 0 (0.0%) |
| 19 to 25 Years | 2 (100.0%) | 0 (0.0%) |
| 25 to 34 Years | 4 (44.4%) | 3 (33.3%) |
| 35 to 44 Years | 0 (0.0%) | 0 (0.0%) |
| 45 to 54 Years | 2 (100.0%) | 0 (0.0%) |
| 55 to 64 Years | 1 (50.0%) | 1 (50.0%) |
| 65 to 74 Years | 0 (0.0%) | 0 (0.0%) |
| 75 Years and over | 0 (0.0%) | 0 (0.0%) |
| Total | 26 (81.2%) | 4 (12.5%) |
Disability Status by Sex by Age in Midway
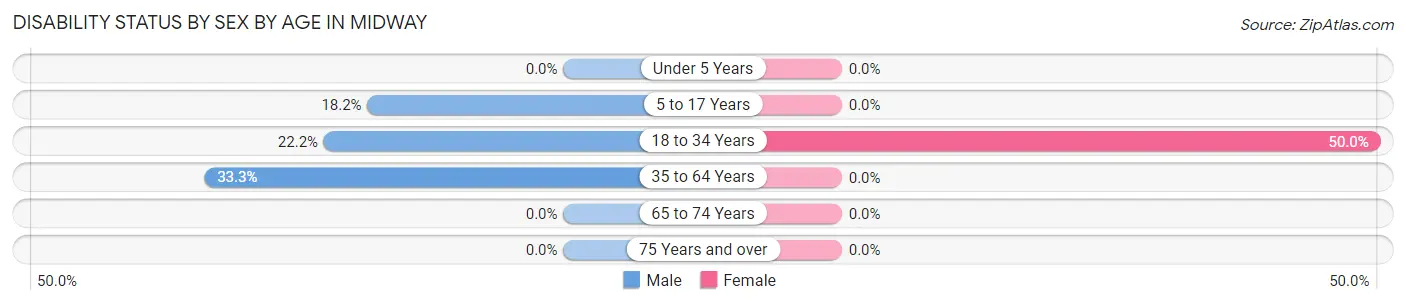
| Age Bracket | Male | Female |
| Under 5 Years | 0 (0.0%) | 0 (0.0%) |
| 5 to 17 Years | 2 (18.2%) | 0 (0.0%) |
| 18 to 34 Years | 2 (22.2%) | 1 (50.0%) |
| 35 to 64 Years | 1 (33.3%) | 0 (0.0%) |
| 65 to 74 Years | 0 (0.0%) | 0 (0.0%) |
| 75 Years and over | 0 (0.0%) | 0 (0.0%) |
Disability Class by Sex by Age in Midway
Disability Class: Hearing Difficulty
| Age Bracket | Male | Female |
| Under 5 Years | 0 (0.0%) | 0 (0.0%) |
| 5 to 17 Years | 0 (0.0%) | 0 (0.0%) |
| 18 to 34 Years | 0 (0.0%) | 0 (0.0%) |
| 35 to 64 Years | 0 (0.0%) | 0 (0.0%) |
| 65 to 74 Years | 0 (0.0%) | 0 (0.0%) |
| 75 Years and over | 0 (0.0%) | 0 (0.0%) |
Disability Class: Vision Difficulty
| Age Bracket | Male | Female |
| Under 5 Years | 0 (0.0%) | 0 (0.0%) |
| 5 to 17 Years | 0 (0.0%) | 0 (0.0%) |
| 18 to 34 Years | 0 (0.0%) | 0 (0.0%) |
| 35 to 64 Years | 0 (0.0%) | 0 (0.0%) |
| 65 to 74 Years | 0 (0.0%) | 0 (0.0%) |
| 75 Years and over | 0 (0.0%) | 0 (0.0%) |
Disability Class: Cognitive Difficulty
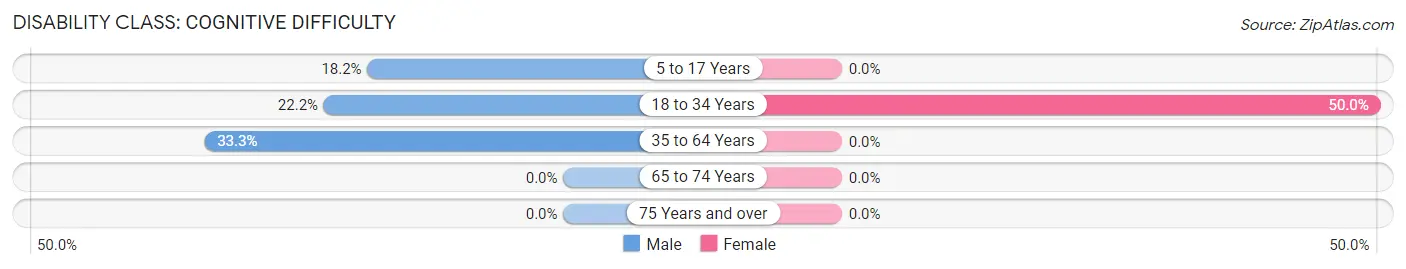
| Age Bracket | Male | Female |
| 5 to 17 Years | 2 (18.2%) | 0 (0.0%) |
| 18 to 34 Years | 2 (22.2%) | 1 (50.0%) |
| 35 to 64 Years | 1 (33.3%) | 0 (0.0%) |
| 65 to 74 Years | 0 (0.0%) | 0 (0.0%) |
| 75 Years and over | 0 (0.0%) | 0 (0.0%) |
Disability Class: Ambulatory Difficulty
| Age Bracket | Male | Female |
| 5 to 17 Years | 0 (0.0%) | 0 (0.0%) |
| 18 to 34 Years | 0 (0.0%) | 0 (0.0%) |
| 35 to 64 Years | 0 (0.0%) | 0 (0.0%) |
| 65 to 74 Years | 0 (0.0%) | 0 (0.0%) |
| 75 Years and over | 0 (0.0%) | 0 (0.0%) |
Disability Class: Self-Care Difficulty
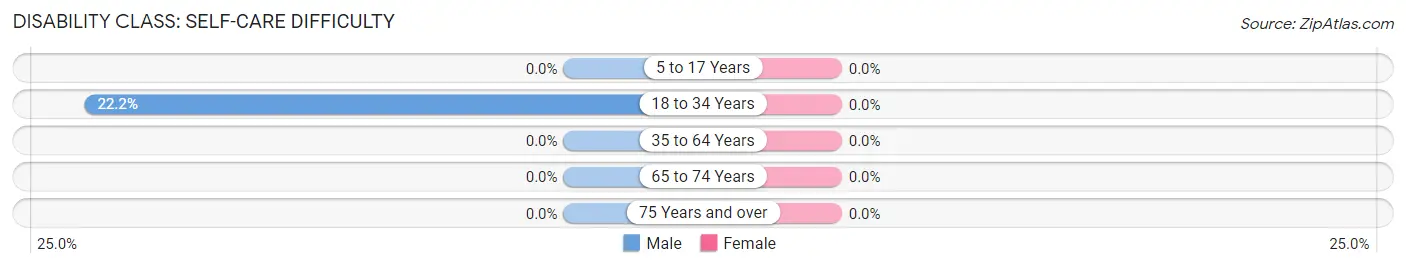
| Age Bracket | Male | Female |
| 5 to 17 Years | 0 (0.0%) | 0 (0.0%) |
| 18 to 34 Years | 2 (22.2%) | 0 (0.0%) |
| 35 to 64 Years | 0 (0.0%) | 0 (0.0%) |
| 65 to 74 Years | 0 (0.0%) | 0 (0.0%) |
| 75 Years and over | 0 (0.0%) | 0 (0.0%) |
Technology Access in Midway
Computing Device Access in Midway
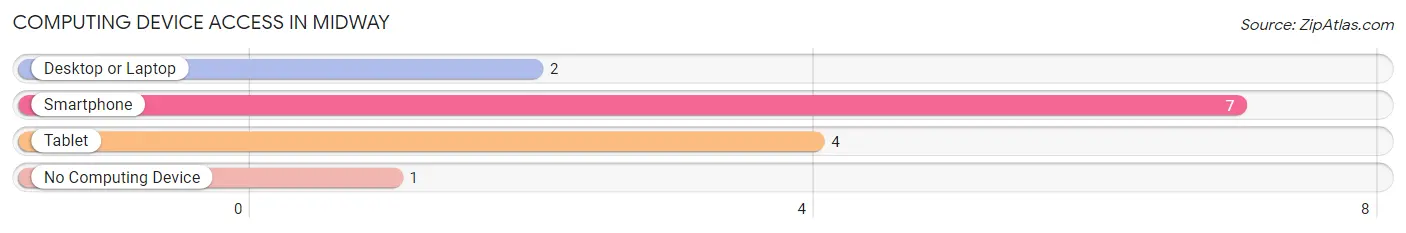
| Device Type | # Households | % Households |
| Desktop or Laptop | 2 | 25.0% |
| Smartphone | 7 | 87.5% |
| Tablet | 4 | 50.0% |
| No Computing Device | 1 | 12.5% |
| Total | 8 | 100.0% |
Internet Access in Midway
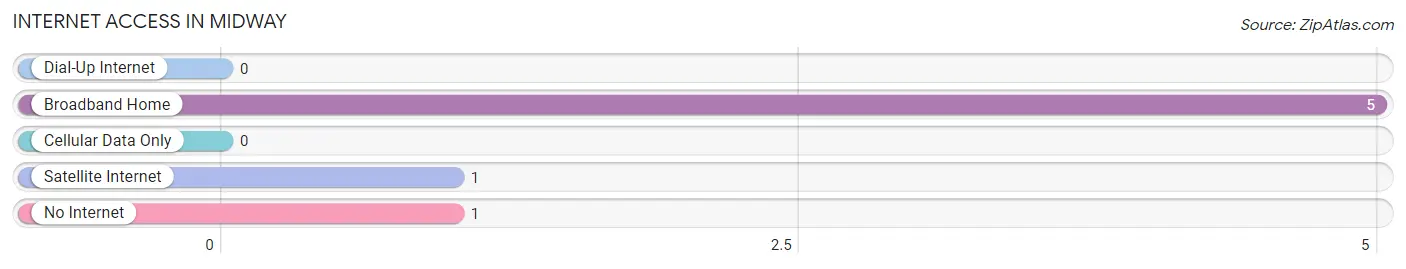
| Internet Type | # Households | % Households |
| Dial-Up Internet | 0 | 0.0% |
| Broadband Home | 5 | 62.5% |
| Cellular Data Only | 0 | 0.0% |
| Satellite Internet | 1 | 12.5% |
| No Internet | 1 | 12.5% |
| Total | 8 | 100.0% |
Midway Summary
Midway, Minnesota is a small city located in the southeastern corner of the state, just north of the Twin Cities metropolitan area. It is part of Washington County and is situated along the banks of the Mississippi River. The city has a population of just over 4,000 people and is known for its small-town charm and rural atmosphere.
History
Midway was first settled in 1854 by a group of German immigrants who were looking for a place to call home. The city was originally known as “Midway Station” due to its location between St. Paul and Stillwater. The name was later changed to “Midway” in 1856.
The city was officially incorporated in 1858 and quickly grew in population and size. By the late 1800s, Midway had become a thriving community with a variety of businesses, including a flour mill, a sawmill, a brickyard, and a brewery.
In the early 1900s, Midway experienced a period of growth and prosperity. The city was home to several large factories, including a paper mill, a canning factory, and a furniture factory. The city also had a thriving agricultural industry, with many farmers growing corn, wheat, and other crops.
By the mid-1900s, Midway had become a popular tourist destination. The city was home to several resorts, including the Midway Hotel and the Midway Inn. The city also had a variety of attractions, including a golf course, a movie theater, and a bowling alley.
Geography
Midway is located in the southeastern corner of Minnesota, just north of the Twin Cities metropolitan area. The city is situated along the banks of the Mississippi River and is surrounded by rolling hills and farmland. The city has a total area of 4.2 square miles, with 0.2 square miles of water.
The city has a humid continental climate, with hot summers and cold winters. The average temperature in the summer is around 75 degrees Fahrenheit, while the average temperature in the winter is around 20 degrees Fahrenheit.
Economy
Midway’s economy is largely based on agriculture and tourism. The city is home to several large farms, which produce corn, wheat, and other crops. The city also has a thriving tourism industry, with many visitors coming to the city to enjoy its small-town charm and rural atmosphere.
The city is also home to several small businesses, including restaurants, shops, and other services. The city also has a variety of manufacturing businesses, including a paper mill, a canning factory, and a furniture factory.
Demographics
As of the 2010 census, Midway had a population of 4,072 people. The racial makeup of the city was 97.2% White, 0.7% African American, 0.3% Native American, 0.3% Asian, 0.1% Pacific Islander, 0.4% from other races, and 1.1% from two or more races. Hispanic or Latino of any race were 1.3% of the population.
The median household income in Midway was $50,938, and the median family income was $60,938. The per capita income for the city was $25,938. About 5.2% of families and 7.2% of the population were below the poverty line, including 8.3% of those under age 18 and 5.2% of those age 65 or over.
Common Questions
What is Per Capita Income in Midway?
Per Capita income in Midway is $11,694.
What is the Median Family Income in Midway?
Median Family Income in Midway is $31,250.
What is the Median Household income in Midway?
Median Household Income in Midway is $33,750.
What is Inequality or Gini Index in Midway?
Inequality or Gini Index in Midway is 0.26.
What is the Total Population of Midway?
Total Population of Midway is 32.
What is the Total Male Population of Midway?
Total Male Population of Midway is 24.
What is the Total Female Population of Midway?
Total Female Population of Midway is 8.
What is the Ratio of Males per 100 Females in Midway?
There are 300.00 Males per 100 Females in Midway.
What is the Ratio of Females per 100 Males in Midway?
There are 33.33 Females per 100 Males in Midway.
What is the Median Population Age in Midway?
Median Population Age in Midway is 13.7 Years.
What is the Average Family Size in Midway
Average Family Size in Midway is 4.1 People.
What is the Average Household Size in Midway
Average Household Size in Midway is 4.0 People.
How Large is the Labor Force in Midway?
There are 9 People in the Labor Forcein in Midway.
What is the Percentage of People in the Labor Force in Midway?
60.0% of People are in the Labor Force in Midway.
What is the Unemployment Rate in Midway?
Unemployment Rate in Midway is 22.2%.