Mendota, MN Map & Demographics
Mendota Map
Mendota Overview
$71,380
PER CAPITA INCOME
$131,250
AVG FAMILY INCOME
$104,375
AVG HOUSEHOLD INCOME
66.2%
WAGE / INCOME GAP [ % ]
33.8¢/ $1
WAGE / INCOME GAP [ $ ]
0.55
INEQUALITY / GINI INDEX
142
TOTAL POPULATION
66
MALE POPULATION
76
FEMALE POPULATION
86.84
MALES / 100 FEMALES
115.15
FEMALES / 100 MALES
40.5
MEDIAN AGE
3.1
AVG FAMILY SIZE
2.5
AVG HOUSEHOLD SIZE
75
LABOR FORCE [ PEOPLE ]
65.2%
PERCENT IN LABOR FORCE
4.1%
UNEMPLOYMENT RATE
Mendota Zip Codes
Income in Mendota
Income Overview in Mendota
Per Capita Income in Mendota is $71,380, while median incomes of families and households are $131,250 and $104,375 respectively.
| Characteristic | Number | Measure |
| Per Capita Income | 142 | $71,380 |
| Median Family Income | 36 | $131,250 |
| Mean Family Income | 36 | $215,517 |
| Median Household Income | 54 | $104,375 |
| Mean Household Income | 54 | $186,802 |
| Income Deficit | 36 | $0 |
| Wage / Income Gap (%) | 142 | 66.21% |
| Wage / Income Gap ($) | 142 | 33.79¢ per $1 |
| Gini / Inequality Index | 142 | 0.55 |
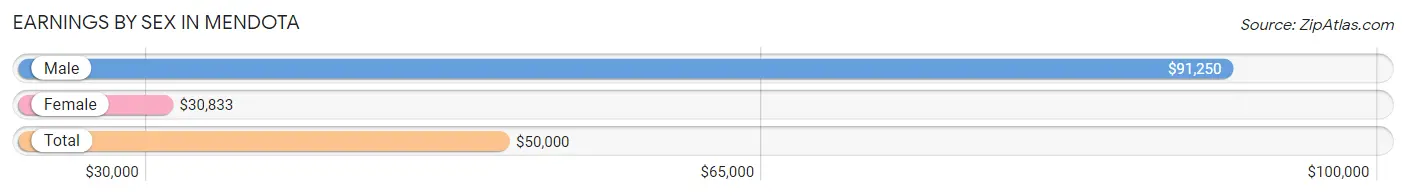
Earnings by Sex in Mendota
Average Earnings in Mendota are $50,000, $91,250 for men and $30,833 for women, a difference of 66.2%.
| Sex | Number | Average Earnings |
| Male | 40 (51.3%) | $91,250 |
| Female | 38 (48.7%) | $30,833 |
| Total | 78 (100.0%) | $50,000 |
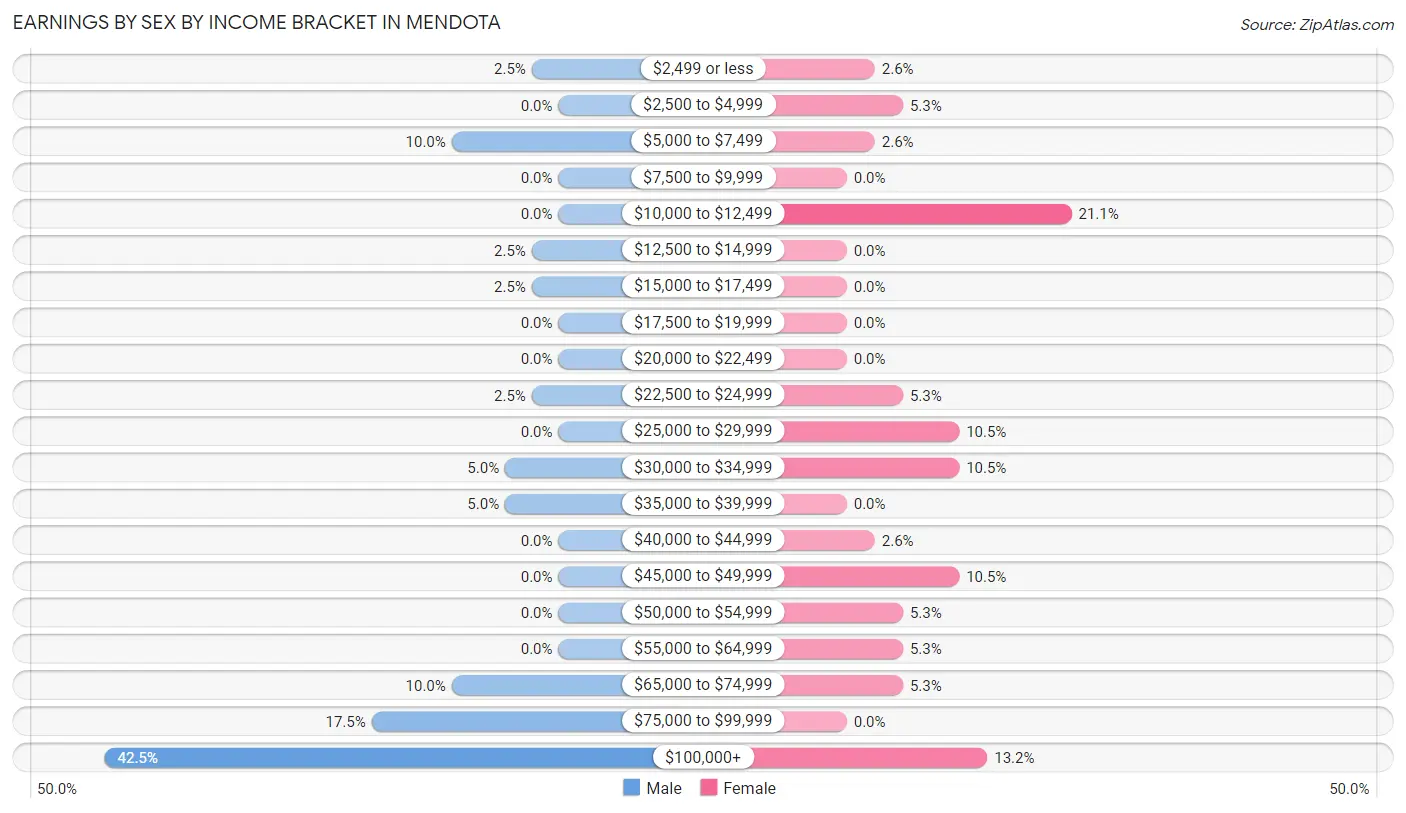
Earnings by Sex by Income Bracket in Mendota
The most common earnings brackets in Mendota are $100,000+ for men (17 | 42.5%) and $10,000 to $12,499 for women (8 | 21.0%).
| Income | Male | Female |
| $2,499 or less | 1 (2.5%) | 1 (2.6%) |
| $2,500 to $4,999 | 0 (0.0%) | 2 (5.3%) |
| $5,000 to $7,499 | 4 (10.0%) | 1 (2.6%) |
| $7,500 to $9,999 | 0 (0.0%) | 0 (0.0%) |
| $10,000 to $12,499 | 0 (0.0%) | 8 (21.0%) |
| $12,500 to $14,999 | 1 (2.5%) | 0 (0.0%) |
| $15,000 to $17,499 | 1 (2.5%) | 0 (0.0%) |
| $17,500 to $19,999 | 0 (0.0%) | 0 (0.0%) |
| $20,000 to $22,499 | 0 (0.0%) | 0 (0.0%) |
| $22,500 to $24,999 | 1 (2.5%) | 2 (5.3%) |
| $25,000 to $29,999 | 0 (0.0%) | 4 (10.5%) |
| $30,000 to $34,999 | 2 (5.0%) | 4 (10.5%) |
| $35,000 to $39,999 | 2 (5.0%) | 0 (0.0%) |
| $40,000 to $44,999 | 0 (0.0%) | 1 (2.6%) |
| $45,000 to $49,999 | 0 (0.0%) | 4 (10.5%) |
| $50,000 to $54,999 | 0 (0.0%) | 2 (5.3%) |
| $55,000 to $64,999 | 0 (0.0%) | 2 (5.3%) |
| $65,000 to $74,999 | 4 (10.0%) | 2 (5.3%) |
| $75,000 to $99,999 | 7 (17.5%) | 0 (0.0%) |
| $100,000+ | 17 (42.5%) | 5 (13.2%) |
| Total | 40 (100.0%) | 38 (100.0%) |
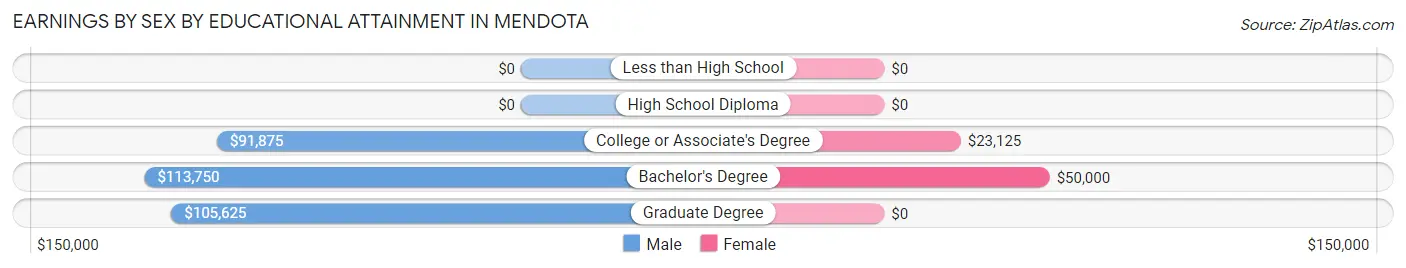
Earnings by Sex by Educational Attainment in Mendota
Average earnings in Mendota are $93,750 for men and $45,625 for women, a difference of 51.3%. Men with an educational attainment of bachelor's degree enjoy the highest average annual earnings of $113,750, while those with college or associate's degree education earn the least with $91,875. Women with an educational attainment of bachelor's degree earn the most with the average annual earnings of $50,000, while those with college or associate's degree education have the smallest earnings of $23,125.
| Educational Attainment | Male Income | Female Income |
| Less than High School | - | - |
| High School Diploma | - | - |
| College or Associate's Degree | $91,875 | $23,125 |
| Bachelor's Degree | $113,750 | $50,000 |
| Graduate Degree | $105,625 | $0 |
| Total | $93,750 | $45,625 |
Family Income in Mendota
Family Income Brackets in Mendota
According to the Mendota family income data, there are 10 families falling into the $100,000 to $149,999 income range, which is the most common income bracket and makes up 27.8% of all families.
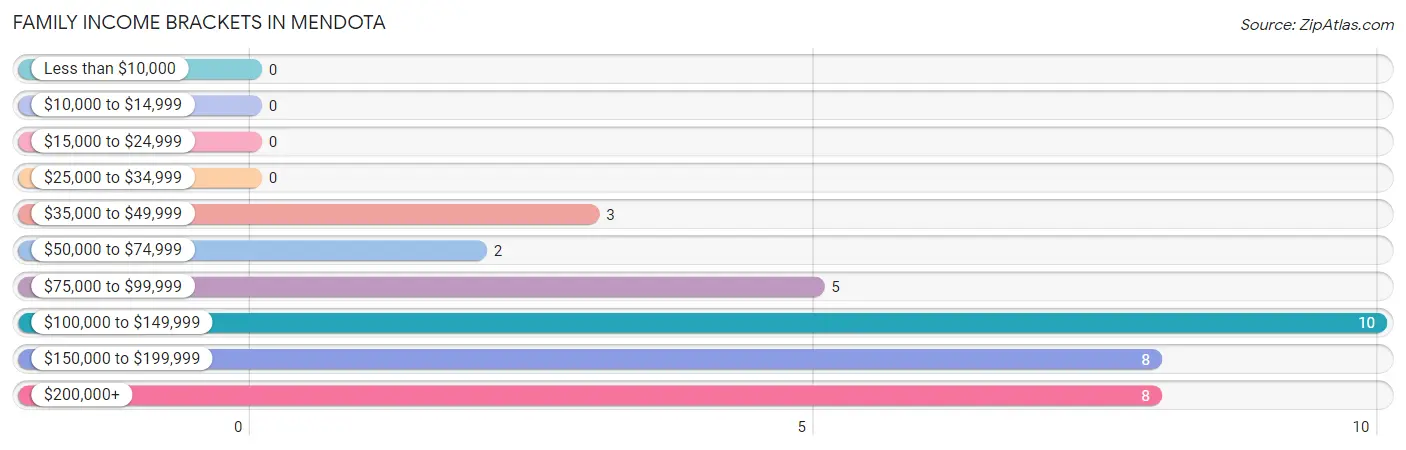
| Income Bracket | # Families | % Families |
| Less than $10,000 | 0 | 0.0% |
| $10,000 to $14,999 | 0 | 0.0% |
| $15,000 to $24,999 | 0 | 0.0% |
| $25,000 to $34,999 | 0 | 0.0% |
| $35,000 to $49,999 | 3 | 8.3% |
| $50,000 to $74,999 | 2 | 5.6% |
| $75,000 to $99,999 | 5 | 13.9% |
| $100,000 to $149,999 | 10 | 27.8% |
| $150,000 to $199,999 | 8 | 22.2% |
| $200,000+ | 8 | 22.2% |
Family Income by Famaliy Size in Mendota
4-person families (5 | 13.9%) account for the highest median family income in Mendota with $195,625 per family, while 3-person families (10 | 27.8%) have the highest median income of $59,583 per family member.
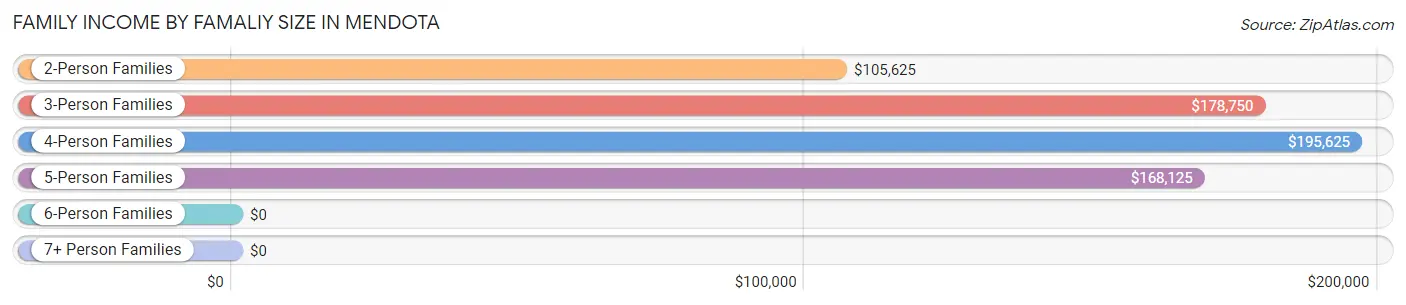
| Income Bracket | # Families | Median Income |
| 2-Person Families | 15 (41.7%) | $105,625 |
| 3-Person Families | 10 (27.8%) | $178,750 |
| 4-Person Families | 5 (13.9%) | $195,625 |
| 5-Person Families | 5 (13.9%) | $168,125 |
| 6-Person Families | 1 (2.8%) | $0 |
| 7+ Person Families | 0 (0.0%) | $0 |
| Total | 36 (100.0%) | $131,250 |
Family Income by Number of Earners in Mendota
The median family income in Mendota is $131,250, with families comprising 3+ earners (5) having the highest median family income of $195,625, while families with no earners (5) have the lowest median family income of $78,750, accounting for 13.9% and 13.9% of families, respectively.
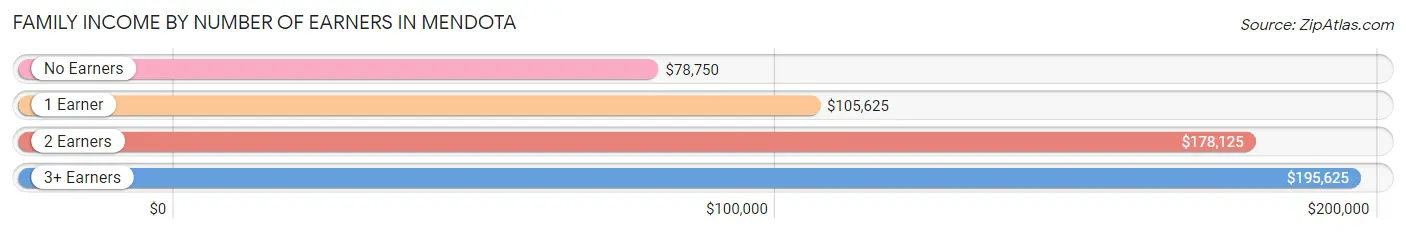
| Number of Earners | # Families | Median Income |
| No Earners | 5 (13.9%) | $78,750 |
| 1 Earner | 13 (36.1%) | $105,625 |
| 2 Earners | 13 (36.1%) | $178,125 |
| 3+ Earners | 5 (13.9%) | $195,625 |
| Total | 36 (100.0%) | $131,250 |
Household Income in Mendota
Household Income Brackets in Mendota
With 12 households falling in the category, the $100,000 to $149,999 income range is the most frequent in Mendota, accounting for 22.2% of all households.
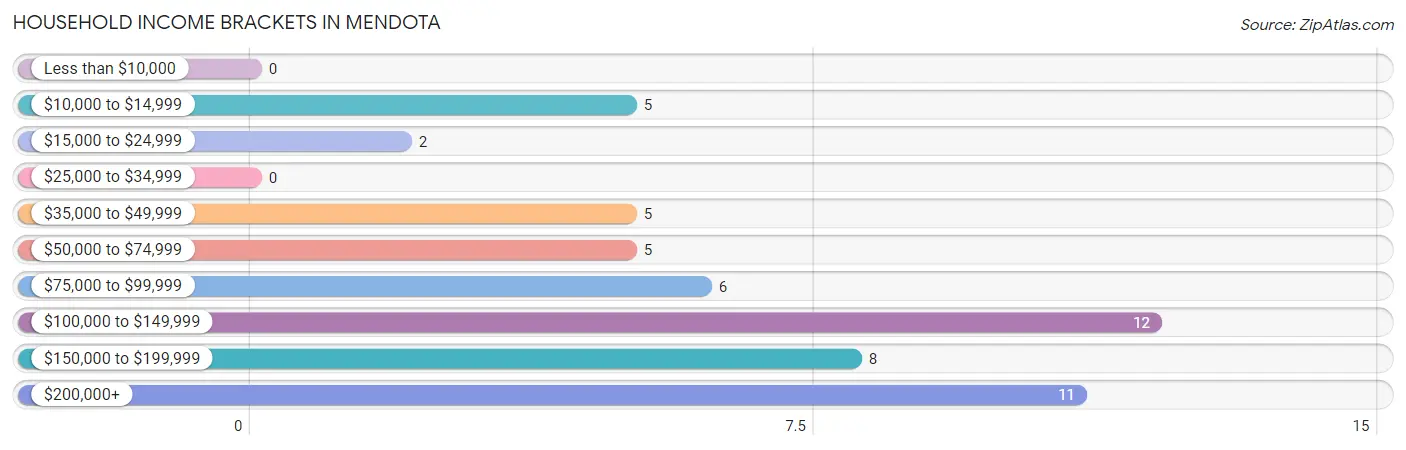
| Income Bracket | # Households | % Households |
| Less than $10,000 | 0 | 0.0% |
| $10,000 to $14,999 | 5 | 9.3% |
| $15,000 to $24,999 | 2 | 3.7% |
| $25,000 to $34,999 | 0 | 0.0% |
| $35,000 to $49,999 | 5 | 9.3% |
| $50,000 to $74,999 | 5 | 9.3% |
| $75,000 to $99,999 | 6 | 11.1% |
| $100,000 to $149,999 | 12 | 22.2% |
| $150,000 to $199,999 | 8 | 14.8% |
| $200,000+ | 11 | 20.4% |
Household Income by Householder Age in Mendota
The median household income in Mendota is $104,375, with the highest median household income of $178,125 found in the 45 to 64 years age bracket for the primary householder. A total of 25 households (46.3%) fall into this category.
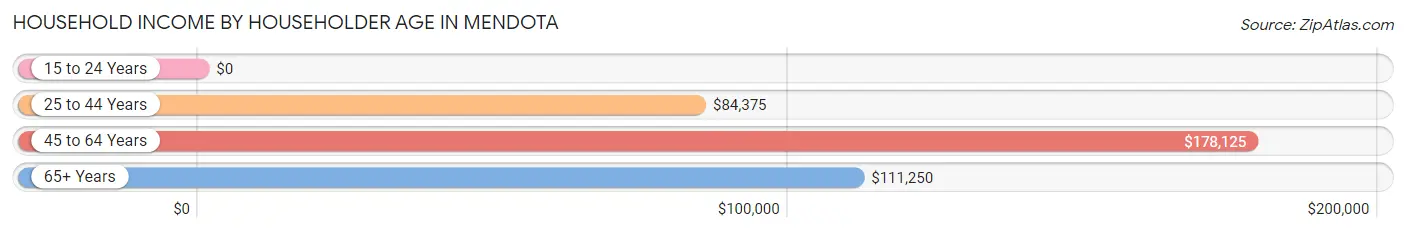
| Income Bracket | # Households | Median Income |
| 15 to 24 Years | 0 (0.0%) | $0 |
| 25 to 44 Years | 15 (27.8%) | $84,375 |
| 45 to 64 Years | 25 (46.3%) | $178,125 |
| 65+ Years | 14 (25.9%) | $111,250 |
| Total | 54 (100.0%) | $104,375 |
Poverty in Mendota
Income Below Poverty by Sex and Age in Mendota
With 15.1% poverty level for males and 2.6% for females among the residents of Mendota, 25 to 34 year old males and 18 to 24 year old females are the most vulnerable to poverty, with 7 males (53.8%) and 2 females (25.0%) in their respective age groups living below the poverty level.
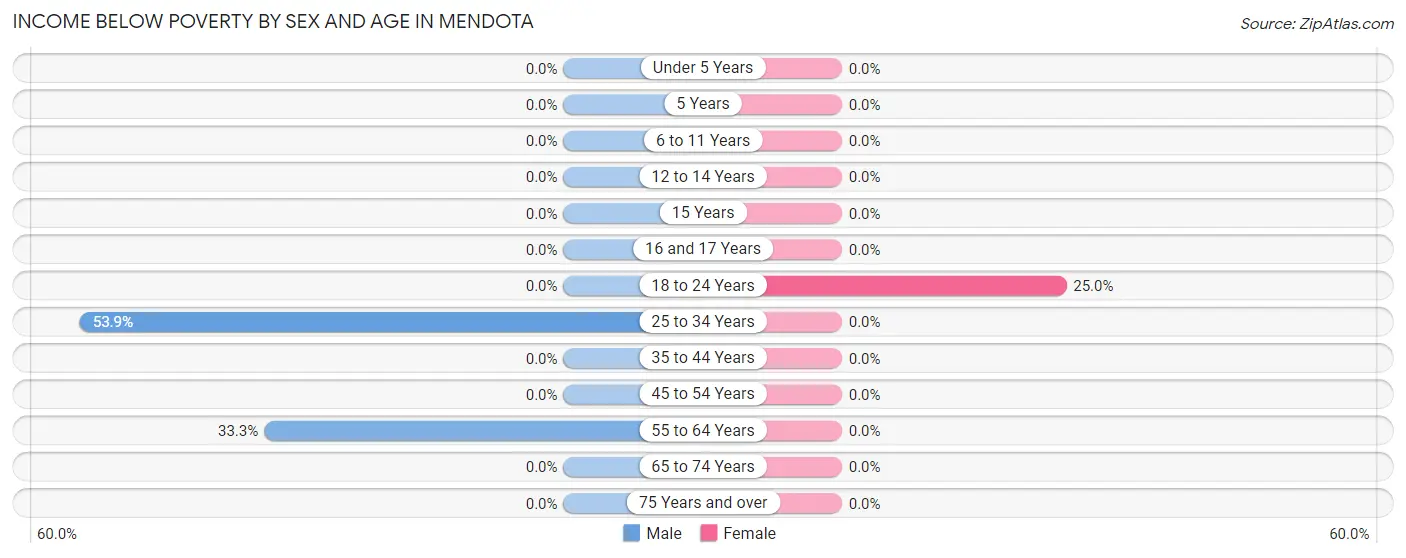
| Age Bracket | Male | Female |
| Under 5 Years | 0 (0.0%) | 0 (0.0%) |
| 5 Years | 0 (0.0%) | 0 (0.0%) |
| 6 to 11 Years | 0 (0.0%) | 0 (0.0%) |
| 12 to 14 Years | 0 (0.0%) | 0 (0.0%) |
| 15 Years | 0 (0.0%) | 0 (0.0%) |
| 16 and 17 Years | 0 (0.0%) | 0 (0.0%) |
| 18 to 24 Years | 0 (0.0%) | 2 (25.0%) |
| 25 to 34 Years | 7 (53.8%) | 0 (0.0%) |
| 35 to 44 Years | 0 (0.0%) | 0 (0.0%) |
| 45 to 54 Years | 0 (0.0%) | 0 (0.0%) |
| 55 to 64 Years | 3 (33.3%) | 0 (0.0%) |
| 65 to 74 Years | 0 (0.0%) | 0 (0.0%) |
| 75 Years and over | 0 (0.0%) | 0 (0.0%) |
| Total | 10 (15.1%) | 2 (2.6%) |
Income Above Poverty by Sex and Age in Mendota
According to the poverty statistics in Mendota, males aged under 5 years and females aged under 5 years are the age groups that are most secure financially, with 100.0% of males and 100.0% of females in these age groups living above the poverty line.
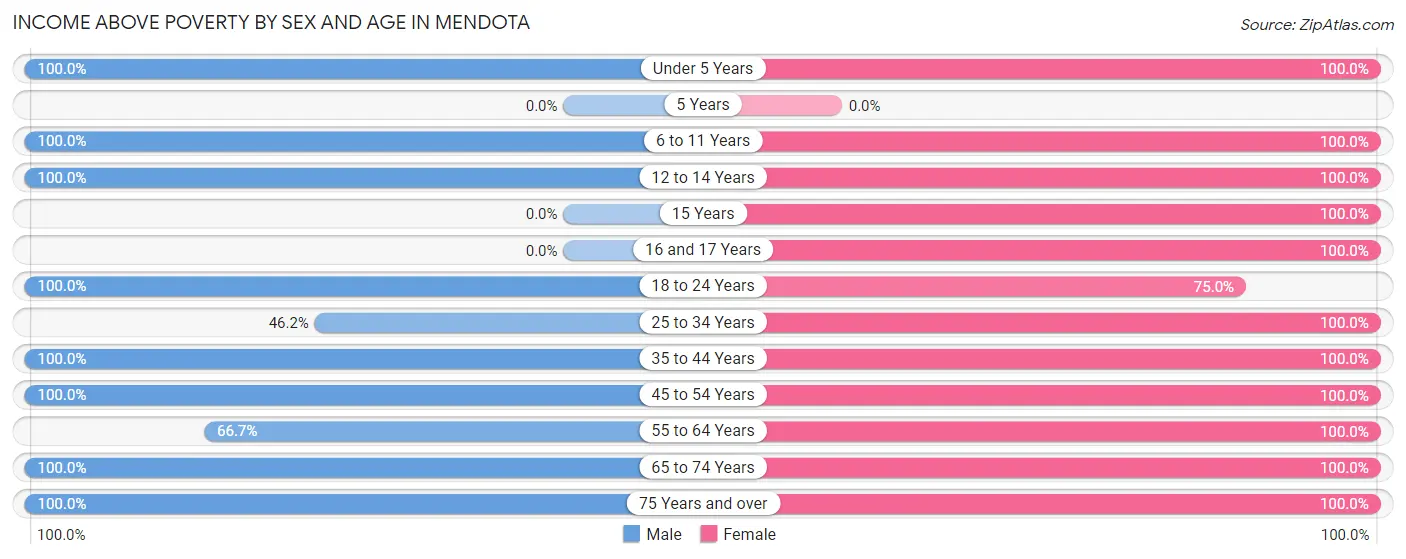
| Age Bracket | Male | Female |
| Under 5 Years | 2 (100.0%) | 9 (100.0%) |
| 5 Years | 0 (0.0%) | 0 (0.0%) |
| 6 to 11 Years | 6 (100.0%) | 7 (100.0%) |
| 12 to 14 Years | 1 (100.0%) | 1 (100.0%) |
| 15 Years | 0 (0.0%) | 1 (100.0%) |
| 16 and 17 Years | 0 (0.0%) | 1 (100.0%) |
| 18 to 24 Years | 2 (100.0%) | 6 (75.0%) |
| 25 to 34 Years | 6 (46.2%) | 11 (100.0%) |
| 35 to 44 Years | 8 (100.0%) | 9 (100.0%) |
| 45 to 54 Years | 9 (100.0%) | 10 (100.0%) |
| 55 to 64 Years | 6 (66.7%) | 11 (100.0%) |
| 65 to 74 Years | 9 (100.0%) | 6 (100.0%) |
| 75 Years and over | 7 (100.0%) | 2 (100.0%) |
| Total | 56 (84.9%) | 74 (97.4%) |
Income Below Poverty Among Married-Couple Families in Mendota
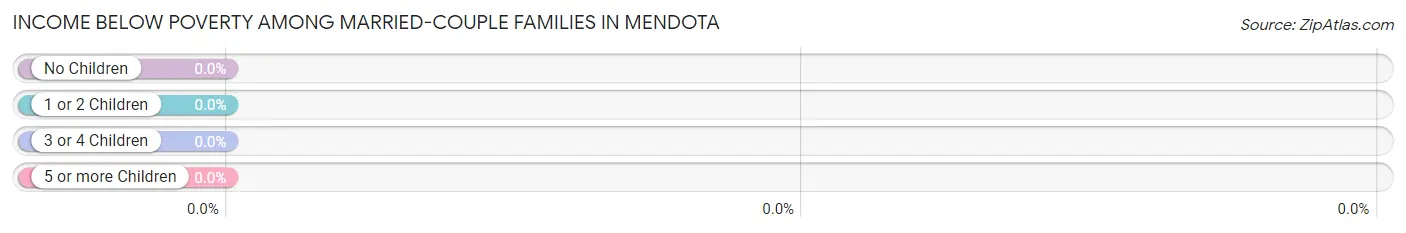
| Children | Above Poverty | Below Poverty |
| No Children | 16 (100.0%) | 0 (0.0%) |
| 1 or 2 Children | 10 (100.0%) | 0 (0.0%) |
| 3 or 4 Children | 5 (100.0%) | 0 (0.0%) |
| 5 or more Children | 0 (0.0%) | 0 (0.0%) |
| Total | 31 (100.0%) | 0 (0.0%) |
Income Below Poverty Among Single-Parent Households in Mendota
| Children | Single Father | Single Mother |
| No Children | 0 (0.0%) | 0 (0.0%) |
| 1 or 2 Children | 0 (0.0%) | 0 (0.0%) |
| 3 or 4 Children | 0 (0.0%) | 0 (0.0%) |
| 5 or more Children | 0 (0.0%) | 0 (0.0%) |
| Total | 0 (0.0%) | 0 (0.0%) |
Income Below Poverty Among Married-Couple vs Single-Parent Households in Mendota
| Children | Married-Couple Families | Single-Parent Households |
| No Children | 0 (0.0%) | 0 (0.0%) |
| 1 or 2 Children | 0 (0.0%) | 0 (0.0%) |
| 3 or 4 Children | 0 (0.0%) | 0 (0.0%) |
| 5 or more Children | 0 (0.0%) | 0 (0.0%) |
| Total | 0 (0.0%) | 0 (0.0%) |
Race in Mendota
The most populous races in Mendota are White / Caucasian (129 | 90.8%), Two or more Races (8 | 5.6%), and Asian (3 | 2.1%).
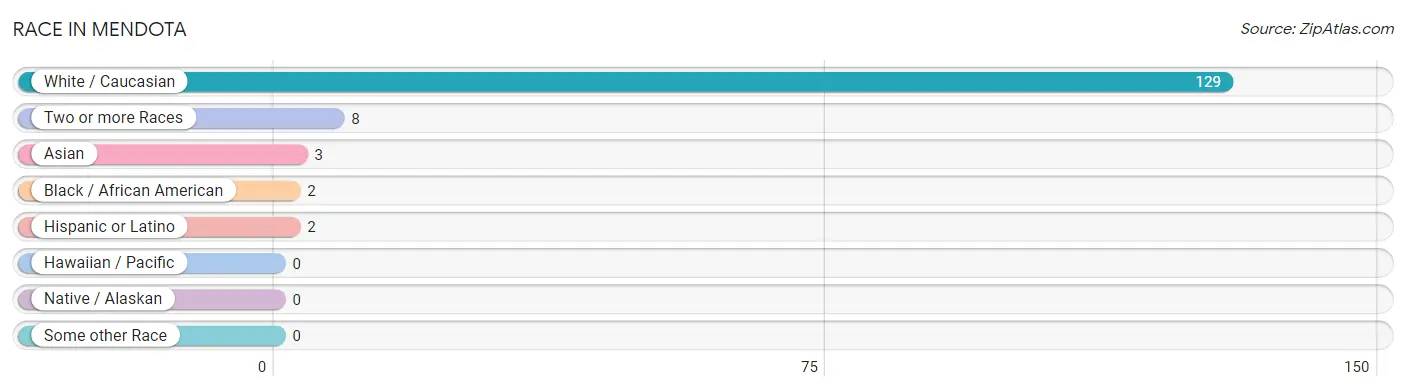
| Race | # Population | % Population |
| Asian | 3 | 2.1% |
| Black / African American | 2 | 1.4% |
| Hawaiian / Pacific | 0 | 0.0% |
| Hispanic or Latino | 2 | 1.4% |
| Native / Alaskan | 0 | 0.0% |
| White / Caucasian | 129 | 90.8% |
| Two or more Races | 8 | 5.6% |
| Some other Race | 0 | 0.0% |
| Total | 142 | 100.0% |
Ancestry in Mendota
The most populous ancestries reported in Mendota are German (40 | 28.2%), Norwegian (33 | 23.2%), Irish (31 | 21.8%), European (12 | 8.5%), and French (9 | 6.3%), together accounting for 88.0% of all Mendota residents.
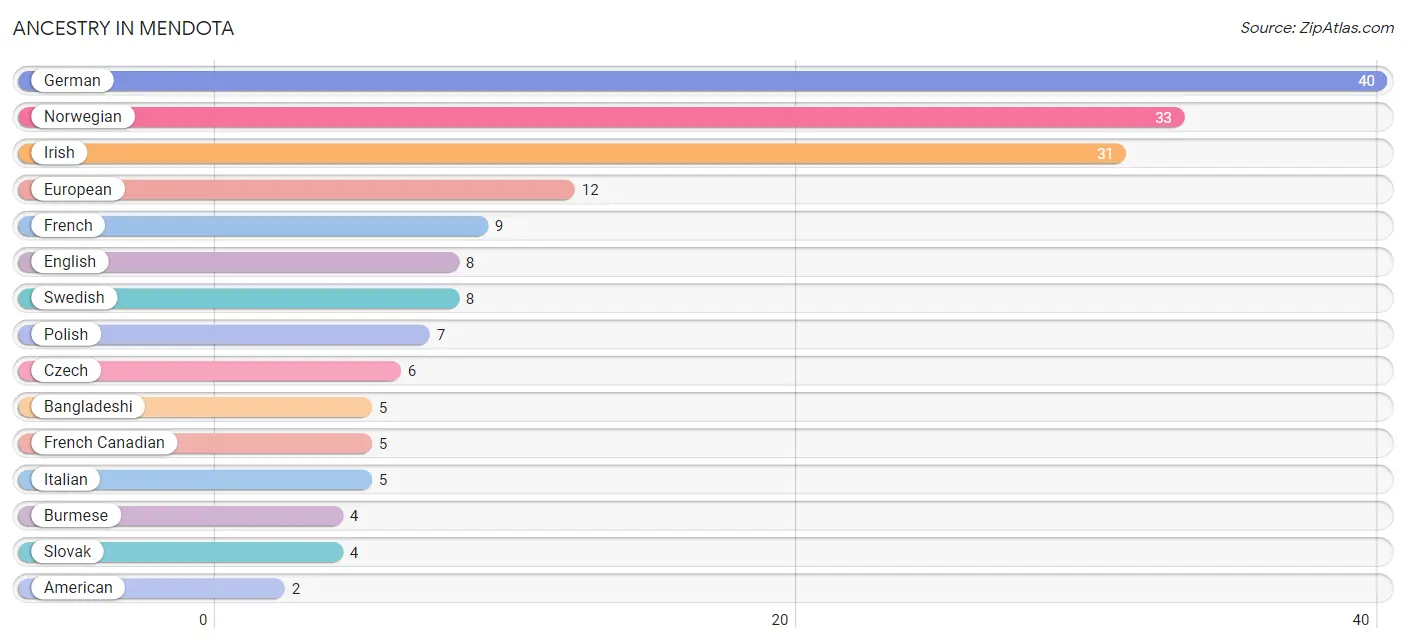
| Ancestry | # Population | % Population |
| American | 2 | 1.4% |
| Arab | 1 | 0.7% |
| Bangladeshi | 5 | 3.5% |
| Burmese | 4 | 2.8% |
| Colombian | 2 | 1.4% |
| Czech | 6 | 4.2% |
| Dutch | 2 | 1.4% |
| English | 8 | 5.6% |
| European | 12 | 8.5% |
| French | 9 | 6.3% |
| French Canadian | 5 | 3.5% |
| German | 40 | 28.2% |
| Irish | 31 | 21.8% |
| Italian | 5 | 3.5% |
| Lebanese | 1 | 0.7% |
| Norwegian | 33 | 23.2% |
| Polish | 7 | 4.9% |
| Scandinavian | 1 | 0.7% |
| Slovak | 4 | 2.8% |
| South American | 2 | 1.4% |
| Swedish | 8 | 5.6% | View All 21 Rows |
Immigrants in Mendota
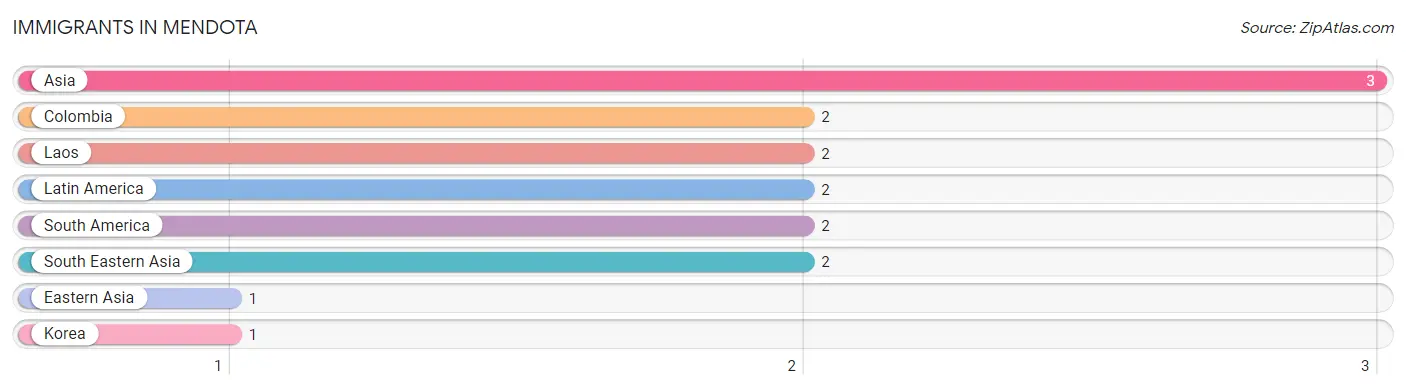
The most numerous immigrant groups reported in Mendota came from Asia (3 | 2.1%), Colombia (2 | 1.4%), Laos (2 | 1.4%), Latin America (2 | 1.4%), and South America (2 | 1.4%), together accounting for 7.7% of all Mendota residents.
| Immigration Origin | # Population | % Population |
| Asia | 3 | 2.1% |
| Colombia | 2 | 1.4% |
| Eastern Asia | 1 | 0.7% |
| Korea | 1 | 0.7% |
| Laos | 2 | 1.4% |
| Latin America | 2 | 1.4% |
| South America | 2 | 1.4% |
| South Eastern Asia | 2 | 1.4% | View All 8 Rows |
Sex and Age in Mendota
Sex and Age in Mendota
The most populous age groups in Mendota are 25 to 29 Years (7 | 10.6%) for men and Under 5 Years (9 | 11.8%) for women.
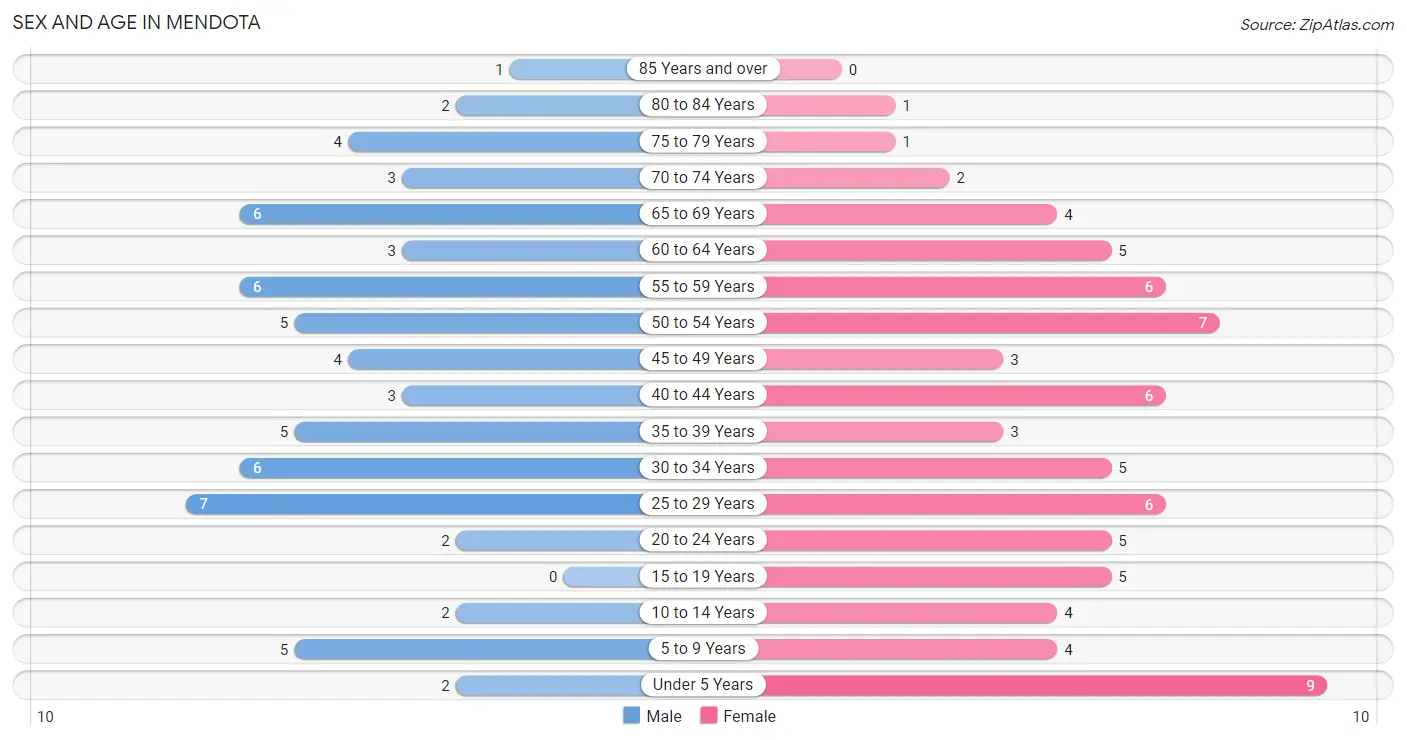
| Age Bracket | Male | Female |
| Under 5 Years | 2 (3.0%) | 9 (11.8%) |
| 5 to 9 Years | 5 (7.6%) | 4 (5.3%) |
| 10 to 14 Years | 2 (3.0%) | 4 (5.3%) |
| 15 to 19 Years | 0 (0.0%) | 5 (6.6%) |
| 20 to 24 Years | 2 (3.0%) | 5 (6.6%) |
| 25 to 29 Years | 7 (10.6%) | 6 (7.9%) |
| 30 to 34 Years | 6 (9.1%) | 5 (6.6%) |
| 35 to 39 Years | 5 (7.6%) | 3 (4.0%) |
| 40 to 44 Years | 3 (4.5%) | 6 (7.9%) |
| 45 to 49 Years | 4 (6.1%) | 3 (4.0%) |
| 50 to 54 Years | 5 (7.6%) | 7 (9.2%) |
| 55 to 59 Years | 6 (9.1%) | 6 (7.9%) |
| 60 to 64 Years | 3 (4.5%) | 5 (6.6%) |
| 65 to 69 Years | 6 (9.1%) | 4 (5.3%) |
| 70 to 74 Years | 3 (4.5%) | 2 (2.6%) |
| 75 to 79 Years | 4 (6.1%) | 1 (1.3%) |
| 80 to 84 Years | 2 (3.0%) | 1 (1.3%) |
| 85 Years and over | 1 (1.5%) | 0 (0.0%) |
| Total | 66 (100.0%) | 76 (100.0%) |
Families and Households in Mendota
Median Family Size in Mendota
The median family size in Mendota is 3.14 persons per family, with married-couple families (31 | 86.1%) accounting for the largest median family size of 3.29 persons per family. On the other hand, single female/mother families (1 | 2.8%) represent the smallest median family size with 2.00 persons per family.
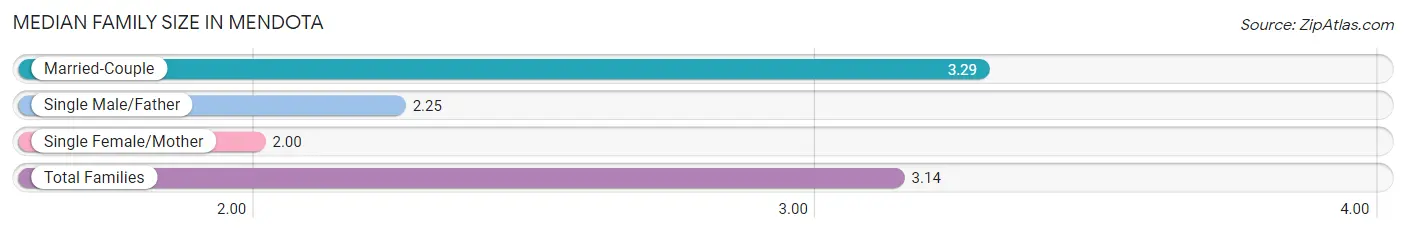
| Family Type | # Families | Family Size |
| Married-Couple | 31 (86.1%) | 3.29 |
| Single Male/Father | 4 (11.1%) | 2.25 |
| Single Female/Mother | 1 (2.8%) | 2.00 |
| Total Families | 36 (100.0%) | 3.14 |
Median Household Size in Mendota
The median household size in Mendota is 2.54 persons per household, with married-couple households (31 | 57.4%) accounting for the largest median household size of 3.35 persons per household. non-family households (18 | 33.3%) represent the smallest median household size with 1.11 persons per household.
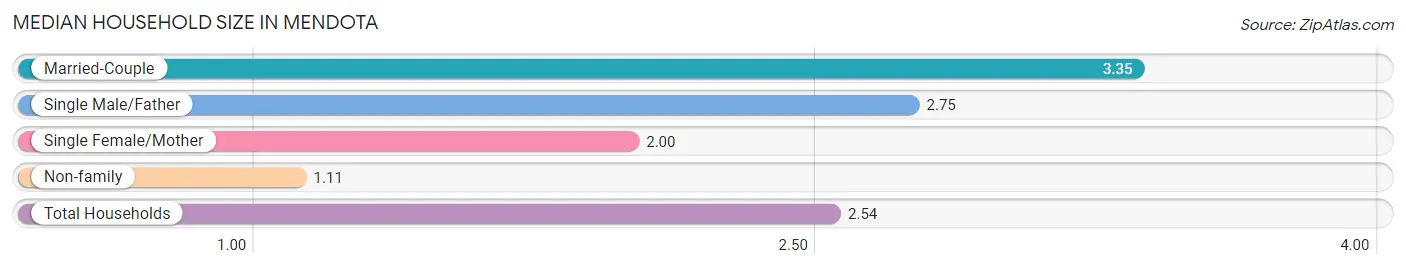
| Household Type | # Households | Household Size |
| Married-Couple | 31 (57.4%) | 3.35 |
| Single Male/Father | 4 (7.4%) | 2.75 |
| Single Female/Mother | 1 (1.8%) | 2.00 |
| Non-family | 18 (33.3%) | 1.11 |
| Total Households | 54 (100.0%) | 2.54 |
Household Size by Marriage Status in Mendota
Out of a total of 54 households in Mendota, 36 (66.7%) are family households, while 18 (33.3%) are nonfamily households. The most numerous type of family households are 2-person households, comprising 13, and the most common type of nonfamily households are 1-person households, comprising 16.
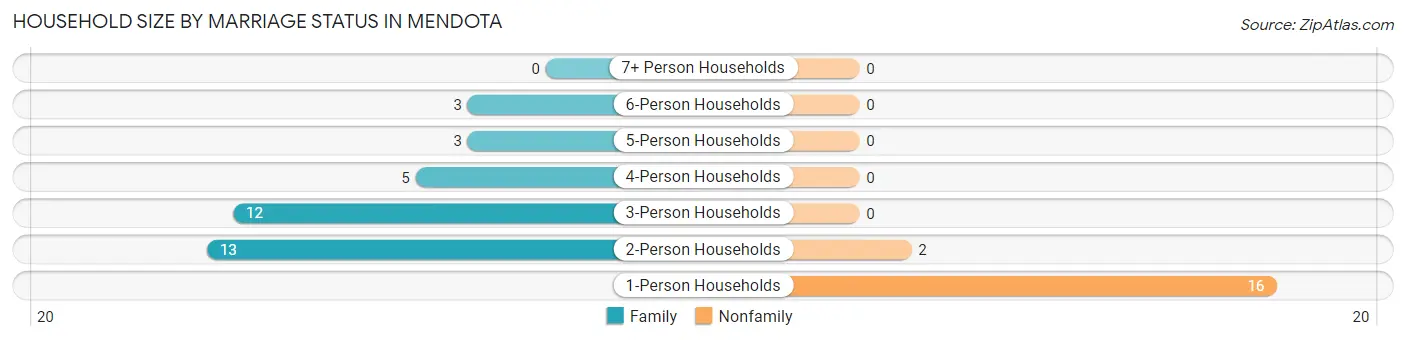
| Household Size | Family Households | Nonfamily Households |
| 1-Person Households | - | 16 (29.6%) |
| 2-Person Households | 13 (24.1%) | 2 (3.7%) |
| 3-Person Households | 12 (22.2%) | 0 (0.0%) |
| 4-Person Households | 5 (9.3%) | 0 (0.0%) |
| 5-Person Households | 3 (5.6%) | 0 (0.0%) |
| 6-Person Households | 3 (5.6%) | 0 (0.0%) |
| 7+ Person Households | 0 (0.0%) | 0 (0.0%) |
| Total | 36 (66.7%) | 18 (33.3%) |
Female Fertility in Mendota
Fertility by Age in Mendota
Average fertility rate in Mendota is 86.0 births per 1,000 women. Women in the age bracket of 20 to 34 years have the highest fertility rate with 188.0 births per 1,000 women. Women in the age bracket of 20 to 34 years acount for 100.0% of all women with births.
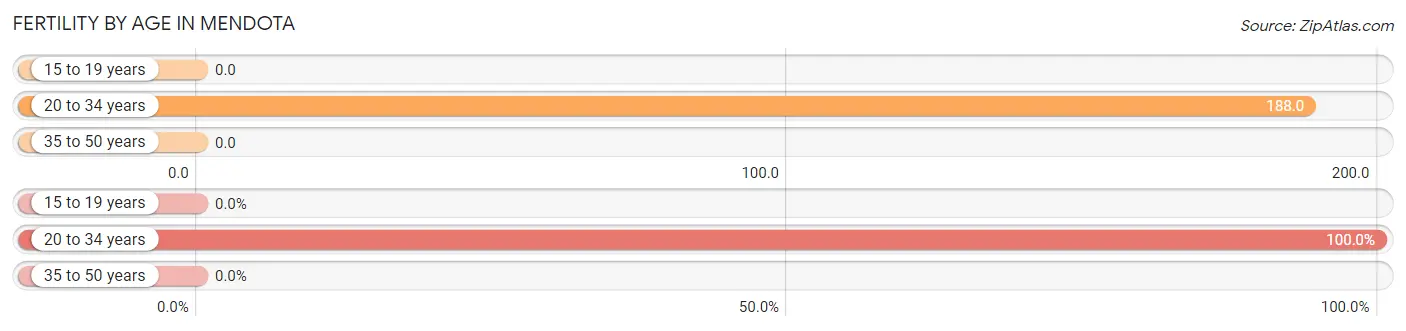
| Age Bracket | Women with Births | Births / 1,000 Women |
| 15 to 19 years | 0 (0.0%) | 0.0 |
| 20 to 34 years | 3 (100.0%) | 188.0 |
| 35 to 50 years | 0 (0.0%) | 0.0 |
| Total | 3 (100.0%) | 86.0 |
Fertility by Age by Marriage Status in Mendota
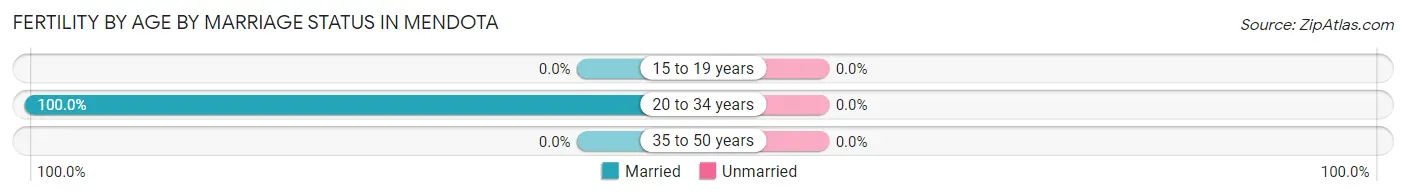
| Age Bracket | Married | Unmarried |
| 15 to 19 years | 0 (0.0%) | 0 (0.0%) |
| 20 to 34 years | 3 (100.0%) | 0 (0.0%) |
| 35 to 50 years | 0 (0.0%) | 0 (0.0%) |
| Total | 3 (100.0%) | 0 (0.0%) |
Fertility by Education in Mendota
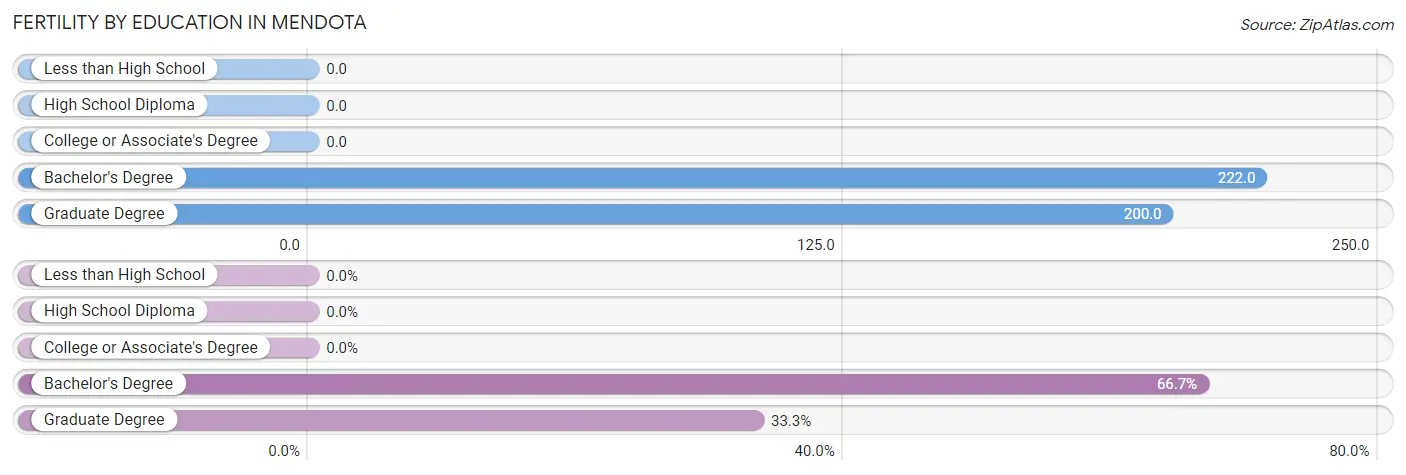
| Educational Attainment | Women with Births | Births / 1,000 Women |
| Less than High School | 0 (0.0%) | 0.0 |
| High School Diploma | 0 (0.0%) | 0.0 |
| College or Associate's Degree | 0 (0.0%) | 0.0 |
| Bachelor's Degree | 2 (66.7%) | 222.0 |
| Graduate Degree | 1 (33.3%) | 200.0 |
| Total | 3 (100.0%) | 86.0 |
Fertility by Education by Marriage Status in Mendota
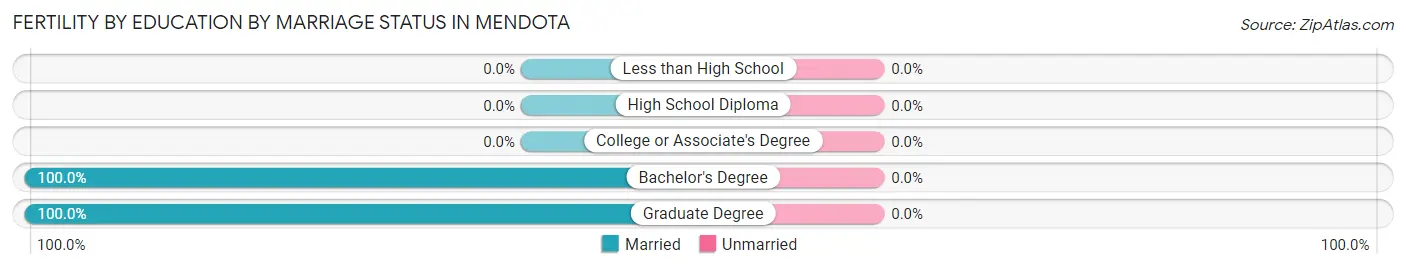
| Educational Attainment | Married | Unmarried |
| Less than High School | 0 (0.0%) | 0 (0.0%) |
| High School Diploma | 0 (0.0%) | 0 (0.0%) |
| College or Associate's Degree | 0 (0.0%) | 0 (0.0%) |
| Bachelor's Degree | 2 (100.0%) | 0 (0.0%) |
| Graduate Degree | 1 (100.0%) | 0 (0.0%) |
| Total | 3 (100.0%) | 0 (0.0%) |
Employment Characteristics in Mendota
Employment by Class of Employer in Mendota
Among the 72 employed individuals in Mendota, private company employees (41 | 56.9%), not-for-profit organizations (12 | 16.7%), and self-employed (incorporated) (8 | 11.1%) make up the most common classes of employment.
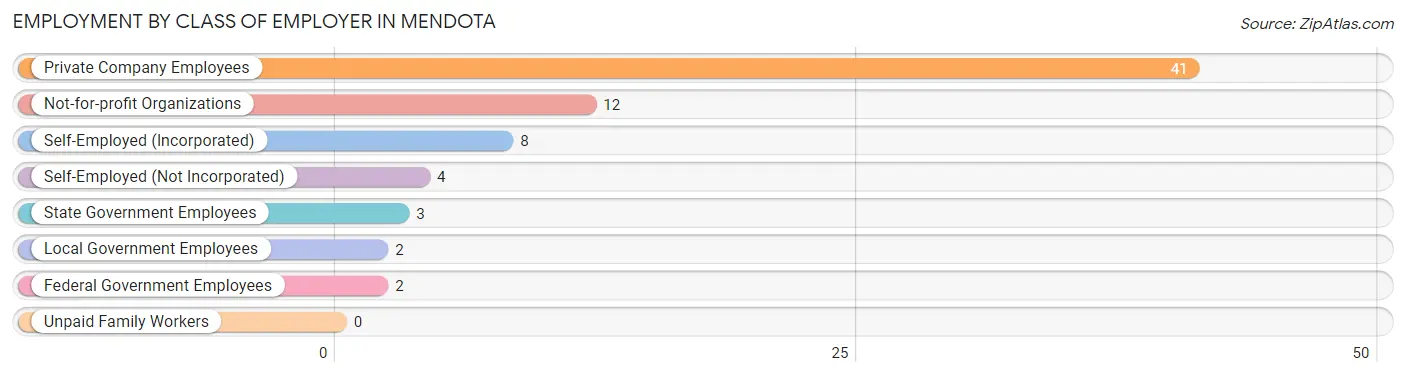
| Employer Class | # Employees | % Employees |
| Private Company Employees | 41 | 56.9% |
| Self-Employed (Incorporated) | 8 | 11.1% |
| Self-Employed (Not Incorporated) | 4 | 5.6% |
| Not-for-profit Organizations | 12 | 16.7% |
| Local Government Employees | 2 | 2.8% |
| State Government Employees | 3 | 4.2% |
| Federal Government Employees | 2 | 2.8% |
| Unpaid Family Workers | 0 | 0.0% |
| Total | 72 | 100.0% |
Employment Status by Age in Mendota
According to the labor force statistics for Mendota, out of the total population over 16 years of age (115), 65.2% or 75 individuals are in the labor force, with 4.1% or 3 of them unemployed. The age group with the highest labor force participation rate is 16 to 19 years, with 100.0% or 4 individuals in the labor force. Within the labor force, the 35 to 44 years age range has the highest percentage of unemployed individuals, with 13.3% or 2 of them being unemployed.
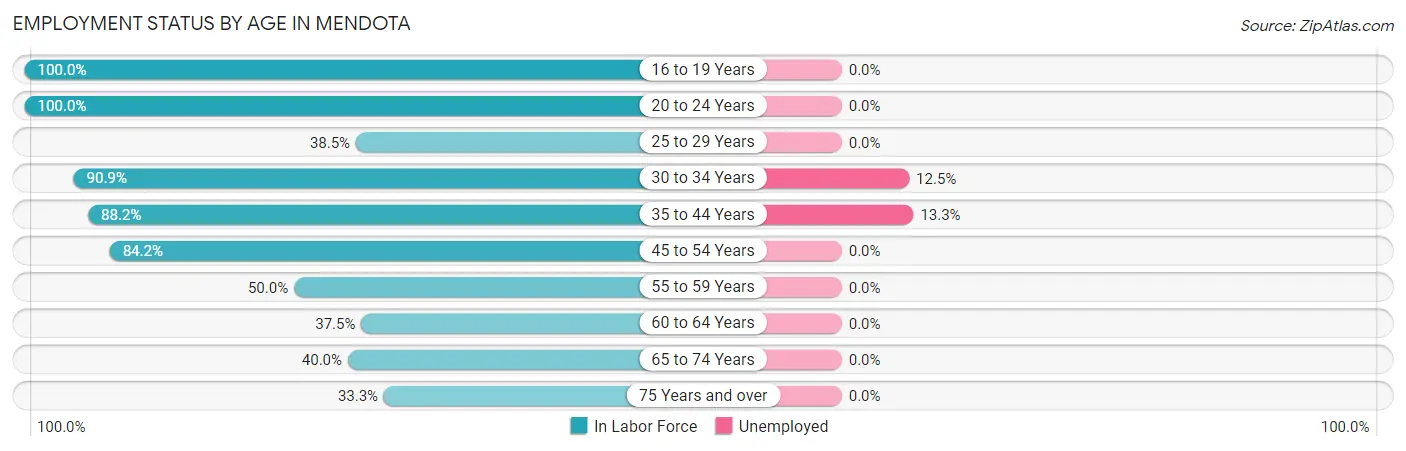
| Age Bracket | In Labor Force | Unemployed |
| 16 to 19 Years | 4 (100.0%) | 0 (0.0%) |
| 20 to 24 Years | 7 (100.0%) | 0 (0.0%) |
| 25 to 29 Years | 5 (38.5%) | 0 (0.0%) |
| 30 to 34 Years | 10 (90.9%) | 1 (12.5%) |
| 35 to 44 Years | 15 (88.2%) | 2 (13.3%) |
| 45 to 54 Years | 16 (84.2%) | 0 (0.0%) |
| 55 to 59 Years | 6 (50.0%) | 0 (0.0%) |
| 60 to 64 Years | 3 (37.5%) | 0 (0.0%) |
| 65 to 74 Years | 6 (40.0%) | 0 (0.0%) |
| 75 Years and over | 3 (33.3%) | 0 (0.0%) |
| Total | 75 (65.2%) | 3 (4.1%) |
Employment Status by Educational Attainment in Mendota
According to labor force statistics for Mendota, 68.8% of individuals (55) out of the total population between 25 and 64 years of age (80) are in the labor force, with 5.7% or 3 of them being unemployed. The group with the highest labor force participation rate are those with the educational attainment of bachelor's degree or higher, with 77.1% or 27 individuals in the labor force. Within the labor force, individuals with college / associate degree education have the highest percentage of unemployment, with 21.4% or 3 of them being unemployed.
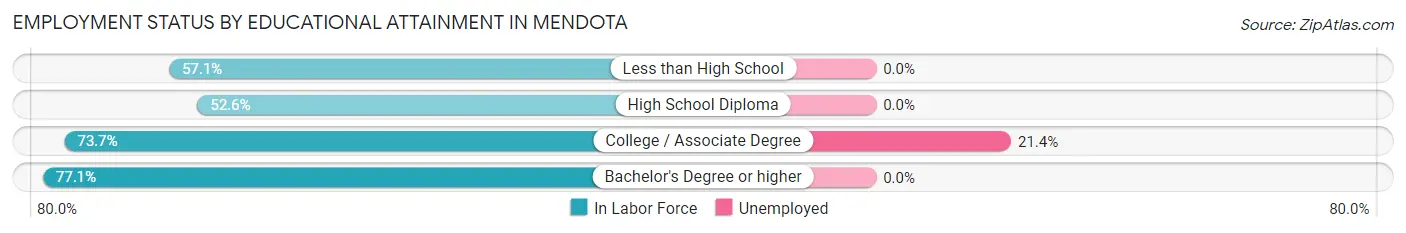
| Educational Attainment | In Labor Force | Unemployed |
| Less than High School | 4 (57.1%) | 0 (0.0%) |
| High School Diploma | 10 (52.6%) | 0 (0.0%) |
| College / Associate Degree | 14 (73.7%) | 4 (21.4%) |
| Bachelor's Degree or higher | 27 (77.1%) | 0 (0.0%) |
| Total | 55 (68.8%) | 5 (5.7%) |
Employment Occupations by Sex in Mendota
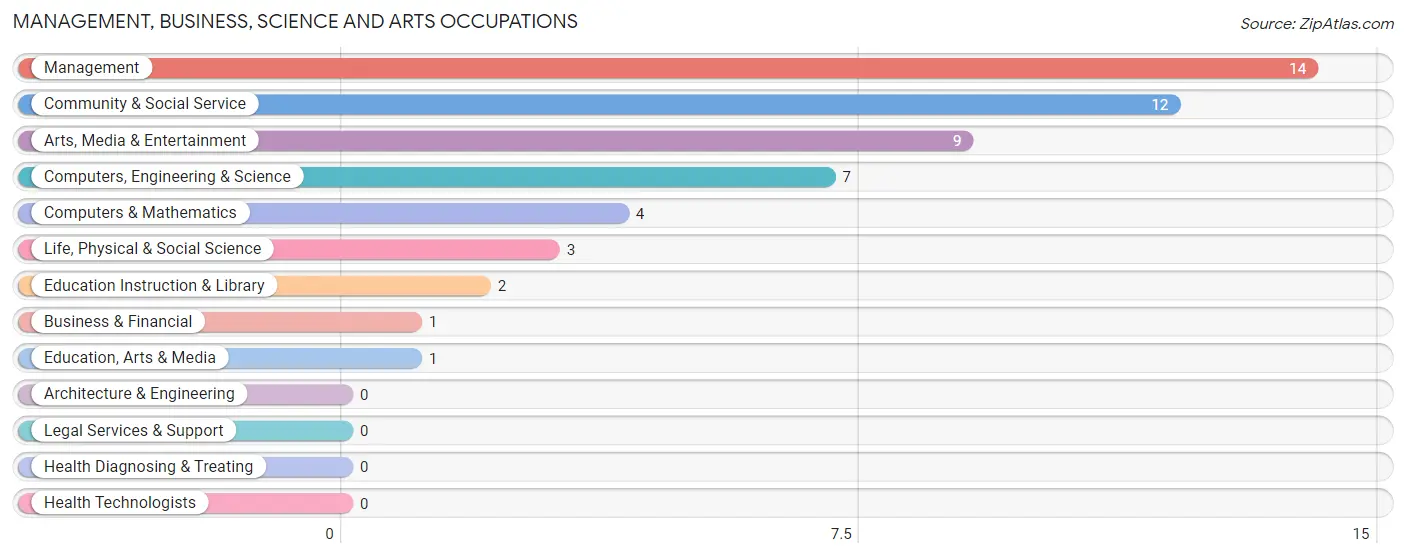
Management, Business, Science and Arts Occupations
The most common Management, Business, Science and Arts occupations in Mendota are Management (14 | 20.0%), Community & Social Service (12 | 17.1%), Arts, Media & Entertainment (9 | 12.9%), Computers, Engineering & Science (7 | 10.0%), and Computers & Mathematics (4 | 5.7%).
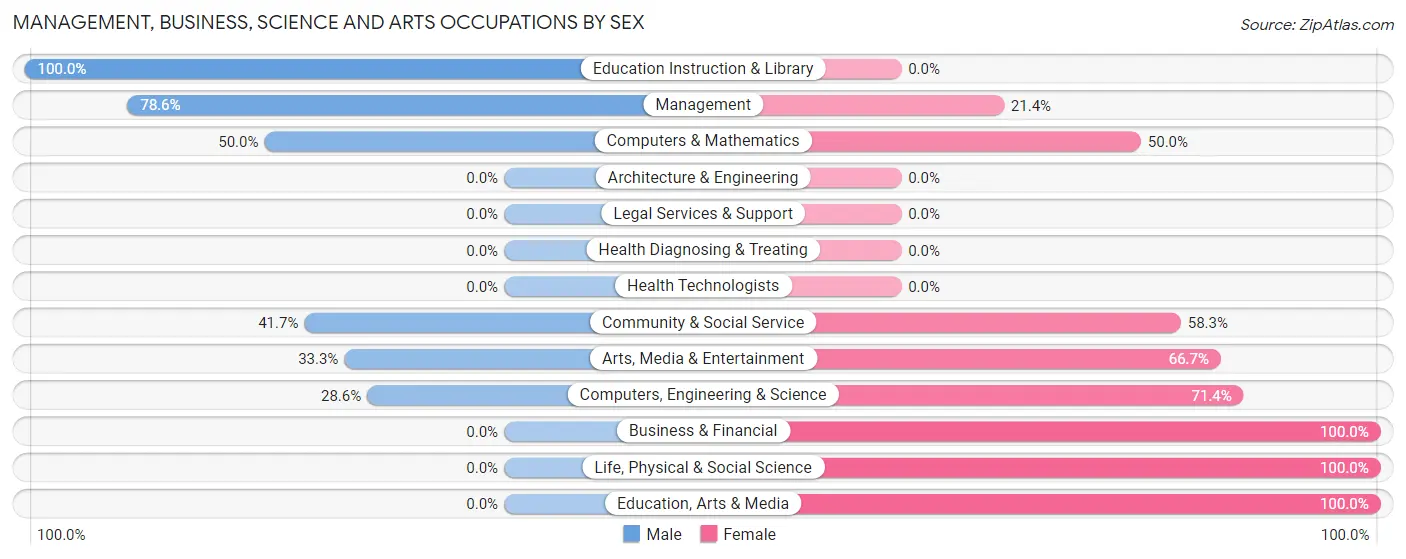
Management, Business, Science and Arts Occupations by Sex
Within the Management, Business, Science and Arts occupations in Mendota, the most male-oriented occupations are Education Instruction & Library (100.0%), Management (78.6%), and Computers & Mathematics (50.0%), while the most female-oriented occupations are Business & Financial (100.0%), Life, Physical & Social Science (100.0%), and Education, Arts & Media (100.0%).
| Occupation | Male | Female |
| Management | 11 (78.6%) | 3 (21.4%) |
| Business & Financial | 0 (0.0%) | 1 (100.0%) |
| Computers, Engineering & Science | 2 (28.6%) | 5 (71.4%) |
| Computers & Mathematics | 2 (50.0%) | 2 (50.0%) |
| Architecture & Engineering | 0 (0.0%) | 0 (0.0%) |
| Life, Physical & Social Science | 0 (0.0%) | 3 (100.0%) |
| Community & Social Service | 5 (41.7%) | 7 (58.3%) |
| Education, Arts & Media | 0 (0.0%) | 1 (100.0%) |
| Legal Services & Support | 0 (0.0%) | 0 (0.0%) |
| Education Instruction & Library | 2 (100.0%) | 0 (0.0%) |
| Arts, Media & Entertainment | 3 (33.3%) | 6 (66.7%) |
| Health Diagnosing & Treating | 0 (0.0%) | 0 (0.0%) |
| Health Technologists | 0 (0.0%) | 0 (0.0%) |
| Total (Category) | 18 (52.9%) | 16 (47.1%) |
| Total (Overall) | 33 (47.1%) | 37 (52.9%) |
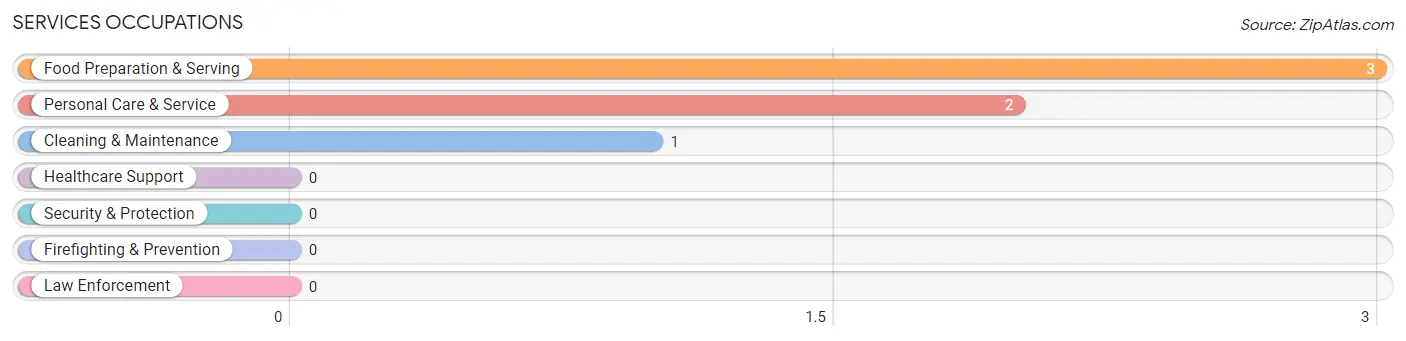
Services Occupations
The most common Services occupations in Mendota are Food Preparation & Serving (3 | 4.3%), Personal Care & Service (2 | 2.9%), and Cleaning & Maintenance (1 | 1.4%).
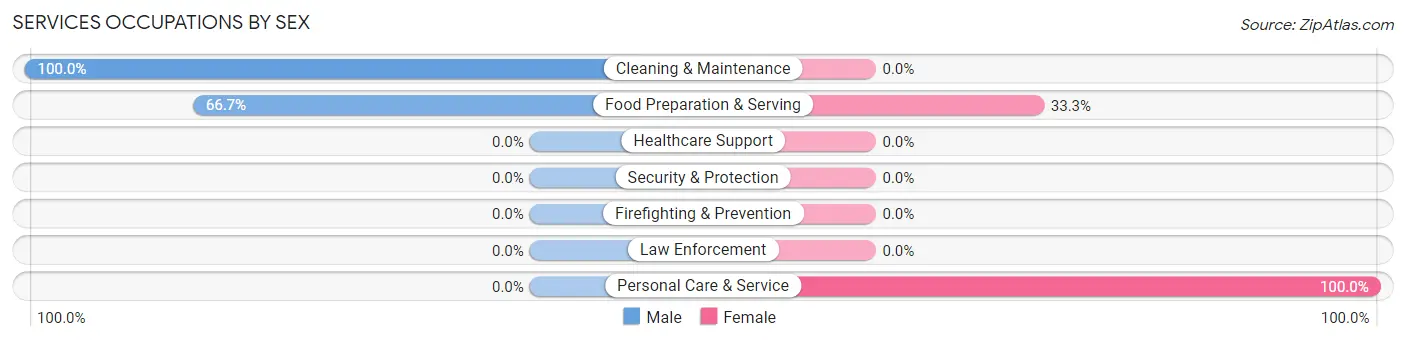
Services Occupations by Sex
Within the Services occupations in Mendota, the most male-oriented occupations are Cleaning & Maintenance (100.0%), and Food Preparation & Serving (66.7%), while the most female-oriented occupations are Personal Care & Service (100.0%), and Food Preparation & Serving (33.3%).
| Occupation | Male | Female |
| Healthcare Support | 0 (0.0%) | 0 (0.0%) |
| Security & Protection | 0 (0.0%) | 0 (0.0%) |
| Firefighting & Prevention | 0 (0.0%) | 0 (0.0%) |
| Law Enforcement | 0 (0.0%) | 0 (0.0%) |
| Food Preparation & Serving | 2 (66.7%) | 1 (33.3%) |
| Cleaning & Maintenance | 1 (100.0%) | 0 (0.0%) |
| Personal Care & Service | 0 (0.0%) | 2 (100.0%) |
| Total (Category) | 3 (50.0%) | 3 (50.0%) |
| Total (Overall) | 33 (47.1%) | 37 (52.9%) |
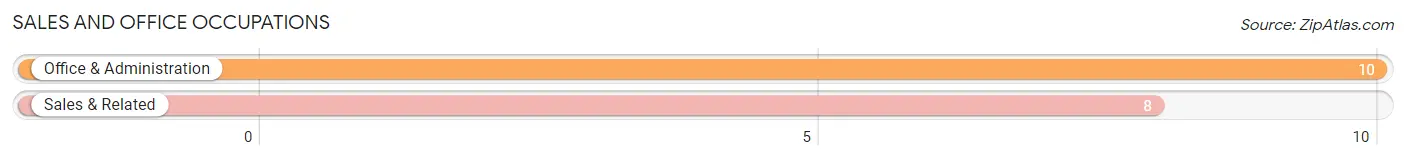
Sales and Office Occupations
The most common Sales and Office occupations in Mendota are Office & Administration (10 | 14.3%), and Sales & Related (8 | 11.4%).
Sales and Office Occupations by Sex
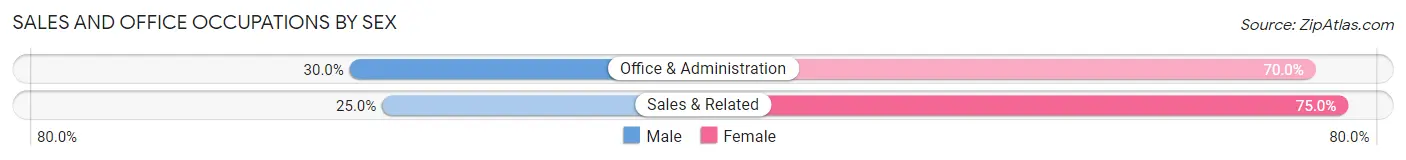
| Occupation | Male | Female |
| Sales & Related | 2 (25.0%) | 6 (75.0%) |
| Office & Administration | 3 (30.0%) | 7 (70.0%) |
| Total (Category) | 5 (27.8%) | 13 (72.2%) |
| Total (Overall) | 33 (47.1%) | 37 (52.9%) |
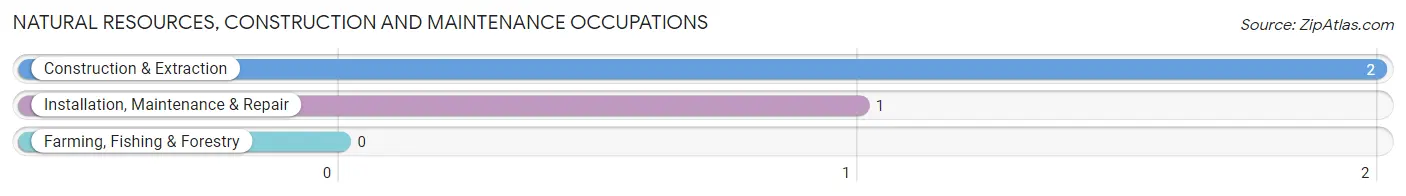
Natural Resources, Construction and Maintenance Occupations
The most common Natural Resources, Construction and Maintenance occupations in Mendota are Construction & Extraction (2 | 2.9%), and Installation, Maintenance & Repair (1 | 1.4%).
Natural Resources, Construction and Maintenance Occupations by Sex
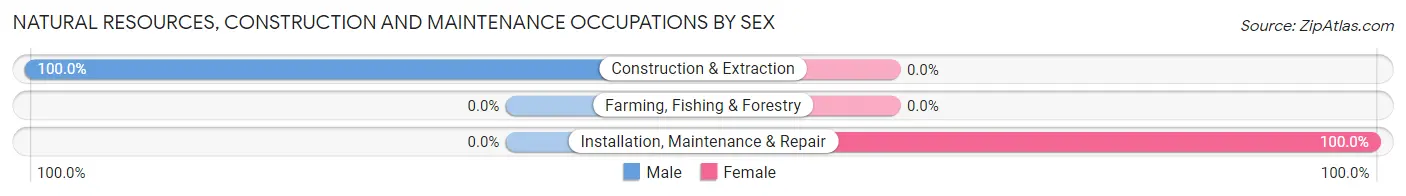
| Occupation | Male | Female |
| Farming, Fishing & Forestry | 0 (0.0%) | 0 (0.0%) |
| Construction & Extraction | 2 (100.0%) | 0 (0.0%) |
| Installation, Maintenance & Repair | 0 (0.0%) | 1 (100.0%) |
| Total (Category) | 2 (66.7%) | 1 (33.3%) |
| Total (Overall) | 33 (47.1%) | 37 (52.9%) |
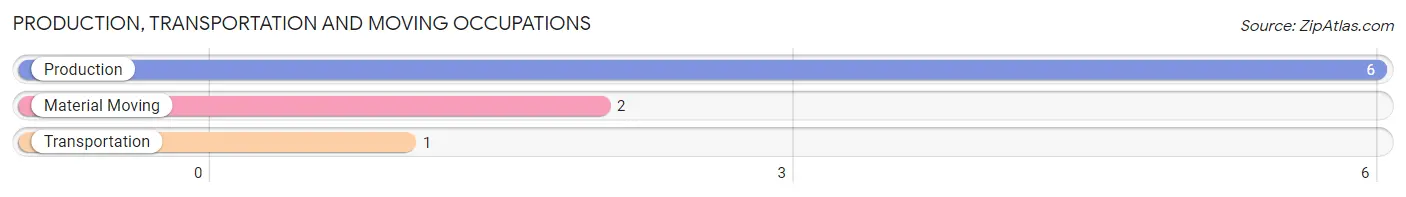
Production, Transportation and Moving Occupations
The most common Production, Transportation and Moving occupations in Mendota are Production (6 | 8.6%), Material Moving (2 | 2.9%), and Transportation (1 | 1.4%).
Production, Transportation and Moving Occupations by Sex
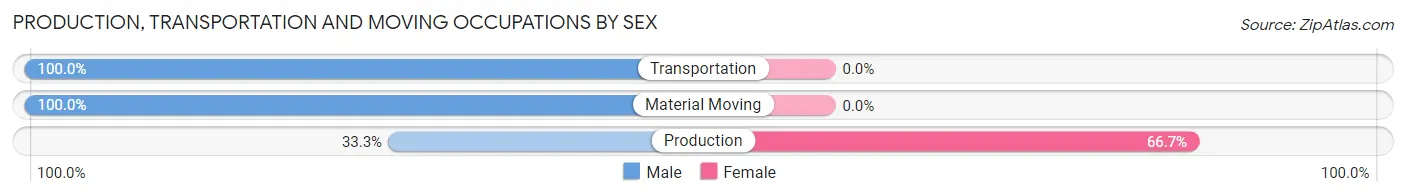
| Occupation | Male | Female |
| Production | 2 (33.3%) | 4 (66.7%) |
| Transportation | 1 (100.0%) | 0 (0.0%) |
| Material Moving | 2 (100.0%) | 0 (0.0%) |
| Total (Category) | 5 (55.6%) | 4 (44.4%) |
| Total (Overall) | 33 (47.1%) | 37 (52.9%) |
Employment Industries by Sex in Mendota
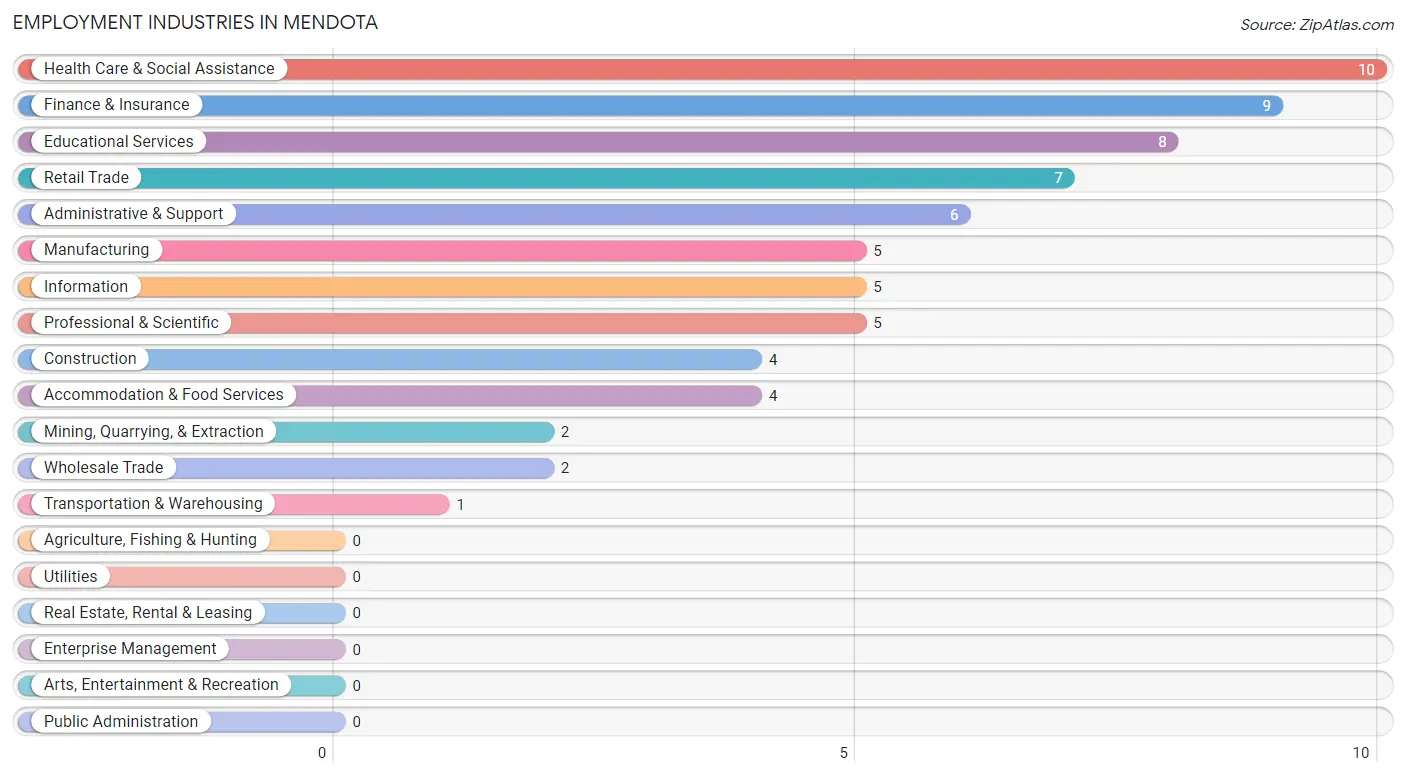
Employment Industries in Mendota
The major employment industries in Mendota include Health Care & Social Assistance (10 | 14.3%), Finance & Insurance (9 | 12.9%), Educational Services (8 | 11.4%), Retail Trade (7 | 10.0%), and Administrative & Support (6 | 8.6%).
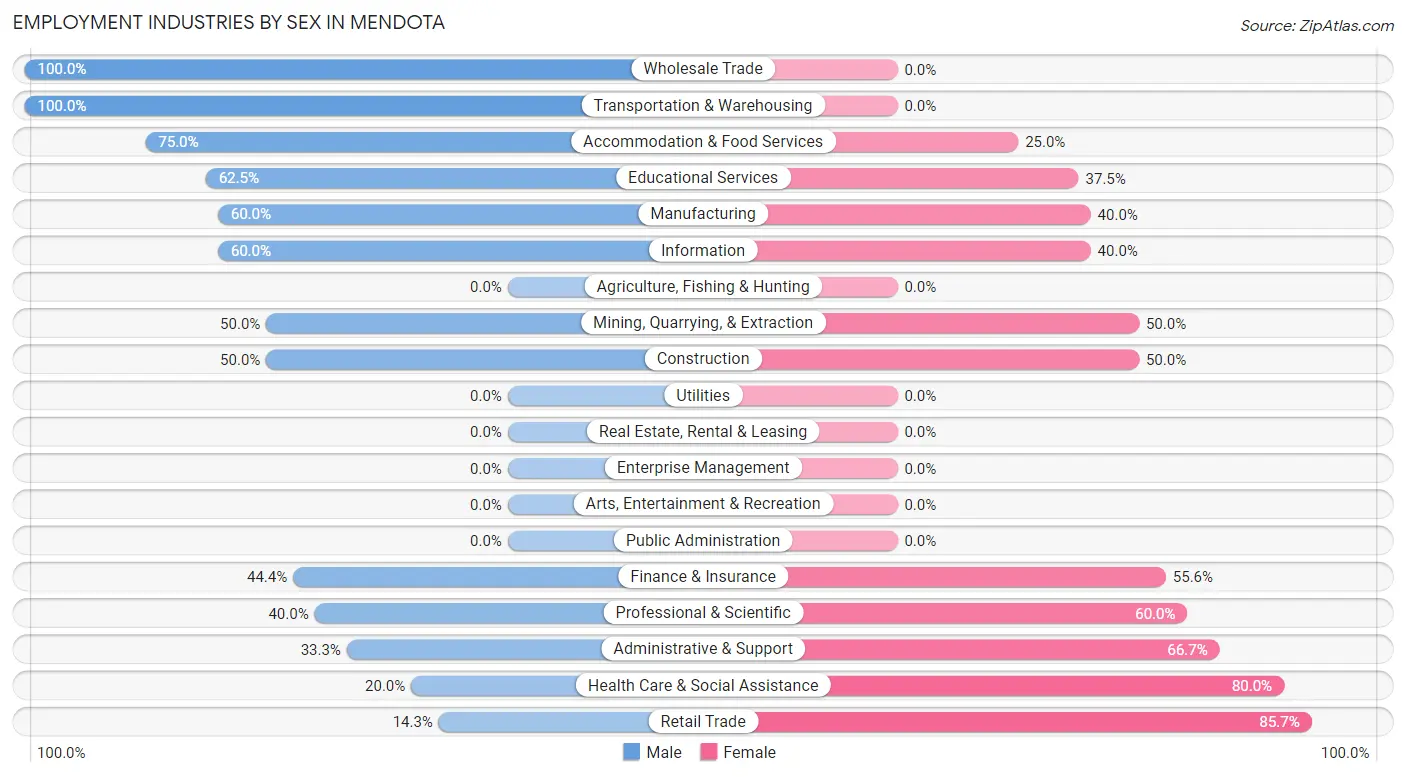
Employment Industries by Sex in Mendota
The Mendota industries that see more men than women are Wholesale Trade (100.0%), Transportation & Warehousing (100.0%), and Accommodation & Food Services (75.0%), whereas the industries that tend to have a higher number of women are Retail Trade (85.7%), Health Care & Social Assistance (80.0%), and Administrative & Support (66.7%).
| Industry | Male | Female |
| Agriculture, Fishing & Hunting | 0 (0.0%) | 0 (0.0%) |
| Mining, Quarrying, & Extraction | 1 (50.0%) | 1 (50.0%) |
| Construction | 2 (50.0%) | 2 (50.0%) |
| Manufacturing | 3 (60.0%) | 2 (40.0%) |
| Wholesale Trade | 2 (100.0%) | 0 (0.0%) |
| Retail Trade | 1 (14.3%) | 6 (85.7%) |
| Transportation & Warehousing | 1 (100.0%) | 0 (0.0%) |
| Utilities | 0 (0.0%) | 0 (0.0%) |
| Information | 3 (60.0%) | 2 (40.0%) |
| Finance & Insurance | 4 (44.4%) | 5 (55.6%) |
| Real Estate, Rental & Leasing | 0 (0.0%) | 0 (0.0%) |
| Professional & Scientific | 2 (40.0%) | 3 (60.0%) |
| Enterprise Management | 0 (0.0%) | 0 (0.0%) |
| Administrative & Support | 2 (33.3%) | 4 (66.7%) |
| Educational Services | 5 (62.5%) | 3 (37.5%) |
| Health Care & Social Assistance | 2 (20.0%) | 8 (80.0%) |
| Arts, Entertainment & Recreation | 0 (0.0%) | 0 (0.0%) |
| Accommodation & Food Services | 3 (75.0%) | 1 (25.0%) |
| Public Administration | 0 (0.0%) | 0 (0.0%) |
| Total | 33 (47.1%) | 37 (52.9%) |
Education in Mendota
School Enrollment in Mendota
The most common levels of schooling among the 21 students in Mendota are college / undergraduate (7 | 33.3%), kindergarten (6 | 28.6%), and middle school (4 | 19.1%).
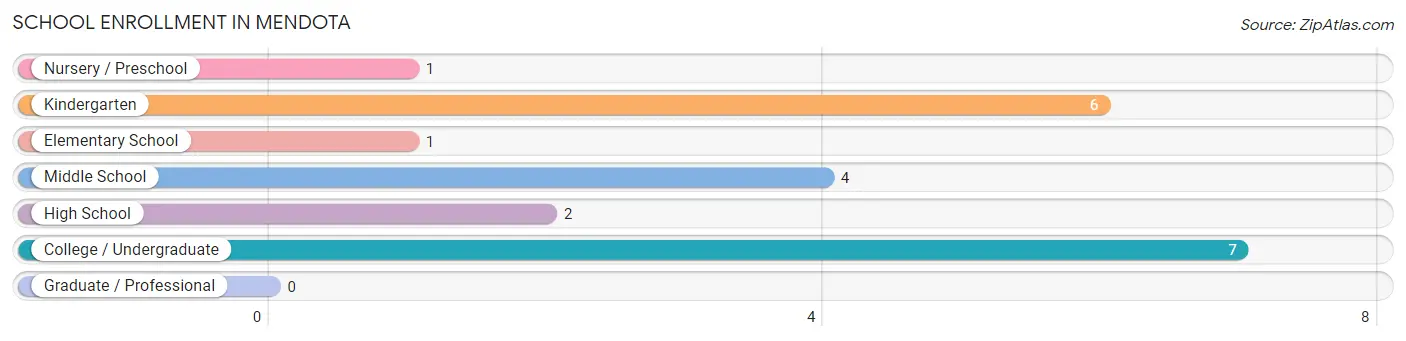
| School Level | # Students | % Students |
| Nursery / Preschool | 1 | 4.8% |
| Kindergarten | 6 | 28.6% |
| Elementary School | 1 | 4.8% |
| Middle School | 4 | 19.1% |
| High School | 2 | 9.5% |
| College / Undergraduate | 7 | 33.3% |
| Graduate / Professional | 0 | 0.0% |
| Total | 21 | 100.0% |
School Enrollment by Age by Funding Source in Mendota
Out of a total of 21 students who are enrolled in schools in Mendota, 12 (57.1%) attend a private institution, while the remaining 9 (42.9%) are enrolled in public schools. The age group of 3 to 4 year olds has the highest likelihood of being enrolled in private schools, with 1 (100.0% in the age bracket) enrolled. Conversely, the age group of 18 to 19 year olds has the lowest likelihood of being enrolled in a private school, with 3 (100.0% in the age bracket) attending a public institution.
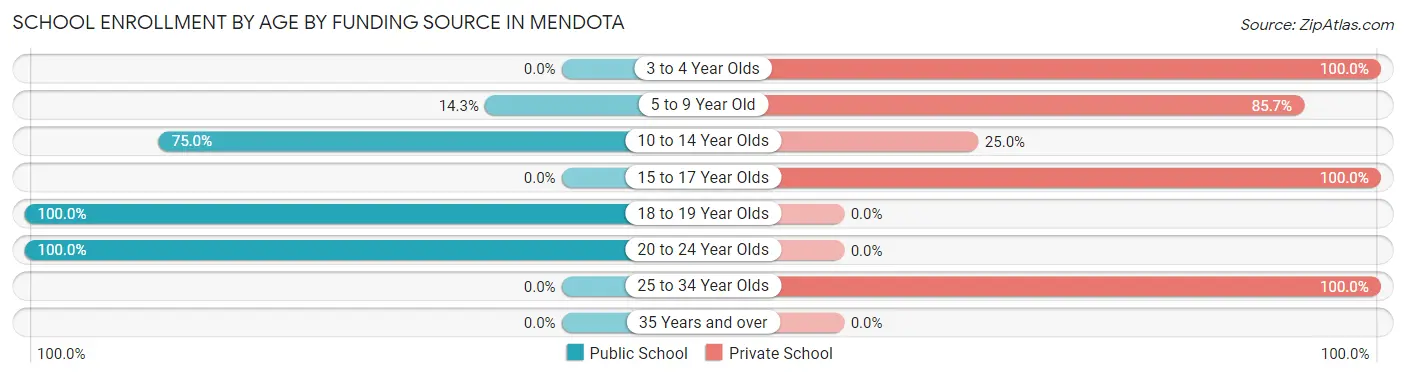
| Age Bracket | Public School | Private School |
| 3 to 4 Year Olds | 0 (0.0%) | 1 (100.0%) |
| 5 to 9 Year Old | 1 (14.3%) | 6 (85.7%) |
| 10 to 14 Year Olds | 3 (75.0%) | 1 (25.0%) |
| 15 to 17 Year Olds | 0 (0.0%) | 2 (100.0%) |
| 18 to 19 Year Olds | 3 (100.0%) | 0 (0.0%) |
| 20 to 24 Year Olds | 2 (100.0%) | 0 (0.0%) |
| 25 to 34 Year Olds | 0 (0.0%) | 2 (100.0%) |
| 35 Years and over | 0 (0.0%) | 0 (0.0%) |
| Total | 9 (42.9%) | 12 (57.1%) |
Educational Attainment by Field of Study in Mendota
Business (11 | 22.9%), literature & languages (6 | 12.5%), communications (6 | 12.5%), psychology (5 | 10.4%), and education (4 | 8.3%) are the most common fields of study among 48 individuals in Mendota who have obtained a bachelor's degree or higher.
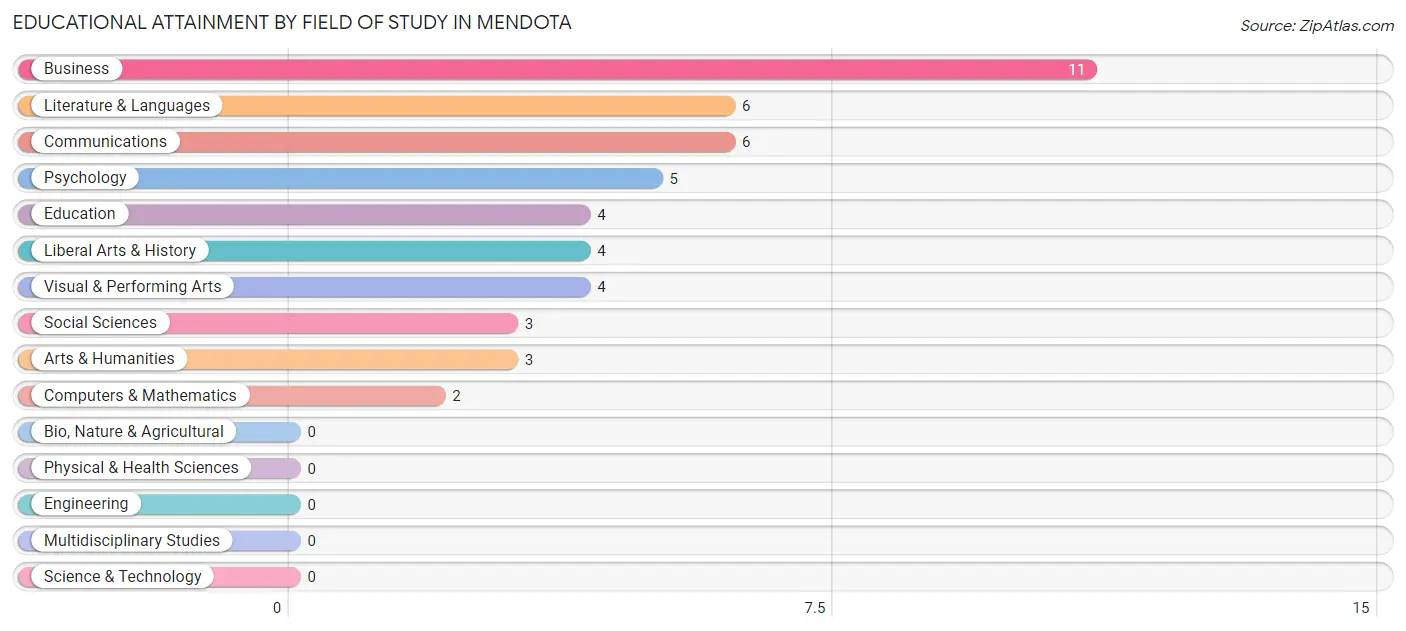
| Field of Study | # Graduates | % Graduates |
| Computers & Mathematics | 2 | 4.2% |
| Bio, Nature & Agricultural | 0 | 0.0% |
| Physical & Health Sciences | 0 | 0.0% |
| Psychology | 5 | 10.4% |
| Social Sciences | 3 | 6.2% |
| Engineering | 0 | 0.0% |
| Multidisciplinary Studies | 0 | 0.0% |
| Science & Technology | 0 | 0.0% |
| Business | 11 | 22.9% |
| Education | 4 | 8.3% |
| Literature & Languages | 6 | 12.5% |
| Liberal Arts & History | 4 | 8.3% |
| Visual & Performing Arts | 4 | 8.3% |
| Communications | 6 | 12.5% |
| Arts & Humanities | 3 | 6.2% |
| Total | 48 | 100.0% |
Transportation & Commute in Mendota
Vehicle Availability by Sex in Mendota
The most prevalent vehicle ownership categories in Mendota are males with 3 vehicles (13, accounting for 37.1%) and females with 3 vehicles (10, making up 35.1%).
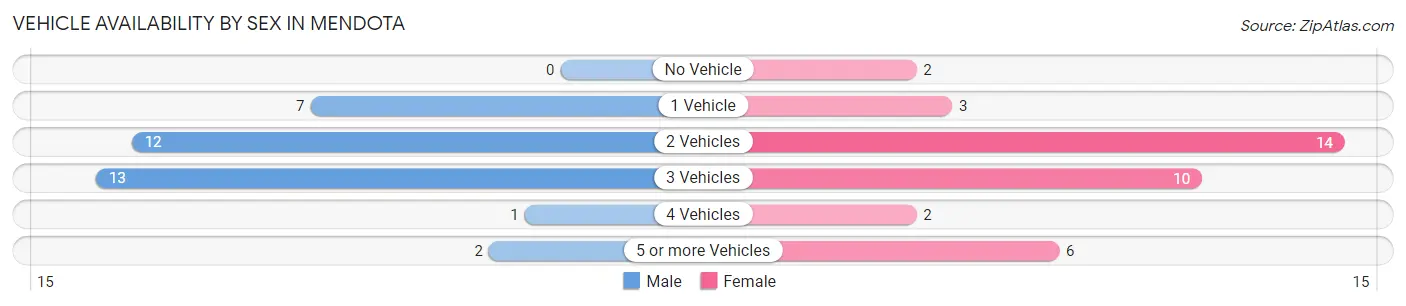
| Vehicles Available | Male | Female |
| No Vehicle | 0 (0.0%) | 2 (5.4%) |
| 1 Vehicle | 7 (20.0%) | 3 (8.1%) |
| 2 Vehicles | 12 (34.3%) | 14 (37.8%) |
| 3 Vehicles | 13 (37.1%) | 10 (27.0%) |
| 4 Vehicles | 1 (2.9%) | 2 (5.4%) |
| 5 or more Vehicles | 2 (5.7%) | 6 (16.2%) |
| Total | 35 (100.0%) | 37 (100.0%) |
Commute Time in Mendota
The most frequently occuring commute durations in Mendota are 10 to 14 minutes (10 commuters, 17.5%), 20 to 24 minutes (8 commuters, 14.0%), and 30 to 34 minutes (8 commuters, 14.0%).
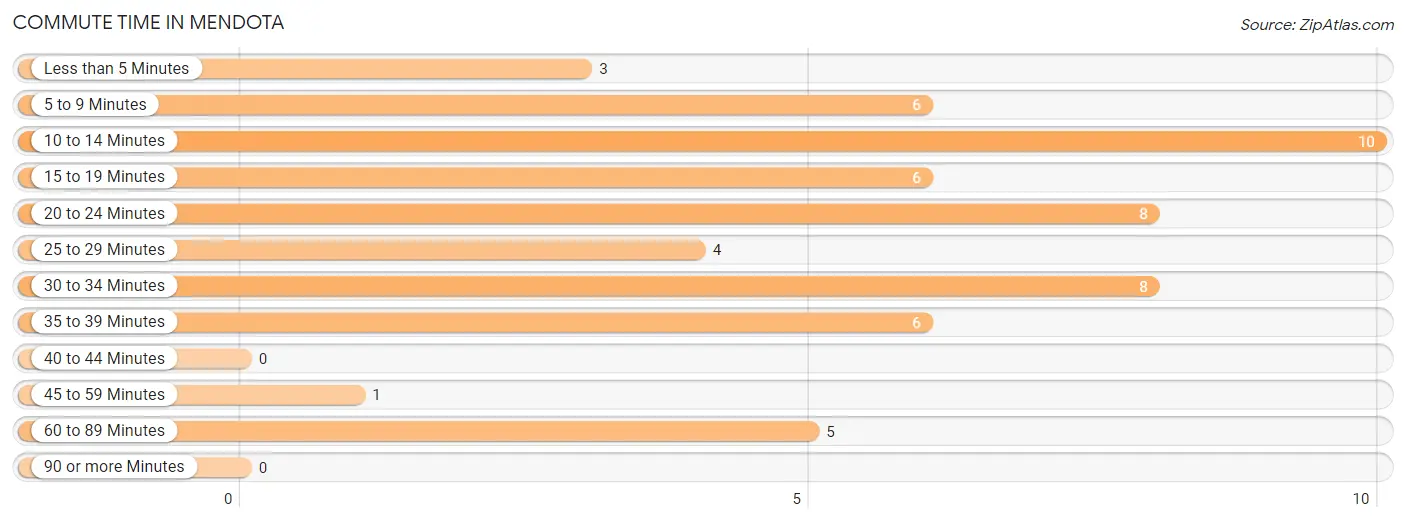
| Commute Time | # Commuters | % Commuters |
| Less than 5 Minutes | 3 | 5.3% |
| 5 to 9 Minutes | 6 | 10.5% |
| 10 to 14 Minutes | 10 | 17.5% |
| 15 to 19 Minutes | 6 | 10.5% |
| 20 to 24 Minutes | 8 | 14.0% |
| 25 to 29 Minutes | 4 | 7.0% |
| 30 to 34 Minutes | 8 | 14.0% |
| 35 to 39 Minutes | 6 | 10.5% |
| 40 to 44 Minutes | 0 | 0.0% |
| 45 to 59 Minutes | 1 | 1.8% |
| 60 to 89 Minutes | 5 | 8.8% |
| 90 or more Minutes | 0 | 0.0% |
Commute Time by Sex in Mendota
The most common commute times in Mendota are 15 to 19 minutes (6 commuters, 20.0%) for males and 5 to 9 minutes (6 commuters, 22.2%) for females.
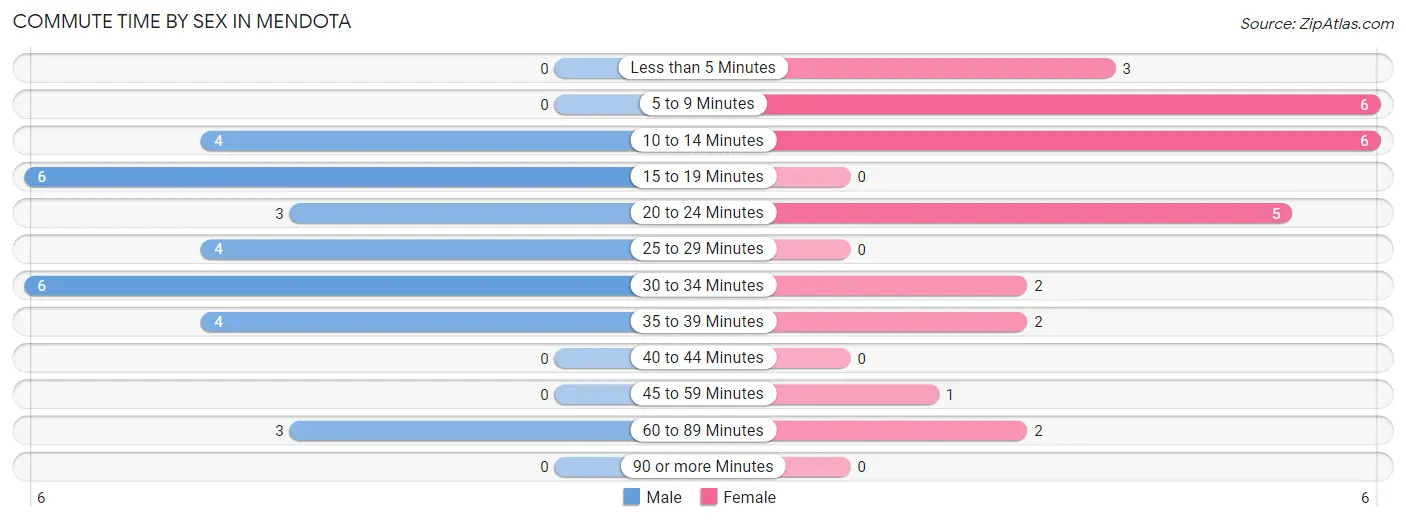
| Commute Time | Male | Female |
| Less than 5 Minutes | 0 (0.0%) | 3 (11.1%) |
| 5 to 9 Minutes | 0 (0.0%) | 6 (22.2%) |
| 10 to 14 Minutes | 4 (13.3%) | 6 (22.2%) |
| 15 to 19 Minutes | 6 (20.0%) | 0 (0.0%) |
| 20 to 24 Minutes | 3 (10.0%) | 5 (18.5%) |
| 25 to 29 Minutes | 4 (13.3%) | 0 (0.0%) |
| 30 to 34 Minutes | 6 (20.0%) | 2 (7.4%) |
| 35 to 39 Minutes | 4 (13.3%) | 2 (7.4%) |
| 40 to 44 Minutes | 0 (0.0%) | 0 (0.0%) |
| 45 to 59 Minutes | 0 (0.0%) | 1 (3.7%) |
| 60 to 89 Minutes | 3 (10.0%) | 2 (7.4%) |
| 90 or more Minutes | 0 (0.0%) | 0 (0.0%) |
Time of Departure to Work by Sex in Mendota
The most frequent times of departure to work in Mendota are 6:00 AM to 6:29 AM (10, 33.3%) for males and 8:00 AM to 8:29 AM (10, 37.0%) for females.
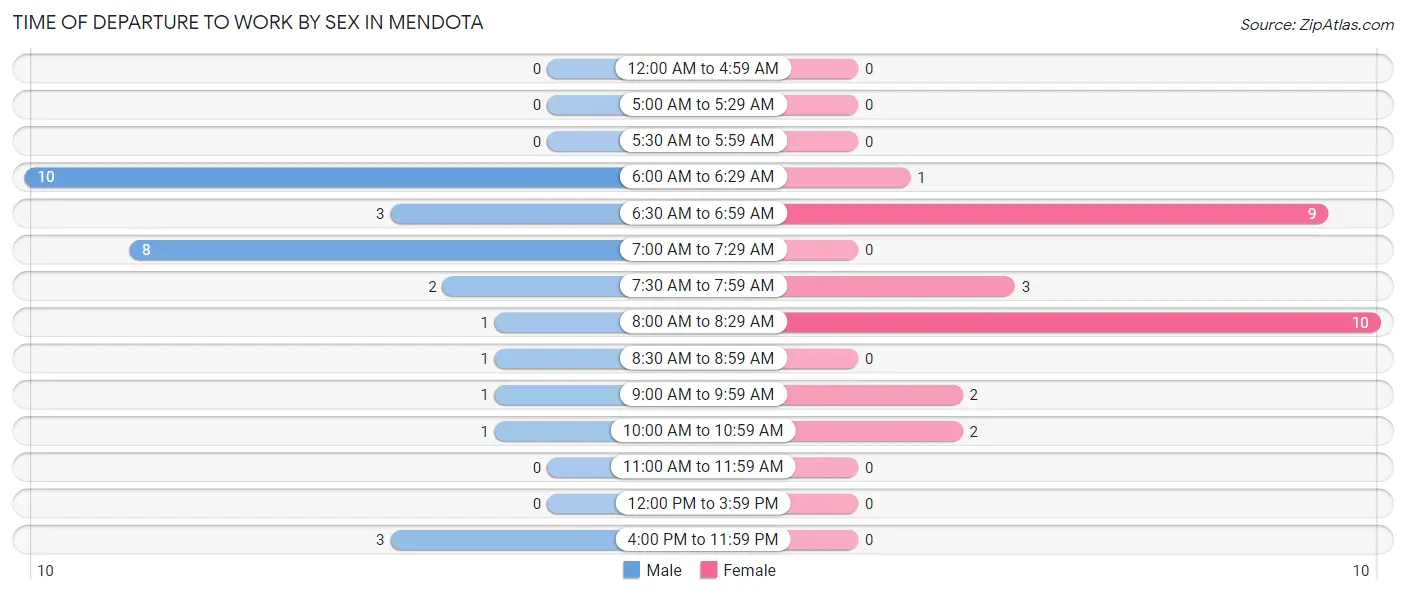
| Time of Departure | Male | Female |
| 12:00 AM to 4:59 AM | 0 (0.0%) | 0 (0.0%) |
| 5:00 AM to 5:29 AM | 0 (0.0%) | 0 (0.0%) |
| 5:30 AM to 5:59 AM | 0 (0.0%) | 0 (0.0%) |
| 6:00 AM to 6:29 AM | 10 (33.3%) | 1 (3.7%) |
| 6:30 AM to 6:59 AM | 3 (10.0%) | 9 (33.3%) |
| 7:00 AM to 7:29 AM | 8 (26.7%) | 0 (0.0%) |
| 7:30 AM to 7:59 AM | 2 (6.7%) | 3 (11.1%) |
| 8:00 AM to 8:29 AM | 1 (3.3%) | 10 (37.0%) |
| 8:30 AM to 8:59 AM | 1 (3.3%) | 0 (0.0%) |
| 9:00 AM to 9:59 AM | 1 (3.3%) | 2 (7.4%) |
| 10:00 AM to 10:59 AM | 1 (3.3%) | 2 (7.4%) |
| 11:00 AM to 11:59 AM | 0 (0.0%) | 0 (0.0%) |
| 12:00 PM to 3:59 PM | 0 (0.0%) | 0 (0.0%) |
| 4:00 PM to 11:59 PM | 3 (10.0%) | 0 (0.0%) |
| Total | 30 (100.0%) | 27 (100.0%) |
Housing Occupancy in Mendota
Occupancy by Ownership in Mendota
Of the total 54 dwellings in Mendota, owner-occupied units account for 39 (72.2%), while renter-occupied units make up 15 (27.8%).
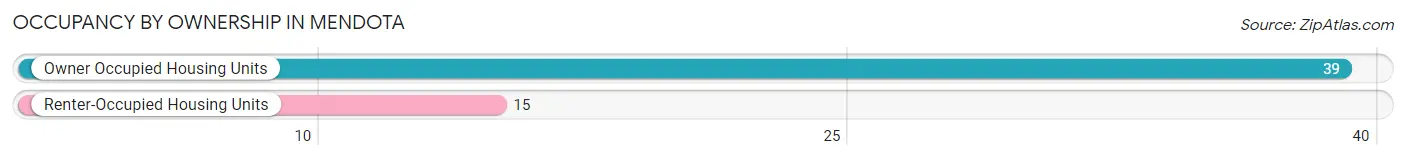
| Occupancy | # Housing Units | % Housing Units |
| Owner Occupied Housing Units | 39 | 72.2% |
| Renter-Occupied Housing Units | 15 | 27.8% |
| Total Occupied Housing Units | 54 | 100.0% |
Occupancy by Household Size in Mendota
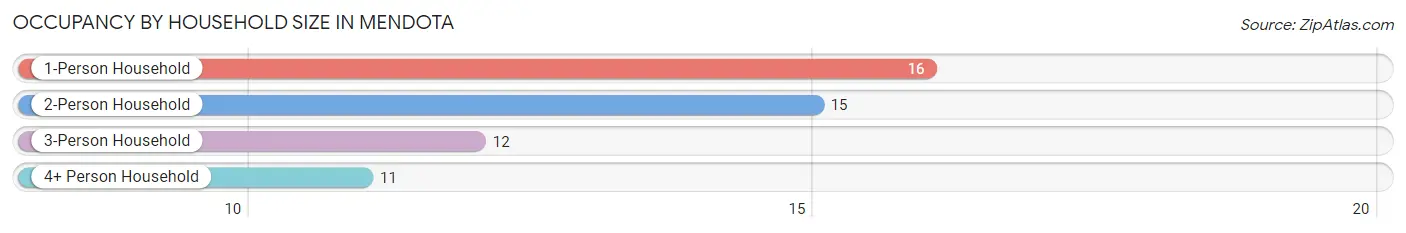
| Household Size | # Housing Units | % Housing Units |
| 1-Person Household | 16 | 29.6% |
| 2-Person Household | 15 | 27.8% |
| 3-Person Household | 12 | 22.2% |
| 4+ Person Household | 11 | 20.4% |
| Total Housing Units | 54 | 100.0% |
Occupancy by Ownership by Household Size in Mendota
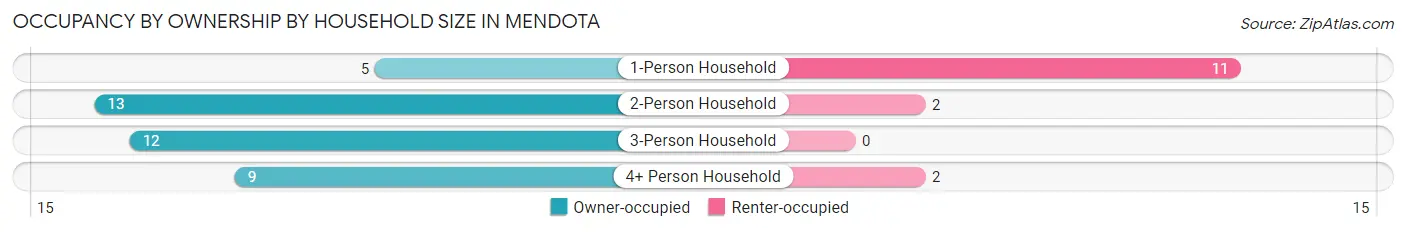
| Household Size | Owner-occupied | Renter-occupied |
| 1-Person Household | 5 (31.2%) | 11 (68.8%) |
| 2-Person Household | 13 (86.7%) | 2 (13.3%) |
| 3-Person Household | 12 (100.0%) | 0 (0.0%) |
| 4+ Person Household | 9 (81.8%) | 2 (18.2%) |
| Total Housing Units | 39 (72.2%) | 15 (27.8%) |
Occupancy by Educational Attainment in Mendota
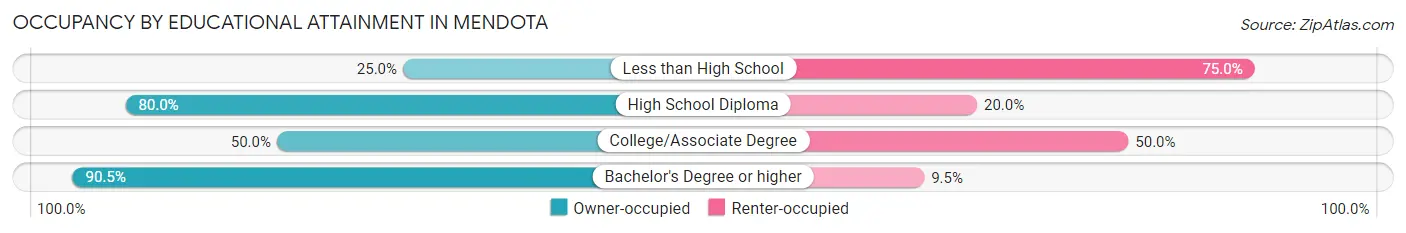
| Household Size | Owner-occupied | Renter-occupied |
| Less than High School | 1 (25.0%) | 3 (75.0%) |
| High School Diploma | 12 (80.0%) | 3 (20.0%) |
| College/Associate Degree | 7 (50.0%) | 7 (50.0%) |
| Bachelor's Degree or higher | 19 (90.5%) | 2 (9.5%) |
Occupancy by Age of Householder in Mendota
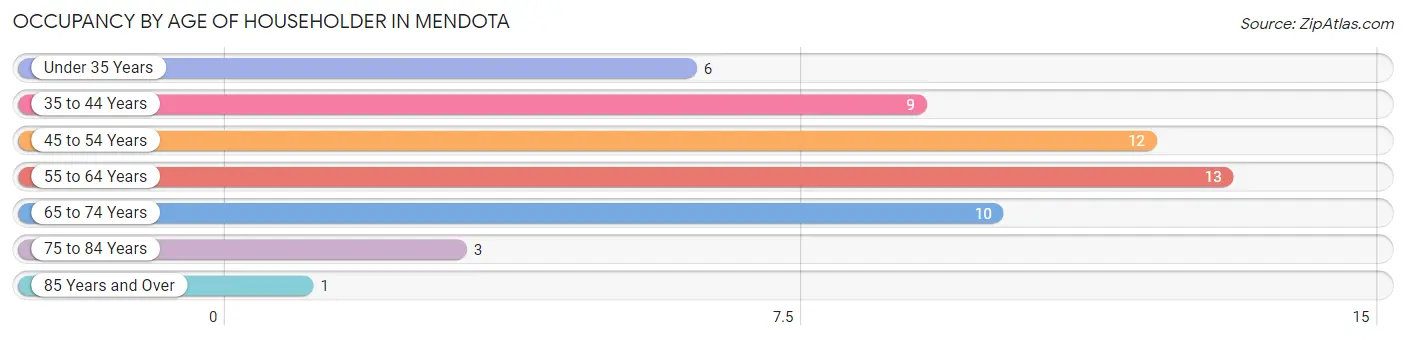
| Age Bracket | # Households | % Households |
| Under 35 Years | 6 | 11.1% |
| 35 to 44 Years | 9 | 16.7% |
| 45 to 54 Years | 12 | 22.2% |
| 55 to 64 Years | 13 | 24.1% |
| 65 to 74 Years | 10 | 18.5% |
| 75 to 84 Years | 3 | 5.6% |
| 85 Years and Over | 1 | 1.8% |
| Total | 54 | 100.0% |
Housing Finances in Mendota
Median Income by Occupancy in Mendota
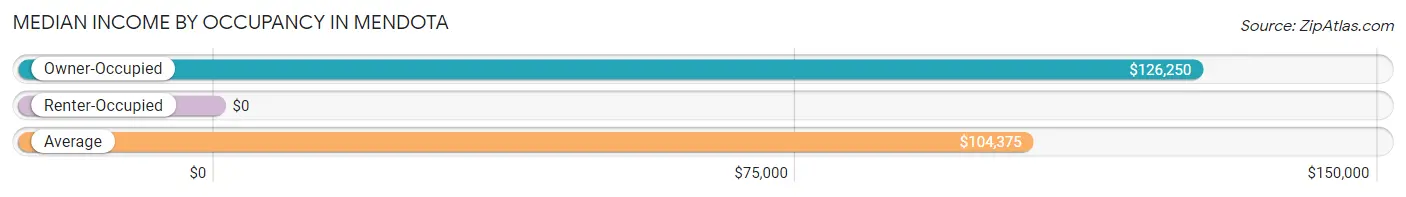
| Occupancy Type | # Households | Median Income |
| Owner-Occupied | 39 (72.2%) | $126,250 |
| Renter-Occupied | 15 (27.8%) | $0 |
| Average | 54 (100.0%) | $104,375 |
Occupancy by Householder Income Bracket in Mendota
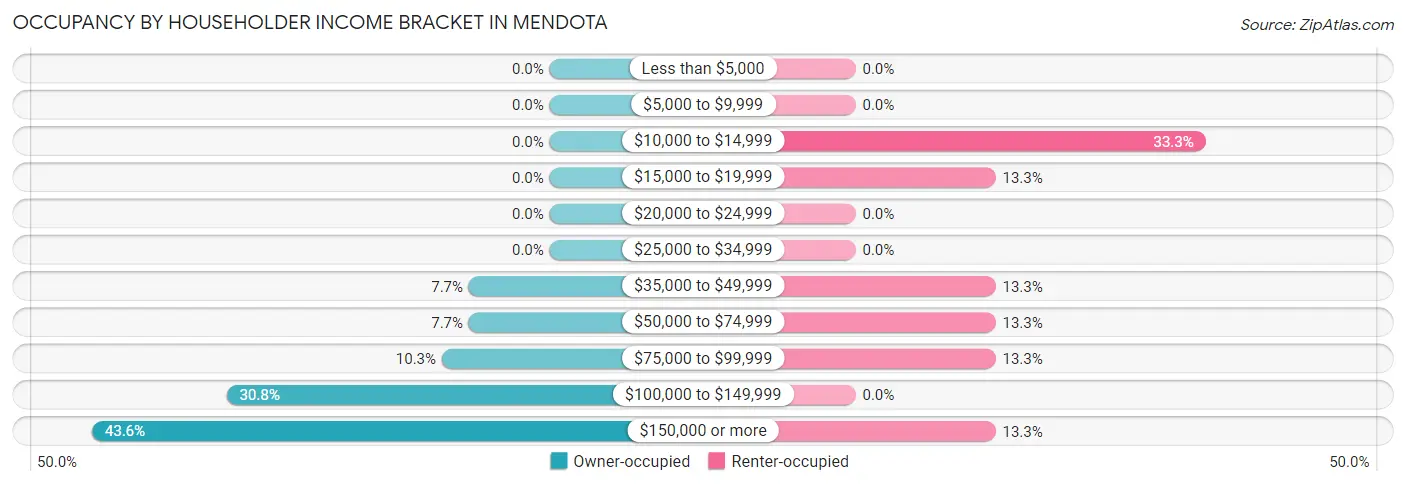
| Income Bracket | Owner-occupied | Renter-occupied |
| Less than $5,000 | 0 (0.0%) | 0 (0.0%) |
| $5,000 to $9,999 | 0 (0.0%) | 0 (0.0%) |
| $10,000 to $14,999 | 0 (0.0%) | 5 (33.3%) |
| $15,000 to $19,999 | 0 (0.0%) | 2 (13.3%) |
| $20,000 to $24,999 | 0 (0.0%) | 0 (0.0%) |
| $25,000 to $34,999 | 0 (0.0%) | 0 (0.0%) |
| $35,000 to $49,999 | 3 (7.7%) | 2 (13.3%) |
| $50,000 to $74,999 | 3 (7.7%) | 2 (13.3%) |
| $75,000 to $99,999 | 4 (10.3%) | 2 (13.3%) |
| $100,000 to $149,999 | 12 (30.8%) | 0 (0.0%) |
| $150,000 or more | 17 (43.6%) | 2 (13.3%) |
| Total | 39 (100.0%) | 15 (100.0%) |
Monthly Housing Cost Tiers in Mendota
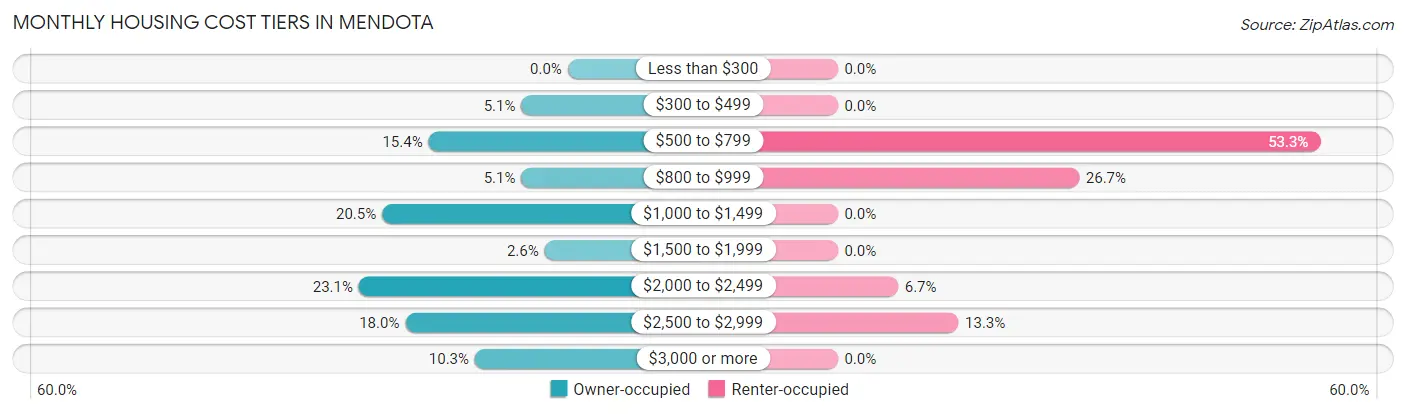
| Monthly Cost | Owner-occupied | Renter-occupied |
| Less than $300 | 0 (0.0%) | 0 (0.0%) |
| $300 to $499 | 2 (5.1%) | 0 (0.0%) |
| $500 to $799 | 6 (15.4%) | 8 (53.3%) |
| $800 to $999 | 2 (5.1%) | 4 (26.7%) |
| $1,000 to $1,499 | 8 (20.5%) | 0 (0.0%) |
| $1,500 to $1,999 | 1 (2.6%) | 0 (0.0%) |
| $2,000 to $2,499 | 9 (23.1%) | 1 (6.7%) |
| $2,500 to $2,999 | 7 (17.9%) | 2 (13.3%) |
| $3,000 or more | 4 (10.3%) | 0 (0.0%) |
| Total | 39 (100.0%) | 15 (100.0%) |
Physical Housing Characteristics in Mendota
Housing Structures in Mendota
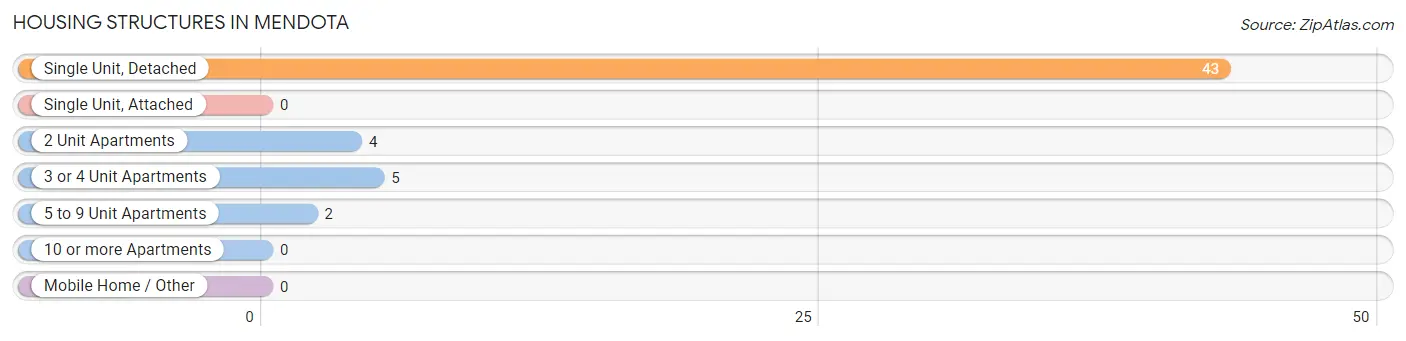
| Structure Type | # Housing Units | % Housing Units |
| Single Unit, Detached | 43 | 79.6% |
| Single Unit, Attached | 0 | 0.0% |
| 2 Unit Apartments | 4 | 7.4% |
| 3 or 4 Unit Apartments | 5 | 9.3% |
| 5 to 9 Unit Apartments | 2 | 3.7% |
| 10 or more Apartments | 0 | 0.0% |
| Mobile Home / Other | 0 | 0.0% |
| Total | 54 | 100.0% |
Housing Structures by Occupancy in Mendota
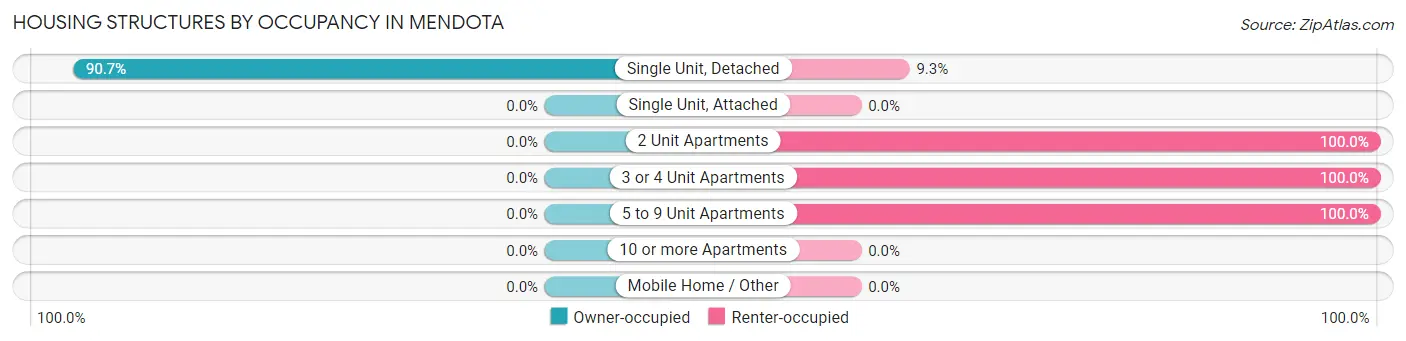
| Structure Type | Owner-occupied | Renter-occupied |
| Single Unit, Detached | 39 (90.7%) | 4 (9.3%) |
| Single Unit, Attached | 0 (0.0%) | 0 (0.0%) |
| 2 Unit Apartments | 0 (0.0%) | 4 (100.0%) |
| 3 or 4 Unit Apartments | 0 (0.0%) | 5 (100.0%) |
| 5 to 9 Unit Apartments | 0 (0.0%) | 2 (100.0%) |
| 10 or more Apartments | 0 (0.0%) | 0 (0.0%) |
| Mobile Home / Other | 0 (0.0%) | 0 (0.0%) |
| Total | 39 (72.2%) | 15 (27.8%) |
Housing Structures by Number of Rooms in Mendota
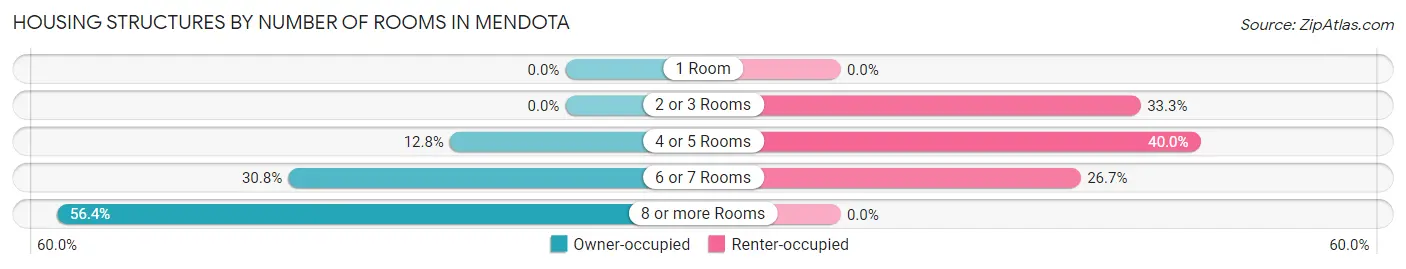
| Number of Rooms | Owner-occupied | Renter-occupied |
| 1 Room | 0 (0.0%) | 0 (0.0%) |
| 2 or 3 Rooms | 0 (0.0%) | 5 (33.3%) |
| 4 or 5 Rooms | 5 (12.8%) | 6 (40.0%) |
| 6 or 7 Rooms | 12 (30.8%) | 4 (26.7%) |
| 8 or more Rooms | 22 (56.4%) | 0 (0.0%) |
| Total | 39 (100.0%) | 15 (100.0%) |
Housing Structure by Heating Type in Mendota
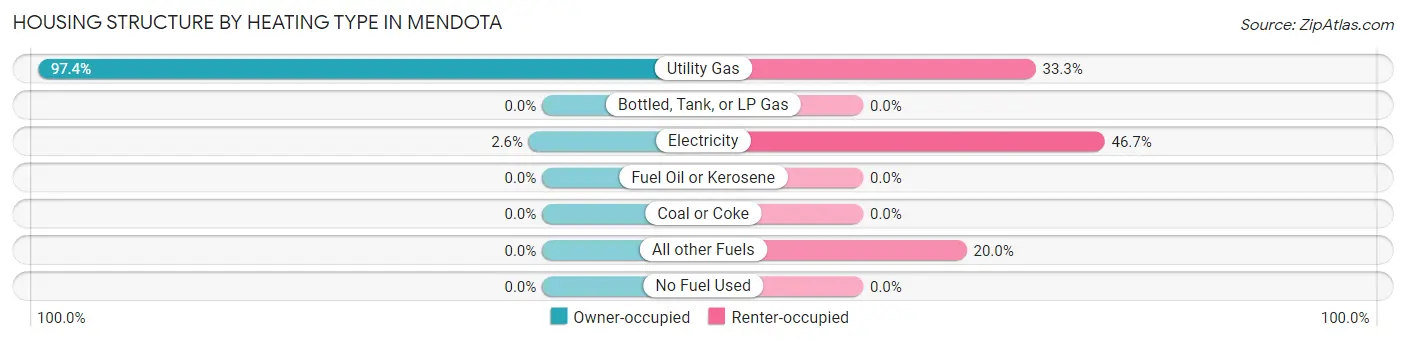
| Heating Type | Owner-occupied | Renter-occupied |
| Utility Gas | 38 (97.4%) | 5 (33.3%) |
| Bottled, Tank, or LP Gas | 0 (0.0%) | 0 (0.0%) |
| Electricity | 1 (2.6%) | 7 (46.7%) |
| Fuel Oil or Kerosene | 0 (0.0%) | 0 (0.0%) |
| Coal or Coke | 0 (0.0%) | 0 (0.0%) |
| All other Fuels | 0 (0.0%) | 3 (20.0%) |
| No Fuel Used | 0 (0.0%) | 0 (0.0%) |
| Total | 39 (100.0%) | 15 (100.0%) |
Household Vehicle Usage in Mendota
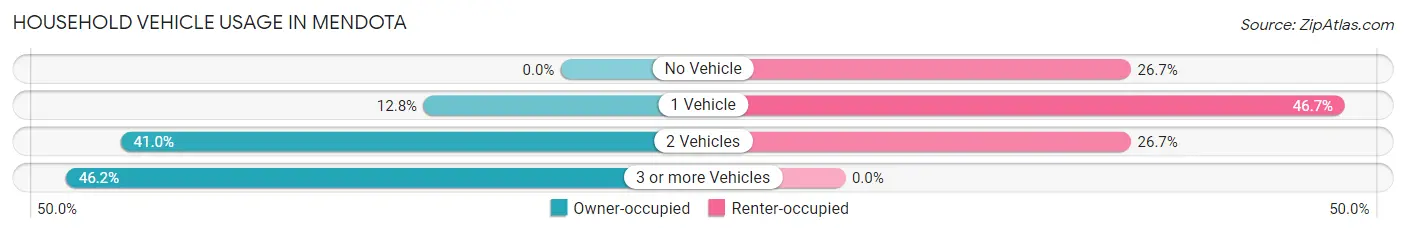
| Vehicles per Household | Owner-occupied | Renter-occupied |
| No Vehicle | 0 (0.0%) | 4 (26.7%) |
| 1 Vehicle | 5 (12.8%) | 7 (46.7%) |
| 2 Vehicles | 16 (41.0%) | 4 (26.7%) |
| 3 or more Vehicles | 18 (46.2%) | 0 (0.0%) |
| Total | 39 (100.0%) | 15 (100.0%) |
Real Estate & Mortgages in Mendota
Real Estate and Mortgage Overview in Mendota
| Characteristic | Without Mortgage | With Mortgage |
| Housing Units | 17 | 22 |
| Median Property Value | $1,375,000 | $333,300 |
| Median Household Income | $122,917 | $12 |
| Monthly Housing Costs | - | - |
| Real Estate Taxes | - | - |
Property Value by Mortgage Status in Mendota
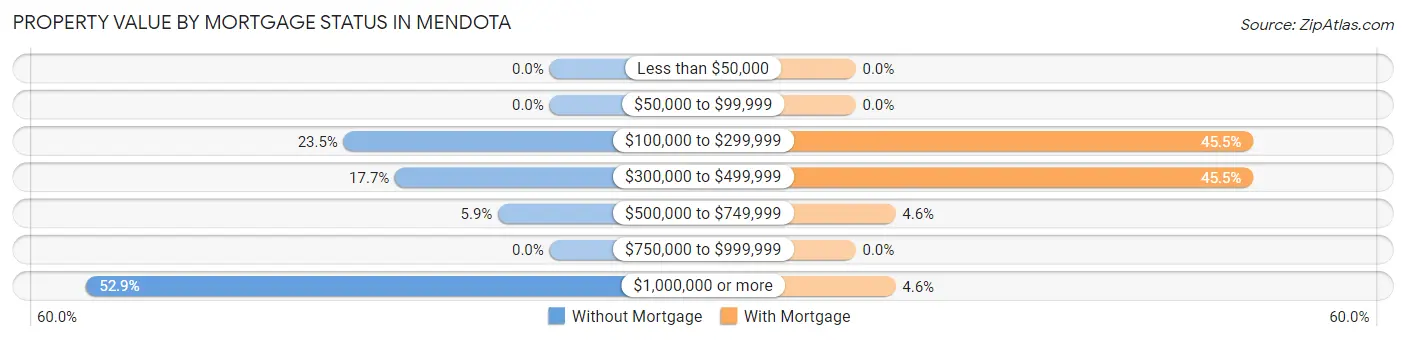
| Property Value | Without Mortgage | With Mortgage |
| Less than $50,000 | 0 (0.0%) | 0 (0.0%) |
| $50,000 to $99,999 | 0 (0.0%) | 0 (0.0%) |
| $100,000 to $299,999 | 4 (23.5%) | 10 (45.5%) |
| $300,000 to $499,999 | 3 (17.6%) | 10 (45.5%) |
| $500,000 to $749,999 | 1 (5.9%) | 1 (4.5%) |
| $750,000 to $999,999 | 0 (0.0%) | 0 (0.0%) |
| $1,000,000 or more | 9 (52.9%) | 1 (4.5%) |
| Total | 17 (100.0%) | 22 (100.0%) |
Household Income by Mortgage Status in Mendota
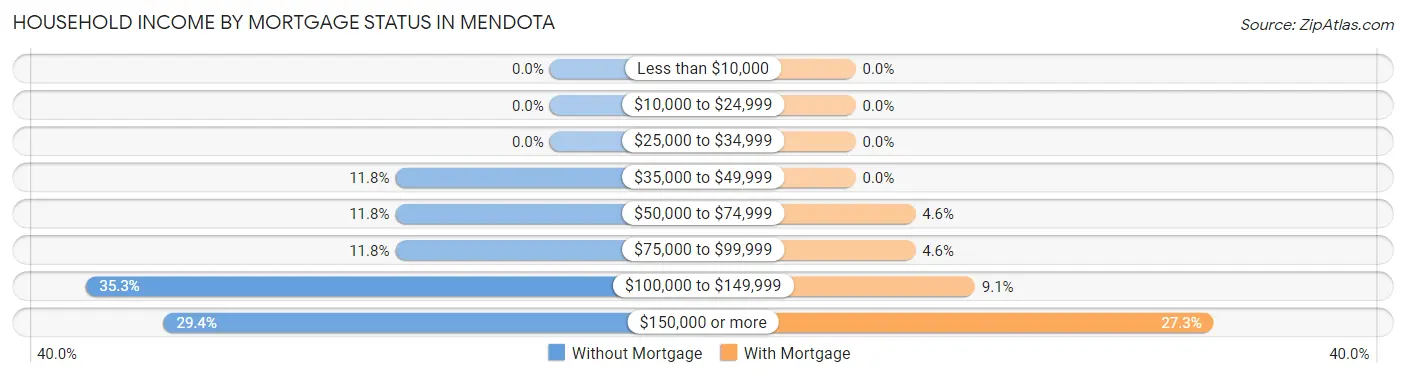
| Household Income | Without Mortgage | With Mortgage |
| Less than $10,000 | 0 (0.0%) | 0 (0.0%) |
| $10,000 to $24,999 | 0 (0.0%) | 0 (0.0%) |
| $25,000 to $34,999 | 0 (0.0%) | 0 (0.0%) |
| $35,000 to $49,999 | 2 (11.8%) | 0 (0.0%) |
| $50,000 to $74,999 | 2 (11.8%) | 1 (4.5%) |
| $75,000 to $99,999 | 2 (11.8%) | 1 (4.5%) |
| $100,000 to $149,999 | 6 (35.3%) | 2 (9.1%) |
| $150,000 or more | 5 (29.4%) | 6 (27.3%) |
| Total | 17 (100.0%) | 22 (100.0%) |
Property Value to Household Income Ratio in Mendota
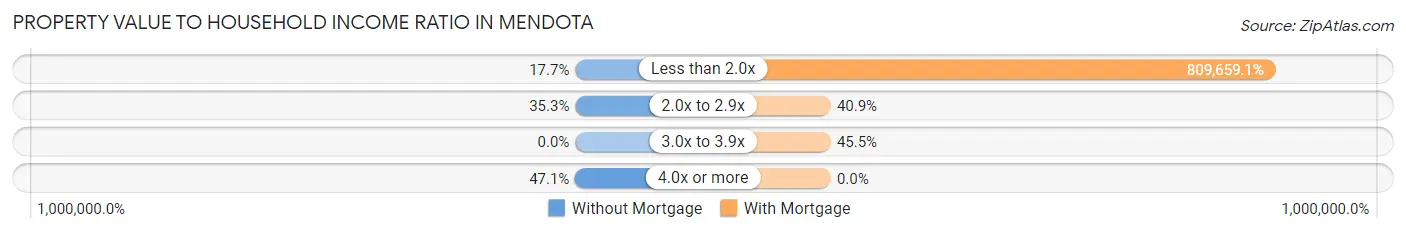
| Value-to-Income Ratio | Without Mortgage | With Mortgage |
| Less than 2.0x | 3 (17.6%) | 178,125 (809,659.1%) |
| 2.0x to 2.9x | 6 (35.3%) | 9 (40.9%) |
| 3.0x to 3.9x | 0 (0.0%) | 10 (45.5%) |
| 4.0x or more | 8 (47.1%) | 0 (0.0%) |
| Total | 17 (100.0%) | 22 (100.0%) |
Real Estate Taxes by Mortgage Status in Mendota
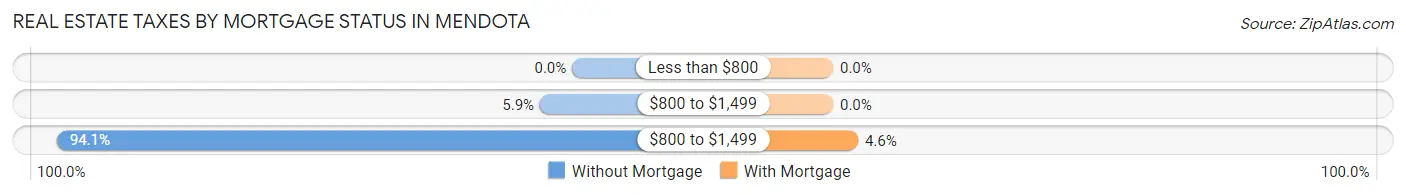
| Property Taxes | Without Mortgage | With Mortgage |
| Less than $800 | 0 (0.0%) | 0 (0.0%) |
| $800 to $1,499 | 1 (5.9%) | 0 (0.0%) |
| $800 to $1,499 | 16 (94.1%) | 1 (4.5%) |
| Total | 17 (100.0%) | 22 (100.0%) |
Health & Disability in Mendota
Health Insurance Coverage by Age in Mendota
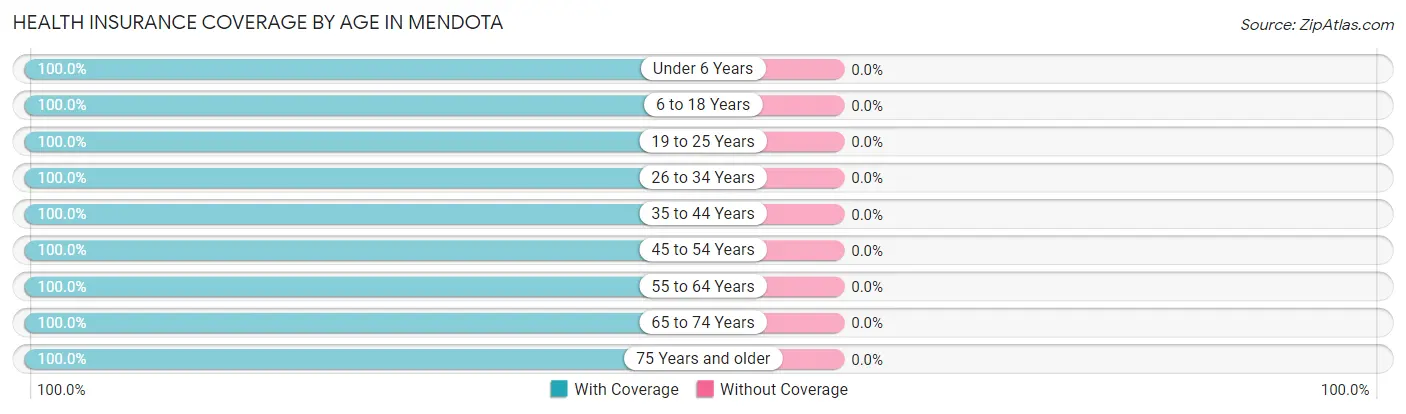
| Age Bracket | With Coverage | Without Coverage |
| Under 6 Years | 11 (100.0%) | 0 (0.0%) |
| 6 to 18 Years | 20 (100.0%) | 0 (0.0%) |
| 19 to 25 Years | 9 (100.0%) | 0 (0.0%) |
| 26 to 34 Years | 20 (100.0%) | 0 (0.0%) |
| 35 to 44 Years | 17 (100.0%) | 0 (0.0%) |
| 45 to 54 Years | 19 (100.0%) | 0 (0.0%) |
| 55 to 64 Years | 20 (100.0%) | 0 (0.0%) |
| 65 to 74 Years | 15 (100.0%) | 0 (0.0%) |
| 75 Years and older | 9 (100.0%) | 0 (0.0%) |
| Total | 140 (100.0%) | 0 (0.0%) |
Health Insurance Coverage by Citizenship Status in Mendota
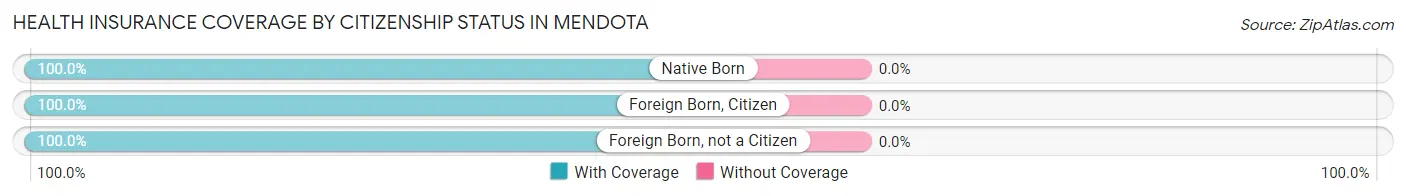
| Citizenship Status | With Coverage | Without Coverage |
| Native Born | 11 (100.0%) | 0 (0.0%) |
| Foreign Born, Citizen | 20 (100.0%) | 0 (0.0%) |
| Foreign Born, not a Citizen | 9 (100.0%) | 0 (0.0%) |
Health Insurance Coverage by Household Income in Mendota
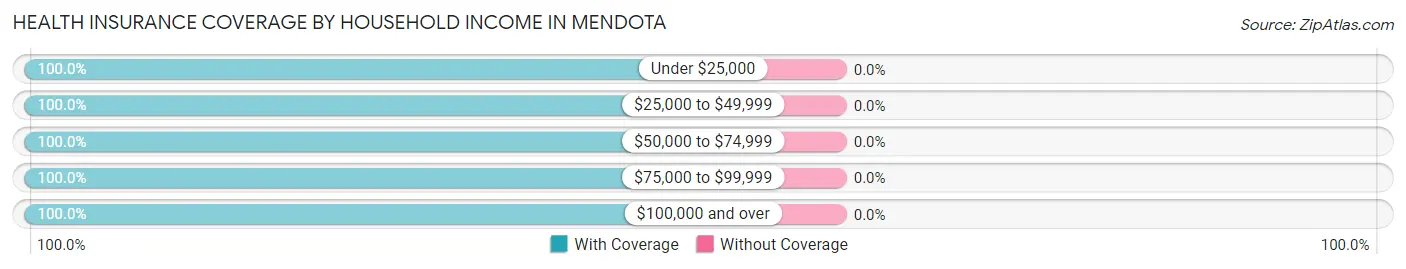
| Household Income | With Coverage | Without Coverage |
| Under $25,000 | 7 (100.0%) | 0 (0.0%) |
| $25,000 to $49,999 | 9 (100.0%) | 0 (0.0%) |
| $50,000 to $74,999 | 8 (100.0%) | 0 (0.0%) |
| $75,000 to $99,999 | 19 (100.0%) | 0 (0.0%) |
| $100,000 and over | 92 (100.0%) | 0 (0.0%) |
Public vs Private Health Insurance Coverage by Age in Mendota
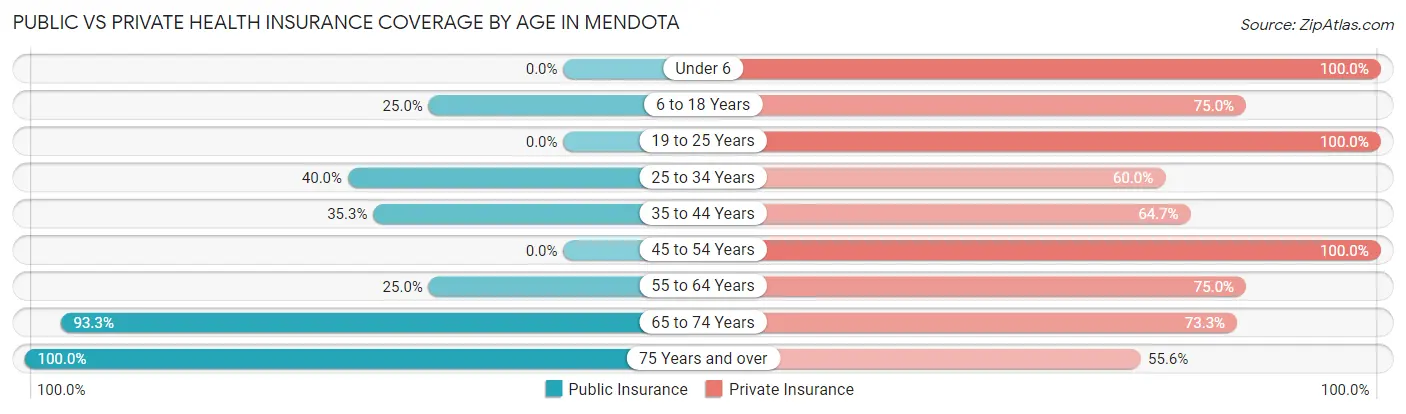
| Age Bracket | Public Insurance | Private Insurance |
| Under 6 | 0 (0.0%) | 11 (100.0%) |
| 6 to 18 Years | 5 (25.0%) | 15 (75.0%) |
| 19 to 25 Years | 0 (0.0%) | 9 (100.0%) |
| 25 to 34 Years | 8 (40.0%) | 12 (60.0%) |
| 35 to 44 Years | 6 (35.3%) | 11 (64.7%) |
| 45 to 54 Years | 0 (0.0%) | 19 (100.0%) |
| 55 to 64 Years | 5 (25.0%) | 15 (75.0%) |
| 65 to 74 Years | 14 (93.3%) | 11 (73.3%) |
| 75 Years and over | 9 (100.0%) | 5 (55.6%) |
| Total | 47 (33.6%) | 108 (77.1%) |
Disability Status by Sex by Age in Mendota
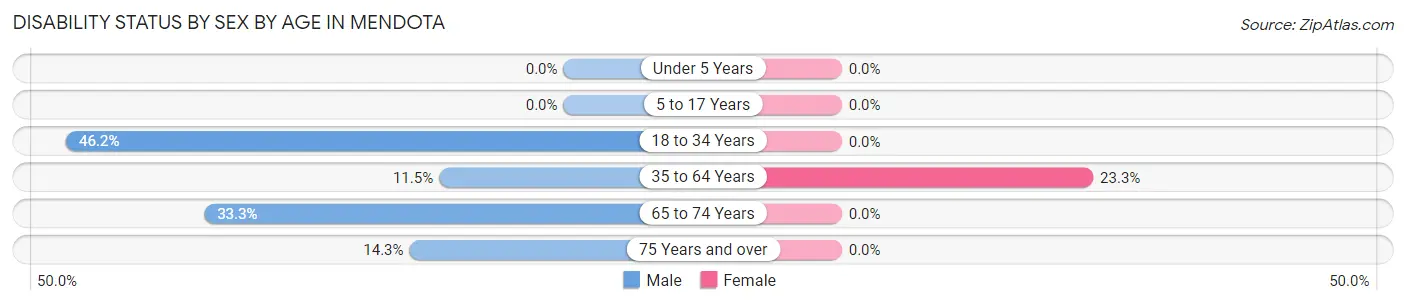
| Age Bracket | Male | Female |
| Under 5 Years | 0 (0.0%) | 0 (0.0%) |
| 5 to 17 Years | 0 (0.0%) | 0 (0.0%) |
| 18 to 34 Years | 6 (46.2%) | 0 (0.0%) |
| 35 to 64 Years | 3 (11.5%) | 7 (23.3%) |
| 65 to 74 Years | 3 (33.3%) | 0 (0.0%) |
| 75 Years and over | 1 (14.3%) | 0 (0.0%) |
Disability Class by Sex by Age in Mendota
Disability Class: Hearing Difficulty
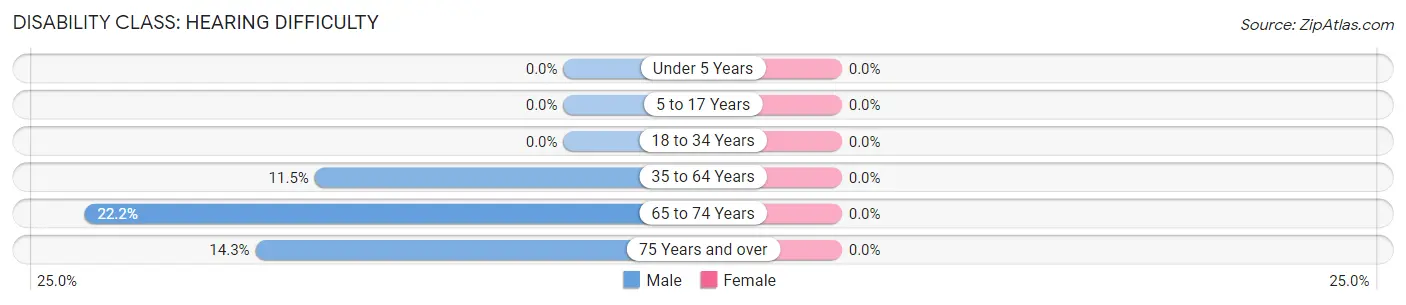
| Age Bracket | Male | Female |
| Under 5 Years | 0 (0.0%) | 0 (0.0%) |
| 5 to 17 Years | 0 (0.0%) | 0 (0.0%) |
| 18 to 34 Years | 0 (0.0%) | 0 (0.0%) |
| 35 to 64 Years | 3 (11.5%) | 0 (0.0%) |
| 65 to 74 Years | 2 (22.2%) | 0 (0.0%) |
| 75 Years and over | 1 (14.3%) | 0 (0.0%) |
Disability Class: Vision Difficulty
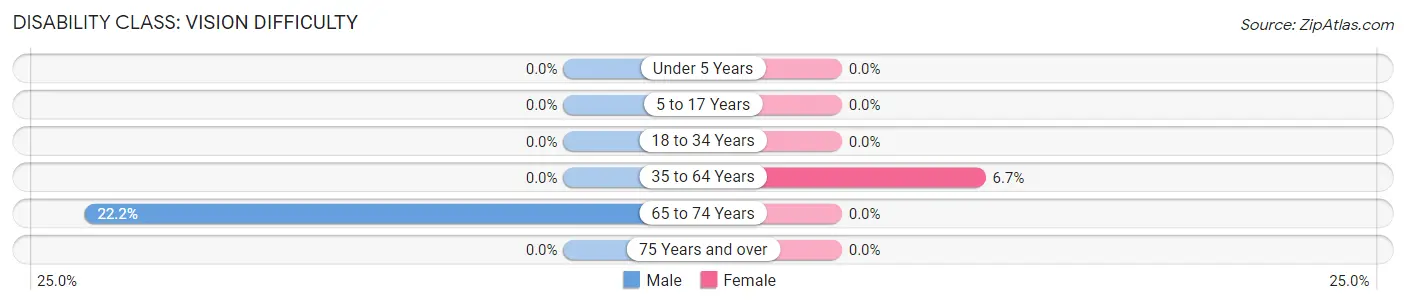
| Age Bracket | Male | Female |
| Under 5 Years | 0 (0.0%) | 0 (0.0%) |
| 5 to 17 Years | 0 (0.0%) | 0 (0.0%) |
| 18 to 34 Years | 0 (0.0%) | 0 (0.0%) |
| 35 to 64 Years | 0 (0.0%) | 2 (6.7%) |
| 65 to 74 Years | 2 (22.2%) | 0 (0.0%) |
| 75 Years and over | 0 (0.0%) | 0 (0.0%) |
Disability Class: Cognitive Difficulty
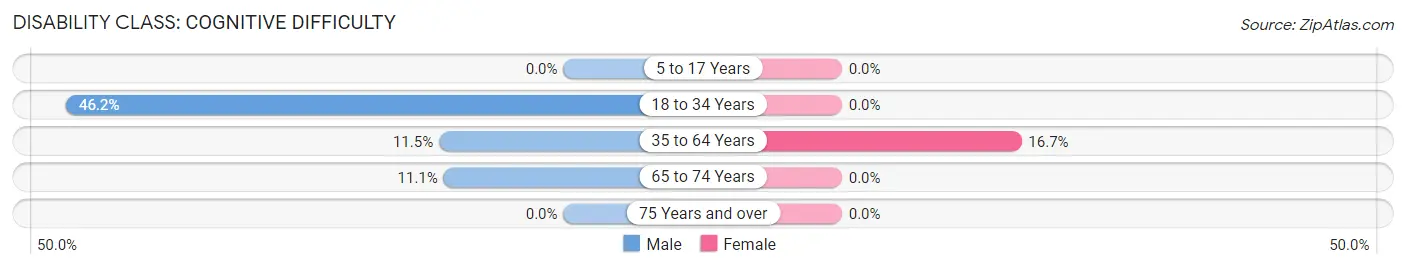
| Age Bracket | Male | Female |
| 5 to 17 Years | 0 (0.0%) | 0 (0.0%) |
| 18 to 34 Years | 6 (46.2%) | 0 (0.0%) |
| 35 to 64 Years | 3 (11.5%) | 5 (16.7%) |
| 65 to 74 Years | 1 (11.1%) | 0 (0.0%) |
| 75 Years and over | 0 (0.0%) | 0 (0.0%) |
Disability Class: Ambulatory Difficulty
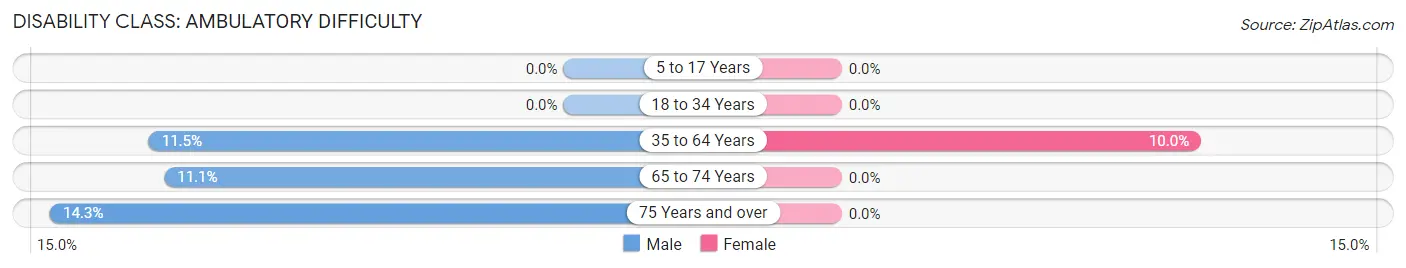
| Age Bracket | Male | Female |
| 5 to 17 Years | 0 (0.0%) | 0 (0.0%) |
| 18 to 34 Years | 0 (0.0%) | 0 (0.0%) |
| 35 to 64 Years | 3 (11.5%) | 3 (10.0%) |
| 65 to 74 Years | 1 (11.1%) | 0 (0.0%) |
| 75 Years and over | 1 (14.3%) | 0 (0.0%) |
Disability Class: Self-Care Difficulty
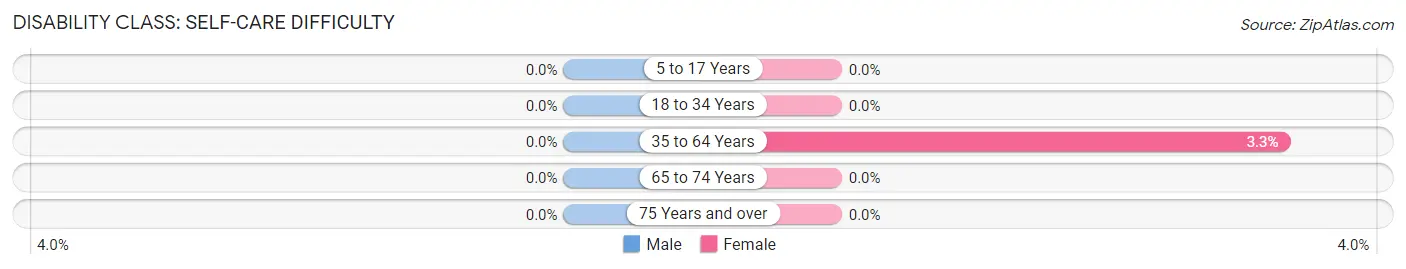
| Age Bracket | Male | Female |
| 5 to 17 Years | 0 (0.0%) | 0 (0.0%) |
| 18 to 34 Years | 0 (0.0%) | 0 (0.0%) |
| 35 to 64 Years | 0 (0.0%) | 1 (3.3%) |
| 65 to 74 Years | 0 (0.0%) | 0 (0.0%) |
| 75 Years and over | 0 (0.0%) | 0 (0.0%) |
Technology Access in Mendota
Computing Device Access in Mendota
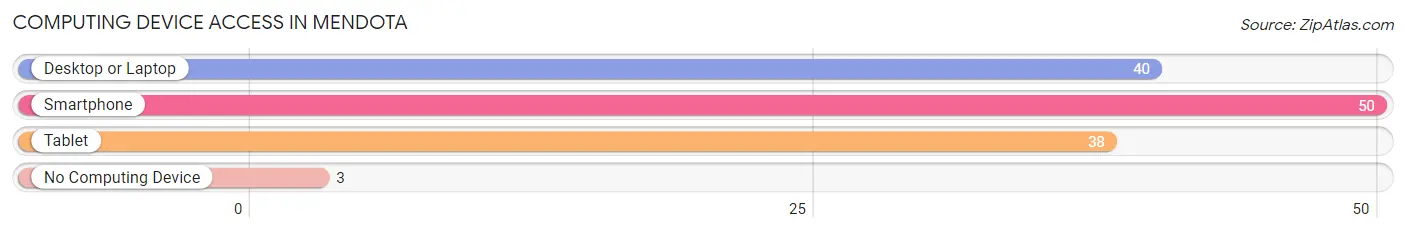
| Device Type | # Households | % Households |
| Desktop or Laptop | 40 | 74.1% |
| Smartphone | 50 | 92.6% |
| Tablet | 38 | 70.4% |
| No Computing Device | 3 | 5.6% |
| Total | 54 | 100.0% |
Internet Access in Mendota
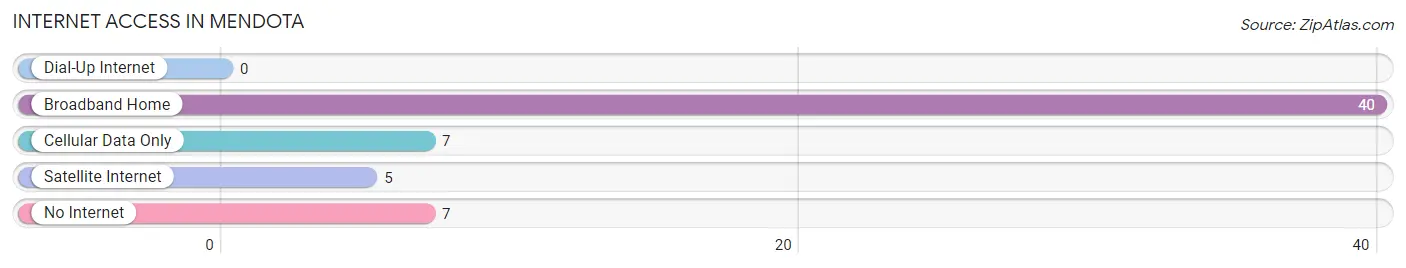
| Internet Type | # Households | % Households |
| Dial-Up Internet | 0 | 0.0% |
| Broadband Home | 40 | 74.1% |
| Cellular Data Only | 7 | 13.0% |
| Satellite Internet | 5 | 9.3% |
| No Internet | 7 | 13.0% |
| Total | 54 | 100.0% |
Mendota Summary
Mendota, Minnesota is a small city located in Dakota County, just south of the Twin Cities of Minneapolis and St. Paul. It is situated on the banks of the Mississippi River, and is home to a population of just over 2,000 people. The city is known for its rich history, beautiful geography, and vibrant economy.
History
Mendota was first settled in 1839 by a group of French-Canadian fur traders. The city was named after the nearby Mendota Rapids, which were named after the Dakota Sioux word for “meeting place”. The city was incorporated in 1858, and was the first city in Dakota County.
In the late 19th century, Mendota was a popular destination for wealthy Minnesotans looking to escape the hustle and bustle of the Twin Cities. The city was home to several grand estates, including the historic Sibley House, which was built in 1856 and is now a museum.
The city was also home to a thriving commercial district, which included a number of stores, restaurants, and other businesses. The city was also home to a number of industries, including a flour mill, a brickyard, and a brewery.
Geography
Mendota is located in the southeastern corner of Dakota County, just south of the Twin Cities. The city is situated on the banks of the Mississippi River, and is surrounded by rolling hills and lush forests. The city is home to several parks, including the Mendota Nature Reserve, which is a popular destination for birdwatchers and nature lovers.
The city is also home to a number of historic sites, including the Sibley House, the Mendota Bridge, and the Mendota Lighthouse. The city is also home to a number of recreational activities, including fishing, boating, and hiking.
Economy
Mendota’s economy is largely based on tourism and retail. The city is home to a number of small businesses, including restaurants, shops, and galleries. The city is also home to a number of larger businesses, including a hospital, a bank, and a grocery store.
The city is also home to a number of manufacturing companies, including a paper mill, a printing company, and a plastics factory. The city is also home to a number of government offices, including the Dakota County Courthouse and the Mendota Police Department.
Demographics
As of the 2010 census, the population of Mendota was 2,062. The city is predominantly white, with a small Hispanic population. The median household income is $50,000, and the median home value is $170,000.
Mendota is a small city with a rich history, beautiful geography, and vibrant economy. The city is home to a diverse population, and is a popular destination for tourists and locals alike. The city is home to a number of businesses, government offices, and recreational activities, making it a great place to live and work.
Common Questions
What is Per Capita Income in Mendota?
Per Capita income in Mendota is $71,380.
What is the Median Family Income in Mendota?
Median Family Income in Mendota is $131,250.
What is the Median Household income in Mendota?
Median Household Income in Mendota is $104,375.
What is Income or Wage Gap in Mendota?
Income or Wage Gap in Mendota is 66.2%.
Women in Mendota earn 33.8 cents for every dollar earned by a man.
What is Inequality or Gini Index in Mendota?
Inequality or Gini Index in Mendota is 0.55.
What is the Total Population of Mendota?
Total Population of Mendota is 142.
What is the Total Male Population of Mendota?
Total Male Population of Mendota is 66.
What is the Total Female Population of Mendota?
Total Female Population of Mendota is 76.
What is the Ratio of Males per 100 Females in Mendota?
There are 86.84 Males per 100 Females in Mendota.
What is the Ratio of Females per 100 Males in Mendota?
There are 115.15 Females per 100 Males in Mendota.
What is the Median Population Age in Mendota?
Median Population Age in Mendota is 40.5 Years.
What is the Average Family Size in Mendota
Average Family Size in Mendota is 3.1 People.
What is the Average Household Size in Mendota
Average Household Size in Mendota is 2.5 People.
How Large is the Labor Force in Mendota?
There are 75 People in the Labor Forcein in Mendota.
What is the Percentage of People in the Labor Force in Mendota?
65.2% of People are in the Labor Force in Mendota.
What is the Unemployment Rate in Mendota?
Unemployment Rate in Mendota is 4.1%.