Limestone, OK Map & Demographics
Limestone Map
Limestone Overview
$50,915
PER CAPITA INCOME
$109,167
AVG FAMILY INCOME
$109,875
AVG HOUSEHOLD INCOME
42.8%
WAGE / INCOME GAP [ % ]
57.2¢/ $1
WAGE / INCOME GAP [ $ ]
0.44
INEQUALITY / GINI INDEX
802
TOTAL POPULATION
433
MALE POPULATION
369
FEMALE POPULATION
117.34
MALES / 100 FEMALES
85.22
FEMALES / 100 MALES
40.7
MEDIAN AGE
3.4
AVG FAMILY SIZE
3.3
AVG HOUSEHOLD SIZE
441
LABOR FORCE [ PEOPLE ]
70.2%
PERCENT IN LABOR FORCE
1.8%
UNEMPLOYMENT RATE
Income in Limestone
Income Overview in Limestone
Per Capita Income in Limestone is $50,915, while median incomes of families and households are $109,167 and $109,875 respectively.
| Characteristic | Number | Measure |
| Per Capita Income | 802 | $50,915 |
| Median Family Income | 216 | $109,167 |
| Mean Family Income | 216 | $169,078 |
| Median Household Income | 246 | $109,875 |
| Mean Household Income | 246 | $160,407 |
| Income Deficit | 216 | $0 |
| Wage / Income Gap (%) | 802 | 42.76% |
| Wage / Income Gap ($) | 802 | 57.24¢ per $1 |
| Gini / Inequality Index | 802 | 0.44 |
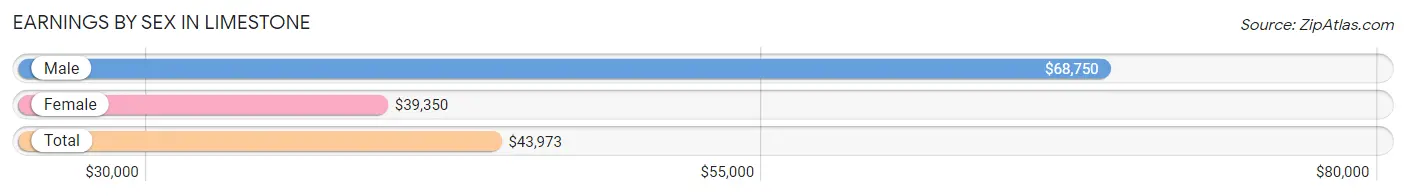
Earnings by Sex in Limestone
Average Earnings in Limestone are $43,973, $68,750 for men and $39,350 for women, a difference of 42.8%.
| Sex | Number | Average Earnings |
| Male | 284 (64.4%) | $68,750 |
| Female | 157 (35.6%) | $39,350 |
| Total | 441 (100.0%) | $43,973 |
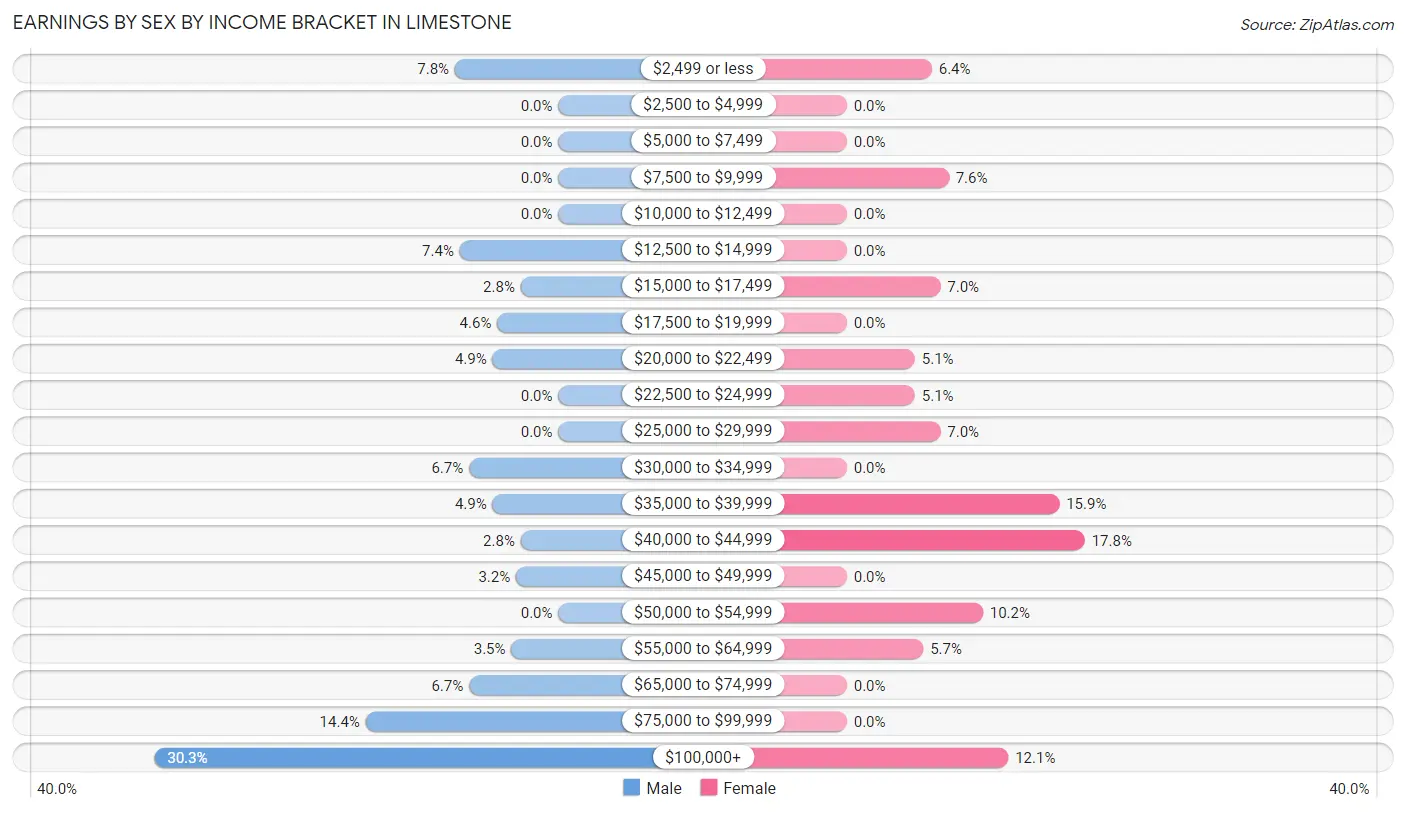
Earnings by Sex by Income Bracket in Limestone
The most common earnings brackets in Limestone are $100,000+ for men (86 | 30.3%) and $40,000 to $44,999 for women (28 | 17.8%).
| Income | Male | Female |
| $2,499 or less | 22 (7.7%) | 10 (6.4%) |
| $2,500 to $4,999 | 0 (0.0%) | 0 (0.0%) |
| $5,000 to $7,499 | 0 (0.0%) | 0 (0.0%) |
| $7,500 to $9,999 | 0 (0.0%) | 12 (7.6%) |
| $10,000 to $12,499 | 0 (0.0%) | 0 (0.0%) |
| $12,500 to $14,999 | 21 (7.4%) | 0 (0.0%) |
| $15,000 to $17,499 | 8 (2.8%) | 11 (7.0%) |
| $17,500 to $19,999 | 13 (4.6%) | 0 (0.0%) |
| $20,000 to $22,499 | 14 (4.9%) | 8 (5.1%) |
| $22,500 to $24,999 | 0 (0.0%) | 8 (5.1%) |
| $25,000 to $29,999 | 0 (0.0%) | 11 (7.0%) |
| $30,000 to $34,999 | 19 (6.7%) | 0 (0.0%) |
| $35,000 to $39,999 | 14 (4.9%) | 25 (15.9%) |
| $40,000 to $44,999 | 8 (2.8%) | 28 (17.8%) |
| $45,000 to $49,999 | 9 (3.2%) | 0 (0.0%) |
| $50,000 to $54,999 | 0 (0.0%) | 16 (10.2%) |
| $55,000 to $64,999 | 10 (3.5%) | 9 (5.7%) |
| $65,000 to $74,999 | 19 (6.7%) | 0 (0.0%) |
| $75,000 to $99,999 | 41 (14.4%) | 0 (0.0%) |
| $100,000+ | 86 (30.3%) | 19 (12.1%) |
| Total | 284 (100.0%) | 157 (100.0%) |
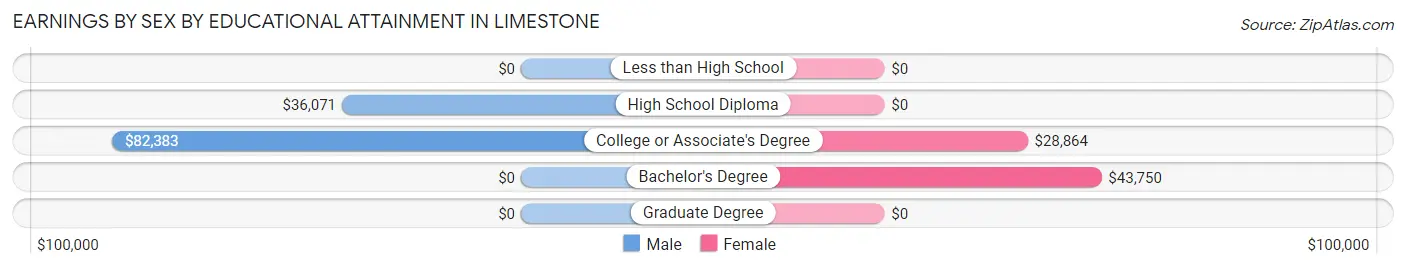
Earnings by Sex by Educational Attainment in Limestone
Average earnings in Limestone are $80,156 for men and $39,350 for women, a difference of 50.9%. Men with an educational attainment of college or associate's degree enjoy the highest average annual earnings of $82,383, while those with high school diploma education earn the least with $36,071. Women with an educational attainment of bachelor's degree earn the most with the average annual earnings of $43,750, while those with college or associate's degree education have the smallest earnings of $28,864.
| Educational Attainment | Male Income | Female Income |
| Less than High School | - | - |
| High School Diploma | $36,071 | $0 |
| College or Associate's Degree | $82,383 | $28,864 |
| Bachelor's Degree | - | - |
| Graduate Degree | - | - |
| Total | $80,156 | $39,350 |
Family Income in Limestone
Family Income Brackets in Limestone
According to the Limestone family income data, there are 63 families falling into the $100,000 to $149,999 income range, which is the most common income bracket and makes up 29.2% of all families.
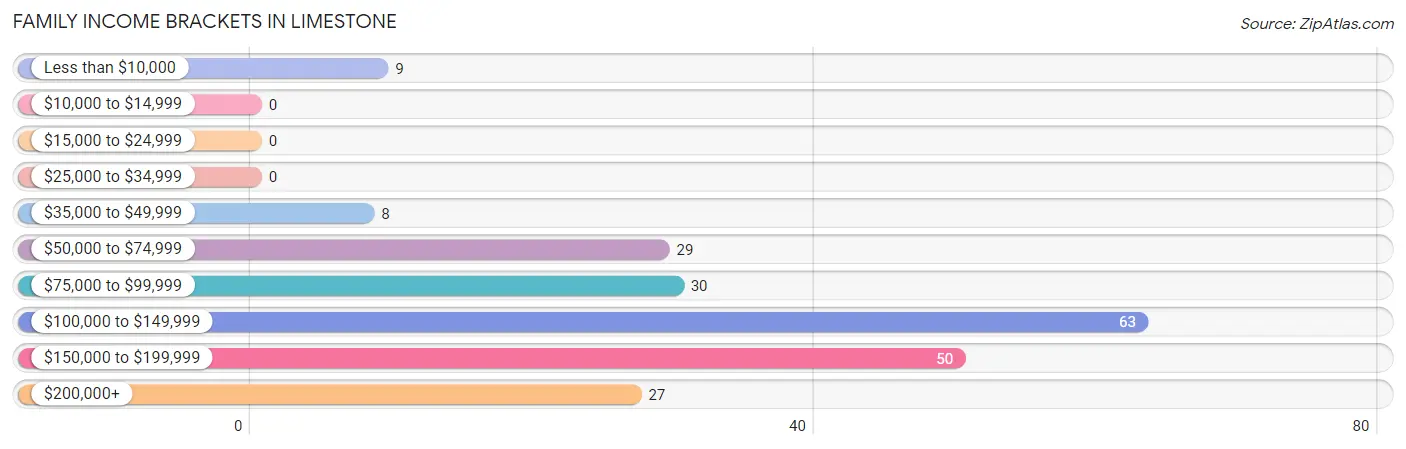
| Income Bracket | # Families | % Families |
| Less than $10,000 | 9 | 4.2% |
| $10,000 to $14,999 | 0 | 0.0% |
| $15,000 to $24,999 | 0 | 0.0% |
| $25,000 to $34,999 | 0 | 0.0% |
| $35,000 to $49,999 | 8 | 3.7% |
| $50,000 to $74,999 | 29 | 13.4% |
| $75,000 to $99,999 | 30 | 13.9% |
| $100,000 to $149,999 | 63 | 29.2% |
| $150,000 to $199,999 | 50 | 23.1% |
| $200,000+ | 27 | 12.5% |
Family Income by Famaliy Size in Limestone
5-person families (36 | 16.7%) account for the highest median family income in Limestone with $150,000 per family, while 2-person families (92 | 42.6%) have the highest median income of $53,850 per family member.
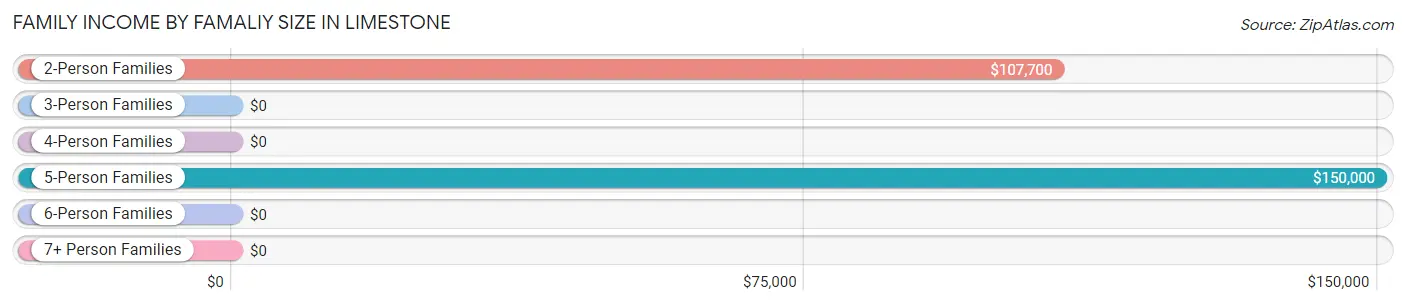
| Income Bracket | # Families | Median Income |
| 2-Person Families | 92 (42.6%) | $107,700 |
| 3-Person Families | 37 (17.1%) | $0 |
| 4-Person Families | 40 (18.5%) | $0 |
| 5-Person Families | 36 (16.7%) | $150,000 |
| 6-Person Families | 0 (0.0%) | $0 |
| 7+ Person Families | 11 (5.1%) | $0 |
| Total | 216 (100.0%) | $109,167 |
Family Income by Number of Earners in Limestone
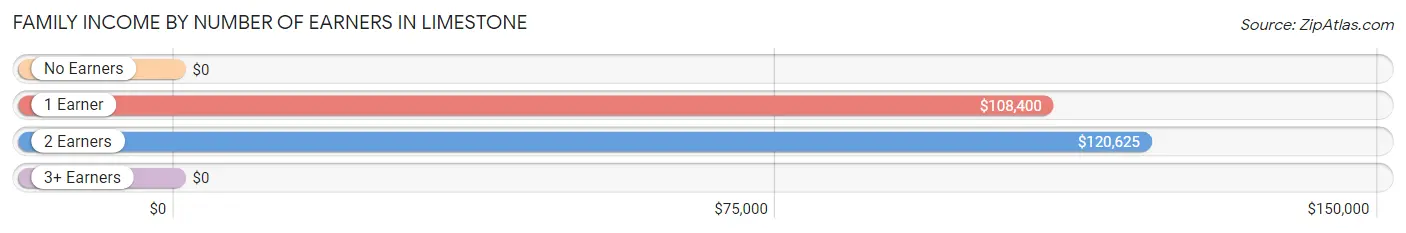
| Number of Earners | # Families | Median Income |
| No Earners | 17 (7.9%) | $0 |
| 1 Earner | 52 (24.1%) | $108,400 |
| 2 Earners | 117 (54.2%) | $120,625 |
| 3+ Earners | 30 (13.9%) | $0 |
| Total | 216 (100.0%) | $109,167 |
Household Income in Limestone
Household Income Brackets in Limestone
With 73 households falling in the category, the $100,000 to $149,999 income range is the most frequent in Limestone, accounting for 29.7% of all households.
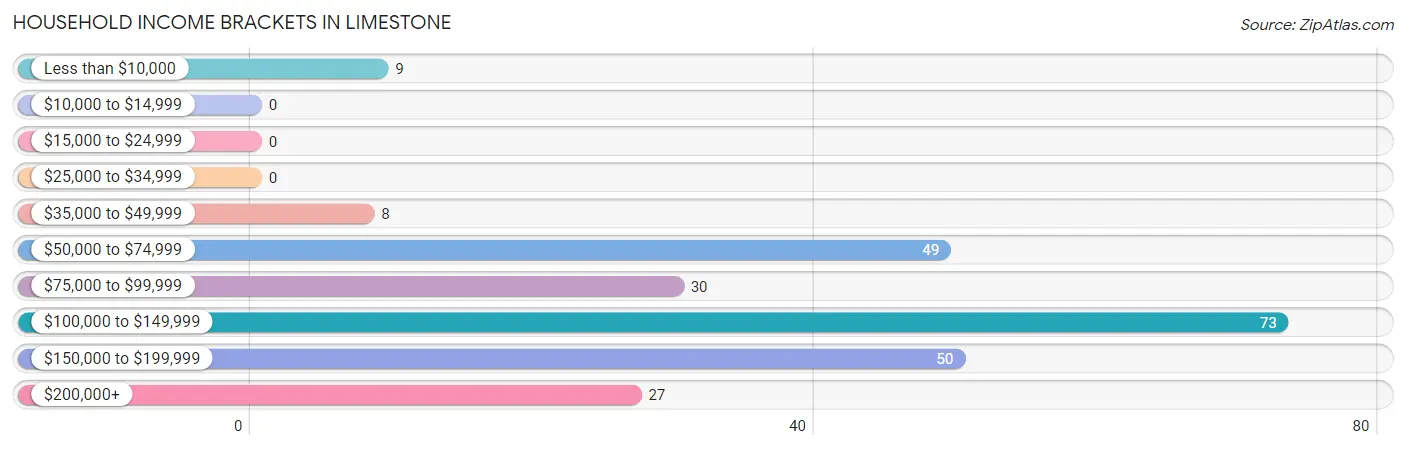
| Income Bracket | # Households | % Households |
| Less than $10,000 | 9 | 3.7% |
| $10,000 to $14,999 | 0 | 0.0% |
| $15,000 to $24,999 | 0 | 0.0% |
| $25,000 to $34,999 | 0 | 0.0% |
| $35,000 to $49,999 | 8 | 3.3% |
| $50,000 to $74,999 | 49 | 19.9% |
| $75,000 to $99,999 | 30 | 12.2% |
| $100,000 to $149,999 | 73 | 29.7% |
| $150,000 to $199,999 | 50 | 20.3% |
| $200,000+ | 27 | 11.0% |
Household Income by Householder Age in Limestone
The median household income in Limestone is $109,875, with the highest median household income of $122,250 found in the 25 to 44 years age bracket for the primary householder. A total of 114 households (46.3%) fall into this category.
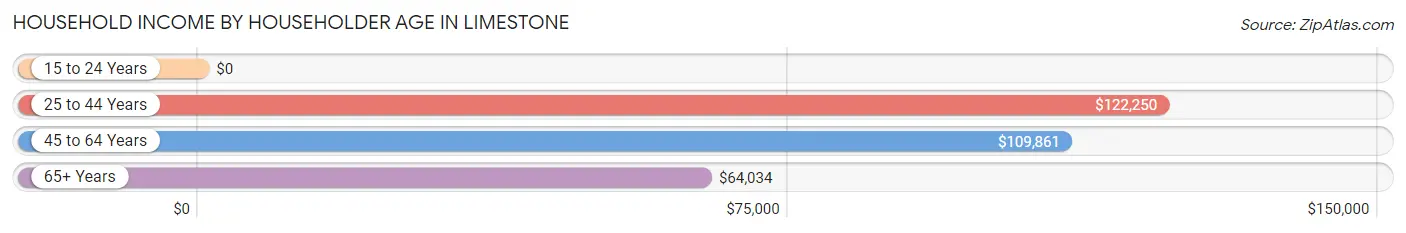
| Income Bracket | # Households | Median Income |
| 15 to 24 Years | 0 (0.0%) | $0 |
| 25 to 44 Years | 114 (46.3%) | $122,250 |
| 45 to 64 Years | 83 (33.7%) | $109,861 |
| 65+ Years | 49 (19.9%) | $64,034 |
| Total | 246 (100.0%) | $109,875 |
Poverty in Limestone
Income Below Poverty by Sex and Age in Limestone
With 2.1% poverty level for males and 6.7% for females among the residents of Limestone, 35 to 44 year old males and 45 to 54 year old females are the most vulnerable to poverty, with 9 males (9.2%) and 8 females (18.6%) in their respective age groups living below the poverty level.
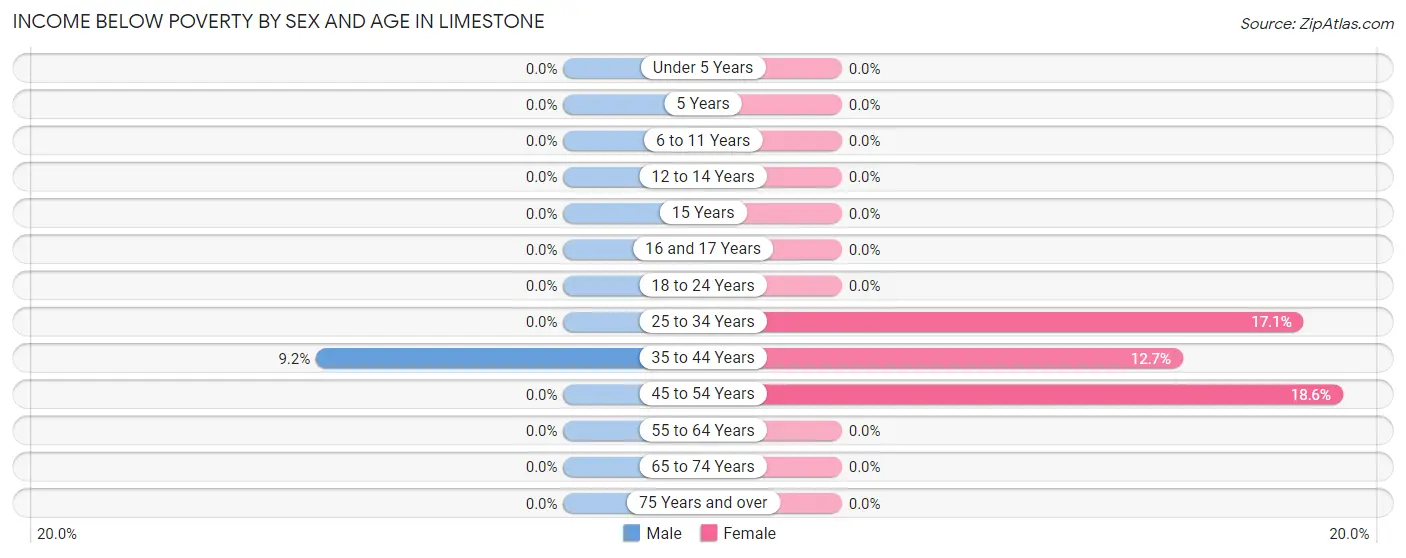
| Age Bracket | Male | Female |
| Under 5 Years | 0 (0.0%) | 0 (0.0%) |
| 5 Years | 0 (0.0%) | 0 (0.0%) |
| 6 to 11 Years | 0 (0.0%) | 0 (0.0%) |
| 12 to 14 Years | 0 (0.0%) | 0 (0.0%) |
| 15 Years | 0 (0.0%) | 0 (0.0%) |
| 16 and 17 Years | 0 (0.0%) | 0 (0.0%) |
| 18 to 24 Years | 0 (0.0%) | 0 (0.0%) |
| 25 to 34 Years | 0 (0.0%) | 6 (17.1%) |
| 35 to 44 Years | 9 (9.2%) | 10 (12.7%) |
| 45 to 54 Years | 0 (0.0%) | 8 (18.6%) |
| 55 to 64 Years | 0 (0.0%) | 0 (0.0%) |
| 65 to 74 Years | 0 (0.0%) | 0 (0.0%) |
| 75 Years and over | 0 (0.0%) | 0 (0.0%) |
| Total | 9 (2.1%) | 24 (6.7%) |
Income Above Poverty by Sex and Age in Limestone
According to the poverty statistics in Limestone, males aged under 5 years and females aged under 5 years are the age groups that are most secure financially, with 100.0% of males and 100.0% of females in these age groups living above the poverty line.
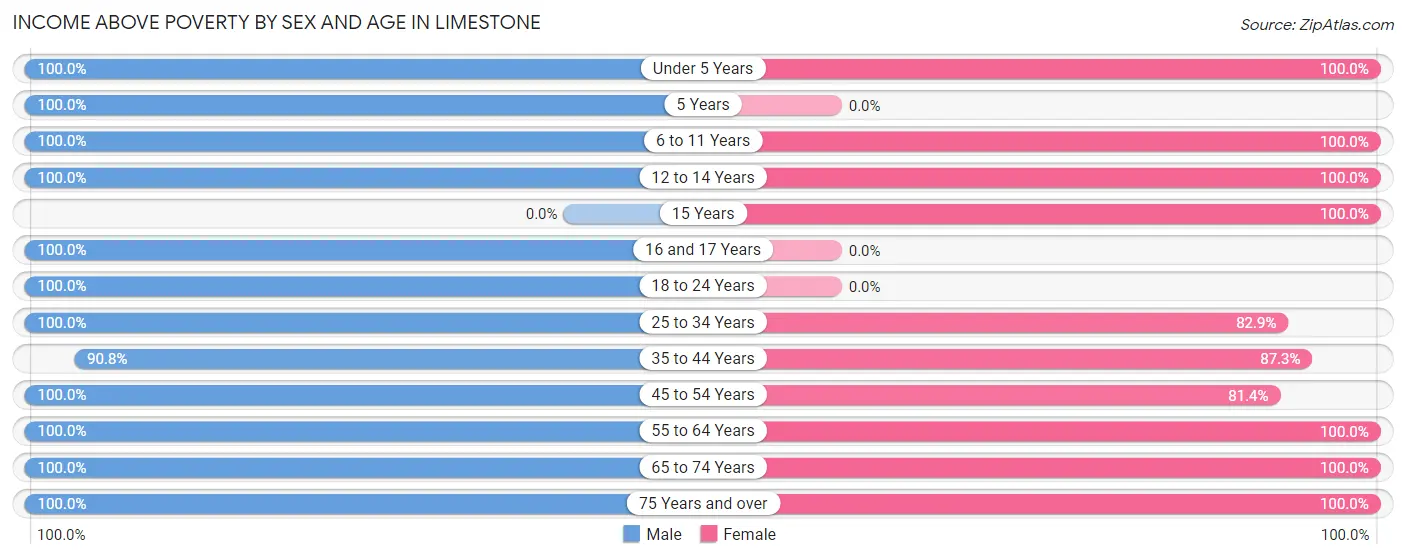
| Age Bracket | Male | Female |
| Under 5 Years | 6 (100.0%) | 14 (100.0%) |
| 5 Years | 11 (100.0%) | 0 (0.0%) |
| 6 to 11 Years | 34 (100.0%) | 22 (100.0%) |
| 12 to 14 Years | 19 (100.0%) | 31 (100.0%) |
| 15 Years | 0 (0.0%) | 14 (100.0%) |
| 16 and 17 Years | 54 (100.0%) | 0 (0.0%) |
| 18 to 24 Years | 14 (100.0%) | 0 (0.0%) |
| 25 to 34 Years | 42 (100.0%) | 29 (82.9%) |
| 35 to 44 Years | 89 (90.8%) | 69 (87.3%) |
| 45 to 54 Years | 30 (100.0%) | 35 (81.4%) |
| 55 to 64 Years | 87 (100.0%) | 59 (100.0%) |
| 65 to 74 Years | 9 (100.0%) | 31 (100.0%) |
| 75 Years and over | 16 (100.0%) | 31 (100.0%) |
| Total | 411 (97.9%) | 335 (93.3%) |
Income Below Poverty Among Married-Couple Families in Limestone
The poverty statistics for married-couple families in Limestone show that 5.3% or 9 of the total 170 families live below the poverty line. Families with no children have the highest poverty rate of 11.0%, comprising of 9 families. On the other hand, families with 1 or 2 children have the lowest poverty rate of 0.0%, which includes 0 families.
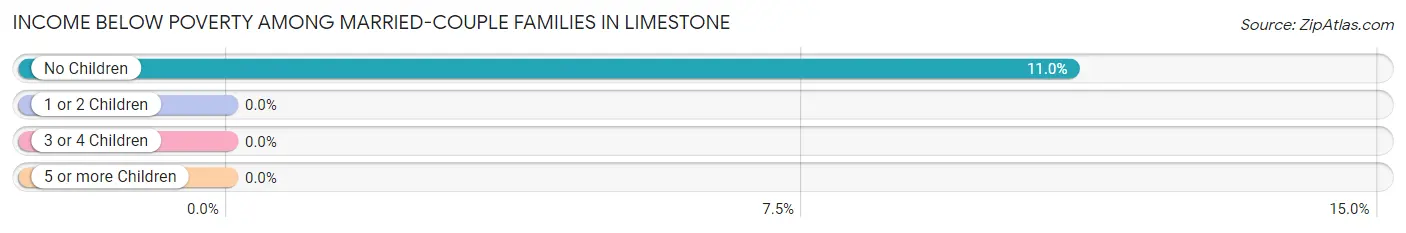
| Children | Above Poverty | Below Poverty |
| No Children | 73 (89.0%) | 9 (11.0%) |
| 1 or 2 Children | 50 (100.0%) | 0 (0.0%) |
| 3 or 4 Children | 38 (100.0%) | 0 (0.0%) |
| 5 or more Children | 0 (0.0%) | 0 (0.0%) |
| Total | 161 (94.7%) | 9 (5.3%) |
Income Below Poverty Among Single-Parent Households in Limestone
| Children | Single Father | Single Mother |
| No Children | 0 (0.0%) | 0 (0.0%) |
| 1 or 2 Children | 0 (0.0%) | 0 (0.0%) |
| 3 or 4 Children | 0 (0.0%) | 0 (0.0%) |
| 5 or more Children | 0 (0.0%) | 0 (0.0%) |
| Total | 0 (0.0%) | 0 (0.0%) |
Income Below Poverty Among Married-Couple vs Single-Parent Households in Limestone
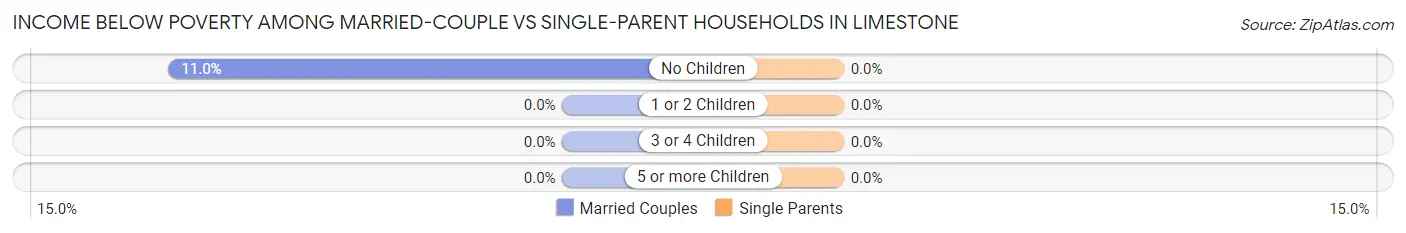
| Children | Married-Couple Families | Single-Parent Households |
| No Children | 9 (11.0%) | 0 (0.0%) |
| 1 or 2 Children | 0 (0.0%) | 0 (0.0%) |
| 3 or 4 Children | 0 (0.0%) | 0 (0.0%) |
| 5 or more Children | 0 (0.0%) | 0 (0.0%) |
| Total | 9 (5.3%) | 0 (0.0%) |
Race in Limestone
The most populous races in Limestone are White / Caucasian (648 | 80.8%), Hispanic or Latino (91 | 11.4%), and Asian (65 | 8.1%).
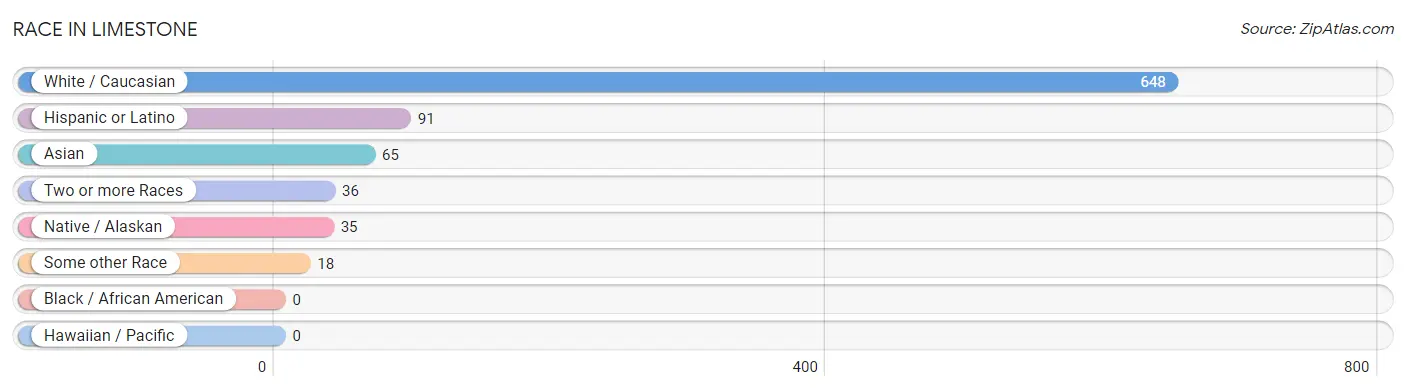
| Race | # Population | % Population |
| Asian | 65 | 8.1% |
| Black / African American | 0 | 0.0% |
| Hawaiian / Pacific | 0 | 0.0% |
| Hispanic or Latino | 91 | 11.4% |
| Native / Alaskan | 35 | 4.4% |
| White / Caucasian | 648 | 80.8% |
| Two or more Races | 36 | 4.5% |
| Some other Race | 18 | 2.2% |
| Total | 802 | 100.0% |
Ancestry in Limestone
The most populous ancestries reported in Limestone are English (131 | 16.3%), German (118 | 14.7%), Mexican (91 | 11.4%), Bangladeshi (65 | 8.1%), and American (64 | 8.0%), together accounting for 58.5% of all Limestone residents.
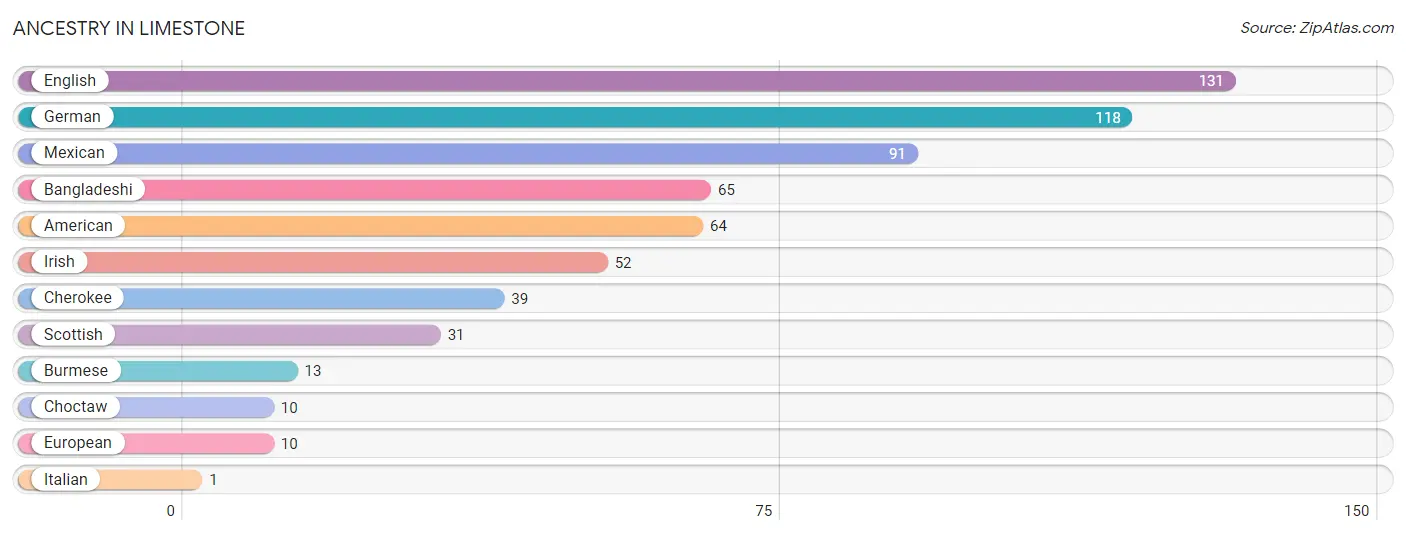
| Ancestry | # Population | % Population |
| American | 64 | 8.0% |
| Bangladeshi | 65 | 8.1% |
| Burmese | 13 | 1.6% |
| Cherokee | 39 | 4.9% |
| Choctaw | 10 | 1.3% |
| English | 131 | 16.3% |
| European | 10 | 1.3% |
| German | 118 | 14.7% |
| Irish | 52 | 6.5% |
| Italian | 1 | 0.1% |
| Mexican | 91 | 11.4% |
| Scottish | 31 | 3.9% | View All 12 Rows |
Immigrants in Limestone
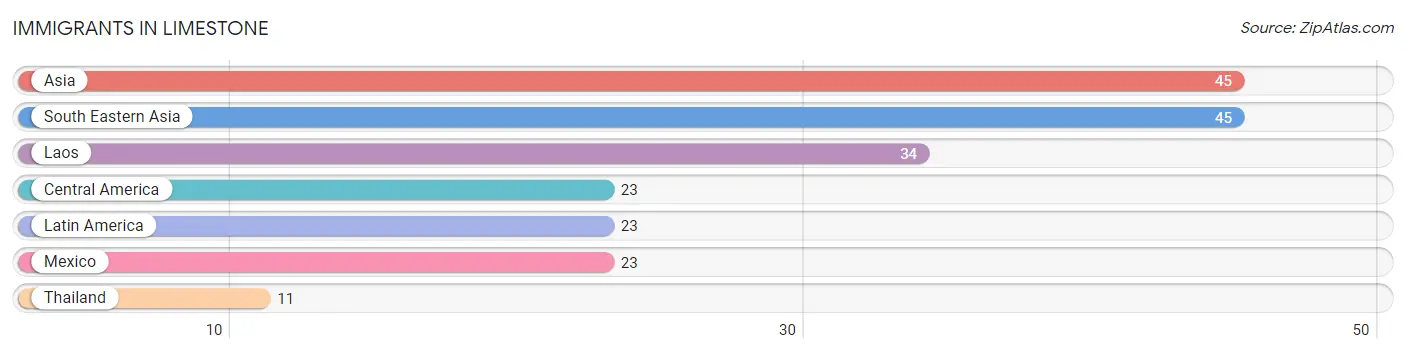
The most numerous immigrant groups reported in Limestone came from Asia (45 | 5.6%), South Eastern Asia (45 | 5.6%), Laos (34 | 4.2%), Central America (23 | 2.9%), and Latin America (23 | 2.9%), together accounting for 21.2% of all Limestone residents.
| Immigration Origin | # Population | % Population |
| Asia | 45 | 5.6% |
| Central America | 23 | 2.9% |
| Laos | 34 | 4.2% |
| Latin America | 23 | 2.9% |
| Mexico | 23 | 2.9% |
| South Eastern Asia | 45 | 5.6% |
| Thailand | 11 | 1.4% | View All 7 Rows |
Sex and Age in Limestone
Sex and Age in Limestone
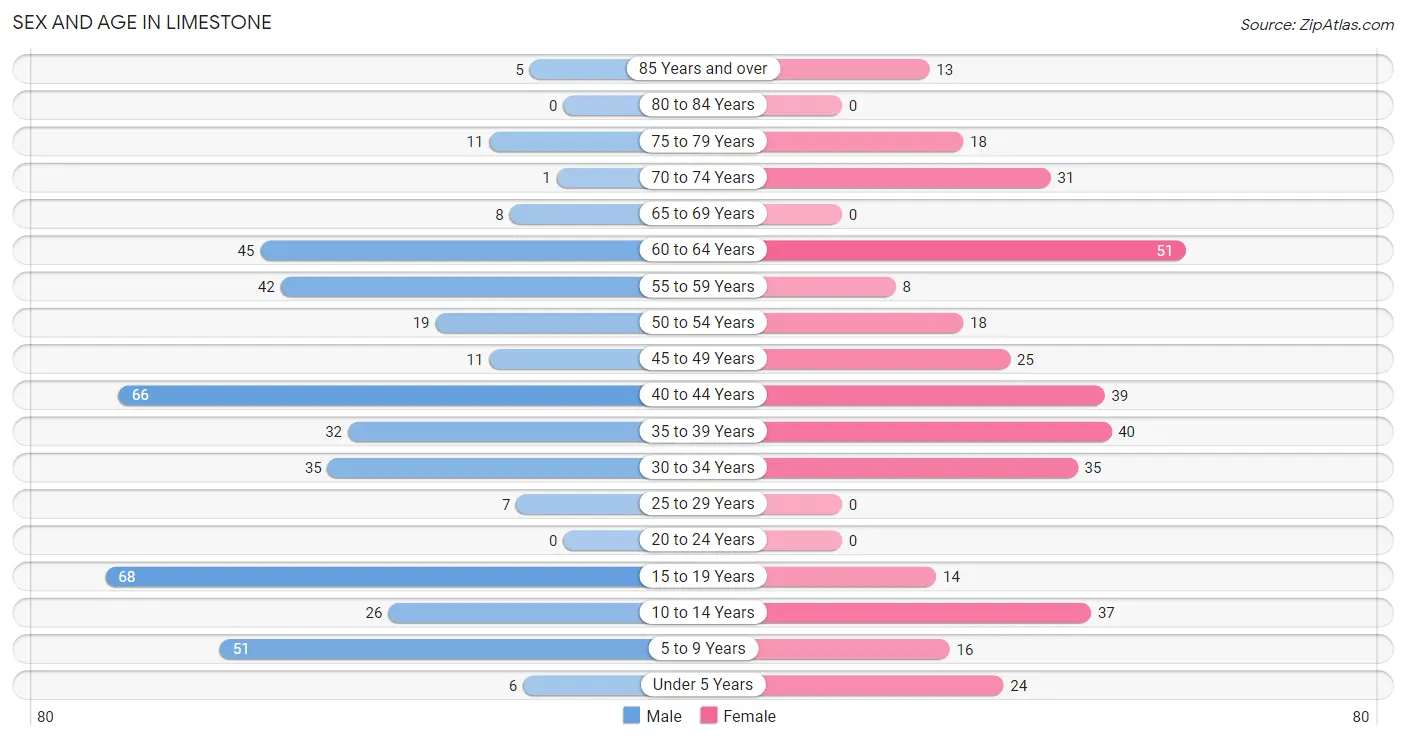
The most populous age groups in Limestone are 15 to 19 Years (68 | 15.7%) for men and 60 to 64 Years (51 | 13.8%) for women.
| Age Bracket | Male | Female |
| Under 5 Years | 6 (1.4%) | 24 (6.5%) |
| 5 to 9 Years | 51 (11.8%) | 16 (4.3%) |
| 10 to 14 Years | 26 (6.0%) | 37 (10.0%) |
| 15 to 19 Years | 68 (15.7%) | 14 (3.8%) |
| 20 to 24 Years | 0 (0.0%) | 0 (0.0%) |
| 25 to 29 Years | 7 (1.6%) | 0 (0.0%) |
| 30 to 34 Years | 35 (8.1%) | 35 (9.5%) |
| 35 to 39 Years | 32 (7.4%) | 40 (10.8%) |
| 40 to 44 Years | 66 (15.2%) | 39 (10.6%) |
| 45 to 49 Years | 11 (2.5%) | 25 (6.8%) |
| 50 to 54 Years | 19 (4.4%) | 18 (4.9%) |
| 55 to 59 Years | 42 (9.7%) | 8 (2.2%) |
| 60 to 64 Years | 45 (10.4%) | 51 (13.8%) |
| 65 to 69 Years | 8 (1.8%) | 0 (0.0%) |
| 70 to 74 Years | 1 (0.2%) | 31 (8.4%) |
| 75 to 79 Years | 11 (2.5%) | 18 (4.9%) |
| 80 to 84 Years | 0 (0.0%) | 0 (0.0%) |
| 85 Years and over | 5 (1.1%) | 13 (3.5%) |
| Total | 433 (100.0%) | 369 (100.0%) |
Families and Households in Limestone
Median Family Size in Limestone
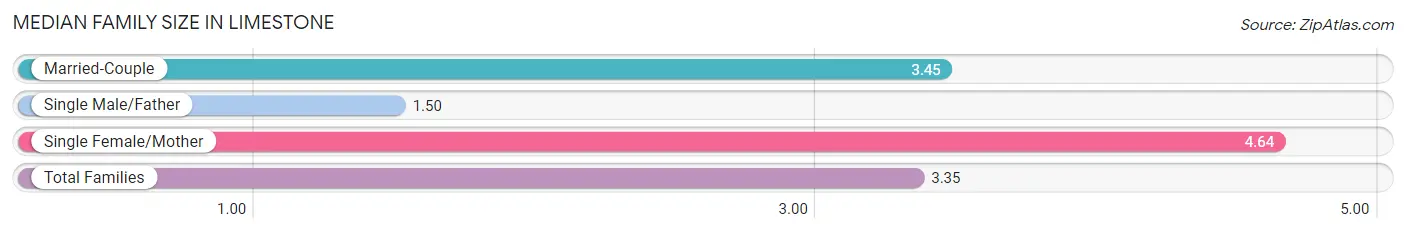
The median family size in Limestone is 3.35 persons per family, with single female/mother families (22 | 10.2%) accounting for the largest median family size of 4.64 persons per family. On the other hand, single male/father families (24 | 11.1%) represent the smallest median family size with 1.50 persons per family.
| Family Type | # Families | Family Size |
| Married-Couple | 170 (78.7%) | 3.45 |
| Single Male/Father | 24 (11.1%) | 1.50 |
| Single Female/Mother | 22 (10.2%) | 4.64 |
| Total Families | 216 (100.0%) | 3.35 |
Median Household Size in Limestone
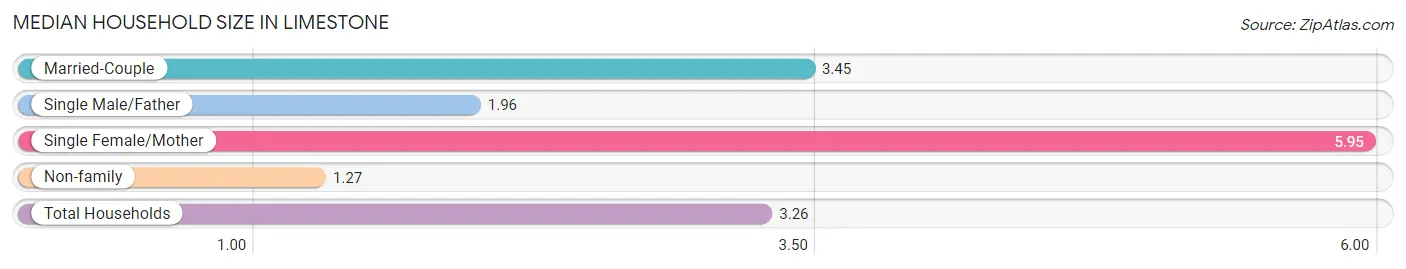
The median household size in Limestone is 3.26 persons per household, with single female/mother households (22 | 8.9%) accounting for the largest median household size of 5.95 persons per household. non-family households (30 | 12.2%) represent the smallest median household size with 1.27 persons per household.
| Household Type | # Households | Household Size |
| Married-Couple | 170 (69.1%) | 3.45 |
| Single Male/Father | 24 (9.8%) | 1.96 |
| Single Female/Mother | 22 (8.9%) | 5.95 |
| Non-family | 30 (12.2%) | 1.27 |
| Total Households | 246 (100.0%) | 3.26 |
Household Size by Marriage Status in Limestone
Out of a total of 246 households in Limestone, 216 (87.8%) are family households, while 30 (12.2%) are nonfamily households. The most numerous type of family households are 2-person households, comprising 76, and the most common type of nonfamily households are 1-person households, comprising 22.
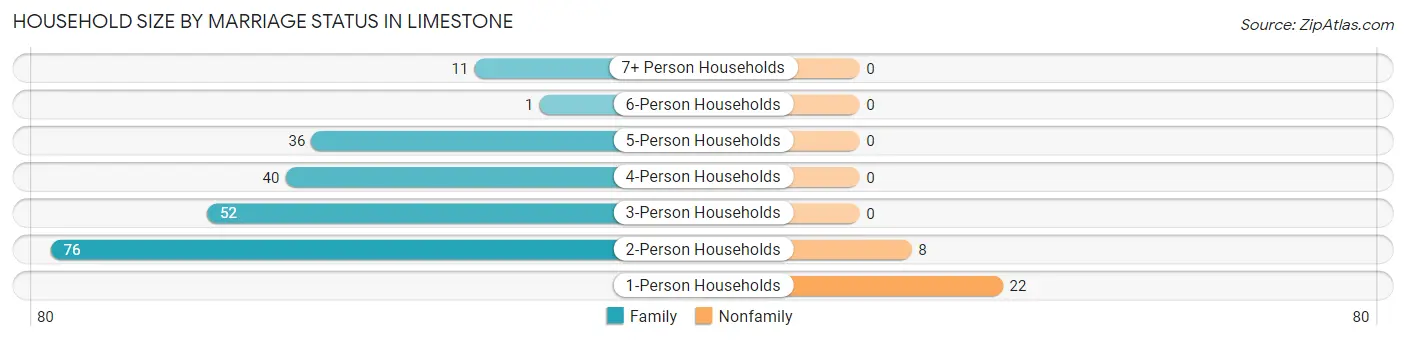
| Household Size | Family Households | Nonfamily Households |
| 1-Person Households | - | 22 (8.9%) |
| 2-Person Households | 76 (30.9%) | 8 (3.3%) |
| 3-Person Households | 52 (21.1%) | 0 (0.0%) |
| 4-Person Households | 40 (16.3%) | 0 (0.0%) |
| 5-Person Households | 36 (14.6%) | 0 (0.0%) |
| 6-Person Households | 1 (0.4%) | 0 (0.0%) |
| 7+ Person Households | 11 (4.5%) | 0 (0.0%) |
| Total | 216 (87.8%) | 30 (12.2%) |
Female Fertility in Limestone
Fertility by Age in Limestone
| Age Bracket | Women with Births | Births / 1,000 Women |
| 15 to 19 years | 0 (0.0%) | 0.0 |
| 20 to 34 years | 0 (0.0%) | 0.0 |
| 35 to 50 years | 0 (0.0%) | 0.0 |
| Total | 0 (0.0%) | 0.0 |
Fertility by Age by Marriage Status in Limestone
| Age Bracket | Married | Unmarried |
| 15 to 19 years | 0 (0.0%) | 0 (0.0%) |
| 20 to 34 years | 0 (0.0%) | 0 (0.0%) |
| 35 to 50 years | 0 (0.0%) | 0 (0.0%) |
| Total | 0 (0.0%) | 0 (0.0%) |
Fertility by Education in Limestone
| Educational Attainment | Women with Births | Births / 1,000 Women |
| Less than High School | 0 (0.0%) | 0.0 |
| High School Diploma | 0 (0.0%) | 0.0 |
| College or Associate's Degree | 0 (0.0%) | 0.0 |
| Bachelor's Degree | 0 (0.0%) | 0.0 |
| Graduate Degree | 0 (0.0%) | 0.0 |
| Total | 0 (0.0%) | 0.0 |
Fertility by Education by Marriage Status in Limestone
| Educational Attainment | Married | Unmarried |
| Less than High School | 0 (0.0%) | 0 (0.0%) |
| High School Diploma | 0 (0.0%) | 0 (0.0%) |
| College or Associate's Degree | 0 (0.0%) | 0 (0.0%) |
| Bachelor's Degree | 0 (0.0%) | 0 (0.0%) |
| Graduate Degree | 0 (0.0%) | 0 (0.0%) |
| Total | 0 (0.0%) | 0 (0.0%) |
Employment Characteristics in Limestone
Employment by Class of Employer in Limestone
Among the 423 employed individuals in Limestone, private company employees (343 | 81.1%), local government employees (24 | 5.7%), and not-for-profit organizations (19 | 4.5%) make up the most common classes of employment.
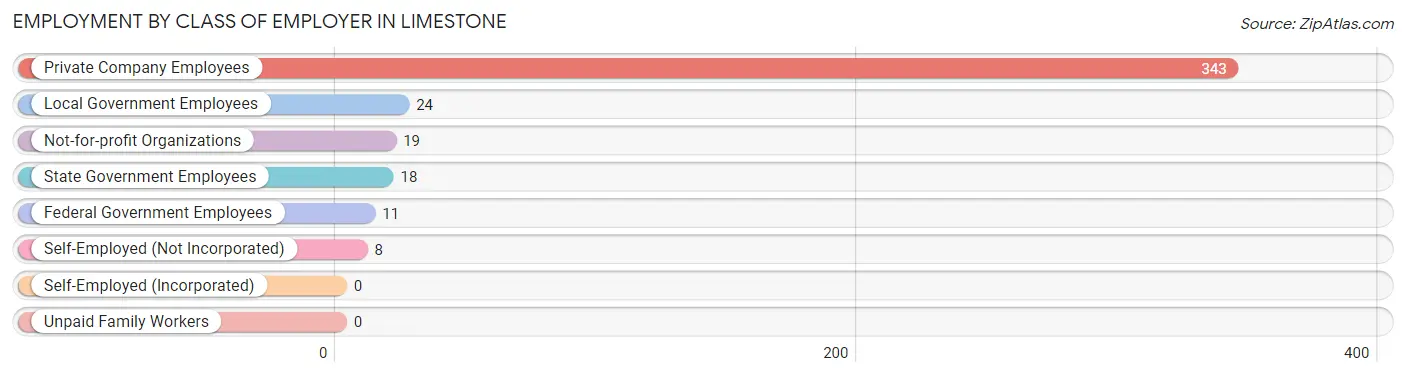
| Employer Class | # Employees | % Employees |
| Private Company Employees | 343 | 81.1% |
| Self-Employed (Incorporated) | 0 | 0.0% |
| Self-Employed (Not Incorporated) | 8 | 1.9% |
| Not-for-profit Organizations | 19 | 4.5% |
| Local Government Employees | 24 | 5.7% |
| State Government Employees | 18 | 4.3% |
| Federal Government Employees | 11 | 2.6% |
| Unpaid Family Workers | 0 | 0.0% |
| Total | 423 | 100.0% |
Employment Status by Age in Limestone
According to the labor force statistics for Limestone, out of the total population over 16 years of age (628), 70.2% or 441 individuals are in the labor force, with 1.8% or 8 of them unemployed. The age group with the highest labor force participation rate is 30 to 34 years, with 91.4% or 64 individuals in the labor force. Within the labor force, the 30 to 34 years age range has the highest percentage of unemployed individuals, with 12.5% or 8 of them being unemployed.
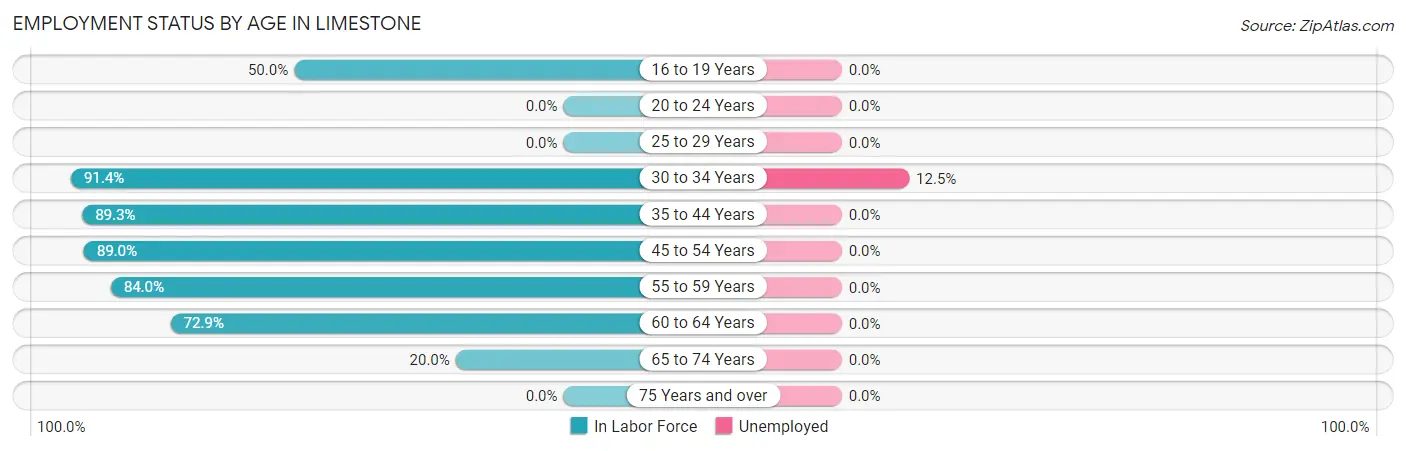
| Age Bracket | In Labor Force | Unemployed |
| 16 to 19 Years | 34 (50.0%) | 0 (0.0%) |
| 20 to 24 Years | 0 (0.0%) | 0 (0.0%) |
| 25 to 29 Years | 0 (0.0%) | 0 (0.0%) |
| 30 to 34 Years | 64 (91.4%) | 8 (12.5%) |
| 35 to 44 Years | 158 (89.3%) | 0 (0.0%) |
| 45 to 54 Years | 65 (89.0%) | 0 (0.0%) |
| 55 to 59 Years | 42 (84.0%) | 0 (0.0%) |
| 60 to 64 Years | 70 (72.9%) | 0 (0.0%) |
| 65 to 74 Years | 8 (20.0%) | 0 (0.0%) |
| 75 Years and over | 0 (0.0%) | 0 (0.0%) |
| Total | 441 (70.2%) | 8 (1.8%) |
Employment Status by Educational Attainment in Limestone
According to labor force statistics for Limestone, 84.4% of individuals (399) out of the total population between 25 and 64 years of age (473) are in the labor force, with 2.0% or 8 of them being unemployed. The group with the highest labor force participation rate are those with the educational attainment of bachelor's degree or higher, with 100.0% or 123 individuals in the labor force. Within the labor force, individuals with college / associate degree education have the highest percentage of unemployment, with 5.3% or 8 of them being unemployed.
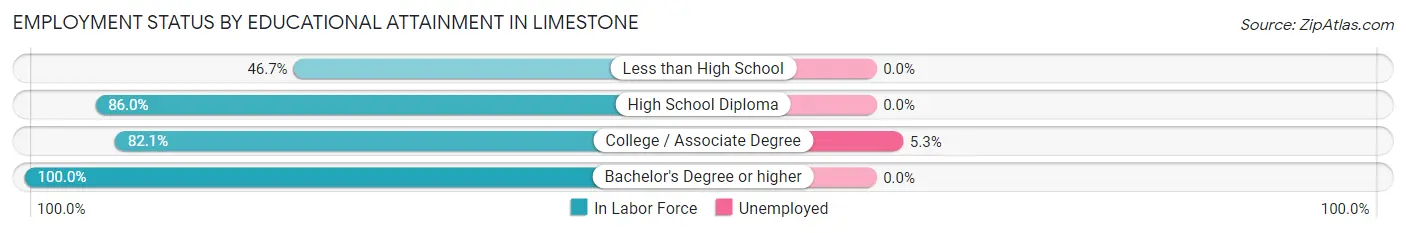
| Educational Attainment | In Labor Force | Unemployed |
| Less than High School | 21 (46.7%) | 0 (0.0%) |
| High School Diploma | 104 (86.0%) | 0 (0.0%) |
| College / Associate Degree | 151 (82.1%) | 10 (5.3%) |
| Bachelor's Degree or higher | 123 (100.0%) | 0 (0.0%) |
| Total | 399 (84.4%) | 9 (2.0%) |
Employment Occupations by Sex in Limestone
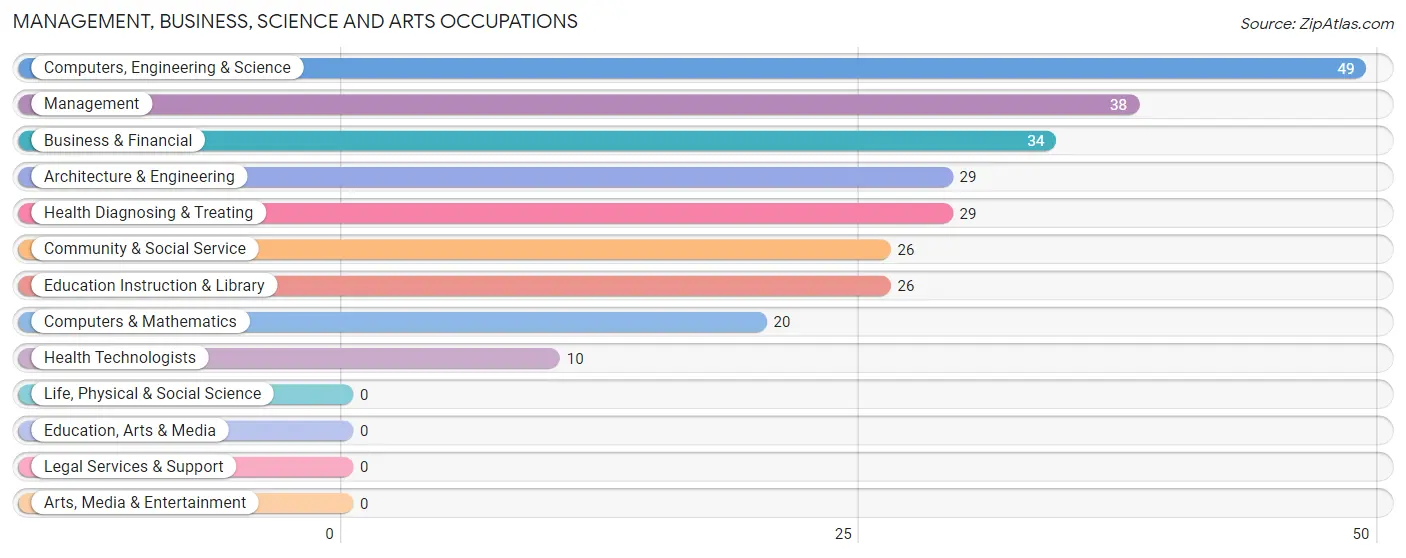
Management, Business, Science and Arts Occupations
The most common Management, Business, Science and Arts occupations in Limestone are Computers, Engineering & Science (49 | 11.3%), Management (38 | 8.8%), Business & Financial (34 | 7.9%), Architecture & Engineering (29 | 6.7%), and Health Diagnosing & Treating (29 | 6.7%).
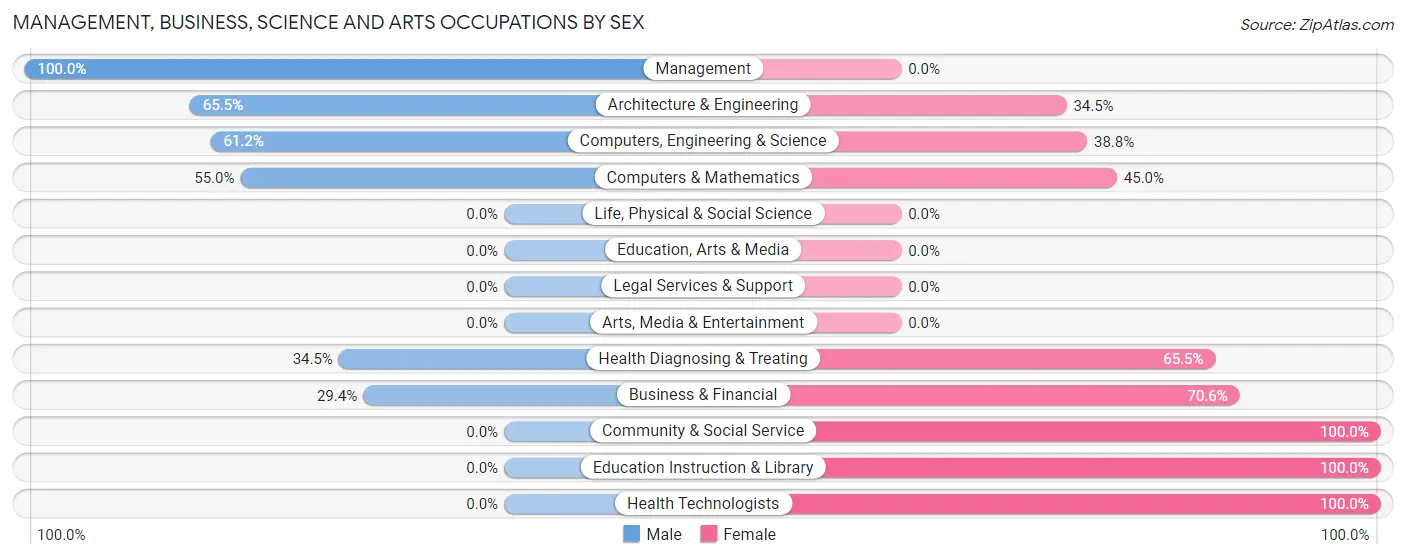
Management, Business, Science and Arts Occupations by Sex
Within the Management, Business, Science and Arts occupations in Limestone, the most male-oriented occupations are Management (100.0%), Architecture & Engineering (65.5%), and Computers, Engineering & Science (61.2%), while the most female-oriented occupations are Community & Social Service (100.0%), Education Instruction & Library (100.0%), and Health Technologists (100.0%).
| Occupation | Male | Female |
| Management | 38 (100.0%) | 0 (0.0%) |
| Business & Financial | 10 (29.4%) | 24 (70.6%) |
| Computers, Engineering & Science | 30 (61.2%) | 19 (38.8%) |
| Computers & Mathematics | 11 (55.0%) | 9 (45.0%) |
| Architecture & Engineering | 19 (65.5%) | 10 (34.5%) |
| Life, Physical & Social Science | 0 (0.0%) | 0 (0.0%) |
| Community & Social Service | 0 (0.0%) | 26 (100.0%) |
| Education, Arts & Media | 0 (0.0%) | 0 (0.0%) |
| Legal Services & Support | 0 (0.0%) | 0 (0.0%) |
| Education Instruction & Library | 0 (0.0%) | 26 (100.0%) |
| Arts, Media & Entertainment | 0 (0.0%) | 0 (0.0%) |
| Health Diagnosing & Treating | 10 (34.5%) | 19 (65.5%) |
| Health Technologists | 0 (0.0%) | 10 (100.0%) |
| Total (Category) | 88 (50.0%) | 88 (50.0%) |
| Total (Overall) | 284 (65.6%) | 149 (34.4%) |
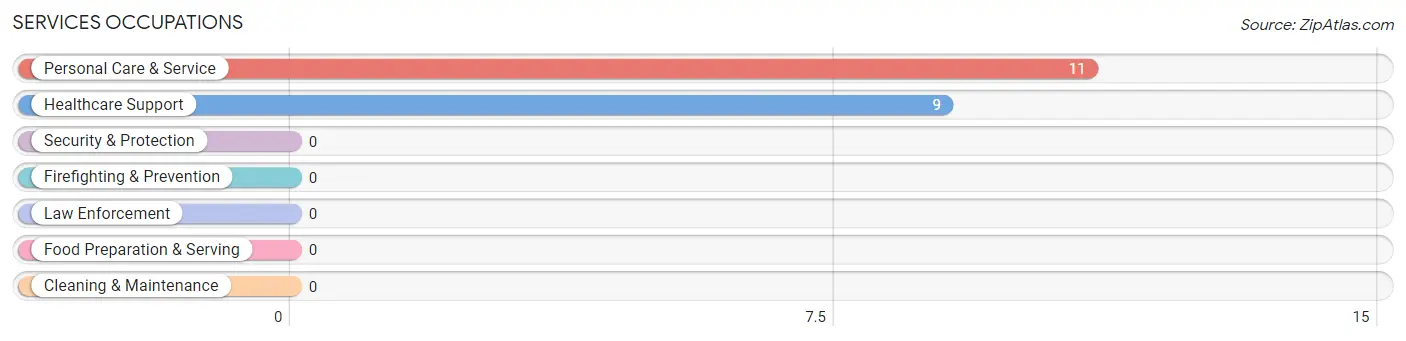
Services Occupations
The most common Services occupations in Limestone are Personal Care & Service (11 | 2.5%), and Healthcare Support (9 | 2.1%).
Services Occupations by Sex
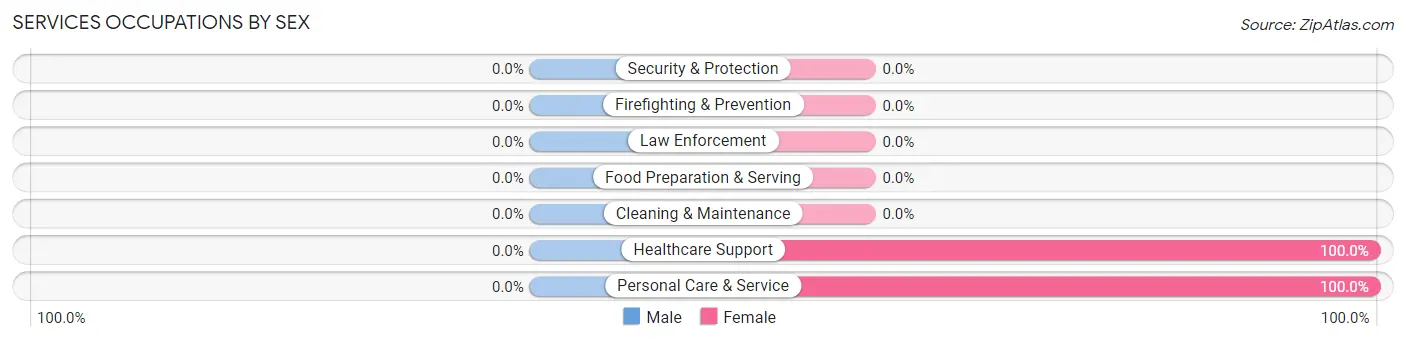
| Occupation | Male | Female |
| Healthcare Support | 0 (0.0%) | 9 (100.0%) |
| Security & Protection | 0 (0.0%) | 0 (0.0%) |
| Firefighting & Prevention | 0 (0.0%) | 0 (0.0%) |
| Law Enforcement | 0 (0.0%) | 0 (0.0%) |
| Food Preparation & Serving | 0 (0.0%) | 0 (0.0%) |
| Cleaning & Maintenance | 0 (0.0%) | 0 (0.0%) |
| Personal Care & Service | 0 (0.0%) | 11 (100.0%) |
| Total (Category) | 0 (0.0%) | 20 (100.0%) |
| Total (Overall) | 284 (65.6%) | 149 (34.4%) |
Sales and Office Occupations
The most common Sales and Office occupations in Limestone are Office & Administration (43 | 9.9%), and Sales & Related (22 | 5.1%).
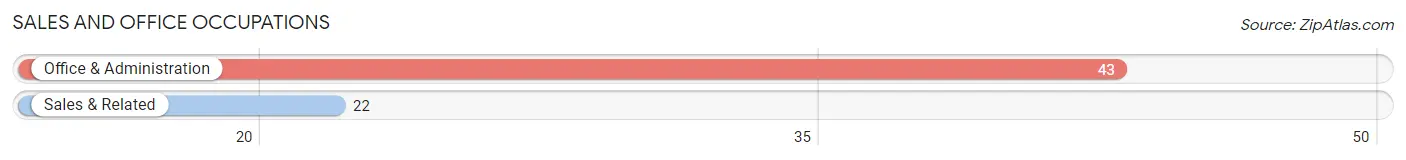
Sales and Office Occupations by Sex
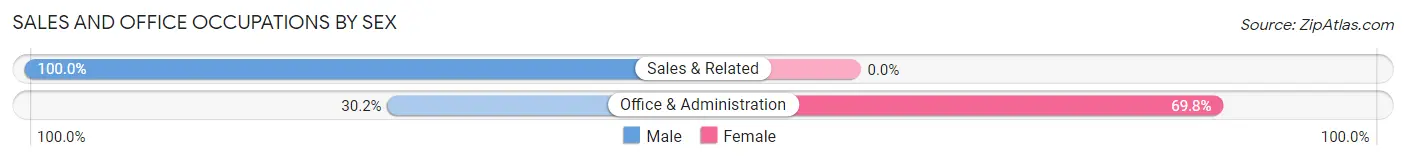
| Occupation | Male | Female |
| Sales & Related | 22 (100.0%) | 0 (0.0%) |
| Office & Administration | 13 (30.2%) | 30 (69.8%) |
| Total (Category) | 35 (53.8%) | 30 (46.2%) |
| Total (Overall) | 284 (65.6%) | 149 (34.4%) |
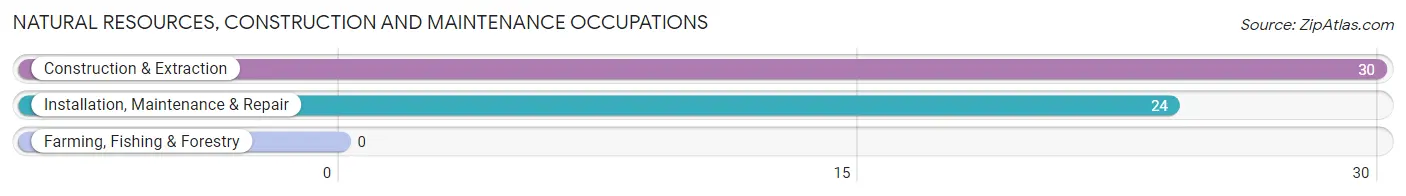
Natural Resources, Construction and Maintenance Occupations
The most common Natural Resources, Construction and Maintenance occupations in Limestone are Construction & Extraction (30 | 6.9%), and Installation, Maintenance & Repair (24 | 5.5%).
Natural Resources, Construction and Maintenance Occupations by Sex
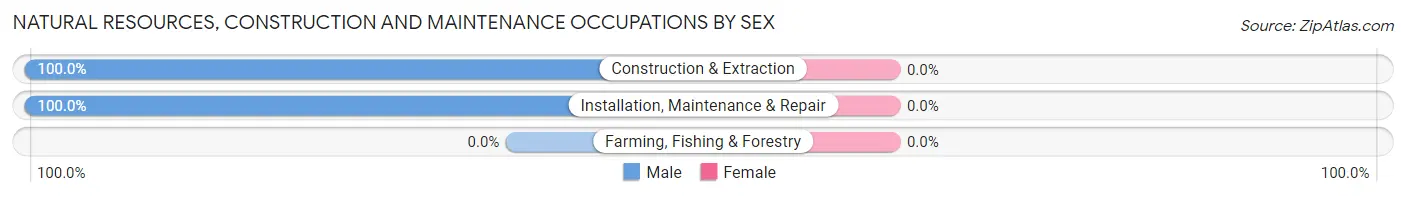
| Occupation | Male | Female |
| Farming, Fishing & Forestry | 0 (0.0%) | 0 (0.0%) |
| Construction & Extraction | 30 (100.0%) | 0 (0.0%) |
| Installation, Maintenance & Repair | 24 (100.0%) | 0 (0.0%) |
| Total (Category) | 54 (100.0%) | 0 (0.0%) |
| Total (Overall) | 284 (65.6%) | 149 (34.4%) |
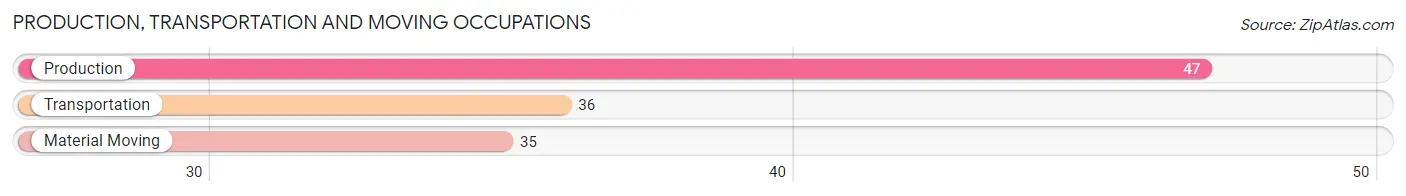
Production, Transportation and Moving Occupations
The most common Production, Transportation and Moving occupations in Limestone are Production (47 | 10.8%), Transportation (36 | 8.3%), and Material Moving (35 | 8.1%).
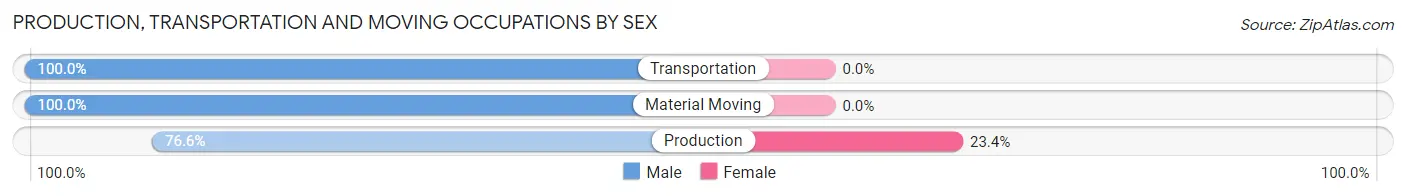
Production, Transportation and Moving Occupations by Sex
| Occupation | Male | Female |
| Production | 36 (76.6%) | 11 (23.4%) |
| Transportation | 36 (100.0%) | 0 (0.0%) |
| Material Moving | 35 (100.0%) | 0 (0.0%) |
| Total (Category) | 107 (90.7%) | 11 (9.3%) |
| Total (Overall) | 284 (65.6%) | 149 (34.4%) |
Employment Industries by Sex in Limestone
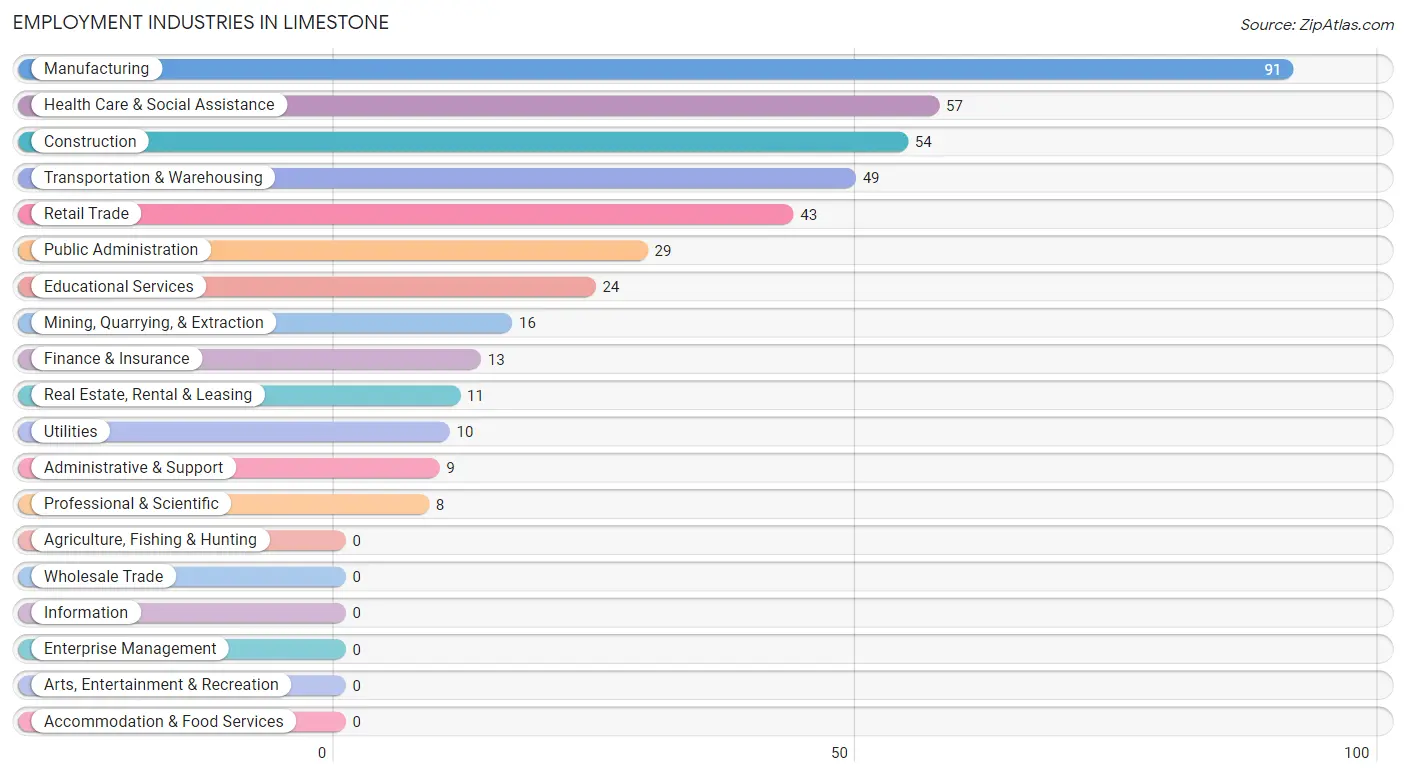
Employment Industries in Limestone
The major employment industries in Limestone include Manufacturing (91 | 21.0%), Health Care & Social Assistance (57 | 13.2%), Construction (54 | 12.5%), Transportation & Warehousing (49 | 11.3%), and Retail Trade (43 | 9.9%).
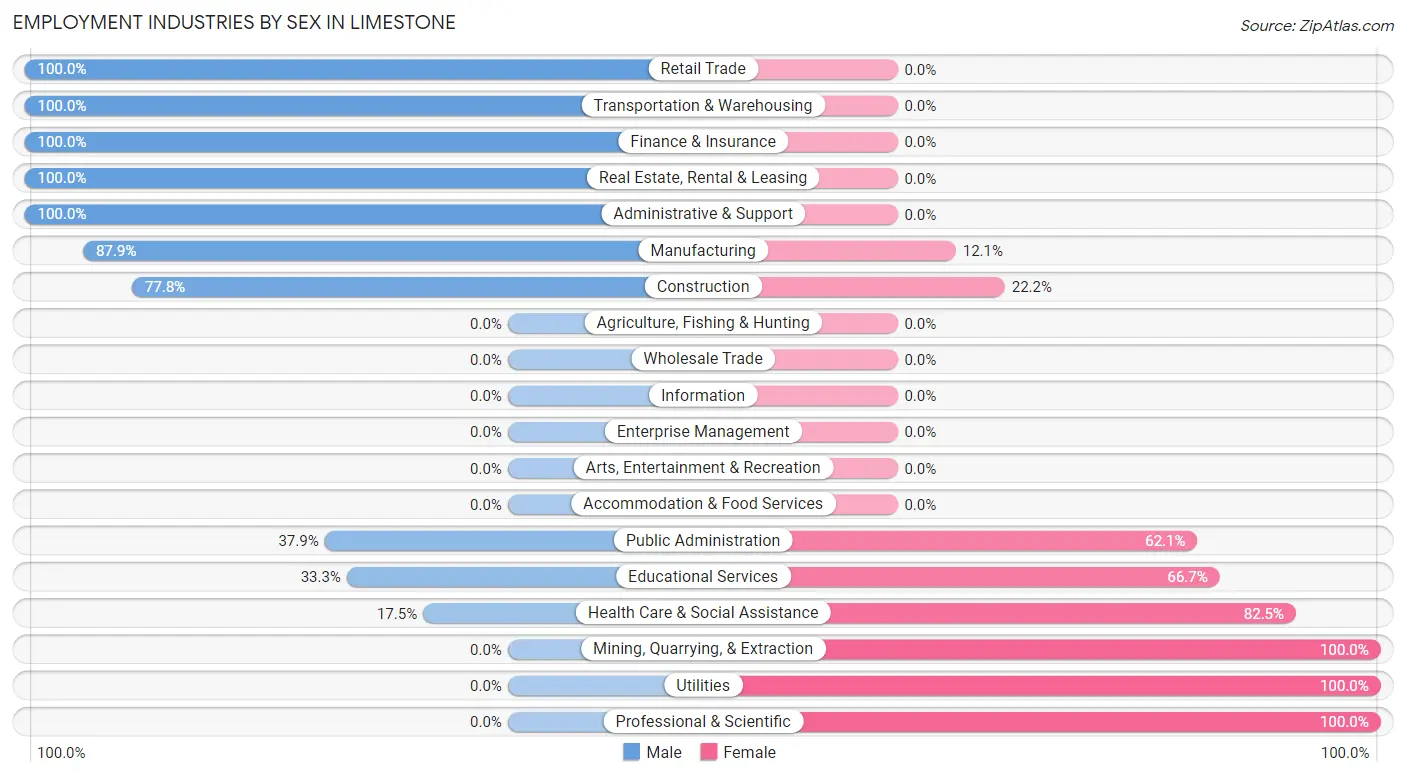
Employment Industries by Sex in Limestone
The Limestone industries that see more men than women are Retail Trade (100.0%), Transportation & Warehousing (100.0%), and Finance & Insurance (100.0%), whereas the industries that tend to have a higher number of women are Mining, Quarrying, & Extraction (100.0%), Utilities (100.0%), and Professional & Scientific (100.0%).
| Industry | Male | Female |
| Agriculture, Fishing & Hunting | 0 (0.0%) | 0 (0.0%) |
| Mining, Quarrying, & Extraction | 0 (0.0%) | 16 (100.0%) |
| Construction | 42 (77.8%) | 12 (22.2%) |
| Manufacturing | 80 (87.9%) | 11 (12.1%) |
| Wholesale Trade | 0 (0.0%) | 0 (0.0%) |
| Retail Trade | 43 (100.0%) | 0 (0.0%) |
| Transportation & Warehousing | 49 (100.0%) | 0 (0.0%) |
| Utilities | 0 (0.0%) | 10 (100.0%) |
| Information | 0 (0.0%) | 0 (0.0%) |
| Finance & Insurance | 13 (100.0%) | 0 (0.0%) |
| Real Estate, Rental & Leasing | 11 (100.0%) | 0 (0.0%) |
| Professional & Scientific | 0 (0.0%) | 8 (100.0%) |
| Enterprise Management | 0 (0.0%) | 0 (0.0%) |
| Administrative & Support | 9 (100.0%) | 0 (0.0%) |
| Educational Services | 8 (33.3%) | 16 (66.7%) |
| Health Care & Social Assistance | 10 (17.5%) | 47 (82.5%) |
| Arts, Entertainment & Recreation | 0 (0.0%) | 0 (0.0%) |
| Accommodation & Food Services | 0 (0.0%) | 0 (0.0%) |
| Public Administration | 11 (37.9%) | 18 (62.1%) |
| Total | 284 (65.6%) | 149 (34.4%) |
Education in Limestone
School Enrollment in Limestone
The most common levels of schooling among the 221 students in Limestone are high school (97 | 43.9%), middle school (34 | 15.4%), and college / undergraduate (32 | 14.5%).
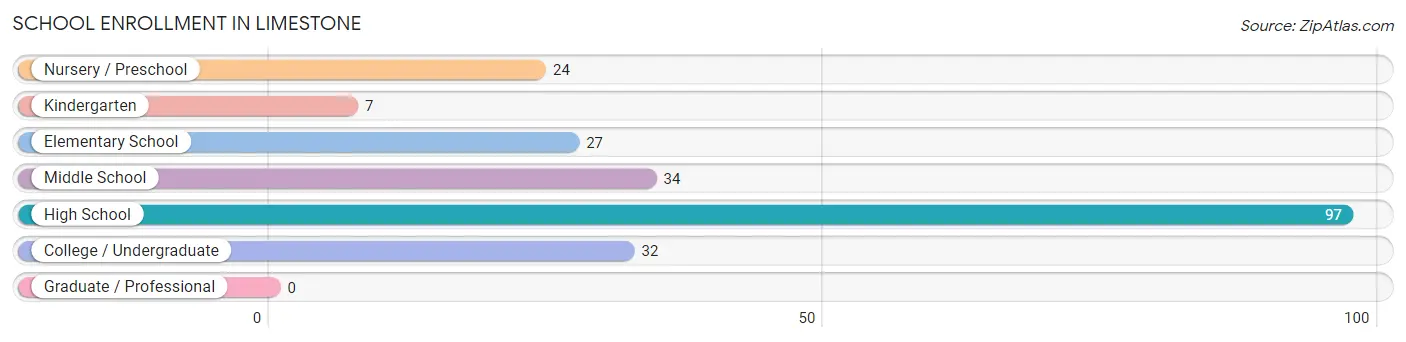
| School Level | # Students | % Students |
| Nursery / Preschool | 24 | 10.9% |
| Kindergarten | 7 | 3.2% |
| Elementary School | 27 | 12.2% |
| Middle School | 34 | 15.4% |
| High School | 97 | 43.9% |
| College / Undergraduate | 32 | 14.5% |
| Graduate / Professional | 0 | 0.0% |
| Total | 221 | 100.0% |
School Enrollment by Age by Funding Source in Limestone
Out of a total of 221 students who are enrolled in schools in Limestone, 68 (30.8%) attend a private institution, while the remaining 153 (69.2%) are enrolled in public schools. The age group of 18 to 19 year olds has the highest likelihood of being enrolled in private schools, with 14 (100.0% in the age bracket) enrolled. Conversely, the age group of 25 to 34 year olds has the lowest likelihood of being enrolled in a private school, with 8 (100.0% in the age bracket) attending a public institution.
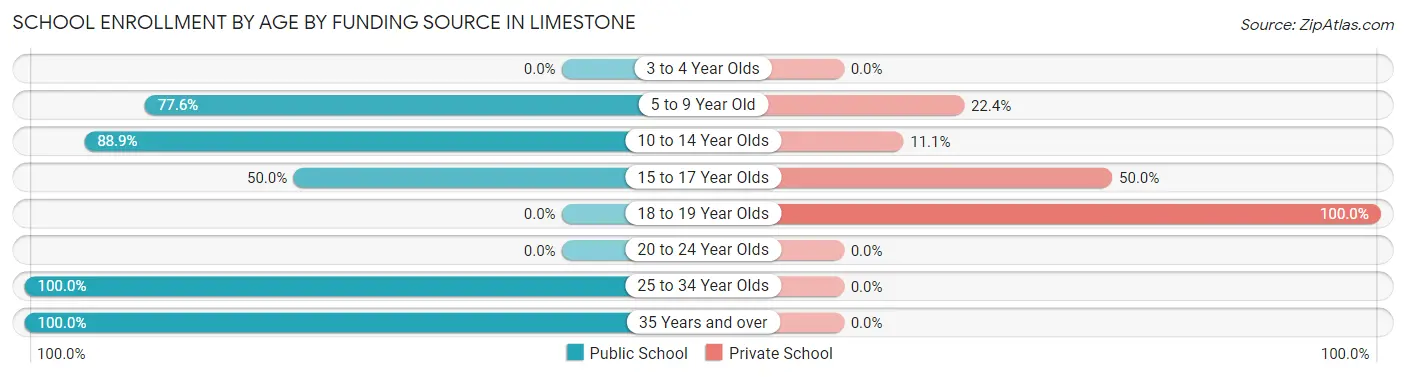
| Age Bracket | Public School | Private School |
| 3 to 4 Year Olds | 0 (0.0%) | 0 (0.0%) |
| 5 to 9 Year Old | 45 (77.6%) | 13 (22.4%) |
| 10 to 14 Year Olds | 56 (88.9%) | 7 (11.1%) |
| 15 to 17 Year Olds | 34 (50.0%) | 34 (50.0%) |
| 18 to 19 Year Olds | 0 (0.0%) | 14 (100.0%) |
| 20 to 24 Year Olds | 0 (0.0%) | 0 (0.0%) |
| 25 to 34 Year Olds | 8 (100.0%) | 0 (0.0%) |
| 35 Years and over | 10 (100.0%) | 0 (0.0%) |
| Total | 153 (69.2%) | 68 (30.8%) |
Educational Attainment by Field of Study in Limestone
Science & technology (34 | 23.0%), business (21 | 14.2%), physical & health sciences (18 | 12.2%), engineering (17 | 11.5%), and bio, nature & agricultural (16 | 10.8%) are the most common fields of study among 148 individuals in Limestone who have obtained a bachelor's degree or higher.
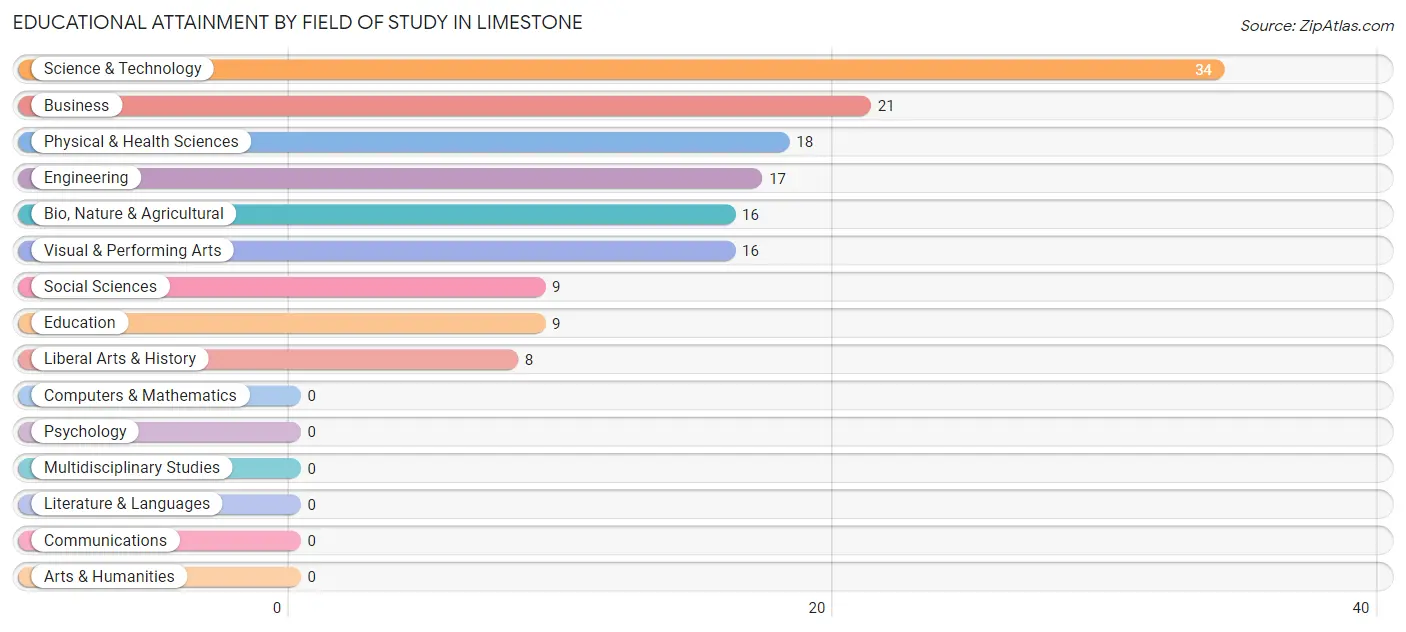
| Field of Study | # Graduates | % Graduates |
| Computers & Mathematics | 0 | 0.0% |
| Bio, Nature & Agricultural | 16 | 10.8% |
| Physical & Health Sciences | 18 | 12.2% |
| Psychology | 0 | 0.0% |
| Social Sciences | 9 | 6.1% |
| Engineering | 17 | 11.5% |
| Multidisciplinary Studies | 0 | 0.0% |
| Science & Technology | 34 | 23.0% |
| Business | 21 | 14.2% |
| Education | 9 | 6.1% |
| Literature & Languages | 0 | 0.0% |
| Liberal Arts & History | 8 | 5.4% |
| Visual & Performing Arts | 16 | 10.8% |
| Communications | 0 | 0.0% |
| Arts & Humanities | 0 | 0.0% |
| Total | 148 | 100.0% |
Transportation & Commute in Limestone
Vehicle Availability by Sex in Limestone
The most prevalent vehicle ownership categories in Limestone are males with 5 or more vehicles (122, accounting for 44.5%) and females with 5 or more vehicles (31, making up 81.9%).
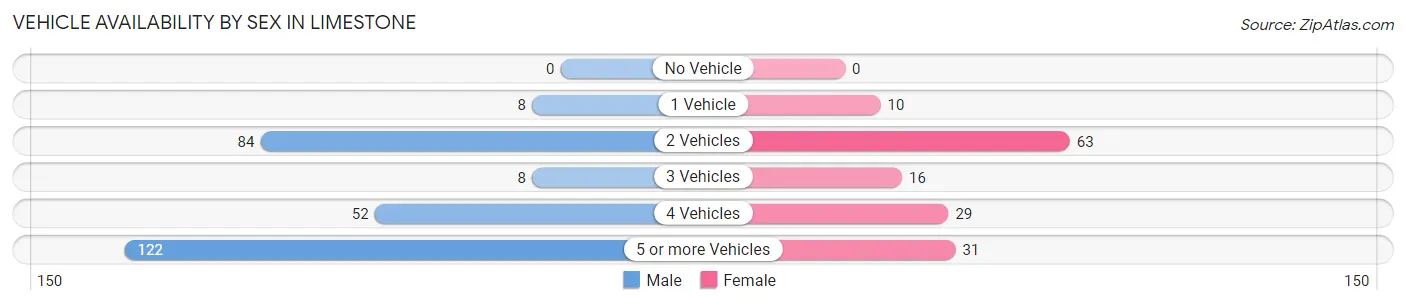
| Vehicles Available | Male | Female |
| No Vehicle | 0 (0.0%) | 0 (0.0%) |
| 1 Vehicle | 8 (2.9%) | 10 (6.7%) |
| 2 Vehicles | 84 (30.7%) | 63 (42.3%) |
| 3 Vehicles | 8 (2.9%) | 16 (10.7%) |
| 4 Vehicles | 52 (19.0%) | 29 (19.5%) |
| 5 or more Vehicles | 122 (44.5%) | 31 (20.8%) |
| Total | 274 (100.0%) | 149 (100.0%) |
Commute Time in Limestone
The most frequently occuring commute durations in Limestone are 30 to 34 minutes (136 commuters, 33.5%), 10 to 14 minutes (84 commuters, 20.7%), and 20 to 24 minutes (61 commuters, 15.0%).
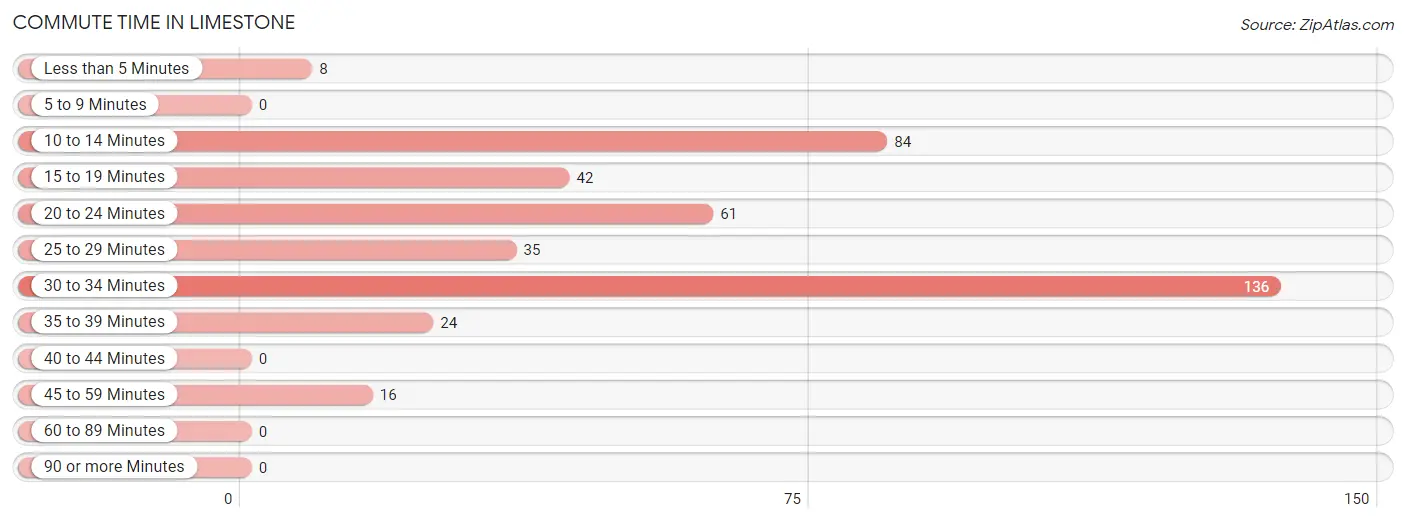
| Commute Time | # Commuters | % Commuters |
| Less than 5 Minutes | 8 | 2.0% |
| 5 to 9 Minutes | 0 | 0.0% |
| 10 to 14 Minutes | 84 | 20.7% |
| 15 to 19 Minutes | 42 | 10.3% |
| 20 to 24 Minutes | 61 | 15.0% |
| 25 to 29 Minutes | 35 | 8.6% |
| 30 to 34 Minutes | 136 | 33.5% |
| 35 to 39 Minutes | 24 | 5.9% |
| 40 to 44 Minutes | 0 | 0.0% |
| 45 to 59 Minutes | 16 | 3.9% |
| 60 to 89 Minutes | 0 | 0.0% |
| 90 or more Minutes | 0 | 0.0% |
Commute Time by Sex in Limestone
The most common commute times in Limestone are 30 to 34 minutes (70 commuters, 26.4%) for males and 30 to 34 minutes (66 commuters, 46.8%) for females.
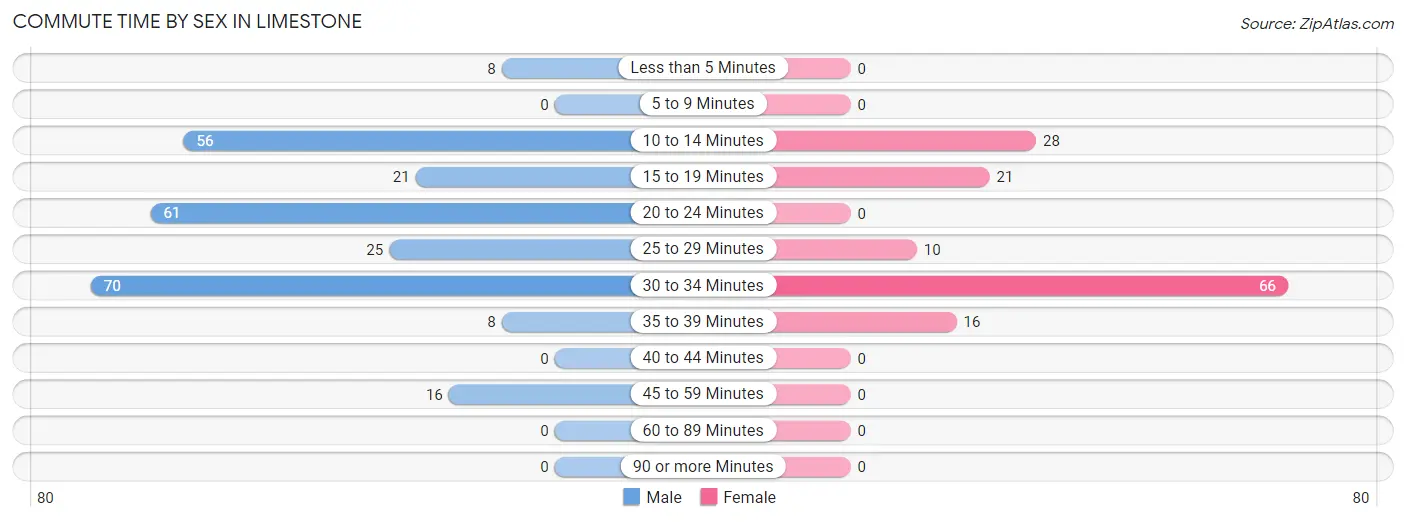
| Commute Time | Male | Female |
| Less than 5 Minutes | 8 (3.0%) | 0 (0.0%) |
| 5 to 9 Minutes | 0 (0.0%) | 0 (0.0%) |
| 10 to 14 Minutes | 56 (21.1%) | 28 (19.9%) |
| 15 to 19 Minutes | 21 (7.9%) | 21 (14.9%) |
| 20 to 24 Minutes | 61 (23.0%) | 0 (0.0%) |
| 25 to 29 Minutes | 25 (9.4%) | 10 (7.1%) |
| 30 to 34 Minutes | 70 (26.4%) | 66 (46.8%) |
| 35 to 39 Minutes | 8 (3.0%) | 16 (11.4%) |
| 40 to 44 Minutes | 0 (0.0%) | 0 (0.0%) |
| 45 to 59 Minutes | 16 (6.0%) | 0 (0.0%) |
| 60 to 89 Minutes | 0 (0.0%) | 0 (0.0%) |
| 90 or more Minutes | 0 (0.0%) | 0 (0.0%) |
Time of Departure to Work by Sex in Limestone
The most frequent times of departure to work in Limestone are 6:30 AM to 6:59 AM (82, 30.9%) for males and 6:30 AM to 6:59 AM (54, 38.3%) for females.
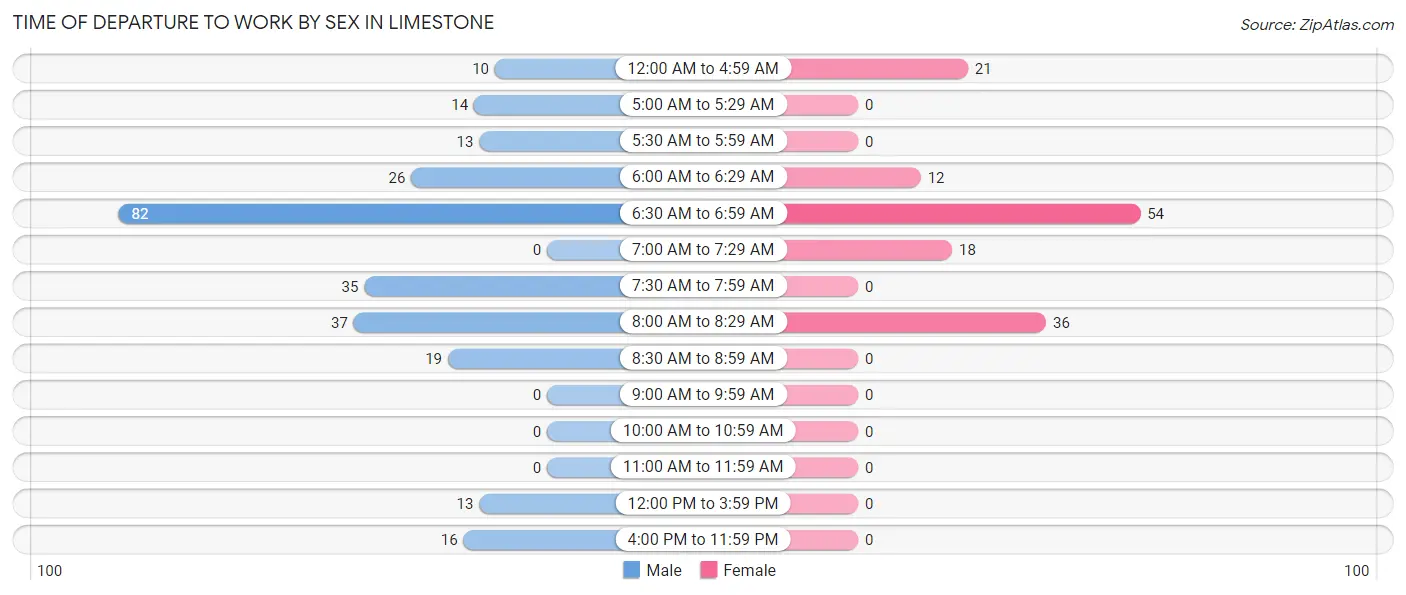
| Time of Departure | Male | Female |
| 12:00 AM to 4:59 AM | 10 (3.8%) | 21 (14.9%) |
| 5:00 AM to 5:29 AM | 14 (5.3%) | 0 (0.0%) |
| 5:30 AM to 5:59 AM | 13 (4.9%) | 0 (0.0%) |
| 6:00 AM to 6:29 AM | 26 (9.8%) | 12 (8.5%) |
| 6:30 AM to 6:59 AM | 82 (30.9%) | 54 (38.3%) |
| 7:00 AM to 7:29 AM | 0 (0.0%) | 18 (12.8%) |
| 7:30 AM to 7:59 AM | 35 (13.2%) | 0 (0.0%) |
| 8:00 AM to 8:29 AM | 37 (14.0%) | 36 (25.5%) |
| 8:30 AM to 8:59 AM | 19 (7.2%) | 0 (0.0%) |
| 9:00 AM to 9:59 AM | 0 (0.0%) | 0 (0.0%) |
| 10:00 AM to 10:59 AM | 0 (0.0%) | 0 (0.0%) |
| 11:00 AM to 11:59 AM | 0 (0.0%) | 0 (0.0%) |
| 12:00 PM to 3:59 PM | 13 (4.9%) | 0 (0.0%) |
| 4:00 PM to 11:59 PM | 16 (6.0%) | 0 (0.0%) |
| Total | 265 (100.0%) | 141 (100.0%) |
Housing Occupancy in Limestone
Occupancy by Ownership in Limestone
Of the total 246 dwellings in Limestone, owner-occupied units account for 227 (92.3%), while renter-occupied units make up 19 (7.7%).
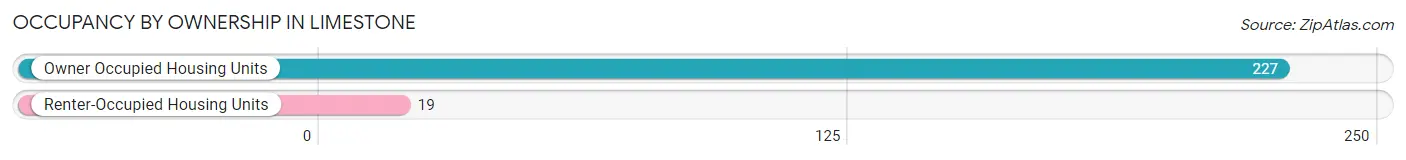
| Occupancy | # Housing Units | % Housing Units |
| Owner Occupied Housing Units | 227 | 92.3% |
| Renter-Occupied Housing Units | 19 | 7.7% |
| Total Occupied Housing Units | 246 | 100.0% |
Occupancy by Household Size in Limestone
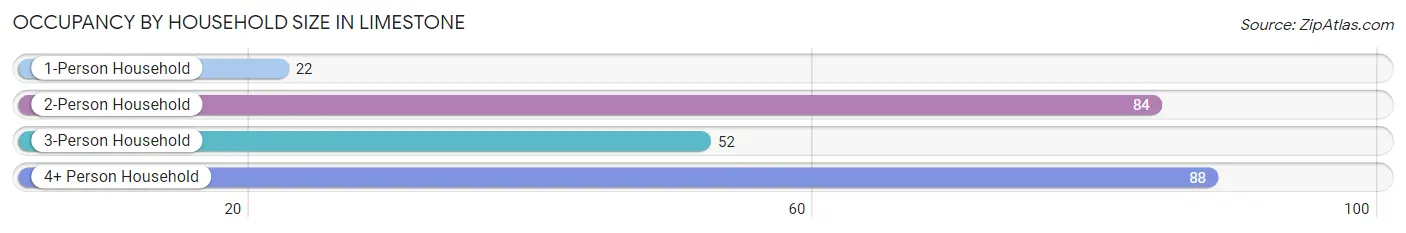
| Household Size | # Housing Units | % Housing Units |
| 1-Person Household | 22 | 8.9% |
| 2-Person Household | 84 | 34.2% |
| 3-Person Household | 52 | 21.1% |
| 4+ Person Household | 88 | 35.8% |
| Total Housing Units | 246 | 100.0% |
Occupancy by Ownership by Household Size in Limestone
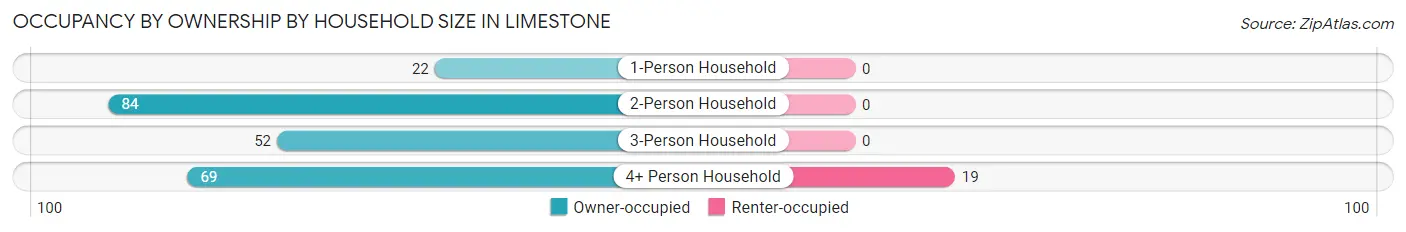
| Household Size | Owner-occupied | Renter-occupied |
| 1-Person Household | 22 (100.0%) | 0 (0.0%) |
| 2-Person Household | 84 (100.0%) | 0 (0.0%) |
| 3-Person Household | 52 (100.0%) | 0 (0.0%) |
| 4+ Person Household | 69 (78.4%) | 19 (21.6%) |
| Total Housing Units | 227 (92.3%) | 19 (7.7%) |
Occupancy by Educational Attainment in Limestone
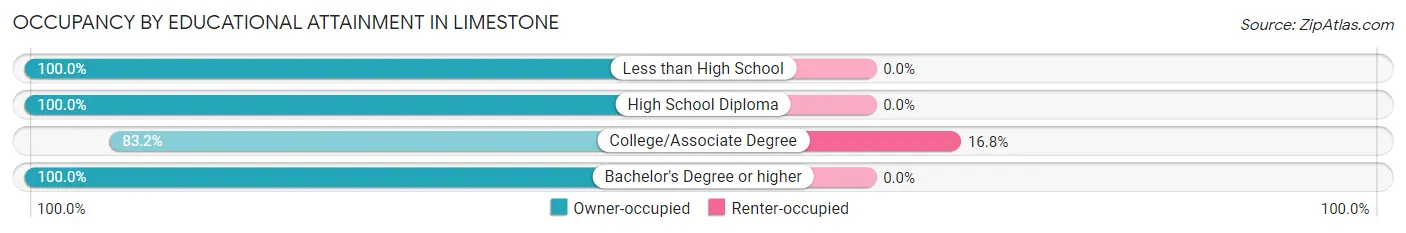
| Household Size | Owner-occupied | Renter-occupied |
| Less than High School | 9 (100.0%) | 0 (0.0%) |
| High School Diploma | 61 (100.0%) | 0 (0.0%) |
| College/Associate Degree | 94 (83.2%) | 19 (16.8%) |
| Bachelor's Degree or higher | 63 (100.0%) | 0 (0.0%) |
Occupancy by Age of Householder in Limestone
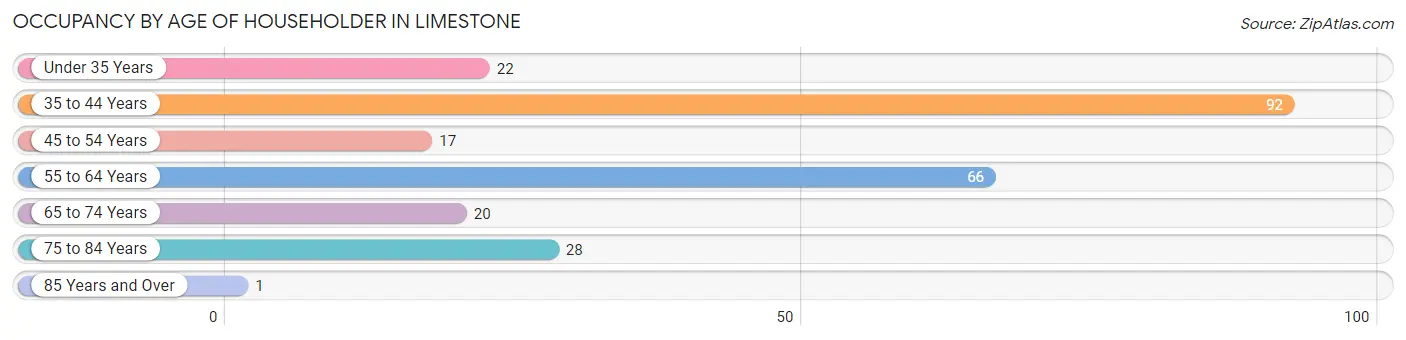
| Age Bracket | # Households | % Households |
| Under 35 Years | 22 | 8.9% |
| 35 to 44 Years | 92 | 37.4% |
| 45 to 54 Years | 17 | 6.9% |
| 55 to 64 Years | 66 | 26.8% |
| 65 to 74 Years | 20 | 8.1% |
| 75 to 84 Years | 28 | 11.4% |
| 85 Years and Over | 1 | 0.4% |
| Total | 246 | 100.0% |
Housing Finances in Limestone
Median Income by Occupancy in Limestone
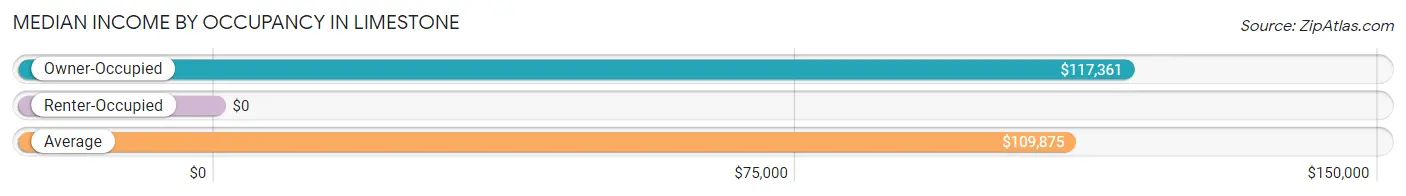
| Occupancy Type | # Households | Median Income |
| Owner-Occupied | 227 (92.3%) | $117,361 |
| Renter-Occupied | 19 (7.7%) | $0 |
| Average | 246 (100.0%) | $109,875 |
Occupancy by Householder Income Bracket in Limestone
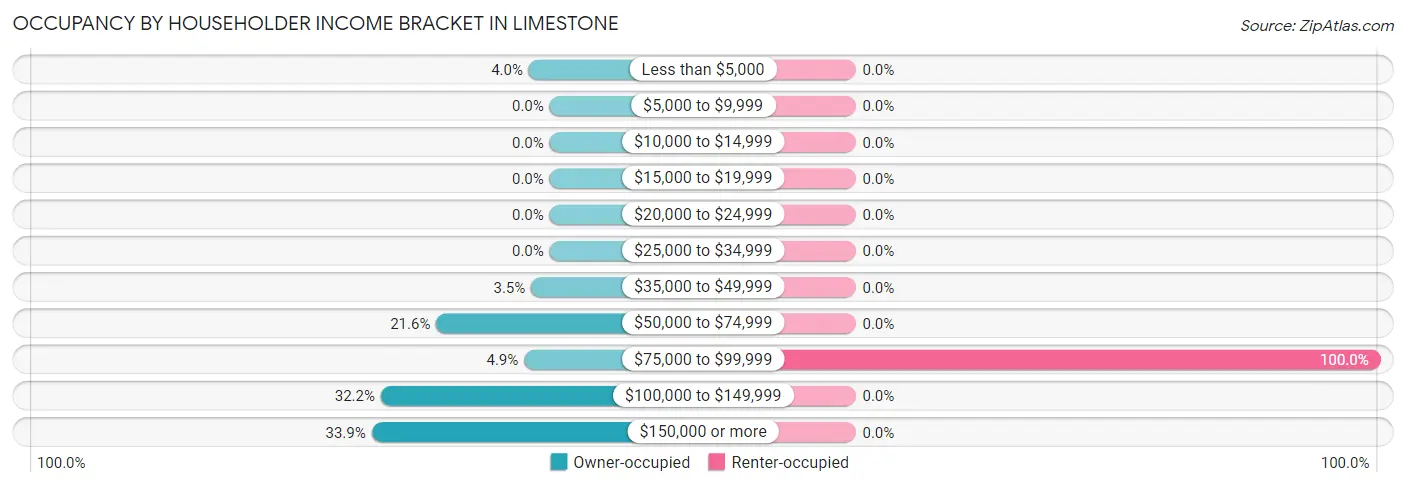
| Income Bracket | Owner-occupied | Renter-occupied |
| Less than $5,000 | 9 (4.0%) | 0 (0.0%) |
| $5,000 to $9,999 | 0 (0.0%) | 0 (0.0%) |
| $10,000 to $14,999 | 0 (0.0%) | 0 (0.0%) |
| $15,000 to $19,999 | 0 (0.0%) | 0 (0.0%) |
| $20,000 to $24,999 | 0 (0.0%) | 0 (0.0%) |
| $25,000 to $34,999 | 0 (0.0%) | 0 (0.0%) |
| $35,000 to $49,999 | 8 (3.5%) | 0 (0.0%) |
| $50,000 to $74,999 | 49 (21.6%) | 0 (0.0%) |
| $75,000 to $99,999 | 11 (4.9%) | 19 (100.0%) |
| $100,000 to $149,999 | 73 (32.2%) | 0 (0.0%) |
| $150,000 or more | 77 (33.9%) | 0 (0.0%) |
| Total | 227 (100.0%) | 19 (100.0%) |
Monthly Housing Cost Tiers in Limestone
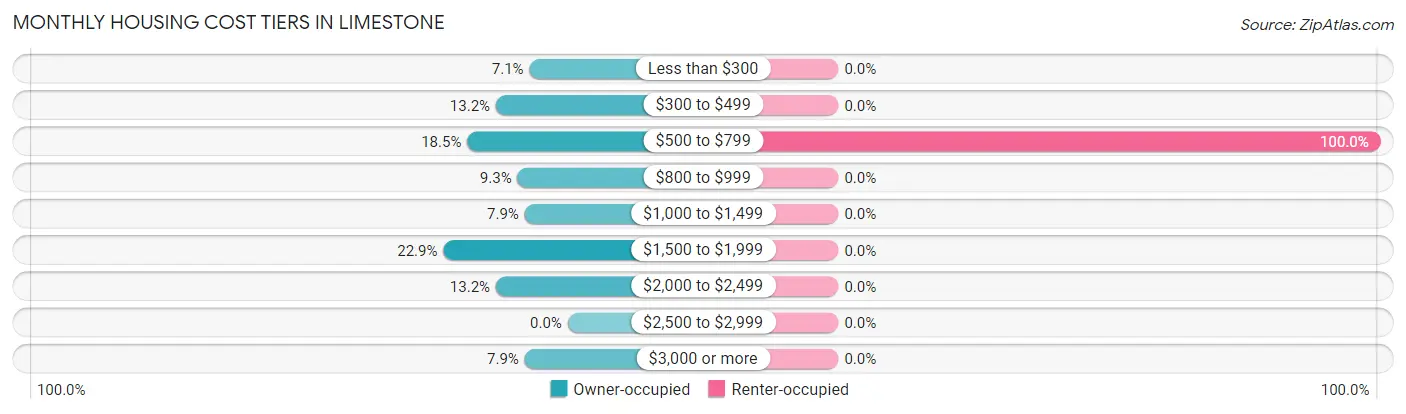
| Monthly Cost | Owner-occupied | Renter-occupied |
| Less than $300 | 16 (7.0%) | 0 (0.0%) |
| $300 to $499 | 30 (13.2%) | 0 (0.0%) |
| $500 to $799 | 42 (18.5%) | 19 (100.0%) |
| $800 to $999 | 21 (9.2%) | 0 (0.0%) |
| $1,000 to $1,499 | 18 (7.9%) | 0 (0.0%) |
| $1,500 to $1,999 | 52 (22.9%) | 0 (0.0%) |
| $2,000 to $2,499 | 30 (13.2%) | 0 (0.0%) |
| $2,500 to $2,999 | 0 (0.0%) | 0 (0.0%) |
| $3,000 or more | 18 (7.9%) | 0 (0.0%) |
| Total | 227 (100.0%) | 19 (100.0%) |
Physical Housing Characteristics in Limestone
Housing Structures in Limestone
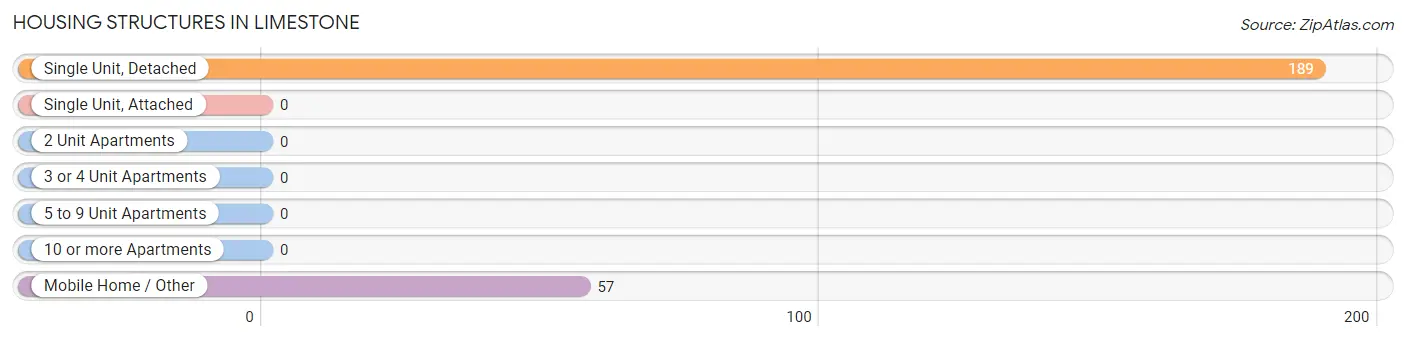
| Structure Type | # Housing Units | % Housing Units |
| Single Unit, Detached | 189 | 76.8% |
| Single Unit, Attached | 0 | 0.0% |
| 2 Unit Apartments | 0 | 0.0% |
| 3 or 4 Unit Apartments | 0 | 0.0% |
| 5 to 9 Unit Apartments | 0 | 0.0% |
| 10 or more Apartments | 0 | 0.0% |
| Mobile Home / Other | 57 | 23.2% |
| Total | 246 | 100.0% |
Housing Structures by Occupancy in Limestone
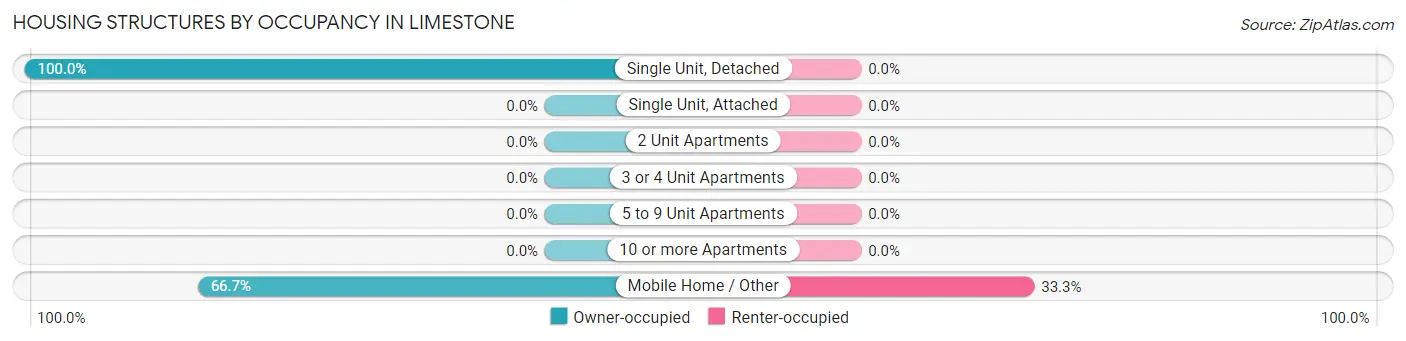
| Structure Type | Owner-occupied | Renter-occupied |
| Single Unit, Detached | 189 (100.0%) | 0 (0.0%) |
| Single Unit, Attached | 0 (0.0%) | 0 (0.0%) |
| 2 Unit Apartments | 0 (0.0%) | 0 (0.0%) |
| 3 or 4 Unit Apartments | 0 (0.0%) | 0 (0.0%) |
| 5 to 9 Unit Apartments | 0 (0.0%) | 0 (0.0%) |
| 10 or more Apartments | 0 (0.0%) | 0 (0.0%) |
| Mobile Home / Other | 38 (66.7%) | 19 (33.3%) |
| Total | 227 (92.3%) | 19 (7.7%) |
Housing Structures by Number of Rooms in Limestone
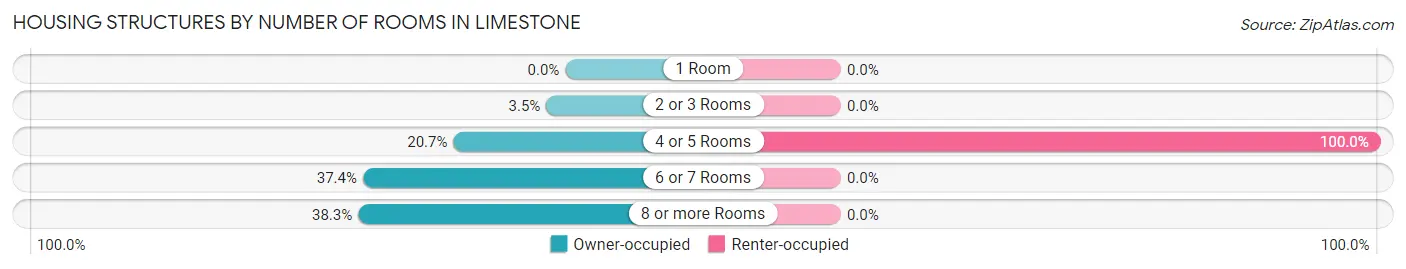
| Number of Rooms | Owner-occupied | Renter-occupied |
| 1 Room | 0 (0.0%) | 0 (0.0%) |
| 2 or 3 Rooms | 8 (3.5%) | 0 (0.0%) |
| 4 or 5 Rooms | 47 (20.7%) | 19 (100.0%) |
| 6 or 7 Rooms | 85 (37.4%) | 0 (0.0%) |
| 8 or more Rooms | 87 (38.3%) | 0 (0.0%) |
| Total | 227 (100.0%) | 19 (100.0%) |
Housing Structure by Heating Type in Limestone
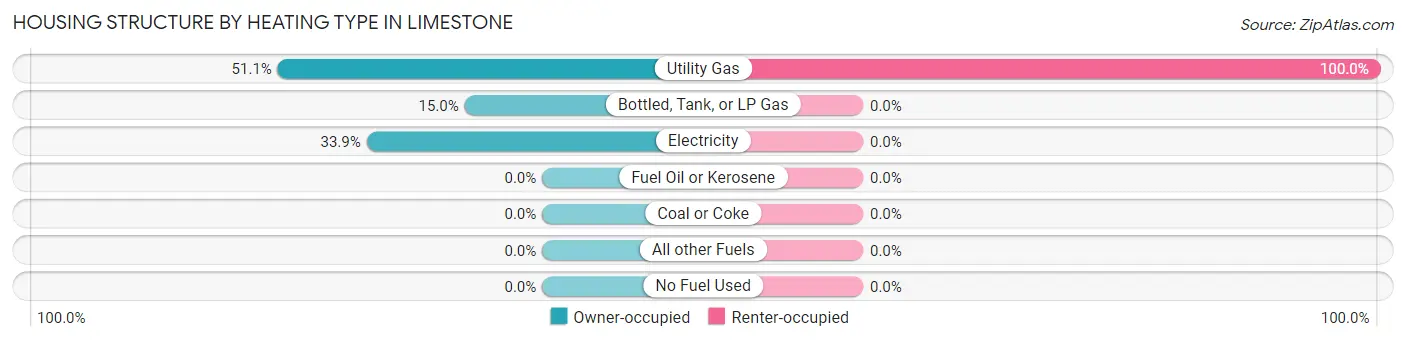
| Heating Type | Owner-occupied | Renter-occupied |
| Utility Gas | 116 (51.1%) | 19 (100.0%) |
| Bottled, Tank, or LP Gas | 34 (15.0%) | 0 (0.0%) |
| Electricity | 77 (33.9%) | 0 (0.0%) |
| Fuel Oil or Kerosene | 0 (0.0%) | 0 (0.0%) |
| Coal or Coke | 0 (0.0%) | 0 (0.0%) |
| All other Fuels | 0 (0.0%) | 0 (0.0%) |
| No Fuel Used | 0 (0.0%) | 0 (0.0%) |
| Total | 227 (100.0%) | 19 (100.0%) |
Household Vehicle Usage in Limestone
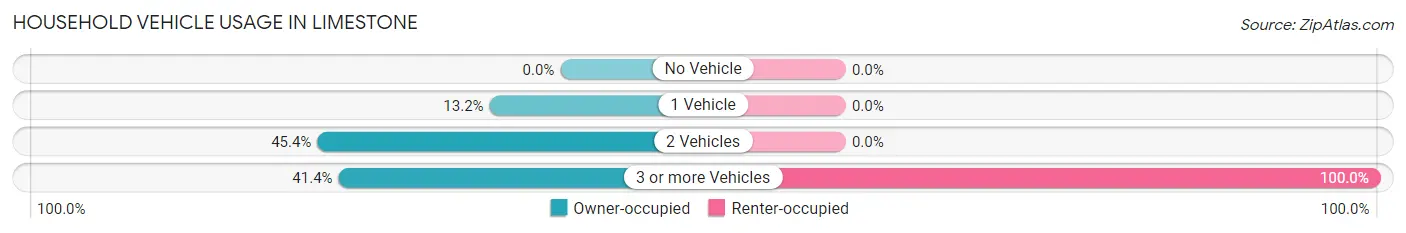
| Vehicles per Household | Owner-occupied | Renter-occupied |
| No Vehicle | 0 (0.0%) | 0 (0.0%) |
| 1 Vehicle | 30 (13.2%) | 0 (0.0%) |
| 2 Vehicles | 103 (45.4%) | 0 (0.0%) |
| 3 or more Vehicles | 94 (41.4%) | 19 (100.0%) |
| Total | 227 (100.0%) | 19 (100.0%) |
Real Estate & Mortgages in Limestone
Real Estate and Mortgage Overview in Limestone
| Characteristic | Without Mortgage | With Mortgage |
| Housing Units | 103 | 124 |
| Median Property Value | $227,600 | $324,100 |
| Median Household Income | $87,639 | $59 |
| Monthly Housing Costs | $603 | $18 |
| Real Estate Taxes | $1,750 | $10 |
Property Value by Mortgage Status in Limestone
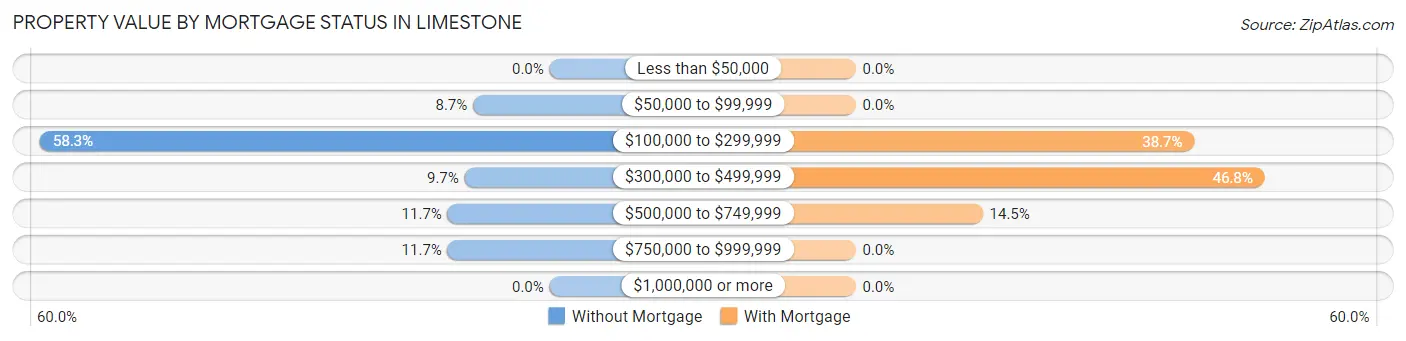
| Property Value | Without Mortgage | With Mortgage |
| Less than $50,000 | 0 (0.0%) | 0 (0.0%) |
| $50,000 to $99,999 | 9 (8.7%) | 0 (0.0%) |
| $100,000 to $299,999 | 60 (58.3%) | 48 (38.7%) |
| $300,000 to $499,999 | 10 (9.7%) | 58 (46.8%) |
| $500,000 to $749,999 | 12 (11.7%) | 18 (14.5%) |
| $750,000 to $999,999 | 12 (11.7%) | 0 (0.0%) |
| $1,000,000 or more | 0 (0.0%) | 0 (0.0%) |
| Total | 103 (100.0%) | 124 (100.0%) |
Household Income by Mortgage Status in Limestone
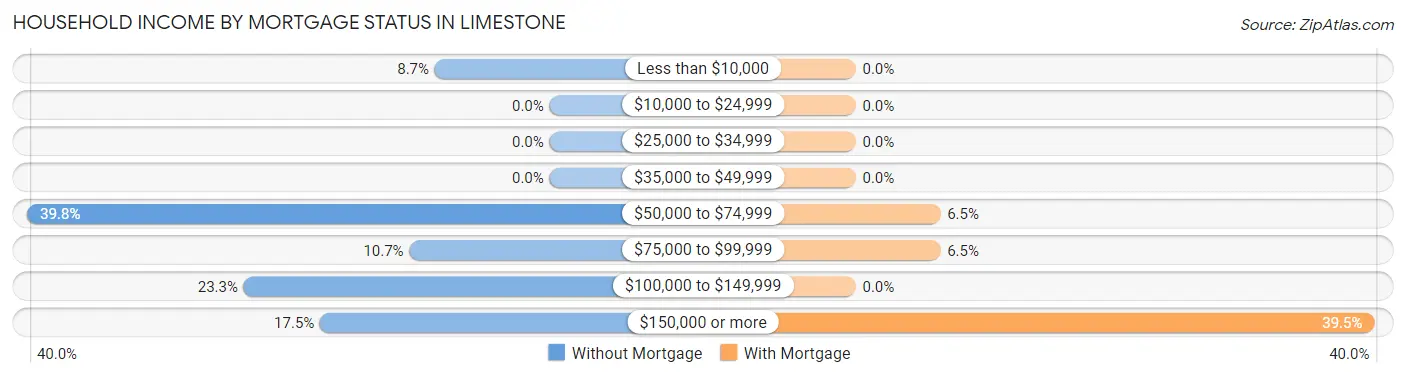
| Household Income | Without Mortgage | With Mortgage |
| Less than $10,000 | 9 (8.7%) | 0 (0.0%) |
| $10,000 to $24,999 | 0 (0.0%) | 0 (0.0%) |
| $25,000 to $34,999 | 0 (0.0%) | 0 (0.0%) |
| $35,000 to $49,999 | 0 (0.0%) | 0 (0.0%) |
| $50,000 to $74,999 | 41 (39.8%) | 8 (6.5%) |
| $75,000 to $99,999 | 11 (10.7%) | 8 (6.5%) |
| $100,000 to $149,999 | 24 (23.3%) | 0 (0.0%) |
| $150,000 or more | 18 (17.5%) | 49 (39.5%) |
| Total | 103 (100.0%) | 124 (100.0%) |
Property Value to Household Income Ratio in Limestone
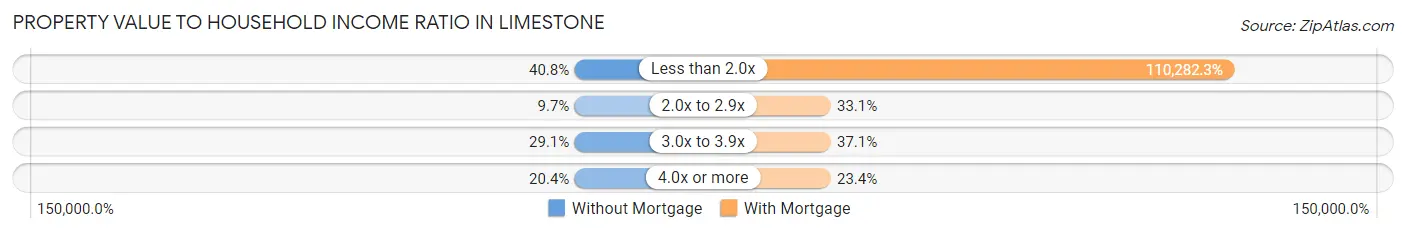
| Value-to-Income Ratio | Without Mortgage | With Mortgage |
| Less than 2.0x | 42 (40.8%) | 136,750 (110,282.3%) |
| 2.0x to 2.9x | 10 (9.7%) | 41 (33.1%) |
| 3.0x to 3.9x | 30 (29.1%) | 46 (37.1%) |
| 4.0x or more | 21 (20.4%) | 29 (23.4%) |
| Total | 103 (100.0%) | 124 (100.0%) |
Real Estate Taxes by Mortgage Status in Limestone
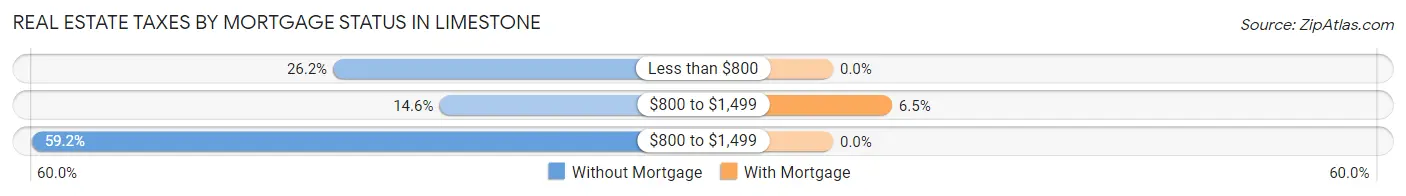
| Property Taxes | Without Mortgage | With Mortgage |
| Less than $800 | 27 (26.2%) | 0 (0.0%) |
| $800 to $1,499 | 15 (14.6%) | 8 (6.5%) |
| $800 to $1,499 | 61 (59.2%) | 0 (0.0%) |
| Total | 103 (100.0%) | 124 (100.0%) |
Health & Disability in Limestone
Health Insurance Coverage by Age in Limestone
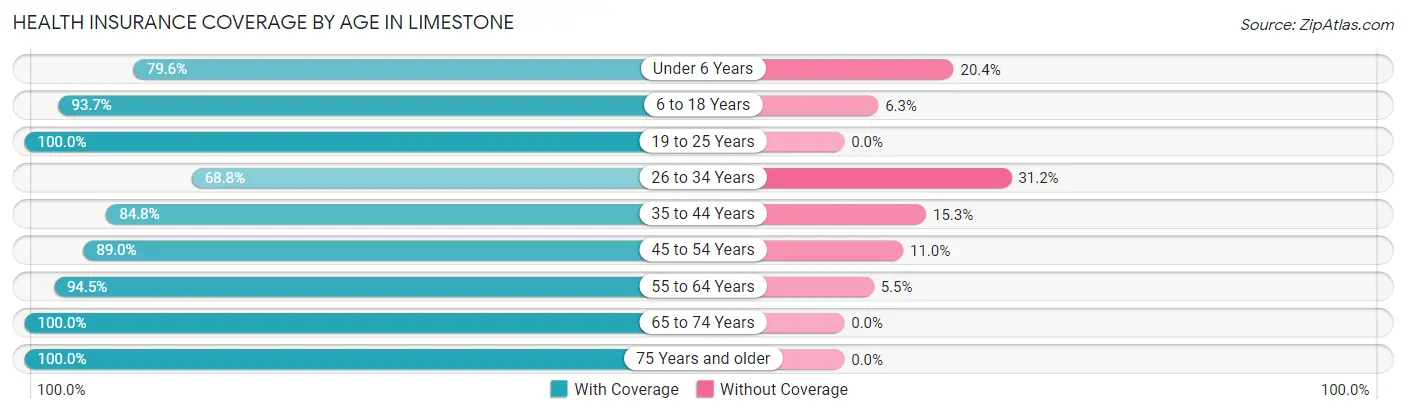
| Age Bracket | With Coverage | Without Coverage |
| Under 6 Years | 43 (79.6%) | 11 (20.4%) |
| 6 to 18 Years | 163 (93.7%) | 11 (6.3%) |
| 19 to 25 Years | 14 (100.0%) | 0 (0.0%) |
| 26 to 34 Years | 53 (68.8%) | 24 (31.2%) |
| 35 to 44 Years | 150 (84.8%) | 27 (15.2%) |
| 45 to 54 Years | 65 (89.0%) | 8 (11.0%) |
| 55 to 64 Years | 138 (94.5%) | 8 (5.5%) |
| 65 to 74 Years | 40 (100.0%) | 0 (0.0%) |
| 75 Years and older | 47 (100.0%) | 0 (0.0%) |
| Total | 713 (88.9%) | 89 (11.1%) |
Health Insurance Coverage by Citizenship Status in Limestone
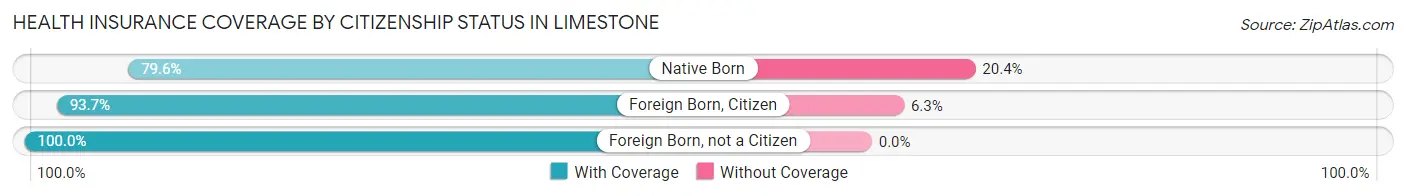
| Citizenship Status | With Coverage | Without Coverage |
| Native Born | 43 (79.6%) | 11 (20.4%) |
| Foreign Born, Citizen | 163 (93.7%) | 11 (6.3%) |
| Foreign Born, not a Citizen | 14 (100.0%) | 0 (0.0%) |
Health Insurance Coverage by Household Income in Limestone
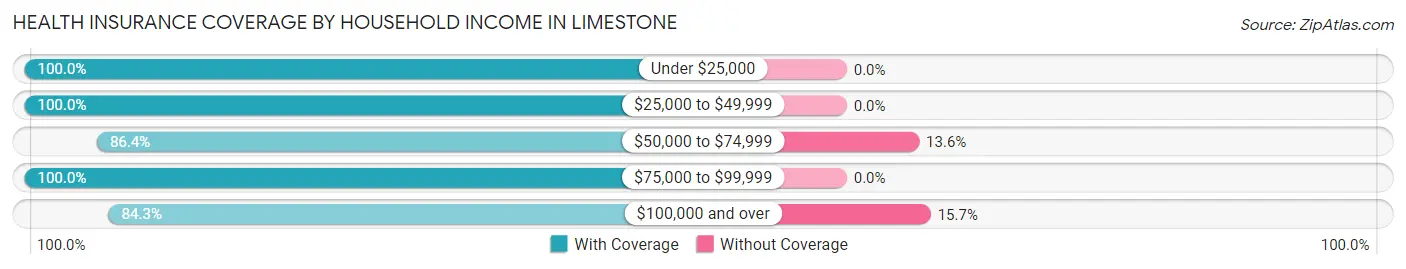
| Household Income | With Coverage | Without Coverage |
| Under $25,000 | 19 (100.0%) | 0 (0.0%) |
| $25,000 to $49,999 | 9 (100.0%) | 0 (0.0%) |
| $50,000 to $74,999 | 102 (86.4%) | 16 (13.6%) |
| $75,000 to $99,999 | 192 (100.0%) | 0 (0.0%) |
| $100,000 and over | 391 (84.3%) | 73 (15.7%) |
Public vs Private Health Insurance Coverage by Age in Limestone
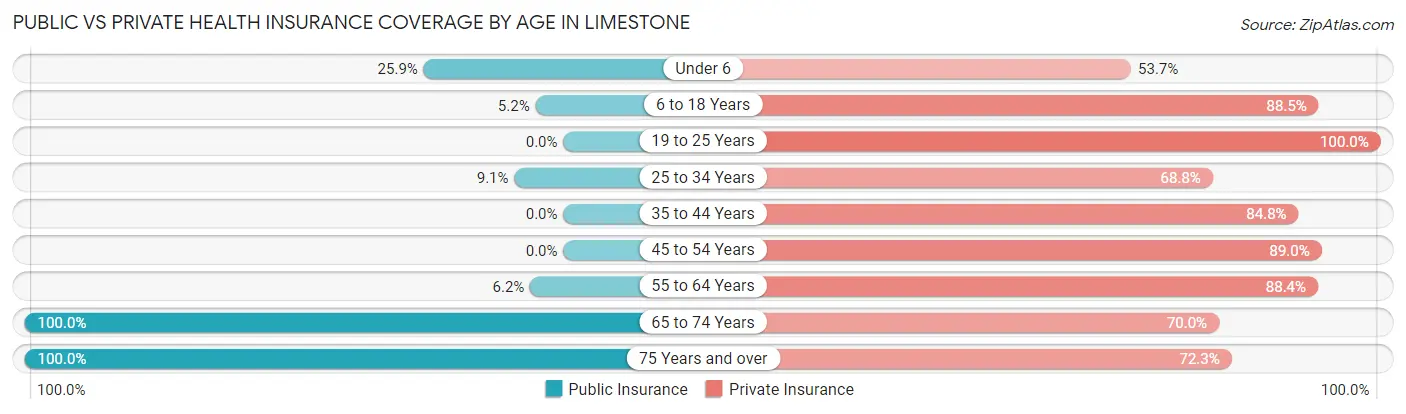
| Age Bracket | Public Insurance | Private Insurance |
| Under 6 | 14 (25.9%) | 29 (53.7%) |
| 6 to 18 Years | 9 (5.2%) | 154 (88.5%) |
| 19 to 25 Years | 0 (0.0%) | 14 (100.0%) |
| 25 to 34 Years | 7 (9.1%) | 53 (68.8%) |
| 35 to 44 Years | 0 (0.0%) | 150 (84.8%) |
| 45 to 54 Years | 0 (0.0%) | 65 (89.0%) |
| 55 to 64 Years | 9 (6.2%) | 129 (88.4%) |
| 65 to 74 Years | 40 (100.0%) | 28 (70.0%) |
| 75 Years and over | 47 (100.0%) | 34 (72.3%) |
| Total | 126 (15.7%) | 656 (81.8%) |
Disability Status by Sex by Age in Limestone
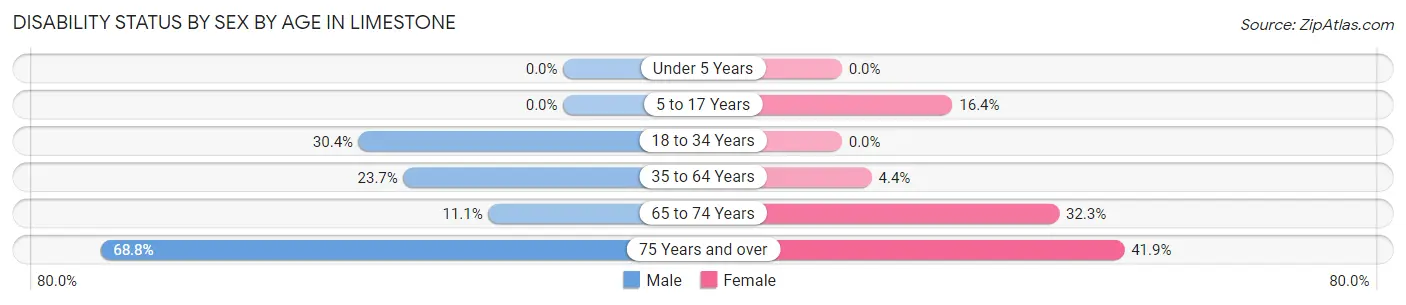
| Age Bracket | Male | Female |
| Under 5 Years | 0 (0.0%) | 0 (0.0%) |
| 5 to 17 Years | 0 (0.0%) | 11 (16.4%) |
| 18 to 34 Years | 17 (30.4%) | 0 (0.0%) |
| 35 to 64 Years | 51 (23.7%) | 8 (4.4%) |
| 65 to 74 Years | 1 (11.1%) | 10 (32.3%) |
| 75 Years and over | 11 (68.8%) | 13 (41.9%) |
Disability Class by Sex by Age in Limestone
Disability Class: Hearing Difficulty
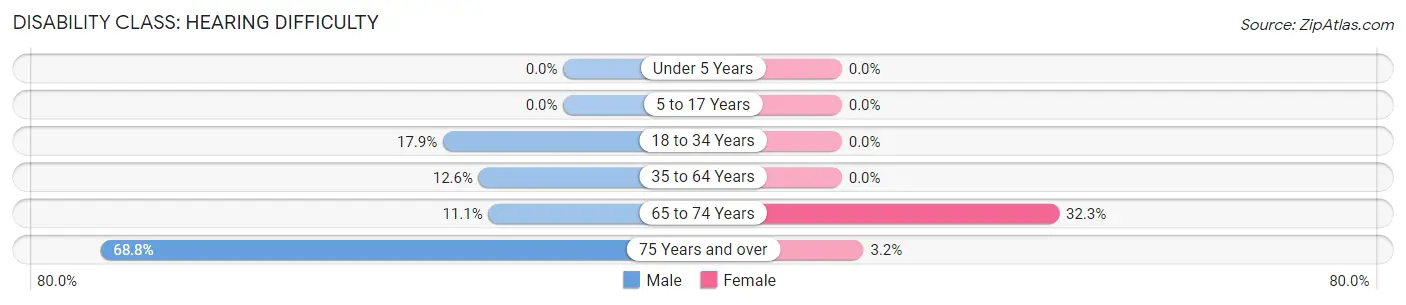
| Age Bracket | Male | Female |
| Under 5 Years | 0 (0.0%) | 0 (0.0%) |
| 5 to 17 Years | 0 (0.0%) | 0 (0.0%) |
| 18 to 34 Years | 10 (17.9%) | 0 (0.0%) |
| 35 to 64 Years | 27 (12.6%) | 0 (0.0%) |
| 65 to 74 Years | 1 (11.1%) | 10 (32.3%) |
| 75 Years and over | 11 (68.8%) | 1 (3.2%) |
Disability Class: Vision Difficulty
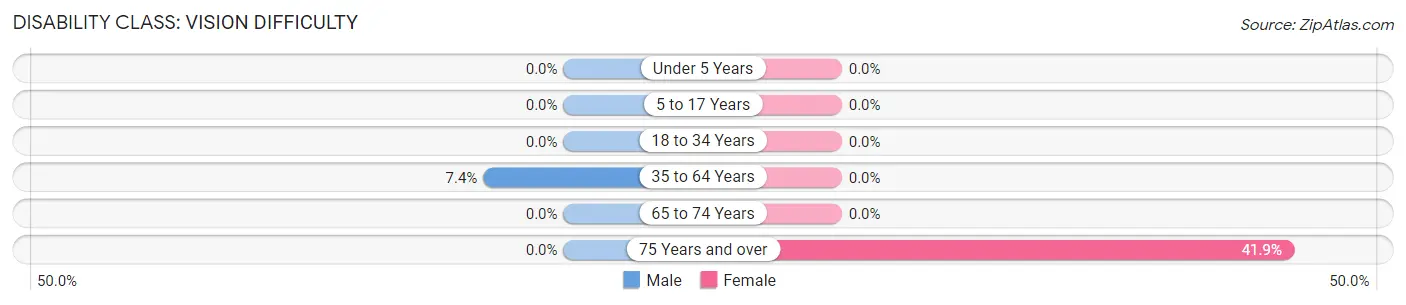
| Age Bracket | Male | Female |
| Under 5 Years | 0 (0.0%) | 0 (0.0%) |
| 5 to 17 Years | 0 (0.0%) | 0 (0.0%) |
| 18 to 34 Years | 0 (0.0%) | 0 (0.0%) |
| 35 to 64 Years | 16 (7.4%) | 0 (0.0%) |
| 65 to 74 Years | 0 (0.0%) | 0 (0.0%) |
| 75 Years and over | 0 (0.0%) | 13 (41.9%) |
Disability Class: Cognitive Difficulty
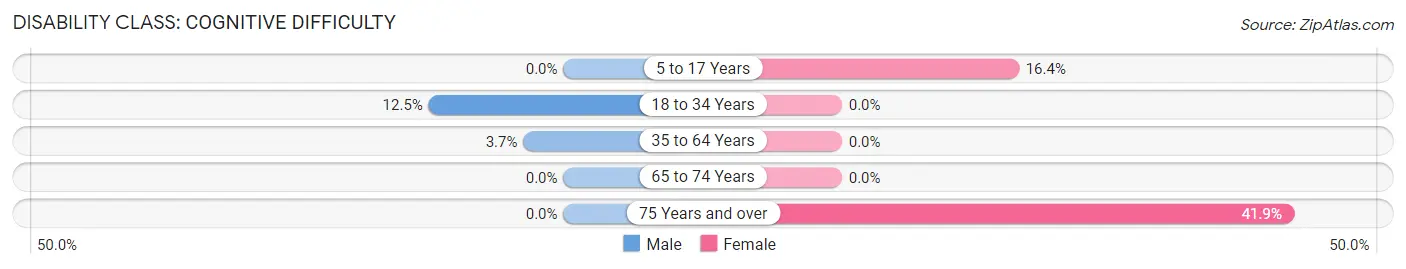
| Age Bracket | Male | Female |
| 5 to 17 Years | 0 (0.0%) | 11 (16.4%) |
| 18 to 34 Years | 7 (12.5%) | 0 (0.0%) |
| 35 to 64 Years | 8 (3.7%) | 0 (0.0%) |
| 65 to 74 Years | 0 (0.0%) | 0 (0.0%) |
| 75 Years and over | 0 (0.0%) | 13 (41.9%) |
Disability Class: Ambulatory Difficulty
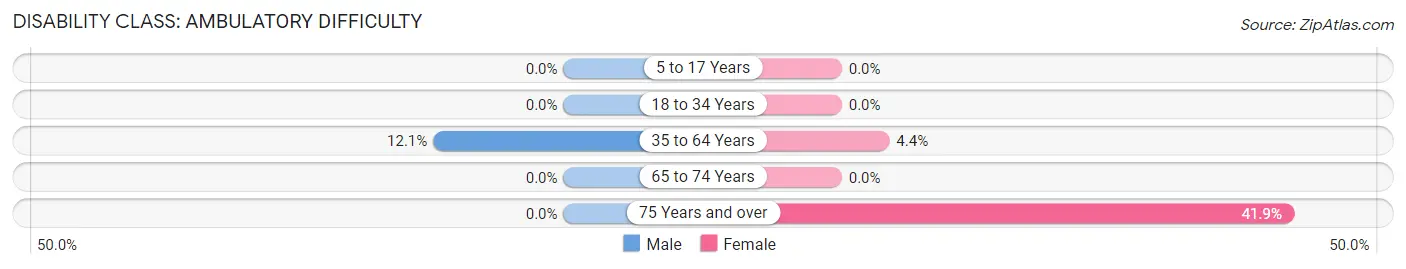
| Age Bracket | Male | Female |
| 5 to 17 Years | 0 (0.0%) | 0 (0.0%) |
| 18 to 34 Years | 0 (0.0%) | 0 (0.0%) |
| 35 to 64 Years | 26 (12.1%) | 8 (4.4%) |
| 65 to 74 Years | 0 (0.0%) | 0 (0.0%) |
| 75 Years and over | 0 (0.0%) | 13 (41.9%) |
Disability Class: Self-Care Difficulty
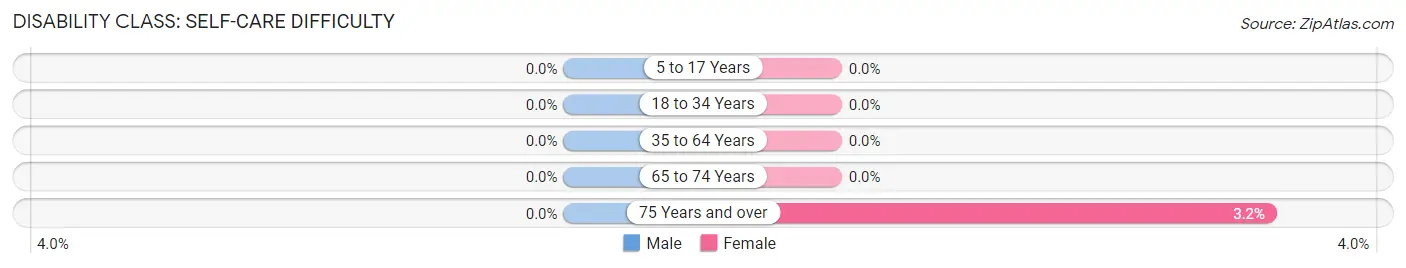
| Age Bracket | Male | Female |
| 5 to 17 Years | 0 (0.0%) | 0 (0.0%) |
| 18 to 34 Years | 0 (0.0%) | 0 (0.0%) |
| 35 to 64 Years | 0 (0.0%) | 0 (0.0%) |
| 65 to 74 Years | 0 (0.0%) | 0 (0.0%) |
| 75 Years and over | 0 (0.0%) | 1 (3.2%) |
Technology Access in Limestone
Computing Device Access in Limestone
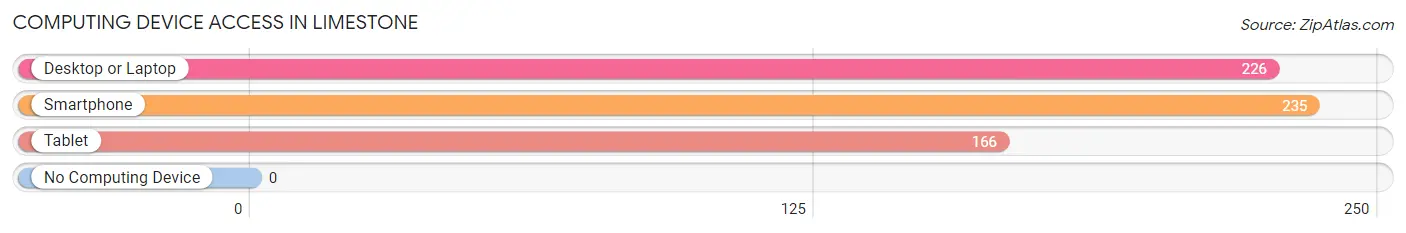
| Device Type | # Households | % Households |
| Desktop or Laptop | 226 | 91.9% |
| Smartphone | 235 | 95.5% |
| Tablet | 166 | 67.5% |
| No Computing Device | 0 | 0.0% |
| Total | 246 | 100.0% |
Internet Access in Limestone
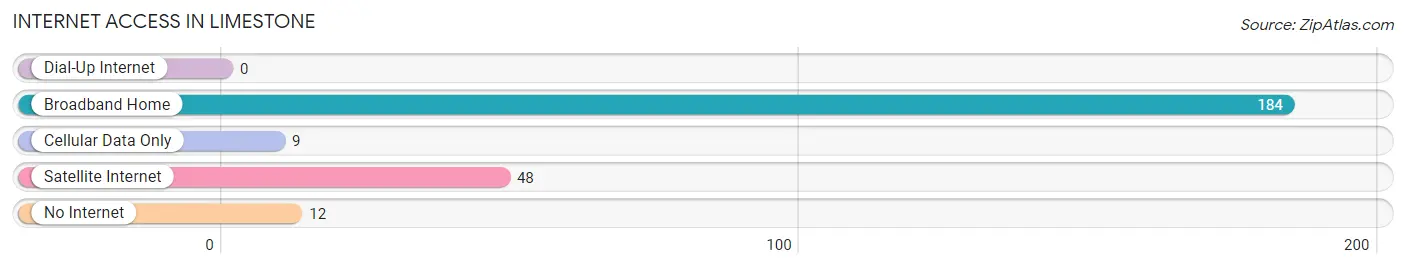
| Internet Type | # Households | % Households |
| Dial-Up Internet | 0 | 0.0% |
| Broadband Home | 184 | 74.8% |
| Cellular Data Only | 9 | 3.7% |
| Satellite Internet | 48 | 19.5% |
| No Internet | 12 | 4.9% |
| Total | 246 | 100.0% |
Limestone Summary
Limestone, Oklahoma is a small town located in the northeastern corner of the state, near the Arkansas border. It is part of the Fort Smith metropolitan area and is situated in the foothills of the Ozark Mountains. The town was founded in 1887 and has a population of just over 1,000 people.
Geography
Limestone is located in the foothills of the Ozark Mountains, in the northeastern corner of Oklahoma. It is situated in Le Flore County, near the Arkansas border. The town is located at the intersection of US Highway 59 and State Highway 82. The town is surrounded by rolling hills and is situated on the banks of the Arkansas River. The town is located in a temperate climate, with hot summers and mild winters.
History
Limestone was founded in 1887 by a group of settlers from Arkansas. The town was named after the limestone deposits that were found in the area. The town was originally a farming community, but it soon became a trading post for the surrounding area. The town was incorporated in 1895 and the first post office was established in 1896.
In the early 1900s, the town began to grow and prosper. The town was home to several businesses, including a general store, a blacksmith shop, a hotel, and a bank. The town also had a school and a church.
In the 1920s, the town began to decline. The Great Depression hit the town hard and many of the businesses closed. The town was also hit by a tornado in 1929, which destroyed many of the buildings.
In the 1940s, the town began to recover. The town was home to several businesses, including a lumber mill, a cotton gin, and a canning factory. The town also had a movie theater and a bowling alley.
In the 1950s, the town began to decline again. The lumber mill and the canning factory closed, and the town's population began to decline. The town was also hit by a tornado in 1957, which destroyed many of the buildings.
In the 1960s, the town began to recover again. The town was home to several businesses, including a grocery store, a hardware store, and a restaurant. The town also had a library and a museum.
In the 1970s, the town began to decline again. The town's population continued to decline and many of the businesses closed. The town was also hit by a tornado in 1979, which destroyed many of the buildings.
In the 1980s, the town began to recover again. The town was home to several businesses, including a gas station, a grocery store, and a restaurant. The town also had a library and a museum.
In the 1990s, the town began to decline again. The town's population continued to decline and many of the businesses closed. The town was also hit by a tornado in 1999, which destroyed many of the buildings.
Economy
Limestone's economy is largely based on agriculture. The town is home to several farms, which produce a variety of crops, including corn, soybeans, and wheat. The town is also home to several businesses, including a grocery store, a hardware store, and a restaurant.
Demographics
As of the 2010 census, the population of Limestone was 1,072. The town is predominantly white, with a small African American population. The median household income is $31,250 and the median home value is $76,400. The town has a high school graduation rate of 81.3%.
Conclusion
Limestone, Oklahoma is a small town located in the northeastern corner of the state, near the Arkansas border. It is part of the Fort Smith metropolitan area and is situated in the foothills of the Ozark Mountains. The town was founded in 1887 and has a population of just over 1,000 people. The town's economy is largely based on agriculture, and the town is home to several businesses, including a grocery store, a hardware store, and a restaurant. The town is predominantly white, with a small African American population. The median household income is $31,250 and the median home value is $76,400. The town has a high school graduation rate of 81.3%.
Common Questions
What is Per Capita Income in Limestone?
Per Capita income in Limestone is $50,915.
What is the Median Family Income in Limestone?
Median Family Income in Limestone is $109,167.
What is the Median Household income in Limestone?
Median Household Income in Limestone is $109,875.
What is Income or Wage Gap in Limestone?
Income or Wage Gap in Limestone is 42.8%.
Women in Limestone earn 57.2 cents for every dollar earned by a man.
What is Inequality or Gini Index in Limestone?
Inequality or Gini Index in Limestone is 0.44.
What is the Total Population of Limestone?
Total Population of Limestone is 802.
What is the Total Male Population of Limestone?
Total Male Population of Limestone is 433.
What is the Total Female Population of Limestone?
Total Female Population of Limestone is 369.
What is the Ratio of Males per 100 Females in Limestone?
There are 117.34 Males per 100 Females in Limestone.
What is the Ratio of Females per 100 Males in Limestone?
There are 85.22 Females per 100 Males in Limestone.
What is the Median Population Age in Limestone?
Median Population Age in Limestone is 40.7 Years.
What is the Average Family Size in Limestone
Average Family Size in Limestone is 3.4 People.
What is the Average Household Size in Limestone
Average Household Size in Limestone is 3.3 People.
How Large is the Labor Force in Limestone?
There are 441 People in the Labor Forcein in Limestone.
What is the Percentage of People in the Labor Force in Limestone?
70.2% of People are in the Labor Force in Limestone.
What is the Unemployment Rate in Limestone?
Unemployment Rate in Limestone is 1.8%.