Tracy, MN Map & Demographics
Tracy Map
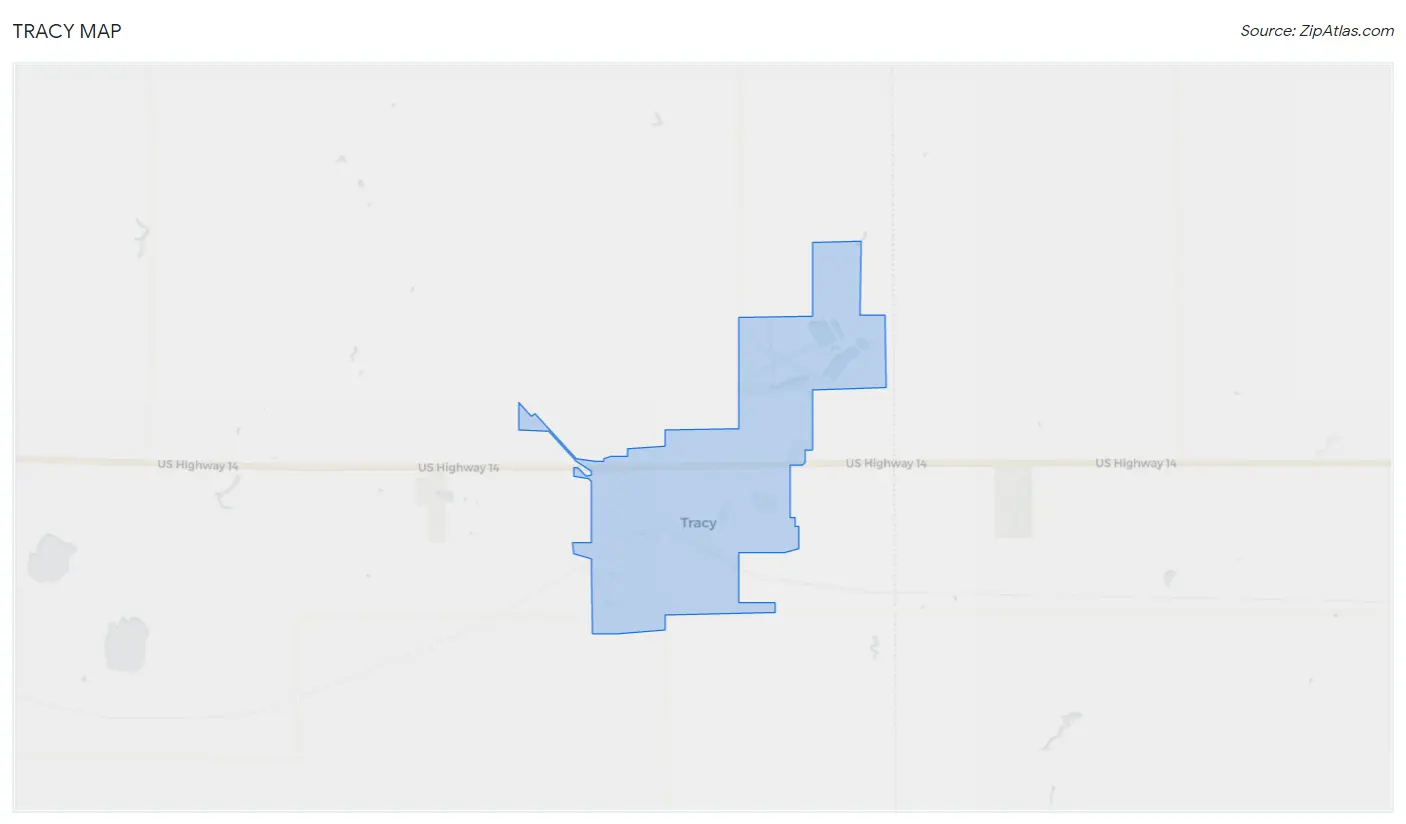
Tracy Overview
$28,717
PER CAPITA INCOME
$72,228
AVG FAMILY INCOME
$63,201
AVG HOUSEHOLD INCOME
14.5%
WAGE / INCOME GAP [ % ]
85.5¢/ $1
WAGE / INCOME GAP [ $ ]
$8,128
FAMILY INCOME DEFICIT
0.41
INEQUALITY / GINI INDEX
2,006
TOTAL POPULATION
1,026
MALE POPULATION
980
FEMALE POPULATION
104.69
MALES / 100 FEMALES
95.52
FEMALES / 100 MALES
39.0
MEDIAN AGE
3.4
AVG FAMILY SIZE
2.6
AVG HOUSEHOLD SIZE
1,010
LABOR FORCE [ PEOPLE ]
64.9%
PERCENT IN LABOR FORCE
3.4%
UNEMPLOYMENT RATE
Tracy Zip Codes
Tracy Area Codes
Income in Tracy
Income Overview in Tracy
Per Capita Income in Tracy is $28,717, while median incomes of families and households are $72,228 and $63,201 respectively.
| Characteristic | Number | Measure |
| Per Capita Income | 2,006 | $28,717 |
| Median Family Income | 467 | $72,228 |
| Mean Family Income | 467 | $91,353 |
| Median Household Income | 743 | $63,201 |
| Mean Household Income | 743 | $75,134 |
| Income Deficit | 467 | $8,128 |
| Wage / Income Gap (%) | 2,006 | 14.51% |
| Wage / Income Gap ($) | 2,006 | 85.49¢ per $1 |
| Gini / Inequality Index | 2,006 | 0.41 |
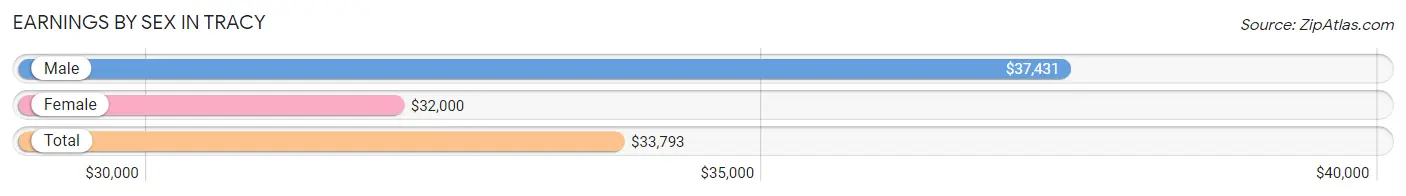
Earnings by Sex in Tracy
Average Earnings in Tracy are $33,793, $37,431 for men and $32,000 for women, a difference of 14.5%.
| Sex | Number | Average Earnings |
| Male | 549 (51.1%) | $37,431 |
| Female | 526 (48.9%) | $32,000 |
| Total | 1,075 (100.0%) | $33,793 |
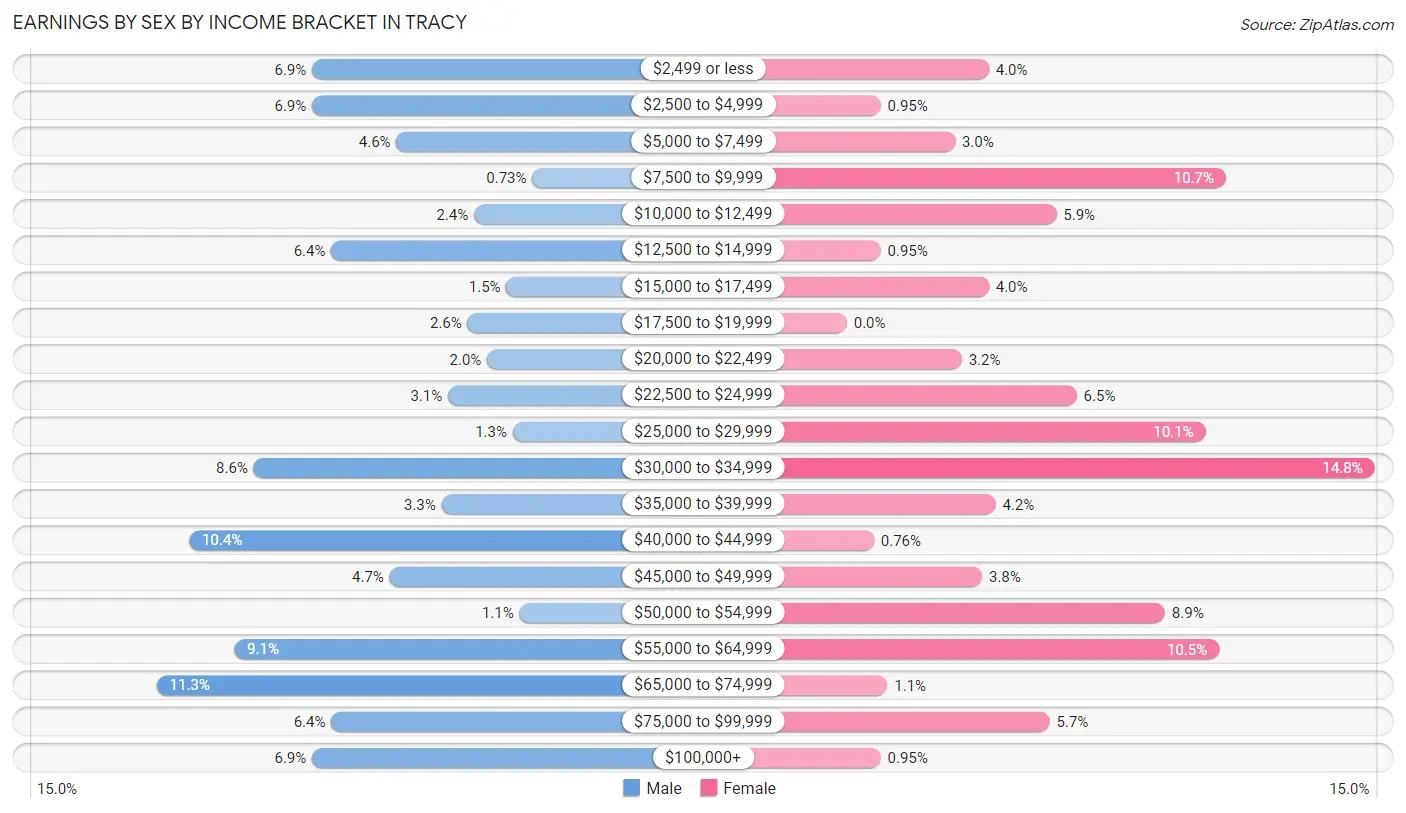
Earnings by Sex by Income Bracket in Tracy
The most common earnings brackets in Tracy are $65,000 to $74,999 for men (62 | 11.3%) and $30,000 to $34,999 for women (78 | 14.8%).
| Income | Male | Female |
| $2,499 or less | 38 (6.9%) | 21 (4.0%) |
| $2,500 to $4,999 | 38 (6.9%) | 5 (0.9%) |
| $5,000 to $7,499 | 25 (4.5%) | 16 (3.0%) |
| $7,500 to $9,999 | 4 (0.7%) | 56 (10.6%) |
| $10,000 to $12,499 | 13 (2.4%) | 31 (5.9%) |
| $12,500 to $14,999 | 35 (6.4%) | 5 (0.9%) |
| $15,000 to $17,499 | 8 (1.5%) | 21 (4.0%) |
| $17,500 to $19,999 | 14 (2.5%) | 0 (0.0%) |
| $20,000 to $22,499 | 11 (2.0%) | 17 (3.2%) |
| $22,500 to $24,999 | 17 (3.1%) | 34 (6.5%) |
| $25,000 to $29,999 | 7 (1.3%) | 53 (10.1%) |
| $30,000 to $34,999 | 47 (8.6%) | 78 (14.8%) |
| $35,000 to $39,999 | 18 (3.3%) | 22 (4.2%) |
| $40,000 to $44,999 | 57 (10.4%) | 4 (0.8%) |
| $45,000 to $49,999 | 26 (4.7%) | 20 (3.8%) |
| $50,000 to $54,999 | 6 (1.1%) | 47 (8.9%) |
| $55,000 to $64,999 | 50 (9.1%) | 55 (10.5%) |
| $65,000 to $74,999 | 62 (11.3%) | 6 (1.1%) |
| $75,000 to $99,999 | 35 (6.4%) | 30 (5.7%) |
| $100,000+ | 38 (6.9%) | 5 (0.9%) |
| Total | 549 (100.0%) | 526 (100.0%) |
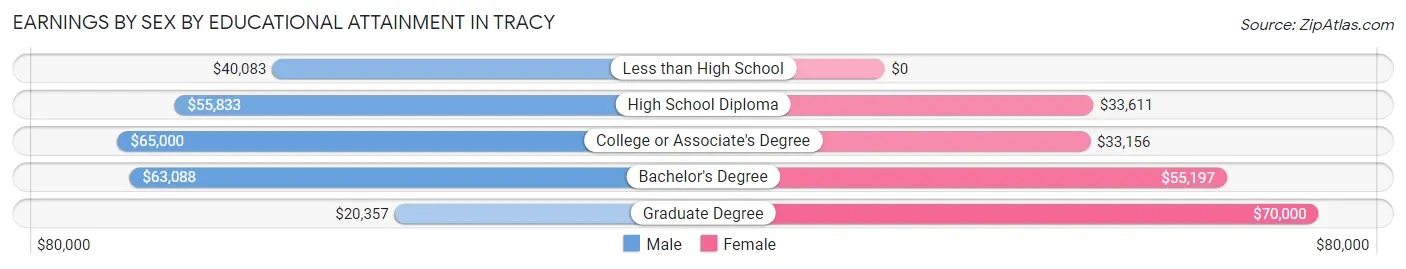
Earnings by Sex by Educational Attainment in Tracy
Average earnings in Tracy are $49,375 for men and $34,375 for women, a difference of 30.4%. Men with an educational attainment of college or associate's degree enjoy the highest average annual earnings of $65,000, while those with graduate degree education earn the least with $20,357. Women with an educational attainment of graduate degree earn the most with the average annual earnings of $70,000, while those with college or associate's degree education have the smallest earnings of $33,156.
| Educational Attainment | Male Income | Female Income |
| Less than High School | $40,083 | $0 |
| High School Diploma | $55,833 | $33,611 |
| College or Associate's Degree | $65,000 | $33,156 |
| Bachelor's Degree | $63,088 | $55,197 |
| Graduate Degree | $20,357 | $70,000 |
| Total | $49,375 | $34,375 |
Family Income in Tracy
Family Income Brackets in Tracy
According to the Tracy family income data, there are 101 families falling into the $50,000 to $74,999 income range, which is the most common income bracket and makes up 21.6% of all families. Conversely, the less than $10,000 income bracket is the least frequent group with only 5 families (1.1%) belonging to this category.
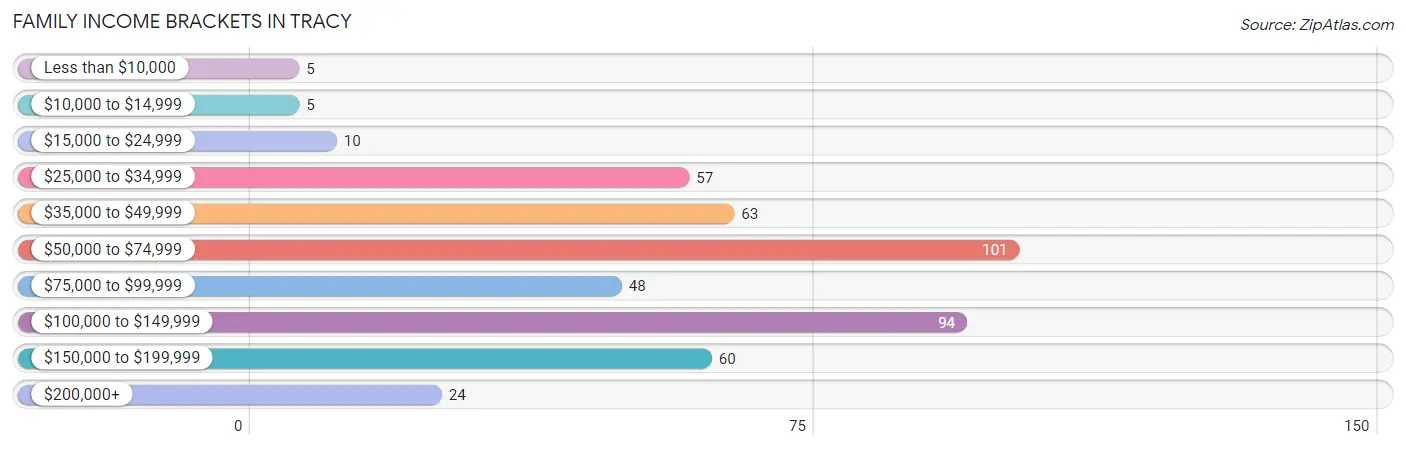
| Income Bracket | # Families | % Families |
| Less than $10,000 | 5 | 1.1% |
| $10,000 to $14,999 | 5 | 1.1% |
| $15,000 to $24,999 | 10 | 2.1% |
| $25,000 to $34,999 | 57 | 12.2% |
| $35,000 to $49,999 | 63 | 13.5% |
| $50,000 to $74,999 | 101 | 21.6% |
| $75,000 to $99,999 | 48 | 10.3% |
| $100,000 to $149,999 | 94 | 20.1% |
| $150,000 to $199,999 | 60 | 12.8% |
| $200,000+ | 24 | 5.1% |
Family Income by Famaliy Size in Tracy
4-person families (78 | 16.7%) account for the highest median family income in Tracy with $116,667 per family, while 3-person families (78 | 16.7%) have the highest median income of $35,500 per family member.
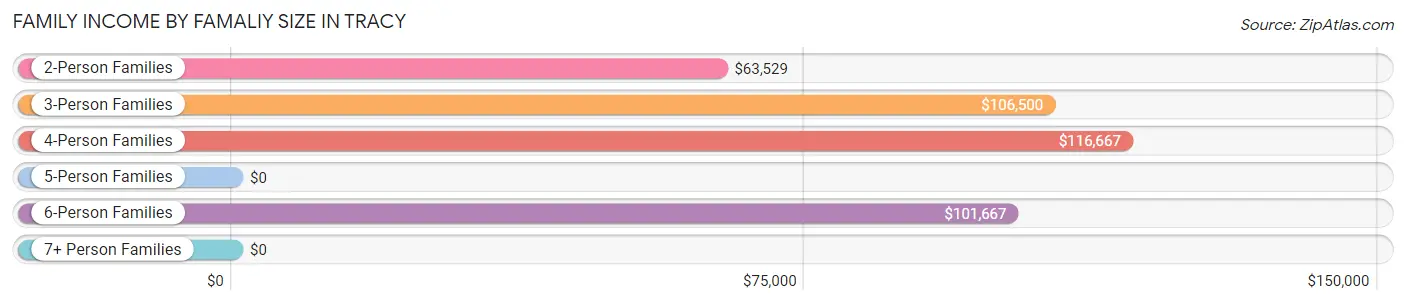
| Income Bracket | # Families | Median Income |
| 2-Person Families | 212 (45.4%) | $63,529 |
| 3-Person Families | 78 (16.7%) | $106,500 |
| 4-Person Families | 78 (16.7%) | $116,667 |
| 5-Person Families | 77 (16.5%) | $0 |
| 6-Person Families | 16 (3.4%) | $101,667 |
| 7+ Person Families | 6 (1.3%) | $0 |
| Total | 467 (100.0%) | $72,228 |
Family Income by Number of Earners in Tracy
The median family income in Tracy is $72,228, with families comprising 3+ earners (94) having the highest median family income of $147,857, while families with 1 earner (93) have the lowest median family income of $41,528, accounting for 20.1% and 19.9% of families, respectively.
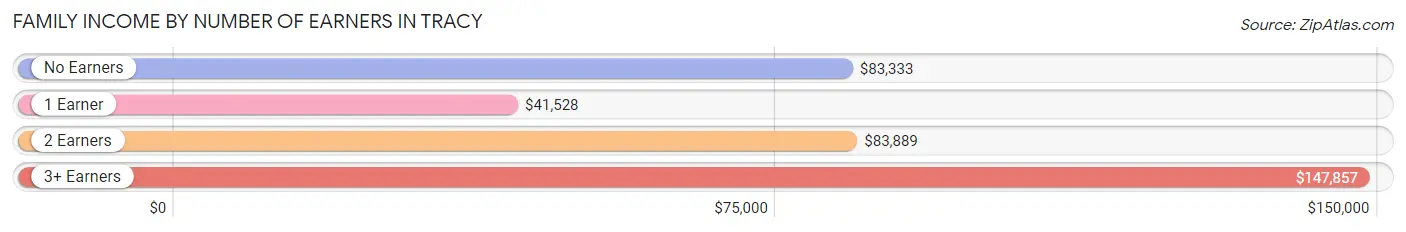
| Number of Earners | # Families | Median Income |
| No Earners | 64 (13.7%) | $83,333 |
| 1 Earner | 93 (19.9%) | $41,528 |
| 2 Earners | 216 (46.3%) | $83,889 |
| 3+ Earners | 94 (20.1%) | $147,857 |
| Total | 467 (100.0%) | $72,228 |
Household Income in Tracy
Household Income Brackets in Tracy
With 153 households falling in the category, the $50,000 to $74,999 income range is the most frequent in Tracy, accounting for 20.6% of all households. In contrast, only 20 households (2.7%) fall into the $10,000 to $14,999 income bracket, making it the least populous group.
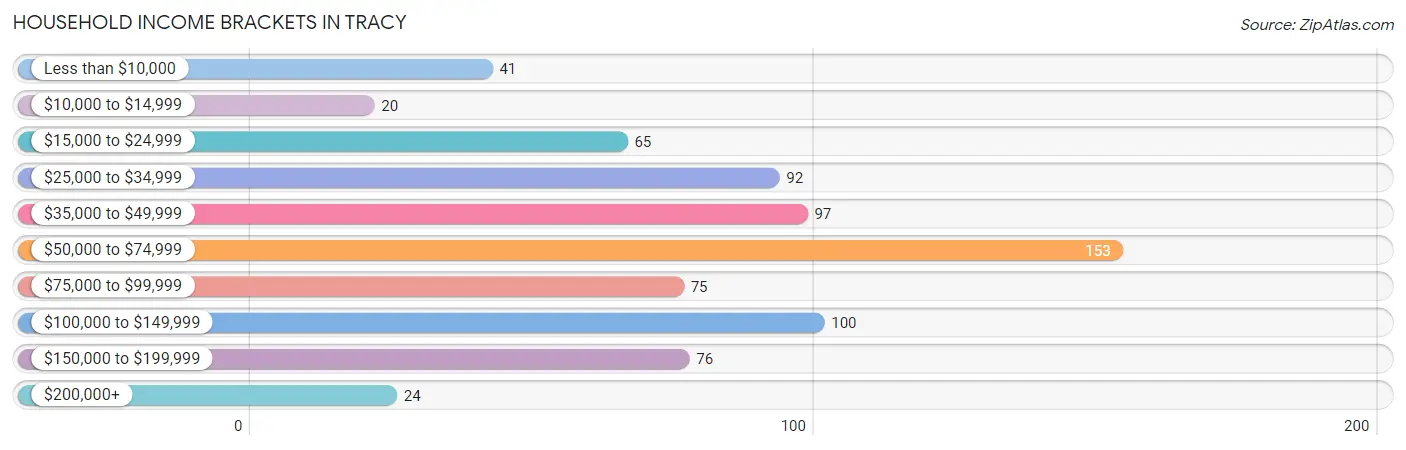
| Income Bracket | # Households | % Households |
| Less than $10,000 | 41 | 5.5% |
| $10,000 to $14,999 | 20 | 2.7% |
| $15,000 to $24,999 | 65 | 8.7% |
| $25,000 to $34,999 | 92 | 12.4% |
| $35,000 to $49,999 | 97 | 13.1% |
| $50,000 to $74,999 | 153 | 20.6% |
| $75,000 to $99,999 | 75 | 10.1% |
| $100,000 to $149,999 | 100 | 13.5% |
| $150,000 to $199,999 | 76 | 10.2% |
| $200,000+ | 24 | 3.2% |
Household Income by Householder Age in Tracy
The median household income in Tracy is $63,201, with the highest median household income of $83,611 found in the 25 to 44 years age bracket for the primary householder. A total of 200 households (26.9%) fall into this category. Meanwhile, the 65+ years age bracket for the primary householder has the lowest median household income of $32,500, with 246 households (33.1%) in this group.

| Income Bracket | # Households | Median Income |
| 15 to 24 Years | 22 (3.0%) | $41,875 |
| 25 to 44 Years | 200 (26.9%) | $83,611 |
| 45 to 64 Years | 275 (37.0%) | $72,411 |
| 65+ Years | 246 (33.1%) | $32,500 |
| Total | 743 (100.0%) | $63,201 |
Poverty in Tracy
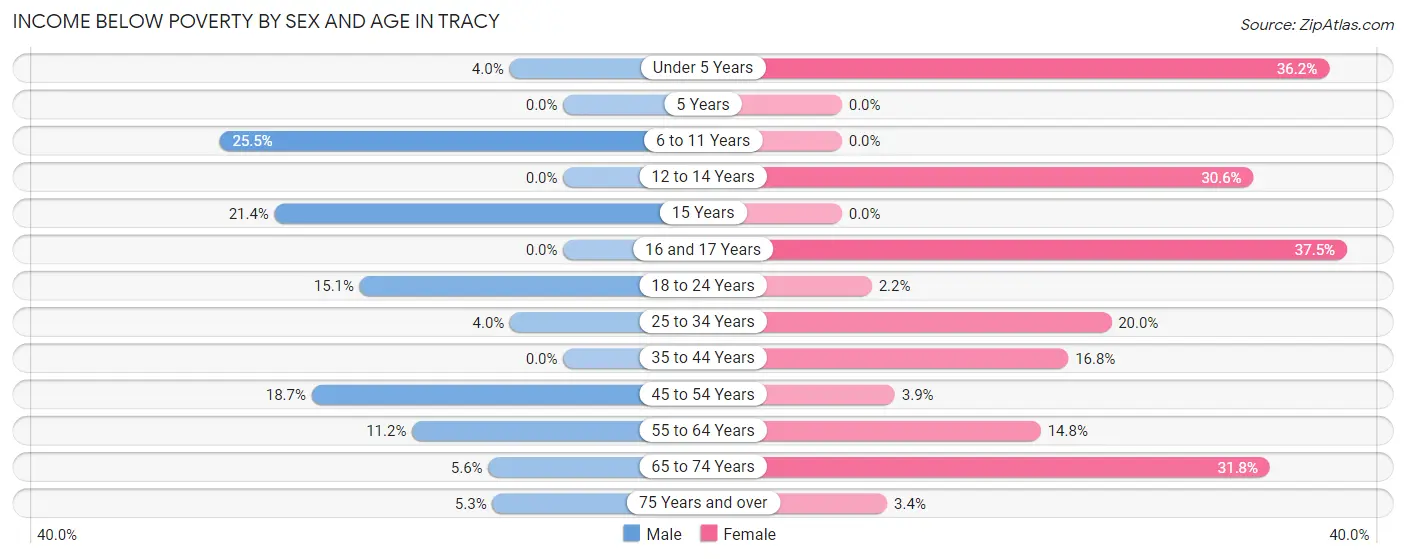
Income Below Poverty by Sex and Age in Tracy
With 10.3% poverty level for males and 14.8% for females among the residents of Tracy, 6 to 11 year old males and 16 and 17 year old females are the most vulnerable to poverty, with 36 males (25.5%) and 12 females (37.5%) in their respective age groups living below the poverty level.
| Age Bracket | Male | Female |
| Under 5 Years | 4 (4.0%) | 17 (36.2%) |
| 5 Years | 0 (0.0%) | 0 (0.0%) |
| 6 to 11 Years | 36 (25.5%) | 0 (0.0%) |
| 12 to 14 Years | 0 (0.0%) | 11 (30.6%) |
| 15 Years | 3 (21.4%) | 0 (0.0%) |
| 16 and 17 Years | 0 (0.0%) | 12 (37.5%) |
| 18 to 24 Years | 21 (15.1%) | 2 (2.2%) |
| 25 to 34 Years | 3 (4.0%) | 20 (20.0%) |
| 35 to 44 Years | 0 (0.0%) | 20 (16.8%) |
| 45 to 54 Years | 17 (18.7%) | 5 (3.9%) |
| 55 to 64 Years | 11 (11.2%) | 13 (14.8%) |
| 65 to 74 Years | 5 (5.6%) | 34 (31.8%) |
| 75 Years and over | 5 (5.3%) | 3 (3.4%) |
| Total | 105 (10.3%) | 137 (14.8%) |
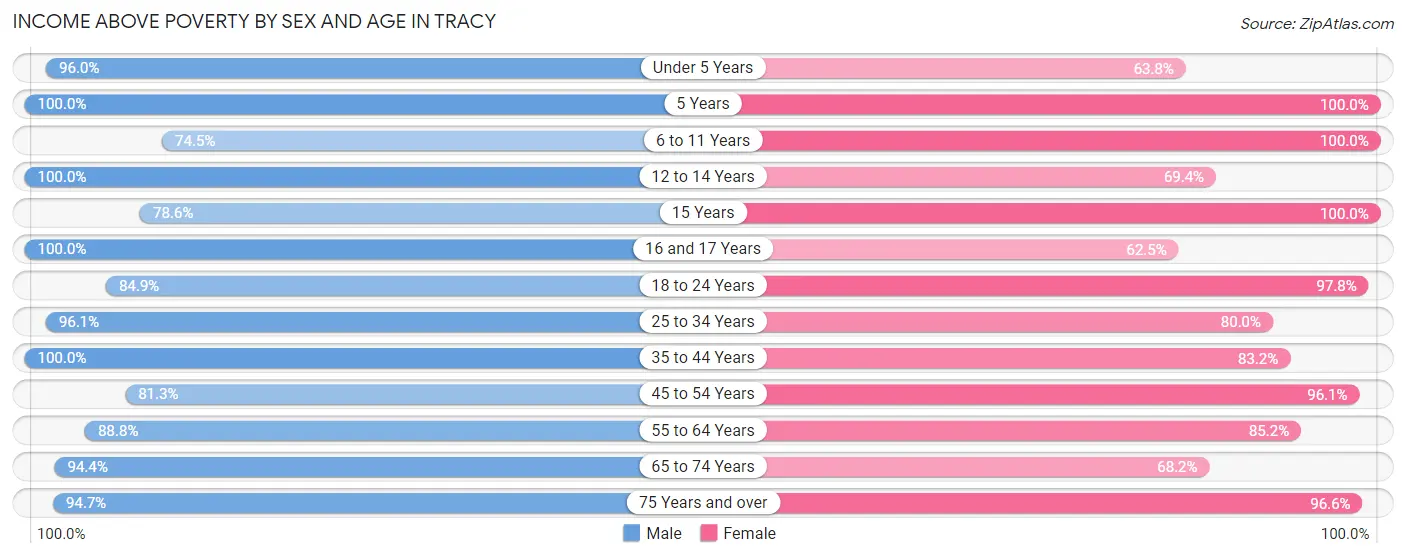
Income Above Poverty by Sex and Age in Tracy
According to the poverty statistics in Tracy, males aged 5 years and females aged 5 years are the age groups that are most secure financially, with 100.0% of males and 100.0% of females in these age groups living above the poverty line.
| Age Bracket | Male | Female |
| Under 5 Years | 96 (96.0%) | 30 (63.8%) |
| 5 Years | 3 (100.0%) | 15 (100.0%) |
| 6 to 11 Years | 105 (74.5%) | 60 (100.0%) |
| 12 to 14 Years | 13 (100.0%) | 25 (69.4%) |
| 15 Years | 11 (78.6%) | 13 (100.0%) |
| 16 and 17 Years | 31 (100.0%) | 20 (62.5%) |
| 18 to 24 Years | 118 (84.9%) | 88 (97.8%) |
| 25 to 34 Years | 73 (96.1%) | 80 (80.0%) |
| 35 to 44 Years | 127 (100.0%) | 99 (83.2%) |
| 45 to 54 Years | 74 (81.3%) | 122 (96.1%) |
| 55 to 64 Years | 87 (88.8%) | 75 (85.2%) |
| 65 to 74 Years | 85 (94.4%) | 73 (68.2%) |
| 75 Years and over | 90 (94.7%) | 86 (96.6%) |
| Total | 913 (89.7%) | 786 (85.2%) |
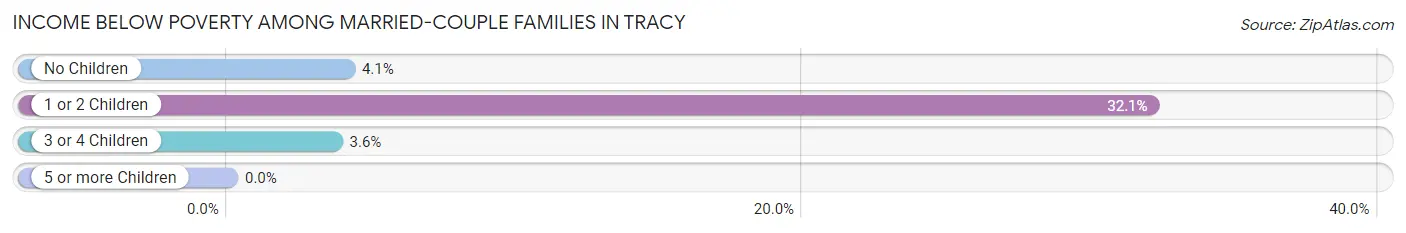
Income Below Poverty Among Married-Couple Families in Tracy
The poverty statistics for married-couple families in Tracy show that 8.1% or 29 of the total 357 families live below the poverty line. Families with 1 or 2 children have the highest poverty rate of 32.1%, comprising of 17 families. On the other hand, families with 5 or more children have the lowest poverty rate of 0.0%, which includes 0 families.
| Children | Above Poverty | Below Poverty |
| No Children | 236 (95.9%) | 10 (4.1%) |
| 1 or 2 Children | 36 (67.9%) | 17 (32.1%) |
| 3 or 4 Children | 53 (96.4%) | 2 (3.6%) |
| 5 or more Children | 3 (100.0%) | 0 (0.0%) |
| Total | 328 (91.9%) | 29 (8.1%) |
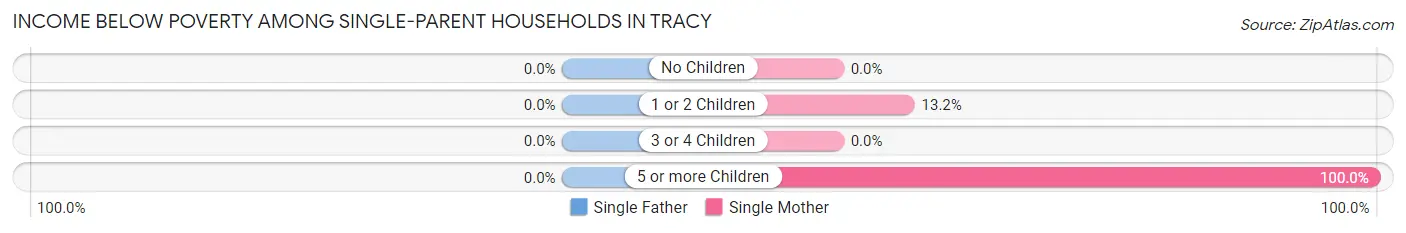
Income Below Poverty Among Single-Parent Households in Tracy
| Children | Single Father | Single Mother |
| No Children | 0 (0.0%) | 0 (0.0%) |
| 1 or 2 Children | 0 (0.0%) | 7 (13.2%) |
| 3 or 4 Children | 0 (0.0%) | 0 (0.0%) |
| 5 or more Children | 0 (0.0%) | 3 (100.0%) |
| Total | 0 (0.0%) | 10 (12.5%) |
Income Below Poverty Among Married-Couple vs Single-Parent Households in Tracy
The poverty data for Tracy shows that 29 of the married-couple family households (8.1%) and 10 of the single-parent households (9.1%) are living below the poverty level. Within the married-couple family households, those with 1 or 2 children have the highest poverty rate, with 17 households (32.1%) falling below the poverty line. Among the single-parent households, those with 5 or more children have the highest poverty rate, with 3 household (100.0%) living below poverty.
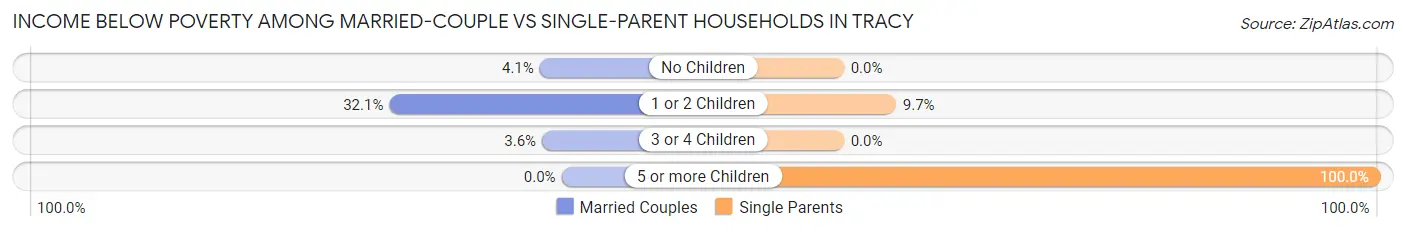
| Children | Married-Couple Families | Single-Parent Households |
| No Children | 10 (4.1%) | 0 (0.0%) |
| 1 or 2 Children | 17 (32.1%) | 7 (9.7%) |
| 3 or 4 Children | 2 (3.6%) | 0 (0.0%) |
| 5 or more Children | 0 (0.0%) | 3 (100.0%) |
| Total | 29 (8.1%) | 10 (9.1%) |
Race in Tracy
The most populous races in Tracy are White / Caucasian (1,602 | 79.9%), Asian (288 | 14.4%), and Hispanic or Latino (110 | 5.5%).
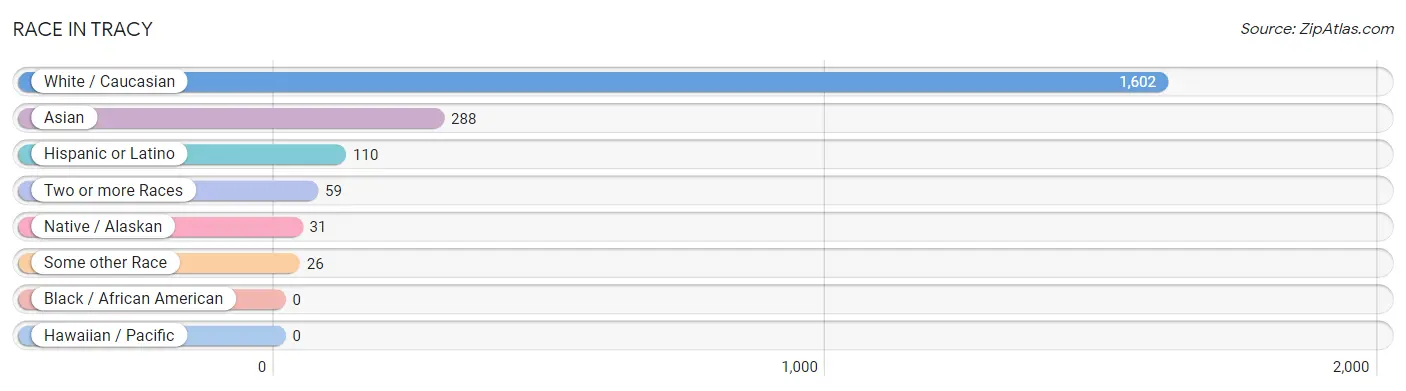
| Race | # Population | % Population |
| Asian | 288 | 14.4% |
| Black / African American | 0 | 0.0% |
| Hawaiian / Pacific | 0 | 0.0% |
| Hispanic or Latino | 110 | 5.5% |
| Native / Alaskan | 31 | 1.5% |
| White / Caucasian | 1,602 | 79.9% |
| Two or more Races | 59 | 2.9% |
| Some other Race | 26 | 1.3% |
| Total | 2,006 | 100.0% |
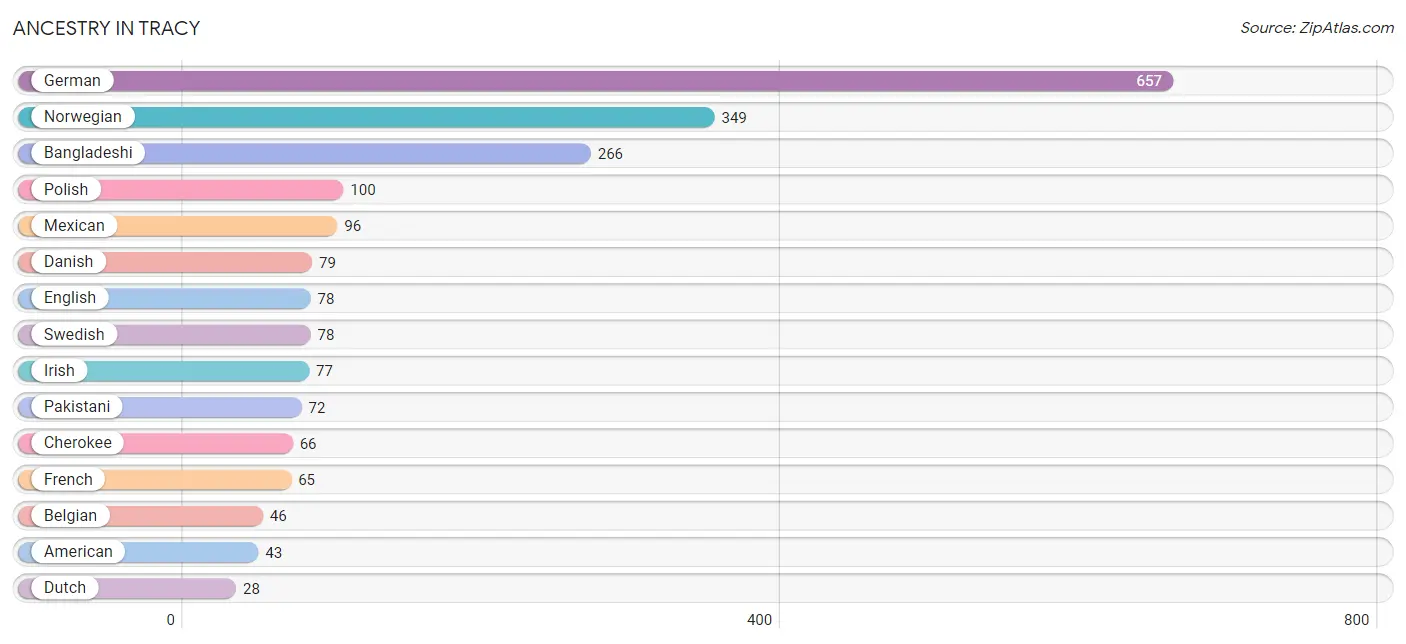
Ancestry in Tracy
The most populous ancestries reported in Tracy are German (657 | 32.8%), Norwegian (349 | 17.4%), Bangladeshi (266 | 13.3%), Polish (100 | 5.0%), and Mexican (96 | 4.8%), together accounting for 73.2% of all Tracy residents.
| Ancestry | # Population | % Population |
| American | 43 | 2.1% |
| Arab | 3 | 0.2% |
| Bangladeshi | 266 | 13.3% |
| Belgian | 46 | 2.3% |
| British | 6 | 0.3% |
| Cherokee | 66 | 3.3% |
| Croatian | 10 | 0.5% |
| Czech | 19 | 0.9% |
| Danish | 79 | 3.9% |
| Dutch | 28 | 1.4% |
| English | 78 | 3.9% |
| French | 65 | 3.2% |
| French Canadian | 8 | 0.4% |
| German | 657 | 32.8% |
| Irish | 77 | 3.8% |
| Italian | 14 | 0.7% |
| Lebanese | 3 | 0.2% |
| Mexican | 96 | 4.8% |
| Norwegian | 349 | 17.4% |
| Pakistani | 72 | 3.6% |
| Polish | 100 | 5.0% |
| Scandinavian | 18 | 0.9% |
| Scotch-Irish | 18 | 0.9% |
| Scottish | 20 | 1.0% |
| Sioux | 6 | 0.3% |
| Swedish | 78 | 3.9% |
| Swiss | 7 | 0.4% |
| Welsh | 3 | 0.2% | View All 28 Rows |
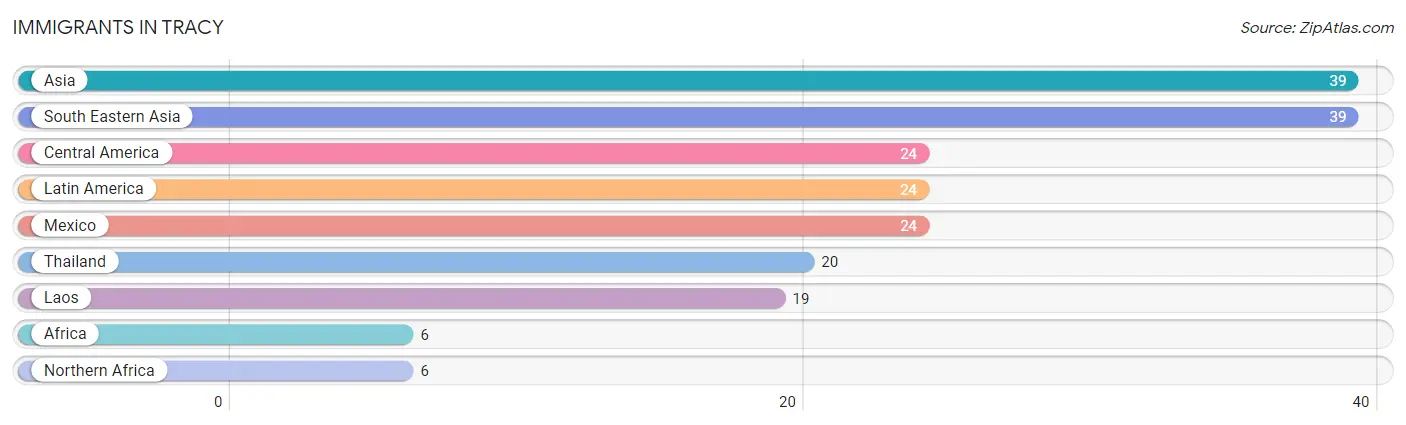
Immigrants in Tracy
The most numerous immigrant groups reported in Tracy came from Asia (39 | 1.9%), South Eastern Asia (39 | 1.9%), Central America (24 | 1.2%), Latin America (24 | 1.2%), and Mexico (24 | 1.2%), together accounting for 7.5% of all Tracy residents.
| Immigration Origin | # Population | % Population |
| Africa | 6 | 0.3% |
| Asia | 39 | 1.9% |
| Central America | 24 | 1.2% |
| Laos | 19 | 0.9% |
| Latin America | 24 | 1.2% |
| Mexico | 24 | 1.2% |
| Northern Africa | 6 | 0.3% |
| South Eastern Asia | 39 | 1.9% |
| Thailand | 20 | 1.0% | View All 9 Rows |
Sex and Age in Tracy
Sex and Age in Tracy
The most populous age groups in Tracy are 15 to 19 Years (120 | 11.7%) for men and 20 to 24 Years (90 | 9.2%) for women.
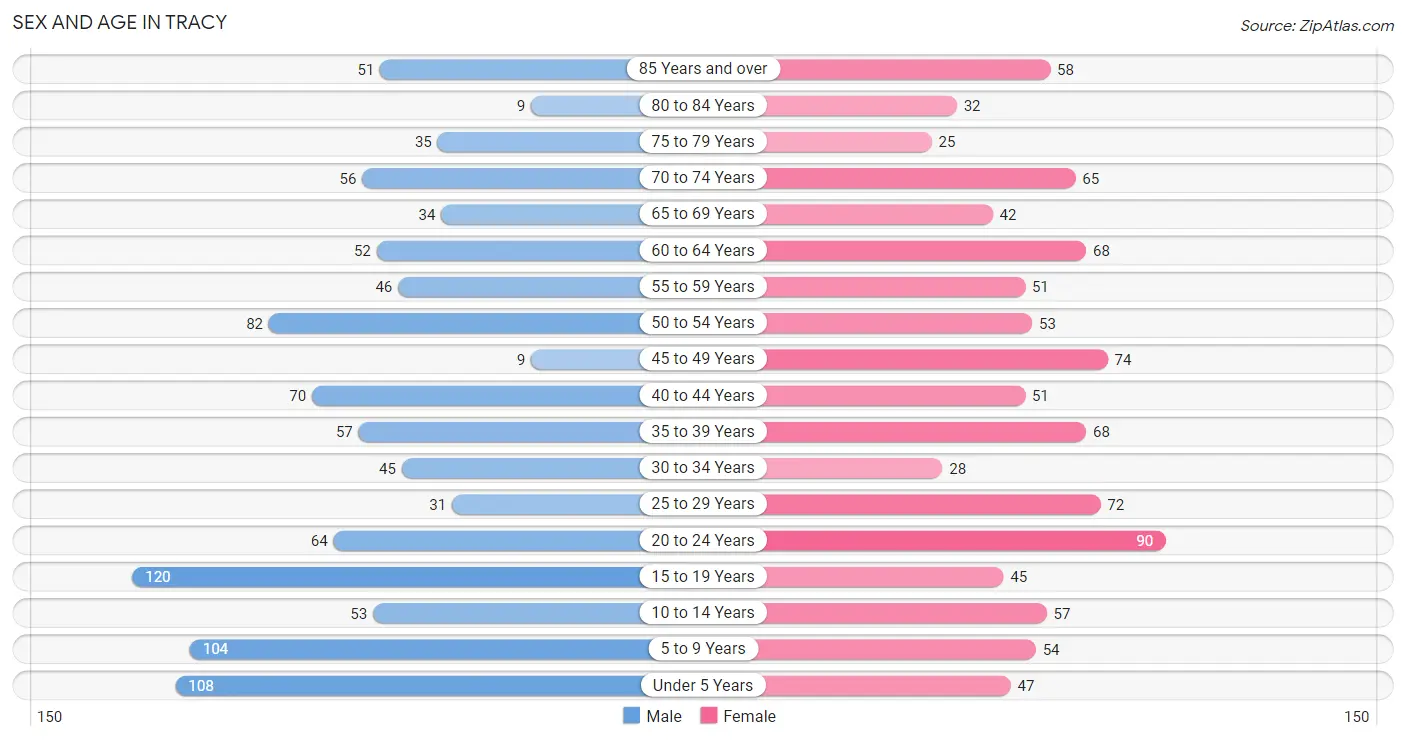
| Age Bracket | Male | Female |
| Under 5 Years | 108 (10.5%) | 47 (4.8%) |
| 5 to 9 Years | 104 (10.1%) | 54 (5.5%) |
| 10 to 14 Years | 53 (5.2%) | 57 (5.8%) |
| 15 to 19 Years | 120 (11.7%) | 45 (4.6%) |
| 20 to 24 Years | 64 (6.2%) | 90 (9.2%) |
| 25 to 29 Years | 31 (3.0%) | 72 (7.3%) |
| 30 to 34 Years | 45 (4.4%) | 28 (2.9%) |
| 35 to 39 Years | 57 (5.6%) | 68 (6.9%) |
| 40 to 44 Years | 70 (6.8%) | 51 (5.2%) |
| 45 to 49 Years | 9 (0.9%) | 74 (7.5%) |
| 50 to 54 Years | 82 (8.0%) | 53 (5.4%) |
| 55 to 59 Years | 46 (4.5%) | 51 (5.2%) |
| 60 to 64 Years | 52 (5.1%) | 68 (6.9%) |
| 65 to 69 Years | 34 (3.3%) | 42 (4.3%) |
| 70 to 74 Years | 56 (5.5%) | 65 (6.6%) |
| 75 to 79 Years | 35 (3.4%) | 25 (2.5%) |
| 80 to 84 Years | 9 (0.9%) | 32 (3.3%) |
| 85 Years and over | 51 (5.0%) | 58 (5.9%) |
| Total | 1,026 (100.0%) | 980 (100.0%) |
Families and Households in Tracy
Median Family Size in Tracy
The median family size in Tracy is 3.40 persons per family, with single male/father families (30 | 6.4%) accounting for the largest median family size of 4.33 persons per family. On the other hand, married-couple families (357 | 76.4%) represent the smallest median family size with 3.32 persons per family.
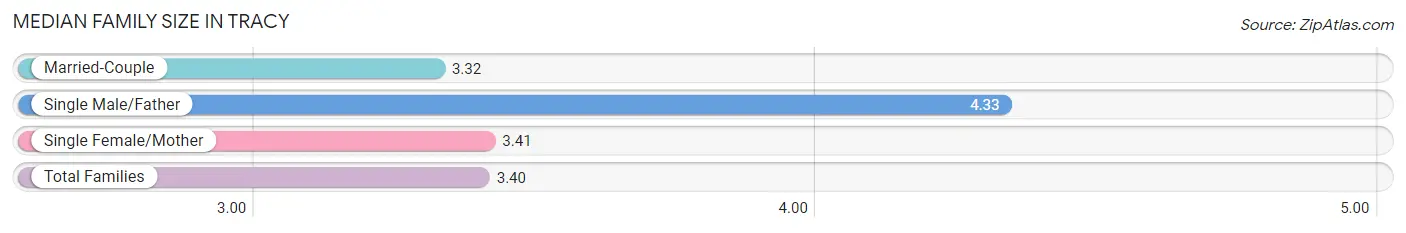
| Family Type | # Families | Family Size |
| Married-Couple | 357 (76.4%) | 3.32 |
| Single Male/Father | 30 (6.4%) | 4.33 |
| Single Female/Mother | 80 (17.1%) | 3.41 |
| Total Families | 467 (100.0%) | 3.40 |
Median Household Size in Tracy
The median household size in Tracy is 2.60 persons per household, with single male/father households (30 | 4.0%) accounting for the largest median household size of 5.57 persons per household. non-family households (276 | 37.1%) represent the smallest median household size with 1.08 persons per household.
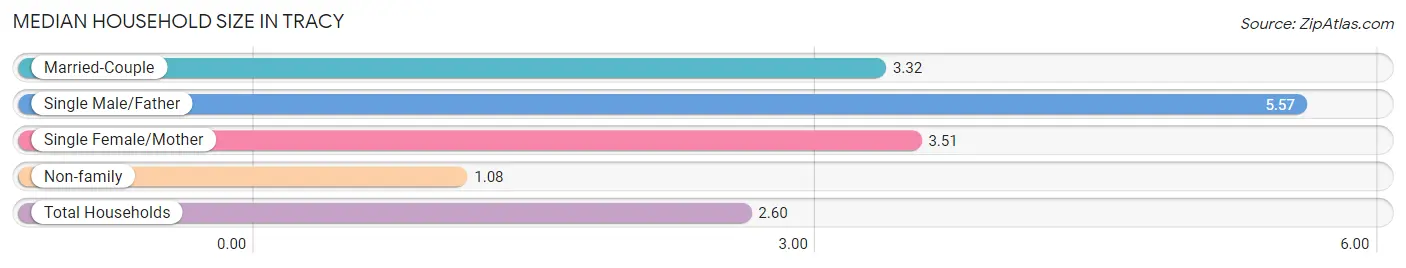
| Household Type | # Households | Household Size |
| Married-Couple | 357 (48.0%) | 3.32 |
| Single Male/Father | 30 (4.0%) | 5.57 |
| Single Female/Mother | 80 (10.8%) | 3.51 |
| Non-family | 276 (37.1%) | 1.08 |
| Total Households | 743 (100.0%) | 2.60 |
Household Size by Marriage Status in Tracy
Out of a total of 743 households in Tracy, 467 (62.8%) are family households, while 276 (37.1%) are nonfamily households. The most numerous type of family households are 2-person households, comprising 212, and the most common type of nonfamily households are 1-person households, comprising 259.
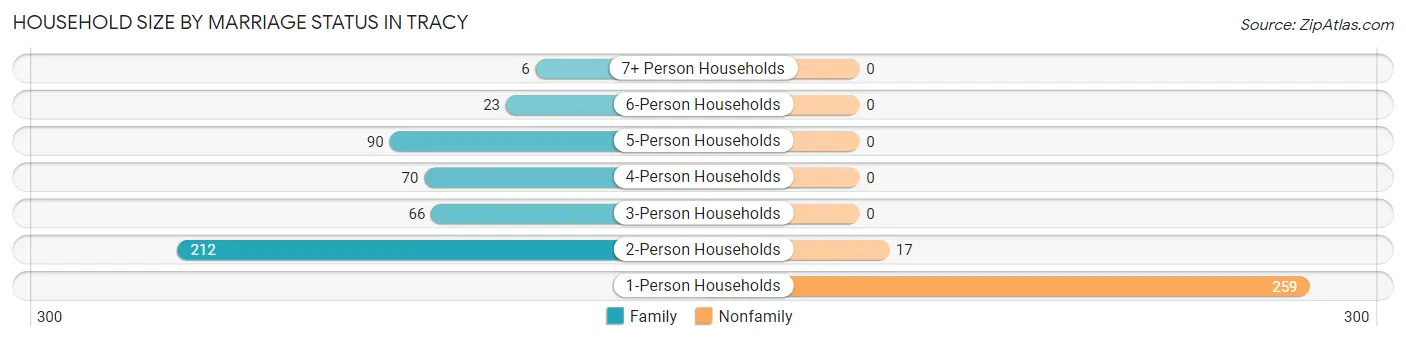
| Household Size | Family Households | Nonfamily Households |
| 1-Person Households | - | 259 (34.9%) |
| 2-Person Households | 212 (28.5%) | 17 (2.3%) |
| 3-Person Households | 66 (8.9%) | 0 (0.0%) |
| 4-Person Households | 70 (9.4%) | 0 (0.0%) |
| 5-Person Households | 90 (12.1%) | 0 (0.0%) |
| 6-Person Households | 23 (3.1%) | 0 (0.0%) |
| 7+ Person Households | 6 (0.8%) | 0 (0.0%) |
| Total | 467 (62.8%) | 276 (37.1%) |
Female Fertility in Tracy
Fertility by Age in Tracy
Average fertility rate in Tracy is 62.0 births per 1,000 women. Women in the age bracket of 20 to 34 years have the highest fertility rate with 142.0 births per 1,000 women. Women in the age bracket of 20 to 34 years acount for 100.0% of all women with births.
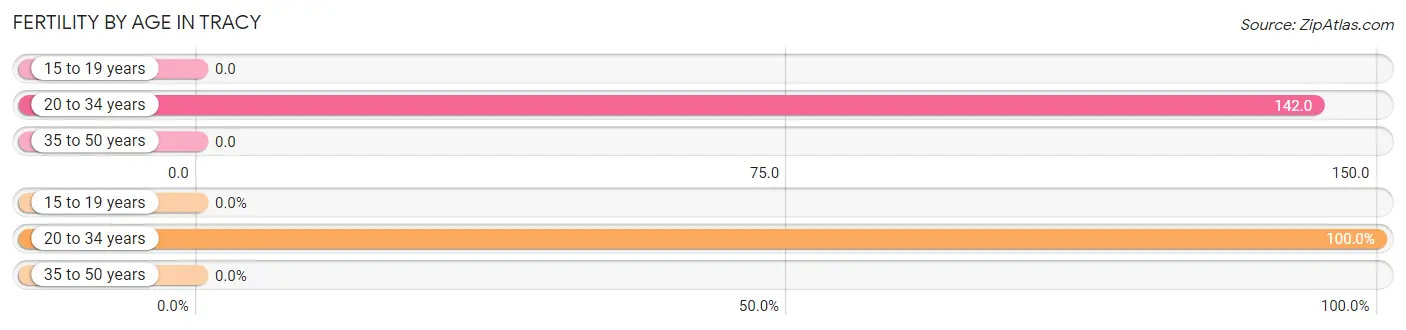
| Age Bracket | Women with Births | Births / 1,000 Women |
| 15 to 19 years | 0 (0.0%) | 0.0 |
| 20 to 34 years | 27 (100.0%) | 142.0 |
| 35 to 50 years | 0 (0.0%) | 0.0 |
| Total | 27 (100.0%) | 62.0 |
Fertility by Age by Marriage Status in Tracy
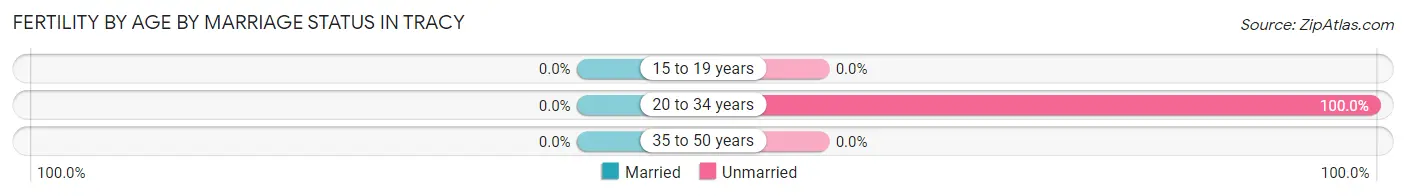
| Age Bracket | Married | Unmarried |
| 15 to 19 years | 0 (0.0%) | 0 (0.0%) |
| 20 to 34 years | 0 (0.0%) | 27 (100.0%) |
| 35 to 50 years | 0 (0.0%) | 0 (0.0%) |
| Total | 0 (0.0%) | 27 (100.0%) |
Fertility by Education in Tracy
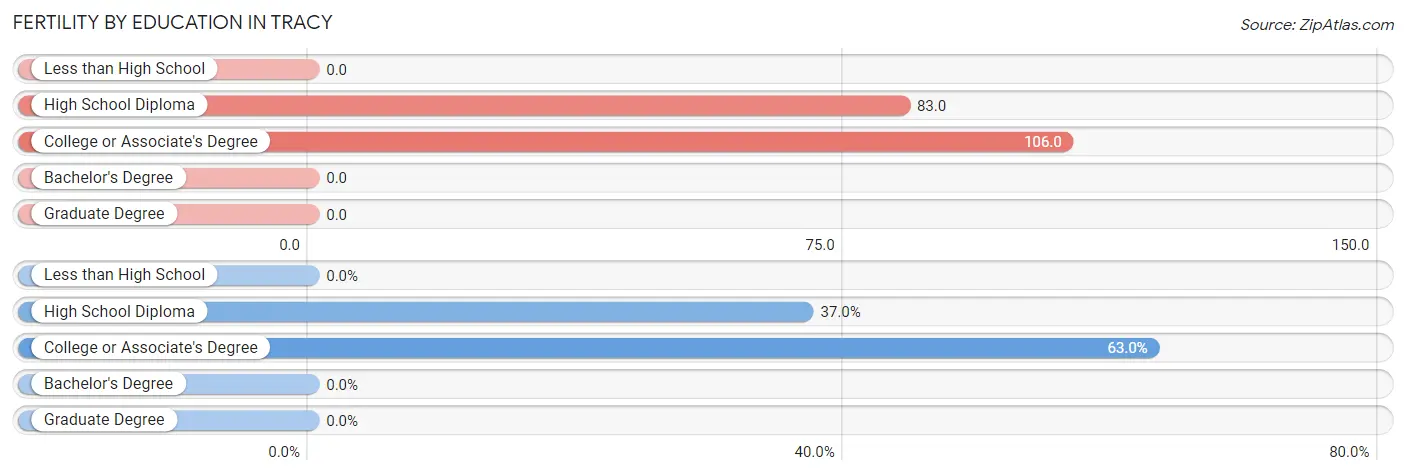
| Educational Attainment | Women with Births | Births / 1,000 Women |
| Less than High School | 0 (0.0%) | 0.0 |
| High School Diploma | 10 (37.0%) | 83.0 |
| College or Associate's Degree | 17 (63.0%) | 106.0 |
| Bachelor's Degree | 0 (0.0%) | 0.0 |
| Graduate Degree | 0 (0.0%) | 0.0 |
| Total | 27 (100.0%) | 62.0 |
Fertility by Education by Marriage Status in Tracy
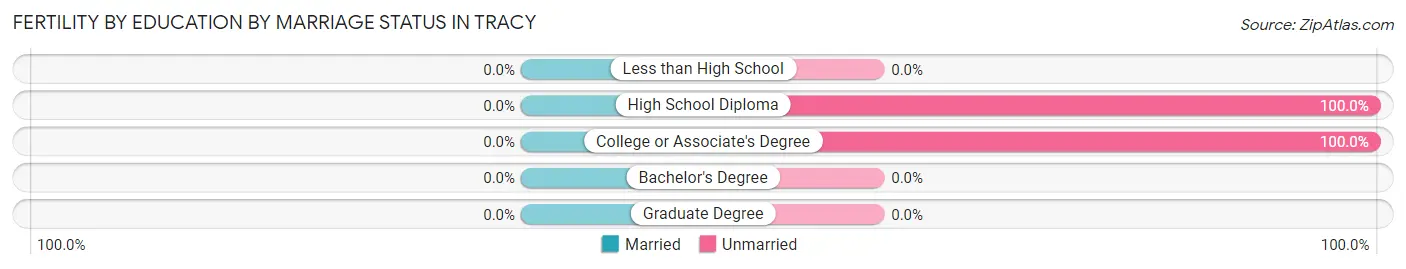
| Educational Attainment | Married | Unmarried |
| Less than High School | 0 (0.0%) | 0 (0.0%) |
| High School Diploma | 0 (0.0%) | 10 (100.0%) |
| College or Associate's Degree | 0 (0.0%) | 17 (100.0%) |
| Bachelor's Degree | 0 (0.0%) | 0 (0.0%) |
| Graduate Degree | 0 (0.0%) | 0 (0.0%) |
| Total | 0 (0.0%) | 27 (100.0%) |
Employment Characteristics in Tracy
Employment by Class of Employer in Tracy
Among the 964 employed individuals in Tracy, private company employees (580 | 60.2%), not-for-profit organizations (91 | 9.4%), and self-employed (incorporated) (87 | 9.0%) make up the most common classes of employment.
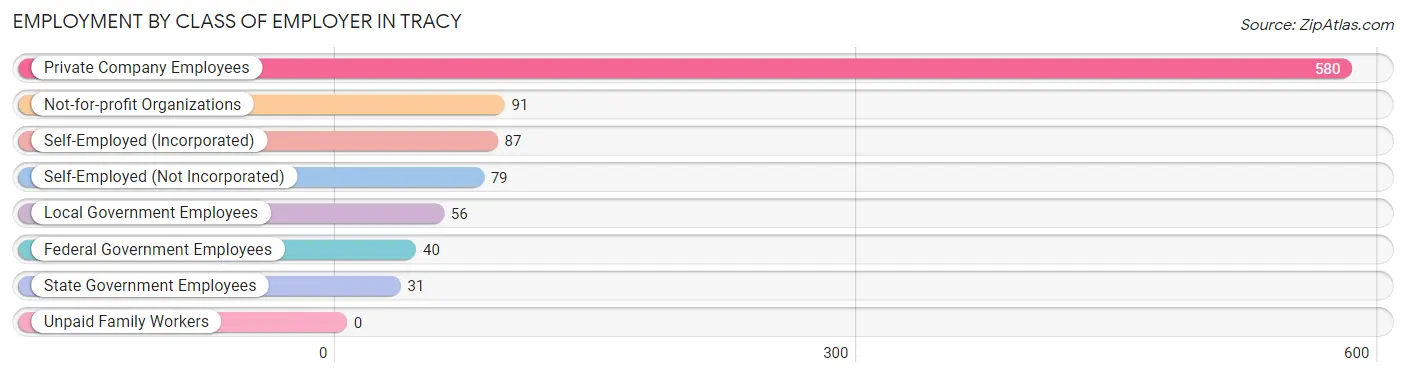
| Employer Class | # Employees | % Employees |
| Private Company Employees | 580 | 60.2% |
| Self-Employed (Incorporated) | 87 | 9.0% |
| Self-Employed (Not Incorporated) | 79 | 8.2% |
| Not-for-profit Organizations | 91 | 9.4% |
| Local Government Employees | 56 | 5.8% |
| State Government Employees | 31 | 3.2% |
| Federal Government Employees | 40 | 4.2% |
| Unpaid Family Workers | 0 | 0.0% |
| Total | 964 | 100.0% |
Employment Status by Age in Tracy
According to the labor force statistics for Tracy, out of the total population over 16 years of age (1,556), 64.9% or 1,010 individuals are in the labor force, with 3.4% or 34 of them unemployed. The age group with the highest labor force participation rate is 30 to 34 years, with 100.0% or 73 individuals in the labor force. Within the labor force, the 16 to 19 years age range has the highest percentage of unemployed individuals, with 16.1% or 18 of them being unemployed.
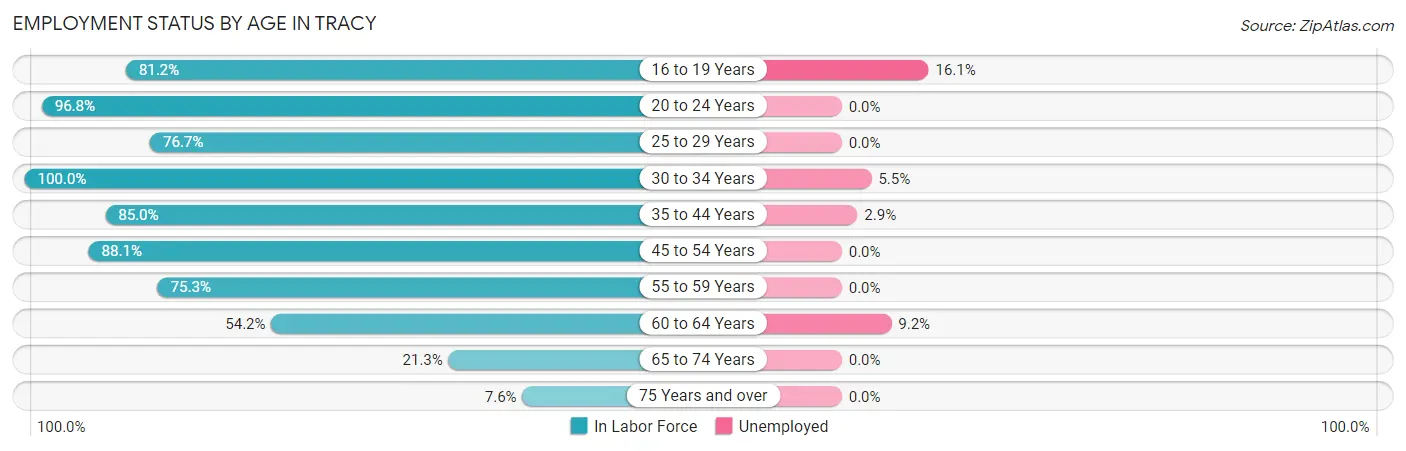
| Age Bracket | In Labor Force | Unemployed |
| 16 to 19 Years | 112 (81.2%) | 18 (16.1%) |
| 20 to 24 Years | 149 (96.8%) | 0 (0.0%) |
| 25 to 29 Years | 79 (76.7%) | 0 (0.0%) |
| 30 to 34 Years | 73 (100.0%) | 4 (5.5%) |
| 35 to 44 Years | 209 (85.0%) | 6 (2.9%) |
| 45 to 54 Years | 192 (88.1%) | 0 (0.0%) |
| 55 to 59 Years | 73 (75.3%) | 0 (0.0%) |
| 60 to 64 Years | 65 (54.2%) | 6 (9.2%) |
| 65 to 74 Years | 42 (21.3%) | 0 (0.0%) |
| 75 Years and over | 16 (7.6%) | 0 (0.0%) |
| Total | 1,010 (64.9%) | 34 (3.4%) |
Employment Status by Educational Attainment in Tracy
According to labor force statistics for Tracy, 80.6% of individuals (691) out of the total population between 25 and 64 years of age (857) are in the labor force, with 2.3% or 16 of them being unemployed. The group with the highest labor force participation rate are those with the educational attainment of bachelor's degree or higher, with 93.6% or 161 individuals in the labor force. Within the labor force, individuals with high school diploma education have the highest percentage of unemployment, with 9.3% or 16 of them being unemployed.
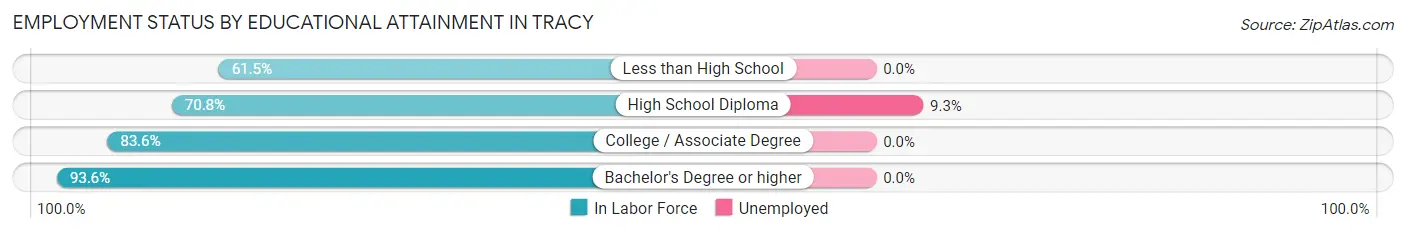
| Educational Attainment | In Labor Force | Unemployed |
| Less than High School | 32 (61.5%) | 0 (0.0%) |
| High School Diploma | 172 (70.8%) | 23 (9.3%) |
| College / Associate Degree | 326 (83.6%) | 0 (0.0%) |
| Bachelor's Degree or higher | 161 (93.6%) | 0 (0.0%) |
| Total | 691 (80.6%) | 20 (2.3%) |
Employment Occupations by Sex in Tracy
Management, Business, Science and Arts Occupations
The most common Management, Business, Science and Arts occupations in Tracy are Management (140 | 14.3%), Health Diagnosing & Treating (75 | 7.7%), Community & Social Service (62 | 6.4%), Health Technologists (53 | 5.4%), and Education Instruction & Library (41 | 4.2%).
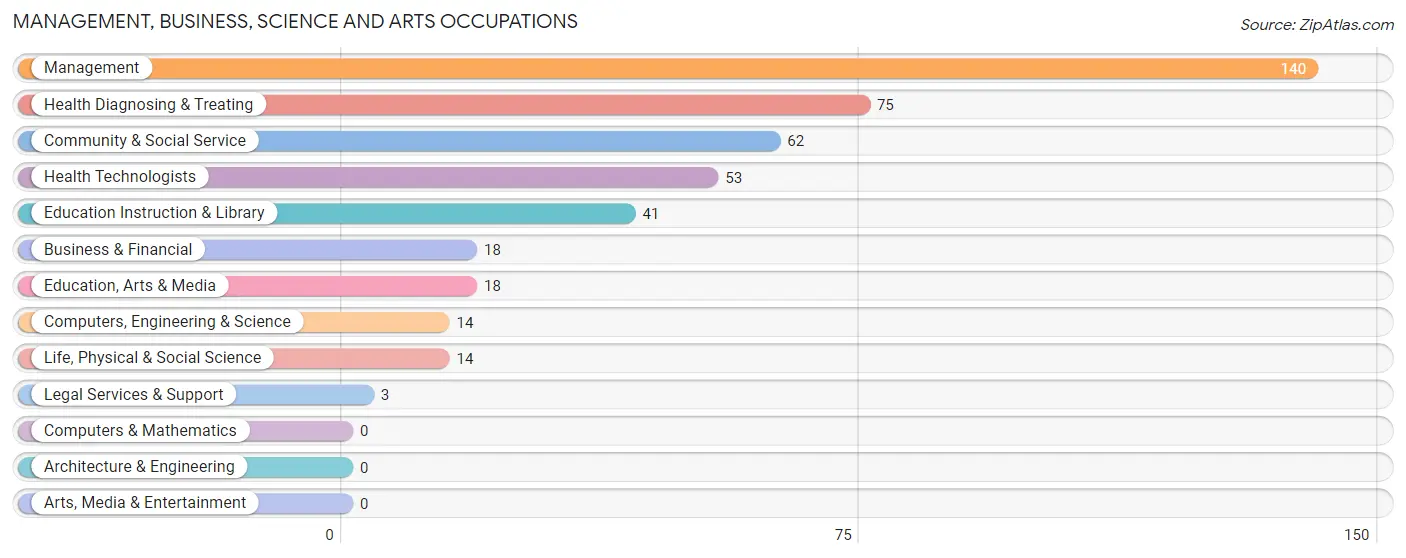
Management, Business, Science and Arts Occupations by Sex
Within the Management, Business, Science and Arts occupations in Tracy, the most male-oriented occupations are Legal Services & Support (100.0%), Education, Arts & Media (83.3%), and Computers, Engineering & Science (78.6%), while the most female-oriented occupations are Education Instruction & Library (100.0%), Health Technologists (100.0%), and Health Diagnosing & Treating (93.3%).
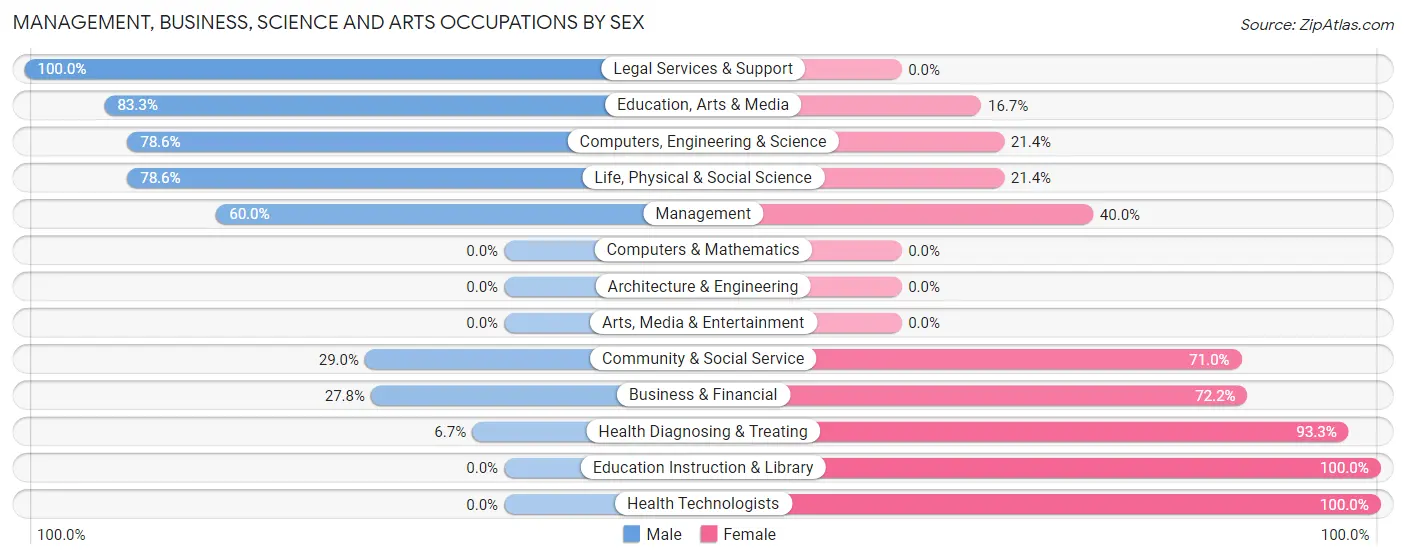
| Occupation | Male | Female |
| Management | 84 (60.0%) | 56 (40.0%) |
| Business & Financial | 5 (27.8%) | 13 (72.2%) |
| Computers, Engineering & Science | 11 (78.6%) | 3 (21.4%) |
| Computers & Mathematics | 0 (0.0%) | 0 (0.0%) |
| Architecture & Engineering | 0 (0.0%) | 0 (0.0%) |
| Life, Physical & Social Science | 11 (78.6%) | 3 (21.4%) |
| Community & Social Service | 18 (29.0%) | 44 (71.0%) |
| Education, Arts & Media | 15 (83.3%) | 3 (16.7%) |
| Legal Services & Support | 3 (100.0%) | 0 (0.0%) |
| Education Instruction & Library | 0 (0.0%) | 41 (100.0%) |
| Arts, Media & Entertainment | 0 (0.0%) | 0 (0.0%) |
| Health Diagnosing & Treating | 5 (6.7%) | 70 (93.3%) |
| Health Technologists | 0 (0.0%) | 53 (100.0%) |
| Total (Category) | 123 (39.8%) | 186 (60.2%) |
| Total (Overall) | 491 (50.3%) | 485 (49.7%) |
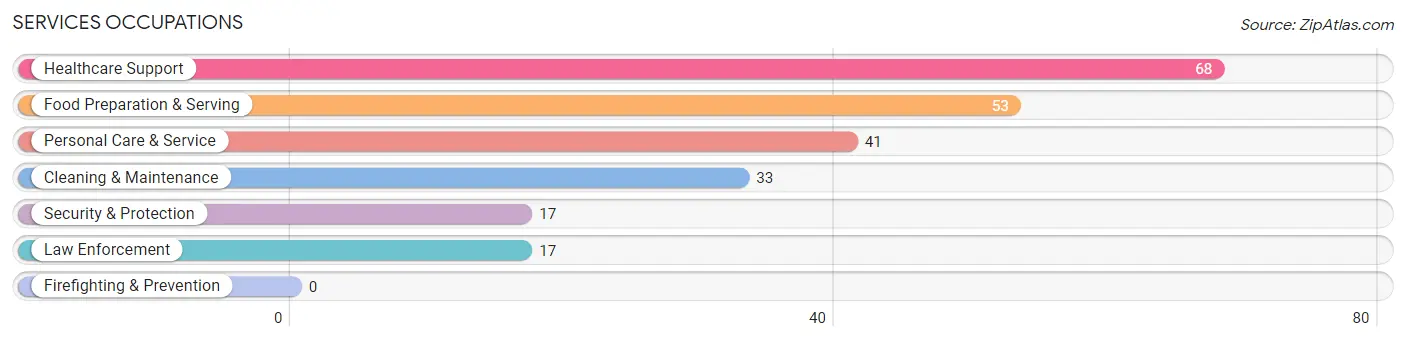
Services Occupations
The most common Services occupations in Tracy are Healthcare Support (68 | 7.0%), Food Preparation & Serving (53 | 5.4%), Personal Care & Service (41 | 4.2%), Cleaning & Maintenance (33 | 3.4%), and Security & Protection (17 | 1.7%).
Services Occupations by Sex
Within the Services occupations in Tracy, the most male-oriented occupations are Security & Protection (100.0%), Law Enforcement (100.0%), and Food Preparation & Serving (58.5%), while the most female-oriented occupations are Personal Care & Service (100.0%), Healthcare Support (95.6%), and Cleaning & Maintenance (66.7%).
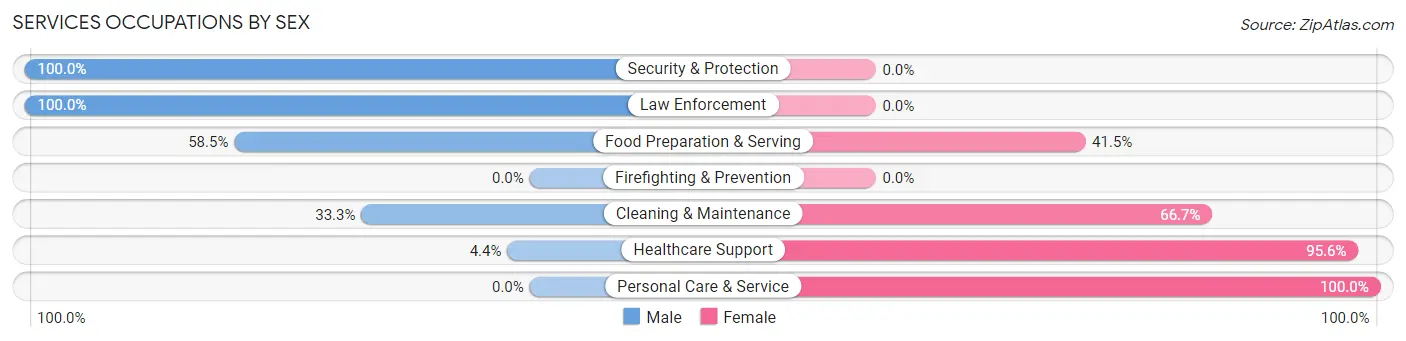
| Occupation | Male | Female |
| Healthcare Support | 3 (4.4%) | 65 (95.6%) |
| Security & Protection | 17 (100.0%) | 0 (0.0%) |
| Firefighting & Prevention | 0 (0.0%) | 0 (0.0%) |
| Law Enforcement | 17 (100.0%) | 0 (0.0%) |
| Food Preparation & Serving | 31 (58.5%) | 22 (41.5%) |
| Cleaning & Maintenance | 11 (33.3%) | 22 (66.7%) |
| Personal Care & Service | 0 (0.0%) | 41 (100.0%) |
| Total (Category) | 62 (29.2%) | 150 (70.8%) |
| Total (Overall) | 491 (50.3%) | 485 (49.7%) |
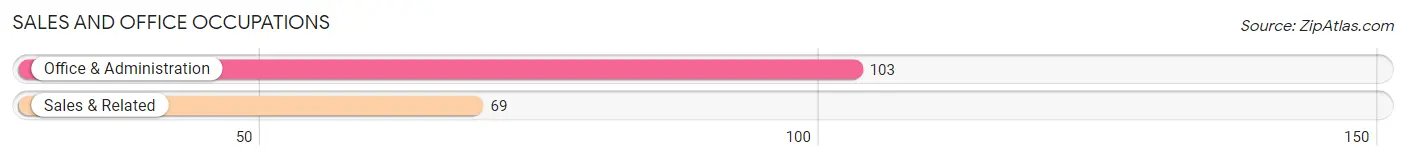
Sales and Office Occupations
The most common Sales and Office occupations in Tracy are Office & Administration (103 | 10.5%), and Sales & Related (69 | 7.1%).
Sales and Office Occupations by Sex
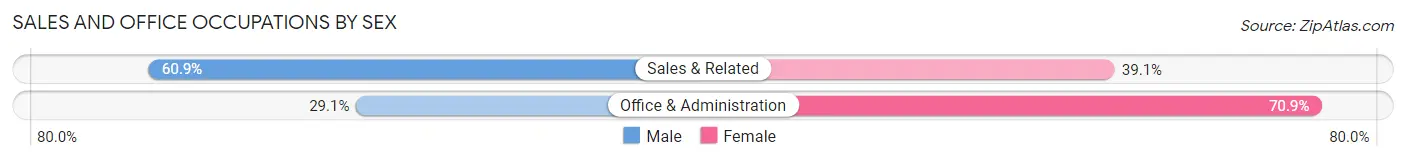
| Occupation | Male | Female |
| Sales & Related | 42 (60.9%) | 27 (39.1%) |
| Office & Administration | 30 (29.1%) | 73 (70.9%) |
| Total (Category) | 72 (41.9%) | 100 (58.1%) |
| Total (Overall) | 491 (50.3%) | 485 (49.7%) |
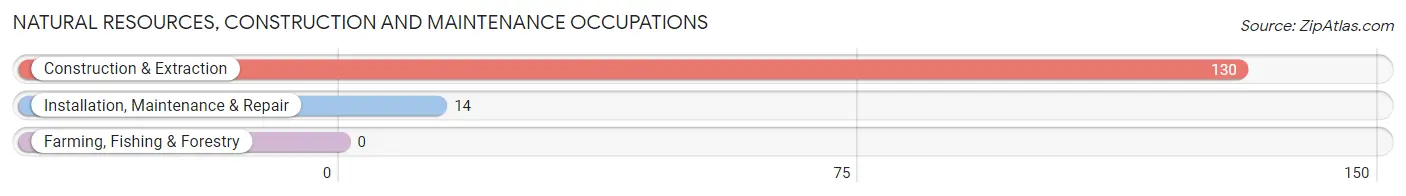
Natural Resources, Construction and Maintenance Occupations
The most common Natural Resources, Construction and Maintenance occupations in Tracy are Construction & Extraction (130 | 13.3%), and Installation, Maintenance & Repair (14 | 1.4%).
Natural Resources, Construction and Maintenance Occupations by Sex
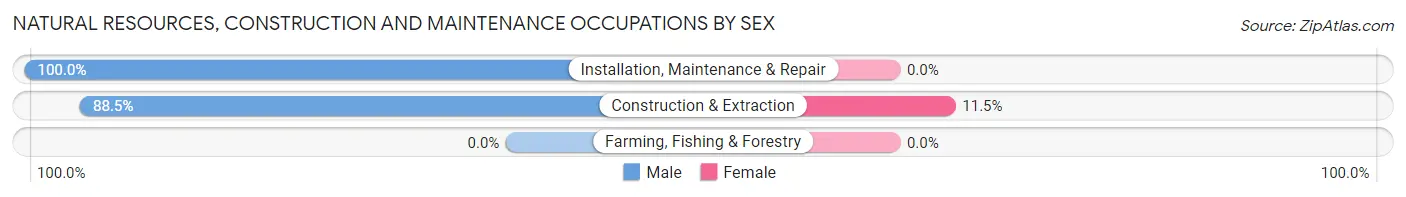
| Occupation | Male | Female |
| Farming, Fishing & Forestry | 0 (0.0%) | 0 (0.0%) |
| Construction & Extraction | 115 (88.5%) | 15 (11.5%) |
| Installation, Maintenance & Repair | 14 (100.0%) | 0 (0.0%) |
| Total (Category) | 129 (89.6%) | 15 (10.4%) |
| Total (Overall) | 491 (50.3%) | 485 (49.7%) |
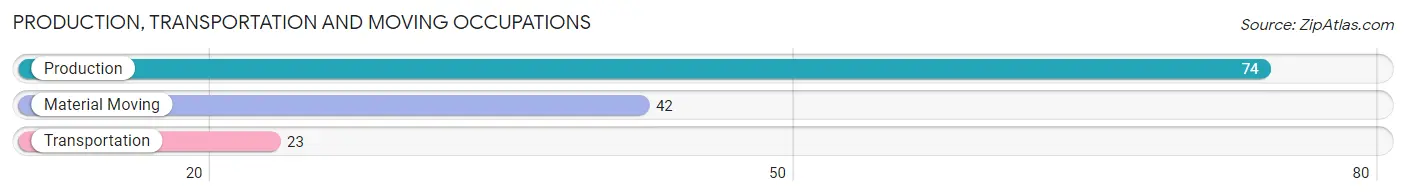
Production, Transportation and Moving Occupations
The most common Production, Transportation and Moving occupations in Tracy are Production (74 | 7.6%), Material Moving (42 | 4.3%), and Transportation (23 | 2.4%).
Production, Transportation and Moving Occupations by Sex
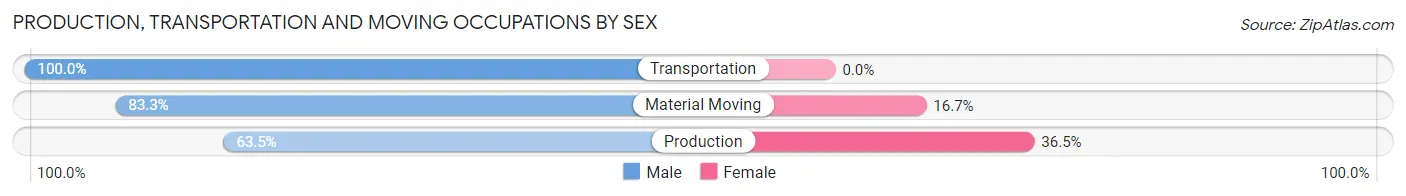
| Occupation | Male | Female |
| Production | 47 (63.5%) | 27 (36.5%) |
| Transportation | 23 (100.0%) | 0 (0.0%) |
| Material Moving | 35 (83.3%) | 7 (16.7%) |
| Total (Category) | 105 (75.5%) | 34 (24.5%) |
| Total (Overall) | 491 (50.3%) | 485 (49.7%) |
Employment Industries by Sex in Tracy
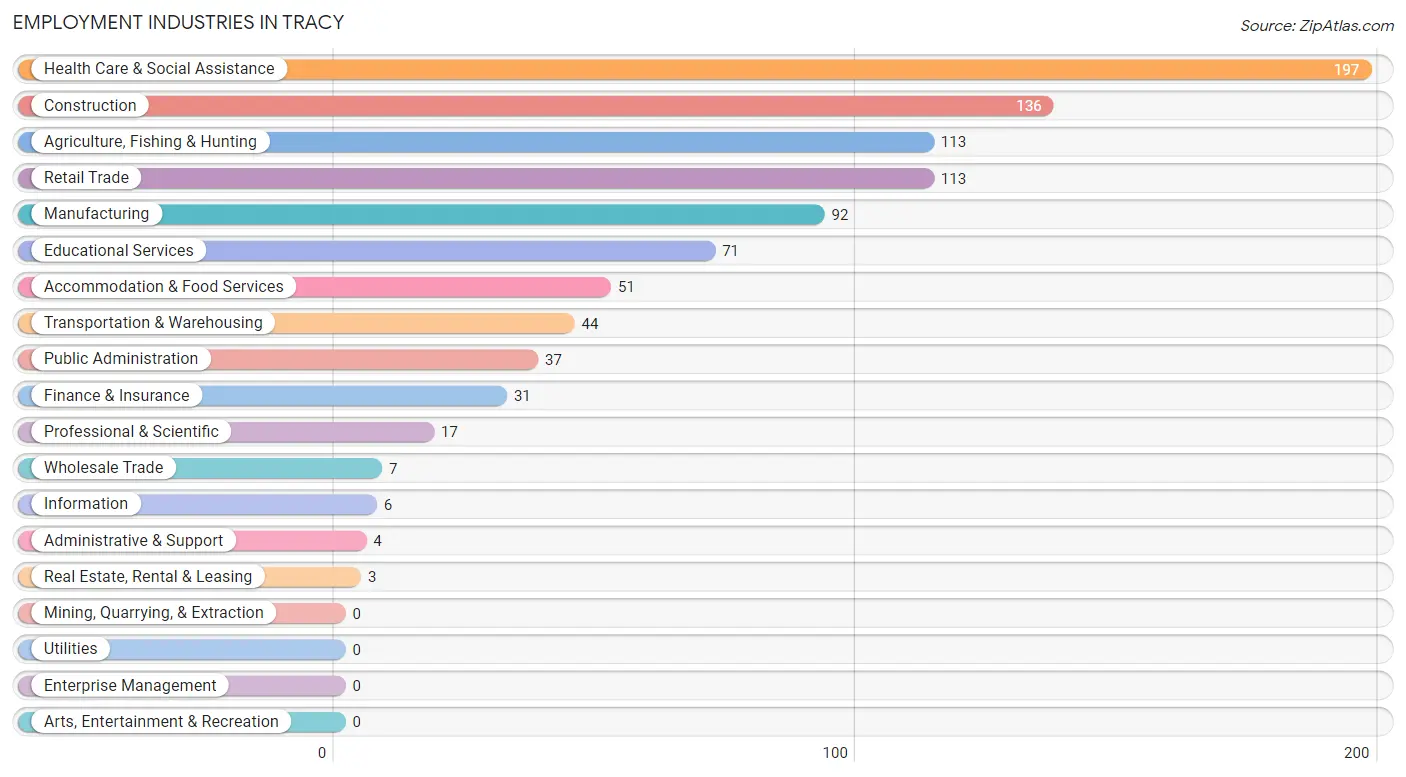
Employment Industries in Tracy
The major employment industries in Tracy include Health Care & Social Assistance (197 | 20.2%), Construction (136 | 13.9%), Agriculture, Fishing & Hunting (113 | 11.6%), Retail Trade (113 | 11.6%), and Manufacturing (92 | 9.4%).
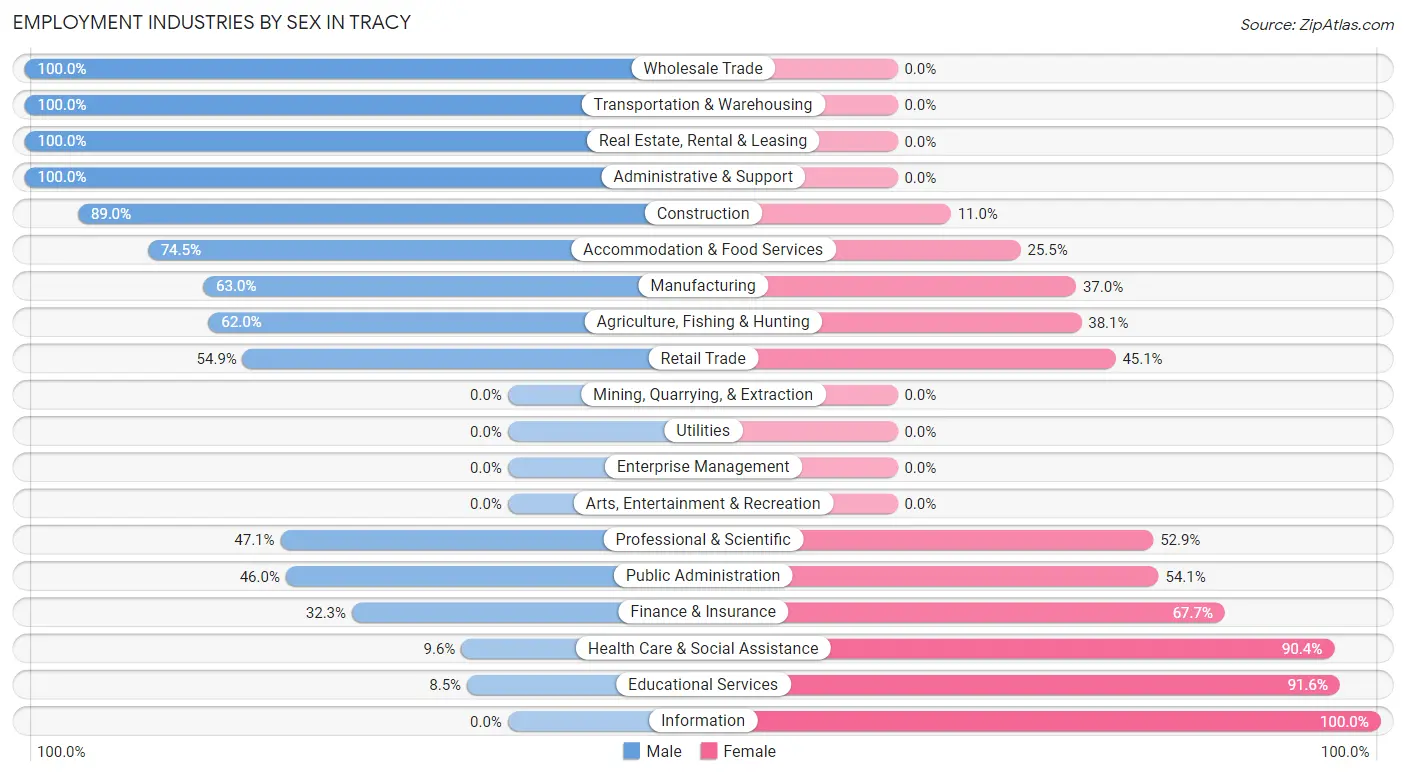
Employment Industries by Sex in Tracy
The Tracy industries that see more men than women are Wholesale Trade (100.0%), Transportation & Warehousing (100.0%), and Real Estate, Rental & Leasing (100.0%), whereas the industries that tend to have a higher number of women are Information (100.0%), Educational Services (91.5%), and Health Care & Social Assistance (90.4%).
| Industry | Male | Female |
| Agriculture, Fishing & Hunting | 70 (62.0%) | 43 (38.1%) |
| Mining, Quarrying, & Extraction | 0 (0.0%) | 0 (0.0%) |
| Construction | 121 (89.0%) | 15 (11.0%) |
| Manufacturing | 58 (63.0%) | 34 (37.0%) |
| Wholesale Trade | 7 (100.0%) | 0 (0.0%) |
| Retail Trade | 62 (54.9%) | 51 (45.1%) |
| Transportation & Warehousing | 44 (100.0%) | 0 (0.0%) |
| Utilities | 0 (0.0%) | 0 (0.0%) |
| Information | 0 (0.0%) | 6 (100.0%) |
| Finance & Insurance | 10 (32.3%) | 21 (67.7%) |
| Real Estate, Rental & Leasing | 3 (100.0%) | 0 (0.0%) |
| Professional & Scientific | 8 (47.1%) | 9 (52.9%) |
| Enterprise Management | 0 (0.0%) | 0 (0.0%) |
| Administrative & Support | 4 (100.0%) | 0 (0.0%) |
| Educational Services | 6 (8.5%) | 65 (91.5%) |
| Health Care & Social Assistance | 19 (9.6%) | 178 (90.4%) |
| Arts, Entertainment & Recreation | 0 (0.0%) | 0 (0.0%) |
| Accommodation & Food Services | 38 (74.5%) | 13 (25.5%) |
| Public Administration | 17 (46.0%) | 20 (54.0%) |
| Total | 491 (50.3%) | 485 (49.7%) |
Education in Tracy
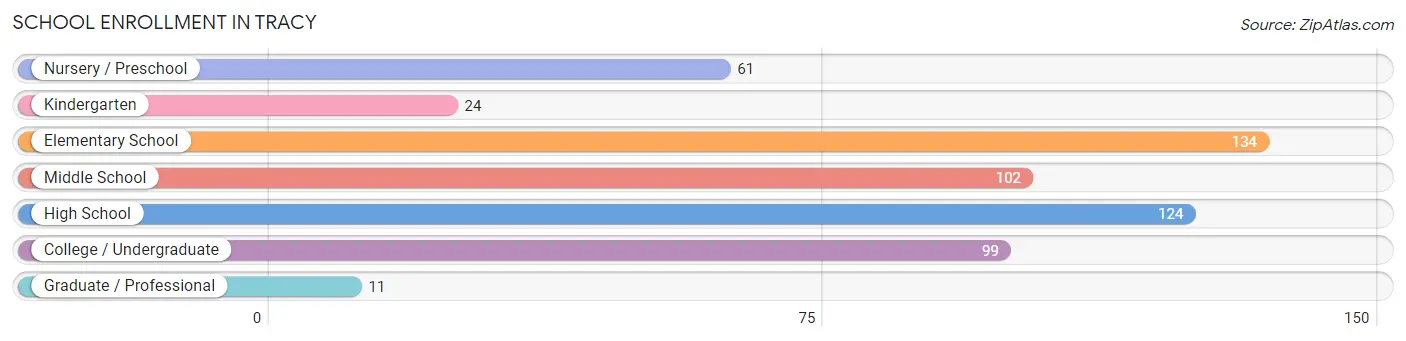
School Enrollment in Tracy
The most common levels of schooling among the 555 students in Tracy are elementary school (134 | 24.1%), high school (124 | 22.3%), and middle school (102 | 18.4%).
| School Level | # Students | % Students |
| Nursery / Preschool | 61 | 11.0% |
| Kindergarten | 24 | 4.3% |
| Elementary School | 134 | 24.1% |
| Middle School | 102 | 18.4% |
| High School | 124 | 22.3% |
| College / Undergraduate | 99 | 17.8% |
| Graduate / Professional | 11 | 2.0% |
| Total | 555 | 100.0% |
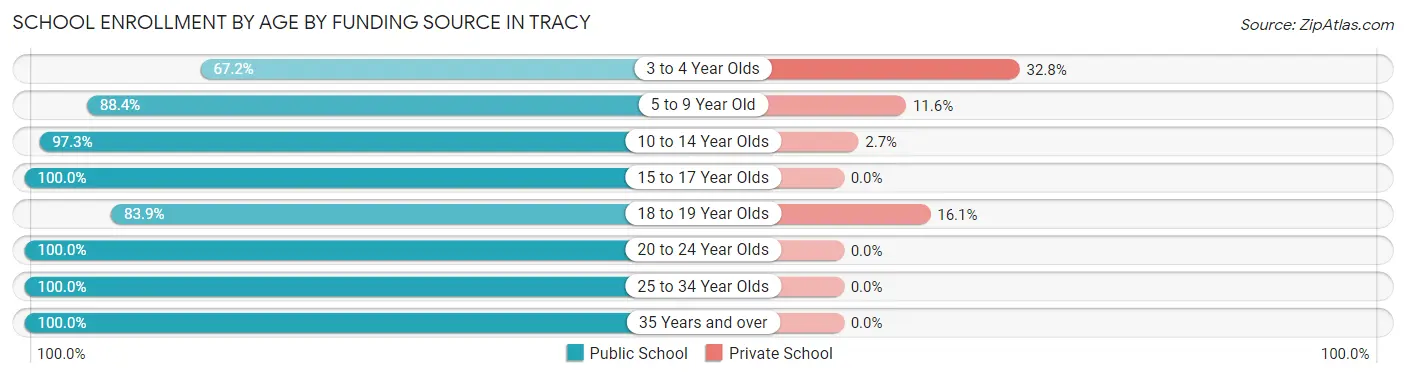
School Enrollment by Age by Funding Source in Tracy
Out of a total of 555 students who are enrolled in schools in Tracy, 45 (8.1%) attend a private institution, while the remaining 510 (91.9%) are enrolled in public schools. The age group of 3 to 4 year olds has the highest likelihood of being enrolled in private schools, with 19 (32.8% in the age bracket) enrolled. Conversely, the age group of 15 to 17 year olds has the lowest likelihood of being enrolled in a private school, with 90 (100.0% in the age bracket) attending a public institution.
| Age Bracket | Public School | Private School |
| 3 to 4 Year Olds | 39 (67.2%) | 19 (32.8%) |
| 5 to 9 Year Old | 137 (88.4%) | 18 (11.6%) |
| 10 to 14 Year Olds | 107 (97.3%) | 3 (2.7%) |
| 15 to 17 Year Olds | 90 (100.0%) | 0 (0.0%) |
| 18 to 19 Year Olds | 26 (83.9%) | 5 (16.1%) |
| 20 to 24 Year Olds | 67 (100.0%) | 0 (0.0%) |
| 25 to 34 Year Olds | 18 (100.0%) | 0 (0.0%) |
| 35 Years and over | 26 (100.0%) | 0 (0.0%) |
| Total | 510 (91.9%) | 45 (8.1%) |
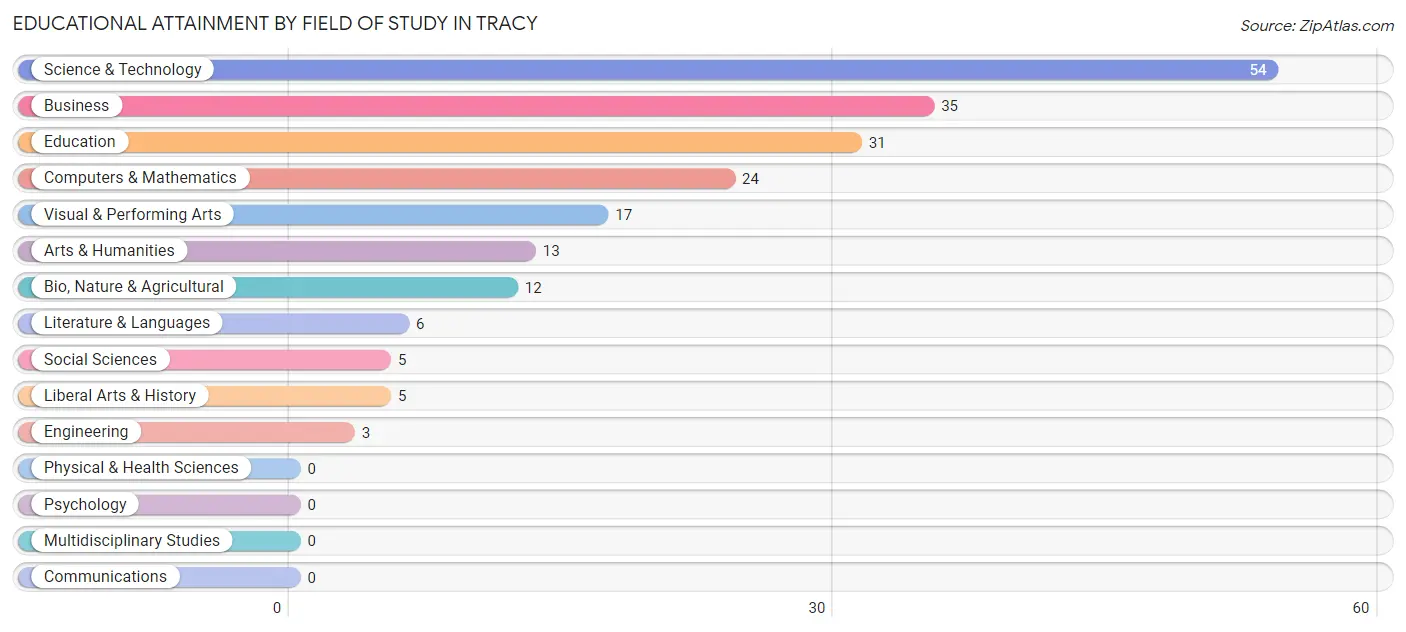
Educational Attainment by Field of Study in Tracy
Science & technology (54 | 26.3%), business (35 | 17.1%), education (31 | 15.1%), computers & mathematics (24 | 11.7%), and visual & performing arts (17 | 8.3%) are the most common fields of study among 205 individuals in Tracy who have obtained a bachelor's degree or higher.
| Field of Study | # Graduates | % Graduates |
| Computers & Mathematics | 24 | 11.7% |
| Bio, Nature & Agricultural | 12 | 5.9% |
| Physical & Health Sciences | 0 | 0.0% |
| Psychology | 0 | 0.0% |
| Social Sciences | 5 | 2.4% |
| Engineering | 3 | 1.5% |
| Multidisciplinary Studies | 0 | 0.0% |
| Science & Technology | 54 | 26.3% |
| Business | 35 | 17.1% |
| Education | 31 | 15.1% |
| Literature & Languages | 6 | 2.9% |
| Liberal Arts & History | 5 | 2.4% |
| Visual & Performing Arts | 17 | 8.3% |
| Communications | 0 | 0.0% |
| Arts & Humanities | 13 | 6.3% |
| Total | 205 | 100.0% |
Transportation & Commute in Tracy
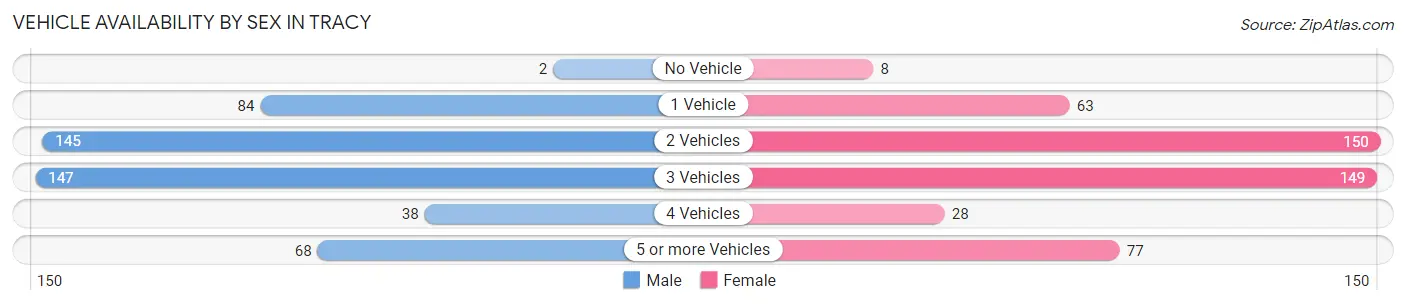
Vehicle Availability by Sex in Tracy
The most prevalent vehicle ownership categories in Tracy are males with 3 vehicles (147, accounting for 30.4%) and females with 3 vehicles (149, making up 30.9%).
| Vehicles Available | Male | Female |
| No Vehicle | 2 (0.4%) | 8 (1.7%) |
| 1 Vehicle | 84 (17.4%) | 63 (13.3%) |
| 2 Vehicles | 145 (30.0%) | 150 (31.6%) |
| 3 Vehicles | 147 (30.4%) | 149 (31.4%) |
| 4 Vehicles | 38 (7.9%) | 28 (5.9%) |
| 5 or more Vehicles | 68 (14.1%) | 77 (16.2%) |
| Total | 484 (100.0%) | 475 (100.0%) |
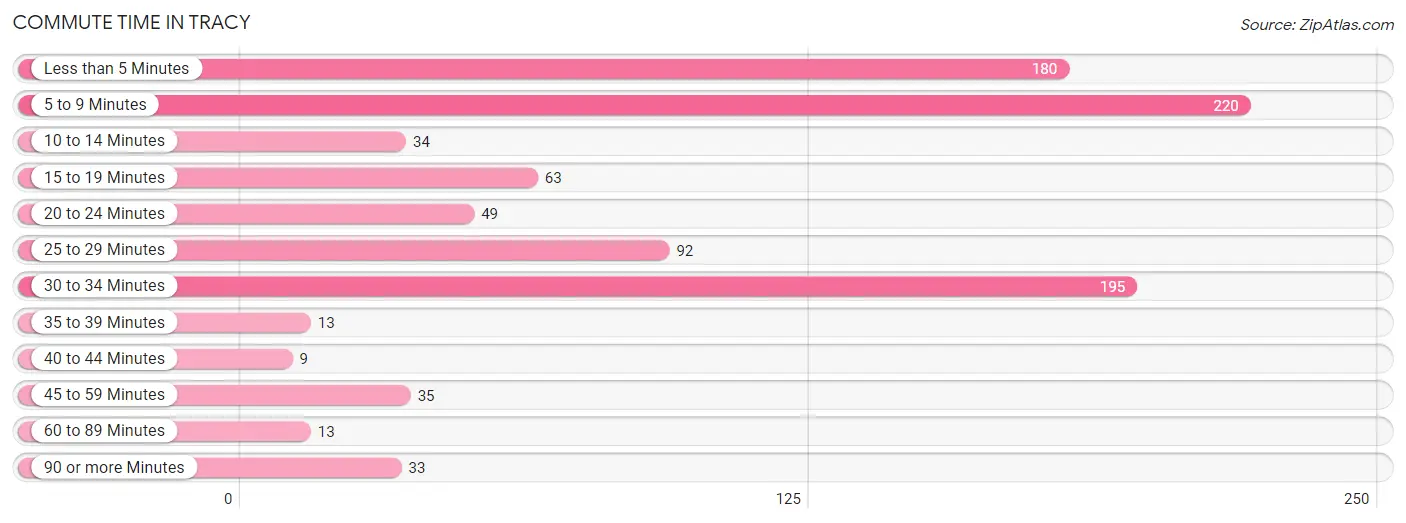
Commute Time in Tracy
The most frequently occuring commute durations in Tracy are 5 to 9 minutes (220 commuters, 23.5%), 30 to 34 minutes (195 commuters, 20.8%), and less than 5 minutes (180 commuters, 19.2%).
| Commute Time | # Commuters | % Commuters |
| Less than 5 Minutes | 180 | 19.2% |
| 5 to 9 Minutes | 220 | 23.5% |
| 10 to 14 Minutes | 34 | 3.6% |
| 15 to 19 Minutes | 63 | 6.7% |
| 20 to 24 Minutes | 49 | 5.2% |
| 25 to 29 Minutes | 92 | 9.8% |
| 30 to 34 Minutes | 195 | 20.8% |
| 35 to 39 Minutes | 13 | 1.4% |
| 40 to 44 Minutes | 9 | 1.0% |
| 45 to 59 Minutes | 35 | 3.7% |
| 60 to 89 Minutes | 13 | 1.4% |
| 90 or more Minutes | 33 | 3.5% |
Commute Time by Sex in Tracy
The most common commute times in Tracy are 5 to 9 minutes (99 commuters, 20.9%) for males and 5 to 9 minutes (121 commuters, 26.1%) for females.
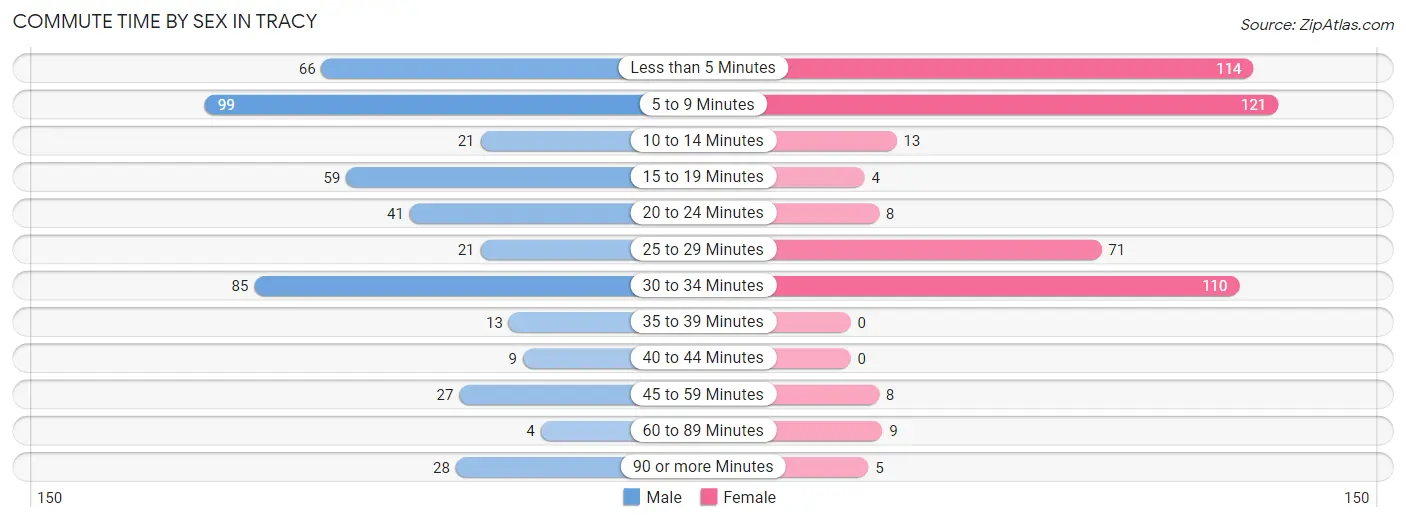
| Commute Time | Male | Female |
| Less than 5 Minutes | 66 (14.0%) | 114 (24.6%) |
| 5 to 9 Minutes | 99 (20.9%) | 121 (26.1%) |
| 10 to 14 Minutes | 21 (4.4%) | 13 (2.8%) |
| 15 to 19 Minutes | 59 (12.5%) | 4 (0.9%) |
| 20 to 24 Minutes | 41 (8.7%) | 8 (1.7%) |
| 25 to 29 Minutes | 21 (4.4%) | 71 (15.3%) |
| 30 to 34 Minutes | 85 (18.0%) | 110 (23.8%) |
| 35 to 39 Minutes | 13 (2.8%) | 0 (0.0%) |
| 40 to 44 Minutes | 9 (1.9%) | 0 (0.0%) |
| 45 to 59 Minutes | 27 (5.7%) | 8 (1.7%) |
| 60 to 89 Minutes | 4 (0.9%) | 9 (1.9%) |
| 90 or more Minutes | 28 (5.9%) | 5 (1.1%) |
Time of Departure to Work by Sex in Tracy
The most frequent times of departure to work in Tracy are 6:30 AM to 6:59 AM (116, 24.5%) for males and 7:30 AM to 7:59 AM (119, 25.7%) for females.
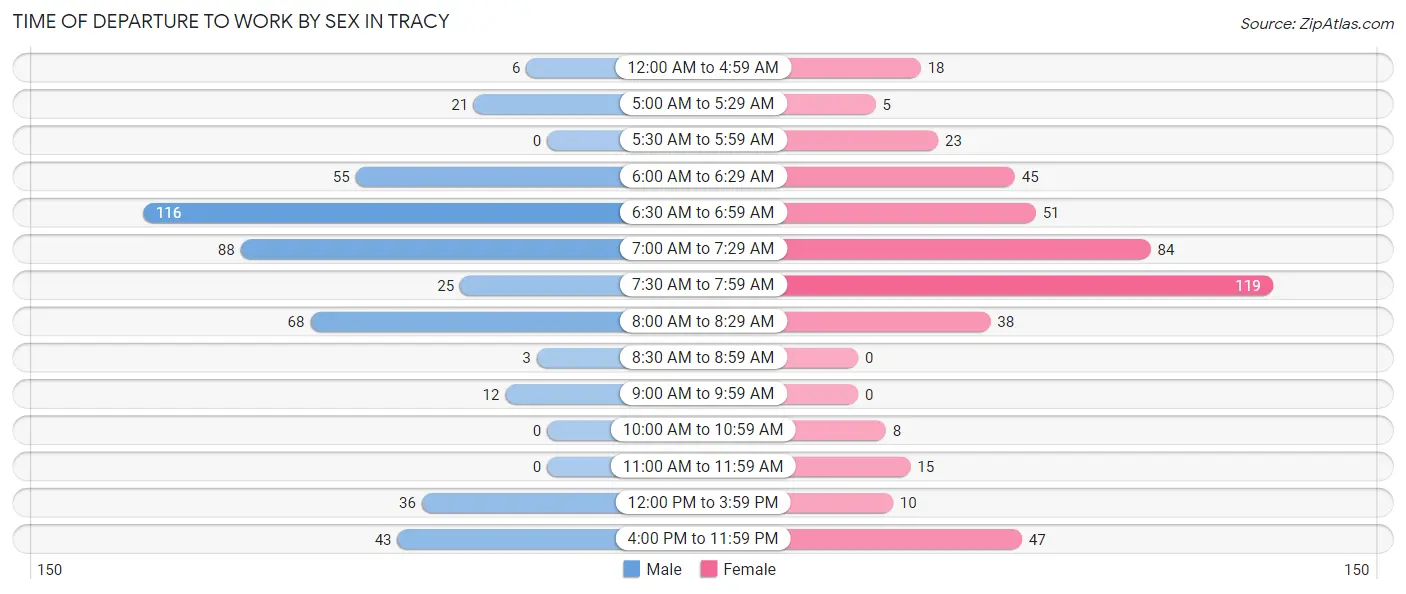
| Time of Departure | Male | Female |
| 12:00 AM to 4:59 AM | 6 (1.3%) | 18 (3.9%) |
| 5:00 AM to 5:29 AM | 21 (4.4%) | 5 (1.1%) |
| 5:30 AM to 5:59 AM | 0 (0.0%) | 23 (5.0%) |
| 6:00 AM to 6:29 AM | 55 (11.6%) | 45 (9.7%) |
| 6:30 AM to 6:59 AM | 116 (24.5%) | 51 (11.0%) |
| 7:00 AM to 7:29 AM | 88 (18.6%) | 84 (18.1%) |
| 7:30 AM to 7:59 AM | 25 (5.3%) | 119 (25.7%) |
| 8:00 AM to 8:29 AM | 68 (14.4%) | 38 (8.2%) |
| 8:30 AM to 8:59 AM | 3 (0.6%) | 0 (0.0%) |
| 9:00 AM to 9:59 AM | 12 (2.5%) | 0 (0.0%) |
| 10:00 AM to 10:59 AM | 0 (0.0%) | 8 (1.7%) |
| 11:00 AM to 11:59 AM | 0 (0.0%) | 15 (3.2%) |
| 12:00 PM to 3:59 PM | 36 (7.6%) | 10 (2.2%) |
| 4:00 PM to 11:59 PM | 43 (9.1%) | 47 (10.2%) |
| Total | 473 (100.0%) | 463 (100.0%) |
Housing Occupancy in Tracy
Occupancy by Ownership in Tracy
Of the total 743 dwellings in Tracy, owner-occupied units account for 613 (82.5%), while renter-occupied units make up 130 (17.5%).
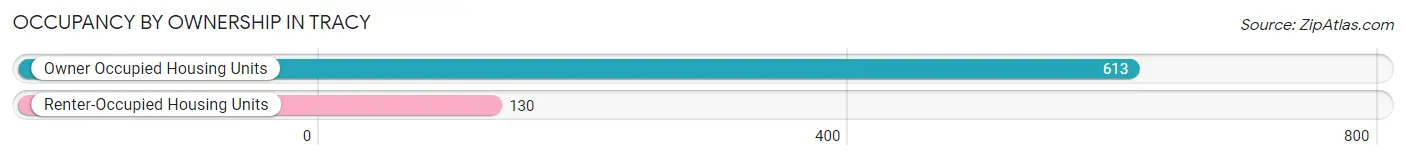
| Occupancy | # Housing Units | % Housing Units |
| Owner Occupied Housing Units | 613 | 82.5% |
| Renter-Occupied Housing Units | 130 | 17.5% |
| Total Occupied Housing Units | 743 | 100.0% |
Occupancy by Household Size in Tracy
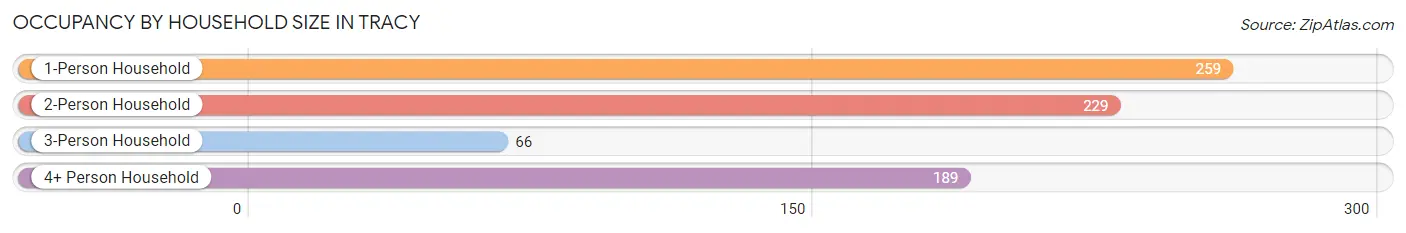
| Household Size | # Housing Units | % Housing Units |
| 1-Person Household | 259 | 34.9% |
| 2-Person Household | 229 | 30.8% |
| 3-Person Household | 66 | 8.9% |
| 4+ Person Household | 189 | 25.4% |
| Total Housing Units | 743 | 100.0% |
Occupancy by Ownership by Household Size in Tracy
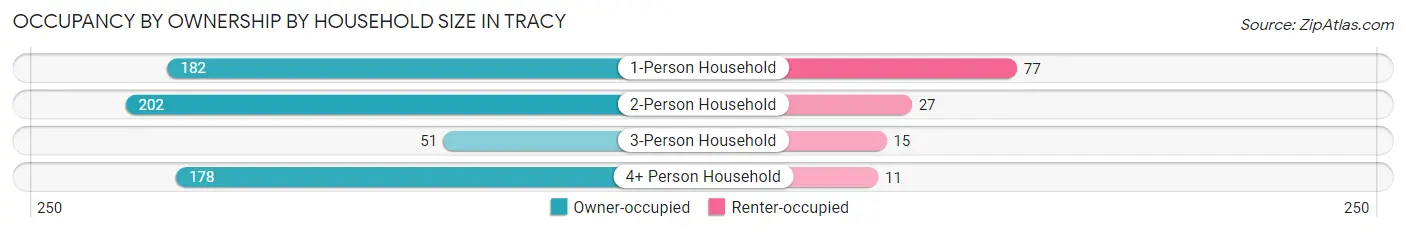
| Household Size | Owner-occupied | Renter-occupied |
| 1-Person Household | 182 (70.3%) | 77 (29.7%) |
| 2-Person Household | 202 (88.2%) | 27 (11.8%) |
| 3-Person Household | 51 (77.3%) | 15 (22.7%) |
| 4+ Person Household | 178 (94.2%) | 11 (5.8%) |
| Total Housing Units | 613 (82.5%) | 130 (17.5%) |
Occupancy by Educational Attainment in Tracy
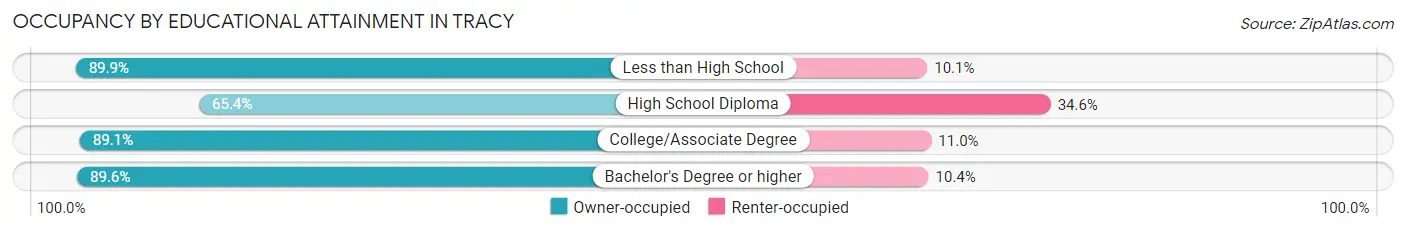
| Household Size | Owner-occupied | Renter-occupied |
| Less than High School | 62 (89.9%) | 7 (10.1%) |
| High School Diploma | 138 (65.4%) | 73 (34.6%) |
| College/Associate Degree | 301 (89.0%) | 37 (11.0%) |
| Bachelor's Degree or higher | 112 (89.6%) | 13 (10.4%) |
Occupancy by Age of Householder in Tracy
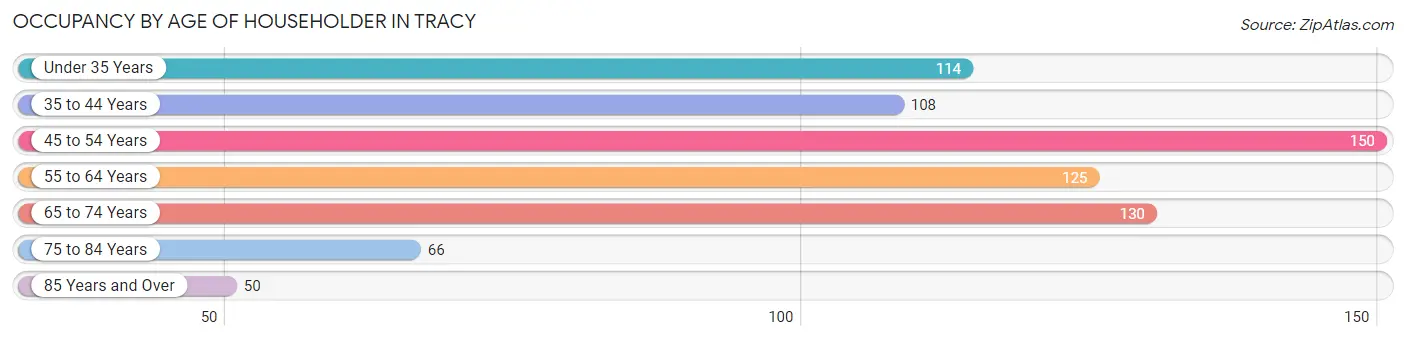
| Age Bracket | # Households | % Households |
| Under 35 Years | 114 | 15.3% |
| 35 to 44 Years | 108 | 14.5% |
| 45 to 54 Years | 150 | 20.2% |
| 55 to 64 Years | 125 | 16.8% |
| 65 to 74 Years | 130 | 17.5% |
| 75 to 84 Years | 66 | 8.9% |
| 85 Years and Over | 50 | 6.7% |
| Total | 743 | 100.0% |
Housing Finances in Tracy
Median Income by Occupancy in Tracy
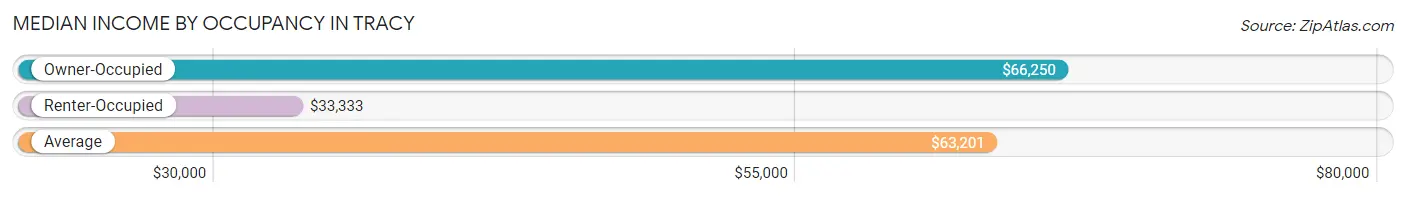
| Occupancy Type | # Households | Median Income |
| Owner-Occupied | 613 (82.5%) | $66,250 |
| Renter-Occupied | 130 (17.5%) | $33,333 |
| Average | 743 (100.0%) | $63,201 |
Occupancy by Householder Income Bracket in Tracy
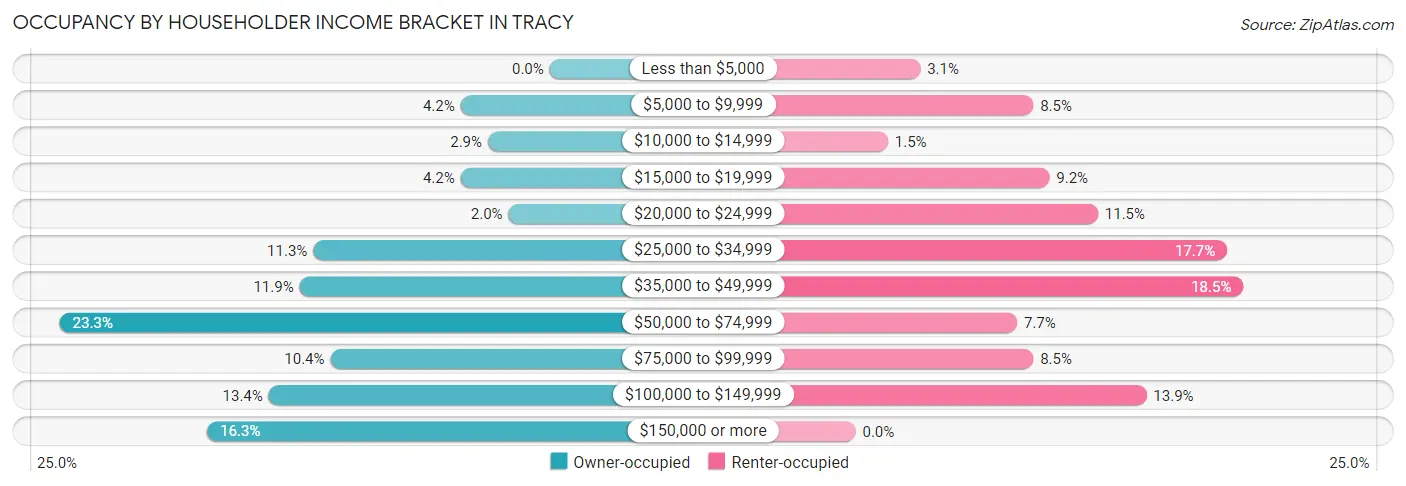
| Income Bracket | Owner-occupied | Renter-occupied |
| Less than $5,000 | 0 (0.0%) | 4 (3.1%) |
| $5,000 to $9,999 | 26 (4.2%) | 11 (8.5%) |
| $10,000 to $14,999 | 18 (2.9%) | 2 (1.5%) |
| $15,000 to $19,999 | 26 (4.2%) | 12 (9.2%) |
| $20,000 to $24,999 | 12 (2.0%) | 15 (11.5%) |
| $25,000 to $34,999 | 69 (11.3%) | 23 (17.7%) |
| $35,000 to $49,999 | 73 (11.9%) | 24 (18.5%) |
| $50,000 to $74,999 | 143 (23.3%) | 10 (7.7%) |
| $75,000 to $99,999 | 64 (10.4%) | 11 (8.5%) |
| $100,000 to $149,999 | 82 (13.4%) | 18 (13.9%) |
| $150,000 or more | 100 (16.3%) | 0 (0.0%) |
| Total | 613 (100.0%) | 130 (100.0%) |
Monthly Housing Cost Tiers in Tracy
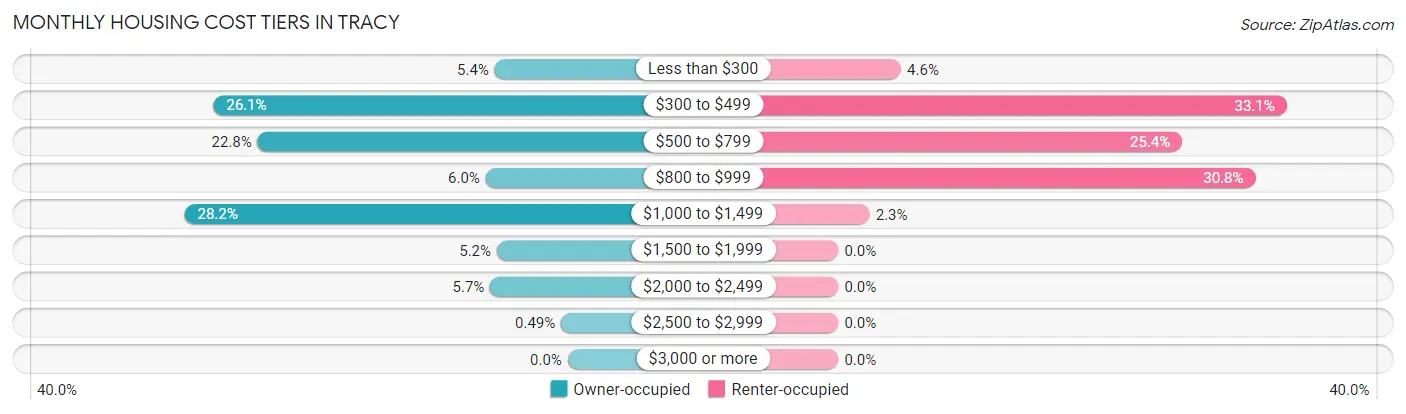
| Monthly Cost | Owner-occupied | Renter-occupied |
| Less than $300 | 33 (5.4%) | 6 (4.6%) |
| $300 to $499 | 160 (26.1%) | 43 (33.1%) |
| $500 to $799 | 140 (22.8%) | 33 (25.4%) |
| $800 to $999 | 37 (6.0%) | 40 (30.8%) |
| $1,000 to $1,499 | 173 (28.2%) | 3 (2.3%) |
| $1,500 to $1,999 | 32 (5.2%) | 0 (0.0%) |
| $2,000 to $2,499 | 35 (5.7%) | 0 (0.0%) |
| $2,500 to $2,999 | 3 (0.5%) | 0 (0.0%) |
| $3,000 or more | 0 (0.0%) | 0 (0.0%) |
| Total | 613 (100.0%) | 130 (100.0%) |
Physical Housing Characteristics in Tracy
Housing Structures in Tracy
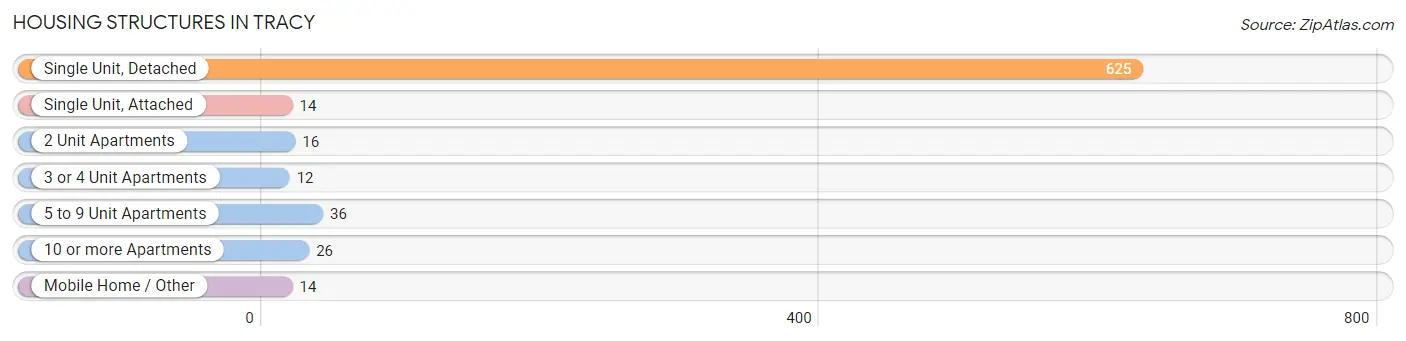
| Structure Type | # Housing Units | % Housing Units |
| Single Unit, Detached | 625 | 84.1% |
| Single Unit, Attached | 14 | 1.9% |
| 2 Unit Apartments | 16 | 2.1% |
| 3 or 4 Unit Apartments | 12 | 1.6% |
| 5 to 9 Unit Apartments | 36 | 4.9% |
| 10 or more Apartments | 26 | 3.5% |
| Mobile Home / Other | 14 | 1.9% |
| Total | 743 | 100.0% |
Housing Structures by Occupancy in Tracy
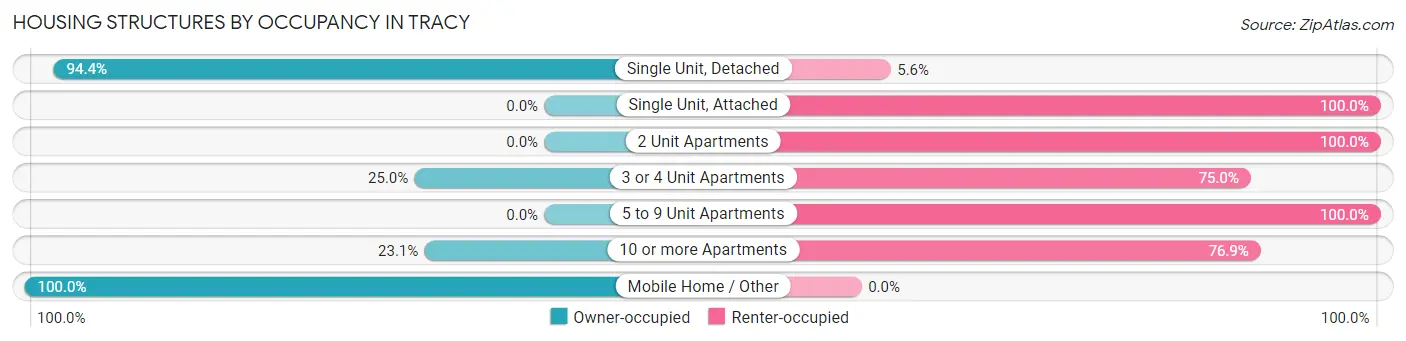
| Structure Type | Owner-occupied | Renter-occupied |
| Single Unit, Detached | 590 (94.4%) | 35 (5.6%) |
| Single Unit, Attached | 0 (0.0%) | 14 (100.0%) |
| 2 Unit Apartments | 0 (0.0%) | 16 (100.0%) |
| 3 or 4 Unit Apartments | 3 (25.0%) | 9 (75.0%) |
| 5 to 9 Unit Apartments | 0 (0.0%) | 36 (100.0%) |
| 10 or more Apartments | 6 (23.1%) | 20 (76.9%) |
| Mobile Home / Other | 14 (100.0%) | 0 (0.0%) |
| Total | 613 (82.5%) | 130 (17.5%) |
Housing Structures by Number of Rooms in Tracy
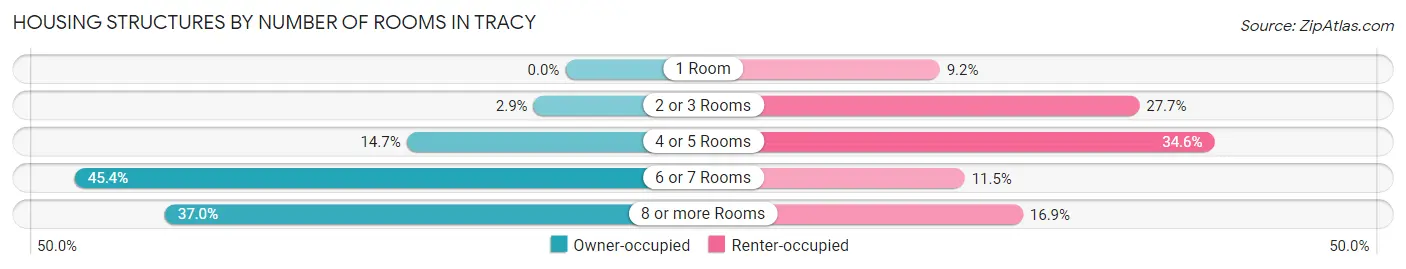
| Number of Rooms | Owner-occupied | Renter-occupied |
| 1 Room | 0 (0.0%) | 12 (9.2%) |
| 2 or 3 Rooms | 18 (2.9%) | 36 (27.7%) |
| 4 or 5 Rooms | 90 (14.7%) | 45 (34.6%) |
| 6 or 7 Rooms | 278 (45.4%) | 15 (11.5%) |
| 8 or more Rooms | 227 (37.0%) | 22 (16.9%) |
| Total | 613 (100.0%) | 130 (100.0%) |
Housing Structure by Heating Type in Tracy
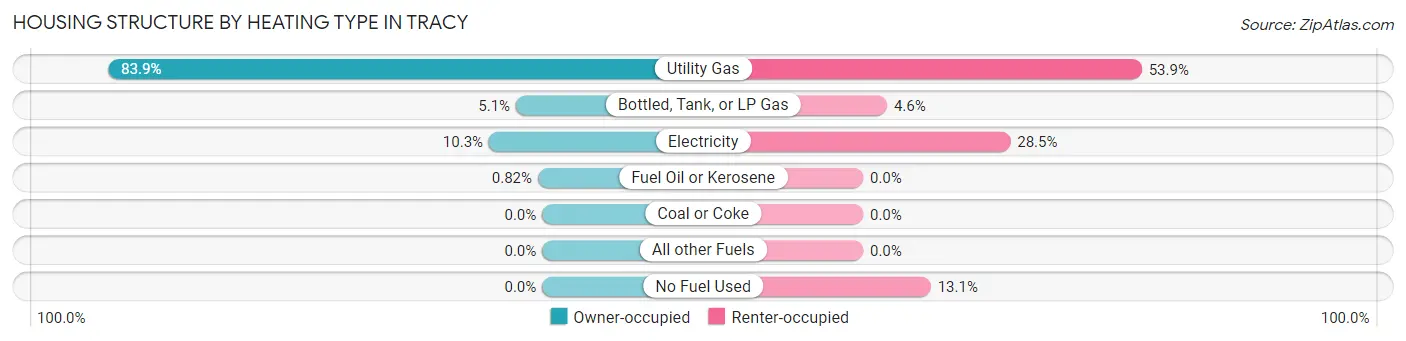
| Heating Type | Owner-occupied | Renter-occupied |
| Utility Gas | 514 (83.9%) | 70 (53.8%) |
| Bottled, Tank, or LP Gas | 31 (5.1%) | 6 (4.6%) |
| Electricity | 63 (10.3%) | 37 (28.5%) |
| Fuel Oil or Kerosene | 5 (0.8%) | 0 (0.0%) |
| Coal or Coke | 0 (0.0%) | 0 (0.0%) |
| All other Fuels | 0 (0.0%) | 0 (0.0%) |
| No Fuel Used | 0 (0.0%) | 17 (13.1%) |
| Total | 613 (100.0%) | 130 (100.0%) |
Household Vehicle Usage in Tracy
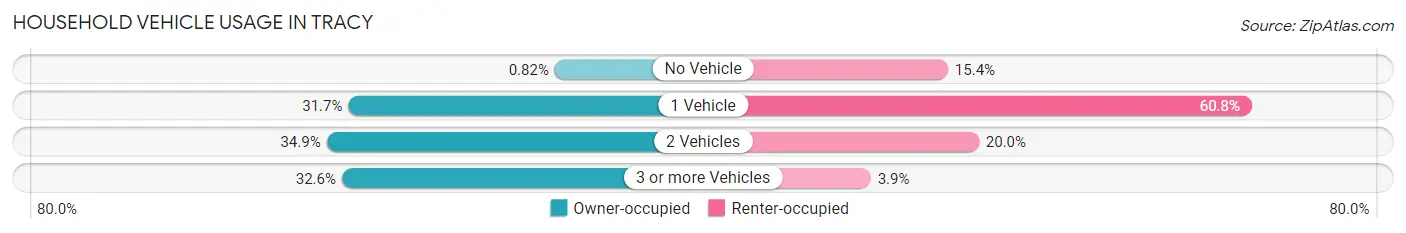
| Vehicles per Household | Owner-occupied | Renter-occupied |
| No Vehicle | 5 (0.8%) | 20 (15.4%) |
| 1 Vehicle | 194 (31.7%) | 79 (60.8%) |
| 2 Vehicles | 214 (34.9%) | 26 (20.0%) |
| 3 or more Vehicles | 200 (32.6%) | 5 (3.8%) |
| Total | 613 (100.0%) | 130 (100.0%) |
Real Estate & Mortgages in Tracy
Real Estate and Mortgage Overview in Tracy
| Characteristic | Without Mortgage | With Mortgage |
| Housing Units | 319 | 294 |
| Median Property Value | $89,000 | $112,200 |
| Median Household Income | $59,821 | $60 |
| Monthly Housing Costs | $439 | $0 |
| Real Estate Taxes | $1,071 | $6 |
Property Value by Mortgage Status in Tracy
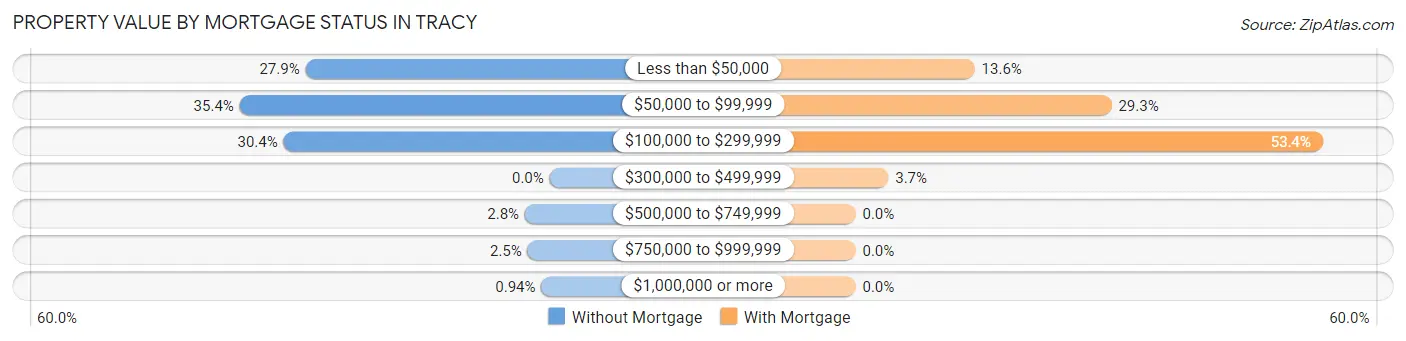
| Property Value | Without Mortgage | With Mortgage |
| Less than $50,000 | 89 (27.9%) | 40 (13.6%) |
| $50,000 to $99,999 | 113 (35.4%) | 86 (29.2%) |
| $100,000 to $299,999 | 97 (30.4%) | 157 (53.4%) |
| $300,000 to $499,999 | 0 (0.0%) | 11 (3.7%) |
| $500,000 to $749,999 | 9 (2.8%) | 0 (0.0%) |
| $750,000 to $999,999 | 8 (2.5%) | 0 (0.0%) |
| $1,000,000 or more | 3 (0.9%) | 0 (0.0%) |
| Total | 319 (100.0%) | 294 (100.0%) |
Household Income by Mortgage Status in Tracy
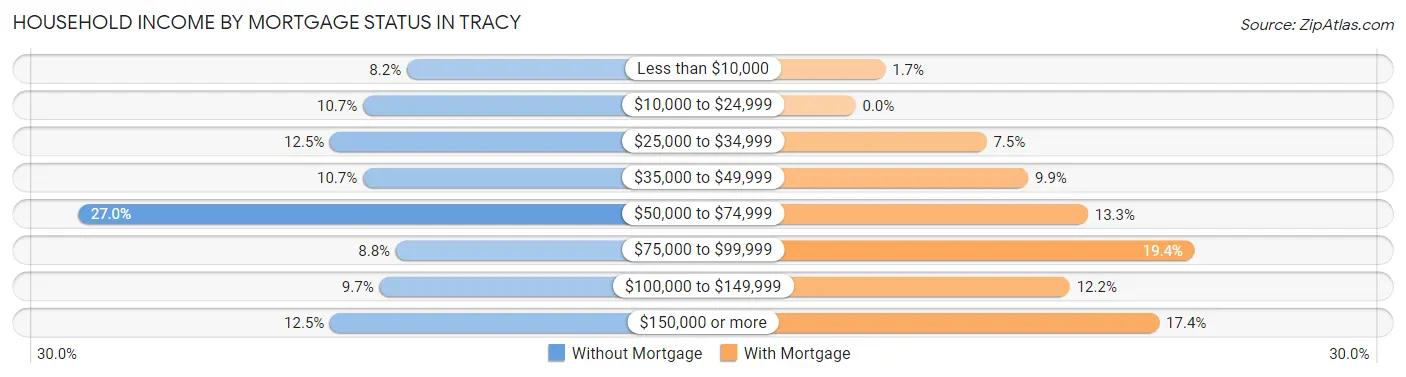
| Household Income | Without Mortgage | With Mortgage |
| Less than $10,000 | 26 (8.2%) | 5 (1.7%) |
| $10,000 to $24,999 | 34 (10.7%) | 0 (0.0%) |
| $25,000 to $34,999 | 40 (12.5%) | 22 (7.5%) |
| $35,000 to $49,999 | 34 (10.7%) | 29 (9.9%) |
| $50,000 to $74,999 | 86 (27.0%) | 39 (13.3%) |
| $75,000 to $99,999 | 28 (8.8%) | 57 (19.4%) |
| $100,000 to $149,999 | 31 (9.7%) | 36 (12.2%) |
| $150,000 or more | 40 (12.5%) | 51 (17.3%) |
| Total | 319 (100.0%) | 294 (100.0%) |
Property Value to Household Income Ratio in Tracy
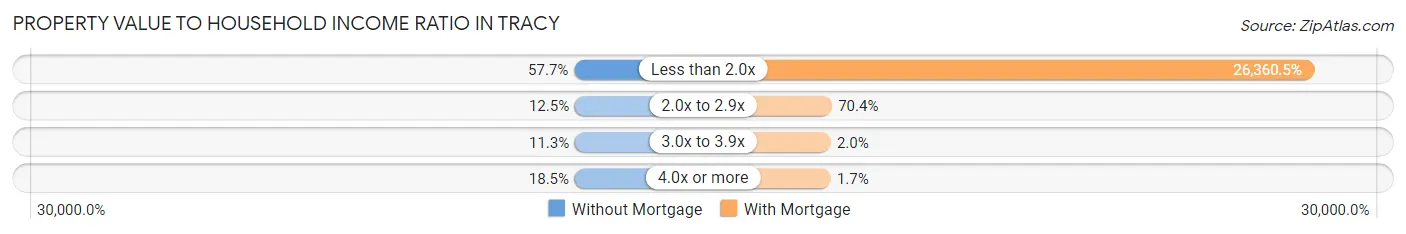
| Value-to-Income Ratio | Without Mortgage | With Mortgage |
| Less than 2.0x | 184 (57.7%) | 77,500 (26,360.5%) |
| 2.0x to 2.9x | 40 (12.5%) | 207 (70.4%) |
| 3.0x to 3.9x | 36 (11.3%) | 6 (2.0%) |
| 4.0x or more | 59 (18.5%) | 5 (1.7%) |
| Total | 319 (100.0%) | 294 (100.0%) |
Real Estate Taxes by Mortgage Status in Tracy
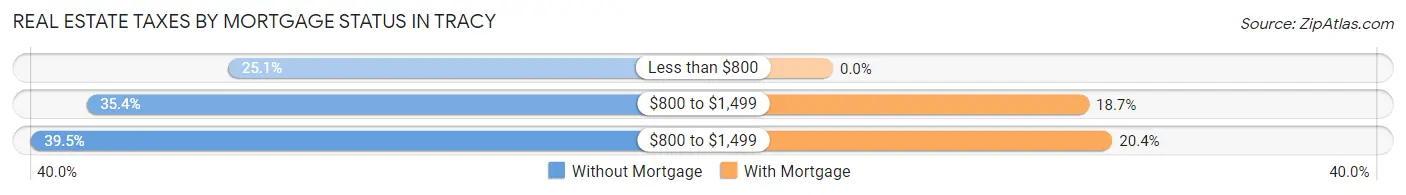
| Property Taxes | Without Mortgage | With Mortgage |
| Less than $800 | 80 (25.1%) | 0 (0.0%) |
| $800 to $1,499 | 113 (35.4%) | 55 (18.7%) |
| $800 to $1,499 | 126 (39.5%) | 60 (20.4%) |
| Total | 319 (100.0%) | 294 (100.0%) |
Health & Disability in Tracy
Health Insurance Coverage by Age in Tracy
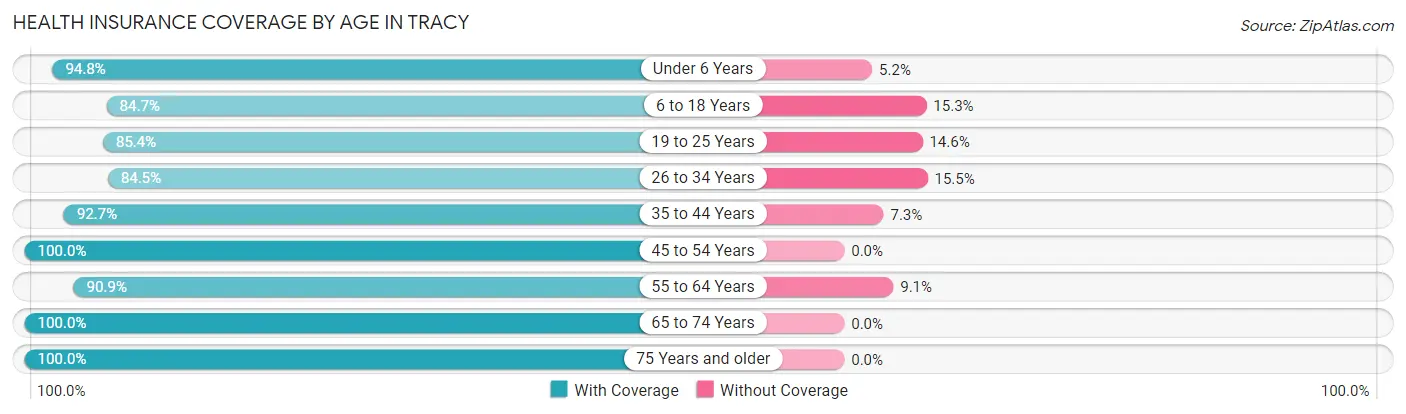
| Age Bracket | With Coverage | Without Coverage |
| Under 6 Years | 164 (94.8%) | 9 (5.2%) |
| 6 to 18 Years | 332 (84.7%) | 60 (15.3%) |
| 19 to 25 Years | 164 (85.4%) | 28 (14.6%) |
| 26 to 34 Years | 136 (84.5%) | 25 (15.5%) |
| 35 to 44 Years | 228 (92.7%) | 18 (7.3%) |
| 45 to 54 Years | 218 (100.0%) | 0 (0.0%) |
| 55 to 64 Years | 169 (90.9%) | 17 (9.1%) |
| 65 to 74 Years | 197 (100.0%) | 0 (0.0%) |
| 75 Years and older | 184 (100.0%) | 0 (0.0%) |
| Total | 1,792 (91.9%) | 157 (8.1%) |
Health Insurance Coverage by Citizenship Status in Tracy
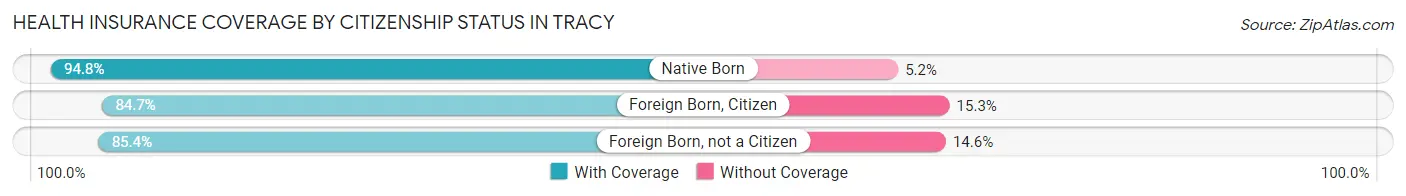
| Citizenship Status | With Coverage | Without Coverage |
| Native Born | 164 (94.8%) | 9 (5.2%) |
| Foreign Born, Citizen | 332 (84.7%) | 60 (15.3%) |
| Foreign Born, not a Citizen | 164 (85.4%) | 28 (14.6%) |
Health Insurance Coverage by Household Income in Tracy
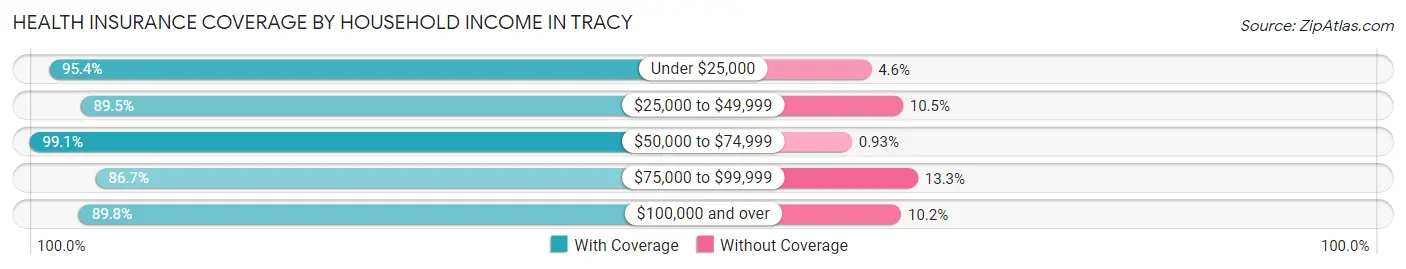
| Household Income | With Coverage | Without Coverage |
| Under $25,000 | 146 (95.4%) | 7 (4.6%) |
| $25,000 to $49,999 | 384 (89.5%) | 45 (10.5%) |
| $50,000 to $74,999 | 428 (99.1%) | 4 (0.9%) |
| $75,000 to $99,999 | 215 (86.7%) | 33 (13.3%) |
| $100,000 and over | 601 (89.8%) | 68 (10.2%) |
Public vs Private Health Insurance Coverage by Age in Tracy
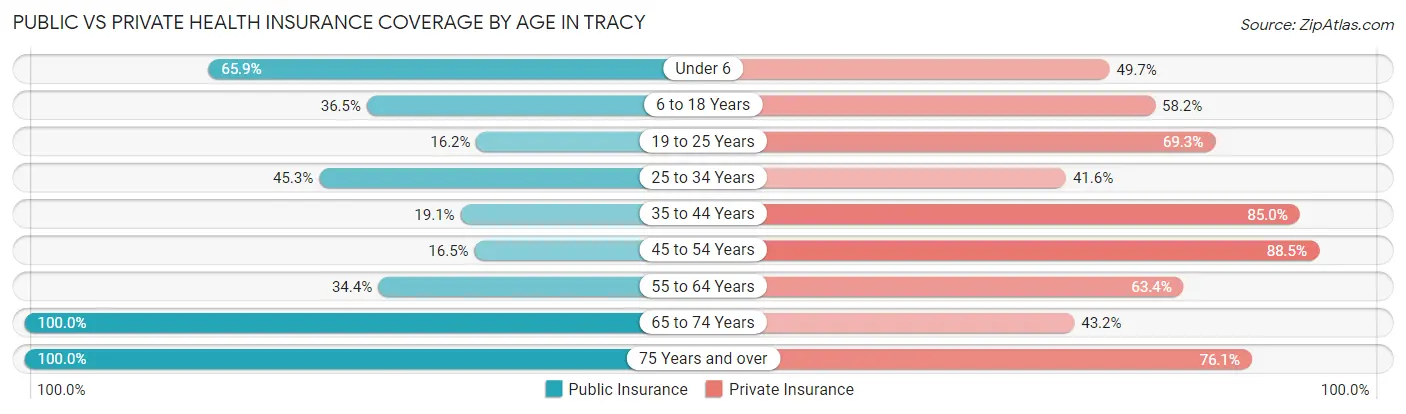
| Age Bracket | Public Insurance | Private Insurance |
| Under 6 | 114 (65.9%) | 86 (49.7%) |
| 6 to 18 Years | 143 (36.5%) | 228 (58.2%) |
| 19 to 25 Years | 31 (16.2%) | 133 (69.3%) |
| 25 to 34 Years | 73 (45.3%) | 67 (41.6%) |
| 35 to 44 Years | 47 (19.1%) | 209 (85.0%) |
| 45 to 54 Years | 36 (16.5%) | 193 (88.5%) |
| 55 to 64 Years | 64 (34.4%) | 118 (63.4%) |
| 65 to 74 Years | 197 (100.0%) | 85 (43.1%) |
| 75 Years and over | 184 (100.0%) | 140 (76.1%) |
| Total | 889 (45.6%) | 1,259 (64.6%) |
Disability Status by Sex by Age in Tracy
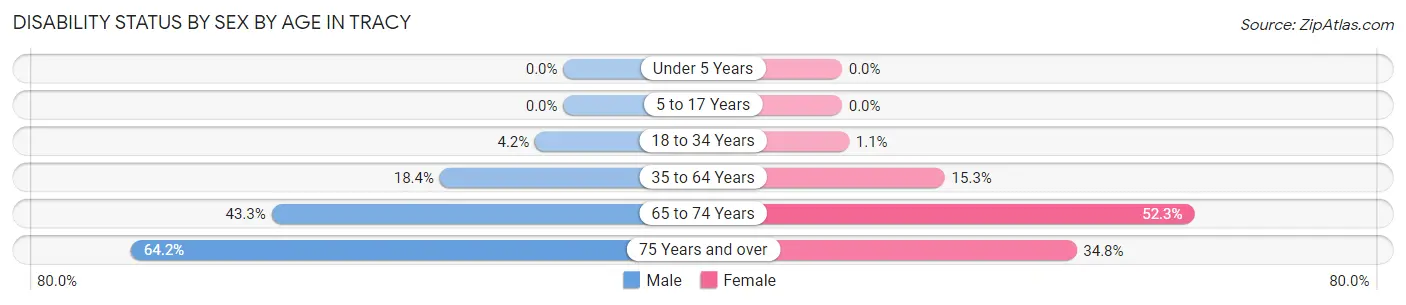
| Age Bracket | Male | Female |
| Under 5 Years | 0 (0.0%) | 0 (0.0%) |
| 5 to 17 Years | 0 (0.0%) | 0 (0.0%) |
| 18 to 34 Years | 9 (4.2%) | 2 (1.1%) |
| 35 to 64 Years | 58 (18.3%) | 51 (15.3%) |
| 65 to 74 Years | 39 (43.3%) | 56 (52.3%) |
| 75 Years and over | 61 (64.2%) | 31 (34.8%) |
Disability Class by Sex by Age in Tracy
Disability Class: Hearing Difficulty
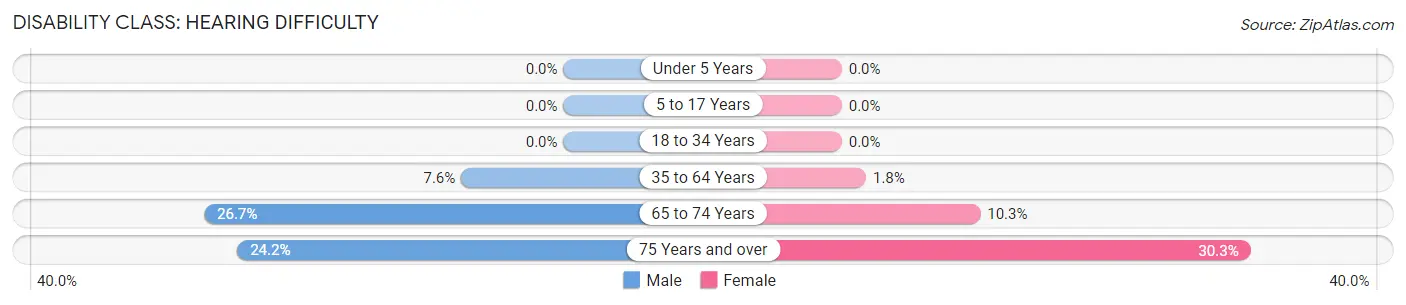
| Age Bracket | Male | Female |
| Under 5 Years | 0 (0.0%) | 0 (0.0%) |
| 5 to 17 Years | 0 (0.0%) | 0 (0.0%) |
| 18 to 34 Years | 0 (0.0%) | 0 (0.0%) |
| 35 to 64 Years | 24 (7.6%) | 6 (1.8%) |
| 65 to 74 Years | 24 (26.7%) | 11 (10.3%) |
| 75 Years and over | 23 (24.2%) | 27 (30.3%) |
Disability Class: Vision Difficulty
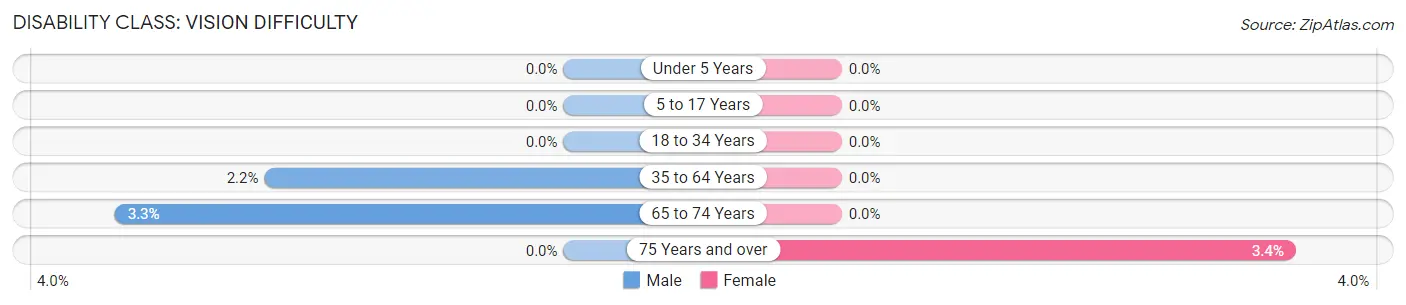
| Age Bracket | Male | Female |
| Under 5 Years | 0 (0.0%) | 0 (0.0%) |
| 5 to 17 Years | 0 (0.0%) | 0 (0.0%) |
| 18 to 34 Years | 0 (0.0%) | 0 (0.0%) |
| 35 to 64 Years | 7 (2.2%) | 0 (0.0%) |
| 65 to 74 Years | 3 (3.3%) | 0 (0.0%) |
| 75 Years and over | 0 (0.0%) | 3 (3.4%) |
Disability Class: Cognitive Difficulty
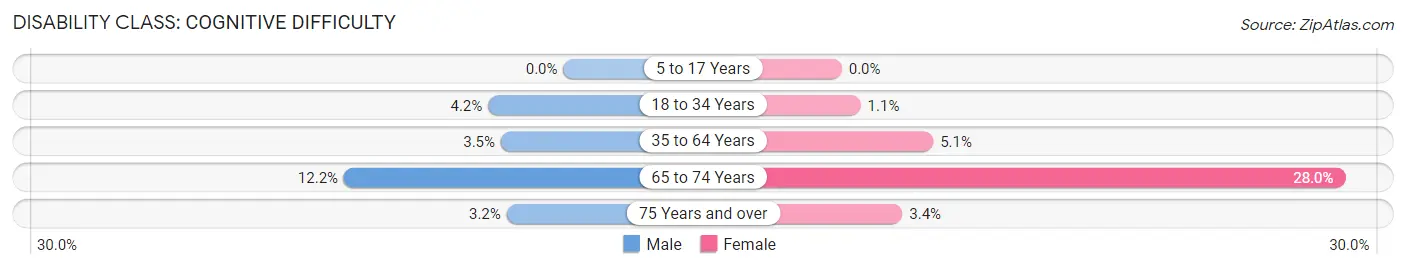
| Age Bracket | Male | Female |
| 5 to 17 Years | 0 (0.0%) | 0 (0.0%) |
| 18 to 34 Years | 9 (4.2%) | 2 (1.1%) |
| 35 to 64 Years | 11 (3.5%) | 17 (5.1%) |
| 65 to 74 Years | 11 (12.2%) | 30 (28.0%) |
| 75 Years and over | 3 (3.2%) | 3 (3.4%) |
Disability Class: Ambulatory Difficulty
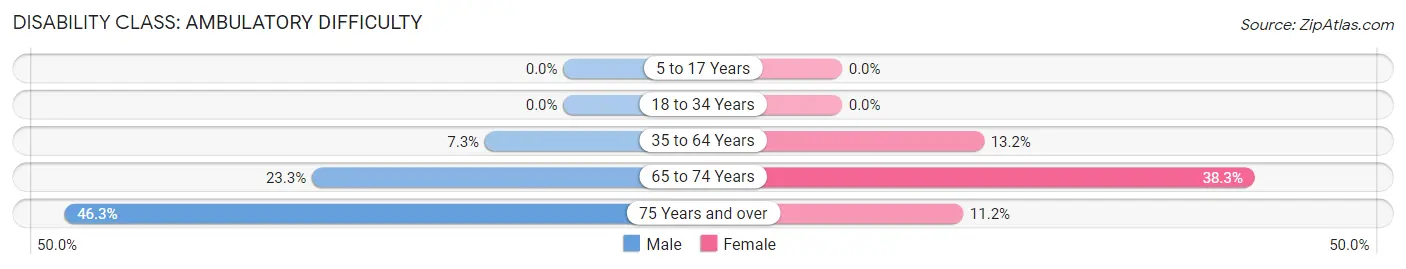
| Age Bracket | Male | Female |
| 5 to 17 Years | 0 (0.0%) | 0 (0.0%) |
| 18 to 34 Years | 0 (0.0%) | 0 (0.0%) |
| 35 to 64 Years | 23 (7.3%) | 44 (13.2%) |
| 65 to 74 Years | 21 (23.3%) | 41 (38.3%) |
| 75 Years and over | 44 (46.3%) | 10 (11.2%) |
Disability Class: Self-Care Difficulty
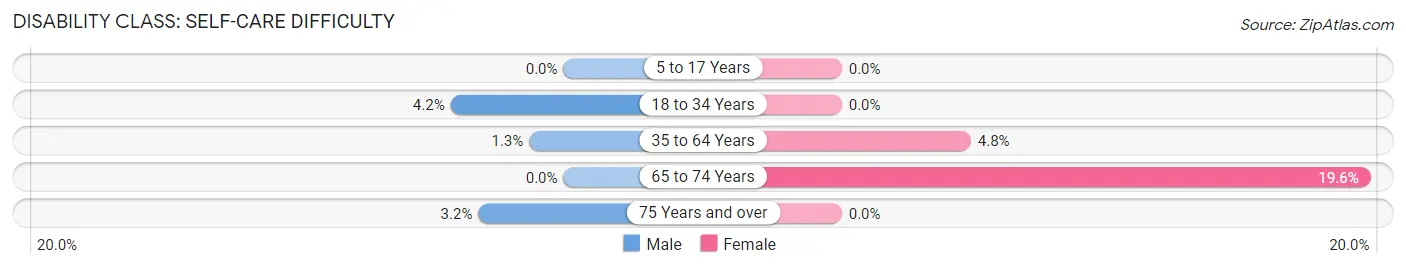
| Age Bracket | Male | Female |
| 5 to 17 Years | 0 (0.0%) | 0 (0.0%) |
| 18 to 34 Years | 9 (4.2%) | 0 (0.0%) |
| 35 to 64 Years | 4 (1.3%) | 16 (4.8%) |
| 65 to 74 Years | 0 (0.0%) | 21 (19.6%) |
| 75 Years and over | 3 (3.2%) | 0 (0.0%) |
Technology Access in Tracy
Computing Device Access in Tracy
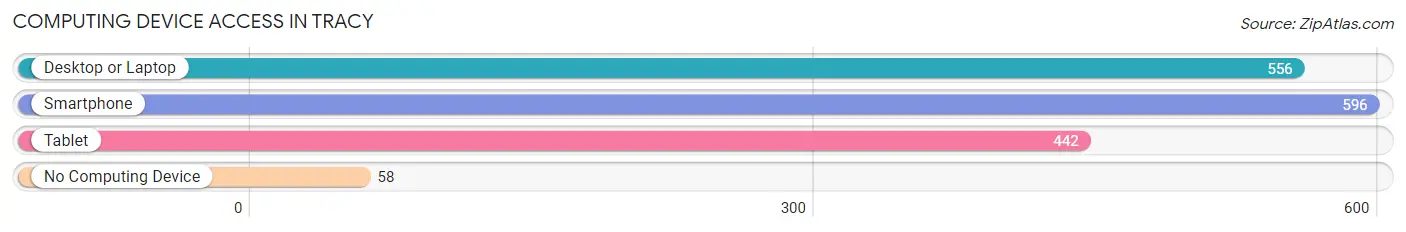
| Device Type | # Households | % Households |
| Desktop or Laptop | 556 | 74.8% |
| Smartphone | 596 | 80.2% |
| Tablet | 442 | 59.5% |
| No Computing Device | 58 | 7.8% |
| Total | 743 | 100.0% |
Internet Access in Tracy
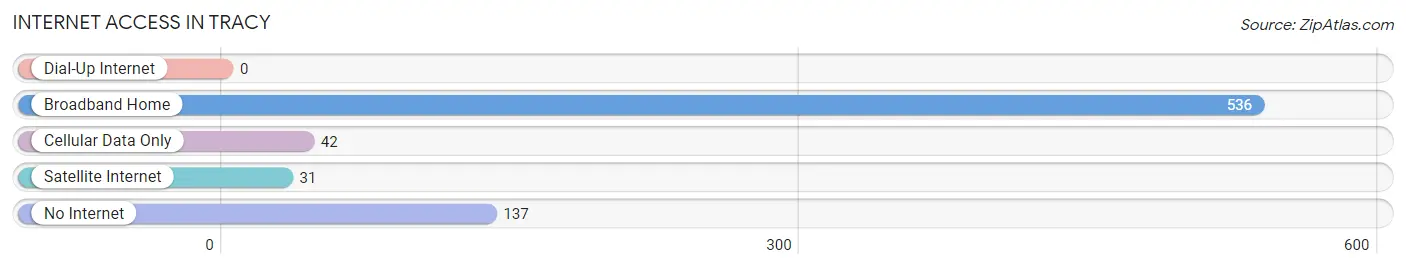
| Internet Type | # Households | % Households |
| Dial-Up Internet | 0 | 0.0% |
| Broadband Home | 536 | 72.1% |
| Cellular Data Only | 42 | 5.7% |
| Satellite Internet | 31 | 4.2% |
| No Internet | 137 | 18.4% |
| Total | 743 | 100.0% |
Tracy Summary
Tracy, Minnesota is a small city located in the southwestern corner of the state, in Lyon County. It is situated on the banks of the Cottonwood River, and is surrounded by rolling hills and farmland. The city has a population of 2,717, according to the 2010 census, and is the county seat of Lyon County.
Tracy was founded in 1871 by a group of settlers from Wisconsin. The city was named after a local Native American chief, Chief Tracy. The city was incorporated in 1881, and has since grown to become a thriving community.
Geography
Tracy is located in the southwestern corner of Minnesota, in Lyon County. It is situated on the banks of the Cottonwood River, and is surrounded by rolling hills and farmland. The city has a total area of 2.2 square miles, all of which is land. The city is located approximately 50 miles southwest of the state capital, St. Paul.
The climate in Tracy is typical of the Midwest, with hot summers and cold winters. The average temperature in the summer is around 75 degrees Fahrenheit, and the average temperature in the winter is around 20 degrees Fahrenheit. The city receives an average of 28 inches of precipitation per year.
Economy
Tracy’s economy is largely based on agriculture and manufacturing. The city is home to several large agricultural companies, including Cargill, Land O’Lakes, and CHS. The city also has several manufacturing companies, including Tracy Manufacturing, which produces agricultural equipment, and Tracy Plastics, which produces plastic products.
The city also has a thriving retail sector, with several stores and restaurants located in the downtown area. The city is also home to several banks, including Wells Fargo and US Bank.
Demographics
According to the 2010 census, Tracy has a population of 2,717. The racial makeup of the city is 95.3% White, 0.7% African American, 0.3% Native American, 0.3% Asian, 0.1% Pacific Islander, 1.2% from other races, and 2.3% from two or more races. Hispanic or Latino of any race were 3.2% of the population.
The median income for a household in Tracy is $41,944, and the median income for a family is $50,917. The per capita income for the city is $20,845. About 8.3% of families and 10.2% of the population were below the poverty line, including 13.2% of those under age 18 and 8.2% of those age 65 or over.
Tracy is a small city with a rich history and a vibrant economy. The city is home to several large agricultural and manufacturing companies, as well as a thriving retail sector. The city has a diverse population, with a median income that is slightly higher than the state average. Tracy is a great place to live, work, and raise a family.
Common Questions
What is Per Capita Income in Tracy?
Per Capita income in Tracy is $28,717.
What is the Median Family Income in Tracy?
Median Family Income in Tracy is $72,228.
What is the Median Household income in Tracy?
Median Household Income in Tracy is $63,201.
What is Income or Wage Gap in Tracy?
Income or Wage Gap in Tracy is 14.5%.
Women in Tracy earn 85.5 cents for every dollar earned by a man.
What is Family Income Deficit in Tracy?
Family Income Deficit in Tracy is $8,128.
Families that are below poverty line in Tracy earn $8,128 less on average than the poverty threshold level.
What is Inequality or Gini Index in Tracy?
Inequality or Gini Index in Tracy is 0.41.
What is the Total Population of Tracy?
Total Population of Tracy is 2,006.
What is the Total Male Population of Tracy?
Total Male Population of Tracy is 1,026.
What is the Total Female Population of Tracy?
Total Female Population of Tracy is 980.
What is the Ratio of Males per 100 Females in Tracy?
There are 104.69 Males per 100 Females in Tracy.
What is the Ratio of Females per 100 Males in Tracy?
There are 95.52 Females per 100 Males in Tracy.
What is the Median Population Age in Tracy?
Median Population Age in Tracy is 39.0 Years.
What is the Average Family Size in Tracy
Average Family Size in Tracy is 3.4 People.
What is the Average Household Size in Tracy
Average Household Size in Tracy is 2.6 People.
How Large is the Labor Force in Tracy?
There are 1,010 People in the Labor Forcein in Tracy.
What is the Percentage of People in the Labor Force in Tracy?
64.9% of People are in the Labor Force in Tracy.
What is the Unemployment Rate in Tracy?
Unemployment Rate in Tracy is 3.4%.