Inkster, ND Map & Demographics
Inkster Map
Inkster Overview
$53,592
PER CAPITA INCOME
$148,750
AVG FAMILY INCOME
0.40
INEQUALITY / GINI INDEX
26
TOTAL POPULATION
15
MALE POPULATION
11
FEMALE POPULATION
136.36
MALES / 100 FEMALES
73.33
FEMALES / 100 MALES
48.0
MEDIAN AGE
3.0
AVG FAMILY SIZE
2.2
AVG HOUSEHOLD SIZE
17
LABOR FORCE [ PEOPLE ]
70.8%
PERCENT IN LABOR FORCE
Inkster Zip Codes
Inkster Area Codes
Income in Inkster
Income Overview in Inkster
| Characteristic | Number | Measure |
| Per Capita Income | 26 | $53,592 |
| Median Family Income | 6 | $148,750 |
| Mean Family Income | 6 | $134,600 |
| Median Household Income | 12 | $0 |
| Mean Household Income | 12 | $87,375 |
| Income Deficit | 6 | $0 |
| Wage / Income Gap (%) | 26 | 0.00% |
| Wage / Income Gap ($) | 26 | 100.00¢ per $1 |
| Gini / Inequality Index | 26 | 0.40 |
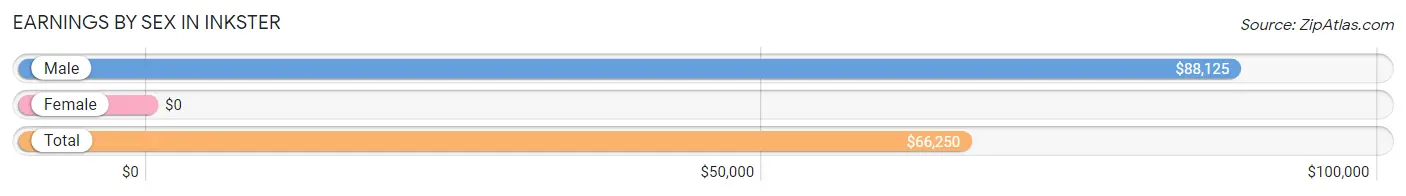
Earnings by Sex in Inkster
| Sex | Number | Average Earnings |
| Male | 11 (64.7%) | $88,125 |
| Female | 6 (35.3%) | $0 |
| Total | 17 (100.0%) | $66,250 |
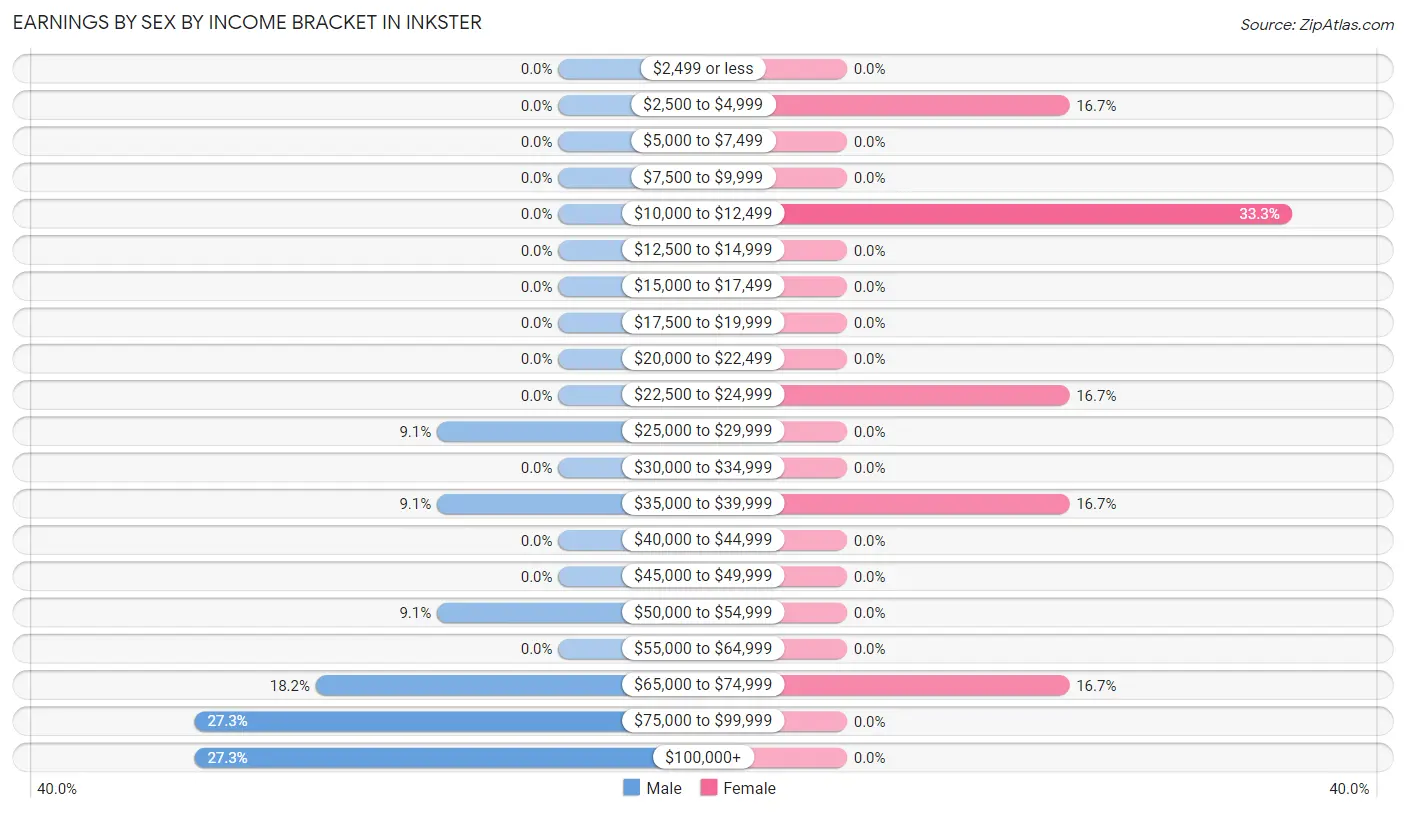
Earnings by Sex by Income Bracket in Inkster
The most common earnings brackets in Inkster are $75,000 to $99,999 for men (3 | 27.3%) and $10,000 to $12,499 for women (2 | 33.3%).
| Income | Male | Female |
| $2,499 or less | 0 (0.0%) | 0 (0.0%) |
| $2,500 to $4,999 | 0 (0.0%) | 1 (16.7%) |
| $5,000 to $7,499 | 0 (0.0%) | 0 (0.0%) |
| $7,500 to $9,999 | 0 (0.0%) | 0 (0.0%) |
| $10,000 to $12,499 | 0 (0.0%) | 2 (33.3%) |
| $12,500 to $14,999 | 0 (0.0%) | 0 (0.0%) |
| $15,000 to $17,499 | 0 (0.0%) | 0 (0.0%) |
| $17,500 to $19,999 | 0 (0.0%) | 0 (0.0%) |
| $20,000 to $22,499 | 0 (0.0%) | 0 (0.0%) |
| $22,500 to $24,999 | 0 (0.0%) | 1 (16.7%) |
| $25,000 to $29,999 | 1 (9.1%) | 0 (0.0%) |
| $30,000 to $34,999 | 0 (0.0%) | 0 (0.0%) |
| $35,000 to $39,999 | 1 (9.1%) | 1 (16.7%) |
| $40,000 to $44,999 | 0 (0.0%) | 0 (0.0%) |
| $45,000 to $49,999 | 0 (0.0%) | 0 (0.0%) |
| $50,000 to $54,999 | 1 (9.1%) | 0 (0.0%) |
| $55,000 to $64,999 | 0 (0.0%) | 0 (0.0%) |
| $65,000 to $74,999 | 2 (18.2%) | 1 (16.7%) |
| $75,000 to $99,999 | 3 (27.3%) | 0 (0.0%) |
| $100,000+ | 3 (27.3%) | 0 (0.0%) |
| Total | 11 (100.0%) | 6 (100.0%) |
Earnings by Sex by Educational Attainment in Inkster
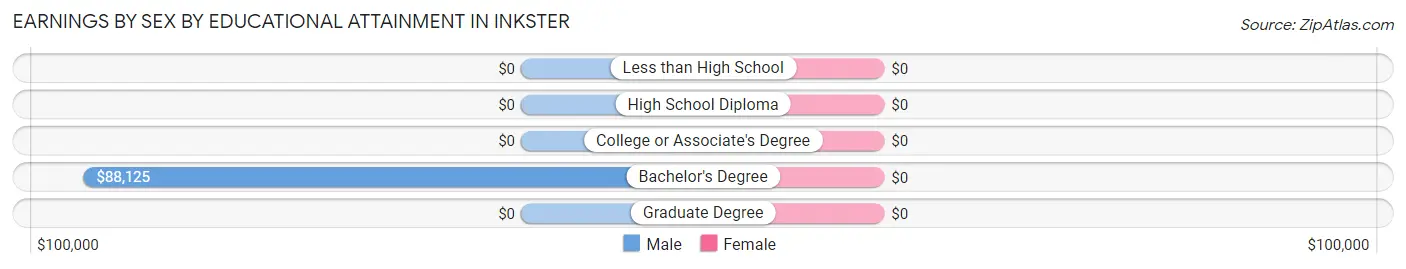
| Educational Attainment | Male Income | Female Income |
| Less than High School | - | - |
| High School Diploma | - | - |
| College or Associate's Degree | - | - |
| Bachelor's Degree | $88,125 | $0 |
| Graduate Degree | - | - |
| Total | $88,750 | $0 |
Family Income in Inkster
Family Income Brackets in Inkster
According to the Inkster family income data, there are 3 families falling into the $150,000 to $199,999 income range, which is the most common income bracket and makes up 50.0% of all families.
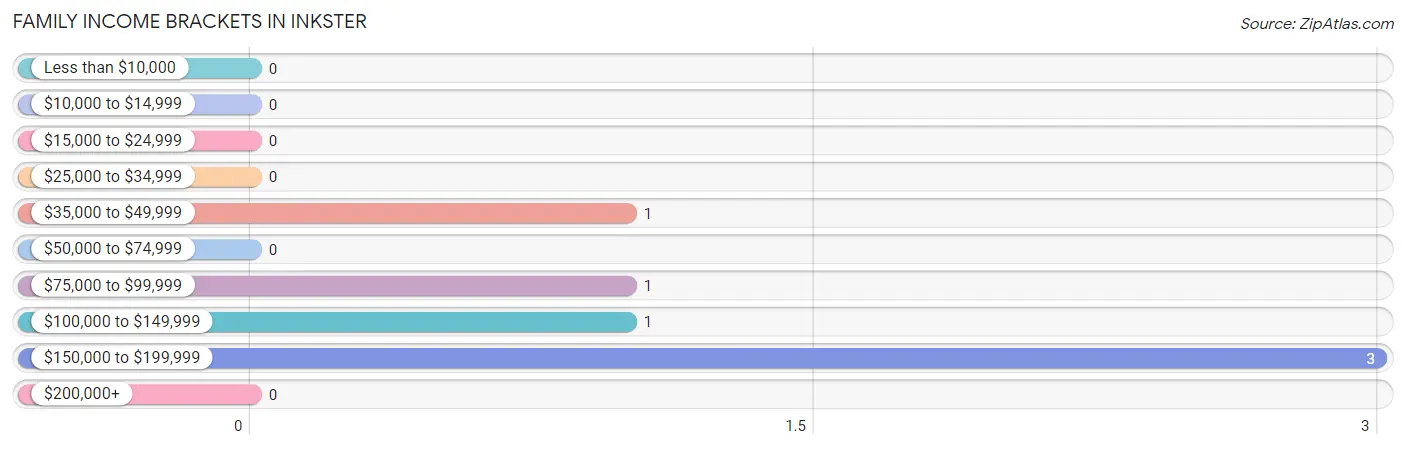
| Income Bracket | # Families | % Families |
| Less than $10,000 | 0 | 0.0% |
| $10,000 to $14,999 | 0 | 0.0% |
| $15,000 to $24,999 | 0 | 0.0% |
| $25,000 to $34,999 | 0 | 0.0% |
| $35,000 to $49,999 | 1 | 16.7% |
| $50,000 to $74,999 | 0 | 0.0% |
| $75,000 to $99,999 | 1 | 16.7% |
| $100,000 to $149,999 | 1 | 16.7% |
| $150,000 to $199,999 | 3 | 50.0% |
| $200,000+ | 0 | 0.0% |
Family Income by Famaliy Size in Inkster
2-person families (5 | 83.3%) account for the highest median family income in Inkster with $153,750 per family, while 2-person families (5 | 83.3%) have the highest median income of $76,875 per family member.
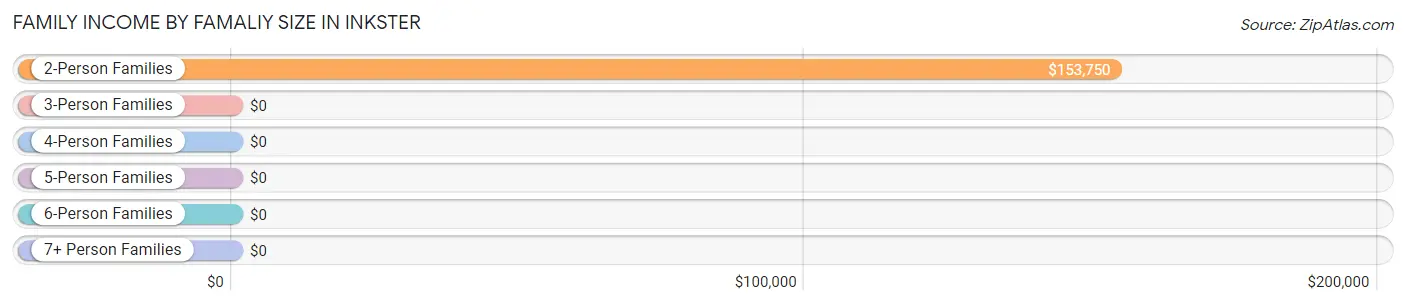
| Income Bracket | # Families | Median Income |
| 2-Person Families | 5 (83.3%) | $153,750 |
| 3-Person Families | 1 (16.7%) | $0 |
| 4-Person Families | 0 (0.0%) | $0 |
| 5-Person Families | 0 (0.0%) | $0 |
| 6-Person Families | 0 (0.0%) | $0 |
| 7+ Person Families | 0 (0.0%) | $0 |
| Total | 6 (100.0%) | $148,750 |
Family Income by Number of Earners in Inkster
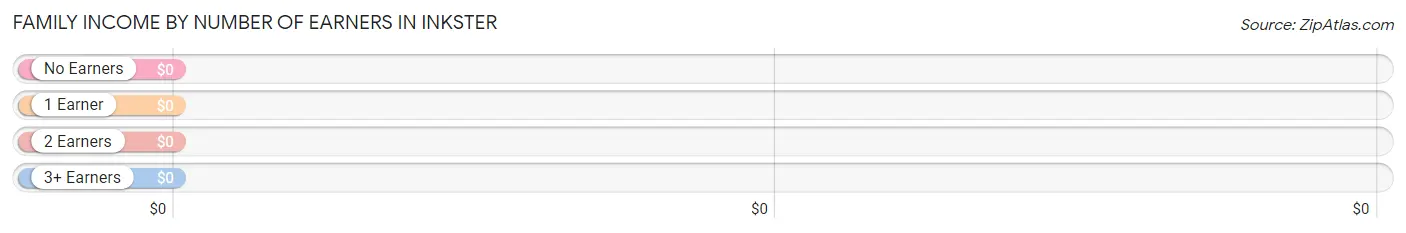
| Number of Earners | # Families | Median Income |
| No Earners | 0 (0.0%) | $0 |
| 1 Earner | 3 (50.0%) | $0 |
| 2 Earners | 3 (50.0%) | $0 |
| 3+ Earners | 0 (0.0%) | $0 |
| Total | 6 (100.0%) | $148,750 |
Household Income in Inkster
Household Income Brackets in Inkster
With 3 households falling in the category, the $35,000 to $49,999 income range is the most frequent in Inkster, accounting for 25.0% of all households.
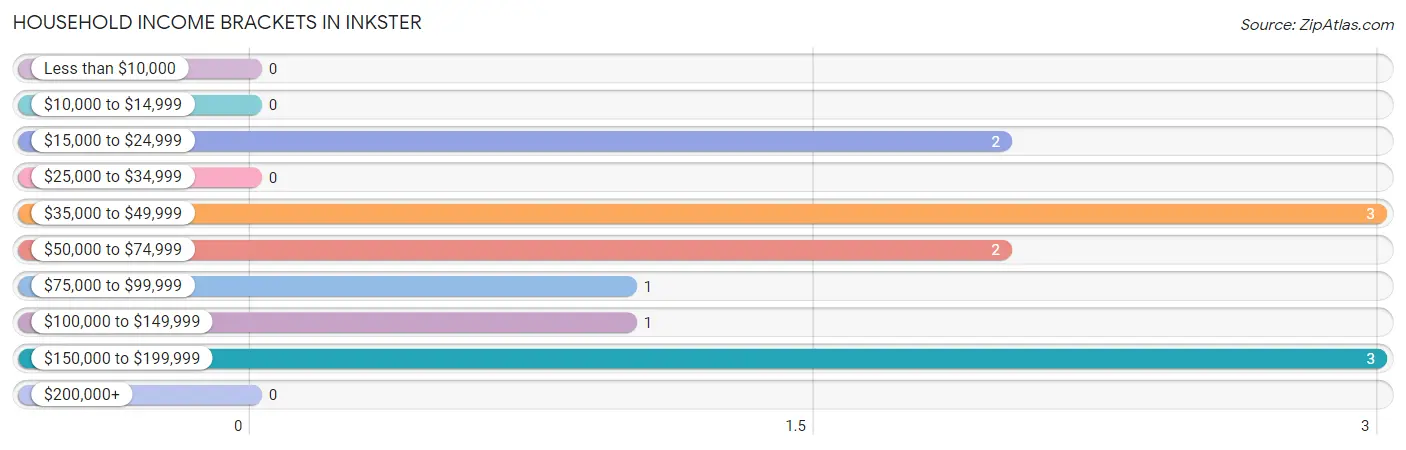
| Income Bracket | # Households | % Households |
| Less than $10,000 | 0 | 0.0% |
| $10,000 to $14,999 | 0 | 0.0% |
| $15,000 to $24,999 | 2 | 16.7% |
| $25,000 to $34,999 | 0 | 0.0% |
| $35,000 to $49,999 | 3 | 25.0% |
| $50,000 to $74,999 | 2 | 16.7% |
| $75,000 to $99,999 | 1 | 8.3% |
| $100,000 to $149,999 | 1 | 8.3% |
| $150,000 to $199,999 | 3 | 25.0% |
| $200,000+ | 0 | 0.0% |
Household Income by Householder Age in Inkster
| Income Bracket | # Households | Median Income |
| 15 to 24 Years | 1 (8.3%) | $0 |
| 25 to 44 Years | 2 (16.7%) | $0 |
| 45 to 64 Years | 4 (33.3%) | $0 |
| 65+ Years | 5 (41.7%) | $0 |
| Total | 12 (100.0%) | $0 |
Poverty in Inkster
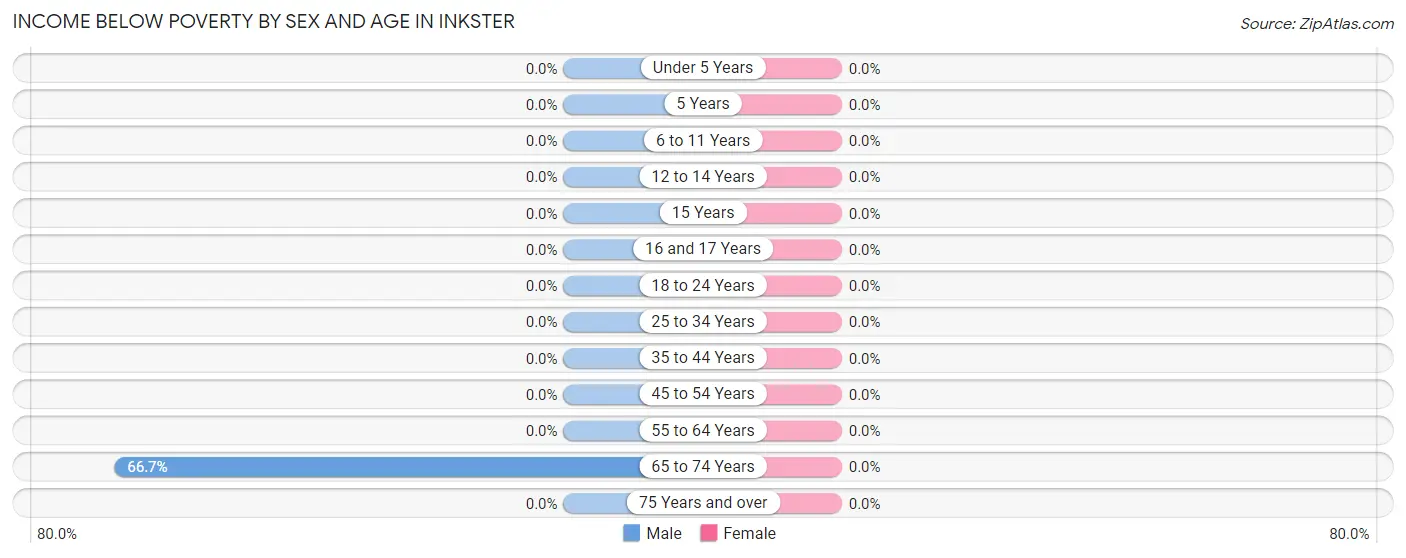
Income Below Poverty by Sex and Age in Inkster
| Age Bracket | Male | Female |
| Under 5 Years | 0 (0.0%) | 0 (0.0%) |
| 5 Years | 0 (0.0%) | 0 (0.0%) |
| 6 to 11 Years | 0 (0.0%) | 0 (0.0%) |
| 12 to 14 Years | 0 (0.0%) | 0 (0.0%) |
| 15 Years | 0 (0.0%) | 0 (0.0%) |
| 16 and 17 Years | 0 (0.0%) | 0 (0.0%) |
| 18 to 24 Years | 0 (0.0%) | 0 (0.0%) |
| 25 to 34 Years | 0 (0.0%) | 0 (0.0%) |
| 35 to 44 Years | 0 (0.0%) | 0 (0.0%) |
| 45 to 54 Years | 0 (0.0%) | 0 (0.0%) |
| 55 to 64 Years | 0 (0.0%) | 0 (0.0%) |
| 65 to 74 Years | 2 (66.7%) | 0 (0.0%) |
| 75 Years and over | 0 (0.0%) | 0 (0.0%) |
| Total | 2 (13.3%) | 0 (0.0%) |
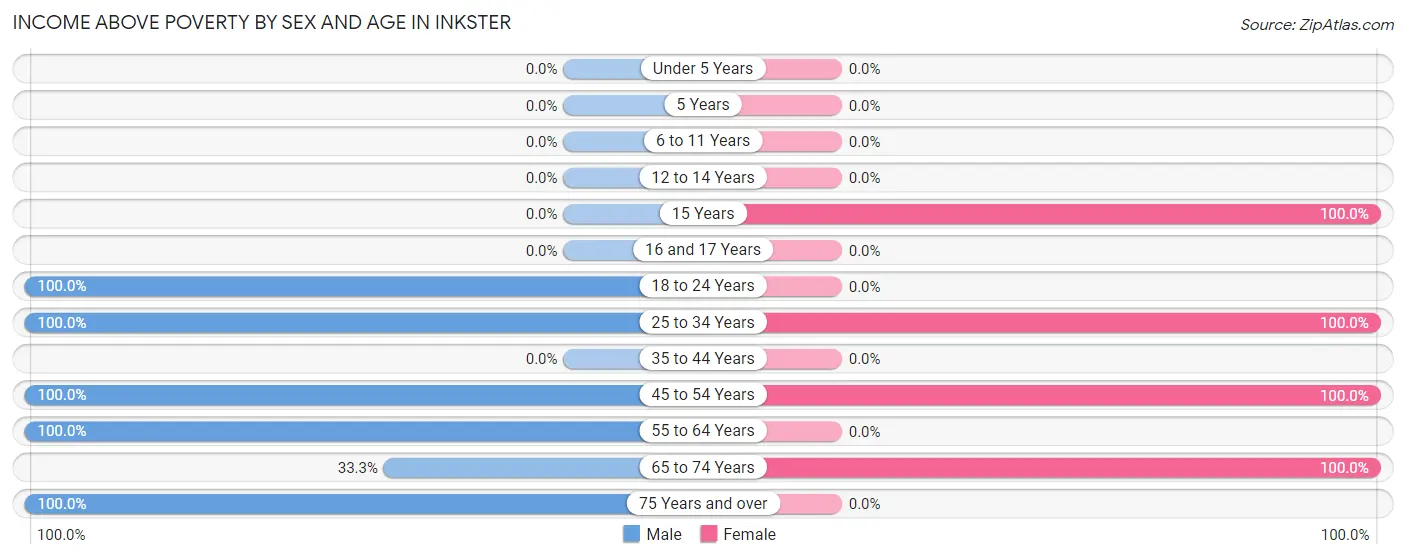
Income Above Poverty by Sex and Age in Inkster
According to the poverty statistics in Inkster, males aged 18 to 24 years and females aged 15 years are the age groups that are most secure financially, with 100.0% of males and 100.0% of females in these age groups living above the poverty line.
| Age Bracket | Male | Female |
| Under 5 Years | 0 (0.0%) | 0 (0.0%) |
| 5 Years | 0 (0.0%) | 0 (0.0%) |
| 6 to 11 Years | 0 (0.0%) | 0 (0.0%) |
| 12 to 14 Years | 0 (0.0%) | 0 (0.0%) |
| 15 Years | 0 (0.0%) | 2 (100.0%) |
| 16 and 17 Years | 0 (0.0%) | 0 (0.0%) |
| 18 to 24 Years | 1 (100.0%) | 0 (0.0%) |
| 25 to 34 Years | 3 (100.0%) | 4 (100.0%) |
| 35 to 44 Years | 0 (0.0%) | 0 (0.0%) |
| 45 to 54 Years | 5 (100.0%) | 4 (100.0%) |
| 55 to 64 Years | 1 (100.0%) | 0 (0.0%) |
| 65 to 74 Years | 1 (33.3%) | 1 (100.0%) |
| 75 Years and over | 2 (100.0%) | 0 (0.0%) |
| Total | 13 (86.7%) | 11 (100.0%) |
Income Below Poverty Among Married-Couple Families in Inkster
| Children | Above Poverty | Below Poverty |
| No Children | 5 (100.0%) | 0 (0.0%) |
| 1 or 2 Children | 1 (100.0%) | 0 (0.0%) |
| 3 or 4 Children | 0 (0.0%) | 0 (0.0%) |
| 5 or more Children | 0 (0.0%) | 0 (0.0%) |
| Total | 6 (100.0%) | 0 (0.0%) |
Income Below Poverty Among Single-Parent Households in Inkster
| Children | Single Father | Single Mother |
| No Children | 0 (0.0%) | 0 (0.0%) |
| 1 or 2 Children | 0 (0.0%) | 0 (0.0%) |
| 3 or 4 Children | 0 (0.0%) | 0 (0.0%) |
| 5 or more Children | 0 (0.0%) | 0 (0.0%) |
| Total | 0 (0.0%) | 0 (0.0%) |
Income Below Poverty Among Married-Couple vs Single-Parent Households in Inkster
| Children | Married-Couple Families | Single-Parent Households |
| No Children | 0 (0.0%) | 0 (0.0%) |
| 1 or 2 Children | 0 (0.0%) | 0 (0.0%) |
| 3 or 4 Children | 0 (0.0%) | 0 (0.0%) |
| 5 or more Children | 0 (0.0%) | 0 (0.0%) |
| Total | 0 (0.0%) | 0 (0.0%) |
Race in Inkster
The most populous races in Inkster are White / Caucasian (21 | 80.8%), and Asian (5 | 19.2%).
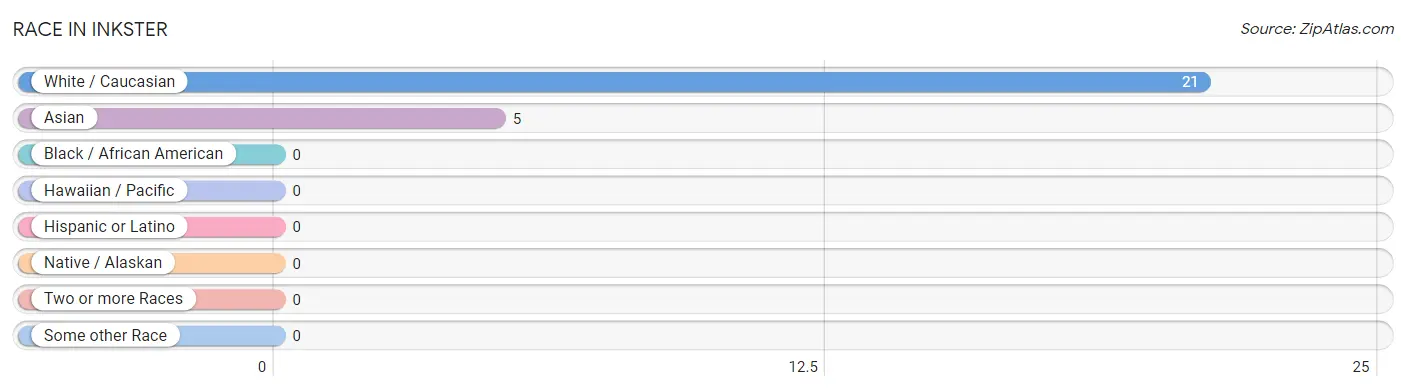
| Race | # Population | % Population |
| Asian | 5 | 19.2% |
| Black / African American | 0 | 0.0% |
| Hawaiian / Pacific | 0 | 0.0% |
| Hispanic or Latino | 0 | 0.0% |
| Native / Alaskan | 0 | 0.0% |
| White / Caucasian | 21 | 80.8% |
| Two or more Races | 0 | 0.0% |
| Some other Race | 0 | 0.0% |
| Total | 26 | 100.0% |
Ancestry in Inkster
The most populous ancestries reported in Inkster are Norwegian (9 | 34.6%), Bangladeshi (5 | 19.2%), English (5 | 19.2%), German (4 | 15.4%), and Irish (4 | 15.4%), together accounting for 103.8% of all Inkster residents.
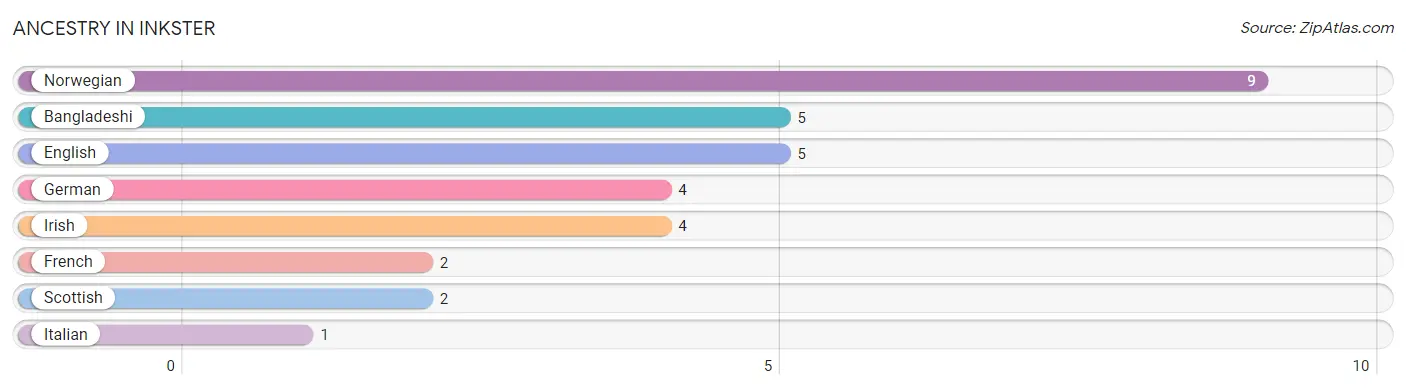
| Ancestry | # Population | % Population |
| Bangladeshi | 5 | 19.2% |
| English | 5 | 19.2% |
| French | 2 | 7.7% |
| German | 4 | 15.4% |
| Irish | 4 | 15.4% |
| Italian | 1 | 3.8% |
| Norwegian | 9 | 34.6% |
| Scottish | 2 | 7.7% | View All 8 Rows |
Immigrants in Inkster
The most numerous immigrant groups reported in Inkster came from Asia (5 | 19.2%), Laos (5 | 19.2%), and South Eastern Asia (5 | 19.2%), together accounting for 57.7% of all Inkster residents.
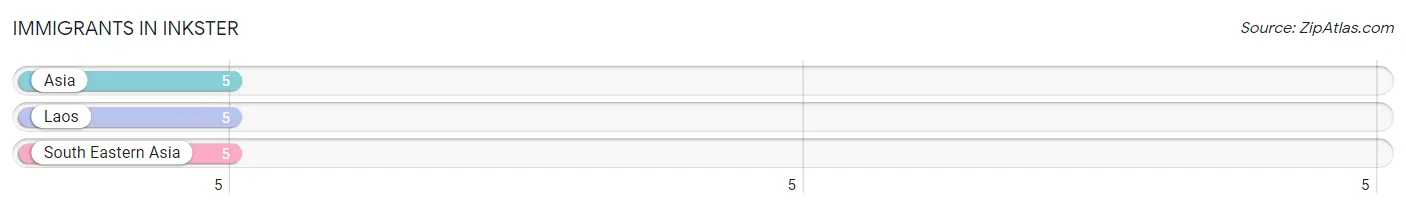
| Immigration Origin | # Population | % Population |
| Asia | 5 | 19.2% |
| Laos | 5 | 19.2% |
| South Eastern Asia | 5 | 19.2% | View All 3 Rows |
Sex and Age in Inkster
Sex and Age in Inkster
The most populous age groups in Inkster are 50 to 54 Years (3 | 20.0%) for men and 45 to 49 Years (4 | 36.4%) for women.
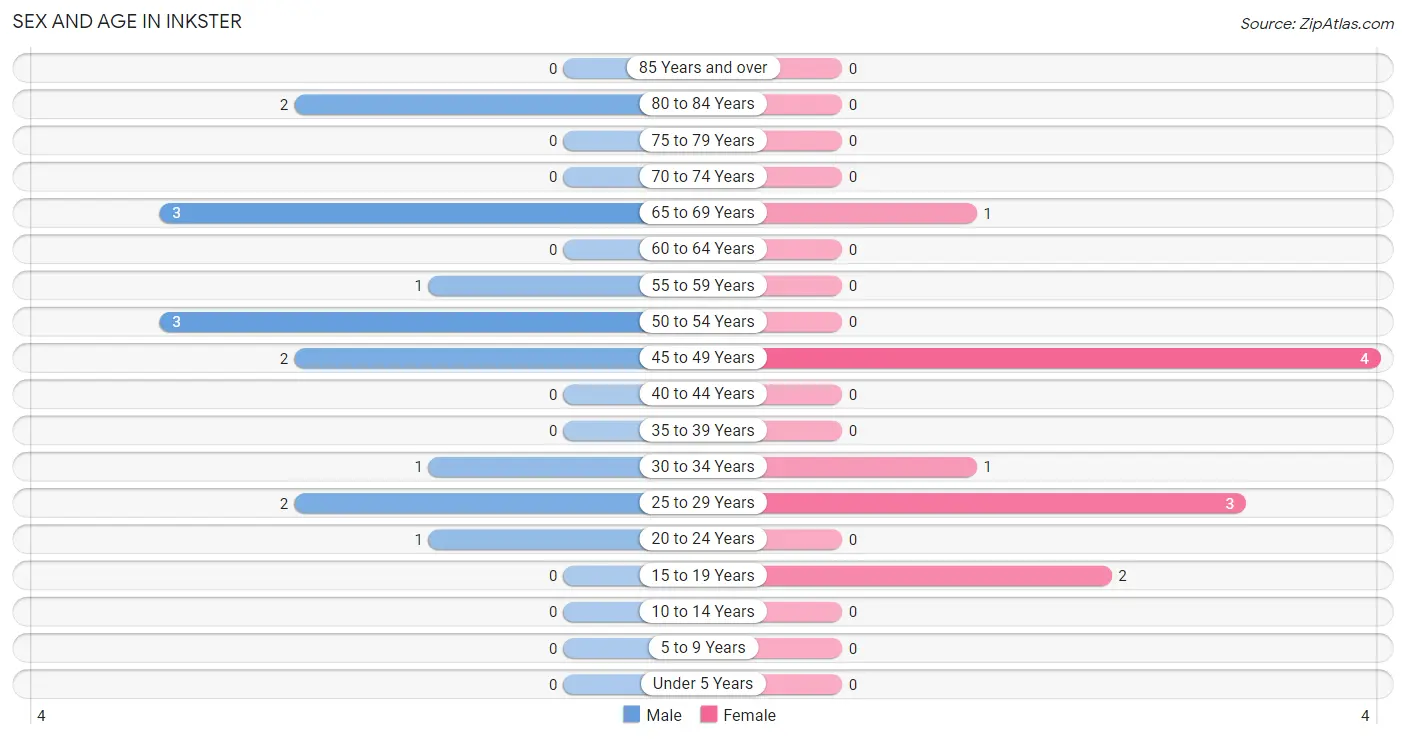
| Age Bracket | Male | Female |
| Under 5 Years | 0 (0.0%) | 0 (0.0%) |
| 5 to 9 Years | 0 (0.0%) | 0 (0.0%) |
| 10 to 14 Years | 0 (0.0%) | 0 (0.0%) |
| 15 to 19 Years | 0 (0.0%) | 2 (18.2%) |
| 20 to 24 Years | 1 (6.7%) | 0 (0.0%) |
| 25 to 29 Years | 2 (13.3%) | 3 (27.3%) |
| 30 to 34 Years | 1 (6.7%) | 1 (9.1%) |
| 35 to 39 Years | 0 (0.0%) | 0 (0.0%) |
| 40 to 44 Years | 0 (0.0%) | 0 (0.0%) |
| 45 to 49 Years | 2 (13.3%) | 4 (36.4%) |
| 50 to 54 Years | 3 (20.0%) | 0 (0.0%) |
| 55 to 59 Years | 1 (6.7%) | 0 (0.0%) |
| 60 to 64 Years | 0 (0.0%) | 0 (0.0%) |
| 65 to 69 Years | 3 (20.0%) | 1 (9.1%) |
| 70 to 74 Years | 0 (0.0%) | 0 (0.0%) |
| 75 to 79 Years | 0 (0.0%) | 0 (0.0%) |
| 80 to 84 Years | 2 (13.3%) | 0 (0.0%) |
| 85 Years and over | 0 (0.0%) | 0 (0.0%) |
| Total | 15 (100.0%) | 11 (100.0%) |
Families and Households in Inkster
Median Family Size in Inkster
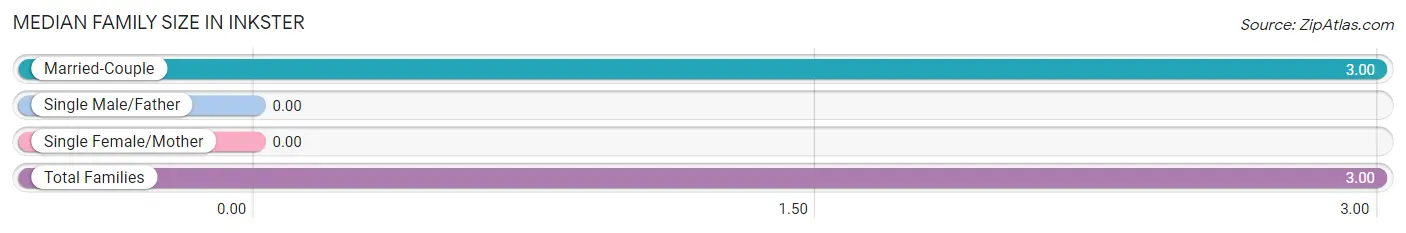
| Family Type | # Families | Family Size |
| Married-Couple | 6 (100.0%) | 3.00 |
| Single Male/Father | 0 (0.0%) | - |
| Single Female/Mother | 0 (0.0%) | - |
| Total Families | 6 (100.0%) | 3.00 |
Median Household Size in Inkster
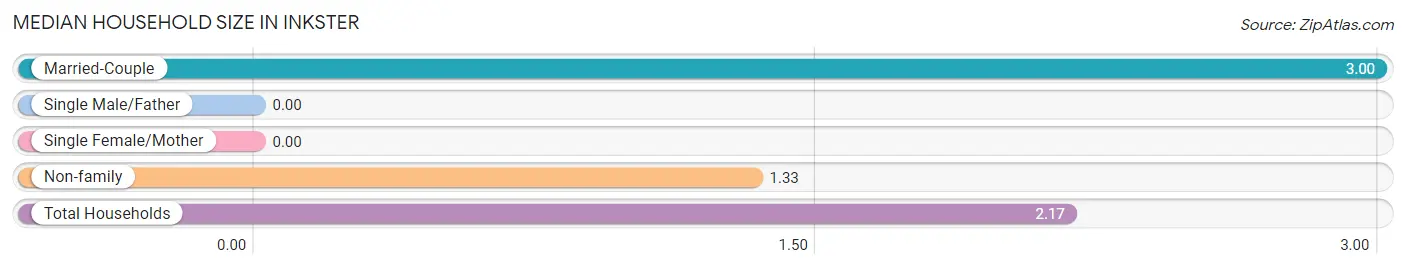
| Household Type | # Households | Household Size |
| Married-Couple | 6 (50.0%) | 3.00 |
| Single Male/Father | 0 (0.0%) | - |
| Single Female/Mother | 0 (0.0%) | - |
| Non-family | 6 (50.0%) | 1.33 |
| Total Households | 12 (100.0%) | 2.17 |
Household Size by Marriage Status in Inkster
Out of a total of 12 households in Inkster, 6 (50.0%) are family households, while 6 (50.0%) are nonfamily households. The most numerous type of family households are 2-person households, comprising 5, and the most common type of nonfamily households are 1-person households, comprising 3.
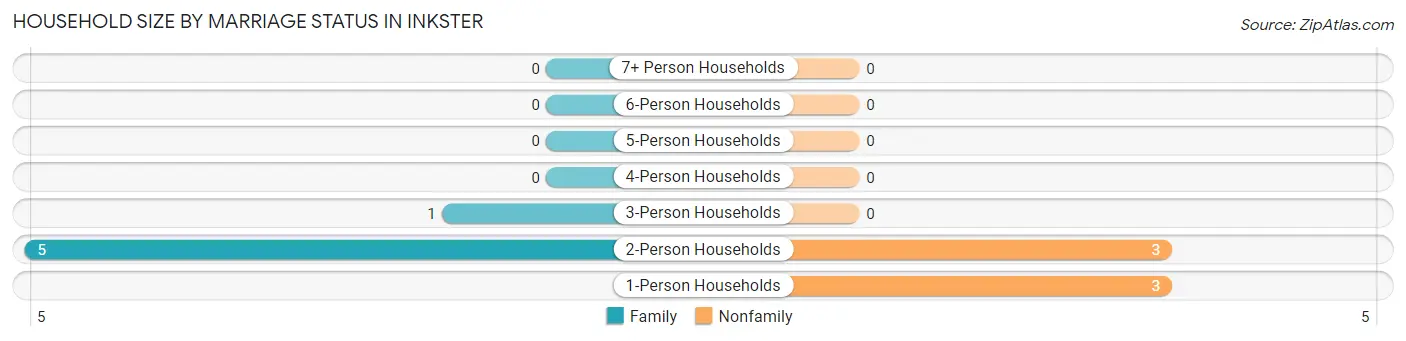
| Household Size | Family Households | Nonfamily Households |
| 1-Person Households | - | 3 (25.0%) |
| 2-Person Households | 5 (41.7%) | 3 (25.0%) |
| 3-Person Households | 1 (8.3%) | 0 (0.0%) |
| 4-Person Households | 0 (0.0%) | 0 (0.0%) |
| 5-Person Households | 0 (0.0%) | 0 (0.0%) |
| 6-Person Households | 0 (0.0%) | 0 (0.0%) |
| 7+ Person Households | 0 (0.0%) | 0 (0.0%) |
| Total | 6 (50.0%) | 6 (50.0%) |
Female Fertility in Inkster
Fertility by Age in Inkster
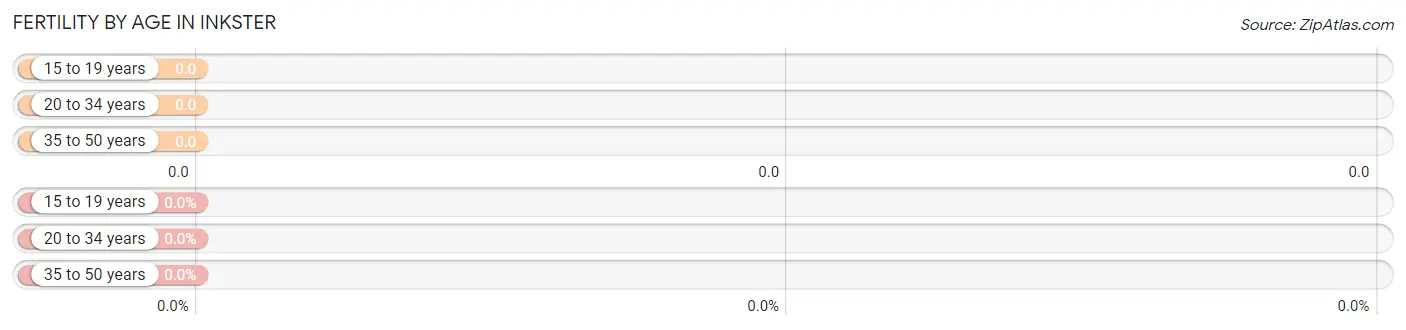
| Age Bracket | Women with Births | Births / 1,000 Women |
| 15 to 19 years | 0 (0.0%) | 0.0 |
| 20 to 34 years | 0 (0.0%) | 0.0 |
| 35 to 50 years | 0 (0.0%) | 0.0 |
| Total | 0 (0.0%) | 0.0 |
Fertility by Age by Marriage Status in Inkster
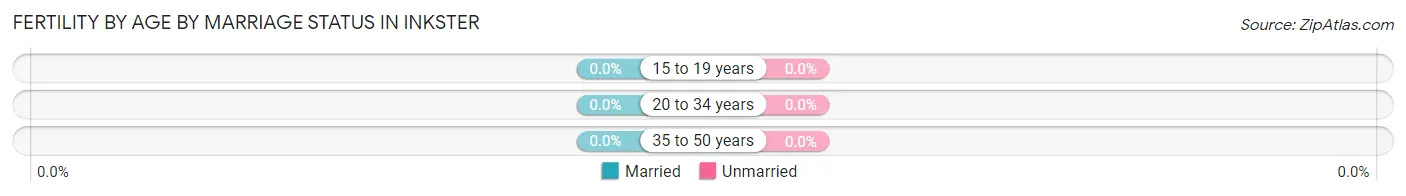
| Age Bracket | Married | Unmarried |
| 15 to 19 years | 0 (0.0%) | 0 (0.0%) |
| 20 to 34 years | 0 (0.0%) | 0 (0.0%) |
| 35 to 50 years | 0 (0.0%) | 0 (0.0%) |
| Total | 0 (0.0%) | 0 (0.0%) |
Fertility by Education in Inkster
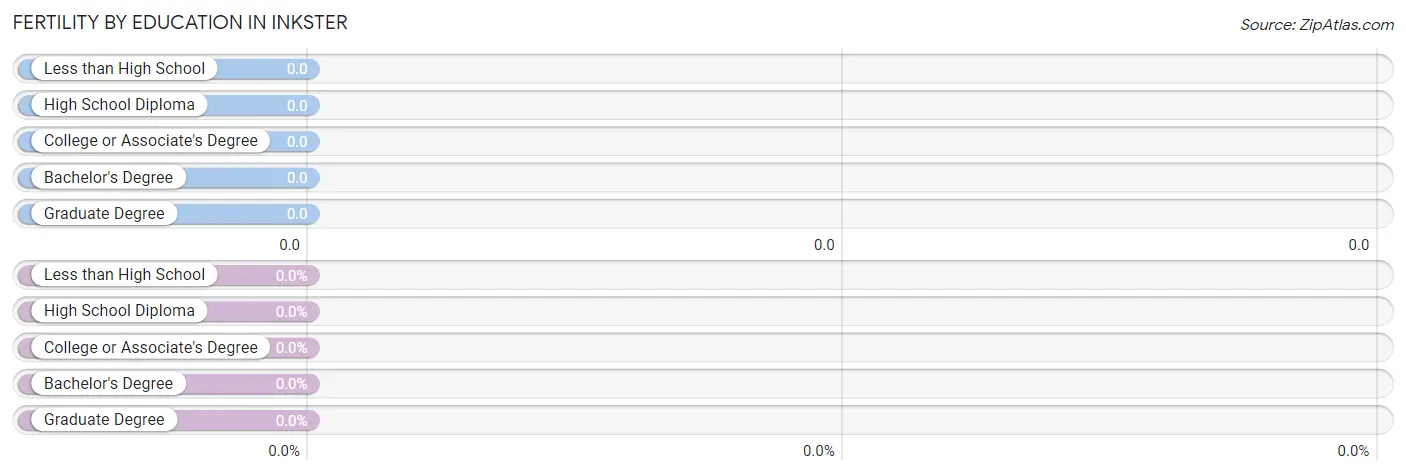
| Educational Attainment | Women with Births | Births / 1,000 Women |
| Less than High School | 0 (0.0%) | 0.0 |
| High School Diploma | 0 (0.0%) | 0.0 |
| College or Associate's Degree | 0 (0.0%) | 0.0 |
| Bachelor's Degree | 0 (0.0%) | 0.0 |
| Graduate Degree | 0 (0.0%) | 0.0 |
| Total | 0 (0.0%) | 0.0 |
Fertility by Education by Marriage Status in Inkster
| Educational Attainment | Married | Unmarried |
| Less than High School | 0 (0.0%) | 0 (0.0%) |
| High School Diploma | 0 (0.0%) | 0 (0.0%) |
| College or Associate's Degree | 0 (0.0%) | 0 (0.0%) |
| Bachelor's Degree | 0 (0.0%) | 0 (0.0%) |
| Graduate Degree | 0 (0.0%) | 0 (0.0%) |
| Total | 0 (0.0%) | 0 (0.0%) |
Employment Characteristics in Inkster
Employment by Class of Employer in Inkster
Among the 17 employed individuals in Inkster, private company employees (8 | 47.1%), not-for-profit organizations (5 | 29.4%), and state government employees (2 | 11.8%) make up the most common classes of employment.
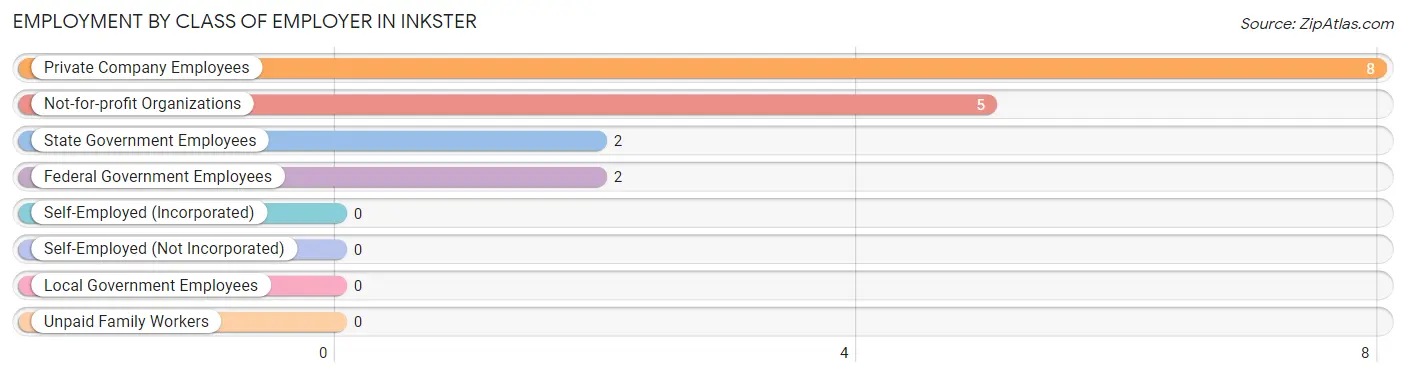
| Employer Class | # Employees | % Employees |
| Private Company Employees | 8 | 47.1% |
| Self-Employed (Incorporated) | 0 | 0.0% |
| Self-Employed (Not Incorporated) | 0 | 0.0% |
| Not-for-profit Organizations | 5 | 29.4% |
| Local Government Employees | 0 | 0.0% |
| State Government Employees | 2 | 11.8% |
| Federal Government Employees | 2 | 11.8% |
| Unpaid Family Workers | 0 | 0.0% |
| Total | 17 | 100.0% |
Employment Status by Age in Inkster
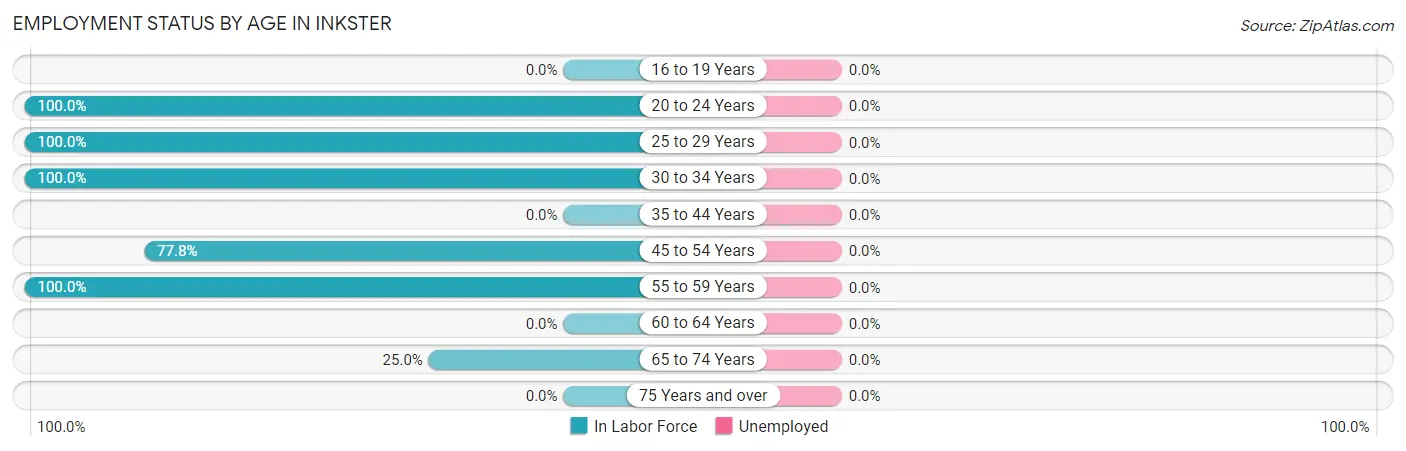
| Age Bracket | In Labor Force | Unemployed |
| 16 to 19 Years | 0 (0.0%) | 0 (0.0%) |
| 20 to 24 Years | 1 (100.0%) | 0 (0.0%) |
| 25 to 29 Years | 5 (100.0%) | 0 (0.0%) |
| 30 to 34 Years | 2 (100.0%) | 0 (0.0%) |
| 35 to 44 Years | 0 (0.0%) | 0 (0.0%) |
| 45 to 54 Years | 7 (77.8%) | 0 (0.0%) |
| 55 to 59 Years | 1 (100.0%) | 0 (0.0%) |
| 60 to 64 Years | 0 (0.0%) | 0 (0.0%) |
| 65 to 74 Years | 1 (25.0%) | 0 (0.0%) |
| 75 Years and over | 0 (0.0%) | 0 (0.0%) |
| Total | 17 (70.8%) | 0 (0.0%) |
Employment Status by Educational Attainment in Inkster
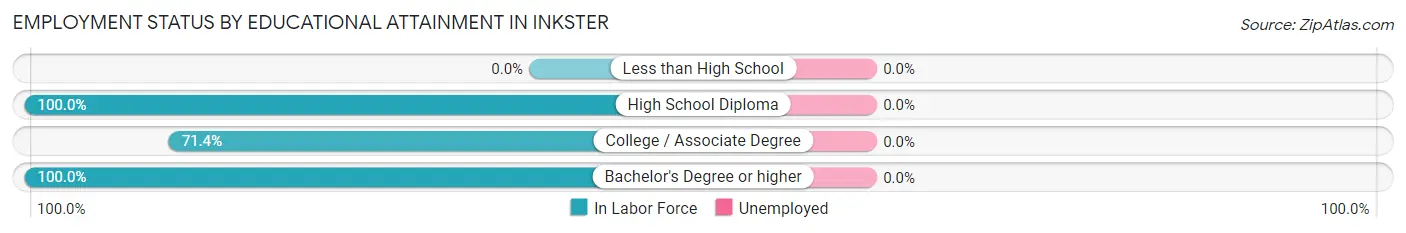
| Educational Attainment | In Labor Force | Unemployed |
| Less than High School | 0 (0.0%) | 0 (0.0%) |
| High School Diploma | 2 (100.0%) | 0 (0.0%) |
| College / Associate Degree | 5 (71.4%) | 0 (0.0%) |
| Bachelor's Degree or higher | 8 (100.0%) | 0 (0.0%) |
| Total | 15 (88.2%) | 0 (0.0%) |
Employment Occupations by Sex in Inkster
Management, Business, Science and Arts Occupations
The most common Management, Business, Science and Arts occupations in Inkster are Health Diagnosing & Treating (3 | 18.8%), Health Technologists (3 | 18.8%), and Management (2 | 12.5%).
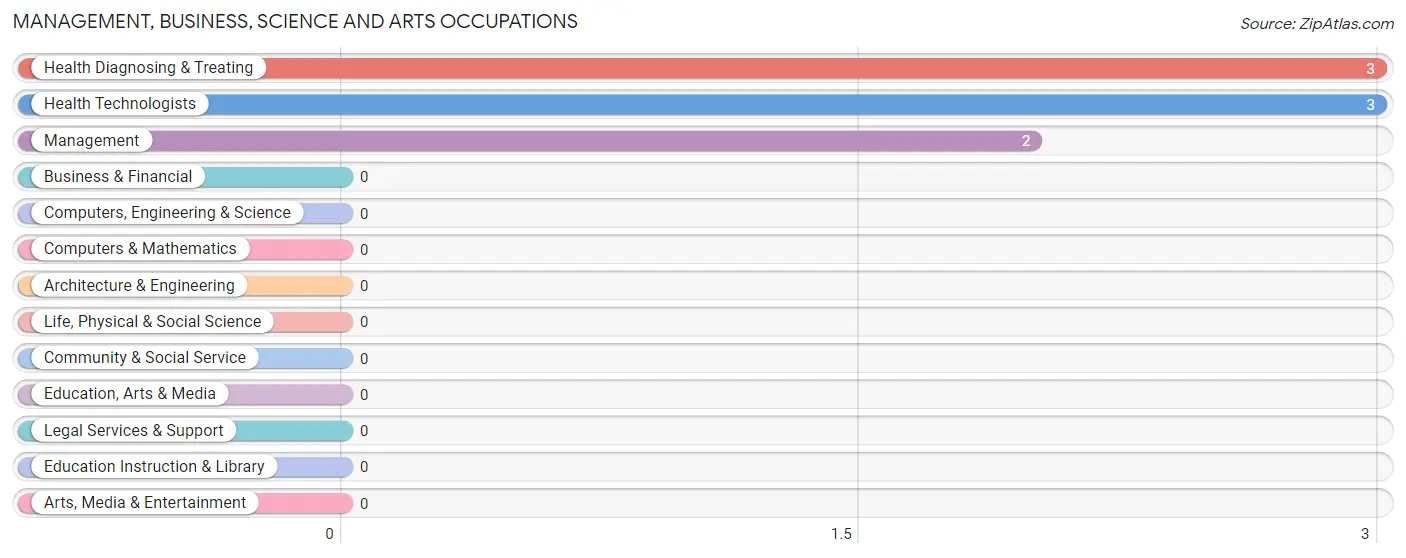
Management, Business, Science and Arts Occupations by Sex
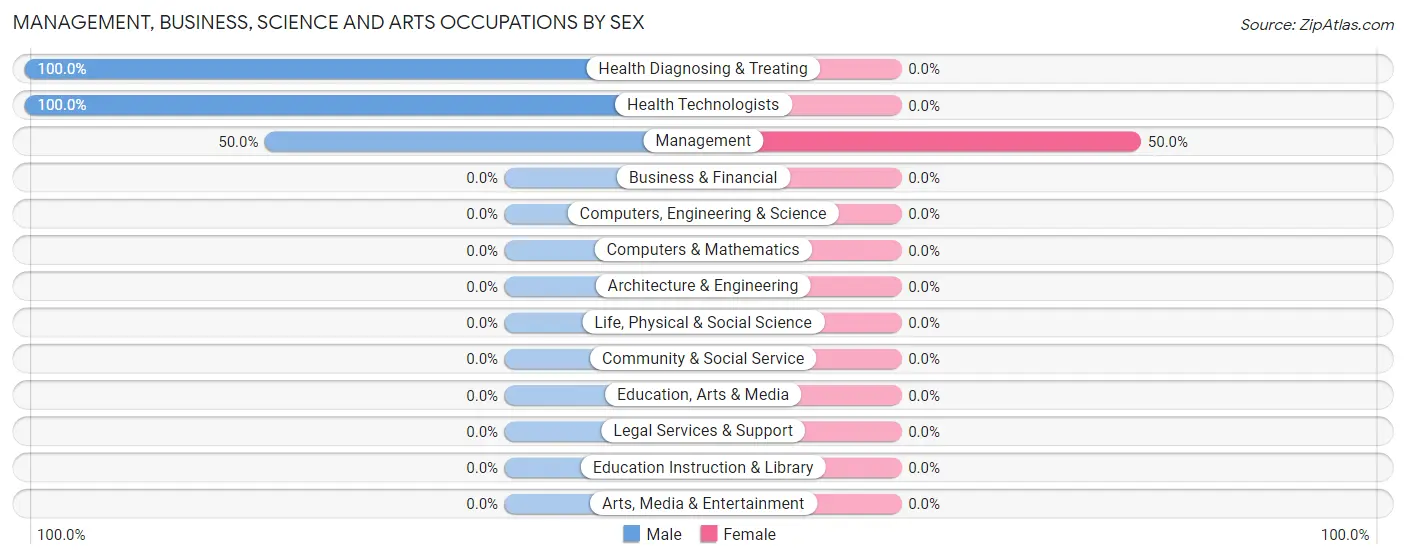
| Occupation | Male | Female |
| Management | 1 (50.0%) | 1 (50.0%) |
| Business & Financial | 0 (0.0%) | 0 (0.0%) |
| Computers, Engineering & Science | 0 (0.0%) | 0 (0.0%) |
| Computers & Mathematics | 0 (0.0%) | 0 (0.0%) |
| Architecture & Engineering | 0 (0.0%) | 0 (0.0%) |
| Life, Physical & Social Science | 0 (0.0%) | 0 (0.0%) |
| Community & Social Service | 0 (0.0%) | 0 (0.0%) |
| Education, Arts & Media | 0 (0.0%) | 0 (0.0%) |
| Legal Services & Support | 0 (0.0%) | 0 (0.0%) |
| Education Instruction & Library | 0 (0.0%) | 0 (0.0%) |
| Arts, Media & Entertainment | 0 (0.0%) | 0 (0.0%) |
| Health Diagnosing & Treating | 3 (100.0%) | 0 (0.0%) |
| Health Technologists | 3 (100.0%) | 0 (0.0%) |
| Total (Category) | 4 (80.0%) | 1 (20.0%) |
| Total (Overall) | 10 (62.5%) | 6 (37.5%) |
Services Occupations
The most common Services occupations in Inkster are , and Cleaning & Maintenance (1 | 6.2%).
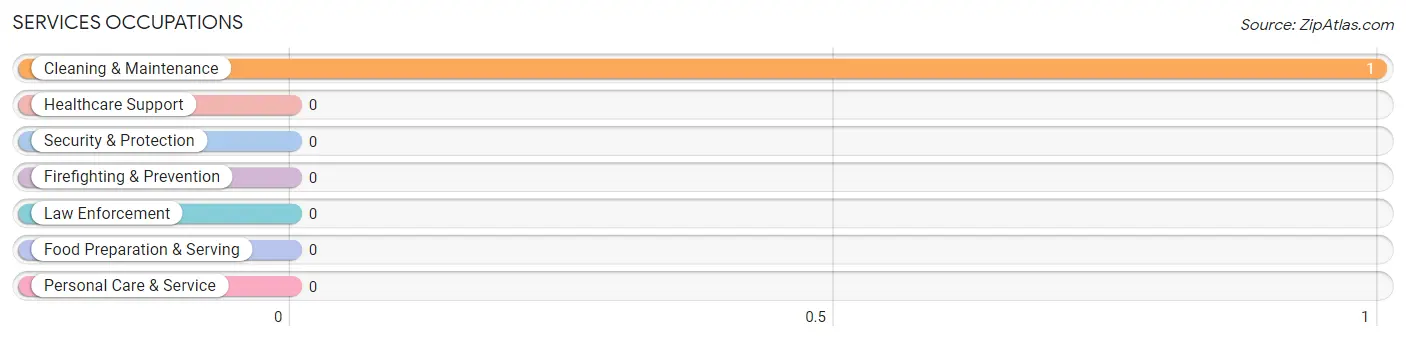
Services Occupations by Sex
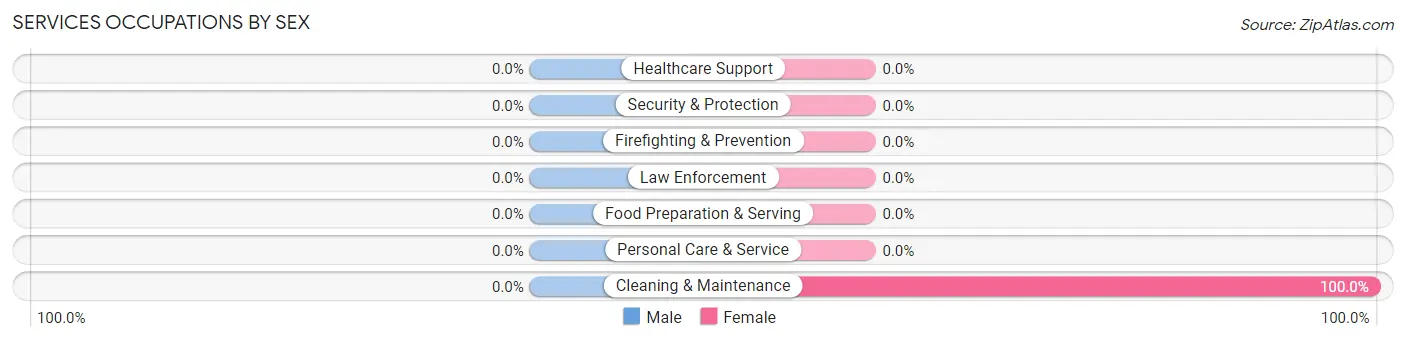
| Occupation | Male | Female |
| Healthcare Support | 0 (0.0%) | 0 (0.0%) |
| Security & Protection | 0 (0.0%) | 0 (0.0%) |
| Firefighting & Prevention | 0 (0.0%) | 0 (0.0%) |
| Law Enforcement | 0 (0.0%) | 0 (0.0%) |
| Food Preparation & Serving | 0 (0.0%) | 0 (0.0%) |
| Cleaning & Maintenance | 0 (0.0%) | 1 (100.0%) |
| Personal Care & Service | 0 (0.0%) | 0 (0.0%) |
| Total (Category) | 0 (0.0%) | 1 (100.0%) |
| Total (Overall) | 10 (62.5%) | 6 (37.5%) |
Sales and Office Occupations
The most common Sales and Office occupations in Inkster are Sales & Related (2 | 12.5%), and Office & Administration (1 | 6.2%).
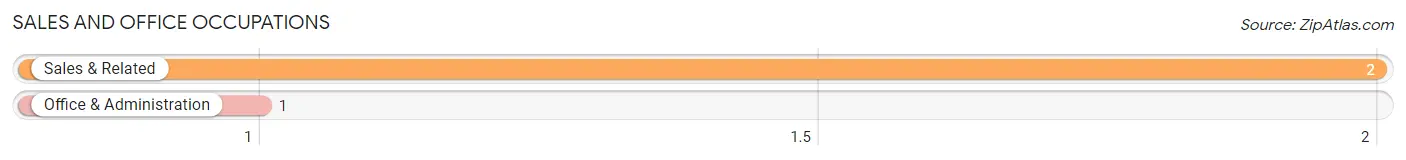
Sales and Office Occupations by Sex
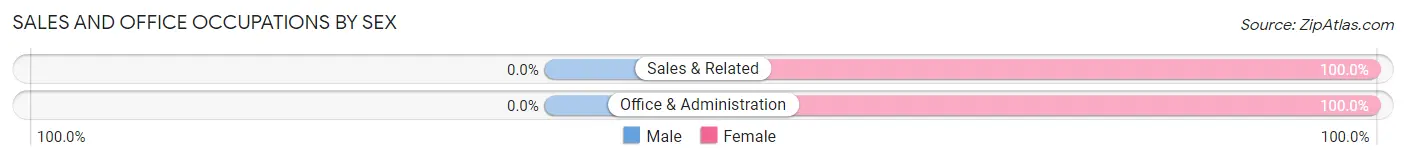
| Occupation | Male | Female |
| Sales & Related | 0 (0.0%) | 2 (100.0%) |
| Office & Administration | 0 (0.0%) | 1 (100.0%) |
| Total (Category) | 0 (0.0%) | 3 (100.0%) |
| Total (Overall) | 10 (62.5%) | 6 (37.5%) |
Natural Resources, Construction and Maintenance Occupations
The most common Natural Resources, Construction and Maintenance occupations in Inkster are Installation, Maintenance & Repair (3 | 18.8%), and Construction & Extraction (1 | 6.2%).
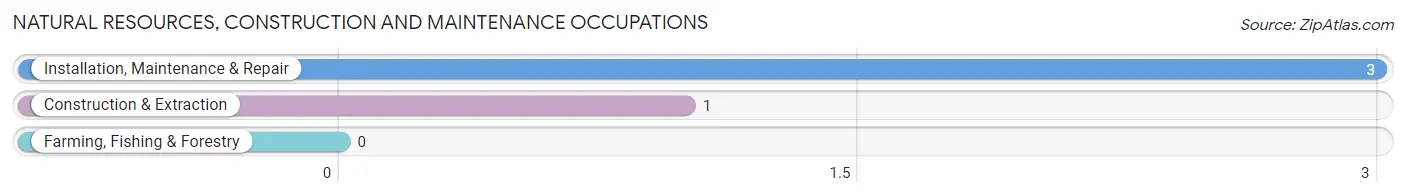
Natural Resources, Construction and Maintenance Occupations by Sex
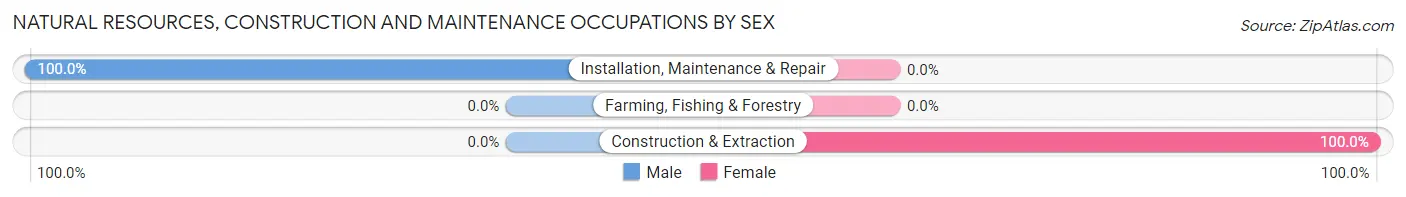
| Occupation | Male | Female |
| Farming, Fishing & Forestry | 0 (0.0%) | 0 (0.0%) |
| Construction & Extraction | 0 (0.0%) | 1 (100.0%) |
| Installation, Maintenance & Repair | 3 (100.0%) | 0 (0.0%) |
| Total (Category) | 3 (75.0%) | 1 (25.0%) |
| Total (Overall) | 10 (62.5%) | 6 (37.5%) |
Production, Transportation and Moving Occupations
The most common Production, Transportation and Moving occupations in Inkster are Transportation (2 | 12.5%), and Material Moving (1 | 6.2%).
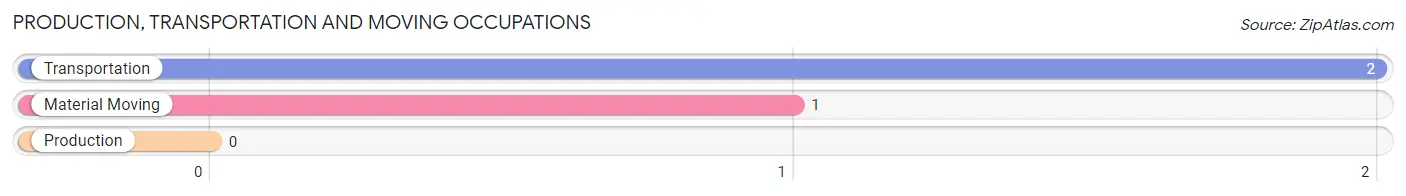
Production, Transportation and Moving Occupations by Sex
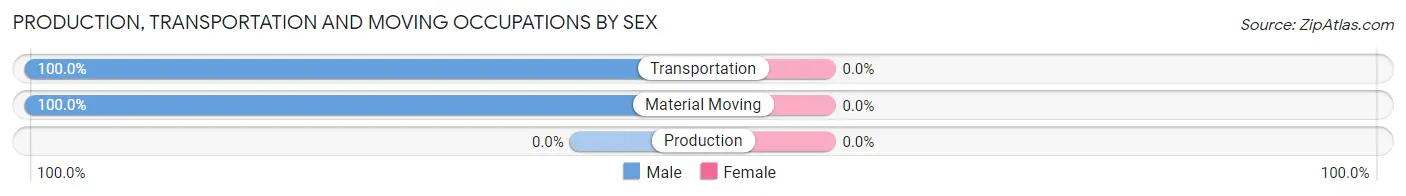
| Occupation | Male | Female |
| Production | 0 (0.0%) | 0 (0.0%) |
| Transportation | 2 (100.0%) | 0 (0.0%) |
| Material Moving | 1 (100.0%) | 0 (0.0%) |
| Total (Category) | 3 (100.0%) | 0 (0.0%) |
| Total (Overall) | 10 (62.5%) | 6 (37.5%) |
Employment Industries by Sex in Inkster
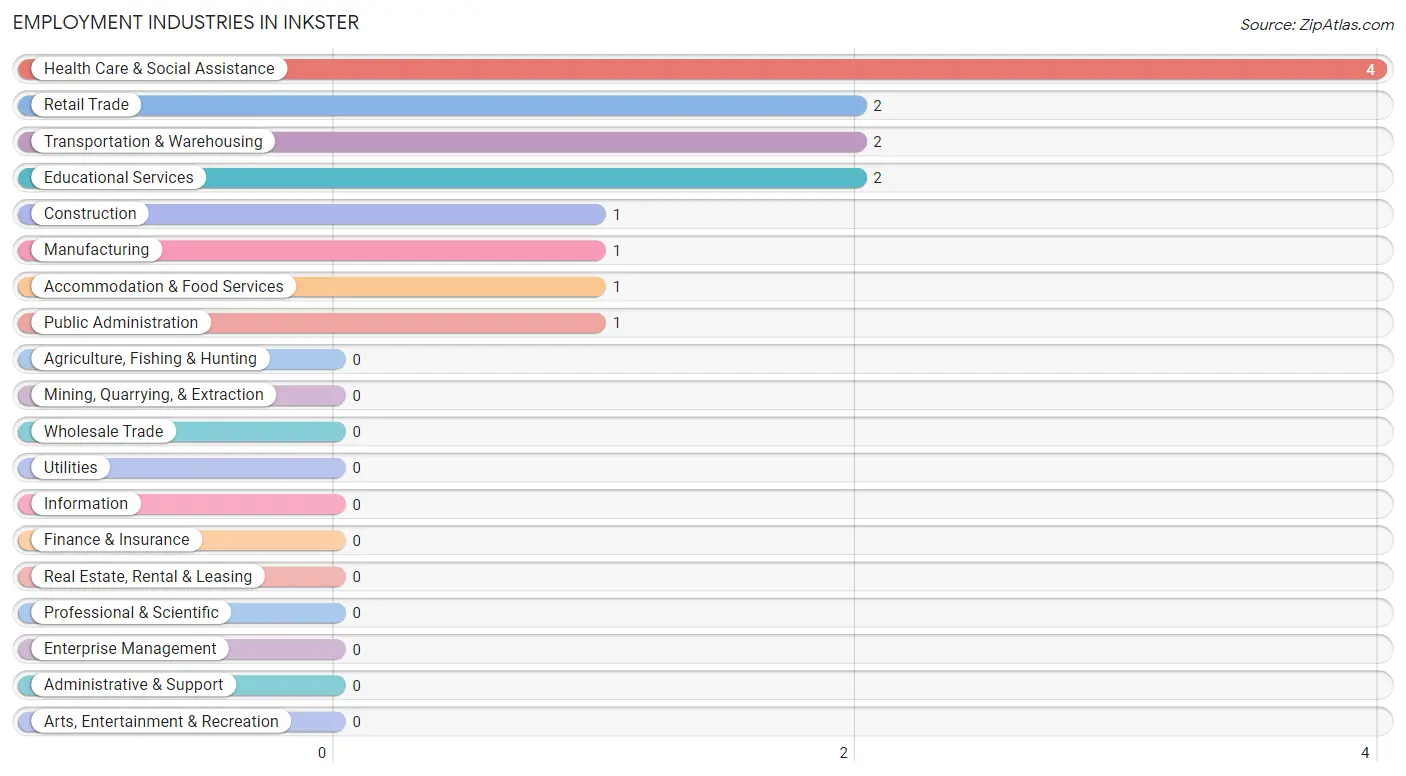
Employment Industries in Inkster
The major employment industries in Inkster include Health Care & Social Assistance (4 | 25.0%), Retail Trade (2 | 12.5%), Transportation & Warehousing (2 | 12.5%), Educational Services (2 | 12.5%), and Construction (1 | 6.2%).
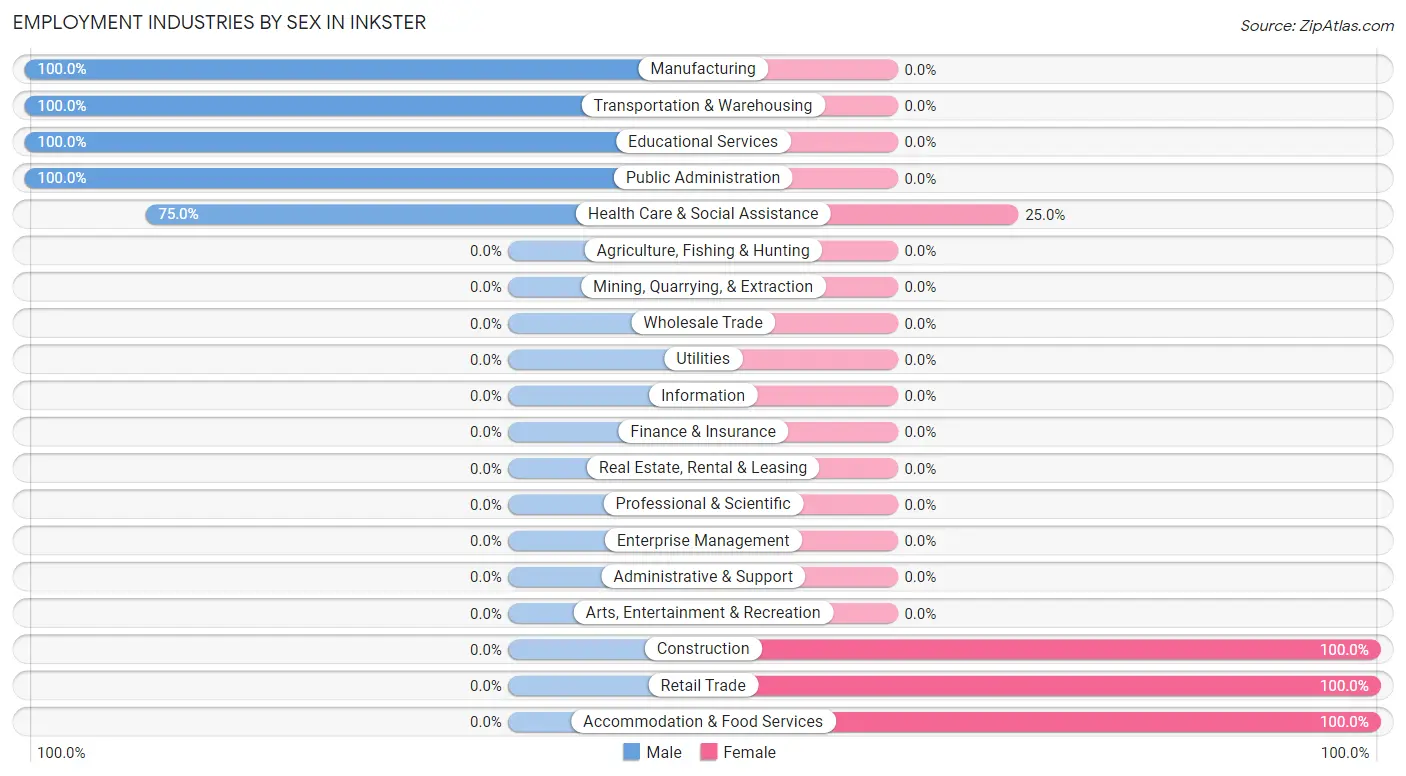
Employment Industries by Sex in Inkster
The Inkster industries that see more men than women are Manufacturing (100.0%), Transportation & Warehousing (100.0%), and Educational Services (100.0%), whereas the industries that tend to have a higher number of women are Construction (100.0%), Retail Trade (100.0%), and Accommodation & Food Services (100.0%).
| Industry | Male | Female |
| Agriculture, Fishing & Hunting | 0 (0.0%) | 0 (0.0%) |
| Mining, Quarrying, & Extraction | 0 (0.0%) | 0 (0.0%) |
| Construction | 0 (0.0%) | 1 (100.0%) |
| Manufacturing | 1 (100.0%) | 0 (0.0%) |
| Wholesale Trade | 0 (0.0%) | 0 (0.0%) |
| Retail Trade | 0 (0.0%) | 2 (100.0%) |
| Transportation & Warehousing | 2 (100.0%) | 0 (0.0%) |
| Utilities | 0 (0.0%) | 0 (0.0%) |
| Information | 0 (0.0%) | 0 (0.0%) |
| Finance & Insurance | 0 (0.0%) | 0 (0.0%) |
| Real Estate, Rental & Leasing | 0 (0.0%) | 0 (0.0%) |
| Professional & Scientific | 0 (0.0%) | 0 (0.0%) |
| Enterprise Management | 0 (0.0%) | 0 (0.0%) |
| Administrative & Support | 0 (0.0%) | 0 (0.0%) |
| Educational Services | 2 (100.0%) | 0 (0.0%) |
| Health Care & Social Assistance | 3 (75.0%) | 1 (25.0%) |
| Arts, Entertainment & Recreation | 0 (0.0%) | 0 (0.0%) |
| Accommodation & Food Services | 0 (0.0%) | 1 (100.0%) |
| Public Administration | 1 (100.0%) | 0 (0.0%) |
| Total | 10 (62.5%) | 6 (37.5%) |
Education in Inkster
School Enrollment in Inkster
The most common levels of schooling among the 4 students in Inkster are high school (2 | 50.0%), and college / undergraduate (2 | 50.0%).
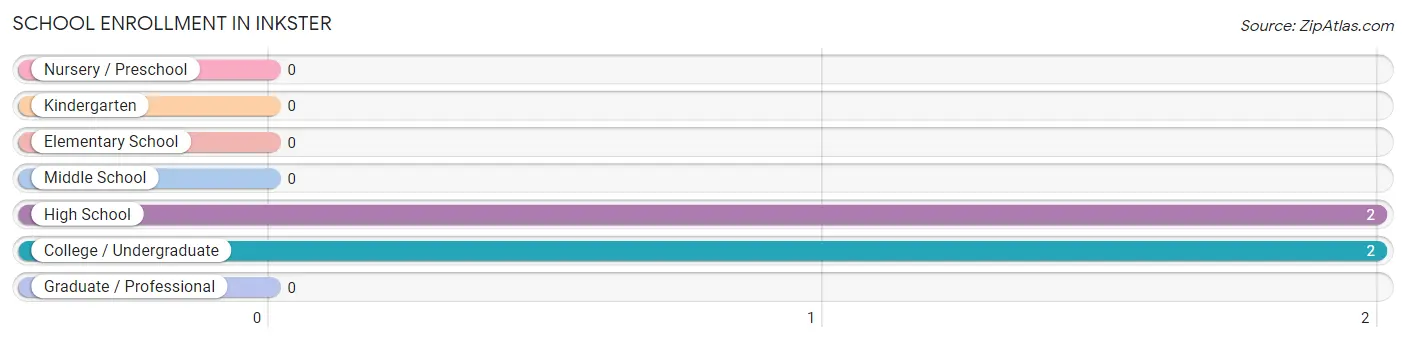
| School Level | # Students | % Students |
| Nursery / Preschool | 0 | 0.0% |
| Kindergarten | 0 | 0.0% |
| Elementary School | 0 | 0.0% |
| Middle School | 0 | 0.0% |
| High School | 2 | 50.0% |
| College / Undergraduate | 2 | 50.0% |
| Graduate / Professional | 0 | 0.0% |
| Total | 4 | 100.0% |
School Enrollment by Age by Funding Source in Inkster
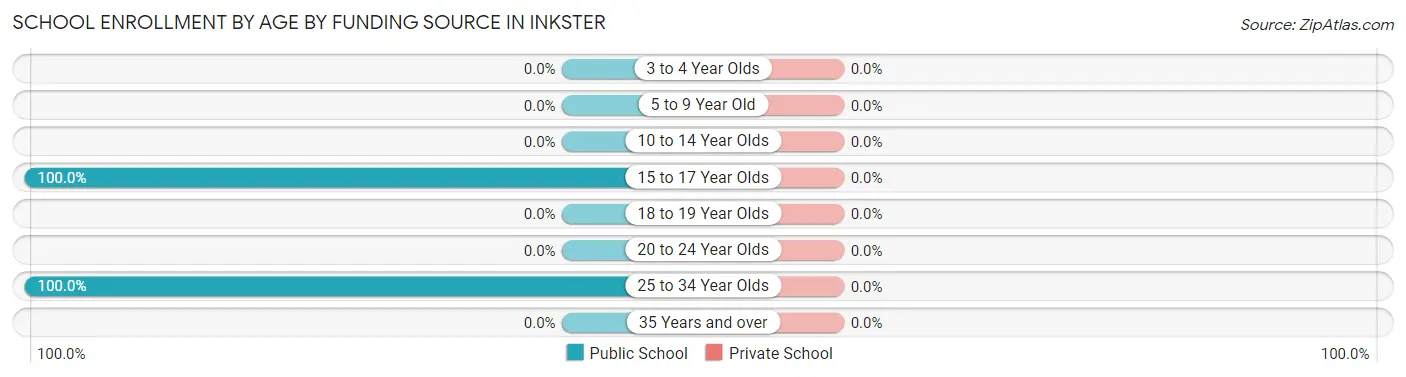
| Age Bracket | Public School | Private School |
| 3 to 4 Year Olds | 0 (0.0%) | 0 (0.0%) |
| 5 to 9 Year Old | 0 (0.0%) | 0 (0.0%) |
| 10 to 14 Year Olds | 0 (0.0%) | 0 (0.0%) |
| 15 to 17 Year Olds | 2 (100.0%) | 0 (0.0%) |
| 18 to 19 Year Olds | 0 (0.0%) | 0 (0.0%) |
| 20 to 24 Year Olds | 0 (0.0%) | 0 (0.0%) |
| 25 to 34 Year Olds | 2 (100.0%) | 0 (0.0%) |
| 35 Years and over | 0 (0.0%) | 0 (0.0%) |
| Total | 4 (100.0%) | 0 (0.0%) |
Educational Attainment by Field of Study in Inkster
Bio, nature & agricultural (3 | 33.3%), business (3 | 33.3%), physical & health sciences (2 | 22.2%), and communications (1 | 11.1%) are the most common fields of study among 9 individuals in Inkster who have obtained a bachelor's degree or higher.
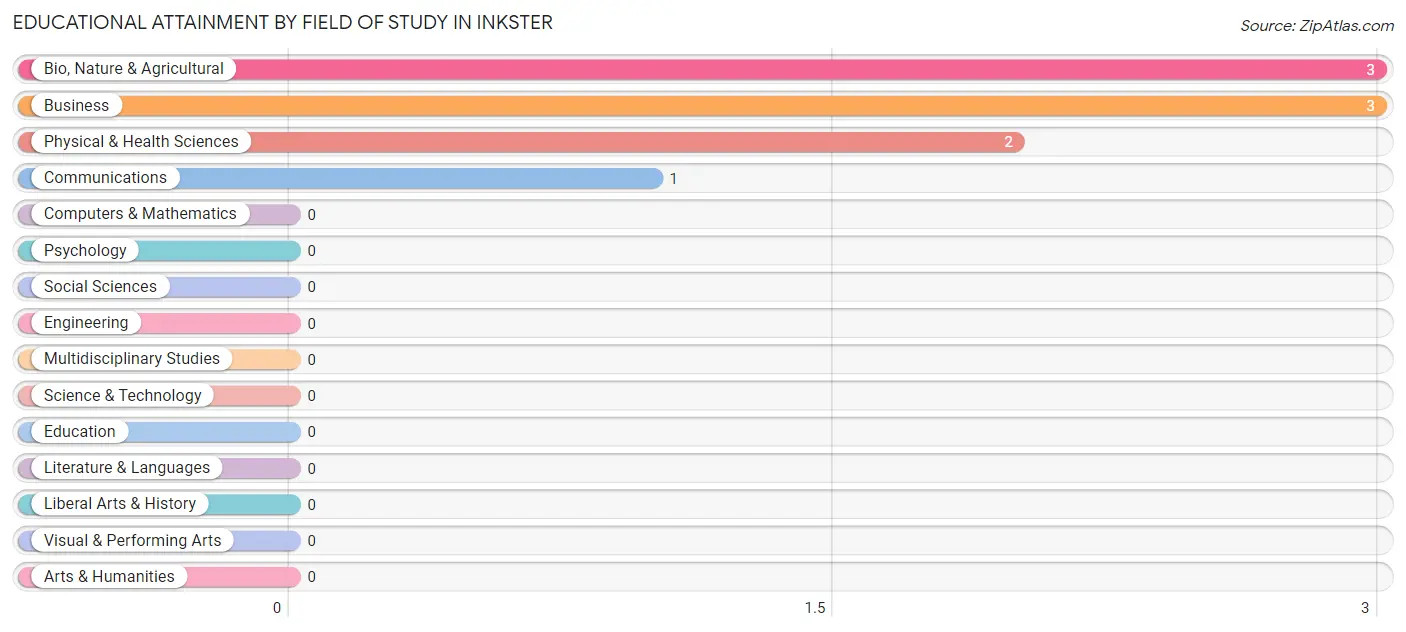
| Field of Study | # Graduates | % Graduates |
| Computers & Mathematics | 0 | 0.0% |
| Bio, Nature & Agricultural | 3 | 33.3% |
| Physical & Health Sciences | 2 | 22.2% |
| Psychology | 0 | 0.0% |
| Social Sciences | 0 | 0.0% |
| Engineering | 0 | 0.0% |
| Multidisciplinary Studies | 0 | 0.0% |
| Science & Technology | 0 | 0.0% |
| Business | 3 | 33.3% |
| Education | 0 | 0.0% |
| Literature & Languages | 0 | 0.0% |
| Liberal Arts & History | 0 | 0.0% |
| Visual & Performing Arts | 0 | 0.0% |
| Communications | 1 | 11.1% |
| Arts & Humanities | 0 | 0.0% |
| Total | 9 | 100.0% |
Transportation & Commute in Inkster
Vehicle Availability by Sex in Inkster
The most prevalent vehicle ownership categories in Inkster are males with 3 vehicles (7, accounting for 63.6%) and females with 3 vehicles (1, making up 116.7%).
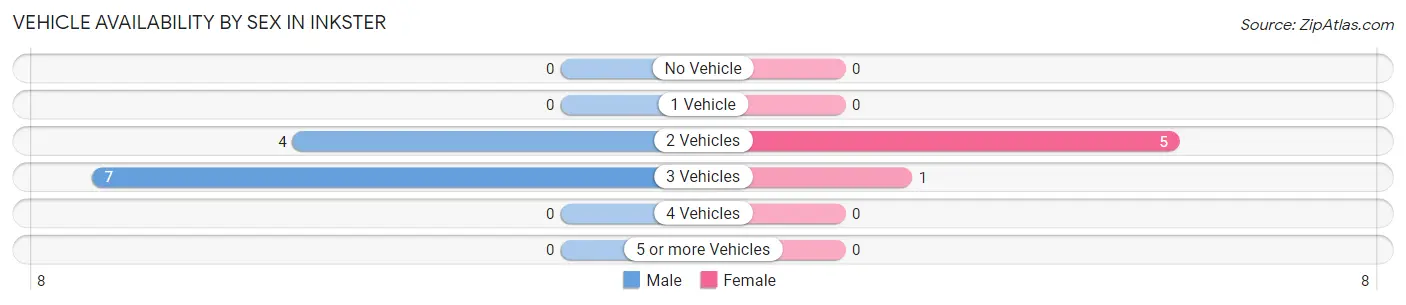
| Vehicles Available | Male | Female |
| No Vehicle | 0 (0.0%) | 0 (0.0%) |
| 1 Vehicle | 0 (0.0%) | 0 (0.0%) |
| 2 Vehicles | 4 (36.4%) | 5 (83.3%) |
| 3 Vehicles | 7 (63.6%) | 1 (16.7%) |
| 4 Vehicles | 0 (0.0%) | 0 (0.0%) |
| 5 or more Vehicles | 0 (0.0%) | 0 (0.0%) |
| Total | 11 (100.0%) | 6 (100.0%) |
Commute Time in Inkster
The most frequently occuring commute durations in Inkster are 45 to 59 minutes (7 commuters, 46.7%), 35 to 39 minutes (3 commuters, 20.0%), and 40 to 44 minutes (3 commuters, 20.0%).
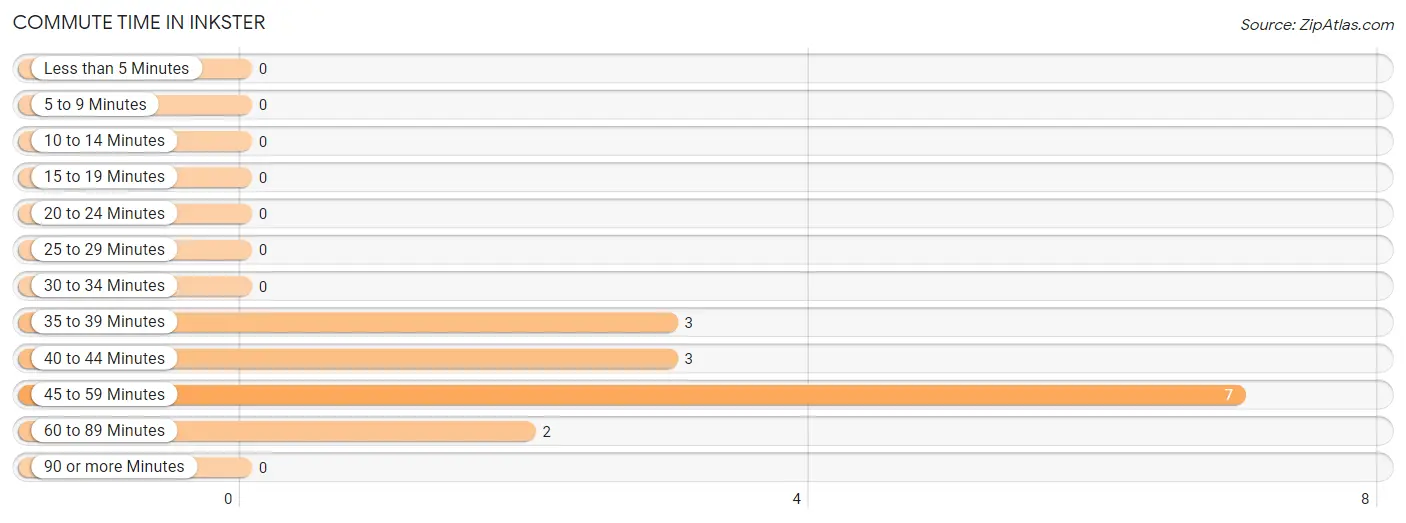
| Commute Time | # Commuters | % Commuters |
| Less than 5 Minutes | 0 | 0.0% |
| 5 to 9 Minutes | 0 | 0.0% |
| 10 to 14 Minutes | 0 | 0.0% |
| 15 to 19 Minutes | 0 | 0.0% |
| 20 to 24 Minutes | 0 | 0.0% |
| 25 to 29 Minutes | 0 | 0.0% |
| 30 to 34 Minutes | 0 | 0.0% |
| 35 to 39 Minutes | 3 | 20.0% |
| 40 to 44 Minutes | 3 | 20.0% |
| 45 to 59 Minutes | 7 | 46.7% |
| 60 to 89 Minutes | 2 | 13.3% |
| 90 or more Minutes | 0 | 0.0% |
Commute Time by Sex in Inkster
The most common commute times in Inkster are 45 to 59 minutes (4 commuters, 40.0%) for males and 45 to 59 minutes (3 commuters, 60.0%) for females.
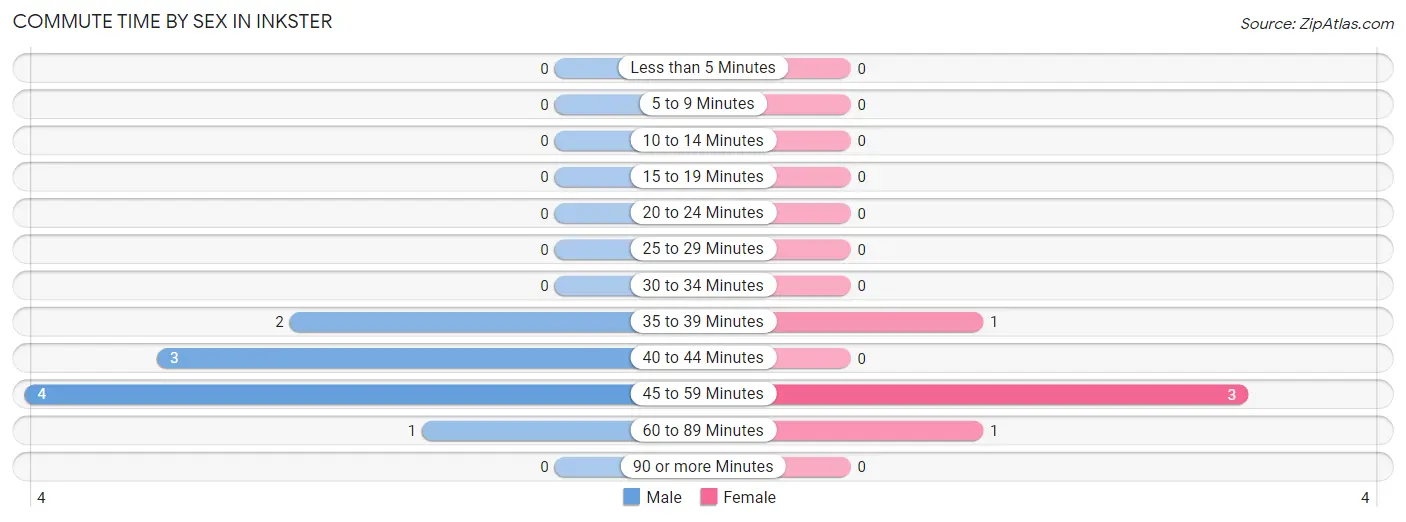
| Commute Time | Male | Female |
| Less than 5 Minutes | 0 (0.0%) | 0 (0.0%) |
| 5 to 9 Minutes | 0 (0.0%) | 0 (0.0%) |
| 10 to 14 Minutes | 0 (0.0%) | 0 (0.0%) |
| 15 to 19 Minutes | 0 (0.0%) | 0 (0.0%) |
| 20 to 24 Minutes | 0 (0.0%) | 0 (0.0%) |
| 25 to 29 Minutes | 0 (0.0%) | 0 (0.0%) |
| 30 to 34 Minutes | 0 (0.0%) | 0 (0.0%) |
| 35 to 39 Minutes | 2 (20.0%) | 1 (20.0%) |
| 40 to 44 Minutes | 3 (30.0%) | 0 (0.0%) |
| 45 to 59 Minutes | 4 (40.0%) | 3 (60.0%) |
| 60 to 89 Minutes | 1 (10.0%) | 1 (20.0%) |
| 90 or more Minutes | 0 (0.0%) | 0 (0.0%) |
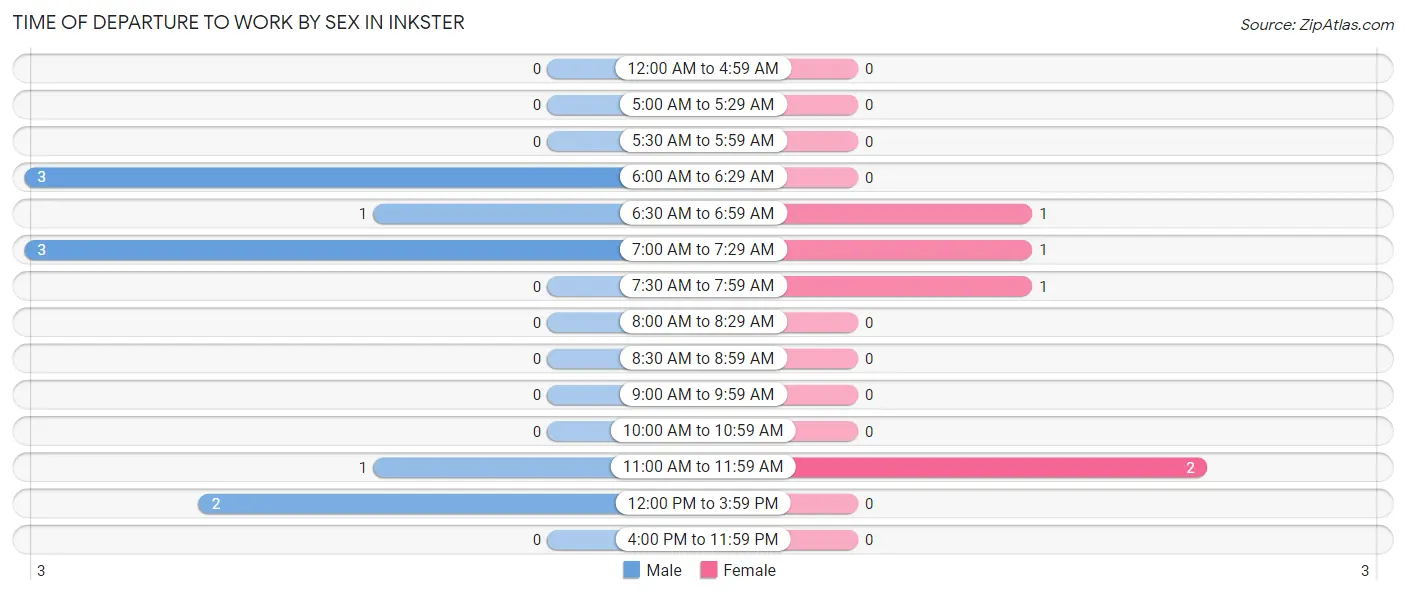
Time of Departure to Work by Sex in Inkster
The most frequent times of departure to work in Inkster are 6:00 AM to 6:29 AM (3, 30.0%) for males and 11:00 AM to 11:59 AM (2, 40.0%) for females.
| Time of Departure | Male | Female |
| 12:00 AM to 4:59 AM | 0 (0.0%) | 0 (0.0%) |
| 5:00 AM to 5:29 AM | 0 (0.0%) | 0 (0.0%) |
| 5:30 AM to 5:59 AM | 0 (0.0%) | 0 (0.0%) |
| 6:00 AM to 6:29 AM | 3 (30.0%) | 0 (0.0%) |
| 6:30 AM to 6:59 AM | 1 (10.0%) | 1 (20.0%) |
| 7:00 AM to 7:29 AM | 3 (30.0%) | 1 (20.0%) |
| 7:30 AM to 7:59 AM | 0 (0.0%) | 1 (20.0%) |
| 8:00 AM to 8:29 AM | 0 (0.0%) | 0 (0.0%) |
| 8:30 AM to 8:59 AM | 0 (0.0%) | 0 (0.0%) |
| 9:00 AM to 9:59 AM | 0 (0.0%) | 0 (0.0%) |
| 10:00 AM to 10:59 AM | 0 (0.0%) | 0 (0.0%) |
| 11:00 AM to 11:59 AM | 1 (10.0%) | 2 (40.0%) |
| 12:00 PM to 3:59 PM | 2 (20.0%) | 0 (0.0%) |
| 4:00 PM to 11:59 PM | 0 (0.0%) | 0 (0.0%) |
| Total | 10 (100.0%) | 5 (100.0%) |
Housing Occupancy in Inkster
Occupancy by Ownership in Inkster
Of the total 12 dwellings in Inkster, owner-occupied units account for 12 (100.0%), while renter-occupied units make up 0 (0.0%).
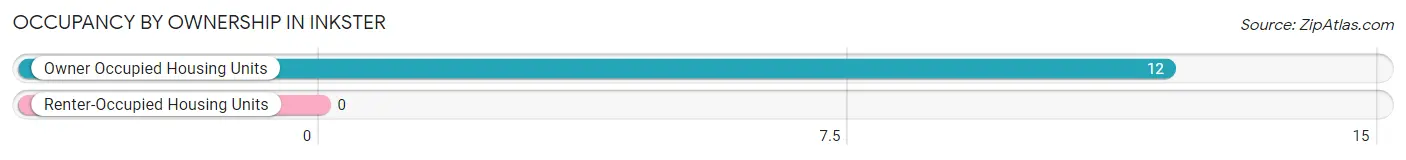
| Occupancy | # Housing Units | % Housing Units |
| Owner Occupied Housing Units | 12 | 100.0% |
| Renter-Occupied Housing Units | 0 | 0.0% |
| Total Occupied Housing Units | 12 | 100.0% |
Occupancy by Household Size in Inkster
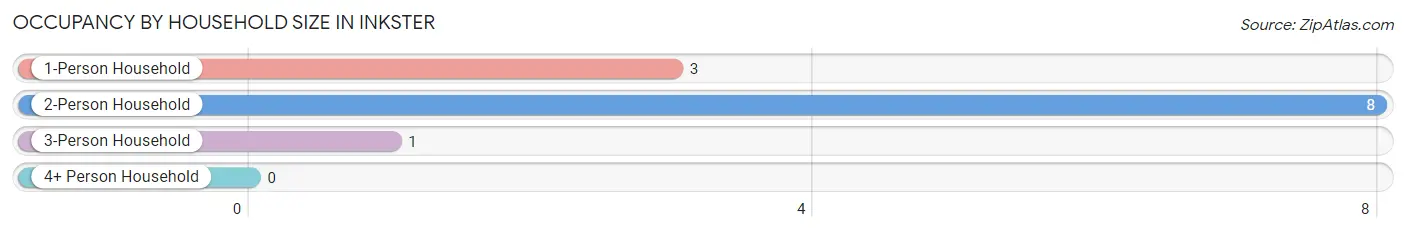
| Household Size | # Housing Units | % Housing Units |
| 1-Person Household | 3 | 25.0% |
| 2-Person Household | 8 | 66.7% |
| 3-Person Household | 1 | 8.3% |
| 4+ Person Household | 0 | 0.0% |
| Total Housing Units | 12 | 100.0% |
Occupancy by Ownership by Household Size in Inkster
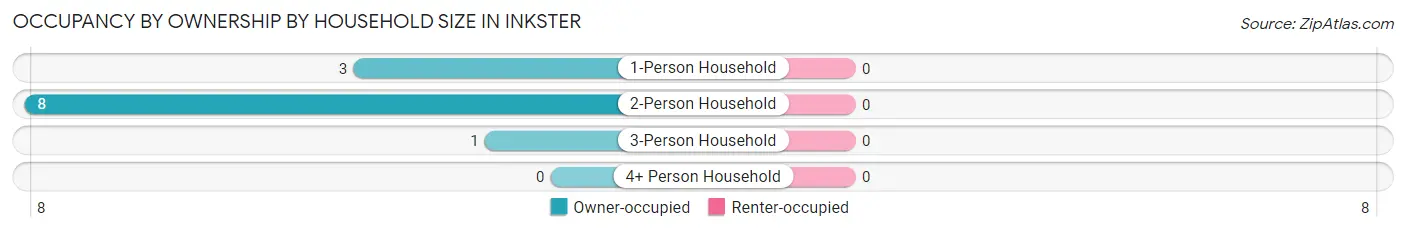
| Household Size | Owner-occupied | Renter-occupied |
| 1-Person Household | 3 (100.0%) | 0 (0.0%) |
| 2-Person Household | 8 (100.0%) | 0 (0.0%) |
| 3-Person Household | 1 (100.0%) | 0 (0.0%) |
| 4+ Person Household | 0 (0.0%) | 0 (0.0%) |
| Total Housing Units | 12 (100.0%) | 0 (0.0%) |
Occupancy by Educational Attainment in Inkster
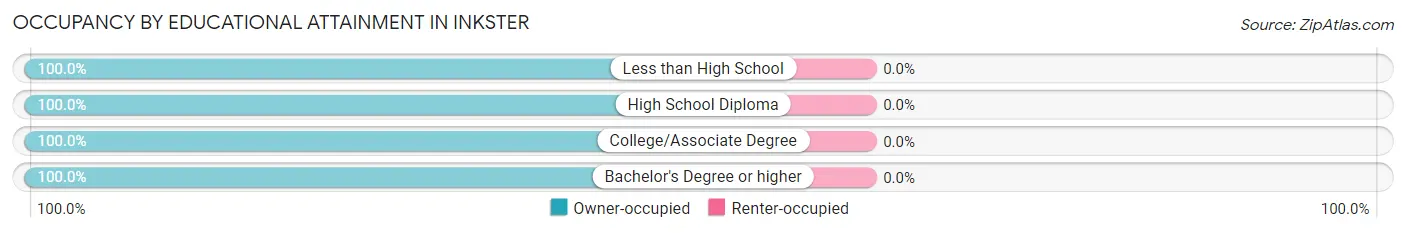
| Household Size | Owner-occupied | Renter-occupied |
| Less than High School | 2 (100.0%) | 0 (0.0%) |
| High School Diploma | 4 (100.0%) | 0 (0.0%) |
| College/Associate Degree | 4 (100.0%) | 0 (0.0%) |
| Bachelor's Degree or higher | 2 (100.0%) | 0 (0.0%) |
Occupancy by Age of Householder in Inkster
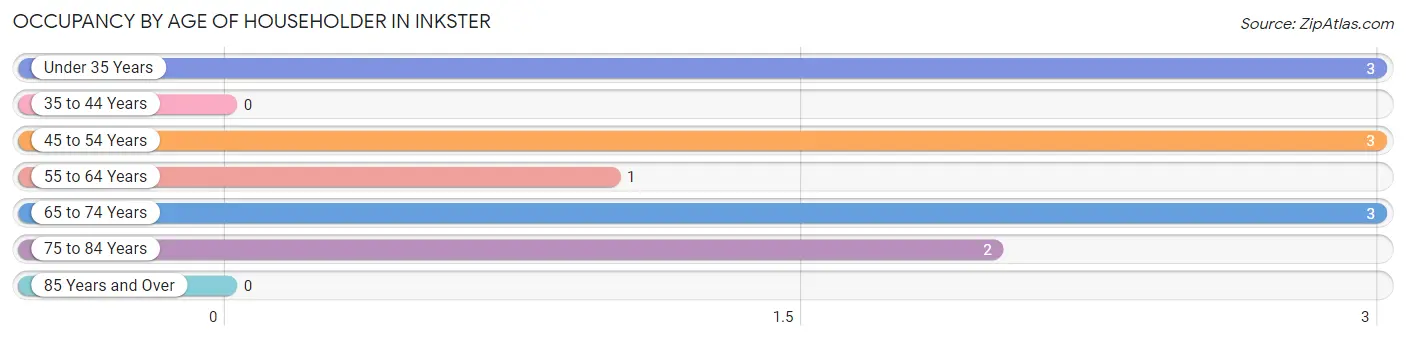
| Age Bracket | # Households | % Households |
| Under 35 Years | 3 | 25.0% |
| 35 to 44 Years | 0 | 0.0% |
| 45 to 54 Years | 3 | 25.0% |
| 55 to 64 Years | 1 | 8.3% |
| 65 to 74 Years | 3 | 25.0% |
| 75 to 84 Years | 2 | 16.7% |
| 85 Years and Over | 0 | 0.0% |
| Total | 12 | 100.0% |
Housing Finances in Inkster
Median Income by Occupancy in Inkster
| Occupancy Type | # Households | Median Income |
| Owner-Occupied | 12 (100.0%) | $0 |
| Renter-Occupied | 0 (0.0%) | $0 |
| Average | 12 (100.0%) | $0 |
Occupancy by Householder Income Bracket in Inkster
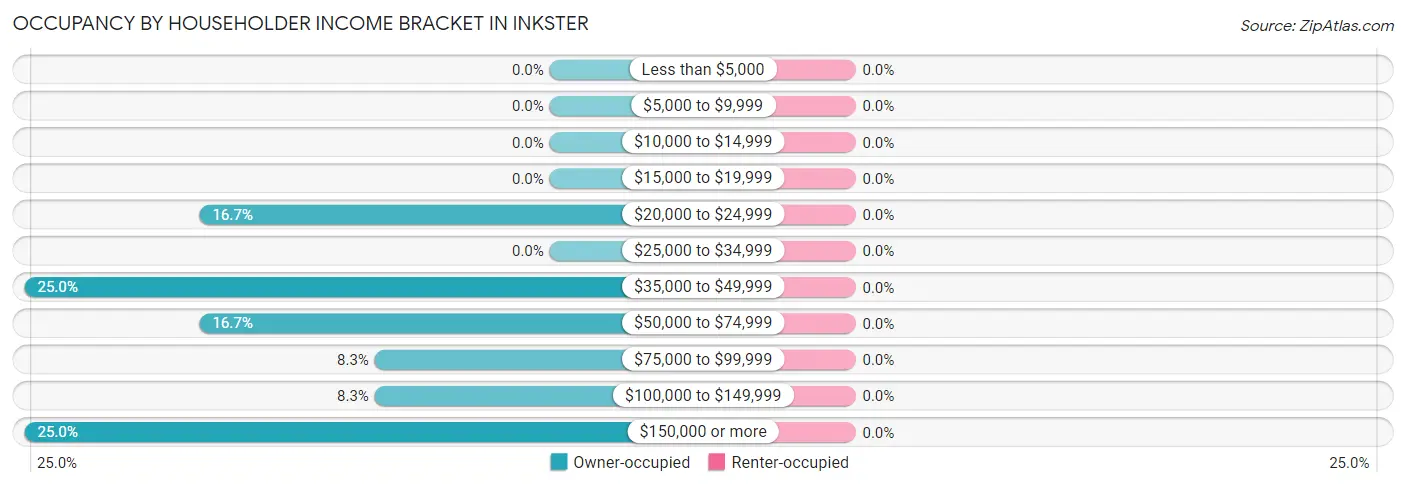
| Income Bracket | Owner-occupied | Renter-occupied |
| Less than $5,000 | 0 (0.0%) | 0 (0.0%) |
| $5,000 to $9,999 | 0 (0.0%) | 0 (0.0%) |
| $10,000 to $14,999 | 0 (0.0%) | 0 (0.0%) |
| $15,000 to $19,999 | 0 (0.0%) | 0 (0.0%) |
| $20,000 to $24,999 | 2 (16.7%) | 0 (0.0%) |
| $25,000 to $34,999 | 0 (0.0%) | 0 (0.0%) |
| $35,000 to $49,999 | 3 (25.0%) | 0 (0.0%) |
| $50,000 to $74,999 | 2 (16.7%) | 0 (0.0%) |
| $75,000 to $99,999 | 1 (8.3%) | 0 (0.0%) |
| $100,000 to $149,999 | 1 (8.3%) | 0 (0.0%) |
| $150,000 or more | 3 (25.0%) | 0 (0.0%) |
| Total | 12 (100.0%) | 0 (0.0%) |
Monthly Housing Cost Tiers in Inkster
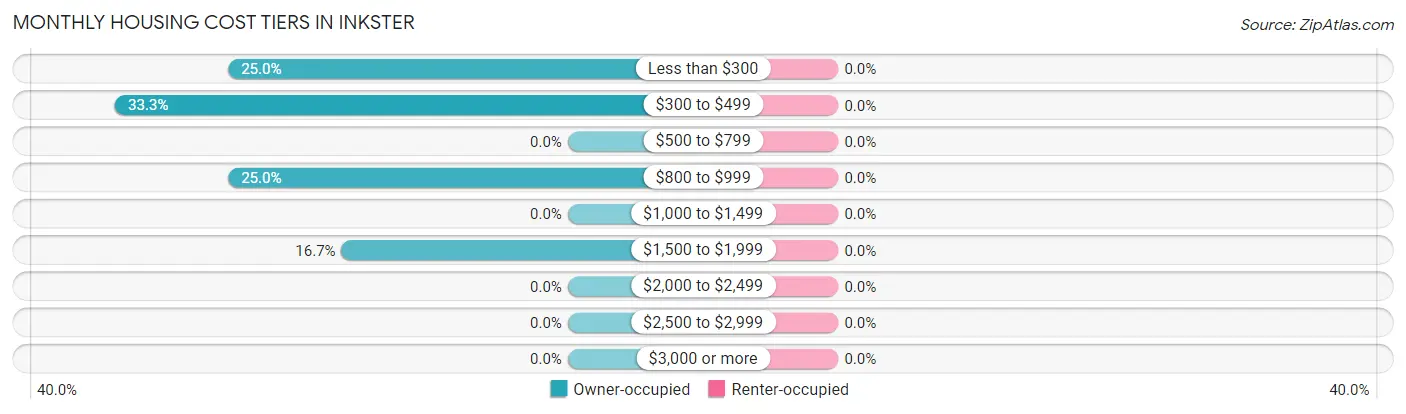
| Monthly Cost | Owner-occupied | Renter-occupied |
| Less than $300 | 3 (25.0%) | 0 (0.0%) |
| $300 to $499 | 4 (33.3%) | 0 (0.0%) |
| $500 to $799 | 0 (0.0%) | 0 (0.0%) |
| $800 to $999 | 3 (25.0%) | 0 (0.0%) |
| $1,000 to $1,499 | 0 (0.0%) | 0 (0.0%) |
| $1,500 to $1,999 | 2 (16.7%) | 0 (0.0%) |
| $2,000 to $2,499 | 0 (0.0%) | 0 (0.0%) |
| $2,500 to $2,999 | 0 (0.0%) | 0 (0.0%) |
| $3,000 or more | 0 (0.0%) | 0 (0.0%) |
| Total | 12 (100.0%) | 0 (0.0%) |
Physical Housing Characteristics in Inkster
Housing Structures in Inkster
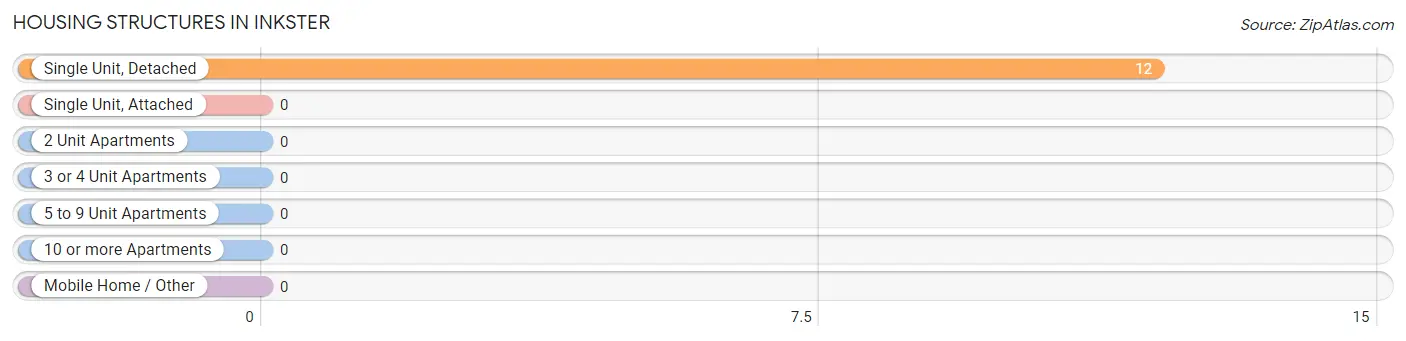
| Structure Type | # Housing Units | % Housing Units |
| Single Unit, Detached | 12 | 100.0% |
| Single Unit, Attached | 0 | 0.0% |
| 2 Unit Apartments | 0 | 0.0% |
| 3 or 4 Unit Apartments | 0 | 0.0% |
| 5 to 9 Unit Apartments | 0 | 0.0% |
| 10 or more Apartments | 0 | 0.0% |
| Mobile Home / Other | 0 | 0.0% |
| Total | 12 | 100.0% |
Housing Structures by Occupancy in Inkster
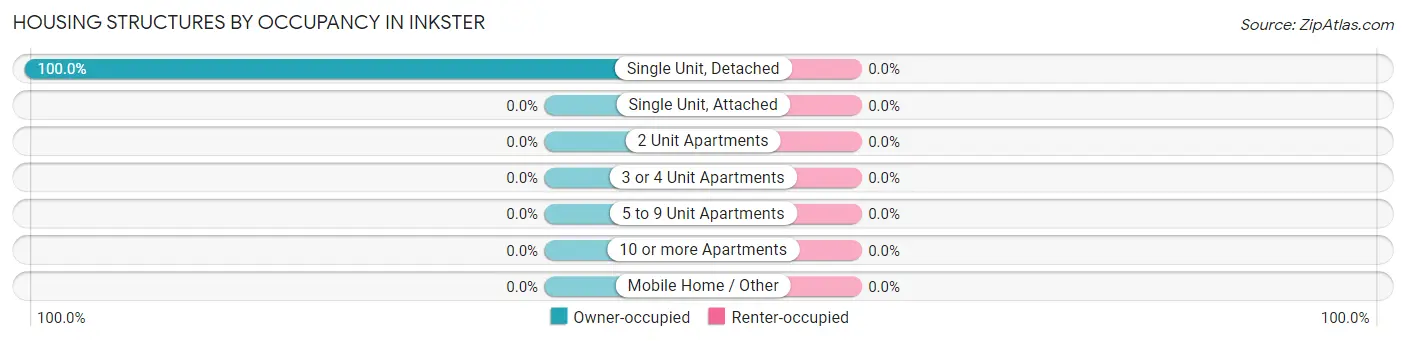
| Structure Type | Owner-occupied | Renter-occupied |
| Single Unit, Detached | 12 (100.0%) | 0 (0.0%) |
| Single Unit, Attached | 0 (0.0%) | 0 (0.0%) |
| 2 Unit Apartments | 0 (0.0%) | 0 (0.0%) |
| 3 or 4 Unit Apartments | 0 (0.0%) | 0 (0.0%) |
| 5 to 9 Unit Apartments | 0 (0.0%) | 0 (0.0%) |
| 10 or more Apartments | 0 (0.0%) | 0 (0.0%) |
| Mobile Home / Other | 0 (0.0%) | 0 (0.0%) |
| Total | 12 (100.0%) | 0 (0.0%) |
Housing Structures by Number of Rooms in Inkster
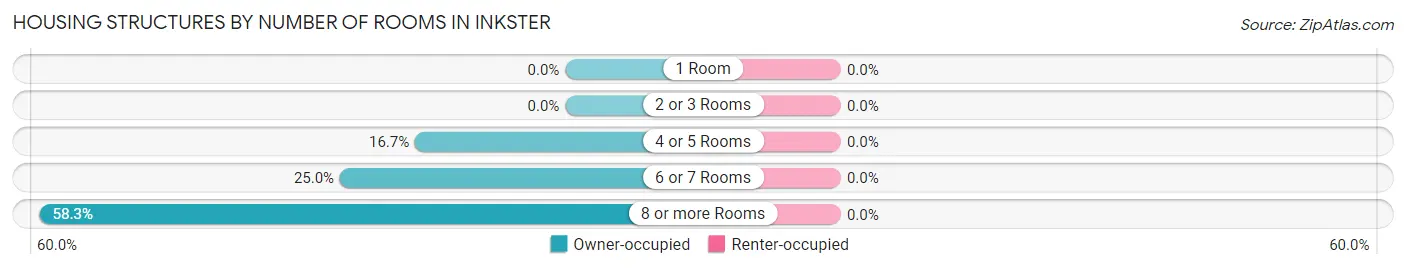
| Number of Rooms | Owner-occupied | Renter-occupied |
| 1 Room | 0 (0.0%) | 0 (0.0%) |
| 2 or 3 Rooms | 0 (0.0%) | 0 (0.0%) |
| 4 or 5 Rooms | 2 (16.7%) | 0 (0.0%) |
| 6 or 7 Rooms | 3 (25.0%) | 0 (0.0%) |
| 8 or more Rooms | 7 (58.3%) | 0 (0.0%) |
| Total | 12 (100.0%) | 0 (0.0%) |
Housing Structure by Heating Type in Inkster
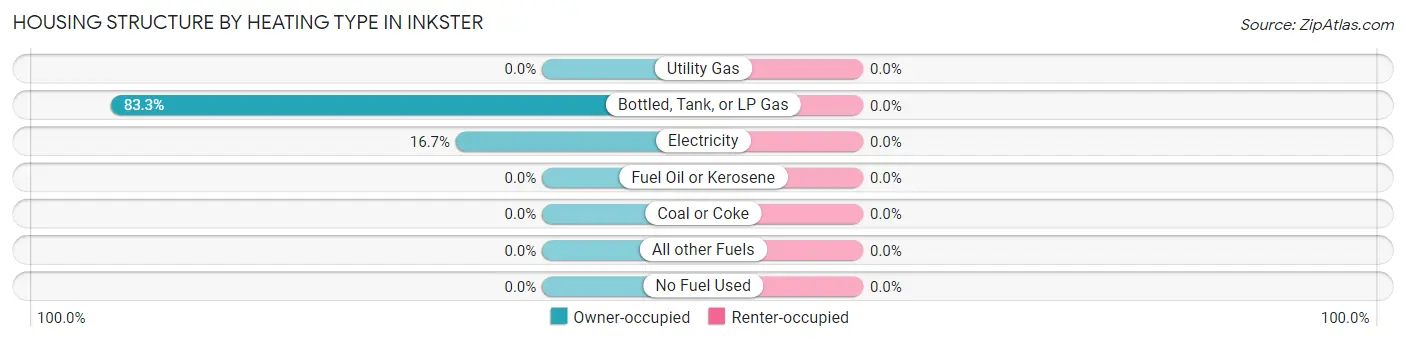
| Heating Type | Owner-occupied | Renter-occupied |
| Utility Gas | 0 (0.0%) | 0 (0.0%) |
| Bottled, Tank, or LP Gas | 10 (83.3%) | 0 (0.0%) |
| Electricity | 2 (16.7%) | 0 (0.0%) |
| Fuel Oil or Kerosene | 0 (0.0%) | 0 (0.0%) |
| Coal or Coke | 0 (0.0%) | 0 (0.0%) |
| All other Fuels | 0 (0.0%) | 0 (0.0%) |
| No Fuel Used | 0 (0.0%) | 0 (0.0%) |
| Total | 12 (100.0%) | 0 (0.0%) |
Household Vehicle Usage in Inkster
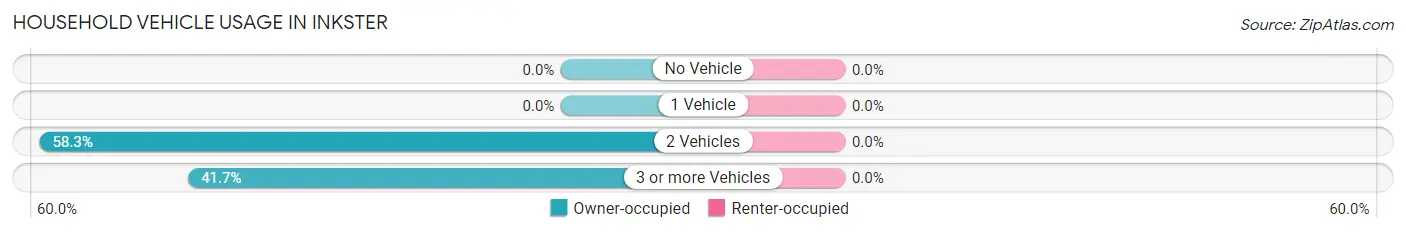
| Vehicles per Household | Owner-occupied | Renter-occupied |
| No Vehicle | 0 (0.0%) | 0 (0.0%) |
| 1 Vehicle | 0 (0.0%) | 0 (0.0%) |
| 2 Vehicles | 7 (58.3%) | 0 (0.0%) |
| 3 or more Vehicles | 5 (41.7%) | 0 (0.0%) |
| Total | 12 (100.0%) | 0 (0.0%) |
Real Estate & Mortgages in Inkster
Real Estate and Mortgage Overview in Inkster
| Characteristic | Without Mortgage | With Mortgage |
| Housing Units | 7 | 5 |
| Median Property Value | $52,500 | $208,300 |
| Median Household Income | - | - |
| Monthly Housing Costs | $358 | $0 |
| Real Estate Taxes | $650 | $0 |
Property Value by Mortgage Status in Inkster
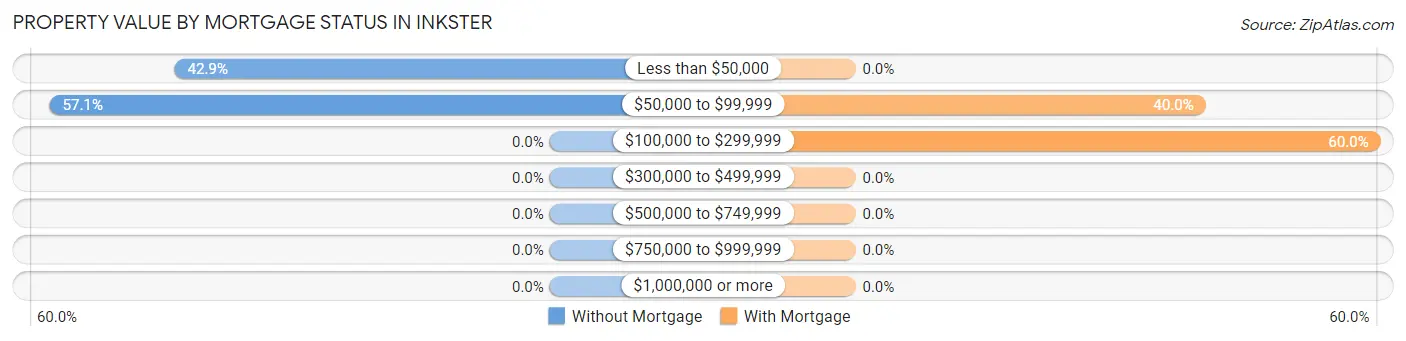
| Property Value | Without Mortgage | With Mortgage |
| Less than $50,000 | 3 (42.9%) | 0 (0.0%) |
| $50,000 to $99,999 | 4 (57.1%) | 2 (40.0%) |
| $100,000 to $299,999 | 0 (0.0%) | 3 (60.0%) |
| $300,000 to $499,999 | 0 (0.0%) | 0 (0.0%) |
| $500,000 to $749,999 | 0 (0.0%) | 0 (0.0%) |
| $750,000 to $999,999 | 0 (0.0%) | 0 (0.0%) |
| $1,000,000 or more | 0 (0.0%) | 0 (0.0%) |
| Total | 7 (100.0%) | 5 (100.0%) |
Household Income by Mortgage Status in Inkster
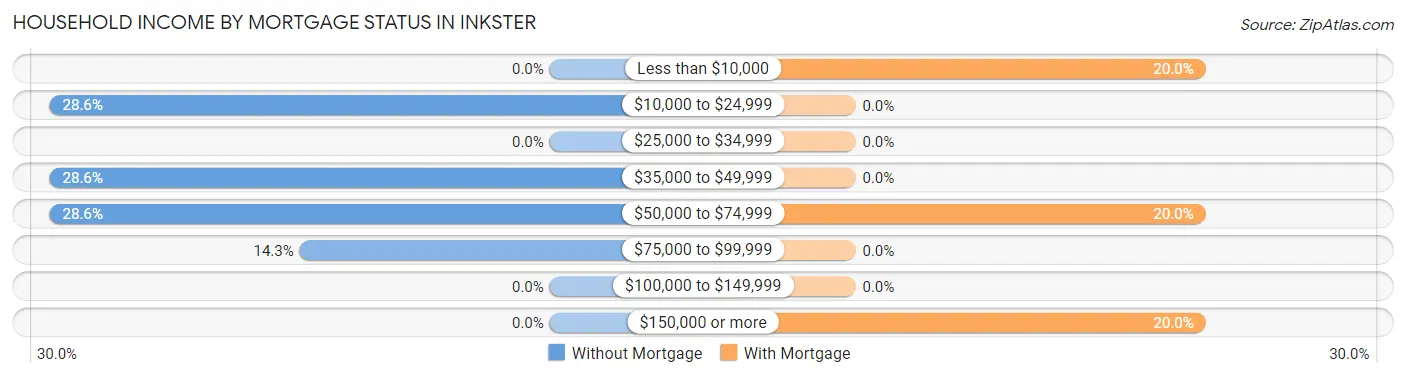
| Household Income | Without Mortgage | With Mortgage |
| Less than $10,000 | 0 (0.0%) | 1 (20.0%) |
| $10,000 to $24,999 | 2 (28.6%) | 0 (0.0%) |
| $25,000 to $34,999 | 0 (0.0%) | 0 (0.0%) |
| $35,000 to $49,999 | 2 (28.6%) | 0 (0.0%) |
| $50,000 to $74,999 | 2 (28.6%) | 1 (20.0%) |
| $75,000 to $99,999 | 1 (14.3%) | 0 (0.0%) |
| $100,000 to $149,999 | 0 (0.0%) | 0 (0.0%) |
| $150,000 or more | 0 (0.0%) | 1 (20.0%) |
| Total | 7 (100.0%) | 5 (100.0%) |
Property Value to Household Income Ratio in Inkster
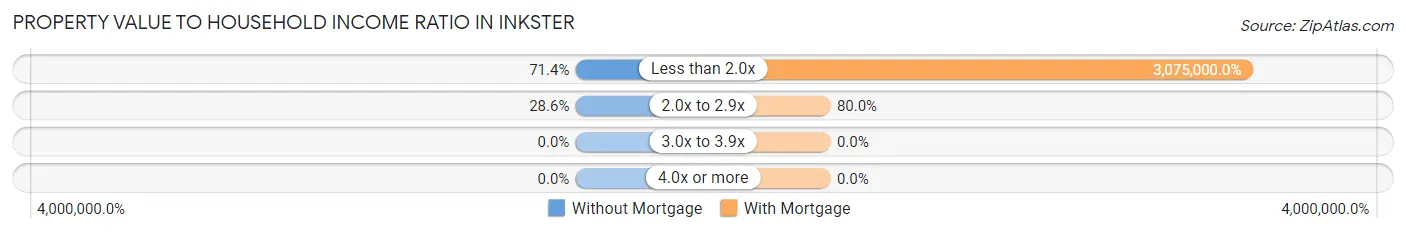
| Value-to-Income Ratio | Without Mortgage | With Mortgage |
| Less than 2.0x | 5 (71.4%) | 153,750 (3,075,000.0%) |
| 2.0x to 2.9x | 2 (28.6%) | 4 (80.0%) |
| 3.0x to 3.9x | 0 (0.0%) | 0 (0.0%) |
| 4.0x or more | 0 (0.0%) | 0 (0.0%) |
| Total | 7 (100.0%) | 5 (100.0%) |
Real Estate Taxes by Mortgage Status in Inkster
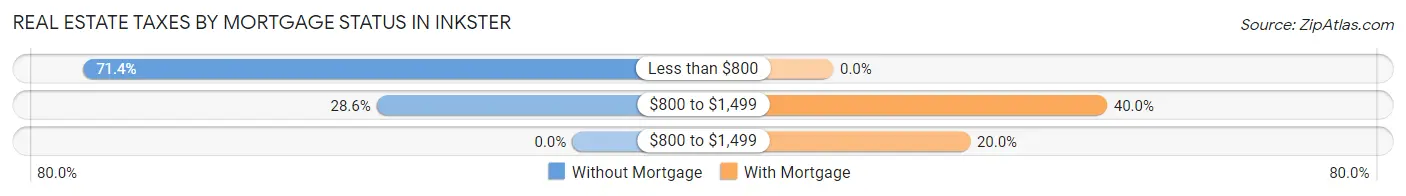
| Property Taxes | Without Mortgage | With Mortgage |
| Less than $800 | 5 (71.4%) | 0 (0.0%) |
| $800 to $1,499 | 2 (28.6%) | 2 (40.0%) |
| $800 to $1,499 | 0 (0.0%) | 1 (20.0%) |
| Total | 7 (100.0%) | 5 (100.0%) |
Health & Disability in Inkster
Health Insurance Coverage by Age in Inkster
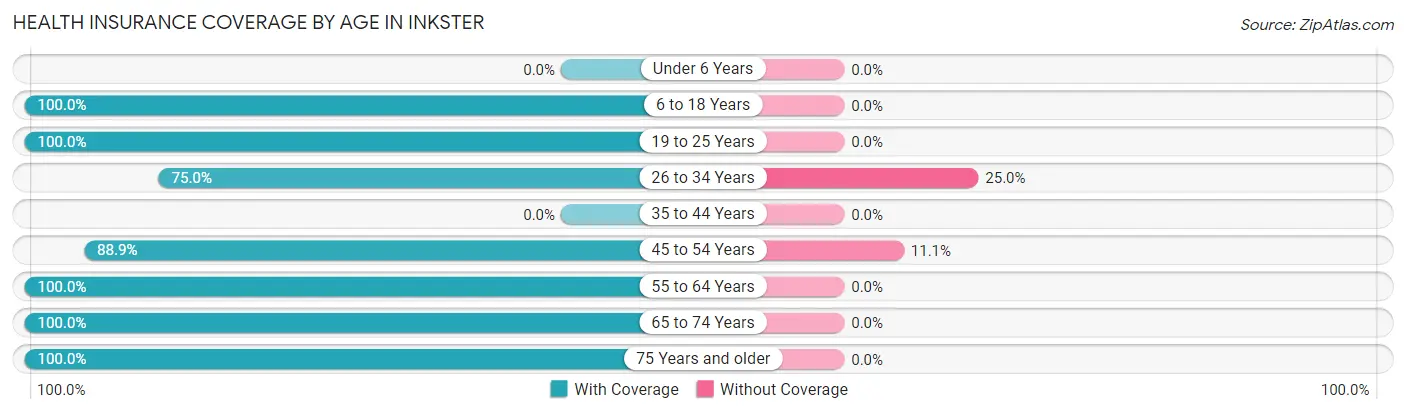
| Age Bracket | With Coverage | Without Coverage |
| Under 6 Years | 0 (0.0%) | 0 (0.0%) |
| 6 to 18 Years | 2 (100.0%) | 0 (0.0%) |
| 19 to 25 Years | 3 (100.0%) | 0 (0.0%) |
| 26 to 34 Years | 3 (75.0%) | 1 (25.0%) |
| 35 to 44 Years | 0 (0.0%) | 0 (0.0%) |
| 45 to 54 Years | 8 (88.9%) | 1 (11.1%) |
| 55 to 64 Years | 1 (100.0%) | 0 (0.0%) |
| 65 to 74 Years | 4 (100.0%) | 0 (0.0%) |
| 75 Years and older | 2 (100.0%) | 0 (0.0%) |
| Total | 23 (92.0%) | 2 (8.0%) |
Health Insurance Coverage by Citizenship Status in Inkster
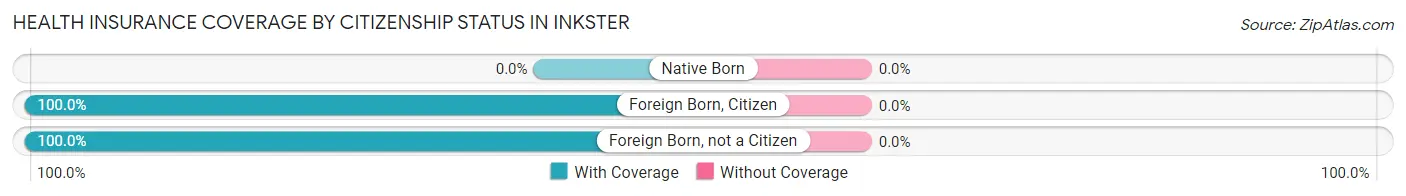
| Citizenship Status | With Coverage | Without Coverage |
| Native Born | 0 (0.0%) | 0 (0.0%) |
| Foreign Born, Citizen | 2 (100.0%) | 0 (0.0%) |
| Foreign Born, not a Citizen | 3 (100.0%) | 0 (0.0%) |
Health Insurance Coverage by Household Income in Inkster
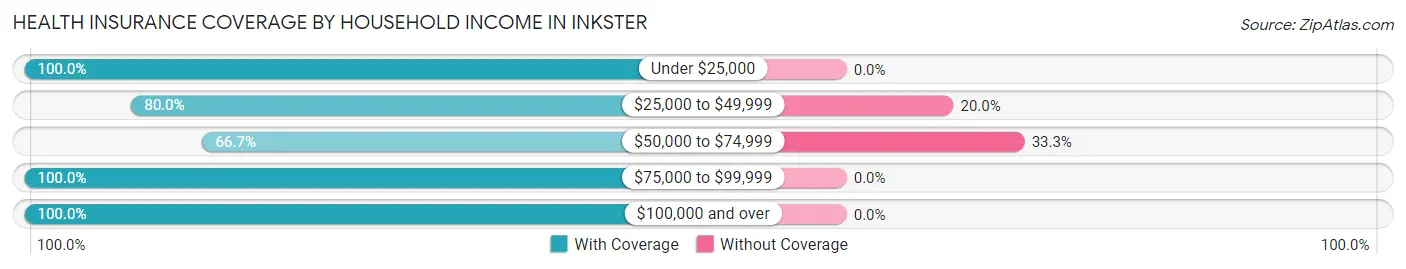
| Household Income | With Coverage | Without Coverage |
| Under $25,000 | 2 (100.0%) | 0 (0.0%) |
| $25,000 to $49,999 | 4 (80.0%) | 1 (20.0%) |
| $50,000 to $74,999 | 2 (66.7%) | 1 (33.3%) |
| $75,000 to $99,999 | 5 (100.0%) | 0 (0.0%) |
| $100,000 and over | 10 (100.0%) | 0 (0.0%) |
Public vs Private Health Insurance Coverage by Age in Inkster
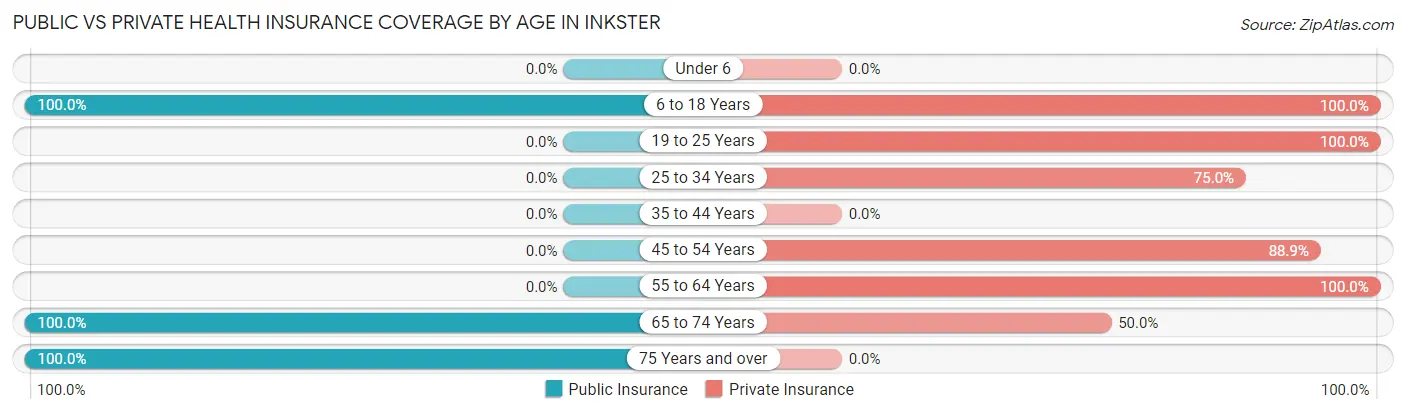
| Age Bracket | Public Insurance | Private Insurance |
| Under 6 | 0 (0.0%) | 0 (0.0%) |
| 6 to 18 Years | 2 (100.0%) | 2 (100.0%) |
| 19 to 25 Years | 0 (0.0%) | 3 (100.0%) |
| 25 to 34 Years | 0 (0.0%) | 3 (75.0%) |
| 35 to 44 Years | 0 (0.0%) | 0 (0.0%) |
| 45 to 54 Years | 0 (0.0%) | 8 (88.9%) |
| 55 to 64 Years | 0 (0.0%) | 1 (100.0%) |
| 65 to 74 Years | 4 (100.0%) | 2 (50.0%) |
| 75 Years and over | 2 (100.0%) | 0 (0.0%) |
| Total | 8 (32.0%) | 19 (76.0%) |
Disability Status by Sex by Age in Inkster
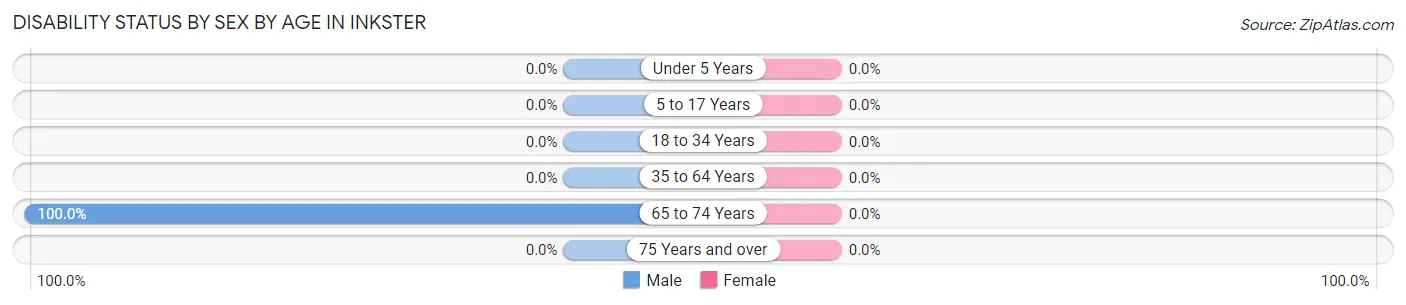
| Age Bracket | Male | Female |
| Under 5 Years | 0 (0.0%) | 0 (0.0%) |
| 5 to 17 Years | 0 (0.0%) | 0 (0.0%) |
| 18 to 34 Years | 0 (0.0%) | 0 (0.0%) |
| 35 to 64 Years | 0 (0.0%) | 0 (0.0%) |
| 65 to 74 Years | 3 (100.0%) | 0 (0.0%) |
| 75 Years and over | 0 (0.0%) | 0 (0.0%) |
Disability Class by Sex by Age in Inkster
Disability Class: Hearing Difficulty
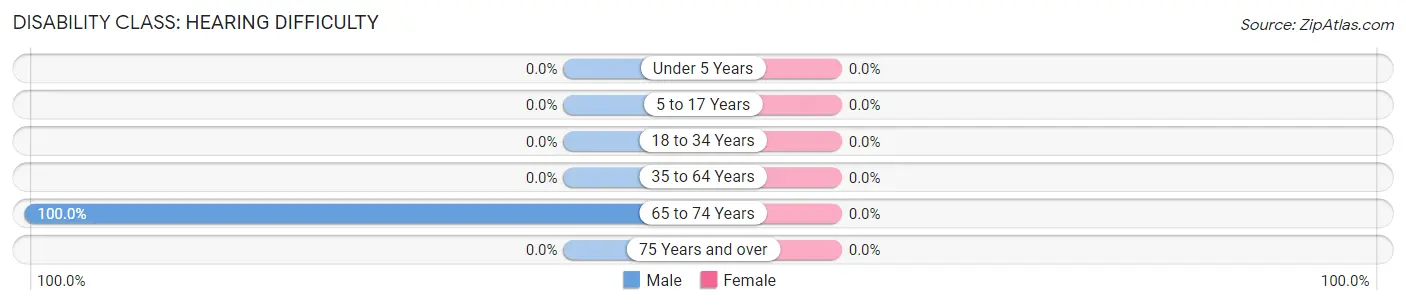
| Age Bracket | Male | Female |
| Under 5 Years | 0 (0.0%) | 0 (0.0%) |
| 5 to 17 Years | 0 (0.0%) | 0 (0.0%) |
| 18 to 34 Years | 0 (0.0%) | 0 (0.0%) |
| 35 to 64 Years | 0 (0.0%) | 0 (0.0%) |
| 65 to 74 Years | 3 (100.0%) | 0 (0.0%) |
| 75 Years and over | 0 (0.0%) | 0 (0.0%) |
Disability Class: Vision Difficulty
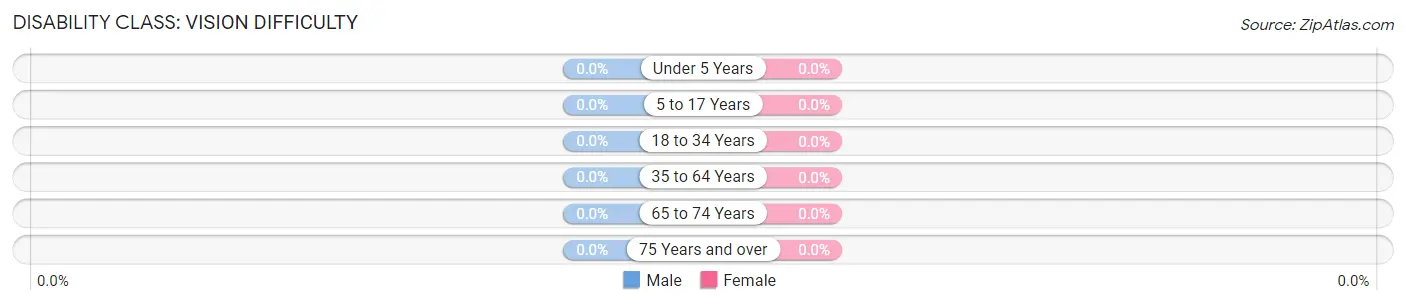
| Age Bracket | Male | Female |
| Under 5 Years | 0 (0.0%) | 0 (0.0%) |
| 5 to 17 Years | 0 (0.0%) | 0 (0.0%) |
| 18 to 34 Years | 0 (0.0%) | 0 (0.0%) |
| 35 to 64 Years | 0 (0.0%) | 0 (0.0%) |
| 65 to 74 Years | 0 (0.0%) | 0 (0.0%) |
| 75 Years and over | 0 (0.0%) | 0 (0.0%) |
Disability Class: Cognitive Difficulty
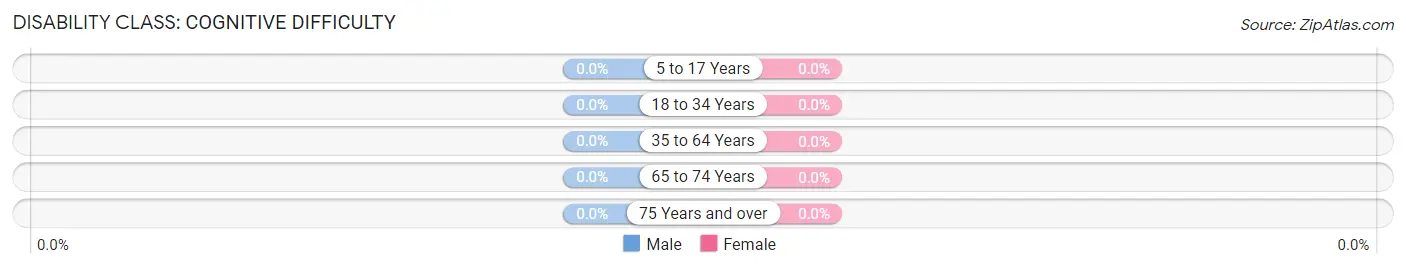
| Age Bracket | Male | Female |
| 5 to 17 Years | 0 (0.0%) | 0 (0.0%) |
| 18 to 34 Years | 0 (0.0%) | 0 (0.0%) |
| 35 to 64 Years | 0 (0.0%) | 0 (0.0%) |
| 65 to 74 Years | 0 (0.0%) | 0 (0.0%) |
| 75 Years and over | 0 (0.0%) | 0 (0.0%) |
Disability Class: Ambulatory Difficulty
| Age Bracket | Male | Female |
| 5 to 17 Years | 0 (0.0%) | 0 (0.0%) |
| 18 to 34 Years | 0 (0.0%) | 0 (0.0%) |
| 35 to 64 Years | 0 (0.0%) | 0 (0.0%) |
| 65 to 74 Years | 0 (0.0%) | 0 (0.0%) |
| 75 Years and over | 0 (0.0%) | 0 (0.0%) |
Disability Class: Self-Care Difficulty
| Age Bracket | Male | Female |
| 5 to 17 Years | 0 (0.0%) | 0 (0.0%) |
| 18 to 34 Years | 0 (0.0%) | 0 (0.0%) |
| 35 to 64 Years | 0 (0.0%) | 0 (0.0%) |
| 65 to 74 Years | 0 (0.0%) | 0 (0.0%) |
| 75 Years and over | 0 (0.0%) | 0 (0.0%) |
Technology Access in Inkster
Computing Device Access in Inkster
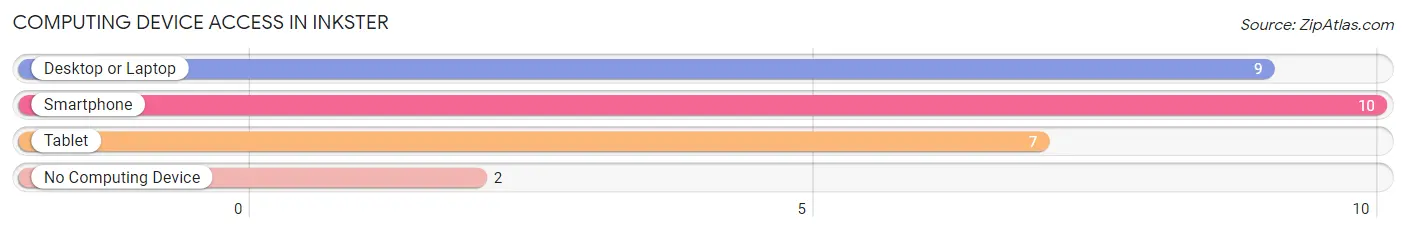
| Device Type | # Households | % Households |
| Desktop or Laptop | 9 | 75.0% |
| Smartphone | 10 | 83.3% |
| Tablet | 7 | 58.3% |
| No Computing Device | 2 | 16.7% |
| Total | 12 | 100.0% |
Internet Access in Inkster
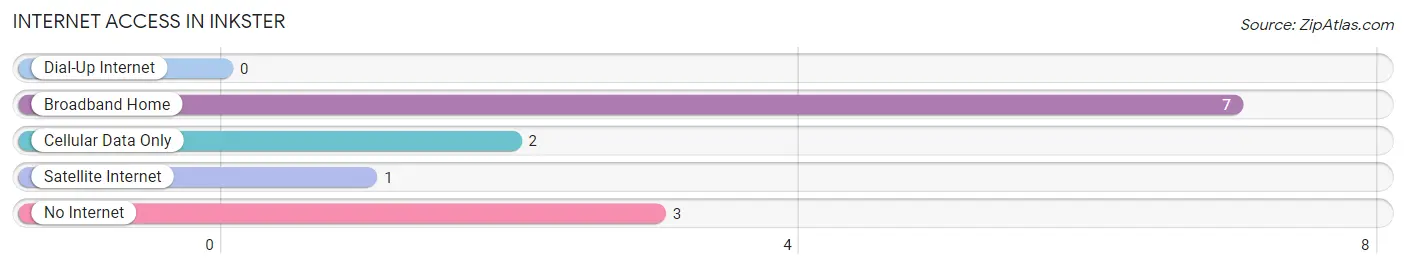
| Internet Type | # Households | % Households |
| Dial-Up Internet | 0 | 0.0% |
| Broadband Home | 7 | 58.3% |
| Cellular Data Only | 2 | 16.7% |
| Satellite Internet | 1 | 8.3% |
| No Internet | 3 | 25.0% |
| Total | 12 | 100.0% |
Inkster Summary
Inkster, North Dakota is a small town located in Grand Forks County, in the northeastern part of the state. The town was founded in 1883 and is named after the Inkster family, who were among the first settlers in the area. The population of Inkster was estimated to be around 200 people in 2020.
Geography
Inkster is located in the Red River Valley, which is a flat, fertile region of North Dakota. The town is situated on the banks of the Red River, which is the border between North Dakota and Minnesota. The town is surrounded by agricultural land, and the main crops grown in the area are wheat, corn, and soybeans. The town is also located near the Turtle Mountains, which are a range of hills and mountains located in the northern part of the state.
Economy
Inkster’s economy is largely based on agriculture. The town is home to several farms, which produce wheat, corn, and soybeans. The town also has a few small businesses, such as a grocery store, a hardware store, and a few restaurants.
Demographics
Inkster is a predominantly white town, with the majority of the population being of German and Norwegian descent. The town also has a small Native American population, with the majority of the Native Americans living in the nearby Turtle Mountain Reservation. The median household income in Inkster is around $45,000, and the median home value is around $90,000.
History
Inkster was founded in 1883 by the Inkster family, who were among the first settlers in the area. The town was originally called Inksterville, but the name was changed to Inkster in 1887. The town was a popular stop for travelers on the Red River Trail, which was a major route for settlers heading west. The town was also a popular destination for hunters and trappers, who would come to the area to hunt and trap fur-bearing animals.
In the early 1900s, Inkster was a thriving community, with a population of over 500 people. The town had several businesses, including a hotel, a bank, a post office, and a general store. The town also had a school, a church, and a newspaper.
In the late 1900s, the population of Inkster began to decline, as many of the town’s residents moved away to larger cities. The town’s population is now estimated to be around 200 people. Despite its small size, Inkster is still a vibrant community, with a strong sense of community and pride.
Common Questions
What is Per Capita Income in Inkster?
Per Capita income in Inkster is $53,592.
What is the Median Family Income in Inkster?
Median Family Income in Inkster is $148,750.
What is Inequality or Gini Index in Inkster?
Inequality or Gini Index in Inkster is 0.40.
What is the Total Population of Inkster?
Total Population of Inkster is 26.
What is the Total Male Population of Inkster?
Total Male Population of Inkster is 15.
What is the Total Female Population of Inkster?
Total Female Population of Inkster is 11.
What is the Ratio of Males per 100 Females in Inkster?
There are 136.36 Males per 100 Females in Inkster.
What is the Ratio of Females per 100 Males in Inkster?
There are 73.33 Females per 100 Males in Inkster.
What is the Median Population Age in Inkster?
Median Population Age in Inkster is 48.0 Years.
What is the Average Family Size in Inkster
Average Family Size in Inkster is 3.0 People.
What is the Average Household Size in Inkster
Average Household Size in Inkster is 2.2 People.
How Large is the Labor Force in Inkster?
There are 17 People in the Labor Forcein in Inkster.
What is the Percentage of People in the Labor Force in Inkster?
70.8% of People are in the Labor Force in Inkster.