Centerville, MN Map & Demographics
Centerville Map
Centerville Overview
$52,958
PER CAPITA INCOME
$149,671
AVG FAMILY INCOME
$117,481
AVG HOUSEHOLD INCOME
17.3%
WAGE / INCOME GAP [ % ]
82.7¢/ $1
WAGE / INCOME GAP [ $ ]
0.34
INEQUALITY / GINI INDEX
3,916
TOTAL POPULATION
1,939
MALE POPULATION
1,977
FEMALE POPULATION
98.08
MALES / 100 FEMALES
101.96
FEMALES / 100 MALES
39.0
MEDIAN AGE
3.4
AVG FAMILY SIZE
2.8
AVG HOUSEHOLD SIZE
2,276
LABOR FORCE [ PEOPLE ]
76.2%
PERCENT IN LABOR FORCE
0.6%
UNEMPLOYMENT RATE
Income in Centerville
Income Overview in Centerville
Per Capita Income in Centerville is $52,958, while median incomes of families and households are $149,671 and $117,481 respectively.
| Characteristic | Number | Measure |
| Per Capita Income | 3,916 | $52,958 |
| Median Family Income | 983 | $149,671 |
| Mean Family Income | 983 | $169,956 |
| Median Household Income | 1,405 | $117,481 |
| Mean Household Income | 1,405 | $143,882 |
| Income Deficit | 983 | $0 |
| Wage / Income Gap (%) | 3,916 | 17.26% |
| Wage / Income Gap ($) | 3,916 | 82.74¢ per $1 |
| Gini / Inequality Index | 3,916 | 0.34 |
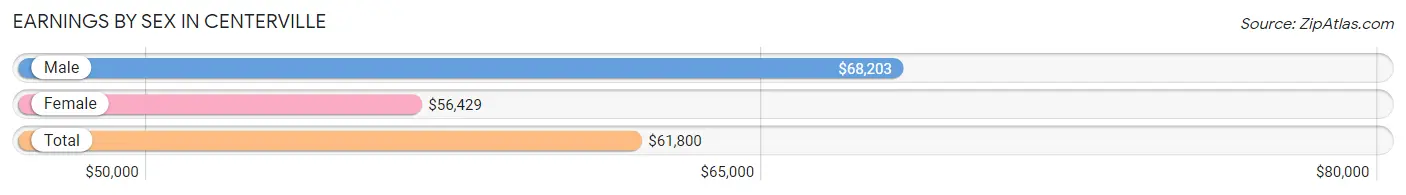
Earnings by Sex in Centerville
Average Earnings in Centerville are $61,800, $68,203 for men and $56,429 for women, a difference of 17.3%.
| Sex | Number | Average Earnings |
| Male | 1,186 (51.1%) | $68,203 |
| Female | 1,134 (48.9%) | $56,429 |
| Total | 2,320 (100.0%) | $61,800 |
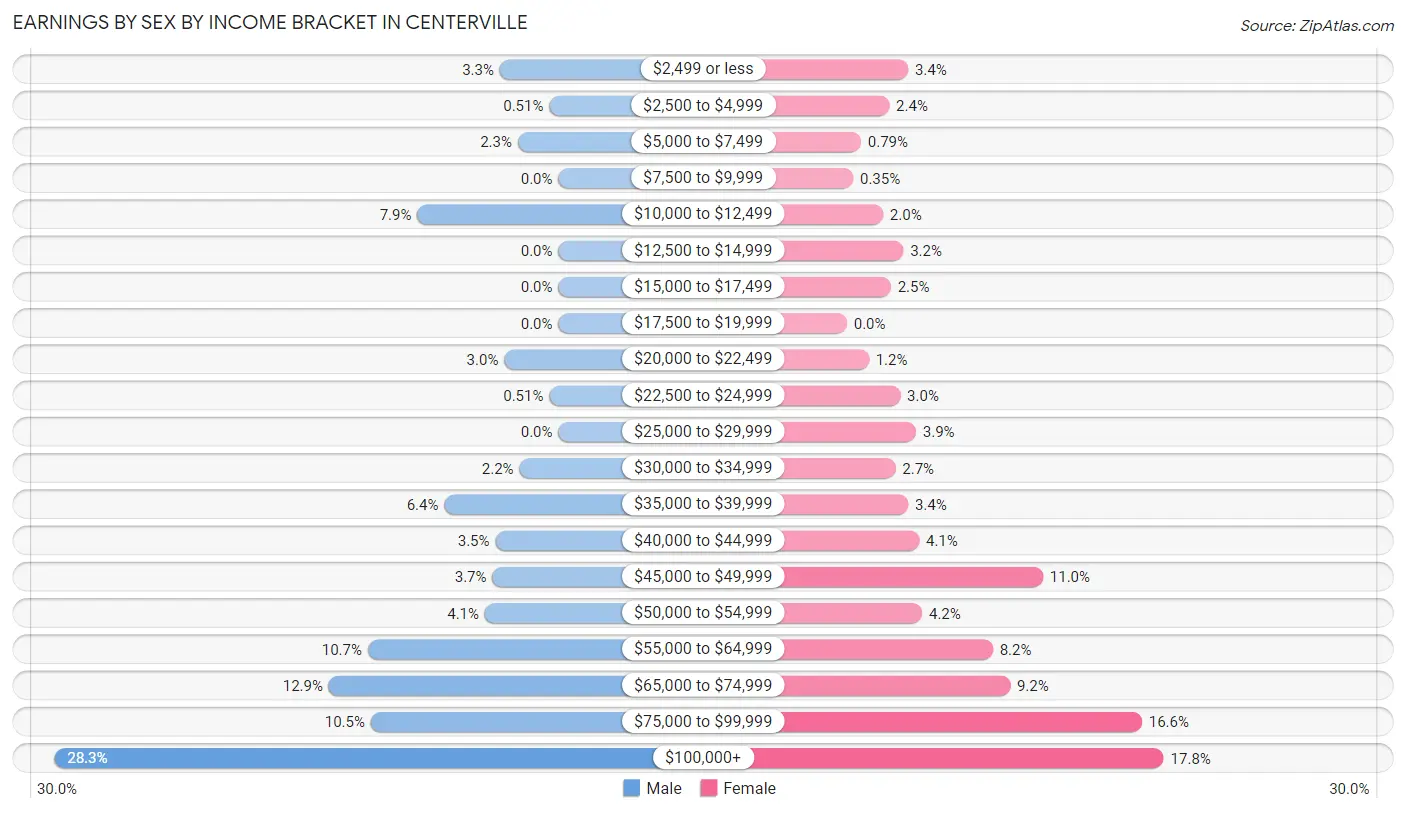
Earnings by Sex by Income Bracket in Centerville
The most common earnings brackets in Centerville are $100,000+ for men (336 | 28.3%) and $100,000+ for women (202 | 17.8%).
| Income | Male | Female |
| $2,499 or less | 39 (3.3%) | 39 (3.4%) |
| $2,500 to $4,999 | 6 (0.5%) | 27 (2.4%) |
| $5,000 to $7,499 | 27 (2.3%) | 9 (0.8%) |
| $7,500 to $9,999 | 0 (0.0%) | 4 (0.4%) |
| $10,000 to $12,499 | 94 (7.9%) | 23 (2.0%) |
| $12,500 to $14,999 | 0 (0.0%) | 36 (3.2%) |
| $15,000 to $17,499 | 0 (0.0%) | 28 (2.5%) |
| $17,500 to $19,999 | 0 (0.0%) | 0 (0.0%) |
| $20,000 to $22,499 | 36 (3.0%) | 14 (1.2%) |
| $22,500 to $24,999 | 6 (0.5%) | 34 (3.0%) |
| $25,000 to $29,999 | 0 (0.0%) | 44 (3.9%) |
| $30,000 to $34,999 | 26 (2.2%) | 31 (2.7%) |
| $35,000 to $39,999 | 76 (6.4%) | 39 (3.4%) |
| $40,000 to $44,999 | 42 (3.5%) | 46 (4.1%) |
| $45,000 to $49,999 | 44 (3.7%) | 125 (11.0%) |
| $50,000 to $54,999 | 49 (4.1%) | 48 (4.2%) |
| $55,000 to $64,999 | 127 (10.7%) | 93 (8.2%) |
| $65,000 to $74,999 | 153 (12.9%) | 104 (9.2%) |
| $75,000 to $99,999 | 125 (10.5%) | 188 (16.6%) |
| $100,000+ | 336 (28.3%) | 202 (17.8%) |
| Total | 1,186 (100.0%) | 1,134 (100.0%) |
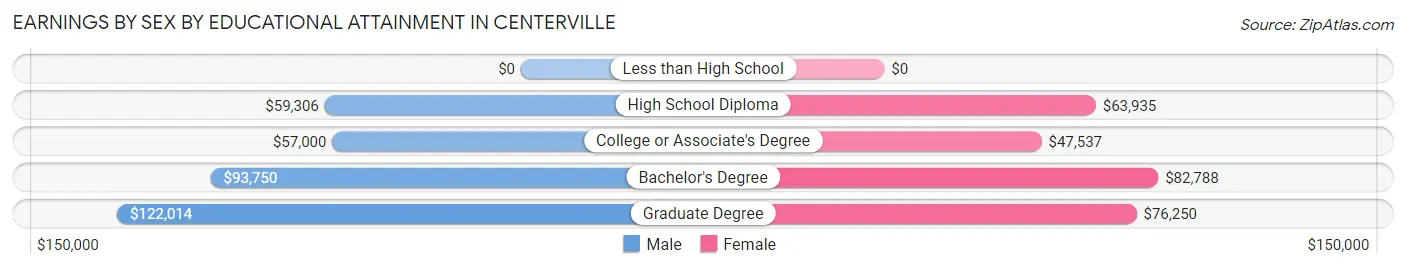
Earnings by Sex by Educational Attainment in Centerville
Average earnings in Centerville are $72,125 for men and $64,962 for women, a difference of 9.9%. Men with an educational attainment of graduate degree enjoy the highest average annual earnings of $122,014, while those with college or associate's degree education earn the least with $57,000. Women with an educational attainment of bachelor's degree earn the most with the average annual earnings of $82,788, while those with college or associate's degree education have the smallest earnings of $47,537.
| Educational Attainment | Male Income | Female Income |
| Less than High School | - | - |
| High School Diploma | $59,306 | $63,935 |
| College or Associate's Degree | $57,000 | $47,537 |
| Bachelor's Degree | $93,750 | $82,788 |
| Graduate Degree | $122,014 | $76,250 |
| Total | $72,125 | $64,962 |
Family Income in Centerville
Family Income Brackets in Centerville
According to the Centerville family income data, there are 267 families falling into the $200,000+ income range, which is the most common income bracket and makes up 27.2% of all families.
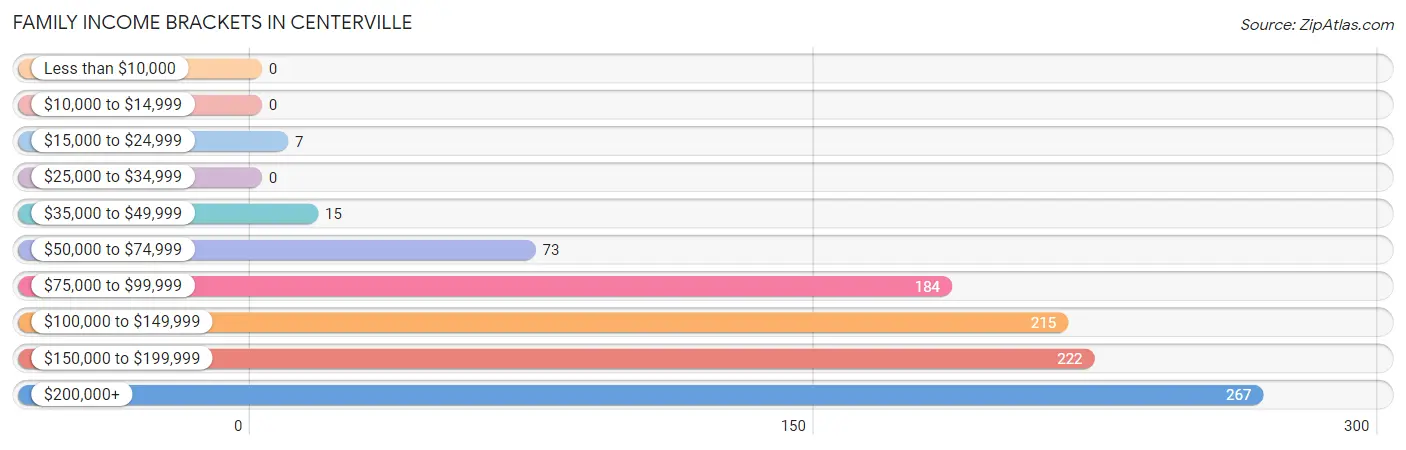
| Income Bracket | # Families | % Families |
| Less than $10,000 | 0 | 0.0% |
| $10,000 to $14,999 | 0 | 0.0% |
| $15,000 to $24,999 | 7 | 0.7% |
| $25,000 to $34,999 | 0 | 0.0% |
| $35,000 to $49,999 | 15 | 1.5% |
| $50,000 to $74,999 | 73 | 7.4% |
| $75,000 to $99,999 | 184 | 18.7% |
| $100,000 to $149,999 | 215 | 21.9% |
| $150,000 to $199,999 | 222 | 22.6% |
| $200,000+ | 267 | 27.2% |
Family Income by Famaliy Size in Centerville
3-person families (173 | 17.6%) account for the highest median family income in Centerville with $171,875 per family, while 3-person families (173 | 17.6%) have the highest median income of $57,292 per family member.
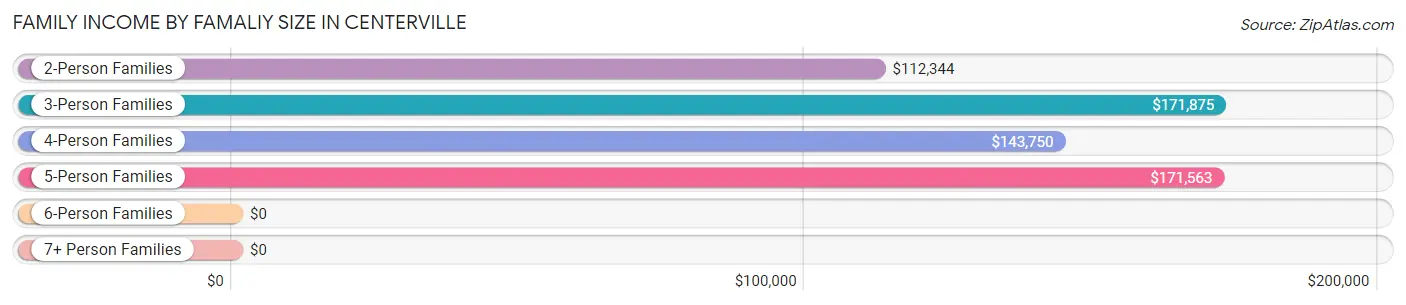
| Income Bracket | # Families | Median Income |
| 2-Person Families | 421 (42.8%) | $112,344 |
| 3-Person Families | 173 (17.6%) | $171,875 |
| 4-Person Families | 159 (16.2%) | $143,750 |
| 5-Person Families | 175 (17.8%) | $171,563 |
| 6-Person Families | 34 (3.5%) | $0 |
| 7+ Person Families | 21 (2.1%) | $0 |
| Total | 983 (100.0%) | $149,671 |
Family Income by Number of Earners in Centerville
The median family income in Centerville is $149,671, with families comprising 3+ earners (185) having the highest median family income of $183,594, while families with 1 earner (225) have the lowest median family income of $96,681, accounting for 18.8% and 22.9% of families, respectively.
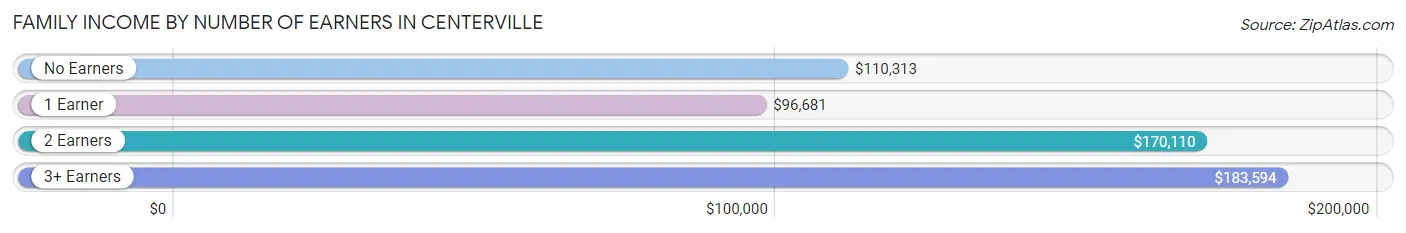
| Number of Earners | # Families | Median Income |
| No Earners | 98 (10.0%) | $110,313 |
| 1 Earner | 225 (22.9%) | $96,681 |
| 2 Earners | 475 (48.3%) | $170,110 |
| 3+ Earners | 185 (18.8%) | $183,594 |
| Total | 983 (100.0%) | $149,671 |
Household Income in Centerville
Household Income Brackets in Centerville
With 320 households falling in the category, the $100,000 to $149,999 income range is the most frequent in Centerville, accounting for 22.8% of all households.
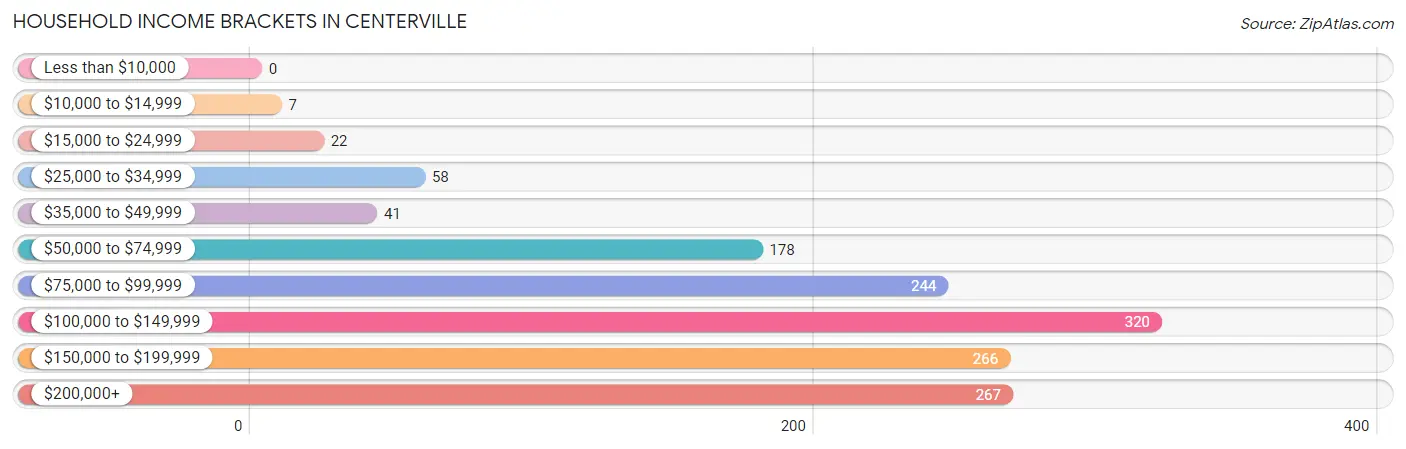
| Income Bracket | # Households | % Households |
| Less than $10,000 | 0 | 0.0% |
| $10,000 to $14,999 | 7 | 0.5% |
| $15,000 to $24,999 | 22 | 1.6% |
| $25,000 to $34,999 | 58 | 4.1% |
| $35,000 to $49,999 | 41 | 2.9% |
| $50,000 to $74,999 | 178 | 12.7% |
| $75,000 to $99,999 | 244 | 17.4% |
| $100,000 to $149,999 | 320 | 22.8% |
| $150,000 to $199,999 | 266 | 18.9% |
| $200,000+ | 267 | 19.0% |
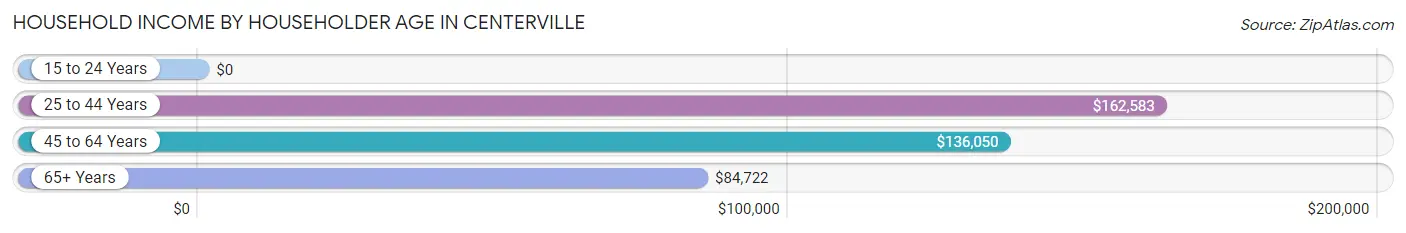
Household Income by Householder Age in Centerville
The median household income in Centerville is $117,481, with the highest median household income of $162,583 found in the 25 to 44 years age bracket for the primary householder. A total of 455 households (32.4%) fall into this category. Meanwhile, the 15 to 24 years age bracket for the primary householder has the lowest median household income of $0, with 11 households (0.8%) in this group.
| Income Bracket | # Households | Median Income |
| 15 to 24 Years | 11 (0.8%) | $0 |
| 25 to 44 Years | 455 (32.4%) | $162,583 |
| 45 to 64 Years | 619 (44.1%) | $136,050 |
| 65+ Years | 320 (22.8%) | $84,722 |
| Total | 1,405 (100.0%) | $117,481 |
Poverty in Centerville
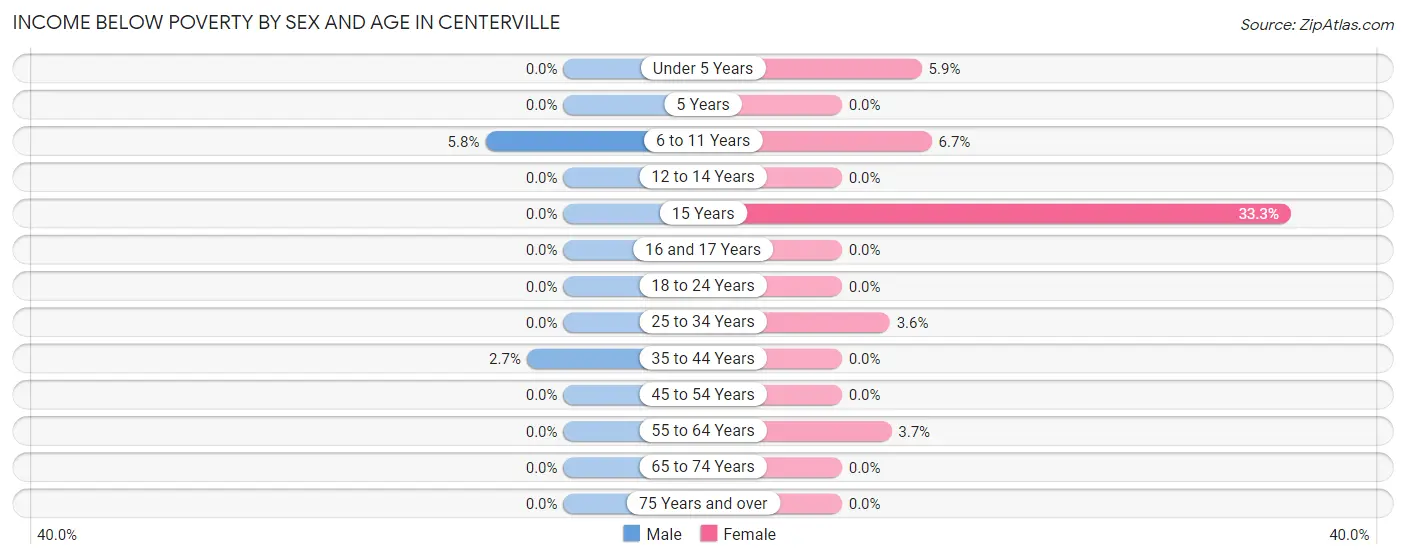
Income Below Poverty by Sex and Age in Centerville
With 0.9% poverty level for males and 2.7% for females among the residents of Centerville, 6 to 11 year old males and 15 year old females are the most vulnerable to poverty, with 8 males (5.8%) and 14 females (33.3%) in their respective age groups living below the poverty level.
| Age Bracket | Male | Female |
| Under 5 Years | 0 (0.0%) | 8 (5.9%) |
| 5 Years | 0 (0.0%) | 0 (0.0%) |
| 6 to 11 Years | 8 (5.8%) | 17 (6.7%) |
| 12 to 14 Years | 0 (0.0%) | 0 (0.0%) |
| 15 Years | 0 (0.0%) | 14 (33.3%) |
| 16 and 17 Years | 0 (0.0%) | 0 (0.0%) |
| 18 to 24 Years | 0 (0.0%) | 0 (0.0%) |
| 25 to 34 Years | 0 (0.0%) | 8 (3.6%) |
| 35 to 44 Years | 9 (2.7%) | 0 (0.0%) |
| 45 to 54 Years | 0 (0.0%) | 0 (0.0%) |
| 55 to 64 Years | 0 (0.0%) | 7 (3.7%) |
| 65 to 74 Years | 0 (0.0%) | 0 (0.0%) |
| 75 Years and over | 0 (0.0%) | 0 (0.0%) |
| Total | 17 (0.9%) | 54 (2.7%) |
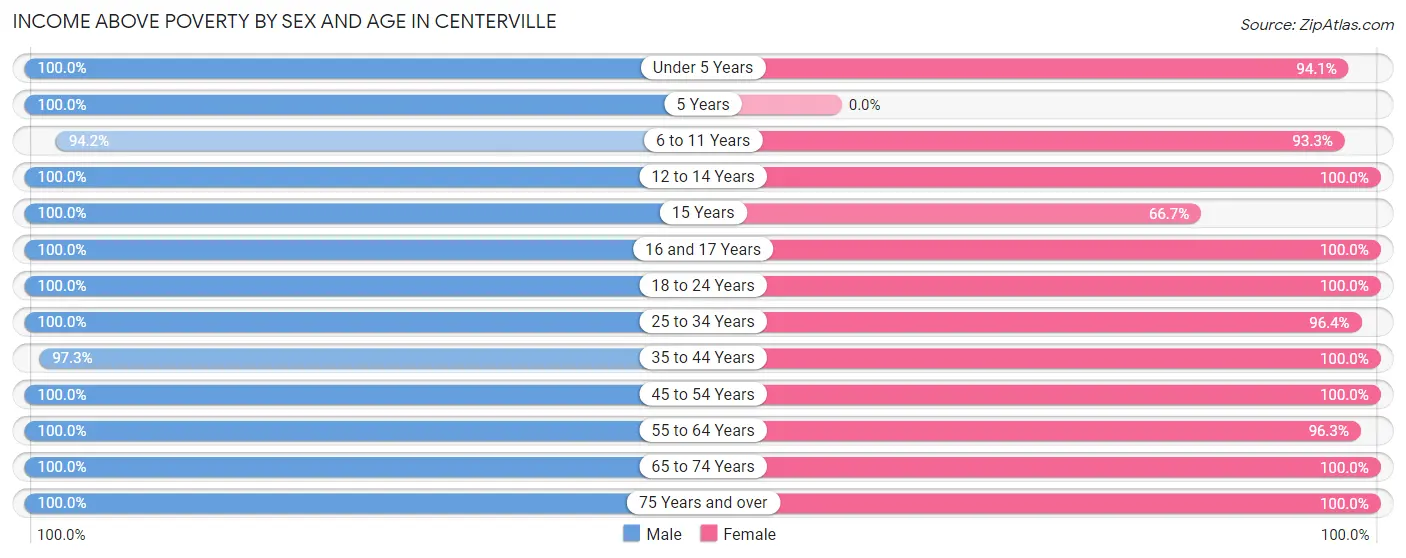
Income Above Poverty by Sex and Age in Centerville
According to the poverty statistics in Centerville, males aged under 5 years and females aged 12 to 14 years are the age groups that are most secure financially, with 100.0% of males and 100.0% of females in these age groups living above the poverty line.
| Age Bracket | Male | Female |
| Under 5 Years | 117 (100.0%) | 127 (94.1%) |
| 5 Years | 40 (100.0%) | 0 (0.0%) |
| 6 to 11 Years | 130 (94.2%) | 238 (93.3%) |
| 12 to 14 Years | 127 (100.0%) | 41 (100.0%) |
| 15 Years | 22 (100.0%) | 28 (66.7%) |
| 16 and 17 Years | 59 (100.0%) | 69 (100.0%) |
| 18 to 24 Years | 144 (100.0%) | 83 (100.0%) |
| 25 to 34 Years | 159 (100.0%) | 217 (96.4%) |
| 35 to 44 Years | 322 (97.3%) | 355 (100.0%) |
| 45 to 54 Years | 242 (100.0%) | 273 (100.0%) |
| 55 to 64 Years | 310 (100.0%) | 183 (96.3%) |
| 65 to 74 Years | 148 (100.0%) | 175 (100.0%) |
| 75 Years and over | 90 (100.0%) | 134 (100.0%) |
| Total | 1,910 (99.1%) | 1,923 (97.3%) |
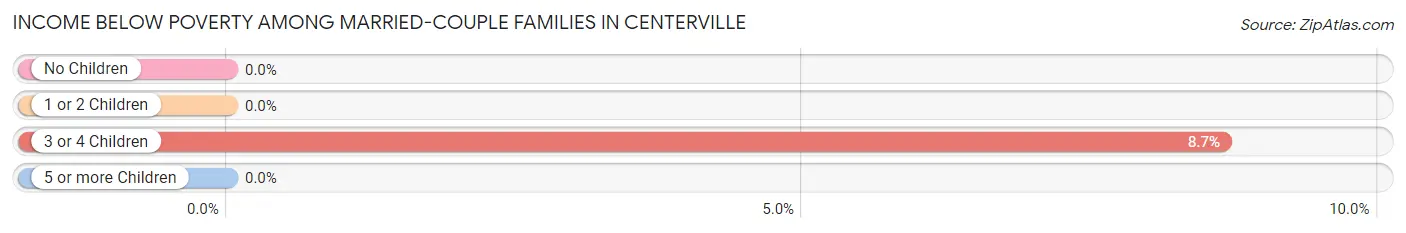
Income Below Poverty Among Married-Couple Families in Centerville
The poverty statistics for married-couple families in Centerville show that 1.1% or 9 of the total 826 families live below the poverty line. Families with 3 or 4 children have the highest poverty rate of 8.6%, comprising of 9 families. On the other hand, families with no children have the lowest poverty rate of 0.0%, which includes 0 families.
| Children | Above Poverty | Below Poverty |
| No Children | 442 (100.0%) | 0 (0.0%) |
| 1 or 2 Children | 280 (100.0%) | 0 (0.0%) |
| 3 or 4 Children | 95 (91.3%) | 9 (8.6%) |
| 5 or more Children | 0 (0.0%) | 0 (0.0%) |
| Total | 817 (98.9%) | 9 (1.1%) |
Income Below Poverty Among Single-Parent Households in Centerville
| Children | Single Father | Single Mother |
| No Children | 0 (0.0%) | 0 (0.0%) |
| 1 or 2 Children | 0 (0.0%) | 0 (0.0%) |
| 3 or 4 Children | 0 (0.0%) | 0 (0.0%) |
| 5 or more Children | 0 (0.0%) | 0 (0.0%) |
| Total | 0 (0.0%) | 0 (0.0%) |
Income Below Poverty Among Married-Couple vs Single-Parent Households in Centerville
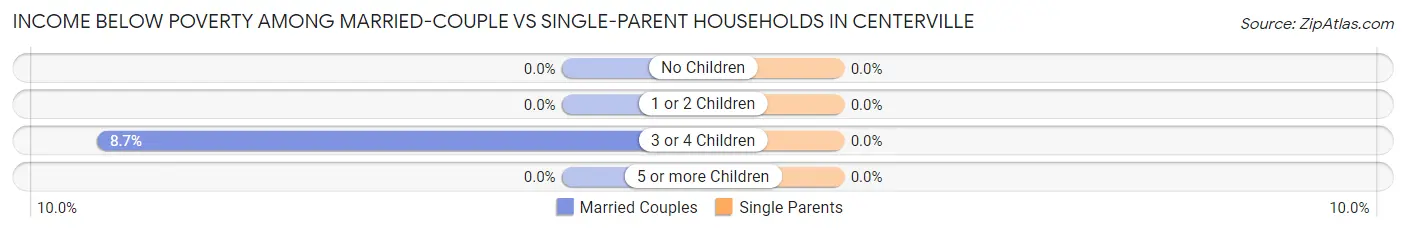
| Children | Married-Couple Families | Single-Parent Households |
| No Children | 0 (0.0%) | 0 (0.0%) |
| 1 or 2 Children | 0 (0.0%) | 0 (0.0%) |
| 3 or 4 Children | 9 (8.6%) | 0 (0.0%) |
| 5 or more Children | 0 (0.0%) | 0 (0.0%) |
| Total | 9 (1.1%) | 0 (0.0%) |
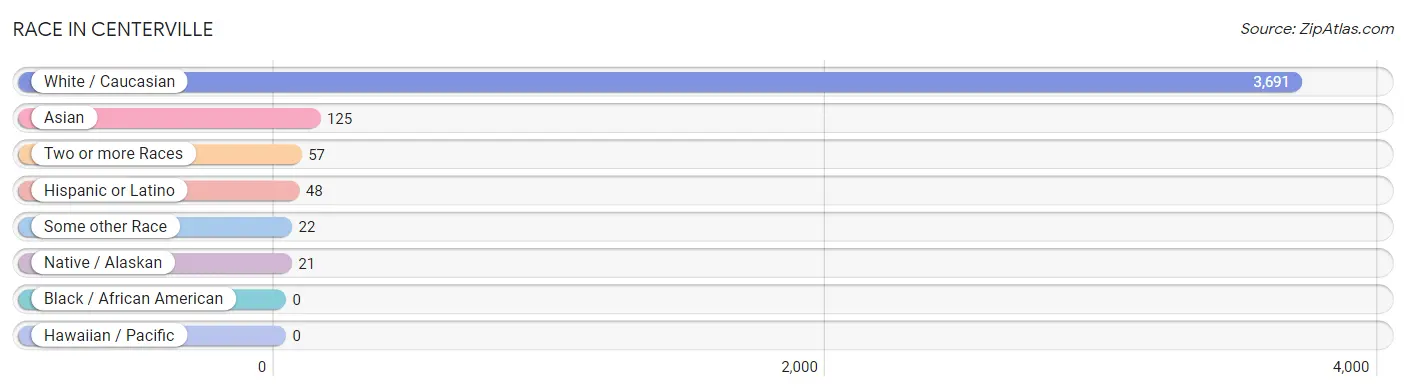
Race in Centerville
The most populous races in Centerville are White / Caucasian (3,691 | 94.3%), Asian (125 | 3.2%), and Two or more Races (57 | 1.5%).
| Race | # Population | % Population |
| Asian | 125 | 3.2% |
| Black / African American | 0 | 0.0% |
| Hawaiian / Pacific | 0 | 0.0% |
| Hispanic or Latino | 48 | 1.2% |
| Native / Alaskan | 21 | 0.5% |
| White / Caucasian | 3,691 | 94.3% |
| Two or more Races | 57 | 1.5% |
| Some other Race | 22 | 0.6% |
| Total | 3,916 | 100.0% |
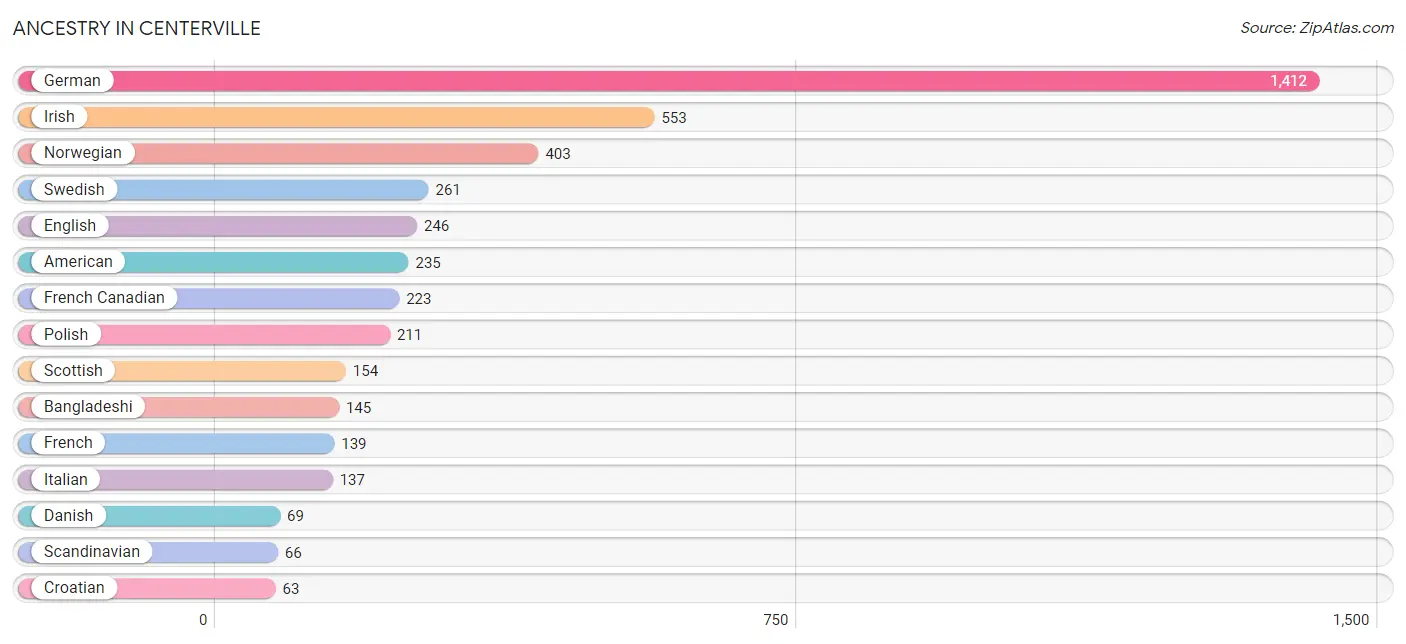
Ancestry in Centerville
The most populous ancestries reported in Centerville are German (1,412 | 36.1%), Irish (553 | 14.1%), Norwegian (403 | 10.3%), Swedish (261 | 6.7%), and English (246 | 6.3%), together accounting for 73.4% of all Centerville residents.
| Ancestry | # Population | % Population |
| American | 235 | 6.0% |
| Arab | 29 | 0.7% |
| Austrian | 14 | 0.4% |
| Bangladeshi | 145 | 3.7% |
| Belgian | 29 | 0.7% |
| Chippewa | 1 | 0.0% |
| Croatian | 63 | 1.6% |
| Czech | 34 | 0.9% |
| Danish | 69 | 1.8% |
| Dutch | 40 | 1.0% |
| Eastern European | 42 | 1.1% |
| English | 246 | 6.3% |
| European | 46 | 1.2% |
| Finnish | 58 | 1.5% |
| French | 139 | 3.5% |
| French Canadian | 223 | 5.7% |
| German | 1,412 | 36.1% |
| Hungarian | 8 | 0.2% |
| Irish | 553 | 14.1% |
| Italian | 137 | 3.5% |
| Lithuanian | 12 | 0.3% |
| Mexican | 26 | 0.7% |
| Northern European | 11 | 0.3% |
| Norwegian | 403 | 10.3% |
| Polish | 211 | 5.4% |
| Romanian | 10 | 0.3% |
| Russian | 28 | 0.7% |
| Scandinavian | 66 | 1.7% |
| Scotch-Irish | 38 | 1.0% |
| Scottish | 154 | 3.9% |
| Sioux | 21 | 0.5% |
| Slovak | 13 | 0.3% |
| Sri Lankan | 3 | 0.1% |
| Swedish | 261 | 6.7% |
| Swiss | 30 | 0.8% | View All 35 Rows |
Immigrants in Centerville
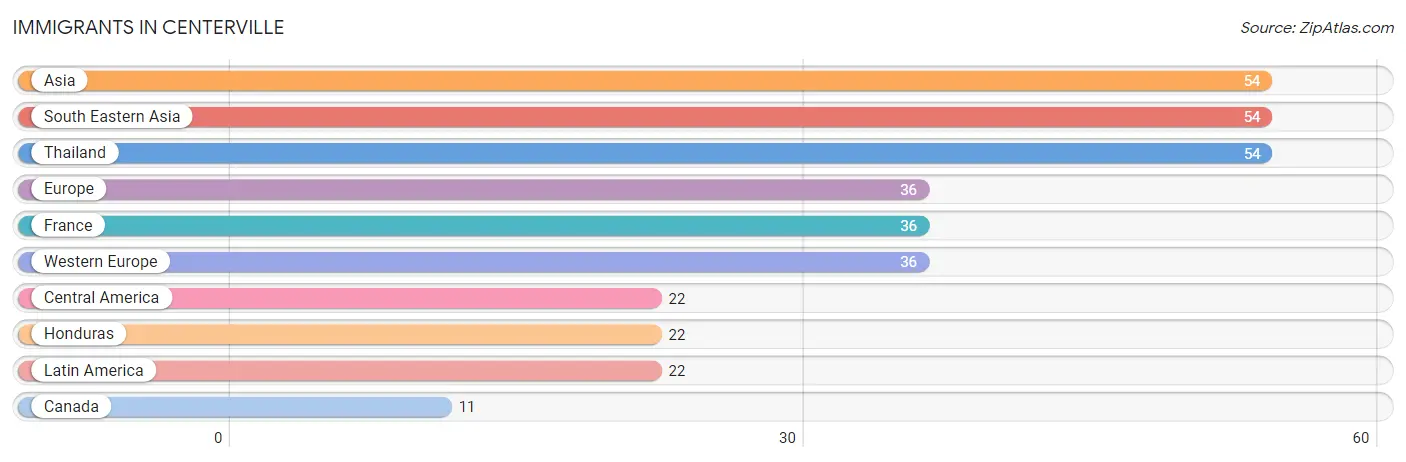
The most numerous immigrant groups reported in Centerville came from Asia (54 | 1.4%), South Eastern Asia (54 | 1.4%), Thailand (54 | 1.4%), Europe (36 | 0.9%), and France (36 | 0.9%), together accounting for 6.0% of all Centerville residents.
| Immigration Origin | # Population | % Population |
| Asia | 54 | 1.4% |
| Canada | 11 | 0.3% |
| Central America | 22 | 0.6% |
| Europe | 36 | 0.9% |
| France | 36 | 0.9% |
| Honduras | 22 | 0.6% |
| Latin America | 22 | 0.6% |
| South Eastern Asia | 54 | 1.4% |
| Thailand | 54 | 1.4% |
| Western Europe | 36 | 0.9% | View All 10 Rows |
Sex and Age in Centerville
Sex and Age in Centerville
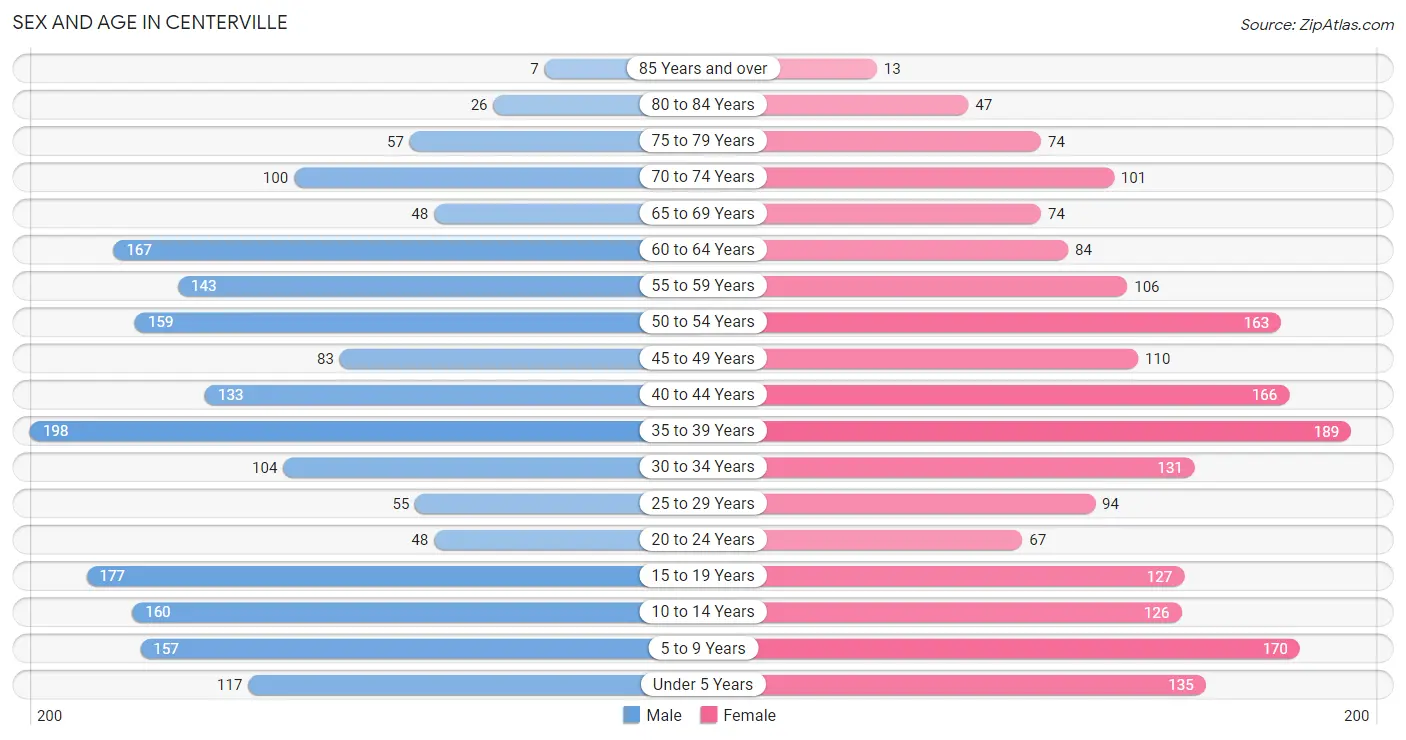
The most populous age groups in Centerville are 35 to 39 Years (198 | 10.2%) for men and 35 to 39 Years (189 | 9.6%) for women.
| Age Bracket | Male | Female |
| Under 5 Years | 117 (6.0%) | 135 (6.8%) |
| 5 to 9 Years | 157 (8.1%) | 170 (8.6%) |
| 10 to 14 Years | 160 (8.3%) | 126 (6.4%) |
| 15 to 19 Years | 177 (9.1%) | 127 (6.4%) |
| 20 to 24 Years | 48 (2.5%) | 67 (3.4%) |
| 25 to 29 Years | 55 (2.8%) | 94 (4.8%) |
| 30 to 34 Years | 104 (5.4%) | 131 (6.6%) |
| 35 to 39 Years | 198 (10.2%) | 189 (9.6%) |
| 40 to 44 Years | 133 (6.9%) | 166 (8.4%) |
| 45 to 49 Years | 83 (4.3%) | 110 (5.6%) |
| 50 to 54 Years | 159 (8.2%) | 163 (8.2%) |
| 55 to 59 Years | 143 (7.4%) | 106 (5.4%) |
| 60 to 64 Years | 167 (8.6%) | 84 (4.3%) |
| 65 to 69 Years | 48 (2.5%) | 74 (3.7%) |
| 70 to 74 Years | 100 (5.2%) | 101 (5.1%) |
| 75 to 79 Years | 57 (2.9%) | 74 (3.7%) |
| 80 to 84 Years | 26 (1.3%) | 47 (2.4%) |
| 85 Years and over | 7 (0.4%) | 13 (0.7%) |
| Total | 1,939 (100.0%) | 1,977 (100.0%) |
Families and Households in Centerville
Median Family Size in Centerville
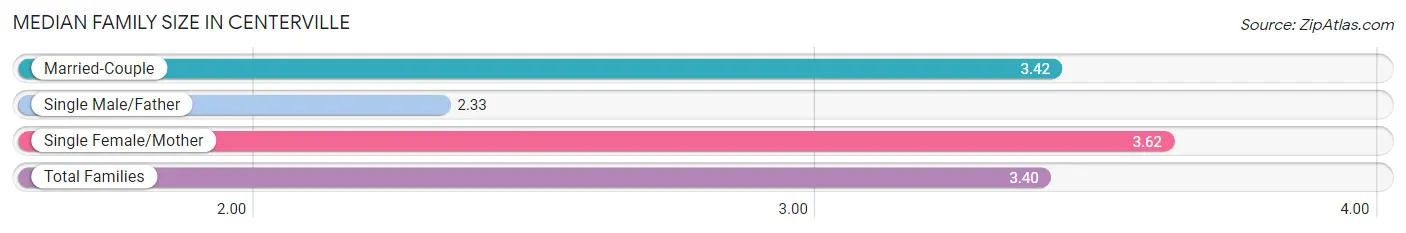
The median family size in Centerville is 3.40 persons per family, with single female/mother families (117 | 11.9%) accounting for the largest median family size of 3.62 persons per family. On the other hand, single male/father families (40 | 4.1%) represent the smallest median family size with 2.33 persons per family.
| Family Type | # Families | Family Size |
| Married-Couple | 826 (84.0%) | 3.42 |
| Single Male/Father | 40 (4.1%) | 2.33 |
| Single Female/Mother | 117 (11.9%) | 3.62 |
| Total Families | 983 (100.0%) | 3.40 |
Median Household Size in Centerville
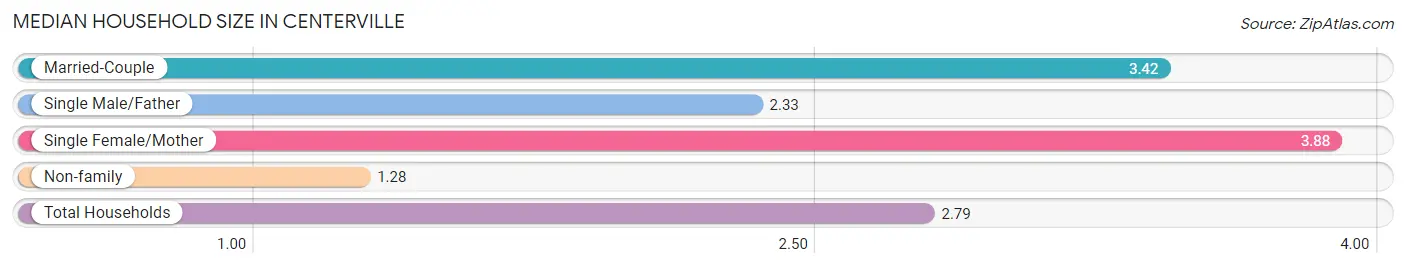
The median household size in Centerville is 2.79 persons per household, with single female/mother households (117 | 8.3%) accounting for the largest median household size of 3.88 persons per household. non-family households (422 | 30.0%) represent the smallest median household size with 1.28 persons per household.
| Household Type | # Households | Household Size |
| Married-Couple | 826 (58.8%) | 3.42 |
| Single Male/Father | 40 (2.9%) | 2.33 |
| Single Female/Mother | 117 (8.3%) | 3.88 |
| Non-family | 422 (30.0%) | 1.28 |
| Total Households | 1,405 (100.0%) | 2.79 |
Household Size by Marriage Status in Centerville
Out of a total of 1,405 households in Centerville, 983 (70.0%) are family households, while 422 (30.0%) are nonfamily households. The most numerous type of family households are 2-person households, comprising 392, and the most common type of nonfamily households are 1-person households, comprising 341.
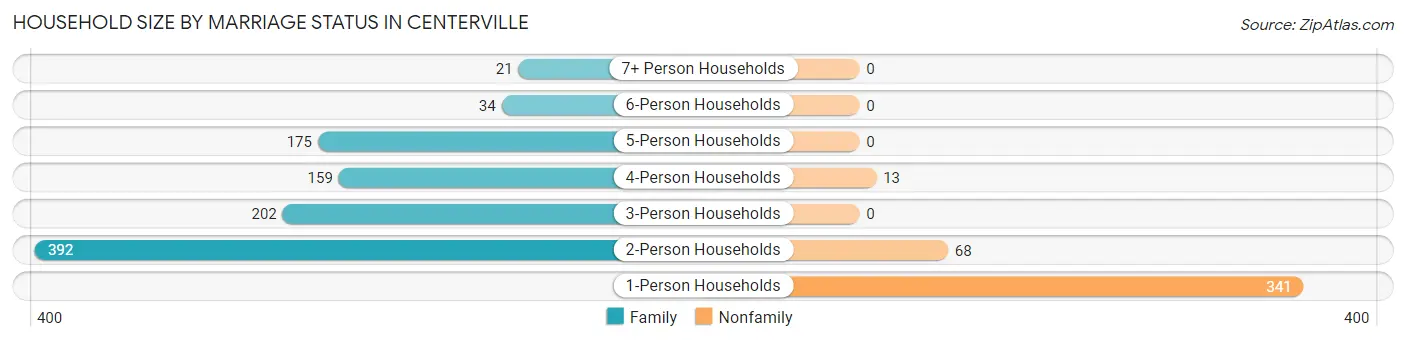
| Household Size | Family Households | Nonfamily Households |
| 1-Person Households | - | 341 (24.3%) |
| 2-Person Households | 392 (27.9%) | 68 (4.8%) |
| 3-Person Households | 202 (14.4%) | 0 (0.0%) |
| 4-Person Households | 159 (11.3%) | 13 (0.9%) |
| 5-Person Households | 175 (12.5%) | 0 (0.0%) |
| 6-Person Households | 34 (2.4%) | 0 (0.0%) |
| 7+ Person Households | 21 (1.5%) | 0 (0.0%) |
| Total | 983 (70.0%) | 422 (30.0%) |
Female Fertility in Centerville
Fertility by Age in Centerville
Average fertility rate in Centerville is 27.0 births per 1,000 women. Women in the age bracket of 20 to 34 years have the highest fertility rate with 51.0 births per 1,000 women. Women in the age bracket of 20 to 34 years acount for 60.0% of all women with births.
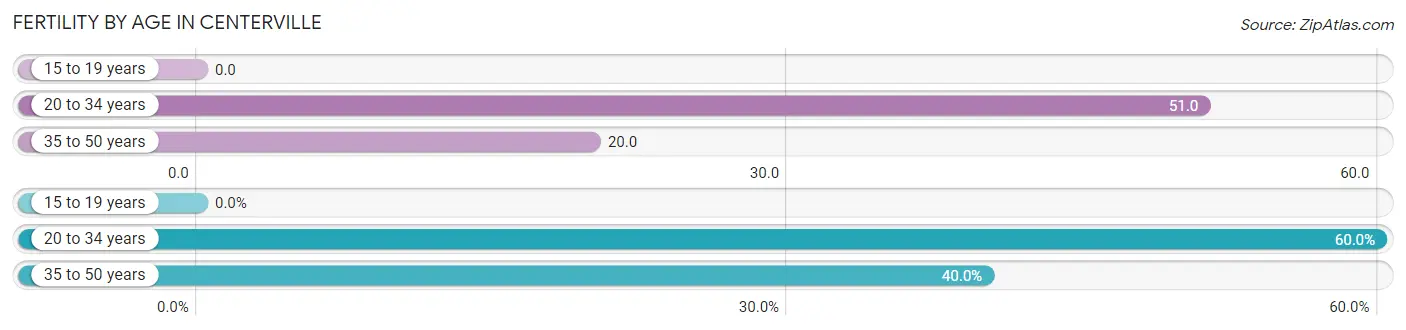
| Age Bracket | Women with Births | Births / 1,000 Women |
| 15 to 19 years | 0 (0.0%) | 0.0 |
| 20 to 34 years | 15 (60.0%) | 51.0 |
| 35 to 50 years | 10 (40.0%) | 20.0 |
| Total | 25 (100.0%) | 27.0 |
Fertility by Age by Marriage Status in Centerville
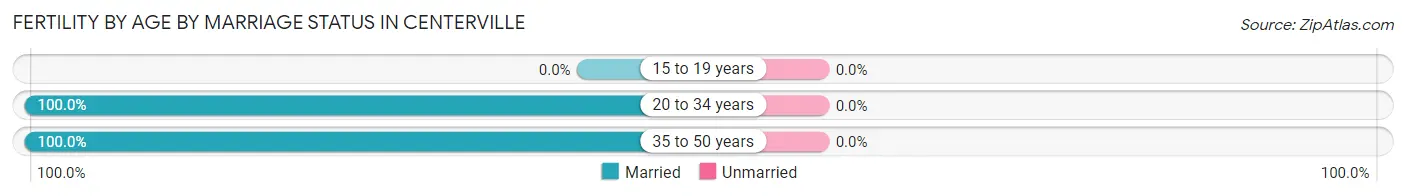
| Age Bracket | Married | Unmarried |
| 15 to 19 years | 0 (0.0%) | 0 (0.0%) |
| 20 to 34 years | 15 (100.0%) | 0 (0.0%) |
| 35 to 50 years | 10 (100.0%) | 0 (0.0%) |
| Total | 25 (100.0%) | 0 (0.0%) |
Fertility by Education in Centerville
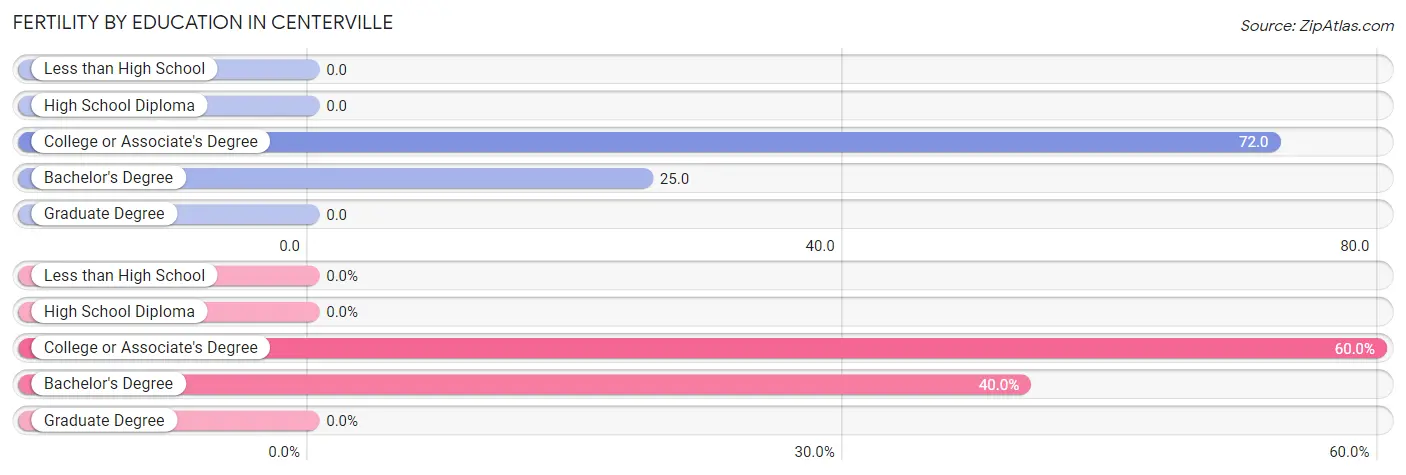
| Educational Attainment | Women with Births | Births / 1,000 Women |
| Less than High School | 0 (0.0%) | 0.0 |
| High School Diploma | 0 (0.0%) | 0.0 |
| College or Associate's Degree | 15 (60.0%) | 72.0 |
| Bachelor's Degree | 10 (40.0%) | 25.0 |
| Graduate Degree | 0 (0.0%) | 0.0 |
| Total | 25 (100.0%) | 27.0 |
Fertility by Education by Marriage Status in Centerville
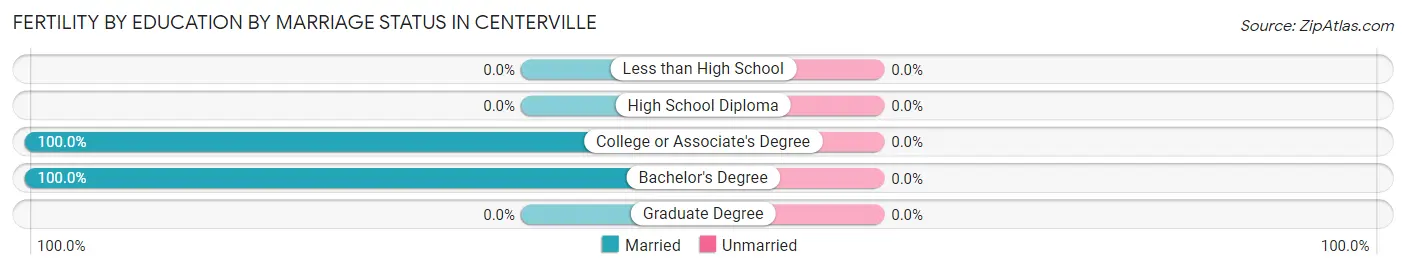
| Educational Attainment | Married | Unmarried |
| Less than High School | 0 (0.0%) | 0 (0.0%) |
| High School Diploma | 0 (0.0%) | 0 (0.0%) |
| College or Associate's Degree | 15 (100.0%) | 0 (0.0%) |
| Bachelor's Degree | 10 (100.0%) | 0 (0.0%) |
| Graduate Degree | 0 (0.0%) | 0 (0.0%) |
| Total | 25 (100.0%) | 0 (0.0%) |
Employment Characteristics in Centerville
Employment by Class of Employer in Centerville
Among the 2,224 employed individuals in Centerville, private company employees (1,559 | 70.1%), local government employees (152 | 6.8%), and not-for-profit organizations (149 | 6.7%) make up the most common classes of employment.
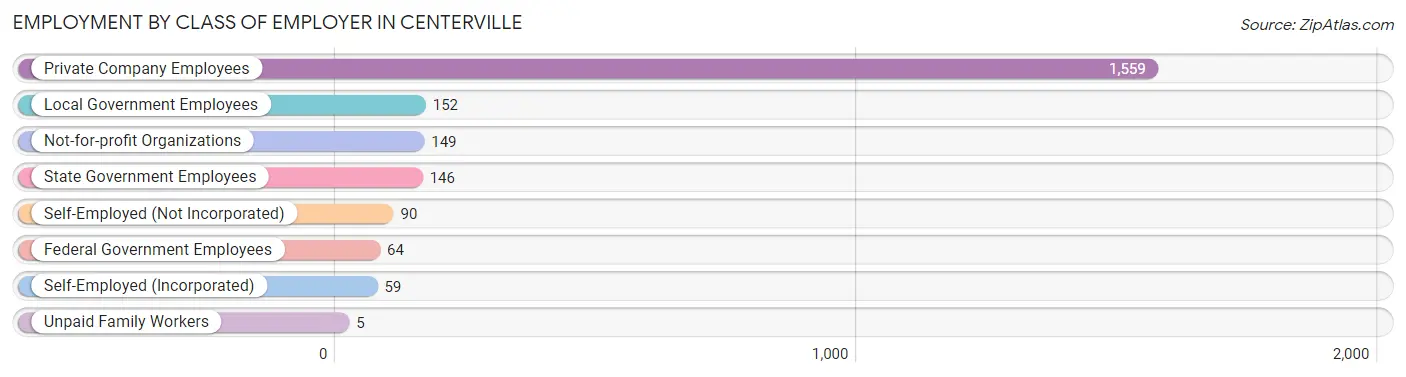
| Employer Class | # Employees | % Employees |
| Private Company Employees | 1,559 | 70.1% |
| Self-Employed (Incorporated) | 59 | 2.6% |
| Self-Employed (Not Incorporated) | 90 | 4.1% |
| Not-for-profit Organizations | 149 | 6.7% |
| Local Government Employees | 152 | 6.8% |
| State Government Employees | 146 | 6.6% |
| Federal Government Employees | 64 | 2.9% |
| Unpaid Family Workers | 5 | 0.2% |
| Total | 2,224 | 100.0% |
Employment Status by Age in Centerville
According to the labor force statistics for Centerville, out of the total population over 16 years of age (2,987), 76.2% or 2,276 individuals are in the labor force, with 0.6% or 14 of them unemployed. The age group with the highest labor force participation rate is 20 to 24 years, with 100.0% or 115 individuals in the labor force. Within the labor force, the 55 to 59 years age range has the highest percentage of unemployed individuals, with 2.7% or 6 of them being unemployed.
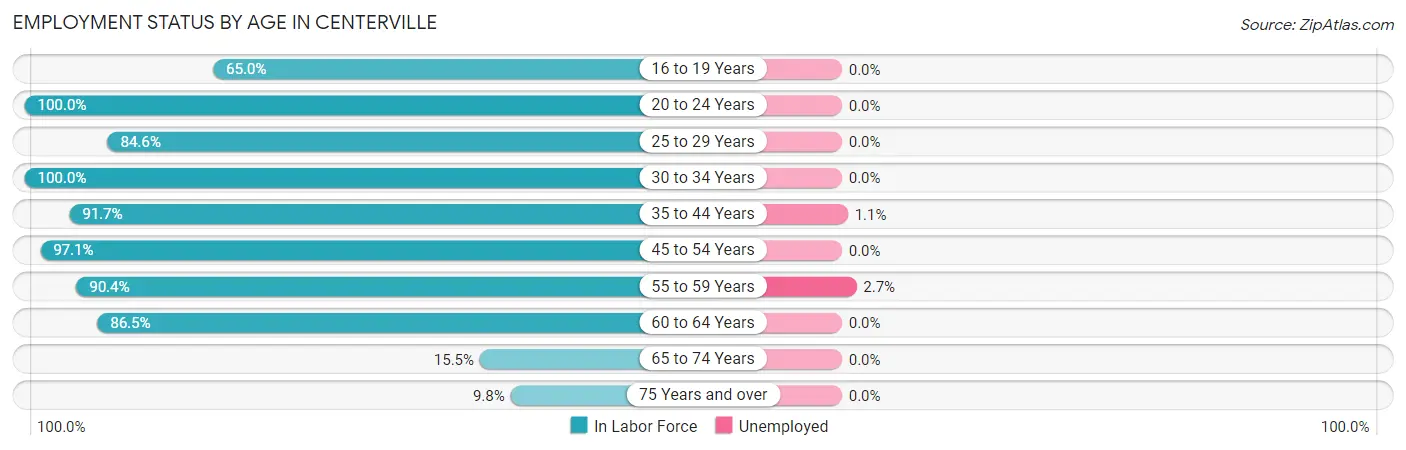
| Age Bracket | In Labor Force | Unemployed |
| 16 to 19 Years | 156 (65.0%) | 0 (0.0%) |
| 20 to 24 Years | 115 (100.0%) | 0 (0.0%) |
| 25 to 29 Years | 126 (84.6%) | 0 (0.0%) |
| 30 to 34 Years | 235 (100.0%) | 0 (0.0%) |
| 35 to 44 Years | 629 (91.7%) | 7 (1.1%) |
| 45 to 54 Years | 500 (97.1%) | 0 (0.0%) |
| 55 to 59 Years | 225 (90.4%) | 6 (2.7%) |
| 60 to 64 Years | 217 (86.5%) | 0 (0.0%) |
| 65 to 74 Years | 50 (15.5%) | 0 (0.0%) |
| 75 Years and over | 22 (9.8%) | 0 (0.0%) |
| Total | 2,276 (76.2%) | 14 (0.6%) |
Employment Status by Educational Attainment in Centerville
According to labor force statistics for Centerville, 92.7% of individuals (1,933) out of the total population between 25 and 64 years of age (2,085) are in the labor force, with 0.7% or 14 of them being unemployed. The group with the highest labor force participation rate are those with the educational attainment of college / associate degree, with 94.9% or 593 individuals in the labor force. Within the labor force, individuals with high school diploma education have the highest percentage of unemployment, with 2.3% or 7 of them being unemployed.
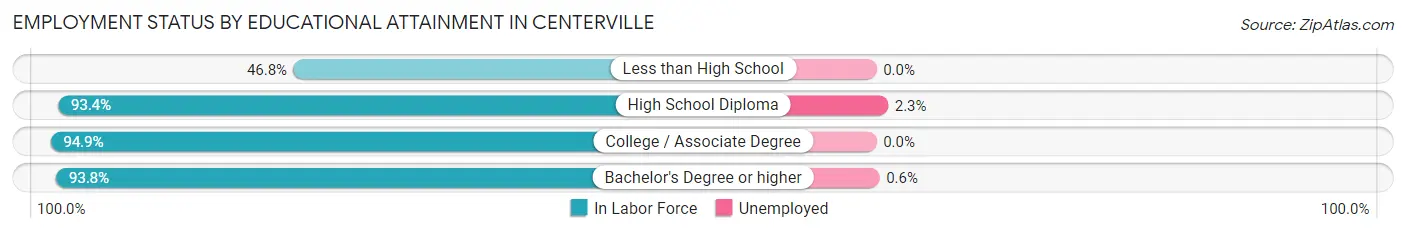
| Educational Attainment | In Labor Force | Unemployed |
| Less than High School | 29 (46.8%) | 0 (0.0%) |
| High School Diploma | 298 (93.4%) | 7 (2.3%) |
| College / Associate Degree | 593 (94.9%) | 0 (0.0%) |
| Bachelor's Degree or higher | 1,012 (93.8%) | 6 (0.6%) |
| Total | 1,933 (92.7%) | 15 (0.7%) |
Employment Occupations by Sex in Centerville
Management, Business, Science and Arts Occupations
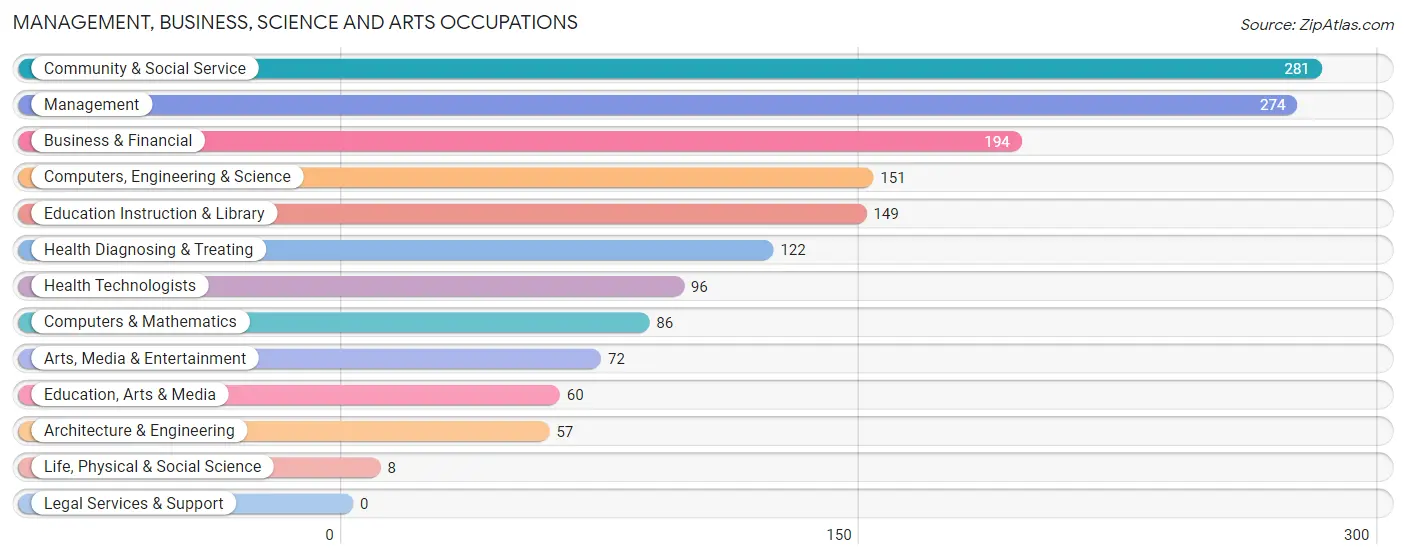
The most common Management, Business, Science and Arts occupations in Centerville are Community & Social Service (281 | 12.5%), Management (274 | 12.2%), Business & Financial (194 | 8.6%), Computers, Engineering & Science (151 | 6.7%), and Education Instruction & Library (149 | 6.6%).
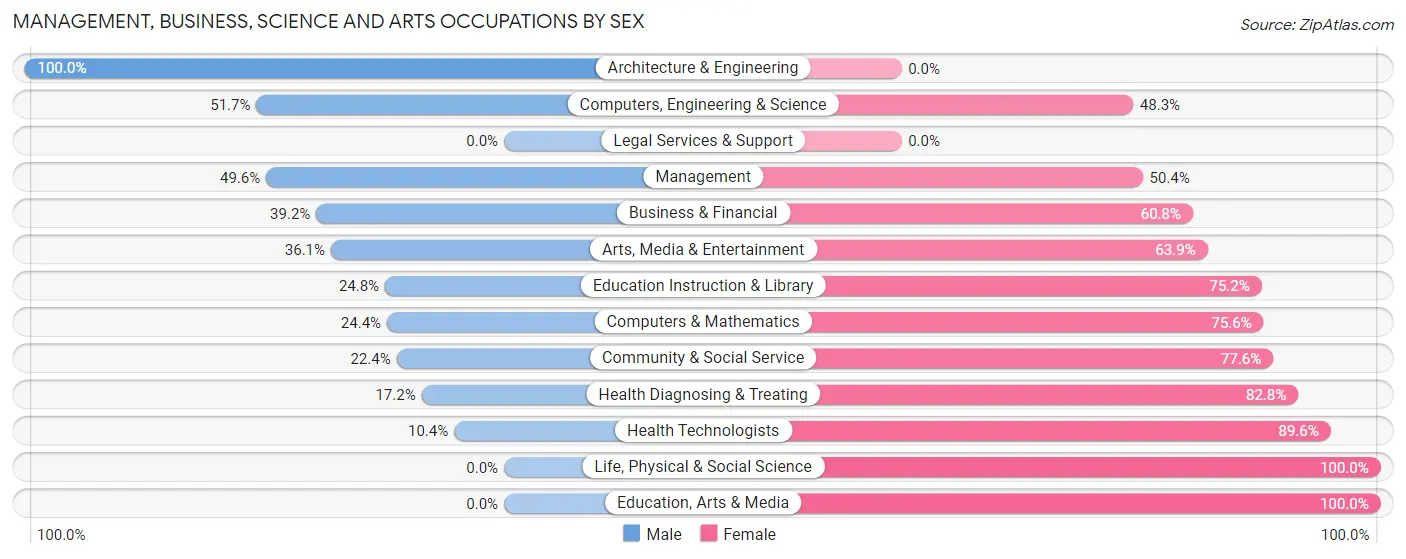
Management, Business, Science and Arts Occupations by Sex
Within the Management, Business, Science and Arts occupations in Centerville, the most male-oriented occupations are Architecture & Engineering (100.0%), Computers, Engineering & Science (51.7%), and Management (49.6%), while the most female-oriented occupations are Life, Physical & Social Science (100.0%), Education, Arts & Media (100.0%), and Health Technologists (89.6%).
| Occupation | Male | Female |
| Management | 136 (49.6%) | 138 (50.4%) |
| Business & Financial | 76 (39.2%) | 118 (60.8%) |
| Computers, Engineering & Science | 78 (51.7%) | 73 (48.3%) |
| Computers & Mathematics | 21 (24.4%) | 65 (75.6%) |
| Architecture & Engineering | 57 (100.0%) | 0 (0.0%) |
| Life, Physical & Social Science | 0 (0.0%) | 8 (100.0%) |
| Community & Social Service | 63 (22.4%) | 218 (77.6%) |
| Education, Arts & Media | 0 (0.0%) | 60 (100.0%) |
| Legal Services & Support | 0 (0.0%) | 0 (0.0%) |
| Education Instruction & Library | 37 (24.8%) | 112 (75.2%) |
| Arts, Media & Entertainment | 26 (36.1%) | 46 (63.9%) |
| Health Diagnosing & Treating | 21 (17.2%) | 101 (82.8%) |
| Health Technologists | 10 (10.4%) | 86 (89.6%) |
| Total (Category) | 374 (36.6%) | 648 (63.4%) |
| Total (Overall) | 1,134 (50.4%) | 1,117 (49.6%) |
Services Occupations
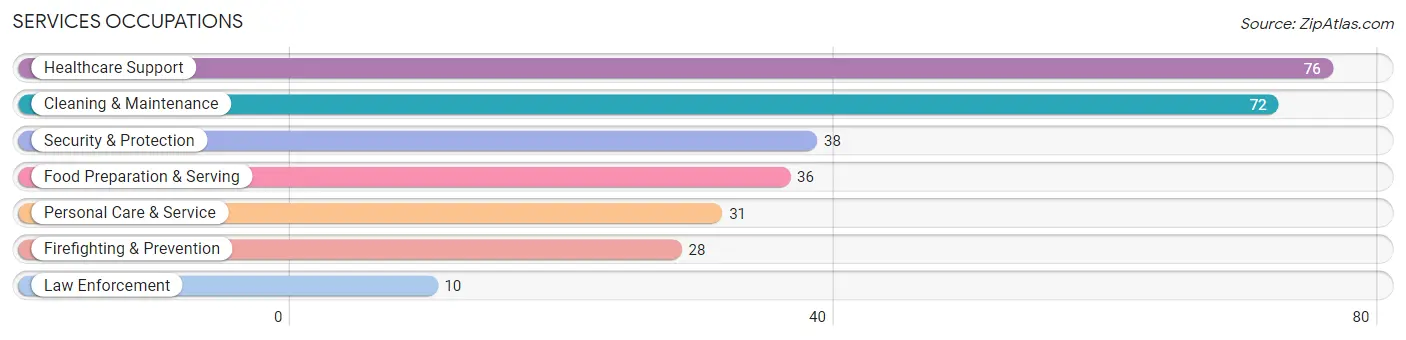
The most common Services occupations in Centerville are Healthcare Support (76 | 3.4%), Cleaning & Maintenance (72 | 3.2%), Security & Protection (38 | 1.7%), Food Preparation & Serving (36 | 1.6%), and Personal Care & Service (31 | 1.4%).
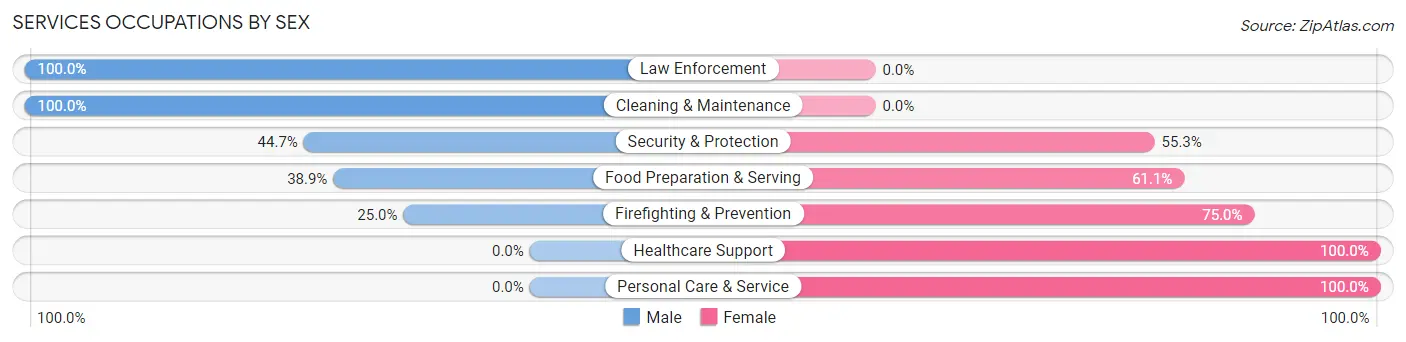
Services Occupations by Sex
Within the Services occupations in Centerville, the most male-oriented occupations are Law Enforcement (100.0%), Cleaning & Maintenance (100.0%), and Security & Protection (44.7%), while the most female-oriented occupations are Healthcare Support (100.0%), Personal Care & Service (100.0%), and Firefighting & Prevention (75.0%).
| Occupation | Male | Female |
| Healthcare Support | 0 (0.0%) | 76 (100.0%) |
| Security & Protection | 17 (44.7%) | 21 (55.3%) |
| Firefighting & Prevention | 7 (25.0%) | 21 (75.0%) |
| Law Enforcement | 10 (100.0%) | 0 (0.0%) |
| Food Preparation & Serving | 14 (38.9%) | 22 (61.1%) |
| Cleaning & Maintenance | 72 (100.0%) | 0 (0.0%) |
| Personal Care & Service | 0 (0.0%) | 31 (100.0%) |
| Total (Category) | 103 (40.7%) | 150 (59.3%) |
| Total (Overall) | 1,134 (50.4%) | 1,117 (49.6%) |
Sales and Office Occupations
The most common Sales and Office occupations in Centerville are Office & Administration (277 | 12.3%), and Sales & Related (150 | 6.7%).

Sales and Office Occupations by Sex

| Occupation | Male | Female |
| Sales & Related | 73 (48.7%) | 77 (51.3%) |
| Office & Administration | 107 (38.6%) | 170 (61.4%) |
| Total (Category) | 180 (42.1%) | 247 (57.9%) |
| Total (Overall) | 1,134 (50.4%) | 1,117 (49.6%) |
Natural Resources, Construction and Maintenance Occupations
The most common Natural Resources, Construction and Maintenance occupations in Centerville are Construction & Extraction (185 | 8.2%), Installation, Maintenance & Repair (34 | 1.5%), and Farming, Fishing & Forestry (11 | 0.5%).

Natural Resources, Construction and Maintenance Occupations by Sex

| Occupation | Male | Female |
| Farming, Fishing & Forestry | 11 (100.0%) | 0 (0.0%) |
| Construction & Extraction | 156 (84.3%) | 29 (15.7%) |
| Installation, Maintenance & Repair | 34 (100.0%) | 0 (0.0%) |
| Total (Category) | 201 (87.4%) | 29 (12.6%) |
| Total (Overall) | 1,134 (50.4%) | 1,117 (49.6%) |
Production, Transportation and Moving Occupations
The most common Production, Transportation and Moving occupations in Centerville are Production (127 | 5.6%), Material Moving (99 | 4.4%), and Transportation (93 | 4.1%).
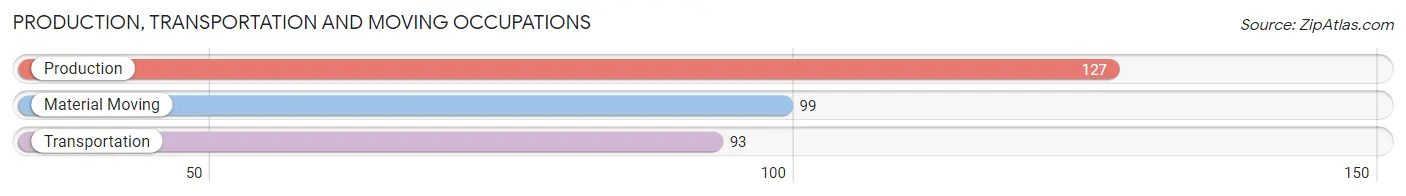
Production, Transportation and Moving Occupations by Sex

| Occupation | Male | Female |
| Production | 104 (81.9%) | 23 (18.1%) |
| Transportation | 73 (78.5%) | 20 (21.5%) |
| Material Moving | 99 (100.0%) | 0 (0.0%) |
| Total (Category) | 276 (86.5%) | 43 (13.5%) |
| Total (Overall) | 1,134 (50.4%) | 1,117 (49.6%) |
Employment Industries by Sex in Centerville
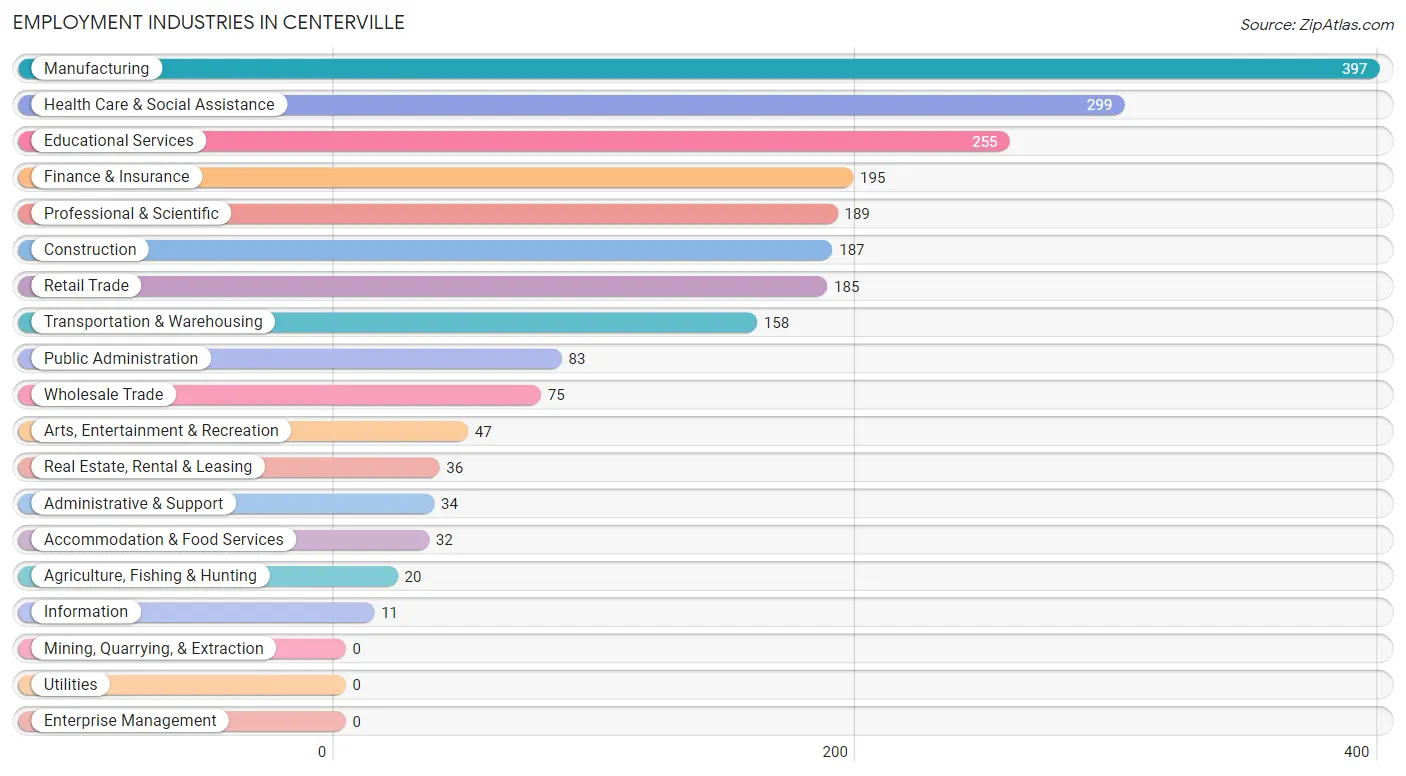
Employment Industries in Centerville
The major employment industries in Centerville include Manufacturing (397 | 17.6%), Health Care & Social Assistance (299 | 13.3%), Educational Services (255 | 11.3%), Finance & Insurance (195 | 8.7%), and Professional & Scientific (189 | 8.4%).
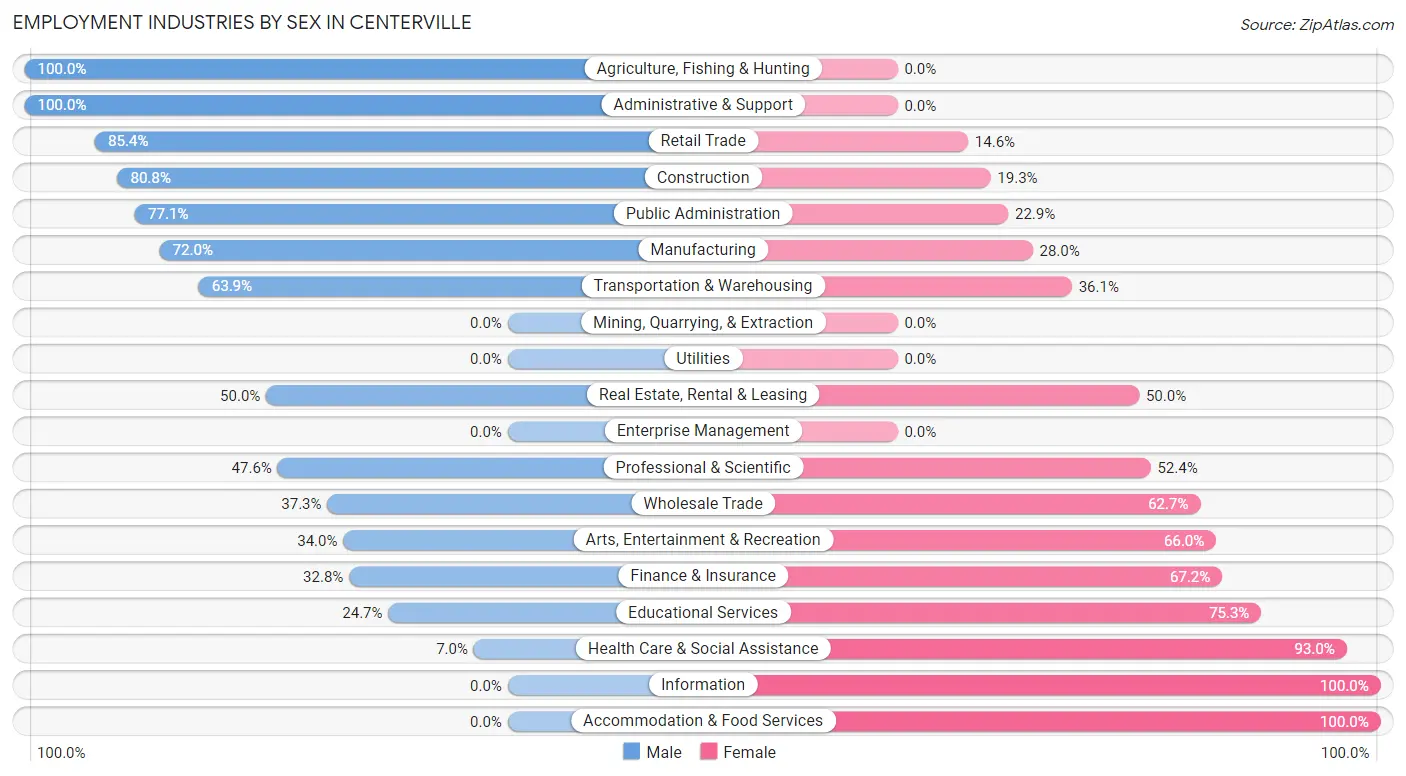
Employment Industries by Sex in Centerville
The Centerville industries that see more men than women are Agriculture, Fishing & Hunting (100.0%), Administrative & Support (100.0%), and Retail Trade (85.4%), whereas the industries that tend to have a higher number of women are Information (100.0%), Accommodation & Food Services (100.0%), and Health Care & Social Assistance (93.0%).
| Industry | Male | Female |
| Agriculture, Fishing & Hunting | 20 (100.0%) | 0 (0.0%) |
| Mining, Quarrying, & Extraction | 0 (0.0%) | 0 (0.0%) |
| Construction | 151 (80.7%) | 36 (19.3%) |
| Manufacturing | 286 (72.0%) | 111 (28.0%) |
| Wholesale Trade | 28 (37.3%) | 47 (62.7%) |
| Retail Trade | 158 (85.4%) | 27 (14.6%) |
| Transportation & Warehousing | 101 (63.9%) | 57 (36.1%) |
| Utilities | 0 (0.0%) | 0 (0.0%) |
| Information | 0 (0.0%) | 11 (100.0%) |
| Finance & Insurance | 64 (32.8%) | 131 (67.2%) |
| Real Estate, Rental & Leasing | 18 (50.0%) | 18 (50.0%) |
| Professional & Scientific | 90 (47.6%) | 99 (52.4%) |
| Enterprise Management | 0 (0.0%) | 0 (0.0%) |
| Administrative & Support | 34 (100.0%) | 0 (0.0%) |
| Educational Services | 63 (24.7%) | 192 (75.3%) |
| Health Care & Social Assistance | 21 (7.0%) | 278 (93.0%) |
| Arts, Entertainment & Recreation | 16 (34.0%) | 31 (66.0%) |
| Accommodation & Food Services | 0 (0.0%) | 32 (100.0%) |
| Public Administration | 64 (77.1%) | 19 (22.9%) |
| Total | 1,134 (50.4%) | 1,117 (49.6%) |
Education in Centerville
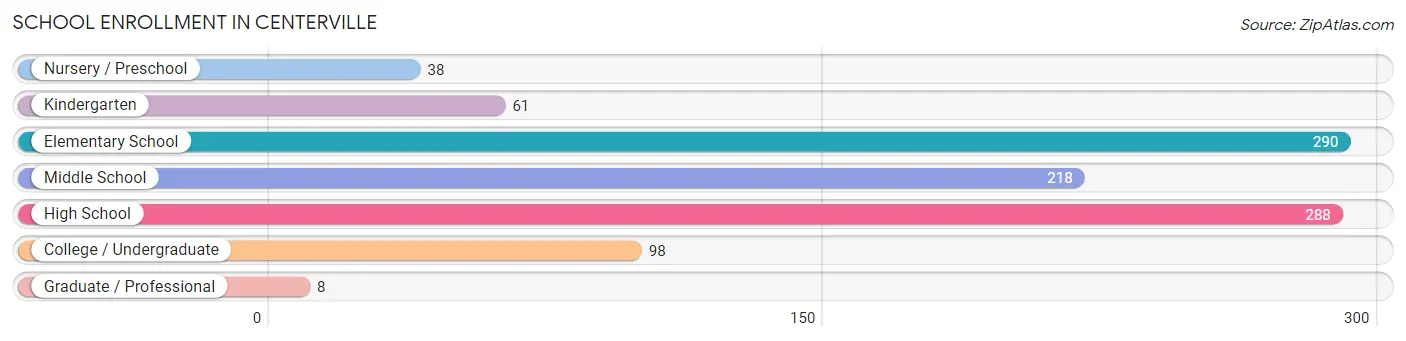
School Enrollment in Centerville
The most common levels of schooling among the 1,001 students in Centerville are elementary school (290 | 29.0%), high school (288 | 28.8%), and middle school (218 | 21.8%).
| School Level | # Students | % Students |
| Nursery / Preschool | 38 | 3.8% |
| Kindergarten | 61 | 6.1% |
| Elementary School | 290 | 29.0% |
| Middle School | 218 | 21.8% |
| High School | 288 | 28.8% |
| College / Undergraduate | 98 | 9.8% |
| Graduate / Professional | 8 | 0.8% |
| Total | 1,001 | 100.0% |
School Enrollment by Age by Funding Source in Centerville
Out of a total of 1,001 students who are enrolled in schools in Centerville, 155 (15.5%) attend a private institution, while the remaining 846 (84.5%) are enrolled in public schools. The age group of 20 to 24 year olds has the highest likelihood of being enrolled in private schools, with 20 (100.0% in the age bracket) enrolled. Conversely, the age group of 3 to 4 year olds has the lowest likelihood of being enrolled in a private school, with 29 (100.0% in the age bracket) attending a public institution.
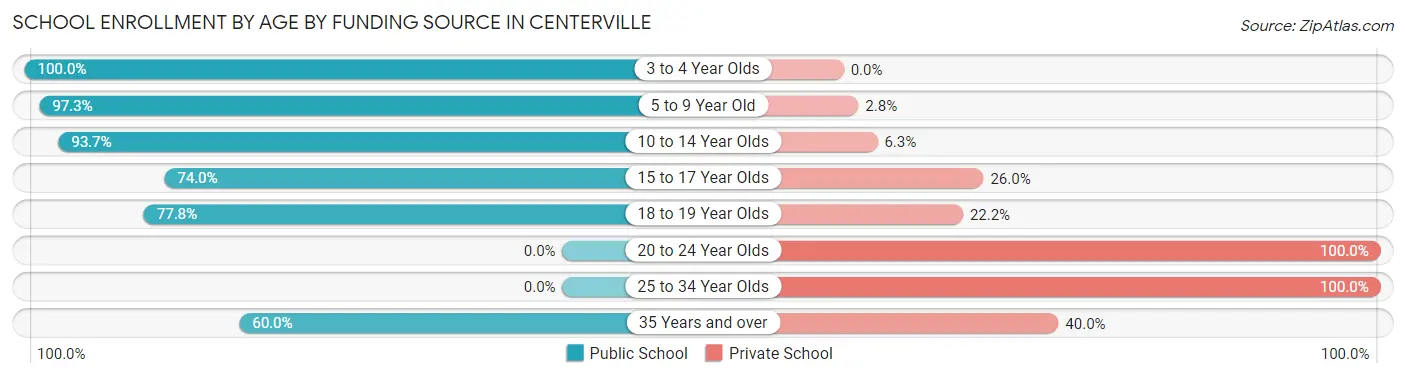
| Age Bracket | Public School | Private School |
| 3 to 4 Year Olds | 29 (100.0%) | 0 (0.0%) |
| 5 to 9 Year Old | 318 (97.3%) | 9 (2.8%) |
| 10 to 14 Year Olds | 268 (93.7%) | 18 (6.3%) |
| 15 to 17 Year Olds | 142 (74.0%) | 50 (26.0%) |
| 18 to 19 Year Olds | 77 (77.8%) | 22 (22.2%) |
| 20 to 24 Year Olds | 0 (0.0%) | 20 (100.0%) |
| 25 to 34 Year Olds | 0 (0.0%) | 28 (100.0%) |
| 35 Years and over | 12 (60.0%) | 8 (40.0%) |
| Total | 846 (84.5%) | 155 (15.5%) |
Educational Attainment by Field of Study in Centerville
Business (304 | 22.9%), psychology (150 | 11.3%), education (139 | 10.5%), engineering (109 | 8.2%), and bio, nature & agricultural (102 | 7.7%) are the most common fields of study among 1,325 individuals in Centerville who have obtained a bachelor's degree or higher.
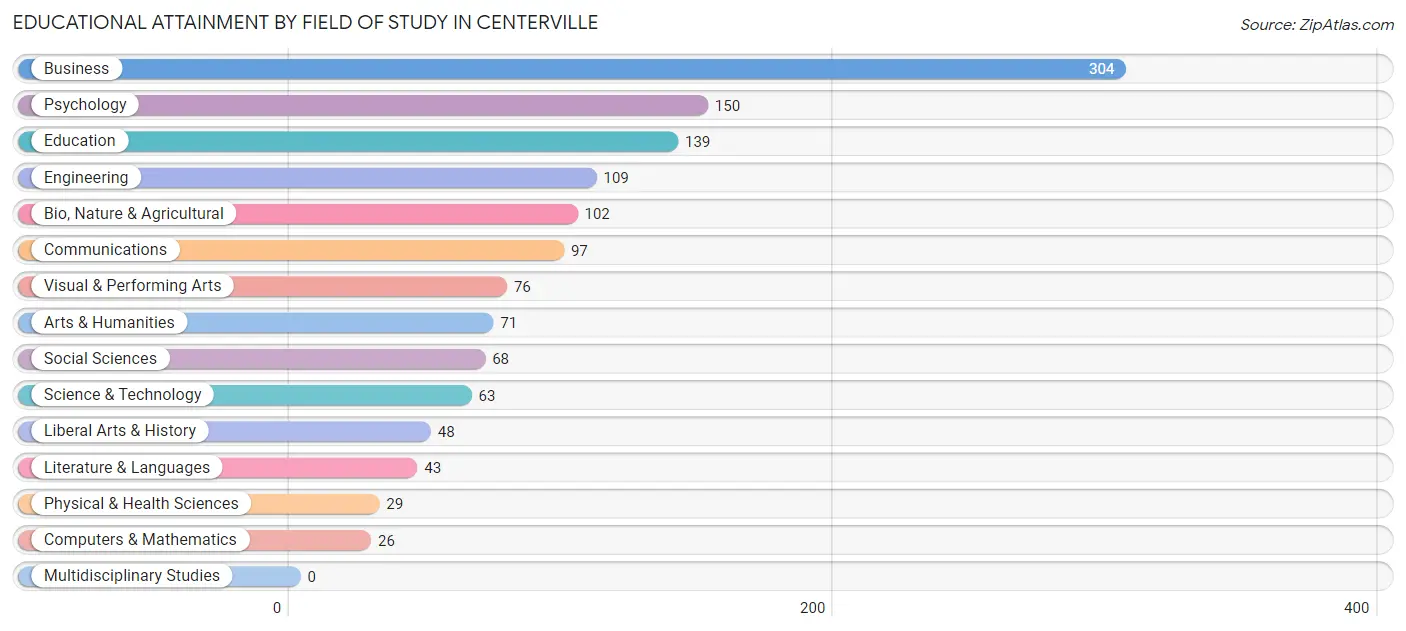
| Field of Study | # Graduates | % Graduates |
| Computers & Mathematics | 26 | 2.0% |
| Bio, Nature & Agricultural | 102 | 7.7% |
| Physical & Health Sciences | 29 | 2.2% |
| Psychology | 150 | 11.3% |
| Social Sciences | 68 | 5.1% |
| Engineering | 109 | 8.2% |
| Multidisciplinary Studies | 0 | 0.0% |
| Science & Technology | 63 | 4.8% |
| Business | 304 | 22.9% |
| Education | 139 | 10.5% |
| Literature & Languages | 43 | 3.3% |
| Liberal Arts & History | 48 | 3.6% |
| Visual & Performing Arts | 76 | 5.7% |
| Communications | 97 | 7.3% |
| Arts & Humanities | 71 | 5.4% |
| Total | 1,325 | 100.0% |
Transportation & Commute in Centerville
Vehicle Availability by Sex in Centerville
The most prevalent vehicle ownership categories in Centerville are males with 2 vehicles (487, accounting for 43.6%) and females with 2 vehicles (530, making up 44.0%).
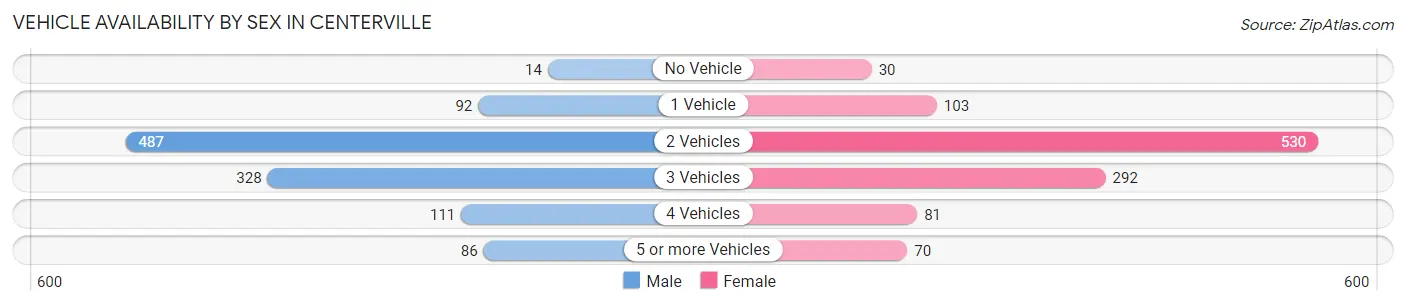
| Vehicles Available | Male | Female |
| No Vehicle | 14 (1.3%) | 30 (2.7%) |
| 1 Vehicle | 92 (8.2%) | 103 (9.3%) |
| 2 Vehicles | 487 (43.6%) | 530 (47.9%) |
| 3 Vehicles | 328 (29.3%) | 292 (26.4%) |
| 4 Vehicles | 111 (9.9%) | 81 (7.3%) |
| 5 or more Vehicles | 86 (7.7%) | 70 (6.3%) |
| Total | 1,118 (100.0%) | 1,106 (100.0%) |
Commute Time in Centerville
The most frequently occuring commute durations in Centerville are 20 to 24 minutes (295 commuters, 16.8%), 25 to 29 minutes (278 commuters, 15.8%), and 30 to 34 minutes (252 commuters, 14.3%).
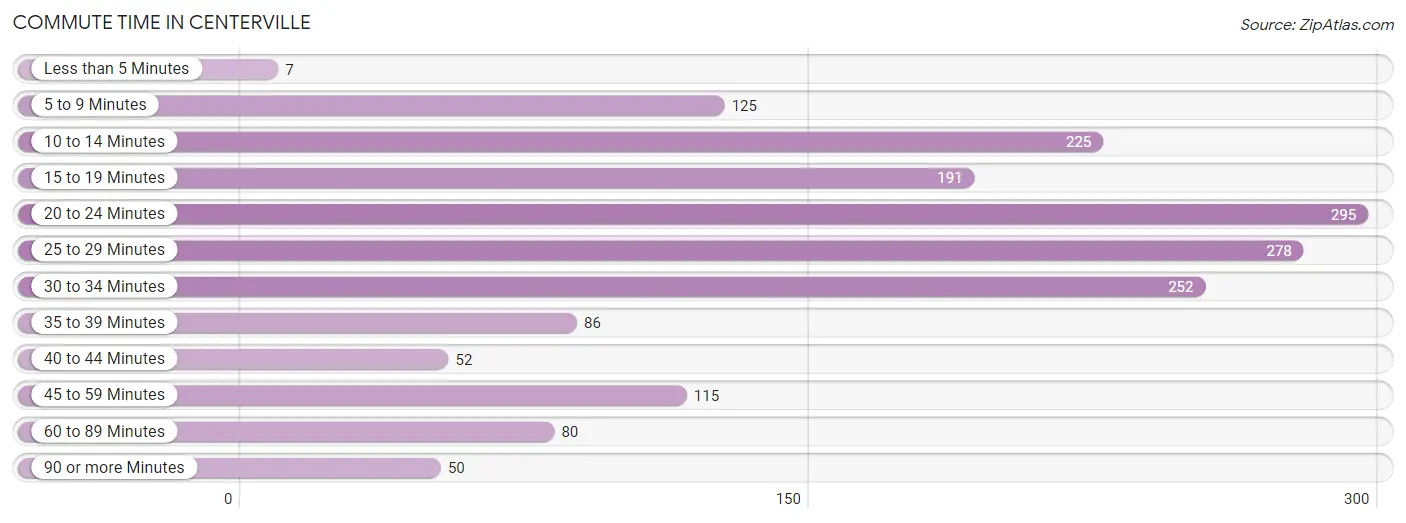
| Commute Time | # Commuters | % Commuters |
| Less than 5 Minutes | 7 | 0.4% |
| 5 to 9 Minutes | 125 | 7.1% |
| 10 to 14 Minutes | 225 | 12.8% |
| 15 to 19 Minutes | 191 | 10.9% |
| 20 to 24 Minutes | 295 | 16.8% |
| 25 to 29 Minutes | 278 | 15.8% |
| 30 to 34 Minutes | 252 | 14.3% |
| 35 to 39 Minutes | 86 | 4.9% |
| 40 to 44 Minutes | 52 | 3.0% |
| 45 to 59 Minutes | 115 | 6.6% |
| 60 to 89 Minutes | 80 | 4.6% |
| 90 or more Minutes | 50 | 2.9% |
Commute Time by Sex in Centerville
The most common commute times in Centerville are 20 to 24 minutes (209 commuters, 22.7%) for males and 30 to 34 minutes (156 commuters, 18.6%) for females.
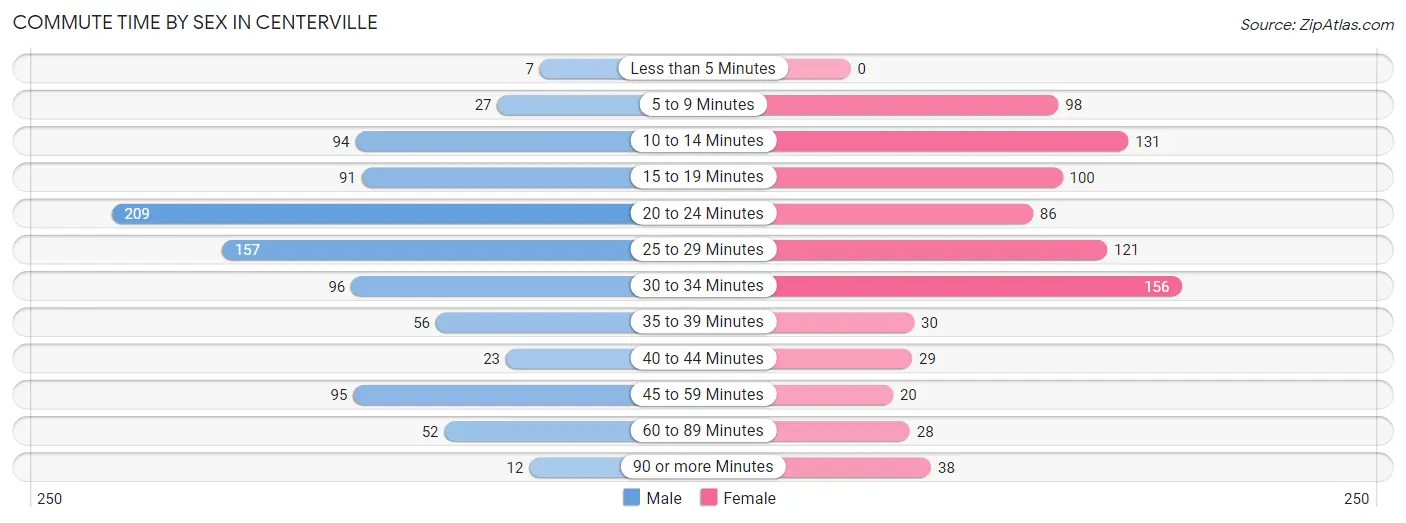
| Commute Time | Male | Female |
| Less than 5 Minutes | 7 (0.8%) | 0 (0.0%) |
| 5 to 9 Minutes | 27 (2.9%) | 98 (11.7%) |
| 10 to 14 Minutes | 94 (10.2%) | 131 (15.7%) |
| 15 to 19 Minutes | 91 (9.9%) | 100 (11.9%) |
| 20 to 24 Minutes | 209 (22.7%) | 86 (10.3%) |
| 25 to 29 Minutes | 157 (17.1%) | 121 (14.5%) |
| 30 to 34 Minutes | 96 (10.4%) | 156 (18.6%) |
| 35 to 39 Minutes | 56 (6.1%) | 30 (3.6%) |
| 40 to 44 Minutes | 23 (2.5%) | 29 (3.5%) |
| 45 to 59 Minutes | 95 (10.3%) | 20 (2.4%) |
| 60 to 89 Minutes | 52 (5.7%) | 28 (3.4%) |
| 90 or more Minutes | 12 (1.3%) | 38 (4.5%) |
Time of Departure to Work by Sex in Centerville
The most frequent times of departure to work in Centerville are 5:30 AM to 5:59 AM (180, 19.6%) for males and 6:00 AM to 6:29 AM (193, 23.1%) for females.
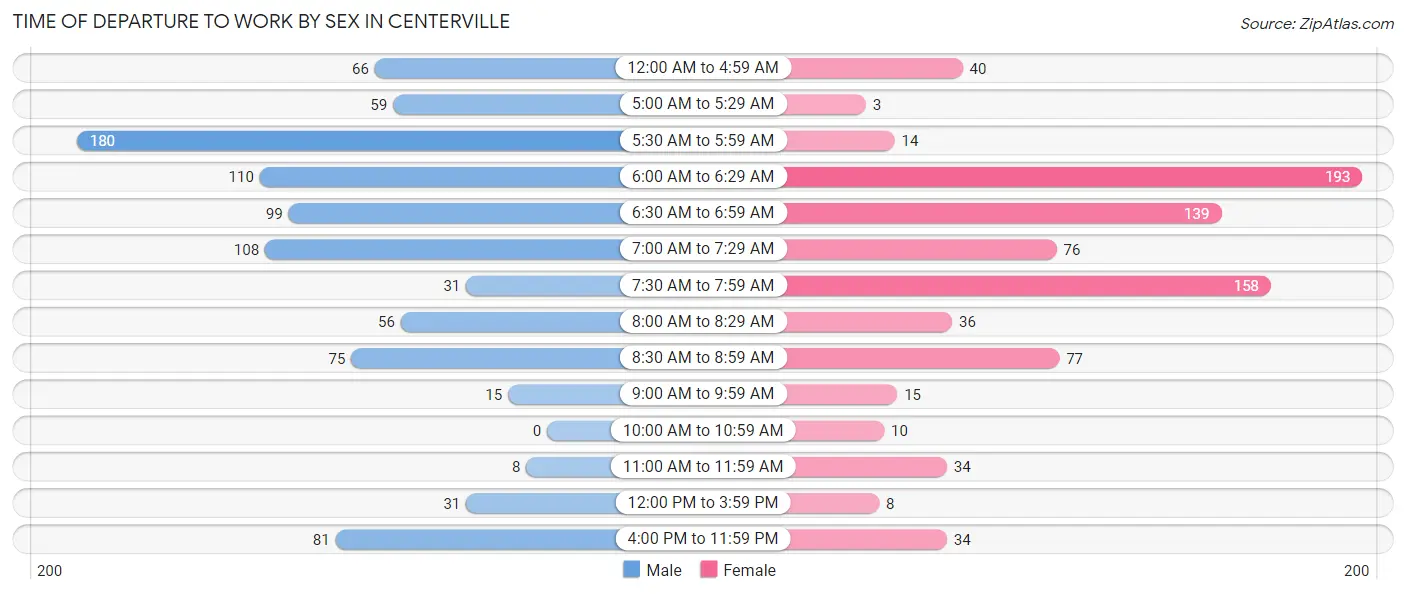
| Time of Departure | Male | Female |
| 12:00 AM to 4:59 AM | 66 (7.2%) | 40 (4.8%) |
| 5:00 AM to 5:29 AM | 59 (6.4%) | 3 (0.4%) |
| 5:30 AM to 5:59 AM | 180 (19.6%) | 14 (1.7%) |
| 6:00 AM to 6:29 AM | 110 (12.0%) | 193 (23.1%) |
| 6:30 AM to 6:59 AM | 99 (10.8%) | 139 (16.6%) |
| 7:00 AM to 7:29 AM | 108 (11.7%) | 76 (9.1%) |
| 7:30 AM to 7:59 AM | 31 (3.4%) | 158 (18.9%) |
| 8:00 AM to 8:29 AM | 56 (6.1%) | 36 (4.3%) |
| 8:30 AM to 8:59 AM | 75 (8.2%) | 77 (9.2%) |
| 9:00 AM to 9:59 AM | 15 (1.6%) | 15 (1.8%) |
| 10:00 AM to 10:59 AM | 0 (0.0%) | 10 (1.2%) |
| 11:00 AM to 11:59 AM | 8 (0.9%) | 34 (4.1%) |
| 12:00 PM to 3:59 PM | 31 (3.4%) | 8 (1.0%) |
| 4:00 PM to 11:59 PM | 81 (8.8%) | 34 (4.1%) |
| Total | 919 (100.0%) | 837 (100.0%) |
Housing Occupancy in Centerville
Occupancy by Ownership in Centerville
Of the total 1,405 dwellings in Centerville, owner-occupied units account for 1,296 (92.2%), while renter-occupied units make up 109 (7.8%).
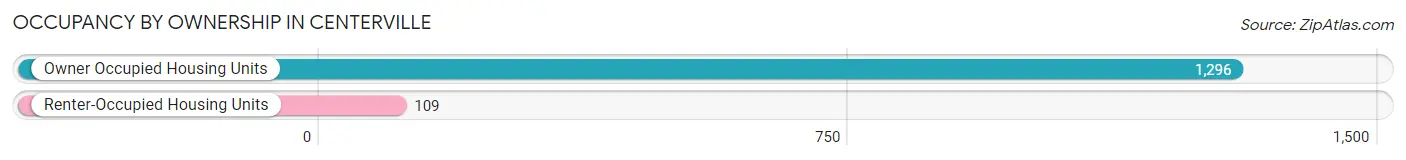
| Occupancy | # Housing Units | % Housing Units |
| Owner Occupied Housing Units | 1,296 | 92.2% |
| Renter-Occupied Housing Units | 109 | 7.8% |
| Total Occupied Housing Units | 1,405 | 100.0% |
Occupancy by Household Size in Centerville
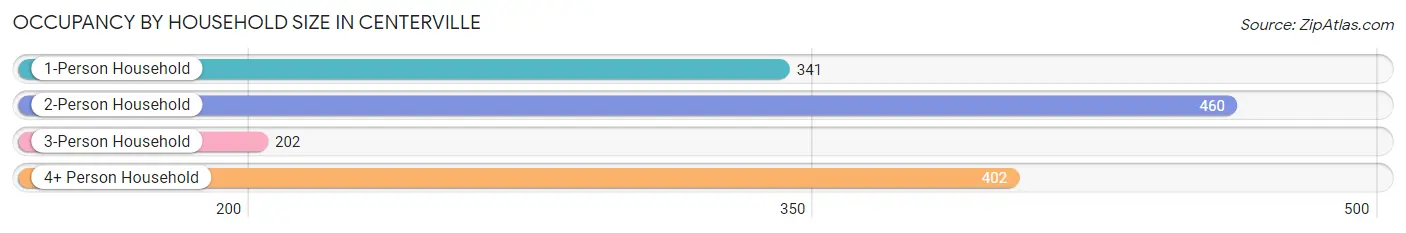
| Household Size | # Housing Units | % Housing Units |
| 1-Person Household | 341 | 24.3% |
| 2-Person Household | 460 | 32.7% |
| 3-Person Household | 202 | 14.4% |
| 4+ Person Household | 402 | 28.6% |
| Total Housing Units | 1,405 | 100.0% |
Occupancy by Ownership by Household Size in Centerville
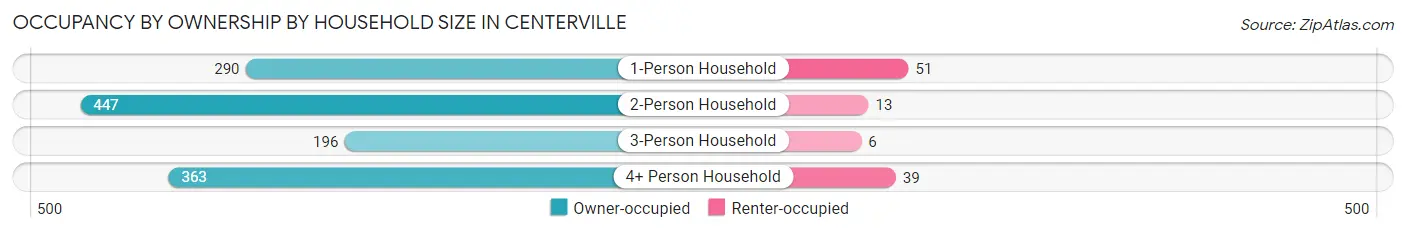
| Household Size | Owner-occupied | Renter-occupied |
| 1-Person Household | 290 (85.0%) | 51 (15.0%) |
| 2-Person Household | 447 (97.2%) | 13 (2.8%) |
| 3-Person Household | 196 (97.0%) | 6 (3.0%) |
| 4+ Person Household | 363 (90.3%) | 39 (9.7%) |
| Total Housing Units | 1,296 (92.2%) | 109 (7.8%) |
Occupancy by Educational Attainment in Centerville
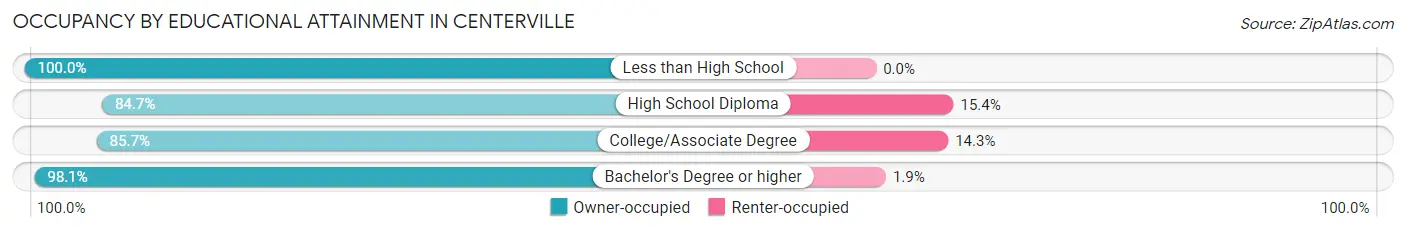
| Household Size | Owner-occupied | Renter-occupied |
| Less than High School | 34 (100.0%) | 0 (0.0%) |
| High School Diploma | 171 (84.7%) | 31 (15.3%) |
| College/Associate Degree | 384 (85.7%) | 64 (14.3%) |
| Bachelor's Degree or higher | 707 (98.1%) | 14 (1.9%) |
Occupancy by Age of Householder in Centerville
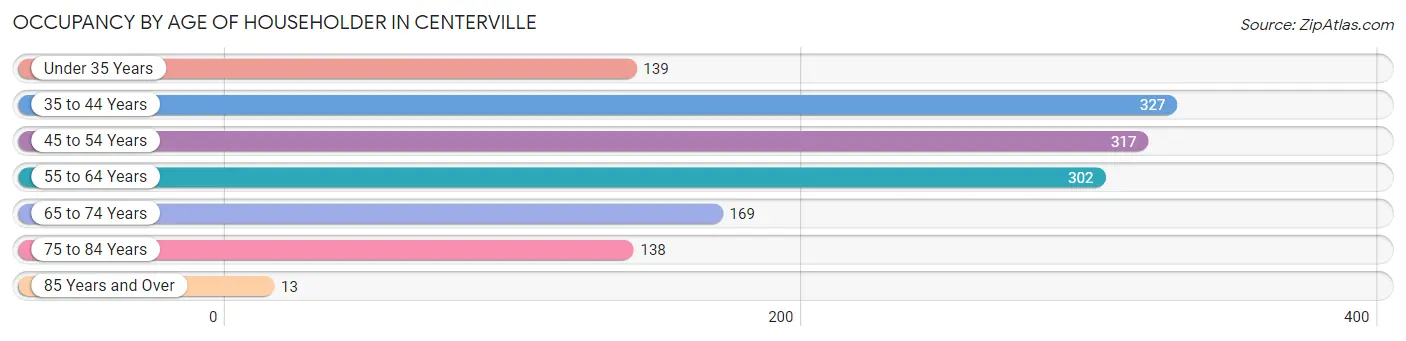
| Age Bracket | # Households | % Households |
| Under 35 Years | 139 | 9.9% |
| 35 to 44 Years | 327 | 23.3% |
| 45 to 54 Years | 317 | 22.6% |
| 55 to 64 Years | 302 | 21.5% |
| 65 to 74 Years | 169 | 12.0% |
| 75 to 84 Years | 138 | 9.8% |
| 85 Years and Over | 13 | 0.9% |
| Total | 1,405 | 100.0% |
Housing Finances in Centerville
Median Income by Occupancy in Centerville
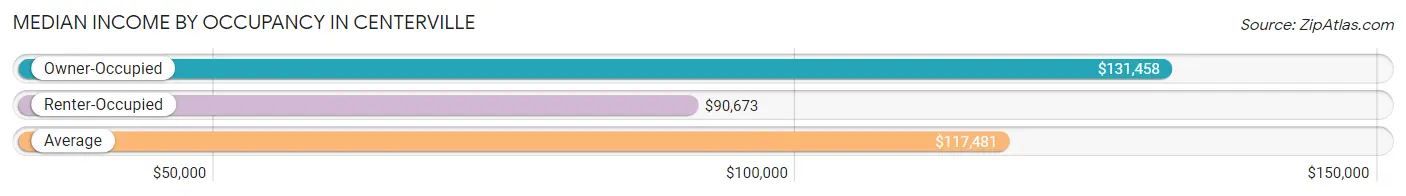
| Occupancy Type | # Households | Median Income |
| Owner-Occupied | 1,296 (92.2%) | $131,458 |
| Renter-Occupied | 109 (7.8%) | $90,673 |
| Average | 1,405 (100.0%) | $117,481 |
Occupancy by Householder Income Bracket in Centerville
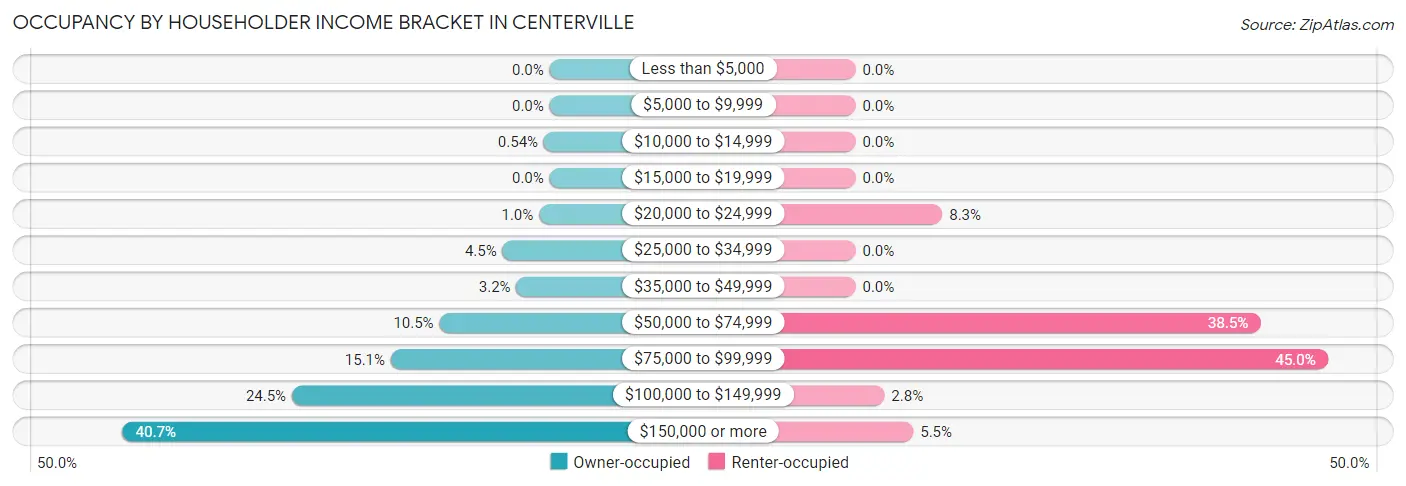
| Income Bracket | Owner-occupied | Renter-occupied |
| Less than $5,000 | 0 (0.0%) | 0 (0.0%) |
| $5,000 to $9,999 | 0 (0.0%) | 0 (0.0%) |
| $10,000 to $14,999 | 7 (0.5%) | 0 (0.0%) |
| $15,000 to $19,999 | 0 (0.0%) | 0 (0.0%) |
| $20,000 to $24,999 | 13 (1.0%) | 9 (8.3%) |
| $25,000 to $34,999 | 58 (4.5%) | 0 (0.0%) |
| $35,000 to $49,999 | 41 (3.2%) | 0 (0.0%) |
| $50,000 to $74,999 | 136 (10.5%) | 42 (38.5%) |
| $75,000 to $99,999 | 196 (15.1%) | 49 (45.0%) |
| $100,000 to $149,999 | 318 (24.5%) | 3 (2.8%) |
| $150,000 or more | 527 (40.7%) | 6 (5.5%) |
| Total | 1,296 (100.0%) | 109 (100.0%) |
Monthly Housing Cost Tiers in Centerville
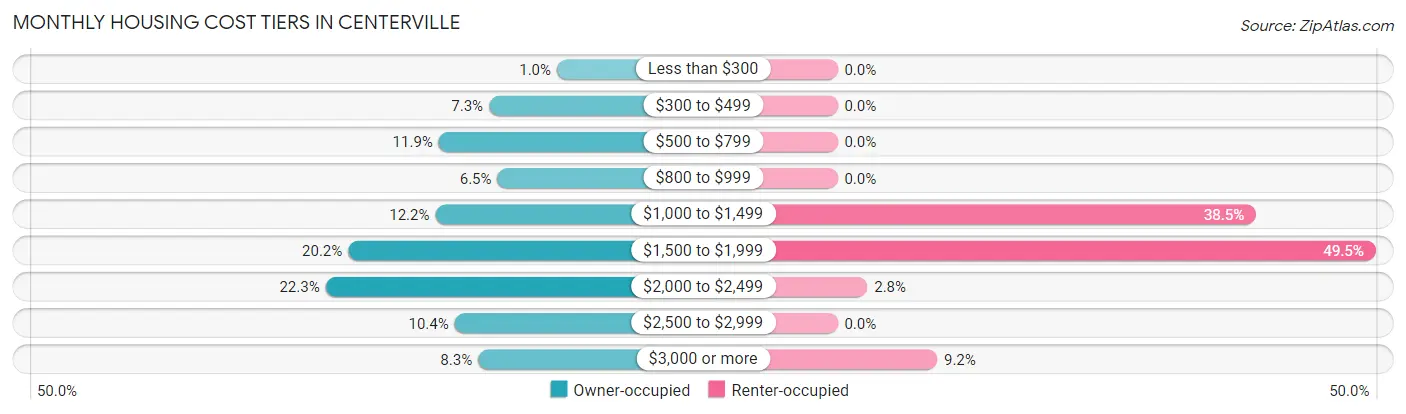
| Monthly Cost | Owner-occupied | Renter-occupied |
| Less than $300 | 13 (1.0%) | 0 (0.0%) |
| $300 to $499 | 94 (7.2%) | 0 (0.0%) |
| $500 to $799 | 154 (11.9%) | 0 (0.0%) |
| $800 to $999 | 84 (6.5%) | 0 (0.0%) |
| $1,000 to $1,499 | 158 (12.2%) | 42 (38.5%) |
| $1,500 to $1,999 | 262 (20.2%) | 54 (49.5%) |
| $2,000 to $2,499 | 289 (22.3%) | 3 (2.8%) |
| $2,500 to $2,999 | 135 (10.4%) | 0 (0.0%) |
| $3,000 or more | 107 (8.3%) | 10 (9.2%) |
| Total | 1,296 (100.0%) | 109 (100.0%) |
Physical Housing Characteristics in Centerville
Housing Structures in Centerville
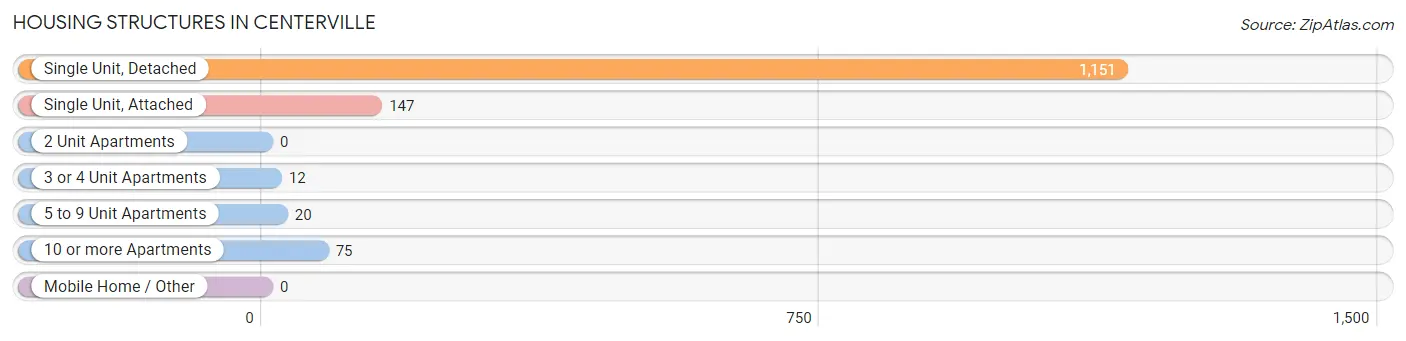
| Structure Type | # Housing Units | % Housing Units |
| Single Unit, Detached | 1,151 | 81.9% |
| Single Unit, Attached | 147 | 10.5% |
| 2 Unit Apartments | 0 | 0.0% |
| 3 or 4 Unit Apartments | 12 | 0.9% |
| 5 to 9 Unit Apartments | 20 | 1.4% |
| 10 or more Apartments | 75 | 5.3% |
| Mobile Home / Other | 0 | 0.0% |
| Total | 1,405 | 100.0% |
Housing Structures by Occupancy in Centerville
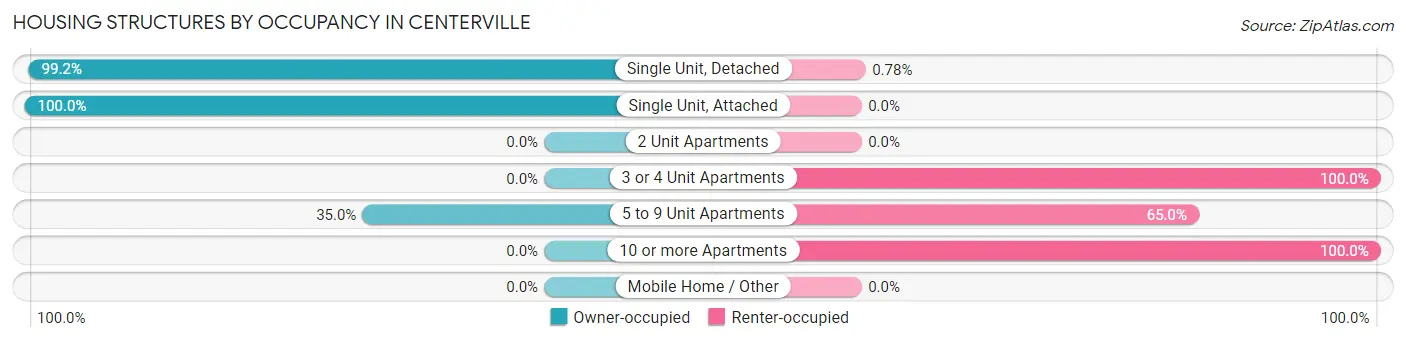
| Structure Type | Owner-occupied | Renter-occupied |
| Single Unit, Detached | 1,142 (99.2%) | 9 (0.8%) |
| Single Unit, Attached | 147 (100.0%) | 0 (0.0%) |
| 2 Unit Apartments | 0 (0.0%) | 0 (0.0%) |
| 3 or 4 Unit Apartments | 0 (0.0%) | 12 (100.0%) |
| 5 to 9 Unit Apartments | 7 (35.0%) | 13 (65.0%) |
| 10 or more Apartments | 0 (0.0%) | 75 (100.0%) |
| Mobile Home / Other | 0 (0.0%) | 0 (0.0%) |
| Total | 1,296 (92.2%) | 109 (7.8%) |
Housing Structures by Number of Rooms in Centerville
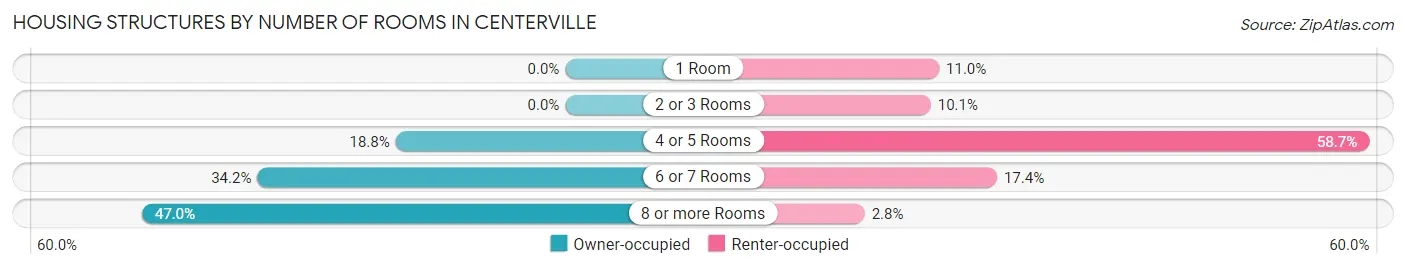
| Number of Rooms | Owner-occupied | Renter-occupied |
| 1 Room | 0 (0.0%) | 12 (11.0%) |
| 2 or 3 Rooms | 0 (0.0%) | 11 (10.1%) |
| 4 or 5 Rooms | 244 (18.8%) | 64 (58.7%) |
| 6 or 7 Rooms | 443 (34.2%) | 19 (17.4%) |
| 8 or more Rooms | 609 (47.0%) | 3 (2.8%) |
| Total | 1,296 (100.0%) | 109 (100.0%) |
Housing Structure by Heating Type in Centerville
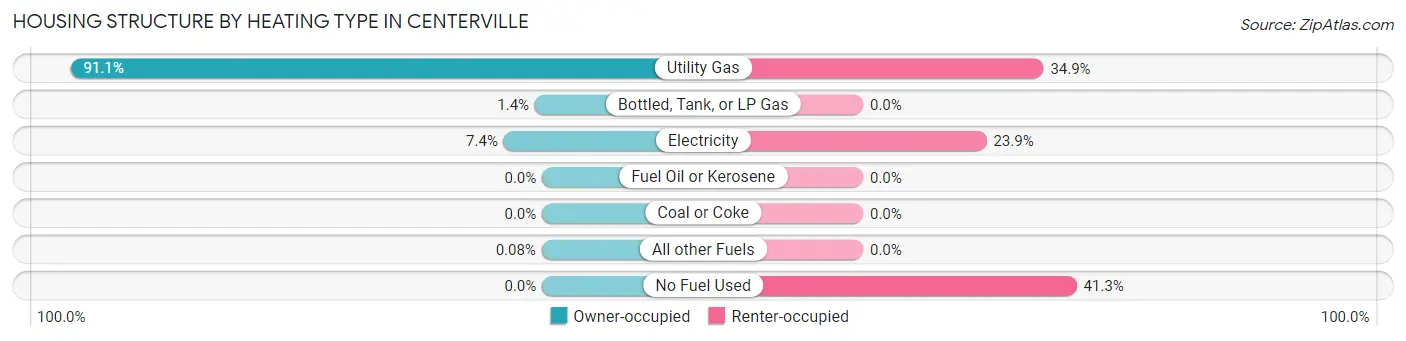
| Heating Type | Owner-occupied | Renter-occupied |
| Utility Gas | 1,181 (91.1%) | 38 (34.9%) |
| Bottled, Tank, or LP Gas | 18 (1.4%) | 0 (0.0%) |
| Electricity | 96 (7.4%) | 26 (23.8%) |
| Fuel Oil or Kerosene | 0 (0.0%) | 0 (0.0%) |
| Coal or Coke | 0 (0.0%) | 0 (0.0%) |
| All other Fuels | 1 (0.1%) | 0 (0.0%) |
| No Fuel Used | 0 (0.0%) | 45 (41.3%) |
| Total | 1,296 (100.0%) | 109 (100.0%) |
Household Vehicle Usage in Centerville
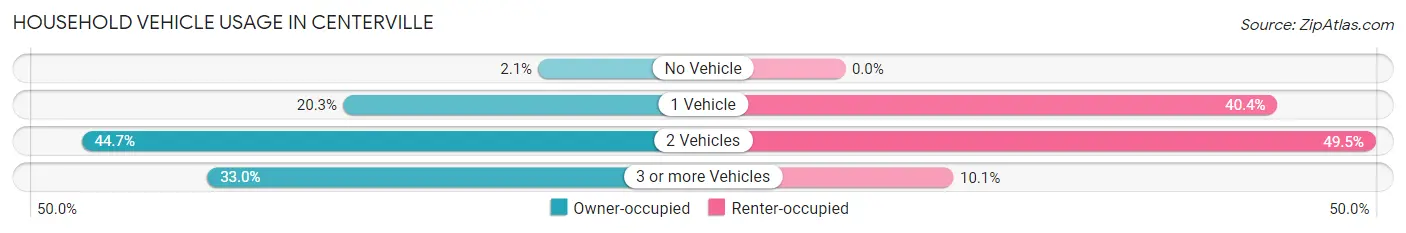
| Vehicles per Household | Owner-occupied | Renter-occupied |
| No Vehicle | 27 (2.1%) | 0 (0.0%) |
| 1 Vehicle | 263 (20.3%) | 44 (40.4%) |
| 2 Vehicles | 579 (44.7%) | 54 (49.5%) |
| 3 or more Vehicles | 427 (33.0%) | 11 (10.1%) |
| Total | 1,296 (100.0%) | 109 (100.0%) |
Real Estate & Mortgages in Centerville
Real Estate and Mortgage Overview in Centerville
| Characteristic | Without Mortgage | With Mortgage |
| Housing Units | 340 | 956 |
| Median Property Value | $298,000 | $374,300 |
| Median Household Income | $83,056 | $509 |
| Monthly Housing Costs | $655 | $107 |
| Real Estate Taxes | $3,862 | $13 |
Property Value by Mortgage Status in Centerville
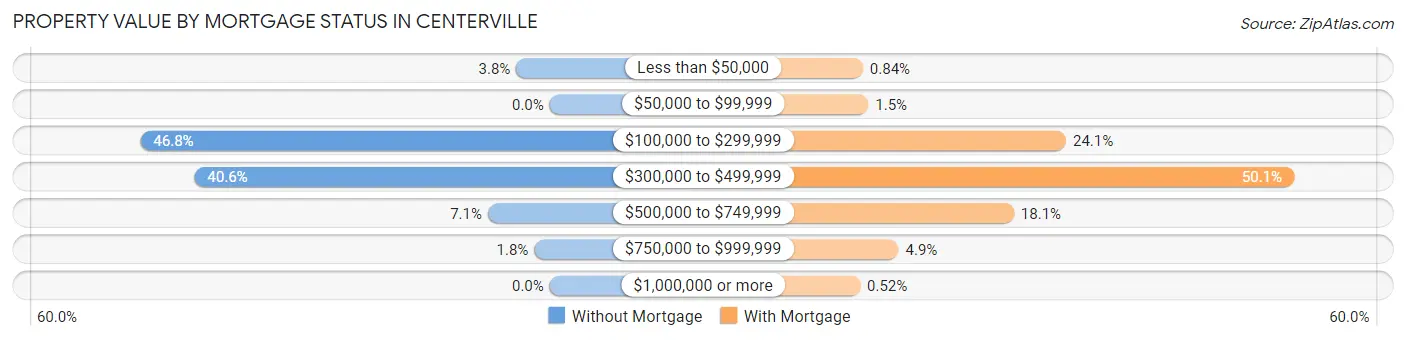
| Property Value | Without Mortgage | With Mortgage |
| Less than $50,000 | 13 (3.8%) | 8 (0.8%) |
| $50,000 to $99,999 | 0 (0.0%) | 14 (1.5%) |
| $100,000 to $299,999 | 159 (46.8%) | 230 (24.1%) |
| $300,000 to $499,999 | 138 (40.6%) | 479 (50.1%) |
| $500,000 to $749,999 | 24 (7.1%) | 173 (18.1%) |
| $750,000 to $999,999 | 6 (1.8%) | 47 (4.9%) |
| $1,000,000 or more | 0 (0.0%) | 5 (0.5%) |
| Total | 340 (100.0%) | 956 (100.0%) |
Household Income by Mortgage Status in Centerville
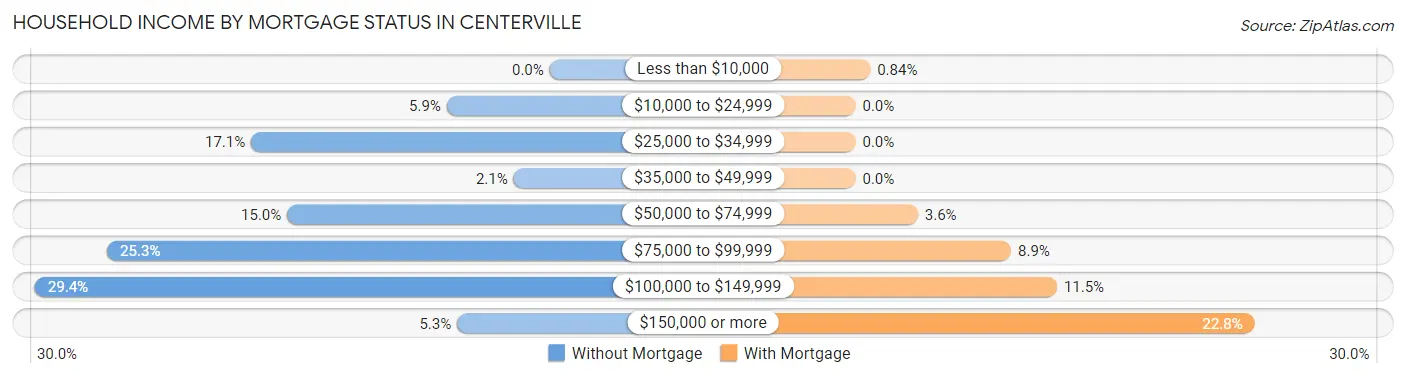
| Household Income | Without Mortgage | With Mortgage |
| Less than $10,000 | 0 (0.0%) | 8 (0.8%) |
| $10,000 to $24,999 | 20 (5.9%) | 0 (0.0%) |
| $25,000 to $34,999 | 58 (17.1%) | 0 (0.0%) |
| $35,000 to $49,999 | 7 (2.1%) | 0 (0.0%) |
| $50,000 to $74,999 | 51 (15.0%) | 34 (3.6%) |
| $75,000 to $99,999 | 86 (25.3%) | 85 (8.9%) |
| $100,000 to $149,999 | 100 (29.4%) | 110 (11.5%) |
| $150,000 or more | 18 (5.3%) | 218 (22.8%) |
| Total | 340 (100.0%) | 956 (100.0%) |
Property Value to Household Income Ratio in Centerville
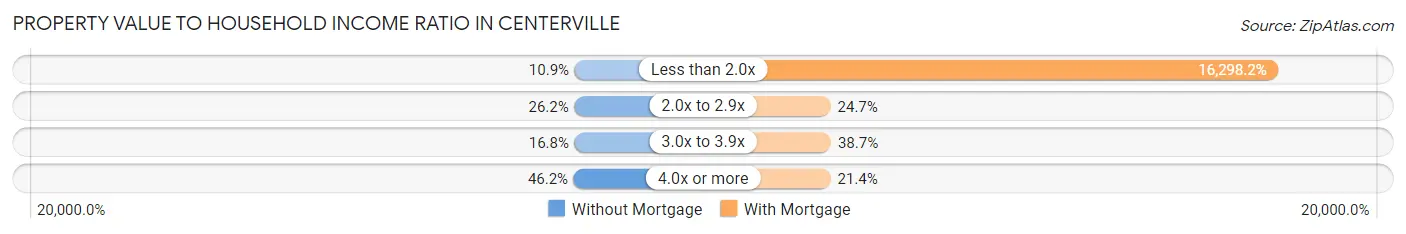
| Value-to-Income Ratio | Without Mortgage | With Mortgage |
| Less than 2.0x | 37 (10.9%) | 155,811 (16,298.2%) |
| 2.0x to 2.9x | 89 (26.2%) | 236 (24.7%) |
| 3.0x to 3.9x | 57 (16.8%) | 370 (38.7%) |
| 4.0x or more | 157 (46.2%) | 205 (21.4%) |
| Total | 340 (100.0%) | 956 (100.0%) |
Real Estate Taxes by Mortgage Status in Centerville

| Property Taxes | Without Mortgage | With Mortgage |
| Less than $800 | 8 (2.4%) | 0 (0.0%) |
| $800 to $1,499 | 0 (0.0%) | 12 (1.3%) |
| $800 to $1,499 | 319 (93.8%) | 1 (0.1%) |
| Total | 340 (100.0%) | 956 (100.0%) |
Health & Disability in Centerville
Health Insurance Coverage by Age in Centerville
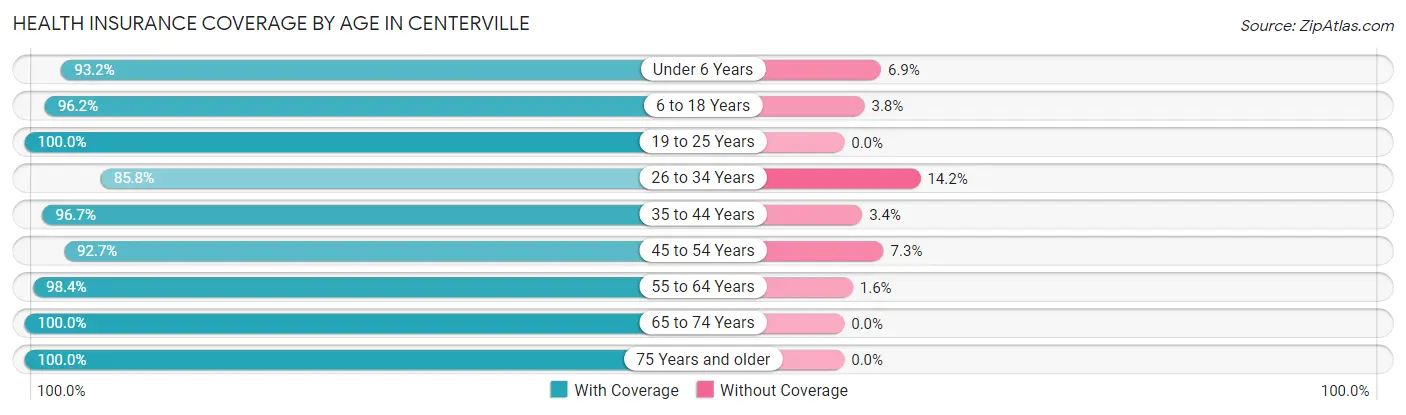
| Age Bracket | With Coverage | Without Coverage |
| Under 6 Years | 272 (93.1%) | 20 (6.9%) |
| 6 to 18 Years | 816 (96.2%) | 32 (3.8%) |
| 19 to 25 Years | 155 (100.0%) | 0 (0.0%) |
| 26 to 34 Years | 320 (85.8%) | 53 (14.2%) |
| 35 to 44 Years | 663 (96.7%) | 23 (3.4%) |
| 45 to 54 Years | 467 (92.7%) | 37 (7.3%) |
| 55 to 64 Years | 492 (98.4%) | 8 (1.6%) |
| 65 to 74 Years | 323 (100.0%) | 0 (0.0%) |
| 75 Years and older | 224 (100.0%) | 0 (0.0%) |
| Total | 3,732 (95.6%) | 173 (4.4%) |
Health Insurance Coverage by Citizenship Status in Centerville

| Citizenship Status | With Coverage | Without Coverage |
| Native Born | 272 (93.1%) | 20 (6.9%) |
| Foreign Born, Citizen | 816 (96.2%) | 32 (3.8%) |
| Foreign Born, not a Citizen | 155 (100.0%) | 0 (0.0%) |
Health Insurance Coverage by Household Income in Centerville
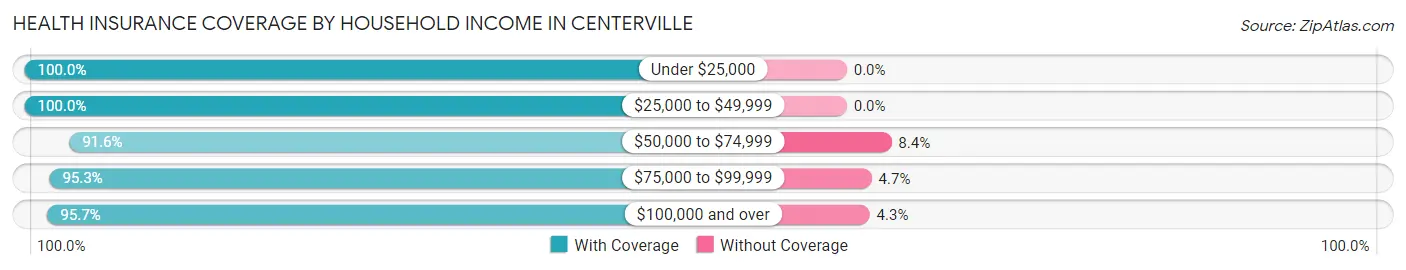
| Household Income | With Coverage | Without Coverage |
| Under $25,000 | 35 (100.0%) | 0 (0.0%) |
| $25,000 to $49,999 | 147 (100.0%) | 0 (0.0%) |
| $50,000 to $74,999 | 252 (91.6%) | 23 (8.4%) |
| $75,000 to $99,999 | 614 (95.3%) | 30 (4.7%) |
| $100,000 and over | 2,684 (95.7%) | 120 (4.3%) |
Public vs Private Health Insurance Coverage by Age in Centerville
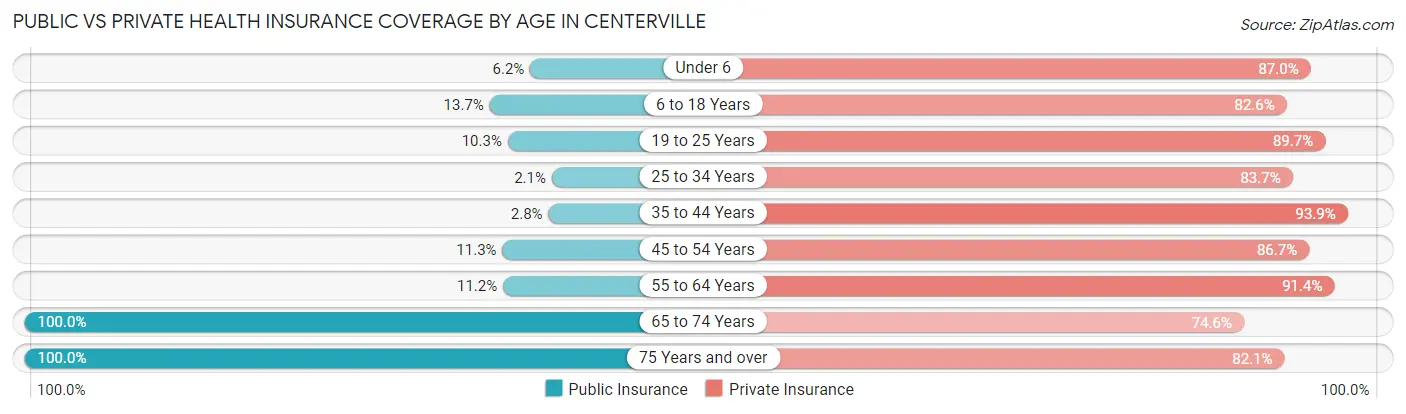
| Age Bracket | Public Insurance | Private Insurance |
| Under 6 | 18 (6.2%) | 254 (87.0%) |
| 6 to 18 Years | 116 (13.7%) | 700 (82.6%) |
| 19 to 25 Years | 16 (10.3%) | 139 (89.7%) |
| 25 to 34 Years | 8 (2.1%) | 312 (83.7%) |
| 35 to 44 Years | 19 (2.8%) | 644 (93.9%) |
| 45 to 54 Years | 57 (11.3%) | 437 (86.7%) |
| 55 to 64 Years | 56 (11.2%) | 457 (91.4%) |
| 65 to 74 Years | 323 (100.0%) | 241 (74.6%) |
| 75 Years and over | 224 (100.0%) | 184 (82.1%) |
| Total | 837 (21.4%) | 3,368 (86.3%) |
Disability Status by Sex by Age in Centerville
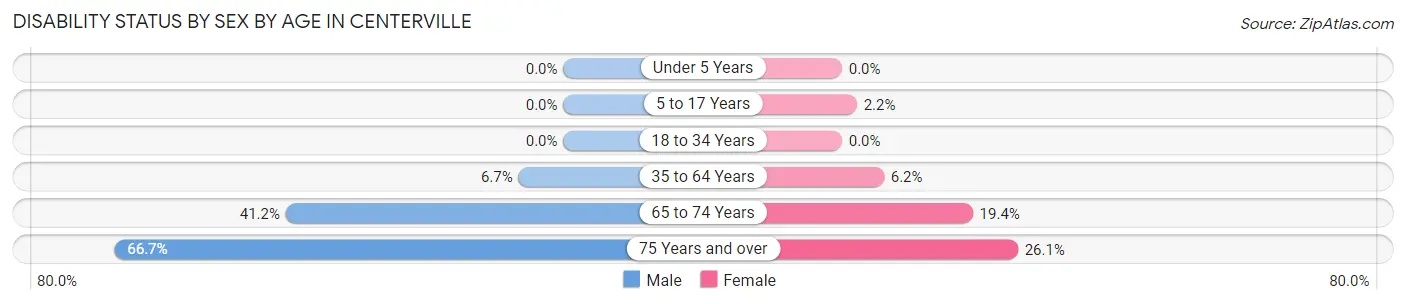
| Age Bracket | Male | Female |
| Under 5 Years | 0 (0.0%) | 0 (0.0%) |
| 5 to 17 Years | 0 (0.0%) | 9 (2.2%) |
| 18 to 34 Years | 0 (0.0%) | 0 (0.0%) |
| 35 to 64 Years | 58 (6.7%) | 51 (6.2%) |
| 65 to 74 Years | 61 (41.2%) | 34 (19.4%) |
| 75 Years and over | 60 (66.7%) | 35 (26.1%) |
Disability Class by Sex by Age in Centerville
Disability Class: Hearing Difficulty
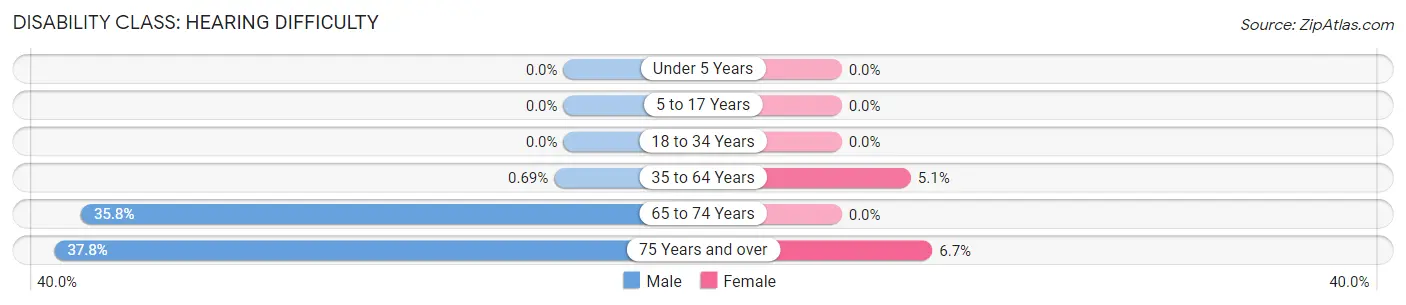
| Age Bracket | Male | Female |
| Under 5 Years | 0 (0.0%) | 0 (0.0%) |
| 5 to 17 Years | 0 (0.0%) | 0 (0.0%) |
| 18 to 34 Years | 0 (0.0%) | 0 (0.0%) |
| 35 to 64 Years | 6 (0.7%) | 42 (5.1%) |
| 65 to 74 Years | 53 (35.8%) | 0 (0.0%) |
| 75 Years and over | 34 (37.8%) | 9 (6.7%) |
Disability Class: Vision Difficulty
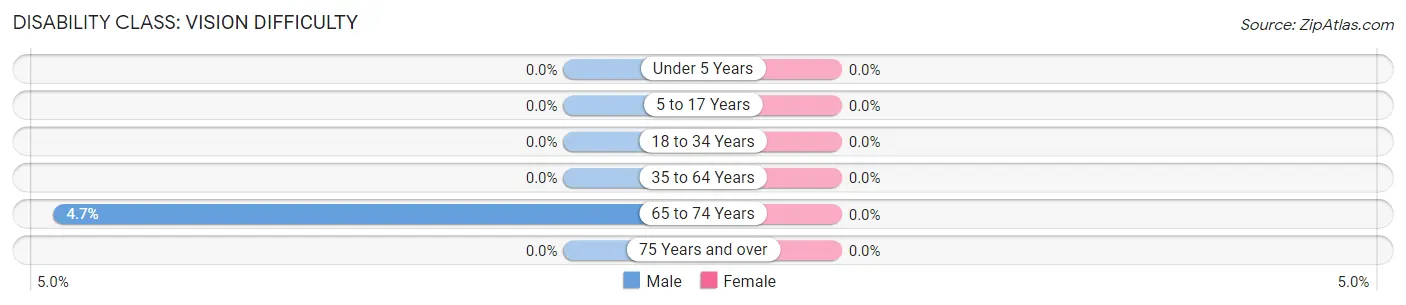
| Age Bracket | Male | Female |
| Under 5 Years | 0 (0.0%) | 0 (0.0%) |
| 5 to 17 Years | 0 (0.0%) | 0 (0.0%) |
| 18 to 34 Years | 0 (0.0%) | 0 (0.0%) |
| 35 to 64 Years | 0 (0.0%) | 0 (0.0%) |
| 65 to 74 Years | 7 (4.7%) | 0 (0.0%) |
| 75 Years and over | 0 (0.0%) | 0 (0.0%) |
Disability Class: Cognitive Difficulty
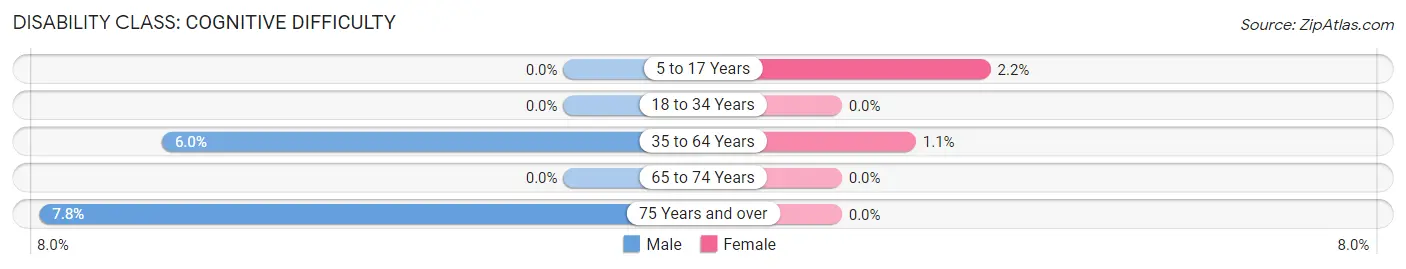
| Age Bracket | Male | Female |
| 5 to 17 Years | 0 (0.0%) | 9 (2.2%) |
| 18 to 34 Years | 0 (0.0%) | 0 (0.0%) |
| 35 to 64 Years | 52 (6.0%) | 9 (1.1%) |
| 65 to 74 Years | 0 (0.0%) | 0 (0.0%) |
| 75 Years and over | 7 (7.8%) | 0 (0.0%) |
Disability Class: Ambulatory Difficulty
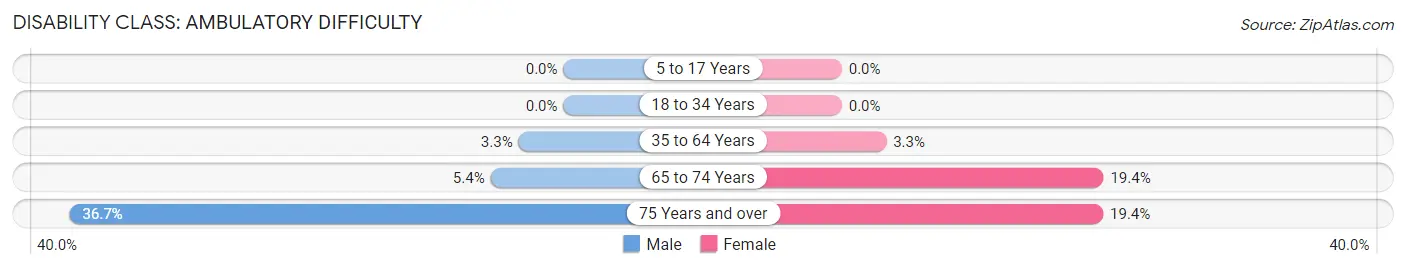
| Age Bracket | Male | Female |
| 5 to 17 Years | 0 (0.0%) | 0 (0.0%) |
| 18 to 34 Years | 0 (0.0%) | 0 (0.0%) |
| 35 to 64 Years | 29 (3.3%) | 27 (3.3%) |
| 65 to 74 Years | 8 (5.4%) | 34 (19.4%) |
| 75 Years and over | 33 (36.7%) | 26 (19.4%) |
Disability Class: Self-Care Difficulty
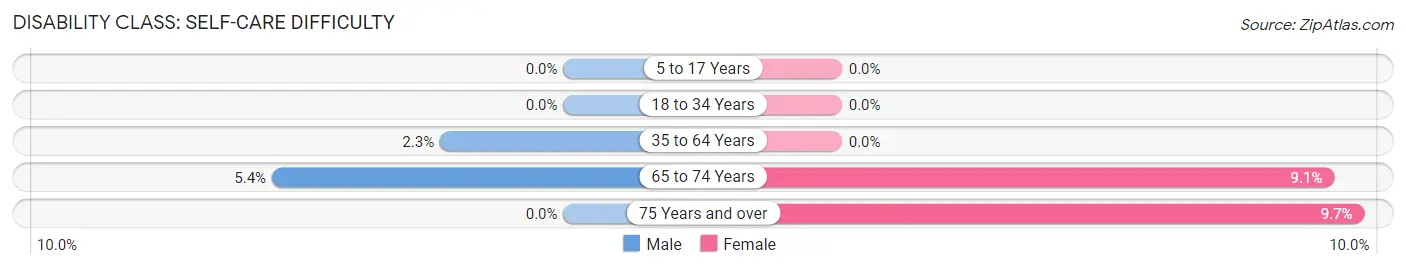
| Age Bracket | Male | Female |
| 5 to 17 Years | 0 (0.0%) | 0 (0.0%) |
| 18 to 34 Years | 0 (0.0%) | 0 (0.0%) |
| 35 to 64 Years | 20 (2.3%) | 0 (0.0%) |
| 65 to 74 Years | 8 (5.4%) | 16 (9.1%) |
| 75 Years and over | 0 (0.0%) | 13 (9.7%) |
Technology Access in Centerville
Computing Device Access in Centerville
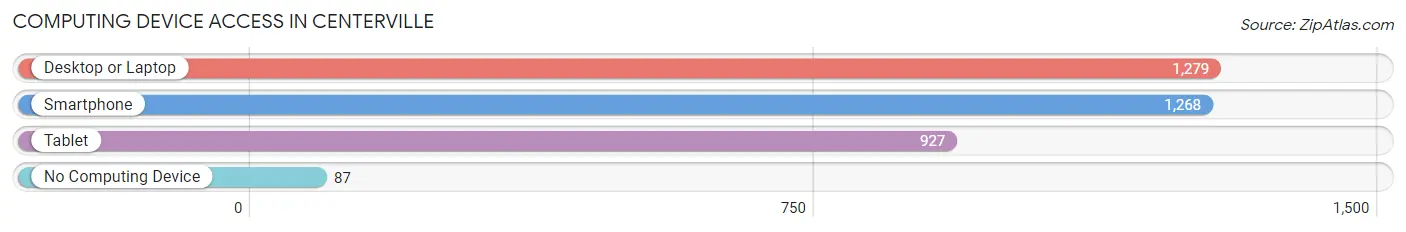
| Device Type | # Households | % Households |
| Desktop or Laptop | 1,279 | 91.0% |
| Smartphone | 1,268 | 90.2% |
| Tablet | 927 | 66.0% |
| No Computing Device | 87 | 6.2% |
| Total | 1,405 | 100.0% |
Internet Access in Centerville
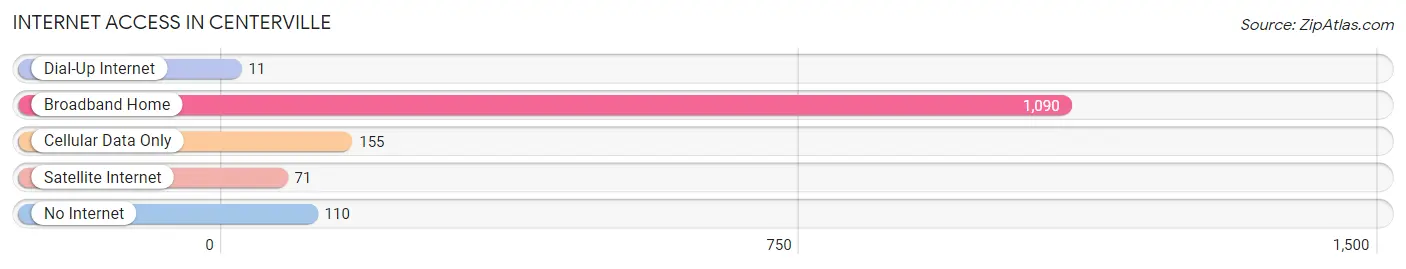
| Internet Type | # Households | % Households |
| Dial-Up Internet | 11 | 0.8% |
| Broadband Home | 1,090 | 77.6% |
| Cellular Data Only | 155 | 11.0% |
| Satellite Internet | 71 | 5.1% |
| No Internet | 110 | 7.8% |
| Total | 1,405 | 100.0% |
Centerville Summary
Centerville, Minnesota is a small city located in Anoka County, Minnesota. It is situated on the banks of the Rum River, approximately 25 miles north of Minneapolis. The city has a population of approximately 4,000 people and is part of the Twin Cities metropolitan area.
History
Centerville was founded in 1856 by a group of settlers from New England. The settlers were attracted to the area by the abundance of timber and the potential for farming. The town was originally named Centerville because of its central location between the cities of Anoka and St. Francis.
The first settlers built a sawmill and a gristmill, which provided the town with its first industry. The town grew slowly but steadily, and by the late 19th century, it had become a thriving community.
In the early 20th century, the town experienced a period of growth and prosperity. The population increased from 1,000 in 1900 to 4,000 in 1950. During this time, the town was home to several businesses, including a flour mill, a creamery, a furniture factory, and a brickyard.
Geography
Centerville is located in Anoka County, Minnesota. It is situated on the banks of the Rum River, approximately 25 miles north of Minneapolis. The city has a total area of 2.2 square miles, all of which is land.
The city is located in a region of rolling hills and wooded areas. The terrain is mostly flat, with some areas of higher elevation. The climate is humid continental, with cold winters and warm summers.
Economy
Centerville’s economy is largely based on agriculture and manufacturing. The city is home to several large farms, which produce a variety of crops, including corn, soybeans, and wheat. The city is also home to several manufacturing companies, which produce a variety of products, including furniture, clothing, and electronics.
The city is also home to several small businesses, including restaurants, retail stores, and service providers. The city is also home to several large employers, including the Anoka County government, the Anoka-Hennepin School District, and the Centerville Medical Center.
Demographics
As of the 2010 census, the population of Centerville was 4,000. The racial makeup of the city was 94.2% White, 1.2% African American, 0.7% Native American, 0.7% Asian, 0.1% Pacific Islander, 1.2% from other races, and 2.0% from two or more races. Hispanic or Latino of any race were 3.2% of the population.
The median income for a household in the city was $50,000, and the median income for a family was $60,000. The per capita income for the city was $25,000. About 8.2% of families and 10.2% of the population were below the poverty line, including 14.2% of those under age 18 and 6.2% of those age 65 or over.
Centerville is a small city with a rich history and a diverse economy. It is home to a variety of businesses, from large employers to small businesses, and its population is diverse and growing. The city is a great place to live, work, and play, and it is sure to continue to grow and thrive in the years to come.
Common Questions
What is Per Capita Income in Centerville?
Per Capita income in Centerville is $52,958.
What is the Median Family Income in Centerville?
Median Family Income in Centerville is $149,671.
What is the Median Household income in Centerville?
Median Household Income in Centerville is $117,481.
What is Income or Wage Gap in Centerville?
Income or Wage Gap in Centerville is 17.3%.
Women in Centerville earn 82.7 cents for every dollar earned by a man.
What is Inequality or Gini Index in Centerville?
Inequality or Gini Index in Centerville is 0.34.
What is the Total Population of Centerville?
Total Population of Centerville is 3,916.
What is the Total Male Population of Centerville?
Total Male Population of Centerville is 1,939.
What is the Total Female Population of Centerville?
Total Female Population of Centerville is 1,977.
What is the Ratio of Males per 100 Females in Centerville?
There are 98.08 Males per 100 Females in Centerville.
What is the Ratio of Females per 100 Males in Centerville?
There are 101.96 Females per 100 Males in Centerville.
What is the Median Population Age in Centerville?
Median Population Age in Centerville is 39.0 Years.
What is the Average Family Size in Centerville
Average Family Size in Centerville is 3.4 People.
What is the Average Household Size in Centerville
Average Household Size in Centerville is 2.8 People.
How Large is the Labor Force in Centerville?
There are 2,276 People in the Labor Forcein in Centerville.
What is the Percentage of People in the Labor Force in Centerville?
76.2% of People are in the Labor Force in Centerville.
What is the Unemployment Rate in Centerville?
Unemployment Rate in Centerville is 0.6%.