Turley, OK Map & Demographics
Turley Map
Turley Overview
$18,776
PER CAPITA INCOME
$41,165
AVG FAMILY INCOME
$40,906
AVG HOUSEHOLD INCOME
47.8%
WAGE / INCOME GAP [ % ]
52.2¢/ $1
WAGE / INCOME GAP [ $ ]
$8,710
FAMILY INCOME DEFICIT
0.35
INEQUALITY / GINI INDEX
2,917
TOTAL POPULATION
1,431
MALE POPULATION
1,486
FEMALE POPULATION
96.30
MALES / 100 FEMALES
103.84
FEMALES / 100 MALES
40.3
MEDIAN AGE
3.0
AVG FAMILY SIZE
2.6
AVG HOUSEHOLD SIZE
1,305
LABOR FORCE [ PEOPLE ]
55.6%
PERCENT IN LABOR FORCE
11.1%
UNEMPLOYMENT RATE
Income in Turley
Income Overview in Turley
Per Capita Income in Turley is $18,776, while median incomes of families and households are $41,165 and $40,906 respectively.
| Characteristic | Number | Measure |
| Per Capita Income | 2,917 | $18,776 |
| Median Family Income | 737 | $41,165 |
| Mean Family Income | 737 | $56,233 |
| Median Household Income | 1,054 | $40,906 |
| Mean Household Income | 1,054 | $53,310 |
| Income Deficit | 737 | $8,710 |
| Wage / Income Gap (%) | 2,917 | 47.82% |
| Wage / Income Gap ($) | 2,917 | 52.18¢ per $1 |
| Gini / Inequality Index | 2,917 | 0.35 |
Earnings by Sex in Turley
Average Earnings in Turley are $23,634, $30,778 for men and $16,061 for women, a difference of 47.8%.
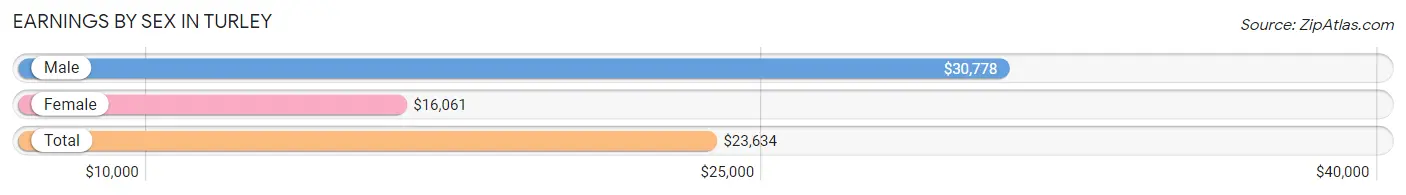
| Sex | Number | Average Earnings |
| Male | 719 (52.3%) | $30,778 |
| Female | 656 (47.7%) | $16,061 |
| Total | 1,375 (100.0%) | $23,634 |
Earnings by Sex by Income Bracket in Turley
The most common earnings brackets in Turley are $25,000 to $29,999 for men (83 | 11.5%) and $12,500 to $14,999 for women (138 | 21.0%).
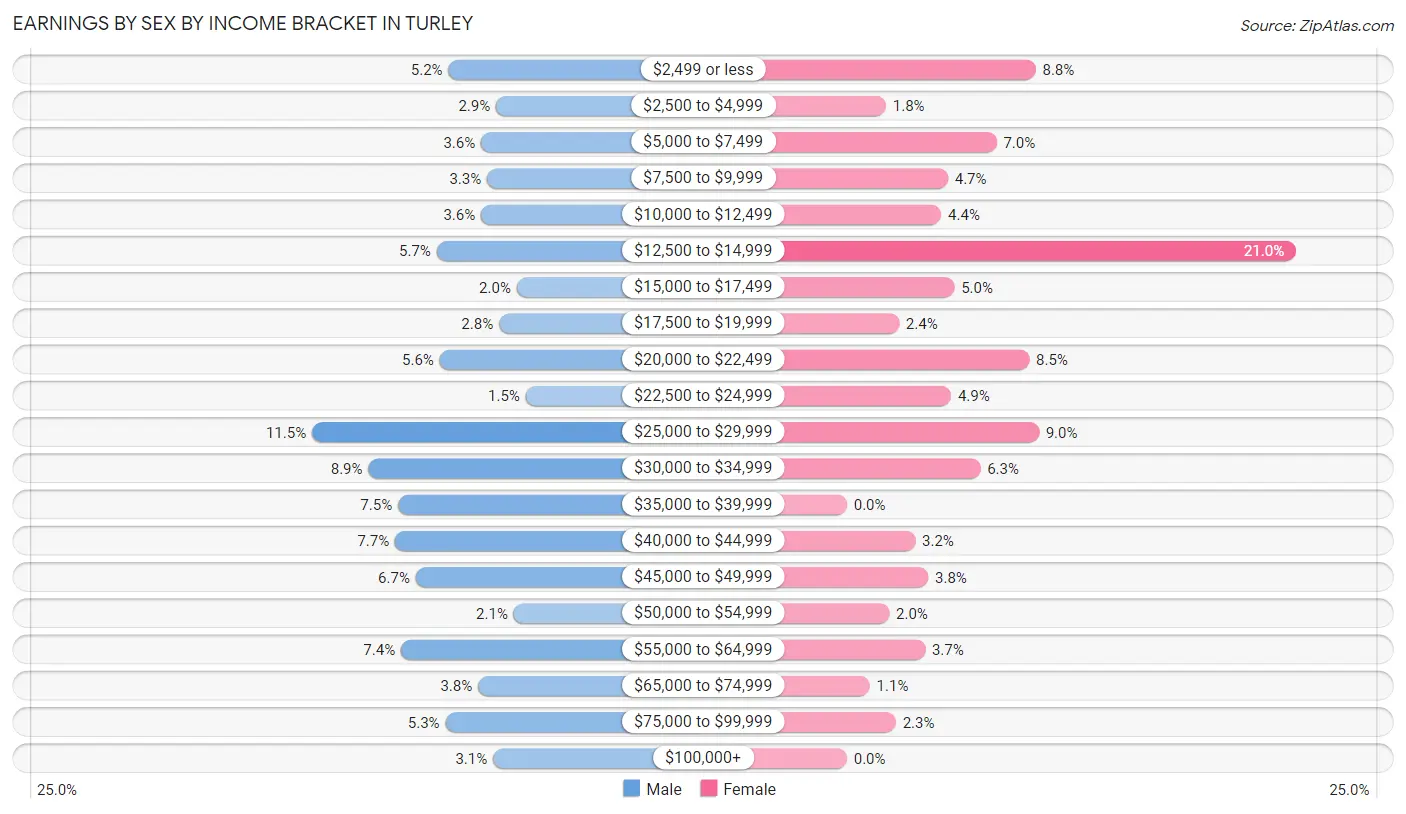
| Income | Male | Female |
| $2,499 or less | 37 (5.1%) | 58 (8.8%) |
| $2,500 to $4,999 | 21 (2.9%) | 12 (1.8%) |
| $5,000 to $7,499 | 26 (3.6%) | 46 (7.0%) |
| $7,500 to $9,999 | 24 (3.3%) | 31 (4.7%) |
| $10,000 to $12,499 | 26 (3.6%) | 29 (4.4%) |
| $12,500 to $14,999 | 41 (5.7%) | 138 (21.0%) |
| $15,000 to $17,499 | 14 (1.9%) | 33 (5.0%) |
| $17,500 to $19,999 | 20 (2.8%) | 16 (2.4%) |
| $20,000 to $22,499 | 40 (5.6%) | 56 (8.5%) |
| $22,500 to $24,999 | 11 (1.5%) | 32 (4.9%) |
| $25,000 to $29,999 | 83 (11.5%) | 59 (9.0%) |
| $30,000 to $34,999 | 64 (8.9%) | 41 (6.2%) |
| $35,000 to $39,999 | 54 (7.5%) | 0 (0.0%) |
| $40,000 to $44,999 | 55 (7.6%) | 21 (3.2%) |
| $45,000 to $49,999 | 48 (6.7%) | 25 (3.8%) |
| $50,000 to $54,999 | 15 (2.1%) | 13 (2.0%) |
| $55,000 to $64,999 | 53 (7.4%) | 24 (3.7%) |
| $65,000 to $74,999 | 27 (3.8%) | 7 (1.1%) |
| $75,000 to $99,999 | 38 (5.3%) | 15 (2.3%) |
| $100,000+ | 22 (3.1%) | 0 (0.0%) |
| Total | 719 (100.0%) | 656 (100.0%) |
Earnings by Sex by Educational Attainment in Turley
Average earnings in Turley are $31,715 for men and $15,909 for women, a difference of 49.8%. Men with an educational attainment of bachelor's degree enjoy the highest average annual earnings of $40,750, while those with high school diploma education earn the least with $30,521. Women with an educational attainment of bachelor's degree earn the most with the average annual earnings of $29,063, while those with less than high school education have the smallest earnings of $13,554.
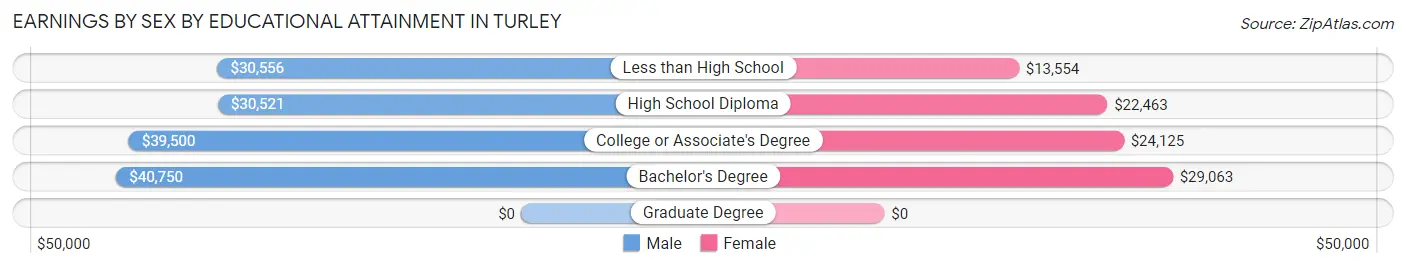
| Educational Attainment | Male Income | Female Income |
| Less than High School | $30,556 | $13,554 |
| High School Diploma | $30,521 | $22,463 |
| College or Associate's Degree | $39,500 | $24,125 |
| Bachelor's Degree | $40,750 | $29,063 |
| Graduate Degree | - | - |
| Total | $31,715 | $15,909 |
Family Income in Turley
Family Income Brackets in Turley
According to the Turley family income data, there are 255 families falling into the $35,000 to $49,999 income range, which is the most common income bracket and makes up 34.6% of all families.
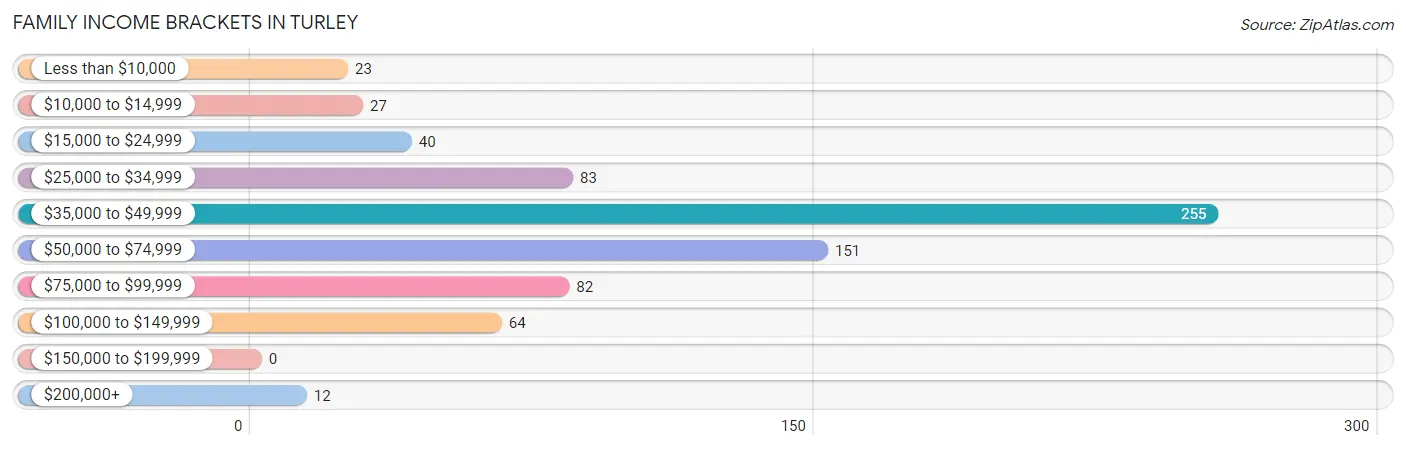
| Income Bracket | # Families | % Families |
| Less than $10,000 | 23 | 3.1% |
| $10,000 to $14,999 | 27 | 3.7% |
| $15,000 to $24,999 | 40 | 5.4% |
| $25,000 to $34,999 | 83 | 11.3% |
| $35,000 to $49,999 | 255 | 34.6% |
| $50,000 to $74,999 | 151 | 20.5% |
| $75,000 to $99,999 | 82 | 11.1% |
| $100,000 to $149,999 | 64 | 8.7% |
| $150,000 to $199,999 | 0 | 0.0% |
| $200,000+ | 12 | 1.6% |
Family Income by Famaliy Size in Turley
4-person families (106 | 14.4%) account for the highest median family income in Turley with $55,833 per family, while 2-person families (381 | 51.7%) have the highest median income of $19,564 per family member.
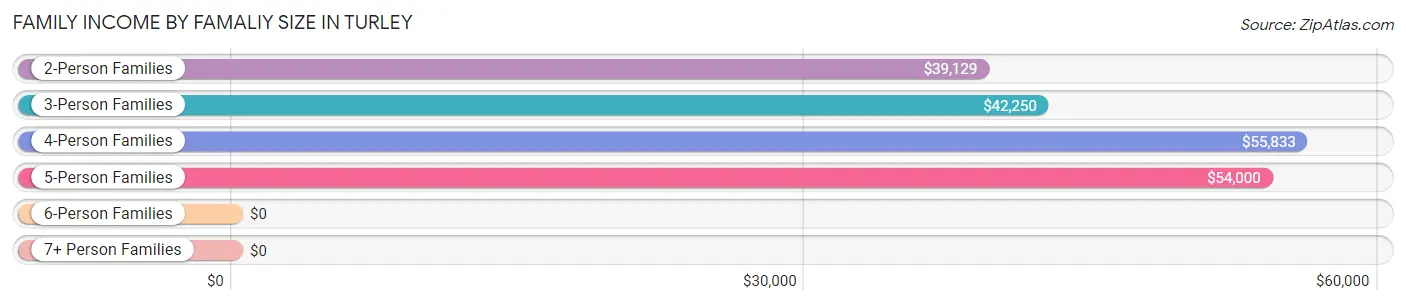
| Income Bracket | # Families | Median Income |
| 2-Person Families | 381 (51.7%) | $39,129 |
| 3-Person Families | 150 (20.3%) | $42,250 |
| 4-Person Families | 106 (14.4%) | $55,833 |
| 5-Person Families | 52 (7.1%) | $54,000 |
| 6-Person Families | 21 (2.9%) | $0 |
| 7+ Person Families | 27 (3.7%) | $0 |
| Total | 737 (100.0%) | $41,165 |
Family Income by Number of Earners in Turley
The median family income in Turley is $41,165, with families comprising 3+ earners (64) having the highest median family income of $80,000, while families with no earners (102) have the lowest median family income of $38,409, accounting for 8.7% and 13.8% of families, respectively.
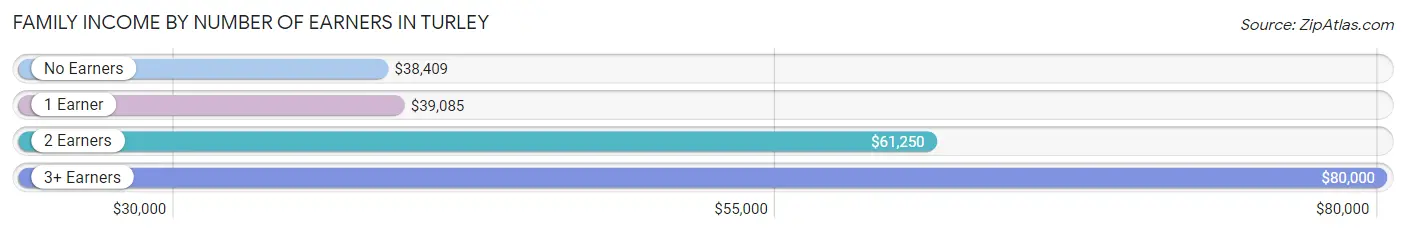
| Number of Earners | # Families | Median Income |
| No Earners | 102 (13.8%) | $38,409 |
| 1 Earner | 417 (56.6%) | $39,085 |
| 2 Earners | 154 (20.9%) | $61,250 |
| 3+ Earners | 64 (8.7%) | $80,000 |
| Total | 737 (100.0%) | $41,165 |
Household Income in Turley
Household Income Brackets in Turley
With 331 households falling in the category, the $35,000 to $49,999 income range is the most frequent in Turley, accounting for 31.4% of all households. In contrast, only 6 households (0.6%) fall into the $150,000 to $199,999 income bracket, making it the least populous group.
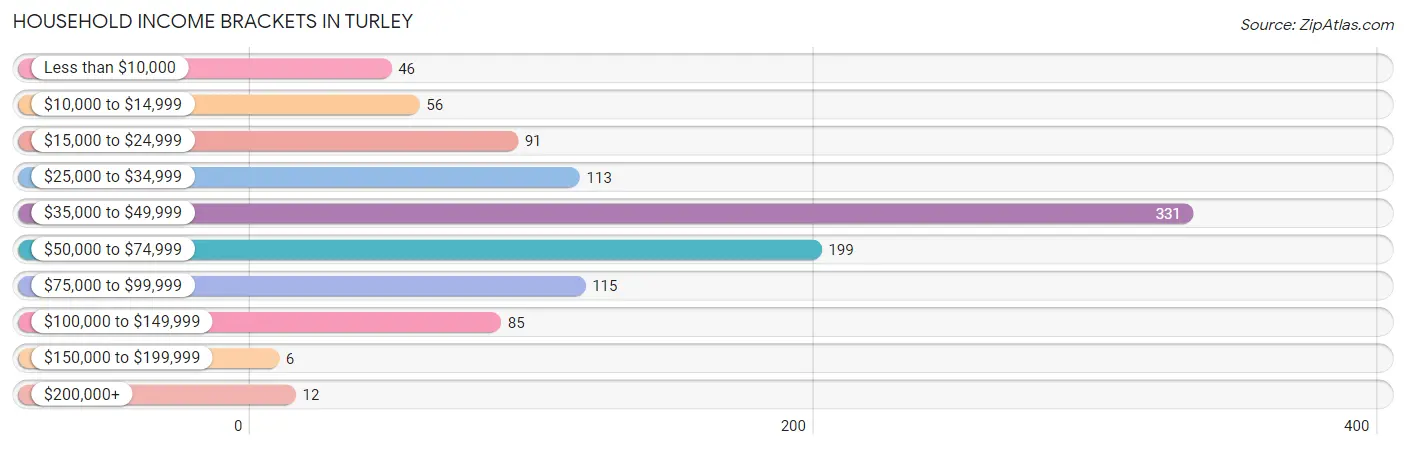
| Income Bracket | # Households | % Households |
| Less than $10,000 | 46 | 4.4% |
| $10,000 to $14,999 | 56 | 5.3% |
| $15,000 to $24,999 | 91 | 8.6% |
| $25,000 to $34,999 | 113 | 10.7% |
| $35,000 to $49,999 | 331 | 31.4% |
| $50,000 to $74,999 | 199 | 18.9% |
| $75,000 to $99,999 | 115 | 10.9% |
| $100,000 to $149,999 | 85 | 8.1% |
| $150,000 to $199,999 | 6 | 0.6% |
| $200,000+ | 12 | 1.1% |
Household Income by Householder Age in Turley
The median household income in Turley is $40,906, with the highest median household income of $48,500 found in the 45 to 64 years age bracket for the primary householder. A total of 448 households (42.5%) fall into this category. Meanwhile, the 15 to 24 years age bracket for the primary householder has the lowest median household income of $33,333, with 14 households (1.3%) in this group.
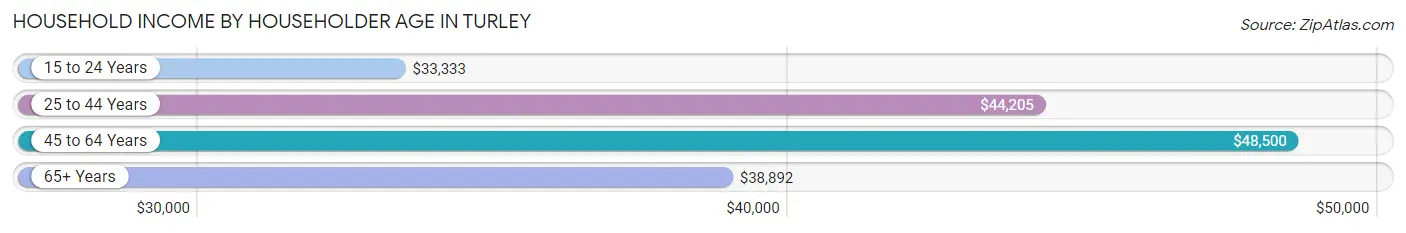
| Income Bracket | # Households | Median Income |
| 15 to 24 Years | 14 (1.3%) | $33,333 |
| 25 to 44 Years | 265 (25.1%) | $44,205 |
| 45 to 64 Years | 448 (42.5%) | $48,500 |
| 65+ Years | 327 (31.0%) | $38,892 |
| Total | 1,054 (100.0%) | $40,906 |
Poverty in Turley
Income Below Poverty by Sex and Age in Turley
With 19.5% poverty level for males and 19.2% for females among the residents of Turley, 15 year old males and 5 year old females are the most vulnerable to poverty, with 8 males (53.3%) and 21 females (52.5%) in their respective age groups living below the poverty level.
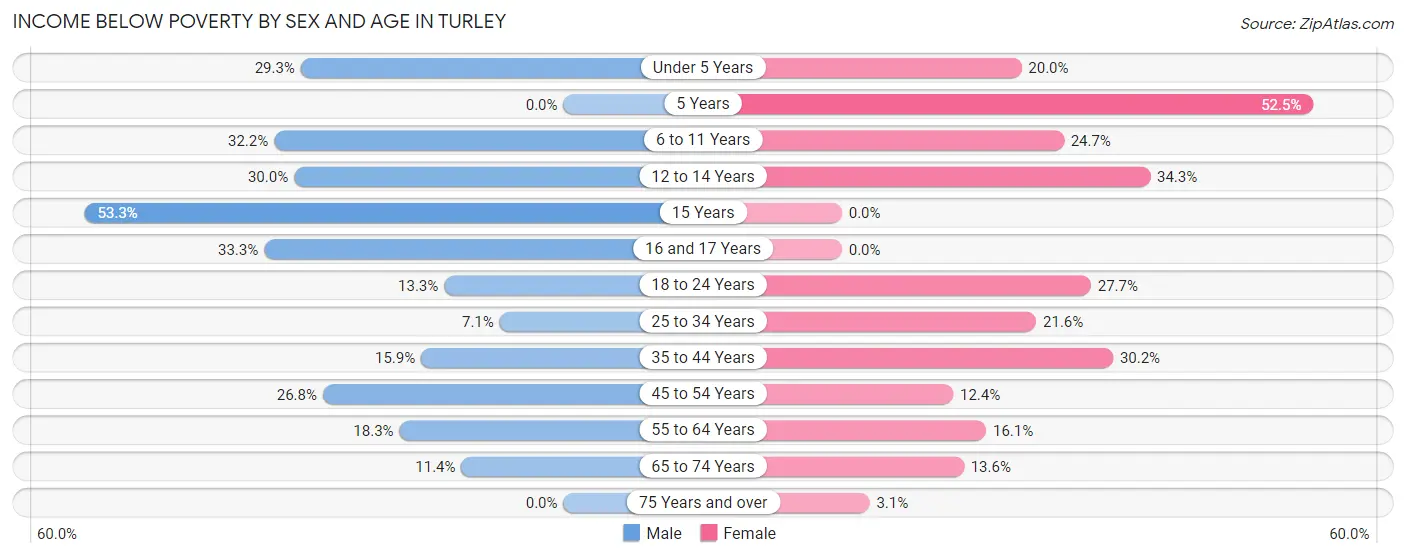
| Age Bracket | Male | Female |
| Under 5 Years | 43 (29.2%) | 11 (20.0%) |
| 5 Years | 0 (0.0%) | 21 (52.5%) |
| 6 to 11 Years | 29 (32.2%) | 21 (24.7%) |
| 12 to 14 Years | 9 (30.0%) | 23 (34.3%) |
| 15 Years | 8 (53.3%) | 0 (0.0%) |
| 16 and 17 Years | 16 (33.3%) | 0 (0.0%) |
| 18 to 24 Years | 17 (13.3%) | 33 (27.7%) |
| 25 to 34 Years | 13 (7.1%) | 29 (21.6%) |
| 35 to 44 Years | 29 (15.9%) | 45 (30.2%) |
| 45 to 54 Years | 60 (26.8%) | 28 (12.4%) |
| 55 to 64 Years | 40 (18.3%) | 27 (16.1%) |
| 65 to 74 Years | 10 (11.4%) | 11 (13.6%) |
| 75 Years and over | 0 (0.0%) | 6 (3.1%) |
| Total | 274 (19.5%) | 255 (19.2%) |
Income Above Poverty by Sex and Age in Turley
According to the poverty statistics in Turley, males aged 5 years and females aged 16 and 17 years are the age groups that are most secure financially, with 100.0% of males and 100.0% of females in these age groups living above the poverty line.
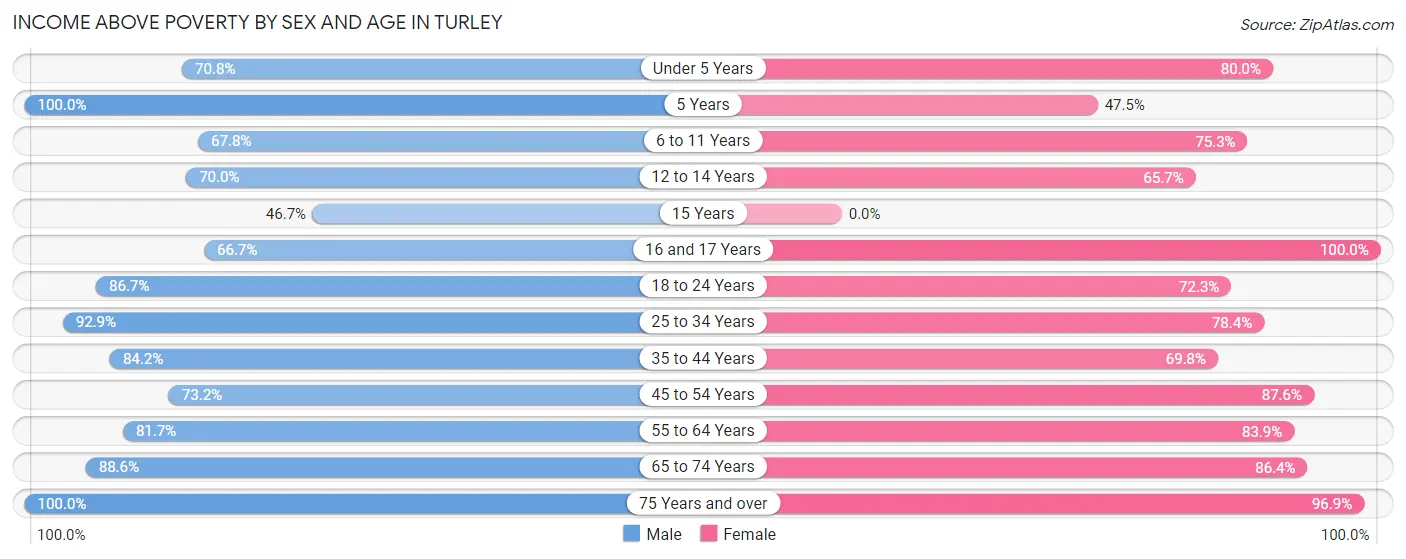
| Age Bracket | Male | Female |
| Under 5 Years | 104 (70.8%) | 44 (80.0%) |
| 5 Years | 6 (100.0%) | 19 (47.5%) |
| 6 to 11 Years | 61 (67.8%) | 64 (75.3%) |
| 12 to 14 Years | 21 (70.0%) | 44 (65.7%) |
| 15 Years | 7 (46.7%) | 0 (0.0%) |
| 16 and 17 Years | 32 (66.7%) | 8 (100.0%) |
| 18 to 24 Years | 111 (86.7%) | 86 (72.3%) |
| 25 to 34 Years | 170 (92.9%) | 105 (78.4%) |
| 35 to 44 Years | 154 (84.2%) | 104 (69.8%) |
| 45 to 54 Years | 164 (73.2%) | 198 (87.6%) |
| 55 to 64 Years | 179 (81.7%) | 141 (83.9%) |
| 65 to 74 Years | 78 (88.6%) | 70 (86.4%) |
| 75 Years and over | 48 (100.0%) | 189 (96.9%) |
| Total | 1,135 (80.5%) | 1,072 (80.8%) |
Income Below Poverty Among Married-Couple Families in Turley
The poverty statistics for married-couple families in Turley show that 10.3% or 42 of the total 406 families live below the poverty line. Families with 3 or 4 children have the highest poverty rate of 40.0%, comprising of 8 families. On the other hand, families with 5 or more children have the lowest poverty rate of 0.0%, which includes 0 families.
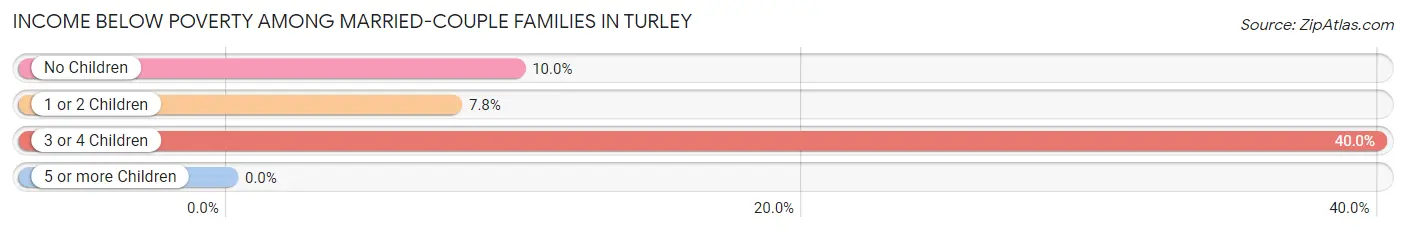
| Children | Above Poverty | Below Poverty |
| No Children | 207 (90.0%) | 23 (10.0%) |
| 1 or 2 Children | 130 (92.2%) | 11 (7.8%) |
| 3 or 4 Children | 12 (60.0%) | 8 (40.0%) |
| 5 or more Children | 15 (100.0%) | 0 (0.0%) |
| Total | 364 (89.7%) | 42 (10.3%) |
Income Below Poverty Among Single-Parent Households in Turley
According to the poverty data in Turley, 21.9% or 21 single-father households and 14.5% or 34 single-mother households are living below the poverty line. Among single-father households, those with 1 or 2 children have the highest poverty rate, with 10 households (32.3%) experiencing poverty. Likewise, among single-mother households, those with 5 or more children have the highest poverty rate, with 6 households (100.0%) falling below the poverty line.
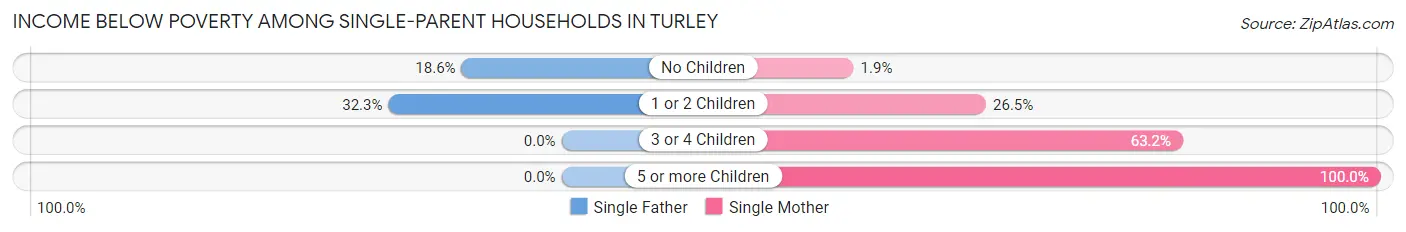
| Children | Single Father | Single Mother |
| No Children | 11 (18.6%) | 3 (1.9%) |
| 1 or 2 Children | 10 (32.3%) | 13 (26.5%) |
| 3 or 4 Children | 0 (0.0%) | 12 (63.2%) |
| 5 or more Children | 0 (0.0%) | 6 (100.0%) |
| Total | 21 (21.9%) | 34 (14.5%) |
Income Below Poverty Among Married-Couple vs Single-Parent Households in Turley
The poverty data for Turley shows that 42 of the married-couple family households (10.3%) and 55 of the single-parent households (16.6%) are living below the poverty level. Within the married-couple family households, those with 3 or 4 children have the highest poverty rate, with 8 households (40.0%) falling below the poverty line. Among the single-parent households, those with 5 or more children have the highest poverty rate, with 6 household (100.0%) living below poverty.
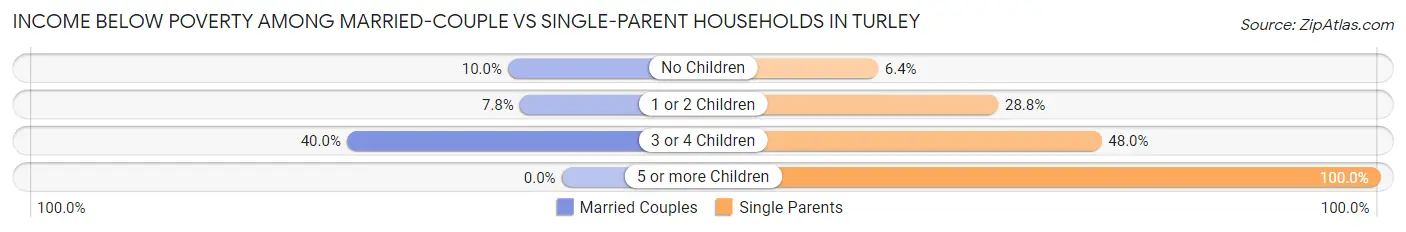
| Children | Married-Couple Families | Single-Parent Households |
| No Children | 23 (10.0%) | 14 (6.4%) |
| 1 or 2 Children | 11 (7.8%) | 23 (28.7%) |
| 3 or 4 Children | 8 (40.0%) | 12 (48.0%) |
| 5 or more Children | 0 (0.0%) | 6 (100.0%) |
| Total | 42 (10.3%) | 55 (16.6%) |
Race in Turley
The most populous races in Turley are White / Caucasian (1,291 | 44.3%), Hispanic or Latino (513 | 17.6%), and Two or more Races (421 | 14.4%).
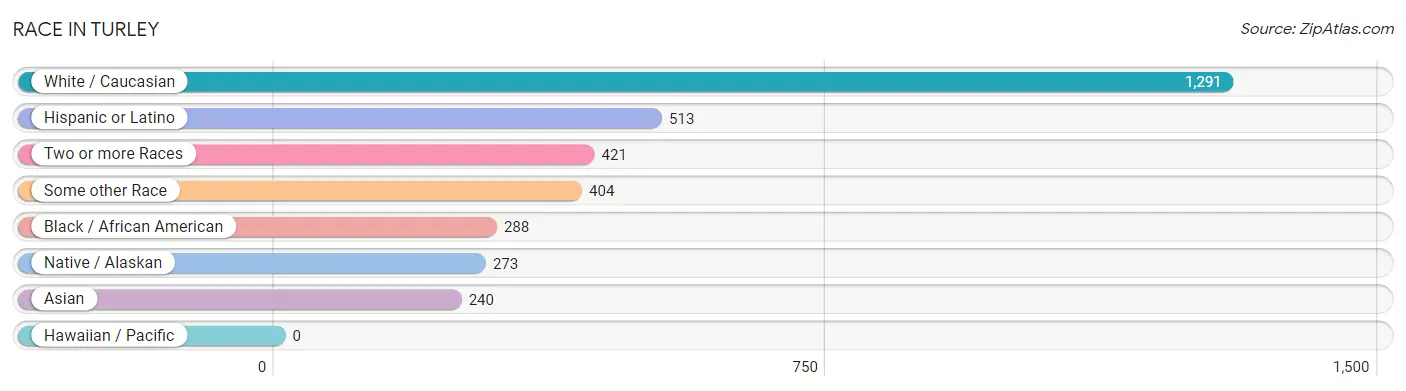
| Race | # Population | % Population |
| Asian | 240 | 8.2% |
| Black / African American | 288 | 9.9% |
| Hawaiian / Pacific | 0 | 0.0% |
| Hispanic or Latino | 513 | 17.6% |
| Native / Alaskan | 273 | 9.4% |
| White / Caucasian | 1,291 | 44.3% |
| Two or more Races | 421 | 14.4% |
| Some other Race | 404 | 13.9% |
| Total | 2,917 | 100.0% |
Ancestry in Turley
The most populous ancestries reported in Turley are Mexican (409 | 14.0%), Cherokee (263 | 9.0%), German (242 | 8.3%), Bangladeshi (232 | 8.0%), and Irish (229 | 7.9%), together accounting for 47.1% of all Turley residents.
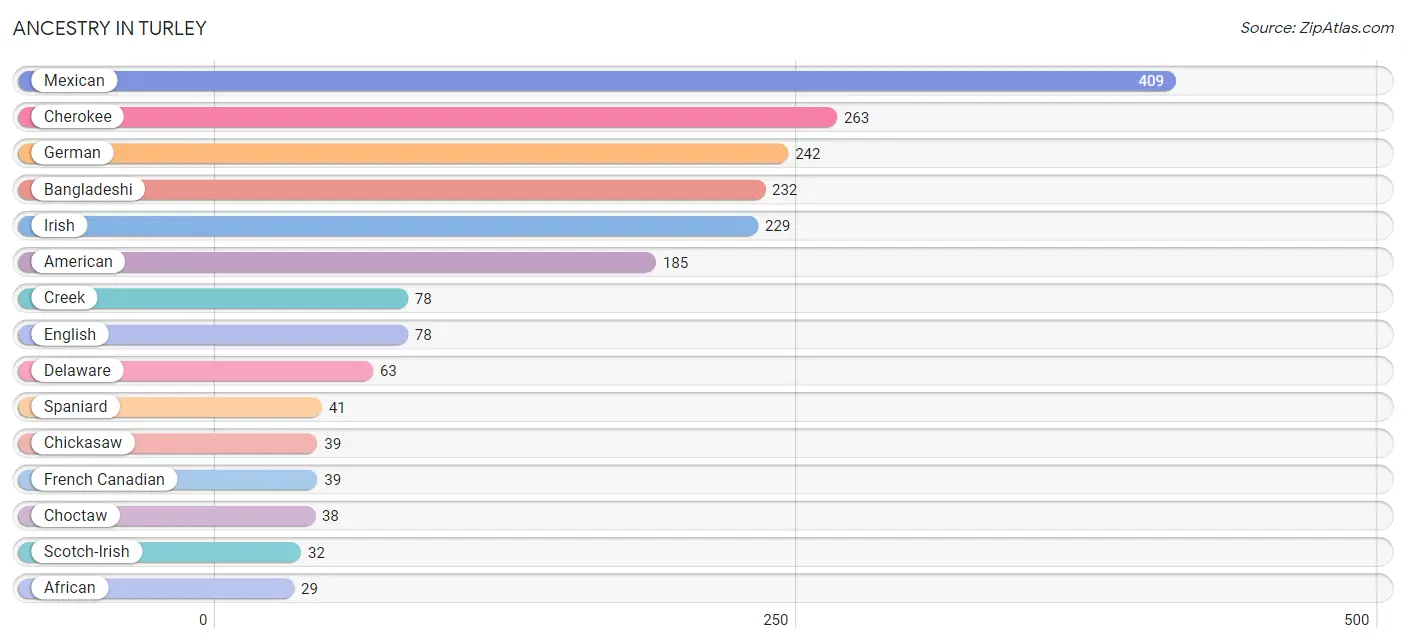
| Ancestry | # Population | % Population |
| African | 29 | 1.0% |
| American | 185 | 6.3% |
| Apache | 22 | 0.7% |
| Arab | 11 | 0.4% |
| Austrian | 9 | 0.3% |
| Bangladeshi | 232 | 8.0% |
| Bhutanese | 10 | 0.3% |
| Canadian | 4 | 0.1% |
| Central American | 25 | 0.9% |
| Cherokee | 263 | 9.0% |
| Chickasaw | 39 | 1.3% |
| Choctaw | 38 | 1.3% |
| Cree | 9 | 0.3% |
| Creek | 78 | 2.7% |
| Delaware | 63 | 2.2% |
| Dutch | 24 | 0.8% |
| Dutch West Indian | 23 | 0.8% |
| English | 78 | 2.7% |
| European | 6 | 0.2% |
| French | 19 | 0.6% |
| French Canadian | 39 | 1.3% |
| German | 242 | 8.3% |
| Haitian | 9 | 0.3% |
| Hungarian | 6 | 0.2% |
| Irish | 229 | 7.9% |
| Italian | 6 | 0.2% |
| Kiowa | 6 | 0.2% |
| Korean | 8 | 0.3% |
| Lebanese | 11 | 0.4% |
| Mexican | 409 | 14.0% |
| Navajo | 4 | 0.1% |
| Norwegian | 3 | 0.1% |
| Osage | 18 | 0.6% |
| Pakistani | 5 | 0.2% |
| Pennsylvania German | 12 | 0.4% |
| Polish | 8 | 0.3% |
| Portuguese | 20 | 0.7% |
| Puerto Rican | 23 | 0.8% |
| Salvadoran | 25 | 0.9% |
| Scotch-Irish | 32 | 1.1% |
| Scottish | 22 | 0.7% |
| Seminole | 1 | 0.0% |
| Spaniard | 41 | 1.4% |
| Subsaharan African | 29 | 1.0% |
| Turkish | 11 | 0.4% |
| Welsh | 10 | 0.3% | View All 46 Rows |
Immigrants in Turley
The most numerous immigrant groups reported in Turley came from Central America (149 | 5.1%), Latin America (149 | 5.1%), Mexico (149 | 5.1%), Asia (87 | 3.0%), and South Eastern Asia (80 | 2.7%), together accounting for 21.0% of all Turley residents.
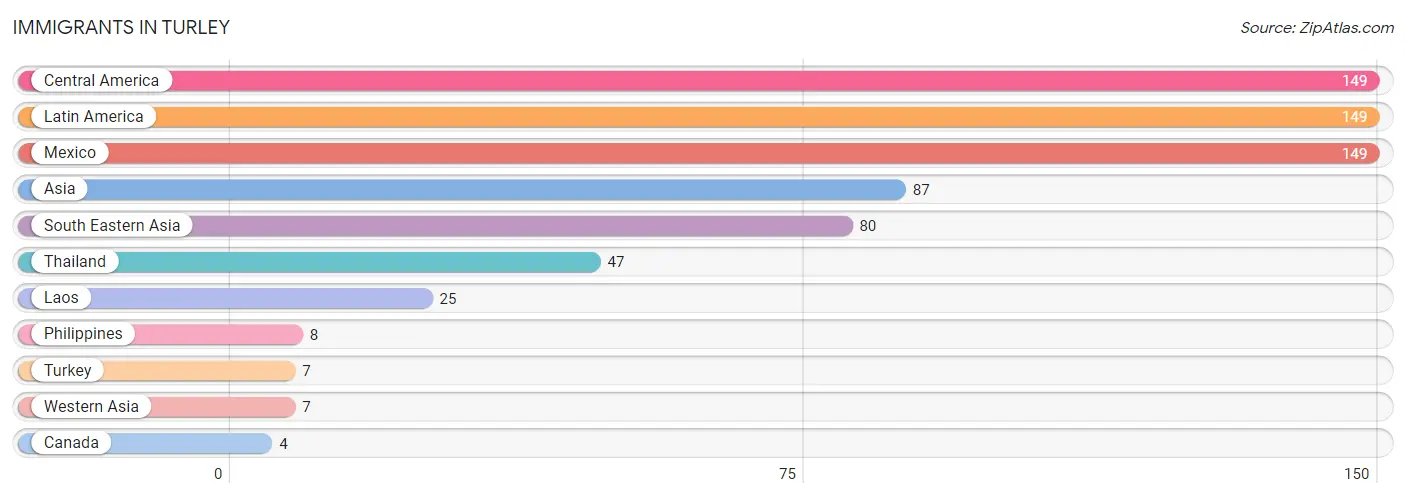
| Immigration Origin | # Population | % Population |
| Asia | 87 | 3.0% |
| Canada | 4 | 0.1% |
| Central America | 149 | 5.1% |
| Laos | 25 | 0.9% |
| Latin America | 149 | 5.1% |
| Mexico | 149 | 5.1% |
| Philippines | 8 | 0.3% |
| South Eastern Asia | 80 | 2.7% |
| Thailand | 47 | 1.6% |
| Turkey | 7 | 0.2% |
| Western Asia | 7 | 0.2% | View All 11 Rows |
Sex and Age in Turley
Sex and Age in Turley
The most populous age groups in Turley are Under 5 Years (150 | 10.5%) for men and 75 to 79 Years (176 | 11.8%) for women.
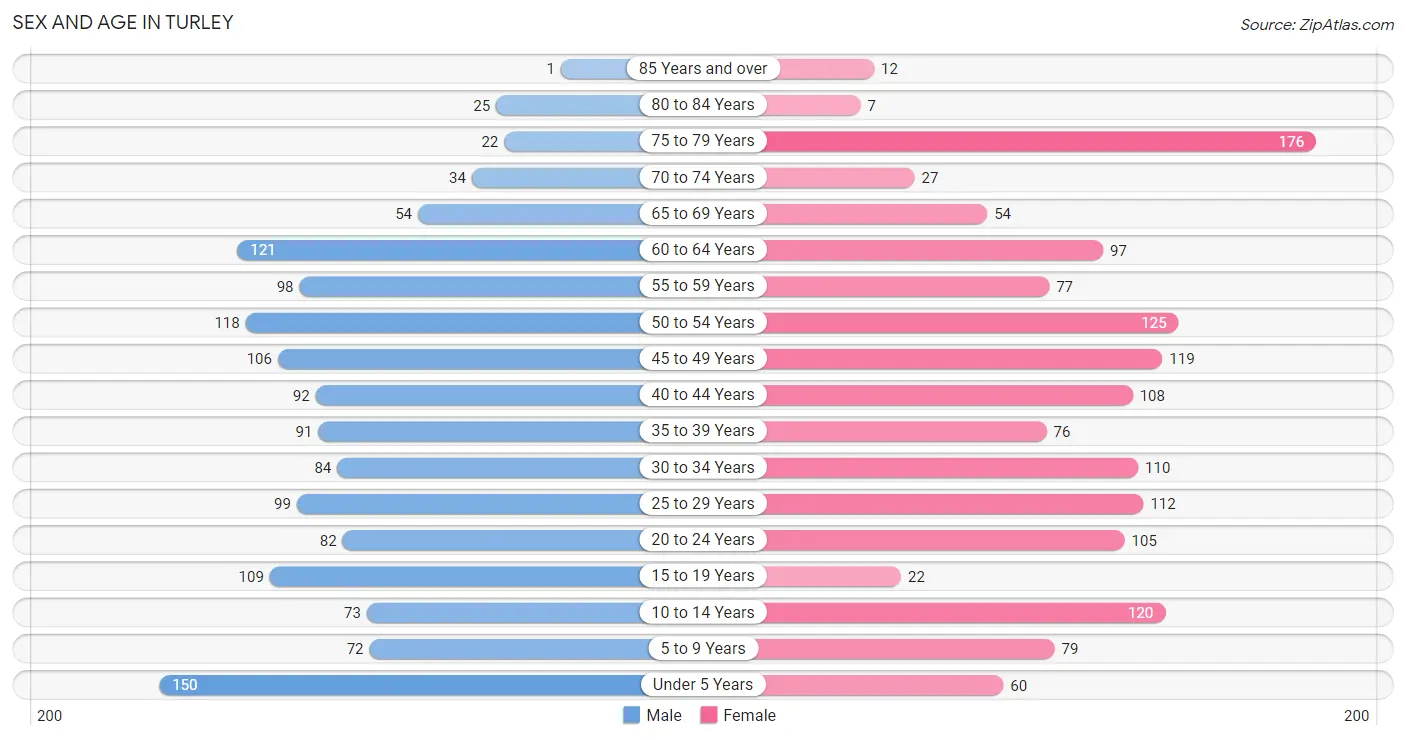
| Age Bracket | Male | Female |
| Under 5 Years | 150 (10.5%) | 60 (4.0%) |
| 5 to 9 Years | 72 (5.0%) | 79 (5.3%) |
| 10 to 14 Years | 73 (5.1%) | 120 (8.1%) |
| 15 to 19 Years | 109 (7.6%) | 22 (1.5%) |
| 20 to 24 Years | 82 (5.7%) | 105 (7.1%) |
| 25 to 29 Years | 99 (6.9%) | 112 (7.5%) |
| 30 to 34 Years | 84 (5.9%) | 110 (7.4%) |
| 35 to 39 Years | 91 (6.4%) | 76 (5.1%) |
| 40 to 44 Years | 92 (6.4%) | 108 (7.3%) |
| 45 to 49 Years | 106 (7.4%) | 119 (8.0%) |
| 50 to 54 Years | 118 (8.3%) | 125 (8.4%) |
| 55 to 59 Years | 98 (6.9%) | 77 (5.2%) |
| 60 to 64 Years | 121 (8.5%) | 97 (6.5%) |
| 65 to 69 Years | 54 (3.8%) | 54 (3.6%) |
| 70 to 74 Years | 34 (2.4%) | 27 (1.8%) |
| 75 to 79 Years | 22 (1.5%) | 176 (11.8%) |
| 80 to 84 Years | 25 (1.8%) | 7 (0.5%) |
| 85 Years and over | 1 (0.1%) | 12 (0.8%) |
| Total | 1,431 (100.0%) | 1,486 (100.0%) |
Families and Households in Turley
Median Family Size in Turley
The median family size in Turley is 3.04 persons per family, with married-couple families (406 | 55.1%) accounting for the largest median family size of 3.46 persons per family. On the other hand, single female/mother families (235 | 31.9%) represent the smallest median family size with 2.33 persons per family.
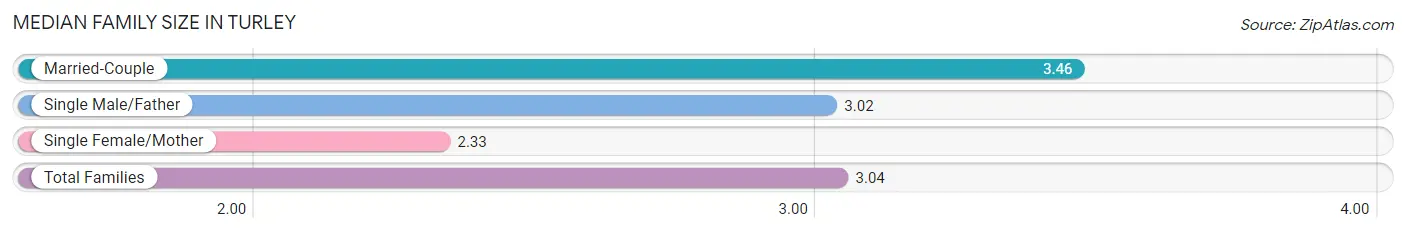
| Family Type | # Families | Family Size |
| Married-Couple | 406 (55.1%) | 3.46 |
| Single Male/Father | 96 (13.0%) | 3.02 |
| Single Female/Mother | 235 (31.9%) | 2.33 |
| Total Families | 737 (100.0%) | 3.04 |
Median Household Size in Turley
The median household size in Turley is 2.63 persons per household, with married-couple households (406 | 38.5%) accounting for the largest median household size of 3.49 persons per household. non-family households (317 | 30.1%) represent the smallest median household size with 1.42 persons per household.
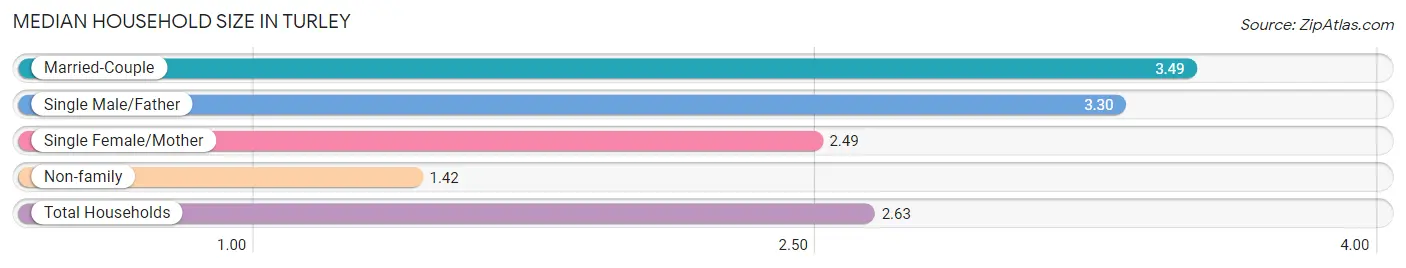
| Household Type | # Households | Household Size |
| Married-Couple | 406 (38.5%) | 3.49 |
| Single Male/Father | 96 (9.1%) | 3.30 |
| Single Female/Mother | 235 (22.3%) | 2.49 |
| Non-family | 317 (30.1%) | 1.42 |
| Total Households | 1,054 (100.0%) | 2.63 |
Household Size by Marriage Status in Turley
Out of a total of 1,054 households in Turley, 737 (69.9%) are family households, while 317 (30.1%) are nonfamily households. The most numerous type of family households are 2-person households, comprising 356, and the most common type of nonfamily households are 1-person households, comprising 233.
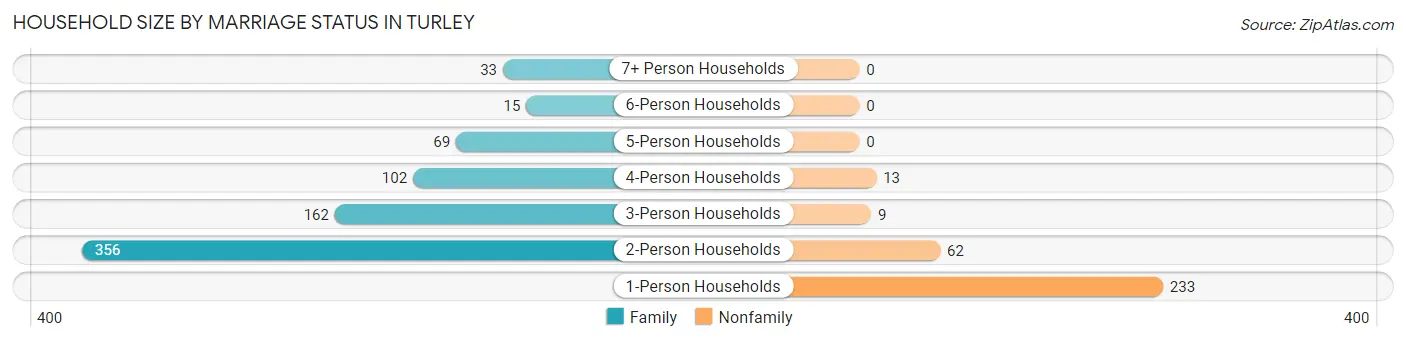
| Household Size | Family Households | Nonfamily Households |
| 1-Person Households | - | 233 (22.1%) |
| 2-Person Households | 356 (33.8%) | 62 (5.9%) |
| 3-Person Households | 162 (15.4%) | 9 (0.9%) |
| 4-Person Households | 102 (9.7%) | 13 (1.2%) |
| 5-Person Households | 69 (6.6%) | 0 (0.0%) |
| 6-Person Households | 15 (1.4%) | 0 (0.0%) |
| 7+ Person Households | 33 (3.1%) | 0 (0.0%) |
| Total | 737 (69.9%) | 317 (30.1%) |
Female Fertility in Turley
Fertility by Age in Turley
Average fertility rate in Turley is 58.0 births per 1,000 women. Women in the age bracket of 20 to 34 years have the highest fertility rate with 104.0 births per 1,000 women. Women in the age bracket of 20 to 34 years acount for 87.2% of all women with births.
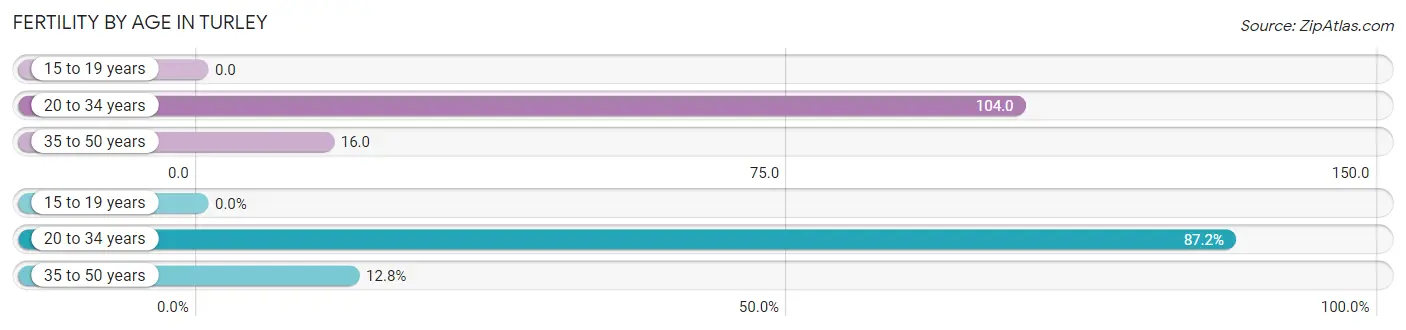
| Age Bracket | Women with Births | Births / 1,000 Women |
| 15 to 19 years | 0 (0.0%) | 0.0 |
| 20 to 34 years | 34 (87.2%) | 104.0 |
| 35 to 50 years | 5 (12.8%) | 16.0 |
| Total | 39 (100.0%) | 58.0 |
Fertility by Age by Marriage Status in Turley
41.0% of women with births (39) in Turley are married. The highest percentage of unmarried women with births falls into 35 to 50 years age bracket with 100.0% of them unmarried at the time of birth, while the lowest percentage of unmarried women with births belong to 20 to 34 years age bracket with 52.9% of them unmarried.
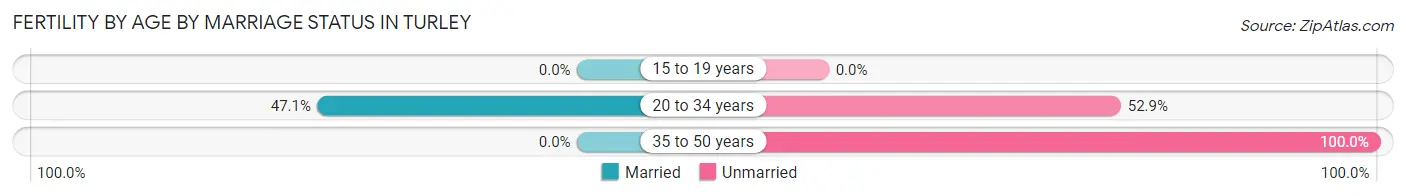
| Age Bracket | Married | Unmarried |
| 15 to 19 years | 0 (0.0%) | 0 (0.0%) |
| 20 to 34 years | 16 (47.1%) | 18 (52.9%) |
| 35 to 50 years | 0 (0.0%) | 5 (100.0%) |
| Total | 16 (41.0%) | 23 (59.0%) |
Fertility by Education in Turley
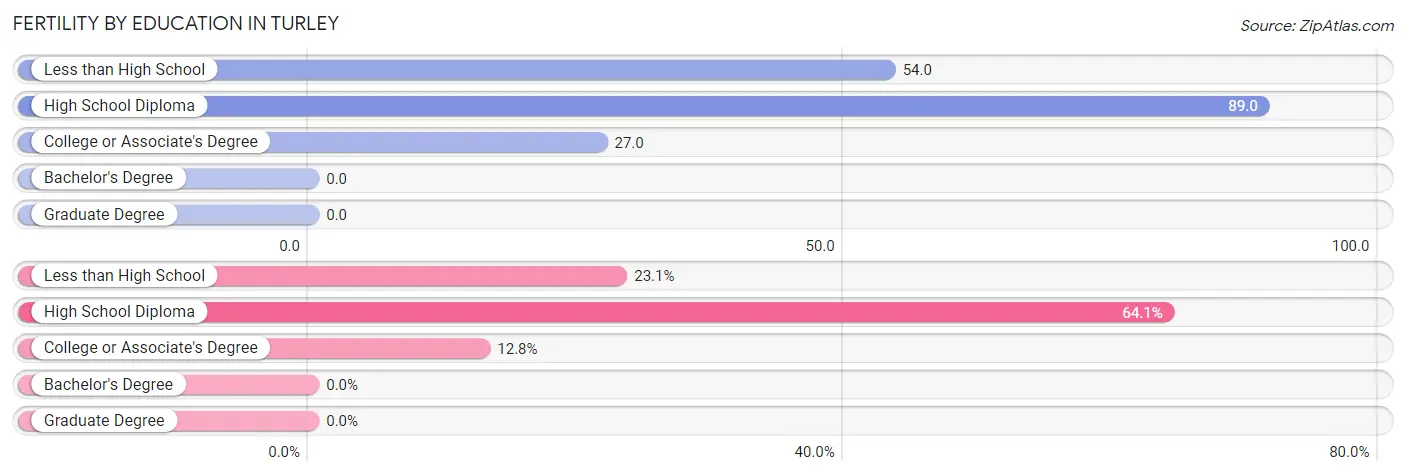
| Educational Attainment | Women with Births | Births / 1,000 Women |
| Less than High School | 9 (23.1%) | 54.0 |
| High School Diploma | 25 (64.1%) | 89.0 |
| College or Associate's Degree | 5 (12.8%) | 27.0 |
| Bachelor's Degree | 0 (0.0%) | 0.0 |
| Graduate Degree | 0 (0.0%) | 0.0 |
| Total | 39 (100.0%) | 58.0 |
Fertility by Education by Marriage Status in Turley
59.0% of women with births in Turley are unmarried. Women with the educational attainment of less than high school are most likely to be married with 100.0% of them married at childbirth, while women with the educational attainment of college or associate's degree are least likely to be married with 100.0% of them unmarried at childbirth.
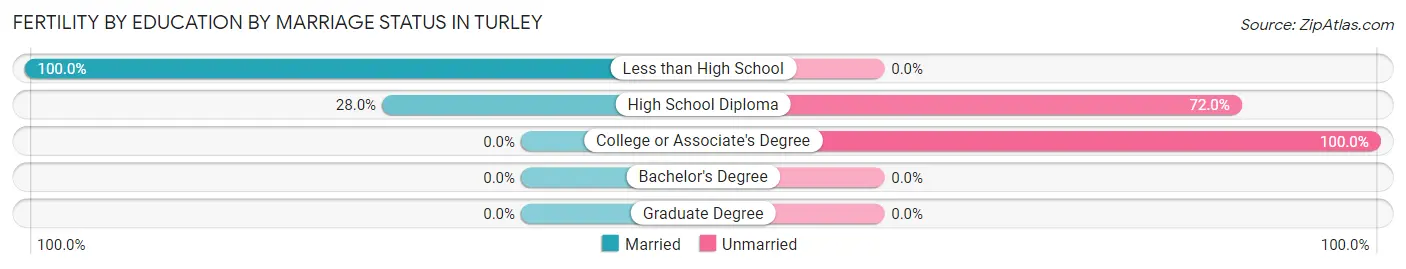
| Educational Attainment | Married | Unmarried |
| Less than High School | 9 (100.0%) | 0 (0.0%) |
| High School Diploma | 7 (28.0%) | 18 (72.0%) |
| College or Associate's Degree | 0 (0.0%) | 5 (100.0%) |
| Bachelor's Degree | 0 (0.0%) | 0 (0.0%) |
| Graduate Degree | 0 (0.0%) | 0 (0.0%) |
| Total | 16 (41.0%) | 23 (59.0%) |
Employment Characteristics in Turley
Employment by Class of Employer in Turley
Among the 1,108 employed individuals in Turley, private company employees (741 | 66.9%), self-employed (not incorporated) (221 | 20.0%), and state government employees (48 | 4.3%) make up the most common classes of employment.
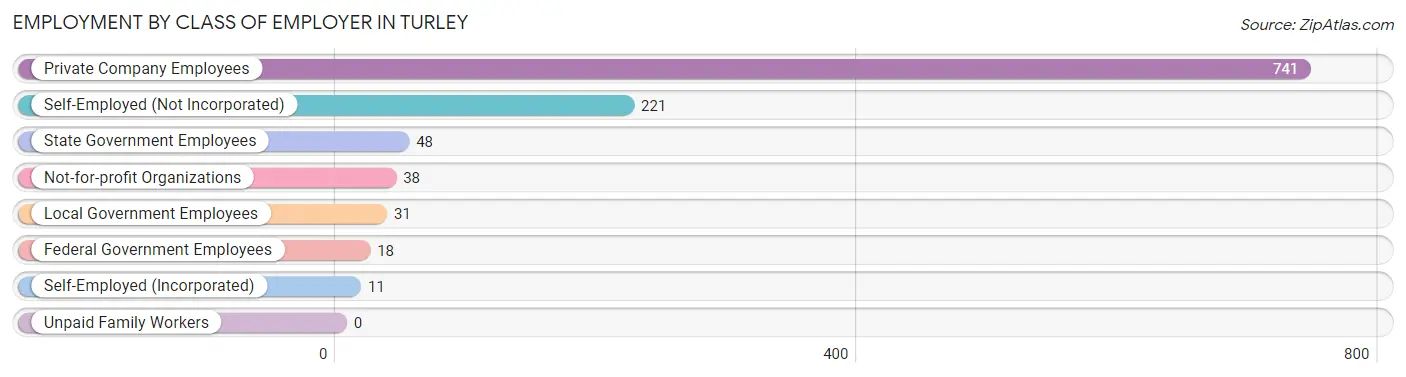
| Employer Class | # Employees | % Employees |
| Private Company Employees | 741 | 66.9% |
| Self-Employed (Incorporated) | 11 | 1.0% |
| Self-Employed (Not Incorporated) | 221 | 20.0% |
| Not-for-profit Organizations | 38 | 3.4% |
| Local Government Employees | 31 | 2.8% |
| State Government Employees | 48 | 4.3% |
| Federal Government Employees | 18 | 1.6% |
| Unpaid Family Workers | 0 | 0.0% |
| Total | 1,108 | 100.0% |
Employment Status by Age in Turley
According to the labor force statistics for Turley, out of the total population over 16 years of age (2,348), 55.6% or 1,305 individuals are in the labor force, with 11.1% or 145 of them unemployed. The age group with the highest labor force participation rate is 55 to 59 years, with 62.9% or 110 individuals in the labor force. Within the labor force, the 16 to 19 years age range has the highest percentage of unemployed individuals, with 24.5% or 13 of them being unemployed.
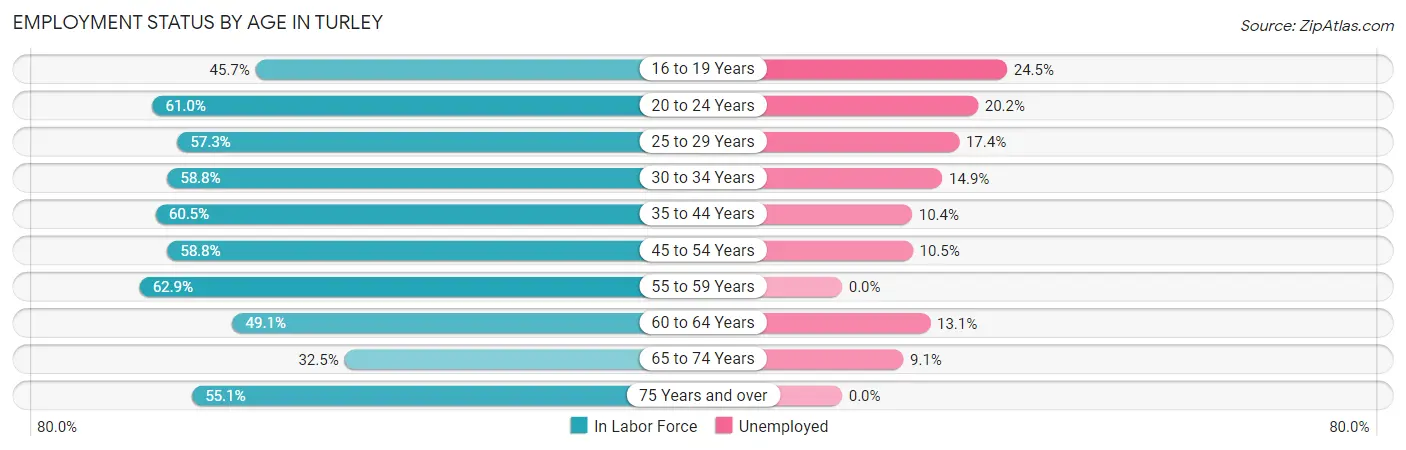
| Age Bracket | In Labor Force | Unemployed |
| 16 to 19 Years | 53 (45.7%) | 13 (24.5%) |
| 20 to 24 Years | 114 (61.0%) | 23 (20.2%) |
| 25 to 29 Years | 121 (57.3%) | 21 (17.4%) |
| 30 to 34 Years | 114 (58.8%) | 17 (14.9%) |
| 35 to 44 Years | 222 (60.5%) | 23 (10.4%) |
| 45 to 54 Years | 275 (58.8%) | 29 (10.5%) |
| 55 to 59 Years | 110 (62.9%) | 0 (0.0%) |
| 60 to 64 Years | 107 (49.1%) | 14 (13.1%) |
| 65 to 74 Years | 55 (32.5%) | 5 (9.1%) |
| 75 Years and over | 134 (55.1%) | 0 (0.0%) |
| Total | 1,305 (55.6%) | 145 (11.1%) |
Employment Status by Educational Attainment in Turley
According to labor force statistics for Turley, 58.1% of individuals (949) out of the total population between 25 and 64 years of age (1,633) are in the labor force, with 11.0% or 104 of them being unemployed. The group with the highest labor force participation rate are those with the educational attainment of bachelor's degree or higher, with 89.6% or 86 individuals in the labor force. Within the labor force, individuals with bachelor's degree or higher education have the highest percentage of unemployment, with 24.4% or 21 of them being unemployed.
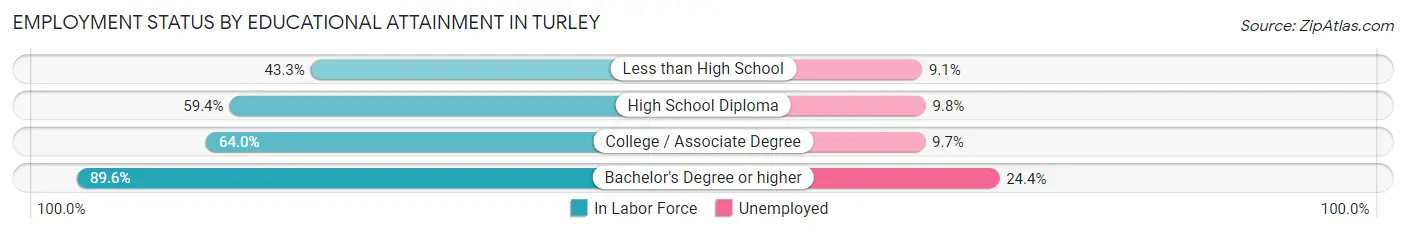
| Educational Attainment | In Labor Force | Unemployed |
| Less than High School | 186 (43.3%) | 39 (9.1%) |
| High School Diploma | 409 (59.4%) | 67 (9.8%) |
| College / Associate Degree | 268 (64.0%) | 41 (9.7%) |
| Bachelor's Degree or higher | 86 (89.6%) | 23 (24.4%) |
| Total | 949 (58.1%) | 180 (11.0%) |
Employment Occupations by Sex in Turley
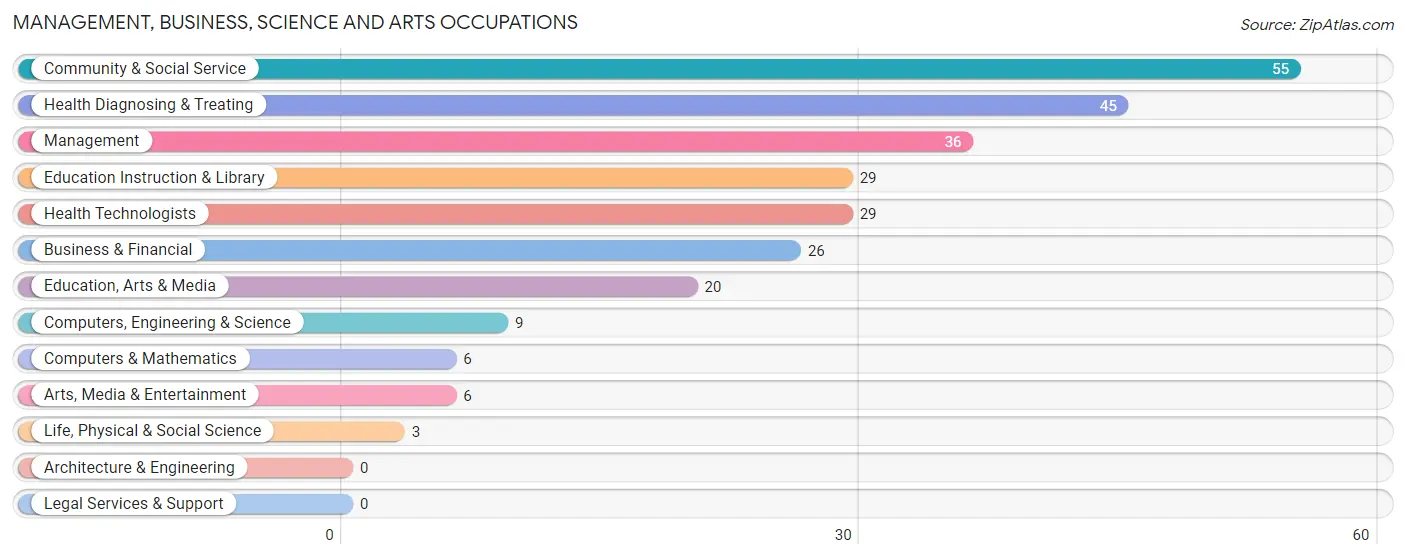
Management, Business, Science and Arts Occupations
The most common Management, Business, Science and Arts occupations in Turley are Community & Social Service (55 | 4.7%), Health Diagnosing & Treating (45 | 3.9%), Management (36 | 3.1%), Education Instruction & Library (29 | 2.5%), and Health Technologists (29 | 2.5%).
Management, Business, Science and Arts Occupations by Sex
Within the Management, Business, Science and Arts occupations in Turley, the most male-oriented occupations are Computers, Engineering & Science (100.0%), Computers & Mathematics (100.0%), and Life, Physical & Social Science (100.0%), while the most female-oriented occupations are Arts, Media & Entertainment (100.0%), Health Diagnosing & Treating (100.0%), and Health Technologists (100.0%).
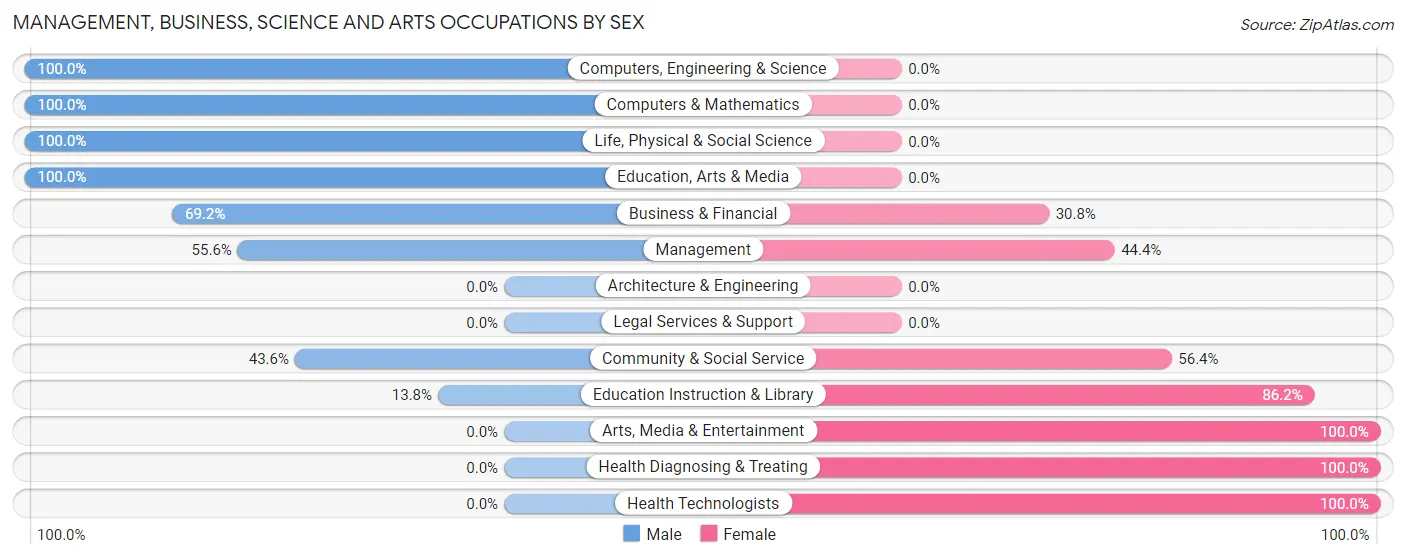
| Occupation | Male | Female |
| Management | 20 (55.6%) | 16 (44.4%) |
| Business & Financial | 18 (69.2%) | 8 (30.8%) |
| Computers, Engineering & Science | 9 (100.0%) | 0 (0.0%) |
| Computers & Mathematics | 6 (100.0%) | 0 (0.0%) |
| Architecture & Engineering | 0 (0.0%) | 0 (0.0%) |
| Life, Physical & Social Science | 3 (100.0%) | 0 (0.0%) |
| Community & Social Service | 24 (43.6%) | 31 (56.4%) |
| Education, Arts & Media | 20 (100.0%) | 0 (0.0%) |
| Legal Services & Support | 0 (0.0%) | 0 (0.0%) |
| Education Instruction & Library | 4 (13.8%) | 25 (86.2%) |
| Arts, Media & Entertainment | 0 (0.0%) | 6 (100.0%) |
| Health Diagnosing & Treating | 0 (0.0%) | 45 (100.0%) |
| Health Technologists | 0 (0.0%) | 29 (100.0%) |
| Total (Category) | 71 (41.5%) | 100 (58.5%) |
| Total (Overall) | 643 (55.4%) | 517 (44.6%) |
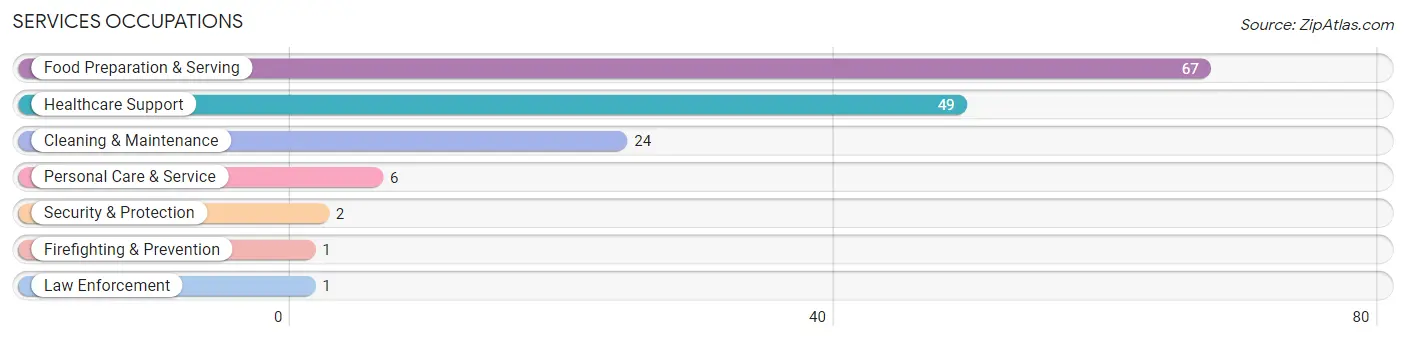
Services Occupations
The most common Services occupations in Turley are Food Preparation & Serving (67 | 5.8%), Healthcare Support (49 | 4.2%), Cleaning & Maintenance (24 | 2.1%), Personal Care & Service (6 | 0.5%), and Security & Protection (2 | 0.2%).
Services Occupations by Sex
Within the Services occupations in Turley, the most male-oriented occupations are Security & Protection (100.0%), Firefighting & Prevention (100.0%), and Law Enforcement (100.0%), while the most female-oriented occupations are Healthcare Support (100.0%), Personal Care & Service (100.0%), and Food Preparation & Serving (65.7%).
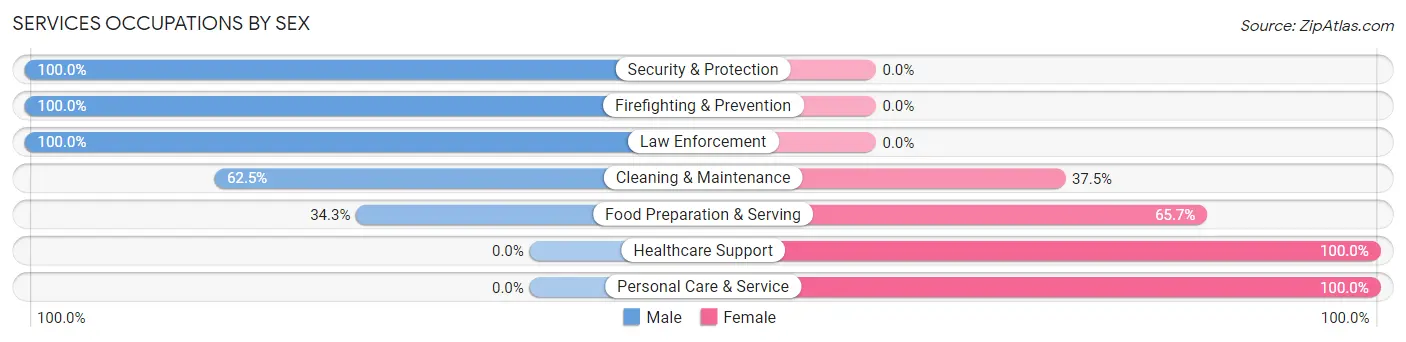
| Occupation | Male | Female |
| Healthcare Support | 0 (0.0%) | 49 (100.0%) |
| Security & Protection | 2 (100.0%) | 0 (0.0%) |
| Firefighting & Prevention | 1 (100.0%) | 0 (0.0%) |
| Law Enforcement | 1 (100.0%) | 0 (0.0%) |
| Food Preparation & Serving | 23 (34.3%) | 44 (65.7%) |
| Cleaning & Maintenance | 15 (62.5%) | 9 (37.5%) |
| Personal Care & Service | 0 (0.0%) | 6 (100.0%) |
| Total (Category) | 40 (27.0%) | 108 (73.0%) |
| Total (Overall) | 643 (55.4%) | 517 (44.6%) |
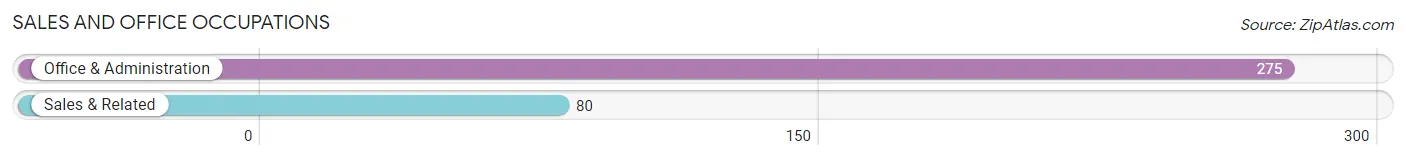
Sales and Office Occupations
The most common Sales and Office occupations in Turley are Office & Administration (275 | 23.7%), and Sales & Related (80 | 6.9%).
Sales and Office Occupations by Sex
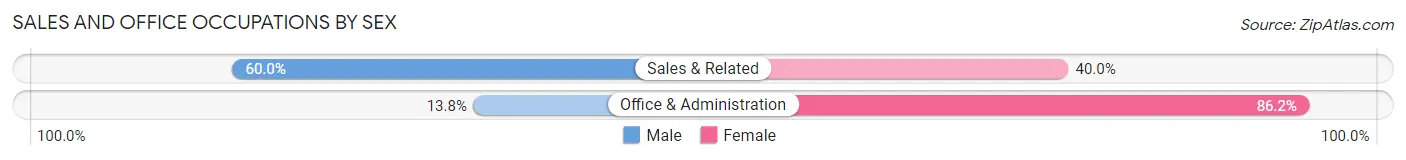
| Occupation | Male | Female |
| Sales & Related | 48 (60.0%) | 32 (40.0%) |
| Office & Administration | 38 (13.8%) | 237 (86.2%) |
| Total (Category) | 86 (24.2%) | 269 (75.8%) |
| Total (Overall) | 643 (55.4%) | 517 (44.6%) |
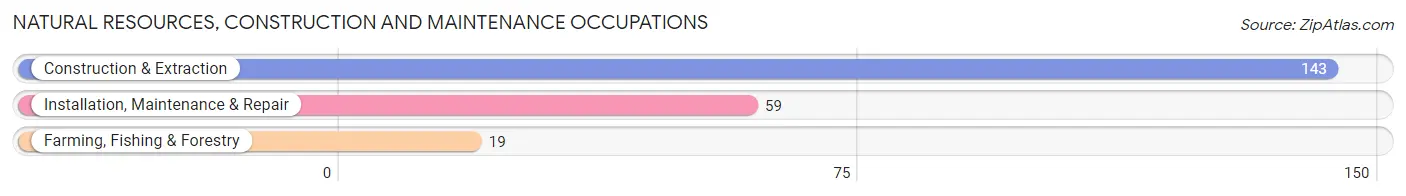
Natural Resources, Construction and Maintenance Occupations
The most common Natural Resources, Construction and Maintenance occupations in Turley are Construction & Extraction (143 | 12.3%), Installation, Maintenance & Repair (59 | 5.1%), and Farming, Fishing & Forestry (19 | 1.6%).
Natural Resources, Construction and Maintenance Occupations by Sex
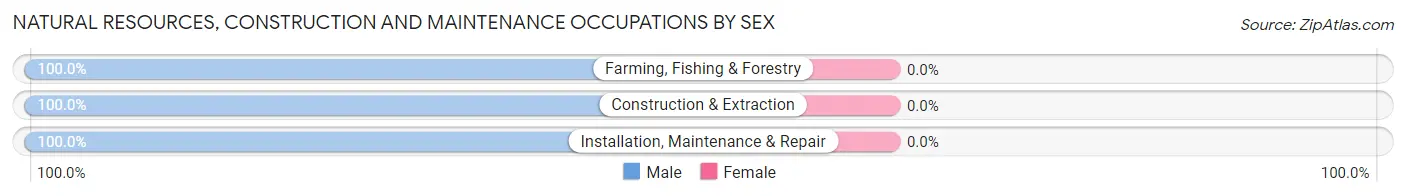
| Occupation | Male | Female |
| Farming, Fishing & Forestry | 19 (100.0%) | 0 (0.0%) |
| Construction & Extraction | 143 (100.0%) | 0 (0.0%) |
| Installation, Maintenance & Repair | 59 (100.0%) | 0 (0.0%) |
| Total (Category) | 221 (100.0%) | 0 (0.0%) |
| Total (Overall) | 643 (55.4%) | 517 (44.6%) |
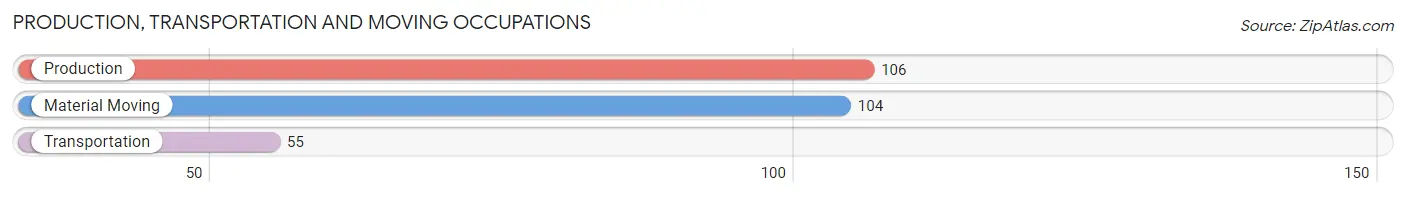
Production, Transportation and Moving Occupations
The most common Production, Transportation and Moving occupations in Turley are Production (106 | 9.1%), Material Moving (104 | 9.0%), and Transportation (55 | 4.7%).
Production, Transportation and Moving Occupations by Sex
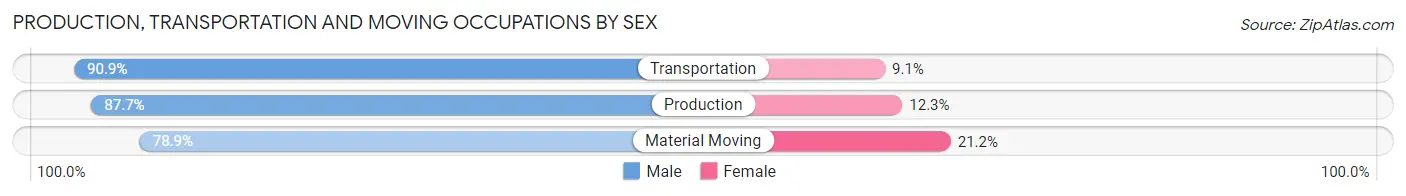
| Occupation | Male | Female |
| Production | 93 (87.7%) | 13 (12.3%) |
| Transportation | 50 (90.9%) | 5 (9.1%) |
| Material Moving | 82 (78.8%) | 22 (21.1%) |
| Total (Category) | 225 (84.9%) | 40 (15.1%) |
| Total (Overall) | 643 (55.4%) | 517 (44.6%) |
Employment Industries by Sex in Turley
Employment Industries in Turley
The major employment industries in Turley include Manufacturing (154 | 13.3%), Health Care & Social Assistance (153 | 13.2%), Construction (142 | 12.2%), Professional & Scientific (138 | 11.9%), and Retail Trade (133 | 11.5%).
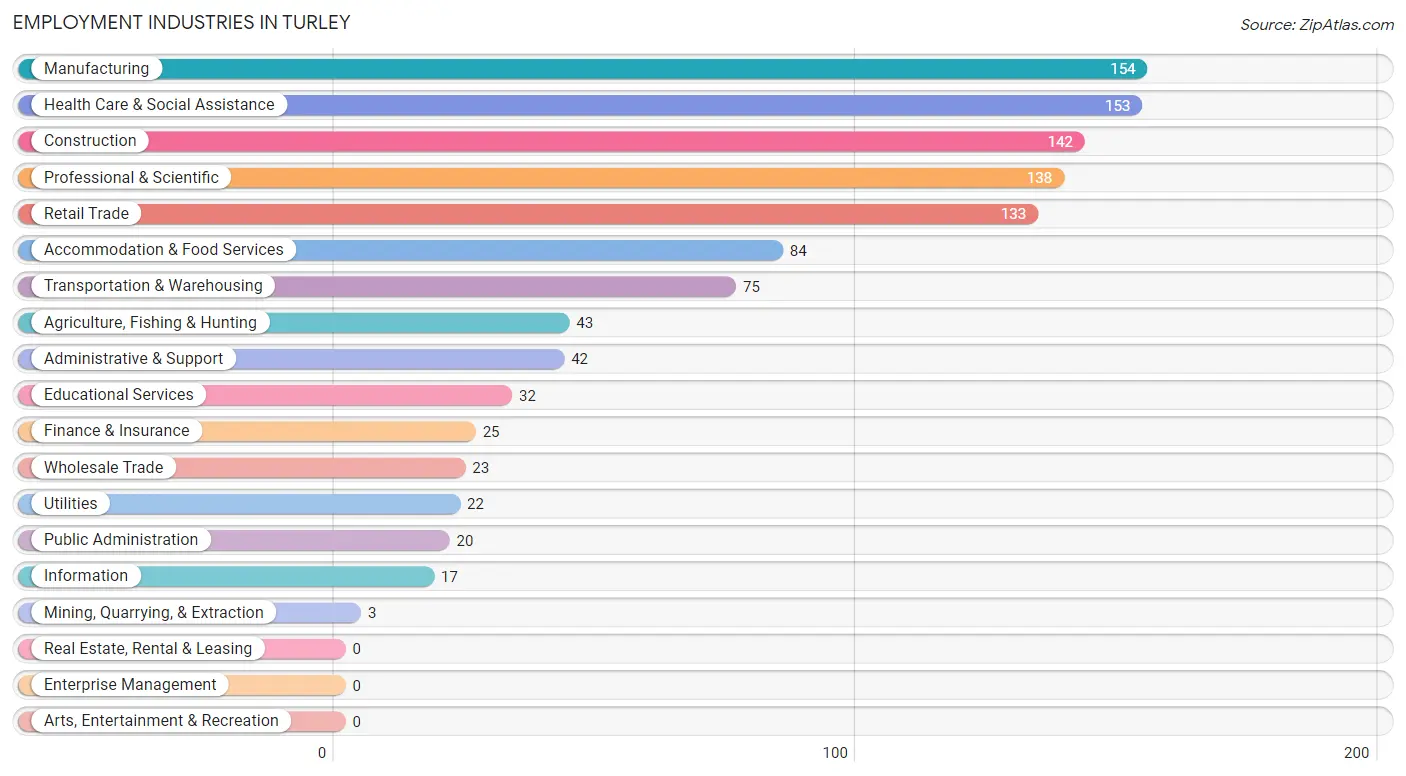
Employment Industries by Sex in Turley
The Turley industries that see more men than women are Mining, Quarrying, & Extraction (100.0%), Public Administration (100.0%), and Construction (96.5%), whereas the industries that tend to have a higher number of women are Health Care & Social Assistance (100.0%), Professional & Scientific (97.1%), and Finance & Insurance (80.0%).
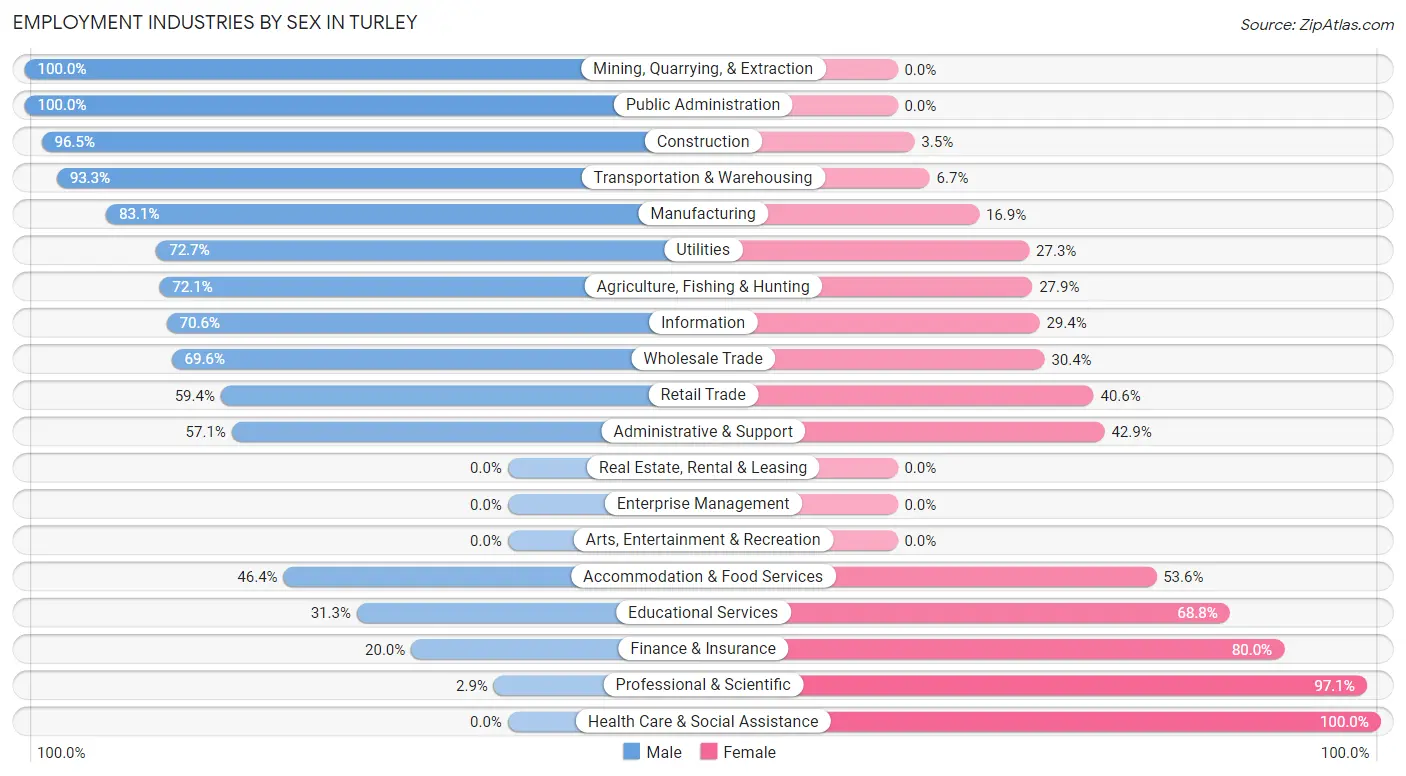
| Industry | Male | Female |
| Agriculture, Fishing & Hunting | 31 (72.1%) | 12 (27.9%) |
| Mining, Quarrying, & Extraction | 3 (100.0%) | 0 (0.0%) |
| Construction | 137 (96.5%) | 5 (3.5%) |
| Manufacturing | 128 (83.1%) | 26 (16.9%) |
| Wholesale Trade | 16 (69.6%) | 7 (30.4%) |
| Retail Trade | 79 (59.4%) | 54 (40.6%) |
| Transportation & Warehousing | 70 (93.3%) | 5 (6.7%) |
| Utilities | 16 (72.7%) | 6 (27.3%) |
| Information | 12 (70.6%) | 5 (29.4%) |
| Finance & Insurance | 5 (20.0%) | 20 (80.0%) |
| Real Estate, Rental & Leasing | 0 (0.0%) | 0 (0.0%) |
| Professional & Scientific | 4 (2.9%) | 134 (97.1%) |
| Enterprise Management | 0 (0.0%) | 0 (0.0%) |
| Administrative & Support | 24 (57.1%) | 18 (42.9%) |
| Educational Services | 10 (31.2%) | 22 (68.8%) |
| Health Care & Social Assistance | 0 (0.0%) | 153 (100.0%) |
| Arts, Entertainment & Recreation | 0 (0.0%) | 0 (0.0%) |
| Accommodation & Food Services | 39 (46.4%) | 45 (53.6%) |
| Public Administration | 20 (100.0%) | 0 (0.0%) |
| Total | 643 (55.4%) | 517 (44.6%) |
Education in Turley
School Enrollment in Turley
The most common levels of schooling among the 549 students in Turley are middle school (156 | 28.4%), elementary school (129 | 23.5%), and high school (103 | 18.8%).
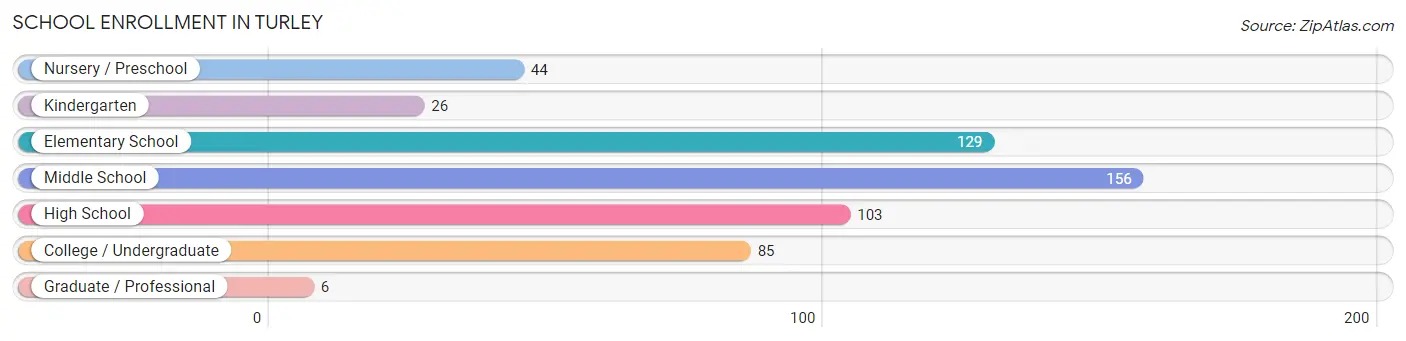
| School Level | # Students | % Students |
| Nursery / Preschool | 44 | 8.0% |
| Kindergarten | 26 | 4.7% |
| Elementary School | 129 | 23.5% |
| Middle School | 156 | 28.4% |
| High School | 103 | 18.8% |
| College / Undergraduate | 85 | 15.5% |
| Graduate / Professional | 6 | 1.1% |
| Total | 549 | 100.0% |
School Enrollment by Age by Funding Source in Turley
Out of a total of 549 students who are enrolled in schools in Turley, 81 (14.8%) attend a private institution, while the remaining 468 (85.2%) are enrolled in public schools. The age group of 25 to 34 year olds has the highest likelihood of being enrolled in private schools, with 9 (45.0% in the age bracket) enrolled. Conversely, the age group of 3 to 4 year olds has the lowest likelihood of being enrolled in a private school, with 44 (100.0% in the age bracket) attending a public institution.
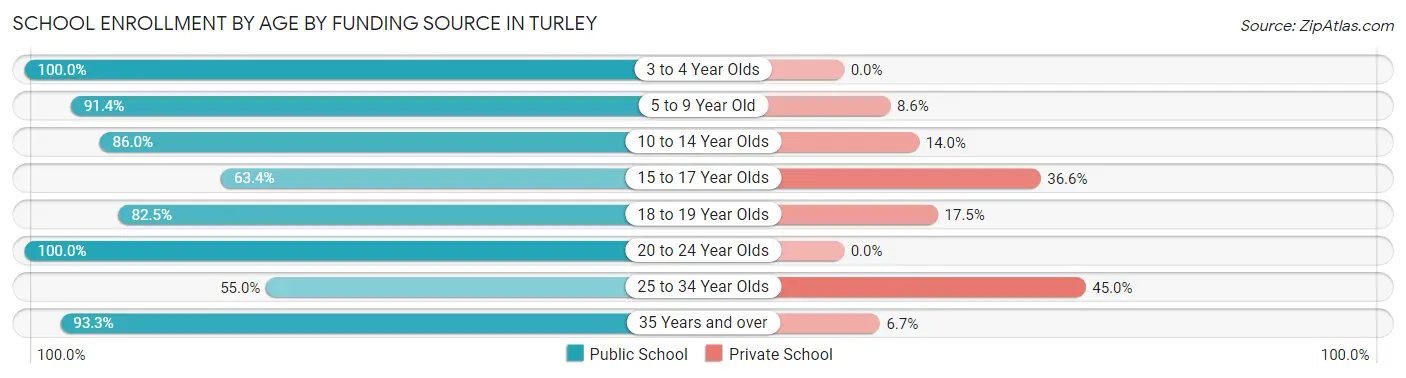
| Age Bracket | Public School | Private School |
| 3 to 4 Year Olds | 44 (100.0%) | 0 (0.0%) |
| 5 to 9 Year Old | 106 (91.4%) | 10 (8.6%) |
| 10 to 14 Year Olds | 166 (86.0%) | 27 (14.0%) |
| 15 to 17 Year Olds | 45 (63.4%) | 26 (36.6%) |
| 18 to 19 Year Olds | 33 (82.5%) | 7 (17.5%) |
| 20 to 24 Year Olds | 35 (100.0%) | 0 (0.0%) |
| 25 to 34 Year Olds | 11 (55.0%) | 9 (45.0%) |
| 35 Years and over | 28 (93.3%) | 2 (6.7%) |
| Total | 468 (85.2%) | 81 (14.8%) |
Educational Attainment by Field of Study in Turley
Business (34 | 31.2%), psychology (20 | 18.3%), education (13 | 11.9%), literature & languages (11 | 10.1%), and science & technology (9 | 8.3%) are the most common fields of study among 109 individuals in Turley who have obtained a bachelor's degree or higher.
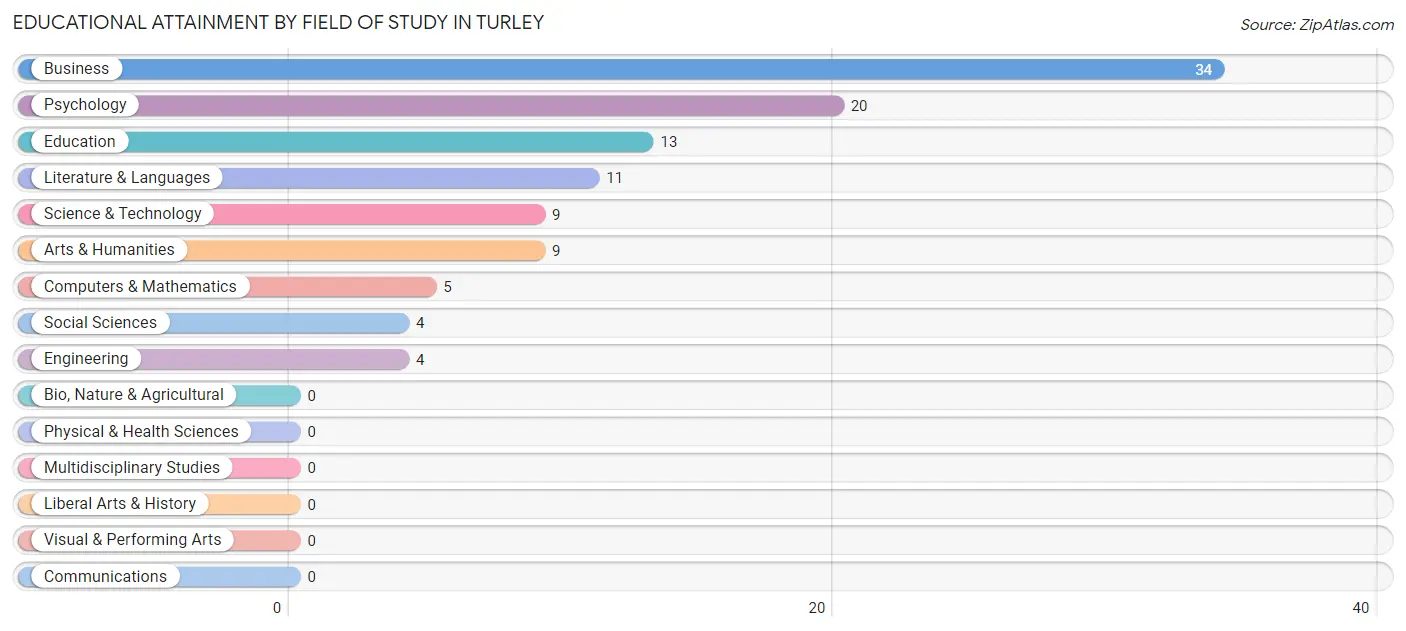
| Field of Study | # Graduates | % Graduates |
| Computers & Mathematics | 5 | 4.6% |
| Bio, Nature & Agricultural | 0 | 0.0% |
| Physical & Health Sciences | 0 | 0.0% |
| Psychology | 20 | 18.3% |
| Social Sciences | 4 | 3.7% |
| Engineering | 4 | 3.7% |
| Multidisciplinary Studies | 0 | 0.0% |
| Science & Technology | 9 | 8.3% |
| Business | 34 | 31.2% |
| Education | 13 | 11.9% |
| Literature & Languages | 11 | 10.1% |
| Liberal Arts & History | 0 | 0.0% |
| Visual & Performing Arts | 0 | 0.0% |
| Communications | 0 | 0.0% |
| Arts & Humanities | 9 | 8.3% |
| Total | 109 | 100.0% |
Transportation & Commute in Turley
Vehicle Availability by Sex in Turley
The most prevalent vehicle ownership categories in Turley are males with 2 vehicles (223, accounting for 36.6%) and females with 2 vehicles (290, making up 44.7%).
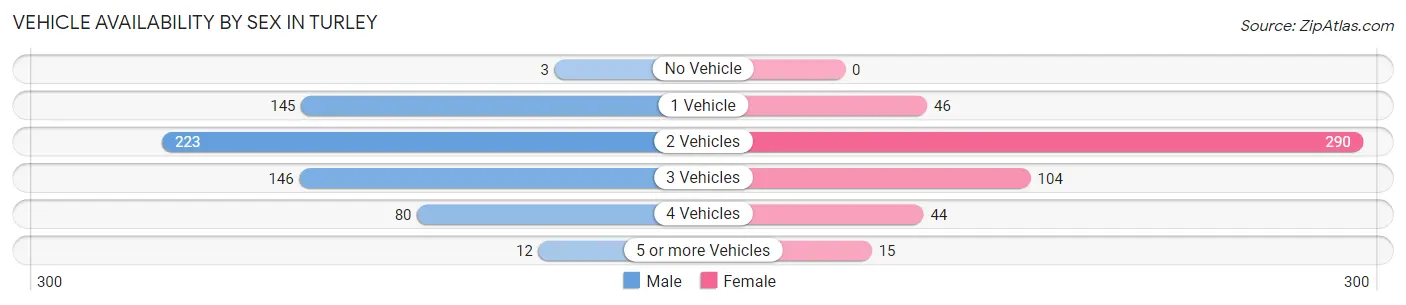
| Vehicles Available | Male | Female |
| No Vehicle | 3 (0.5%) | 0 (0.0%) |
| 1 Vehicle | 145 (23.8%) | 46 (9.2%) |
| 2 Vehicles | 223 (36.6%) | 290 (58.1%) |
| 3 Vehicles | 146 (24.0%) | 104 (20.8%) |
| 4 Vehicles | 80 (13.1%) | 44 (8.8%) |
| 5 or more Vehicles | 12 (2.0%) | 15 (3.0%) |
| Total | 609 (100.0%) | 499 (100.0%) |
Commute Time in Turley
The most frequently occuring commute durations in Turley are 20 to 24 minutes (360 commuters, 33.6%), 15 to 19 minutes (206 commuters, 19.2%), and 30 to 34 minutes (126 commuters, 11.7%).
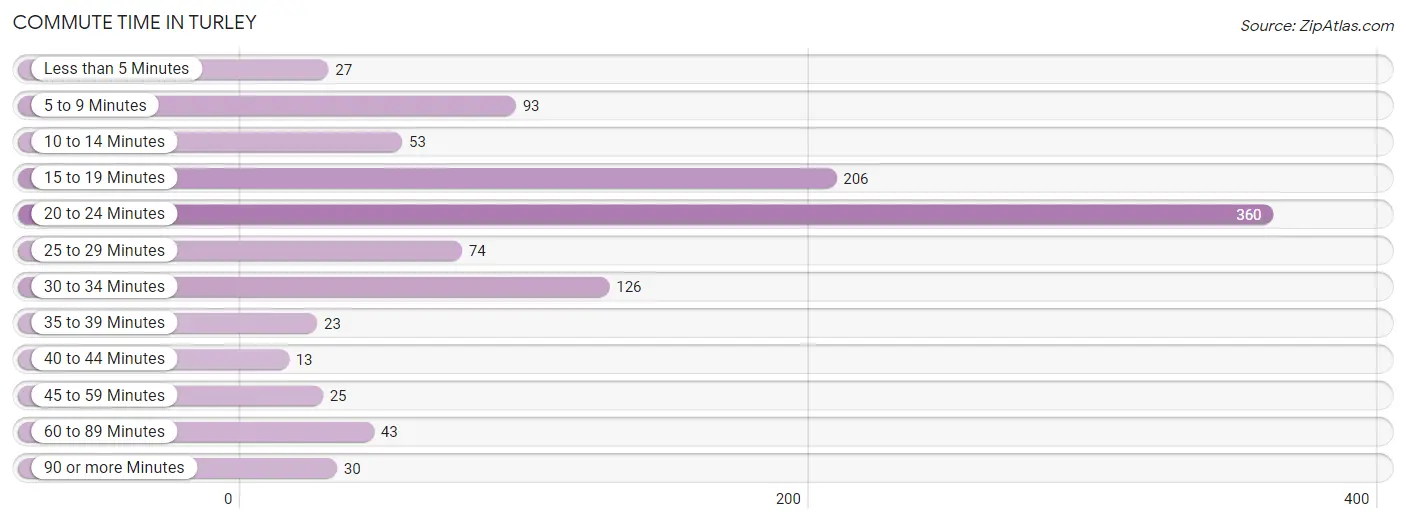
| Commute Time | # Commuters | % Commuters |
| Less than 5 Minutes | 27 | 2.5% |
| 5 to 9 Minutes | 93 | 8.7% |
| 10 to 14 Minutes | 53 | 4.9% |
| 15 to 19 Minutes | 206 | 19.2% |
| 20 to 24 Minutes | 360 | 33.6% |
| 25 to 29 Minutes | 74 | 6.9% |
| 30 to 34 Minutes | 126 | 11.7% |
| 35 to 39 Minutes | 23 | 2.1% |
| 40 to 44 Minutes | 13 | 1.2% |
| 45 to 59 Minutes | 25 | 2.3% |
| 60 to 89 Minutes | 43 | 4.0% |
| 90 or more Minutes | 30 | 2.8% |
Commute Time by Sex in Turley
The most common commute times in Turley are 20 to 24 minutes (149 commuters, 25.5%) for males and 20 to 24 minutes (211 commuters, 43.2%) for females.
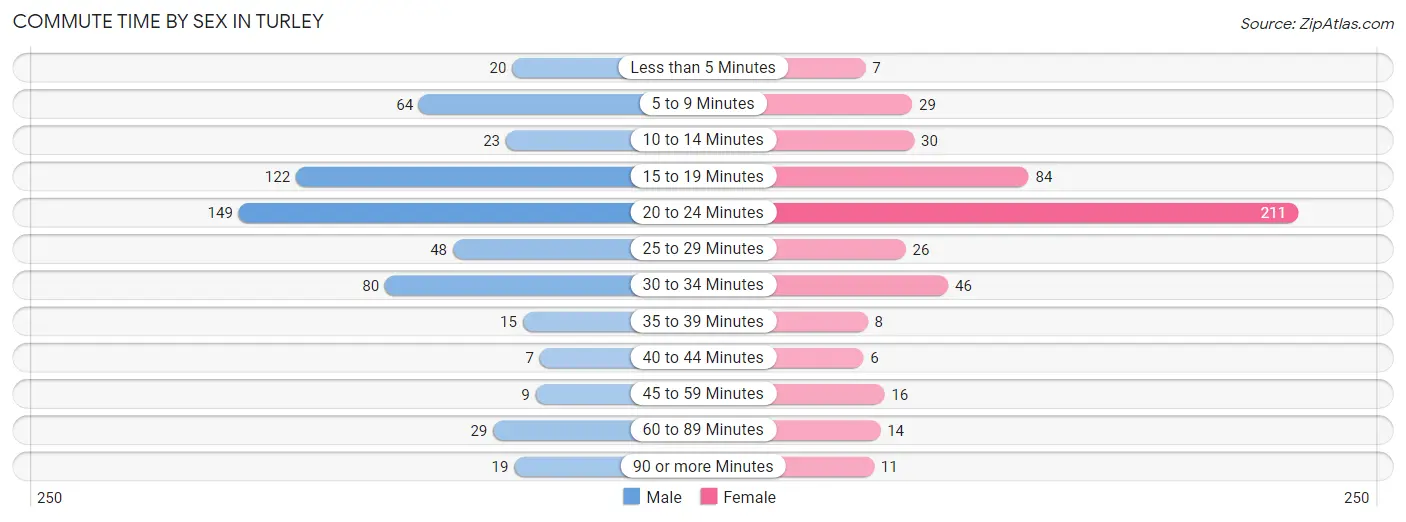
| Commute Time | Male | Female |
| Less than 5 Minutes | 20 (3.4%) | 7 (1.4%) |
| 5 to 9 Minutes | 64 (10.9%) | 29 (5.9%) |
| 10 to 14 Minutes | 23 (3.9%) | 30 (6.1%) |
| 15 to 19 Minutes | 122 (20.8%) | 84 (17.2%) |
| 20 to 24 Minutes | 149 (25.5%) | 211 (43.2%) |
| 25 to 29 Minutes | 48 (8.2%) | 26 (5.3%) |
| 30 to 34 Minutes | 80 (13.7%) | 46 (9.4%) |
| 35 to 39 Minutes | 15 (2.6%) | 8 (1.6%) |
| 40 to 44 Minutes | 7 (1.2%) | 6 (1.2%) |
| 45 to 59 Minutes | 9 (1.5%) | 16 (3.3%) |
| 60 to 89 Minutes | 29 (5.0%) | 14 (2.9%) |
| 90 or more Minutes | 19 (3.3%) | 11 (2.2%) |
Time of Departure to Work by Sex in Turley
The most frequent times of departure to work in Turley are 7:00 AM to 7:29 AM (126, 21.5%) for males and 12:00 AM to 4:59 AM (153, 31.4%) for females.
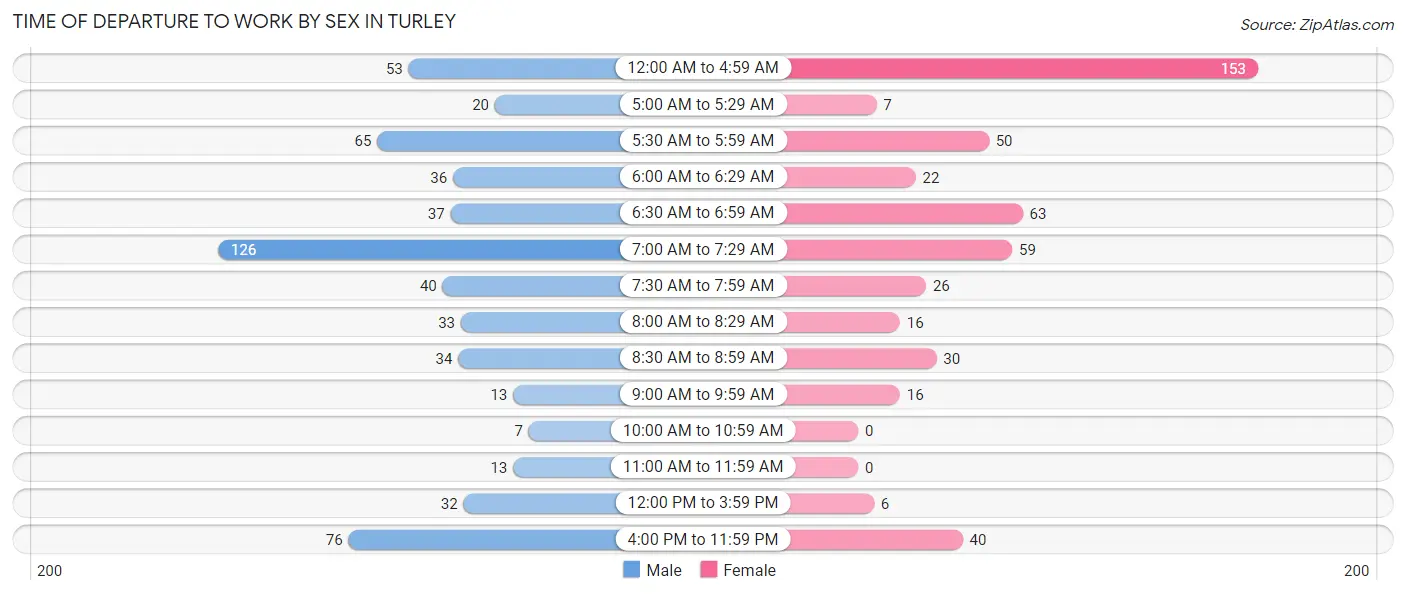
| Time of Departure | Male | Female |
| 12:00 AM to 4:59 AM | 53 (9.1%) | 153 (31.4%) |
| 5:00 AM to 5:29 AM | 20 (3.4%) | 7 (1.4%) |
| 5:30 AM to 5:59 AM | 65 (11.1%) | 50 (10.2%) |
| 6:00 AM to 6:29 AM | 36 (6.1%) | 22 (4.5%) |
| 6:30 AM to 6:59 AM | 37 (6.3%) | 63 (12.9%) |
| 7:00 AM to 7:29 AM | 126 (21.5%) | 59 (12.1%) |
| 7:30 AM to 7:59 AM | 40 (6.8%) | 26 (5.3%) |
| 8:00 AM to 8:29 AM | 33 (5.6%) | 16 (3.3%) |
| 8:30 AM to 8:59 AM | 34 (5.8%) | 30 (6.1%) |
| 9:00 AM to 9:59 AM | 13 (2.2%) | 16 (3.3%) |
| 10:00 AM to 10:59 AM | 7 (1.2%) | 0 (0.0%) |
| 11:00 AM to 11:59 AM | 13 (2.2%) | 0 (0.0%) |
| 12:00 PM to 3:59 PM | 32 (5.5%) | 6 (1.2%) |
| 4:00 PM to 11:59 PM | 76 (13.0%) | 40 (8.2%) |
| Total | 585 (100.0%) | 488 (100.0%) |
Housing Occupancy in Turley
Occupancy by Ownership in Turley
Of the total 1,054 dwellings in Turley, owner-occupied units account for 761 (72.2%), while renter-occupied units make up 293 (27.8%).
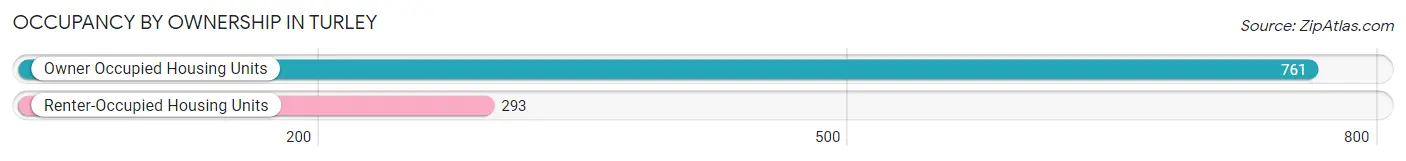
| Occupancy | # Housing Units | % Housing Units |
| Owner Occupied Housing Units | 761 | 72.2% |
| Renter-Occupied Housing Units | 293 | 27.8% |
| Total Occupied Housing Units | 1,054 | 100.0% |
Occupancy by Household Size in Turley
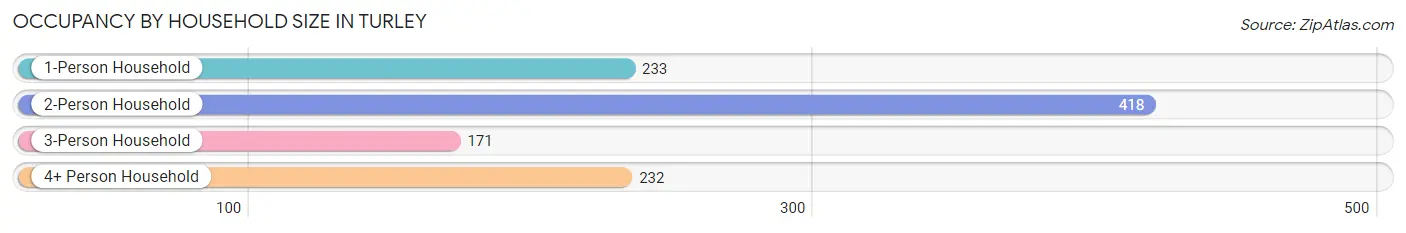
| Household Size | # Housing Units | % Housing Units |
| 1-Person Household | 233 | 22.1% |
| 2-Person Household | 418 | 39.7% |
| 3-Person Household | 171 | 16.2% |
| 4+ Person Household | 232 | 22.0% |
| Total Housing Units | 1,054 | 100.0% |
Occupancy by Ownership by Household Size in Turley
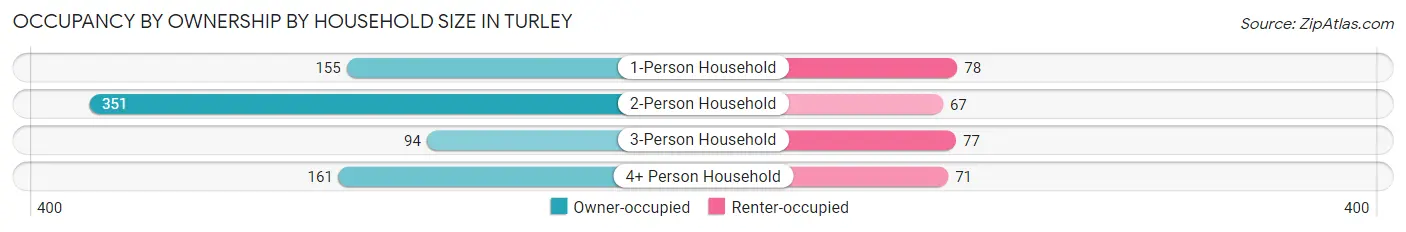
| Household Size | Owner-occupied | Renter-occupied |
| 1-Person Household | 155 (66.5%) | 78 (33.5%) |
| 2-Person Household | 351 (84.0%) | 67 (16.0%) |
| 3-Person Household | 94 (55.0%) | 77 (45.0%) |
| 4+ Person Household | 161 (69.4%) | 71 (30.6%) |
| Total Housing Units | 761 (72.2%) | 293 (27.8%) |
Occupancy by Educational Attainment in Turley
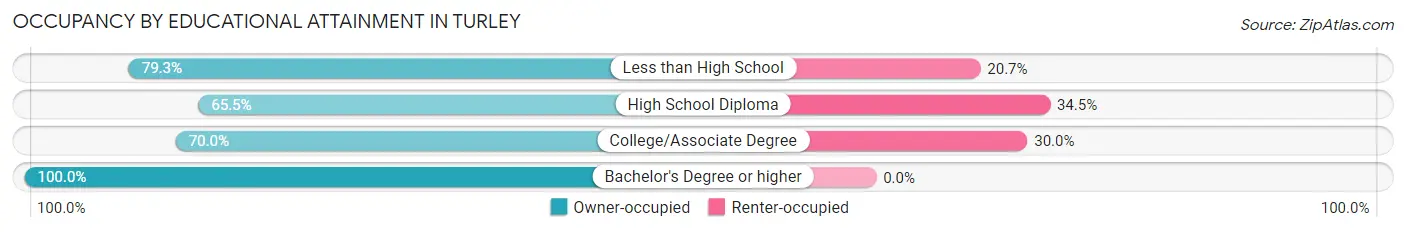
| Household Size | Owner-occupied | Renter-occupied |
| Less than High School | 265 (79.3%) | 69 (20.7%) |
| High School Diploma | 251 (65.5%) | 132 (34.5%) |
| College/Associate Degree | 215 (70.0%) | 92 (30.0%) |
| Bachelor's Degree or higher | 30 (100.0%) | 0 (0.0%) |
Occupancy by Age of Householder in Turley
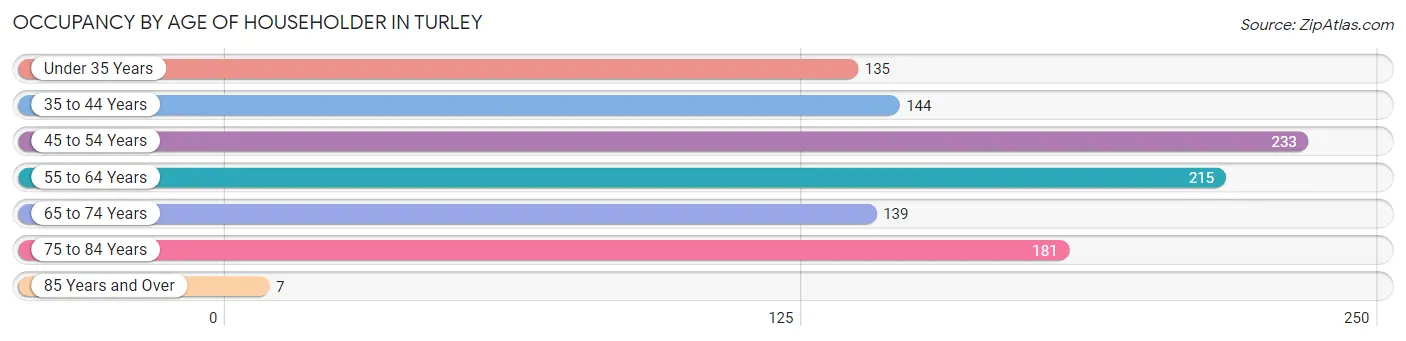
| Age Bracket | # Households | % Households |
| Under 35 Years | 135 | 12.8% |
| 35 to 44 Years | 144 | 13.7% |
| 45 to 54 Years | 233 | 22.1% |
| 55 to 64 Years | 215 | 20.4% |
| 65 to 74 Years | 139 | 13.2% |
| 75 to 84 Years | 181 | 17.2% |
| 85 Years and Over | 7 | 0.7% |
| Total | 1,054 | 100.0% |
Housing Finances in Turley
Median Income by Occupancy in Turley
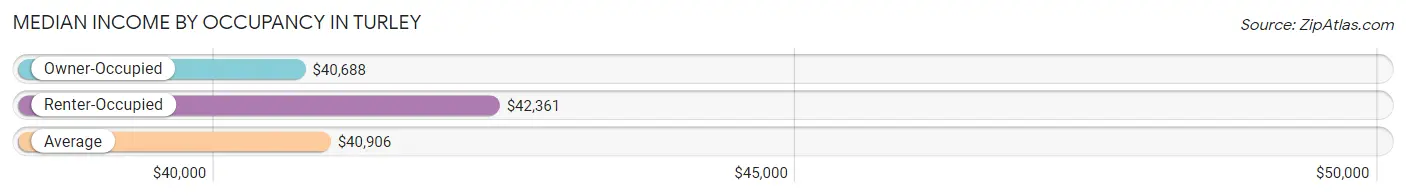
| Occupancy Type | # Households | Median Income |
| Owner-Occupied | 761 (72.2%) | $40,688 |
| Renter-Occupied | 293 (27.8%) | $42,361 |
| Average | 1,054 (100.0%) | $40,906 |
Occupancy by Householder Income Bracket in Turley
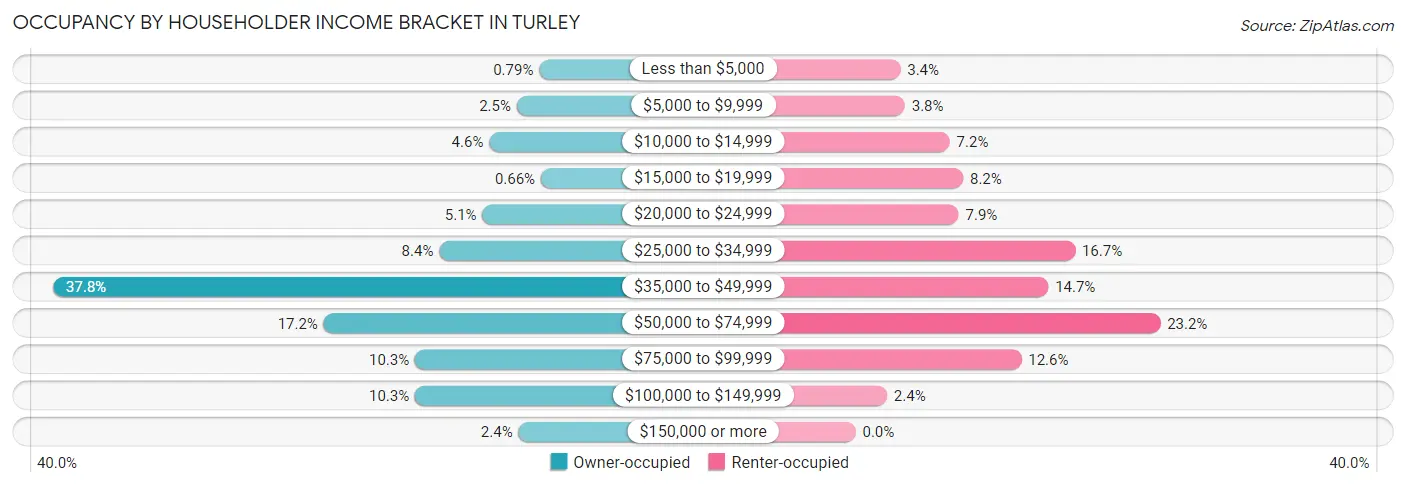
| Income Bracket | Owner-occupied | Renter-occupied |
| Less than $5,000 | 6 (0.8%) | 10 (3.4%) |
| $5,000 to $9,999 | 19 (2.5%) | 11 (3.7%) |
| $10,000 to $14,999 | 35 (4.6%) | 21 (7.2%) |
| $15,000 to $19,999 | 5 (0.7%) | 24 (8.2%) |
| $20,000 to $24,999 | 39 (5.1%) | 23 (7.9%) |
| $25,000 to $34,999 | 64 (8.4%) | 49 (16.7%) |
| $35,000 to $49,999 | 288 (37.8%) | 43 (14.7%) |
| $50,000 to $74,999 | 131 (17.2%) | 68 (23.2%) |
| $75,000 to $99,999 | 78 (10.2%) | 37 (12.6%) |
| $100,000 to $149,999 | 78 (10.2%) | 7 (2.4%) |
| $150,000 or more | 18 (2.4%) | 0 (0.0%) |
| Total | 761 (100.0%) | 293 (100.0%) |
Monthly Housing Cost Tiers in Turley
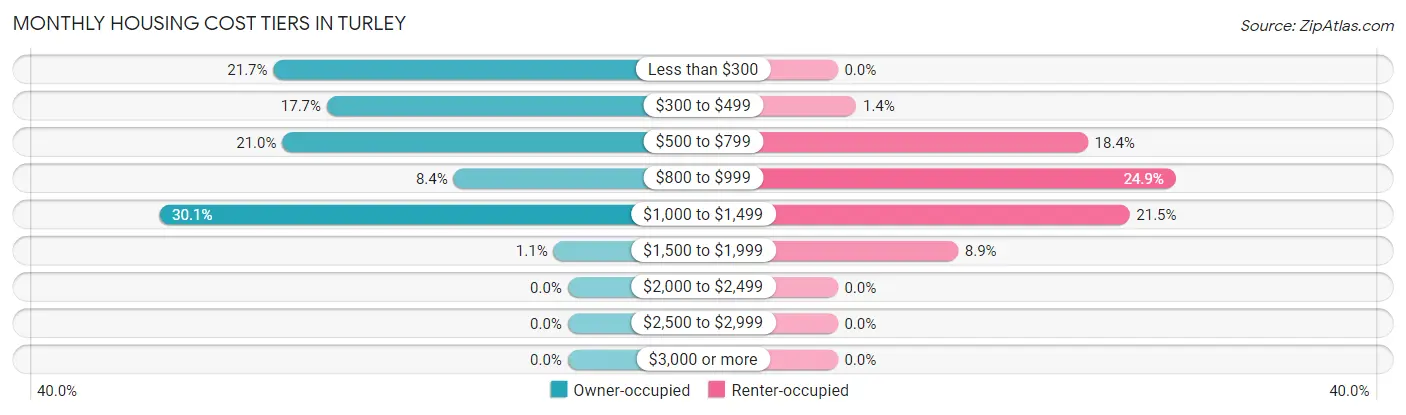
| Monthly Cost | Owner-occupied | Renter-occupied |
| Less than $300 | 165 (21.7%) | 0 (0.0%) |
| $300 to $499 | 135 (17.7%) | 4 (1.4%) |
| $500 to $799 | 160 (21.0%) | 54 (18.4%) |
| $800 to $999 | 64 (8.4%) | 73 (24.9%) |
| $1,000 to $1,499 | 229 (30.1%) | 63 (21.5%) |
| $1,500 to $1,999 | 8 (1.1%) | 26 (8.9%) |
| $2,000 to $2,499 | 0 (0.0%) | 0 (0.0%) |
| $2,500 to $2,999 | 0 (0.0%) | 0 (0.0%) |
| $3,000 or more | 0 (0.0%) | 0 (0.0%) |
| Total | 761 (100.0%) | 293 (100.0%) |
Physical Housing Characteristics in Turley
Housing Structures in Turley
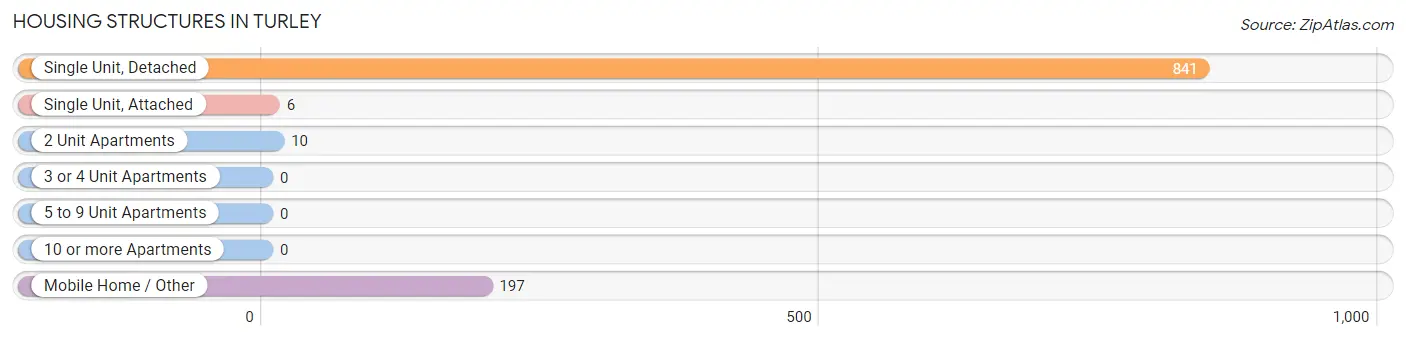
| Structure Type | # Housing Units | % Housing Units |
| Single Unit, Detached | 841 | 79.8% |
| Single Unit, Attached | 6 | 0.6% |
| 2 Unit Apartments | 10 | 0.9% |
| 3 or 4 Unit Apartments | 0 | 0.0% |
| 5 to 9 Unit Apartments | 0 | 0.0% |
| 10 or more Apartments | 0 | 0.0% |
| Mobile Home / Other | 197 | 18.7% |
| Total | 1,054 | 100.0% |
Housing Structures by Occupancy in Turley
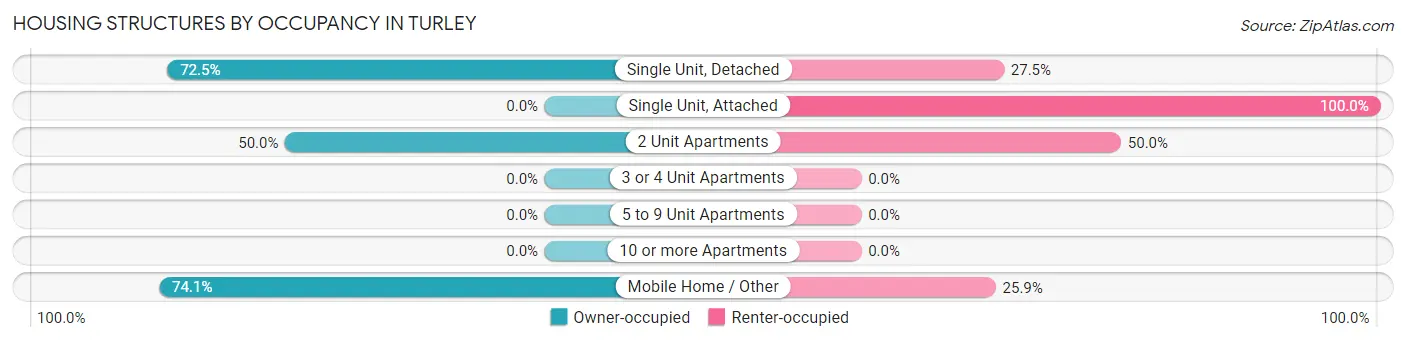
| Structure Type | Owner-occupied | Renter-occupied |
| Single Unit, Detached | 610 (72.5%) | 231 (27.5%) |
| Single Unit, Attached | 0 (0.0%) | 6 (100.0%) |
| 2 Unit Apartments | 5 (50.0%) | 5 (50.0%) |
| 3 or 4 Unit Apartments | 0 (0.0%) | 0 (0.0%) |
| 5 to 9 Unit Apartments | 0 (0.0%) | 0 (0.0%) |
| 10 or more Apartments | 0 (0.0%) | 0 (0.0%) |
| Mobile Home / Other | 146 (74.1%) | 51 (25.9%) |
| Total | 761 (72.2%) | 293 (27.8%) |
Housing Structures by Number of Rooms in Turley
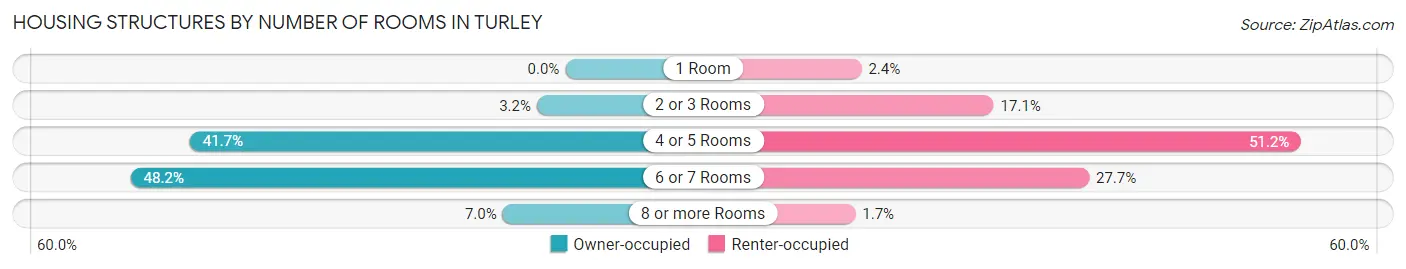
| Number of Rooms | Owner-occupied | Renter-occupied |
| 1 Room | 0 (0.0%) | 7 (2.4%) |
| 2 or 3 Rooms | 24 (3.2%) | 50 (17.1%) |
| 4 or 5 Rooms | 317 (41.7%) | 150 (51.2%) |
| 6 or 7 Rooms | 367 (48.2%) | 81 (27.7%) |
| 8 or more Rooms | 53 (7.0%) | 5 (1.7%) |
| Total | 761 (100.0%) | 293 (100.0%) |
Housing Structure by Heating Type in Turley
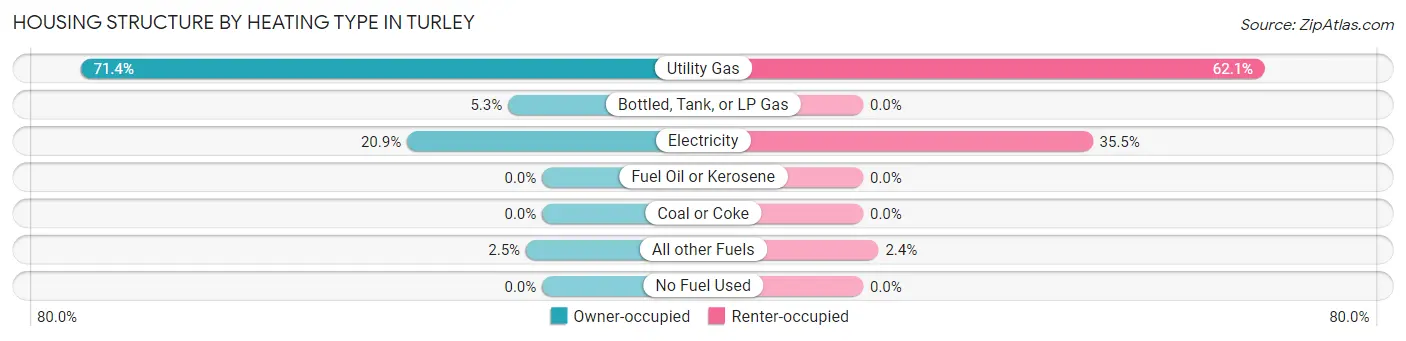
| Heating Type | Owner-occupied | Renter-occupied |
| Utility Gas | 543 (71.4%) | 182 (62.1%) |
| Bottled, Tank, or LP Gas | 40 (5.3%) | 0 (0.0%) |
| Electricity | 159 (20.9%) | 104 (35.5%) |
| Fuel Oil or Kerosene | 0 (0.0%) | 0 (0.0%) |
| Coal or Coke | 0 (0.0%) | 0 (0.0%) |
| All other Fuels | 19 (2.5%) | 7 (2.4%) |
| No Fuel Used | 0 (0.0%) | 0 (0.0%) |
| Total | 761 (100.0%) | 293 (100.0%) |
Household Vehicle Usage in Turley
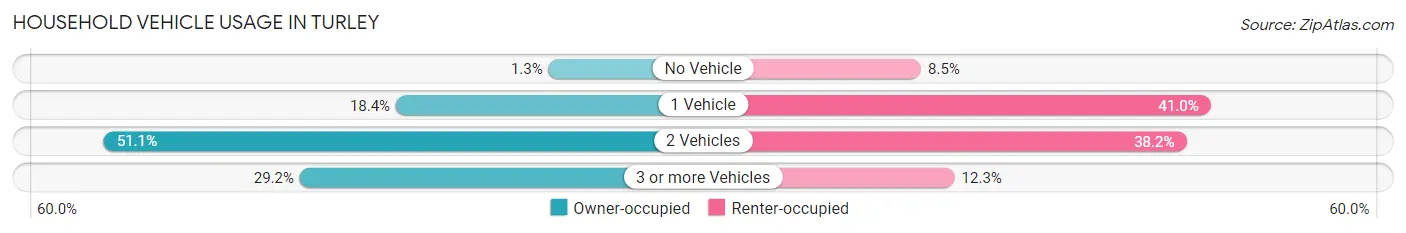
| Vehicles per Household | Owner-occupied | Renter-occupied |
| No Vehicle | 10 (1.3%) | 25 (8.5%) |
| 1 Vehicle | 140 (18.4%) | 120 (41.0%) |
| 2 Vehicles | 389 (51.1%) | 112 (38.2%) |
| 3 or more Vehicles | 222 (29.2%) | 36 (12.3%) |
| Total | 761 (100.0%) | 293 (100.0%) |
Real Estate & Mortgages in Turley
Real Estate and Mortgage Overview in Turley
| Characteristic | Without Mortgage | With Mortgage |
| Housing Units | 426 | 335 |
| Median Property Value | $65,700 | $50,700 |
| Median Household Income | $43,611 | $3 |
| Monthly Housing Costs | $377 | $0 |
| Real Estate Taxes | $521 | $9 |
Property Value by Mortgage Status in Turley
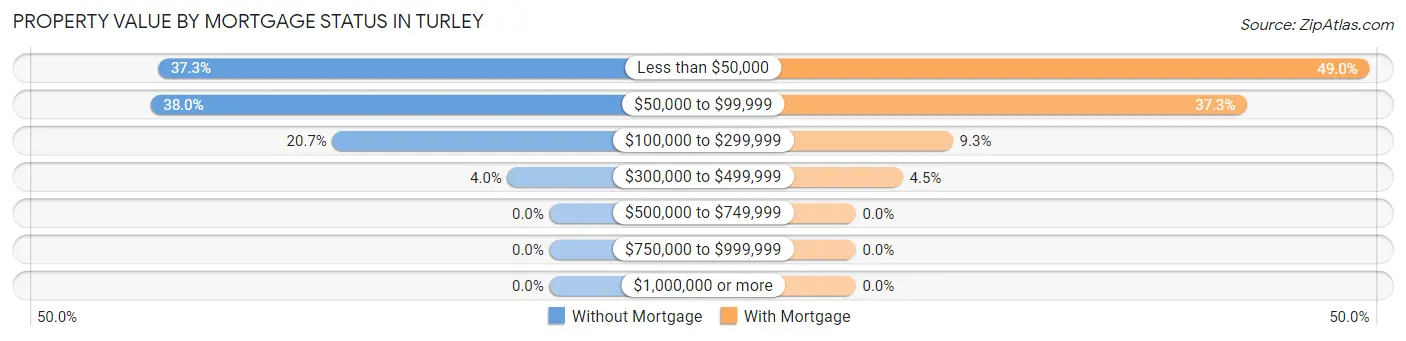
| Property Value | Without Mortgage | With Mortgage |
| Less than $50,000 | 159 (37.3%) | 164 (49.0%) |
| $50,000 to $99,999 | 162 (38.0%) | 125 (37.3%) |
| $100,000 to $299,999 | 88 (20.7%) | 31 (9.2%) |
| $300,000 to $499,999 | 17 (4.0%) | 15 (4.5%) |
| $500,000 to $749,999 | 0 (0.0%) | 0 (0.0%) |
| $750,000 to $999,999 | 0 (0.0%) | 0 (0.0%) |
| $1,000,000 or more | 0 (0.0%) | 0 (0.0%) |
| Total | 426 (100.0%) | 335 (100.0%) |
Household Income by Mortgage Status in Turley
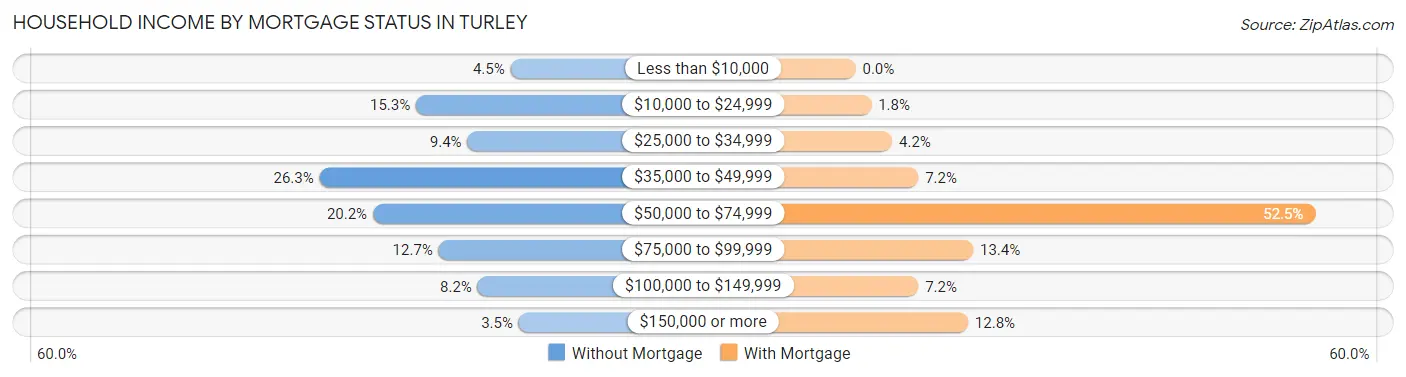
| Household Income | Without Mortgage | With Mortgage |
| Less than $10,000 | 19 (4.5%) | 0 (0.0%) |
| $10,000 to $24,999 | 65 (15.3%) | 6 (1.8%) |
| $25,000 to $34,999 | 40 (9.4%) | 14 (4.2%) |
| $35,000 to $49,999 | 112 (26.3%) | 24 (7.2%) |
| $50,000 to $74,999 | 86 (20.2%) | 176 (52.5%) |
| $75,000 to $99,999 | 54 (12.7%) | 45 (13.4%) |
| $100,000 to $149,999 | 35 (8.2%) | 24 (7.2%) |
| $150,000 or more | 15 (3.5%) | 43 (12.8%) |
| Total | 426 (100.0%) | 335 (100.0%) |
Property Value to Household Income Ratio in Turley
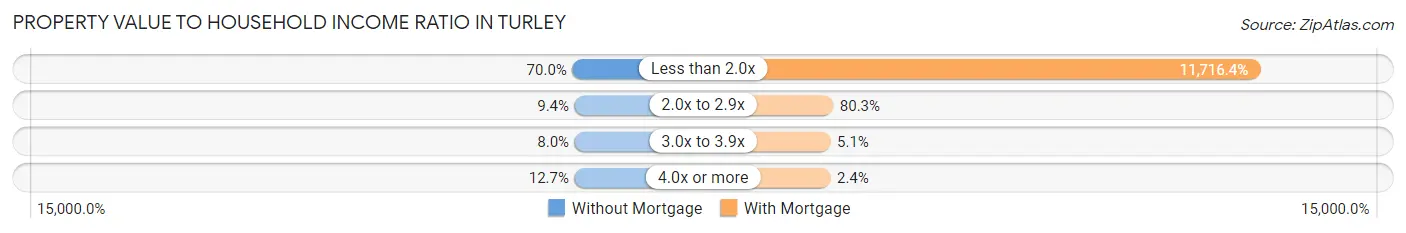
| Value-to-Income Ratio | Without Mortgage | With Mortgage |
| Less than 2.0x | 298 (70.0%) | 39,250 (11,716.4%) |
| 2.0x to 2.9x | 40 (9.4%) | 269 (80.3%) |
| 3.0x to 3.9x | 34 (8.0%) | 17 (5.1%) |
| 4.0x or more | 54 (12.7%) | 8 (2.4%) |
| Total | 426 (100.0%) | 335 (100.0%) |
Real Estate Taxes by Mortgage Status in Turley
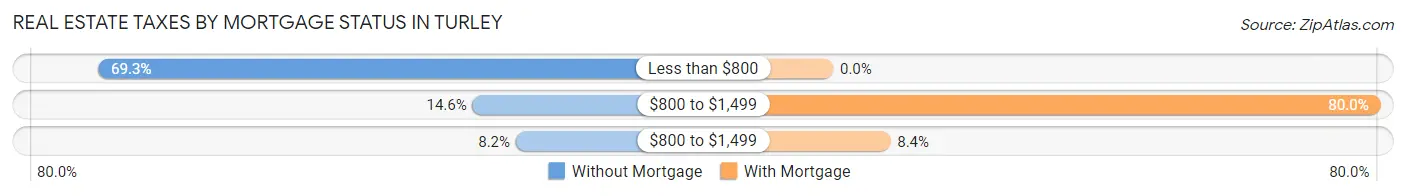
| Property Taxes | Without Mortgage | With Mortgage |
| Less than $800 | 295 (69.3%) | 0 (0.0%) |
| $800 to $1,499 | 62 (14.5%) | 268 (80.0%) |
| $800 to $1,499 | 35 (8.2%) | 28 (8.4%) |
| Total | 426 (100.0%) | 335 (100.0%) |
Health & Disability in Turley
Health Insurance Coverage by Age in Turley
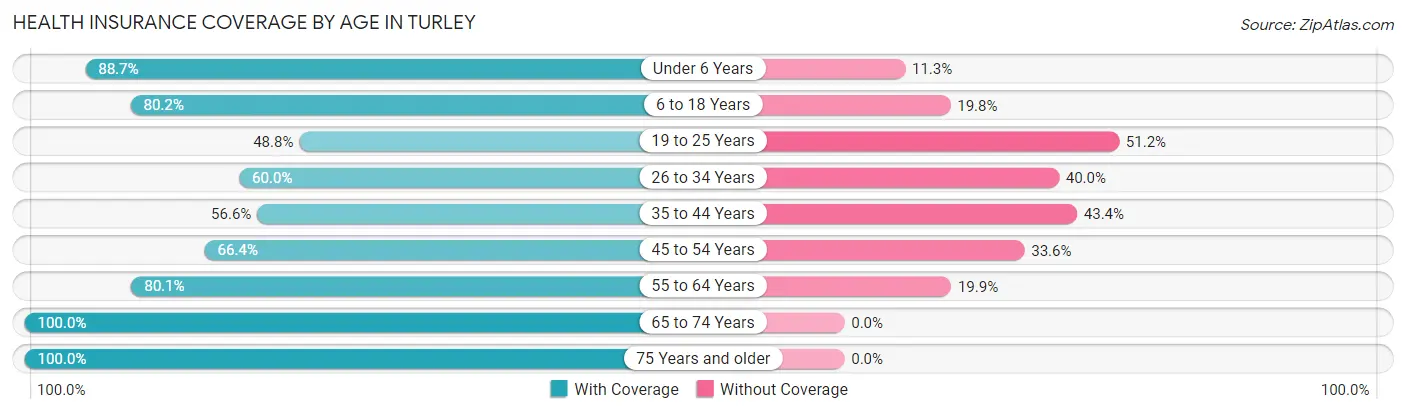
| Age Bracket | With Coverage | Without Coverage |
| Under 6 Years | 227 (88.7%) | 29 (11.3%) |
| 6 to 18 Years | 329 (80.2%) | 81 (19.8%) |
| 19 to 25 Years | 121 (48.8%) | 127 (51.2%) |
| 26 to 34 Years | 165 (60.0%) | 110 (40.0%) |
| 35 to 44 Years | 188 (56.6%) | 144 (43.4%) |
| 45 to 54 Years | 299 (66.4%) | 151 (33.6%) |
| 55 to 64 Years | 310 (80.1%) | 77 (19.9%) |
| 65 to 74 Years | 169 (100.0%) | 0 (0.0%) |
| 75 Years and older | 243 (100.0%) | 0 (0.0%) |
| Total | 2,051 (74.0%) | 719 (26.0%) |
Health Insurance Coverage by Citizenship Status in Turley
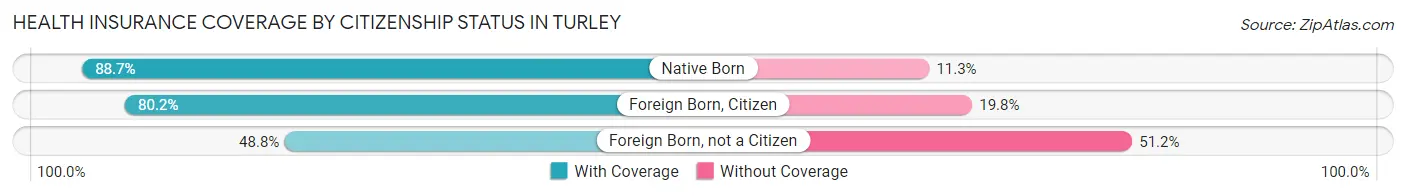
| Citizenship Status | With Coverage | Without Coverage |
| Native Born | 227 (88.7%) | 29 (11.3%) |
| Foreign Born, Citizen | 329 (80.2%) | 81 (19.8%) |
| Foreign Born, not a Citizen | 121 (48.8%) | 127 (51.2%) |
Health Insurance Coverage by Household Income in Turley
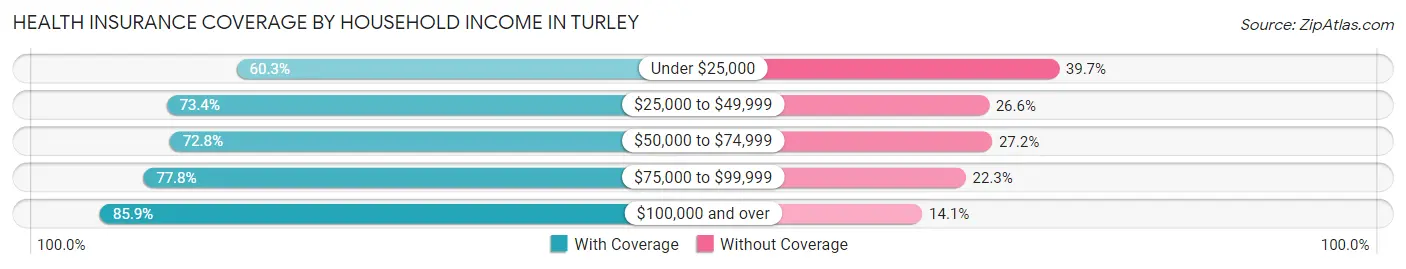
| Household Income | With Coverage | Without Coverage |
| Under $25,000 | 220 (60.3%) | 145 (39.7%) |
| $25,000 to $49,999 | 671 (73.4%) | 243 (26.6%) |
| $50,000 to $74,999 | 514 (72.8%) | 192 (27.2%) |
| $75,000 to $99,999 | 269 (77.7%) | 77 (22.3%) |
| $100,000 and over | 377 (85.9%) | 62 (14.1%) |
Public vs Private Health Insurance Coverage by Age in Turley
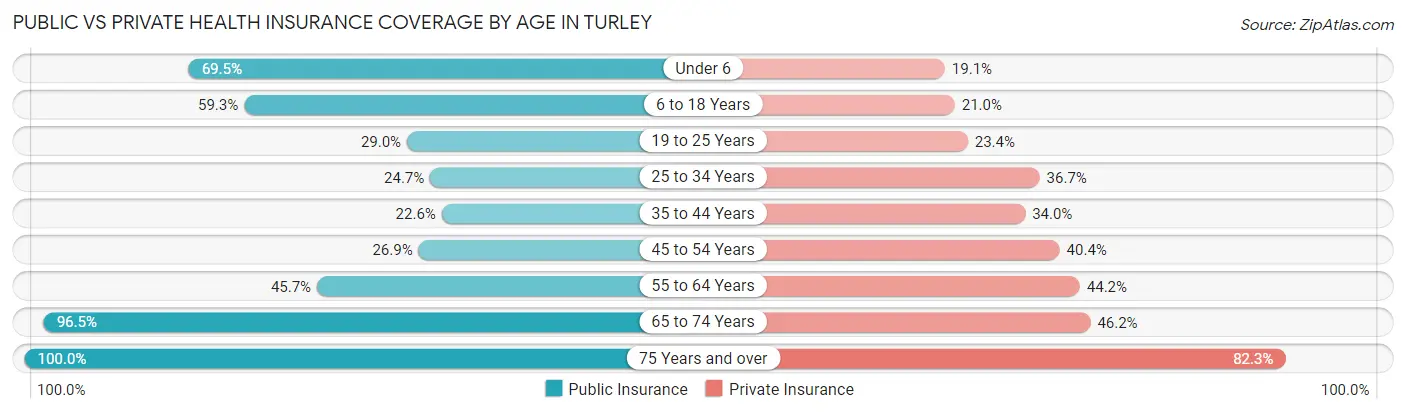
| Age Bracket | Public Insurance | Private Insurance |
| Under 6 | 178 (69.5%) | 49 (19.1%) |
| 6 to 18 Years | 243 (59.3%) | 86 (21.0%) |
| 19 to 25 Years | 72 (29.0%) | 58 (23.4%) |
| 25 to 34 Years | 68 (24.7%) | 101 (36.7%) |
| 35 to 44 Years | 75 (22.6%) | 113 (34.0%) |
| 45 to 54 Years | 121 (26.9%) | 182 (40.4%) |
| 55 to 64 Years | 177 (45.7%) | 171 (44.2%) |
| 65 to 74 Years | 163 (96.5%) | 78 (46.2%) |
| 75 Years and over | 243 (100.0%) | 200 (82.3%) |
| Total | 1,340 (48.4%) | 1,038 (37.5%) |
Disability Status by Sex by Age in Turley
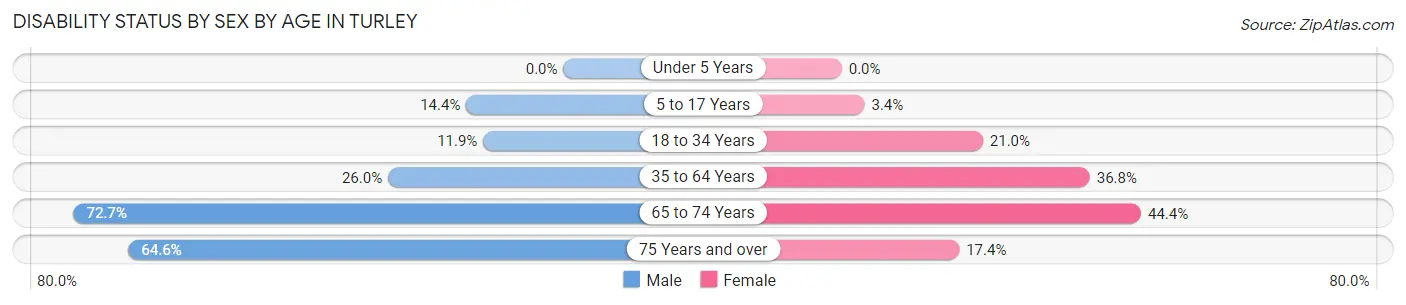
| Age Bracket | Male | Female |
| Under 5 Years | 0 (0.0%) | 0 (0.0%) |
| 5 to 17 Years | 30 (14.4%) | 7 (3.4%) |
| 18 to 34 Years | 37 (11.9%) | 53 (20.9%) |
| 35 to 64 Years | 163 (26.0%) | 200 (36.8%) |
| 65 to 74 Years | 64 (72.7%) | 36 (44.4%) |
| 75 Years and over | 31 (64.6%) | 34 (17.4%) |
Disability Class by Sex by Age in Turley
Disability Class: Hearing Difficulty
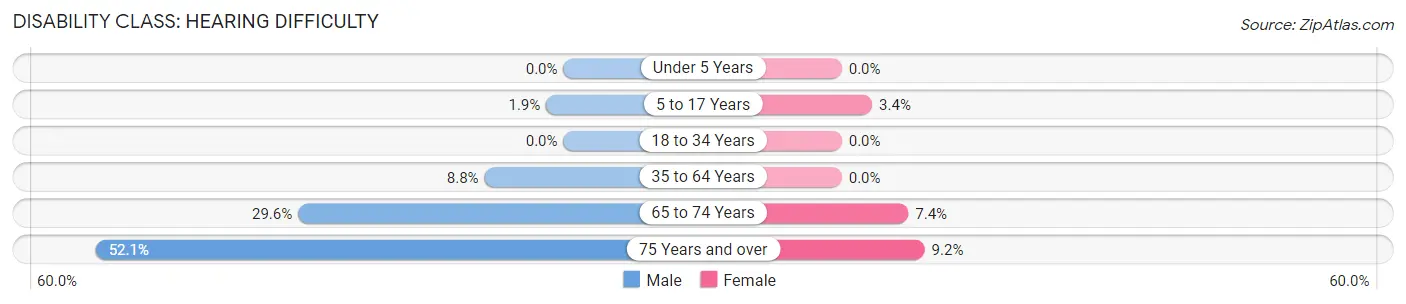
| Age Bracket | Male | Female |
| Under 5 Years | 0 (0.0%) | 0 (0.0%) |
| 5 to 17 Years | 4 (1.9%) | 7 (3.4%) |
| 18 to 34 Years | 0 (0.0%) | 0 (0.0%) |
| 35 to 64 Years | 55 (8.8%) | 0 (0.0%) |
| 65 to 74 Years | 26 (29.5%) | 6 (7.4%) |
| 75 Years and over | 25 (52.1%) | 18 (9.2%) |
Disability Class: Vision Difficulty
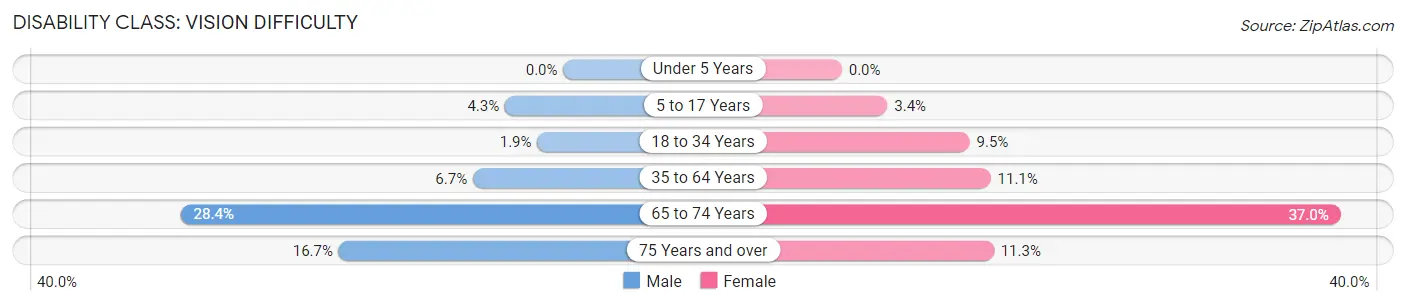
| Age Bracket | Male | Female |
| Under 5 Years | 0 (0.0%) | 0 (0.0%) |
| 5 to 17 Years | 9 (4.3%) | 7 (3.4%) |
| 18 to 34 Years | 6 (1.9%) | 24 (9.5%) |
| 35 to 64 Years | 42 (6.7%) | 60 (11.1%) |
| 65 to 74 Years | 25 (28.4%) | 30 (37.0%) |
| 75 Years and over | 8 (16.7%) | 22 (11.3%) |
Disability Class: Cognitive Difficulty
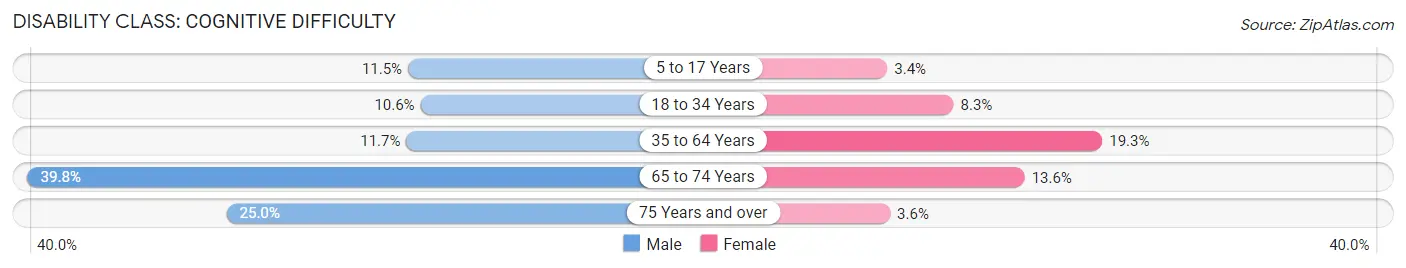
| Age Bracket | Male | Female |
| 5 to 17 Years | 24 (11.5%) | 7 (3.4%) |
| 18 to 34 Years | 33 (10.6%) | 21 (8.3%) |
| 35 to 64 Years | 73 (11.7%) | 105 (19.3%) |
| 65 to 74 Years | 35 (39.8%) | 11 (13.6%) |
| 75 Years and over | 12 (25.0%) | 7 (3.6%) |
Disability Class: Ambulatory Difficulty
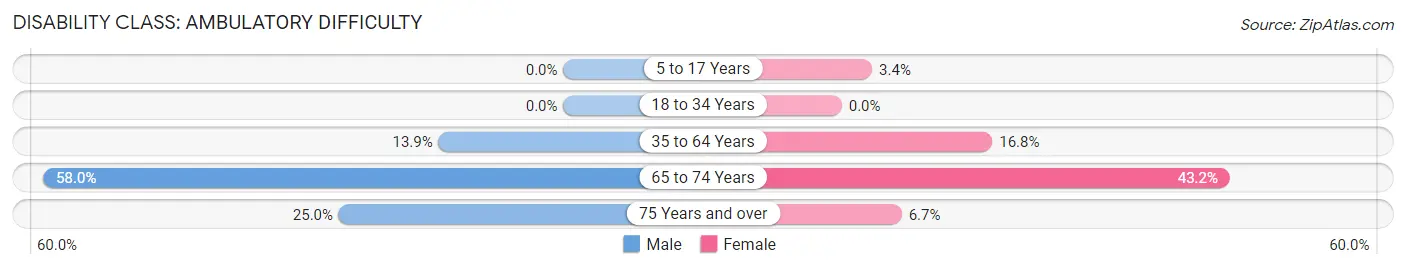
| Age Bracket | Male | Female |
| 5 to 17 Years | 0 (0.0%) | 7 (3.4%) |
| 18 to 34 Years | 0 (0.0%) | 0 (0.0%) |
| 35 to 64 Years | 87 (13.9%) | 91 (16.8%) |
| 65 to 74 Years | 51 (58.0%) | 35 (43.2%) |
| 75 Years and over | 12 (25.0%) | 13 (6.7%) |
Disability Class: Self-Care Difficulty
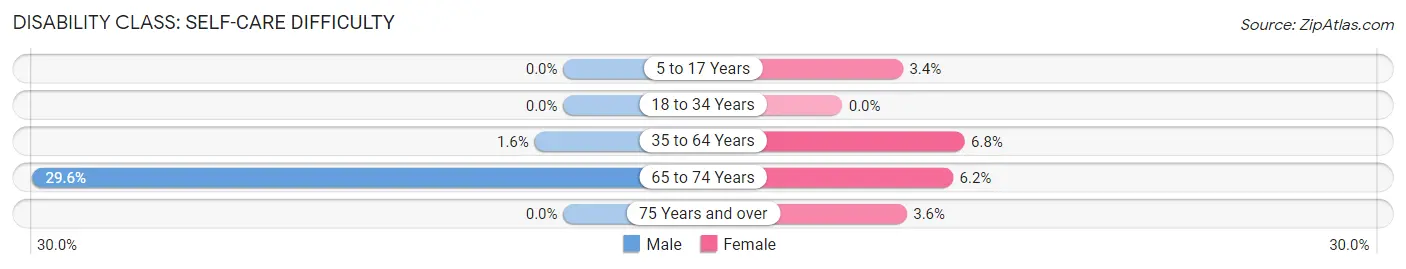
| Age Bracket | Male | Female |
| 5 to 17 Years | 0 (0.0%) | 7 (3.4%) |
| 18 to 34 Years | 0 (0.0%) | 0 (0.0%) |
| 35 to 64 Years | 10 (1.6%) | 37 (6.8%) |
| 65 to 74 Years | 26 (29.5%) | 5 (6.2%) |
| 75 Years and over | 0 (0.0%) | 7 (3.6%) |
Technology Access in Turley
Computing Device Access in Turley
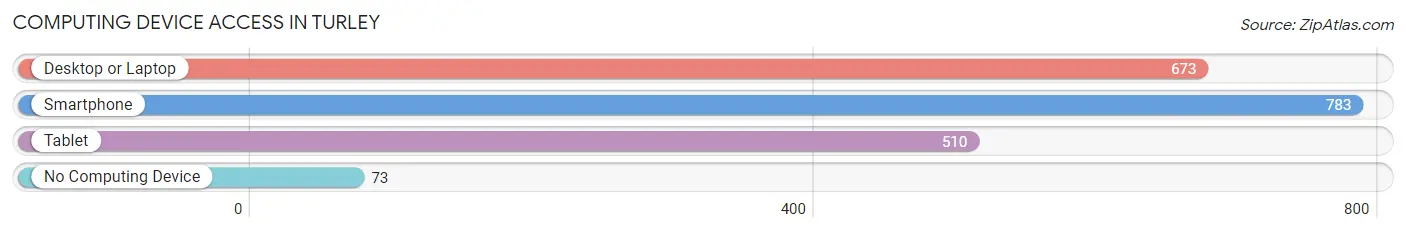
| Device Type | # Households | % Households |
| Desktop or Laptop | 673 | 63.8% |
| Smartphone | 783 | 74.3% |
| Tablet | 510 | 48.4% |
| No Computing Device | 73 | 6.9% |
| Total | 1,054 | 100.0% |
Internet Access in Turley
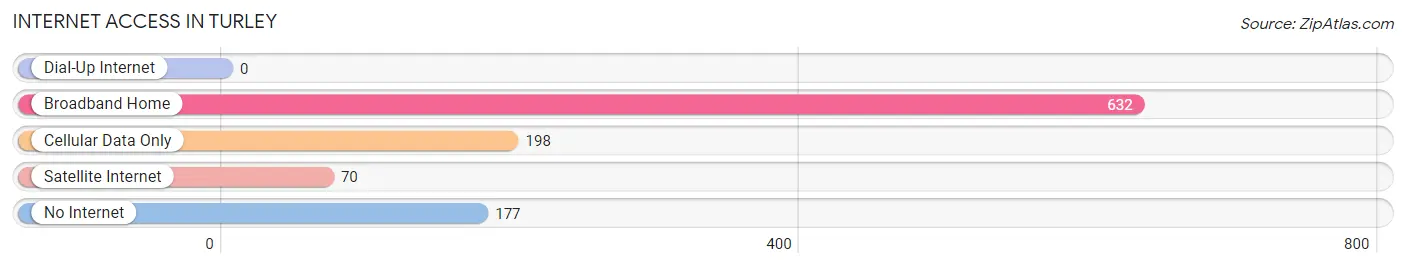
| Internet Type | # Households | % Households |
| Dial-Up Internet | 0 | 0.0% |
| Broadband Home | 632 | 60.0% |
| Cellular Data Only | 198 | 18.8% |
| Satellite Internet | 70 | 6.6% |
| No Internet | 177 | 16.8% |
| Total | 1,054 | 100.0% |
Turley Summary
Turley is a small town located in Tulsa County, Oklahoma. It is situated in the northeastern part of the state, about 15 miles north of Tulsa. The town was founded in 1891 and was named after the Turley family, who were among the first settlers in the area. The population of Turley was 1,845 at the 2010 census.
Geography
Turley is located at 36°14'25" North, 95°59'45" West (36.240278, -95.995833). It is situated in the northeastern part of Tulsa County, about 15 miles north of Tulsa. The town is located on the Arkansas River, which forms the northern boundary of the town. The terrain is mostly flat, with some rolling hills in the area. The average elevation is 690 feet above sea level.
Climate
Turley has a humid subtropical climate, with hot summers and mild winters. The average annual temperature is 63°F, with an average high of 87°F in the summer and an average low of 37°F in the winter. The average annual precipitation is 40 inches, with most of it falling in the spring and summer months.
Demographics
As of the 2010 census, there were 1,845 people, 717 households, and 486 families residing in Turley. The population density was 1,092.3 people per square mile. The racial makeup of the town was 79.2% White, 0.7% African American, 0.7% Native American, 0.2% Asian, 0.1% Pacific Islander, 16.2% from other races, and 2.9% from two or more races. Hispanic or Latino of any race were 24.2% of the population.
The median age in Turley was 36.2 years. 24.2% of residents were under the age of 18; 8.3% were between the ages of 18 and 24; 24.2% were from 25 to 44; 28.2% were from 45 to 64; and 15.1% were 65 years of age or older. The gender makeup of the town was 48.2% male and 51.8% female.
Economy
The economy of Turley is largely based on agriculture. The town is home to several farms, which produce a variety of crops, including corn, wheat, soybeans, and hay. The town also has a few small businesses, including a grocery store, a hardware store, and a few restaurants.
The town is served by the Tulsa International Airport, which is located about 25 miles south of Turley. The airport provides access to the rest of the country and the world.
Education
Turley is served by the Tulsa Public Schools system. The town has one elementary school, Turley Elementary School, which serves students in grades K-5. The town also has one middle school, Turley Middle School, which serves students in grades 6-8.
Conclusion
Turley is a small town located in Tulsa County, Oklahoma. It is situated in the northeastern part of the state, about 15 miles north of Tulsa. The town was founded in 1891 and was named after the Turley family, who were among the first settlers in the area. The population of Turley was 1,845 at the 2010 census. The town is located on the Arkansas River, and the terrain is mostly flat, with some rolling hills in the area. The economy of Turley is largely based on agriculture, and the town is served by the Tulsa International Airport. The town is served by the Tulsa Public Schools system, and has one elementary school and one middle school.
Common Questions
What is Per Capita Income in Turley?
Per Capita income in Turley is $18,776.
What is the Median Family Income in Turley?
Median Family Income in Turley is $41,165.
What is the Median Household income in Turley?
Median Household Income in Turley is $40,906.
What is Income or Wage Gap in Turley?
Income or Wage Gap in Turley is 47.8%.
Women in Turley earn 52.2 cents for every dollar earned by a man.
What is Family Income Deficit in Turley?
Family Income Deficit in Turley is $8,710.
Families that are below poverty line in Turley earn $8,710 less on average than the poverty threshold level.
What is Inequality or Gini Index in Turley?
Inequality or Gini Index in Turley is 0.35.
What is the Total Population of Turley?
Total Population of Turley is 2,917.
What is the Total Male Population of Turley?
Total Male Population of Turley is 1,431.
What is the Total Female Population of Turley?
Total Female Population of Turley is 1,486.
What is the Ratio of Males per 100 Females in Turley?
There are 96.30 Males per 100 Females in Turley.
What is the Ratio of Females per 100 Males in Turley?
There are 103.84 Females per 100 Males in Turley.
What is the Median Population Age in Turley?
Median Population Age in Turley is 40.3 Years.
What is the Average Family Size in Turley
Average Family Size in Turley is 3.0 People.
What is the Average Household Size in Turley
Average Household Size in Turley is 2.6 People.
How Large is the Labor Force in Turley?
There are 1,305 People in the Labor Forcein in Turley.
What is the Percentage of People in the Labor Force in Turley?
55.6% of People are in the Labor Force in Turley.
What is the Unemployment Rate in Turley?
Unemployment Rate in Turley is 11.1%.