Lawton, OK Map & Demographics
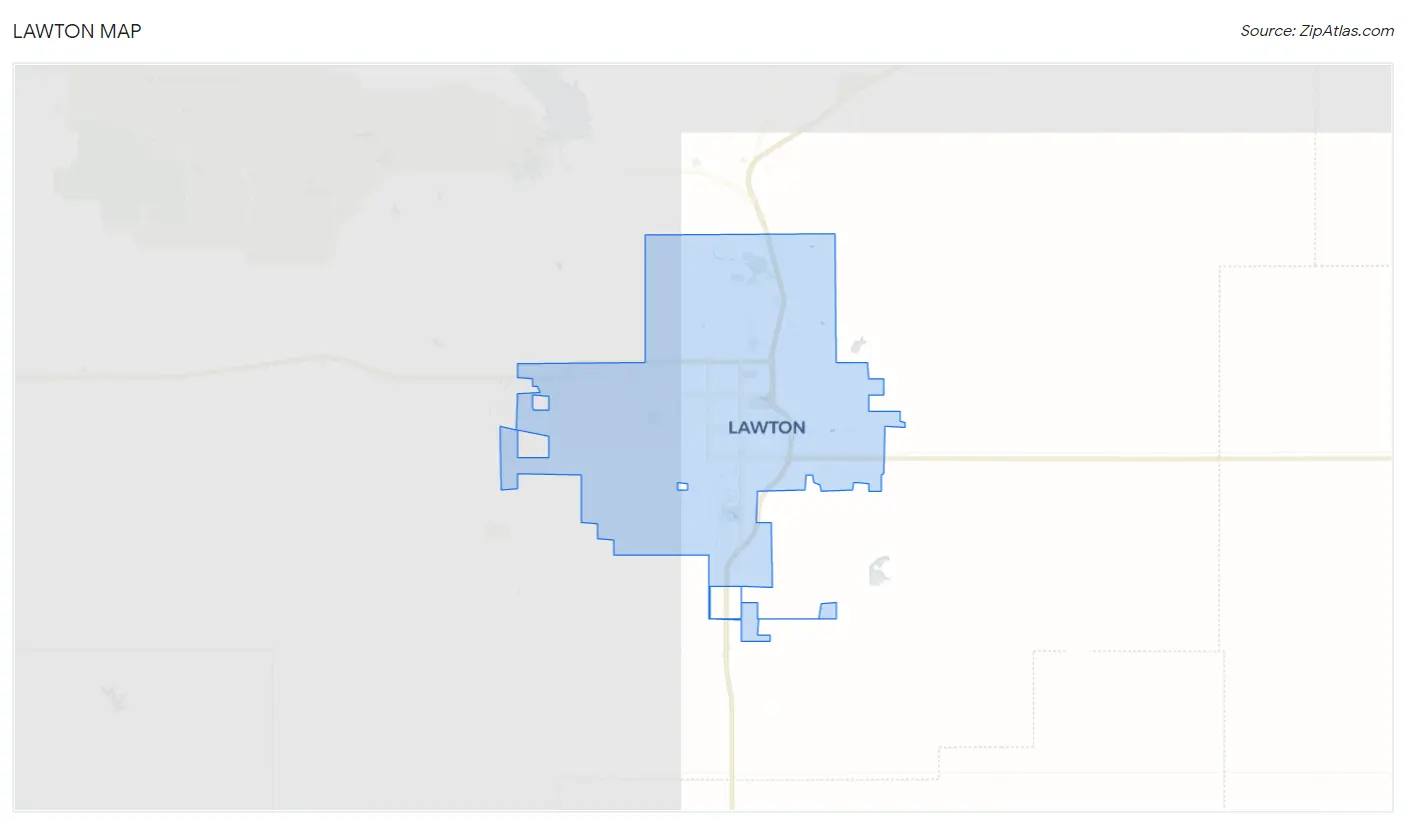
Lawton Map
Lawton Overview
$27,221
PER CAPITA INCOME
$62,222
AVG FAMILY INCOME
$51,561
AVG HOUSEHOLD INCOME
17.5%
WAGE / INCOME GAP [ % ]
82.5¢/ $1
WAGE / INCOME GAP [ $ ]
$11,691
FAMILY INCOME DEFICIT
0.45
INEQUALITY / GINI INDEX
91,023
TOTAL POPULATION
47,663
MALE POPULATION
43,360
FEMALE POPULATION
109.92
MALES / 100 FEMALES
90.97
FEMALES / 100 MALES
31.9
MEDIAN AGE
3.1
AVG FAMILY SIZE
2.5
AVG HOUSEHOLD SIZE
44,476
LABOR FORCE [ PEOPLE ]
61.7%
PERCENT IN LABOR FORCE
7.7%
UNEMPLOYMENT RATE
Lawton Area Codes
Income in Lawton
Income Overview in Lawton
Per Capita Income in Lawton is $27,221, while median incomes of families and households are $62,222 and $51,561 respectively.
| Characteristic | Number | Measure |
| Per Capita Income | 91,023 | $27,221 |
| Median Family Income | 19,946 | $62,222 |
| Mean Family Income | 19,946 | $76,658 |
| Median Household Income | 33,144 | $51,561 |
| Mean Household Income | 33,144 | $66,992 |
| Income Deficit | 19,946 | $11,691 |
| Wage / Income Gap (%) | 91,023 | 17.52% |
| Wage / Income Gap ($) | 91,023 | 82.48¢ per $1 |
| Gini / Inequality Index | 91,023 | 0.45 |
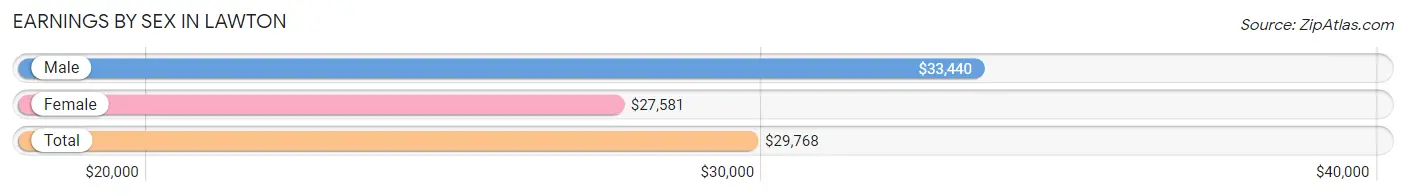
Earnings by Sex in Lawton
Average Earnings in Lawton are $29,768, $33,440 for men and $27,581 for women, a difference of 17.5%.
| Sex | Number | Average Earnings |
| Male | 24,894 (53.8%) | $33,440 |
| Female | 21,356 (46.2%) | $27,581 |
| Total | 46,250 (100.0%) | $29,768 |
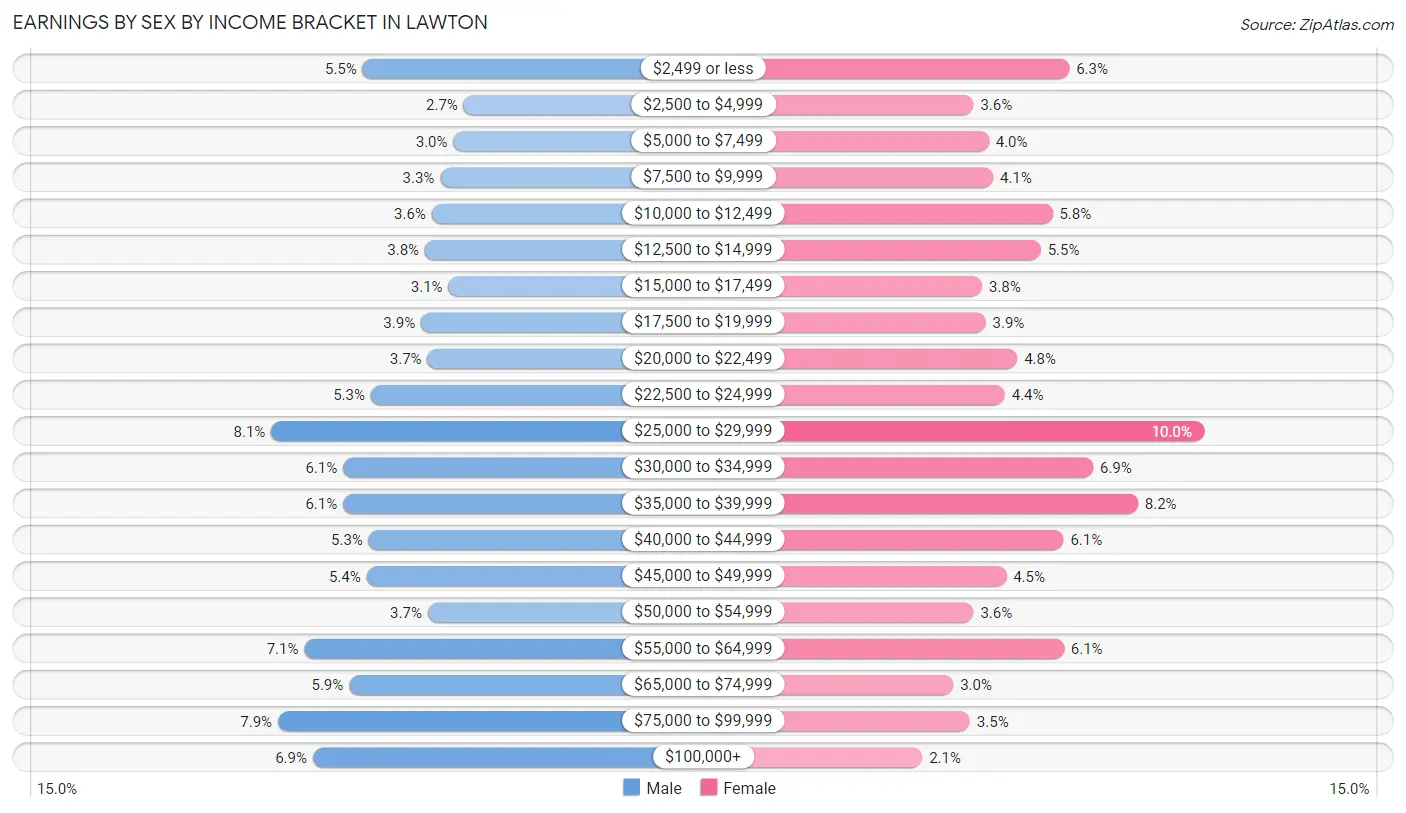
Earnings by Sex by Income Bracket in Lawton
The most common earnings brackets in Lawton are $25,000 to $29,999 for men (2,010 | 8.1%) and $25,000 to $29,999 for women (2,142 | 10.0%).
| Income | Male | Female |
| $2,499 or less | 1,370 (5.5%) | 1,335 (6.2%) |
| $2,500 to $4,999 | 663 (2.7%) | 761 (3.6%) |
| $5,000 to $7,499 | 735 (2.9%) | 852 (4.0%) |
| $7,500 to $9,999 | 826 (3.3%) | 878 (4.1%) |
| $10,000 to $12,499 | 886 (3.6%) | 1,235 (5.8%) |
| $12,500 to $14,999 | 934 (3.7%) | 1,164 (5.4%) |
| $15,000 to $17,499 | 769 (3.1%) | 811 (3.8%) |
| $17,500 to $19,999 | 960 (3.9%) | 833 (3.9%) |
| $20,000 to $22,499 | 915 (3.7%) | 1,024 (4.8%) |
| $22,500 to $24,999 | 1,312 (5.3%) | 949 (4.4%) |
| $25,000 to $29,999 | 2,010 (8.1%) | 2,142 (10.0%) |
| $30,000 to $34,999 | 1,505 (6.0%) | 1,477 (6.9%) |
| $35,000 to $39,999 | 1,507 (6.0%) | 1,746 (8.2%) |
| $40,000 to $44,999 | 1,328 (5.3%) | 1,301 (6.1%) |
| $45,000 to $49,999 | 1,341 (5.4%) | 956 (4.5%) |
| $50,000 to $54,999 | 913 (3.7%) | 760 (3.6%) |
| $55,000 to $64,999 | 1,777 (7.1%) | 1,303 (6.1%) |
| $65,000 to $74,999 | 1,464 (5.9%) | 638 (3.0%) |
| $75,000 to $99,999 | 1,961 (7.9%) | 738 (3.5%) |
| $100,000+ | 1,718 (6.9%) | 453 (2.1%) |
| Total | 24,894 (100.0%) | 21,356 (100.0%) |
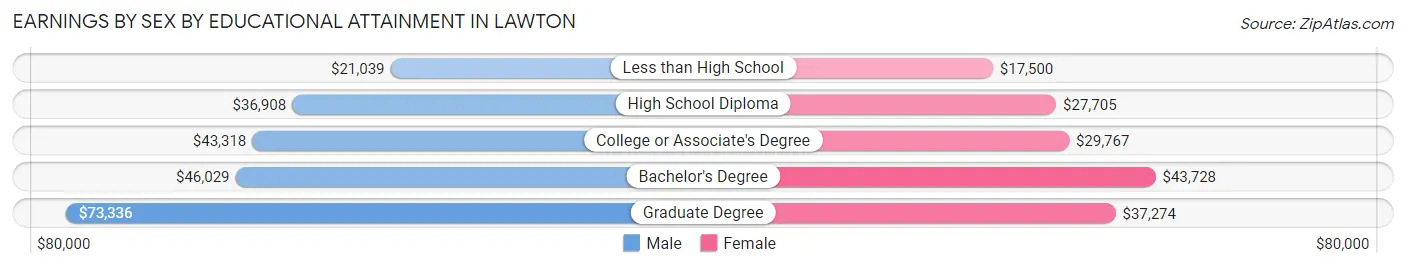
Earnings by Sex by Educational Attainment in Lawton
Average earnings in Lawton are $42,872 for men and $30,754 for women, a difference of 28.3%. Men with an educational attainment of graduate degree enjoy the highest average annual earnings of $73,336, while those with less than high school education earn the least with $21,039. Women with an educational attainment of bachelor's degree earn the most with the average annual earnings of $43,728, while those with less than high school education have the smallest earnings of $17,500.
| Educational Attainment | Male Income | Female Income |
| Less than High School | $21,039 | $17,500 |
| High School Diploma | $36,908 | $27,705 |
| College or Associate's Degree | $43,318 | $29,767 |
| Bachelor's Degree | $46,029 | $43,728 |
| Graduate Degree | $73,336 | $37,274 |
| Total | $42,872 | $30,754 |
Family Income in Lawton
Family Income Brackets in Lawton
According to the Lawton family income data, there are 4,049 families falling into the $50,000 to $74,999 income range, which is the most common income bracket and makes up 20.3% of all families. Conversely, the $10,000 to $14,999 income bracket is the least frequent group with only 598 families (3.0%) belonging to this category.
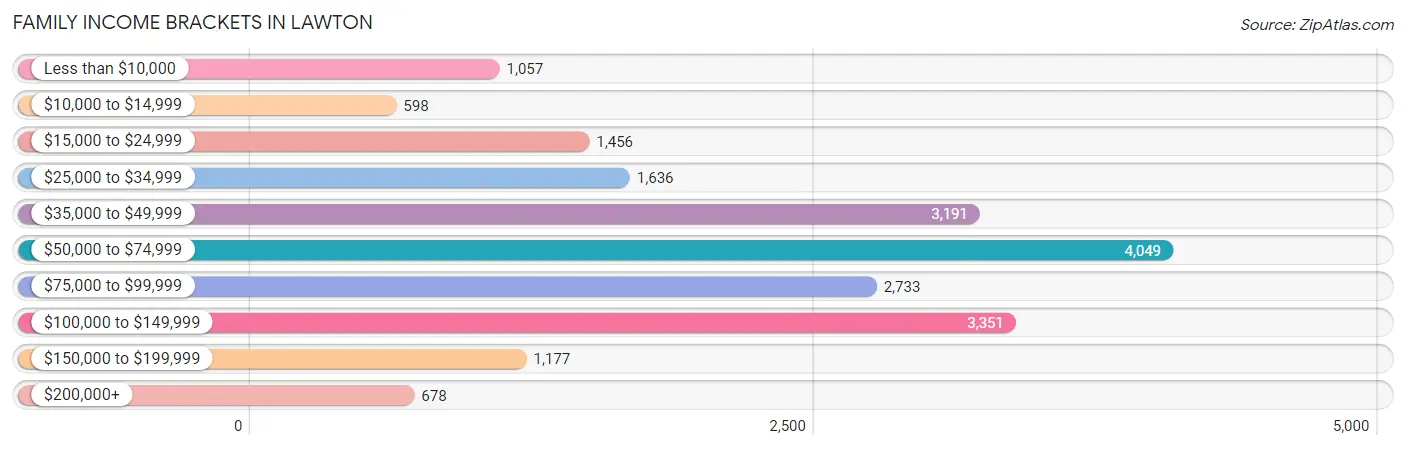
| Income Bracket | # Families | % Families |
| Less than $10,000 | 1,057 | 5.3% |
| $10,000 to $14,999 | 598 | 3.0% |
| $15,000 to $24,999 | 1,456 | 7.3% |
| $25,000 to $34,999 | 1,636 | 8.2% |
| $35,000 to $49,999 | 3,191 | 16.0% |
| $50,000 to $74,999 | 4,049 | 20.3% |
| $75,000 to $99,999 | 2,733 | 13.7% |
| $100,000 to $149,999 | 3,351 | 16.8% |
| $150,000 to $199,999 | 1,177 | 5.9% |
| $200,000+ | 678 | 3.4% |
Family Income by Famaliy Size in Lawton
7+ person families (296 | 1.5%) account for the highest median family income in Lawton with $84,912 per family, while 2-person families (9,698 | 48.6%) have the highest median income of $29,746 per family member.
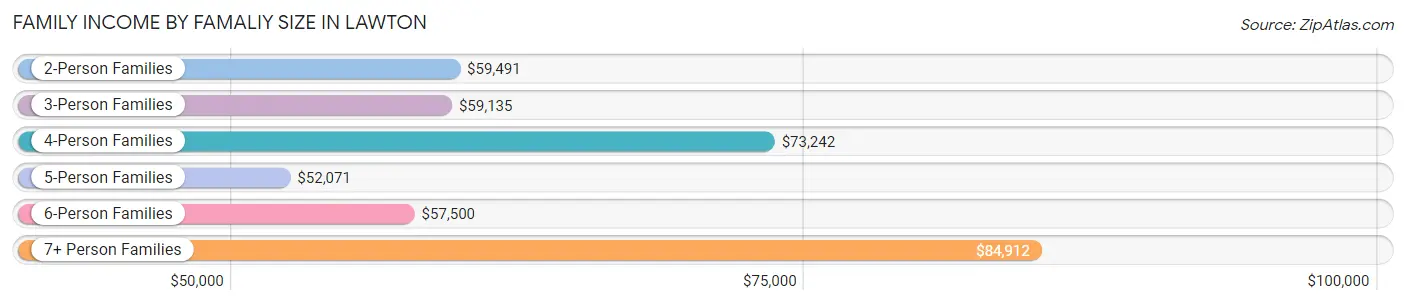
| Income Bracket | # Families | Median Income |
| 2-Person Families | 9,698 (48.6%) | $59,491 |
| 3-Person Families | 4,031 (20.2%) | $59,135 |
| 4-Person Families | 3,747 (18.8%) | $73,242 |
| 5-Person Families | 1,616 (8.1%) | $52,071 |
| 6-Person Families | 558 (2.8%) | $57,500 |
| 7+ Person Families | 296 (1.5%) | $84,912 |
| Total | 19,946 (100.0%) | $62,222 |
Family Income by Number of Earners in Lawton
The median family income in Lawton is $62,222, with families comprising 3+ earners (1,035) having the highest median family income of $117,821, while families with 1 earner (8,521) have the lowest median family income of $45,191, accounting for 5.2% and 42.7% of families, respectively.
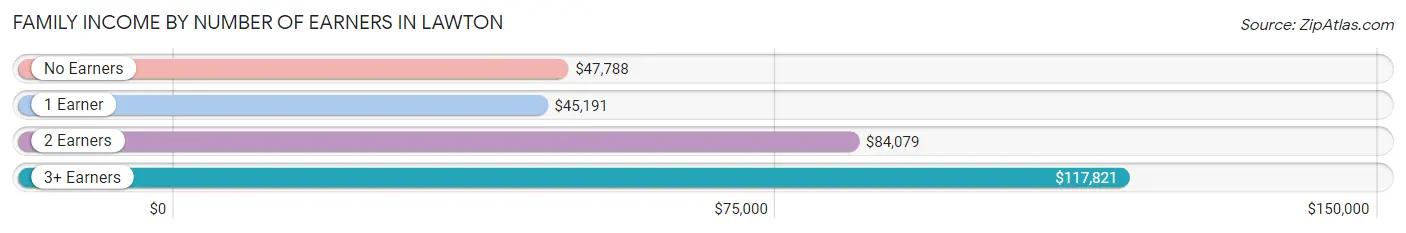
| Number of Earners | # Families | Median Income |
| No Earners | 3,124 (15.7%) | $47,788 |
| 1 Earner | 8,521 (42.7%) | $45,191 |
| 2 Earners | 7,266 (36.4%) | $84,079 |
| 3+ Earners | 1,035 (5.2%) | $117,821 |
| Total | 19,946 (100.0%) | $62,222 |
Household Income in Lawton
Household Income Brackets in Lawton
With 6,695 households falling in the category, the $50,000 to $74,999 income range is the most frequent in Lawton, accounting for 20.2% of all households. In contrast, only 1,061 households (3.2%) fall into the $200,000+ income bracket, making it the least populous group.
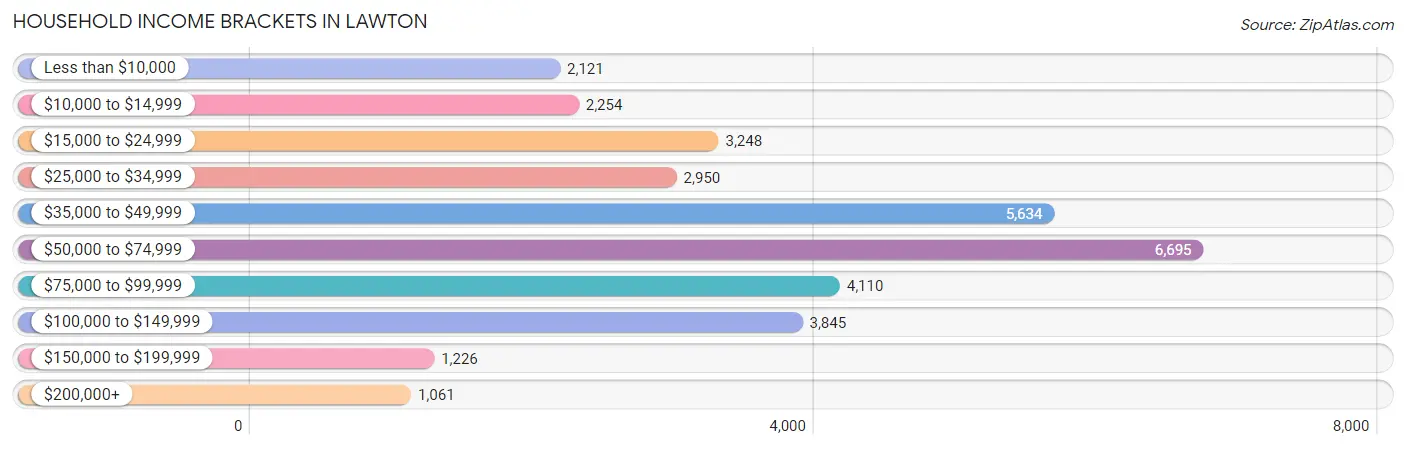
| Income Bracket | # Households | % Households |
| Less than $10,000 | 2,121 | 6.4% |
| $10,000 to $14,999 | 2,254 | 6.8% |
| $15,000 to $24,999 | 3,248 | 9.8% |
| $25,000 to $34,999 | 2,950 | 8.9% |
| $35,000 to $49,999 | 5,634 | 17.0% |
| $50,000 to $74,999 | 6,695 | 20.2% |
| $75,000 to $99,999 | 4,110 | 12.4% |
| $100,000 to $149,999 | 3,845 | 11.6% |
| $150,000 to $199,999 | 1,226 | 3.7% |
| $200,000+ | 1,061 | 3.2% |
Household Income by Householder Age in Lawton
The median household income in Lawton is $51,561, with the highest median household income of $59,178 found in the 45 to 64 years age bracket for the primary householder. A total of 10,760 households (32.5%) fall into this category. Meanwhile, the 15 to 24 years age bracket for the primary householder has the lowest median household income of $41,140, with 2,859 households (8.6%) in this group.
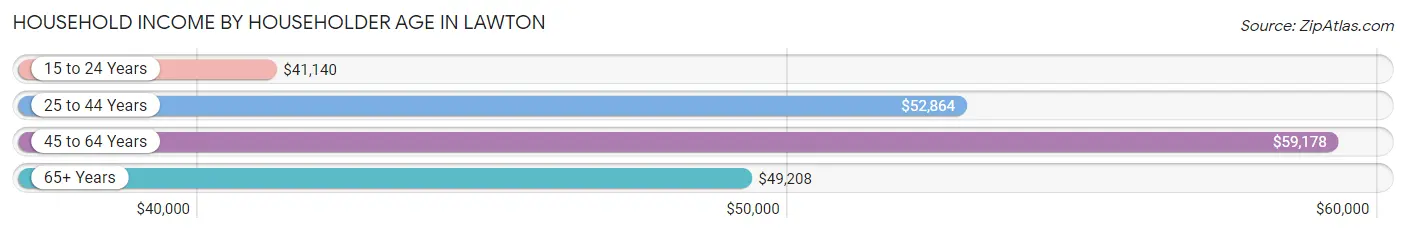
| Income Bracket | # Households | Median Income |
| 15 to 24 Years | 2,859 (8.6%) | $41,140 |
| 25 to 44 Years | 12,869 (38.8%) | $52,864 |
| 45 to 64 Years | 10,760 (32.5%) | $59,178 |
| 65+ Years | 6,656 (20.1%) | $49,208 |
| Total | 33,144 (100.0%) | $51,561 |
Poverty in Lawton
Income Below Poverty by Sex and Age in Lawton
With 19.0% poverty level for males and 19.8% for females among the residents of Lawton, 12 to 14 year old males and 5 year old females are the most vulnerable to poverty, with 464 males (30.7%) and 296 females (40.1%) in their respective age groups living below the poverty level.
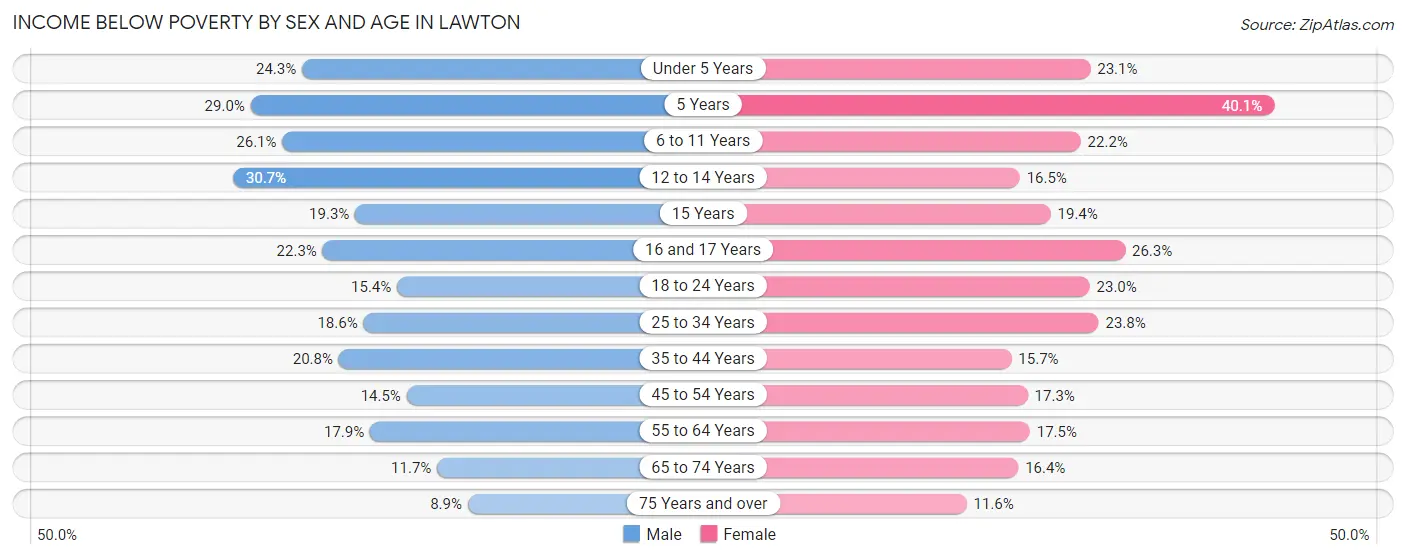
| Age Bracket | Male | Female |
| Under 5 Years | 782 (24.2%) | 706 (23.1%) |
| 5 Years | 184 (29.0%) | 296 (40.1%) |
| 6 to 11 Years | 902 (26.1%) | 688 (22.2%) |
| 12 to 14 Years | 464 (30.7%) | 306 (16.5%) |
| 15 Years | 79 (19.3%) | 88 (19.4%) |
| 16 and 17 Years | 216 (22.3%) | 245 (26.3%) |
| 18 to 24 Years | 689 (15.4%) | 893 (23.0%) |
| 25 to 34 Years | 1,275 (18.5%) | 1,706 (23.8%) |
| 35 to 44 Years | 1,116 (20.8%) | 853 (15.7%) |
| 45 to 54 Years | 599 (14.5%) | 740 (17.2%) |
| 55 to 64 Years | 820 (17.9%) | 861 (17.4%) |
| 65 to 74 Years | 330 (11.7%) | 560 (16.4%) |
| 75 Years and over | 135 (8.9%) | 260 (11.6%) |
| Total | 7,591 (19.0%) | 8,202 (19.8%) |
Income Above Poverty by Sex and Age in Lawton
According to the poverty statistics in Lawton, males aged 75 years and over and females aged 75 years and over are the age groups that are most secure financially, with 91.1% of males and 88.4% of females in these age groups living above the poverty line.
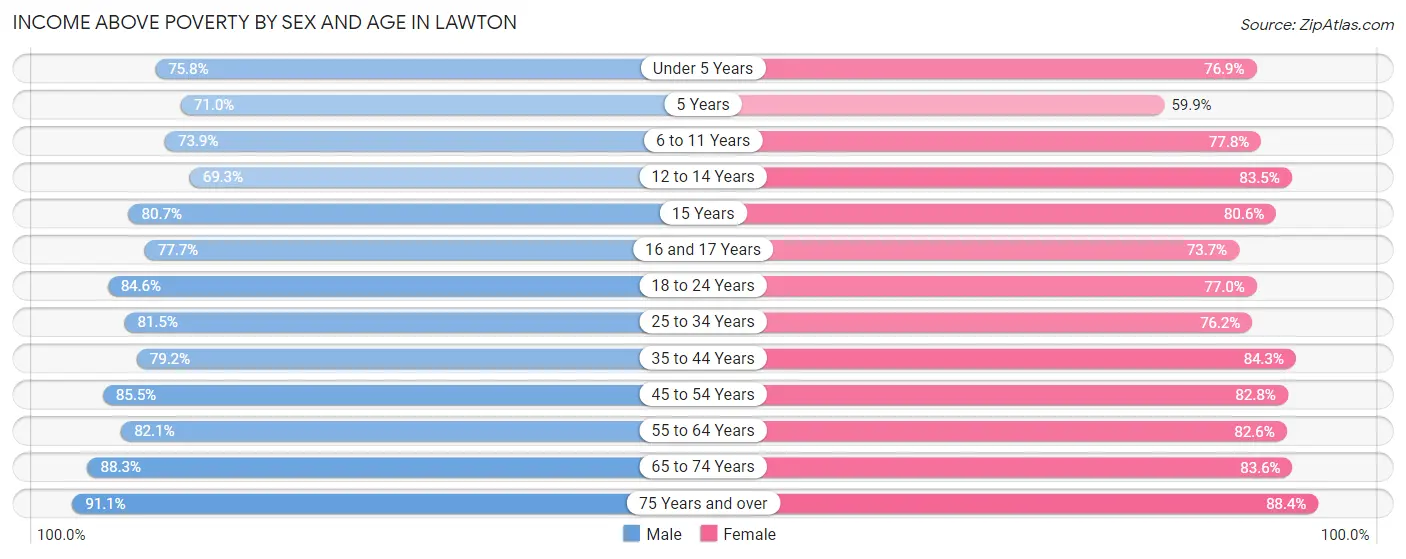
| Age Bracket | Male | Female |
| Under 5 Years | 2,443 (75.7%) | 2,356 (76.9%) |
| 5 Years | 450 (71.0%) | 442 (59.9%) |
| 6 to 11 Years | 2,556 (73.9%) | 2,415 (77.8%) |
| 12 to 14 Years | 1,049 (69.3%) | 1,547 (83.5%) |
| 15 Years | 330 (80.7%) | 366 (80.6%) |
| 16 and 17 Years | 751 (77.7%) | 687 (73.7%) |
| 18 to 24 Years | 3,775 (84.6%) | 2,990 (77.0%) |
| 25 to 34 Years | 5,599 (81.5%) | 5,452 (76.2%) |
| 35 to 44 Years | 4,238 (79.2%) | 4,565 (84.3%) |
| 45 to 54 Years | 3,522 (85.5%) | 3,551 (82.8%) |
| 55 to 64 Years | 3,752 (82.1%) | 4,072 (82.6%) |
| 65 to 74 Years | 2,489 (88.3%) | 2,860 (83.6%) |
| 75 Years and over | 1,387 (91.1%) | 1,986 (88.4%) |
| Total | 32,341 (81.0%) | 33,289 (80.2%) |
Income Below Poverty Among Married-Couple Families in Lawton
The poverty statistics for married-couple families in Lawton show that 6.5% or 798 of the total 12,297 families live below the poverty line. Families with 3 or 4 children have the highest poverty rate of 14.0%, comprising of 174 families. On the other hand, families with no children have the lowest poverty rate of 3.6%, which includes 239 families.
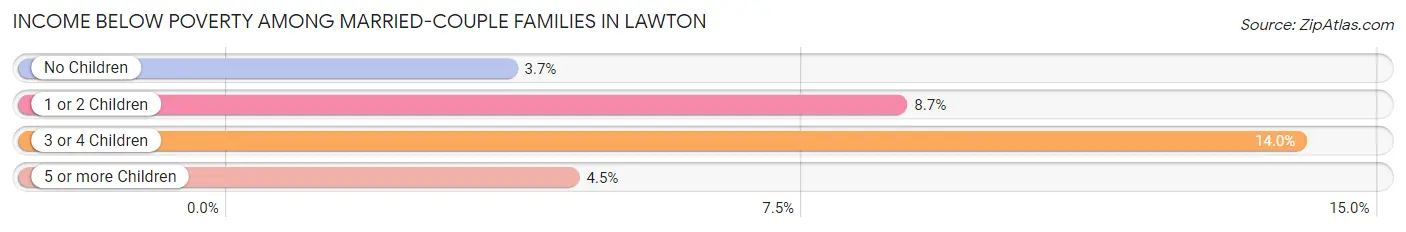
| Children | Above Poverty | Below Poverty |
| No Children | 6,306 (96.4%) | 239 (3.6%) |
| 1 or 2 Children | 3,928 (91.3%) | 376 (8.7%) |
| 3 or 4 Children | 1,072 (86.0%) | 174 (14.0%) |
| 5 or more Children | 193 (95.5%) | 9 (4.5%) |
| Total | 11,499 (93.5%) | 798 (6.5%) |
Income Below Poverty Among Single-Parent Households in Lawton
According to the poverty data in Lawton, 17.0% or 342 single-father households and 32.2% or 1,813 single-mother households are living below the poverty line. Among single-father households, those with 3 or 4 children have the highest poverty rate, with 46 households (30.5%) experiencing poverty. Likewise, among single-mother households, those with 5 or more children have the highest poverty rate, with 28 households (100.0%) falling below the poverty line.
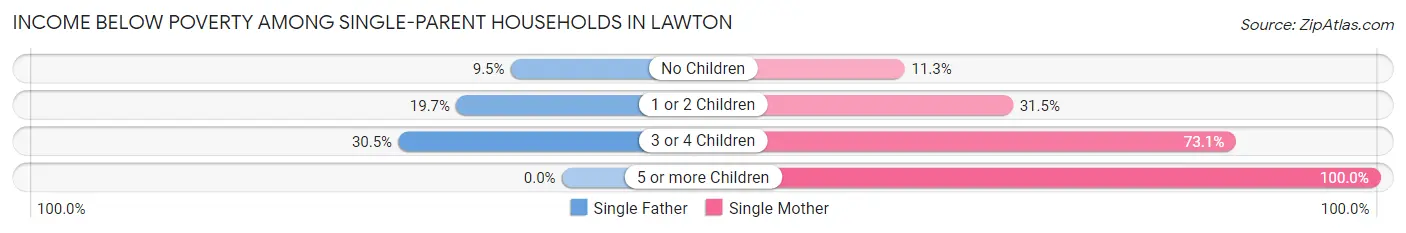
| Children | Single Father | Single Mother |
| No Children | 66 (9.5%) | 163 (11.3%) |
| 1 or 2 Children | 230 (19.7%) | 1,079 (31.5%) |
| 3 or 4 Children | 46 (30.5%) | 543 (73.1%) |
| 5 or more Children | 0 (0.0%) | 28 (100.0%) |
| Total | 342 (17.0%) | 1,813 (32.2%) |
Income Below Poverty Among Married-Couple vs Single-Parent Households in Lawton
The poverty data for Lawton shows that 798 of the married-couple family households (6.5%) and 2,155 of the single-parent households (28.2%) are living below the poverty level. Within the married-couple family households, those with 3 or 4 children have the highest poverty rate, with 174 households (14.0%) falling below the poverty line. Among the single-parent households, those with 5 or more children have the highest poverty rate, with 28 household (100.0%) living below poverty.
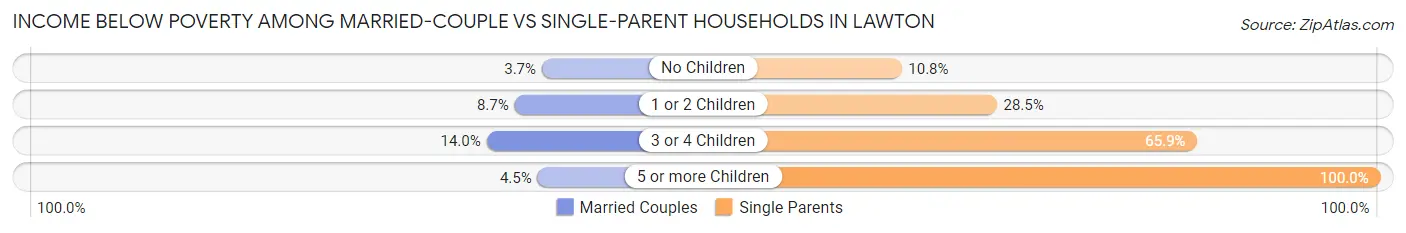
| Children | Married-Couple Families | Single-Parent Households |
| No Children | 239 (3.6%) | 229 (10.7%) |
| 1 or 2 Children | 376 (8.7%) | 1,309 (28.5%) |
| 3 or 4 Children | 174 (14.0%) | 589 (65.9%) |
| 5 or more Children | 9 (4.5%) | 28 (100.0%) |
| Total | 798 (6.5%) | 2,155 (28.2%) |
Race in Lawton
The most populous races in Lawton are White / Caucasian (49,220 | 54.1%), Black / African American (17,620 | 19.4%), and Hispanic or Latino (14,561 | 16.0%).
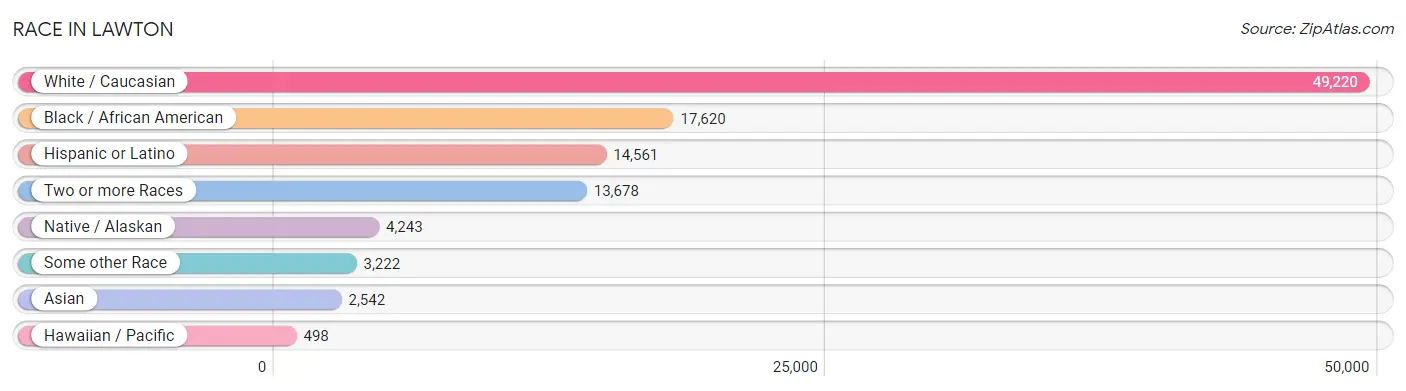
| Race | # Population | % Population |
| Asian | 2,542 | 2.8% |
| Black / African American | 17,620 | 19.4% |
| Hawaiian / Pacific | 498 | 0.5% |
| Hispanic or Latino | 14,561 | 16.0% |
| Native / Alaskan | 4,243 | 4.7% |
| White / Caucasian | 49,220 | 54.1% |
| Two or more Races | 13,678 | 15.0% |
| Some other Race | 3,222 | 3.5% |
| Total | 91,023 | 100.0% |
Ancestry in Lawton
The most populous ancestries reported in Lawton are German (11,465 | 12.6%), Mexican (9,149 | 10.1%), Irish (7,962 | 8.7%), American (5,944 | 6.5%), and English (5,353 | 5.9%), together accounting for 43.8% of all Lawton residents.
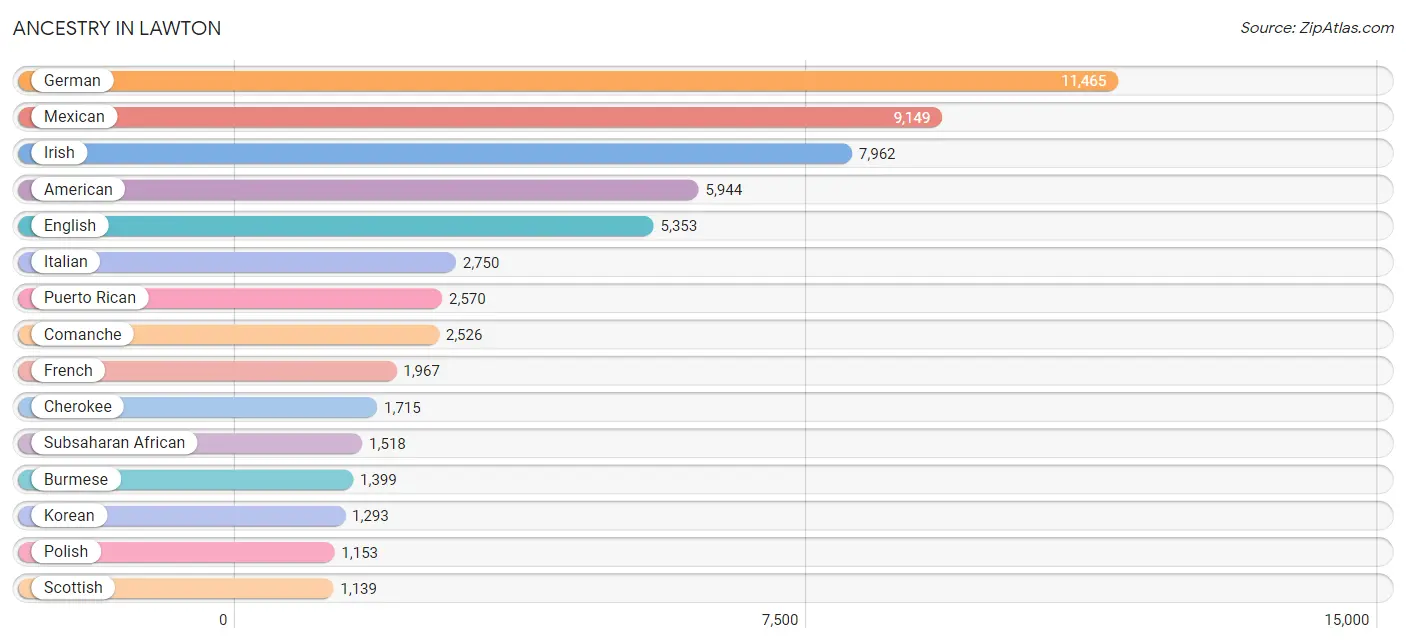
| Ancestry | # Population | % Population |
| African | 821 | 0.9% |
| Alaska Native | 32 | 0.0% |
| Albanian | 9 | 0.0% |
| Aleut | 2 | 0.0% |
| American | 5,944 | 6.5% |
| Apache | 422 | 0.5% |
| Arab | 191 | 0.2% |
| Arapaho | 143 | 0.2% |
| Argentinean | 20 | 0.0% |
| Australian | 18 | 0.0% |
| Austrian | 81 | 0.1% |
| Bangladeshi | 12 | 0.0% |
| Belgian | 49 | 0.1% |
| Bhutanese | 483 | 0.5% |
| Blackfeet | 155 | 0.2% |
| Bolivian | 11 | 0.0% |
| Brazilian | 12 | 0.0% |
| British | 416 | 0.5% |
| British West Indian | 35 | 0.0% |
| Burmese | 1,399 | 1.5% |
| Cajun | 79 | 0.1% |
| Canadian | 132 | 0.2% |
| Cape Verdean | 134 | 0.2% |
| Central American | 1,130 | 1.2% |
| Central American Indian | 196 | 0.2% |
| Cherokee | 1,715 | 1.9% |
| Cheyenne | 80 | 0.1% |
| Chickasaw | 612 | 0.7% |
| Chilean | 56 | 0.1% |
| Chippewa | 43 | 0.1% |
| Choctaw | 872 | 1.0% |
| Colombian | 101 | 0.1% |
| Comanche | 2,526 | 2.8% |
| Cree | 26 | 0.0% |
| Creek | 475 | 0.5% |
| Croatian | 26 | 0.0% |
| Crow | 14 | 0.0% |
| Cuban | 82 | 0.1% |
| Czech | 238 | 0.3% |
| Czechoslovakian | 90 | 0.1% |
| Danish | 124 | 0.1% |
| Delaware | 95 | 0.1% |
| Dominican | 196 | 0.2% |
| Dutch | 666 | 0.7% |
| Dutch West Indian | 100 | 0.1% |
| Eastern European | 87 | 0.1% |
| Egyptian | 10 | 0.0% |
| English | 5,353 | 5.9% |
| Ethiopian | 23 | 0.0% |
| European | 1,107 | 1.2% |
| Filipino | 15 | 0.0% |
| Finnish | 54 | 0.1% |
| French | 1,967 | 2.2% |
| French American Indian | 12 | 0.0% |
| French Canadian | 396 | 0.4% |
| German | 11,465 | 12.6% |
| German Russian | 11 | 0.0% |
| Ghanaian | 21 | 0.0% |
| Greek | 118 | 0.1% |
| Guamanian / Chamorro | 108 | 0.1% |
| Guatemalan | 164 | 0.2% |
| Haitian | 69 | 0.1% |
| Honduran | 96 | 0.1% |
| Houma | 119 | 0.1% |
| Hungarian | 92 | 0.1% |
| Indian (Asian) | 467 | 0.5% |
| Indonesian | 3 | 0.0% |
| Inupiat | 8 | 0.0% |
| Iranian | 8 | 0.0% |
| Irish | 7,962 | 8.7% |
| Iroquois | 131 | 0.1% |
| Italian | 2,750 | 3.0% |
| Jamaican | 984 | 1.1% |
| Japanese | 18 | 0.0% |
| Jordanian | 63 | 0.1% |
| Kenyan | 169 | 0.2% |
| Kiowa | 1,013 | 1.1% |
| Korean | 1,293 | 1.4% |
| Lebanese | 39 | 0.0% |
| Lithuanian | 10 | 0.0% |
| Mexican | 9,149 | 10.1% |
| Mexican American Indian | 95 | 0.1% |
| Mongolian | 5 | 0.0% |
| Native Hawaiian | 563 | 0.6% |
| Navajo | 77 | 0.1% |
| Nicaraguan | 59 | 0.1% |
| Nigerian | 210 | 0.2% |
| Northern European | 84 | 0.1% |
| Norwegian | 630 | 0.7% |
| Ottawa | 28 | 0.0% |
| Pakistani | 76 | 0.1% |
| Panamanian | 536 | 0.6% |
| Pennsylvania German | 36 | 0.0% |
| Peruvian | 3 | 0.0% |
| Polish | 1,153 | 1.3% |
| Portuguese | 189 | 0.2% |
| Potawatomi | 43 | 0.1% |
| Pueblo | 17 | 0.0% |
| Puerto Rican | 2,570 | 2.8% |
| Romanian | 117 | 0.1% |
| Russian | 469 | 0.5% |
| Salvadoran | 226 | 0.3% |
| Samoan | 273 | 0.3% |
| Scandinavian | 232 | 0.3% |
| Scotch-Irish | 620 | 0.7% |
| Scottish | 1,139 | 1.3% |
| Seminole | 80 | 0.1% |
| Serbian | 18 | 0.0% |
| Shoshone | 12 | 0.0% |
| Sioux | 192 | 0.2% |
| Slovak | 11 | 0.0% |
| South African | 80 | 0.1% |
| South American | 254 | 0.3% |
| Spaniard | 337 | 0.4% |
| Spanish | 245 | 0.3% |
| Sri Lankan | 491 | 0.5% |
| Subsaharan African | 1,518 | 1.7% |
| Swedish | 301 | 0.3% |
| Swiss | 78 | 0.1% |
| Syrian | 67 | 0.1% |
| Thai | 283 | 0.3% |
| Tlingit-Haida | 13 | 0.0% |
| Trinidadian and Tobagonian | 12 | 0.0% |
| Turkish | 54 | 0.1% |
| Ukrainian | 44 | 0.1% |
| Venezuelan | 63 | 0.1% |
| Welsh | 451 | 0.5% |
| West Indian | 24 | 0.0% |
| Yugoslavian | 21 | 0.0% |
| Zimbabwean | 18 | 0.0% | View All 130 Rows |
Immigrants in Lawton
The most numerous immigrant groups reported in Lawton came from Asia (1,823 | 2.0%), Latin America (1,526 | 1.7%), Europe (1,435 | 1.6%), Western Europe (1,058 | 1.2%), and Central America (1,027 | 1.1%), together accounting for 7.6% of all Lawton residents.
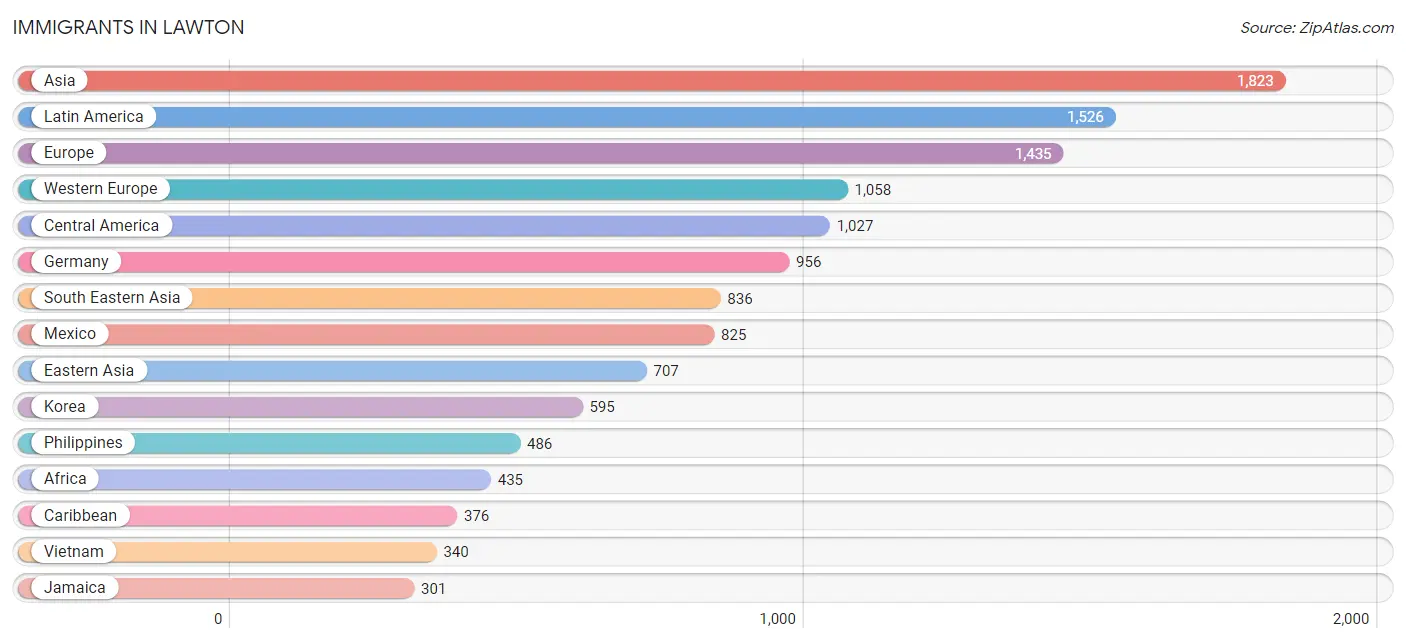
| Immigration Origin | # Population | % Population |
| Afghanistan | 17 | 0.0% |
| Africa | 435 | 0.5% |
| Albania | 9 | 0.0% |
| Asia | 1,823 | 2.0% |
| Australia | 10 | 0.0% |
| Austria | 19 | 0.0% |
| Belarus | 7 | 0.0% |
| Cabo Verde | 129 | 0.1% |
| Canada | 87 | 0.1% |
| Caribbean | 376 | 0.4% |
| Central America | 1,027 | 1.1% |
| Chile | 26 | 0.0% |
| China | 44 | 0.1% |
| Colombia | 49 | 0.1% |
| Cuba | 24 | 0.0% |
| Dominica | 5 | 0.0% |
| Dominican Republic | 4 | 0.0% |
| Eastern Africa | 131 | 0.1% |
| Eastern Asia | 707 | 0.8% |
| Eastern Europe | 248 | 0.3% |
| Egypt | 10 | 0.0% |
| El Salvador | 9 | 0.0% |
| England | 8 | 0.0% |
| Ethiopia | 50 | 0.1% |
| Europe | 1,435 | 1.6% |
| France | 57 | 0.1% |
| Germany | 956 | 1.1% |
| Ghana | 21 | 0.0% |
| Greece | 20 | 0.0% |
| Grenada | 7 | 0.0% |
| Guatemala | 28 | 0.0% |
| Honduras | 8 | 0.0% |
| Hong Kong | 7 | 0.0% |
| Hungary | 41 | 0.1% |
| India | 92 | 0.1% |
| Italy | 77 | 0.1% |
| Jamaica | 301 | 0.3% |
| Japan | 68 | 0.1% |
| Jordan | 1 | 0.0% |
| Kenya | 57 | 0.1% |
| Korea | 595 | 0.6% |
| Latin America | 1,526 | 1.7% |
| Lebanon | 18 | 0.0% |
| Liberia | 11 | 0.0% |
| Mexico | 825 | 0.9% |
| Micronesia | 41 | 0.1% |
| Moldova | 9 | 0.0% |
| Morocco | 3 | 0.0% |
| Nepal | 74 | 0.1% |
| Netherlands | 26 | 0.0% |
| Nigeria | 113 | 0.1% |
| Northern Africa | 13 | 0.0% |
| Northern Europe | 9 | 0.0% |
| Oceania | 107 | 0.1% |
| Pakistan | 56 | 0.1% |
| Panama | 157 | 0.2% |
| Philippines | 486 | 0.5% |
| Poland | 70 | 0.1% |
| Romania | 29 | 0.0% |
| Russia | 66 | 0.1% |
| Saudi Arabia | 10 | 0.0% |
| South America | 123 | 0.1% |
| South Central Asia | 239 | 0.3% |
| South Eastern Asia | 836 | 0.9% |
| Southern Europe | 106 | 0.1% |
| Spain | 9 | 0.0% |
| Taiwan | 15 | 0.0% |
| Thailand | 10 | 0.0% |
| Trinidad and Tobago | 18 | 0.0% |
| Turkey | 12 | 0.0% |
| Ukraine | 8 | 0.0% |
| Venezuela | 36 | 0.0% |
| Vietnam | 340 | 0.4% |
| Western Africa | 290 | 0.3% |
| Western Asia | 41 | 0.1% |
| Western Europe | 1,058 | 1.2% |
| Zimbabwe | 18 | 0.0% | View All 77 Rows |
Sex and Age in Lawton
Sex and Age in Lawton
The most populous age groups in Lawton are 20 to 24 Years (5,500 | 11.5%) for men and 25 to 29 Years (3,900 | 9.0%) for women.
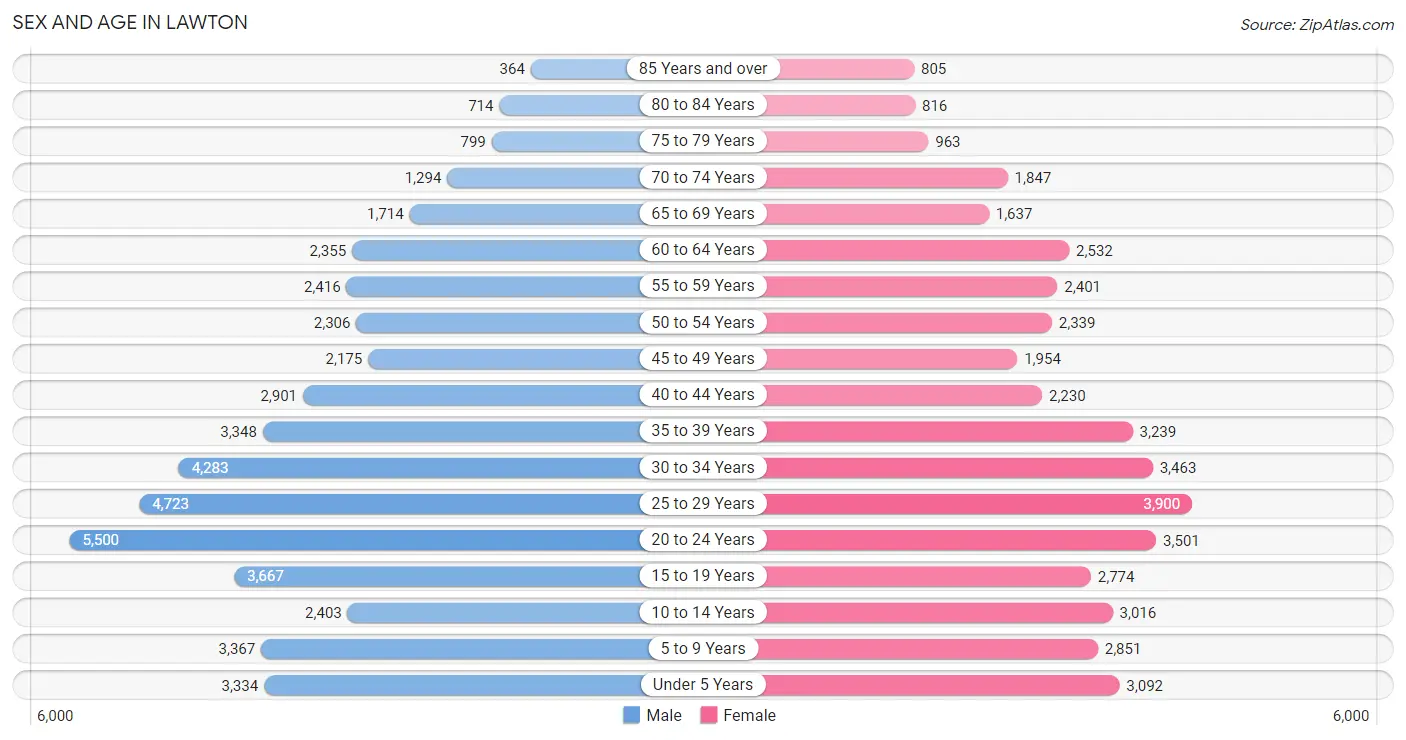
| Age Bracket | Male | Female |
| Under 5 Years | 3,334 (7.0%) | 3,092 (7.1%) |
| 5 to 9 Years | 3,367 (7.1%) | 2,851 (6.6%) |
| 10 to 14 Years | 2,403 (5.0%) | 3,016 (7.0%) |
| 15 to 19 Years | 3,667 (7.7%) | 2,774 (6.4%) |
| 20 to 24 Years | 5,500 (11.5%) | 3,501 (8.1%) |
| 25 to 29 Years | 4,723 (9.9%) | 3,900 (9.0%) |
| 30 to 34 Years | 4,283 (9.0%) | 3,463 (8.0%) |
| 35 to 39 Years | 3,348 (7.0%) | 3,239 (7.5%) |
| 40 to 44 Years | 2,901 (6.1%) | 2,230 (5.1%) |
| 45 to 49 Years | 2,175 (4.6%) | 1,954 (4.5%) |
| 50 to 54 Years | 2,306 (4.8%) | 2,339 (5.4%) |
| 55 to 59 Years | 2,416 (5.1%) | 2,401 (5.5%) |
| 60 to 64 Years | 2,355 (4.9%) | 2,532 (5.8%) |
| 65 to 69 Years | 1,714 (3.6%) | 1,637 (3.8%) |
| 70 to 74 Years | 1,294 (2.7%) | 1,847 (4.3%) |
| 75 to 79 Years | 799 (1.7%) | 963 (2.2%) |
| 80 to 84 Years | 714 (1.5%) | 816 (1.9%) |
| 85 Years and over | 364 (0.8%) | 805 (1.9%) |
| Total | 47,663 (100.0%) | 43,360 (100.0%) |
Families and Households in Lawton
Median Family Size in Lawton
The median family size in Lawton is 3.13 persons per family, with married-couple families (12,297 | 61.7%) accounting for the largest median family size of 3.24 persons per family. On the other hand, single male/father families (2,013 | 10.1%) represent the smallest median family size with 2.77 persons per family.
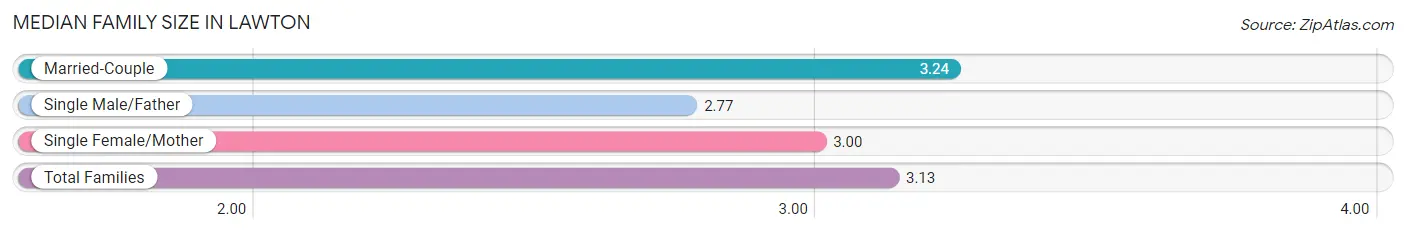
| Family Type | # Families | Family Size |
| Married-Couple | 12,297 (61.7%) | 3.24 |
| Single Male/Father | 2,013 (10.1%) | 2.77 |
| Single Female/Mother | 5,636 (28.3%) | 3.00 |
| Total Families | 19,946 (100.0%) | 3.13 |
Median Household Size in Lawton
The median household size in Lawton is 2.47 persons per household, with single female/mother households (5,636 | 17.0%) accounting for the largest median household size of 3.31 persons per household. non-family households (13,198 | 39.8%) represent the smallest median household size with 1.24 persons per household.
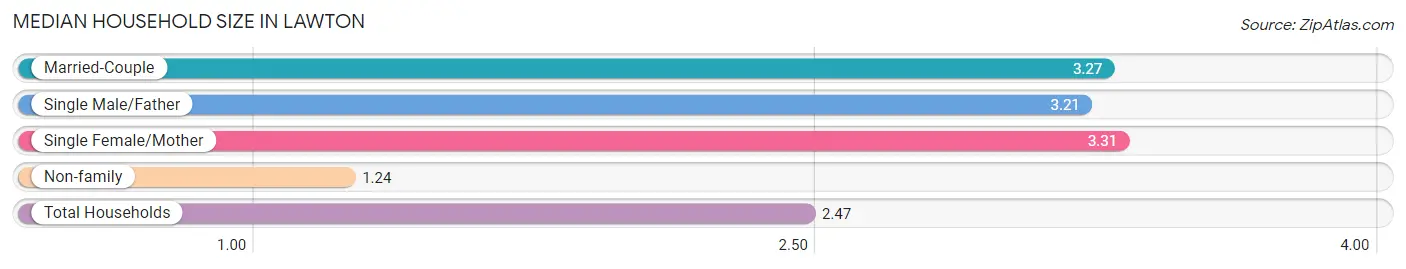
| Household Type | # Households | Household Size |
| Married-Couple | 12,297 (37.1%) | 3.27 |
| Single Male/Father | 2,013 (6.1%) | 3.21 |
| Single Female/Mother | 5,636 (17.0%) | 3.31 |
| Non-family | 13,198 (39.8%) | 1.24 |
| Total Households | 33,144 (100.0%) | 2.47 |
Household Size by Marriage Status in Lawton
Out of a total of 33,144 households in Lawton, 19,946 (60.2%) are family households, while 13,198 (39.8%) are nonfamily households. The most numerous type of family households are 2-person households, comprising 8,644, and the most common type of nonfamily households are 1-person households, comprising 11,159.
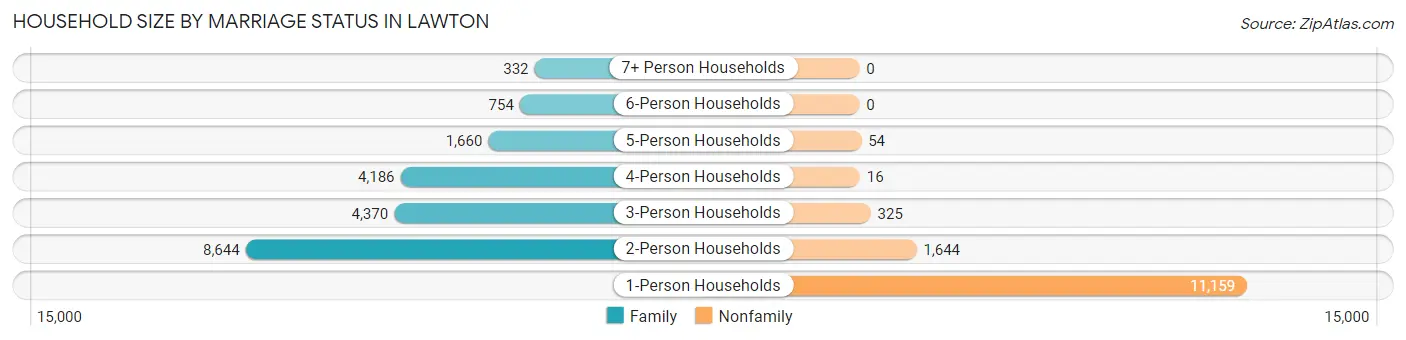
| Household Size | Family Households | Nonfamily Households |
| 1-Person Households | - | 11,159 (33.7%) |
| 2-Person Households | 8,644 (26.1%) | 1,644 (5.0%) |
| 3-Person Households | 4,370 (13.2%) | 325 (1.0%) |
| 4-Person Households | 4,186 (12.6%) | 16 (0.1%) |
| 5-Person Households | 1,660 (5.0%) | 54 (0.2%) |
| 6-Person Households | 754 (2.3%) | 0 (0.0%) |
| 7+ Person Households | 332 (1.0%) | 0 (0.0%) |
| Total | 19,946 (60.2%) | 13,198 (39.8%) |
Female Fertility in Lawton
Fertility by Age in Lawton
Average fertility rate in Lawton is 63.0 births per 1,000 women. Women in the age bracket of 20 to 34 years have the highest fertility rate with 113.0 births per 1,000 women. Women in the age bracket of 20 to 34 years acount for 89.8% of all women with births.
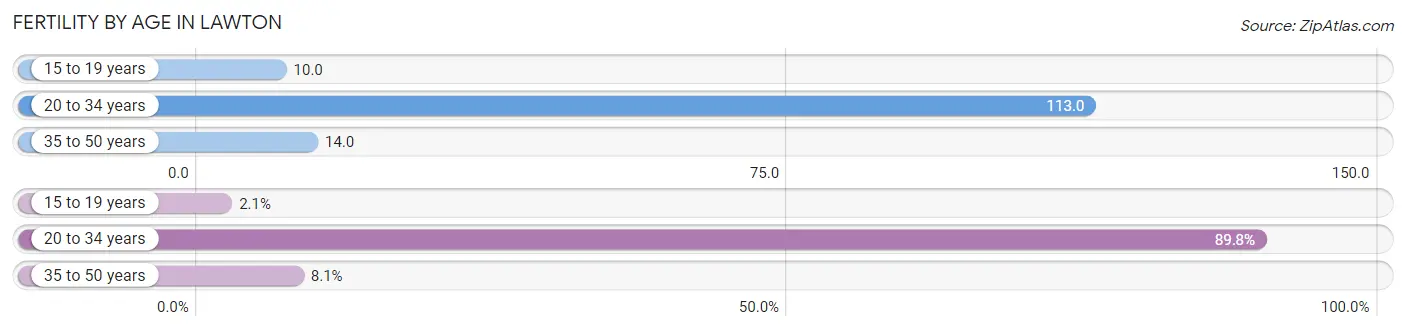
| Age Bracket | Women with Births | Births / 1,000 Women |
| 15 to 19 years | 28 (2.1%) | 10.0 |
| 20 to 34 years | 1,227 (89.8%) | 113.0 |
| 35 to 50 years | 111 (8.1%) | 14.0 |
| Total | 1,366 (100.0%) | 63.0 |
Fertility by Age by Marriage Status in Lawton
53.4% of women with births (1,366) in Lawton are married. The highest percentage of unmarried women with births falls into 15 to 19 years age bracket with 100.0% of them unmarried at the time of birth, while the lowest percentage of unmarried women with births belong to 35 to 50 years age bracket with 36.0% of them unmarried.
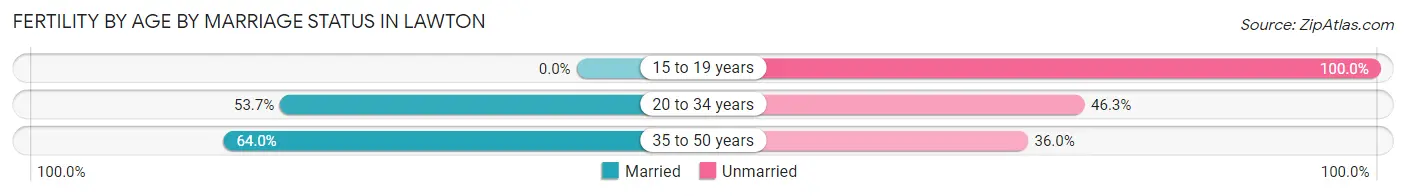
| Age Bracket | Married | Unmarried |
| 15 to 19 years | 0 (0.0%) | 28 (100.0%) |
| 20 to 34 years | 659 (53.7%) | 568 (46.3%) |
| 35 to 50 years | 71 (64.0%) | 40 (36.0%) |
| Total | 729 (53.4%) | 637 (46.6%) |
Fertility by Education in Lawton
Average fertility rate in Lawton is 63.0 births per 1,000 women. Women with the education attainment of high school diploma have the highest fertility rate of 77.0 births per 1,000 women, while women with the education attainment of less than high school have the lowest fertility at 25.0 births per 1,000 women. Women with the education attainment of college or associate's degree represent 37.9% of all women with births.
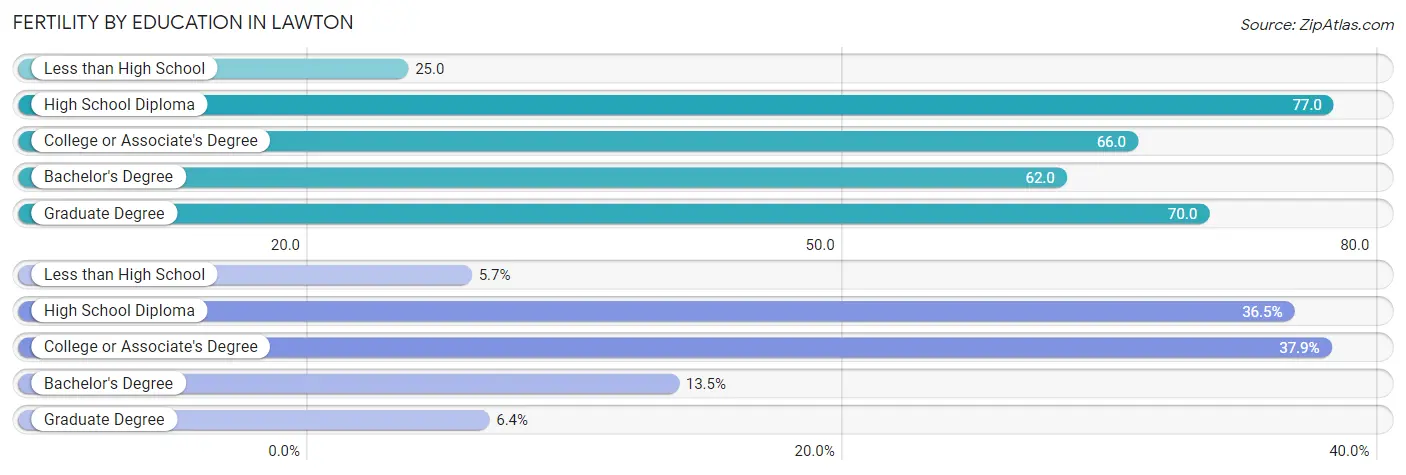
| Educational Attainment | Women with Births | Births / 1,000 Women |
| Less than High School | 78 (5.7%) | 25.0 |
| High School Diploma | 499 (36.5%) | 77.0 |
| College or Associate's Degree | 518 (37.9%) | 66.0 |
| Bachelor's Degree | 184 (13.5%) | 62.0 |
| Graduate Degree | 87 (6.4%) | 70.0 |
| Total | 1,366 (100.0%) | 63.0 |
Fertility by Education by Marriage Status in Lawton
46.6% of women with births in Lawton are unmarried. Women with the educational attainment of bachelor's degree are most likely to be married with 92.4% of them married at childbirth, while women with the educational attainment of college or associate's degree are least likely to be married with 59.9% of them unmarried at childbirth.
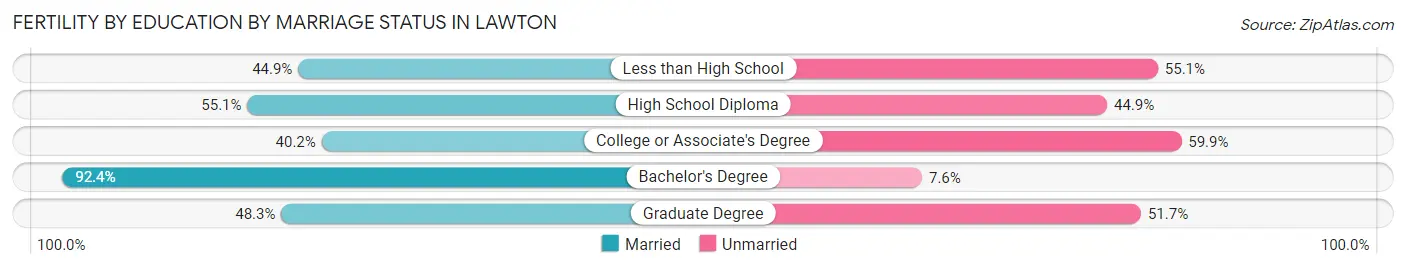
| Educational Attainment | Married | Unmarried |
| Less than High School | 35 (44.9%) | 43 (55.1%) |
| High School Diploma | 275 (55.1%) | 224 (44.9%) |
| College or Associate's Degree | 208 (40.2%) | 310 (59.9%) |
| Bachelor's Degree | 170 (92.4%) | 14 (7.6%) |
| Graduate Degree | 42 (48.3%) | 45 (51.7%) |
| Total | 729 (53.4%) | 637 (46.6%) |
Employment Characteristics in Lawton
Employment by Class of Employer in Lawton
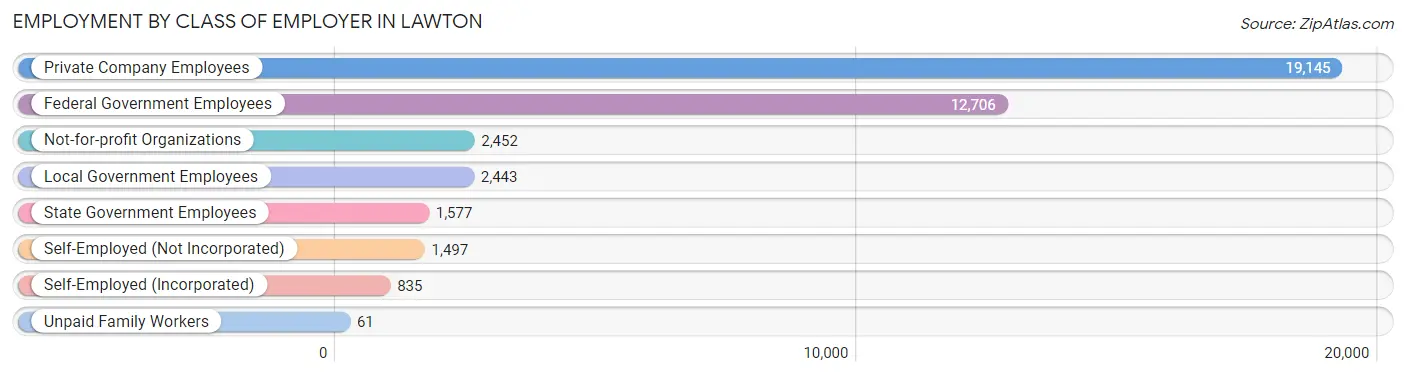
Among the 40,716 employed individuals in Lawton, private company employees (19,145 | 47.0%), federal government employees (12,706 | 31.2%), and not-for-profit organizations (2,452 | 6.0%) make up the most common classes of employment.
| Employer Class | # Employees | % Employees |
| Private Company Employees | 19,145 | 47.0% |
| Self-Employed (Incorporated) | 835 | 2.1% |
| Self-Employed (Not Incorporated) | 1,497 | 3.7% |
| Not-for-profit Organizations | 2,452 | 6.0% |
| Local Government Employees | 2,443 | 6.0% |
| State Government Employees | 1,577 | 3.9% |
| Federal Government Employees | 12,706 | 31.2% |
| Unpaid Family Workers | 61 | 0.2% |
| Total | 40,716 | 100.0% |
Employment Status by Age in Lawton
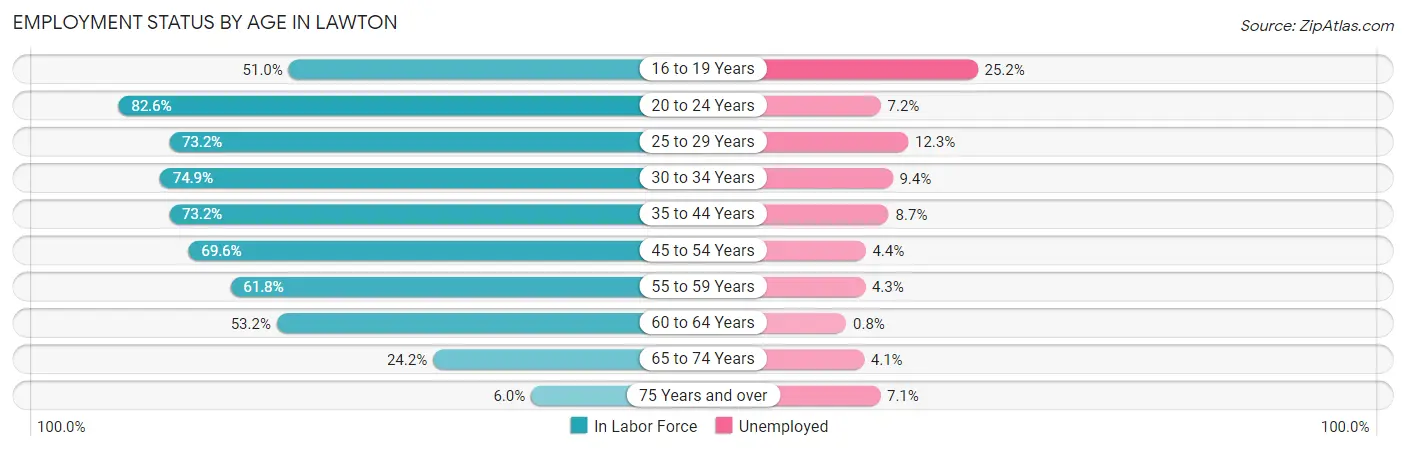
According to the labor force statistics for Lawton, out of the total population over 16 years of age (72,085), 61.7% or 44,476 individuals are in the labor force, with 7.7% or 3,425 of them unemployed. The age group with the highest labor force participation rate is 20 to 24 years, with 82.6% or 7,435 individuals in the labor force. Within the labor force, the 16 to 19 years age range has the highest percentage of unemployed individuals, with 25.2% or 715 of them being unemployed.
| Age Bracket | In Labor Force | Unemployed |
| 16 to 19 Years | 2,839 (51.0%) | 715 (25.2%) |
| 20 to 24 Years | 7,435 (82.6%) | 535 (7.2%) |
| 25 to 29 Years | 6,312 (73.2%) | 776 (12.3%) |
| 30 to 34 Years | 5,802 (74.9%) | 545 (9.4%) |
| 35 to 44 Years | 8,578 (73.2%) | 746 (8.7%) |
| 45 to 54 Years | 6,107 (69.6%) | 269 (4.4%) |
| 55 to 59 Years | 2,977 (61.8%) | 128 (4.3%) |
| 60 to 64 Years | 2,600 (53.2%) | 21 (0.8%) |
| 65 to 74 Years | 1,571 (24.2%) | 64 (4.1%) |
| 75 Years and over | 268 (6.0%) | 19 (7.1%) |
| Total | 44,476 (61.7%) | 3,425 (7.7%) |
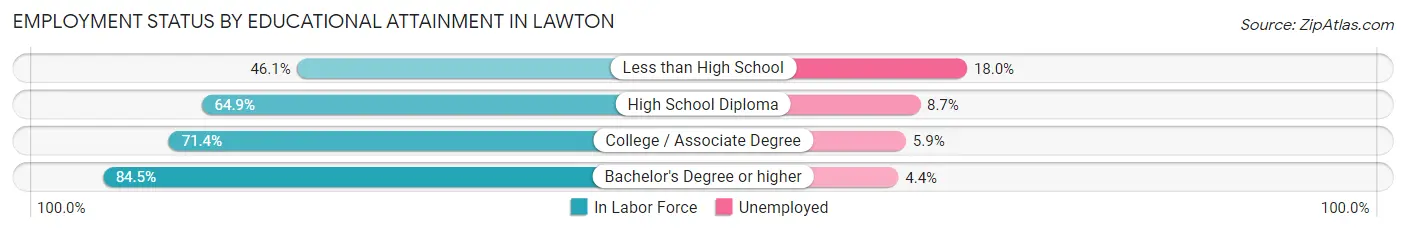
Employment Status by Educational Attainment in Lawton
According to labor force statistics for Lawton, 69.5% of individuals (32,363) out of the total population between 25 and 64 years of age (46,565) are in the labor force, with 7.3% or 2,362 of them being unemployed. The group with the highest labor force participation rate are those with the educational attainment of bachelor's degree or higher, with 84.5% or 8,597 individuals in the labor force. Within the labor force, individuals with less than high school education have the highest percentage of unemployment, with 18.0% or 399 of them being unemployed.
| Educational Attainment | In Labor Force | Unemployed |
| Less than High School | 2,214 (46.1%) | 865 (18.0%) |
| High School Diploma | 9,933 (64.9%) | 1,332 (8.7%) |
| College / Associate Degree | 11,626 (71.4%) | 961 (5.9%) |
| Bachelor's Degree or higher | 8,597 (84.5%) | 448 (4.4%) |
| Total | 32,363 (69.5%) | 3,399 (7.3%) |
Employment Occupations by Sex in Lawton
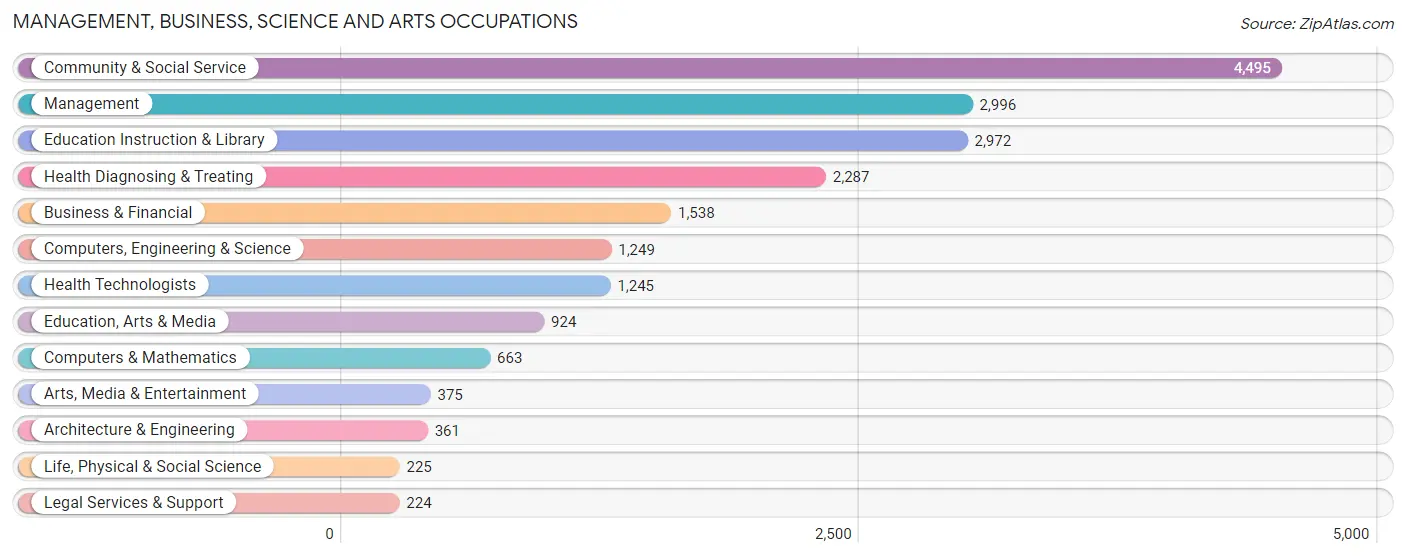
Management, Business, Science and Arts Occupations
The most common Management, Business, Science and Arts occupations in Lawton are Community & Social Service (4,495 | 13.6%), Management (2,996 | 9.0%), Education Instruction & Library (2,972 | 9.0%), Health Diagnosing & Treating (2,287 | 6.9%), and Business & Financial (1,538 | 4.6%).
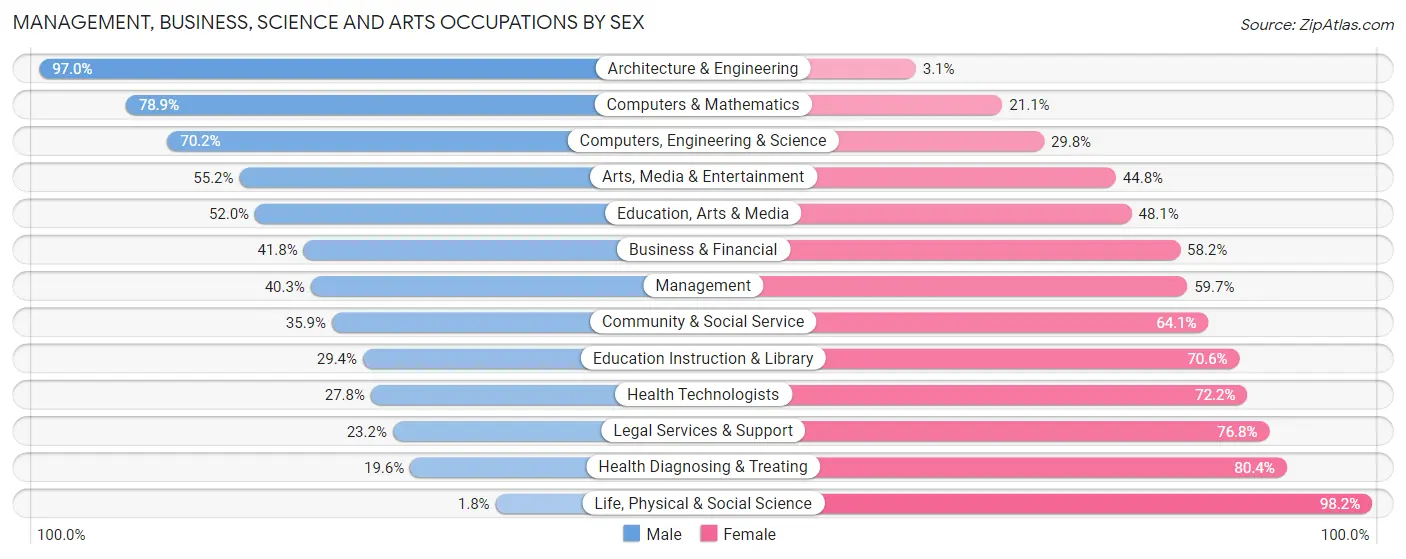
Management, Business, Science and Arts Occupations by Sex
Within the Management, Business, Science and Arts occupations in Lawton, the most male-oriented occupations are Architecture & Engineering (97.0%), Computers & Mathematics (78.9%), and Computers, Engineering & Science (70.2%), while the most female-oriented occupations are Life, Physical & Social Science (98.2%), Health Diagnosing & Treating (80.4%), and Legal Services & Support (76.8%).
| Occupation | Male | Female |
| Management | 1,208 (40.3%) | 1,788 (59.7%) |
| Business & Financial | 643 (41.8%) | 895 (58.2%) |
| Computers, Engineering & Science | 877 (70.2%) | 372 (29.8%) |
| Computers & Mathematics | 523 (78.9%) | 140 (21.1%) |
| Architecture & Engineering | 350 (97.0%) | 11 (3.0%) |
| Life, Physical & Social Science | 4 (1.8%) | 221 (98.2%) |
| Community & Social Service | 1,614 (35.9%) | 2,881 (64.1%) |
| Education, Arts & Media | 480 (51.9%) | 444 (48.0%) |
| Legal Services & Support | 52 (23.2%) | 172 (76.8%) |
| Education Instruction & Library | 875 (29.4%) | 2,097 (70.6%) |
| Arts, Media & Entertainment | 207 (55.2%) | 168 (44.8%) |
| Health Diagnosing & Treating | 448 (19.6%) | 1,839 (80.4%) |
| Health Technologists | 346 (27.8%) | 899 (72.2%) |
| Total (Category) | 4,790 (38.1%) | 7,775 (61.9%) |
| Total (Overall) | 15,612 (47.1%) | 17,543 (52.9%) |
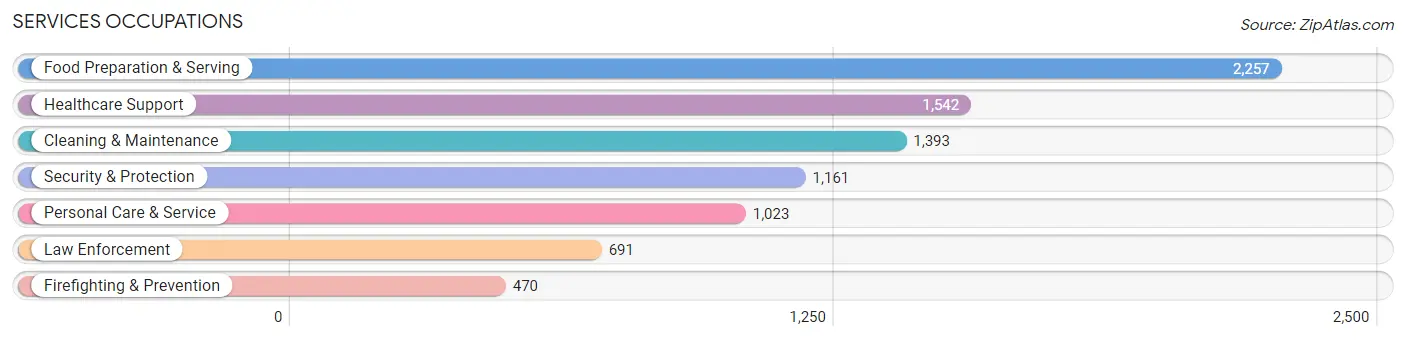
Services Occupations
The most common Services occupations in Lawton are Food Preparation & Serving (2,257 | 6.8%), Healthcare Support (1,542 | 4.6%), Cleaning & Maintenance (1,393 | 4.2%), Security & Protection (1,161 | 3.5%), and Personal Care & Service (1,023 | 3.1%).
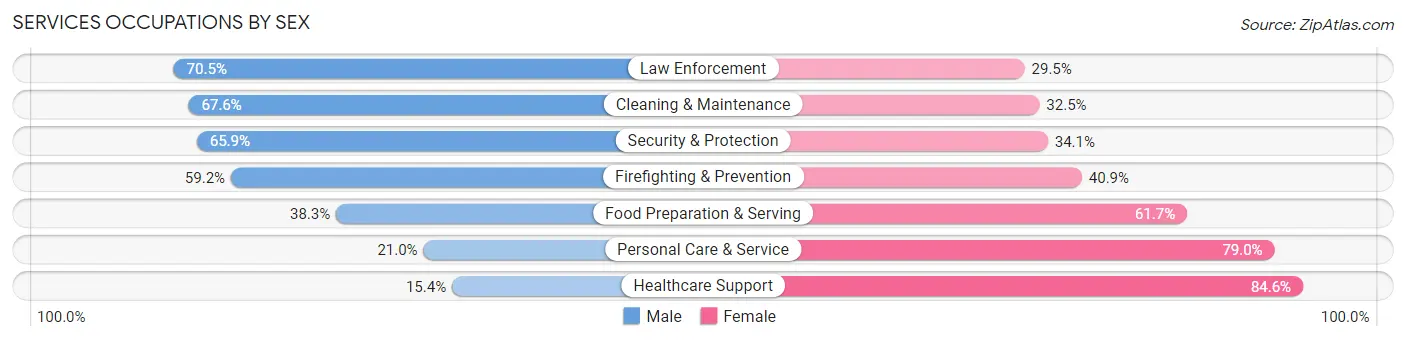
Services Occupations by Sex
Within the Services occupations in Lawton, the most male-oriented occupations are Law Enforcement (70.5%), Cleaning & Maintenance (67.5%), and Security & Protection (65.9%), while the most female-oriented occupations are Healthcare Support (84.6%), Personal Care & Service (79.0%), and Food Preparation & Serving (61.7%).
| Occupation | Male | Female |
| Healthcare Support | 237 (15.4%) | 1,305 (84.6%) |
| Security & Protection | 765 (65.9%) | 396 (34.1%) |
| Firefighting & Prevention | 278 (59.2%) | 192 (40.8%) |
| Law Enforcement | 487 (70.5%) | 204 (29.5%) |
| Food Preparation & Serving | 865 (38.3%) | 1,392 (61.7%) |
| Cleaning & Maintenance | 941 (67.5%) | 452 (32.5%) |
| Personal Care & Service | 215 (21.0%) | 808 (79.0%) |
| Total (Category) | 3,023 (41.0%) | 4,353 (59.0%) |
| Total (Overall) | 15,612 (47.1%) | 17,543 (52.9%) |
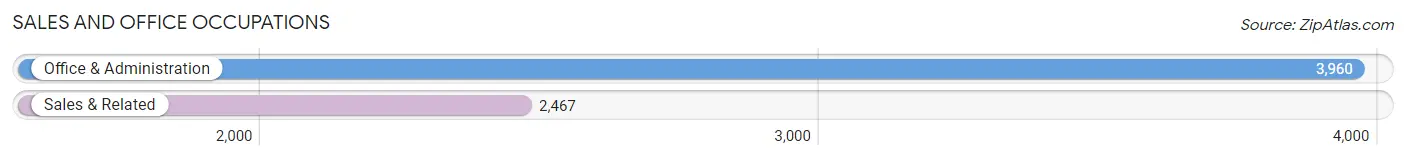
Sales and Office Occupations
The most common Sales and Office occupations in Lawton are Office & Administration (3,960 | 11.9%), and Sales & Related (2,467 | 7.4%).
Sales and Office Occupations by Sex
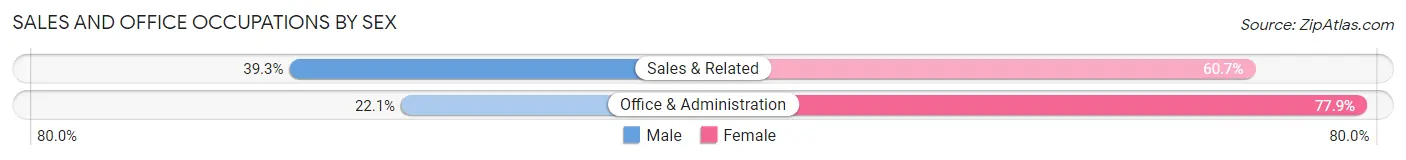
| Occupation | Male | Female |
| Sales & Related | 969 (39.3%) | 1,498 (60.7%) |
| Office & Administration | 875 (22.1%) | 3,085 (77.9%) |
| Total (Category) | 1,844 (28.7%) | 4,583 (71.3%) |
| Total (Overall) | 15,612 (47.1%) | 17,543 (52.9%) |
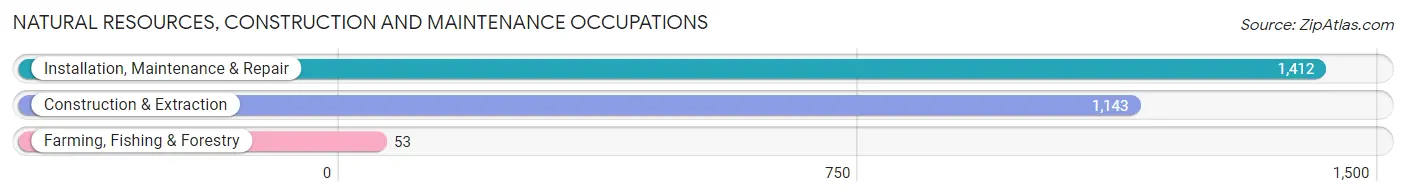
Natural Resources, Construction and Maintenance Occupations
The most common Natural Resources, Construction and Maintenance occupations in Lawton are Installation, Maintenance & Repair (1,412 | 4.3%), Construction & Extraction (1,143 | 3.5%), and Farming, Fishing & Forestry (53 | 0.2%).
Natural Resources, Construction and Maintenance Occupations by Sex
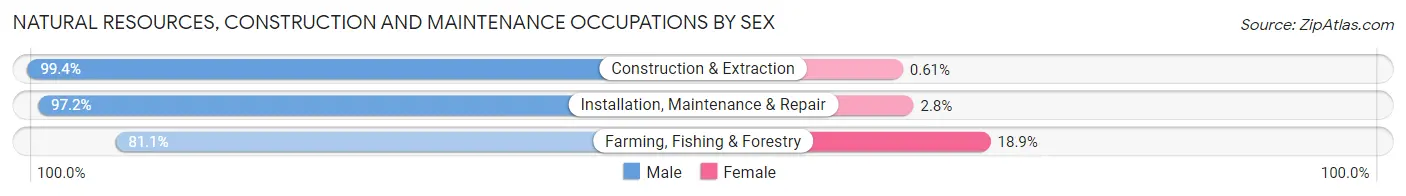
| Occupation | Male | Female |
| Farming, Fishing & Forestry | 43 (81.1%) | 10 (18.9%) |
| Construction & Extraction | 1,136 (99.4%) | 7 (0.6%) |
| Installation, Maintenance & Repair | 1,372 (97.2%) | 40 (2.8%) |
| Total (Category) | 2,551 (97.8%) | 57 (2.2%) |
| Total (Overall) | 15,612 (47.1%) | 17,543 (52.9%) |
Production, Transportation and Moving Occupations
The most common Production, Transportation and Moving occupations in Lawton are Production (1,985 | 6.0%), Material Moving (1,166 | 3.5%), and Transportation (1,028 | 3.1%).
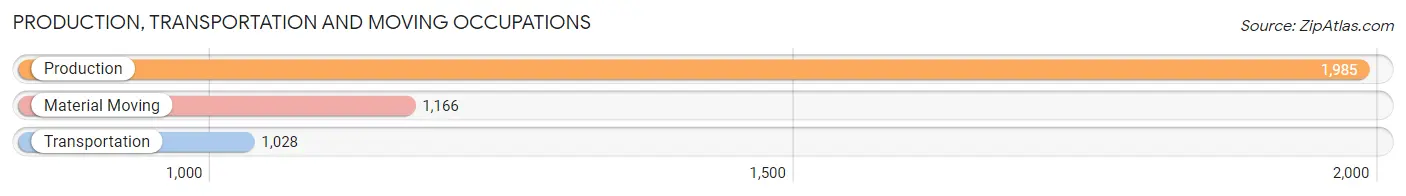
Production, Transportation and Moving Occupations by Sex
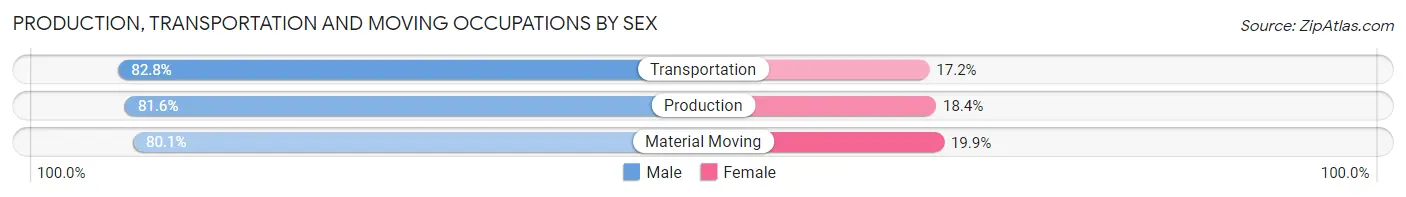
| Occupation | Male | Female |
| Production | 1,619 (81.6%) | 366 (18.4%) |
| Transportation | 851 (82.8%) | 177 (17.2%) |
| Material Moving | 934 (80.1%) | 232 (19.9%) |
| Total (Category) | 3,404 (81.5%) | 775 (18.5%) |
| Total (Overall) | 15,612 (47.1%) | 17,543 (52.9%) |
Employment Industries by Sex in Lawton
Employment Industries in Lawton
The major employment industries in Lawton include Health Care & Social Assistance (6,514 | 19.7%), Retail Trade (3,761 | 11.3%), Manufacturing (3,235 | 9.8%), Educational Services (3,163 | 9.5%), and Public Administration (3,008 | 9.1%).
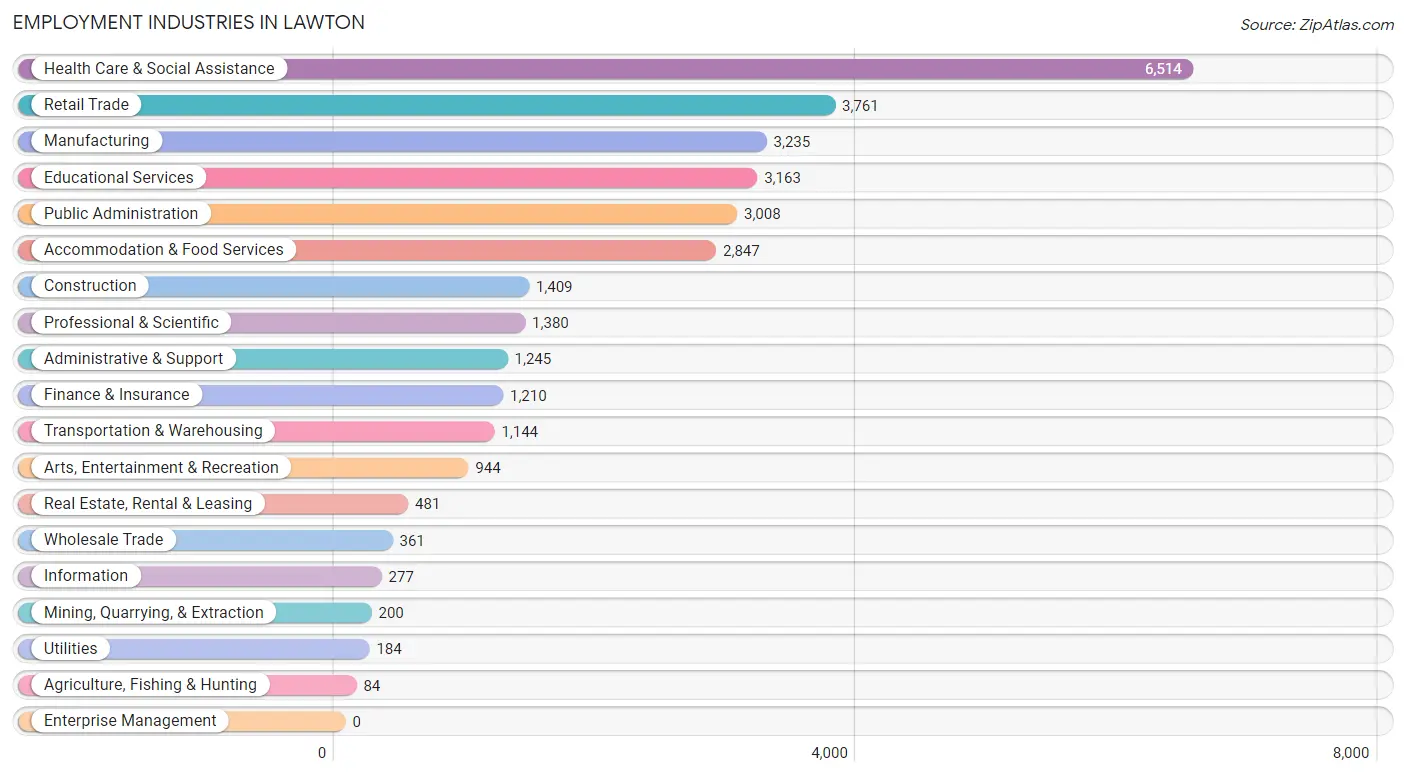
Employment Industries by Sex in Lawton
The Lawton industries that see more men than women are Mining, Quarrying, & Extraction (100.0%), Utilities (95.1%), and Agriculture, Fishing & Hunting (94.1%), whereas the industries that tend to have a higher number of women are Health Care & Social Assistance (83.1%), Finance & Insurance (74.5%), and Educational Services (69.5%).
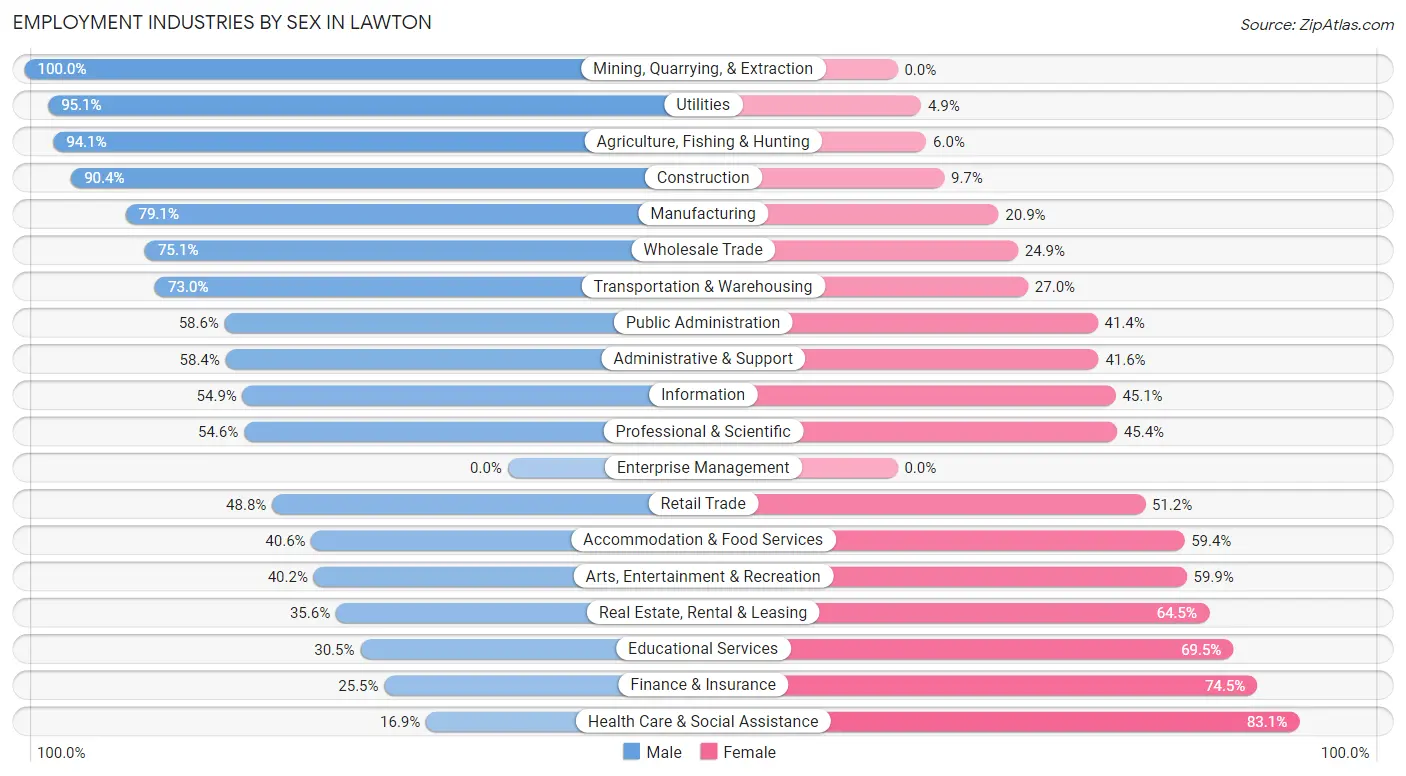
| Industry | Male | Female |
| Agriculture, Fishing & Hunting | 79 (94.1%) | 5 (5.9%) |
| Mining, Quarrying, & Extraction | 200 (100.0%) | 0 (0.0%) |
| Construction | 1,273 (90.3%) | 136 (9.7%) |
| Manufacturing | 2,559 (79.1%) | 676 (20.9%) |
| Wholesale Trade | 271 (75.1%) | 90 (24.9%) |
| Retail Trade | 1,834 (48.8%) | 1,927 (51.2%) |
| Transportation & Warehousing | 835 (73.0%) | 309 (27.0%) |
| Utilities | 175 (95.1%) | 9 (4.9%) |
| Information | 152 (54.9%) | 125 (45.1%) |
| Finance & Insurance | 309 (25.5%) | 901 (74.5%) |
| Real Estate, Rental & Leasing | 171 (35.5%) | 310 (64.4%) |
| Professional & Scientific | 753 (54.6%) | 627 (45.4%) |
| Enterprise Management | 0 (0.0%) | 0 (0.0%) |
| Administrative & Support | 727 (58.4%) | 518 (41.6%) |
| Educational Services | 965 (30.5%) | 2,198 (69.5%) |
| Health Care & Social Assistance | 1,100 (16.9%) | 5,414 (83.1%) |
| Arts, Entertainment & Recreation | 379 (40.2%) | 565 (59.9%) |
| Accommodation & Food Services | 1,157 (40.6%) | 1,690 (59.4%) |
| Public Administration | 1,762 (58.6%) | 1,246 (41.4%) |
| Total | 15,612 (47.1%) | 17,543 (52.9%) |
Education in Lawton
School Enrollment in Lawton
The most common levels of schooling among the 21,506 students in Lawton are elementary school (4,930 | 22.9%), college / undergraduate (4,391 | 20.4%), and high school (4,188 | 19.5%).
| School Level | # Students | % Students |
| Nursery / Preschool | 1,722 | 8.0% |
| Kindergarten | 1,193 | 5.6% |
| Elementary School | 4,930 | 22.9% |
| Middle School | 4,098 | 19.1% |
| High School | 4,188 | 19.5% |
| College / Undergraduate | 4,391 | 20.4% |
| Graduate / Professional | 984 | 4.6% |
| Total | 21,506 | 100.0% |
School Enrollment by Age by Funding Source in Lawton
Out of a total of 21,506 students who are enrolled in schools in Lawton, 2,108 (9.8%) attend a private institution, while the remaining 19,398 (90.2%) are enrolled in public schools. The age group of 3 to 4 year olds has the highest likelihood of being enrolled in private schools, with 179 (15.6% in the age bracket) enrolled. Conversely, the age group of 20 to 24 year olds has the lowest likelihood of being enrolled in a private school, with 1,723 (94.6% in the age bracket) attending a public institution.
| Age Bracket | Public School | Private School |
| 3 to 4 Year Olds | 967 (84.4%) | 179 (15.6%) |
| 5 to 9 Year Old | 5,432 (90.9%) | 544 (9.1%) |
| 10 to 14 Year Olds | 4,710 (90.6%) | 486 (9.3%) |
| 15 to 17 Year Olds | 2,524 (91.2%) | 242 (8.7%) |
| 18 to 19 Year Olds | 1,051 (89.7%) | 121 (10.3%) |
| 20 to 24 Year Olds | 1,723 (94.6%) | 98 (5.4%) |
| 25 to 34 Year Olds | 1,731 (90.0%) | 193 (10.0%) |
| 35 Years and over | 1,271 (84.5%) | 234 (15.5%) |
| Total | 19,398 (90.2%) | 2,108 (9.8%) |
Educational Attainment by Field of Study in Lawton
Business (2,454 | 17.1%), education (2,122 | 14.8%), arts & humanities (1,435 | 10.0%), science & technology (1,104 | 7.7%), and psychology (1,085 | 7.6%) are the most common fields of study among 14,335 individuals in Lawton who have obtained a bachelor's degree or higher.
| Field of Study | # Graduates | % Graduates |
| Computers & Mathematics | 942 | 6.6% |
| Bio, Nature & Agricultural | 721 | 5.0% |
| Physical & Health Sciences | 500 | 3.5% |
| Psychology | 1,085 | 7.6% |
| Social Sciences | 885 | 6.2% |
| Engineering | 514 | 3.6% |
| Multidisciplinary Studies | 311 | 2.2% |
| Science & Technology | 1,104 | 7.7% |
| Business | 2,454 | 17.1% |
| Education | 2,122 | 14.8% |
| Literature & Languages | 550 | 3.8% |
| Liberal Arts & History | 714 | 5.0% |
| Visual & Performing Arts | 732 | 5.1% |
| Communications | 266 | 1.9% |
| Arts & Humanities | 1,435 | 10.0% |
| Total | 14,335 | 100.0% |
Transportation & Commute in Lawton
Vehicle Availability by Sex in Lawton
The most prevalent vehicle ownership categories in Lawton are males with 2 vehicles (8,311, accounting for 44.4%) and females with 2 vehicles (7,543, making up 48.1%).
| Vehicles Available | Male | Female |
| No Vehicle | 944 (5.0%) | 648 (3.7%) |
| 1 Vehicle | 5,199 (27.8%) | 5,250 (30.4%) |
| 2 Vehicles | 8,311 (44.4%) | 7,543 (43.6%) |
| 3 Vehicles | 3,175 (17.0%) | 2,917 (16.9%) |
| 4 Vehicles | 756 (4.0%) | 755 (4.4%) |
| 5 or more Vehicles | 347 (1.8%) | 176 (1.0%) |
| Total | 18,732 (100.0%) | 17,289 (100.0%) |
Commute Time in Lawton
The most frequently occuring commute durations in Lawton are 15 to 19 minutes (9,676 commuters, 27.3%), 10 to 14 minutes (8,703 commuters, 24.5%), and 5 to 9 minutes (7,278 commuters, 20.5%).
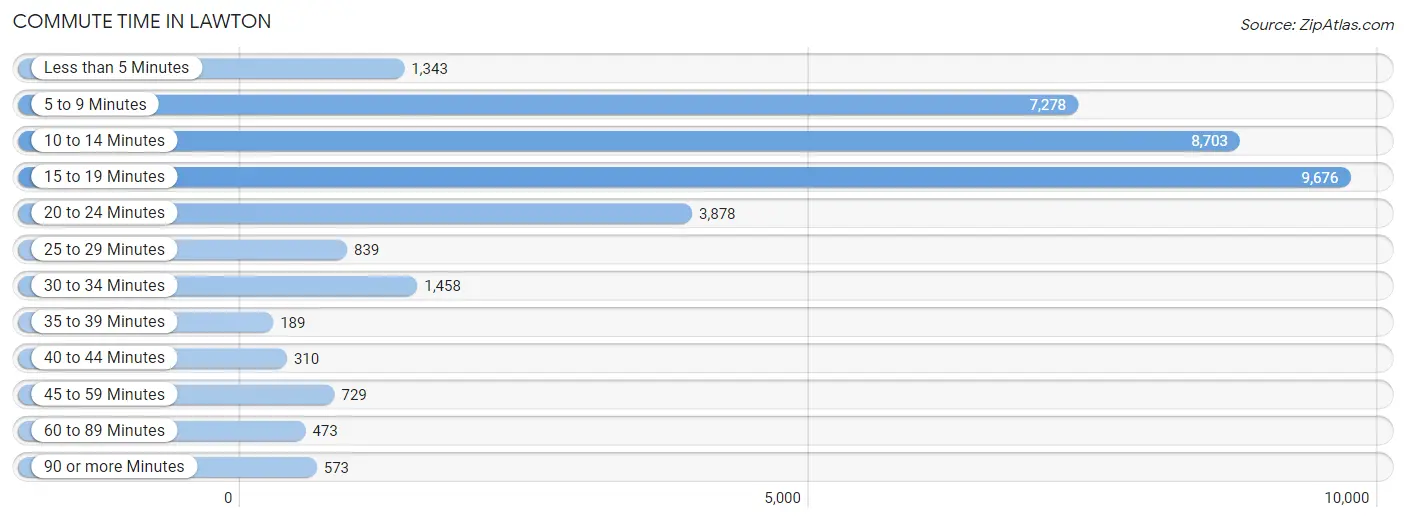
| Commute Time | # Commuters | % Commuters |
| Less than 5 Minutes | 1,343 | 3.8% |
| 5 to 9 Minutes | 7,278 | 20.5% |
| 10 to 14 Minutes | 8,703 | 24.5% |
| 15 to 19 Minutes | 9,676 | 27.3% |
| 20 to 24 Minutes | 3,878 | 10.9% |
| 25 to 29 Minutes | 839 | 2.4% |
| 30 to 34 Minutes | 1,458 | 4.1% |
| 35 to 39 Minutes | 189 | 0.5% |
| 40 to 44 Minutes | 310 | 0.9% |
| 45 to 59 Minutes | 729 | 2.1% |
| 60 to 89 Minutes | 473 | 1.3% |
| 90 or more Minutes | 573 | 1.6% |
Commute Time by Sex in Lawton
The most common commute times in Lawton are 15 to 19 minutes (5,470 commuters, 29.0%) for males and 15 to 19 minutes (4,206 commuters, 25.3%) for females.
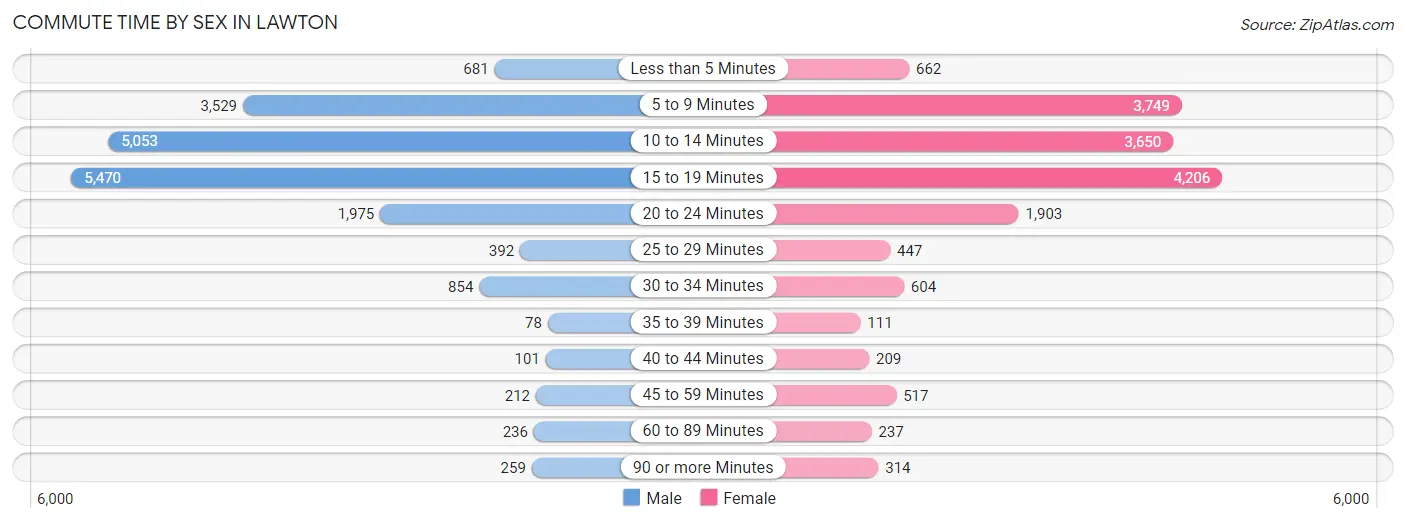
| Commute Time | Male | Female |
| Less than 5 Minutes | 681 (3.6%) | 662 (4.0%) |
| 5 to 9 Minutes | 3,529 (18.7%) | 3,749 (22.6%) |
| 10 to 14 Minutes | 5,053 (26.8%) | 3,650 (22.0%) |
| 15 to 19 Minutes | 5,470 (29.0%) | 4,206 (25.3%) |
| 20 to 24 Minutes | 1,975 (10.5%) | 1,903 (11.5%) |
| 25 to 29 Minutes | 392 (2.1%) | 447 (2.7%) |
| 30 to 34 Minutes | 854 (4.5%) | 604 (3.6%) |
| 35 to 39 Minutes | 78 (0.4%) | 111 (0.7%) |
| 40 to 44 Minutes | 101 (0.5%) | 209 (1.3%) |
| 45 to 59 Minutes | 212 (1.1%) | 517 (3.1%) |
| 60 to 89 Minutes | 236 (1.3%) | 237 (1.4%) |
| 90 or more Minutes | 259 (1.4%) | 314 (1.9%) |
Time of Departure to Work by Sex in Lawton
The most frequent times of departure to work in Lawton are 6:00 AM to 6:29 AM (2,603, 13.8%) for males and 7:30 AM to 7:59 AM (2,781, 16.7%) for females.
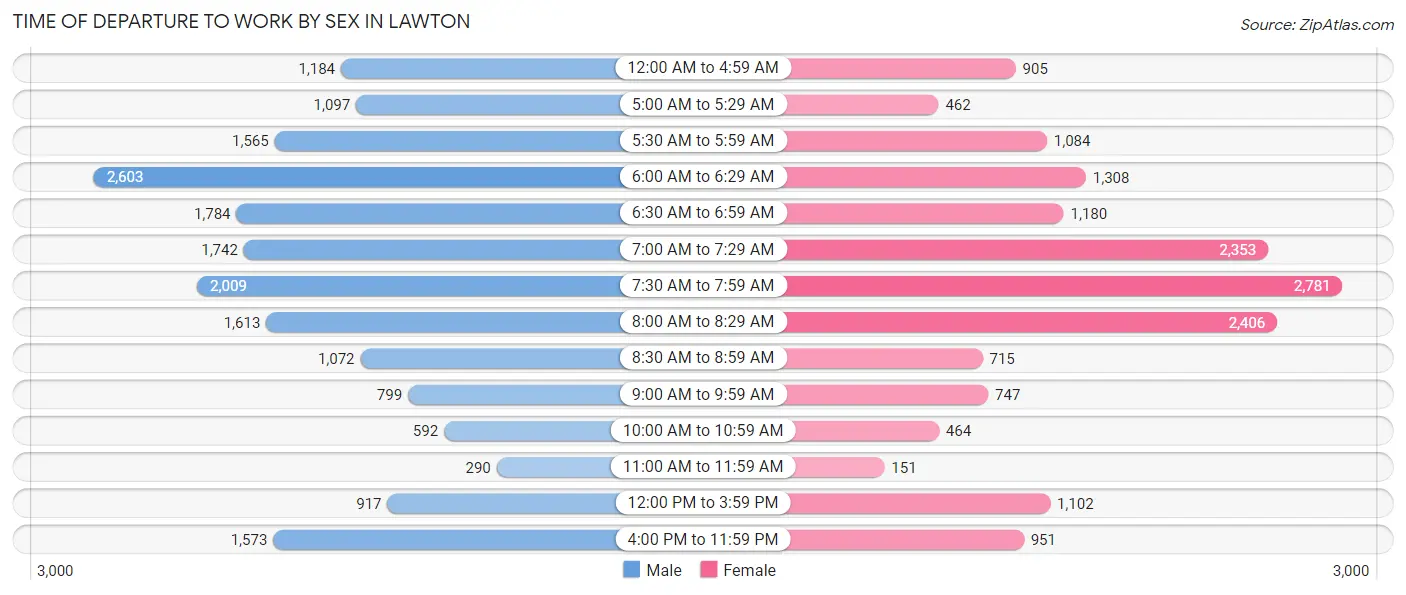
| Time of Departure | Male | Female |
| 12:00 AM to 4:59 AM | 1,184 (6.3%) | 905 (5.4%) |
| 5:00 AM to 5:29 AM | 1,097 (5.8%) | 462 (2.8%) |
| 5:30 AM to 5:59 AM | 1,565 (8.3%) | 1,084 (6.5%) |
| 6:00 AM to 6:29 AM | 2,603 (13.8%) | 1,308 (7.9%) |
| 6:30 AM to 6:59 AM | 1,784 (9.5%) | 1,180 (7.1%) |
| 7:00 AM to 7:29 AM | 1,742 (9.2%) | 2,353 (14.2%) |
| 7:30 AM to 7:59 AM | 2,009 (10.7%) | 2,781 (16.7%) |
| 8:00 AM to 8:29 AM | 1,613 (8.6%) | 2,406 (14.5%) |
| 8:30 AM to 8:59 AM | 1,072 (5.7%) | 715 (4.3%) |
| 9:00 AM to 9:59 AM | 799 (4.2%) | 747 (4.5%) |
| 10:00 AM to 10:59 AM | 592 (3.1%) | 464 (2.8%) |
| 11:00 AM to 11:59 AM | 290 (1.5%) | 151 (0.9%) |
| 12:00 PM to 3:59 PM | 917 (4.9%) | 1,102 (6.6%) |
| 4:00 PM to 11:59 PM | 1,573 (8.4%) | 951 (5.7%) |
| Total | 18,840 (100.0%) | 16,609 (100.0%) |
Housing Occupancy in Lawton
Occupancy by Ownership in Lawton
Of the total 33,144 dwellings in Lawton, owner-occupied units account for 14,817 (44.7%), while renter-occupied units make up 18,327 (55.3%).

| Occupancy | # Housing Units | % Housing Units |
| Owner Occupied Housing Units | 14,817 | 44.7% |
| Renter-Occupied Housing Units | 18,327 | 55.3% |
| Total Occupied Housing Units | 33,144 | 100.0% |
Occupancy by Household Size in Lawton
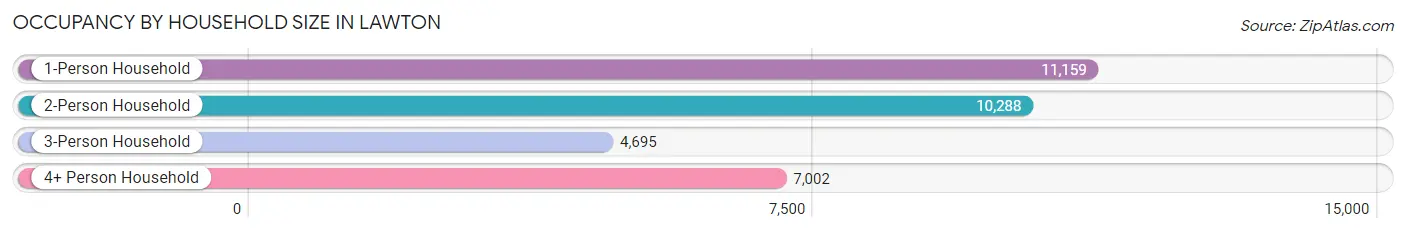
| Household Size | # Housing Units | % Housing Units |
| 1-Person Household | 11,159 | 33.7% |
| 2-Person Household | 10,288 | 31.0% |
| 3-Person Household | 4,695 | 14.2% |
| 4+ Person Household | 7,002 | 21.1% |
| Total Housing Units | 33,144 | 100.0% |
Occupancy by Ownership by Household Size in Lawton
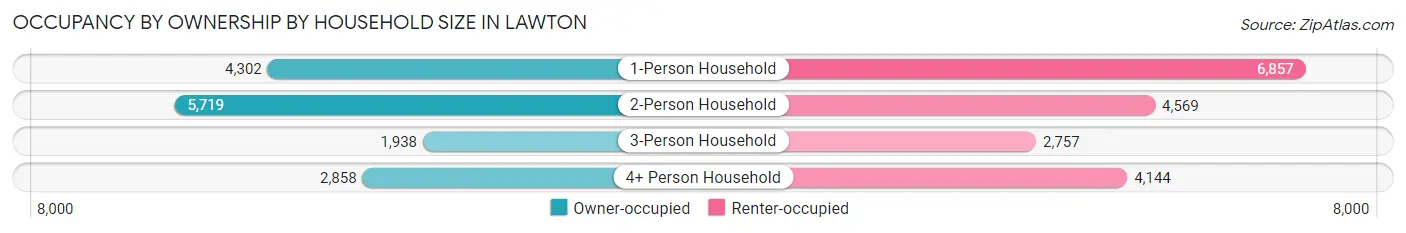
| Household Size | Owner-occupied | Renter-occupied |
| 1-Person Household | 4,302 (38.6%) | 6,857 (61.5%) |
| 2-Person Household | 5,719 (55.6%) | 4,569 (44.4%) |
| 3-Person Household | 1,938 (41.3%) | 2,757 (58.7%) |
| 4+ Person Household | 2,858 (40.8%) | 4,144 (59.2%) |
| Total Housing Units | 14,817 (44.7%) | 18,327 (55.3%) |
Occupancy by Educational Attainment in Lawton
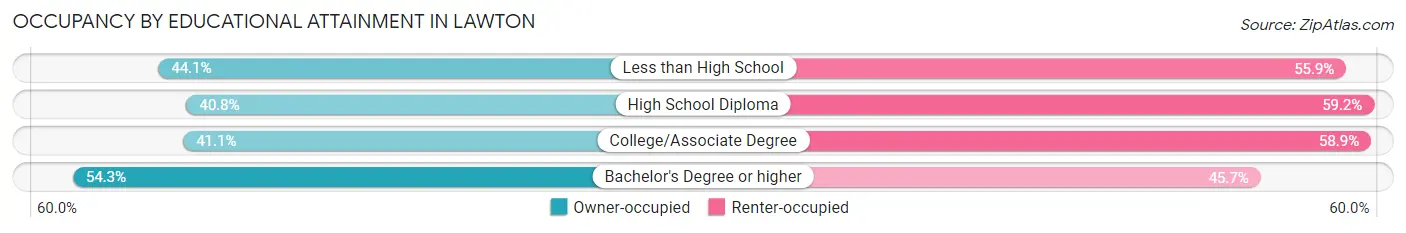
| Household Size | Owner-occupied | Renter-occupied |
| Less than High School | 1,279 (44.1%) | 1,622 (55.9%) |
| High School Diploma | 3,817 (40.8%) | 5,548 (59.2%) |
| College/Associate Degree | 5,036 (41.1%) | 7,208 (58.9%) |
| Bachelor's Degree or higher | 4,685 (54.3%) | 3,949 (45.7%) |
Occupancy by Age of Householder in Lawton
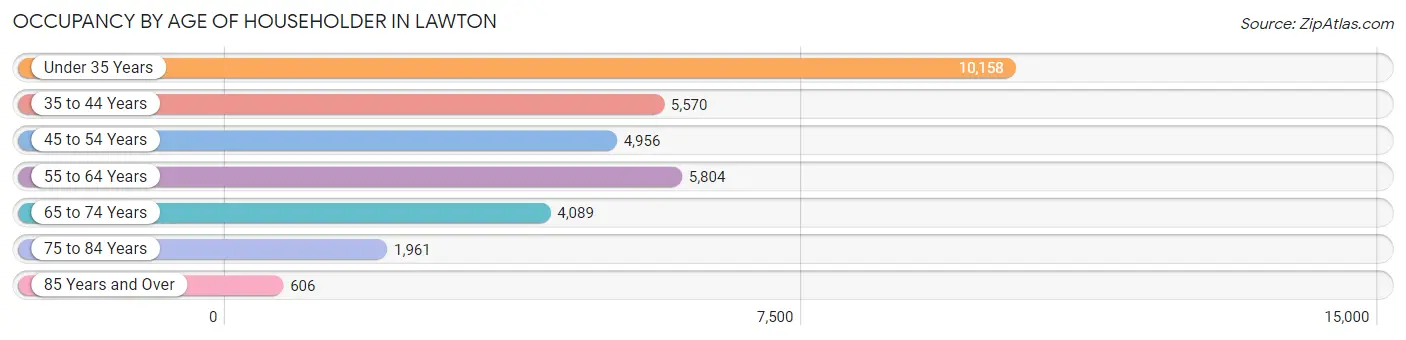
| Age Bracket | # Households | % Households |
| Under 35 Years | 10,158 | 30.6% |
| 35 to 44 Years | 5,570 | 16.8% |
| 45 to 54 Years | 4,956 | 14.9% |
| 55 to 64 Years | 5,804 | 17.5% |
| 65 to 74 Years | 4,089 | 12.3% |
| 75 to 84 Years | 1,961 | 5.9% |
| 85 Years and Over | 606 | 1.8% |
| Total | 33,144 | 100.0% |
Housing Finances in Lawton
Median Income by Occupancy in Lawton
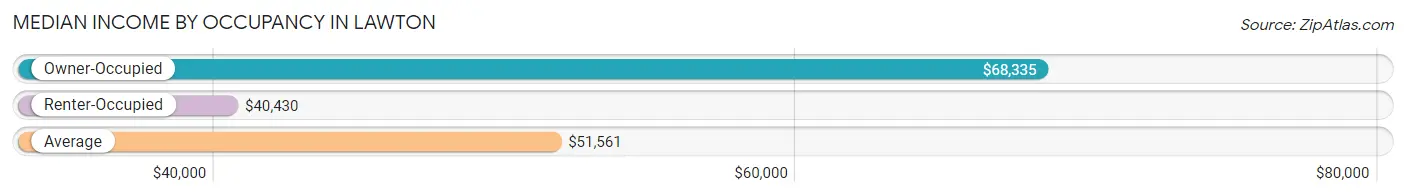
| Occupancy Type | # Households | Median Income |
| Owner-Occupied | 14,817 (44.7%) | $68,335 |
| Renter-Occupied | 18,327 (55.3%) | $40,430 |
| Average | 33,144 (100.0%) | $51,561 |
Occupancy by Householder Income Bracket in Lawton
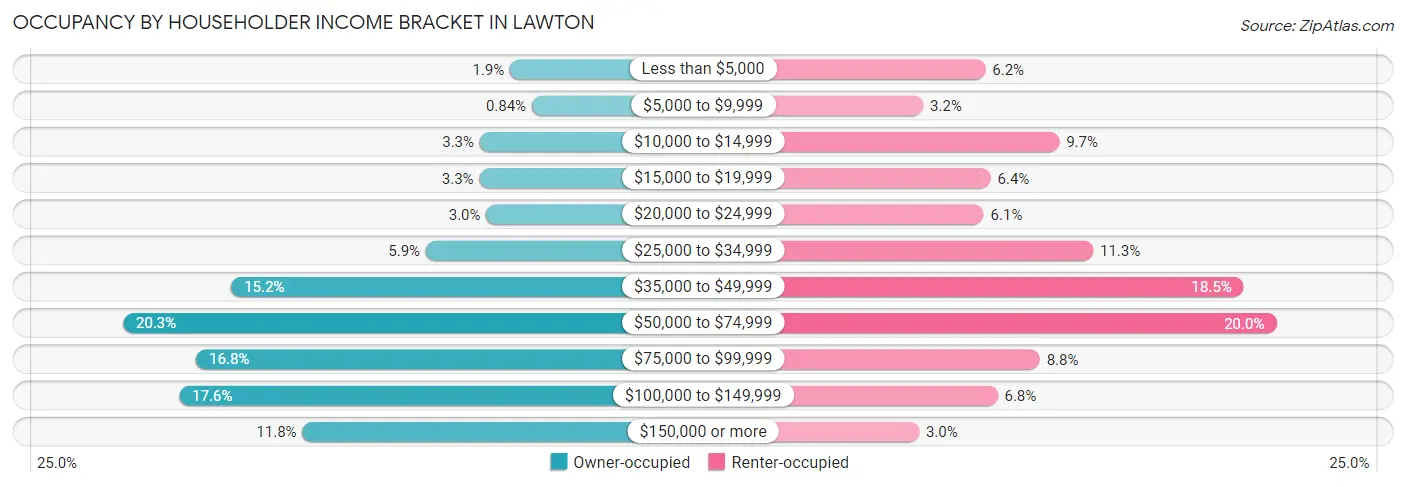
| Income Bracket | Owner-occupied | Renter-occupied |
| Less than $5,000 | 278 (1.9%) | 1,133 (6.2%) |
| $5,000 to $9,999 | 125 (0.8%) | 591 (3.2%) |
| $10,000 to $14,999 | 492 (3.3%) | 1,777 (9.7%) |
| $15,000 to $19,999 | 495 (3.3%) | 1,178 (6.4%) |
| $20,000 to $24,999 | 446 (3.0%) | 1,118 (6.1%) |
| $25,000 to $34,999 | 873 (5.9%) | 2,072 (11.3%) |
| $35,000 to $49,999 | 2,246 (15.2%) | 3,387 (18.5%) |
| $50,000 to $74,999 | 3,011 (20.3%) | 3,670 (20.0%) |
| $75,000 to $99,999 | 2,493 (16.8%) | 1,608 (8.8%) |
| $100,000 to $149,999 | 2,614 (17.6%) | 1,239 (6.8%) |
| $150,000 or more | 1,744 (11.8%) | 554 (3.0%) |
| Total | 14,817 (100.0%) | 18,327 (100.0%) |
Monthly Housing Cost Tiers in Lawton
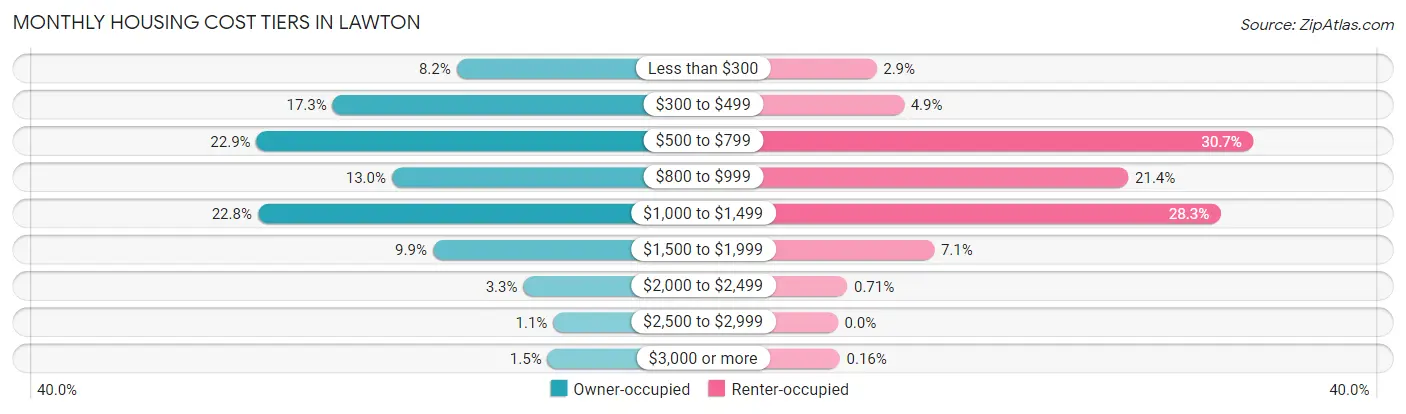
| Monthly Cost | Owner-occupied | Renter-occupied |
| Less than $300 | 1,213 (8.2%) | 525 (2.9%) |
| $300 to $499 | 2,566 (17.3%) | 894 (4.9%) |
| $500 to $799 | 3,398 (22.9%) | 5,618 (30.6%) |
| $800 to $999 | 1,920 (13.0%) | 3,924 (21.4%) |
| $1,000 to $1,499 | 3,383 (22.8%) | 5,177 (28.2%) |
| $1,500 to $1,999 | 1,473 (9.9%) | 1,303 (7.1%) |
| $2,000 to $2,499 | 485 (3.3%) | 131 (0.7%) |
| $2,500 to $2,999 | 158 (1.1%) | 0 (0.0%) |
| $3,000 or more | 221 (1.5%) | 29 (0.2%) |
| Total | 14,817 (100.0%) | 18,327 (100.0%) |
Physical Housing Characteristics in Lawton
Housing Structures in Lawton
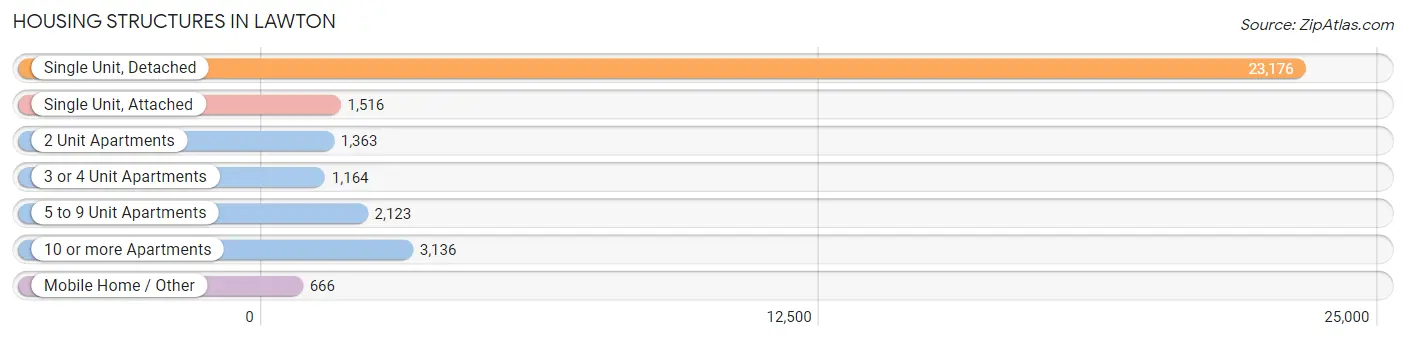
| Structure Type | # Housing Units | % Housing Units |
| Single Unit, Detached | 23,176 | 69.9% |
| Single Unit, Attached | 1,516 | 4.6% |
| 2 Unit Apartments | 1,363 | 4.1% |
| 3 or 4 Unit Apartments | 1,164 | 3.5% |
| 5 to 9 Unit Apartments | 2,123 | 6.4% |
| 10 or more Apartments | 3,136 | 9.5% |
| Mobile Home / Other | 666 | 2.0% |
| Total | 33,144 | 100.0% |
Housing Structures by Occupancy in Lawton
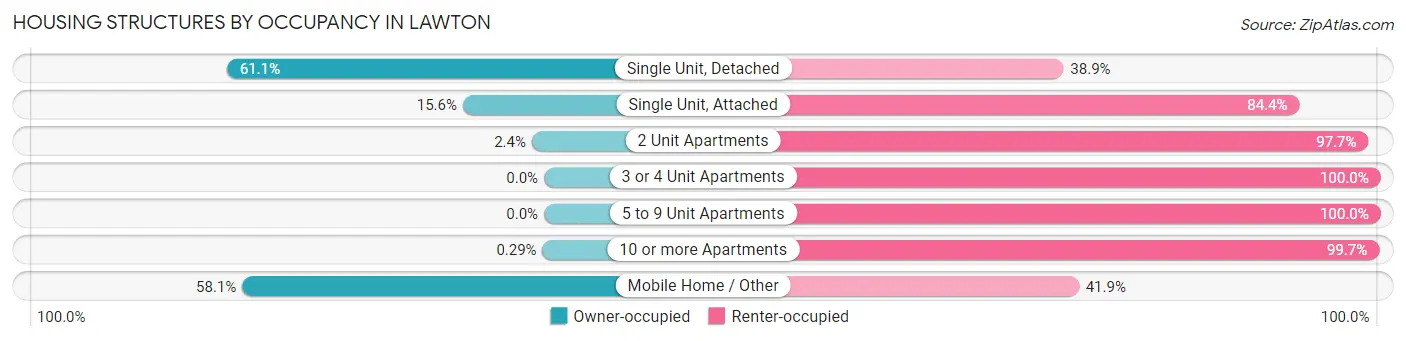
| Structure Type | Owner-occupied | Renter-occupied |
| Single Unit, Detached | 14,152 (61.1%) | 9,024 (38.9%) |
| Single Unit, Attached | 237 (15.6%) | 1,279 (84.4%) |
| 2 Unit Apartments | 32 (2.4%) | 1,331 (97.7%) |
| 3 or 4 Unit Apartments | 0 (0.0%) | 1,164 (100.0%) |
| 5 to 9 Unit Apartments | 0 (0.0%) | 2,123 (100.0%) |
| 10 or more Apartments | 9 (0.3%) | 3,127 (99.7%) |
| Mobile Home / Other | 387 (58.1%) | 279 (41.9%) |
| Total | 14,817 (44.7%) | 18,327 (55.3%) |
Housing Structures by Number of Rooms in Lawton
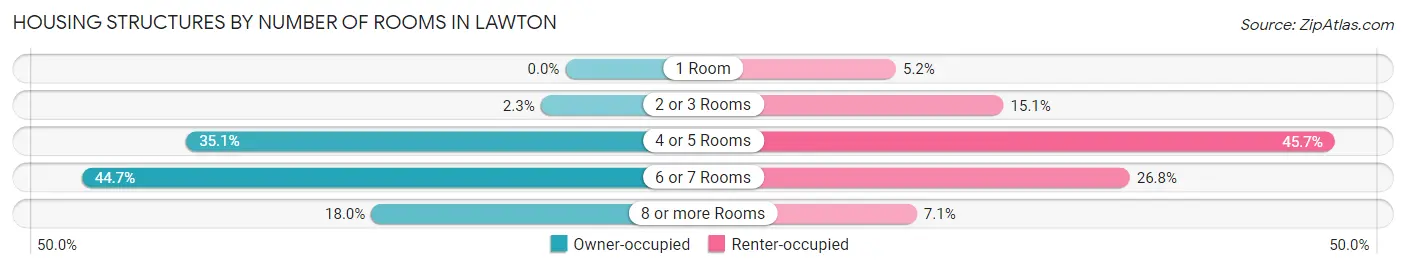
| Number of Rooms | Owner-occupied | Renter-occupied |
| 1 Room | 0 (0.0%) | 951 (5.2%) |
| 2 or 3 Rooms | 340 (2.3%) | 2,775 (15.1%) |
| 4 or 5 Rooms | 5,193 (35.0%) | 8,382 (45.7%) |
| 6 or 7 Rooms | 6,625 (44.7%) | 4,914 (26.8%) |
| 8 or more Rooms | 2,659 (17.9%) | 1,305 (7.1%) |
| Total | 14,817 (100.0%) | 18,327 (100.0%) |
Housing Structure by Heating Type in Lawton
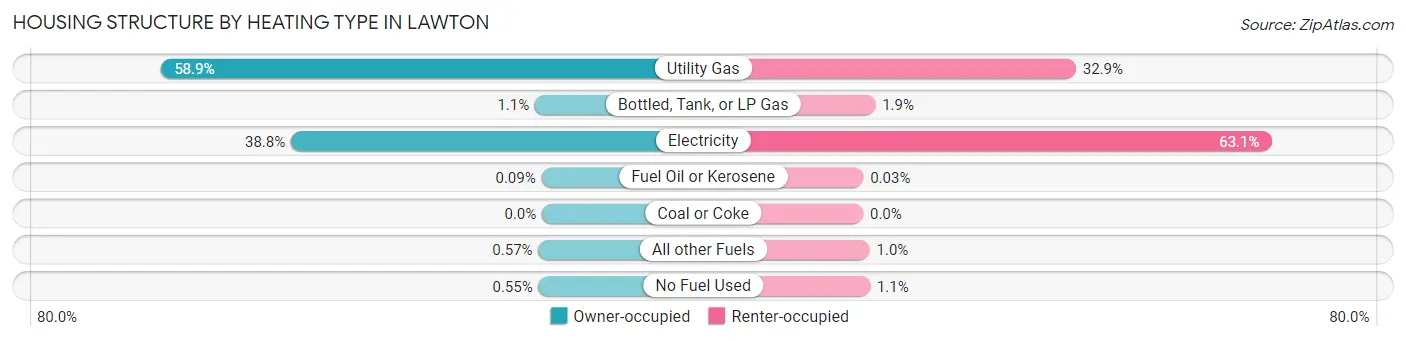
| Heating Type | Owner-occupied | Renter-occupied |
| Utility Gas | 8,723 (58.9%) | 6,028 (32.9%) |
| Bottled, Tank, or LP Gas | 162 (1.1%) | 344 (1.9%) |
| Electricity | 5,751 (38.8%) | 11,567 (63.1%) |
| Fuel Oil or Kerosene | 14 (0.1%) | 5 (0.0%) |
| Coal or Coke | 0 (0.0%) | 0 (0.0%) |
| All other Fuels | 85 (0.6%) | 186 (1.0%) |
| No Fuel Used | 82 (0.5%) | 197 (1.1%) |
| Total | 14,817 (100.0%) | 18,327 (100.0%) |
Household Vehicle Usage in Lawton
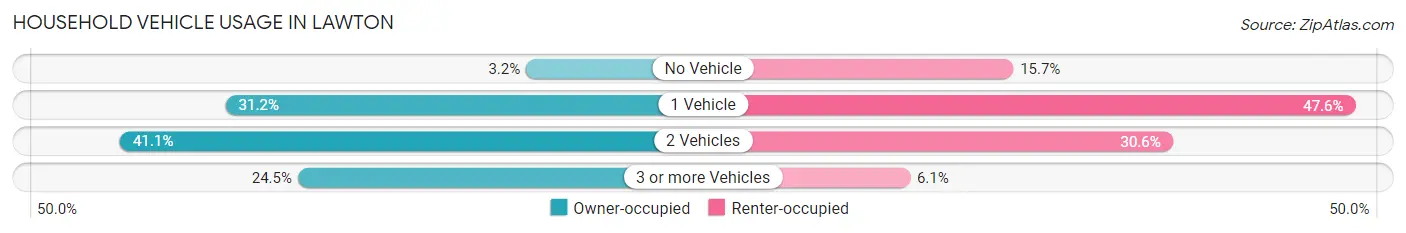
| Vehicles per Household | Owner-occupied | Renter-occupied |
| No Vehicle | 472 (3.2%) | 2,879 (15.7%) |
| 1 Vehicle | 4,627 (31.2%) | 8,731 (47.6%) |
| 2 Vehicles | 6,088 (41.1%) | 5,604 (30.6%) |
| 3 or more Vehicles | 3,630 (24.5%) | 1,113 (6.1%) |
| Total | 14,817 (100.0%) | 18,327 (100.0%) |
Real Estate & Mortgages in Lawton
Real Estate and Mortgage Overview in Lawton
| Characteristic | Without Mortgage | With Mortgage |
| Housing Units | 6,061 | 8,756 |
| Median Property Value | $112,600 | $132,400 |
| Median Household Income | $59,410 | $1,023 |
| Monthly Housing Costs | $454 | $173 |
| Real Estate Taxes | $989 | $965 |
Property Value by Mortgage Status in Lawton
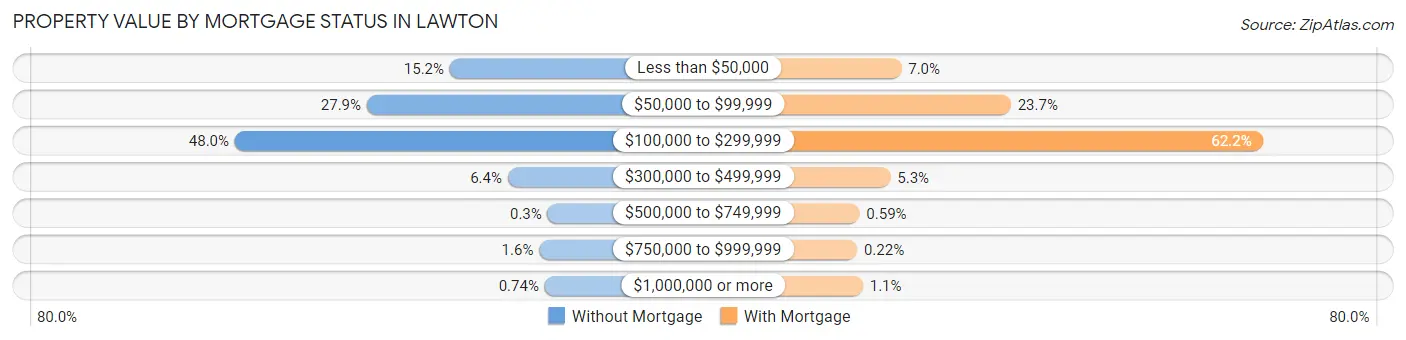
| Property Value | Without Mortgage | With Mortgage |
| Less than $50,000 | 921 (15.2%) | 610 (7.0%) |
| $50,000 to $99,999 | 1,688 (27.9%) | 2,071 (23.6%) |
| $100,000 to $299,999 | 2,907 (48.0%) | 5,444 (62.2%) |
| $300,000 to $499,999 | 386 (6.4%) | 464 (5.3%) |
| $500,000 to $749,999 | 18 (0.3%) | 52 (0.6%) |
| $750,000 to $999,999 | 96 (1.6%) | 19 (0.2%) |
| $1,000,000 or more | 45 (0.7%) | 96 (1.1%) |
| Total | 6,061 (100.0%) | 8,756 (100.0%) |
Household Income by Mortgage Status in Lawton
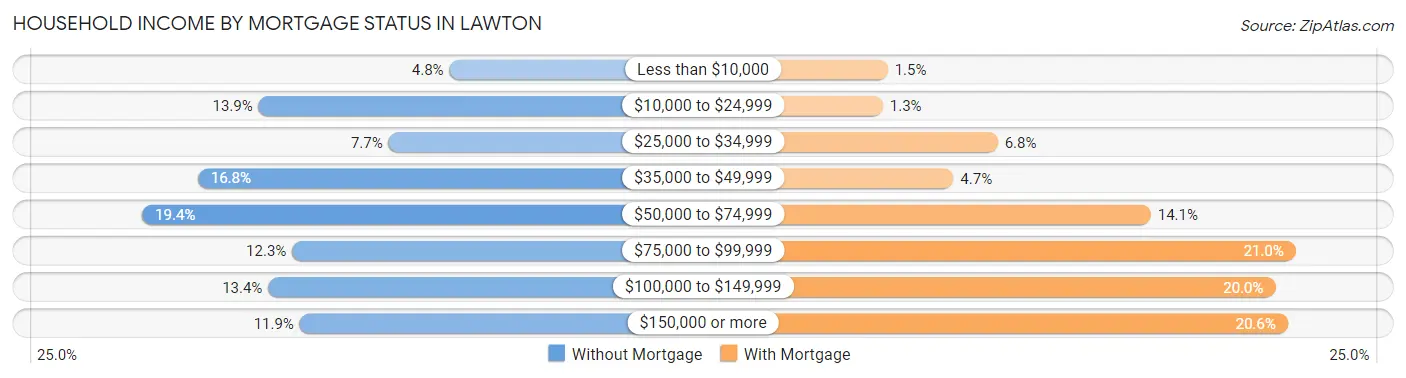
| Household Income | Without Mortgage | With Mortgage |
| Less than $10,000 | 289 (4.8%) | 134 (1.5%) |
| $10,000 to $24,999 | 840 (13.9%) | 114 (1.3%) |
| $25,000 to $34,999 | 465 (7.7%) | 593 (6.8%) |
| $35,000 to $49,999 | 1,015 (16.8%) | 408 (4.7%) |
| $50,000 to $74,999 | 1,176 (19.4%) | 1,231 (14.1%) |
| $75,000 to $99,999 | 743 (12.3%) | 1,835 (21.0%) |
| $100,000 to $149,999 | 812 (13.4%) | 1,750 (20.0%) |
| $150,000 or more | 721 (11.9%) | 1,802 (20.6%) |
| Total | 6,061 (100.0%) | 8,756 (100.0%) |
Property Value to Household Income Ratio in Lawton
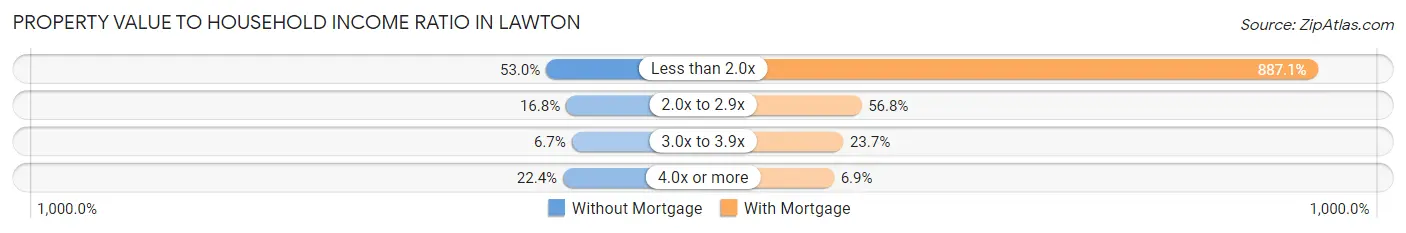
| Value-to-Income Ratio | Without Mortgage | With Mortgage |
| Less than 2.0x | 3,211 (53.0%) | 77,676 (887.1%) |
| 2.0x to 2.9x | 1,015 (16.8%) | 4,971 (56.8%) |
| 3.0x to 3.9x | 405 (6.7%) | 2,075 (23.7%) |
| 4.0x or more | 1,357 (22.4%) | 606 (6.9%) |
| Total | 6,061 (100.0%) | 8,756 (100.0%) |
Real Estate Taxes by Mortgage Status in Lawton
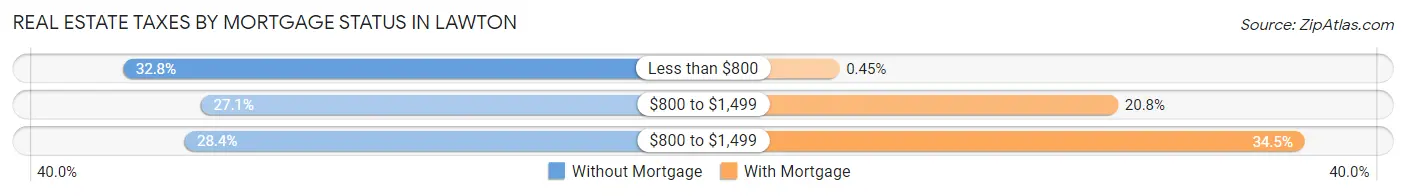
| Property Taxes | Without Mortgage | With Mortgage |
| Less than $800 | 1,989 (32.8%) | 39 (0.4%) |
| $800 to $1,499 | 1,645 (27.1%) | 1,822 (20.8%) |
| $800 to $1,499 | 1,718 (28.3%) | 3,017 (34.5%) |
| Total | 6,061 (100.0%) | 8,756 (100.0%) |
Health & Disability in Lawton
Health Insurance Coverage by Age in Lawton
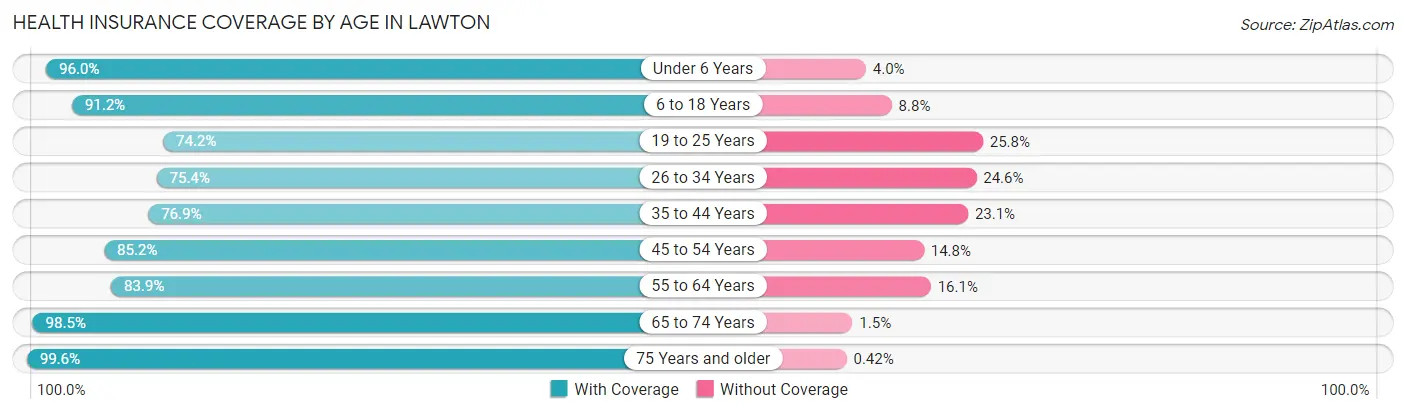
| Age Bracket | With Coverage | Without Coverage |
| Under 6 Years | 7,501 (96.0%) | 314 (4.0%) |
| 6 to 18 Years | 12,722 (91.2%) | 1,232 (8.8%) |
| 19 to 25 Years | 5,616 (74.2%) | 1,955 (25.8%) |
| 26 to 34 Years | 8,220 (75.4%) | 2,685 (24.6%) |
| 35 to 44 Years | 7,662 (76.9%) | 2,297 (23.1%) |
| 45 to 54 Years | 7,022 (85.2%) | 1,223 (14.8%) |
| 55 to 64 Years | 7,964 (83.9%) | 1,531 (16.1%) |
| 65 to 74 Years | 6,145 (98.5%) | 94 (1.5%) |
| 75 Years and older | 3,752 (99.6%) | 16 (0.4%) |
| Total | 66,604 (85.4%) | 11,347 (14.6%) |
Health Insurance Coverage by Citizenship Status in Lawton
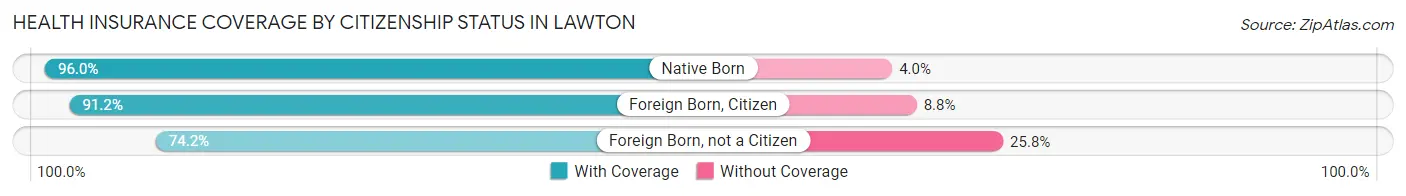
| Citizenship Status | With Coverage | Without Coverage |
| Native Born | 7,501 (96.0%) | 314 (4.0%) |
| Foreign Born, Citizen | 12,722 (91.2%) | 1,232 (8.8%) |
| Foreign Born, not a Citizen | 5,616 (74.2%) | 1,955 (25.8%) |
Health Insurance Coverage by Household Income in Lawton
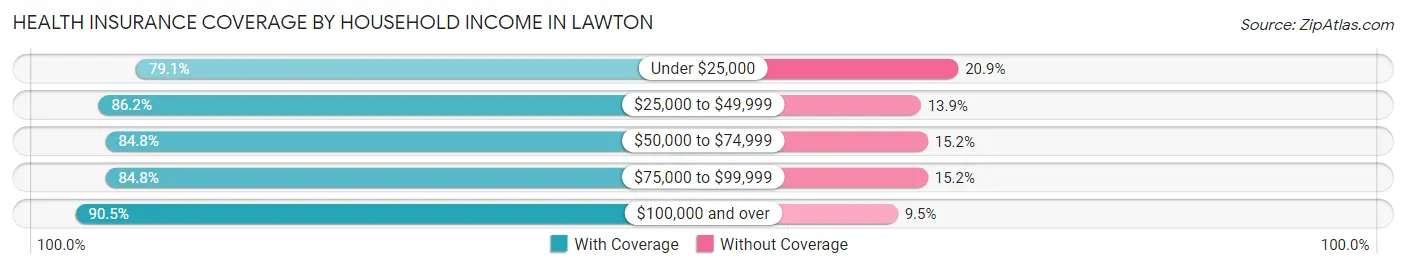
| Household Income | With Coverage | Without Coverage |
| Under $25,000 | 11,059 (79.1%) | 2,919 (20.9%) |
| $25,000 to $49,999 | 15,865 (86.2%) | 2,551 (13.9%) |
| $50,000 to $74,999 | 13,485 (84.8%) | 2,411 (15.2%) |
| $75,000 to $99,999 | 9,412 (84.8%) | 1,683 (15.2%) |
| $100,000 and over | 16,533 (90.5%) | 1,743 (9.5%) |
Public vs Private Health Insurance Coverage by Age in Lawton
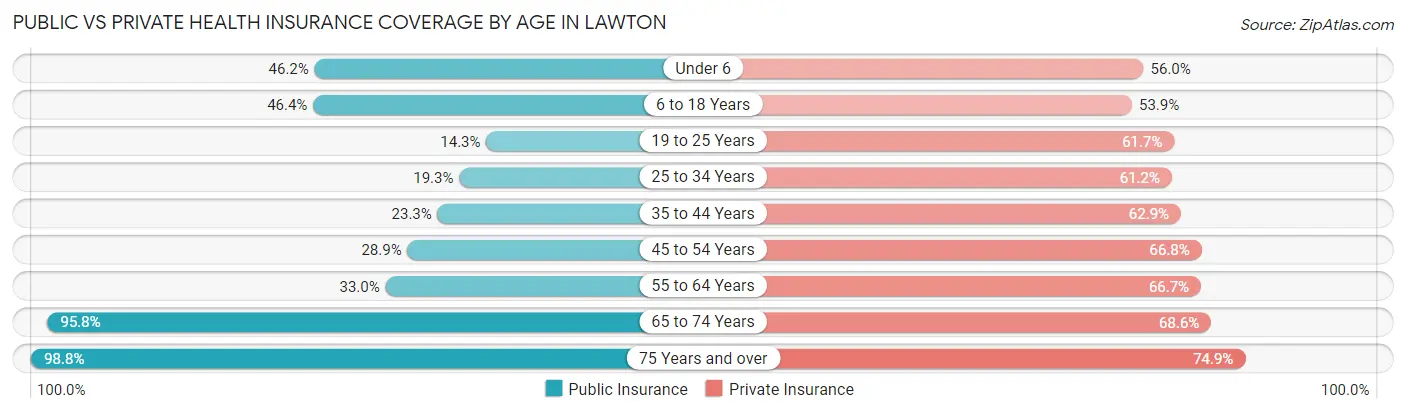
| Age Bracket | Public Insurance | Private Insurance |
| Under 6 | 3,608 (46.2%) | 4,378 (56.0%) |
| 6 to 18 Years | 6,479 (46.4%) | 7,519 (53.9%) |
| 19 to 25 Years | 1,082 (14.3%) | 4,671 (61.7%) |
| 25 to 34 Years | 2,107 (19.3%) | 6,678 (61.2%) |
| 35 to 44 Years | 2,324 (23.3%) | 6,268 (62.9%) |
| 45 to 54 Years | 2,385 (28.9%) | 5,506 (66.8%) |
| 55 to 64 Years | 3,133 (33.0%) | 6,329 (66.7%) |
| 65 to 74 Years | 5,976 (95.8%) | 4,277 (68.5%) |
| 75 Years and over | 3,723 (98.8%) | 2,821 (74.9%) |
| Total | 30,817 (39.5%) | 48,447 (62.2%) |
Disability Status by Sex by Age in Lawton
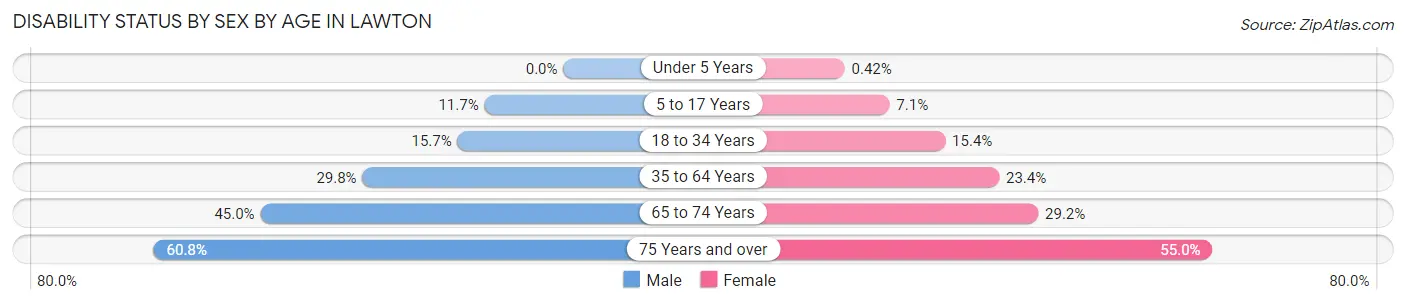
| Age Bracket | Male | Female |
| Under 5 Years | 0 (0.0%) | 13 (0.4%) |
| 5 to 17 Years | 836 (11.7%) | 513 (7.1%) |
| 18 to 34 Years | 1,356 (15.7%) | 1,658 (15.3%) |
| 35 to 64 Years | 3,927 (29.8%) | 3,393 (23.4%) |
| 65 to 74 Years | 1,268 (45.0%) | 997 (29.1%) |
| 75 Years and over | 926 (60.8%) | 1,236 (55.0%) |
Disability Class by Sex by Age in Lawton
Disability Class: Hearing Difficulty
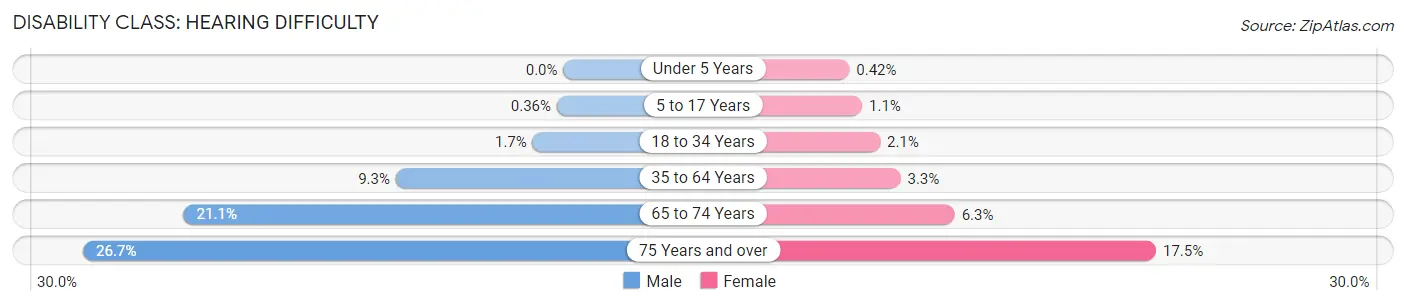
| Age Bracket | Male | Female |
| Under 5 Years | 0 (0.0%) | 13 (0.4%) |
| 5 to 17 Years | 26 (0.4%) | 82 (1.1%) |
| 18 to 34 Years | 148 (1.7%) | 230 (2.1%) |
| 35 to 64 Years | 1,229 (9.3%) | 475 (3.3%) |
| 65 to 74 Years | 596 (21.1%) | 215 (6.3%) |
| 75 Years and over | 407 (26.7%) | 393 (17.5%) |
Disability Class: Vision Difficulty
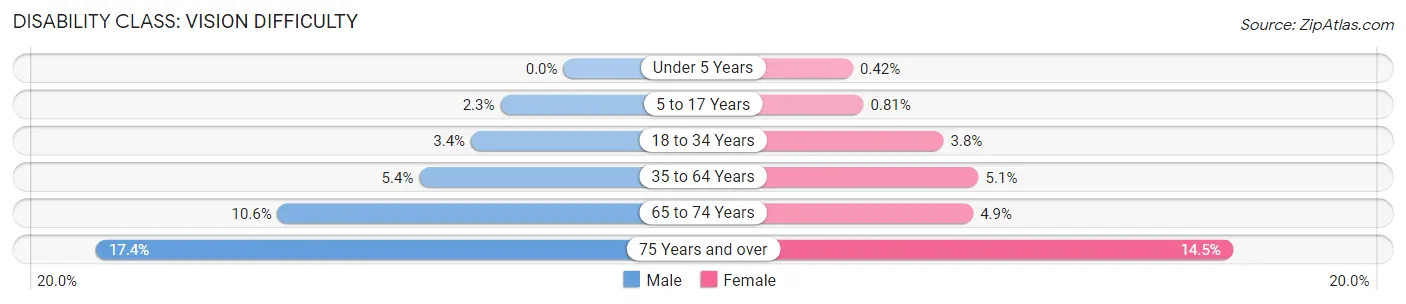
| Age Bracket | Male | Female |
| Under 5 Years | 0 (0.0%) | 13 (0.4%) |
| 5 to 17 Years | 167 (2.3%) | 59 (0.8%) |
| 18 to 34 Years | 296 (3.4%) | 408 (3.8%) |
| 35 to 64 Years | 705 (5.3%) | 738 (5.1%) |
| 65 to 74 Years | 299 (10.6%) | 167 (4.9%) |
| 75 Years and over | 264 (17.3%) | 326 (14.5%) |
Disability Class: Cognitive Difficulty
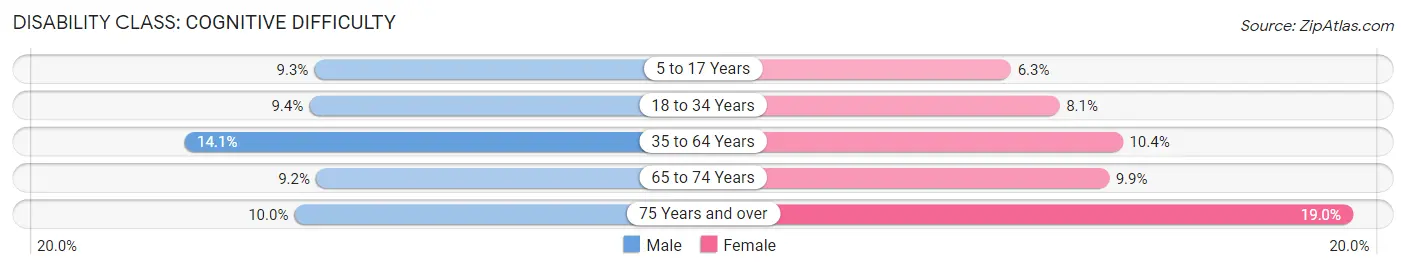
| Age Bracket | Male | Female |
| 5 to 17 Years | 660 (9.2%) | 455 (6.3%) |
| 18 to 34 Years | 815 (9.4%) | 871 (8.1%) |
| 35 to 64 Years | 1,854 (14.1%) | 1,514 (10.4%) |
| 65 to 74 Years | 259 (9.2%) | 339 (9.9%) |
| 75 Years and over | 152 (10.0%) | 426 (19.0%) |
Disability Class: Ambulatory Difficulty
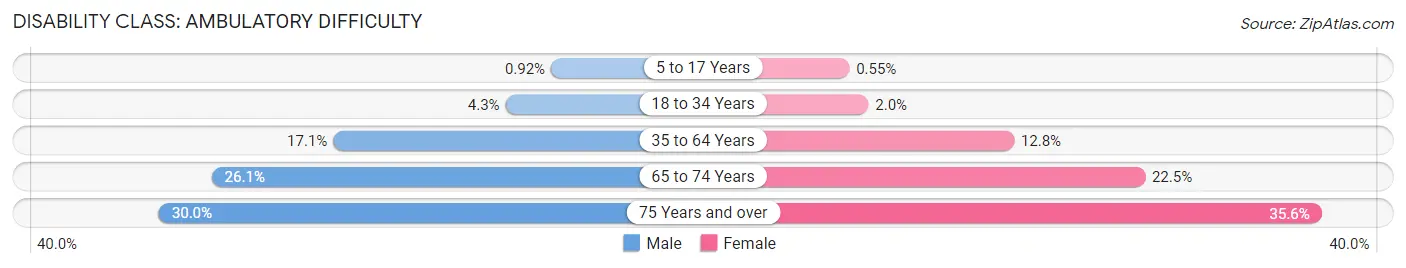
| Age Bracket | Male | Female |
| 5 to 17 Years | 66 (0.9%) | 40 (0.5%) |
| 18 to 34 Years | 371 (4.3%) | 213 (2.0%) |
| 35 to 64 Years | 2,250 (17.1%) | 1,857 (12.8%) |
| 65 to 74 Years | 736 (26.1%) | 770 (22.5%) |
| 75 Years and over | 457 (30.0%) | 800 (35.6%) |
Disability Class: Self-Care Difficulty
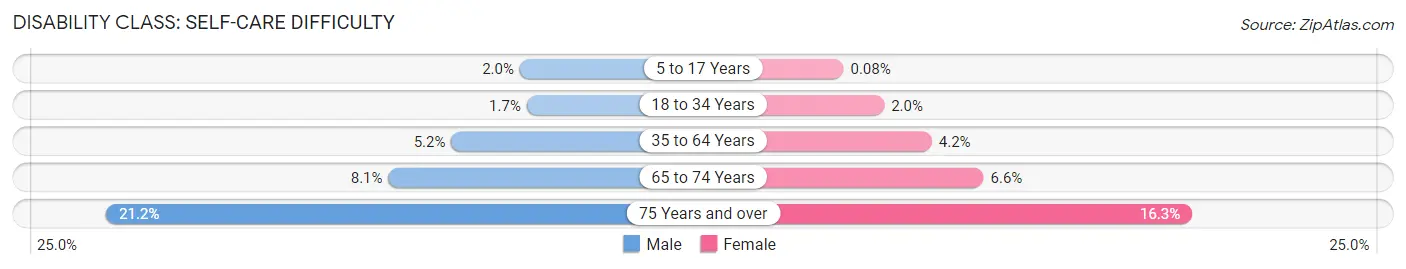
| Age Bracket | Male | Female |
| 5 to 17 Years | 144 (2.0%) | 6 (0.1%) |
| 18 to 34 Years | 147 (1.7%) | 213 (2.0%) |
| 35 to 64 Years | 684 (5.2%) | 608 (4.2%) |
| 65 to 74 Years | 229 (8.1%) | 225 (6.6%) |
| 75 Years and over | 323 (21.2%) | 365 (16.3%) |
Technology Access in Lawton
Computing Device Access in Lawton
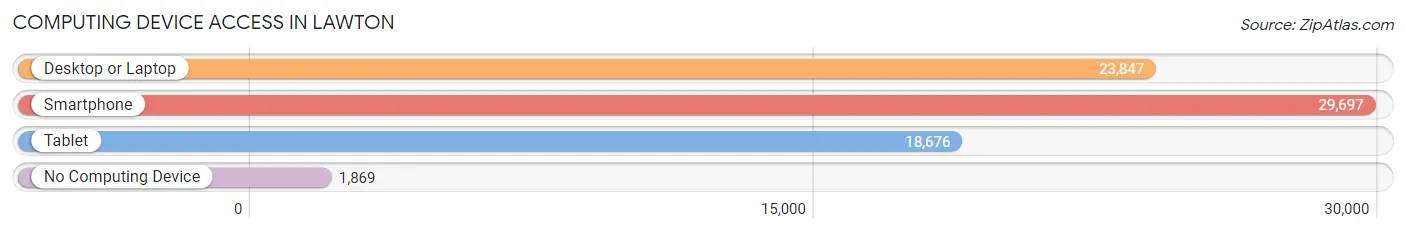
| Device Type | # Households | % Households |
| Desktop or Laptop | 23,847 | 72.0% |
| Smartphone | 29,697 | 89.6% |
| Tablet | 18,676 | 56.4% |
| No Computing Device | 1,869 | 5.6% |
| Total | 33,144 | 100.0% |
Internet Access in Lawton
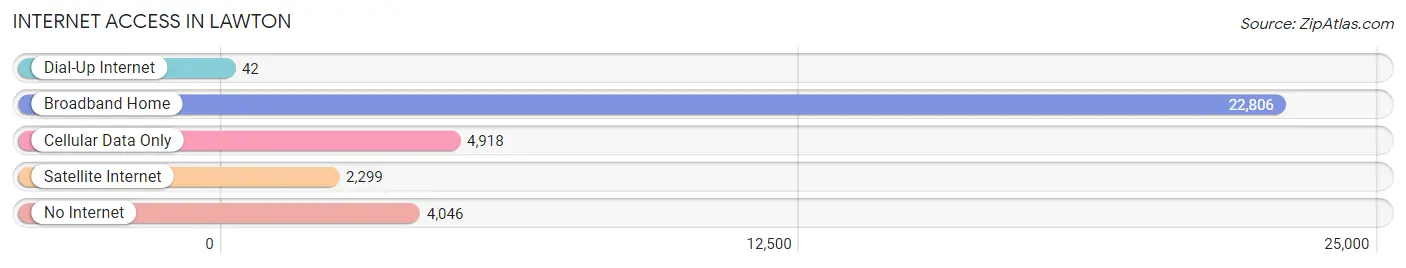
| Internet Type | # Households | % Households |
| Dial-Up Internet | 42 | 0.1% |
| Broadband Home | 22,806 | 68.8% |
| Cellular Data Only | 4,918 | 14.8% |
| Satellite Internet | 2,299 | 6.9% |
| No Internet | 4,046 | 12.2% |
| Total | 33,144 | 100.0% |
Lawton Summary
Lawton, Oklahoma is a city located in the southwestern part of the state, in Comanche County. It is the county seat and the largest city in the county. The city is situated in the Great Plains region of the United States, and is located approximately 85 miles southwest of Oklahoma City. The city is home to Fort Sill, a major U.S. Army installation, and is the principal city of the Lawton, Oklahoma Metropolitan Statistical Area.
History
Lawton was founded in 1901, when the federal government opened the area for settlement. The city was named after Major General Henry Ware Lawton, a Civil War hero who was killed in action in the Philippines in 1899. The city was incorporated in 1902, and the first mayor was elected in 1903.
In the early years, Lawton was a small agricultural community, with a population of just over 1,000. The city grew rapidly after World War II, when Fort Sill was expanded and the population of the city increased to over 20,000. The city continued to grow throughout the 1950s and 1960s, and by the 1970s, the population had reached over 50,000.
Geography
Lawton is located in southwestern Oklahoma, in Comanche County. The city is situated in the Great Plains region of the United States, and is located approximately 85 miles southwest of Oklahoma City. The city is situated at the intersection of Interstate 44 and U.S. Highway 62.
The city has a total area of 44.3 square miles, of which 44.2 square miles is land and 0.1 square miles is water. The city is located at an elevation of 1,068 feet above sea level.
Economy
Lawton’s economy is largely driven by Fort Sill, which is the largest employer in the city. Other major employers include the Lawton Public Schools, Cameron University, and the Comanche County Memorial Hospital.
The city is also home to a number of manufacturing and industrial companies, including Goodyear Tire and Rubber Company, Lawton Manufacturing Company, and Lawton Steel. The city is also home to a number of retail stores, restaurants, and other businesses.
Demographics
As of the 2010 census, the population of Lawton was 96,867. The racial makeup of the city was 68.2% White, 17.3% African American, 8.2% Native American, 1.2% Asian, 0.1% Pacific Islander, and 3.9% from other races. Hispanic or Latino of any race were 8.3% of the population.
The median household income in Lawton was $41,945, and the median family income was $50,945. The per capita income for the city was $20,945. About 17.2% of the population was below the poverty line.
Lawton is served by the Lawton Public Schools, which includes 19 elementary schools, five middle schools, and four high schools. The city is also home to Cameron University, a four-year public university.
Common Questions
What is Per Capita Income in Lawton?
Per Capita income in Lawton is $27,221.
What is the Median Family Income in Lawton?
Median Family Income in Lawton is $62,222.
What is the Median Household income in Lawton?
Median Household Income in Lawton is $51,561.
What is Income or Wage Gap in Lawton?
Income or Wage Gap in Lawton is 17.5%.
Women in Lawton earn 82.5 cents for every dollar earned by a man.
What is Family Income Deficit in Lawton?
Family Income Deficit in Lawton is $11,691.
Families that are below poverty line in Lawton earn $11,691 less on average than the poverty threshold level.
What is Inequality or Gini Index in Lawton?
Inequality or Gini Index in Lawton is 0.45.
What is the Total Population of Lawton?
Total Population of Lawton is 91,023.
What is the Total Male Population of Lawton?
Total Male Population of Lawton is 47,663.
What is the Total Female Population of Lawton?
Total Female Population of Lawton is 43,360.
What is the Ratio of Males per 100 Females in Lawton?
There are 109.92 Males per 100 Females in Lawton.
What is the Ratio of Females per 100 Males in Lawton?
There are 90.97 Females per 100 Males in Lawton.
What is the Median Population Age in Lawton?
Median Population Age in Lawton is 31.9 Years.
What is the Average Family Size in Lawton
Average Family Size in Lawton is 3.1 People.
What is the Average Household Size in Lawton
Average Household Size in Lawton is 2.5 People.
How Large is the Labor Force in Lawton?
There are 44,476 People in the Labor Forcein in Lawton.
What is the Percentage of People in the Labor Force in Lawton?
61.7% of People are in the Labor Force in Lawton.
What is the Unemployment Rate in Lawton?
Unemployment Rate in Lawton is 7.7%.