Apache Junction, AZ Map & Demographics
Apache Junction Map
Apache Junction Overview
$34,148
PER CAPITA INCOME
$67,412
AVG FAMILY INCOME
$56,209
AVG HOUSEHOLD INCOME
24.9%
WAGE / INCOME GAP [ % ]
75.1¢/ $1
WAGE / INCOME GAP [ $ ]
$7,651
FAMILY INCOME DEFICIT
0.44
INEQUALITY / GINI INDEX
38,855
TOTAL POPULATION
19,160
MALE POPULATION
19,695
FEMALE POPULATION
97.28
MALES / 100 FEMALES
102.79
FEMALES / 100 MALES
53.9
MEDIAN AGE
2.7
AVG FAMILY SIZE
2.1
AVG HOUSEHOLD SIZE
16,095
LABOR FORCE [ PEOPLE ]
47.7%
PERCENT IN LABOR FORCE
8.9%
UNEMPLOYMENT RATE
Income in Apache Junction
Income Overview in Apache Junction
Per Capita Income in Apache Junction is $34,148, while median incomes of families and households are $67,412 and $56,209 respectively.
| Characteristic | Number | Measure |
| Per Capita Income | 38,855 | $34,148 |
| Median Family Income | 10,358 | $67,412 |
| Mean Family Income | 10,358 | $79,941 |
| Median Household Income | 17,914 | $56,209 |
| Mean Household Income | 17,914 | $72,859 |
| Income Deficit | 10,358 | $7,651 |
| Wage / Income Gap (%) | 38,855 | 24.87% |
| Wage / Income Gap ($) | 38,855 | 75.13¢ per $1 |
| Gini / Inequality Index | 38,855 | 0.44 |
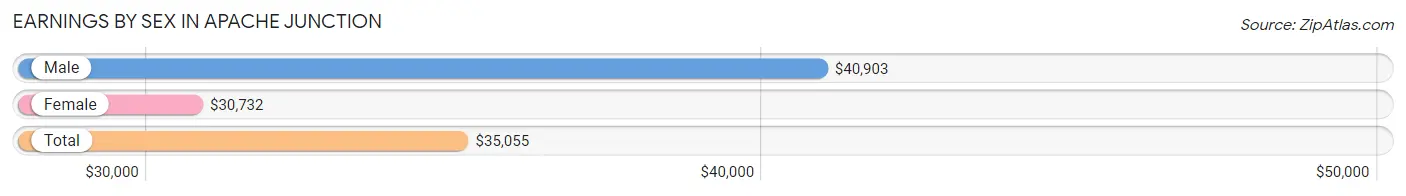
Earnings by Sex in Apache Junction
Average Earnings in Apache Junction are $35,055, $40,903 for men and $30,732 for women, a difference of 24.9%.
| Sex | Number | Average Earnings |
| Male | 9,861 (58.5%) | $40,903 |
| Female | 7,003 (41.5%) | $30,732 |
| Total | 16,864 (100.0%) | $35,055 |
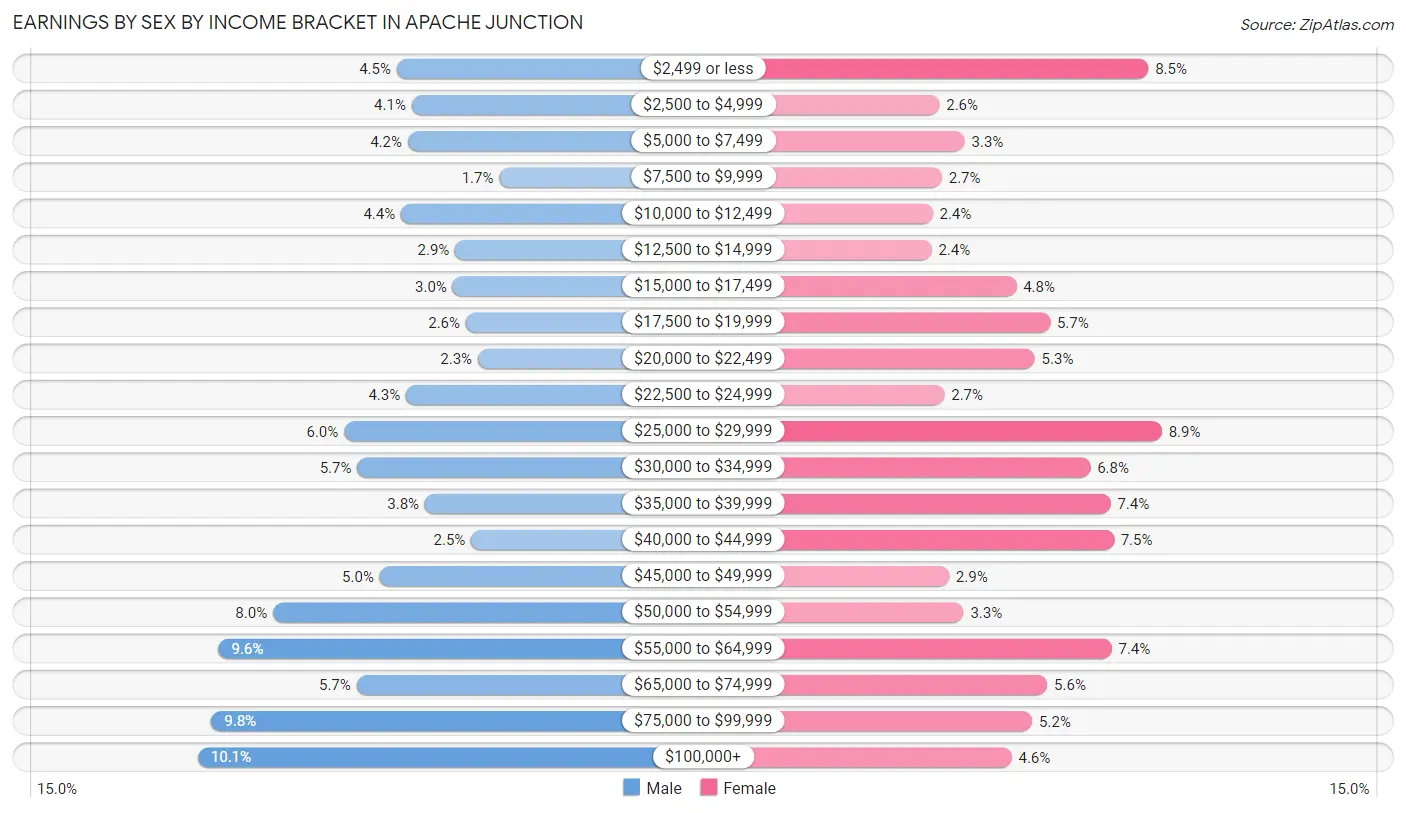
Earnings by Sex by Income Bracket in Apache Junction
The most common earnings brackets in Apache Junction are $100,000+ for men (999 | 10.1%) and $25,000 to $29,999 for women (620 | 8.8%).
| Income | Male | Female |
| $2,499 or less | 448 (4.5%) | 593 (8.5%) |
| $2,500 to $4,999 | 406 (4.1%) | 182 (2.6%) |
| $5,000 to $7,499 | 417 (4.2%) | 232 (3.3%) |
| $7,500 to $9,999 | 164 (1.7%) | 187 (2.7%) |
| $10,000 to $12,499 | 436 (4.4%) | 169 (2.4%) |
| $12,500 to $14,999 | 286 (2.9%) | 167 (2.4%) |
| $15,000 to $17,499 | 293 (3.0%) | 333 (4.8%) |
| $17,500 to $19,999 | 256 (2.6%) | 400 (5.7%) |
| $20,000 to $22,499 | 223 (2.3%) | 370 (5.3%) |
| $22,500 to $24,999 | 422 (4.3%) | 192 (2.7%) |
| $25,000 to $29,999 | 594 (6.0%) | 620 (8.8%) |
| $30,000 to $34,999 | 557 (5.7%) | 479 (6.8%) |
| $35,000 to $39,999 | 370 (3.7%) | 519 (7.4%) |
| $40,000 to $44,999 | 242 (2.5%) | 525 (7.5%) |
| $45,000 to $49,999 | 495 (5.0%) | 201 (2.9%) |
| $50,000 to $54,999 | 791 (8.0%) | 230 (3.3%) |
| $55,000 to $64,999 | 942 (9.6%) | 521 (7.4%) |
| $65,000 to $74,999 | 559 (5.7%) | 394 (5.6%) |
| $75,000 to $99,999 | 961 (9.8%) | 365 (5.2%) |
| $100,000+ | 999 (10.1%) | 324 (4.6%) |
| Total | 9,861 (100.0%) | 7,003 (100.0%) |
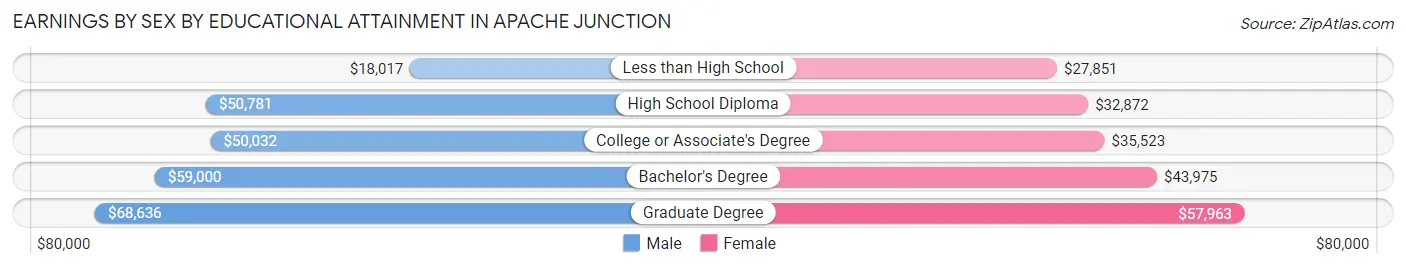
Earnings by Sex by Educational Attainment in Apache Junction
Average earnings in Apache Junction are $48,304 for men and $34,709 for women, a difference of 28.1%. Men with an educational attainment of graduate degree enjoy the highest average annual earnings of $68,636, while those with less than high school education earn the least with $18,017. Women with an educational attainment of graduate degree earn the most with the average annual earnings of $57,963, while those with less than high school education have the smallest earnings of $27,851.
| Educational Attainment | Male Income | Female Income |
| Less than High School | $18,017 | $27,851 |
| High School Diploma | $50,781 | $32,872 |
| College or Associate's Degree | $50,032 | $35,523 |
| Bachelor's Degree | $59,000 | $43,975 |
| Graduate Degree | $68,636 | $57,963 |
| Total | $48,304 | $34,709 |
Family Income in Apache Junction
Family Income Brackets in Apache Junction
According to the Apache Junction family income data, there are 2,714 families falling into the $50,000 to $74,999 income range, which is the most common income bracket and makes up 26.2% of all families. Conversely, the $10,000 to $14,999 income bracket is the least frequent group with only 186 families (1.8%) belonging to this category.
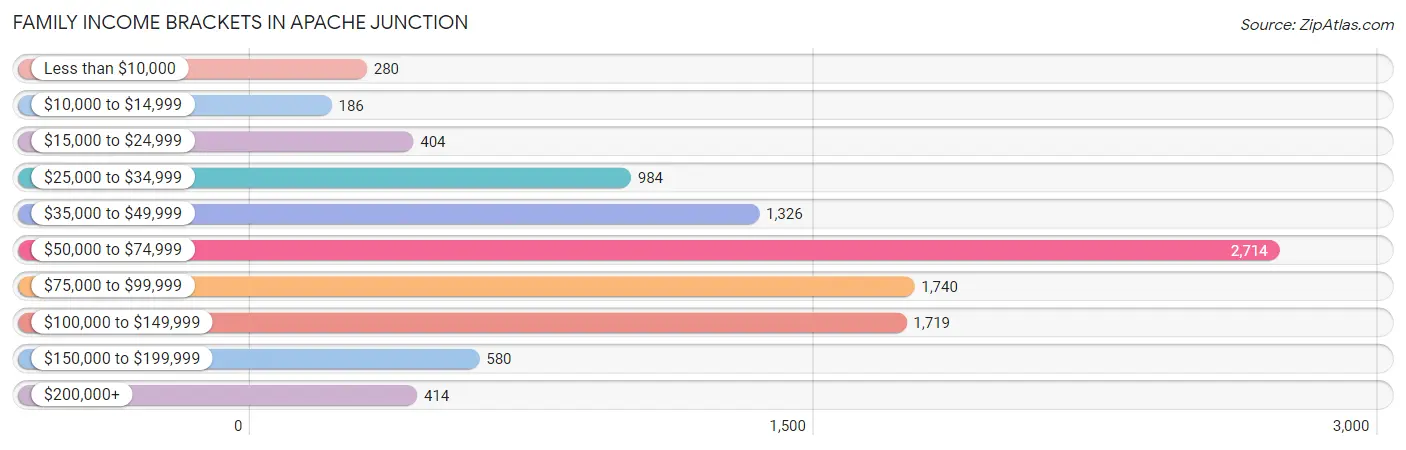
| Income Bracket | # Families | % Families |
| Less than $10,000 | 280 | 2.7% |
| $10,000 to $14,999 | 186 | 1.8% |
| $15,000 to $24,999 | 404 | 3.9% |
| $25,000 to $34,999 | 984 | 9.5% |
| $35,000 to $49,999 | 1,326 | 12.8% |
| $50,000 to $74,999 | 2,714 | 26.2% |
| $75,000 to $99,999 | 1,740 | 16.8% |
| $100,000 to $149,999 | 1,719 | 16.6% |
| $150,000 to $199,999 | 580 | 5.6% |
| $200,000+ | 414 | 4.0% |
Family Income by Famaliy Size in Apache Junction
4-person families (1,135 | 11.0%) account for the highest median family income in Apache Junction with $101,506 per family, while 2-person families (6,686 | 64.5%) have the highest median income of $30,464 per family member.
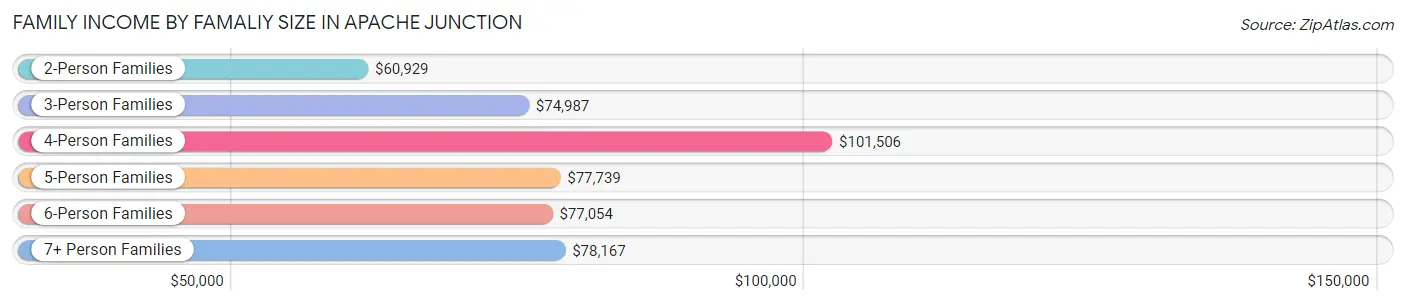
| Income Bracket | # Families | Median Income |
| 2-Person Families | 6,686 (64.5%) | $60,929 |
| 3-Person Families | 1,555 (15.0%) | $74,987 |
| 4-Person Families | 1,135 (11.0%) | $101,506 |
| 5-Person Families | 511 (4.9%) | $77,739 |
| 6-Person Families | 317 (3.1%) | $77,054 |
| 7+ Person Families | 154 (1.5%) | $78,167 |
| Total | 10,358 (100.0%) | $67,412 |
Family Income by Number of Earners in Apache Junction
The median family income in Apache Junction is $67,412, with families comprising 3+ earners (841) having the highest median family income of $109,063, while families with no earners (3,680) have the lowest median family income of $52,408, accounting for 8.1% and 35.5% of families, respectively.
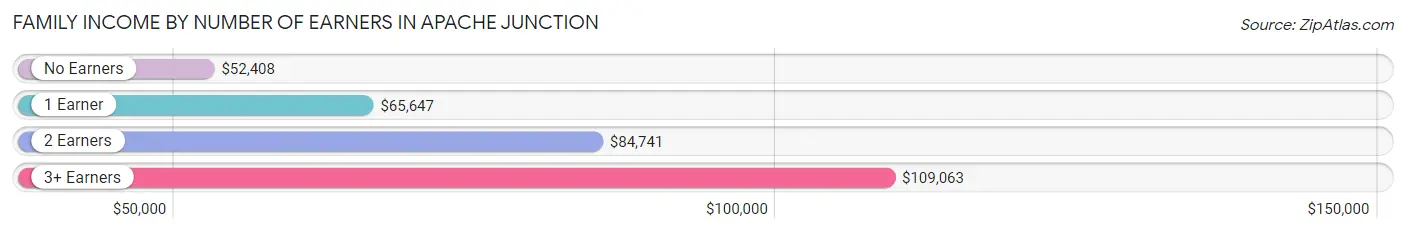
| Number of Earners | # Families | Median Income |
| No Earners | 3,680 (35.5%) | $52,408 |
| 1 Earner | 3,305 (31.9%) | $65,647 |
| 2 Earners | 2,532 (24.4%) | $84,741 |
| 3+ Earners | 841 (8.1%) | $109,063 |
| Total | 10,358 (100.0%) | $67,412 |
Household Income in Apache Junction
Household Income Brackets in Apache Junction
With 3,583 households falling in the category, the $50,000 to $74,999 income range is the most frequent in Apache Junction, accounting for 20.0% of all households. In contrast, only 591 households (3.3%) fall into the $200,000+ income bracket, making it the least populous group.
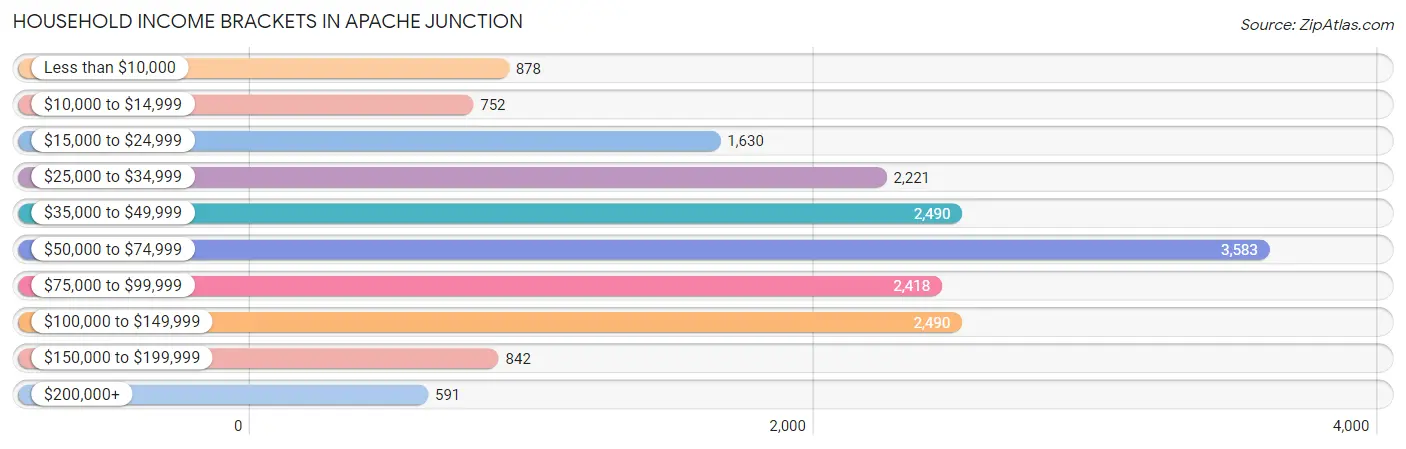
| Income Bracket | # Households | % Households |
| Less than $10,000 | 878 | 4.9% |
| $10,000 to $14,999 | 752 | 4.2% |
| $15,000 to $24,999 | 1,630 | 9.1% |
| $25,000 to $34,999 | 2,221 | 12.4% |
| $35,000 to $49,999 | 2,490 | 13.9% |
| $50,000 to $74,999 | 3,583 | 20.0% |
| $75,000 to $99,999 | 2,418 | 13.5% |
| $100,000 to $149,999 | 2,490 | 13.9% |
| $150,000 to $199,999 | 842 | 4.7% |
| $200,000+ | 591 | 3.3% |
Household Income by Householder Age in Apache Junction
The median household income in Apache Junction is $56,209, with the highest median household income of $77,482 found in the 25 to 44 years age bracket for the primary householder. A total of 3,781 households (21.1%) fall into this category. Meanwhile, the 65+ years age bracket for the primary householder has the lowest median household income of $45,627, with 8,338 households (46.5%) in this group.
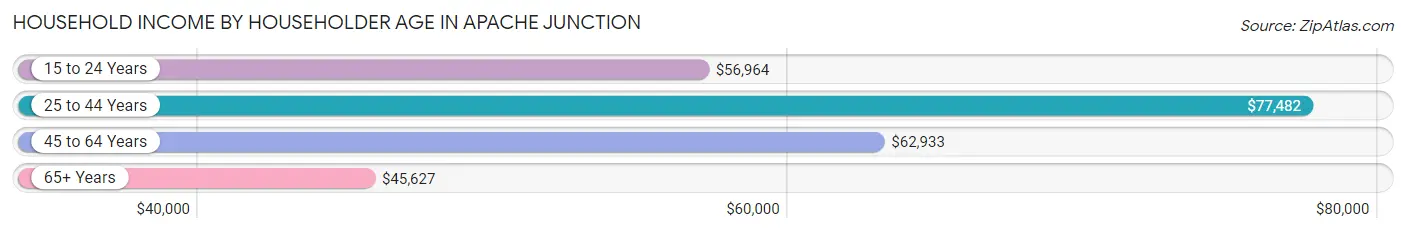
| Income Bracket | # Households | Median Income |
| 15 to 24 Years | 310 (1.7%) | $56,964 |
| 25 to 44 Years | 3,781 (21.1%) | $77,482 |
| 45 to 64 Years | 5,485 (30.6%) | $62,933 |
| 65+ Years | 8,338 (46.5%) | $45,627 |
| Total | 17,914 (100.0%) | $56,209 |
Poverty in Apache Junction
Income Below Poverty by Sex and Age in Apache Junction
With 11.1% poverty level for males and 13.3% for females among the residents of Apache Junction, 6 to 11 year old males and 6 to 11 year old females are the most vulnerable to poverty, with 206 males (22.1%) and 181 females (22.4%) in their respective age groups living below the poverty level.
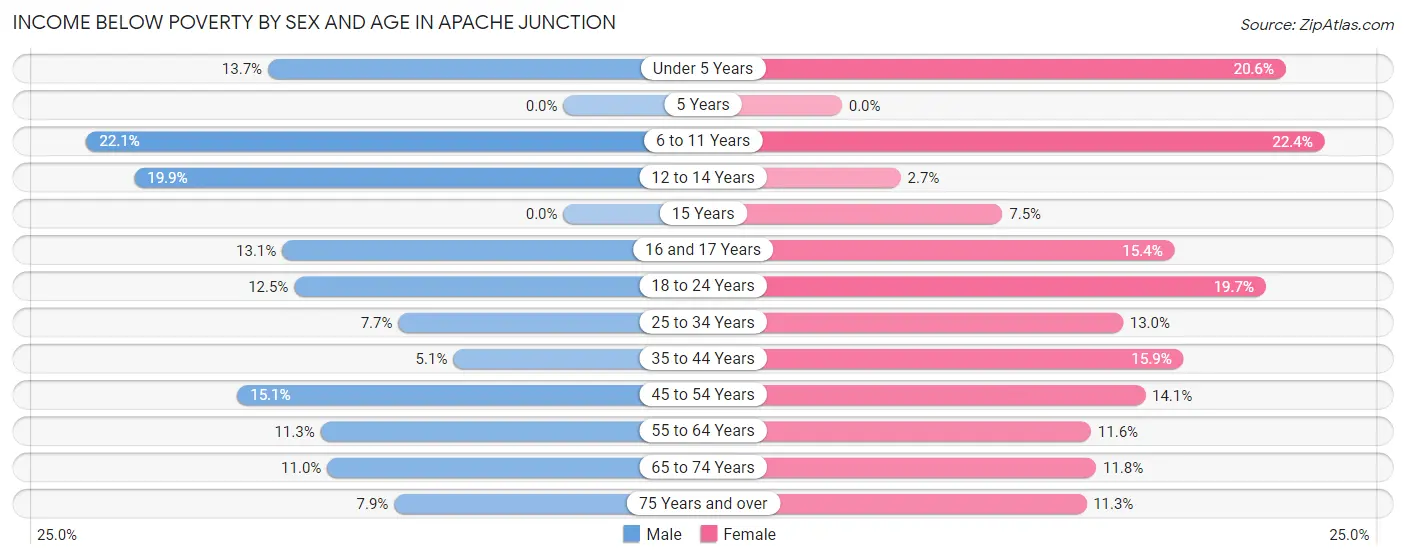
| Age Bracket | Male | Female |
| Under 5 Years | 98 (13.7%) | 192 (20.6%) |
| 5 Years | 0 (0.0%) | 0 (0.0%) |
| 6 to 11 Years | 206 (22.1%) | 181 (22.4%) |
| 12 to 14 Years | 137 (19.9%) | 14 (2.7%) |
| 15 Years | 0 (0.0%) | 7 (7.4%) |
| 16 and 17 Years | 56 (13.1%) | 63 (15.4%) |
| 18 to 24 Years | 155 (12.5%) | 144 (19.7%) |
| 25 to 34 Years | 193 (7.7%) | 247 (13.0%) |
| 35 to 44 Years | 83 (5.1%) | 272 (15.9%) |
| 45 to 54 Years | 327 (15.1%) | 278 (14.1%) |
| 55 to 64 Years | 288 (11.3%) | 368 (11.6%) |
| 65 to 74 Years | 324 (11.0%) | 397 (11.8%) |
| 75 Years and over | 233 (7.9%) | 430 (11.3%) |
| Total | 2,100 (11.1%) | 2,593 (13.3%) |
Income Above Poverty by Sex and Age in Apache Junction
According to the poverty statistics in Apache Junction, males aged 5 years and females aged 5 years are the age groups that are most secure financially, with 100.0% of males and 100.0% of females in these age groups living above the poverty line.
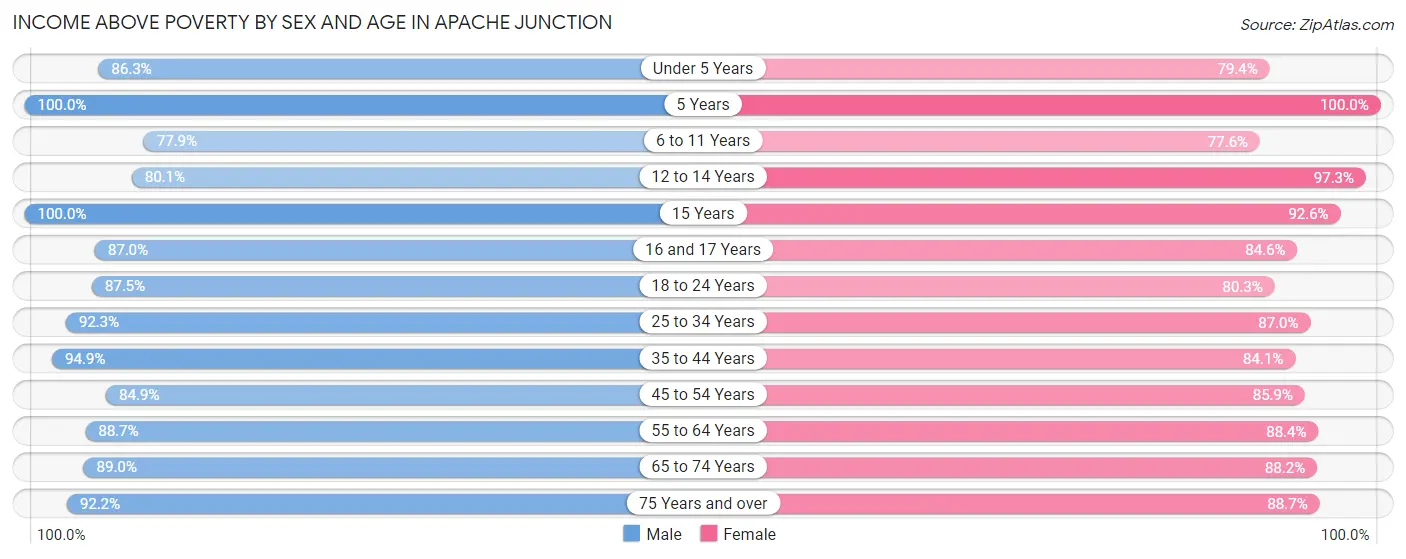
| Age Bracket | Male | Female |
| Under 5 Years | 617 (86.3%) | 740 (79.4%) |
| 5 Years | 48 (100.0%) | 163 (100.0%) |
| 6 to 11 Years | 725 (77.9%) | 627 (77.6%) |
| 12 to 14 Years | 551 (80.1%) | 499 (97.3%) |
| 15 Years | 153 (100.0%) | 87 (92.5%) |
| 16 and 17 Years | 373 (87.0%) | 345 (84.6%) |
| 18 to 24 Years | 1,086 (87.5%) | 588 (80.3%) |
| 25 to 34 Years | 2,327 (92.3%) | 1,647 (87.0%) |
| 35 to 44 Years | 1,540 (94.9%) | 1,443 (84.1%) |
| 45 to 54 Years | 1,834 (84.9%) | 1,698 (85.9%) |
| 55 to 64 Years | 2,268 (88.7%) | 2,815 (88.4%) |
| 65 to 74 Years | 2,631 (89.0%) | 2,966 (88.2%) |
| 75 Years and over | 2,736 (92.1%) | 3,362 (88.7%) |
| Total | 16,889 (88.9%) | 16,980 (86.8%) |
Income Below Poverty Among Married-Couple Families in Apache Junction
The poverty statistics for married-couple families in Apache Junction show that 6.2% or 473 of the total 7,678 families live below the poverty line. Families with 5 or more children have the highest poverty rate of 96.7%, comprising of 59 families. On the other hand, families with no children have the lowest poverty rate of 4.9%, which includes 271 families.
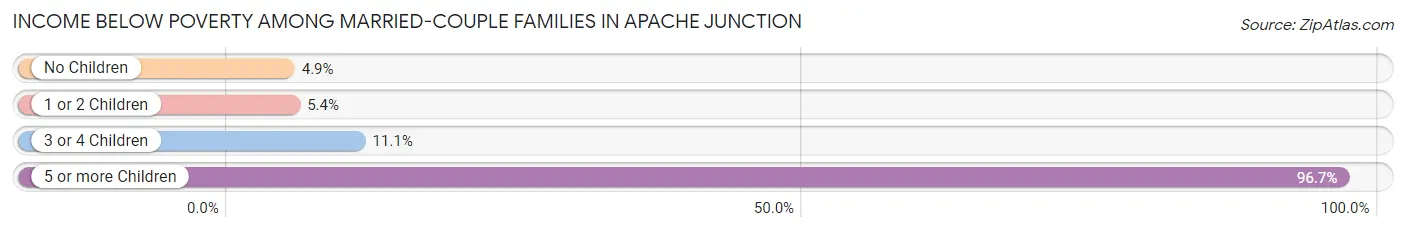
| Children | Above Poverty | Below Poverty |
| No Children | 5,216 (95.1%) | 271 (4.9%) |
| 1 or 2 Children | 1,555 (94.6%) | 89 (5.4%) |
| 3 or 4 Children | 432 (88.9%) | 54 (11.1%) |
| 5 or more Children | 2 (3.3%) | 59 (96.7%) |
| Total | 7,205 (93.8%) | 473 (6.2%) |
Income Below Poverty Among Single-Parent Households in Apache Junction
According to the poverty data in Apache Junction, 18.0% or 151 single-father households and 14.1% or 259 single-mother households are living below the poverty line. Among single-father households, those with 3 or 4 children have the highest poverty rate, with 24 households (100.0%) experiencing poverty. Likewise, among single-mother households, those with 1 or 2 children have the highest poverty rate, with 159 households (29.1%) falling below the poverty line.
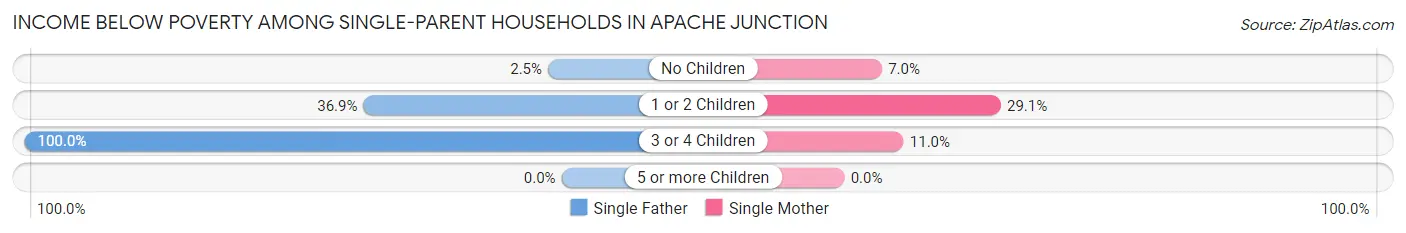
| Children | Single Father | Single Mother |
| No Children | 10 (2.5%) | 74 (7.0%) |
| 1 or 2 Children | 117 (36.9%) | 159 (29.1%) |
| 3 or 4 Children | 24 (100.0%) | 26 (11.0%) |
| 5 or more Children | 0 (0.0%) | 0 (0.0%) |
| Total | 151 (18.0%) | 259 (14.1%) |
Income Below Poverty Among Married-Couple vs Single-Parent Households in Apache Junction
The poverty data for Apache Junction shows that 473 of the married-couple family households (6.2%) and 410 of the single-parent households (15.3%) are living below the poverty level. Within the married-couple family households, those with 5 or more children have the highest poverty rate, with 59 households (96.7%) falling below the poverty line. Among the single-parent households, those with 1 or 2 children have the highest poverty rate, with 276 household (32.0%) living below poverty.
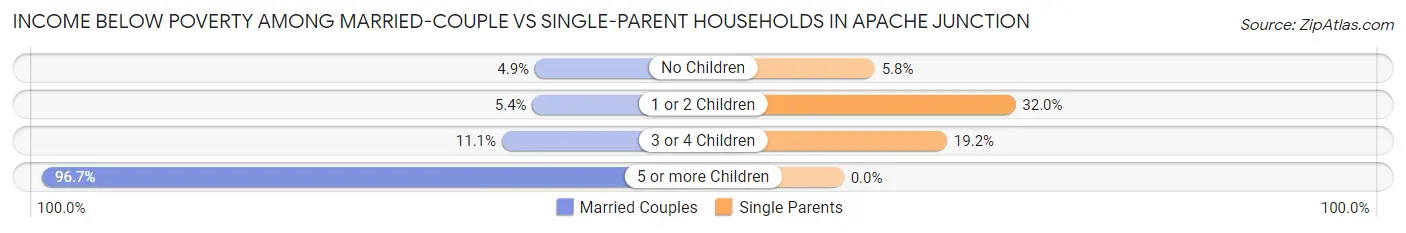
| Children | Married-Couple Families | Single-Parent Households |
| No Children | 271 (4.9%) | 84 (5.8%) |
| 1 or 2 Children | 89 (5.4%) | 276 (32.0%) |
| 3 or 4 Children | 54 (11.1%) | 50 (19.2%) |
| 5 or more Children | 59 (96.7%) | 0 (0.0%) |
| Total | 473 (6.2%) | 410 (15.3%) |
Race in Apache Junction
The most populous races in Apache Junction are White / Caucasian (32,048 | 82.5%), Hispanic or Latino (6,976 | 17.9%), and Two or more Races (3,548 | 9.1%).
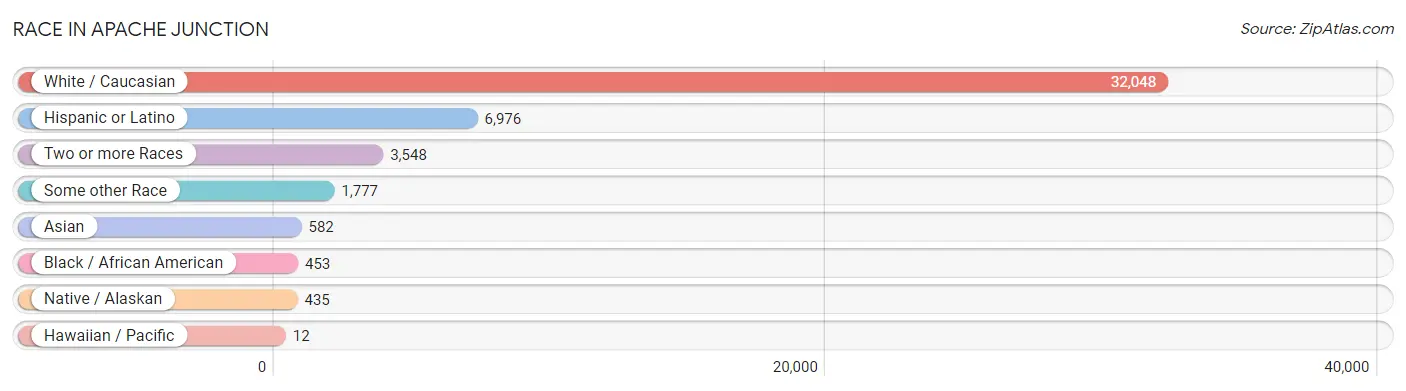
| Race | # Population | % Population |
| Asian | 582 | 1.5% |
| Black / African American | 453 | 1.2% |
| Hawaiian / Pacific | 12 | 0.0% |
| Hispanic or Latino | 6,976 | 17.9% |
| Native / Alaskan | 435 | 1.1% |
| White / Caucasian | 32,048 | 82.5% |
| Two or more Races | 3,548 | 9.1% |
| Some other Race | 1,777 | 4.6% |
| Total | 38,855 | 100.0% |
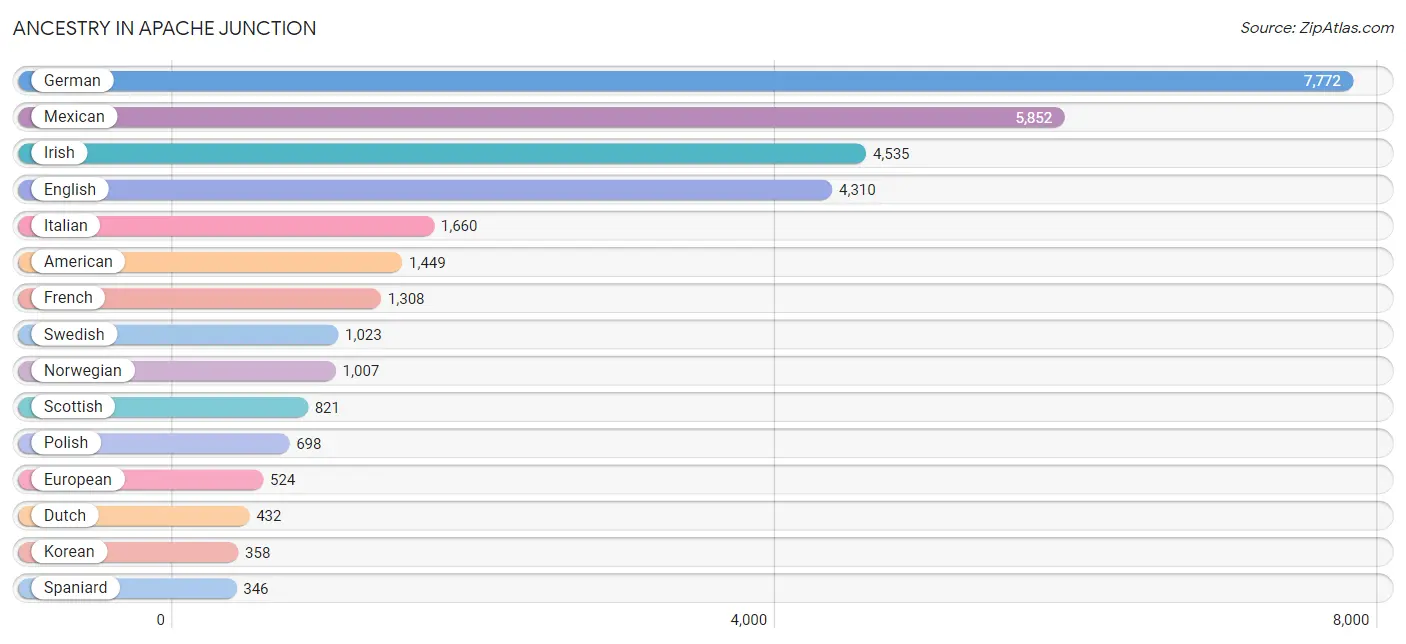
Ancestry in Apache Junction
The most populous ancestries reported in Apache Junction are German (7,772 | 20.0%), Mexican (5,852 | 15.1%), Irish (4,535 | 11.7%), English (4,310 | 11.1%), and Italian (1,660 | 4.3%), together accounting for 62.1% of all Apache Junction residents.
| Ancestry | # Population | % Population |
| Alaska Native | 39 | 0.1% |
| American | 1,449 | 3.7% |
| Apache | 45 | 0.1% |
| Arab | 26 | 0.1% |
| Armenian | 10 | 0.0% |
| Austrian | 95 | 0.2% |
| Belgian | 8 | 0.0% |
| Bhutanese | 16 | 0.0% |
| Blackfeet | 11 | 0.0% |
| British | 183 | 0.5% |
| Burmese | 161 | 0.4% |
| Canadian | 146 | 0.4% |
| Central American | 30 | 0.1% |
| Central American Indian | 32 | 0.1% |
| Cherokee | 199 | 0.5% |
| Colombian | 56 | 0.1% |
| Creek | 99 | 0.3% |
| Croatian | 7 | 0.0% |
| Czech | 110 | 0.3% |
| Czechoslovakian | 58 | 0.2% |
| Danish | 252 | 0.6% |
| Dutch | 432 | 1.1% |
| Eastern European | 150 | 0.4% |
| English | 4,310 | 11.1% |
| European | 524 | 1.3% |
| Finnish | 87 | 0.2% |
| French | 1,308 | 3.4% |
| French Canadian | 150 | 0.4% |
| German | 7,772 | 20.0% |
| Ghanaian | 249 | 0.6% |
| Greek | 43 | 0.1% |
| Guatemalan | 30 | 0.1% |
| Hungarian | 46 | 0.1% |
| Indian (Asian) | 50 | 0.1% |
| Irish | 4,535 | 11.7% |
| Iroquois | 149 | 0.4% |
| Italian | 1,660 | 4.3% |
| Jamaican | 285 | 0.7% |
| Korean | 358 | 0.9% |
| Lebanese | 26 | 0.1% |
| Lithuanian | 47 | 0.1% |
| Malaysian | 34 | 0.1% |
| Maltese | 19 | 0.1% |
| Mexican | 5,852 | 15.1% |
| Mexican American Indian | 19 | 0.1% |
| Native Hawaiian | 12 | 0.0% |
| Navajo | 291 | 0.7% |
| Northern European | 50 | 0.1% |
| Norwegian | 1,007 | 2.6% |
| Pakistani | 11 | 0.0% |
| Polish | 698 | 1.8% |
| Portuguese | 112 | 0.3% |
| Puerto Rican | 120 | 0.3% |
| Romanian | 110 | 0.3% |
| Russian | 333 | 0.9% |
| Scandinavian | 181 | 0.5% |
| Scotch-Irish | 280 | 0.7% |
| Scottish | 821 | 2.1% |
| Serbian | 21 | 0.1% |
| Sioux | 23 | 0.1% |
| Slovak | 77 | 0.2% |
| Slovene | 58 | 0.2% |
| South American | 56 | 0.1% |
| Spaniard | 346 | 0.9% |
| Spanish | 260 | 0.7% |
| Sri Lankan | 14 | 0.0% |
| Subsaharan African | 249 | 0.6% |
| Swedish | 1,023 | 2.6% |
| Swiss | 120 | 0.3% |
| Thai | 71 | 0.2% |
| Turkish | 28 | 0.1% |
| Ukrainian | 29 | 0.1% |
| Welsh | 236 | 0.6% |
| Yaqui | 21 | 0.1% |
| Yuman | 19 | 0.1% | View All 75 Rows |
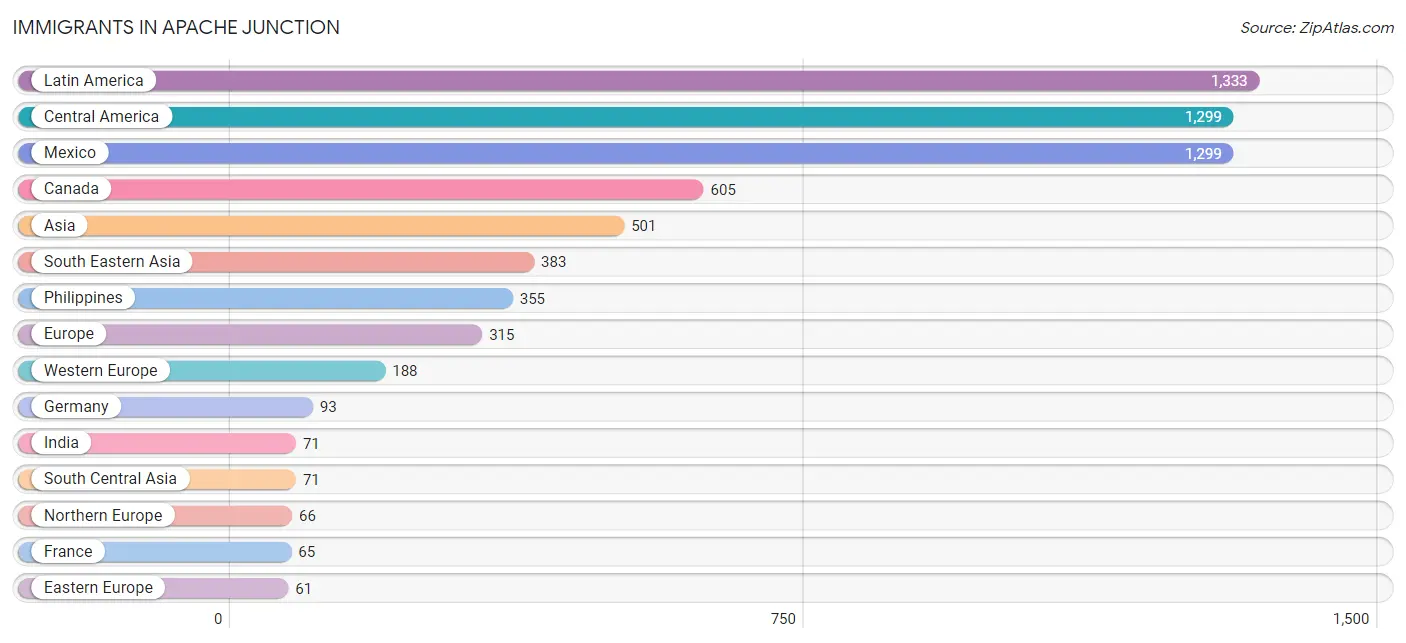
Immigrants in Apache Junction
The most numerous immigrant groups reported in Apache Junction came from Latin America (1,333 | 3.4%), Central America (1,299 | 3.3%), Mexico (1,299 | 3.3%), Canada (605 | 1.6%), and Asia (501 | 1.3%), together accounting for 13.0% of all Apache Junction residents.
| Immigration Origin | # Population | % Population |
| Africa | 48 | 0.1% |
| Asia | 501 | 1.3% |
| Austria | 5 | 0.0% |
| Canada | 605 | 1.6% |
| Central America | 1,299 | 3.3% |
| China | 4 | 0.0% |
| Colombia | 34 | 0.1% |
| Eastern Asia | 47 | 0.1% |
| Eastern Europe | 61 | 0.2% |
| England | 17 | 0.0% |
| Europe | 315 | 0.8% |
| France | 65 | 0.2% |
| Germany | 93 | 0.2% |
| Ghana | 48 | 0.1% |
| India | 71 | 0.2% |
| Korea | 43 | 0.1% |
| Laos | 17 | 0.0% |
| Latin America | 1,333 | 3.4% |
| Mexico | 1,299 | 3.3% |
| Netherlands | 15 | 0.0% |
| Northern Europe | 66 | 0.2% |
| Oceania | 41 | 0.1% |
| Philippines | 355 | 0.9% |
| Romania | 18 | 0.1% |
| Russia | 9 | 0.0% |
| Scotland | 21 | 0.1% |
| South America | 34 | 0.1% |
| South Central Asia | 71 | 0.2% |
| South Eastern Asia | 383 | 1.0% |
| Switzerland | 10 | 0.0% |
| Thailand | 11 | 0.0% |
| Western Africa | 48 | 0.1% |
| Western Europe | 188 | 0.5% | View All 33 Rows |
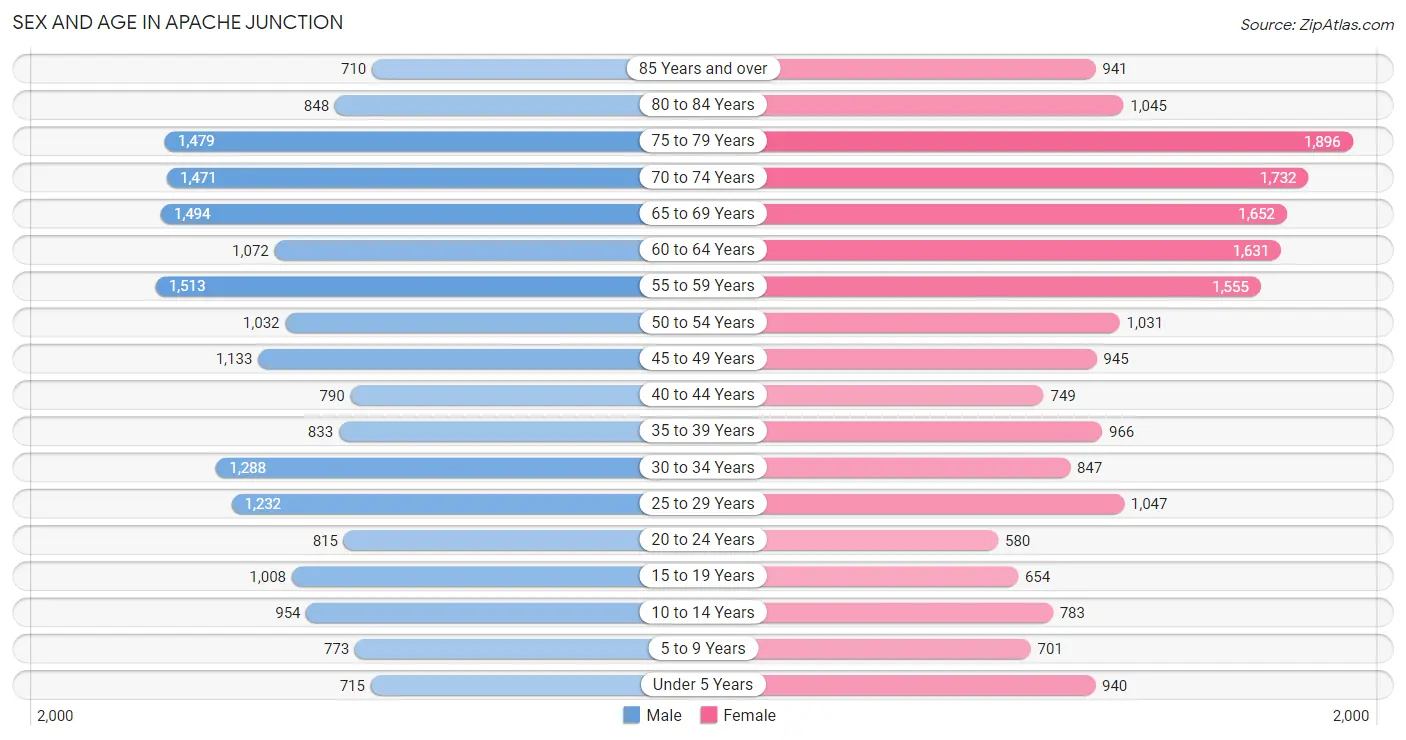
Sex and Age in Apache Junction
Sex and Age in Apache Junction
The most populous age groups in Apache Junction are 55 to 59 Years (1,513 | 7.9%) for men and 75 to 79 Years (1,896 | 9.6%) for women.
| Age Bracket | Male | Female |
| Under 5 Years | 715 (3.7%) | 940 (4.8%) |
| 5 to 9 Years | 773 (4.0%) | 701 (3.6%) |
| 10 to 14 Years | 954 (5.0%) | 783 (4.0%) |
| 15 to 19 Years | 1,008 (5.3%) | 654 (3.3%) |
| 20 to 24 Years | 815 (4.3%) | 580 (2.9%) |
| 25 to 29 Years | 1,232 (6.4%) | 1,047 (5.3%) |
| 30 to 34 Years | 1,288 (6.7%) | 847 (4.3%) |
| 35 to 39 Years | 833 (4.3%) | 966 (4.9%) |
| 40 to 44 Years | 790 (4.1%) | 749 (3.8%) |
| 45 to 49 Years | 1,133 (5.9%) | 945 (4.8%) |
| 50 to 54 Years | 1,032 (5.4%) | 1,031 (5.2%) |
| 55 to 59 Years | 1,513 (7.9%) | 1,555 (7.9%) |
| 60 to 64 Years | 1,072 (5.6%) | 1,631 (8.3%) |
| 65 to 69 Years | 1,494 (7.8%) | 1,652 (8.4%) |
| 70 to 74 Years | 1,471 (7.7%) | 1,732 (8.8%) |
| 75 to 79 Years | 1,479 (7.7%) | 1,896 (9.6%) |
| 80 to 84 Years | 848 (4.4%) | 1,045 (5.3%) |
| 85 Years and over | 710 (3.7%) | 941 (4.8%) |
| Total | 19,160 (100.0%) | 19,695 (100.0%) |
Families and Households in Apache Junction
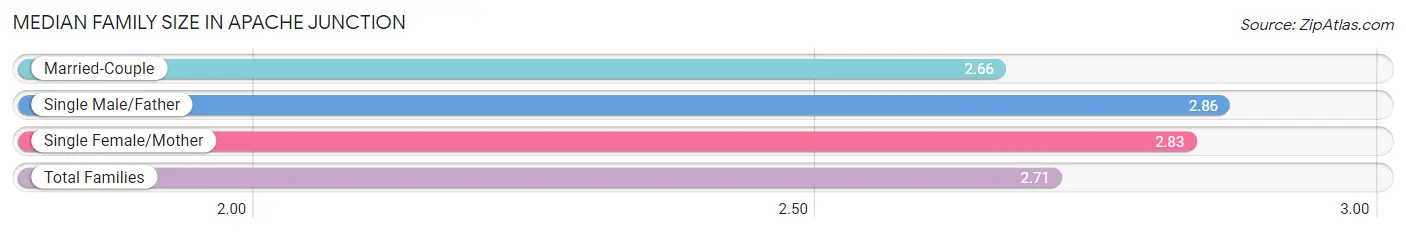
Median Family Size in Apache Junction
The median family size in Apache Junction is 2.71 persons per family, with single male/father families (839 | 8.1%) accounting for the largest median family size of 2.86 persons per family. On the other hand, married-couple families (7,678 | 74.1%) represent the smallest median family size with 2.66 persons per family.
| Family Type | # Families | Family Size |
| Married-Couple | 7,678 (74.1%) | 2.66 |
| Single Male/Father | 839 (8.1%) | 2.86 |
| Single Female/Mother | 1,841 (17.8%) | 2.83 |
| Total Families | 10,358 (100.0%) | 2.71 |
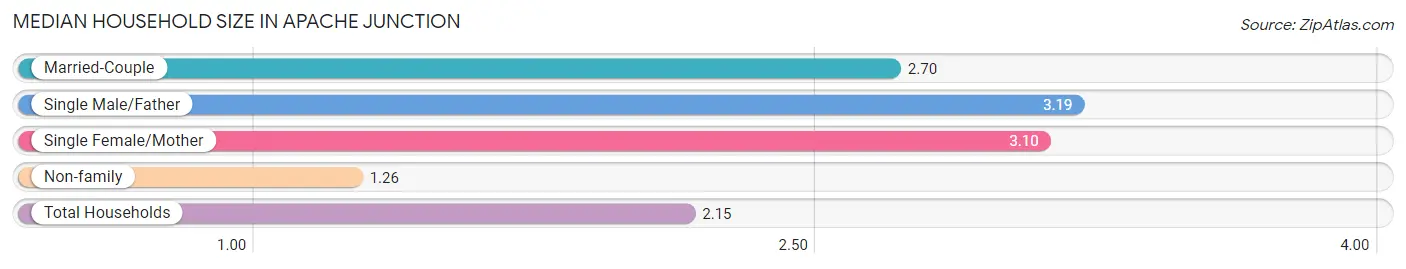
Median Household Size in Apache Junction
The median household size in Apache Junction is 2.15 persons per household, with single male/father households (839 | 4.7%) accounting for the largest median household size of 3.19 persons per household. non-family households (7,556 | 42.2%) represent the smallest median household size with 1.26 persons per household.
| Household Type | # Households | Household Size |
| Married-Couple | 7,678 (42.9%) | 2.70 |
| Single Male/Father | 839 (4.7%) | 3.19 |
| Single Female/Mother | 1,841 (10.3%) | 3.10 |
| Non-family | 7,556 (42.2%) | 1.26 |
| Total Households | 17,914 (100.0%) | 2.15 |
Household Size by Marriage Status in Apache Junction
Out of a total of 17,914 households in Apache Junction, 10,358 (57.8%) are family households, while 7,556 (42.2%) are nonfamily households. The most numerous type of family households are 2-person households, comprising 6,292, and the most common type of nonfamily households are 1-person households, comprising 6,074.
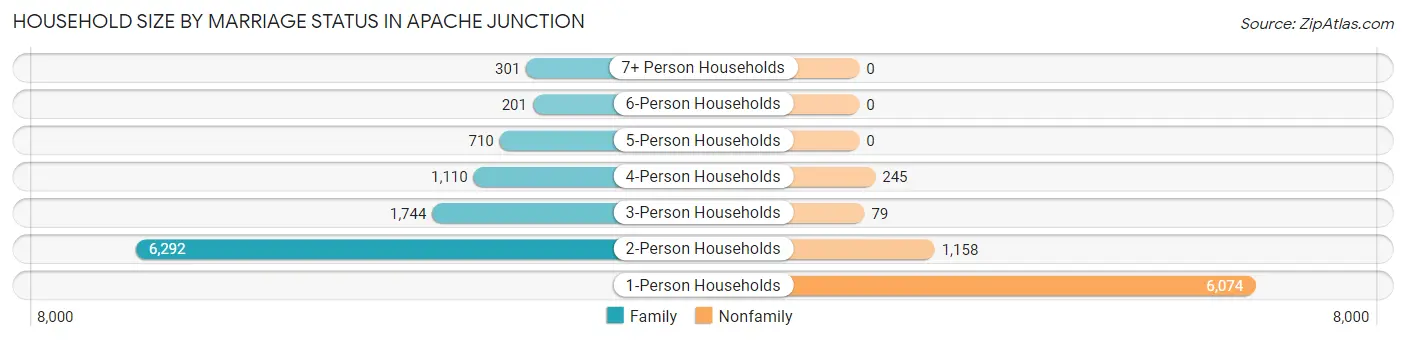
| Household Size | Family Households | Nonfamily Households |
| 1-Person Households | - | 6,074 (33.9%) |
| 2-Person Households | 6,292 (35.1%) | 1,158 (6.5%) |
| 3-Person Households | 1,744 (9.7%) | 79 (0.4%) |
| 4-Person Households | 1,110 (6.2%) | 245 (1.4%) |
| 5-Person Households | 710 (4.0%) | 0 (0.0%) |
| 6-Person Households | 201 (1.1%) | 0 (0.0%) |
| 7+ Person Households | 301 (1.7%) | 0 (0.0%) |
| Total | 10,358 (57.8%) | 7,556 (42.2%) |
Female Fertility in Apache Junction
Fertility by Age in Apache Junction
Average fertility rate in Apache Junction is 62.0 births per 1,000 women. Women in the age bracket of 20 to 34 years have the highest fertility rate with 112.0 births per 1,000 women. Women in the age bracket of 20 to 34 years acount for 73.9% of all women with births.
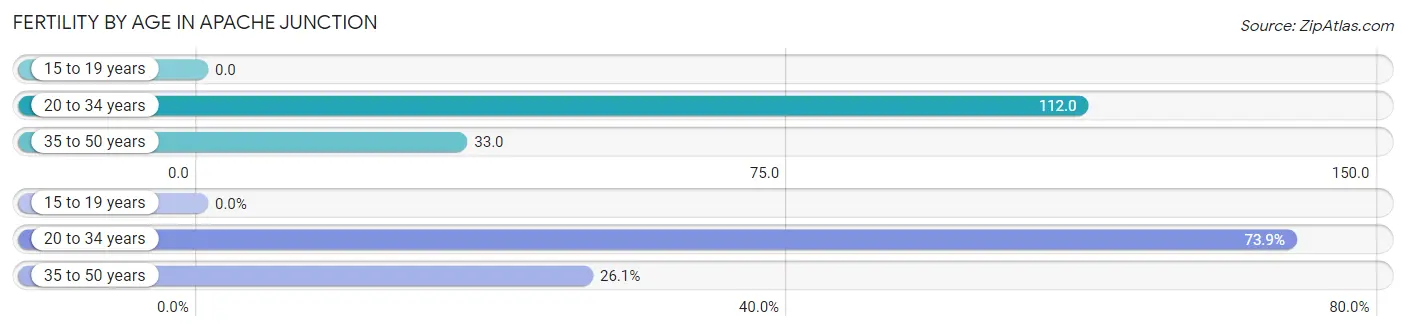
| Age Bracket | Women with Births | Births / 1,000 Women |
| 15 to 19 years | 0 (0.0%) | 0.0 |
| 20 to 34 years | 277 (73.9%) | 112.0 |
| 35 to 50 years | 98 (26.1%) | 33.0 |
| Total | 375 (100.0%) | 62.0 |
Fertility by Age by Marriage Status in Apache Junction
60.8% of women with births (375) in Apache Junction are married. The highest percentage of unmarried women with births falls into 20 to 34 years age bracket with 46.9% of them unmarried at the time of birth, while the lowest percentage of unmarried women with births belong to 35 to 50 years age bracket with 17.3% of them unmarried.
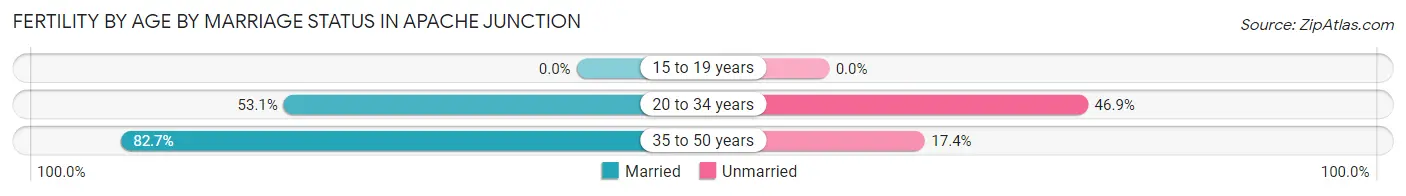
| Age Bracket | Married | Unmarried |
| 15 to 19 years | 0 (0.0%) | 0 (0.0%) |
| 20 to 34 years | 147 (53.1%) | 130 (46.9%) |
| 35 to 50 years | 81 (82.7%) | 17 (17.3%) |
| Total | 228 (60.8%) | 147 (39.2%) |
Fertility by Education in Apache Junction
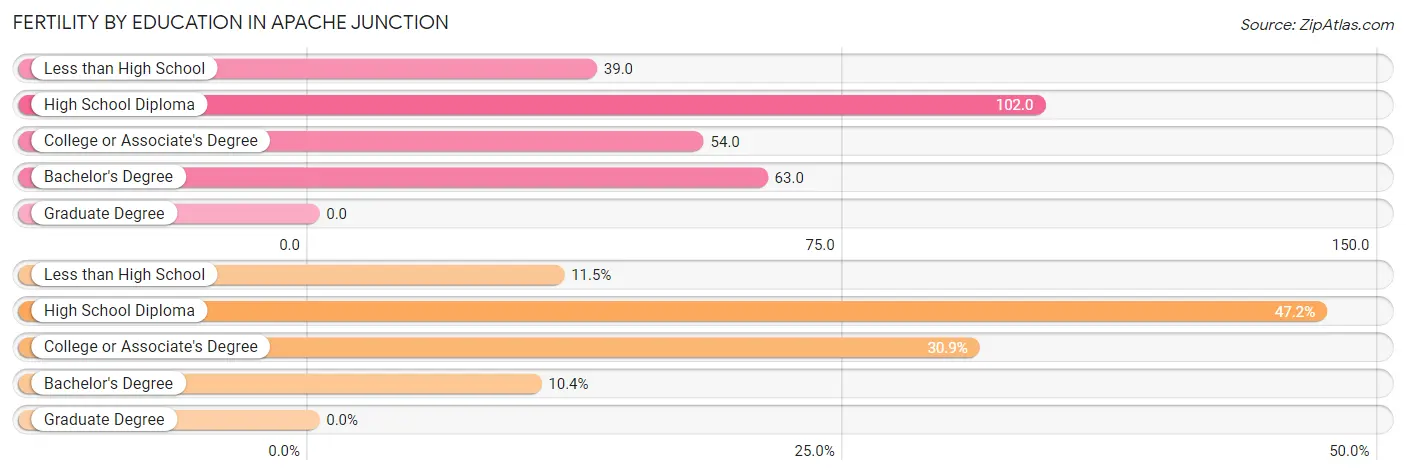
| Educational Attainment | Women with Births | Births / 1,000 Women |
| Less than High School | 43 (11.5%) | 39.0 |
| High School Diploma | 177 (47.2%) | 102.0 |
| College or Associate's Degree | 116 (30.9%) | 54.0 |
| Bachelor's Degree | 39 (10.4%) | 63.0 |
| Graduate Degree | 0 (0.0%) | 0.0 |
| Total | 375 (100.0%) | 62.0 |
Fertility by Education by Marriage Status in Apache Junction
39.2% of women with births in Apache Junction are unmarried. Women with the educational attainment of bachelor's degree are most likely to be married with 100.0% of them married at childbirth, while women with the educational attainment of less than high school are least likely to be married with 72.1% of them unmarried at childbirth.
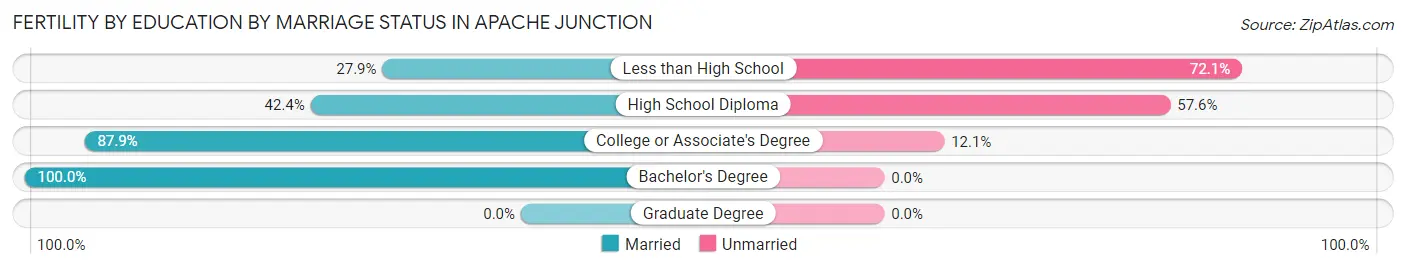
| Educational Attainment | Married | Unmarried |
| Less than High School | 12 (27.9%) | 31 (72.1%) |
| High School Diploma | 75 (42.4%) | 102 (57.6%) |
| College or Associate's Degree | 102 (87.9%) | 14 (12.1%) |
| Bachelor's Degree | 39 (100.0%) | 0 (0.0%) |
| Graduate Degree | 0 (0.0%) | 0 (0.0%) |
| Total | 228 (60.8%) | 147 (39.2%) |
Employment Characteristics in Apache Junction
Employment by Class of Employer in Apache Junction
Among the 14,490 employed individuals in Apache Junction, private company employees (10,550 | 72.8%), local government employees (962 | 6.6%), and not-for-profit organizations (880 | 6.1%) make up the most common classes of employment.
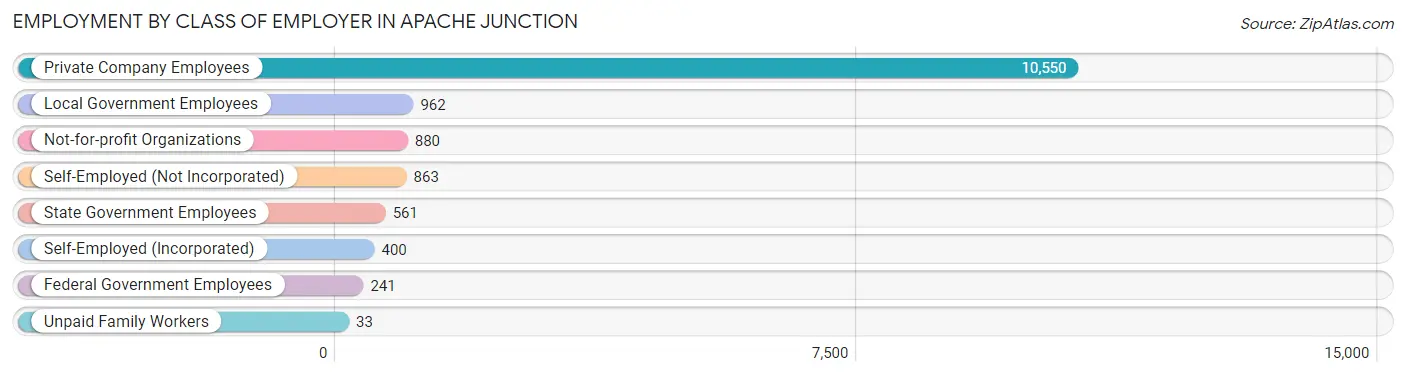
| Employer Class | # Employees | % Employees |
| Private Company Employees | 10,550 | 72.8% |
| Self-Employed (Incorporated) | 400 | 2.8% |
| Self-Employed (Not Incorporated) | 863 | 6.0% |
| Not-for-profit Organizations | 880 | 6.1% |
| Local Government Employees | 962 | 6.6% |
| State Government Employees | 561 | 3.9% |
| Federal Government Employees | 241 | 1.7% |
| Unpaid Family Workers | 33 | 0.2% |
| Total | 14,490 | 100.0% |
Employment Status by Age in Apache Junction
According to the labor force statistics for Apache Junction, out of the total population over 16 years of age (33,742), 47.7% or 16,095 individuals are in the labor force, with 8.9% or 1,432 of them unemployed. The age group with the highest labor force participation rate is 30 to 34 years, with 91.6% or 1,956 individuals in the labor force. Within the labor force, the 20 to 24 years age range has the highest percentage of unemployed individuals, with 19.0% or 233 of them being unemployed.
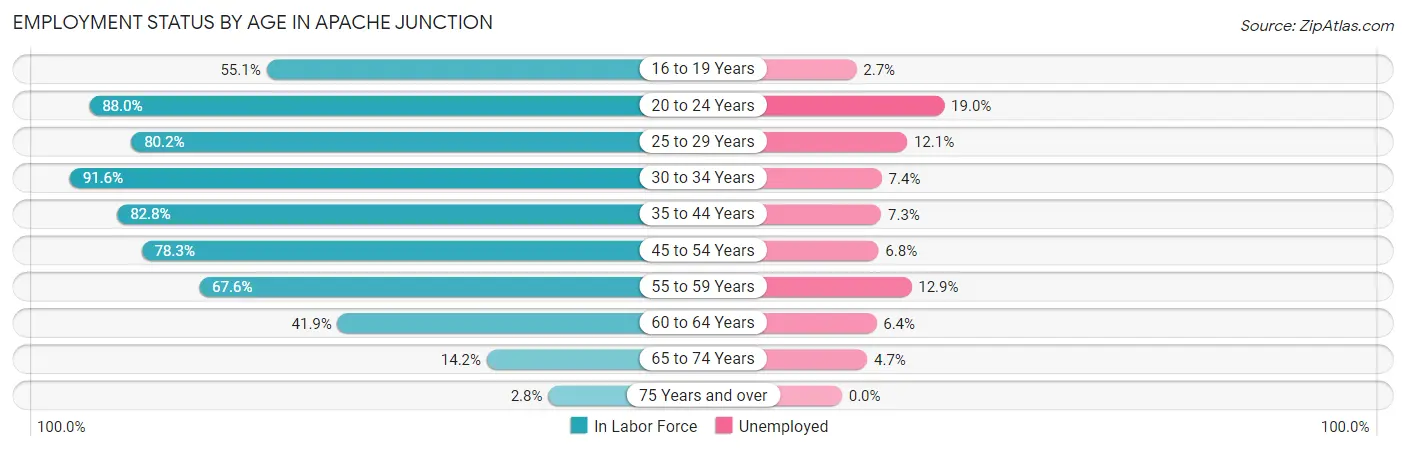
| Age Bracket | In Labor Force | Unemployed |
| 16 to 19 Years | 780 (55.1%) | 21 (2.7%) |
| 20 to 24 Years | 1,228 (88.0%) | 233 (19.0%) |
| 25 to 29 Years | 1,828 (80.2%) | 221 (12.1%) |
| 30 to 34 Years | 1,956 (91.6%) | 145 (7.4%) |
| 35 to 44 Years | 2,764 (82.8%) | 202 (7.3%) |
| 45 to 54 Years | 3,242 (78.3%) | 220 (6.8%) |
| 55 to 59 Years | 2,074 (67.6%) | 268 (12.9%) |
| 60 to 64 Years | 1,133 (41.9%) | 73 (6.4%) |
| 65 to 74 Years | 902 (14.2%) | 42 (4.7%) |
| 75 Years and over | 194 (2.8%) | 0 (0.0%) |
| Total | 16,095 (47.7%) | 1,432 (8.9%) |
Employment Status by Educational Attainment in Apache Junction
According to labor force statistics for Apache Junction, 73.6% of individuals (13,001) out of the total population between 25 and 64 years of age (17,664) are in the labor force, with 8.7% or 1,131 of them being unemployed. The group with the highest labor force participation rate are those with the educational attainment of bachelor's degree or higher, with 87.7% or 2,619 individuals in the labor force. Within the labor force, individuals with less than high school education have the highest percentage of unemployment, with 23.0% or 307 of them being unemployed.
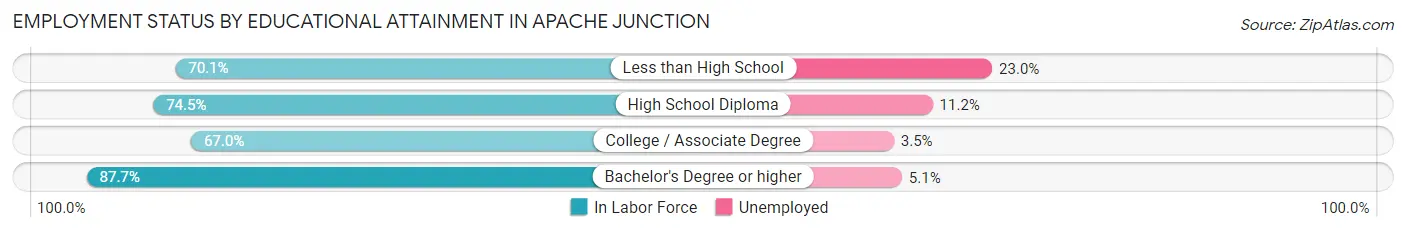
| Educational Attainment | In Labor Force | Unemployed |
| Less than High School | 1,333 (70.1%) | 437 (23.0%) |
| High School Diploma | 4,835 (74.5%) | 727 (11.2%) |
| College / Associate Degree | 4,212 (67.0%) | 220 (3.5%) |
| Bachelor's Degree or higher | 2,619 (87.7%) | 152 (5.1%) |
| Total | 13,001 (73.6%) | 1,537 (8.7%) |
Employment Occupations by Sex in Apache Junction
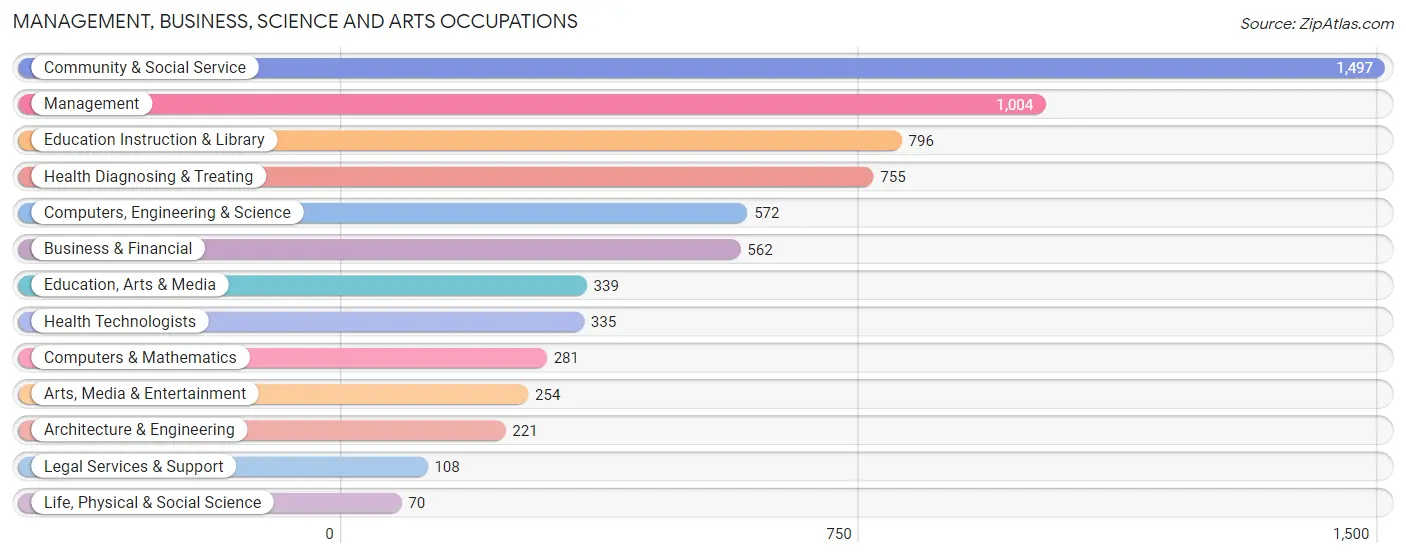
Management, Business, Science and Arts Occupations
The most common Management, Business, Science and Arts occupations in Apache Junction are Community & Social Service (1,497 | 10.2%), Management (1,004 | 6.9%), Education Instruction & Library (796 | 5.4%), Health Diagnosing & Treating (755 | 5.1%), and Computers, Engineering & Science (572 | 3.9%).
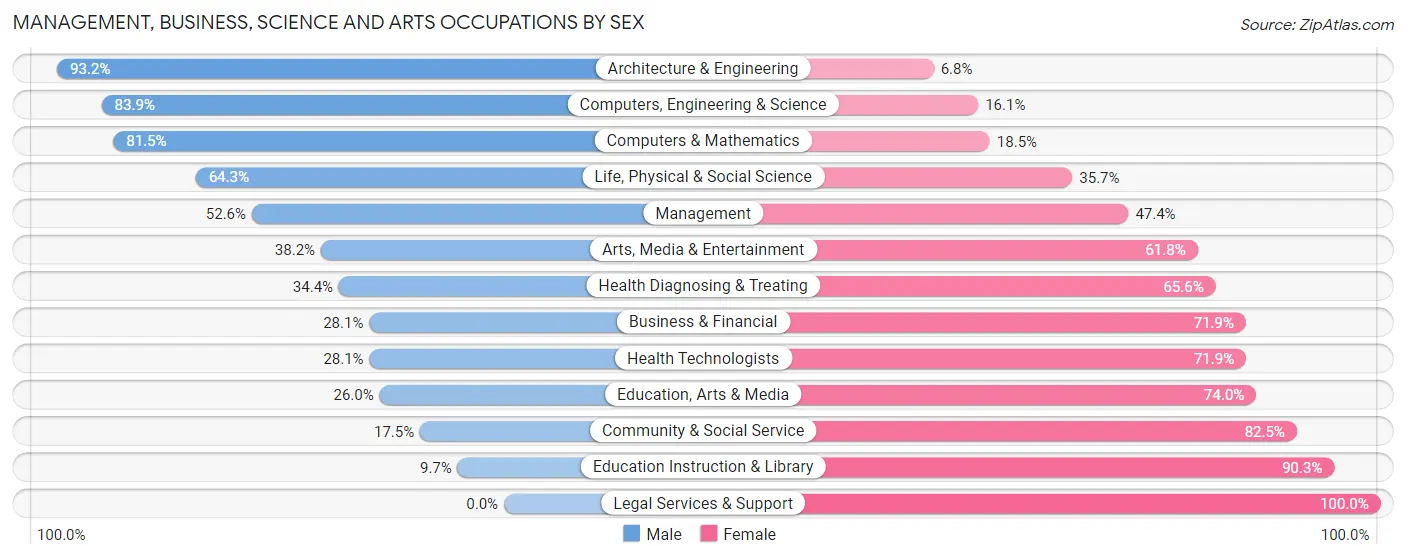
Management, Business, Science and Arts Occupations by Sex
Within the Management, Business, Science and Arts occupations in Apache Junction, the most male-oriented occupations are Architecture & Engineering (93.2%), Computers, Engineering & Science (83.9%), and Computers & Mathematics (81.5%), while the most female-oriented occupations are Legal Services & Support (100.0%), Education Instruction & Library (90.3%), and Community & Social Service (82.5%).
| Occupation | Male | Female |
| Management | 528 (52.6%) | 476 (47.4%) |
| Business & Financial | 158 (28.1%) | 404 (71.9%) |
| Computers, Engineering & Science | 480 (83.9%) | 92 (16.1%) |
| Computers & Mathematics | 229 (81.5%) | 52 (18.5%) |
| Architecture & Engineering | 206 (93.2%) | 15 (6.8%) |
| Life, Physical & Social Science | 45 (64.3%) | 25 (35.7%) |
| Community & Social Service | 262 (17.5%) | 1,235 (82.5%) |
| Education, Arts & Media | 88 (26.0%) | 251 (74.0%) |
| Legal Services & Support | 0 (0.0%) | 108 (100.0%) |
| Education Instruction & Library | 77 (9.7%) | 719 (90.3%) |
| Arts, Media & Entertainment | 97 (38.2%) | 157 (61.8%) |
| Health Diagnosing & Treating | 260 (34.4%) | 495 (65.6%) |
| Health Technologists | 94 (28.1%) | 241 (71.9%) |
| Total (Category) | 1,688 (38.5%) | 2,702 (61.6%) |
| Total (Overall) | 8,375 (57.1%) | 6,282 (42.9%) |
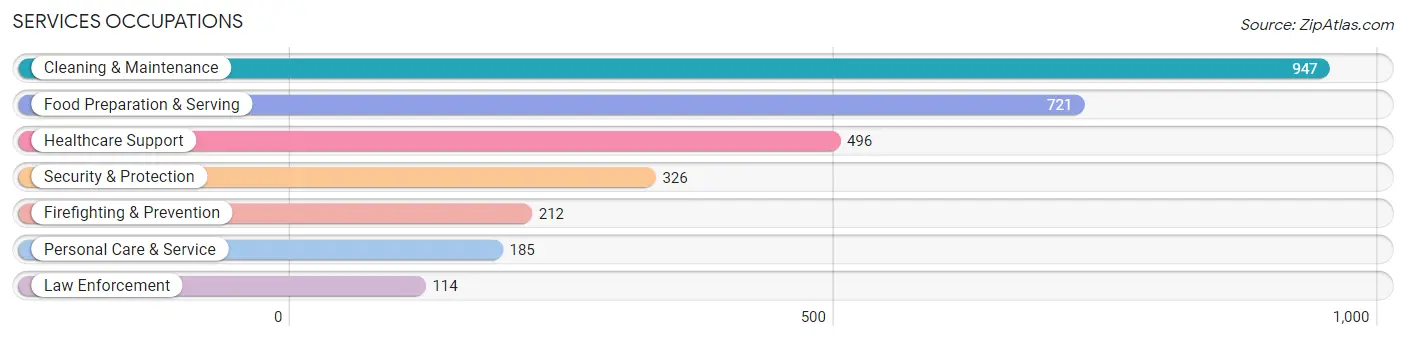
Services Occupations
The most common Services occupations in Apache Junction are Cleaning & Maintenance (947 | 6.5%), Food Preparation & Serving (721 | 4.9%), Healthcare Support (496 | 3.4%), Security & Protection (326 | 2.2%), and Firefighting & Prevention (212 | 1.5%).
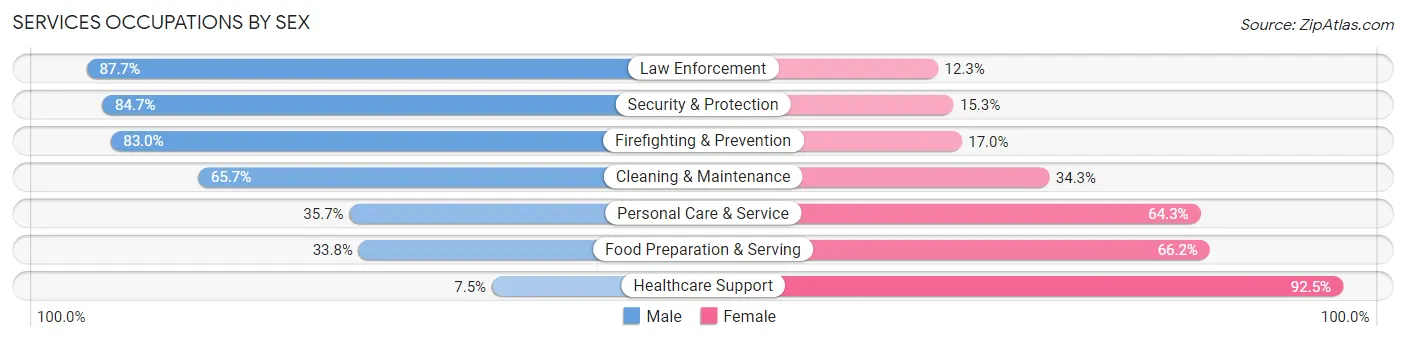
Services Occupations by Sex
Within the Services occupations in Apache Junction, the most male-oriented occupations are Law Enforcement (87.7%), Security & Protection (84.7%), and Firefighting & Prevention (83.0%), while the most female-oriented occupations are Healthcare Support (92.5%), Food Preparation & Serving (66.2%), and Personal Care & Service (64.3%).
| Occupation | Male | Female |
| Healthcare Support | 37 (7.5%) | 459 (92.5%) |
| Security & Protection | 276 (84.7%) | 50 (15.3%) |
| Firefighting & Prevention | 176 (83.0%) | 36 (17.0%) |
| Law Enforcement | 100 (87.7%) | 14 (12.3%) |
| Food Preparation & Serving | 244 (33.8%) | 477 (66.2%) |
| Cleaning & Maintenance | 622 (65.7%) | 325 (34.3%) |
| Personal Care & Service | 66 (35.7%) | 119 (64.3%) |
| Total (Category) | 1,245 (46.5%) | 1,430 (53.5%) |
| Total (Overall) | 8,375 (57.1%) | 6,282 (42.9%) |
Sales and Office Occupations
The most common Sales and Office occupations in Apache Junction are Office & Administration (1,851 | 12.6%), and Sales & Related (1,476 | 10.1%).
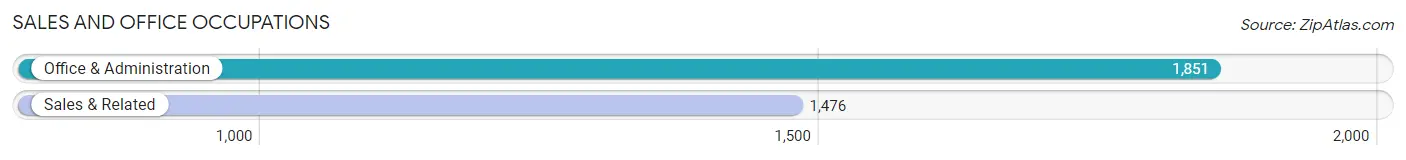
Sales and Office Occupations by Sex
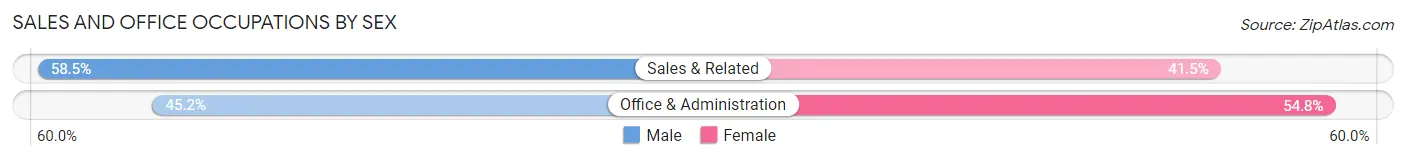
| Occupation | Male | Female |
| Sales & Related | 863 (58.5%) | 613 (41.5%) |
| Office & Administration | 837 (45.2%) | 1,014 (54.8%) |
| Total (Category) | 1,700 (51.1%) | 1,627 (48.9%) |
| Total (Overall) | 8,375 (57.1%) | 6,282 (42.9%) |
Natural Resources, Construction and Maintenance Occupations
The most common Natural Resources, Construction and Maintenance occupations in Apache Junction are Installation, Maintenance & Repair (1,096 | 7.5%), Construction & Extraction (921 | 6.3%), and Farming, Fishing & Forestry (112 | 0.8%).
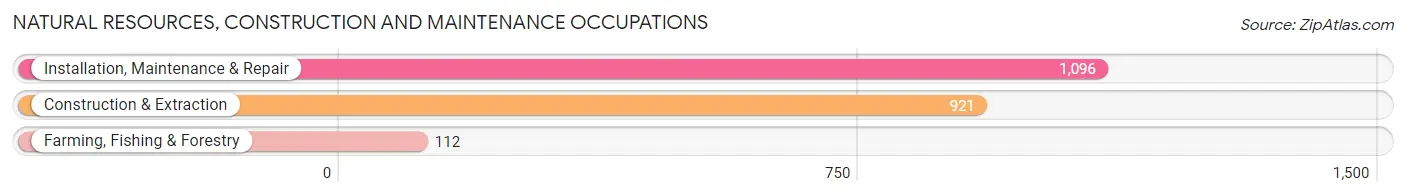
Natural Resources, Construction and Maintenance Occupations by Sex
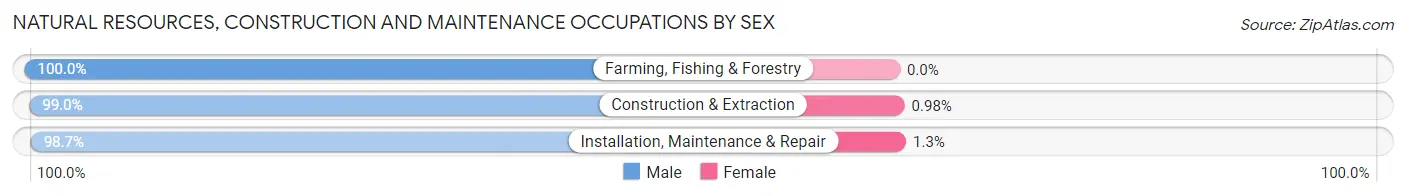
| Occupation | Male | Female |
| Farming, Fishing & Forestry | 112 (100.0%) | 0 (0.0%) |
| Construction & Extraction | 912 (99.0%) | 9 (1.0%) |
| Installation, Maintenance & Repair | 1,082 (98.7%) | 14 (1.3%) |
| Total (Category) | 2,106 (98.9%) | 23 (1.1%) |
| Total (Overall) | 8,375 (57.1%) | 6,282 (42.9%) |
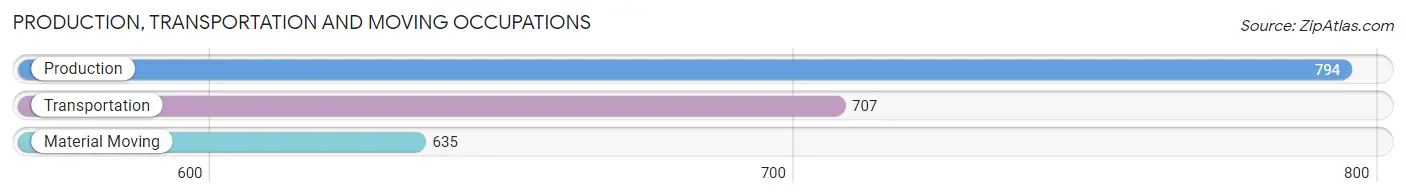
Production, Transportation and Moving Occupations
The most common Production, Transportation and Moving occupations in Apache Junction are Production (794 | 5.4%), Transportation (707 | 4.8%), and Material Moving (635 | 4.3%).
Production, Transportation and Moving Occupations by Sex
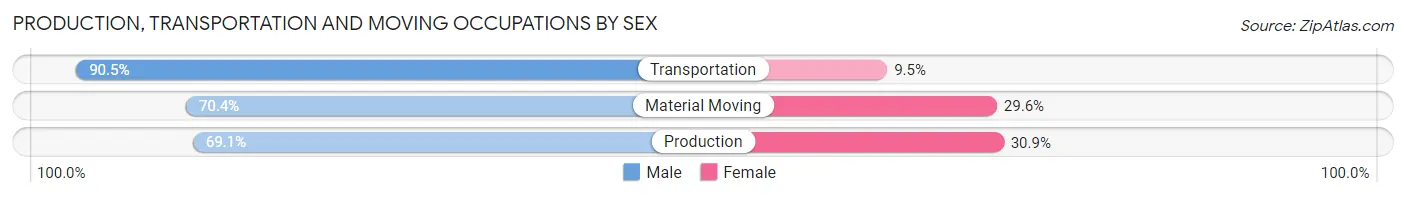
| Occupation | Male | Female |
| Production | 549 (69.1%) | 245 (30.9%) |
| Transportation | 640 (90.5%) | 67 (9.5%) |
| Material Moving | 447 (70.4%) | 188 (29.6%) |
| Total (Category) | 1,636 (76.6%) | 500 (23.4%) |
| Total (Overall) | 8,375 (57.1%) | 6,282 (42.9%) |
Employment Industries by Sex in Apache Junction
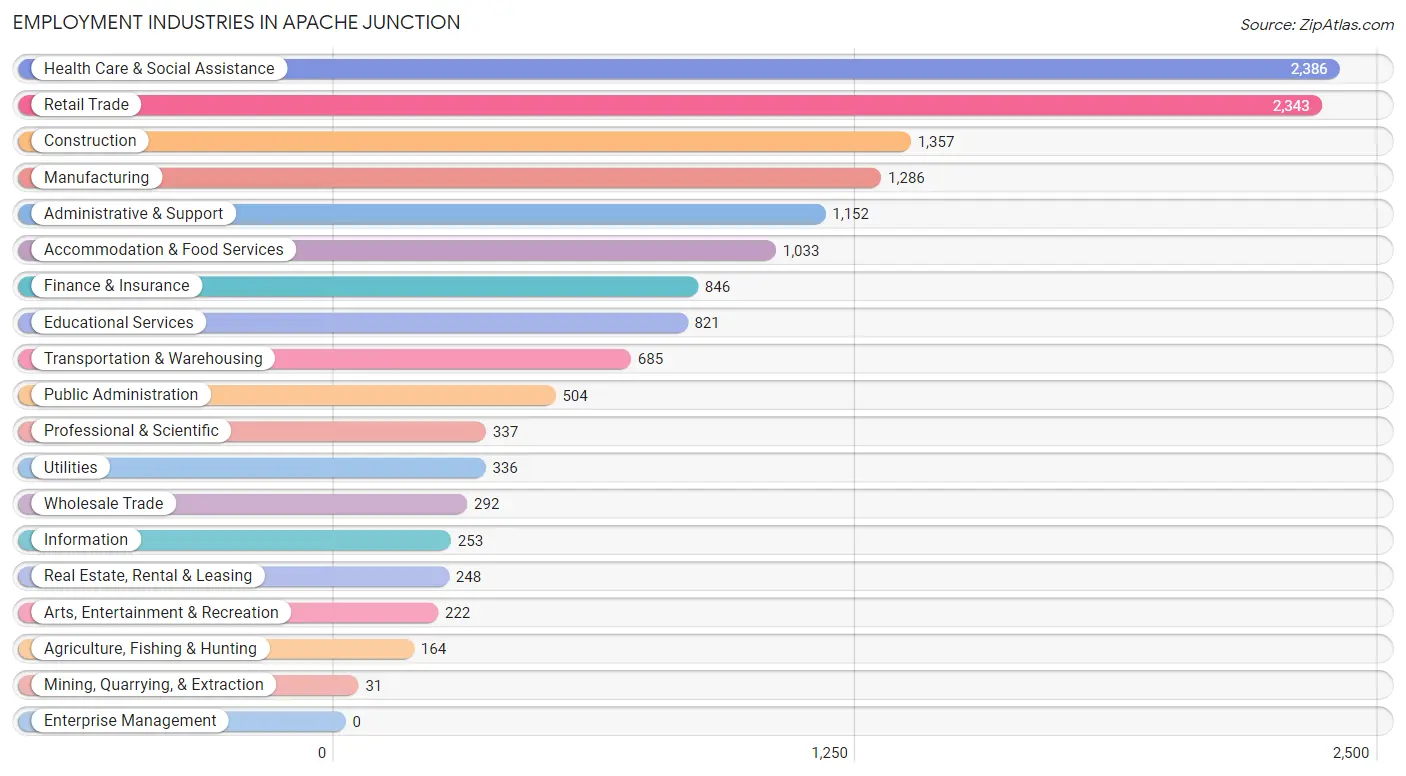
Employment Industries in Apache Junction
The major employment industries in Apache Junction include Health Care & Social Assistance (2,386 | 16.3%), Retail Trade (2,343 | 16.0%), Construction (1,357 | 9.3%), Manufacturing (1,286 | 8.8%), and Administrative & Support (1,152 | 7.9%).
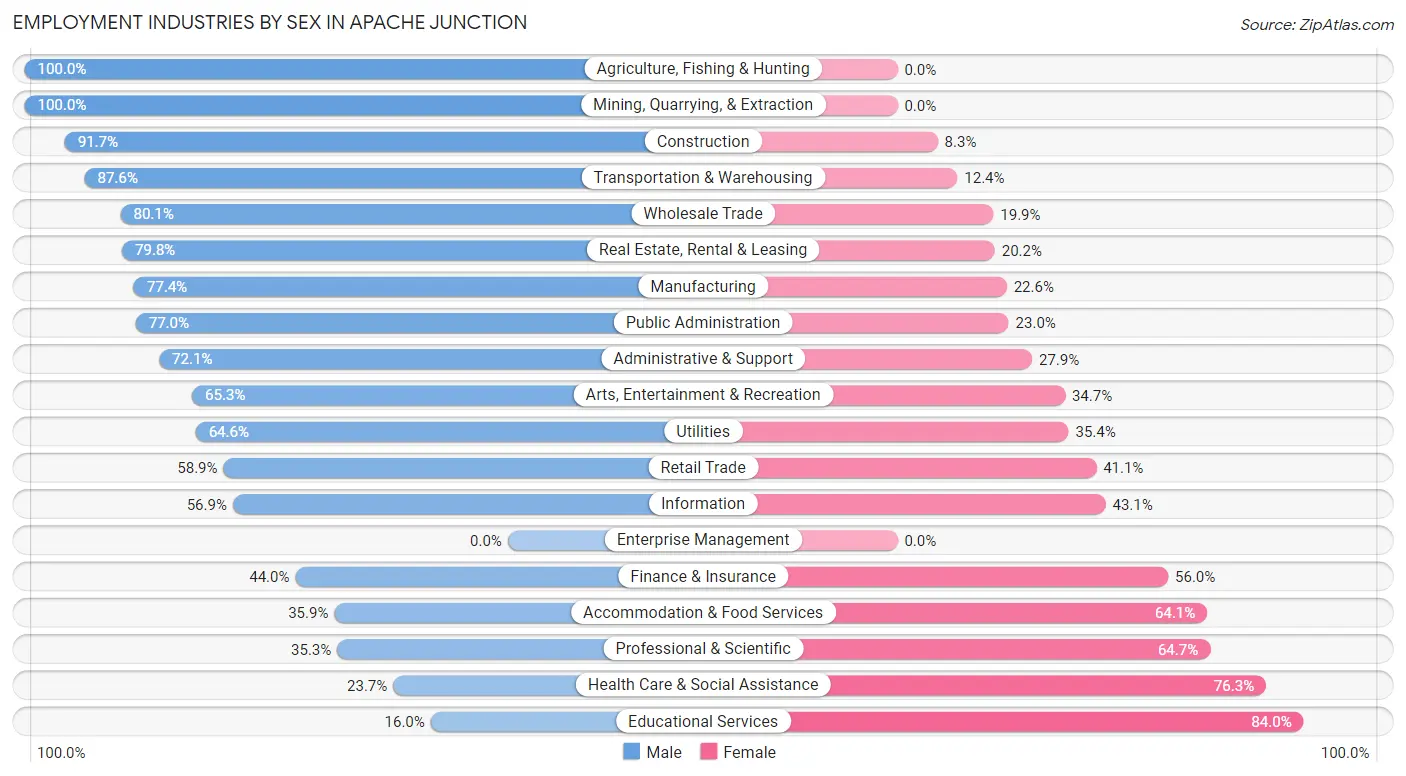
Employment Industries by Sex in Apache Junction
The Apache Junction industries that see more men than women are Agriculture, Fishing & Hunting (100.0%), Mining, Quarrying, & Extraction (100.0%), and Construction (91.7%), whereas the industries that tend to have a higher number of women are Educational Services (84.0%), Health Care & Social Assistance (76.3%), and Professional & Scientific (64.7%).
| Industry | Male | Female |
| Agriculture, Fishing & Hunting | 164 (100.0%) | 0 (0.0%) |
| Mining, Quarrying, & Extraction | 31 (100.0%) | 0 (0.0%) |
| Construction | 1,244 (91.7%) | 113 (8.3%) |
| Manufacturing | 995 (77.4%) | 291 (22.6%) |
| Wholesale Trade | 234 (80.1%) | 58 (19.9%) |
| Retail Trade | 1,379 (58.9%) | 964 (41.1%) |
| Transportation & Warehousing | 600 (87.6%) | 85 (12.4%) |
| Utilities | 217 (64.6%) | 119 (35.4%) |
| Information | 144 (56.9%) | 109 (43.1%) |
| Finance & Insurance | 372 (44.0%) | 474 (56.0%) |
| Real Estate, Rental & Leasing | 198 (79.8%) | 50 (20.2%) |
| Professional & Scientific | 119 (35.3%) | 218 (64.7%) |
| Enterprise Management | 0 (0.0%) | 0 (0.0%) |
| Administrative & Support | 831 (72.1%) | 321 (27.9%) |
| Educational Services | 131 (16.0%) | 690 (84.0%) |
| Health Care & Social Assistance | 566 (23.7%) | 1,820 (76.3%) |
| Arts, Entertainment & Recreation | 145 (65.3%) | 77 (34.7%) |
| Accommodation & Food Services | 371 (35.9%) | 662 (64.1%) |
| Public Administration | 388 (77.0%) | 116 (23.0%) |
| Total | 8,375 (57.1%) | 6,282 (42.9%) |
Education in Apache Junction
School Enrollment in Apache Junction
The most common levels of schooling among the 5,967 students in Apache Junction are high school (1,502 | 25.2%), elementary school (1,355 | 22.7%), and middle school (1,307 | 21.9%).
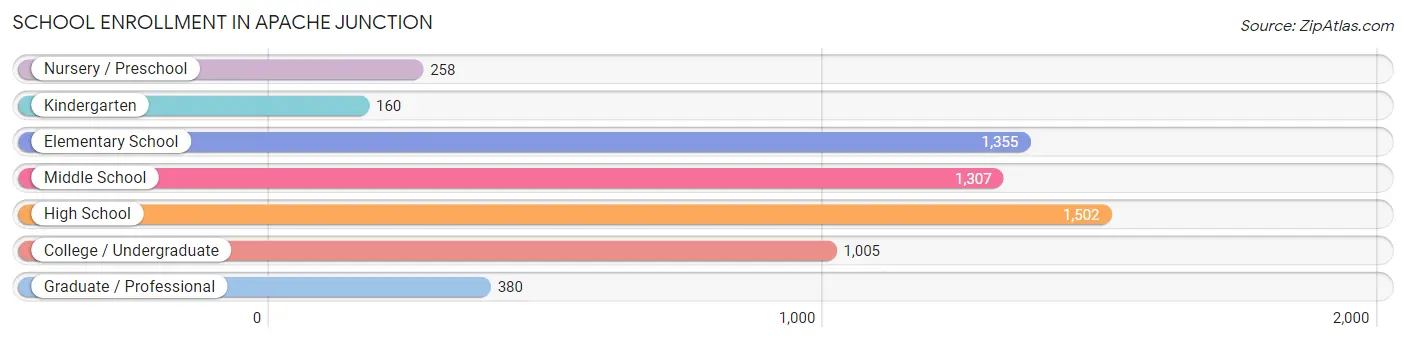
| School Level | # Students | % Students |
| Nursery / Preschool | 258 | 4.3% |
| Kindergarten | 160 | 2.7% |
| Elementary School | 1,355 | 22.7% |
| Middle School | 1,307 | 21.9% |
| High School | 1,502 | 25.2% |
| College / Undergraduate | 1,005 | 16.8% |
| Graduate / Professional | 380 | 6.4% |
| Total | 5,967 | 100.0% |
School Enrollment by Age by Funding Source in Apache Junction
Out of a total of 5,967 students who are enrolled in schools in Apache Junction, 752 (12.6%) attend a private institution, while the remaining 5,215 (87.4%) are enrolled in public schools. The age group of 3 to 4 year olds has the highest likelihood of being enrolled in private schools, with 47 (28.7% in the age bracket) enrolled. Conversely, the age group of 18 to 19 year olds has the lowest likelihood of being enrolled in a private school, with 261 (100.0% in the age bracket) attending a public institution.
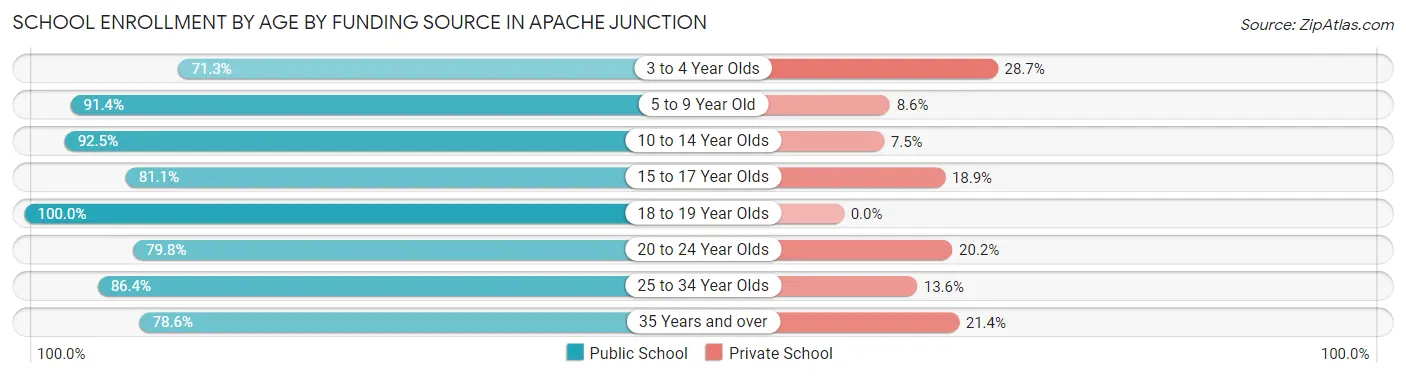
| Age Bracket | Public School | Private School |
| 3 to 4 Year Olds | 117 (71.3%) | 47 (28.7%) |
| 5 to 9 Year Old | 1,279 (91.4%) | 120 (8.6%) |
| 10 to 14 Year Olds | 1,607 (92.5%) | 130 (7.5%) |
| 15 to 17 Year Olds | 809 (81.1%) | 188 (18.9%) |
| 18 to 19 Year Olds | 261 (100.0%) | 0 (0.0%) |
| 20 to 24 Year Olds | 241 (79.8%) | 61 (20.2%) |
| 25 to 34 Year Olds | 368 (86.4%) | 58 (13.6%) |
| 35 Years and over | 535 (78.6%) | 146 (21.4%) |
| Total | 5,215 (87.4%) | 752 (12.6%) |
Educational Attainment by Field of Study in Apache Junction
Business (1,236 | 20.4%), education (1,014 | 16.7%), science & technology (737 | 12.2%), psychology (614 | 10.1%), and engineering (503 | 8.3%) are the most common fields of study among 6,062 individuals in Apache Junction who have obtained a bachelor's degree or higher.
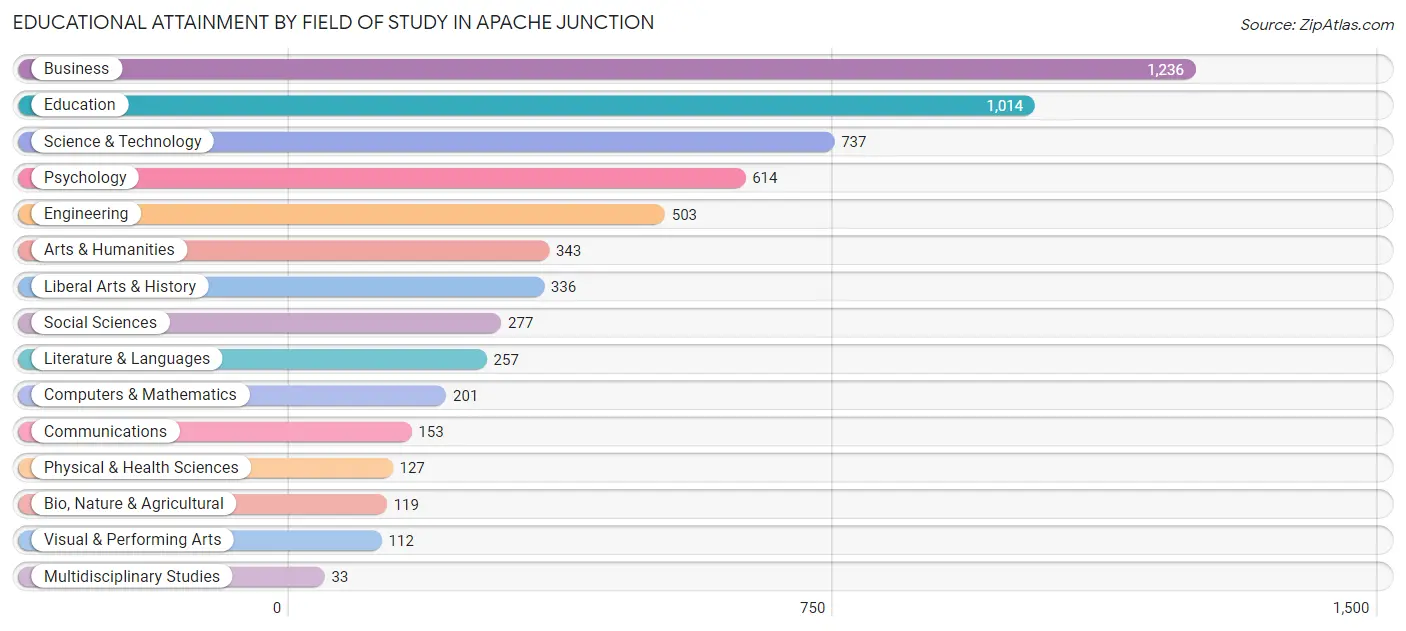
| Field of Study | # Graduates | % Graduates |
| Computers & Mathematics | 201 | 3.3% |
| Bio, Nature & Agricultural | 119 | 2.0% |
| Physical & Health Sciences | 127 | 2.1% |
| Psychology | 614 | 10.1% |
| Social Sciences | 277 | 4.6% |
| Engineering | 503 | 8.3% |
| Multidisciplinary Studies | 33 | 0.5% |
| Science & Technology | 737 | 12.2% |
| Business | 1,236 | 20.4% |
| Education | 1,014 | 16.7% |
| Literature & Languages | 257 | 4.2% |
| Liberal Arts & History | 336 | 5.5% |
| Visual & Performing Arts | 112 | 1.8% |
| Communications | 153 | 2.5% |
| Arts & Humanities | 343 | 5.7% |
| Total | 6,062 | 100.0% |
Transportation & Commute in Apache Junction
Vehicle Availability by Sex in Apache Junction
The most prevalent vehicle ownership categories in Apache Junction are males with 2 vehicles (3,562, accounting for 43.0%) and females with 2 vehicles (2,858, making up 57.5%).
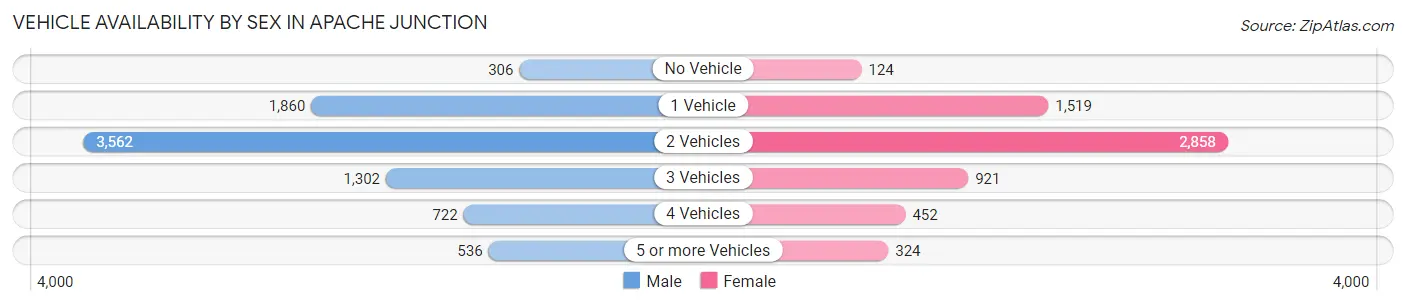
| Vehicles Available | Male | Female |
| No Vehicle | 306 (3.7%) | 124 (2.0%) |
| 1 Vehicle | 1,860 (22.4%) | 1,519 (24.5%) |
| 2 Vehicles | 3,562 (43.0%) | 2,858 (46.1%) |
| 3 Vehicles | 1,302 (15.7%) | 921 (14.9%) |
| 4 Vehicles | 722 (8.7%) | 452 (7.3%) |
| 5 or more Vehicles | 536 (6.5%) | 324 (5.2%) |
| Total | 8,288 (100.0%) | 6,198 (100.0%) |
Commute Time in Apache Junction
The most frequently occuring commute durations in Apache Junction are 30 to 34 minutes (2,091 commuters, 16.4%), 45 to 59 minutes (1,822 commuters, 14.3%), and 20 to 24 minutes (1,717 commuters, 13.4%).
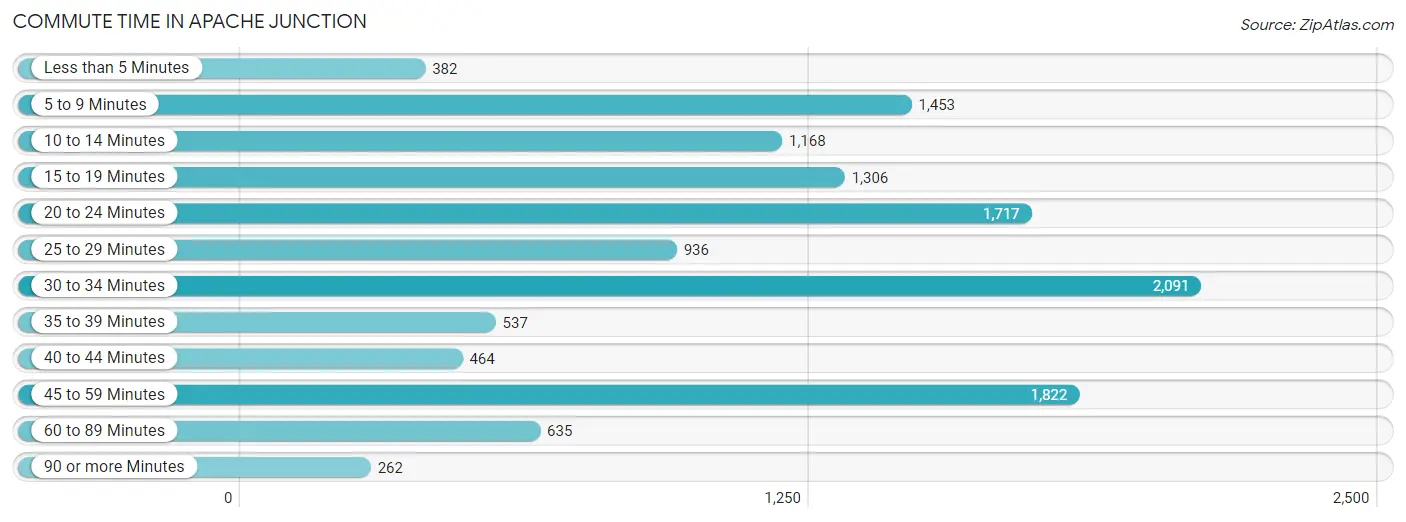
| Commute Time | # Commuters | % Commuters |
| Less than 5 Minutes | 382 | 3.0% |
| 5 to 9 Minutes | 1,453 | 11.4% |
| 10 to 14 Minutes | 1,168 | 9.1% |
| 15 to 19 Minutes | 1,306 | 10.2% |
| 20 to 24 Minutes | 1,717 | 13.4% |
| 25 to 29 Minutes | 936 | 7.3% |
| 30 to 34 Minutes | 2,091 | 16.4% |
| 35 to 39 Minutes | 537 | 4.2% |
| 40 to 44 Minutes | 464 | 3.6% |
| 45 to 59 Minutes | 1,822 | 14.3% |
| 60 to 89 Minutes | 635 | 5.0% |
| 90 or more Minutes | 262 | 2.1% |
Commute Time by Sex in Apache Junction
The most common commute times in Apache Junction are 30 to 34 minutes (1,253 commuters, 16.8%) for males and 20 to 24 minutes (883 commuters, 16.7%) for females.
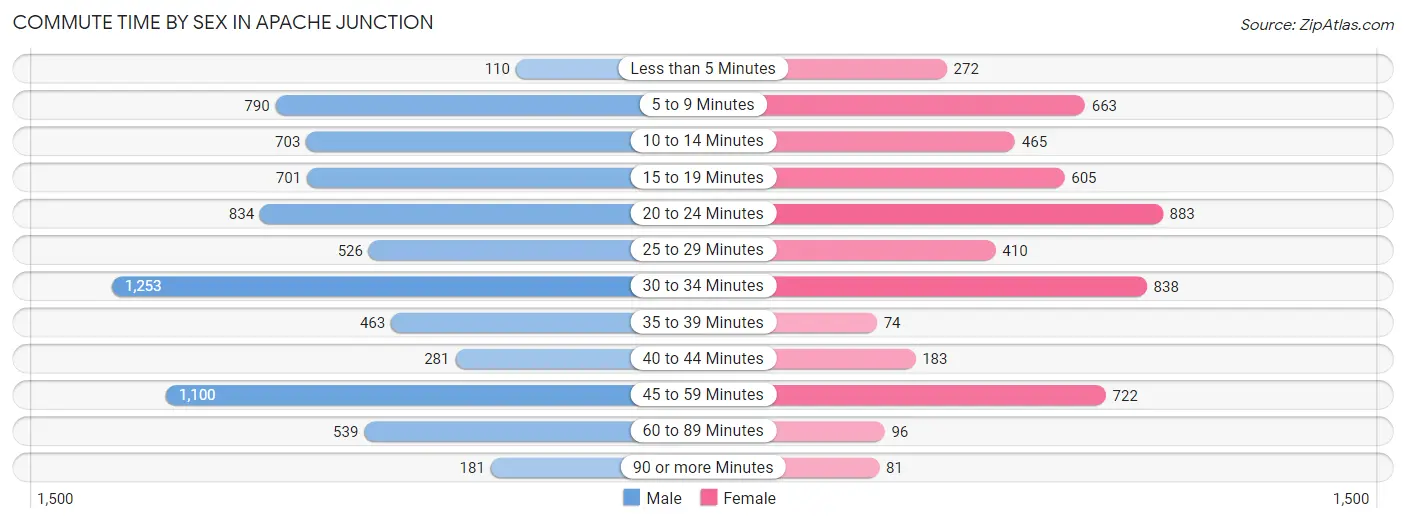
| Commute Time | Male | Female |
| Less than 5 Minutes | 110 (1.5%) | 272 (5.1%) |
| 5 to 9 Minutes | 790 (10.6%) | 663 (12.5%) |
| 10 to 14 Minutes | 703 (9.4%) | 465 (8.8%) |
| 15 to 19 Minutes | 701 (9.4%) | 605 (11.4%) |
| 20 to 24 Minutes | 834 (11.2%) | 883 (16.7%) |
| 25 to 29 Minutes | 526 (7.0%) | 410 (7.7%) |
| 30 to 34 Minutes | 1,253 (16.8%) | 838 (15.8%) |
| 35 to 39 Minutes | 463 (6.2%) | 74 (1.4%) |
| 40 to 44 Minutes | 281 (3.8%) | 183 (3.5%) |
| 45 to 59 Minutes | 1,100 (14.7%) | 722 (13.6%) |
| 60 to 89 Minutes | 539 (7.2%) | 96 (1.8%) |
| 90 or more Minutes | 181 (2.4%) | 81 (1.5%) |
Time of Departure to Work by Sex in Apache Junction
The most frequent times of departure to work in Apache Junction are 12:00 AM to 4:59 AM (1,527, 20.4%) for males and 5:30 AM to 5:59 AM (688, 13.0%) for females.
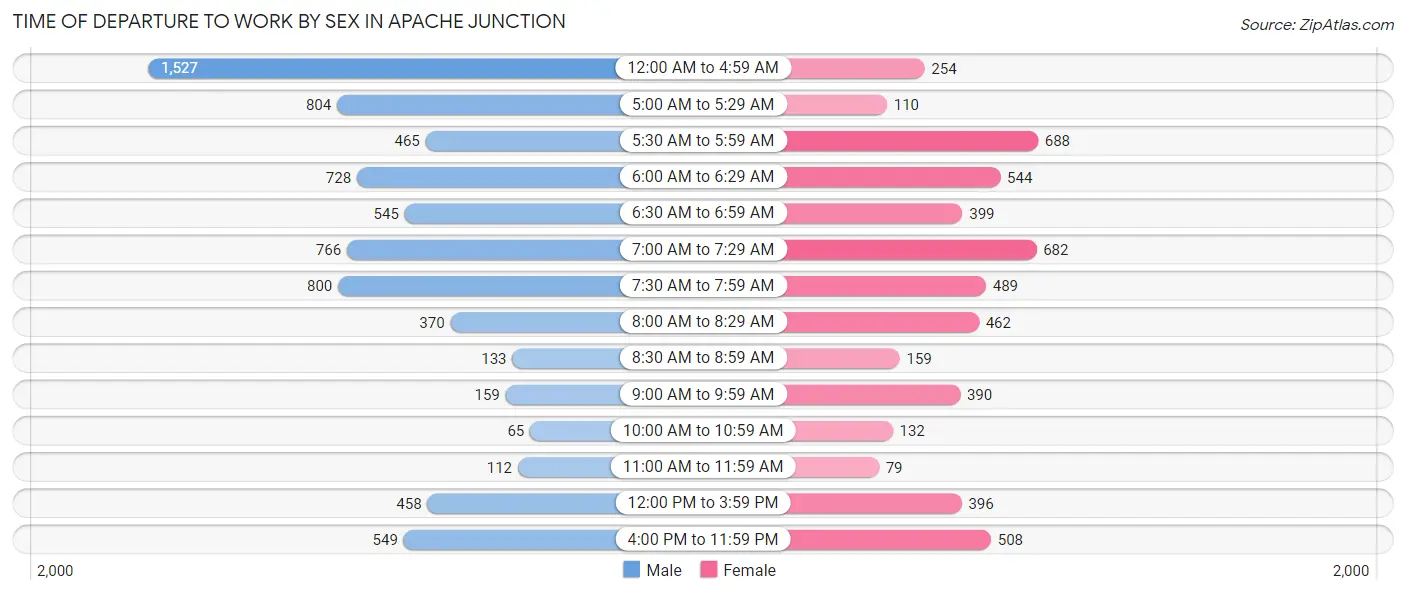
| Time of Departure | Male | Female |
| 12:00 AM to 4:59 AM | 1,527 (20.4%) | 254 (4.8%) |
| 5:00 AM to 5:29 AM | 804 (10.7%) | 110 (2.1%) |
| 5:30 AM to 5:59 AM | 465 (6.2%) | 688 (13.0%) |
| 6:00 AM to 6:29 AM | 728 (9.7%) | 544 (10.3%) |
| 6:30 AM to 6:59 AM | 545 (7.3%) | 399 (7.5%) |
| 7:00 AM to 7:29 AM | 766 (10.2%) | 682 (12.9%) |
| 7:30 AM to 7:59 AM | 800 (10.7%) | 489 (9.2%) |
| 8:00 AM to 8:29 AM | 370 (5.0%) | 462 (8.7%) |
| 8:30 AM to 8:59 AM | 133 (1.8%) | 159 (3.0%) |
| 9:00 AM to 9:59 AM | 159 (2.1%) | 390 (7.4%) |
| 10:00 AM to 10:59 AM | 65 (0.9%) | 132 (2.5%) |
| 11:00 AM to 11:59 AM | 112 (1.5%) | 79 (1.5%) |
| 12:00 PM to 3:59 PM | 458 (6.1%) | 396 (7.5%) |
| 4:00 PM to 11:59 PM | 549 (7.3%) | 508 (9.6%) |
| Total | 7,481 (100.0%) | 5,292 (100.0%) |
Housing Occupancy in Apache Junction
Occupancy by Ownership in Apache Junction
Of the total 17,914 dwellings in Apache Junction, owner-occupied units account for 13,945 (77.8%), while renter-occupied units make up 3,969 (22.2%).
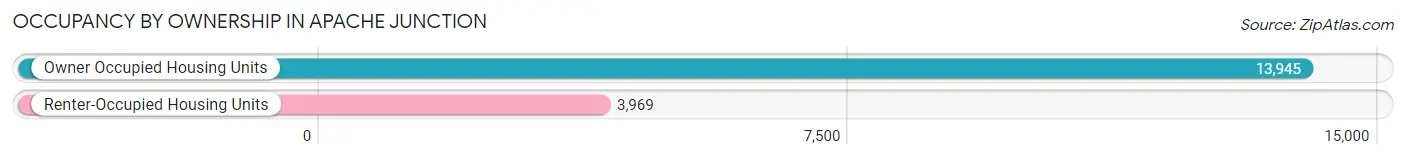
| Occupancy | # Housing Units | % Housing Units |
| Owner Occupied Housing Units | 13,945 | 77.8% |
| Renter-Occupied Housing Units | 3,969 | 22.2% |
| Total Occupied Housing Units | 17,914 | 100.0% |
Occupancy by Household Size in Apache Junction
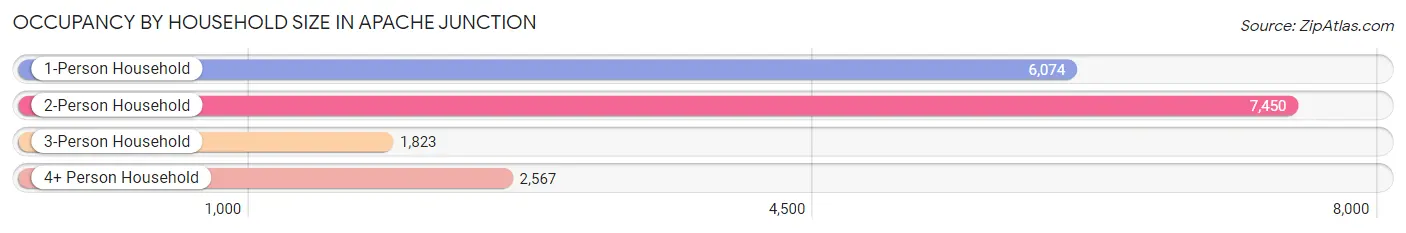
| Household Size | # Housing Units | % Housing Units |
| 1-Person Household | 6,074 | 33.9% |
| 2-Person Household | 7,450 | 41.6% |
| 3-Person Household | 1,823 | 10.2% |
| 4+ Person Household | 2,567 | 14.3% |
| Total Housing Units | 17,914 | 100.0% |
Occupancy by Ownership by Household Size in Apache Junction
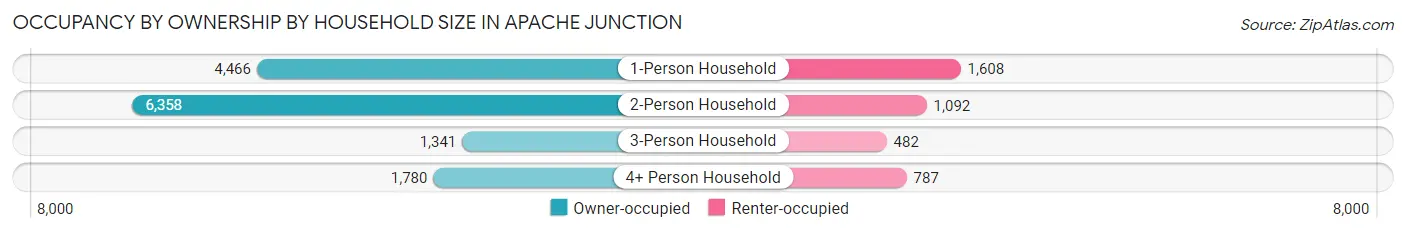
| Household Size | Owner-occupied | Renter-occupied |
| 1-Person Household | 4,466 (73.5%) | 1,608 (26.5%) |
| 2-Person Household | 6,358 (85.3%) | 1,092 (14.7%) |
| 3-Person Household | 1,341 (73.6%) | 482 (26.4%) |
| 4+ Person Household | 1,780 (69.3%) | 787 (30.7%) |
| Total Housing Units | 13,945 (77.8%) | 3,969 (22.2%) |
Occupancy by Educational Attainment in Apache Junction
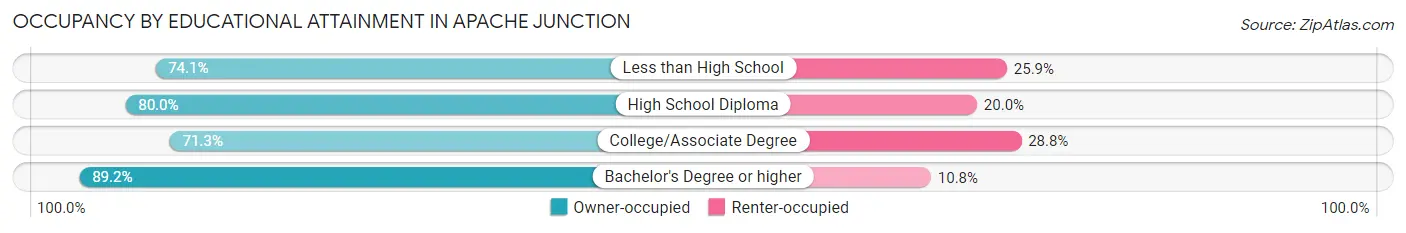
| Household Size | Owner-occupied | Renter-occupied |
| Less than High School | 1,676 (74.1%) | 586 (25.9%) |
| High School Diploma | 4,700 (80.0%) | 1,173 (20.0%) |
| College/Associate Degree | 4,574 (71.3%) | 1,846 (28.7%) |
| Bachelor's Degree or higher | 2,995 (89.2%) | 364 (10.8%) |
Occupancy by Age of Householder in Apache Junction
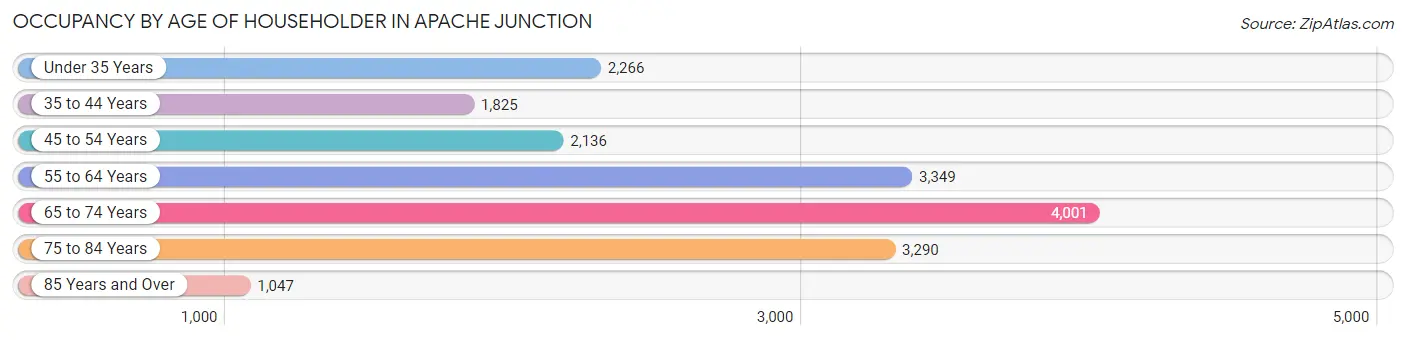
| Age Bracket | # Households | % Households |
| Under 35 Years | 2,266 | 12.7% |
| 35 to 44 Years | 1,825 | 10.2% |
| 45 to 54 Years | 2,136 | 11.9% |
| 55 to 64 Years | 3,349 | 18.7% |
| 65 to 74 Years | 4,001 | 22.3% |
| 75 to 84 Years | 3,290 | 18.4% |
| 85 Years and Over | 1,047 | 5.8% |
| Total | 17,914 | 100.0% |
Housing Finances in Apache Junction
Median Income by Occupancy in Apache Junction
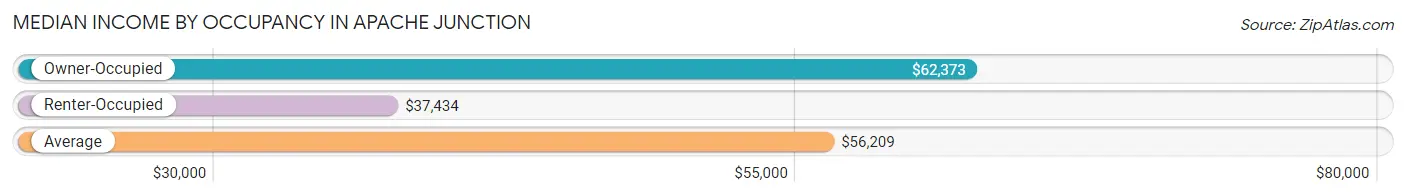
| Occupancy Type | # Households | Median Income |
| Owner-Occupied | 13,945 (77.8%) | $62,373 |
| Renter-Occupied | 3,969 (22.2%) | $37,434 |
| Average | 17,914 (100.0%) | $56,209 |
Occupancy by Householder Income Bracket in Apache Junction
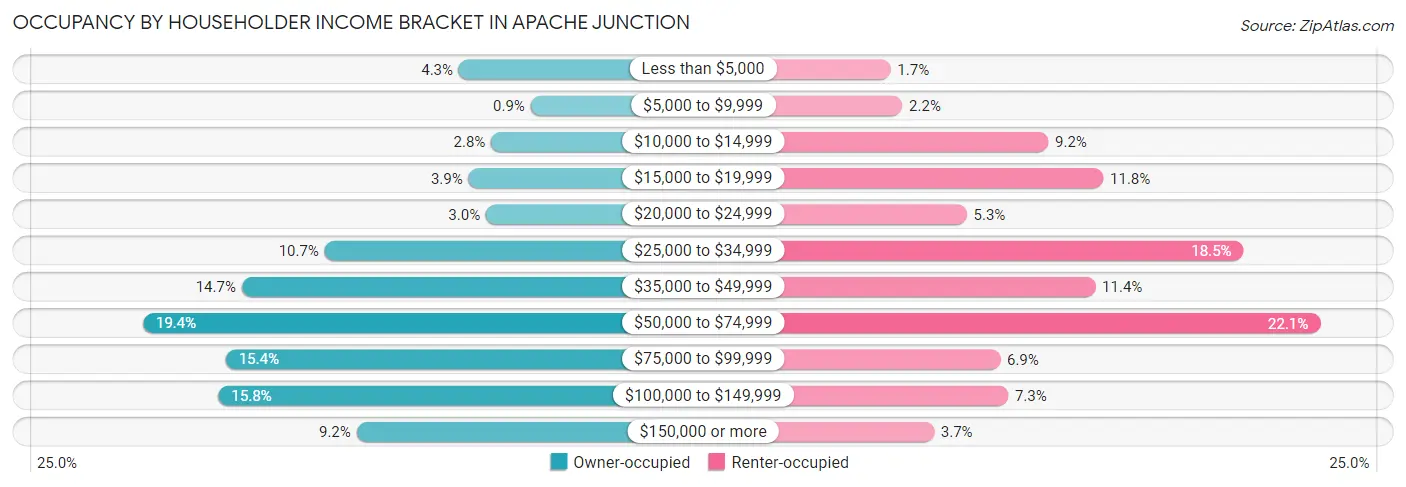
| Income Bracket | Owner-occupied | Renter-occupied |
| Less than $5,000 | 602 (4.3%) | 66 (1.7%) |
| $5,000 to $9,999 | 126 (0.9%) | 88 (2.2%) |
| $10,000 to $14,999 | 388 (2.8%) | 364 (9.2%) |
| $15,000 to $19,999 | 538 (3.9%) | 468 (11.8%) |
| $20,000 to $24,999 | 422 (3.0%) | 210 (5.3%) |
| $25,000 to $34,999 | 1,494 (10.7%) | 733 (18.5%) |
| $35,000 to $49,999 | 2,044 (14.7%) | 453 (11.4%) |
| $50,000 to $74,999 | 2,701 (19.4%) | 878 (22.1%) |
| $75,000 to $99,999 | 2,150 (15.4%) | 273 (6.9%) |
| $100,000 to $149,999 | 2,199 (15.8%) | 288 (7.3%) |
| $150,000 or more | 1,281 (9.2%) | 148 (3.7%) |
| Total | 13,945 (100.0%) | 3,969 (100.0%) |
Monthly Housing Cost Tiers in Apache Junction
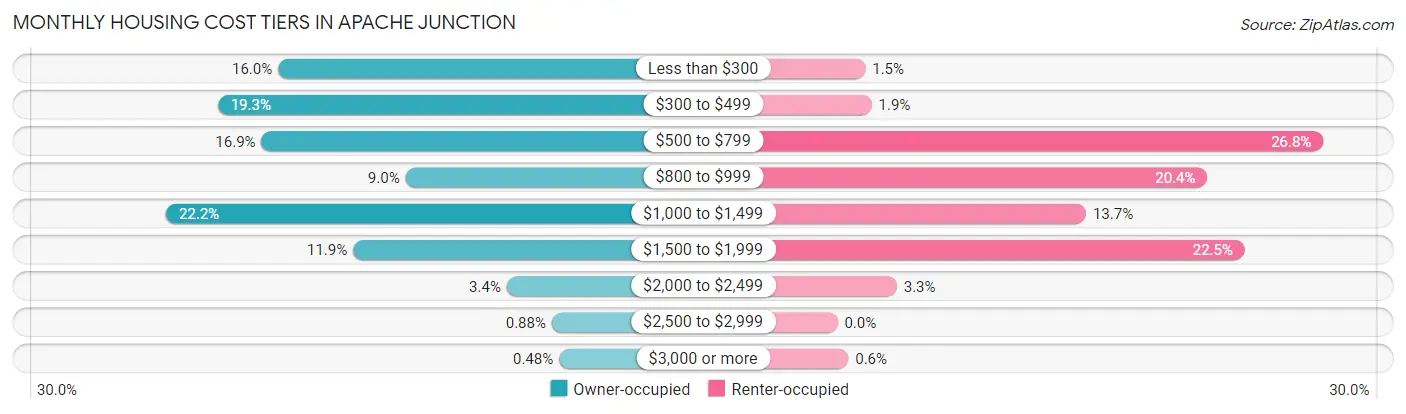
| Monthly Cost | Owner-occupied | Renter-occupied |
| Less than $300 | 2,231 (16.0%) | 61 (1.5%) |
| $300 to $499 | 2,696 (19.3%) | 75 (1.9%) |
| $500 to $799 | 2,360 (16.9%) | 1,065 (26.8%) |
| $800 to $999 | 1,249 (9.0%) | 811 (20.4%) |
| $1,000 to $1,499 | 3,095 (22.2%) | 545 (13.7%) |
| $1,500 to $1,999 | 1,654 (11.9%) | 893 (22.5%) |
| $2,000 to $2,499 | 470 (3.4%) | 130 (3.3%) |
| $2,500 to $2,999 | 123 (0.9%) | 0 (0.0%) |
| $3,000 or more | 67 (0.5%) | 24 (0.6%) |
| Total | 13,945 (100.0%) | 3,969 (100.0%) |
Physical Housing Characteristics in Apache Junction
Housing Structures in Apache Junction
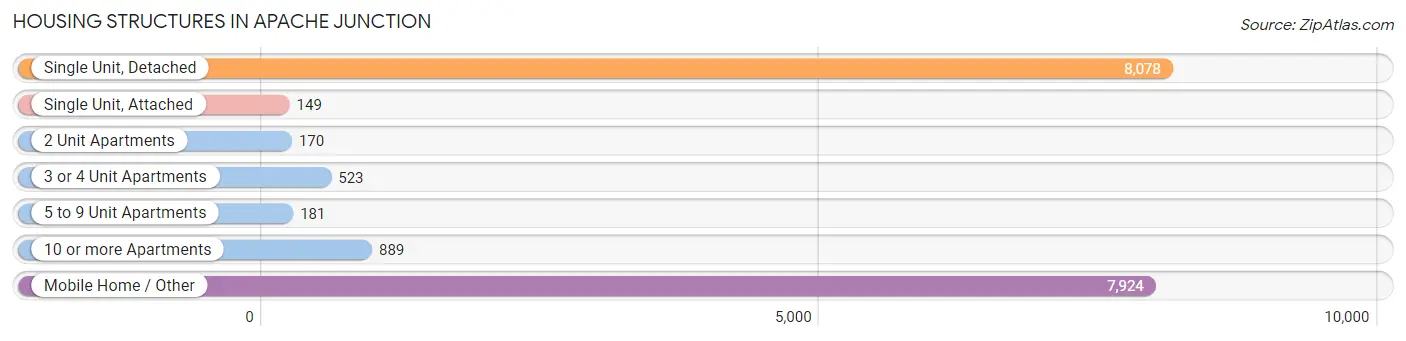
| Structure Type | # Housing Units | % Housing Units |
| Single Unit, Detached | 8,078 | 45.1% |
| Single Unit, Attached | 149 | 0.8% |
| 2 Unit Apartments | 170 | 0.9% |
| 3 or 4 Unit Apartments | 523 | 2.9% |
| 5 to 9 Unit Apartments | 181 | 1.0% |
| 10 or more Apartments | 889 | 5.0% |
| Mobile Home / Other | 7,924 | 44.2% |
| Total | 17,914 | 100.0% |
Housing Structures by Occupancy in Apache Junction
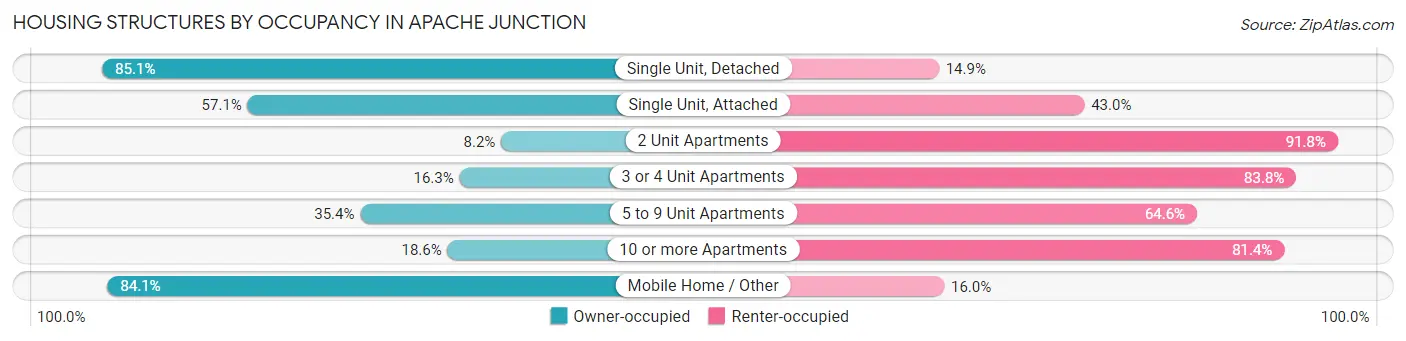
| Structure Type | Owner-occupied | Renter-occupied |
| Single Unit, Detached | 6,872 (85.1%) | 1,206 (14.9%) |
| Single Unit, Attached | 85 (57.1%) | 64 (42.9%) |
| 2 Unit Apartments | 14 (8.2%) | 156 (91.8%) |
| 3 or 4 Unit Apartments | 85 (16.3%) | 438 (83.8%) |
| 5 to 9 Unit Apartments | 64 (35.4%) | 117 (64.6%) |
| 10 or more Apartments | 165 (18.6%) | 724 (81.4%) |
| Mobile Home / Other | 6,660 (84.1%) | 1,264 (16.0%) |
| Total | 13,945 (77.8%) | 3,969 (22.2%) |
Housing Structures by Number of Rooms in Apache Junction
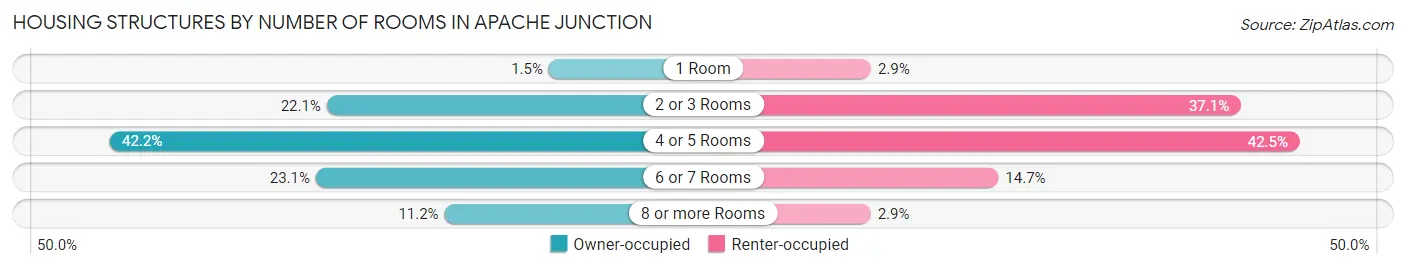
| Number of Rooms | Owner-occupied | Renter-occupied |
| 1 Room | 212 (1.5%) | 114 (2.9%) |
| 2 or 3 Rooms | 3,076 (22.1%) | 1,472 (37.1%) |
| 4 or 5 Rooms | 5,882 (42.2%) | 1,688 (42.5%) |
| 6 or 7 Rooms | 3,217 (23.1%) | 582 (14.7%) |
| 8 or more Rooms | 1,558 (11.2%) | 113 (2.9%) |
| Total | 13,945 (100.0%) | 3,969 (100.0%) |
Housing Structure by Heating Type in Apache Junction
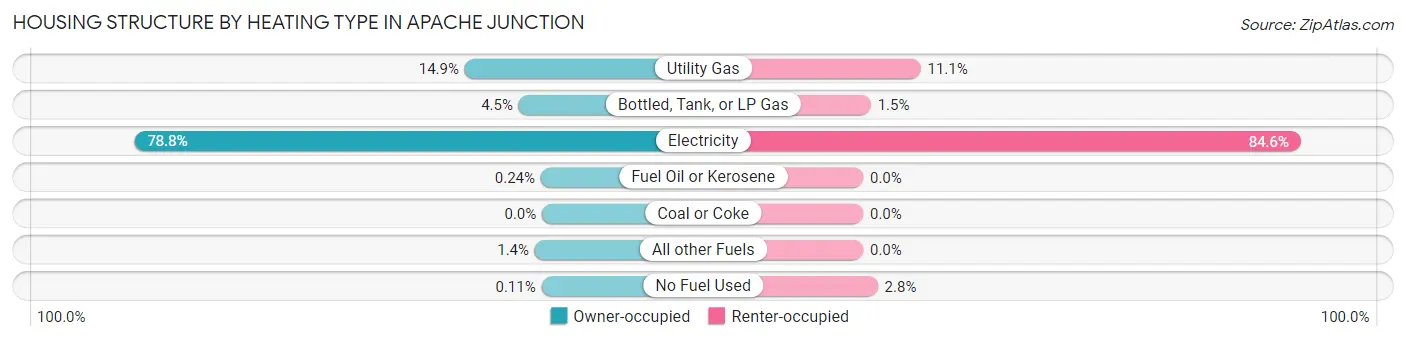
| Heating Type | Owner-occupied | Renter-occupied |
| Utility Gas | 2,084 (14.9%) | 441 (11.1%) |
| Bottled, Tank, or LP Gas | 627 (4.5%) | 59 (1.5%) |
| Electricity | 10,990 (78.8%) | 3,357 (84.6%) |
| Fuel Oil or Kerosene | 33 (0.2%) | 0 (0.0%) |
| Coal or Coke | 0 (0.0%) | 0 (0.0%) |
| All other Fuels | 195 (1.4%) | 0 (0.0%) |
| No Fuel Used | 16 (0.1%) | 112 (2.8%) |
| Total | 13,945 (100.0%) | 3,969 (100.0%) |
Household Vehicle Usage in Apache Junction
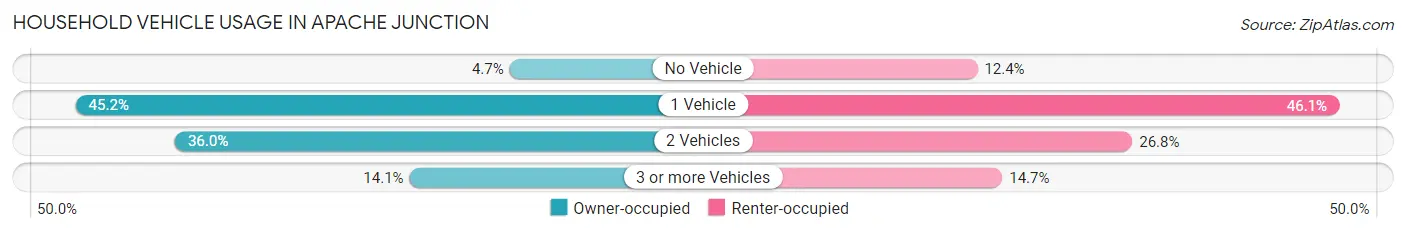
| Vehicles per Household | Owner-occupied | Renter-occupied |
| No Vehicle | 659 (4.7%) | 491 (12.4%) |
| 1 Vehicle | 6,307 (45.2%) | 1,830 (46.1%) |
| 2 Vehicles | 5,015 (36.0%) | 1,065 (26.8%) |
| 3 or more Vehicles | 1,964 (14.1%) | 583 (14.7%) |
| Total | 13,945 (100.0%) | 3,969 (100.0%) |
Real Estate & Mortgages in Apache Junction
Real Estate and Mortgage Overview in Apache Junction
| Characteristic | Without Mortgage | With Mortgage |
| Housing Units | 7,845 | 6,100 |
| Median Property Value | $90,300 | $260,000 |
| Median Household Income | $47,327 | $827 |
| Monthly Housing Costs | $431 | $27 |
| Real Estate Taxes | $613 | $355 |
Property Value by Mortgage Status in Apache Junction
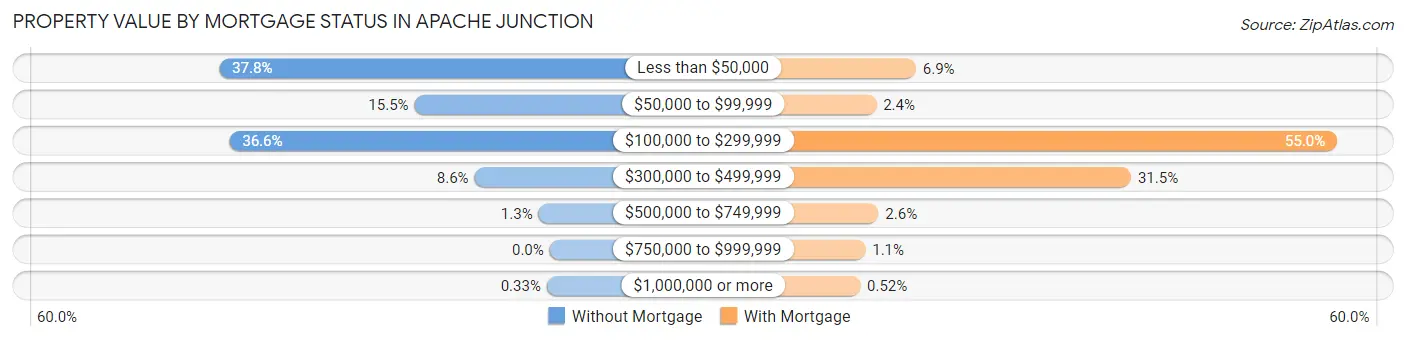
| Property Value | Without Mortgage | With Mortgage |
| Less than $50,000 | 2,962 (37.8%) | 420 (6.9%) |
| $50,000 to $99,999 | 1,212 (15.4%) | 144 (2.4%) |
| $100,000 to $299,999 | 2,871 (36.6%) | 3,357 (55.0%) |
| $300,000 to $499,999 | 674 (8.6%) | 1,920 (31.5%) |
| $500,000 to $749,999 | 100 (1.3%) | 159 (2.6%) |
| $750,000 to $999,999 | 0 (0.0%) | 68 (1.1%) |
| $1,000,000 or more | 26 (0.3%) | 32 (0.5%) |
| Total | 7,845 (100.0%) | 6,100 (100.0%) |
Household Income by Mortgage Status in Apache Junction
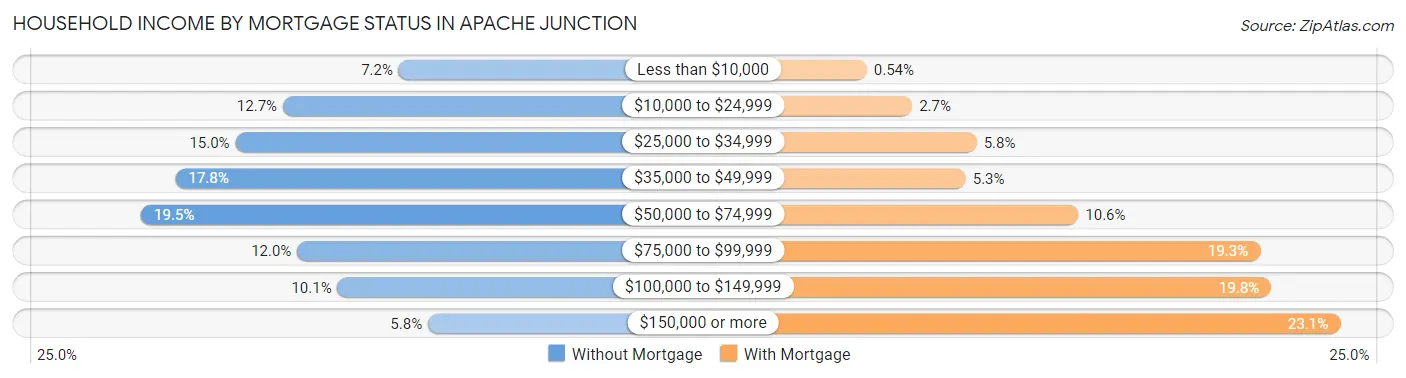
| Household Income | Without Mortgage | With Mortgage |
| Less than $10,000 | 563 (7.2%) | 33 (0.5%) |
| $10,000 to $24,999 | 996 (12.7%) | 165 (2.7%) |
| $25,000 to $34,999 | 1,174 (15.0%) | 352 (5.8%) |
| $35,000 to $49,999 | 1,397 (17.8%) | 320 (5.2%) |
| $50,000 to $74,999 | 1,526 (19.5%) | 647 (10.6%) |
| $75,000 to $99,999 | 943 (12.0%) | 1,175 (19.3%) |
| $100,000 to $149,999 | 792 (10.1%) | 1,207 (19.8%) |
| $150,000 or more | 454 (5.8%) | 1,407 (23.1%) |
| Total | 7,845 (100.0%) | 6,100 (100.0%) |
Property Value to Household Income Ratio in Apache Junction
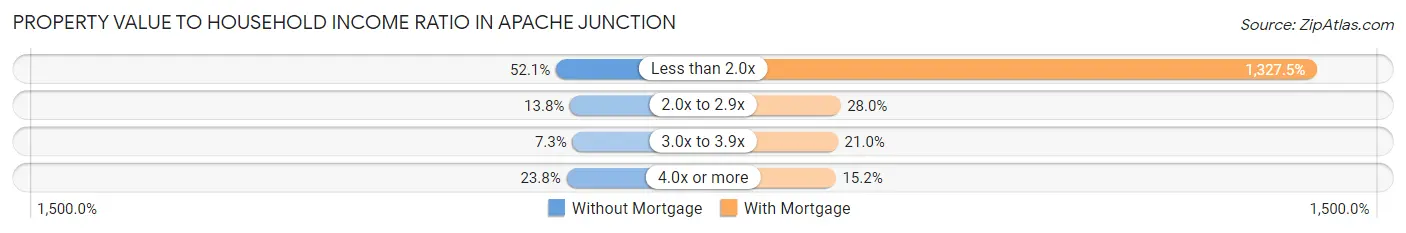
| Value-to-Income Ratio | Without Mortgage | With Mortgage |
| Less than 2.0x | 4,083 (52.0%) | 80,977 (1,327.5%) |
| 2.0x to 2.9x | 1,080 (13.8%) | 1,708 (28.0%) |
| 3.0x to 3.9x | 572 (7.3%) | 1,283 (21.0%) |
| 4.0x or more | 1,868 (23.8%) | 927 (15.2%) |
| Total | 7,845 (100.0%) | 6,100 (100.0%) |
Real Estate Taxes by Mortgage Status in Apache Junction
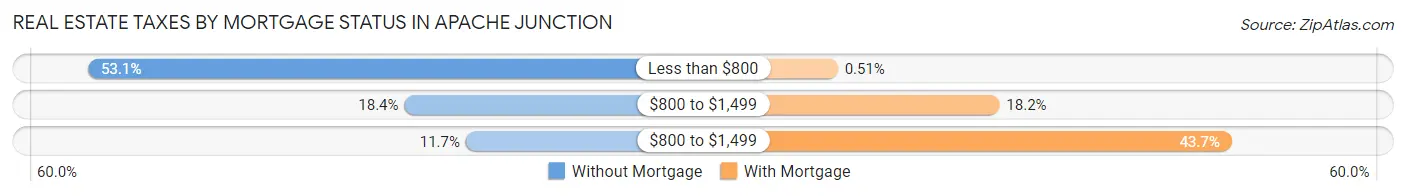
| Property Taxes | Without Mortgage | With Mortgage |
| Less than $800 | 4,162 (53.0%) | 31 (0.5%) |
| $800 to $1,499 | 1,442 (18.4%) | 1,112 (18.2%) |
| $800 to $1,499 | 914 (11.7%) | 2,665 (43.7%) |
| Total | 7,845 (100.0%) | 6,100 (100.0%) |
Health & Disability in Apache Junction
Health Insurance Coverage by Age in Apache Junction
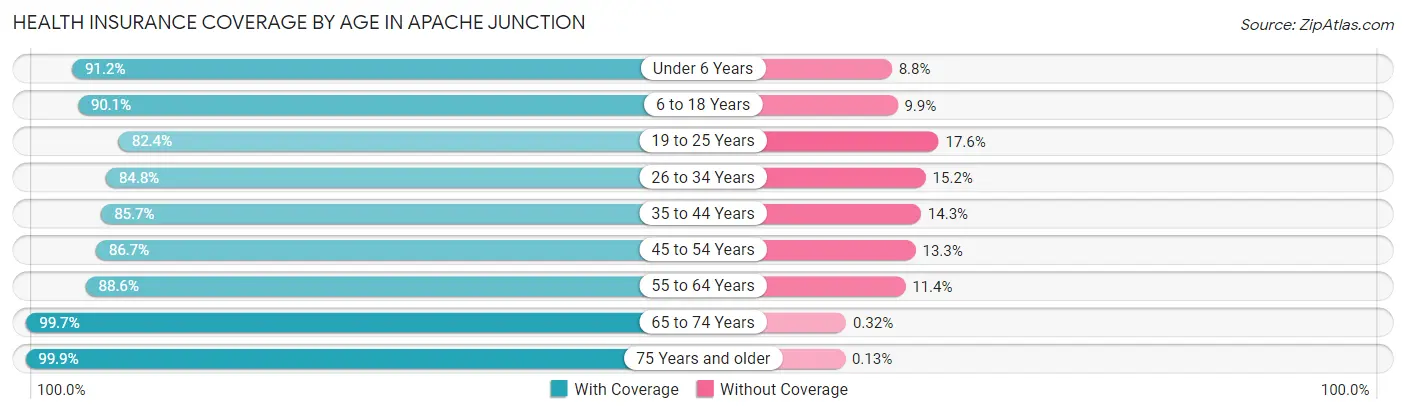
| Age Bracket | With Coverage | Without Coverage |
| Under 6 Years | 1,701 (91.2%) | 165 (8.8%) |
| 6 to 18 Years | 4,040 (90.1%) | 445 (9.9%) |
| 19 to 25 Years | 1,525 (82.4%) | 325 (17.6%) |
| 26 to 34 Years | 3,495 (84.8%) | 625 (15.2%) |
| 35 to 44 Years | 2,861 (85.7%) | 477 (14.3%) |
| 45 to 54 Years | 3,587 (86.7%) | 550 (13.3%) |
| 55 to 64 Years | 5,086 (88.6%) | 653 (11.4%) |
| 65 to 74 Years | 6,298 (99.7%) | 20 (0.3%) |
| 75 Years and older | 6,752 (99.9%) | 9 (0.1%) |
| Total | 35,345 (91.5%) | 3,269 (8.5%) |
Health Insurance Coverage by Citizenship Status in Apache Junction
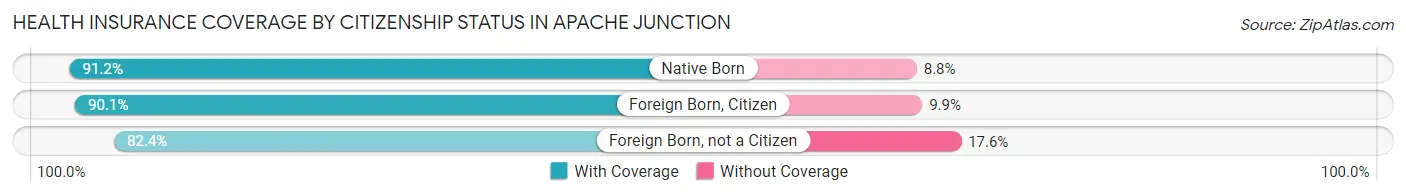
| Citizenship Status | With Coverage | Without Coverage |
| Native Born | 1,701 (91.2%) | 165 (8.8%) |
| Foreign Born, Citizen | 4,040 (90.1%) | 445 (9.9%) |
| Foreign Born, not a Citizen | 1,525 (82.4%) | 325 (17.6%) |
Health Insurance Coverage by Household Income in Apache Junction
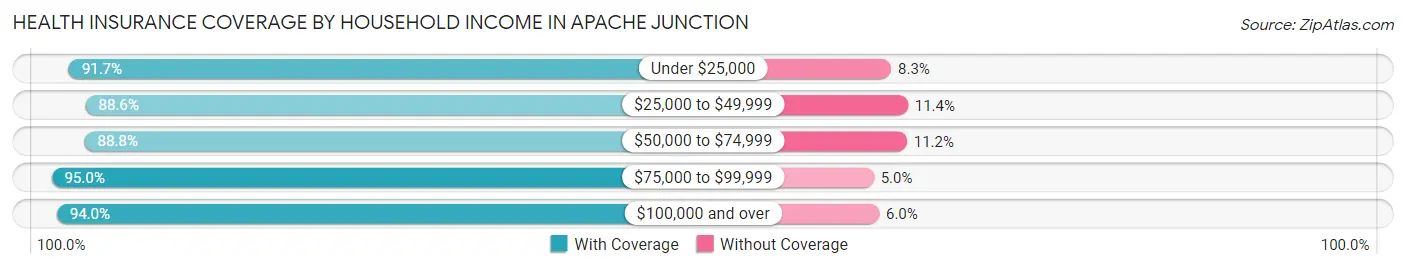
| Household Income | With Coverage | Without Coverage |
| Under $25,000 | 3,957 (91.7%) | 358 (8.3%) |
| $25,000 to $49,999 | 7,333 (88.6%) | 946 (11.4%) |
| $50,000 to $74,999 | 7,724 (88.8%) | 978 (11.2%) |
| $75,000 to $99,999 | 5,672 (95.0%) | 301 (5.0%) |
| $100,000 and over | 10,606 (94.0%) | 682 (6.0%) |
Public vs Private Health Insurance Coverage by Age in Apache Junction
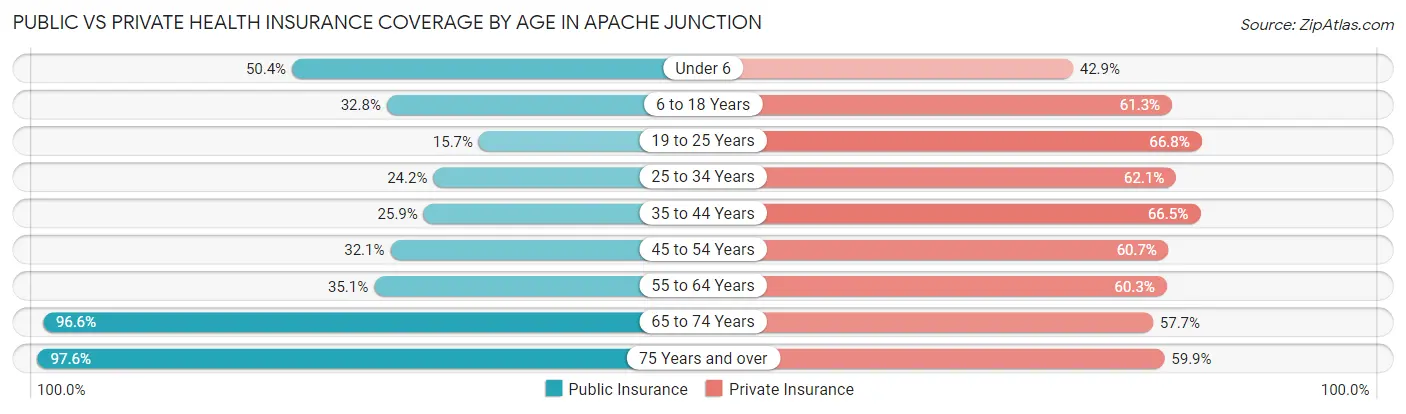
| Age Bracket | Public Insurance | Private Insurance |
| Under 6 | 940 (50.4%) | 800 (42.9%) |
| 6 to 18 Years | 1,470 (32.8%) | 2,748 (61.3%) |
| 19 to 25 Years | 290 (15.7%) | 1,235 (66.8%) |
| 25 to 34 Years | 995 (24.1%) | 2,557 (62.1%) |
| 35 to 44 Years | 866 (25.9%) | 2,219 (66.5%) |
| 45 to 54 Years | 1,329 (32.1%) | 2,510 (60.7%) |
| 55 to 64 Years | 2,016 (35.1%) | 3,460 (60.3%) |
| 65 to 74 Years | 6,103 (96.6%) | 3,648 (57.7%) |
| 75 Years and over | 6,597 (97.6%) | 4,048 (59.9%) |
| Total | 20,606 (53.4%) | 23,225 (60.2%) |
Disability Status by Sex by Age in Apache Junction
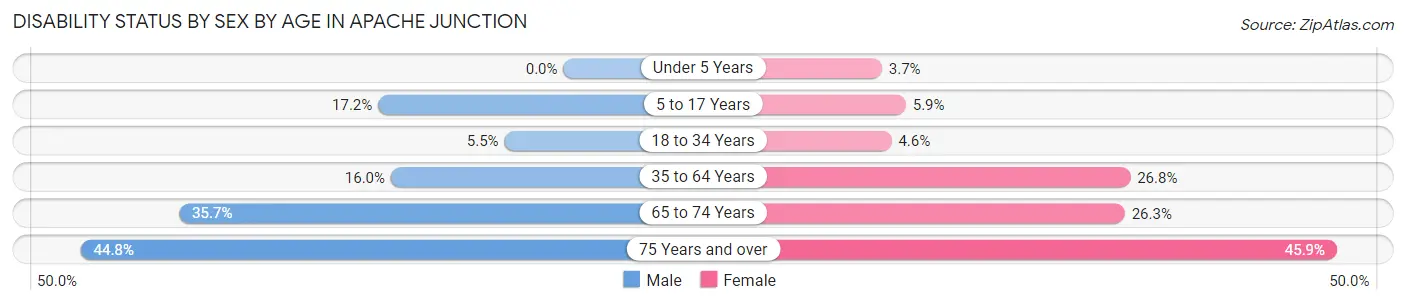
| Age Bracket | Male | Female |
| Under 5 Years | 0 (0.0%) | 35 (3.7%) |
| 5 to 17 Years | 397 (17.2%) | 118 (5.9%) |
| 18 to 34 Years | 205 (5.5%) | 121 (4.6%) |
| 35 to 64 Years | 1,015 (16.0%) | 1,840 (26.8%) |
| 65 to 74 Years | 1,054 (35.7%) | 883 (26.3%) |
| 75 Years and over | 1,330 (44.8%) | 1,742 (45.9%) |
Disability Class by Sex by Age in Apache Junction
Disability Class: Hearing Difficulty
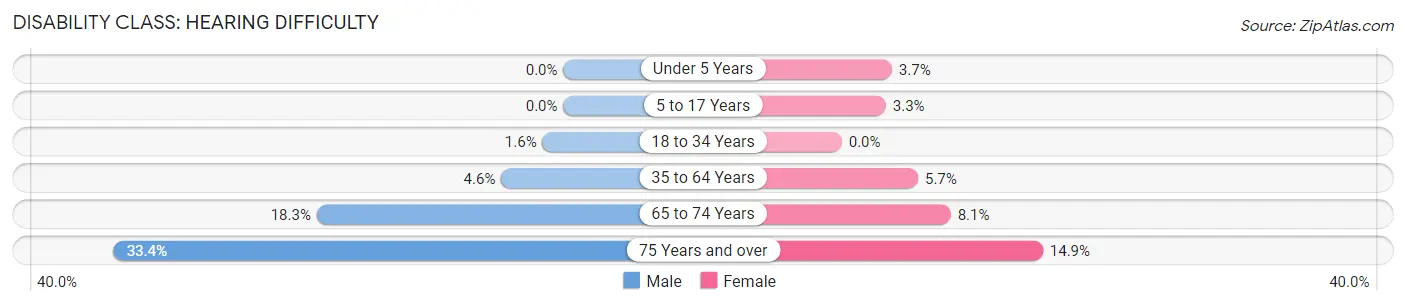
| Age Bracket | Male | Female |
| Under 5 Years | 0 (0.0%) | 35 (3.7%) |
| 5 to 17 Years | 0 (0.0%) | 65 (3.3%) |
| 18 to 34 Years | 58 (1.5%) | 0 (0.0%) |
| 35 to 64 Years | 292 (4.6%) | 389 (5.7%) |
| 65 to 74 Years | 541 (18.3%) | 272 (8.1%) |
| 75 Years and over | 991 (33.4%) | 566 (14.9%) |
Disability Class: Vision Difficulty
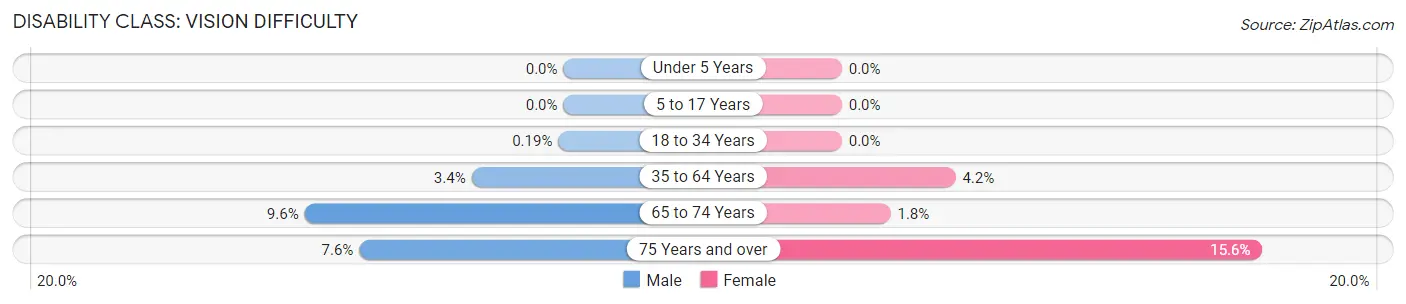
| Age Bracket | Male | Female |
| Under 5 Years | 0 (0.0%) | 0 (0.0%) |
| 5 to 17 Years | 0 (0.0%) | 0 (0.0%) |
| 18 to 34 Years | 7 (0.2%) | 0 (0.0%) |
| 35 to 64 Years | 216 (3.4%) | 290 (4.2%) |
| 65 to 74 Years | 284 (9.6%) | 61 (1.8%) |
| 75 Years and over | 225 (7.6%) | 592 (15.6%) |
Disability Class: Cognitive Difficulty
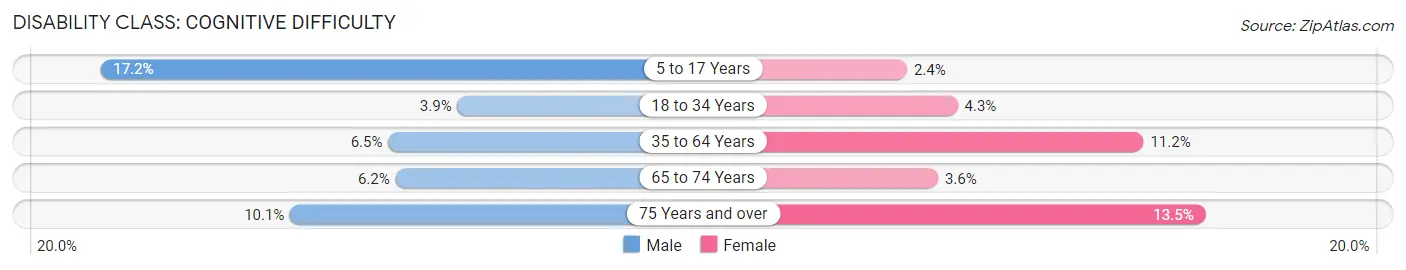
| Age Bracket | Male | Female |
| 5 to 17 Years | 397 (17.2%) | 48 (2.4%) |
| 18 to 34 Years | 147 (3.9%) | 113 (4.3%) |
| 35 to 64 Years | 412 (6.5%) | 770 (11.2%) |
| 65 to 74 Years | 184 (6.2%) | 120 (3.6%) |
| 75 Years and over | 301 (10.1%) | 512 (13.5%) |
Disability Class: Ambulatory Difficulty
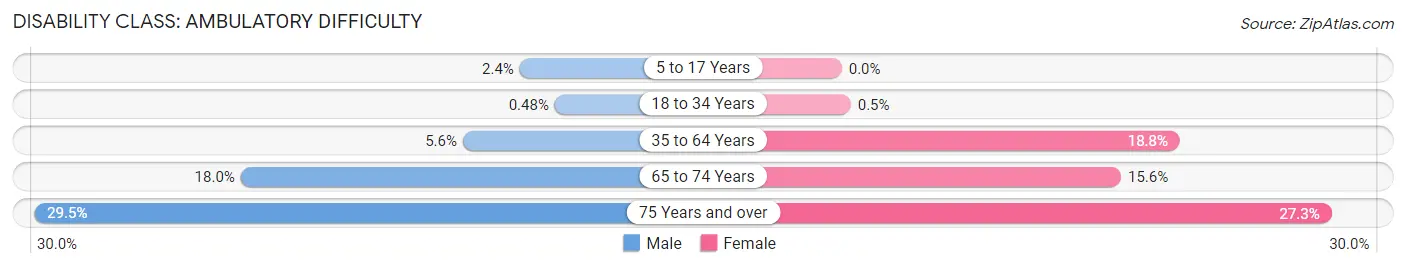
| Age Bracket | Male | Female |
| 5 to 17 Years | 56 (2.4%) | 0 (0.0%) |
| 18 to 34 Years | 18 (0.5%) | 13 (0.5%) |
| 35 to 64 Years | 355 (5.6%) | 1,294 (18.8%) |
| 65 to 74 Years | 531 (18.0%) | 523 (15.5%) |
| 75 Years and over | 875 (29.5%) | 1,034 (27.3%) |
Disability Class: Self-Care Difficulty
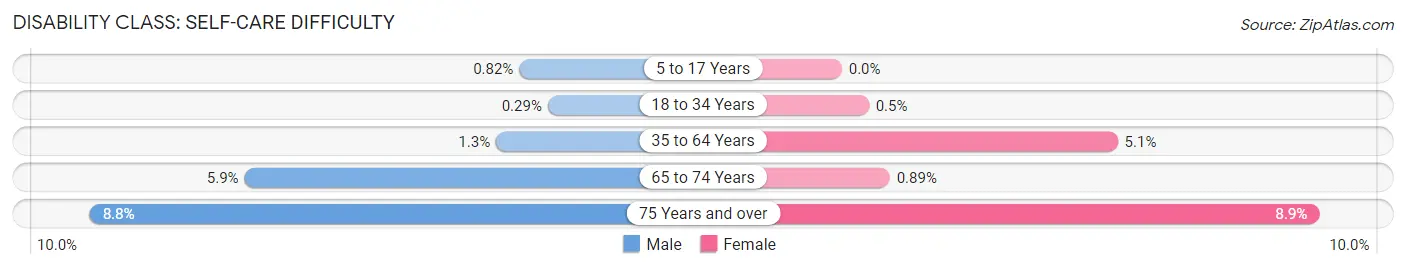
| Age Bracket | Male | Female |
| 5 to 17 Years | 19 (0.8%) | 0 (0.0%) |
| 18 to 34 Years | 11 (0.3%) | 13 (0.5%) |
| 35 to 64 Years | 79 (1.3%) | 352 (5.1%) |
| 65 to 74 Years | 175 (5.9%) | 30 (0.9%) |
| 75 Years and over | 261 (8.8%) | 336 (8.9%) |
Technology Access in Apache Junction
Computing Device Access in Apache Junction
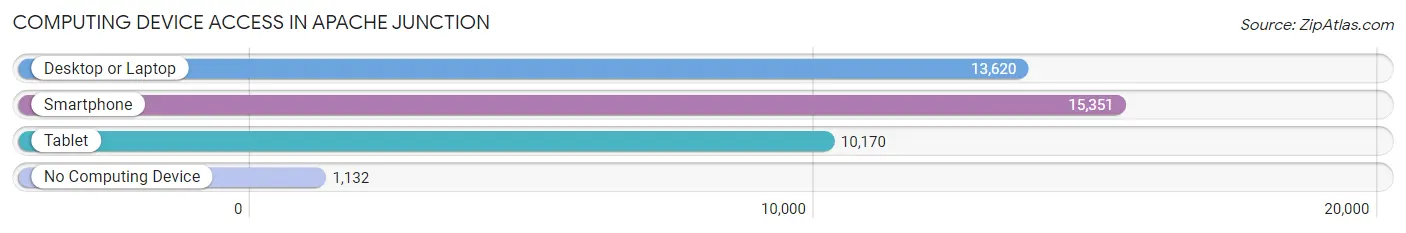
| Device Type | # Households | % Households |
| Desktop or Laptop | 13,620 | 76.0% |
| Smartphone | 15,351 | 85.7% |
| Tablet | 10,170 | 56.8% |
| No Computing Device | 1,132 | 6.3% |
| Total | 17,914 | 100.0% |
Internet Access in Apache Junction
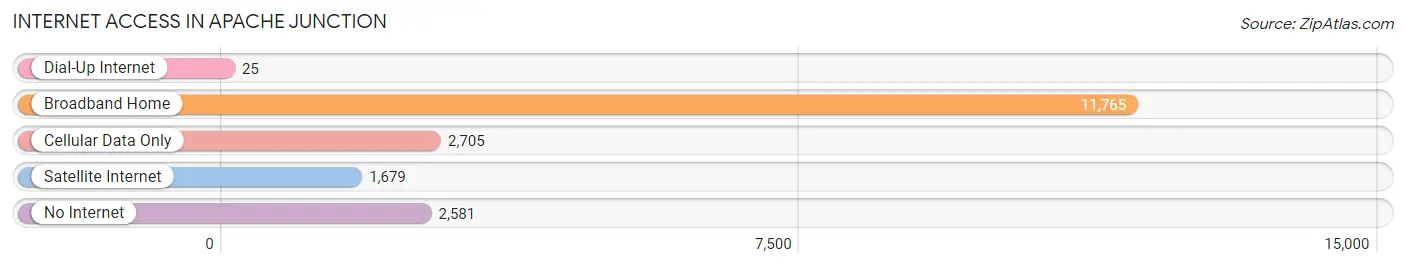
| Internet Type | # Households | % Households |
| Dial-Up Internet | 25 | 0.1% |
| Broadband Home | 11,765 | 65.7% |
| Cellular Data Only | 2,705 | 15.1% |
| Satellite Internet | 1,679 | 9.4% |
| No Internet | 2,581 | 14.4% |
| Total | 17,914 | 100.0% |
Apache Junction Summary
Apache Junction is a city located in Maricopa County, Arizona, United States. It is a suburb of Phoenix and is located in the East Valley section of the Phoenix Metropolitan Area. The city is named after the junction of the Apache Trail and U.S. Route 60. As of the 2010 census, the population of Apache Junction was 35,840, an increase of 9.3% from the 2000 census population of 32,776.
Geography
Apache Junction is located at 33°24′54″N 111°32′46″W (33.415, -111.546). According to the United States Census Bureau, the city has a total area of 34.2 square miles (88.6 km2), all land.
Apache Junction is located on the edge of the Sonoran Desert, at the base of the Superstition Mountains. The Superstition Mountains are a range of mountains in the Sonoran Desert, located east of Phoenix, Arizona. The range is a popular recreation area, and is home to the Superstition Wilderness Area, a large wilderness area of more than 160,000 acres.
Climate
Apache Junction has a hot desert climate, with hot summers and mild winters. The average high temperature in July is 106°F (41°C), and the average low temperature in January is 43°F (6°C). The average annual precipitation is 8.5 inches (216 mm).
Demographics
As of the 2010 census, there were 35,840 people, 15,890 households, and 9,945 families residing in the city. The population density was 1,053.3 people per square mile (406.9/km2). There were 17,890 housing units at an average density of 522.7 per square mile (201.9/km2). The racial makeup of the city was 87.2% White, 1.2% Black or African American, 1.2% Native American, 0.9% Asian, 0.1% Pacific Islander, 7.2% from other races, and 2.2% from two or more races. Hispanic or Latino of any race were 19.2% of the population.
Economy
Apache Junction is home to a variety of businesses, including manufacturing, retail, and service industries. The city is also home to a number of tourist attractions, including the Superstition Mountains, Lost Dutchman State Park, and the Apache Trail.
The city's largest employers include the Apache Junction Unified School District, the City of Apache Junction, and the Apache Junction Hospital. Other major employers include the Apache Junction Chamber of Commerce, the Apache Junction Public Library, and the Apache Junction Police Department.
Conclusion
Apache Junction is a city located in Maricopa County, Arizona, United States. It is a suburb of Phoenix and is located in the East Valley section of the Phoenix Metropolitan Area. The city is named after the junction of the Apache Trail and U.S. Route 60. As of the 2010 census, the population of Apache Junction was 35,840, an increase of 9.3% from the 2000 census population of 32,776. Apache Junction has a hot desert climate, with hot summers and mild winters. The city is home to a variety of businesses, including manufacturing, retail, and service industries. The city's largest employers include the Apache Junction Unified School District, the City of Apache Junction, and the Apache Junction Hospital. Apache Junction is also home to a number of tourist attractions, including the Superstition Mountains, Lost Dutchman State Park, and the Apache Trail.
Common Questions
What is Per Capita Income in Apache Junction?
Per Capita income in Apache Junction is $34,148.
What is the Median Family Income in Apache Junction?
Median Family Income in Apache Junction is $67,412.
What is the Median Household income in Apache Junction?
Median Household Income in Apache Junction is $56,209.
What is Income or Wage Gap in Apache Junction?
Income or Wage Gap in Apache Junction is 24.9%.
Women in Apache Junction earn 75.1 cents for every dollar earned by a man.
What is Family Income Deficit in Apache Junction?
Family Income Deficit in Apache Junction is $7,651.
Families that are below poverty line in Apache Junction earn $7,651 less on average than the poverty threshold level.
What is Inequality or Gini Index in Apache Junction?
Inequality or Gini Index in Apache Junction is 0.44.
What is the Total Population of Apache Junction?
Total Population of Apache Junction is 38,855.
What is the Total Male Population of Apache Junction?
Total Male Population of Apache Junction is 19,160.
What is the Total Female Population of Apache Junction?
Total Female Population of Apache Junction is 19,695.
What is the Ratio of Males per 100 Females in Apache Junction?
There are 97.28 Males per 100 Females in Apache Junction.
What is the Ratio of Females per 100 Males in Apache Junction?
There are 102.79 Females per 100 Males in Apache Junction.
What is the Median Population Age in Apache Junction?
Median Population Age in Apache Junction is 53.9 Years.
What is the Average Family Size in Apache Junction
Average Family Size in Apache Junction is 2.7 People.
What is the Average Household Size in Apache Junction
Average Household Size in Apache Junction is 2.1 People.
How Large is the Labor Force in Apache Junction?
There are 16,095 People in the Labor Forcein in Apache Junction.
What is the Percentage of People in the Labor Force in Apache Junction?
47.7% of People are in the Labor Force in Apache Junction.
What is the Unemployment Rate in Apache Junction?
Unemployment Rate in Apache Junction is 8.9%.