Altamonte Springs, FL Map & Demographics
Altamonte Springs Map
Altamonte Springs Overview
$36,032
PER CAPITA INCOME
$72,436
AVG FAMILY INCOME
$61,714
AVG HOUSEHOLD INCOME
7.2%
WAGE / INCOME GAP [ % ]
92.8¢/ $1
WAGE / INCOME GAP [ $ ]
$8,808
FAMILY INCOME DEFICIT
0.40
INEQUALITY / GINI INDEX
45,772
TOTAL POPULATION
20,511
MALE POPULATION
25,261
FEMALE POPULATION
81.20
MALES / 100 FEMALES
123.16
FEMALES / 100 MALES
36.0
MEDIAN AGE
3.0
AVG FAMILY SIZE
2.2
AVG HOUSEHOLD SIZE
27,671
LABOR FORCE [ PEOPLE ]
72.7%
PERCENT IN LABOR FORCE
5.4%
UNEMPLOYMENT RATE
Altamonte Springs Area Codes
Income in Altamonte Springs
Income Overview in Altamonte Springs
Per Capita Income in Altamonte Springs is $36,032, while median incomes of families and households are $72,436 and $61,714 respectively.
| Characteristic | Number | Measure |
| Per Capita Income | 45,772 | $36,032 |
| Median Family Income | 10,489 | $72,436 |
| Mean Family Income | 10,489 | $88,076 |
| Median Household Income | 20,913 | $61,714 |
| Mean Household Income | 20,913 | $76,296 |
| Income Deficit | 10,489 | $8,808 |
| Wage / Income Gap (%) | 45,772 | 7.17% |
| Wage / Income Gap ($) | 45,772 | 92.83¢ per $1 |
| Gini / Inequality Index | 45,772 | 0.40 |
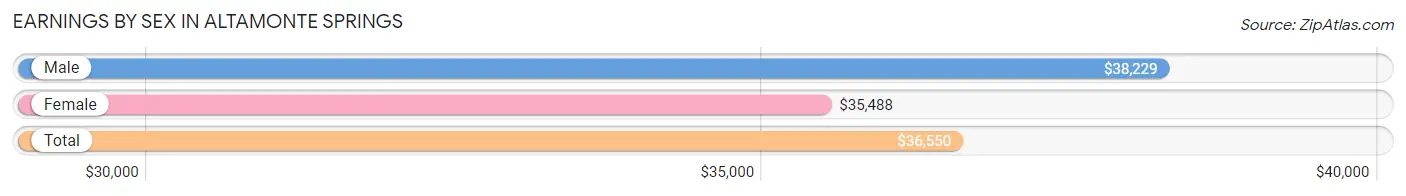
Earnings by Sex in Altamonte Springs
Average Earnings in Altamonte Springs are $36,550, $38,229 for men and $35,488 for women, a difference of 7.2%.
| Sex | Number | Average Earnings |
| Male | 13,583 (47.9%) | $38,229 |
| Female | 14,763 (52.1%) | $35,488 |
| Total | 28,346 (100.0%) | $36,550 |
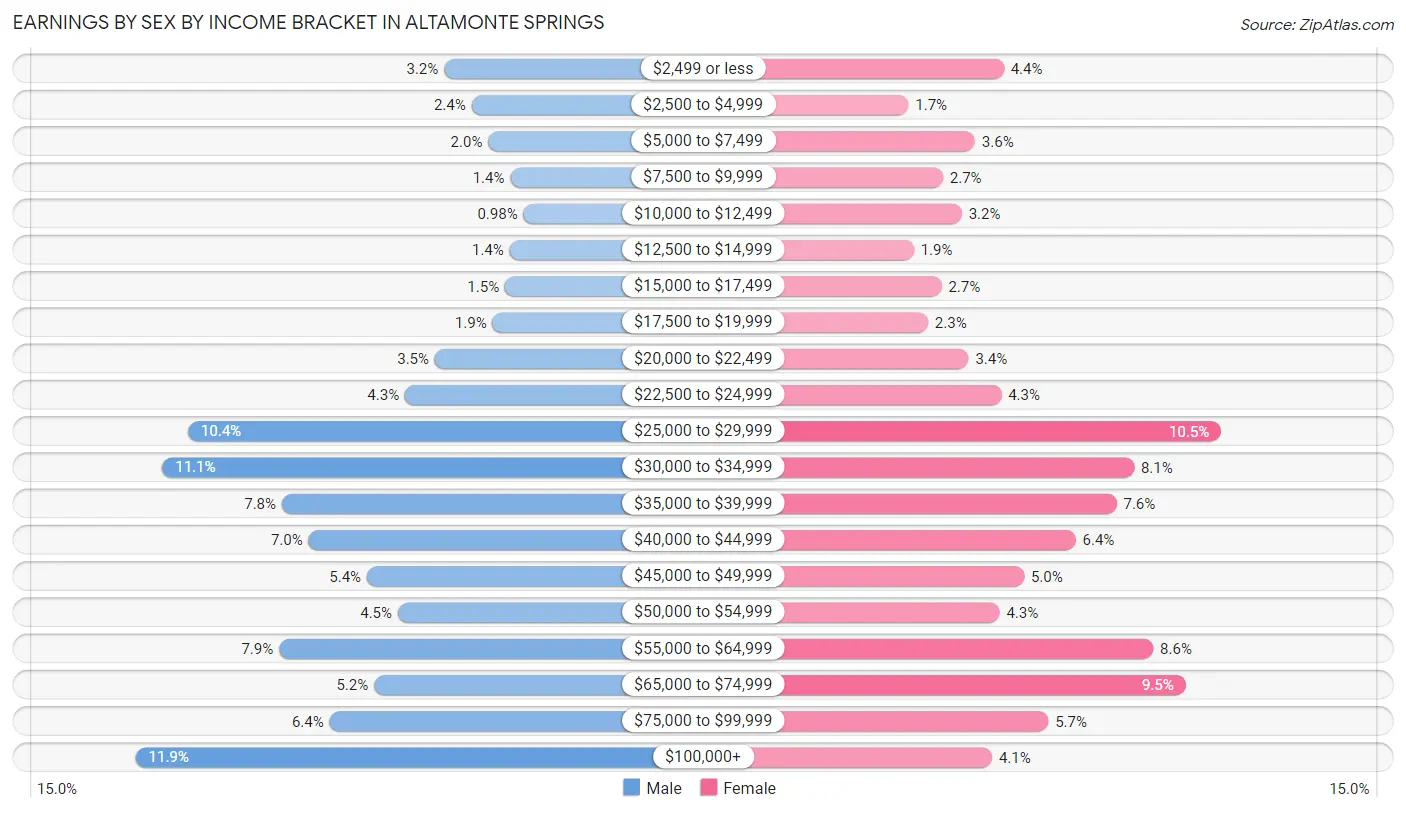
Earnings by Sex by Income Bracket in Altamonte Springs
The most common earnings brackets in Altamonte Springs are $100,000+ for men (1,613 | 11.9%) and $25,000 to $29,999 for women (1,553 | 10.5%).
| Income | Male | Female |
| $2,499 or less | 436 (3.2%) | 651 (4.4%) |
| $2,500 to $4,999 | 332 (2.4%) | 256 (1.7%) |
| $5,000 to $7,499 | 267 (2.0%) | 532 (3.6%) |
| $7,500 to $9,999 | 184 (1.3%) | 399 (2.7%) |
| $10,000 to $12,499 | 133 (1.0%) | 477 (3.2%) |
| $12,500 to $14,999 | 186 (1.4%) | 277 (1.9%) |
| $15,000 to $17,499 | 204 (1.5%) | 393 (2.7%) |
| $17,500 to $19,999 | 251 (1.8%) | 337 (2.3%) |
| $20,000 to $22,499 | 471 (3.5%) | 505 (3.4%) |
| $22,500 to $24,999 | 586 (4.3%) | 640 (4.3%) |
| $25,000 to $29,999 | 1,414 (10.4%) | 1,553 (10.5%) |
| $30,000 to $34,999 | 1,512 (11.1%) | 1,191 (8.1%) |
| $35,000 to $39,999 | 1,055 (7.8%) | 1,119 (7.6%) |
| $40,000 to $44,999 | 953 (7.0%) | 949 (6.4%) |
| $45,000 to $49,999 | 731 (5.4%) | 735 (5.0%) |
| $50,000 to $54,999 | 612 (4.5%) | 633 (4.3%) |
| $55,000 to $64,999 | 1,066 (7.9%) | 1,271 (8.6%) |
| $65,000 to $74,999 | 703 (5.2%) | 1,406 (9.5%) |
| $75,000 to $99,999 | 874 (6.4%) | 836 (5.7%) |
| $100,000+ | 1,613 (11.9%) | 603 (4.1%) |
| Total | 13,583 (100.0%) | 14,763 (100.0%) |
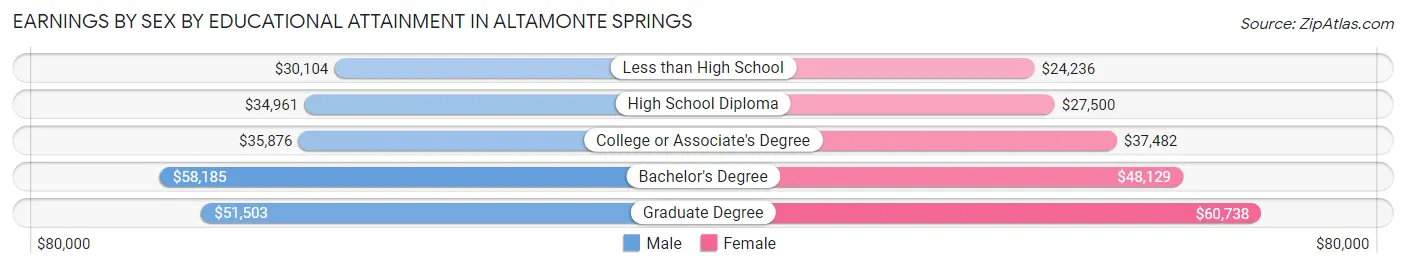
Earnings by Sex by Educational Attainment in Altamonte Springs
Average earnings in Altamonte Springs are $40,768 for men and $38,807 for women, a difference of 4.8%. Men with an educational attainment of bachelor's degree enjoy the highest average annual earnings of $58,185, while those with less than high school education earn the least with $30,104. Women with an educational attainment of graduate degree earn the most with the average annual earnings of $60,738, while those with less than high school education have the smallest earnings of $24,236.
| Educational Attainment | Male Income | Female Income |
| Less than High School | $30,104 | $24,236 |
| High School Diploma | $34,961 | $27,500 |
| College or Associate's Degree | $35,876 | $37,482 |
| Bachelor's Degree | $58,185 | $48,129 |
| Graduate Degree | $51,503 | $60,738 |
| Total | $40,768 | $38,807 |
Family Income in Altamonte Springs
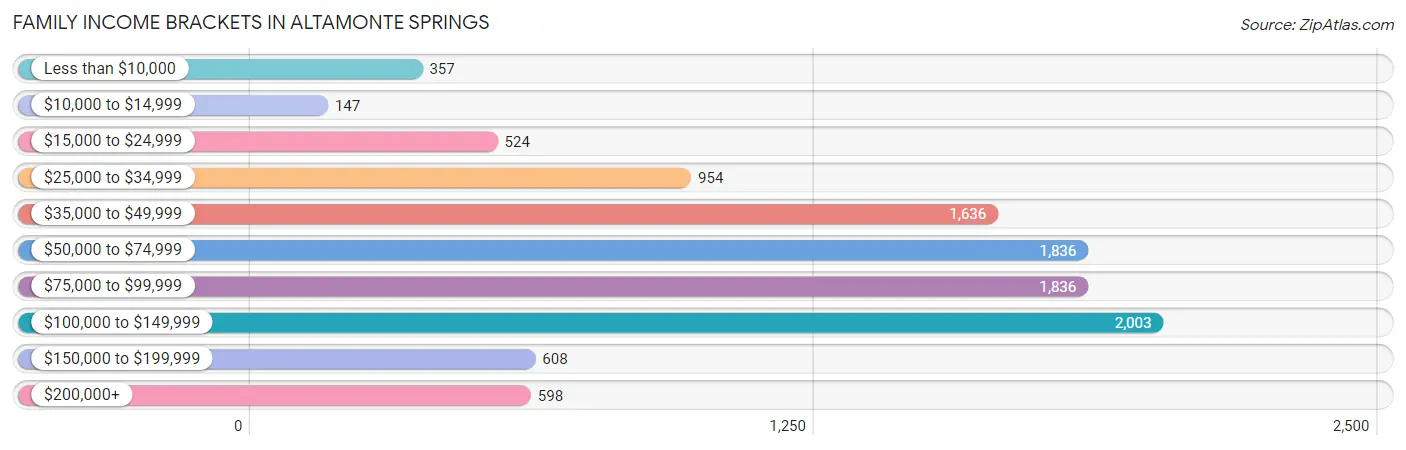
Family Income Brackets in Altamonte Springs
According to the Altamonte Springs family income data, there are 2,003 families falling into the $100,000 to $149,999 income range, which is the most common income bracket and makes up 19.1% of all families. Conversely, the $10,000 to $14,999 income bracket is the least frequent group with only 147 families (1.4%) belonging to this category.
| Income Bracket | # Families | % Families |
| Less than $10,000 | 357 | 3.4% |
| $10,000 to $14,999 | 147 | 1.4% |
| $15,000 to $24,999 | 524 | 5.0% |
| $25,000 to $34,999 | 954 | 9.1% |
| $35,000 to $49,999 | 1,636 | 15.6% |
| $50,000 to $74,999 | 1,836 | 17.5% |
| $75,000 to $99,999 | 1,836 | 17.5% |
| $100,000 to $149,999 | 2,003 | 19.1% |
| $150,000 to $199,999 | 608 | 5.8% |
| $200,000+ | 598 | 5.7% |
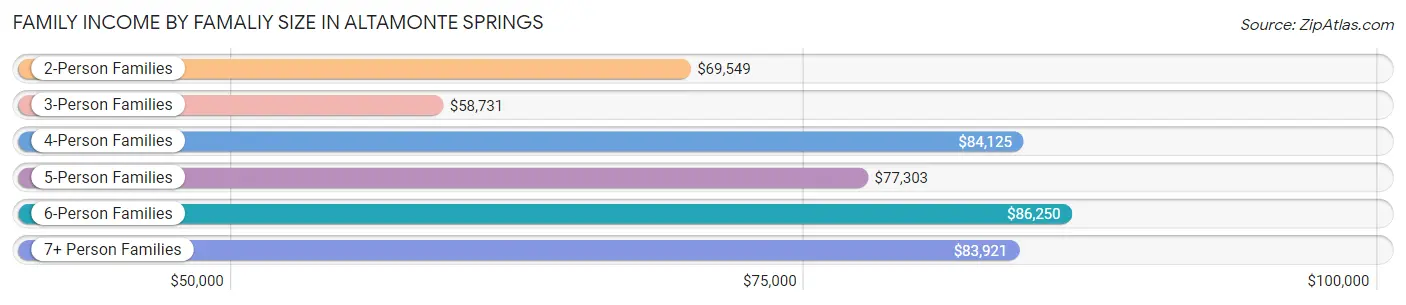
Family Income by Famaliy Size in Altamonte Springs
6-person families (58 | 0.5%) account for the highest median family income in Altamonte Springs with $86,250 per family, while 2-person families (5,457 | 52.0%) have the highest median income of $34,774 per family member.
| Income Bracket | # Families | Median Income |
| 2-Person Families | 5,457 (52.0%) | $69,549 |
| 3-Person Families | 2,503 (23.9%) | $58,731 |
| 4-Person Families | 1,554 (14.8%) | $84,125 |
| 5-Person Families | 780 (7.4%) | $77,303 |
| 6-Person Families | 58 (0.5%) | $86,250 |
| 7+ Person Families | 137 (1.3%) | $83,921 |
| Total | 10,489 (100.0%) | $72,436 |
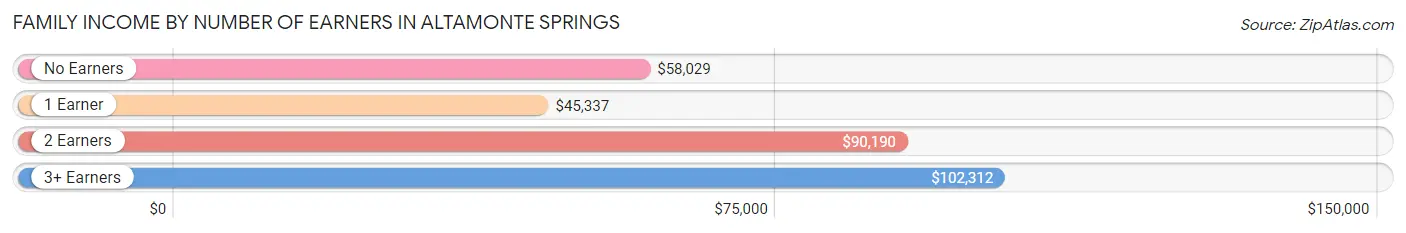
Family Income by Number of Earners in Altamonte Springs
The median family income in Altamonte Springs is $72,436, with families comprising 3+ earners (1,102) having the highest median family income of $102,312, while families with 1 earner (3,785) have the lowest median family income of $45,337, accounting for 10.5% and 36.1% of families, respectively.
| Number of Earners | # Families | Median Income |
| No Earners | 1,039 (9.9%) | $58,029 |
| 1 Earner | 3,785 (36.1%) | $45,337 |
| 2 Earners | 4,563 (43.5%) | $90,190 |
| 3+ Earners | 1,102 (10.5%) | $102,312 |
| Total | 10,489 (100.0%) | $72,436 |
Household Income in Altamonte Springs
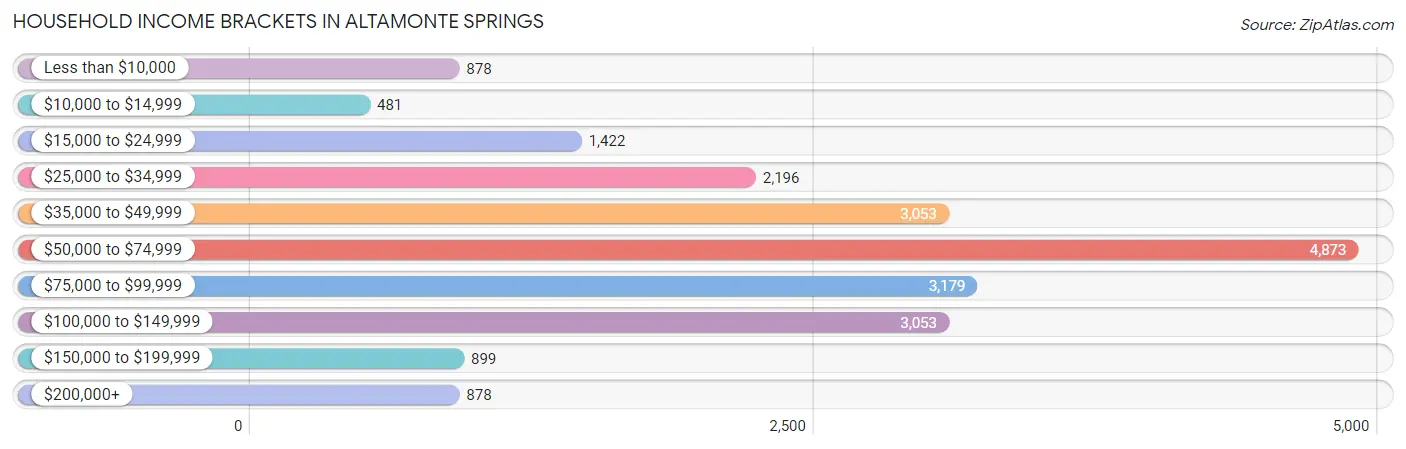
Household Income Brackets in Altamonte Springs
With 4,873 households falling in the category, the $50,000 to $74,999 income range is the most frequent in Altamonte Springs, accounting for 23.3% of all households. In contrast, only 481 households (2.3%) fall into the $10,000 to $14,999 income bracket, making it the least populous group.
| Income Bracket | # Households | % Households |
| Less than $10,000 | 878 | 4.2% |
| $10,000 to $14,999 | 481 | 2.3% |
| $15,000 to $24,999 | 1,422 | 6.8% |
| $25,000 to $34,999 | 2,196 | 10.5% |
| $35,000 to $49,999 | 3,053 | 14.6% |
| $50,000 to $74,999 | 4,873 | 23.3% |
| $75,000 to $99,999 | 3,179 | 15.2% |
| $100,000 to $149,999 | 3,053 | 14.6% |
| $150,000 to $199,999 | 899 | 4.3% |
| $200,000+ | 878 | 4.2% |
Household Income by Householder Age in Altamonte Springs
The median household income in Altamonte Springs is $61,714, with the highest median household income of $66,994 found in the 25 to 44 years age bracket for the primary householder. A total of 9,362 households (44.8%) fall into this category. Meanwhile, the 65+ years age bracket for the primary householder has the lowest median household income of $47,295, with 4,329 households (20.7%) in this group.
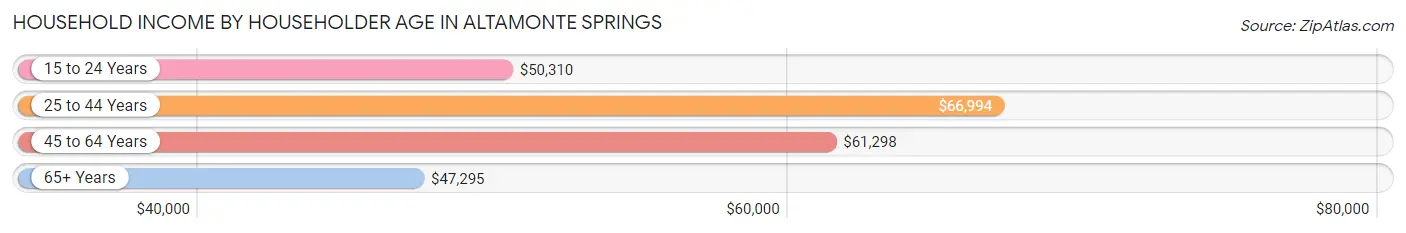
| Income Bracket | # Households | Median Income |
| 15 to 24 Years | 1,002 (4.8%) | $50,310 |
| 25 to 44 Years | 9,362 (44.8%) | $66,994 |
| 45 to 64 Years | 6,220 (29.7%) | $61,298 |
| 65+ Years | 4,329 (20.7%) | $47,295 |
| Total | 20,913 (100.0%) | $61,714 |
Poverty in Altamonte Springs
Income Below Poverty by Sex and Age in Altamonte Springs
With 9.2% poverty level for males and 12.7% for females among the residents of Altamonte Springs, 15 year old males and 16 and 17 year old females are the most vulnerable to poverty, with 29 males (51.8%) and 158 females (31.3%) in their respective age groups living below the poverty level.
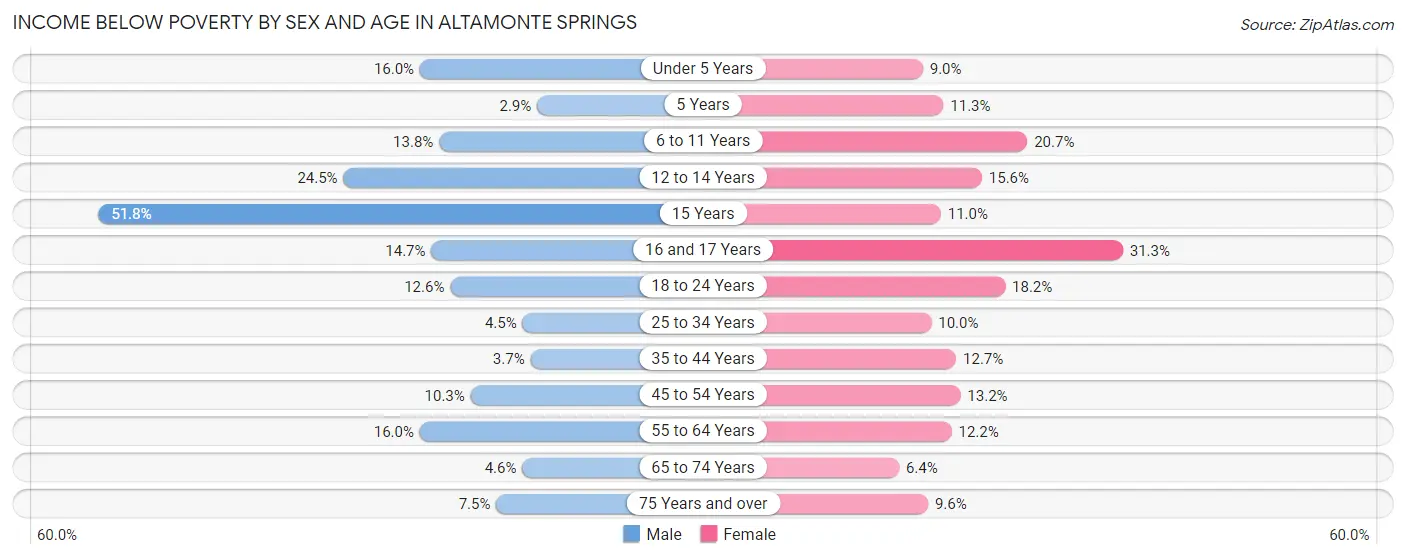
| Age Bracket | Male | Female |
| Under 5 Years | 145 (16.0%) | 107 (9.0%) |
| 5 Years | 8 (2.9%) | 31 (11.3%) |
| 6 to 11 Years | 211 (13.8%) | 310 (20.6%) |
| 12 to 14 Years | 192 (24.5%) | 95 (15.6%) |
| 15 Years | 29 (51.8%) | 30 (11.0%) |
| 16 and 17 Years | 66 (14.7%) | 158 (31.3%) |
| 18 to 24 Years | 186 (12.6%) | 411 (18.2%) |
| 25 to 34 Years | 216 (4.5%) | 488 (10.0%) |
| 35 to 44 Years | 128 (3.7%) | 514 (12.7%) |
| 45 to 54 Years | 236 (10.3%) | 319 (13.2%) |
| 55 to 64 Years | 327 (16.0%) | 358 (12.2%) |
| 65 to 74 Years | 61 (4.6%) | 122 (6.4%) |
| 75 Years and over | 79 (7.5%) | 178 (9.6%) |
| Total | 1,884 (9.2%) | 3,121 (12.7%) |
Income Above Poverty by Sex and Age in Altamonte Springs
According to the poverty statistics in Altamonte Springs, males aged 5 years and females aged 65 to 74 years are the age groups that are most secure financially, with 97.1% of males and 93.6% of females in these age groups living above the poverty line.
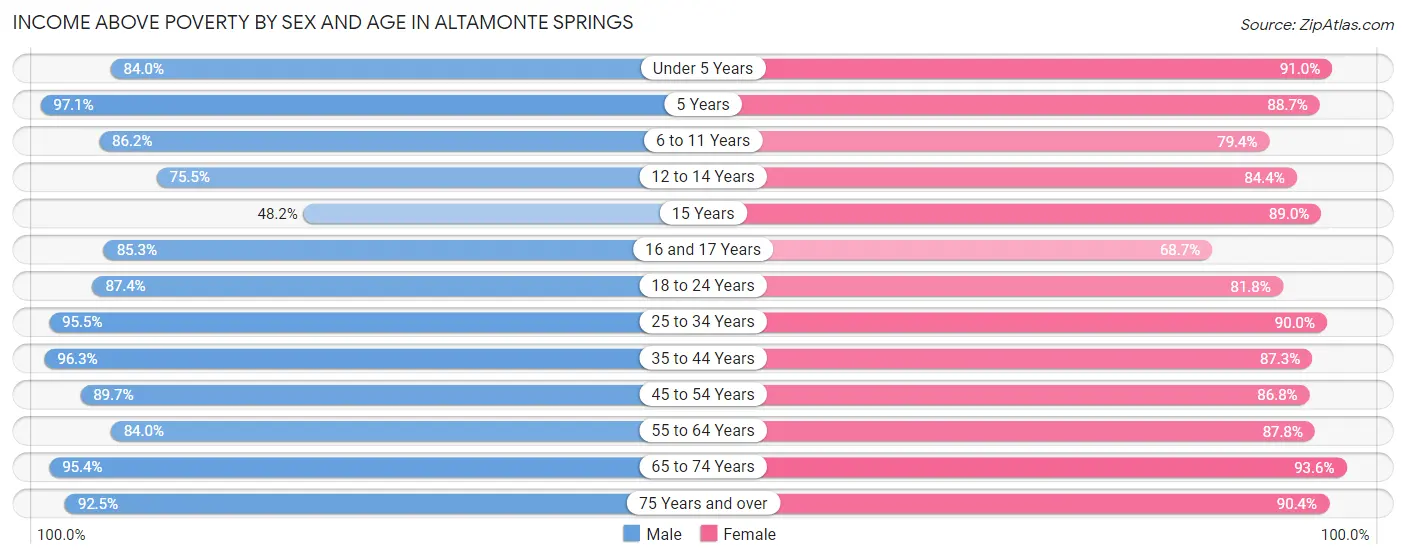
| Age Bracket | Male | Female |
| Under 5 Years | 763 (84.0%) | 1,079 (91.0%) |
| 5 Years | 266 (97.1%) | 243 (88.7%) |
| 6 to 11 Years | 1,315 (86.2%) | 1,191 (79.3%) |
| 12 to 14 Years | 592 (75.5%) | 514 (84.4%) |
| 15 Years | 27 (48.2%) | 242 (89.0%) |
| 16 and 17 Years | 383 (85.3%) | 347 (68.7%) |
| 18 to 24 Years | 1,290 (87.4%) | 1,848 (81.8%) |
| 25 to 34 Years | 4,545 (95.5%) | 4,407 (90.0%) |
| 35 to 44 Years | 3,371 (96.3%) | 3,525 (87.3%) |
| 45 to 54 Years | 2,048 (89.7%) | 2,095 (86.8%) |
| 55 to 64 Years | 1,718 (84.0%) | 2,572 (87.8%) |
| 65 to 74 Years | 1,274 (95.4%) | 1,792 (93.6%) |
| 75 Years and over | 979 (92.5%) | 1,677 (90.4%) |
| Total | 18,571 (90.8%) | 21,532 (87.3%) |
Income Below Poverty Among Married-Couple Families in Altamonte Springs
The poverty statistics for married-couple families in Altamonte Springs show that 5.7% or 352 of the total 6,153 families live below the poverty line. Families with 1 or 2 children have the highest poverty rate of 13.1%, comprising of 266 families. On the other hand, families with 3 or 4 children have the lowest poverty rate of 0.0%, which includes 0 families.
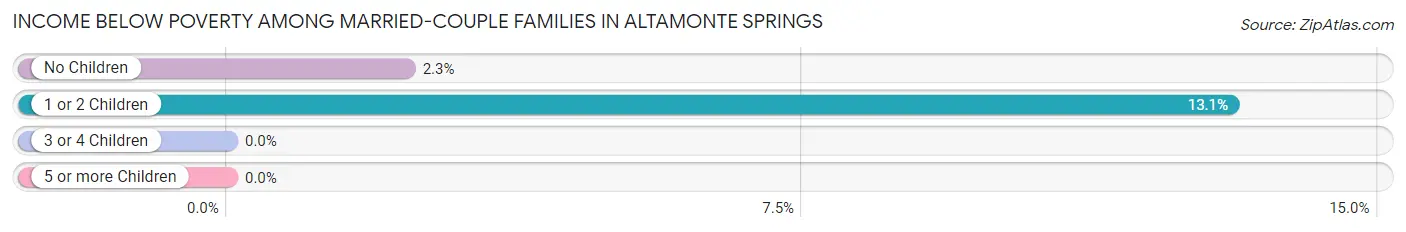
| Children | Above Poverty | Below Poverty |
| No Children | 3,626 (97.7%) | 86 (2.3%) |
| 1 or 2 Children | 1,767 (86.9%) | 266 (13.1%) |
| 3 or 4 Children | 408 (100.0%) | 0 (0.0%) |
| 5 or more Children | 0 (0.0%) | 0 (0.0%) |
| Total | 5,801 (94.3%) | 352 (5.7%) |
Income Below Poverty Among Single-Parent Households in Altamonte Springs
According to the poverty data in Altamonte Springs, 2.2% or 21 single-father households and 20.0% or 677 single-mother households are living below the poverty line. Among single-father households, those with 1 or 2 children have the highest poverty rate, with 14 households (2.9%) experiencing poverty. Likewise, among single-mother households, those with 3 or 4 children have the highest poverty rate, with 75 households (32.5%) falling below the poverty line.
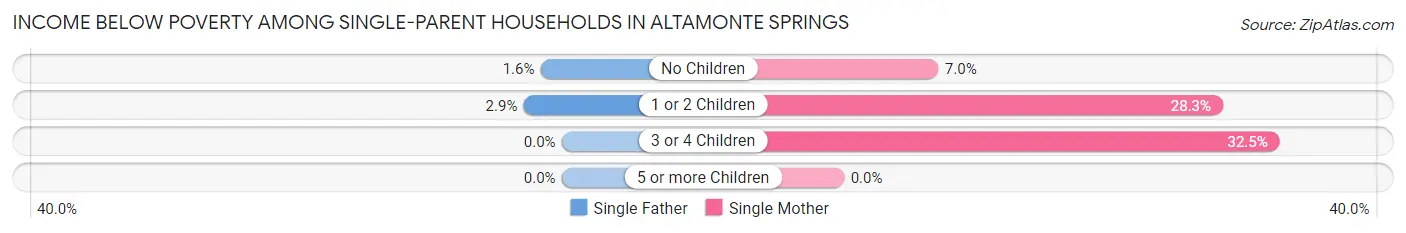
| Children | Single Father | Single Mother |
| No Children | 7 (1.6%) | 95 (7.0%) |
| 1 or 2 Children | 14 (2.9%) | 507 (28.2%) |
| 3 or 4 Children | 0 (0.0%) | 75 (32.5%) |
| 5 or more Children | 0 (0.0%) | 0 (0.0%) |
| Total | 21 (2.2%) | 677 (20.0%) |
Income Below Poverty Among Married-Couple vs Single-Parent Households in Altamonte Springs
The poverty data for Altamonte Springs shows that 352 of the married-couple family households (5.7%) and 698 of the single-parent households (16.1%) are living below the poverty level. Within the married-couple family households, those with 1 or 2 children have the highest poverty rate, with 266 households (13.1%) falling below the poverty line. Among the single-parent households, those with 3 or 4 children have the highest poverty rate, with 75 household (29.6%) living below poverty.
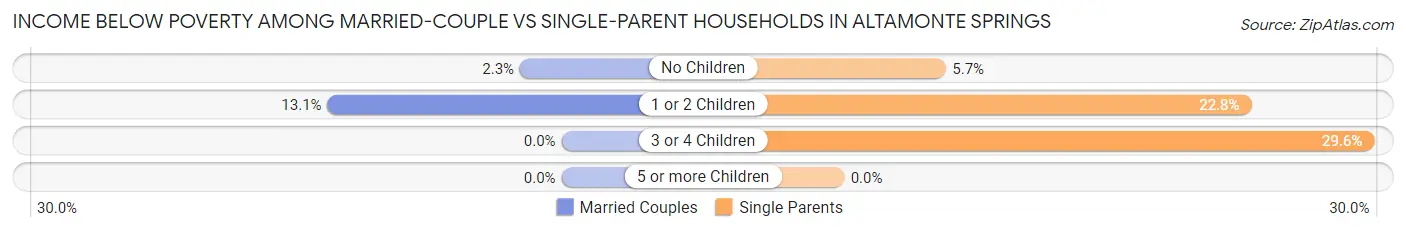
| Children | Married-Couple Families | Single-Parent Households |
| No Children | 86 (2.3%) | 102 (5.7%) |
| 1 or 2 Children | 266 (13.1%) | 521 (22.8%) |
| 3 or 4 Children | 0 (0.0%) | 75 (29.6%) |
| 5 or more Children | 0 (0.0%) | 0 (0.0%) |
| Total | 352 (5.7%) | 698 (16.1%) |
Race in Altamonte Springs
The most populous races in Altamonte Springs are White / Caucasian (26,416 | 57.7%), Hispanic or Latino (13,495 | 29.5%), and Black / African American (8,434 | 18.4%).
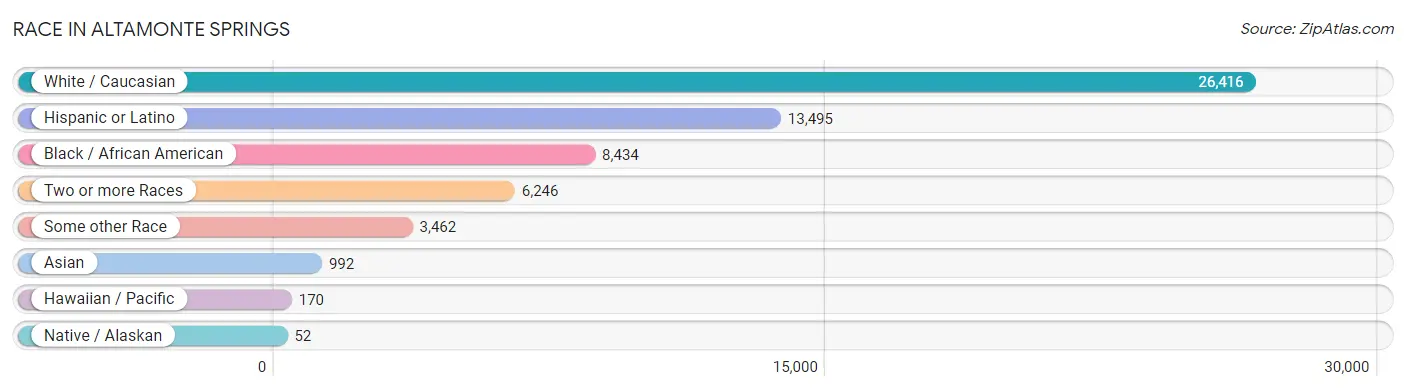
| Race | # Population | % Population |
| Asian | 992 | 2.2% |
| Black / African American | 8,434 | 18.4% |
| Hawaiian / Pacific | 170 | 0.4% |
| Hispanic or Latino | 13,495 | 29.5% |
| Native / Alaskan | 52 | 0.1% |
| White / Caucasian | 26,416 | 57.7% |
| Two or more Races | 6,246 | 13.7% |
| Some other Race | 3,462 | 7.6% |
| Total | 45,772 | 100.0% |
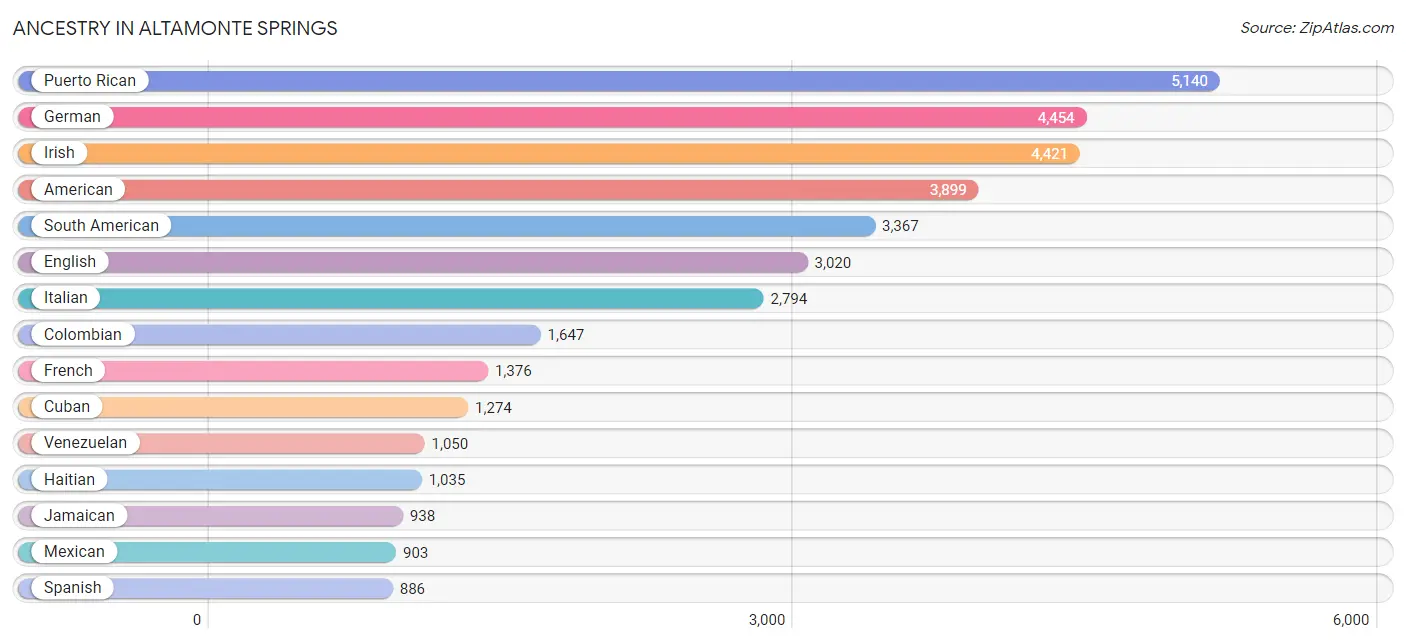
Ancestry in Altamonte Springs
The most populous ancestries reported in Altamonte Springs are Puerto Rican (5,140 | 11.2%), German (4,454 | 9.7%), Irish (4,421 | 9.7%), American (3,899 | 8.5%), and South American (3,367 | 7.4%), together accounting for 46.5% of all Altamonte Springs residents.
| Ancestry | # Population | % Population |
| Afghan | 29 | 0.1% |
| African | 263 | 0.6% |
| Alaskan Athabascan | 6 | 0.0% |
| American | 3,899 | 8.5% |
| Arab | 444 | 1.0% |
| Argentinean | 19 | 0.0% |
| Armenian | 12 | 0.0% |
| Austrian | 64 | 0.1% |
| Bahamian | 10 | 0.0% |
| Barbadian | 18 | 0.0% |
| Belgian | 24 | 0.1% |
| Bermudan | 249 | 0.5% |
| Bhutanese | 30 | 0.1% |
| Brazilian | 464 | 1.0% |
| British | 418 | 0.9% |
| British West Indian | 22 | 0.1% |
| Bulgarian | 19 | 0.0% |
| Burmese | 197 | 0.4% |
| Canadian | 30 | 0.1% |
| Cape Verdean | 19 | 0.0% |
| Celtic | 67 | 0.2% |
| Central American | 851 | 1.9% |
| Central American Indian | 53 | 0.1% |
| Cherokee | 78 | 0.2% |
| Chilean | 40 | 0.1% |
| Colombian | 1,647 | 3.6% |
| Costa Rican | 46 | 0.1% |
| Creek | 9 | 0.0% |
| Croatian | 7 | 0.0% |
| Cuban | 1,274 | 2.8% |
| Cypriot | 54 | 0.1% |
| Czech | 129 | 0.3% |
| Danish | 48 | 0.1% |
| Dominican | 788 | 1.7% |
| Dutch | 200 | 0.4% |
| Eastern European | 132 | 0.3% |
| Ecuadorian | 446 | 1.0% |
| Egyptian | 132 | 0.3% |
| English | 3,020 | 6.6% |
| Estonian | 59 | 0.1% |
| European | 501 | 1.1% |
| Filipino | 1 | 0.0% |
| Finnish | 61 | 0.1% |
| French | 1,376 | 3.0% |
| French Canadian | 163 | 0.4% |
| German | 4,454 | 9.7% |
| Greek | 231 | 0.5% |
| Guamanian / Chamorro | 22 | 0.1% |
| Guyanese | 173 | 0.4% |
| Haitian | 1,035 | 2.3% |
| Honduran | 97 | 0.2% |
| Hungarian | 117 | 0.3% |
| Indian (Asian) | 103 | 0.2% |
| Indonesian | 18 | 0.0% |
| Inupiat | 8 | 0.0% |
| Iranian | 50 | 0.1% |
| Iraqi | 10 | 0.0% |
| Irish | 4,421 | 9.7% |
| Iroquois | 152 | 0.3% |
| Italian | 2,794 | 6.1% |
| Jamaican | 938 | 2.1% |
| Japanese | 49 | 0.1% |
| Jordanian | 7 | 0.0% |
| Korean | 414 | 0.9% |
| Laotian | 88 | 0.2% |
| Latvian | 10 | 0.0% |
| Lebanese | 53 | 0.1% |
| Lithuanian | 33 | 0.1% |
| Luxembourger | 10 | 0.0% |
| Malaysian | 30 | 0.1% |
| Mexican | 903 | 2.0% |
| Native Hawaiian | 161 | 0.4% |
| Nicaraguan | 335 | 0.7% |
| Nigerian | 72 | 0.2% |
| Northern European | 16 | 0.0% |
| Norwegian | 160 | 0.4% |
| Pakistani | 30 | 0.1% |
| Palestinian | 112 | 0.2% |
| Panamanian | 113 | 0.3% |
| Peruvian | 165 | 0.4% |
| Polish | 781 | 1.7% |
| Portuguese | 53 | 0.1% |
| Puerto Rican | 5,140 | 11.2% |
| Romanian | 77 | 0.2% |
| Russian | 842 | 1.8% |
| Salvadoran | 260 | 0.6% |
| Scandinavian | 79 | 0.2% |
| Scotch-Irish | 205 | 0.4% |
| Scottish | 555 | 1.2% |
| Seminole | 64 | 0.1% |
| Serbian | 54 | 0.1% |
| Sioux | 5 | 0.0% |
| Slavic | 27 | 0.1% |
| Slovak | 41 | 0.1% |
| South American | 3,367 | 7.4% |
| Spaniard | 55 | 0.1% |
| Spanish | 886 | 1.9% |
| Sri Lankan | 115 | 0.3% |
| Subsaharan African | 455 | 1.0% |
| Swedish | 270 | 0.6% |
| Swiss | 17 | 0.0% |
| Thai | 186 | 0.4% |
| Trinidadian and Tobagonian | 32 | 0.1% |
| Turkish | 53 | 0.1% |
| Ukrainian | 180 | 0.4% |
| Venezuelan | 1,050 | 2.3% |
| Vietnamese | 32 | 0.1% |
| Welsh | 288 | 0.6% |
| West Indian | 193 | 0.4% |
| Yugoslavian | 62 | 0.1% |
| Zimbabwean | 57 | 0.1% | View All 111 Rows |
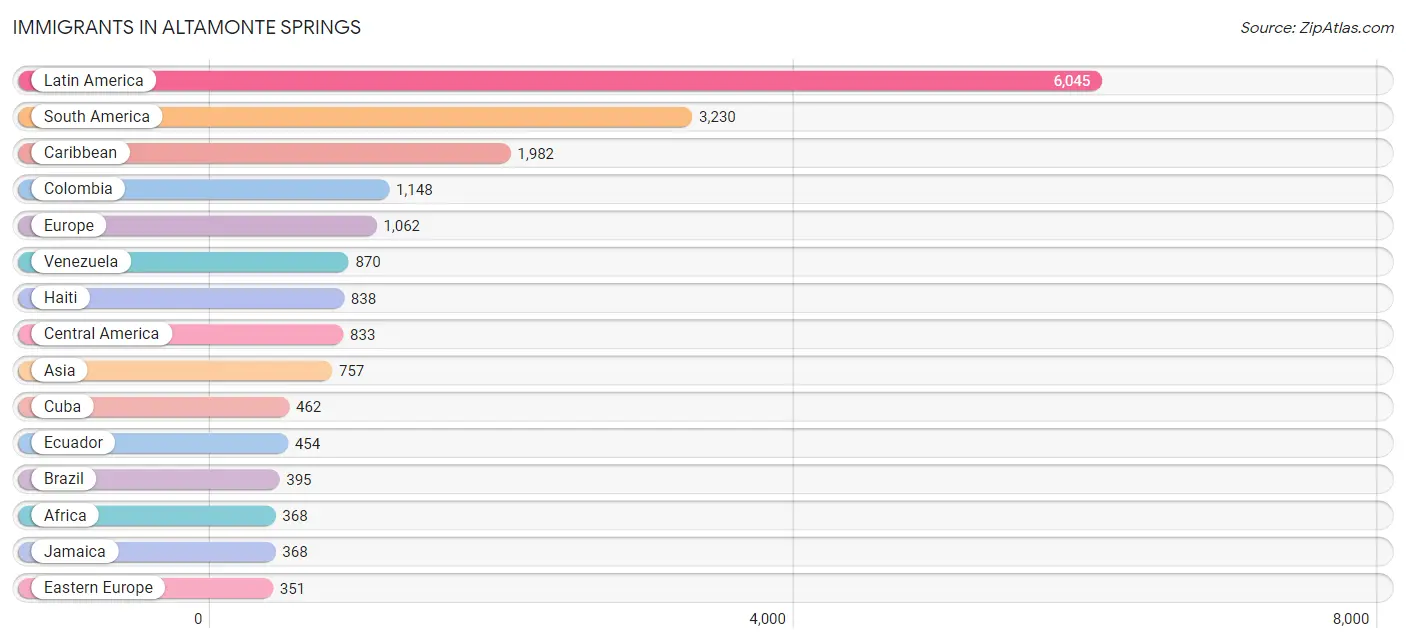
Immigrants in Altamonte Springs
The most numerous immigrant groups reported in Altamonte Springs came from Latin America (6,045 | 13.2%), South America (3,230 | 7.1%), Caribbean (1,982 | 4.3%), Colombia (1,148 | 2.5%), and Europe (1,062 | 2.3%), together accounting for 29.4% of all Altamonte Springs residents.
| Immigration Origin | # Population | % Population |
| Afghanistan | 29 | 0.1% |
| Africa | 368 | 0.8% |
| Argentina | 6 | 0.0% |
| Asia | 757 | 1.7% |
| Bahamas | 12 | 0.0% |
| Bangladesh | 18 | 0.0% |
| Bosnia and Herzegovina | 11 | 0.0% |
| Brazil | 395 | 0.9% |
| Bulgaria | 19 | 0.0% |
| Cambodia | 45 | 0.1% |
| Canada | 82 | 0.2% |
| Caribbean | 1,982 | 4.3% |
| Central America | 833 | 1.8% |
| China | 46 | 0.1% |
| Colombia | 1,148 | 2.5% |
| Costa Rica | 67 | 0.2% |
| Cuba | 462 | 1.0% |
| Denmark | 23 | 0.1% |
| Dominican Republic | 161 | 0.4% |
| Eastern Africa | 57 | 0.1% |
| Eastern Asia | 187 | 0.4% |
| Eastern Europe | 351 | 0.8% |
| Ecuador | 454 | 1.0% |
| Egypt | 176 | 0.4% |
| El Salvador | 27 | 0.1% |
| England | 190 | 0.4% |
| Europe | 1,062 | 2.3% |
| Germany | 108 | 0.2% |
| Greece | 53 | 0.1% |
| Guyana | 155 | 0.3% |
| Haiti | 838 | 1.8% |
| Honduras | 97 | 0.2% |
| Hong Kong | 9 | 0.0% |
| India | 54 | 0.1% |
| Indonesia | 54 | 0.1% |
| Iran | 91 | 0.2% |
| Iraq | 10 | 0.0% |
| Ireland | 12 | 0.0% |
| Italy | 90 | 0.2% |
| Jamaica | 368 | 0.8% |
| Japan | 28 | 0.1% |
| Korea | 113 | 0.3% |
| Kuwait | 7 | 0.0% |
| Latin America | 6,045 | 13.2% |
| Mexico | 323 | 0.7% |
| Morocco | 32 | 0.1% |
| Netherlands | 11 | 0.0% |
| Nicaragua | 250 | 0.5% |
| Nigeria | 56 | 0.1% |
| Northern Africa | 211 | 0.5% |
| Northern Europe | 314 | 0.7% |
| Pakistan | 30 | 0.1% |
| Panama | 69 | 0.2% |
| Peru | 202 | 0.4% |
| Philippines | 142 | 0.3% |
| Poland | 28 | 0.1% |
| Romania | 30 | 0.1% |
| Russia | 63 | 0.1% |
| Saudi Arabia | 24 | 0.1% |
| Scotland | 54 | 0.1% |
| Serbia | 11 | 0.0% |
| South America | 3,230 | 7.1% |
| South Central Asia | 222 | 0.5% |
| South Eastern Asia | 293 | 0.6% |
| Southern Europe | 242 | 0.5% |
| Spain | 99 | 0.2% |
| Taiwan | 1 | 0.0% |
| Thailand | 6 | 0.0% |
| Trinidad and Tobago | 45 | 0.1% |
| Turkey | 9 | 0.0% |
| Ukraine | 155 | 0.3% |
| Venezuela | 870 | 1.9% |
| Vietnam | 46 | 0.1% |
| Western Africa | 100 | 0.2% |
| Western Asia | 55 | 0.1% |
| Western Europe | 119 | 0.3% |
| Zimbabwe | 57 | 0.1% | View All 77 Rows |
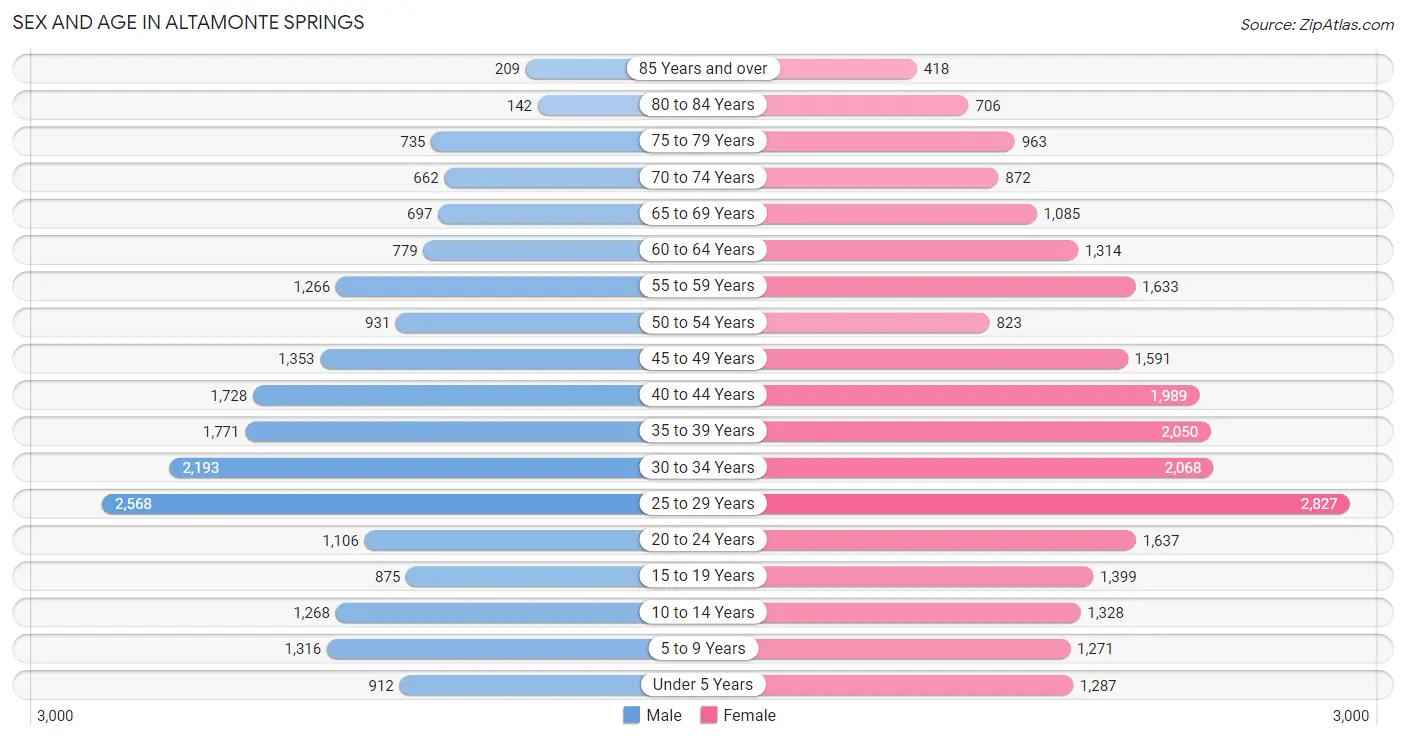
Sex and Age in Altamonte Springs
Sex and Age in Altamonte Springs
The most populous age groups in Altamonte Springs are 25 to 29 Years (2,568 | 12.5%) for men and 25 to 29 Years (2,827 | 11.2%) for women.
| Age Bracket | Male | Female |
| Under 5 Years | 912 (4.4%) | 1,287 (5.1%) |
| 5 to 9 Years | 1,316 (6.4%) | 1,271 (5.0%) |
| 10 to 14 Years | 1,268 (6.2%) | 1,328 (5.3%) |
| 15 to 19 Years | 875 (4.3%) | 1,399 (5.5%) |
| 20 to 24 Years | 1,106 (5.4%) | 1,637 (6.5%) |
| 25 to 29 Years | 2,568 (12.5%) | 2,827 (11.2%) |
| 30 to 34 Years | 2,193 (10.7%) | 2,068 (8.2%) |
| 35 to 39 Years | 1,771 (8.6%) | 2,050 (8.1%) |
| 40 to 44 Years | 1,728 (8.4%) | 1,989 (7.9%) |
| 45 to 49 Years | 1,353 (6.6%) | 1,591 (6.3%) |
| 50 to 54 Years | 931 (4.5%) | 823 (3.3%) |
| 55 to 59 Years | 1,266 (6.2%) | 1,633 (6.5%) |
| 60 to 64 Years | 779 (3.8%) | 1,314 (5.2%) |
| 65 to 69 Years | 697 (3.4%) | 1,085 (4.3%) |
| 70 to 74 Years | 662 (3.2%) | 872 (3.5%) |
| 75 to 79 Years | 735 (3.6%) | 963 (3.8%) |
| 80 to 84 Years | 142 (0.7%) | 706 (2.8%) |
| 85 Years and over | 209 (1.0%) | 418 (1.7%) |
| Total | 20,511 (100.0%) | 25,261 (100.0%) |
Families and Households in Altamonte Springs
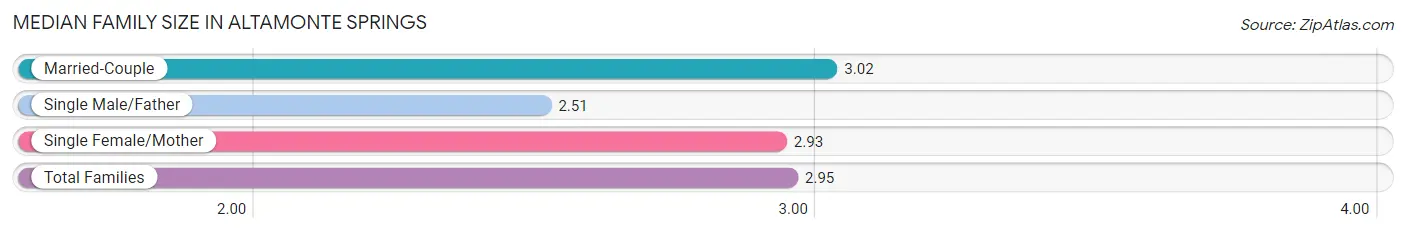
Median Family Size in Altamonte Springs
The median family size in Altamonte Springs is 2.95 persons per family, with married-couple families (6,153 | 58.7%) accounting for the largest median family size of 3.02 persons per family. On the other hand, single male/father families (957 | 9.1%) represent the smallest median family size with 2.51 persons per family.
| Family Type | # Families | Family Size |
| Married-Couple | 6,153 (58.7%) | 3.02 |
| Single Male/Father | 957 (9.1%) | 2.51 |
| Single Female/Mother | 3,379 (32.2%) | 2.93 |
| Total Families | 10,489 (100.0%) | 2.95 |
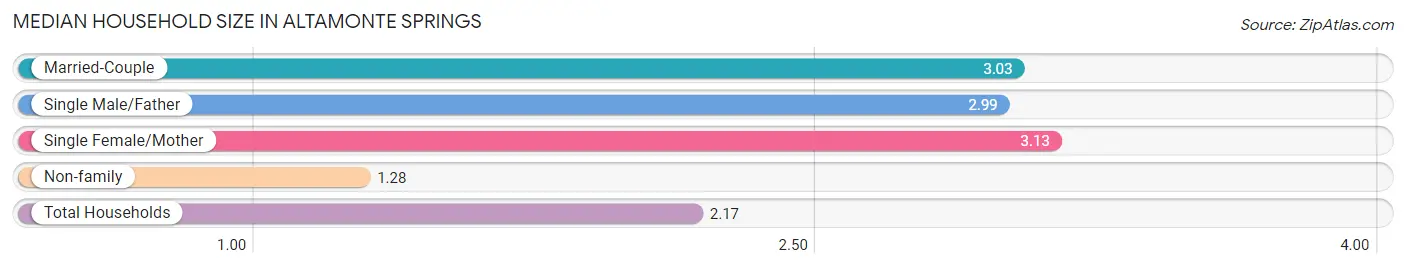
Median Household Size in Altamonte Springs
The median household size in Altamonte Springs is 2.17 persons per household, with single female/mother households (3,379 | 16.2%) accounting for the largest median household size of 3.13 persons per household. non-family households (10,424 | 49.8%) represent the smallest median household size with 1.28 persons per household.
| Household Type | # Households | Household Size |
| Married-Couple | 6,153 (29.4%) | 3.03 |
| Single Male/Father | 957 (4.6%) | 2.99 |
| Single Female/Mother | 3,379 (16.2%) | 3.13 |
| Non-family | 10,424 (49.8%) | 1.28 |
| Total Households | 20,913 (100.0%) | 2.17 |
Household Size by Marriage Status in Altamonte Springs
Out of a total of 20,913 households in Altamonte Springs, 10,489 (50.2%) are family households, while 10,424 (49.8%) are nonfamily households. The most numerous type of family households are 2-person households, comprising 5,007, and the most common type of nonfamily households are 1-person households, comprising 8,066.
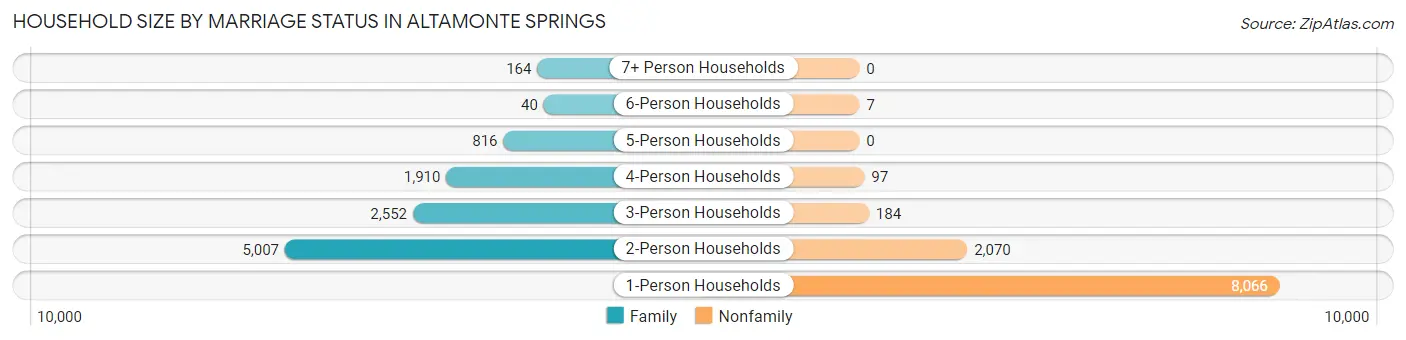
| Household Size | Family Households | Nonfamily Households |
| 1-Person Households | - | 8,066 (38.6%) |
| 2-Person Households | 5,007 (23.9%) | 2,070 (9.9%) |
| 3-Person Households | 2,552 (12.2%) | 184 (0.9%) |
| 4-Person Households | 1,910 (9.1%) | 97 (0.5%) |
| 5-Person Households | 816 (3.9%) | 0 (0.0%) |
| 6-Person Households | 40 (0.2%) | 7 (0.0%) |
| 7+ Person Households | 164 (0.8%) | 0 (0.0%) |
| Total | 10,489 (50.2%) | 10,424 (49.8%) |
Female Fertility in Altamonte Springs
Fertility by Age in Altamonte Springs
Average fertility rate in Altamonte Springs is 42.0 births per 1,000 women. Women in the age bracket of 20 to 34 years have the highest fertility rate with 66.0 births per 1,000 women. Women in the age bracket of 20 to 34 years acount for 74.7% of all women with births.
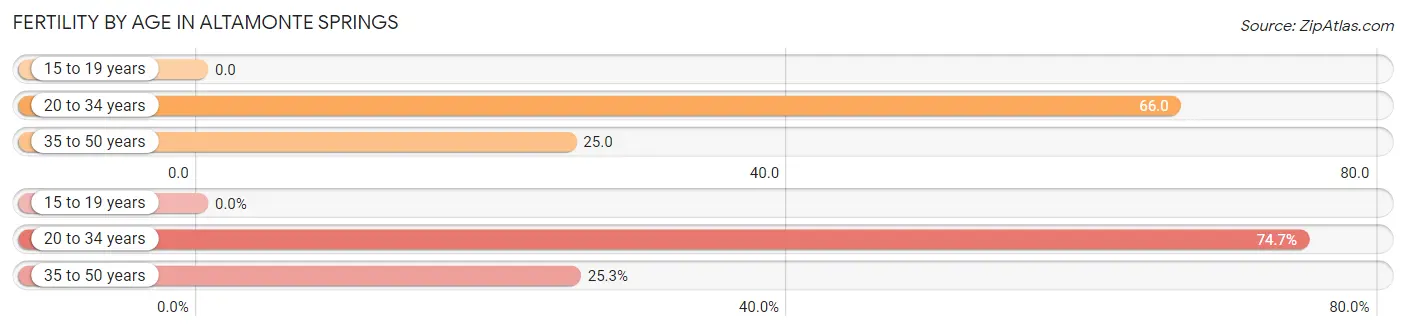
| Age Bracket | Women with Births | Births / 1,000 Women |
| 15 to 19 years | 0 (0.0%) | 0.0 |
| 20 to 34 years | 434 (74.7%) | 66.0 |
| 35 to 50 years | 147 (25.3%) | 25.0 |
| Total | 581 (100.0%) | 42.0 |
Fertility by Age by Marriage Status in Altamonte Springs
80.6% of women with births (581) in Altamonte Springs are married. The highest percentage of unmarried women with births falls into 20 to 34 years age bracket with 21.9% of them unmarried at the time of birth, while the lowest percentage of unmarried women with births belong to 35 to 50 years age bracket with 12.2% of them unmarried.
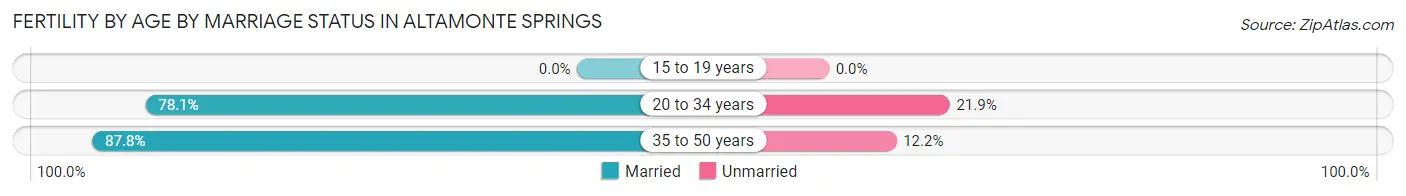
| Age Bracket | Married | Unmarried |
| 15 to 19 years | 0 (0.0%) | 0 (0.0%) |
| 20 to 34 years | 339 (78.1%) | 95 (21.9%) |
| 35 to 50 years | 129 (87.8%) | 18 (12.2%) |
| Total | 468 (80.5%) | 113 (19.5%) |
Fertility by Education in Altamonte Springs
Average fertility rate in Altamonte Springs is 42.0 births per 1,000 women. Women with the education attainment of high school diploma have the highest fertility rate of 85.0 births per 1,000 women, while women with the education attainment of less than high school have the lowest fertility at 11.0 births per 1,000 women. Women with the education attainment of college or associate's degree represent 38.6% of all women with births.
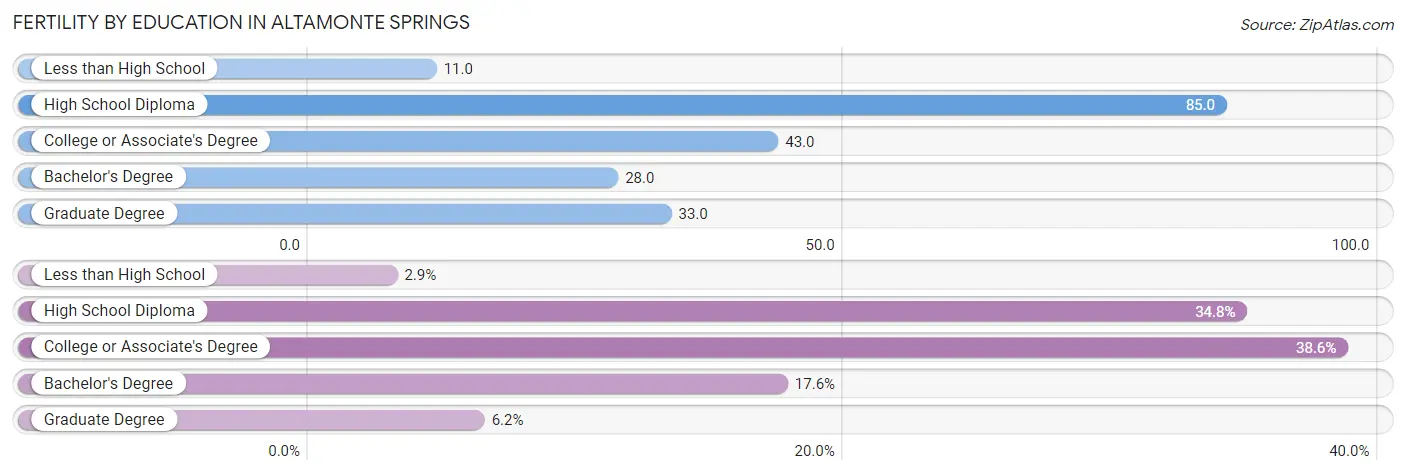
| Educational Attainment | Women with Births | Births / 1,000 Women |
| Less than High School | 17 (2.9%) | 11.0 |
| High School Diploma | 202 (34.8%) | 85.0 |
| College or Associate's Degree | 224 (38.6%) | 43.0 |
| Bachelor's Degree | 102 (17.6%) | 28.0 |
| Graduate Degree | 36 (6.2%) | 33.0 |
| Total | 581 (100.0%) | 42.0 |
Fertility by Education by Marriage Status in Altamonte Springs
19.5% of women with births in Altamonte Springs are unmarried. Women with the educational attainment of less than high school are most likely to be married with 100.0% of them married at childbirth, while women with the educational attainment of high school diploma are least likely to be married with 55.9% of them unmarried at childbirth.
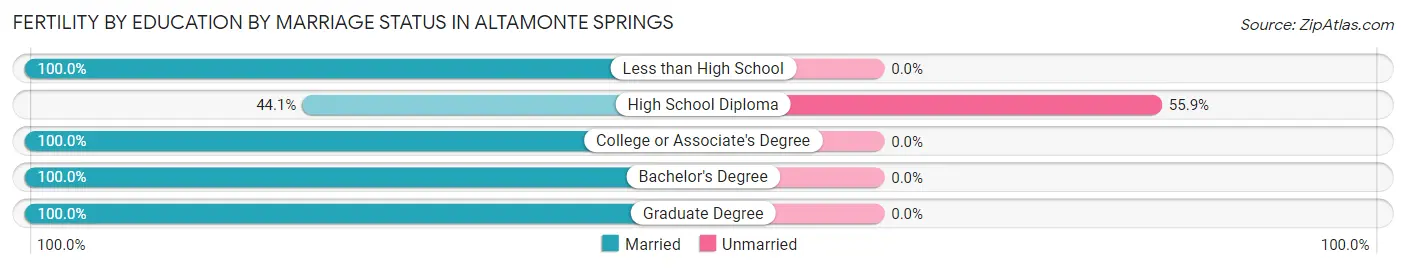
| Educational Attainment | Married | Unmarried |
| Less than High School | 17 (100.0%) | 0 (0.0%) |
| High School Diploma | 89 (44.1%) | 113 (55.9%) |
| College or Associate's Degree | 224 (100.0%) | 0 (0.0%) |
| Bachelor's Degree | 102 (100.0%) | 0 (0.0%) |
| Graduate Degree | 36 (100.0%) | 0 (0.0%) |
| Total | 468 (80.5%) | 113 (19.5%) |
Employment Characteristics in Altamonte Springs
Employment by Class of Employer in Altamonte Springs
Among the 25,749 employed individuals in Altamonte Springs, private company employees (18,737 | 72.8%), not-for-profit organizations (2,537 | 9.9%), and self-employed (not incorporated) (1,442 | 5.6%) make up the most common classes of employment.
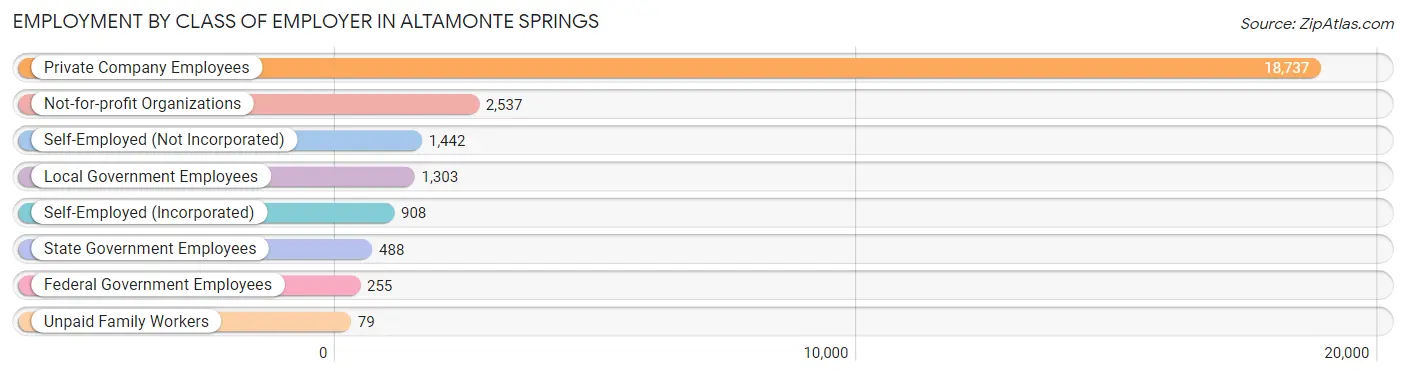
| Employer Class | # Employees | % Employees |
| Private Company Employees | 18,737 | 72.8% |
| Self-Employed (Incorporated) | 908 | 3.5% |
| Self-Employed (Not Incorporated) | 1,442 | 5.6% |
| Not-for-profit Organizations | 2,537 | 9.9% |
| Local Government Employees | 1,303 | 5.1% |
| State Government Employees | 488 | 1.9% |
| Federal Government Employees | 255 | 1.0% |
| Unpaid Family Workers | 79 | 0.3% |
| Total | 25,749 | 100.0% |
Employment Status by Age in Altamonte Springs
According to the labor force statistics for Altamonte Springs, out of the total population over 16 years of age (38,062), 72.7% or 27,671 individuals are in the labor force, with 5.4% or 1,494 of them unemployed. The age group with the highest labor force participation rate is 25 to 29 years, with 95.2% or 5,136 individuals in the labor force. Within the labor force, the 16 to 19 years age range has the highest percentage of unemployed individuals, with 14.4% or 125 of them being unemployed.
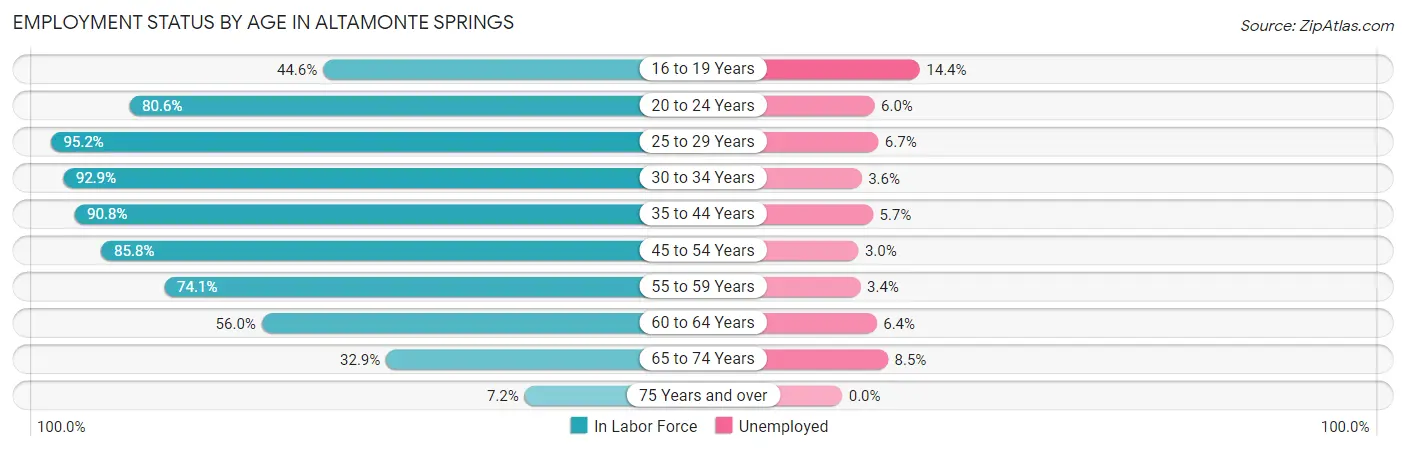
| Age Bracket | In Labor Force | Unemployed |
| 16 to 19 Years | 868 (44.6%) | 125 (14.4%) |
| 20 to 24 Years | 2,211 (80.6%) | 133 (6.0%) |
| 25 to 29 Years | 5,136 (95.2%) | 344 (6.7%) |
| 30 to 34 Years | 3,958 (92.9%) | 142 (3.6%) |
| 35 to 44 Years | 6,845 (90.8%) | 390 (5.7%) |
| 45 to 54 Years | 4,031 (85.8%) | 121 (3.0%) |
| 55 to 59 Years | 2,148 (74.1%) | 73 (3.4%) |
| 60 to 64 Years | 1,172 (56.0%) | 75 (6.4%) |
| 65 to 74 Years | 1,091 (32.9%) | 93 (8.5%) |
| 75 Years and over | 228 (7.2%) | 0 (0.0%) |
| Total | 27,671 (72.7%) | 1,494 (5.4%) |
Employment Status by Educational Attainment in Altamonte Springs
According to labor force statistics for Altamonte Springs, 86.6% of individuals (23,282) out of the total population between 25 and 64 years of age (26,884) are in the labor force, with 4.9% or 1,141 of them being unemployed. The group with the highest labor force participation rate are those with the educational attainment of college / associate degree, with 89.4% or 9,001 individuals in the labor force. Within the labor force, individuals with less than high school education have the highest percentage of unemployment, with 18.2% or 264 of them being unemployed.
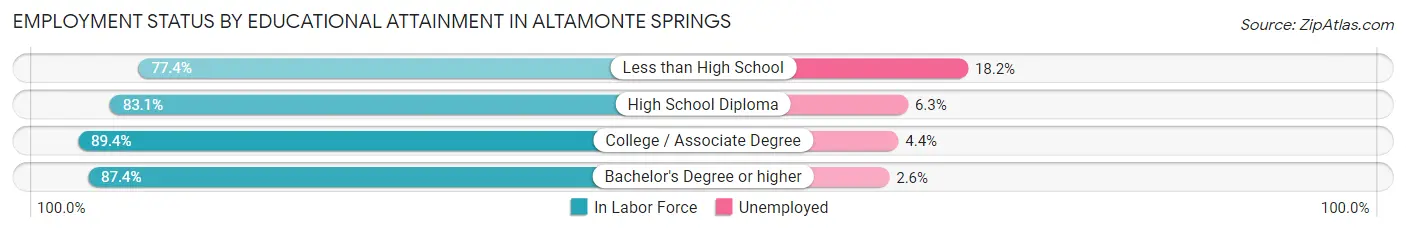
| Educational Attainment | In Labor Force | Unemployed |
| Less than High School | 1,450 (77.4%) | 341 (18.2%) |
| High School Diploma | 4,117 (83.1%) | 312 (6.3%) |
| College / Associate Degree | 9,001 (89.4%) | 443 (4.4%) |
| Bachelor's Degree or higher | 8,730 (87.4%) | 260 (2.6%) |
| Total | 23,282 (86.6%) | 1,317 (4.9%) |
Employment Occupations by Sex in Altamonte Springs
Management, Business, Science and Arts Occupations
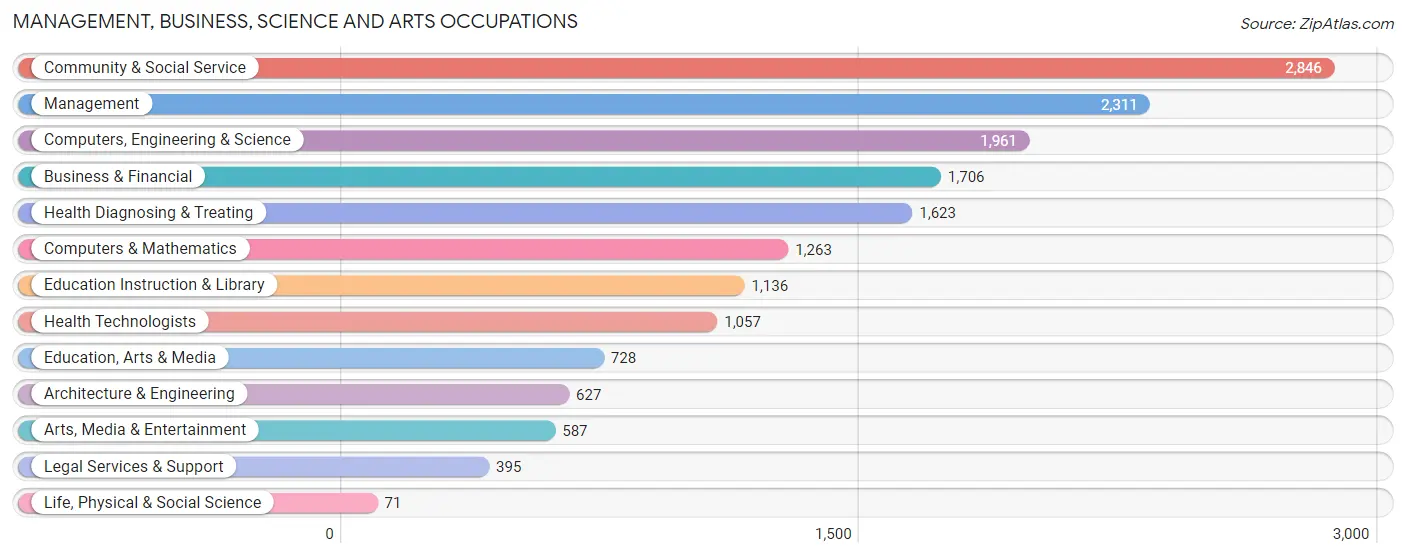
The most common Management, Business, Science and Arts occupations in Altamonte Springs are Community & Social Service (2,846 | 10.9%), Management (2,311 | 8.8%), Computers, Engineering & Science (1,961 | 7.5%), Business & Financial (1,706 | 6.5%), and Health Diagnosing & Treating (1,623 | 6.2%).
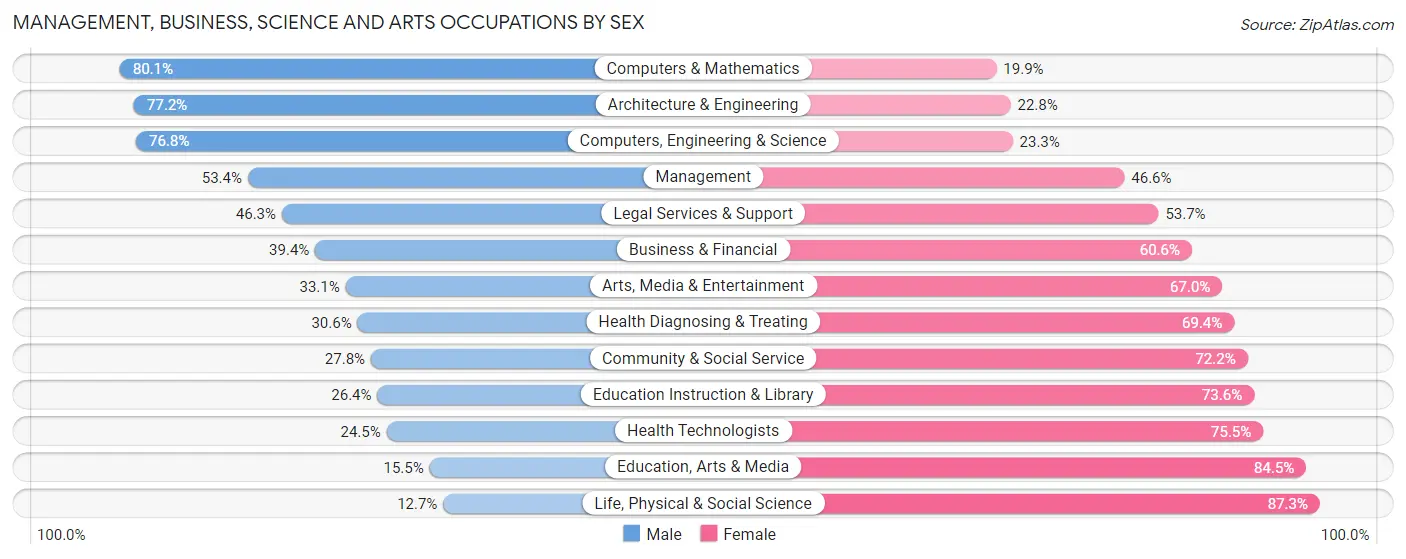
Management, Business, Science and Arts Occupations by Sex
Within the Management, Business, Science and Arts occupations in Altamonte Springs, the most male-oriented occupations are Computers & Mathematics (80.1%), Architecture & Engineering (77.2%), and Computers, Engineering & Science (76.7%), while the most female-oriented occupations are Life, Physical & Social Science (87.3%), Education, Arts & Media (84.5%), and Health Technologists (75.5%).
| Occupation | Male | Female |
| Management | 1,235 (53.4%) | 1,076 (46.6%) |
| Business & Financial | 672 (39.4%) | 1,034 (60.6%) |
| Computers, Engineering & Science | 1,505 (76.7%) | 456 (23.3%) |
| Computers & Mathematics | 1,012 (80.1%) | 251 (19.9%) |
| Architecture & Engineering | 484 (77.2%) | 143 (22.8%) |
| Life, Physical & Social Science | 9 (12.7%) | 62 (87.3%) |
| Community & Social Service | 790 (27.8%) | 2,056 (72.2%) |
| Education, Arts & Media | 113 (15.5%) | 615 (84.5%) |
| Legal Services & Support | 183 (46.3%) | 212 (53.7%) |
| Education Instruction & Library | 300 (26.4%) | 836 (73.6%) |
| Arts, Media & Entertainment | 194 (33.1%) | 393 (66.9%) |
| Health Diagnosing & Treating | 496 (30.6%) | 1,127 (69.4%) |
| Health Technologists | 259 (24.5%) | 798 (75.5%) |
| Total (Category) | 4,698 (45.0%) | 5,749 (55.0%) |
| Total (Overall) | 12,525 (47.9%) | 13,611 (52.1%) |
Services Occupations
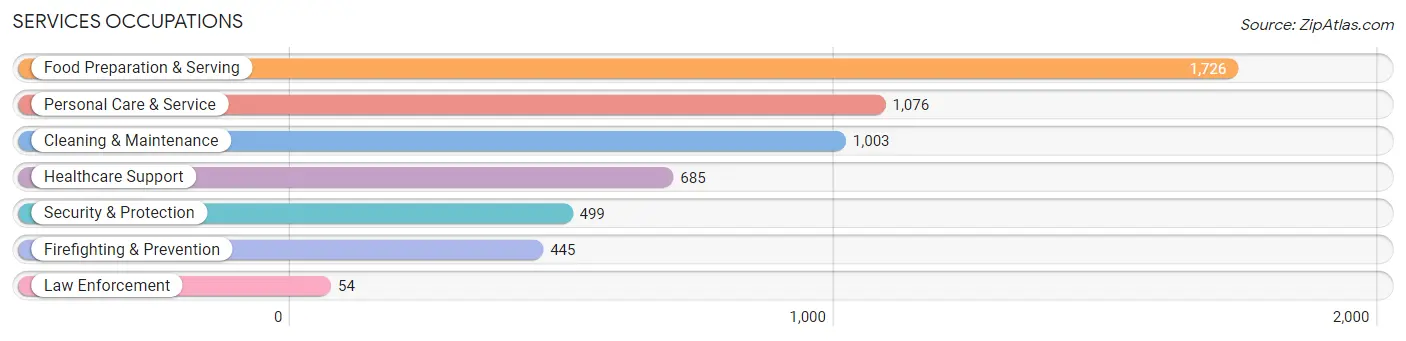
The most common Services occupations in Altamonte Springs are Food Preparation & Serving (1,726 | 6.6%), Personal Care & Service (1,076 | 4.1%), Cleaning & Maintenance (1,003 | 3.8%), Healthcare Support (685 | 2.6%), and Security & Protection (499 | 1.9%).
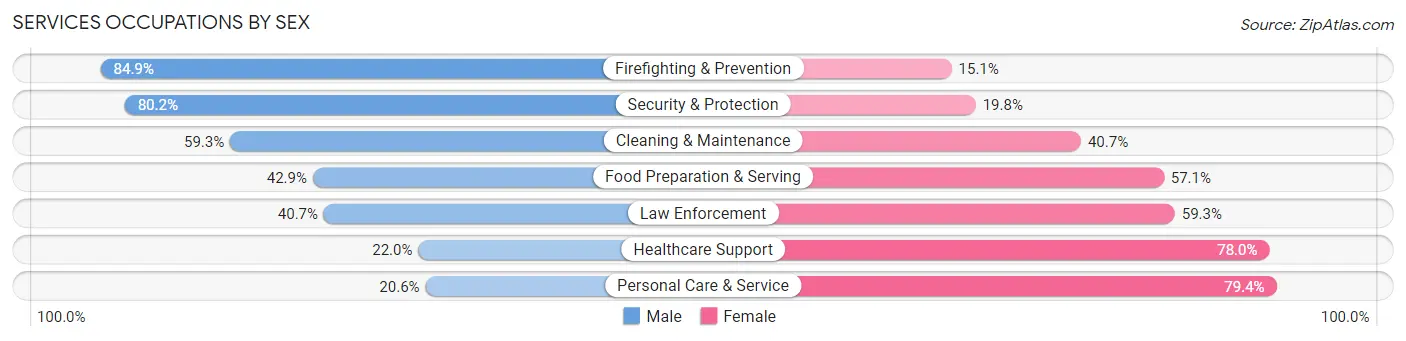
Services Occupations by Sex
Within the Services occupations in Altamonte Springs, the most male-oriented occupations are Firefighting & Prevention (84.9%), Security & Protection (80.2%), and Cleaning & Maintenance (59.3%), while the most female-oriented occupations are Personal Care & Service (79.4%), Healthcare Support (78.0%), and Law Enforcement (59.3%).
| Occupation | Male | Female |
| Healthcare Support | 151 (22.0%) | 534 (78.0%) |
| Security & Protection | 400 (80.2%) | 99 (19.8%) |
| Firefighting & Prevention | 378 (84.9%) | 67 (15.1%) |
| Law Enforcement | 22 (40.7%) | 32 (59.3%) |
| Food Preparation & Serving | 741 (42.9%) | 985 (57.1%) |
| Cleaning & Maintenance | 595 (59.3%) | 408 (40.7%) |
| Personal Care & Service | 222 (20.6%) | 854 (79.4%) |
| Total (Category) | 2,109 (42.3%) | 2,880 (57.7%) |
| Total (Overall) | 12,525 (47.9%) | 13,611 (52.1%) |
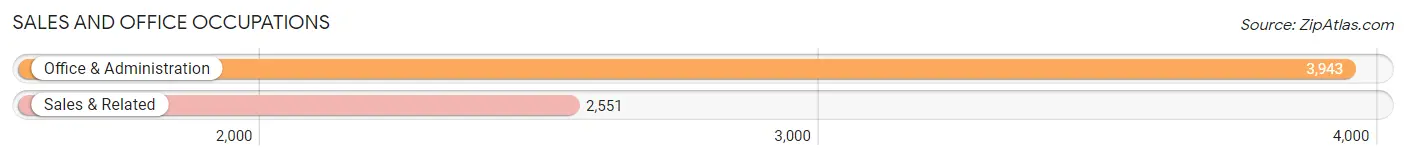
Sales and Office Occupations
The most common Sales and Office occupations in Altamonte Springs are Office & Administration (3,943 | 15.1%), and Sales & Related (2,551 | 9.8%).
Sales and Office Occupations by Sex
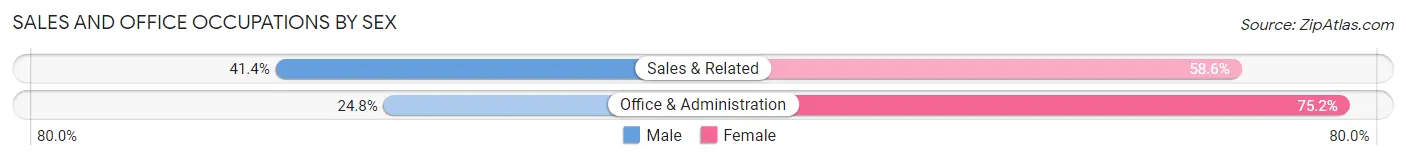
| Occupation | Male | Female |
| Sales & Related | 1,056 (41.4%) | 1,495 (58.6%) |
| Office & Administration | 977 (24.8%) | 2,966 (75.2%) |
| Total (Category) | 2,033 (31.3%) | 4,461 (68.7%) |
| Total (Overall) | 12,525 (47.9%) | 13,611 (52.1%) |
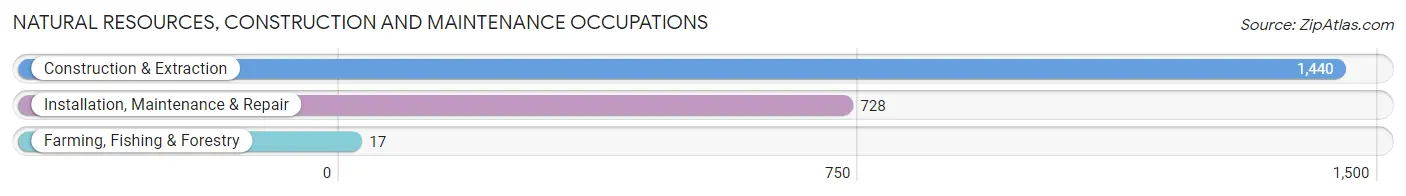
Natural Resources, Construction and Maintenance Occupations
The most common Natural Resources, Construction and Maintenance occupations in Altamonte Springs are Construction & Extraction (1,440 | 5.5%), Installation, Maintenance & Repair (728 | 2.8%), and Farming, Fishing & Forestry (17 | 0.1%).
Natural Resources, Construction and Maintenance Occupations by Sex
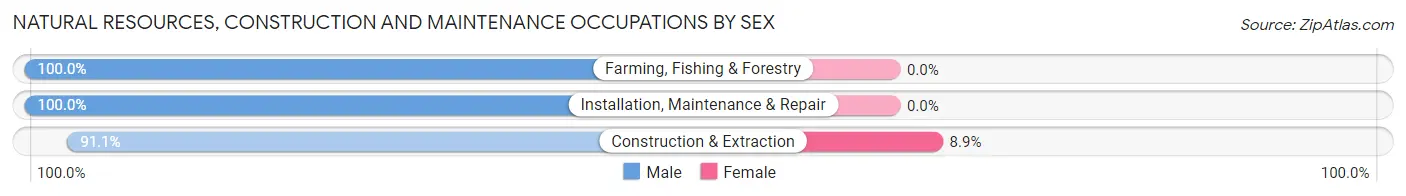
| Occupation | Male | Female |
| Farming, Fishing & Forestry | 17 (100.0%) | 0 (0.0%) |
| Construction & Extraction | 1,312 (91.1%) | 128 (8.9%) |
| Installation, Maintenance & Repair | 728 (100.0%) | 0 (0.0%) |
| Total (Category) | 2,057 (94.1%) | 128 (5.9%) |
| Total (Overall) | 12,525 (47.9%) | 13,611 (52.1%) |
Production, Transportation and Moving Occupations
The most common Production, Transportation and Moving occupations in Altamonte Springs are Transportation (908 | 3.5%), Material Moving (564 | 2.2%), and Production (549 | 2.1%).
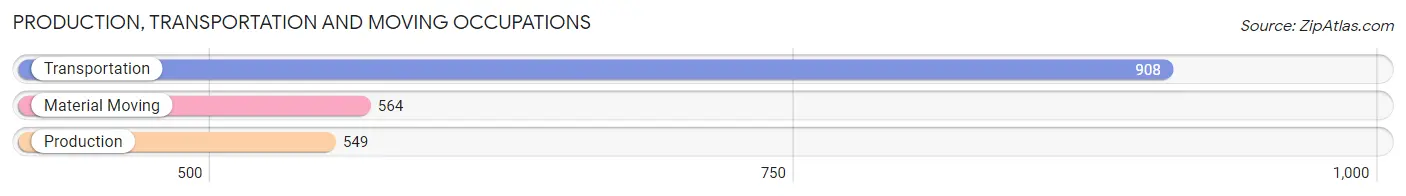
Production, Transportation and Moving Occupations by Sex
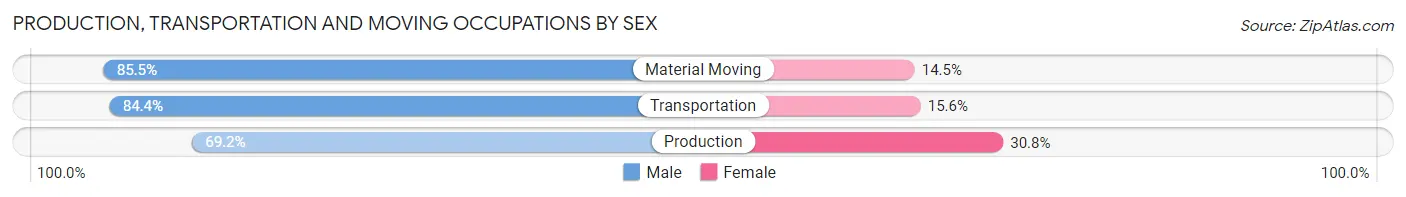
| Occupation | Male | Female |
| Production | 380 (69.2%) | 169 (30.8%) |
| Transportation | 766 (84.4%) | 142 (15.6%) |
| Material Moving | 482 (85.5%) | 82 (14.5%) |
| Total (Category) | 1,628 (80.5%) | 393 (19.5%) |
| Total (Overall) | 12,525 (47.9%) | 13,611 (52.1%) |
Employment Industries by Sex in Altamonte Springs
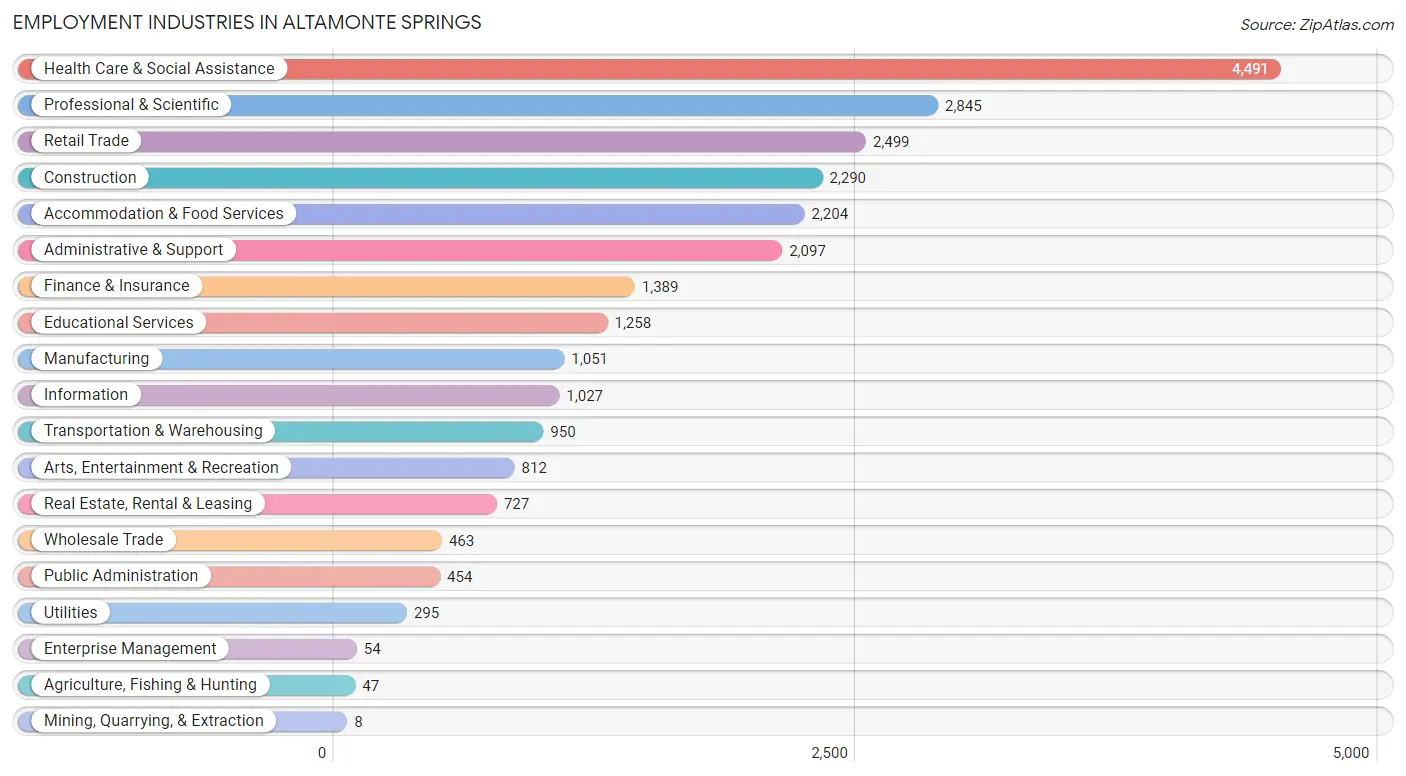
Employment Industries in Altamonte Springs
The major employment industries in Altamonte Springs include Health Care & Social Assistance (4,491 | 17.2%), Professional & Scientific (2,845 | 10.9%), Retail Trade (2,499 | 9.6%), Construction (2,290 | 8.8%), and Accommodation & Food Services (2,204 | 8.4%).
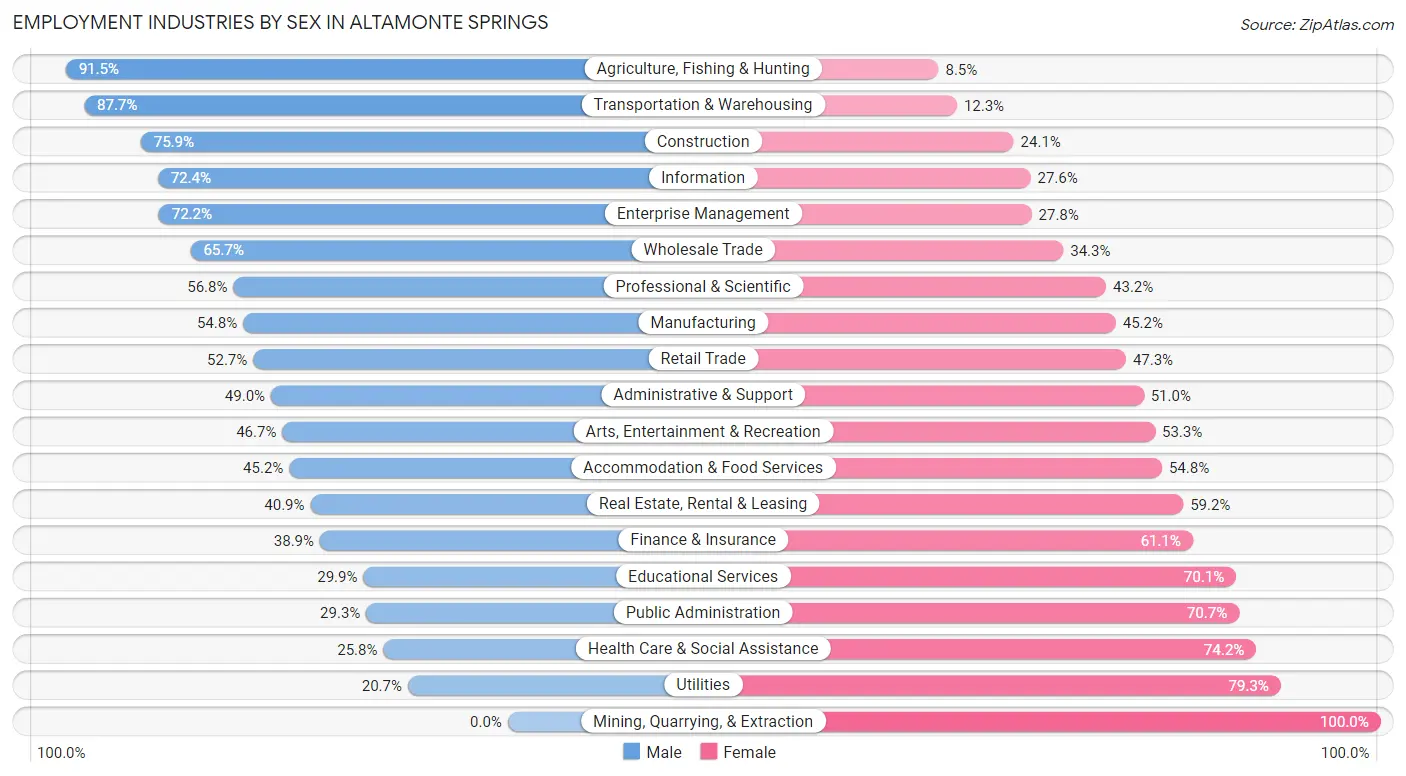
Employment Industries by Sex in Altamonte Springs
The Altamonte Springs industries that see more men than women are Agriculture, Fishing & Hunting (91.5%), Transportation & Warehousing (87.7%), and Construction (75.9%), whereas the industries that tend to have a higher number of women are Mining, Quarrying, & Extraction (100.0%), Utilities (79.3%), and Health Care & Social Assistance (74.2%).
| Industry | Male | Female |
| Agriculture, Fishing & Hunting | 43 (91.5%) | 4 (8.5%) |
| Mining, Quarrying, & Extraction | 0 (0.0%) | 8 (100.0%) |
| Construction | 1,739 (75.9%) | 551 (24.1%) |
| Manufacturing | 576 (54.8%) | 475 (45.2%) |
| Wholesale Trade | 304 (65.7%) | 159 (34.3%) |
| Retail Trade | 1,317 (52.7%) | 1,182 (47.3%) |
| Transportation & Warehousing | 833 (87.7%) | 117 (12.3%) |
| Utilities | 61 (20.7%) | 234 (79.3%) |
| Information | 744 (72.4%) | 283 (27.6%) |
| Finance & Insurance | 540 (38.9%) | 849 (61.1%) |
| Real Estate, Rental & Leasing | 297 (40.8%) | 430 (59.2%) |
| Professional & Scientific | 1,616 (56.8%) | 1,229 (43.2%) |
| Enterprise Management | 39 (72.2%) | 15 (27.8%) |
| Administrative & Support | 1,028 (49.0%) | 1,069 (51.0%) |
| Educational Services | 376 (29.9%) | 882 (70.1%) |
| Health Care & Social Assistance | 1,157 (25.8%) | 3,334 (74.2%) |
| Arts, Entertainment & Recreation | 379 (46.7%) | 433 (53.3%) |
| Accommodation & Food Services | 997 (45.2%) | 1,207 (54.8%) |
| Public Administration | 133 (29.3%) | 321 (70.7%) |
| Total | 12,525 (47.9%) | 13,611 (52.1%) |
Education in Altamonte Springs
School Enrollment in Altamonte Springs
The most common levels of schooling among the 10,656 students in Altamonte Springs are college / undergraduate (2,830 | 26.6%), elementary school (2,156 | 20.2%), and middle school (2,017 | 18.9%).
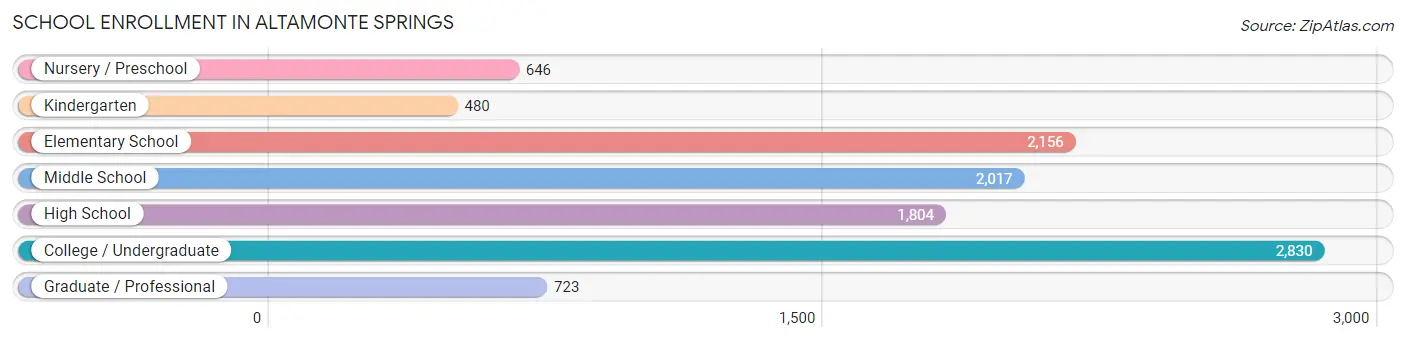
| School Level | # Students | % Students |
| Nursery / Preschool | 646 | 6.1% |
| Kindergarten | 480 | 4.5% |
| Elementary School | 2,156 | 20.2% |
| Middle School | 2,017 | 18.9% |
| High School | 1,804 | 16.9% |
| College / Undergraduate | 2,830 | 26.6% |
| Graduate / Professional | 723 | 6.8% |
| Total | 10,656 | 100.0% |
School Enrollment by Age by Funding Source in Altamonte Springs
Out of a total of 10,656 students who are enrolled in schools in Altamonte Springs, 1,641 (15.4%) attend a private institution, while the remaining 9,015 (84.6%) are enrolled in public schools. The age group of 3 to 4 year olds has the highest likelihood of being enrolled in private schools, with 198 (47.0% in the age bracket) enrolled. Conversely, the age group of 18 to 19 year olds has the lowest likelihood of being enrolled in a private school, with 722 (93.4% in the age bracket) attending a public institution.
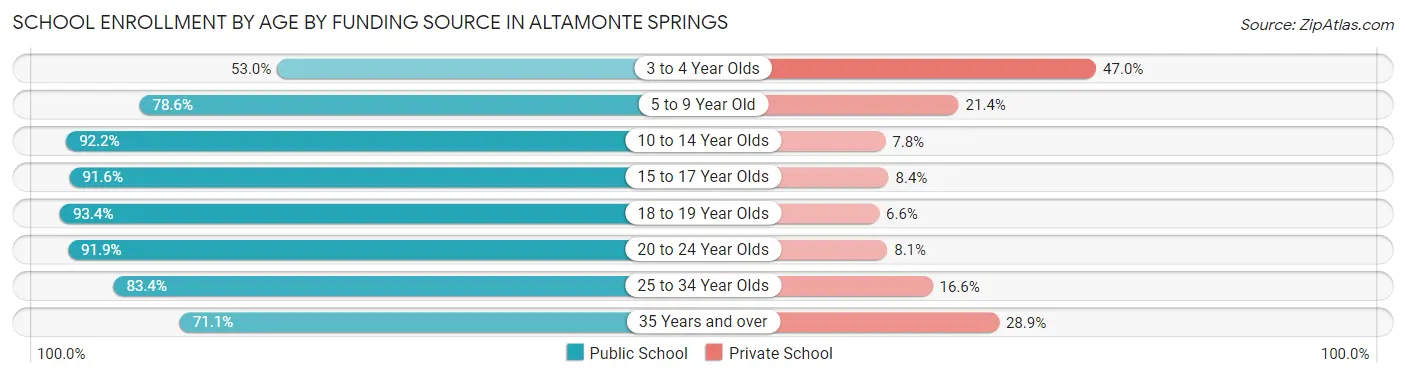
| Age Bracket | Public School | Private School |
| 3 to 4 Year Olds | 223 (53.0%) | 198 (47.0%) |
| 5 to 9 Year Old | 1,974 (78.6%) | 538 (21.4%) |
| 10 to 14 Year Olds | 2,341 (92.2%) | 197 (7.8%) |
| 15 to 17 Year Olds | 1,139 (91.6%) | 104 (8.4%) |
| 18 to 19 Year Olds | 722 (93.4%) | 51 (6.6%) |
| 20 to 24 Year Olds | 702 (91.9%) | 62 (8.1%) |
| 25 to 34 Year Olds | 1,401 (83.4%) | 278 (16.6%) |
| 35 Years and over | 516 (71.1%) | 210 (28.9%) |
| Total | 9,015 (84.6%) | 1,641 (15.4%) |
Educational Attainment by Field of Study in Altamonte Springs
Business (2,948 | 21.9%), science & technology (1,462 | 10.8%), education (1,134 | 8.4%), psychology (1,079 | 8.0%), and social sciences (1,031 | 7.6%) are the most common fields of study among 13,482 individuals in Altamonte Springs who have obtained a bachelor's degree or higher.
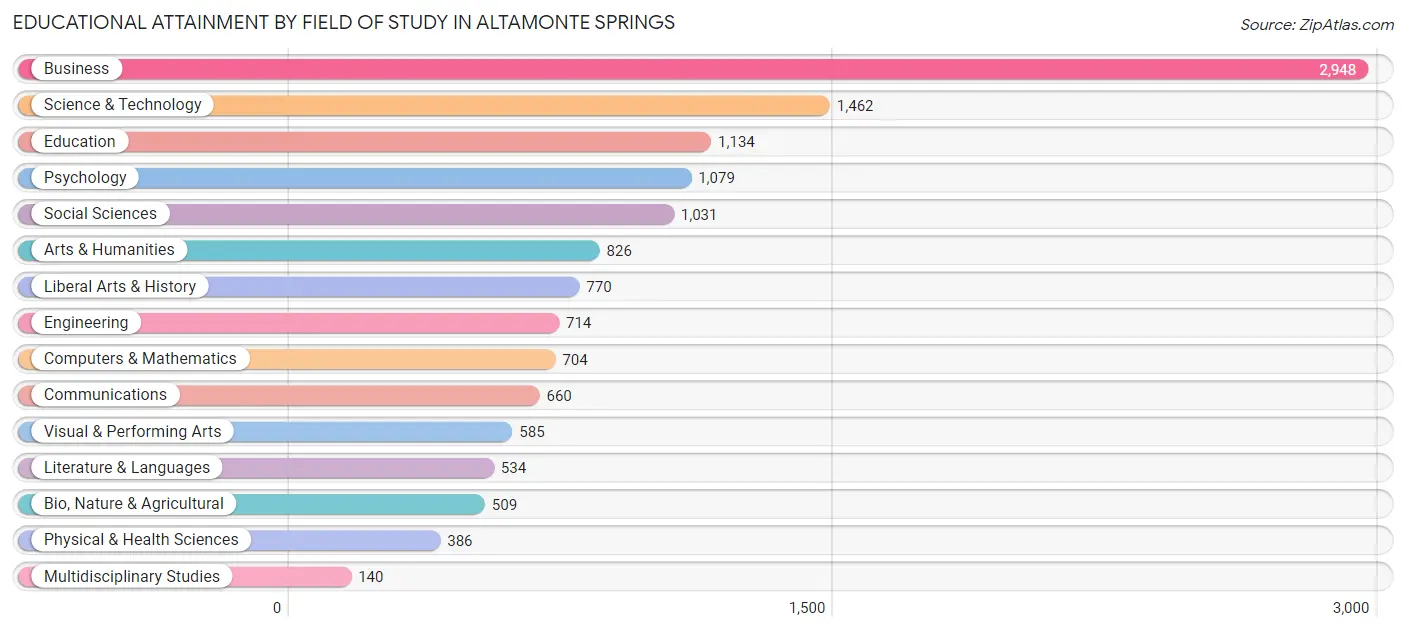
| Field of Study | # Graduates | % Graduates |
| Computers & Mathematics | 704 | 5.2% |
| Bio, Nature & Agricultural | 509 | 3.8% |
| Physical & Health Sciences | 386 | 2.9% |
| Psychology | 1,079 | 8.0% |
| Social Sciences | 1,031 | 7.6% |
| Engineering | 714 | 5.3% |
| Multidisciplinary Studies | 140 | 1.0% |
| Science & Technology | 1,462 | 10.8% |
| Business | 2,948 | 21.9% |
| Education | 1,134 | 8.4% |
| Literature & Languages | 534 | 4.0% |
| Liberal Arts & History | 770 | 5.7% |
| Visual & Performing Arts | 585 | 4.3% |
| Communications | 660 | 4.9% |
| Arts & Humanities | 826 | 6.1% |
| Total | 13,482 | 100.0% |
Transportation & Commute in Altamonte Springs
Vehicle Availability by Sex in Altamonte Springs
The most prevalent vehicle ownership categories in Altamonte Springs are males with 2 vehicles (5,573, accounting for 45.3%) and females with 2 vehicles (5,778, making up 41.4%).
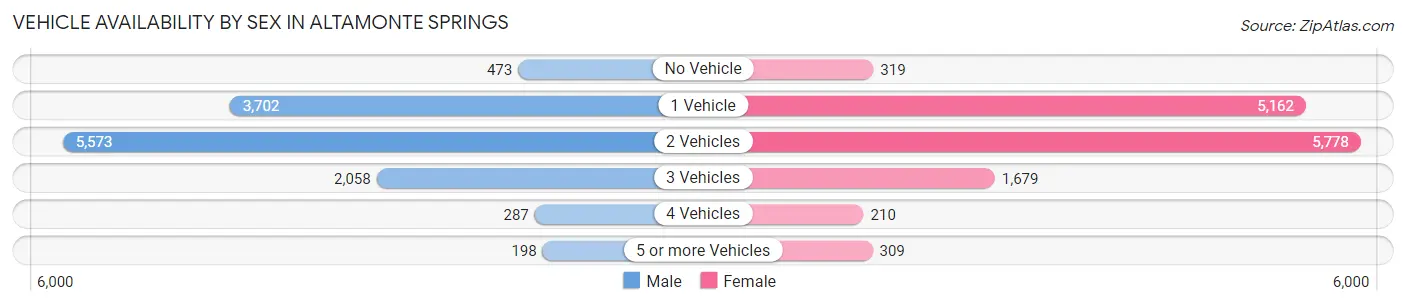
| Vehicles Available | Male | Female |
| No Vehicle | 473 (3.8%) | 319 (2.4%) |
| 1 Vehicle | 3,702 (30.1%) | 5,162 (38.4%) |
| 2 Vehicles | 5,573 (45.3%) | 5,778 (42.9%) |
| 3 Vehicles | 2,058 (16.7%) | 1,679 (12.5%) |
| 4 Vehicles | 287 (2.3%) | 210 (1.6%) |
| 5 or more Vehicles | 198 (1.6%) | 309 (2.3%) |
| Total | 12,291 (100.0%) | 13,457 (100.0%) |
Commute Time in Altamonte Springs
The most frequently occuring commute durations in Altamonte Springs are 20 to 24 minutes (3,982 commuters, 17.7%), 30 to 34 minutes (3,703 commuters, 16.4%), and 15 to 19 minutes (3,597 commuters, 16.0%).
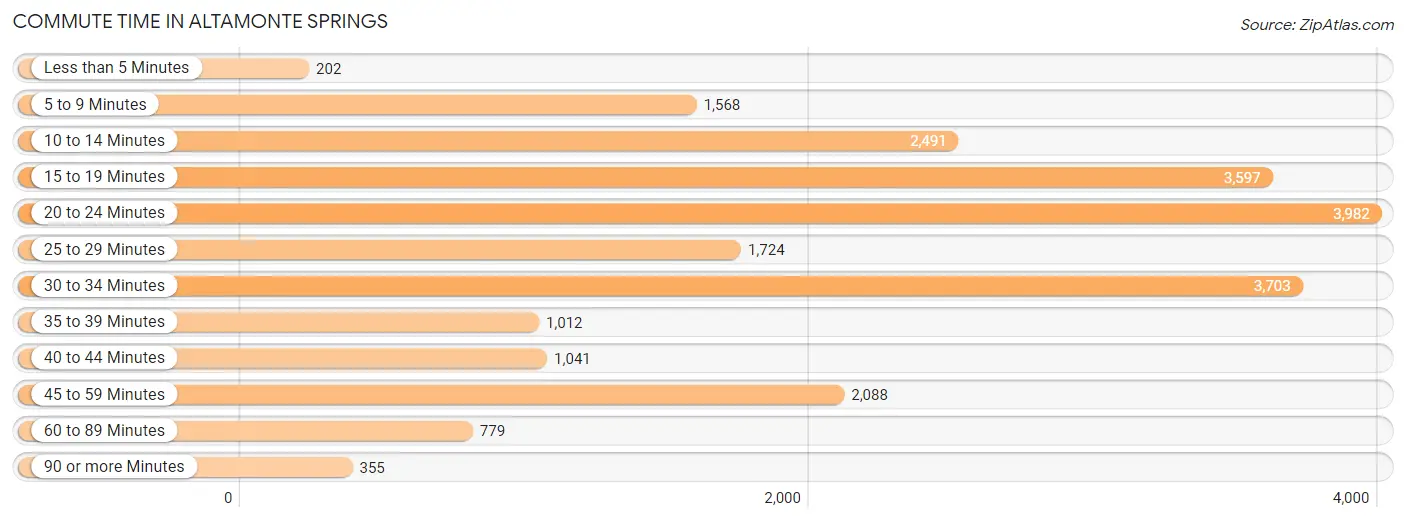
| Commute Time | # Commuters | % Commuters |
| Less than 5 Minutes | 202 | 0.9% |
| 5 to 9 Minutes | 1,568 | 7.0% |
| 10 to 14 Minutes | 2,491 | 11.1% |
| 15 to 19 Minutes | 3,597 | 16.0% |
| 20 to 24 Minutes | 3,982 | 17.7% |
| 25 to 29 Minutes | 1,724 | 7.6% |
| 30 to 34 Minutes | 3,703 | 16.4% |
| 35 to 39 Minutes | 1,012 | 4.5% |
| 40 to 44 Minutes | 1,041 | 4.6% |
| 45 to 59 Minutes | 2,088 | 9.3% |
| 60 to 89 Minutes | 779 | 3.5% |
| 90 or more Minutes | 355 | 1.6% |
Commute Time by Sex in Altamonte Springs
The most common commute times in Altamonte Springs are 30 to 34 minutes (1,845 commuters, 17.1%) for males and 20 to 24 minutes (2,286 commuters, 19.4%) for females.
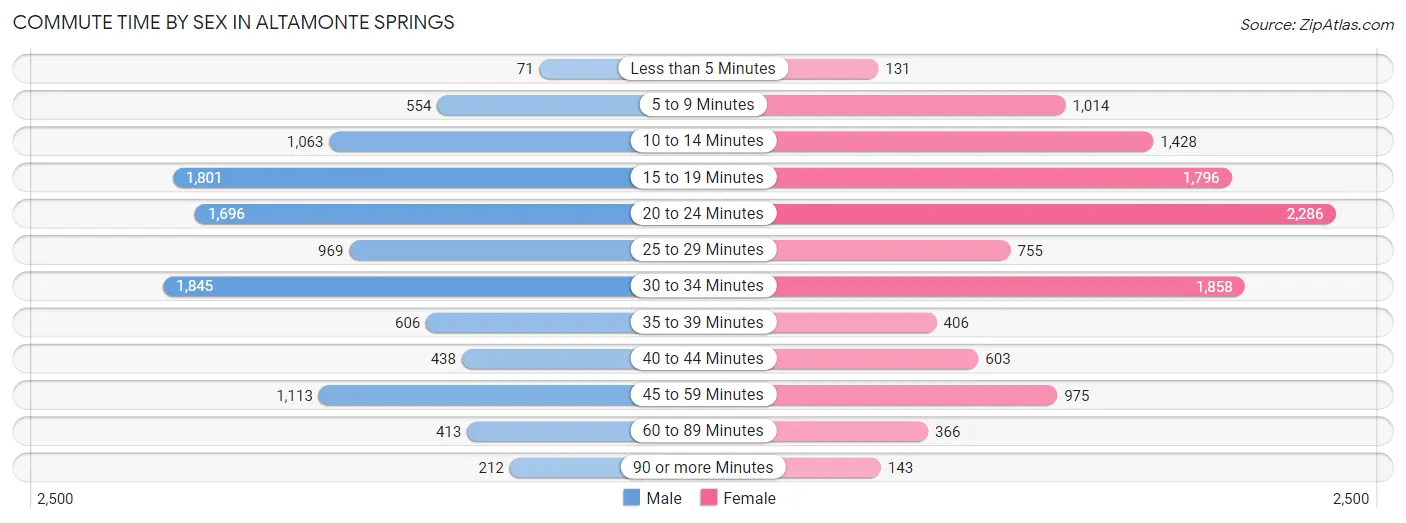
| Commute Time | Male | Female |
| Less than 5 Minutes | 71 (0.7%) | 131 (1.1%) |
| 5 to 9 Minutes | 554 (5.1%) | 1,014 (8.6%) |
| 10 to 14 Minutes | 1,063 (9.9%) | 1,428 (12.1%) |
| 15 to 19 Minutes | 1,801 (16.7%) | 1,796 (15.3%) |
| 20 to 24 Minutes | 1,696 (15.7%) | 2,286 (19.4%) |
| 25 to 29 Minutes | 969 (9.0%) | 755 (6.4%) |
| 30 to 34 Minutes | 1,845 (17.1%) | 1,858 (15.8%) |
| 35 to 39 Minutes | 606 (5.6%) | 406 (3.5%) |
| 40 to 44 Minutes | 438 (4.1%) | 603 (5.1%) |
| 45 to 59 Minutes | 1,113 (10.3%) | 975 (8.3%) |
| 60 to 89 Minutes | 413 (3.8%) | 366 (3.1%) |
| 90 or more Minutes | 212 (2.0%) | 143 (1.2%) |
Time of Departure to Work by Sex in Altamonte Springs
The most frequent times of departure to work in Altamonte Springs are 8:00 AM to 8:29 AM (1,451, 13.5%) for males and 8:00 AM to 8:29 AM (1,984, 16.9%) for females.
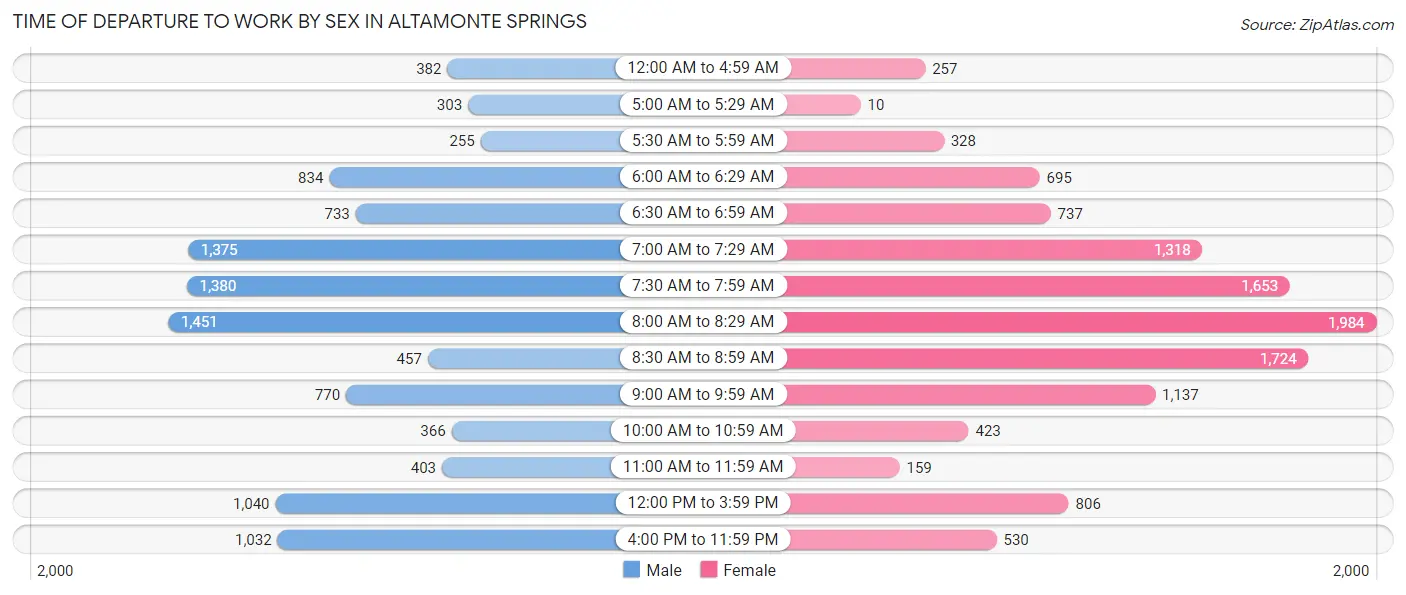
| Time of Departure | Male | Female |
| 12:00 AM to 4:59 AM | 382 (3.5%) | 257 (2.2%) |
| 5:00 AM to 5:29 AM | 303 (2.8%) | 10 (0.1%) |
| 5:30 AM to 5:59 AM | 255 (2.4%) | 328 (2.8%) |
| 6:00 AM to 6:29 AM | 834 (7.7%) | 695 (5.9%) |
| 6:30 AM to 6:59 AM | 733 (6.8%) | 737 (6.3%) |
| 7:00 AM to 7:29 AM | 1,375 (12.8%) | 1,318 (11.2%) |
| 7:30 AM to 7:59 AM | 1,380 (12.8%) | 1,653 (14.1%) |
| 8:00 AM to 8:29 AM | 1,451 (13.5%) | 1,984 (16.9%) |
| 8:30 AM to 8:59 AM | 457 (4.2%) | 1,724 (14.7%) |
| 9:00 AM to 9:59 AM | 770 (7.1%) | 1,137 (9.7%) |
| 10:00 AM to 10:59 AM | 366 (3.4%) | 423 (3.6%) |
| 11:00 AM to 11:59 AM | 403 (3.7%) | 159 (1.3%) |
| 12:00 PM to 3:59 PM | 1,040 (9.7%) | 806 (6.9%) |
| 4:00 PM to 11:59 PM | 1,032 (9.6%) | 530 (4.5%) |
| Total | 10,781 (100.0%) | 11,761 (100.0%) |
Housing Occupancy in Altamonte Springs
Occupancy by Ownership in Altamonte Springs
Of the total 20,913 dwellings in Altamonte Springs, owner-occupied units account for 8,408 (40.2%), while renter-occupied units make up 12,505 (59.8%).
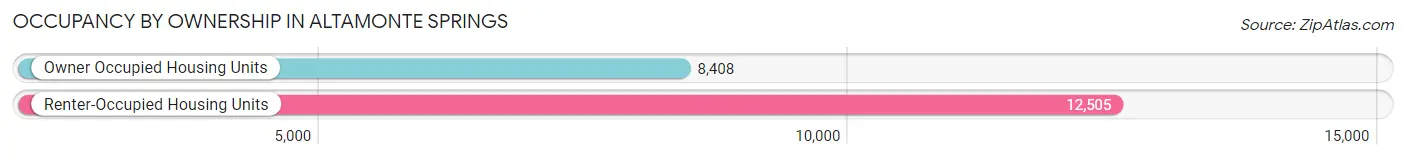
| Occupancy | # Housing Units | % Housing Units |
| Owner Occupied Housing Units | 8,408 | 40.2% |
| Renter-Occupied Housing Units | 12,505 | 59.8% |
| Total Occupied Housing Units | 20,913 | 100.0% |
Occupancy by Household Size in Altamonte Springs
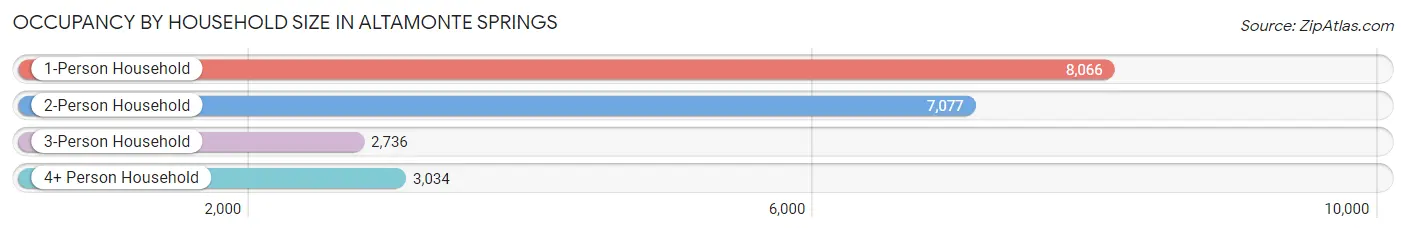
| Household Size | # Housing Units | % Housing Units |
| 1-Person Household | 8,066 | 38.6% |
| 2-Person Household | 7,077 | 33.8% |
| 3-Person Household | 2,736 | 13.1% |
| 4+ Person Household | 3,034 | 14.5% |
| Total Housing Units | 20,913 | 100.0% |
Occupancy by Ownership by Household Size in Altamonte Springs
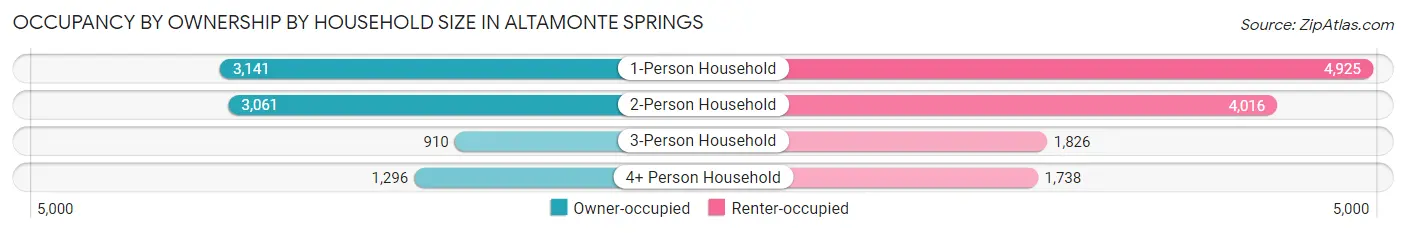
| Household Size | Owner-occupied | Renter-occupied |
| 1-Person Household | 3,141 (38.9%) | 4,925 (61.1%) |
| 2-Person Household | 3,061 (43.2%) | 4,016 (56.8%) |
| 3-Person Household | 910 (33.3%) | 1,826 (66.7%) |
| 4+ Person Household | 1,296 (42.7%) | 1,738 (57.3%) |
| Total Housing Units | 8,408 (40.2%) | 12,505 (59.8%) |
Occupancy by Educational Attainment in Altamonte Springs
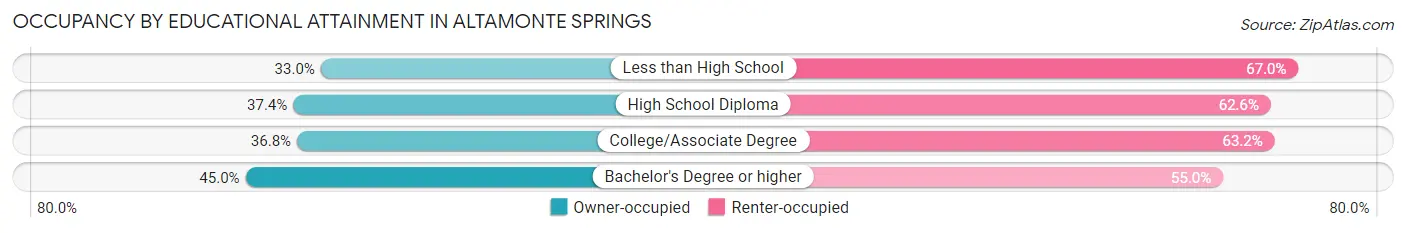
| Household Size | Owner-occupied | Renter-occupied |
| Less than High School | 372 (33.0%) | 754 (67.0%) |
| High School Diploma | 1,330 (37.4%) | 2,225 (62.6%) |
| College/Associate Degree | 2,683 (36.8%) | 4,606 (63.2%) |
| Bachelor's Degree or higher | 4,023 (45.0%) | 4,920 (55.0%) |
Occupancy by Age of Householder in Altamonte Springs
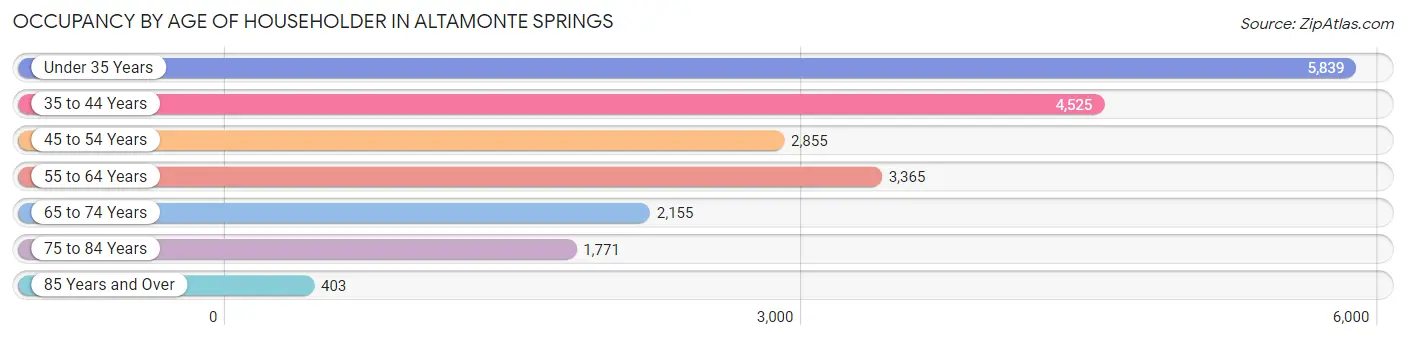
| Age Bracket | # Households | % Households |
| Under 35 Years | 5,839 | 27.9% |
| 35 to 44 Years | 4,525 | 21.6% |
| 45 to 54 Years | 2,855 | 13.7% |
| 55 to 64 Years | 3,365 | 16.1% |
| 65 to 74 Years | 2,155 | 10.3% |
| 75 to 84 Years | 1,771 | 8.5% |
| 85 Years and Over | 403 | 1.9% |
| Total | 20,913 | 100.0% |
Housing Finances in Altamonte Springs
Median Income by Occupancy in Altamonte Springs
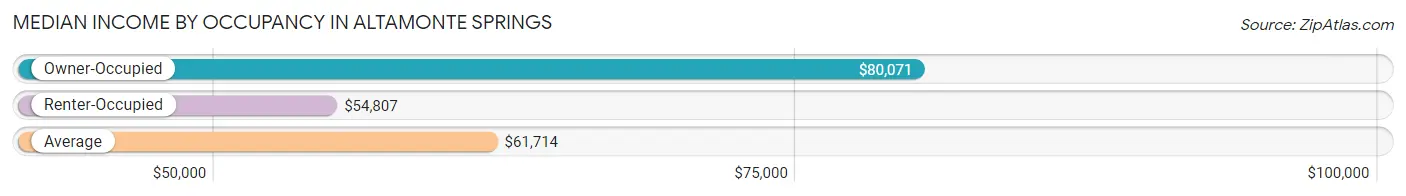
| Occupancy Type | # Households | Median Income |
| Owner-Occupied | 8,408 (40.2%) | $80,071 |
| Renter-Occupied | 12,505 (59.8%) | $54,807 |
| Average | 20,913 (100.0%) | $61,714 |
Occupancy by Householder Income Bracket in Altamonte Springs
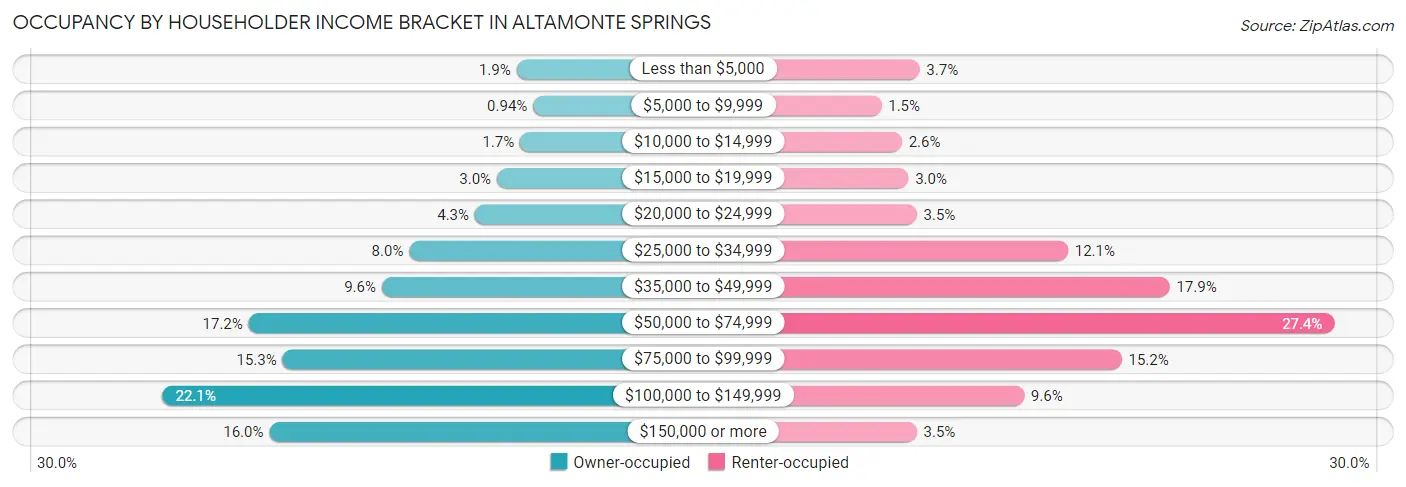
| Income Bracket | Owner-occupied | Renter-occupied |
| Less than $5,000 | 159 (1.9%) | 456 (3.6%) |
| $5,000 to $9,999 | 79 (0.9%) | 184 (1.5%) |
| $10,000 to $14,999 | 142 (1.7%) | 330 (2.6%) |
| $15,000 to $19,999 | 253 (3.0%) | 376 (3.0%) |
| $20,000 to $24,999 | 359 (4.3%) | 437 (3.5%) |
| $25,000 to $34,999 | 674 (8.0%) | 1,517 (12.1%) |
| $35,000 to $49,999 | 806 (9.6%) | 2,244 (17.9%) |
| $50,000 to $74,999 | 1,446 (17.2%) | 3,420 (27.4%) |
| $75,000 to $99,999 | 1,283 (15.3%) | 1,901 (15.2%) |
| $100,000 to $149,999 | 1,860 (22.1%) | 1,203 (9.6%) |
| $150,000 or more | 1,347 (16.0%) | 437 (3.5%) |
| Total | 8,408 (100.0%) | 12,505 (100.0%) |
Monthly Housing Cost Tiers in Altamonte Springs
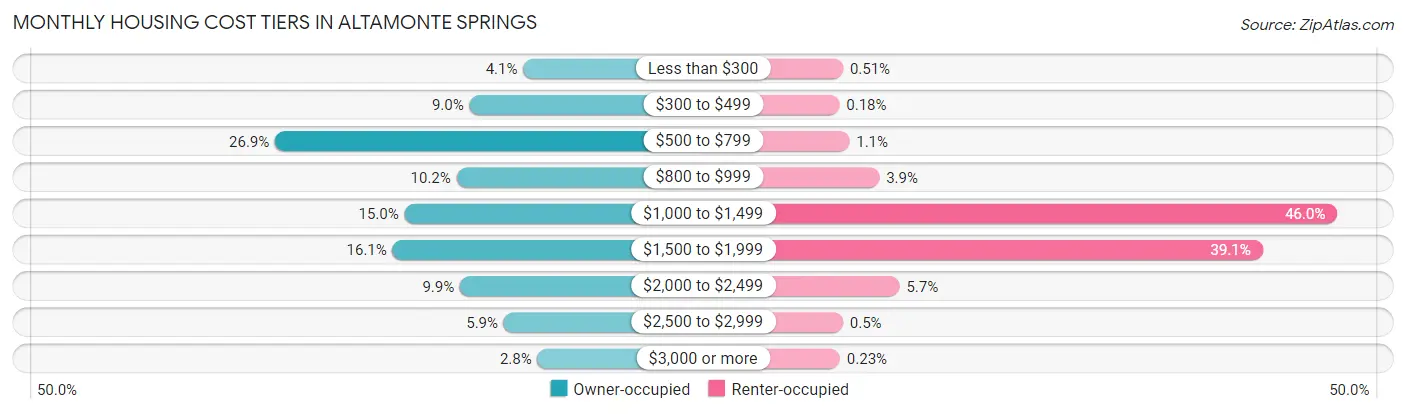
| Monthly Cost | Owner-occupied | Renter-occupied |
| Less than $300 | 344 (4.1%) | 64 (0.5%) |
| $300 to $499 | 760 (9.0%) | 22 (0.2%) |
| $500 to $799 | 2,265 (26.9%) | 136 (1.1%) |
| $800 to $999 | 860 (10.2%) | 482 (3.8%) |
| $1,000 to $1,499 | 1,263 (15.0%) | 5,754 (46.0%) |
| $1,500 to $1,999 | 1,355 (16.1%) | 4,895 (39.1%) |
| $2,000 to $2,499 | 833 (9.9%) | 714 (5.7%) |
| $2,500 to $2,999 | 494 (5.9%) | 63 (0.5%) |
| $3,000 or more | 234 (2.8%) | 29 (0.2%) |
| Total | 8,408 (100.0%) | 12,505 (100.0%) |
Physical Housing Characteristics in Altamonte Springs
Housing Structures in Altamonte Springs
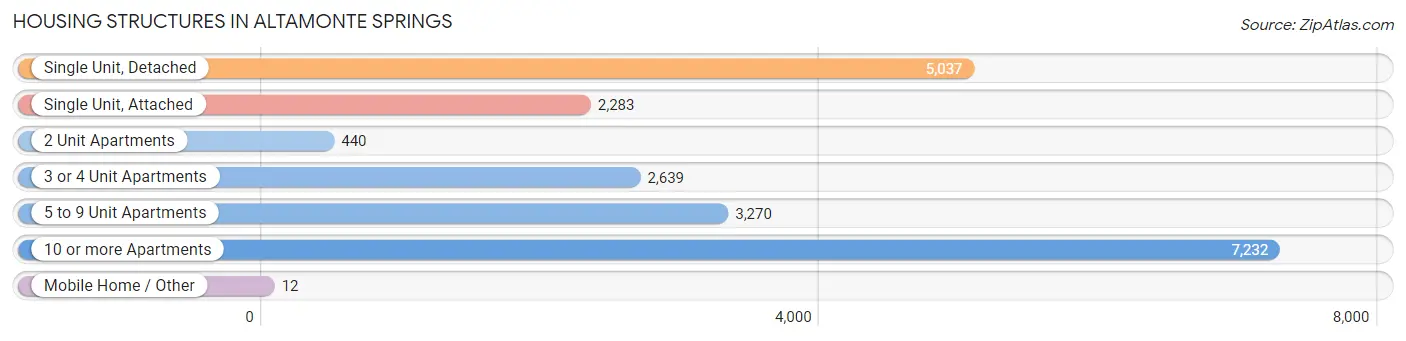
| Structure Type | # Housing Units | % Housing Units |
| Single Unit, Detached | 5,037 | 24.1% |
| Single Unit, Attached | 2,283 | 10.9% |
| 2 Unit Apartments | 440 | 2.1% |
| 3 or 4 Unit Apartments | 2,639 | 12.6% |
| 5 to 9 Unit Apartments | 3,270 | 15.6% |
| 10 or more Apartments | 7,232 | 34.6% |
| Mobile Home / Other | 12 | 0.1% |
| Total | 20,913 | 100.0% |
Housing Structures by Occupancy in Altamonte Springs
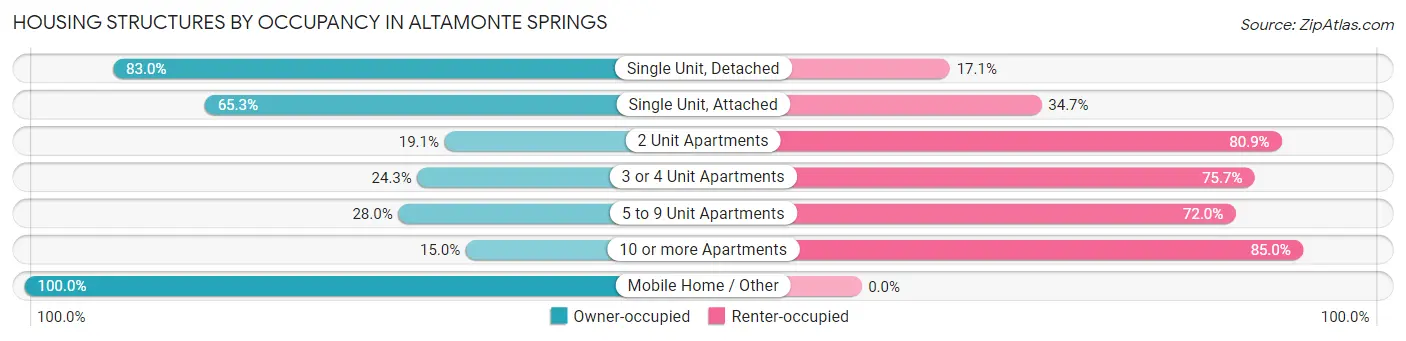
| Structure Type | Owner-occupied | Renter-occupied |
| Single Unit, Detached | 4,178 (83.0%) | 859 (17.1%) |
| Single Unit, Attached | 1,491 (65.3%) | 792 (34.7%) |
| 2 Unit Apartments | 84 (19.1%) | 356 (80.9%) |
| 3 or 4 Unit Apartments | 642 (24.3%) | 1,997 (75.7%) |
| 5 to 9 Unit Apartments | 916 (28.0%) | 2,354 (72.0%) |
| 10 or more Apartments | 1,085 (15.0%) | 6,147 (85.0%) |
| Mobile Home / Other | 12 (100.0%) | 0 (0.0%) |
| Total | 8,408 (40.2%) | 12,505 (59.8%) |
Housing Structures by Number of Rooms in Altamonte Springs
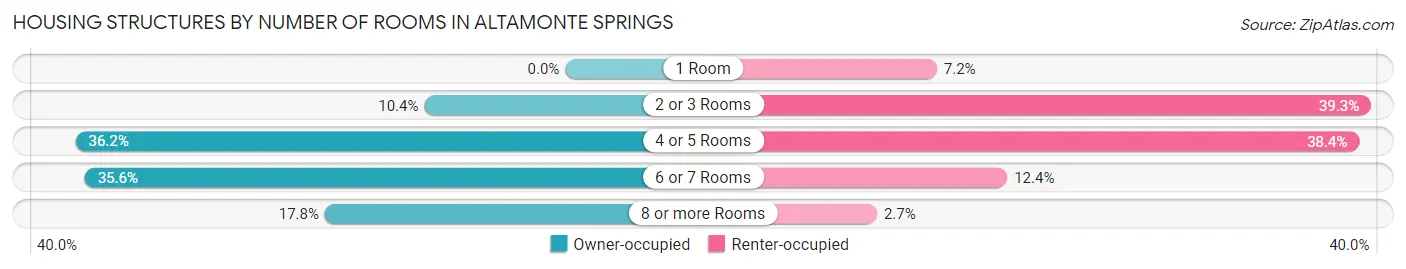
| Number of Rooms | Owner-occupied | Renter-occupied |
| 1 Room | 0 (0.0%) | 896 (7.2%) |
| 2 or 3 Rooms | 877 (10.4%) | 4,914 (39.3%) |
| 4 or 5 Rooms | 3,046 (36.2%) | 4,804 (38.4%) |
| 6 or 7 Rooms | 2,989 (35.5%) | 1,548 (12.4%) |
| 8 or more Rooms | 1,496 (17.8%) | 343 (2.7%) |
| Total | 8,408 (100.0%) | 12,505 (100.0%) |
Housing Structure by Heating Type in Altamonte Springs

| Heating Type | Owner-occupied | Renter-occupied |
| Utility Gas | 300 (3.6%) | 397 (3.2%) |
| Bottled, Tank, or LP Gas | 0 (0.0%) | 62 (0.5%) |
| Electricity | 8,012 (95.3%) | 11,705 (93.6%) |
| Fuel Oil or Kerosene | 33 (0.4%) | 7 (0.1%) |
| Coal or Coke | 0 (0.0%) | 0 (0.0%) |
| All other Fuels | 38 (0.4%) | 21 (0.2%) |
| No Fuel Used | 25 (0.3%) | 313 (2.5%) |
| Total | 8,408 (100.0%) | 12,505 (100.0%) |
Household Vehicle Usage in Altamonte Springs
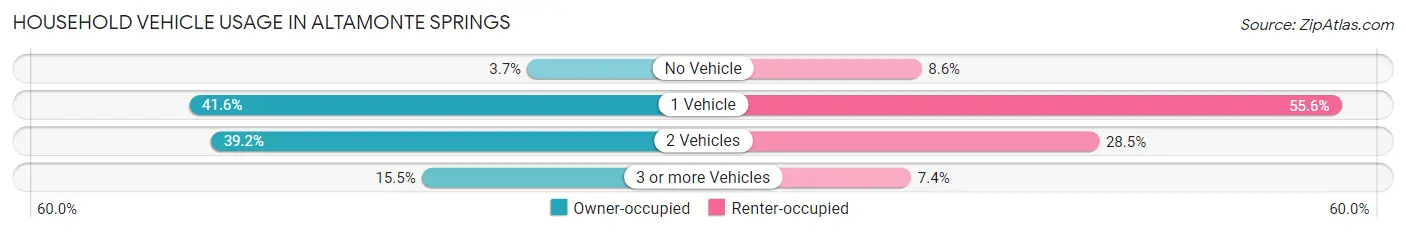
| Vehicles per Household | Owner-occupied | Renter-occupied |
| No Vehicle | 314 (3.7%) | 1,071 (8.6%) |
| 1 Vehicle | 3,495 (41.6%) | 6,951 (55.6%) |
| 2 Vehicles | 3,292 (39.2%) | 3,559 (28.5%) |
| 3 or more Vehicles | 1,307 (15.5%) | 924 (7.4%) |
| Total | 8,408 (100.0%) | 12,505 (100.0%) |
Real Estate & Mortgages in Altamonte Springs
Real Estate and Mortgage Overview in Altamonte Springs
| Characteristic | Without Mortgage | With Mortgage |
| Housing Units | 3,755 | 4,653 |
| Median Property Value | $190,400 | $282,100 |
| Median Household Income | $63,125 | $890 |
| Monthly Housing Costs | $579 | $234 |
| Real Estate Taxes | $1,156 | $200 |
Property Value by Mortgage Status in Altamonte Springs
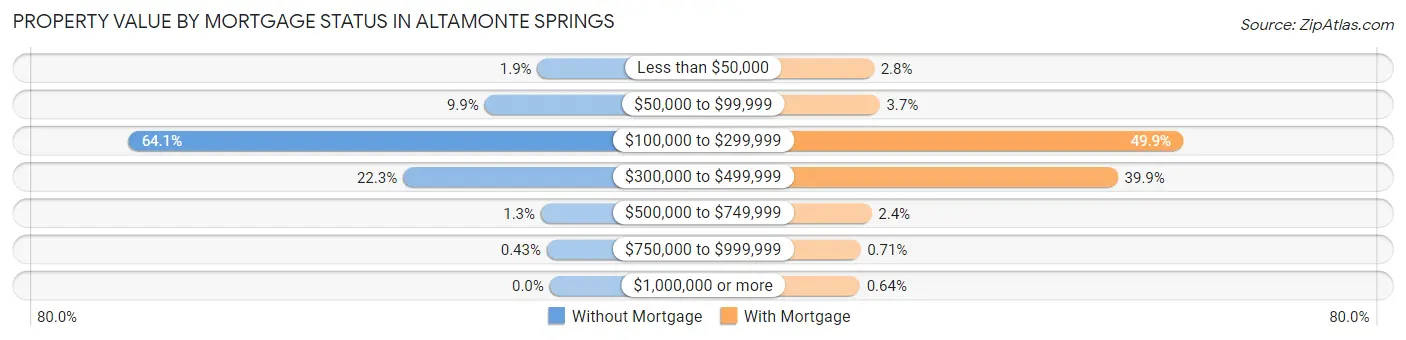
| Property Value | Without Mortgage | With Mortgage |
| Less than $50,000 | 70 (1.9%) | 129 (2.8%) |
| $50,000 to $99,999 | 372 (9.9%) | 170 (3.6%) |
| $100,000 to $299,999 | 2,408 (64.1%) | 2,321 (49.9%) |
| $300,000 to $499,999 | 839 (22.3%) | 1,858 (39.9%) |
| $500,000 to $749,999 | 50 (1.3%) | 112 (2.4%) |
| $750,000 to $999,999 | 16 (0.4%) | 33 (0.7%) |
| $1,000,000 or more | 0 (0.0%) | 30 (0.6%) |
| Total | 3,755 (100.0%) | 4,653 (100.0%) |
Household Income by Mortgage Status in Altamonte Springs
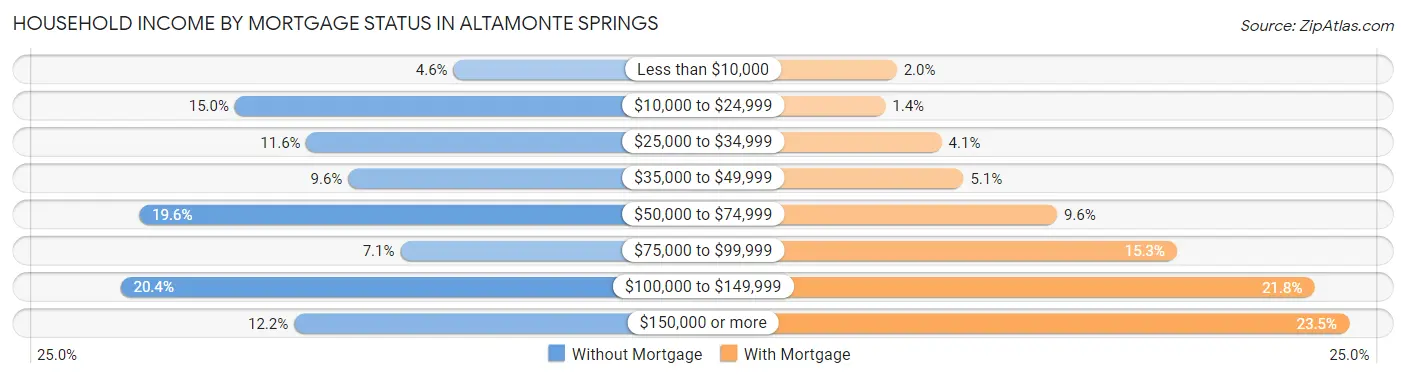
| Household Income | Without Mortgage | With Mortgage |
| Less than $10,000 | 172 (4.6%) | 91 (2.0%) |
| $10,000 to $24,999 | 563 (15.0%) | 66 (1.4%) |
| $25,000 to $34,999 | 435 (11.6%) | 191 (4.1%) |
| $35,000 to $49,999 | 360 (9.6%) | 239 (5.1%) |
| $50,000 to $74,999 | 734 (19.6%) | 446 (9.6%) |
| $75,000 to $99,999 | 267 (7.1%) | 712 (15.3%) |
| $100,000 to $149,999 | 767 (20.4%) | 1,016 (21.8%) |
| $150,000 or more | 457 (12.2%) | 1,093 (23.5%) |
| Total | 3,755 (100.0%) | 4,653 (100.0%) |
Property Value to Household Income Ratio in Altamonte Springs
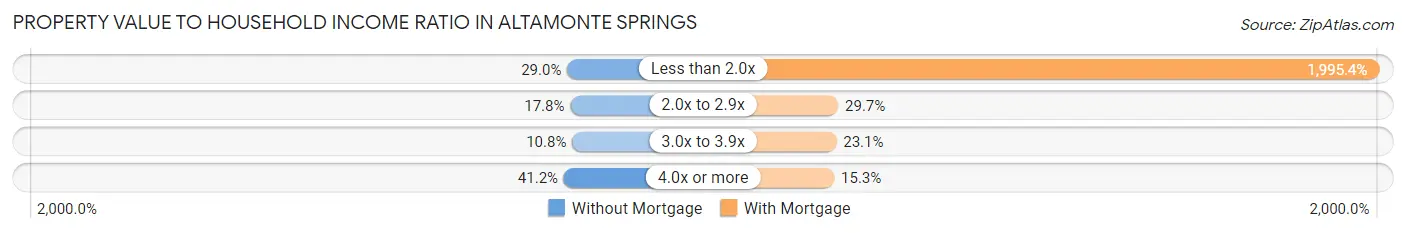
| Value-to-Income Ratio | Without Mortgage | With Mortgage |
| Less than 2.0x | 1,090 (29.0%) | 92,844 (1,995.4%) |
| 2.0x to 2.9x | 667 (17.8%) | 1,381 (29.7%) |
| 3.0x to 3.9x | 407 (10.8%) | 1,073 (23.1%) |
| 4.0x or more | 1,546 (41.2%) | 711 (15.3%) |
| Total | 3,755 (100.0%) | 4,653 (100.0%) |
Real Estate Taxes by Mortgage Status in Altamonte Springs
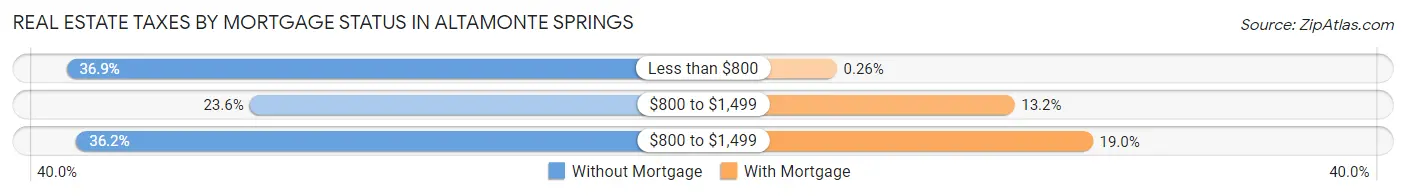
| Property Taxes | Without Mortgage | With Mortgage |
| Less than $800 | 1,387 (36.9%) | 12 (0.3%) |
| $800 to $1,499 | 885 (23.6%) | 616 (13.2%) |
| $800 to $1,499 | 1,360 (36.2%) | 882 (19.0%) |
| Total | 3,755 (100.0%) | 4,653 (100.0%) |
Health & Disability in Altamonte Springs
Health Insurance Coverage by Age in Altamonte Springs
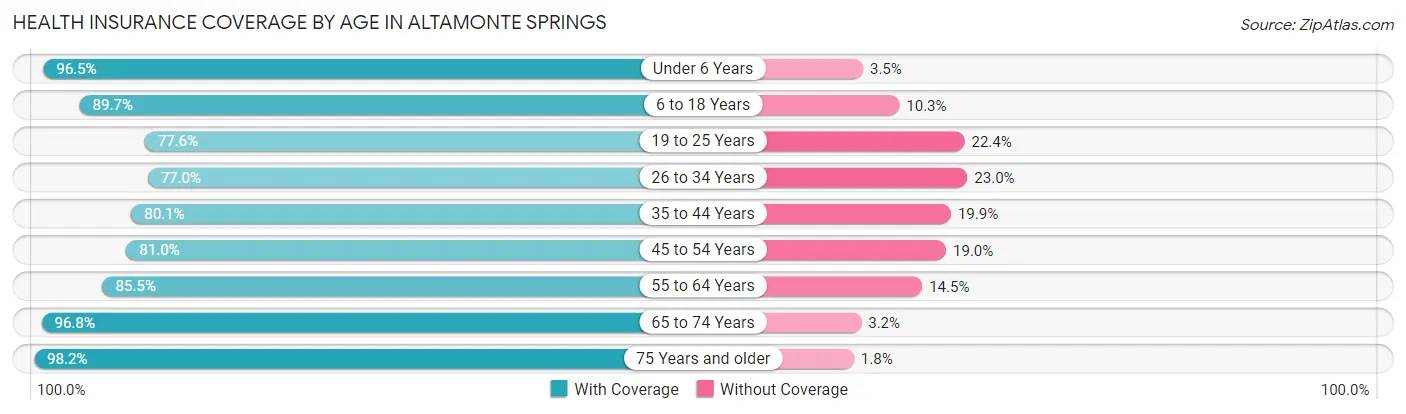
| Age Bracket | With Coverage | Without Coverage |
| Under 6 Years | 2,651 (96.5%) | 96 (3.5%) |
| 6 to 18 Years | 5,766 (89.7%) | 660 (10.3%) |
| 19 to 25 Years | 3,156 (77.6%) | 912 (22.4%) |
| 26 to 34 Years | 6,746 (77.0%) | 2,010 (23.0%) |
| 35 to 44 Years | 6,038 (80.1%) | 1,500 (19.9%) |
| 45 to 54 Years | 3,806 (81.0%) | 892 (19.0%) |
| 55 to 64 Years | 4,252 (85.5%) | 723 (14.5%) |
| 65 to 74 Years | 3,146 (96.8%) | 103 (3.2%) |
| 75 Years and older | 2,861 (98.2%) | 52 (1.8%) |
| Total | 38,422 (84.7%) | 6,948 (15.3%) |
Health Insurance Coverage by Citizenship Status in Altamonte Springs
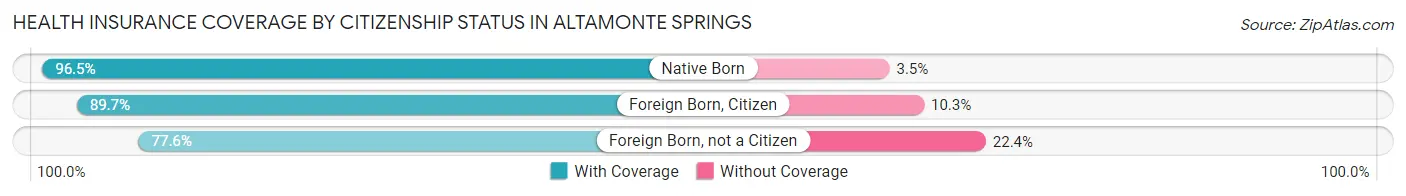
| Citizenship Status | With Coverage | Without Coverage |
| Native Born | 2,651 (96.5%) | 96 (3.5%) |
| Foreign Born, Citizen | 5,766 (89.7%) | 660 (10.3%) |
| Foreign Born, not a Citizen | 3,156 (77.6%) | 912 (22.4%) |
Health Insurance Coverage by Household Income in Altamonte Springs
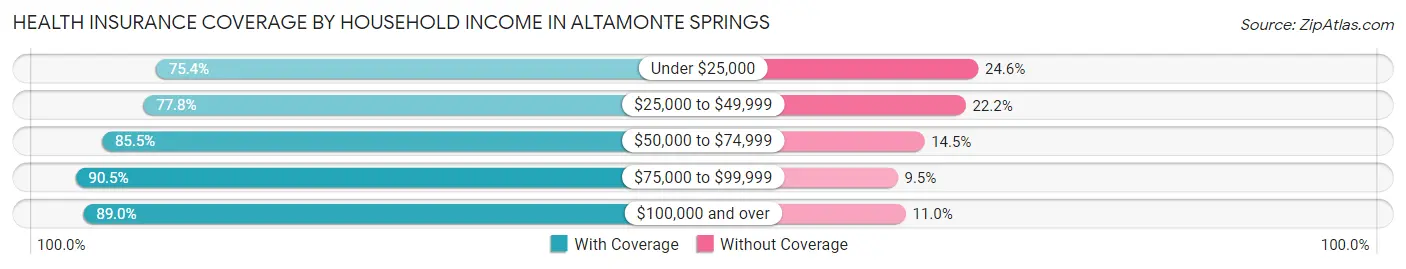
| Household Income | With Coverage | Without Coverage |
| Under $25,000 | 3,149 (75.4%) | 1,027 (24.6%) |
| $25,000 to $49,999 | 8,096 (77.8%) | 2,315 (22.2%) |
| $50,000 to $74,999 | 8,095 (85.5%) | 1,373 (14.5%) |
| $75,000 to $99,999 | 6,951 (90.5%) | 730 (9.5%) |
| $100,000 and over | 12,110 (89.0%) | 1,499 (11.0%) |
Public vs Private Health Insurance Coverage by Age in Altamonte Springs
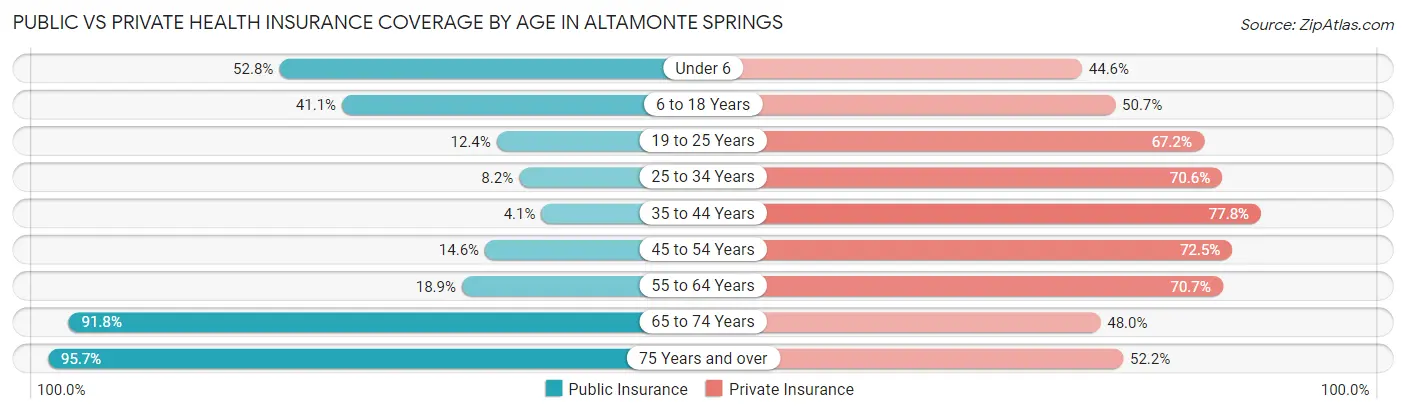
| Age Bracket | Public Insurance | Private Insurance |
| Under 6 | 1,449 (52.7%) | 1,224 (44.6%) |
| 6 to 18 Years | 2,641 (41.1%) | 3,260 (50.7%) |
| 19 to 25 Years | 504 (12.4%) | 2,733 (67.2%) |
| 25 to 34 Years | 721 (8.2%) | 6,180 (70.6%) |
| 35 to 44 Years | 309 (4.1%) | 5,864 (77.8%) |
| 45 to 54 Years | 684 (14.6%) | 3,404 (72.5%) |
| 55 to 64 Years | 938 (18.9%) | 3,516 (70.7%) |
| 65 to 74 Years | 2,984 (91.8%) | 1,559 (48.0%) |
| 75 Years and over | 2,787 (95.7%) | 1,521 (52.2%) |
| Total | 13,017 (28.7%) | 29,261 (64.5%) |
Disability Status by Sex by Age in Altamonte Springs
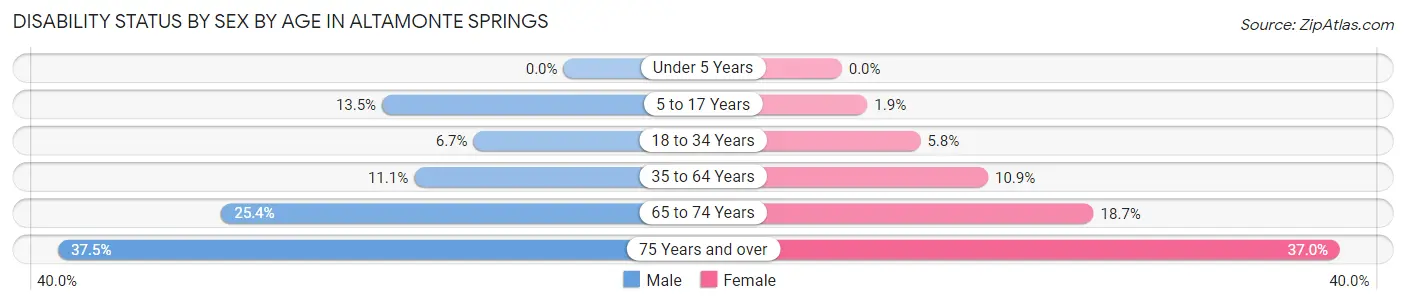
| Age Bracket | Male | Female |
| Under 5 Years | 0 (0.0%) | 0 (0.0%) |
| 5 to 17 Years | 416 (13.5%) | 64 (1.9%) |
| 18 to 34 Years | 413 (6.7%) | 418 (5.8%) |
| 35 to 64 Years | 868 (11.1%) | 1,019 (10.9%) |
| 65 to 74 Years | 339 (25.4%) | 358 (18.7%) |
| 75 Years and over | 397 (37.5%) | 686 (37.0%) |
Disability Class by Sex by Age in Altamonte Springs
Disability Class: Hearing Difficulty
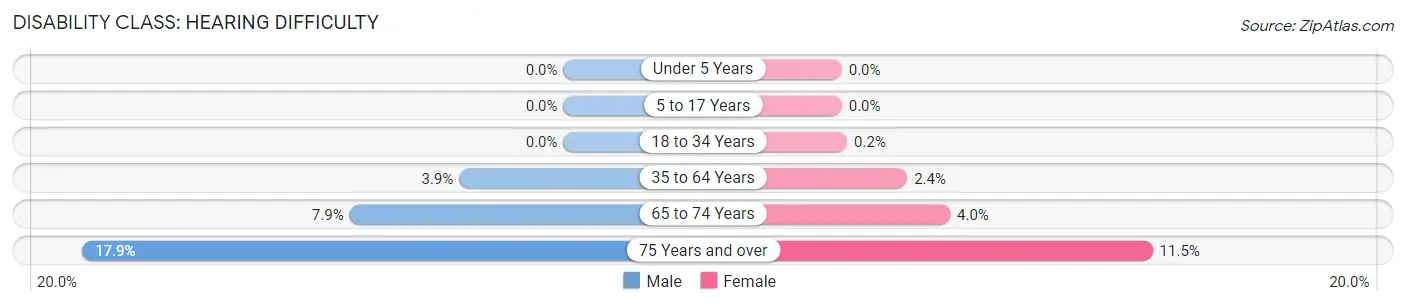
| Age Bracket | Male | Female |
| Under 5 Years | 0 (0.0%) | 0 (0.0%) |
| 5 to 17 Years | 0 (0.0%) | 0 (0.0%) |
| 18 to 34 Years | 0 (0.0%) | 14 (0.2%) |
| 35 to 64 Years | 303 (3.9%) | 228 (2.4%) |
| 65 to 74 Years | 106 (7.9%) | 77 (4.0%) |
| 75 Years and over | 189 (17.9%) | 214 (11.5%) |
Disability Class: Vision Difficulty
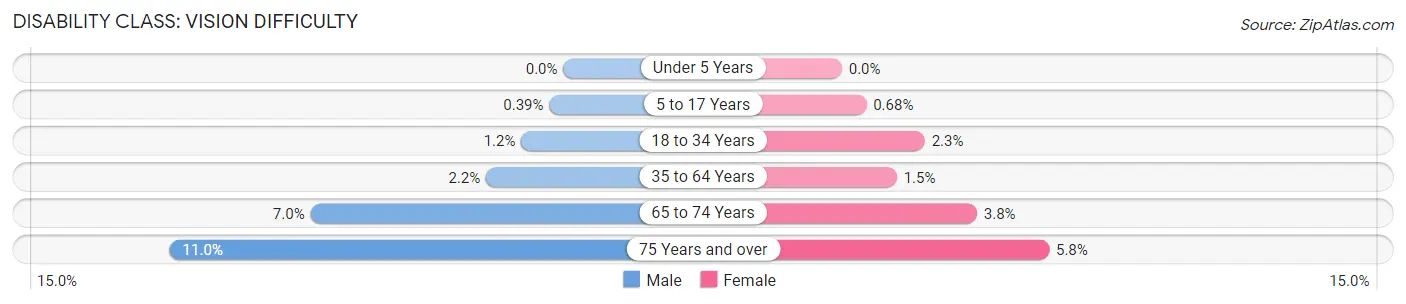
| Age Bracket | Male | Female |
| Under 5 Years | 0 (0.0%) | 0 (0.0%) |
| 5 to 17 Years | 12 (0.4%) | 23 (0.7%) |
| 18 to 34 Years | 72 (1.2%) | 165 (2.3%) |
| 35 to 64 Years | 168 (2.1%) | 144 (1.5%) |
| 65 to 74 Years | 94 (7.0%) | 72 (3.8%) |
| 75 Years and over | 116 (11.0%) | 107 (5.8%) |
Disability Class: Cognitive Difficulty
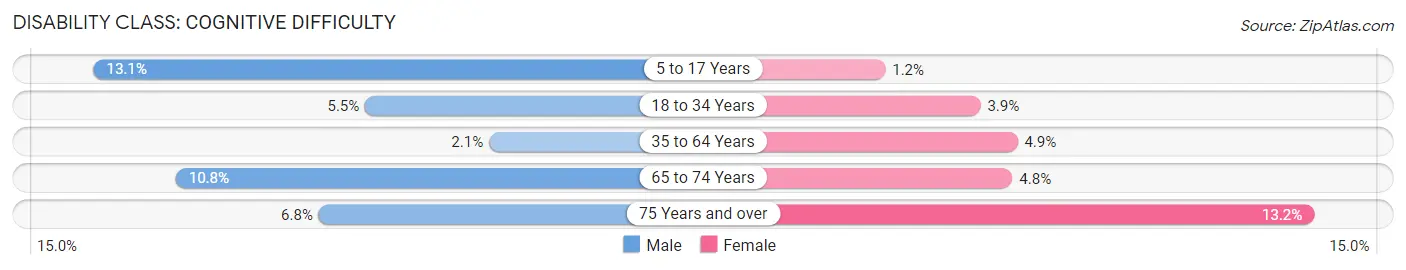
| Age Bracket | Male | Female |
| 5 to 17 Years | 404 (13.1%) | 41 (1.2%) |
| 18 to 34 Years | 341 (5.5%) | 276 (3.9%) |
| 35 to 64 Years | 162 (2.1%) | 459 (4.9%) |
| 65 to 74 Years | 144 (10.8%) | 91 (4.8%) |
| 75 Years and over | 72 (6.8%) | 244 (13.2%) |
Disability Class: Ambulatory Difficulty
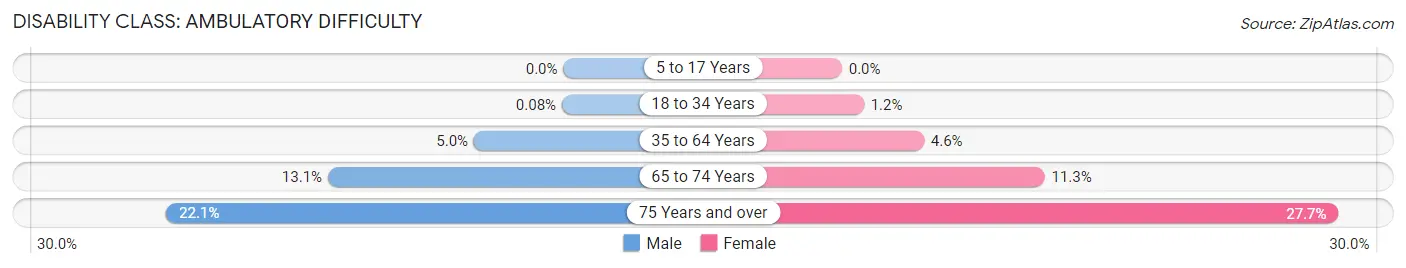
| Age Bracket | Male | Female |
| 5 to 17 Years | 0 (0.0%) | 0 (0.0%) |
| 18 to 34 Years | 5 (0.1%) | 87 (1.2%) |
| 35 to 64 Years | 390 (5.0%) | 429 (4.6%) |
| 65 to 74 Years | 175 (13.1%) | 216 (11.3%) |
| 75 Years and over | 234 (22.1%) | 513 (27.7%) |
Disability Class: Self-Care Difficulty
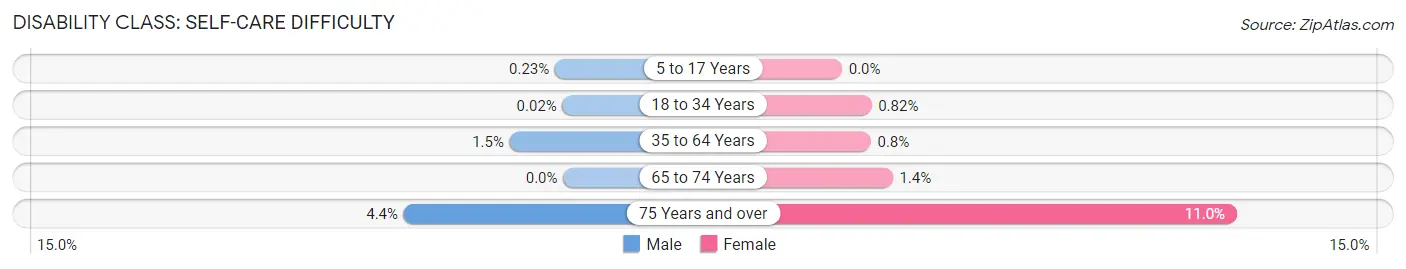
| Age Bracket | Male | Female |
| 5 to 17 Years | 7 (0.2%) | 0 (0.0%) |
| 18 to 34 Years | 1 (0.0%) | 59 (0.8%) |
| 35 to 64 Years | 117 (1.5%) | 75 (0.8%) |
| 65 to 74 Years | 0 (0.0%) | 27 (1.4%) |
| 75 Years and over | 47 (4.4%) | 204 (11.0%) |
Technology Access in Altamonte Springs
Computing Device Access in Altamonte Springs
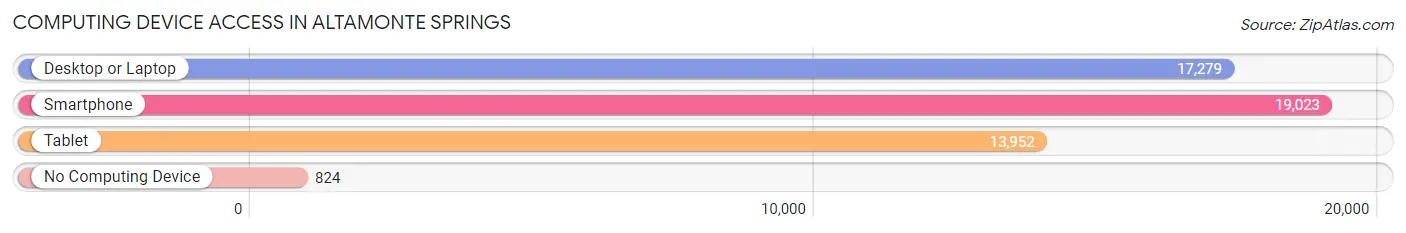
| Device Type | # Households | % Households |
| Desktop or Laptop | 17,279 | 82.6% |
| Smartphone | 19,023 | 91.0% |
| Tablet | 13,952 | 66.7% |
| No Computing Device | 824 | 3.9% |
| Total | 20,913 | 100.0% |
Internet Access in Altamonte Springs
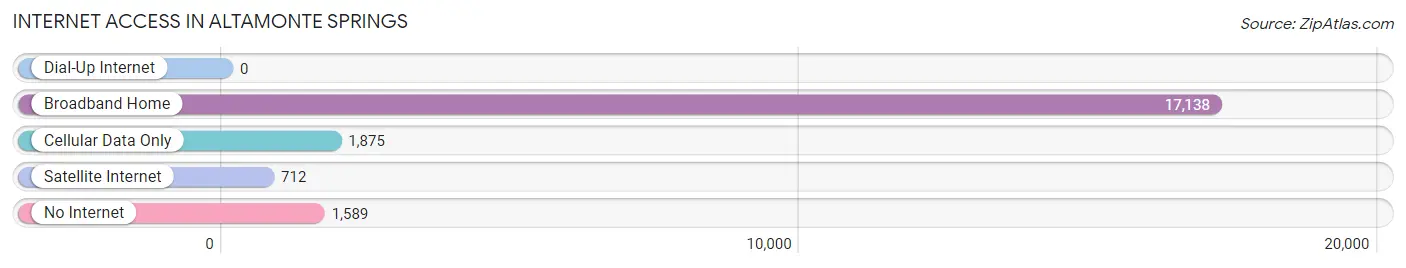
| Internet Type | # Households | % Households |
| Dial-Up Internet | 0 | 0.0% |
| Broadband Home | 17,138 | 82.0% |
| Cellular Data Only | 1,875 | 9.0% |
| Satellite Internet | 712 | 3.4% |
| No Internet | 1,589 | 7.6% |
| Total | 20,913 | 100.0% |
Altamonte Springs Summary
Altamonte Springs is a city located in Seminole County, Florida, United States. It is part of the Orlando–Kissimmee–Sanford Metropolitan Statistical Area. The city is located in the northern suburbs of the Orlando metropolitan area and is approximately 12 miles north of downtown Orlando. As of the 2010 census, the city had a population of 41,496.
History
The area that is now Altamonte Springs was originally inhabited by the Seminole Indians. The area was first settled by Europeans in the mid-1800s. The first permanent settlers were William and Mary Altamonte, who arrived in 1882 and established a homestead on the shores of Lake Orienta. The Altamontes built a hotel and a post office, and the area became known as Altamonte Springs.
In the early 1900s, the area began to grow as a resort destination. The Altamonte Hotel was a popular destination for visitors from around the country. The hotel was destroyed by a fire in 1912, but the area continued to grow. In 1925, the city was incorporated and the population had grown to 1,000.
In the 1950s, the city began to experience rapid growth as the Orlando area became a popular destination for tourists. The city was annexed by the City of Orlando in 1965, but it was reincorporated as a separate city in 1971.
Geography
Altamonte Springs is located in central Florida, approximately 12 miles north of downtown Orlando. The city is located in Seminole County and is part of the Orlando–Kissimmee–Sanford Metropolitan Statistical Area. The city is bordered by Maitland to the north, Longwood to the east, Apopka to the west, and Orlando to the south.
The city has a total area of 11.2 square miles, of which 10.9 square miles is land and 0.3 square miles is water. The city is located on the shores of Lake Orienta and is home to several parks and recreational areas.
Economy
Altamonte Springs is home to a diverse economy. The city is home to several major employers, including Florida Hospital, Adventist Health System, and the Seminole County Public Schools. The city is also home to several retail and entertainment venues, including the Altamonte Mall and the Uptown Altamonte shopping center.
The city is also home to several technology companies, including Lockheed Martin, Siemens, and Verizon. The city is also home to several medical and healthcare companies, including Florida Hospital and Adventist Health System.
Demographics
As of the 2010 census, the city had a population of 41,496. The racial makeup of the city was 68.2% White, 16.3% African American, 0.4% Native American, 6.2% Asian, 0.1% Pacific Islander, 4.7% from other races, and 4.1% from two or more races. Hispanic or Latino of any race were 15.2% of the population.
The median income for a household in the city was $45,845, and the median income for a family was $54,845. The per capita income for the city was $25,845. About 8.7% of families and 11.2% of the population were below the poverty line, including 15.2% of those under age 18 and 6.2% of those age 65 or over.
Common Questions
What is Per Capita Income in Altamonte Springs?
Per Capita income in Altamonte Springs is $36,032.
What is the Median Family Income in Altamonte Springs?
Median Family Income in Altamonte Springs is $72,436.
What is the Median Household income in Altamonte Springs?
Median Household Income in Altamonte Springs is $61,714.
What is Income or Wage Gap in Altamonte Springs?
Income or Wage Gap in Altamonte Springs is 7.2%.
Women in Altamonte Springs earn 92.8 cents for every dollar earned by a man.
What is Family Income Deficit in Altamonte Springs?
Family Income Deficit in Altamonte Springs is $8,808.
Families that are below poverty line in Altamonte Springs earn $8,808 less on average than the poverty threshold level.
What is Inequality or Gini Index in Altamonte Springs?
Inequality or Gini Index in Altamonte Springs is 0.40.
What is the Total Population of Altamonte Springs?
Total Population of Altamonte Springs is 45,772.
What is the Total Male Population of Altamonte Springs?
Total Male Population of Altamonte Springs is 20,511.
What is the Total Female Population of Altamonte Springs?
Total Female Population of Altamonte Springs is 25,261.
What is the Ratio of Males per 100 Females in Altamonte Springs?
There are 81.20 Males per 100 Females in Altamonte Springs.
What is the Ratio of Females per 100 Males in Altamonte Springs?
There are 123.16 Females per 100 Males in Altamonte Springs.
What is the Median Population Age in Altamonte Springs?
Median Population Age in Altamonte Springs is 36.0 Years.
What is the Average Family Size in Altamonte Springs
Average Family Size in Altamonte Springs is 3.0 People.
What is the Average Household Size in Altamonte Springs
Average Household Size in Altamonte Springs is 2.2 People.
How Large is the Labor Force in Altamonte Springs?
There are 27,671 People in the Labor Forcein in Altamonte Springs.
What is the Percentage of People in the Labor Force in Altamonte Springs?
72.7% of People are in the Labor Force in Altamonte Springs.
What is the Unemployment Rate in Altamonte Springs?
Unemployment Rate in Altamonte Springs is 5.4%.