Gifford, IL Map & Demographics
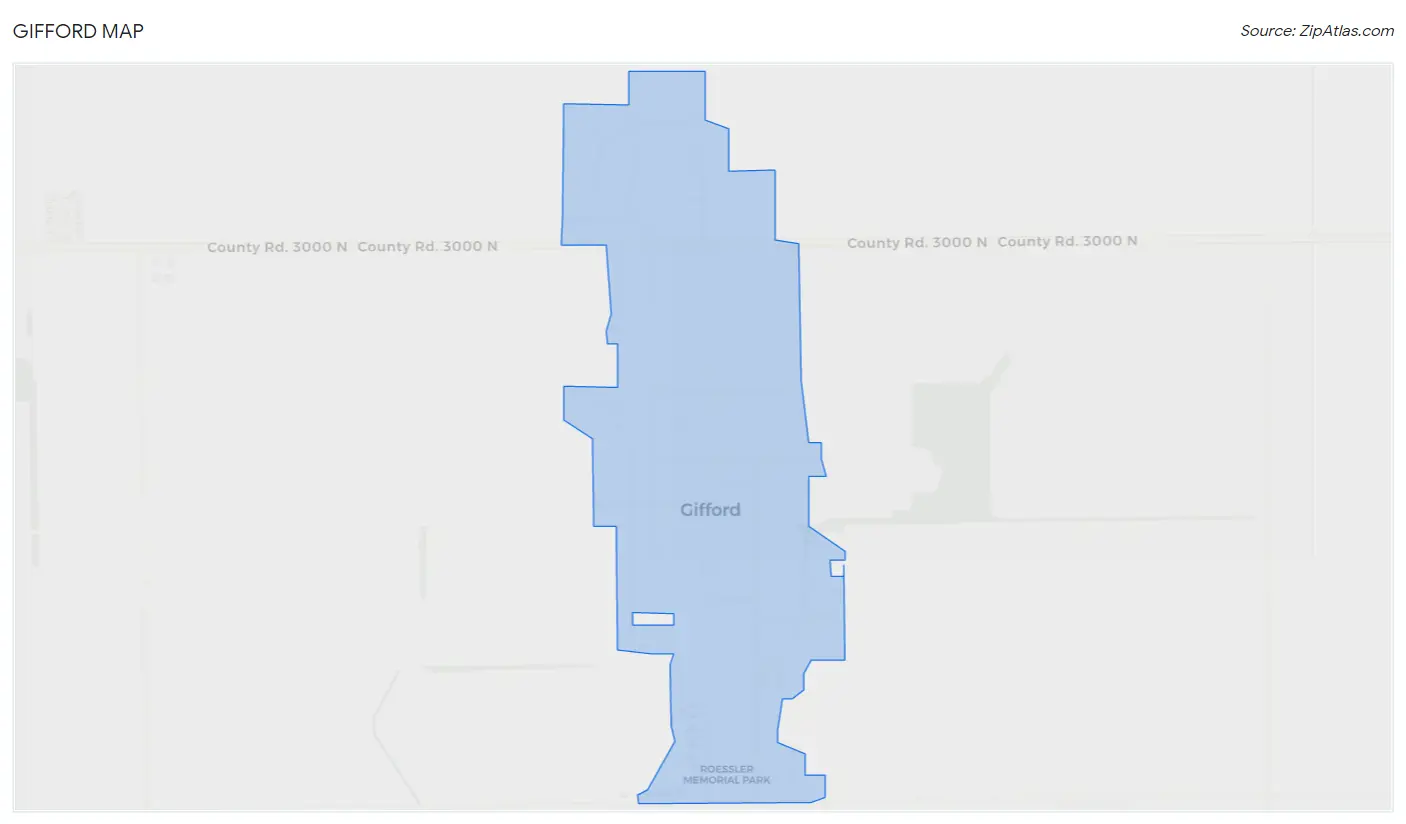
Gifford Map
Gifford Overview
$38,113
PER CAPITA INCOME
$91,875
AVG FAMILY INCOME
$76,382
AVG HOUSEHOLD INCOME
23.2%
WAGE / INCOME GAP [ % ]
76.8¢/ $1
WAGE / INCOME GAP [ $ ]
0.37
INEQUALITY / GINI INDEX
827
TOTAL POPULATION
393
MALE POPULATION
434
FEMALE POPULATION
90.55
MALES / 100 FEMALES
110.43
FEMALES / 100 MALES
52.5
MEDIAN AGE
2.6
AVG FAMILY SIZE
2.1
AVG HOUSEHOLD SIZE
409
LABOR FORCE [ PEOPLE ]
57.7%
PERCENT IN LABOR FORCE
1.5%
UNEMPLOYMENT RATE
Gifford Zip Codes
Gifford Area Codes
Income in Gifford
Income Overview in Gifford
Per Capita Income in Gifford is $38,113, while median incomes of families and households are $91,875 and $76,382 respectively.
| Characteristic | Number | Measure |
| Per Capita Income | 827 | $38,113 |
| Median Family Income | 207 | $91,875 |
| Mean Family Income | 207 | $106,115 |
| Median Household Income | 351 | $76,382 |
| Mean Household Income | 351 | $83,890 |
| Income Deficit | 207 | $0 |
| Wage / Income Gap (%) | 827 | 23.21% |
| Wage / Income Gap ($) | 827 | 76.79¢ per $1 |
| Gini / Inequality Index | 827 | 0.37 |
Earnings by Sex in Gifford
Average Earnings in Gifford are $50,500, $54,432 for men and $41,797 for women, a difference of 23.2%.
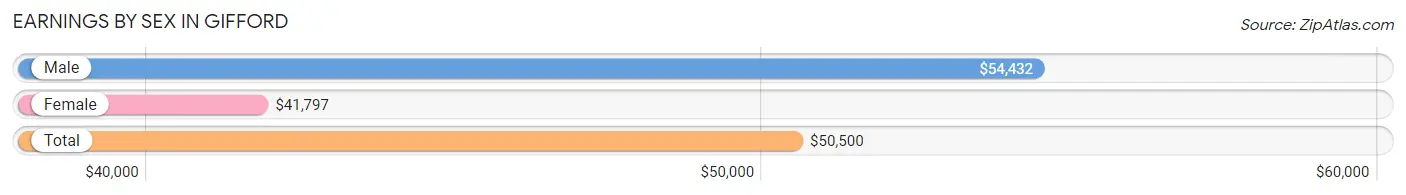
| Sex | Number | Average Earnings |
| Male | 211 (50.7%) | $54,432 |
| Female | 205 (49.3%) | $41,797 |
| Total | 416 (100.0%) | $50,500 |
Earnings by Sex by Income Bracket in Gifford
The most common earnings brackets in Gifford are $75,000 to $99,999 for men (45 | 21.3%) and $55,000 to $64,999 for women (30 | 14.6%).
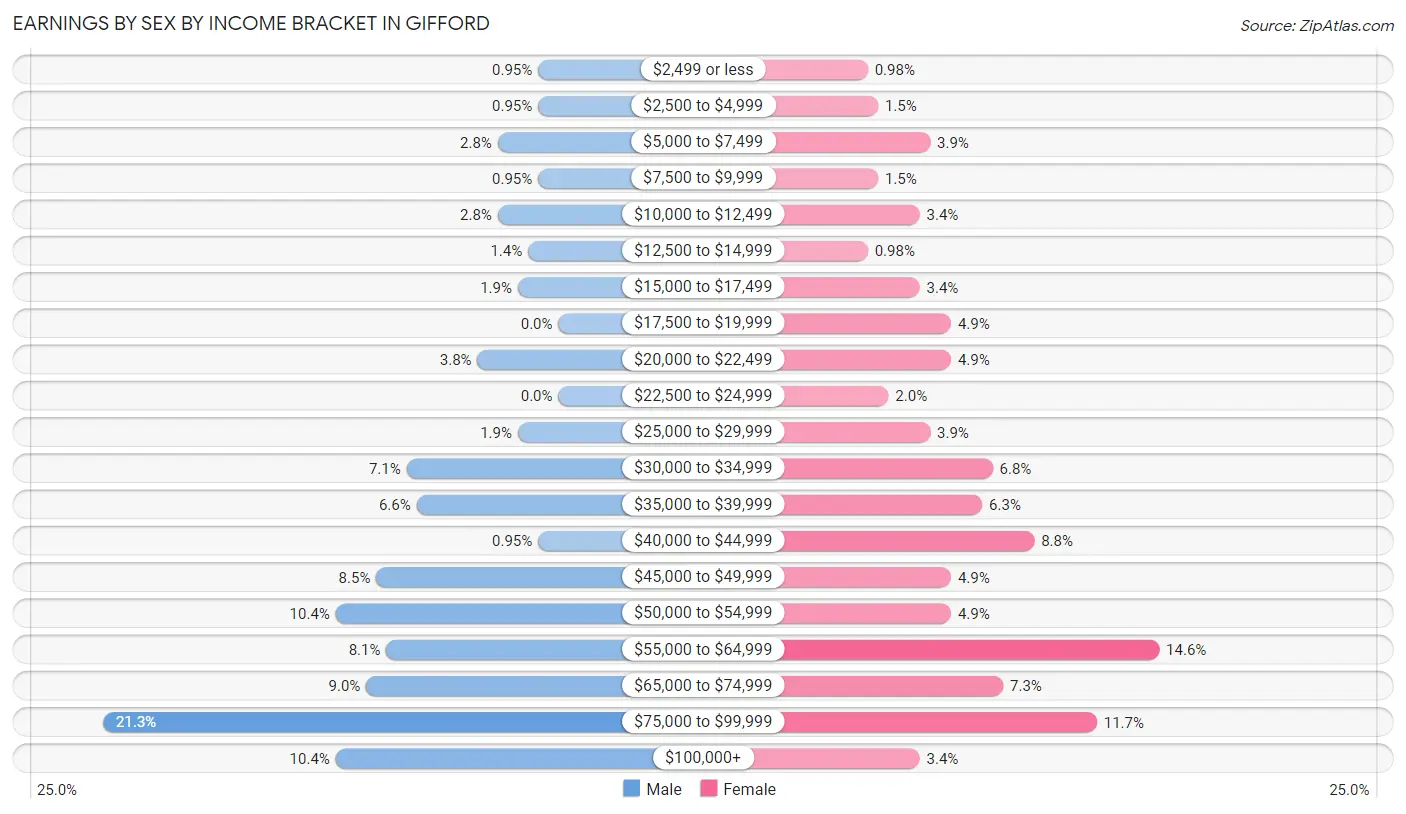
| Income | Male | Female |
| $2,499 or less | 2 (0.9%) | 2 (1.0%) |
| $2,500 to $4,999 | 2 (0.9%) | 3 (1.5%) |
| $5,000 to $7,499 | 6 (2.8%) | 8 (3.9%) |
| $7,500 to $9,999 | 2 (0.9%) | 3 (1.5%) |
| $10,000 to $12,499 | 6 (2.8%) | 7 (3.4%) |
| $12,500 to $14,999 | 3 (1.4%) | 2 (1.0%) |
| $15,000 to $17,499 | 4 (1.9%) | 7 (3.4%) |
| $17,500 to $19,999 | 0 (0.0%) | 10 (4.9%) |
| $20,000 to $22,499 | 8 (3.8%) | 10 (4.9%) |
| $22,500 to $24,999 | 0 (0.0%) | 4 (1.9%) |
| $25,000 to $29,999 | 4 (1.9%) | 8 (3.9%) |
| $30,000 to $34,999 | 15 (7.1%) | 14 (6.8%) |
| $35,000 to $39,999 | 14 (6.6%) | 13 (6.3%) |
| $40,000 to $44,999 | 2 (0.9%) | 18 (8.8%) |
| $45,000 to $49,999 | 18 (8.5%) | 10 (4.9%) |
| $50,000 to $54,999 | 22 (10.4%) | 10 (4.9%) |
| $55,000 to $64,999 | 17 (8.1%) | 30 (14.6%) |
| $65,000 to $74,999 | 19 (9.0%) | 15 (7.3%) |
| $75,000 to $99,999 | 45 (21.3%) | 24 (11.7%) |
| $100,000+ | 22 (10.4%) | 7 (3.4%) |
| Total | 211 (100.0%) | 205 (100.0%) |
Earnings by Sex by Educational Attainment in Gifford
Average earnings in Gifford are $58,393 for men and $44,375 for women, a difference of 24.0%. Men with an educational attainment of graduate degree enjoy the highest average annual earnings of $76,667, while those with high school diploma education earn the least with $54,821. Women with an educational attainment of graduate degree earn the most with the average annual earnings of $64,821, while those with high school diploma education have the smallest earnings of $32,188.
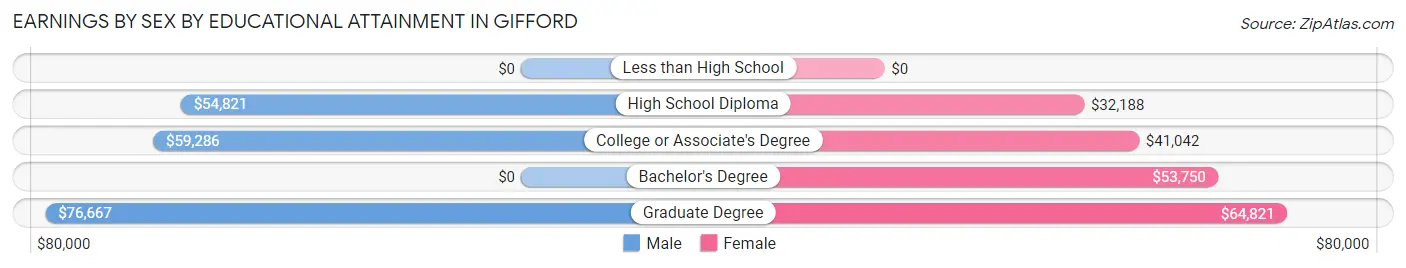
| Educational Attainment | Male Income | Female Income |
| Less than High School | - | - |
| High School Diploma | $54,821 | $32,188 |
| College or Associate's Degree | $59,286 | $41,042 |
| Bachelor's Degree | - | - |
| Graduate Degree | $76,667 | $64,821 |
| Total | $58,393 | $44,375 |
Family Income in Gifford
Family Income Brackets in Gifford
According to the Gifford family income data, there are 57 families falling into the $75,000 to $99,999 income range, which is the most common income bracket and makes up 27.5% of all families.
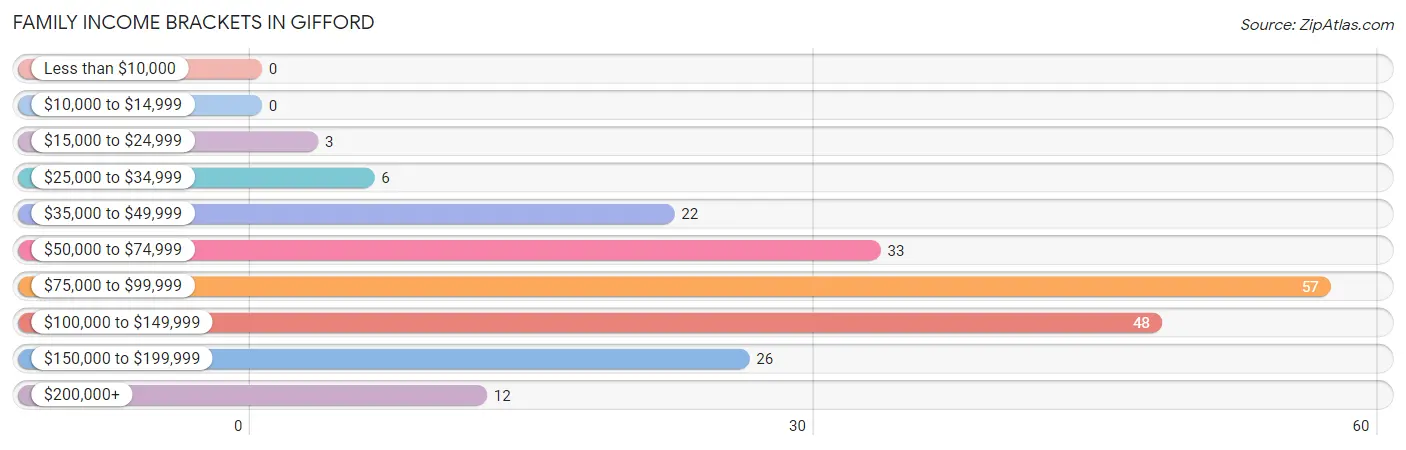
| Income Bracket | # Families | % Families |
| Less than $10,000 | 0 | 0.0% |
| $10,000 to $14,999 | 0 | 0.0% |
| $15,000 to $24,999 | 3 | 1.4% |
| $25,000 to $34,999 | 6 | 2.9% |
| $35,000 to $49,999 | 22 | 10.6% |
| $50,000 to $74,999 | 33 | 15.9% |
| $75,000 to $99,999 | 57 | 27.5% |
| $100,000 to $149,999 | 48 | 23.2% |
| $150,000 to $199,999 | 26 | 12.6% |
| $200,000+ | 12 | 5.8% |
Family Income by Famaliy Size in Gifford
4-person families (28 | 13.5%) account for the highest median family income in Gifford with $126,563 per family, while 2-person families (134 | 64.7%) have the highest median income of $42,500 per family member.
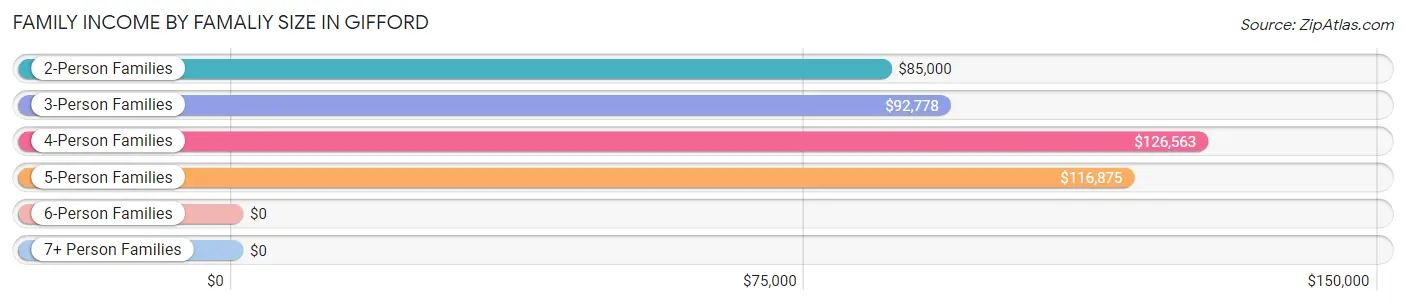
| Income Bracket | # Families | Median Income |
| 2-Person Families | 134 (64.7%) | $85,000 |
| 3-Person Families | 38 (18.4%) | $92,778 |
| 4-Person Families | 28 (13.5%) | $126,563 |
| 5-Person Families | 7 (3.4%) | $116,875 |
| 6-Person Families | 0 (0.0%) | $0 |
| 7+ Person Families | 0 (0.0%) | $0 |
| Total | 207 (100.0%) | $91,875 |
Family Income by Number of Earners in Gifford
The median family income in Gifford is $91,875, with families comprising 3+ earners (7) having the highest median family income of $208,125, while families with no earners (26) have the lowest median family income of $53,929, accounting for 3.4% and 12.6% of families, respectively.
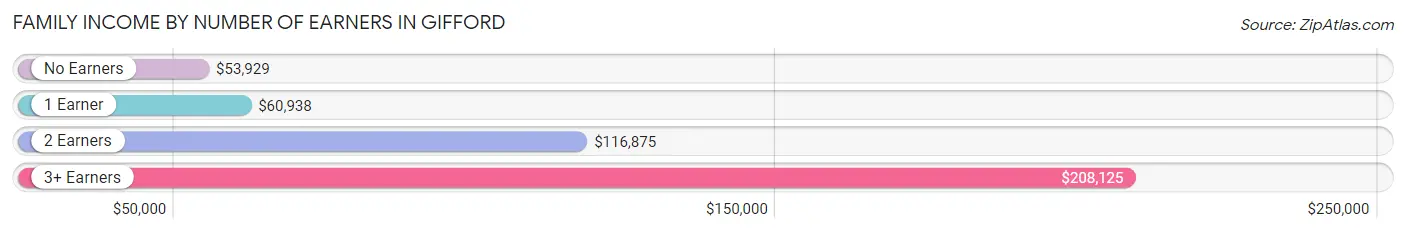
| Number of Earners | # Families | Median Income |
| No Earners | 26 (12.6%) | $53,929 |
| 1 Earner | 49 (23.7%) | $60,938 |
| 2 Earners | 125 (60.4%) | $116,875 |
| 3+ Earners | 7 (3.4%) | $208,125 |
| Total | 207 (100.0%) | $91,875 |
Household Income in Gifford
Household Income Brackets in Gifford
With 82 households falling in the category, the $75,000 to $99,999 income range is the most frequent in Gifford, accounting for 23.4% of all households. In contrast, only 2 households (0.6%) fall into the $10,000 to $14,999 income bracket, making it the least populous group.
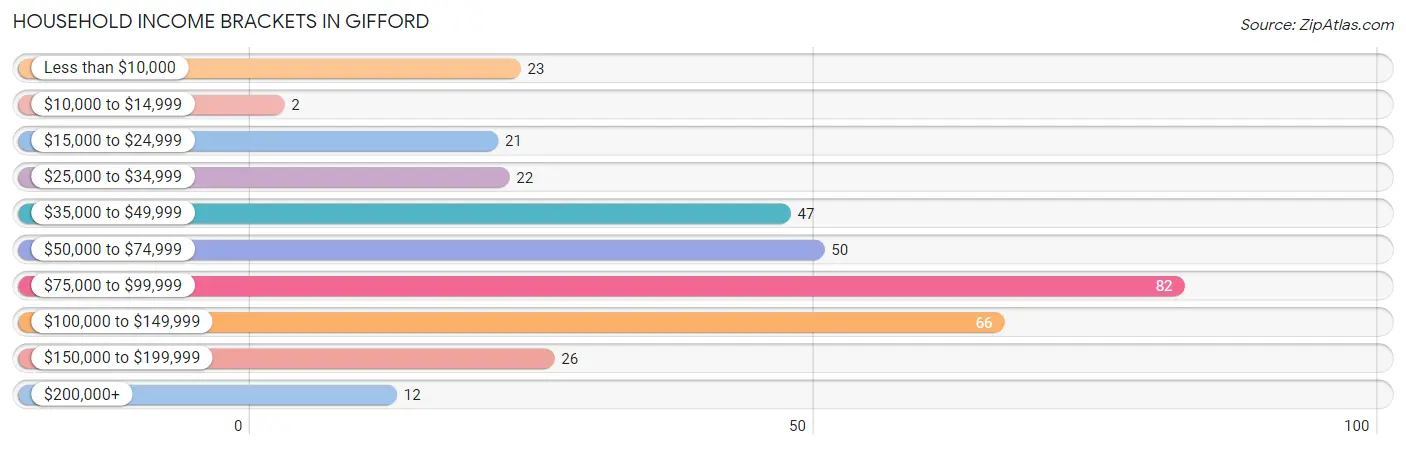
| Income Bracket | # Households | % Households |
| Less than $10,000 | 23 | 6.6% |
| $10,000 to $14,999 | 2 | 0.6% |
| $15,000 to $24,999 | 21 | 6.0% |
| $25,000 to $34,999 | 22 | 6.3% |
| $35,000 to $49,999 | 47 | 13.4% |
| $50,000 to $74,999 | 50 | 14.2% |
| $75,000 to $99,999 | 82 | 23.4% |
| $100,000 to $149,999 | 66 | 18.8% |
| $150,000 to $199,999 | 26 | 7.4% |
| $200,000+ | 12 | 3.4% |
Household Income by Householder Age in Gifford
The median household income in Gifford is $76,382, with the highest median household income of $109,375 found in the 45 to 64 years age bracket for the primary householder. A total of 137 households (39.0%) fall into this category. Meanwhile, the 15 to 24 years age bracket for the primary householder has the lowest median household income of $0, with 11 households (3.1%) in this group.
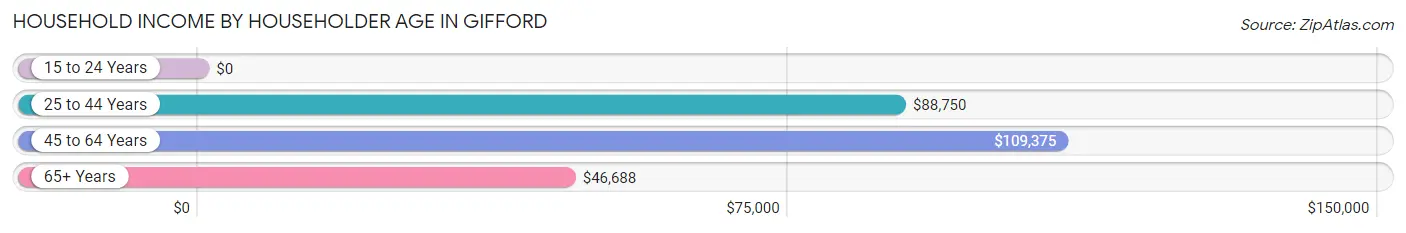
| Income Bracket | # Households | Median Income |
| 15 to 24 Years | 11 (3.1%) | $0 |
| 25 to 44 Years | 66 (18.8%) | $88,750 |
| 45 to 64 Years | 137 (39.0%) | $109,375 |
| 65+ Years | 137 (39.0%) | $46,688 |
| Total | 351 (100.0%) | $76,382 |
Poverty in Gifford
Income Below Poverty by Sex and Age in Gifford
With 6.3% poverty level for males and 4.9% for females among the residents of Gifford, 55 to 64 year old males and 18 to 24 year old females are the most vulnerable to poverty, with 11 males (27.5%) and 3 females (21.4%) in their respective age groups living below the poverty level.
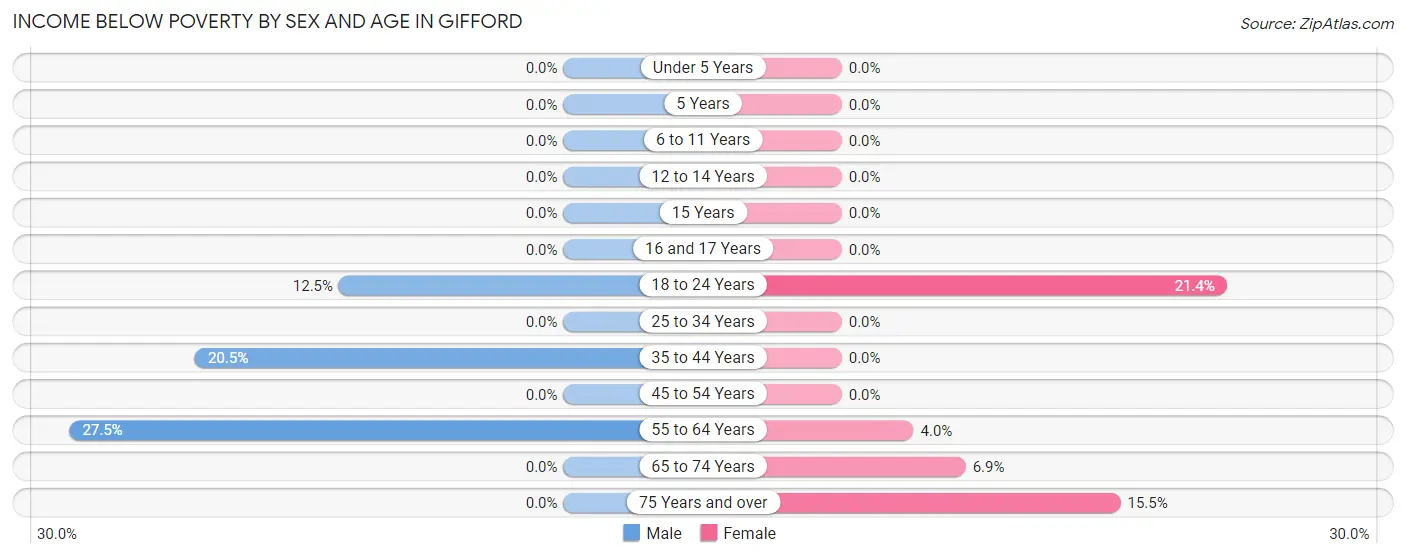
| Age Bracket | Male | Female |
| Under 5 Years | 0 (0.0%) | 0 (0.0%) |
| 5 Years | 0 (0.0%) | 0 (0.0%) |
| 6 to 11 Years | 0 (0.0%) | 0 (0.0%) |
| 12 to 14 Years | 0 (0.0%) | 0 (0.0%) |
| 15 Years | 0 (0.0%) | 0 (0.0%) |
| 16 and 17 Years | 0 (0.0%) | 0 (0.0%) |
| 18 to 24 Years | 3 (12.5%) | 3 (21.4%) |
| 25 to 34 Years | 0 (0.0%) | 0 (0.0%) |
| 35 to 44 Years | 8 (20.5%) | 0 (0.0%) |
| 45 to 54 Years | 0 (0.0%) | 0 (0.0%) |
| 55 to 64 Years | 11 (27.5%) | 2 (4.0%) |
| 65 to 74 Years | 0 (0.0%) | 4 (6.9%) |
| 75 Years and over | 0 (0.0%) | 9 (15.5%) |
| Total | 22 (6.3%) | 18 (4.9%) |
Income Above Poverty by Sex and Age in Gifford
According to the poverty statistics in Gifford, males aged under 5 years and females aged under 5 years are the age groups that are most secure financially, with 100.0% of males and 100.0% of females in these age groups living above the poverty line.
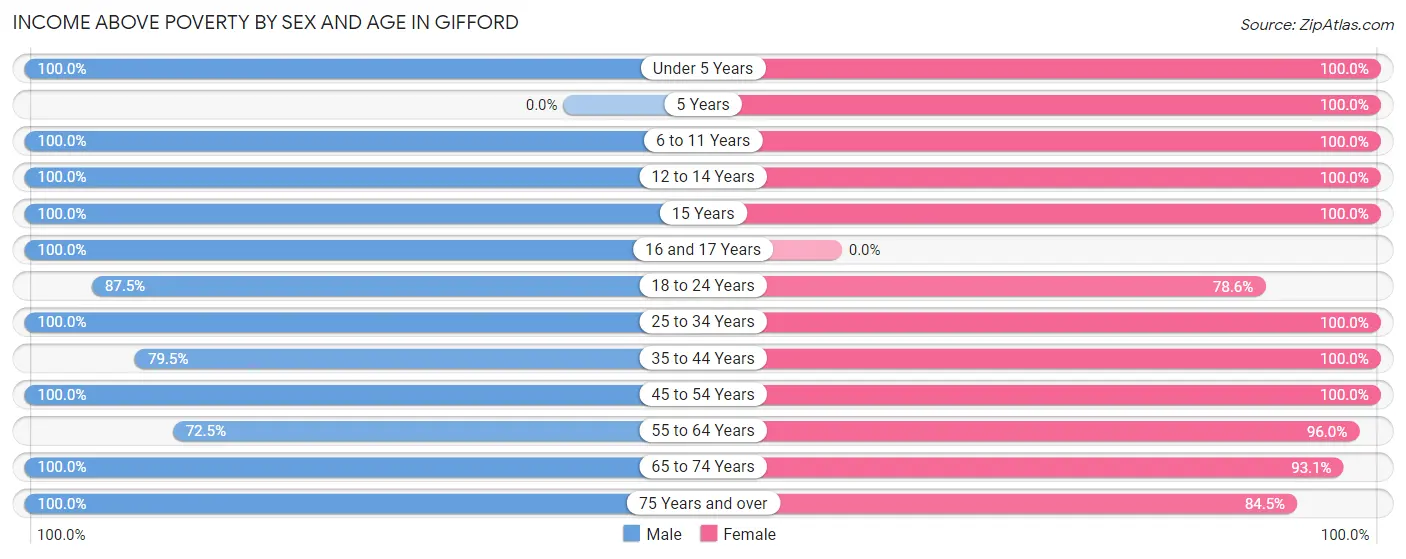
| Age Bracket | Male | Female |
| Under 5 Years | 9 (100.0%) | 24 (100.0%) |
| 5 Years | 0 (0.0%) | 3 (100.0%) |
| 6 to 11 Years | 19 (100.0%) | 7 (100.0%) |
| 12 to 14 Years | 12 (100.0%) | 12 (100.0%) |
| 15 Years | 6 (100.0%) | 4 (100.0%) |
| 16 and 17 Years | 15 (100.0%) | 0 (0.0%) |
| 18 to 24 Years | 21 (87.5%) | 11 (78.6%) |
| 25 to 34 Years | 30 (100.0%) | 40 (100.0%) |
| 35 to 44 Years | 31 (79.5%) | 34 (100.0%) |
| 45 to 54 Years | 86 (100.0%) | 62 (100.0%) |
| 55 to 64 Years | 29 (72.5%) | 48 (96.0%) |
| 65 to 74 Years | 38 (100.0%) | 54 (93.1%) |
| 75 Years and over | 32 (100.0%) | 49 (84.5%) |
| Total | 328 (93.7%) | 348 (95.1%) |
Income Below Poverty Among Married-Couple Families in Gifford
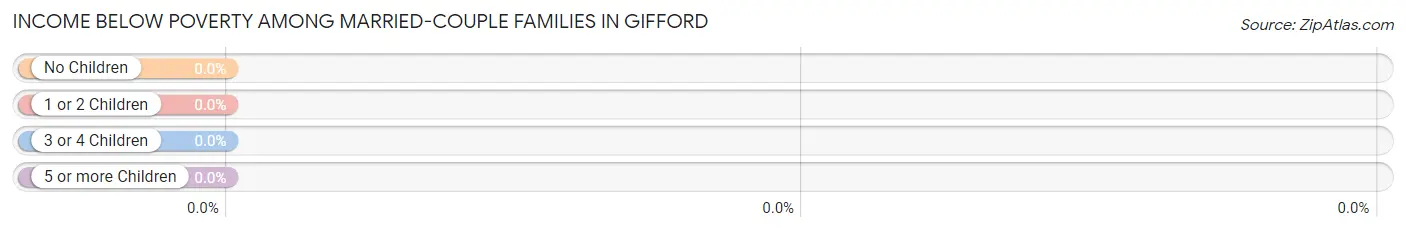
| Children | Above Poverty | Below Poverty |
| No Children | 118 (100.0%) | 0 (0.0%) |
| 1 or 2 Children | 45 (100.0%) | 0 (0.0%) |
| 3 or 4 Children | 7 (100.0%) | 0 (0.0%) |
| 5 or more Children | 0 (0.0%) | 0 (0.0%) |
| Total | 170 (100.0%) | 0 (0.0%) |
Income Below Poverty Among Single-Parent Households in Gifford
| Children | Single Father | Single Mother |
| No Children | 0 (0.0%) | 0 (0.0%) |
| 1 or 2 Children | 0 (0.0%) | 0 (0.0%) |
| 3 or 4 Children | 0 (0.0%) | 0 (0.0%) |
| 5 or more Children | 0 (0.0%) | 0 (0.0%) |
| Total | 0 (0.0%) | 0 (0.0%) |
Income Below Poverty Among Married-Couple vs Single-Parent Households in Gifford
| Children | Married-Couple Families | Single-Parent Households |
| No Children | 0 (0.0%) | 0 (0.0%) |
| 1 or 2 Children | 0 (0.0%) | 0 (0.0%) |
| 3 or 4 Children | 0 (0.0%) | 0 (0.0%) |
| 5 or more Children | 0 (0.0%) | 0 (0.0%) |
| Total | 0 (0.0%) | 0 (0.0%) |
Race in Gifford
The most populous races in Gifford are White / Caucasian (748 | 90.4%), Two or more Races (67 | 8.1%), and Black / African American (12 | 1.5%).
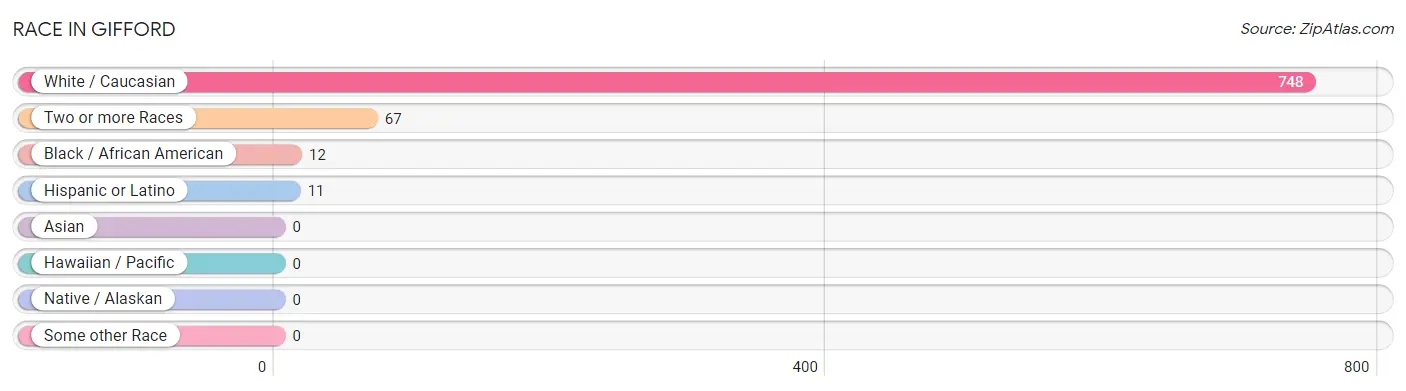
| Race | # Population | % Population |
| Asian | 0 | 0.0% |
| Black / African American | 12 | 1.5% |
| Hawaiian / Pacific | 0 | 0.0% |
| Hispanic or Latino | 11 | 1.3% |
| Native / Alaskan | 0 | 0.0% |
| White / Caucasian | 748 | 90.4% |
| Two or more Races | 67 | 8.1% |
| Some other Race | 0 | 0.0% |
| Total | 827 | 100.0% |
Ancestry in Gifford
The most populous ancestries reported in Gifford are German (227 | 27.5%), Irish (117 | 14.1%), English (52 | 6.3%), American (32 | 3.9%), and Swedish (32 | 3.9%), together accounting for 55.6% of all Gifford residents.
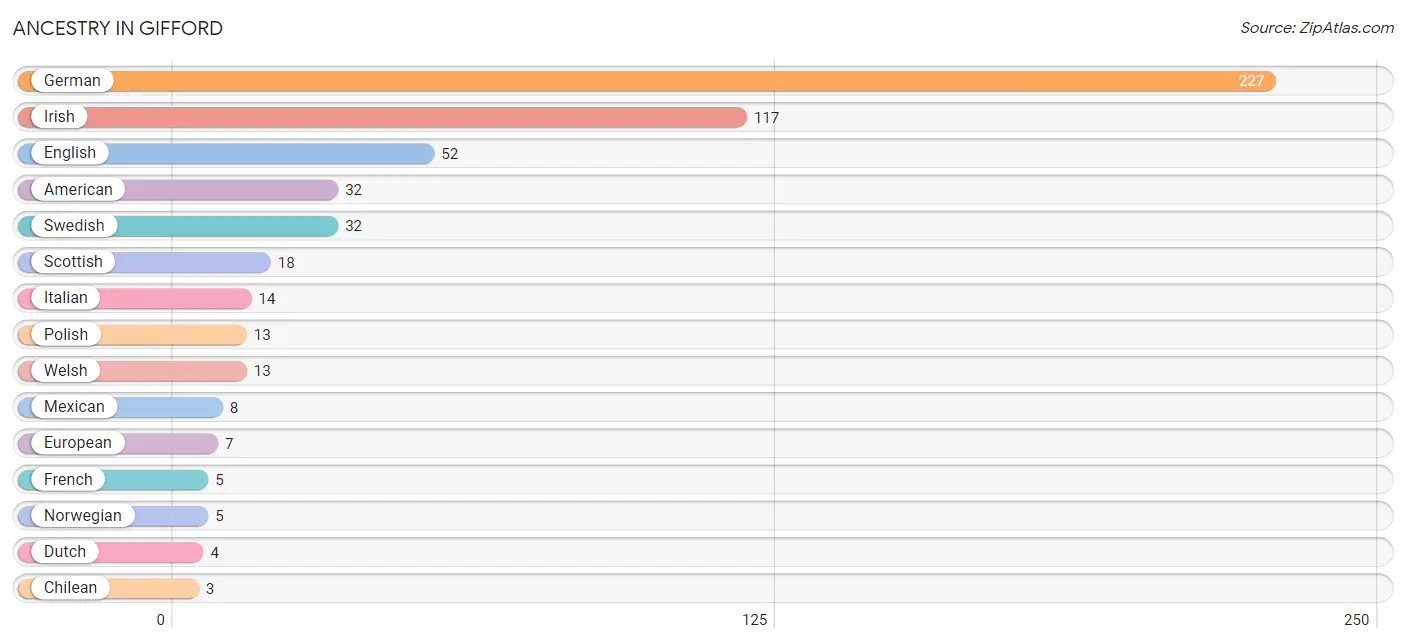
| Ancestry | # Population | % Population |
| American | 32 | 3.9% |
| Chilean | 3 | 0.4% |
| Czechoslovakian | 2 | 0.2% |
| Dutch | 4 | 0.5% |
| English | 52 | 6.3% |
| European | 7 | 0.9% |
| French | 5 | 0.6% |
| German | 227 | 27.5% |
| Irish | 117 | 14.1% |
| Italian | 14 | 1.7% |
| Mexican | 8 | 1.0% |
| Northern European | 1 | 0.1% |
| Norwegian | 5 | 0.6% |
| Pennsylvania German | 2 | 0.2% |
| Polish | 13 | 1.6% |
| Romanian | 3 | 0.4% |
| Russian | 2 | 0.2% |
| Scottish | 18 | 2.2% |
| South American | 3 | 0.4% |
| Swedish | 32 | 3.9% |
| Welsh | 13 | 1.6% | View All 21 Rows |
Immigrants in Gifford
The most numerous immigrant groups reported in Gifford came from Chile (3 | 0.4%), Latin America (3 | 0.4%), and South America (3 | 0.4%), together accounting for 1.1% of all Gifford residents.
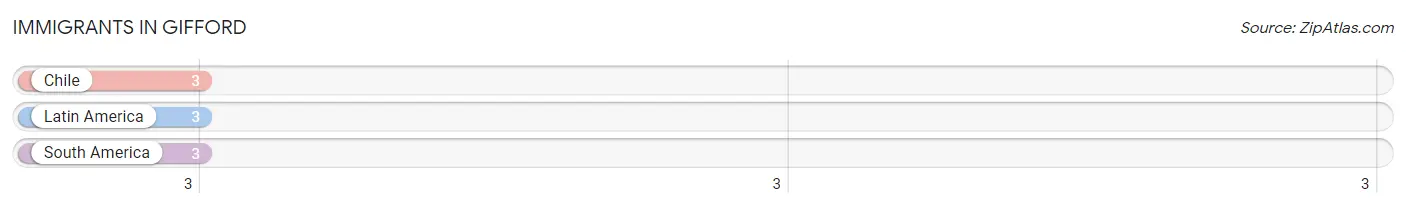
| Immigration Origin | # Population | % Population |
| Chile | 3 | 0.4% |
| Latin America | 3 | 0.4% |
| South America | 3 | 0.4% | View All 3 Rows |
Sex and Age in Gifford
Sex and Age in Gifford
The most populous age groups in Gifford are 50 to 54 Years (47 | 12.0%) for men and 85 Years and over (76 | 17.5%) for women.
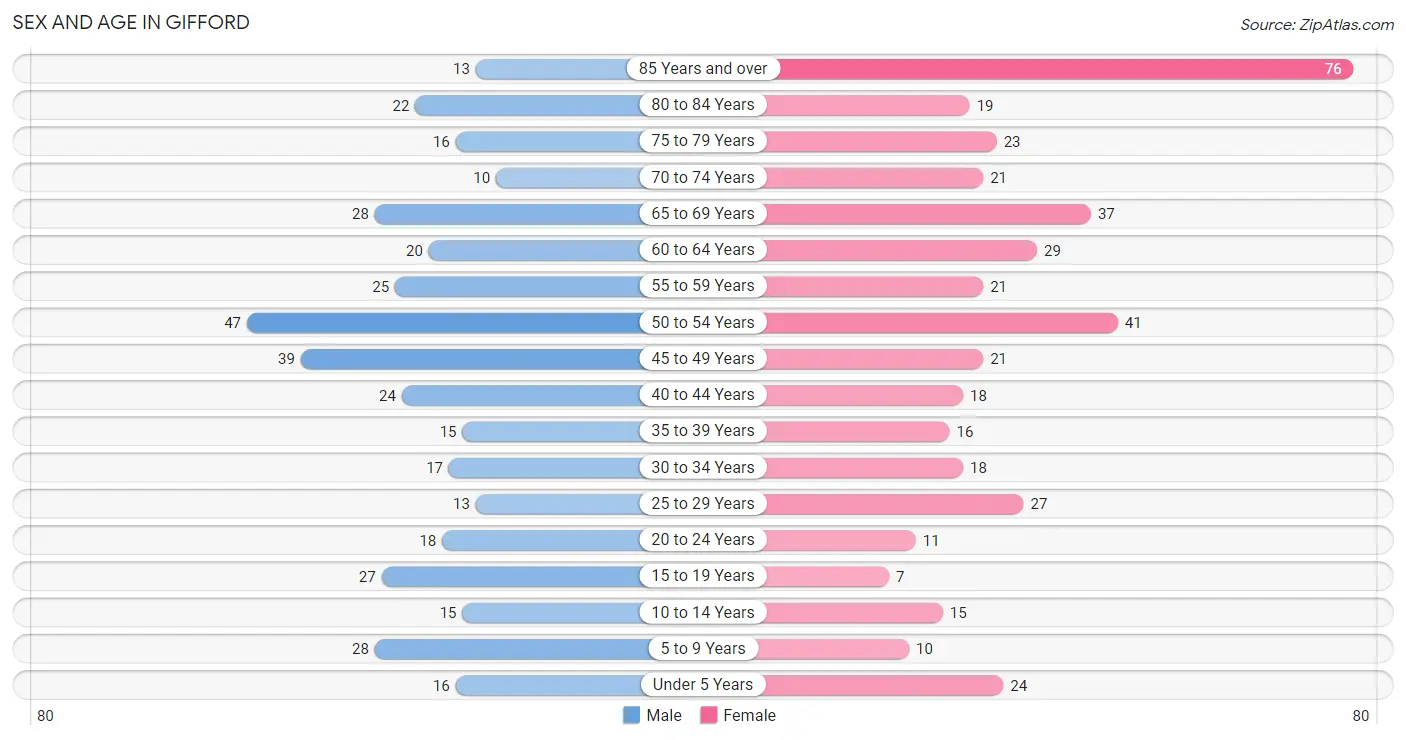
| Age Bracket | Male | Female |
| Under 5 Years | 16 (4.1%) | 24 (5.5%) |
| 5 to 9 Years | 28 (7.1%) | 10 (2.3%) |
| 10 to 14 Years | 15 (3.8%) | 15 (3.5%) |
| 15 to 19 Years | 27 (6.9%) | 7 (1.6%) |
| 20 to 24 Years | 18 (4.6%) | 11 (2.5%) |
| 25 to 29 Years | 13 (3.3%) | 27 (6.2%) |
| 30 to 34 Years | 17 (4.3%) | 18 (4.2%) |
| 35 to 39 Years | 15 (3.8%) | 16 (3.7%) |
| 40 to 44 Years | 24 (6.1%) | 18 (4.2%) |
| 45 to 49 Years | 39 (9.9%) | 21 (4.8%) |
| 50 to 54 Years | 47 (12.0%) | 41 (9.5%) |
| 55 to 59 Years | 25 (6.4%) | 21 (4.8%) |
| 60 to 64 Years | 20 (5.1%) | 29 (6.7%) |
| 65 to 69 Years | 28 (7.1%) | 37 (8.5%) |
| 70 to 74 Years | 10 (2.5%) | 21 (4.8%) |
| 75 to 79 Years | 16 (4.1%) | 23 (5.3%) |
| 80 to 84 Years | 22 (5.6%) | 19 (4.4%) |
| 85 Years and over | 13 (3.3%) | 76 (17.5%) |
| Total | 393 (100.0%) | 434 (100.0%) |
Families and Households in Gifford
Median Family Size in Gifford
The median family size in Gifford is 2.58 persons per family, with single male/father families (9 | 4.3%) accounting for the largest median family size of 3.44 persons per family. On the other hand, single female/mother families (28 | 13.5%) represent the smallest median family size with 2.39 persons per family.
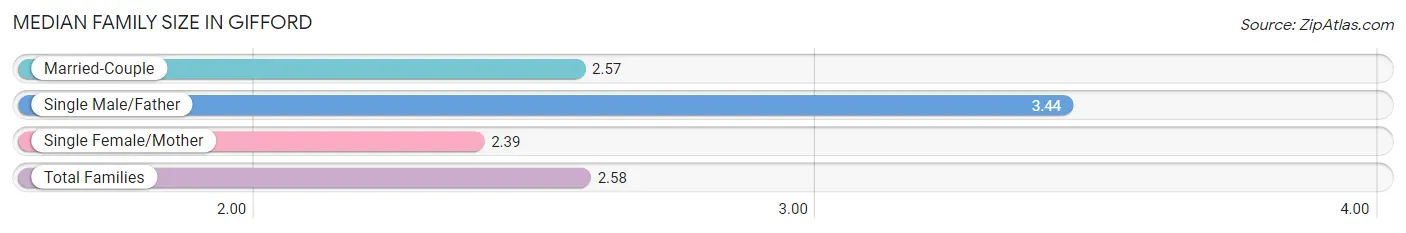
| Family Type | # Families | Family Size |
| Married-Couple | 170 (82.1%) | 2.57 |
| Single Male/Father | 9 (4.3%) | 3.44 |
| Single Female/Mother | 28 (13.5%) | 2.39 |
| Total Families | 207 (100.0%) | 2.58 |
Median Household Size in Gifford
The median household size in Gifford is 2.10 persons per household, with single male/father households (9 | 2.6%) accounting for the largest median household size of 6.78 persons per household. non-family households (144 | 41.0%) represent the smallest median household size with 1.17 persons per household.
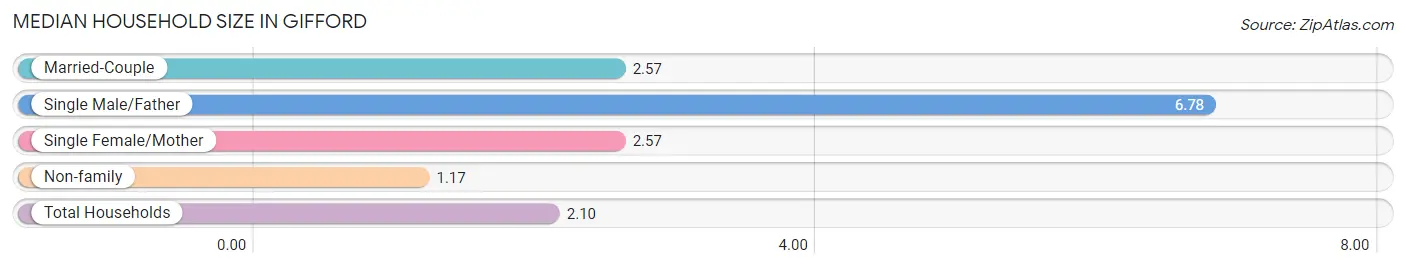
| Household Type | # Households | Household Size |
| Married-Couple | 170 (48.4%) | 2.57 |
| Single Male/Father | 9 (2.6%) | 6.78 |
| Single Female/Mother | 28 (8.0%) | 2.57 |
| Non-family | 144 (41.0%) | 1.17 |
| Total Households | 351 (100.0%) | 2.10 |
Household Size by Marriage Status in Gifford
Out of a total of 351 households in Gifford, 207 (59.0%) are family households, while 144 (41.0%) are nonfamily households. The most numerous type of family households are 2-person households, comprising 128, and the most common type of nonfamily households are 1-person households, comprising 124.
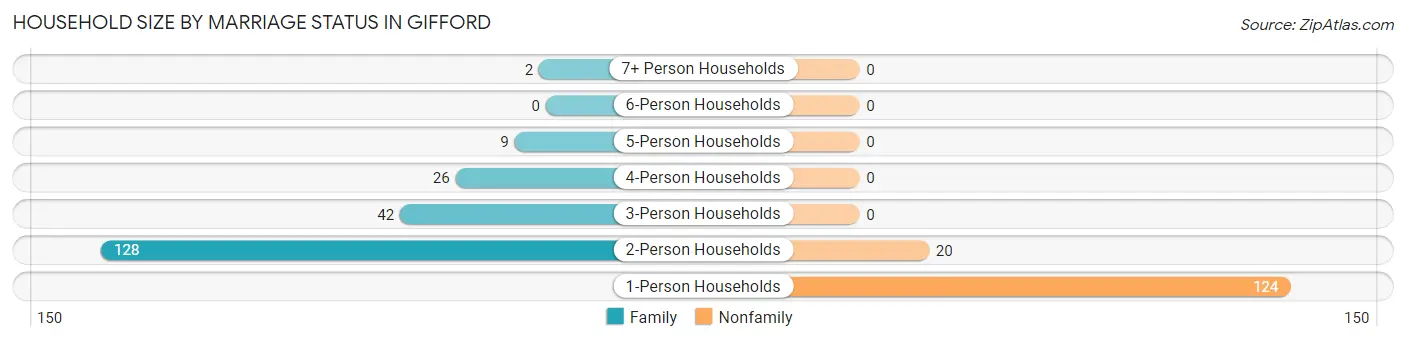
| Household Size | Family Households | Nonfamily Households |
| 1-Person Households | - | 124 (35.3%) |
| 2-Person Households | 128 (36.5%) | 20 (5.7%) |
| 3-Person Households | 42 (12.0%) | 0 (0.0%) |
| 4-Person Households | 26 (7.4%) | 0 (0.0%) |
| 5-Person Households | 9 (2.6%) | 0 (0.0%) |
| 6-Person Households | 0 (0.0%) | 0 (0.0%) |
| 7+ Person Households | 2 (0.6%) | 0 (0.0%) |
| Total | 207 (59.0%) | 144 (41.0%) |
Female Fertility in Gifford
Fertility by Age in Gifford
Average fertility rate in Gifford is 57.0 births per 1,000 women. Women in the age bracket of 20 to 34 years have the highest fertility rate with 71.0 births per 1,000 women. Women in the age bracket of 20 to 34 years acount for 57.1% of all women with births.
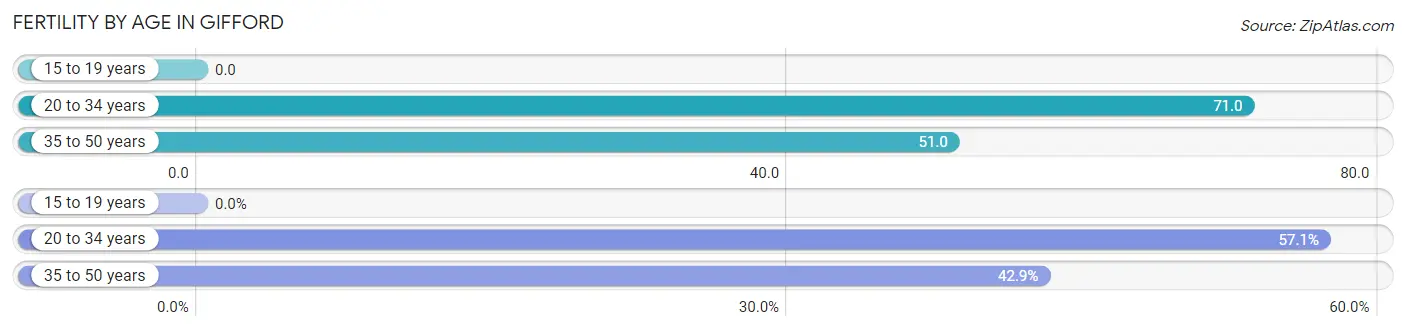
| Age Bracket | Women with Births | Births / 1,000 Women |
| 15 to 19 years | 0 (0.0%) | 0.0 |
| 20 to 34 years | 4 (57.1%) | 71.0 |
| 35 to 50 years | 3 (42.9%) | 51.0 |
| Total | 7 (100.0%) | 57.0 |
Fertility by Age by Marriage Status in Gifford
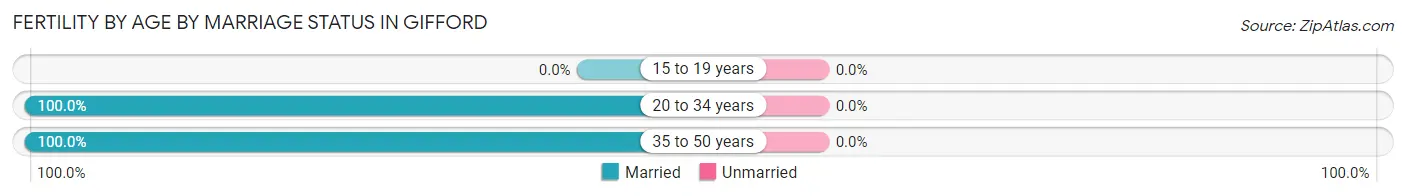
| Age Bracket | Married | Unmarried |
| 15 to 19 years | 0 (0.0%) | 0 (0.0%) |
| 20 to 34 years | 4 (100.0%) | 0 (0.0%) |
| 35 to 50 years | 3 (100.0%) | 0 (0.0%) |
| Total | 7 (100.0%) | 0 (0.0%) |
Fertility by Education in Gifford
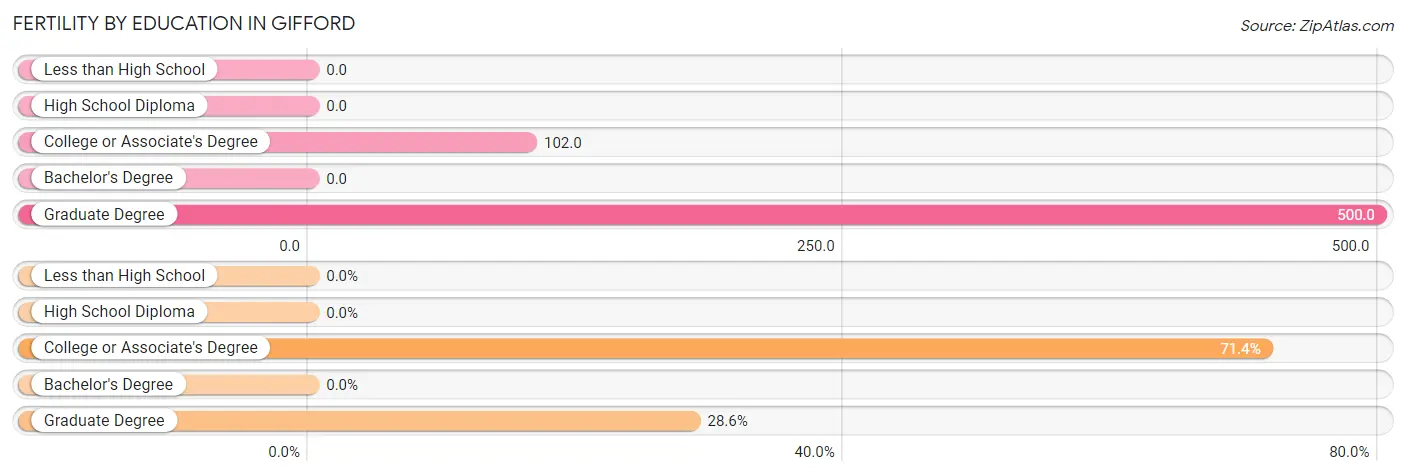
| Educational Attainment | Women with Births | Births / 1,000 Women |
| Less than High School | 0 (0.0%) | 0.0 |
| High School Diploma | 0 (0.0%) | 0.0 |
| College or Associate's Degree | 5 (71.4%) | 102.0 |
| Bachelor's Degree | 0 (0.0%) | 0.0 |
| Graduate Degree | 2 (28.6%) | 500.0 |
| Total | 7 (100.0%) | 57.0 |
Fertility by Education by Marriage Status in Gifford
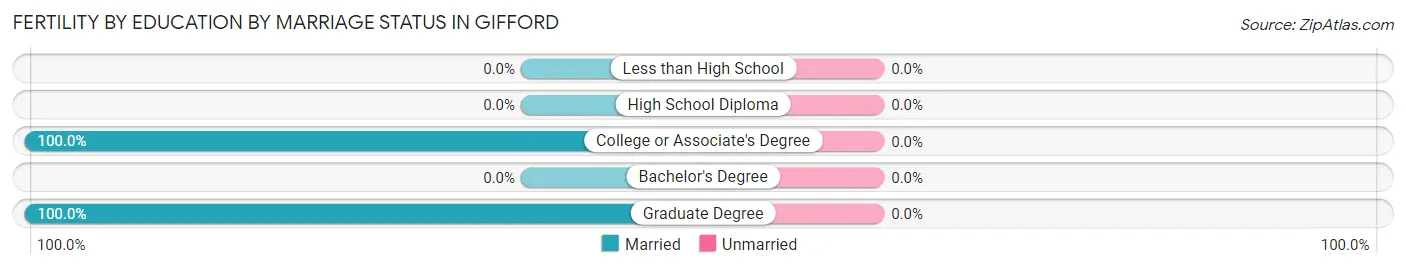
| Educational Attainment | Married | Unmarried |
| Less than High School | 0 (0.0%) | 0 (0.0%) |
| High School Diploma | 0 (0.0%) | 0 (0.0%) |
| College or Associate's Degree | 5 (100.0%) | 0 (0.0%) |
| Bachelor's Degree | 0 (0.0%) | 0 (0.0%) |
| Graduate Degree | 2 (100.0%) | 0 (0.0%) |
| Total | 7 (100.0%) | 0 (0.0%) |
Employment Characteristics in Gifford
Employment by Class of Employer in Gifford
Among the 395 employed individuals in Gifford, private company employees (266 | 67.3%), state government employees (42 | 10.6%), and local government employees (32 | 8.1%) make up the most common classes of employment.
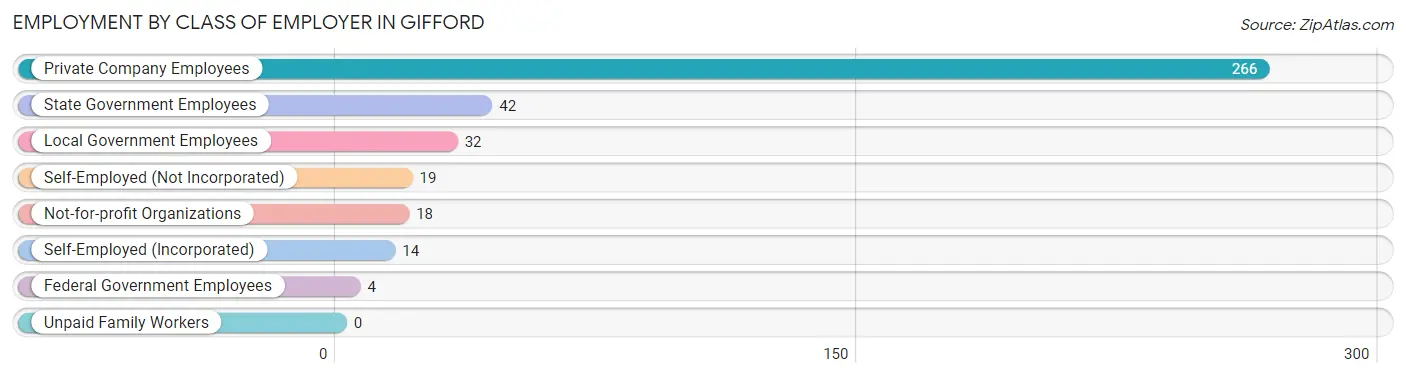
| Employer Class | # Employees | % Employees |
| Private Company Employees | 266 | 67.3% |
| Self-Employed (Incorporated) | 14 | 3.5% |
| Self-Employed (Not Incorporated) | 19 | 4.8% |
| Not-for-profit Organizations | 18 | 4.6% |
| Local Government Employees | 32 | 8.1% |
| State Government Employees | 42 | 10.6% |
| Federal Government Employees | 4 | 1.0% |
| Unpaid Family Workers | 0 | 0.0% |
| Total | 395 | 100.0% |
Employment Status by Age in Gifford
According to the labor force statistics for Gifford, out of the total population over 16 years of age (709), 57.7% or 409 individuals are in the labor force, with 1.5% or 6 of them unemployed. The age group with the highest labor force participation rate is 25 to 29 years, with 100.0% or 40 individuals in the labor force. Within the labor force, the 55 to 59 years age range has the highest percentage of unemployed individuals, with 10.5% or 4 of them being unemployed.
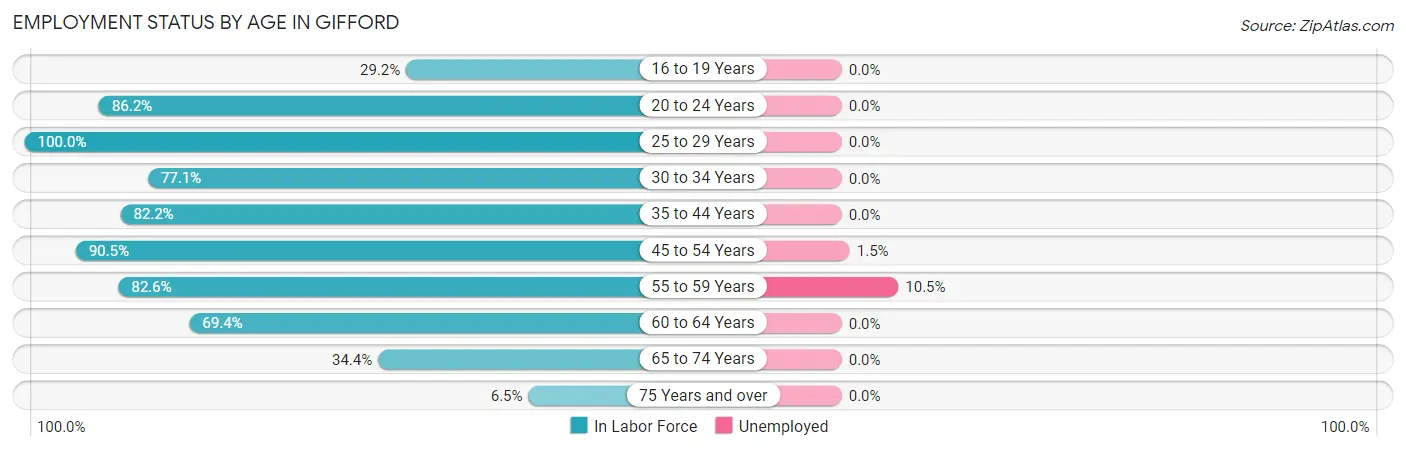
| Age Bracket | In Labor Force | Unemployed |
| 16 to 19 Years | 7 (29.2%) | 0 (0.0%) |
| 20 to 24 Years | 25 (86.2%) | 0 (0.0%) |
| 25 to 29 Years | 40 (100.0%) | 0 (0.0%) |
| 30 to 34 Years | 27 (77.1%) | 0 (0.0%) |
| 35 to 44 Years | 60 (82.2%) | 0 (0.0%) |
| 45 to 54 Years | 134 (90.5%) | 2 (1.5%) |
| 55 to 59 Years | 38 (82.6%) | 4 (10.5%) |
| 60 to 64 Years | 34 (69.4%) | 0 (0.0%) |
| 65 to 74 Years | 33 (34.4%) | 0 (0.0%) |
| 75 Years and over | 11 (6.5%) | 0 (0.0%) |
| Total | 409 (57.7%) | 6 (1.5%) |
Employment Status by Educational Attainment in Gifford
According to labor force statistics for Gifford, 85.2% of individuals (333) out of the total population between 25 and 64 years of age (391) are in the labor force, with 1.8% or 6 of them being unemployed. The group with the highest labor force participation rate are those with the educational attainment of bachelor's degree or higher, with 90.3% or 56 individuals in the labor force. Within the labor force, individuals with bachelor's degree or higher education have the highest percentage of unemployment, with 7.1% or 4 of them being unemployed.
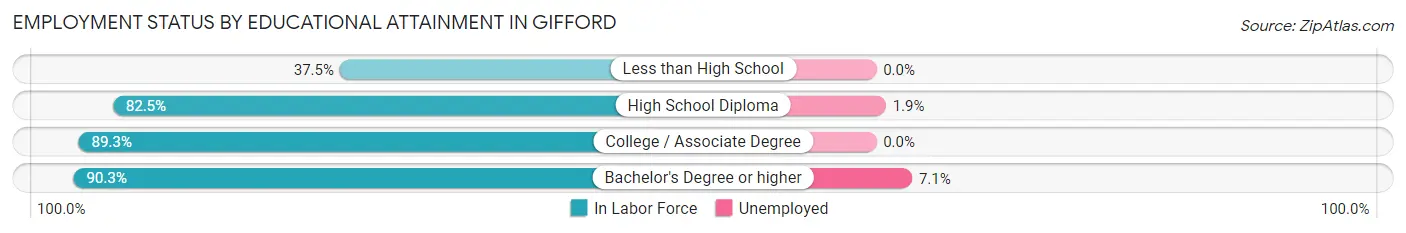
| Educational Attainment | In Labor Force | Unemployed |
| Less than High School | 6 (37.5%) | 0 (0.0%) |
| High School Diploma | 104 (82.5%) | 2 (1.9%) |
| College / Associate Degree | 167 (89.3%) | 0 (0.0%) |
| Bachelor's Degree or higher | 56 (90.3%) | 4 (7.1%) |
| Total | 333 (85.2%) | 7 (1.8%) |
Employment Occupations by Sex in Gifford
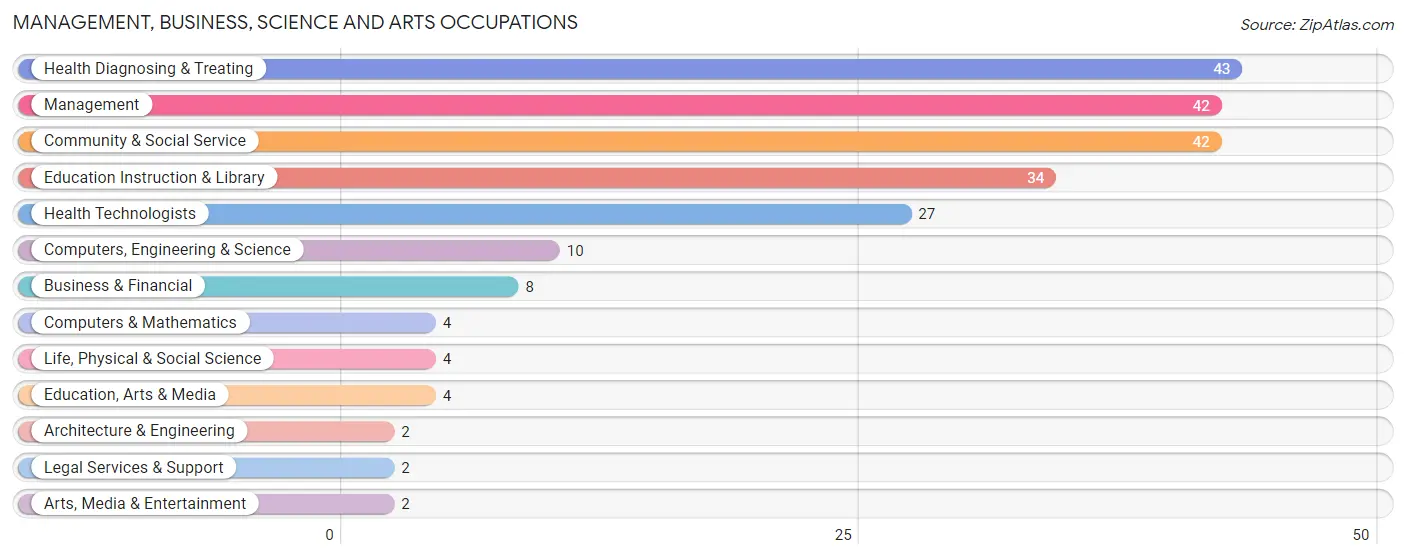
Management, Business, Science and Arts Occupations
The most common Management, Business, Science and Arts occupations in Gifford are Health Diagnosing & Treating (43 | 10.7%), Management (42 | 10.5%), Community & Social Service (42 | 10.5%), Education Instruction & Library (34 | 8.5%), and Health Technologists (27 | 6.7%).
Management, Business, Science and Arts Occupations by Sex
Within the Management, Business, Science and Arts occupations in Gifford, the most male-oriented occupations are Computers & Mathematics (100.0%), Architecture & Engineering (100.0%), and Arts, Media & Entertainment (100.0%), while the most female-oriented occupations are Education, Arts & Media (100.0%), Legal Services & Support (100.0%), and Health Diagnosing & Treating (86.1%).
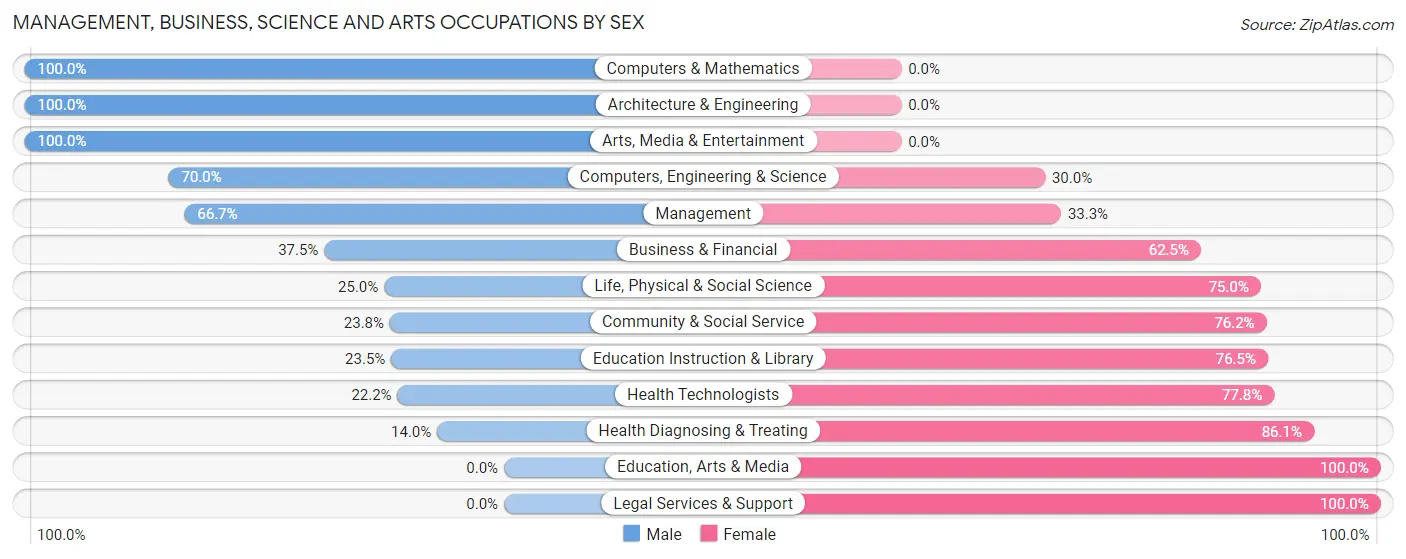
| Occupation | Male | Female |
| Management | 28 (66.7%) | 14 (33.3%) |
| Business & Financial | 3 (37.5%) | 5 (62.5%) |
| Computers, Engineering & Science | 7 (70.0%) | 3 (30.0%) |
| Computers & Mathematics | 4 (100.0%) | 0 (0.0%) |
| Architecture & Engineering | 2 (100.0%) | 0 (0.0%) |
| Life, Physical & Social Science | 1 (25.0%) | 3 (75.0%) |
| Community & Social Service | 10 (23.8%) | 32 (76.2%) |
| Education, Arts & Media | 0 (0.0%) | 4 (100.0%) |
| Legal Services & Support | 0 (0.0%) | 2 (100.0%) |
| Education Instruction & Library | 8 (23.5%) | 26 (76.5%) |
| Arts, Media & Entertainment | 2 (100.0%) | 0 (0.0%) |
| Health Diagnosing & Treating | 6 (14.0%) | 37 (86.1%) |
| Health Technologists | 6 (22.2%) | 21 (77.8%) |
| Total (Category) | 54 (37.2%) | 91 (62.8%) |
| Total (Overall) | 205 (51.1%) | 196 (48.9%) |
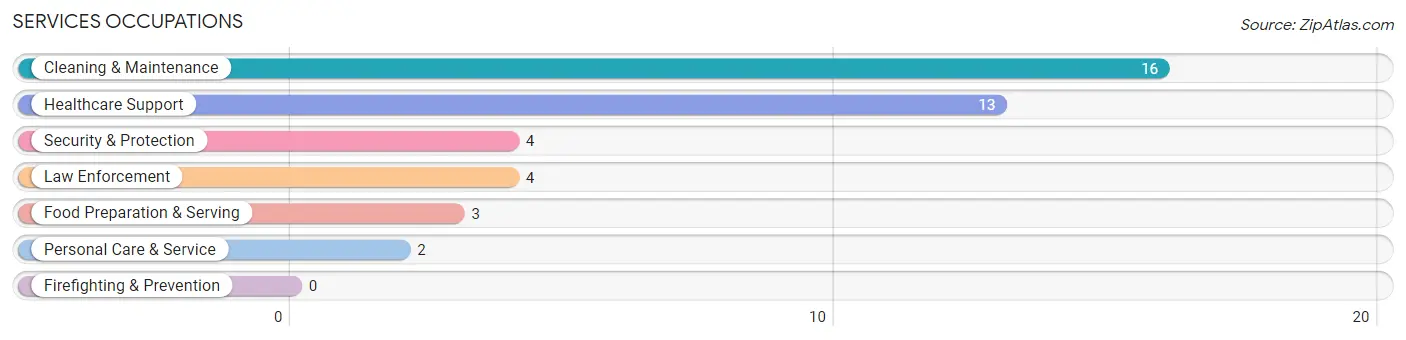
Services Occupations
The most common Services occupations in Gifford are Cleaning & Maintenance (16 | 4.0%), Healthcare Support (13 | 3.2%), Security & Protection (4 | 1.0%), Law Enforcement (4 | 1.0%), and Food Preparation & Serving (3 | 0.7%).
Services Occupations by Sex
Within the Services occupations in Gifford, the most male-oriented occupations are Food Preparation & Serving (100.0%), Cleaning & Maintenance (56.2%), and Security & Protection (50.0%), while the most female-oriented occupations are Healthcare Support (100.0%), Personal Care & Service (100.0%), and Security & Protection (50.0%).
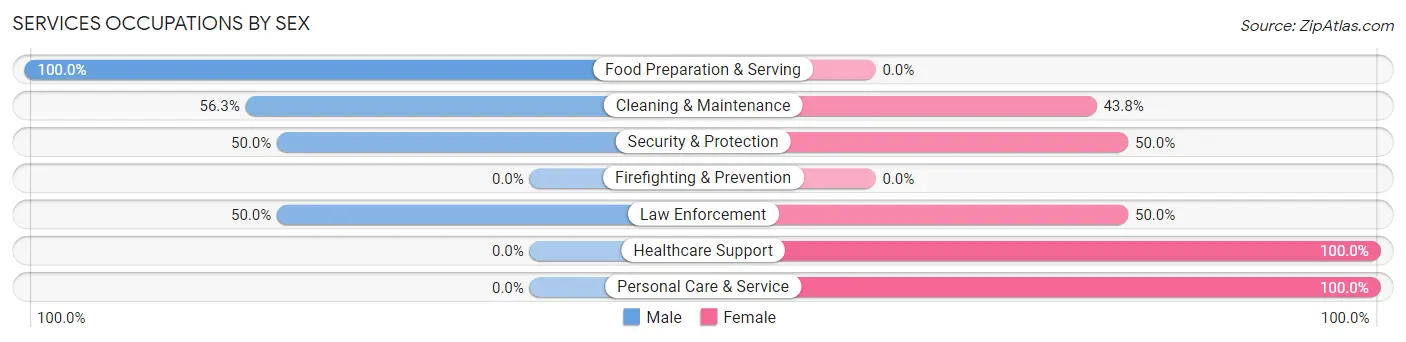
| Occupation | Male | Female |
| Healthcare Support | 0 (0.0%) | 13 (100.0%) |
| Security & Protection | 2 (50.0%) | 2 (50.0%) |
| Firefighting & Prevention | 0 (0.0%) | 0 (0.0%) |
| Law Enforcement | 2 (50.0%) | 2 (50.0%) |
| Food Preparation & Serving | 3 (100.0%) | 0 (0.0%) |
| Cleaning & Maintenance | 9 (56.2%) | 7 (43.8%) |
| Personal Care & Service | 0 (0.0%) | 2 (100.0%) |
| Total (Category) | 14 (36.8%) | 24 (63.2%) |
| Total (Overall) | 205 (51.1%) | 196 (48.9%) |
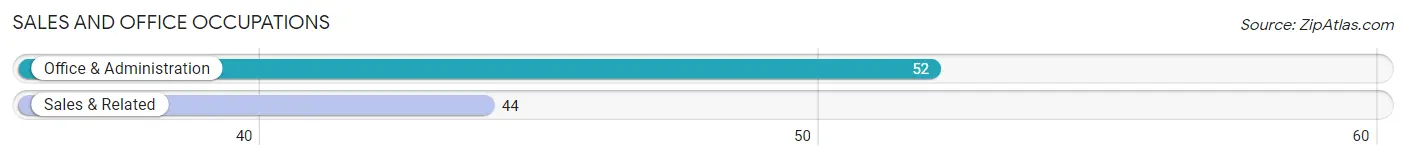
Sales and Office Occupations
The most common Sales and Office occupations in Gifford are Office & Administration (52 | 13.0%), and Sales & Related (44 | 11.0%).
Sales and Office Occupations by Sex
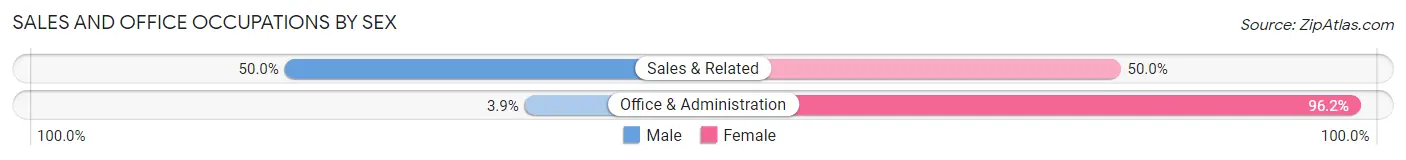
| Occupation | Male | Female |
| Sales & Related | 22 (50.0%) | 22 (50.0%) |
| Office & Administration | 2 (3.8%) | 50 (96.2%) |
| Total (Category) | 24 (25.0%) | 72 (75.0%) |
| Total (Overall) | 205 (51.1%) | 196 (48.9%) |
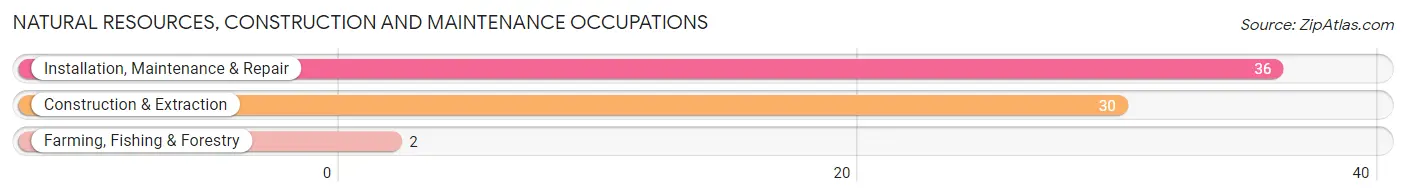
Natural Resources, Construction and Maintenance Occupations
The most common Natural Resources, Construction and Maintenance occupations in Gifford are Installation, Maintenance & Repair (36 | 9.0%), Construction & Extraction (30 | 7.5%), and Farming, Fishing & Forestry (2 | 0.5%).
Natural Resources, Construction and Maintenance Occupations by Sex
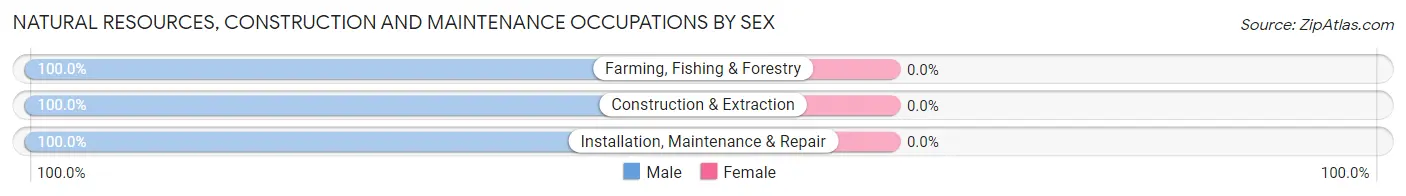
| Occupation | Male | Female |
| Farming, Fishing & Forestry | 2 (100.0%) | 0 (0.0%) |
| Construction & Extraction | 30 (100.0%) | 0 (0.0%) |
| Installation, Maintenance & Repair | 36 (100.0%) | 0 (0.0%) |
| Total (Category) | 68 (100.0%) | 0 (0.0%) |
| Total (Overall) | 205 (51.1%) | 196 (48.9%) |
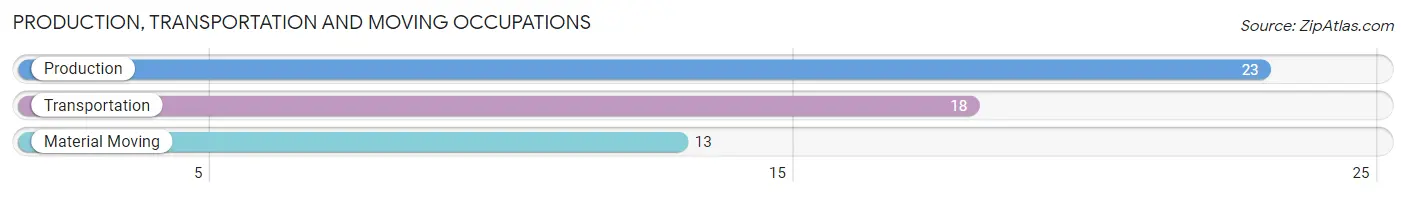
Production, Transportation and Moving Occupations
The most common Production, Transportation and Moving occupations in Gifford are Production (23 | 5.7%), Transportation (18 | 4.5%), and Material Moving (13 | 3.2%).
Production, Transportation and Moving Occupations by Sex
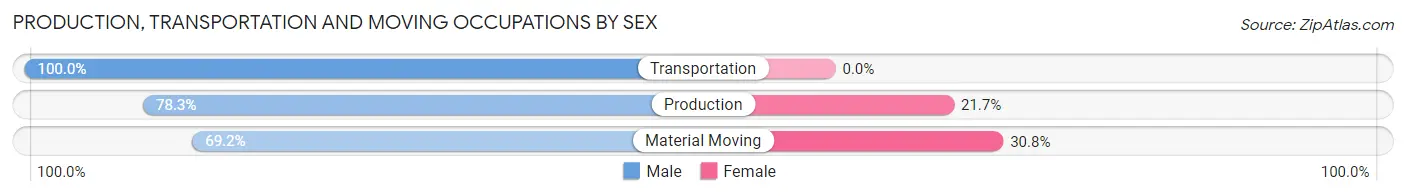
| Occupation | Male | Female |
| Production | 18 (78.3%) | 5 (21.7%) |
| Transportation | 18 (100.0%) | 0 (0.0%) |
| Material Moving | 9 (69.2%) | 4 (30.8%) |
| Total (Category) | 45 (83.3%) | 9 (16.7%) |
| Total (Overall) | 205 (51.1%) | 196 (48.9%) |
Employment Industries by Sex in Gifford
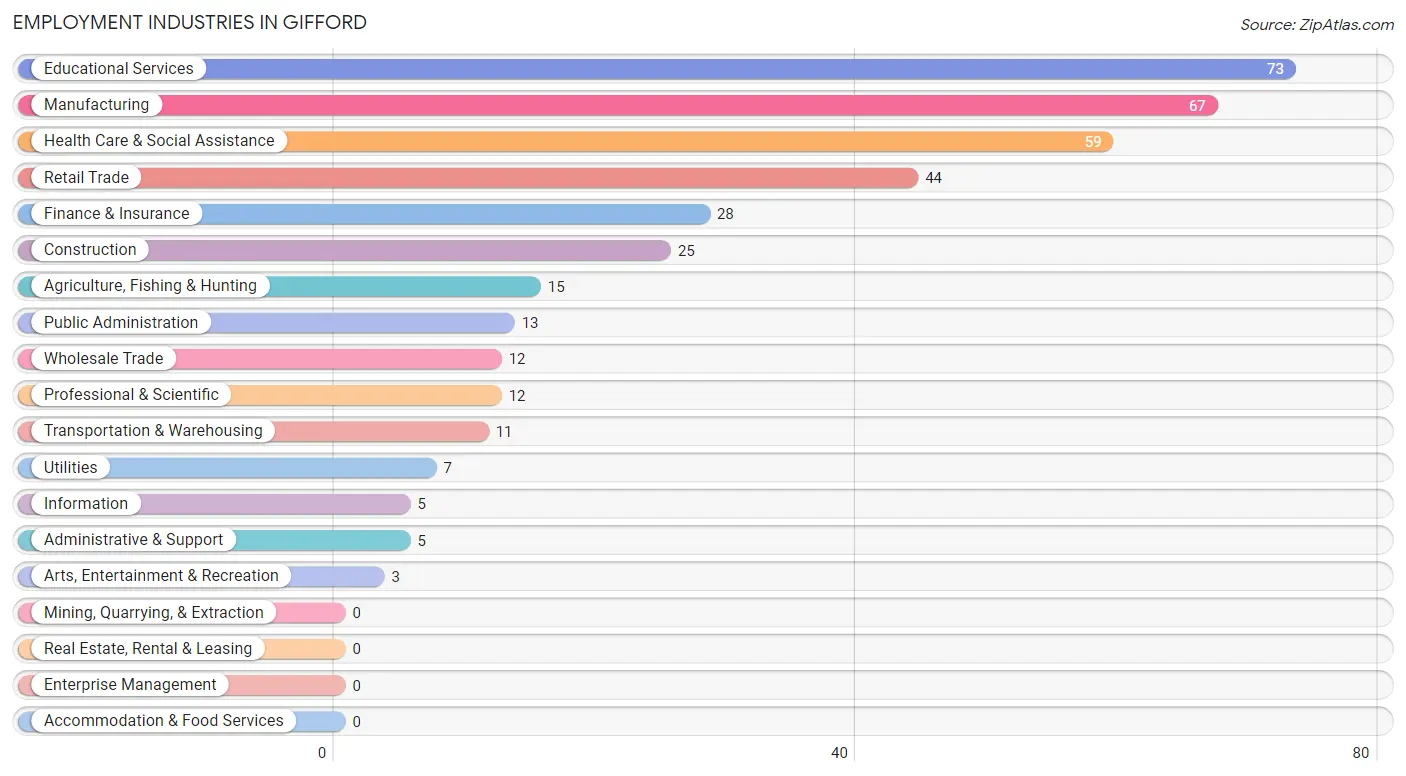
Employment Industries in Gifford
The major employment industries in Gifford include Educational Services (73 | 18.2%), Manufacturing (67 | 16.7%), Health Care & Social Assistance (59 | 14.7%), Retail Trade (44 | 11.0%), and Finance & Insurance (28 | 7.0%).
Employment Industries by Sex in Gifford
The Gifford industries that see more men than women are Agriculture, Fishing & Hunting (100.0%), Manufacturing (86.6%), and Wholesale Trade (83.3%), whereas the industries that tend to have a higher number of women are Health Care & Social Assistance (89.8%), Public Administration (84.6%), and Finance & Insurance (78.6%).
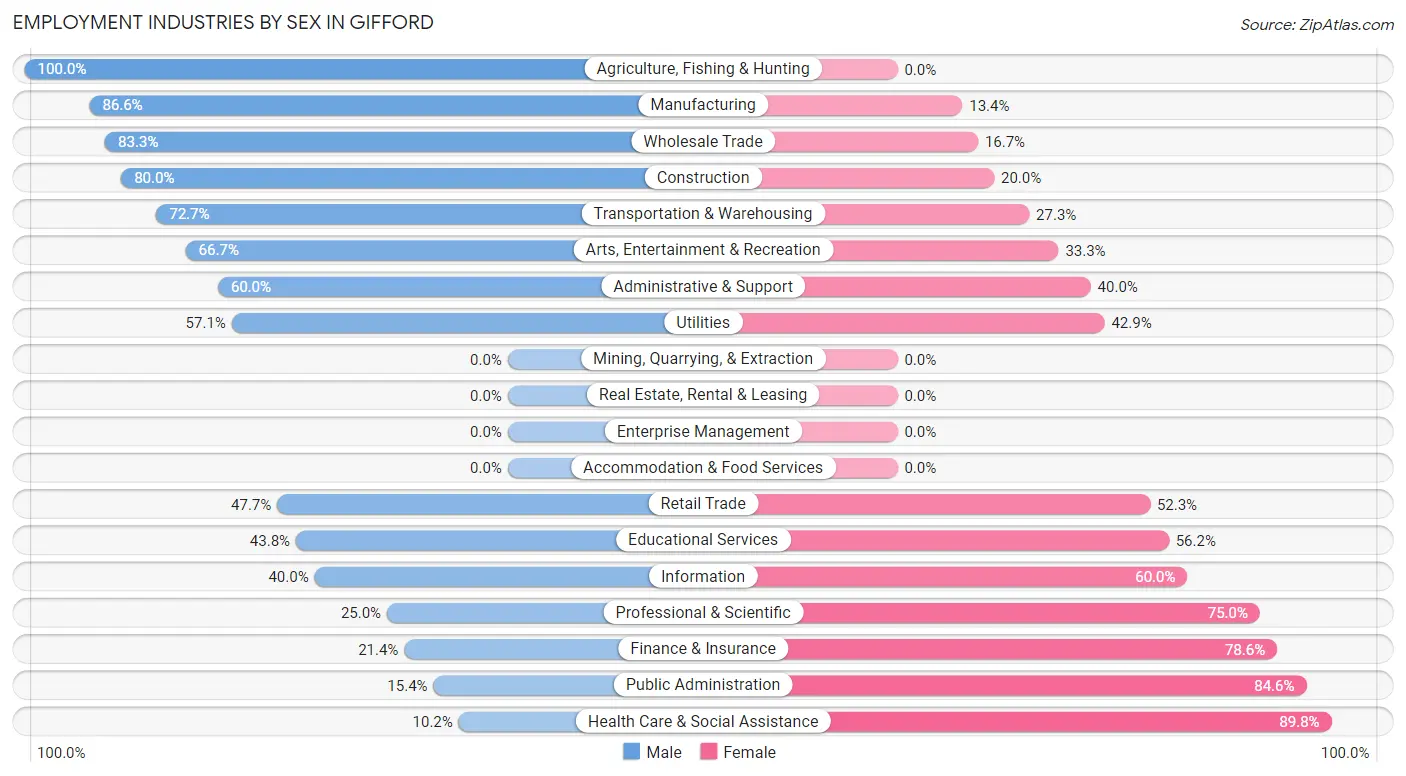
| Industry | Male | Female |
| Agriculture, Fishing & Hunting | 15 (100.0%) | 0 (0.0%) |
| Mining, Quarrying, & Extraction | 0 (0.0%) | 0 (0.0%) |
| Construction | 20 (80.0%) | 5 (20.0%) |
| Manufacturing | 58 (86.6%) | 9 (13.4%) |
| Wholesale Trade | 10 (83.3%) | 2 (16.7%) |
| Retail Trade | 21 (47.7%) | 23 (52.3%) |
| Transportation & Warehousing | 8 (72.7%) | 3 (27.3%) |
| Utilities | 4 (57.1%) | 3 (42.9%) |
| Information | 2 (40.0%) | 3 (60.0%) |
| Finance & Insurance | 6 (21.4%) | 22 (78.6%) |
| Real Estate, Rental & Leasing | 0 (0.0%) | 0 (0.0%) |
| Professional & Scientific | 3 (25.0%) | 9 (75.0%) |
| Enterprise Management | 0 (0.0%) | 0 (0.0%) |
| Administrative & Support | 3 (60.0%) | 2 (40.0%) |
| Educational Services | 32 (43.8%) | 41 (56.2%) |
| Health Care & Social Assistance | 6 (10.2%) | 53 (89.8%) |
| Arts, Entertainment & Recreation | 2 (66.7%) | 1 (33.3%) |
| Accommodation & Food Services | 0 (0.0%) | 0 (0.0%) |
| Public Administration | 2 (15.4%) | 11 (84.6%) |
| Total | 205 (51.1%) | 196 (48.9%) |
Education in Gifford
School Enrollment in Gifford
The most common levels of schooling among the 119 students in Gifford are high school (32 | 26.9%), elementary school (28 | 23.5%), and middle school (19 | 16.0%).
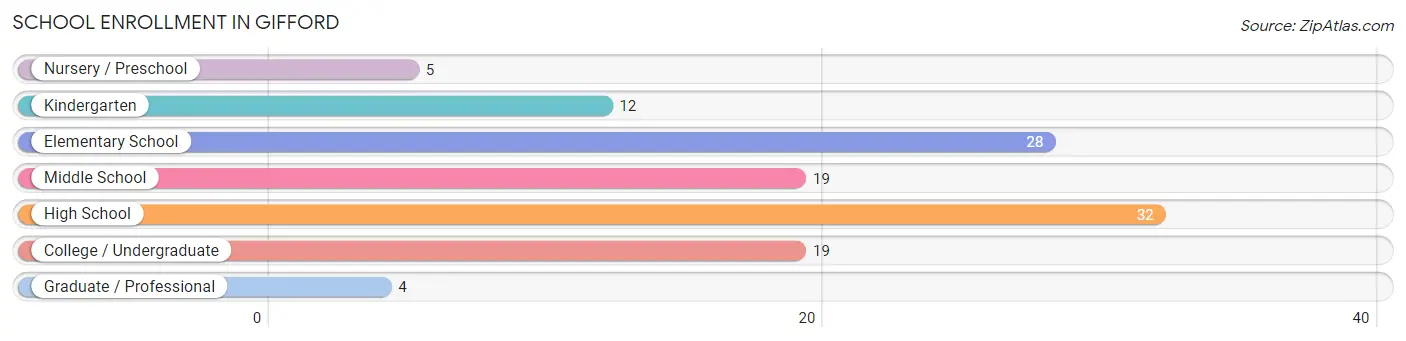
| School Level | # Students | % Students |
| Nursery / Preschool | 5 | 4.2% |
| Kindergarten | 12 | 10.1% |
| Elementary School | 28 | 23.5% |
| Middle School | 19 | 16.0% |
| High School | 32 | 26.9% |
| College / Undergraduate | 19 | 16.0% |
| Graduate / Professional | 4 | 3.4% |
| Total | 119 | 100.0% |
School Enrollment by Age by Funding Source in Gifford
Out of a total of 119 students who are enrolled in schools in Gifford, 4 (3.4%) attend a private institution, while the remaining 115 (96.6%) are enrolled in public schools. The age group of 5 to 9 year old has the highest likelihood of being enrolled in private schools, with 3 (7.9% in the age bracket) enrolled. Conversely, the age group of 3 to 4 year olds has the lowest likelihood of being enrolled in a private school, with 2 (100.0% in the age bracket) attending a public institution.
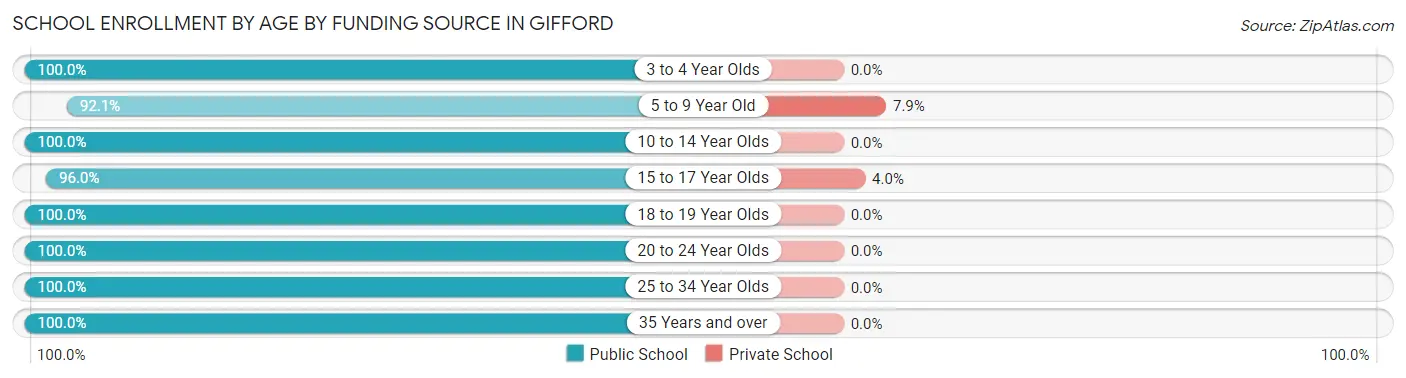
| Age Bracket | Public School | Private School |
| 3 to 4 Year Olds | 2 (100.0%) | 0 (0.0%) |
| 5 to 9 Year Old | 35 (92.1%) | 3 (7.9%) |
| 10 to 14 Year Olds | 27 (100.0%) | 0 (0.0%) |
| 15 to 17 Year Olds | 24 (96.0%) | 1 (4.0%) |
| 18 to 19 Year Olds | 5 (100.0%) | 0 (0.0%) |
| 20 to 24 Year Olds | 12 (100.0%) | 0 (0.0%) |
| 25 to 34 Year Olds | 4 (100.0%) | 0 (0.0%) |
| 35 Years and over | 6 (100.0%) | 0 (0.0%) |
| Total | 115 (96.6%) | 4 (3.4%) |
Educational Attainment by Field of Study in Gifford
Education (25 | 21.2%), business (17 | 14.4%), science & technology (12 | 10.2%), communications (12 | 10.2%), and engineering (9 | 7.6%) are the most common fields of study among 118 individuals in Gifford who have obtained a bachelor's degree or higher.
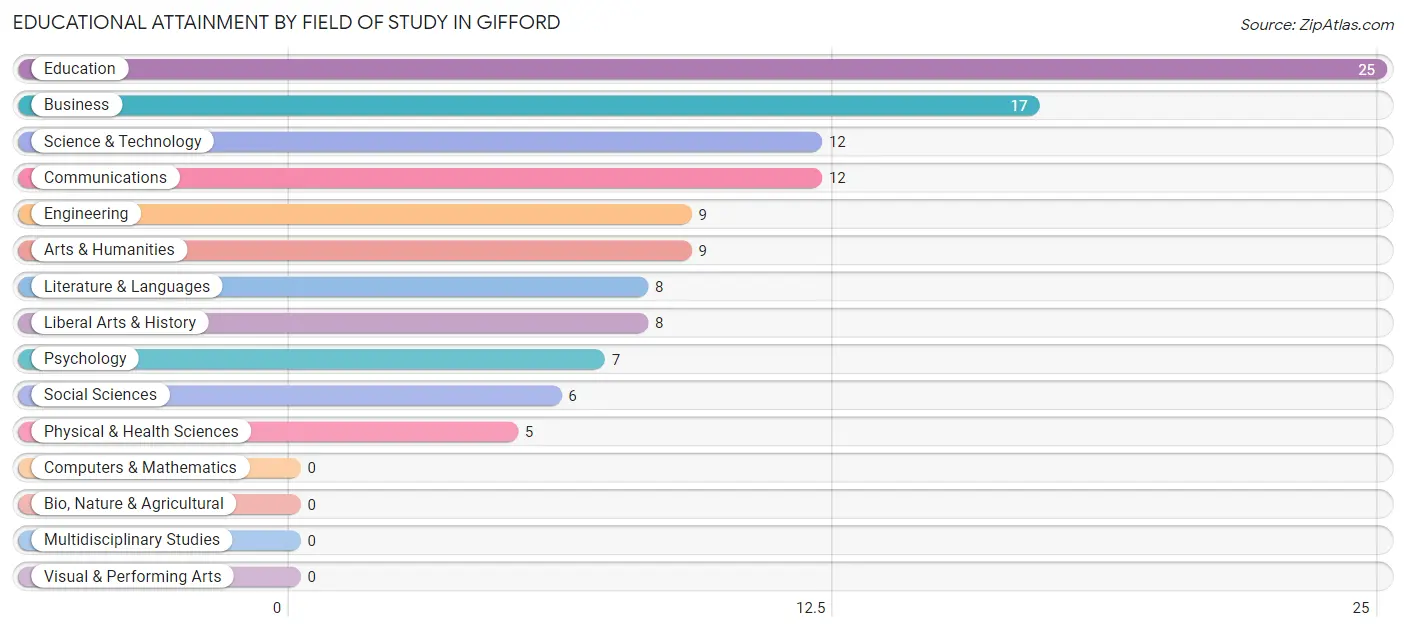
| Field of Study | # Graduates | % Graduates |
| Computers & Mathematics | 0 | 0.0% |
| Bio, Nature & Agricultural | 0 | 0.0% |
| Physical & Health Sciences | 5 | 4.2% |
| Psychology | 7 | 5.9% |
| Social Sciences | 6 | 5.1% |
| Engineering | 9 | 7.6% |
| Multidisciplinary Studies | 0 | 0.0% |
| Science & Technology | 12 | 10.2% |
| Business | 17 | 14.4% |
| Education | 25 | 21.2% |
| Literature & Languages | 8 | 6.8% |
| Liberal Arts & History | 8 | 6.8% |
| Visual & Performing Arts | 0 | 0.0% |
| Communications | 12 | 10.2% |
| Arts & Humanities | 9 | 7.6% |
| Total | 118 | 100.0% |
Transportation & Commute in Gifford
Vehicle Availability by Sex in Gifford
The most prevalent vehicle ownership categories in Gifford are males with 2 vehicles (121, accounting for 60.8%) and females with 2 vehicles (109, making up 61.7%).
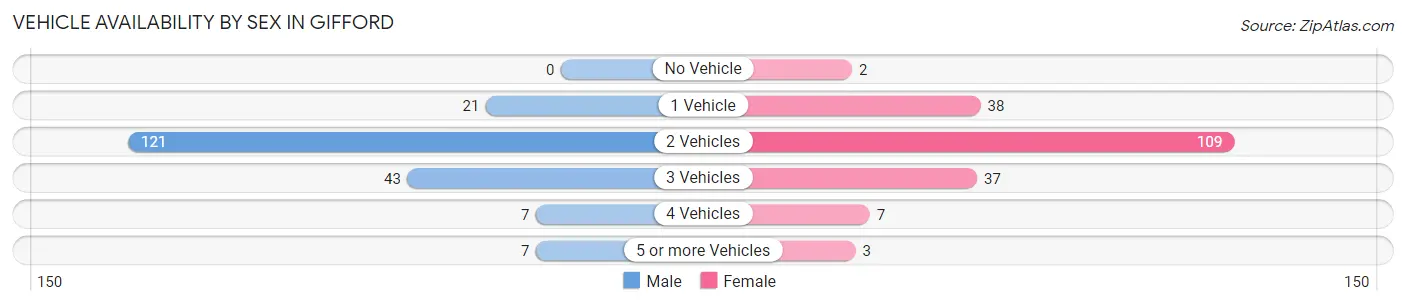
| Vehicles Available | Male | Female |
| No Vehicle | 0 (0.0%) | 2 (1.0%) |
| 1 Vehicle | 21 (10.5%) | 38 (19.4%) |
| 2 Vehicles | 121 (60.8%) | 109 (55.6%) |
| 3 Vehicles | 43 (21.6%) | 37 (18.9%) |
| 4 Vehicles | 7 (3.5%) | 7 (3.6%) |
| 5 or more Vehicles | 7 (3.5%) | 3 (1.5%) |
| Total | 199 (100.0%) | 196 (100.0%) |
Commute Time in Gifford
The most frequently occuring commute durations in Gifford are 30 to 34 minutes (97 commuters, 25.8%), 15 to 19 minutes (53 commuters, 14.1%), and 20 to 24 minutes (44 commuters, 11.7%).
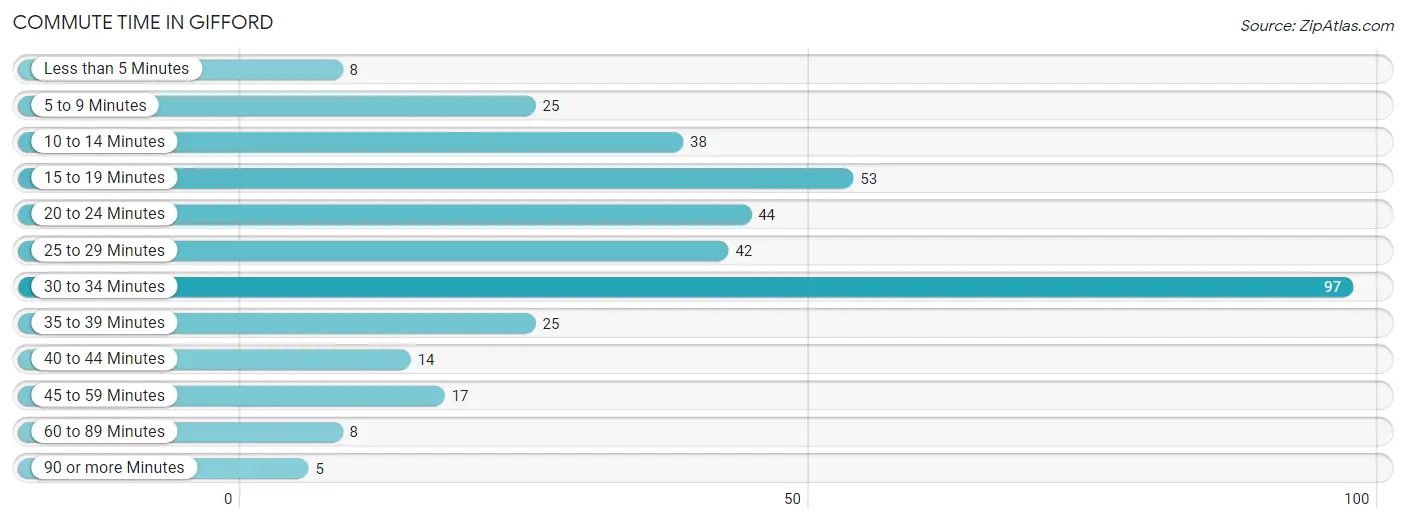
| Commute Time | # Commuters | % Commuters |
| Less than 5 Minutes | 8 | 2.1% |
| 5 to 9 Minutes | 25 | 6.7% |
| 10 to 14 Minutes | 38 | 10.1% |
| 15 to 19 Minutes | 53 | 14.1% |
| 20 to 24 Minutes | 44 | 11.7% |
| 25 to 29 Minutes | 42 | 11.2% |
| 30 to 34 Minutes | 97 | 25.8% |
| 35 to 39 Minutes | 25 | 6.7% |
| 40 to 44 Minutes | 14 | 3.7% |
| 45 to 59 Minutes | 17 | 4.5% |
| 60 to 89 Minutes | 8 | 2.1% |
| 90 or more Minutes | 5 | 1.3% |
Commute Time by Sex in Gifford
The most common commute times in Gifford are 30 to 34 minutes (62 commuters, 32.5%) for males and 30 to 34 minutes (35 commuters, 18.9%) for females.
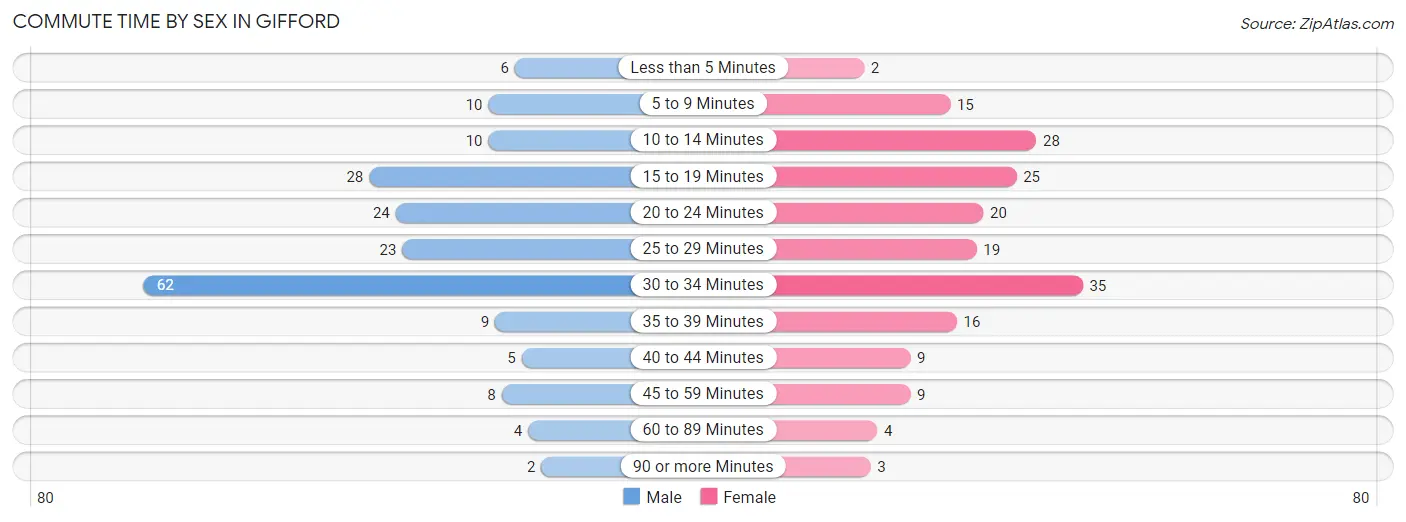
| Commute Time | Male | Female |
| Less than 5 Minutes | 6 (3.1%) | 2 (1.1%) |
| 5 to 9 Minutes | 10 (5.2%) | 15 (8.1%) |
| 10 to 14 Minutes | 10 (5.2%) | 28 (15.1%) |
| 15 to 19 Minutes | 28 (14.7%) | 25 (13.5%) |
| 20 to 24 Minutes | 24 (12.6%) | 20 (10.8%) |
| 25 to 29 Minutes | 23 (12.0%) | 19 (10.3%) |
| 30 to 34 Minutes | 62 (32.5%) | 35 (18.9%) |
| 35 to 39 Minutes | 9 (4.7%) | 16 (8.6%) |
| 40 to 44 Minutes | 5 (2.6%) | 9 (4.9%) |
| 45 to 59 Minutes | 8 (4.2%) | 9 (4.9%) |
| 60 to 89 Minutes | 4 (2.1%) | 4 (2.2%) |
| 90 or more Minutes | 2 (1.1%) | 3 (1.6%) |
Time of Departure to Work by Sex in Gifford
The most frequent times of departure to work in Gifford are 7:00 AM to 7:29 AM (36, 18.9%) for males and 7:00 AM to 7:29 AM (50, 27.0%) for females.
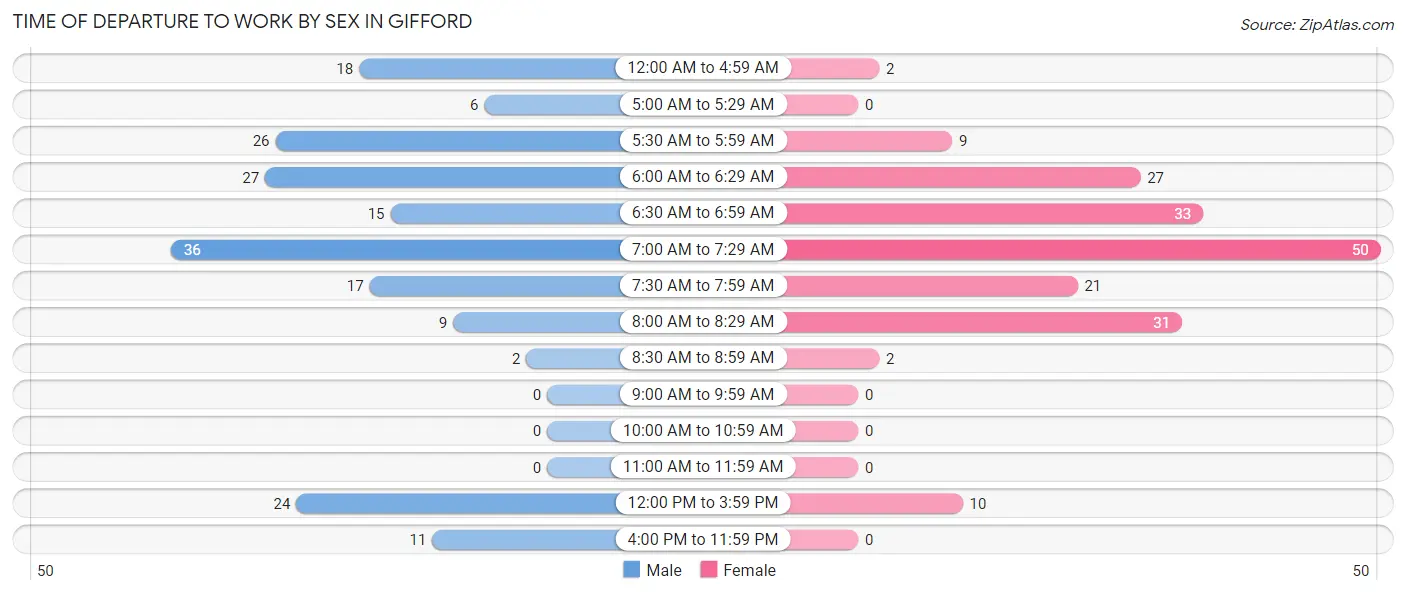
| Time of Departure | Male | Female |
| 12:00 AM to 4:59 AM | 18 (9.4%) | 2 (1.1%) |
| 5:00 AM to 5:29 AM | 6 (3.1%) | 0 (0.0%) |
| 5:30 AM to 5:59 AM | 26 (13.6%) | 9 (4.9%) |
| 6:00 AM to 6:29 AM | 27 (14.1%) | 27 (14.6%) |
| 6:30 AM to 6:59 AM | 15 (7.9%) | 33 (17.8%) |
| 7:00 AM to 7:29 AM | 36 (18.9%) | 50 (27.0%) |
| 7:30 AM to 7:59 AM | 17 (8.9%) | 21 (11.4%) |
| 8:00 AM to 8:29 AM | 9 (4.7%) | 31 (16.8%) |
| 8:30 AM to 8:59 AM | 2 (1.1%) | 2 (1.1%) |
| 9:00 AM to 9:59 AM | 0 (0.0%) | 0 (0.0%) |
| 10:00 AM to 10:59 AM | 0 (0.0%) | 0 (0.0%) |
| 11:00 AM to 11:59 AM | 0 (0.0%) | 0 (0.0%) |
| 12:00 PM to 3:59 PM | 24 (12.6%) | 10 (5.4%) |
| 4:00 PM to 11:59 PM | 11 (5.8%) | 0 (0.0%) |
| Total | 191 (100.0%) | 185 (100.0%) |
Housing Occupancy in Gifford
Occupancy by Ownership in Gifford
Of the total 351 dwellings in Gifford, owner-occupied units account for 325 (92.6%), while renter-occupied units make up 26 (7.4%).
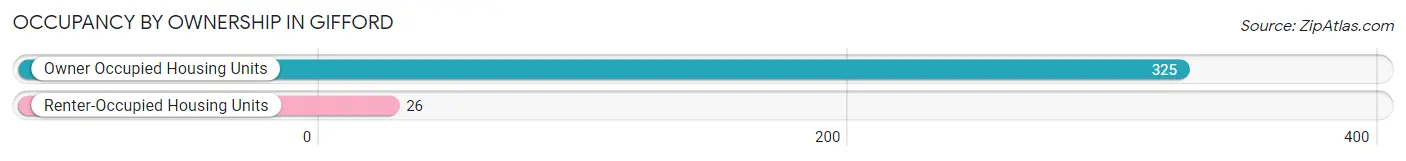
| Occupancy | # Housing Units | % Housing Units |
| Owner Occupied Housing Units | 325 | 92.6% |
| Renter-Occupied Housing Units | 26 | 7.4% |
| Total Occupied Housing Units | 351 | 100.0% |
Occupancy by Household Size in Gifford
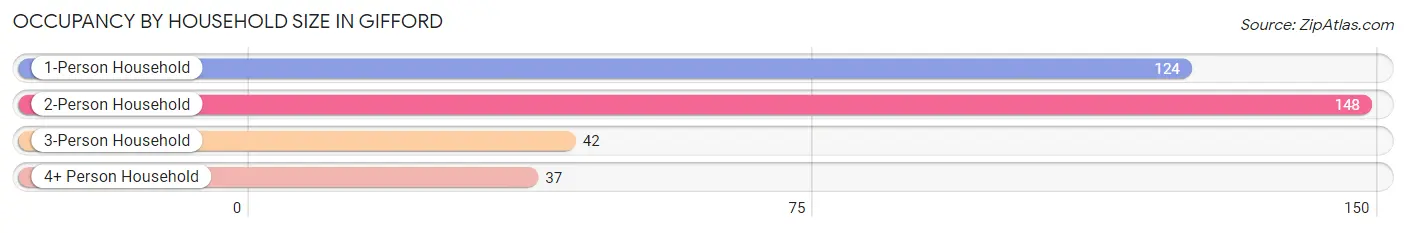
| Household Size | # Housing Units | % Housing Units |
| 1-Person Household | 124 | 35.3% |
| 2-Person Household | 148 | 42.2% |
| 3-Person Household | 42 | 12.0% |
| 4+ Person Household | 37 | 10.5% |
| Total Housing Units | 351 | 100.0% |
Occupancy by Ownership by Household Size in Gifford
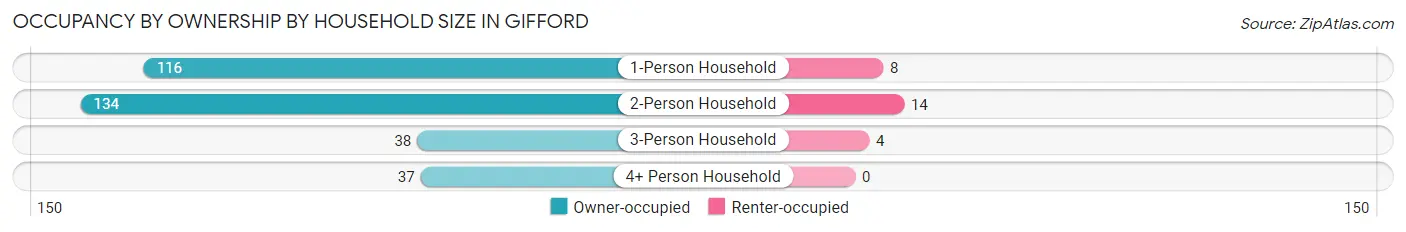
| Household Size | Owner-occupied | Renter-occupied |
| 1-Person Household | 116 (93.5%) | 8 (6.5%) |
| 2-Person Household | 134 (90.5%) | 14 (9.5%) |
| 3-Person Household | 38 (90.5%) | 4 (9.5%) |
| 4+ Person Household | 37 (100.0%) | 0 (0.0%) |
| Total Housing Units | 325 (92.6%) | 26 (7.4%) |
Occupancy by Educational Attainment in Gifford
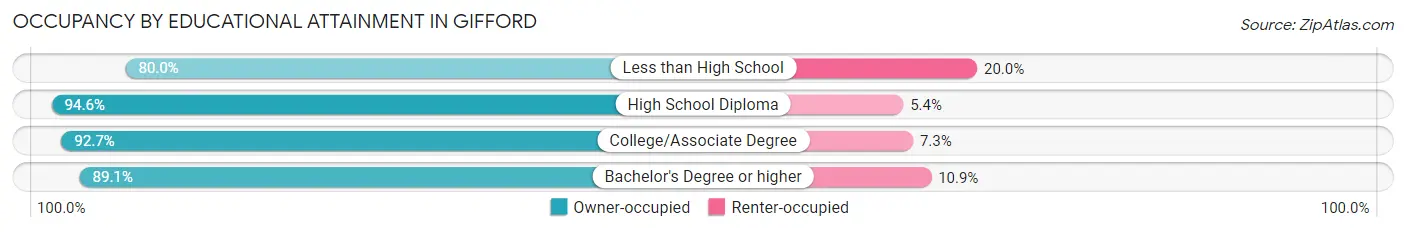
| Household Size | Owner-occupied | Renter-occupied |
| Less than High School | 8 (80.0%) | 2 (20.0%) |
| High School Diploma | 141 (94.6%) | 8 (5.4%) |
| College/Associate Degree | 127 (92.7%) | 10 (7.3%) |
| Bachelor's Degree or higher | 49 (89.1%) | 6 (10.9%) |
Occupancy by Age of Householder in Gifford
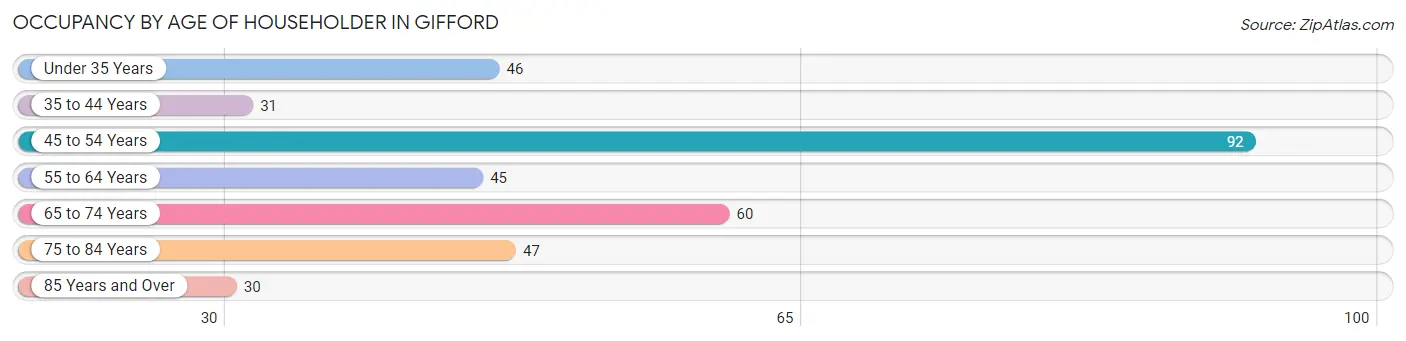
| Age Bracket | # Households | % Households |
| Under 35 Years | 46 | 13.1% |
| 35 to 44 Years | 31 | 8.8% |
| 45 to 54 Years | 92 | 26.2% |
| 55 to 64 Years | 45 | 12.8% |
| 65 to 74 Years | 60 | 17.1% |
| 75 to 84 Years | 47 | 13.4% |
| 85 Years and Over | 30 | 8.6% |
| Total | 351 | 100.0% |
Housing Finances in Gifford
Median Income by Occupancy in Gifford
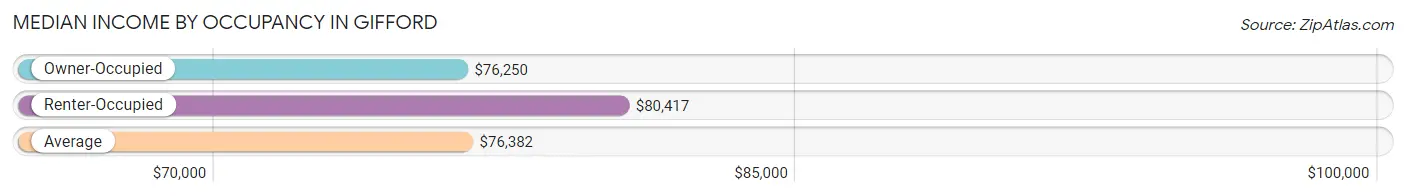
| Occupancy Type | # Households | Median Income |
| Owner-Occupied | 325 (92.6%) | $76,250 |
| Renter-Occupied | 26 (7.4%) | $80,417 |
| Average | 351 (100.0%) | $76,382 |
Occupancy by Householder Income Bracket in Gifford
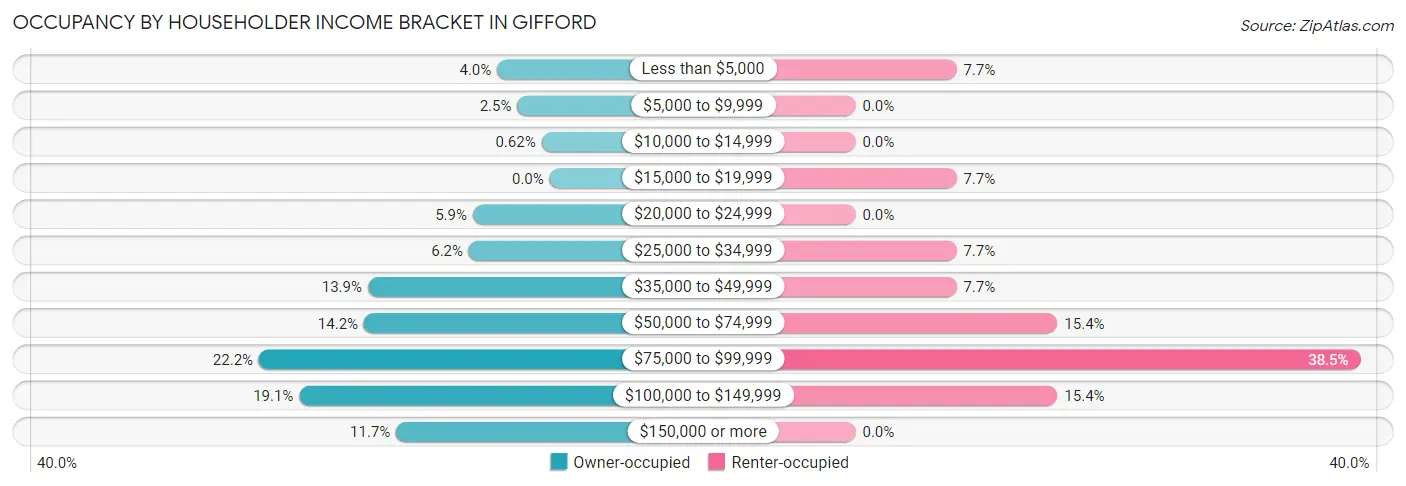
| Income Bracket | Owner-occupied | Renter-occupied |
| Less than $5,000 | 13 (4.0%) | 2 (7.7%) |
| $5,000 to $9,999 | 8 (2.5%) | 0 (0.0%) |
| $10,000 to $14,999 | 2 (0.6%) | 0 (0.0%) |
| $15,000 to $19,999 | 0 (0.0%) | 2 (7.7%) |
| $20,000 to $24,999 | 19 (5.9%) | 0 (0.0%) |
| $25,000 to $34,999 | 20 (6.1%) | 2 (7.7%) |
| $35,000 to $49,999 | 45 (13.9%) | 2 (7.7%) |
| $50,000 to $74,999 | 46 (14.1%) | 4 (15.4%) |
| $75,000 to $99,999 | 72 (22.2%) | 10 (38.5%) |
| $100,000 to $149,999 | 62 (19.1%) | 4 (15.4%) |
| $150,000 or more | 38 (11.7%) | 0 (0.0%) |
| Total | 325 (100.0%) | 26 (100.0%) |
Monthly Housing Cost Tiers in Gifford
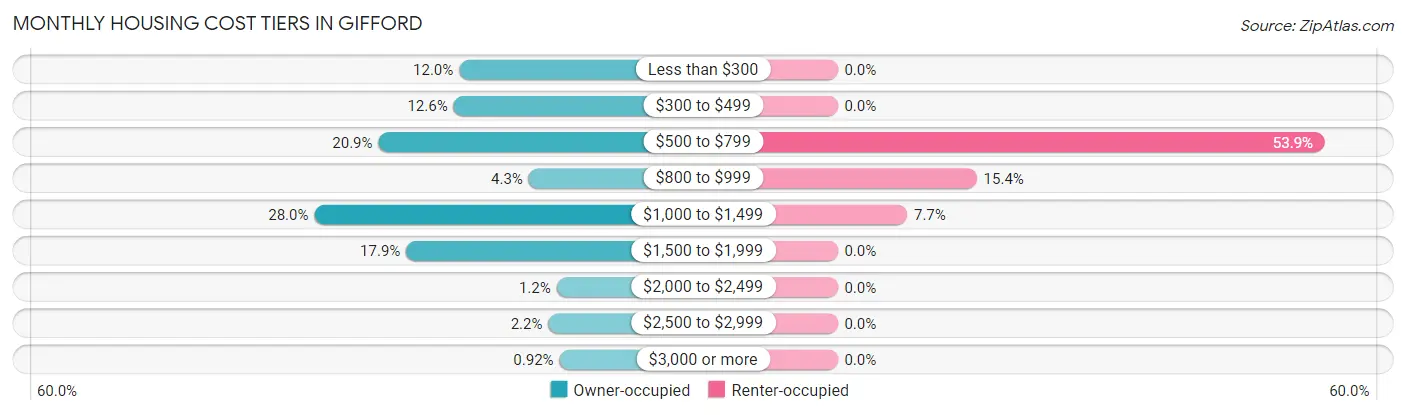
| Monthly Cost | Owner-occupied | Renter-occupied |
| Less than $300 | 39 (12.0%) | 0 (0.0%) |
| $300 to $499 | 41 (12.6%) | 0 (0.0%) |
| $500 to $799 | 68 (20.9%) | 14 (53.8%) |
| $800 to $999 | 14 (4.3%) | 4 (15.4%) |
| $1,000 to $1,499 | 91 (28.0%) | 2 (7.7%) |
| $1,500 to $1,999 | 58 (17.8%) | 0 (0.0%) |
| $2,000 to $2,499 | 4 (1.2%) | 0 (0.0%) |
| $2,500 to $2,999 | 7 (2.1%) | 0 (0.0%) |
| $3,000 or more | 3 (0.9%) | 0 (0.0%) |
| Total | 325 (100.0%) | 26 (100.0%) |
Physical Housing Characteristics in Gifford
Housing Structures in Gifford
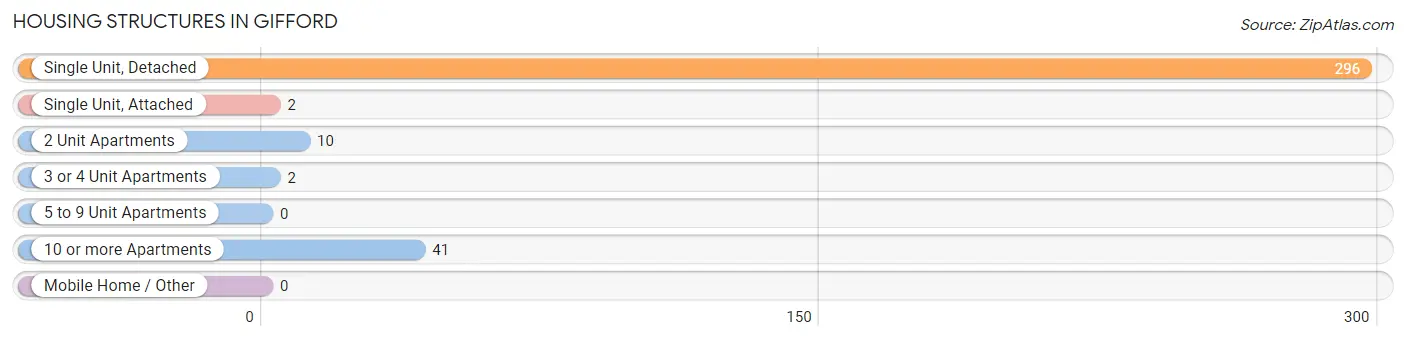
| Structure Type | # Housing Units | % Housing Units |
| Single Unit, Detached | 296 | 84.3% |
| Single Unit, Attached | 2 | 0.6% |
| 2 Unit Apartments | 10 | 2.9% |
| 3 or 4 Unit Apartments | 2 | 0.6% |
| 5 to 9 Unit Apartments | 0 | 0.0% |
| 10 or more Apartments | 41 | 11.7% |
| Mobile Home / Other | 0 | 0.0% |
| Total | 351 | 100.0% |
Housing Structures by Occupancy in Gifford
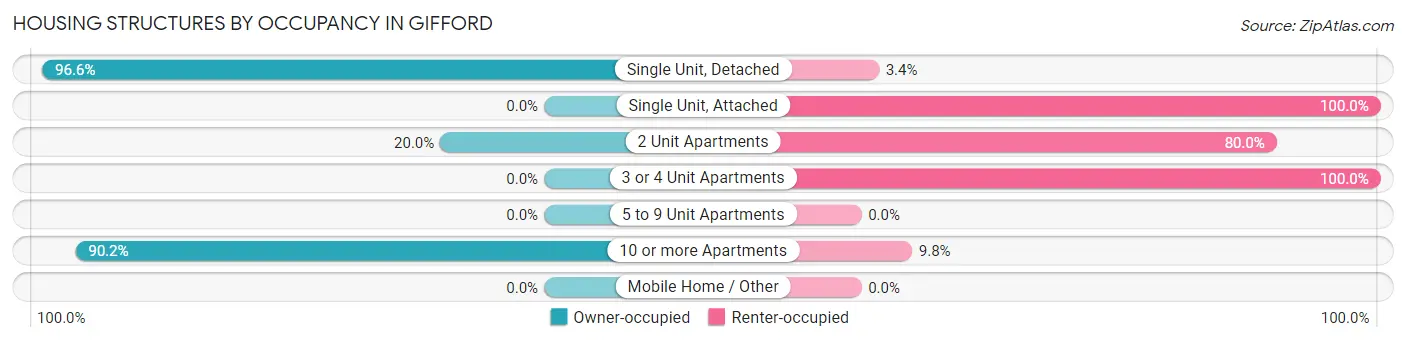
| Structure Type | Owner-occupied | Renter-occupied |
| Single Unit, Detached | 286 (96.6%) | 10 (3.4%) |
| Single Unit, Attached | 0 (0.0%) | 2 (100.0%) |
| 2 Unit Apartments | 2 (20.0%) | 8 (80.0%) |
| 3 or 4 Unit Apartments | 0 (0.0%) | 2 (100.0%) |
| 5 to 9 Unit Apartments | 0 (0.0%) | 0 (0.0%) |
| 10 or more Apartments | 37 (90.2%) | 4 (9.8%) |
| Mobile Home / Other | 0 (0.0%) | 0 (0.0%) |
| Total | 325 (92.6%) | 26 (7.4%) |
Housing Structures by Number of Rooms in Gifford
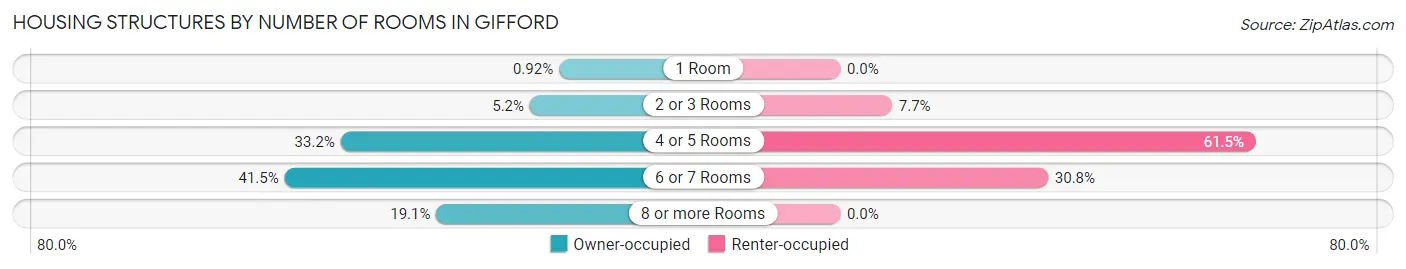
| Number of Rooms | Owner-occupied | Renter-occupied |
| 1 Room | 3 (0.9%) | 0 (0.0%) |
| 2 or 3 Rooms | 17 (5.2%) | 2 (7.7%) |
| 4 or 5 Rooms | 108 (33.2%) | 16 (61.5%) |
| 6 or 7 Rooms | 135 (41.5%) | 8 (30.8%) |
| 8 or more Rooms | 62 (19.1%) | 0 (0.0%) |
| Total | 325 (100.0%) | 26 (100.0%) |
Housing Structure by Heating Type in Gifford
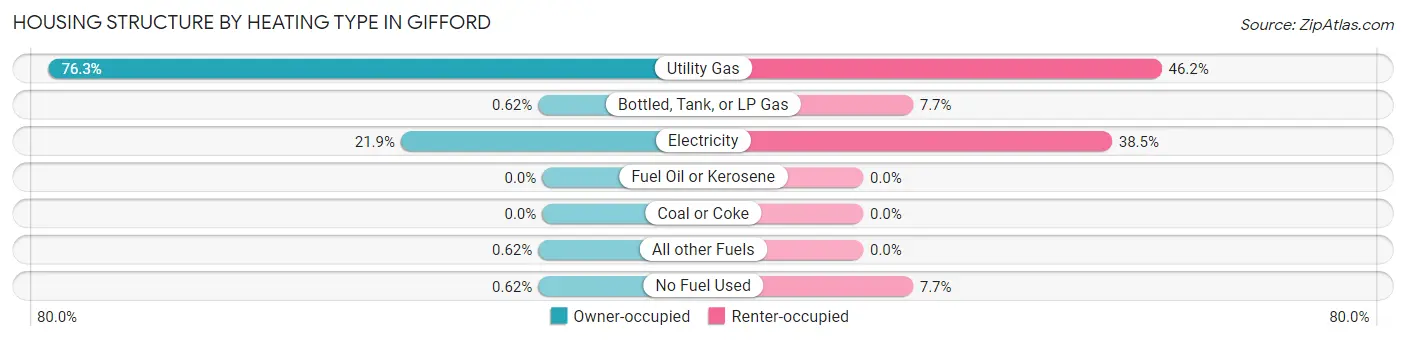
| Heating Type | Owner-occupied | Renter-occupied |
| Utility Gas | 248 (76.3%) | 12 (46.2%) |
| Bottled, Tank, or LP Gas | 2 (0.6%) | 2 (7.7%) |
| Electricity | 71 (21.8%) | 10 (38.5%) |
| Fuel Oil or Kerosene | 0 (0.0%) | 0 (0.0%) |
| Coal or Coke | 0 (0.0%) | 0 (0.0%) |
| All other Fuels | 2 (0.6%) | 0 (0.0%) |
| No Fuel Used | 2 (0.6%) | 2 (7.7%) |
| Total | 325 (100.0%) | 26 (100.0%) |
Household Vehicle Usage in Gifford
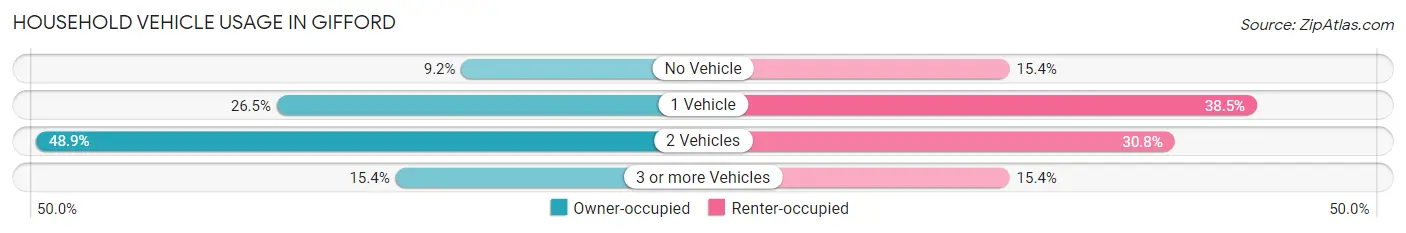
| Vehicles per Household | Owner-occupied | Renter-occupied |
| No Vehicle | 30 (9.2%) | 4 (15.4%) |
| 1 Vehicle | 86 (26.5%) | 10 (38.5%) |
| 2 Vehicles | 159 (48.9%) | 8 (30.8%) |
| 3 or more Vehicles | 50 (15.4%) | 4 (15.4%) |
| Total | 325 (100.0%) | 26 (100.0%) |
Real Estate & Mortgages in Gifford
Real Estate and Mortgage Overview in Gifford
| Characteristic | Without Mortgage | With Mortgage |
| Housing Units | 137 | 188 |
| Median Property Value | $150,700 | $177,000 |
| Median Household Income | $46,563 | $30 |
| Monthly Housing Costs | $436 | $3 |
| Real Estate Taxes | $2,762 | $4 |
Property Value by Mortgage Status in Gifford
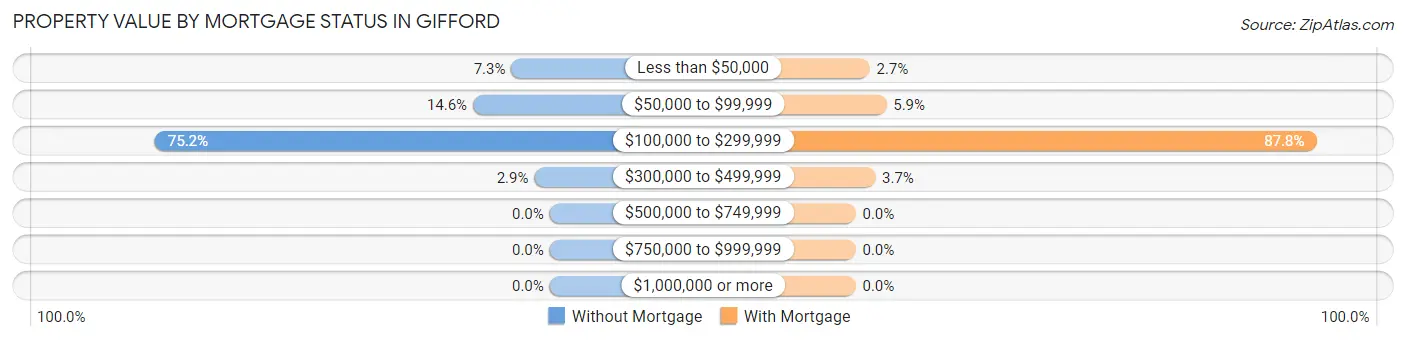
| Property Value | Without Mortgage | With Mortgage |
| Less than $50,000 | 10 (7.3%) | 5 (2.7%) |
| $50,000 to $99,999 | 20 (14.6%) | 11 (5.9%) |
| $100,000 to $299,999 | 103 (75.2%) | 165 (87.8%) |
| $300,000 to $499,999 | 4 (2.9%) | 7 (3.7%) |
| $500,000 to $749,999 | 0 (0.0%) | 0 (0.0%) |
| $750,000 to $999,999 | 0 (0.0%) | 0 (0.0%) |
| $1,000,000 or more | 0 (0.0%) | 0 (0.0%) |
| Total | 137 (100.0%) | 188 (100.0%) |
Household Income by Mortgage Status in Gifford
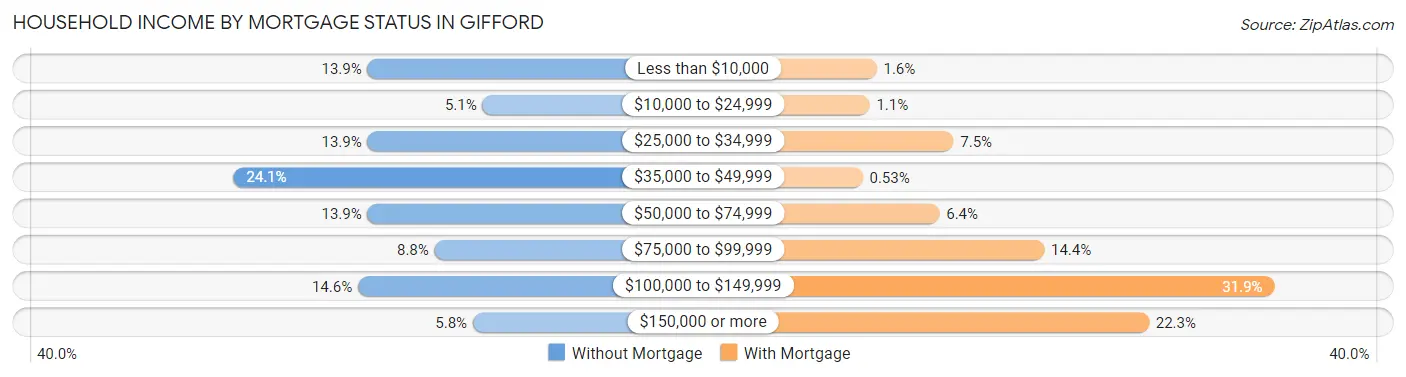
| Household Income | Without Mortgage | With Mortgage |
| Less than $10,000 | 19 (13.9%) | 3 (1.6%) |
| $10,000 to $24,999 | 7 (5.1%) | 2 (1.1%) |
| $25,000 to $34,999 | 19 (13.9%) | 14 (7.4%) |
| $35,000 to $49,999 | 33 (24.1%) | 1 (0.5%) |
| $50,000 to $74,999 | 19 (13.9%) | 12 (6.4%) |
| $75,000 to $99,999 | 12 (8.8%) | 27 (14.4%) |
| $100,000 to $149,999 | 20 (14.6%) | 60 (31.9%) |
| $150,000 or more | 8 (5.8%) | 42 (22.3%) |
| Total | 137 (100.0%) | 188 (100.0%) |
Property Value to Household Income Ratio in Gifford
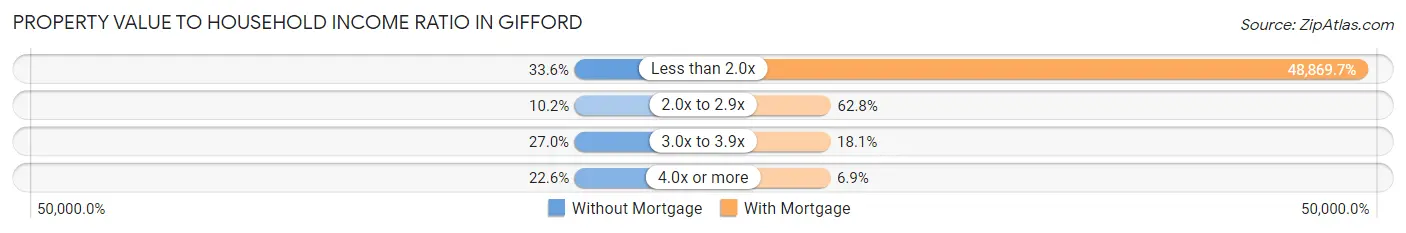
| Value-to-Income Ratio | Without Mortgage | With Mortgage |
| Less than 2.0x | 46 (33.6%) | 91,875 (48,869.7%) |
| 2.0x to 2.9x | 14 (10.2%) | 118 (62.8%) |
| 3.0x to 3.9x | 37 (27.0%) | 34 (18.1%) |
| 4.0x or more | 31 (22.6%) | 13 (6.9%) |
| Total | 137 (100.0%) | 188 (100.0%) |
Real Estate Taxes by Mortgage Status in Gifford
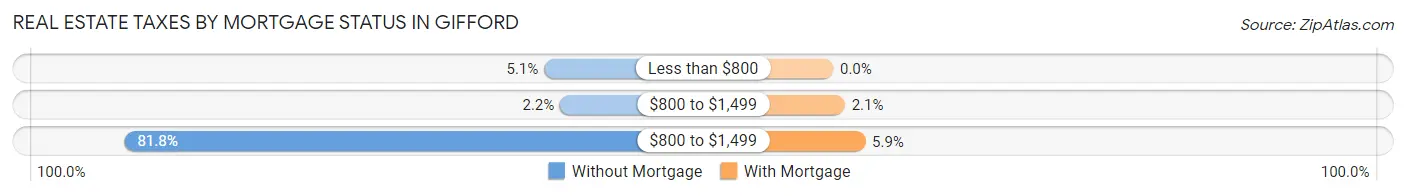
| Property Taxes | Without Mortgage | With Mortgage |
| Less than $800 | 7 (5.1%) | 0 (0.0%) |
| $800 to $1,499 | 3 (2.2%) | 4 (2.1%) |
| $800 to $1,499 | 112 (81.8%) | 11 (5.9%) |
| Total | 137 (100.0%) | 188 (100.0%) |
Health & Disability in Gifford
Health Insurance Coverage by Age in Gifford
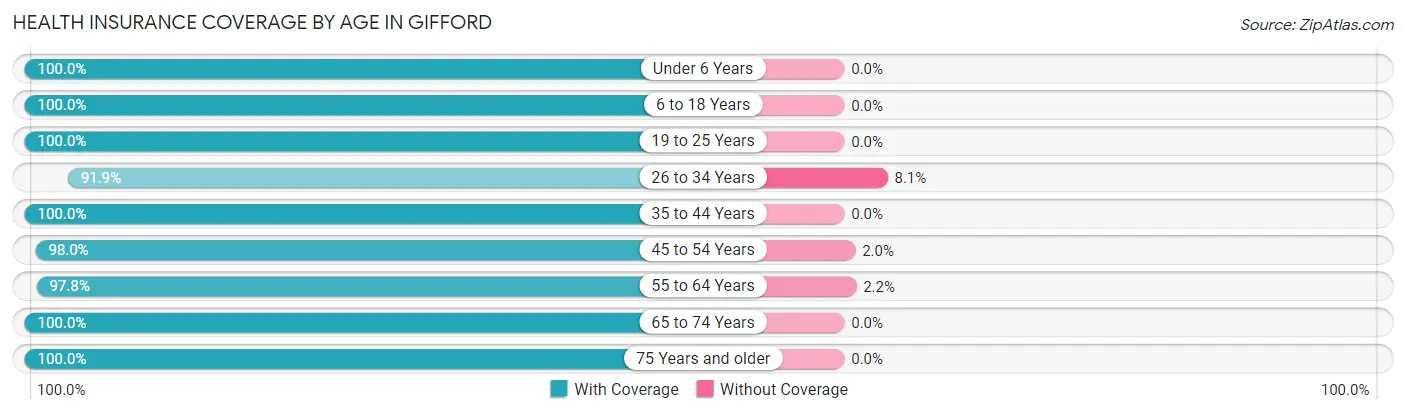
| Age Bracket | With Coverage | Without Coverage |
| Under 6 Years | 51 (100.0%) | 0 (0.0%) |
| 6 to 18 Years | 87 (100.0%) | 0 (0.0%) |
| 19 to 25 Years | 39 (100.0%) | 0 (0.0%) |
| 26 to 34 Years | 57 (91.9%) | 5 (8.1%) |
| 35 to 44 Years | 73 (100.0%) | 0 (0.0%) |
| 45 to 54 Years | 145 (98.0%) | 3 (2.0%) |
| 55 to 64 Years | 88 (97.8%) | 2 (2.2%) |
| 65 to 74 Years | 96 (100.0%) | 0 (0.0%) |
| 75 Years and older | 90 (100.0%) | 0 (0.0%) |
| Total | 726 (98.6%) | 10 (1.4%) |
Health Insurance Coverage by Citizenship Status in Gifford
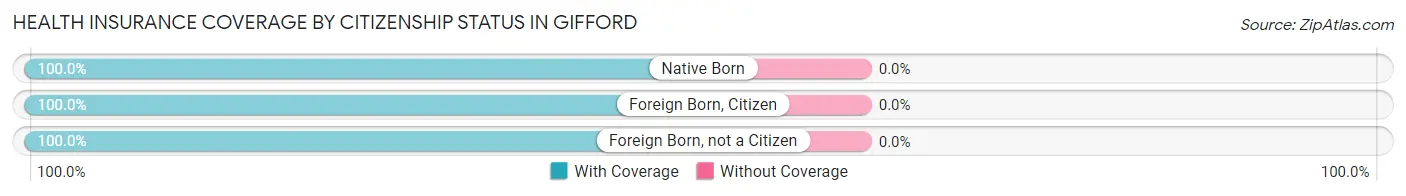
| Citizenship Status | With Coverage | Without Coverage |
| Native Born | 51 (100.0%) | 0 (0.0%) |
| Foreign Born, Citizen | 87 (100.0%) | 0 (0.0%) |
| Foreign Born, not a Citizen | 39 (100.0%) | 0 (0.0%) |
Health Insurance Coverage by Household Income in Gifford
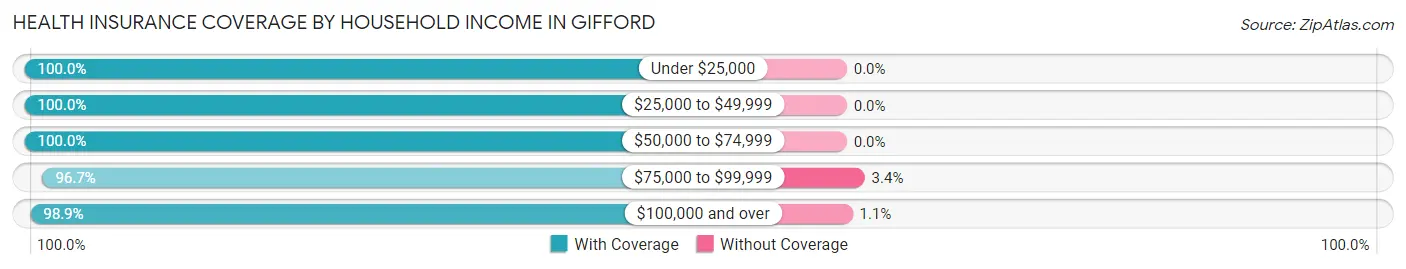
| Household Income | With Coverage | Without Coverage |
| Under $25,000 | 54 (100.0%) | 0 (0.0%) |
| $25,000 to $49,999 | 106 (100.0%) | 0 (0.0%) |
| $50,000 to $74,999 | 89 (100.0%) | 0 (0.0%) |
| $75,000 to $99,999 | 202 (96.7%) | 7 (3.4%) |
| $100,000 and over | 275 (98.9%) | 3 (1.1%) |
Public vs Private Health Insurance Coverage by Age in Gifford
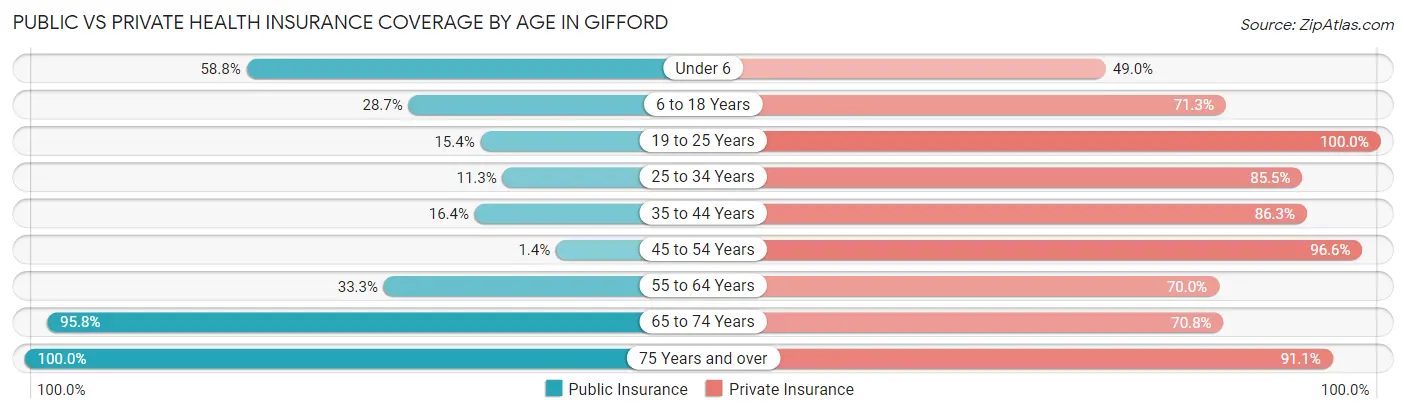
| Age Bracket | Public Insurance | Private Insurance |
| Under 6 | 30 (58.8%) | 25 (49.0%) |
| 6 to 18 Years | 25 (28.7%) | 62 (71.3%) |
| 19 to 25 Years | 6 (15.4%) | 39 (100.0%) |
| 25 to 34 Years | 7 (11.3%) | 53 (85.5%) |
| 35 to 44 Years | 12 (16.4%) | 63 (86.3%) |
| 45 to 54 Years | 2 (1.3%) | 143 (96.6%) |
| 55 to 64 Years | 30 (33.3%) | 63 (70.0%) |
| 65 to 74 Years | 92 (95.8%) | 68 (70.8%) |
| 75 Years and over | 90 (100.0%) | 82 (91.1%) |
| Total | 294 (40.0%) | 598 (81.2%) |
Disability Status by Sex by Age in Gifford
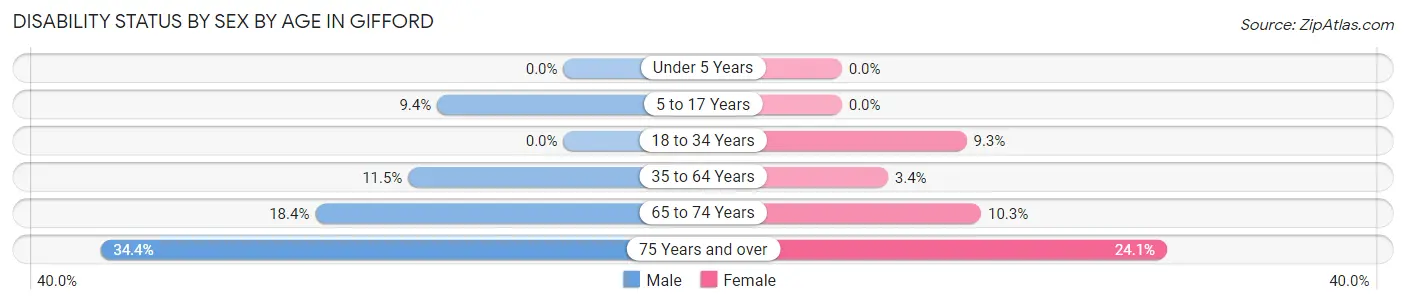
| Age Bracket | Male | Female |
| Under 5 Years | 0 (0.0%) | 0 (0.0%) |
| 5 to 17 Years | 6 (9.4%) | 0 (0.0%) |
| 18 to 34 Years | 0 (0.0%) | 5 (9.3%) |
| 35 to 64 Years | 19 (11.5%) | 5 (3.4%) |
| 65 to 74 Years | 7 (18.4%) | 6 (10.3%) |
| 75 Years and over | 11 (34.4%) | 14 (24.1%) |
Disability Class by Sex by Age in Gifford
Disability Class: Hearing Difficulty
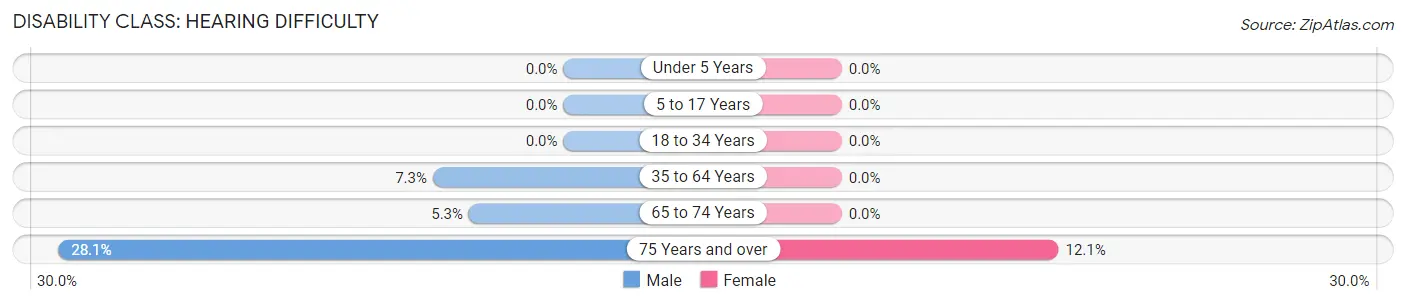
| Age Bracket | Male | Female |
| Under 5 Years | 0 (0.0%) | 0 (0.0%) |
| 5 to 17 Years | 0 (0.0%) | 0 (0.0%) |
| 18 to 34 Years | 0 (0.0%) | 0 (0.0%) |
| 35 to 64 Years | 12 (7.3%) | 0 (0.0%) |
| 65 to 74 Years | 2 (5.3%) | 0 (0.0%) |
| 75 Years and over | 9 (28.1%) | 7 (12.1%) |
Disability Class: Vision Difficulty
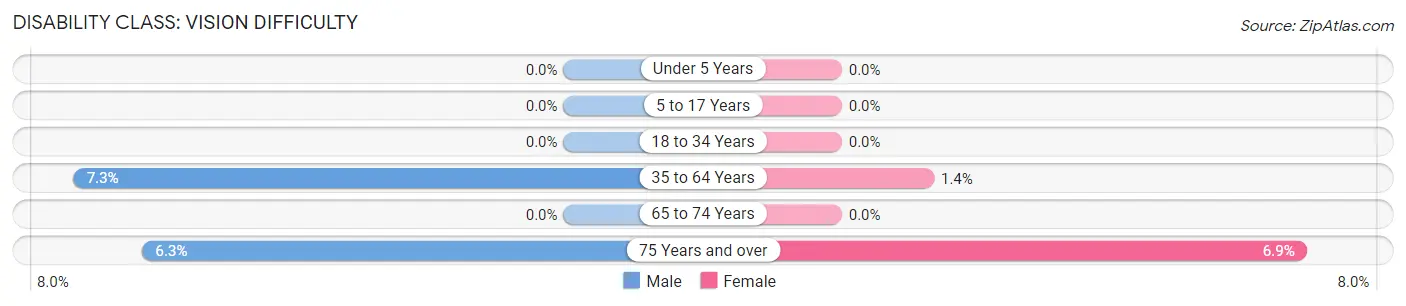
| Age Bracket | Male | Female |
| Under 5 Years | 0 (0.0%) | 0 (0.0%) |
| 5 to 17 Years | 0 (0.0%) | 0 (0.0%) |
| 18 to 34 Years | 0 (0.0%) | 0 (0.0%) |
| 35 to 64 Years | 12 (7.3%) | 2 (1.4%) |
| 65 to 74 Years | 0 (0.0%) | 0 (0.0%) |
| 75 Years and over | 2 (6.2%) | 4 (6.9%) |
Disability Class: Cognitive Difficulty
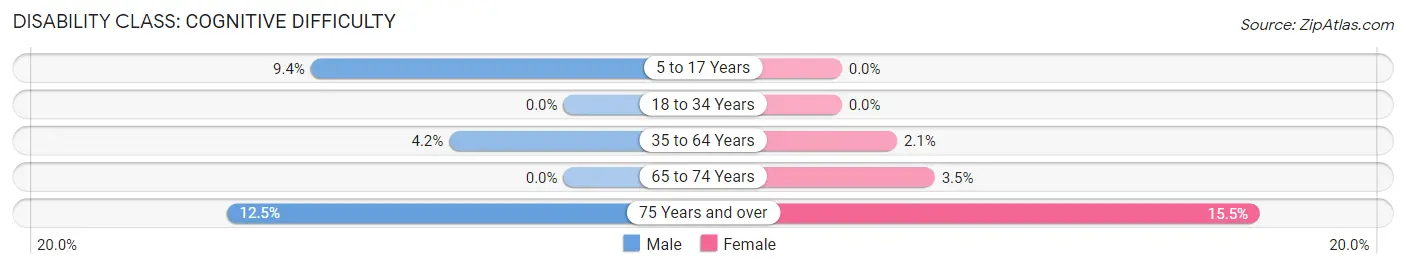
| Age Bracket | Male | Female |
| 5 to 17 Years | 6 (9.4%) | 0 (0.0%) |
| 18 to 34 Years | 0 (0.0%) | 0 (0.0%) |
| 35 to 64 Years | 7 (4.2%) | 3 (2.1%) |
| 65 to 74 Years | 0 (0.0%) | 2 (3.5%) |
| 75 Years and over | 4 (12.5%) | 9 (15.5%) |
Disability Class: Ambulatory Difficulty
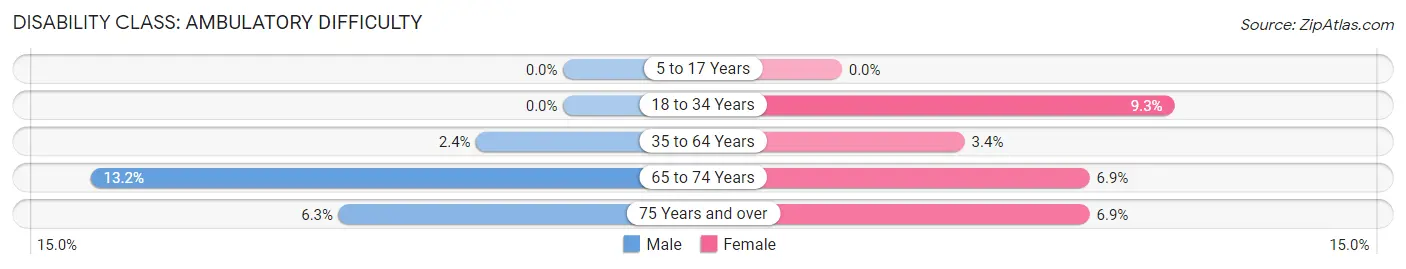
| Age Bracket | Male | Female |
| 5 to 17 Years | 0 (0.0%) | 0 (0.0%) |
| 18 to 34 Years | 0 (0.0%) | 5 (9.3%) |
| 35 to 64 Years | 4 (2.4%) | 5 (3.4%) |
| 65 to 74 Years | 5 (13.2%) | 4 (6.9%) |
| 75 Years and over | 2 (6.2%) | 4 (6.9%) |
Disability Class: Self-Care Difficulty
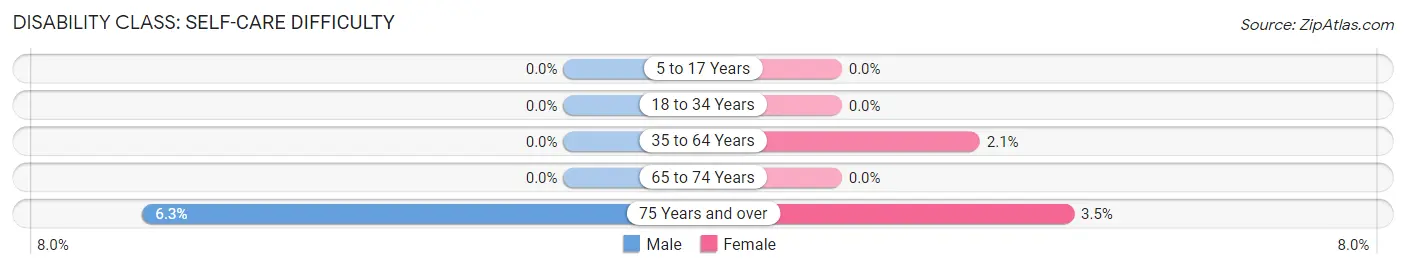
| Age Bracket | Male | Female |
| 5 to 17 Years | 0 (0.0%) | 0 (0.0%) |
| 18 to 34 Years | 0 (0.0%) | 0 (0.0%) |
| 35 to 64 Years | 0 (0.0%) | 3 (2.1%) |
| 65 to 74 Years | 0 (0.0%) | 0 (0.0%) |
| 75 Years and over | 2 (6.2%) | 2 (3.5%) |
Technology Access in Gifford
Computing Device Access in Gifford
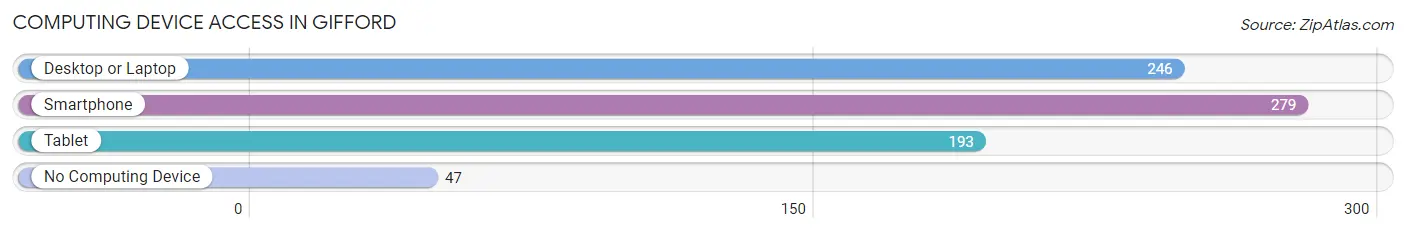
| Device Type | # Households | % Households |
| Desktop or Laptop | 246 | 70.1% |
| Smartphone | 279 | 79.5% |
| Tablet | 193 | 55.0% |
| No Computing Device | 47 | 13.4% |
| Total | 351 | 100.0% |
Internet Access in Gifford
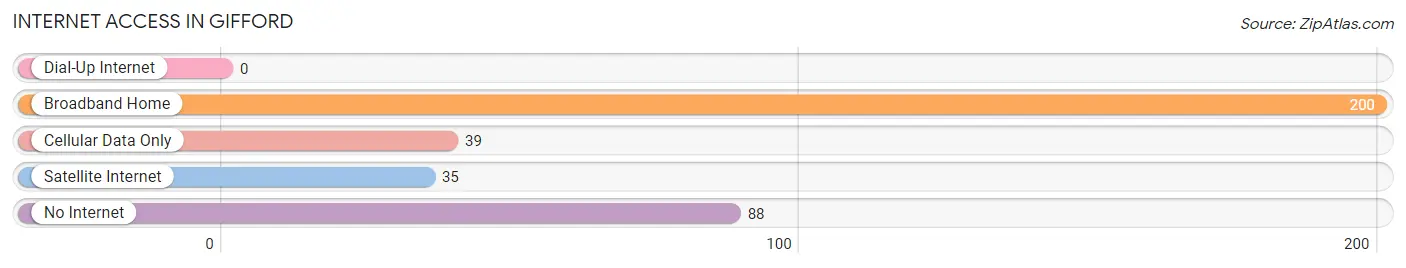
| Internet Type | # Households | % Households |
| Dial-Up Internet | 0 | 0.0% |
| Broadband Home | 200 | 57.0% |
| Cellular Data Only | 39 | 11.1% |
| Satellite Internet | 35 | 10.0% |
| No Internet | 88 | 25.1% |
| Total | 351 | 100.0% |
Gifford Summary
Gifford is a small village located in Champaign County, Illinois. It is situated in the east-central part of the state, about 25 miles south of the city of Champaign. The village has a population of approximately 1,000 people and covers an area of 0.6 square miles.
History
Gifford was founded in 1871 by a group of settlers from Ohio. The village was named after one of the settlers, William Gifford, who was a prominent local businessman. The village was incorporated in 1875 and has remained a small, rural community ever since.
The village was originally an agricultural community, with most of the residents working in the fields or in the local businesses. In the early 1900s, the village began to grow and develop, with the construction of a railroad line and the opening of a post office.
In the 1950s, Gifford began to experience a period of growth and development. The village was connected to the nearby city of Champaign by a new highway, and the population began to increase. The village also saw the opening of several new businesses, including a grocery store, a hardware store, and a bank.
Geography
Gifford is located in the east-central part of Illinois, about 25 miles south of the city of Champaign. The village is situated in a rural area, with rolling hills and farmland surrounding it. The village is located on the banks of the Embarras River, which flows through the area.
The climate in Gifford is typical of the Midwest, with hot summers and cold winters. The average temperature in the summer is around 80 degrees Fahrenheit, while the average temperature in the winter is around 30 degrees Fahrenheit.
Economy
The economy of Gifford is largely based on agriculture. The village is home to several farms, which produce a variety of crops, including corn, soybeans, and wheat. The village also has several small businesses, including a grocery store, a hardware store, and a bank.
The village is also home to a number of manufacturing companies, which produce a variety of products, including furniture, clothing, and electronics. The village is also home to a number of service-based businesses, such as restaurants, auto repair shops, and medical offices.
Demographics
As of the 2010 census, the population of Gifford was 1,000 people. The racial makeup of the village was 97.2% White, 0.7% African American, 0.3% Native American, 0.2% Asian, and 1.6% from other races. The median household income in Gifford was $41,250, and the median age was 38.7 years.
Conclusion
Gifford is a small village located in Champaign County, Illinois. It is situated in the east-central part of the state, about 25 miles south of the city of Champaign. The village has a population of approximately 1,000 people and covers an area of 0.6 square miles. The economy of Gifford is largely based on agriculture, with several farms producing a variety of crops. The village also has several small businesses, including a grocery store, a hardware store, and a bank. The racial makeup of the village is 97.2% White, 0.7% African American, 0.3% Native American, 0.2% Asian, and 1.6% from other races. The median household income in Gifford was $41,250, and the median age was 38.7 years.
Common Questions
What is Per Capita Income in Gifford?
Per Capita income in Gifford is $38,113.
What is the Median Family Income in Gifford?
Median Family Income in Gifford is $91,875.
What is the Median Household income in Gifford?
Median Household Income in Gifford is $76,382.
What is Income or Wage Gap in Gifford?
Income or Wage Gap in Gifford is 23.2%.
Women in Gifford earn 76.8 cents for every dollar earned by a man.
What is Inequality or Gini Index in Gifford?
Inequality or Gini Index in Gifford is 0.37.
What is the Total Population of Gifford?
Total Population of Gifford is 827.
What is the Total Male Population of Gifford?
Total Male Population of Gifford is 393.
What is the Total Female Population of Gifford?
Total Female Population of Gifford is 434.
What is the Ratio of Males per 100 Females in Gifford?
There are 90.55 Males per 100 Females in Gifford.
What is the Ratio of Females per 100 Males in Gifford?
There are 110.43 Females per 100 Males in Gifford.
What is the Median Population Age in Gifford?
Median Population Age in Gifford is 52.5 Years.
What is the Average Family Size in Gifford
Average Family Size in Gifford is 2.6 People.
What is the Average Household Size in Gifford
Average Household Size in Gifford is 2.1 People.
How Large is the Labor Force in Gifford?
There are 409 People in the Labor Forcein in Gifford.
What is the Percentage of People in the Labor Force in Gifford?
57.7% of People are in the Labor Force in Gifford.
What is the Unemployment Rate in Gifford?
Unemployment Rate in Gifford is 1.5%.