Schuyler County, IL Map & Demographics
Schuyler County Map
Schuyler County Overview
$31,679
PER CAPITA INCOME
$81,591
AVG FAMILY INCOME
$63,737
AVG HOUSEHOLD INCOME
20.9%
WAGE / INCOME GAP [ % ]
79.1¢/ $1
WAGE / INCOME GAP [ $ ]
0.41
INEQUALITY / GINI INDEX
6,879
TOTAL POPULATION
3,813
MALE POPULATION
3,066
FEMALE POPULATION
124.36
MALES / 100 FEMALES
80.41
FEMALES / 100 MALES
48.2
MEDIAN AGE
2.9
AVG FAMILY SIZE
2.2
AVG HOUSEHOLD SIZE
3,202
LABOR FORCE [ PEOPLE ]
55.4%
PERCENT IN LABOR FORCE
6.7%
UNEMPLOYMENT RATE
Income in Schuyler County
Income Overview in Schuyler County
Per Capita Income in Schuyler County is $31,679, while median incomes of families and households are $81,591 and $63,737 respectively.
| Characteristic | Number | Measure |
| Per Capita Income | 6,879 | $31,679 |
| Median Family Income | 1,596 | $81,591 |
| Mean Family Income | 1,596 | $90,261 |
| Median Household Income | 2,725 | $63,737 |
| Mean Household Income | 2,725 | $79,229 |
| Income Deficit | 1,596 | $0 |
| Wage / Income Gap (%) | 6,879 | 20.92% |
| Wage / Income Gap ($) | 6,879 | 79.08¢ per $1 |
| Gini / Inequality Index | 6,879 | 0.41 |
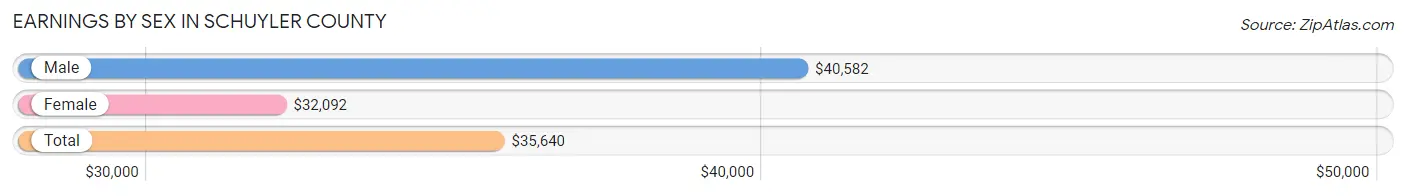
Earnings by Sex in Schuyler County
Average Earnings in Schuyler County are $35,640, $40,582 for men and $32,092 for women, a difference of 20.9%.
| Sex | Number | Average Earnings |
| Male | 1,821 (55.0%) | $40,582 |
| Female | 1,487 (45.0%) | $32,092 |
| Total | 3,308 (100.0%) | $35,640 |
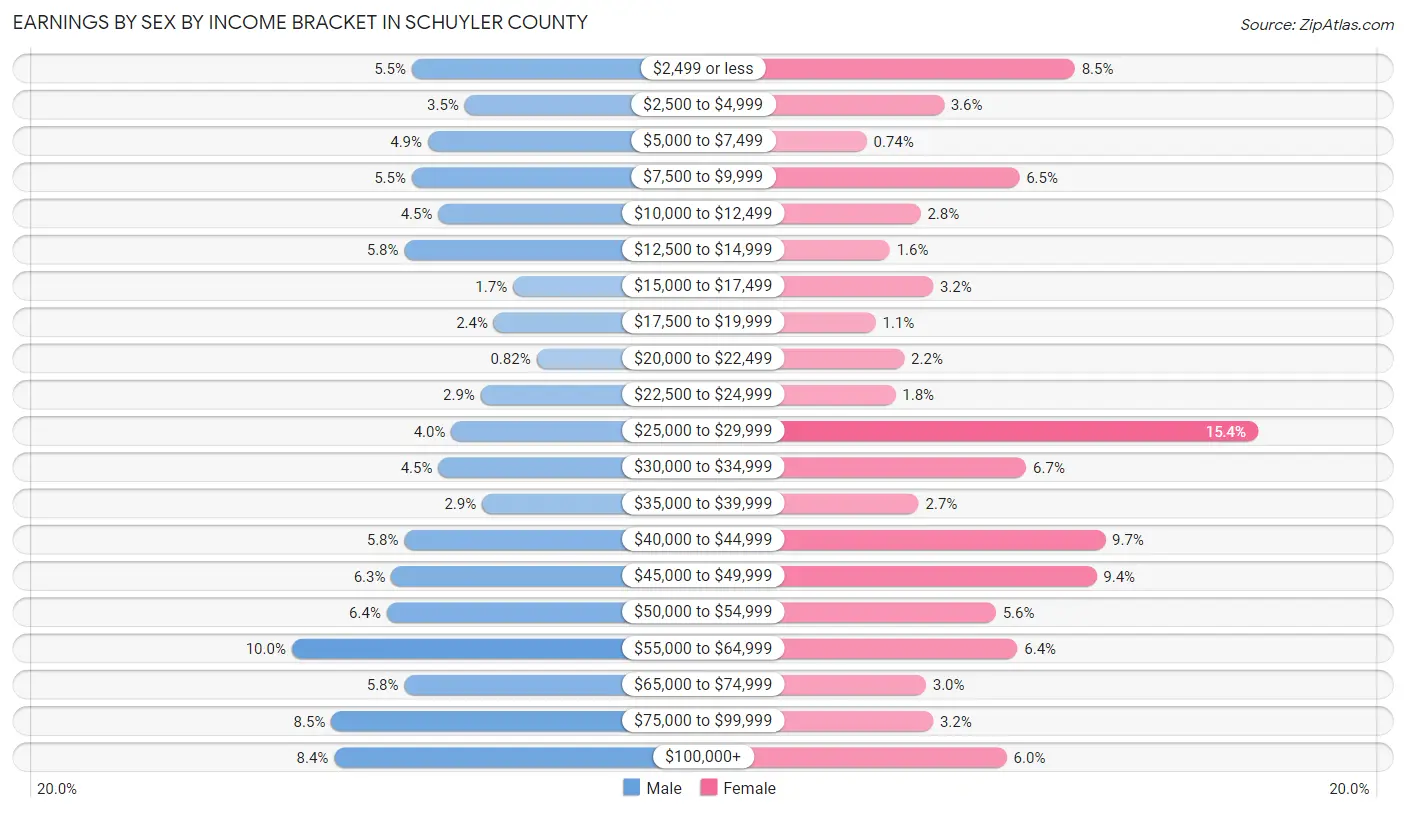
Earnings by Sex by Income Bracket in Schuyler County
The most common earnings brackets in Schuyler County are $55,000 to $64,999 for men (182 | 10.0%) and $25,000 to $29,999 for women (229 | 15.4%).
| Income | Male | Female |
| $2,499 or less | 100 (5.5%) | 127 (8.5%) |
| $2,500 to $4,999 | 64 (3.5%) | 54 (3.6%) |
| $5,000 to $7,499 | 89 (4.9%) | 11 (0.7%) |
| $7,500 to $9,999 | 100 (5.5%) | 96 (6.5%) |
| $10,000 to $12,499 | 82 (4.5%) | 41 (2.8%) |
| $12,500 to $14,999 | 105 (5.8%) | 24 (1.6%) |
| $15,000 to $17,499 | 31 (1.7%) | 48 (3.2%) |
| $17,500 to $19,999 | 44 (2.4%) | 16 (1.1%) |
| $20,000 to $22,499 | 15 (0.8%) | 32 (2.1%) |
| $22,500 to $24,999 | 53 (2.9%) | 27 (1.8%) |
| $25,000 to $29,999 | 73 (4.0%) | 229 (15.4%) |
| $30,000 to $34,999 | 82 (4.5%) | 100 (6.7%) |
| $35,000 to $39,999 | 52 (2.9%) | 40 (2.7%) |
| $40,000 to $44,999 | 105 (5.8%) | 144 (9.7%) |
| $45,000 to $49,999 | 114 (6.3%) | 139 (9.3%) |
| $50,000 to $54,999 | 117 (6.4%) | 83 (5.6%) |
| $55,000 to $64,999 | 182 (10.0%) | 95 (6.4%) |
| $65,000 to $74,999 | 105 (5.8%) | 44 (3.0%) |
| $75,000 to $99,999 | 155 (8.5%) | 48 (3.2%) |
| $100,000+ | 153 (8.4%) | 89 (6.0%) |
| Total | 1,821 (100.0%) | 1,487 (100.0%) |
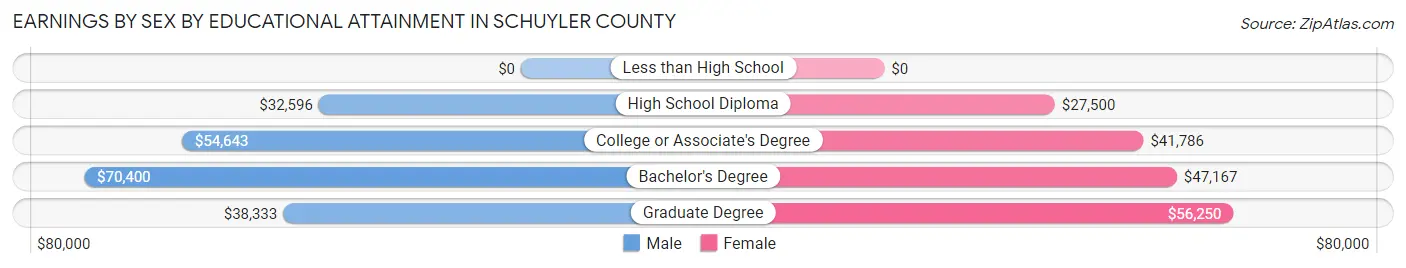
Earnings by Sex by Educational Attainment in Schuyler County
Average earnings in Schuyler County are $45,071 for men and $38,015 for women, a difference of 15.7%. Men with an educational attainment of bachelor's degree enjoy the highest average annual earnings of $70,400, while those with high school diploma education earn the least with $32,596. Women with an educational attainment of graduate degree earn the most with the average annual earnings of $56,250, while those with high school diploma education have the smallest earnings of $27,500.
| Educational Attainment | Male Income | Female Income |
| Less than High School | - | - |
| High School Diploma | $32,596 | $27,500 |
| College or Associate's Degree | $54,643 | $41,786 |
| Bachelor's Degree | $70,400 | $47,167 |
| Graduate Degree | $38,333 | $56,250 |
| Total | $45,071 | $38,015 |
Family Income in Schuyler County
Family Income Brackets in Schuyler County
According to the Schuyler County family income data, there are 369 families falling into the $75,000 to $99,999 income range, which is the most common income bracket and makes up 23.1% of all families. Conversely, the $10,000 to $14,999 income bracket is the least frequent group with only 37 families (2.3%) belonging to this category.
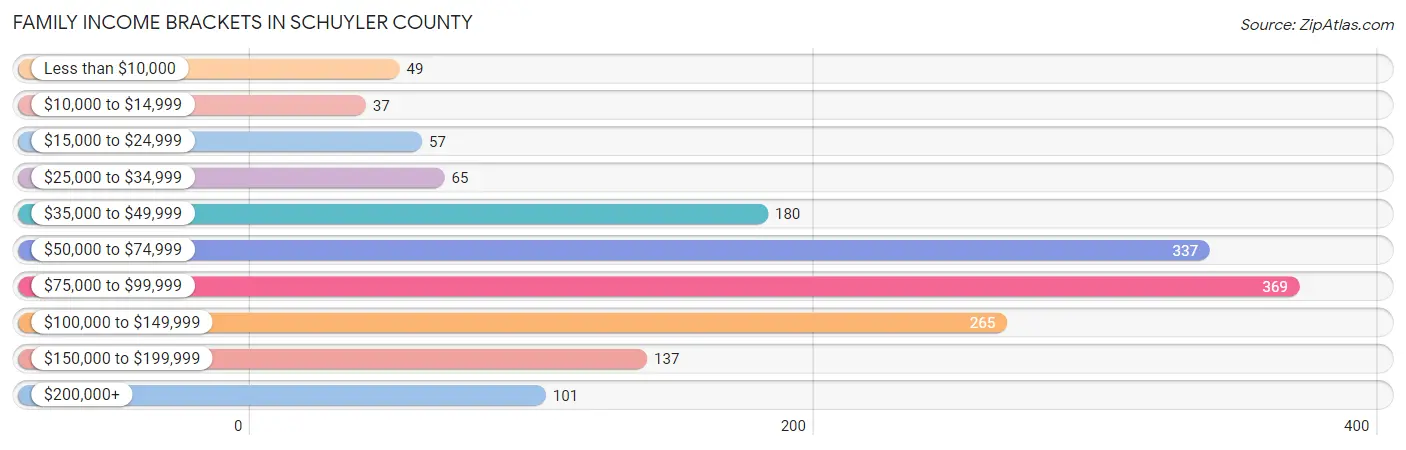
| Income Bracket | # Families | % Families |
| Less than $10,000 | 49 | 3.1% |
| $10,000 to $14,999 | 37 | 2.3% |
| $15,000 to $24,999 | 57 | 3.6% |
| $25,000 to $34,999 | 65 | 4.1% |
| $35,000 to $49,999 | 180 | 11.3% |
| $50,000 to $74,999 | 337 | 21.1% |
| $75,000 to $99,999 | 369 | 23.1% |
| $100,000 to $149,999 | 265 | 16.6% |
| $150,000 to $199,999 | 137 | 8.6% |
| $200,000+ | 101 | 6.3% |
Family Income by Famaliy Size in Schuyler County
6-person families (47 | 2.9%) account for the highest median family income in Schuyler County with $207,604 per family, while 2-person families (879 | 55.1%) have the highest median income of $38,542 per family member.
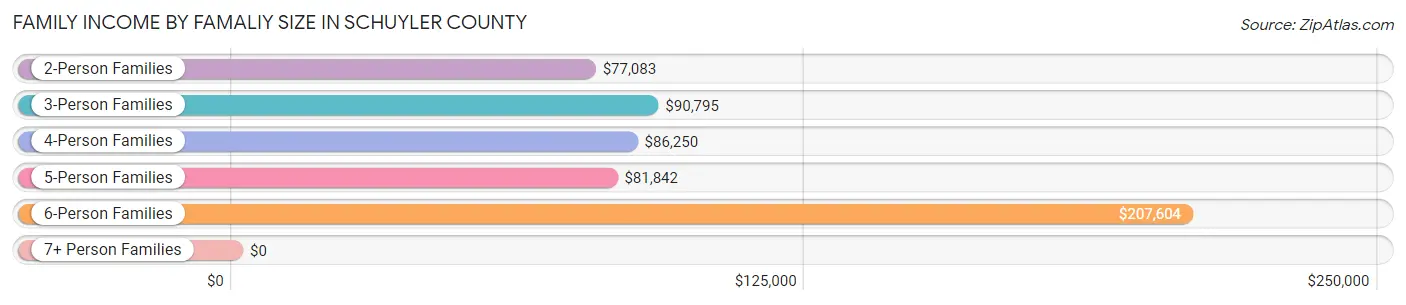
| Income Bracket | # Families | Median Income |
| 2-Person Families | 879 (55.1%) | $77,083 |
| 3-Person Families | 350 (21.9%) | $90,795 |
| 4-Person Families | 176 (11.0%) | $86,250 |
| 5-Person Families | 132 (8.3%) | $81,842 |
| 6-Person Families | 47 (2.9%) | $207,604 |
| 7+ Person Families | 12 (0.7%) | $0 |
| Total | 1,596 (100.0%) | $81,591 |
Family Income by Number of Earners in Schuyler County
The median family income in Schuyler County is $81,591, with families comprising 3+ earners (123) having the highest median family income of $105,583, while families with no earners (323) have the lowest median family income of $44,911, accounting for 7.7% and 20.2% of families, respectively.
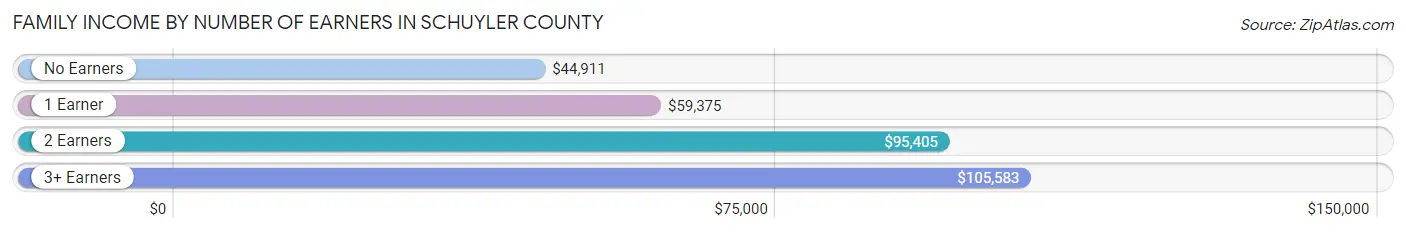
| Number of Earners | # Families | Median Income |
| No Earners | 323 (20.2%) | $44,911 |
| 1 Earner | 412 (25.8%) | $59,375 |
| 2 Earners | 738 (46.2%) | $95,405 |
| 3+ Earners | 123 (7.7%) | $105,583 |
| Total | 1,596 (100.0%) | $81,591 |
Household Income in Schuyler County
Household Income Brackets in Schuyler County
With 515 households falling in the category, the $50,000 to $74,999 income range is the most frequent in Schuyler County, accounting for 18.9% of all households. In contrast, only 84 households (3.1%) fall into the less than $10,000 income bracket, making it the least populous group.
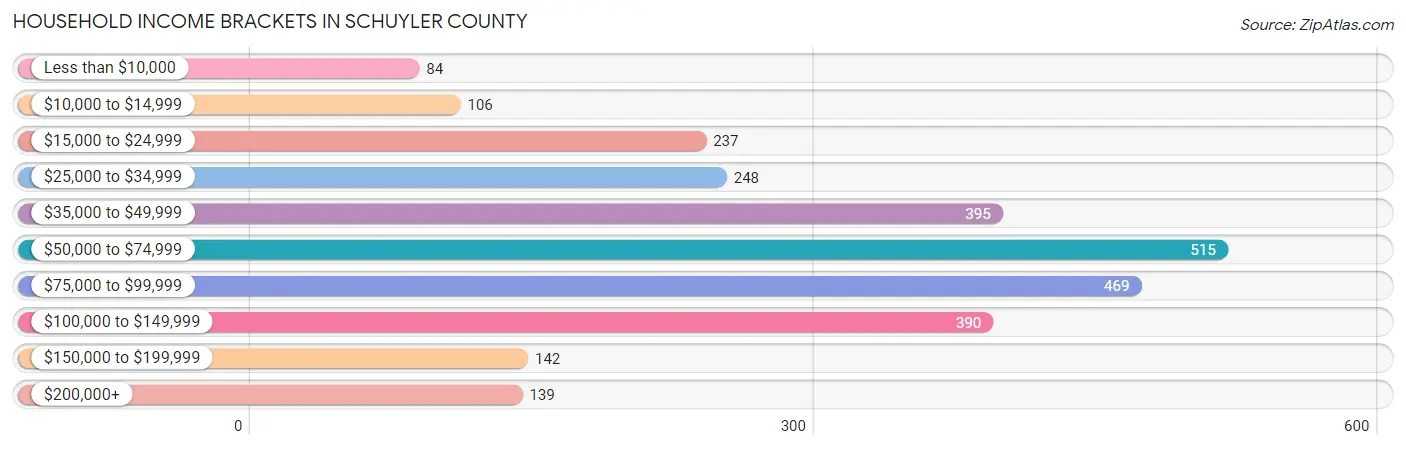
| Income Bracket | # Households | % Households |
| Less than $10,000 | 84 | 3.1% |
| $10,000 to $14,999 | 106 | 3.9% |
| $15,000 to $24,999 | 237 | 8.7% |
| $25,000 to $34,999 | 248 | 9.1% |
| $35,000 to $49,999 | 395 | 14.5% |
| $50,000 to $74,999 | 515 | 18.9% |
| $75,000 to $99,999 | 469 | 17.2% |
| $100,000 to $149,999 | 390 | 14.3% |
| $150,000 to $199,999 | 142 | 5.2% |
| $200,000+ | 139 | 5.1% |
Household Income by Householder Age in Schuyler County
The median household income in Schuyler County is $63,737, with the highest median household income of $69,716 found in the 25 to 44 years age bracket for the primary householder. A total of 745 households (27.3%) fall into this category. Meanwhile, the 15 to 24 years age bracket for the primary householder has the lowest median household income of $0, with 68 households (2.5%) in this group.
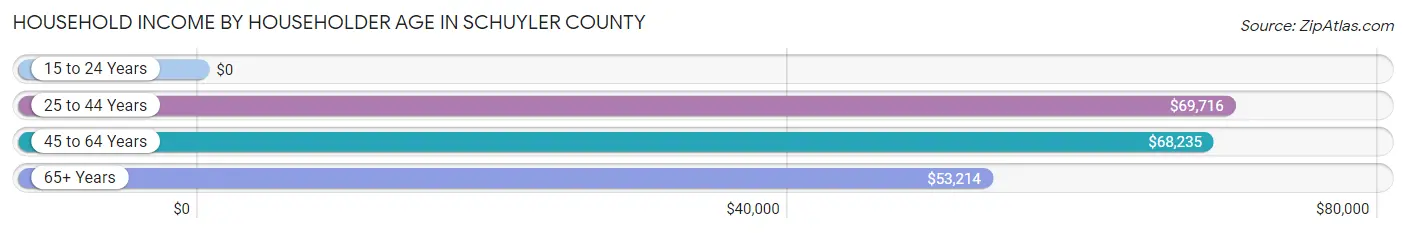
| Income Bracket | # Households | Median Income |
| 15 to 24 Years | 68 (2.5%) | $0 |
| 25 to 44 Years | 745 (27.3%) | $69,716 |
| 45 to 64 Years | 1,036 (38.0%) | $68,235 |
| 65+ Years | 876 (32.2%) | $53,214 |
| Total | 2,725 (100.0%) | $63,737 |
Poverty in Schuyler County
Income Below Poverty by Sex and Age in Schuyler County
With 26.0% poverty level for males and 11.2% for females among the residents of Schuyler County, 55 to 64 year old males and 5 year old females are the most vulnerable to poverty, with 265 males (41.1%) and 32 females (45.7%) in their respective age groups living below the poverty level.
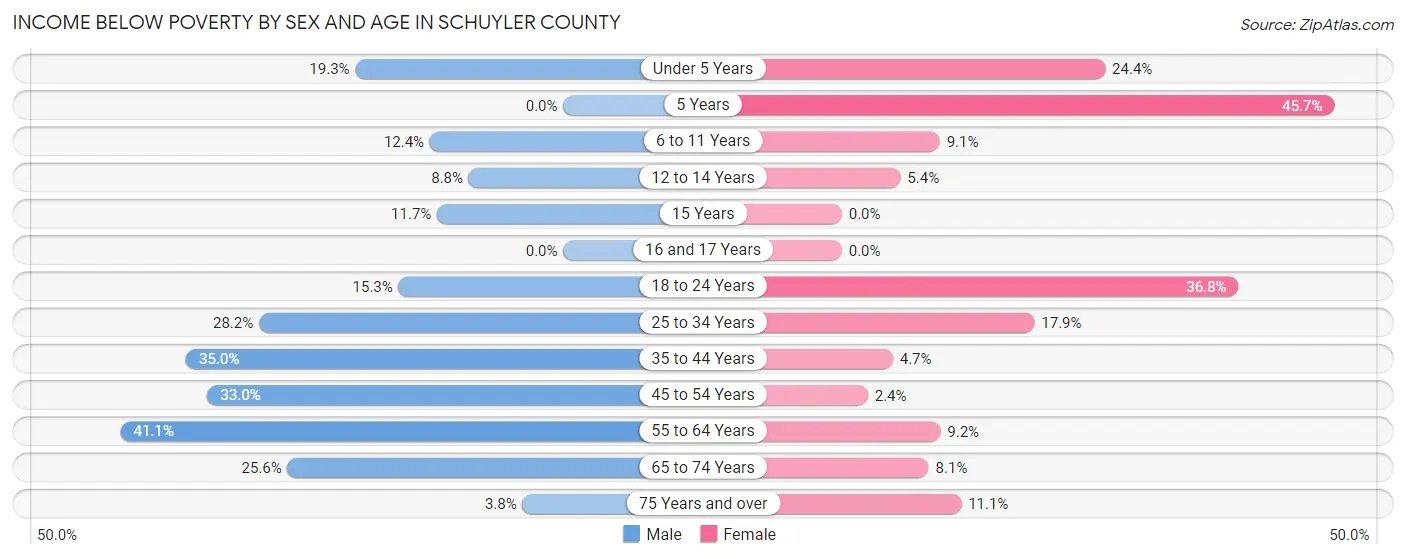
| Age Bracket | Male | Female |
| Under 5 Years | 33 (19.3%) | 22 (24.4%) |
| 5 Years | 0 (0.0%) | 32 (45.7%) |
| 6 to 11 Years | 25 (12.4%) | 12 (9.1%) |
| 12 to 14 Years | 10 (8.8%) | 8 (5.4%) |
| 15 Years | 13 (11.7%) | 0 (0.0%) |
| 16 and 17 Years | 0 (0.0%) | 0 (0.0%) |
| 18 to 24 Years | 39 (15.3%) | 53 (36.8%) |
| 25 to 34 Years | 109 (28.2%) | 62 (17.9%) |
| 35 to 44 Years | 159 (35.0%) | 16 (4.7%) |
| 45 to 54 Years | 183 (33.0%) | 9 (2.4%) |
| 55 to 64 Years | 265 (41.1%) | 42 (9.1%) |
| 65 to 74 Years | 140 (25.6%) | 35 (8.1%) |
| 75 Years and over | 11 (3.8%) | 40 (11.1%) |
| Total | 987 (26.0%) | 331 (11.2%) |
Income Above Poverty by Sex and Age in Schuyler County
According to the poverty statistics in Schuyler County, males aged 5 years and females aged 16 and 17 years are the age groups that are most secure financially, with 100.0% of males and 100.0% of females in these age groups living above the poverty line.
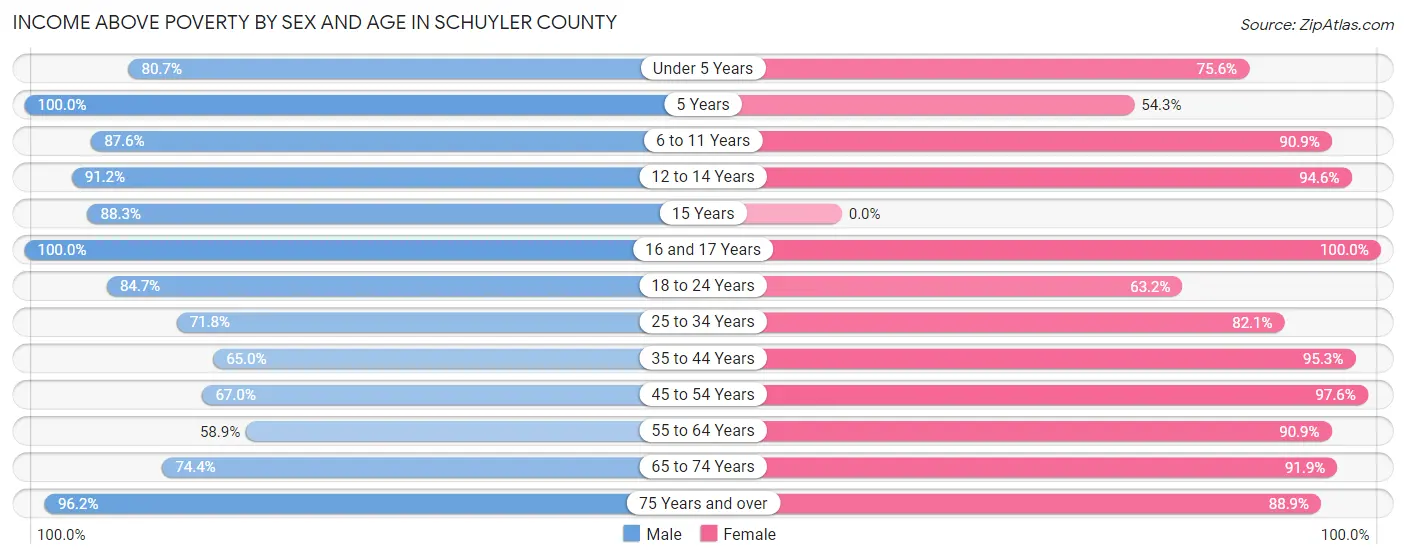
| Age Bracket | Male | Female |
| Under 5 Years | 138 (80.7%) | 68 (75.6%) |
| 5 Years | 23 (100.0%) | 38 (54.3%) |
| 6 to 11 Years | 177 (87.6%) | 120 (90.9%) |
| 12 to 14 Years | 104 (91.2%) | 139 (94.6%) |
| 15 Years | 98 (88.3%) | 0 (0.0%) |
| 16 and 17 Years | 38 (100.0%) | 71 (100.0%) |
| 18 to 24 Years | 216 (84.7%) | 91 (63.2%) |
| 25 to 34 Years | 277 (71.8%) | 285 (82.1%) |
| 35 to 44 Years | 295 (65.0%) | 322 (95.3%) |
| 45 to 54 Years | 371 (67.0%) | 365 (97.6%) |
| 55 to 64 Years | 380 (58.9%) | 417 (90.8%) |
| 65 to 74 Years | 407 (74.4%) | 399 (91.9%) |
| 75 Years and over | 279 (96.2%) | 321 (88.9%) |
| Total | 2,803 (74.0%) | 2,636 (88.8%) |
Income Below Poverty Among Married-Couple Families in Schuyler County
The poverty statistics for married-couple families in Schuyler County show that 6.4% or 79 of the total 1,239 families live below the poverty line. Families with 3 or 4 children have the highest poverty rate of 22.9%, comprising of 30 families. On the other hand, families with no children have the lowest poverty rate of 4.4%, which includes 36 families.
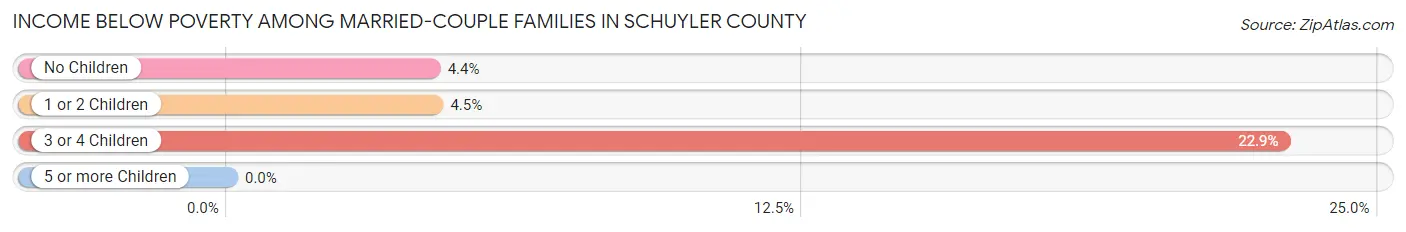
| Children | Above Poverty | Below Poverty |
| No Children | 781 (95.6%) | 36 (4.4%) |
| 1 or 2 Children | 278 (95.5%) | 13 (4.5%) |
| 3 or 4 Children | 101 (77.1%) | 30 (22.9%) |
| 5 or more Children | 0 (0.0%) | 0 (0.0%) |
| Total | 1,160 (93.6%) | 79 (6.4%) |
Income Below Poverty Among Single-Parent Households in Schuyler County
According to the poverty data in Schuyler County, 3.1% or 3 single-father households and 13.1% or 34 single-mother households are living below the poverty line. Among single-father households, those with no children have the highest poverty rate, with 3 households (9.7%) experiencing poverty. Likewise, among single-mother households, those with 1 or 2 children have the highest poverty rate, with 34 households (21.0%) falling below the poverty line.
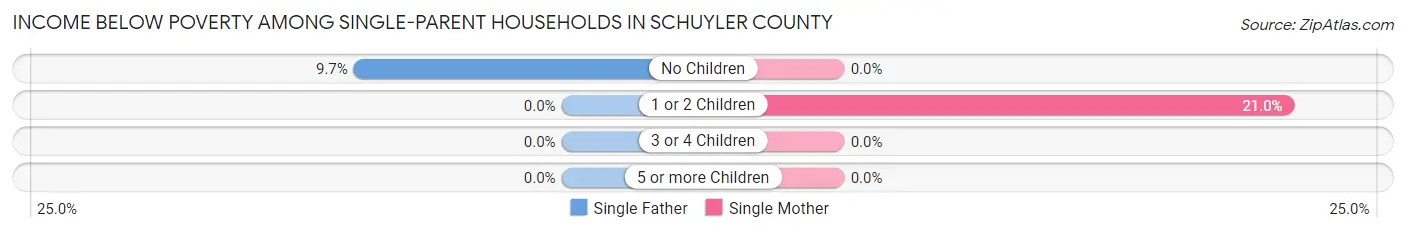
| Children | Single Father | Single Mother |
| No Children | 3 (9.7%) | 0 (0.0%) |
| 1 or 2 Children | 0 (0.0%) | 34 (21.0%) |
| 3 or 4 Children | 0 (0.0%) | 0 (0.0%) |
| 5 or more Children | 0 (0.0%) | 0 (0.0%) |
| Total | 3 (3.1%) | 34 (13.1%) |
Income Below Poverty Among Married-Couple vs Single-Parent Households in Schuyler County
The poverty data for Schuyler County shows that 79 of the married-couple family households (6.4%) and 37 of the single-parent households (10.4%) are living below the poverty level. Within the married-couple family households, those with 3 or 4 children have the highest poverty rate, with 30 households (22.9%) falling below the poverty line. Among the single-parent households, those with 1 or 2 children have the highest poverty rate, with 34 household (15.4%) living below poverty.
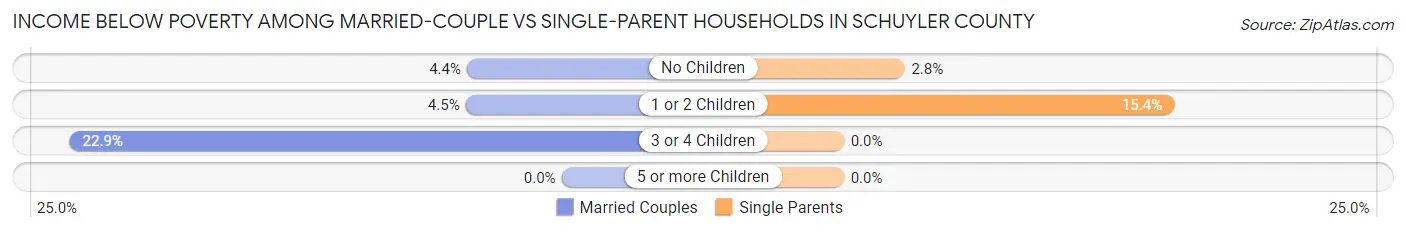
| Children | Married-Couple Families | Single-Parent Households |
| No Children | 36 (4.4%) | 3 (2.8%) |
| 1 or 2 Children | 13 (4.5%) | 34 (15.4%) |
| 3 or 4 Children | 30 (22.9%) | 0 (0.0%) |
| 5 or more Children | 0 (0.0%) | 0 (0.0%) |
| Total | 79 (6.4%) | 37 (10.4%) |
Race in Schuyler County
The most populous races in Schuyler County are White / Caucasian (6,378 | 92.7%), Black / African American (255 | 3.7%), and Hispanic or Latino (173 | 2.5%).
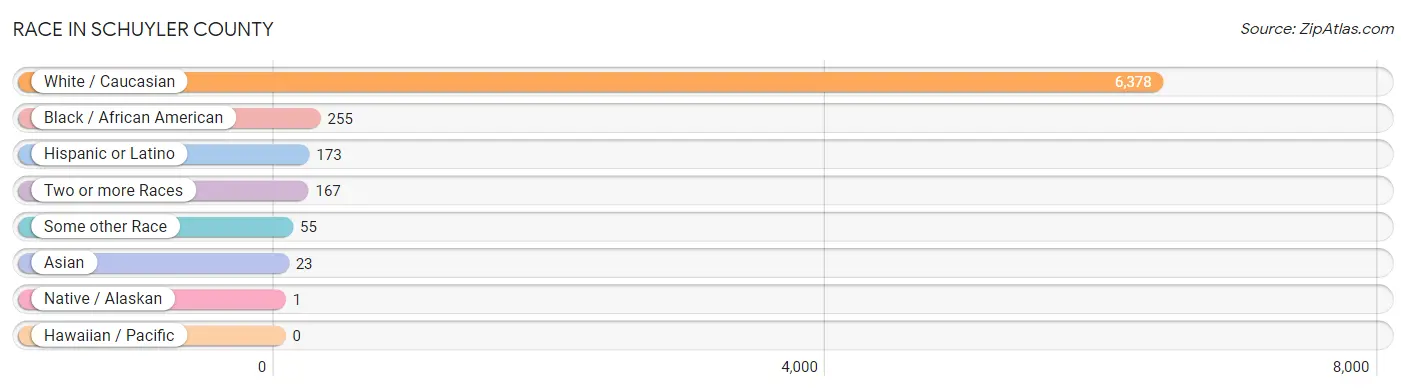
| Race | # Population | % Population |
| Asian | 23 | 0.3% |
| Black / African American | 255 | 3.7% |
| Hawaiian / Pacific | 0 | 0.0% |
| Hispanic or Latino | 173 | 2.5% |
| Native / Alaskan | 1 | 0.0% |
| White / Caucasian | 6,378 | 92.7% |
| Two or more Races | 167 | 2.4% |
| Some other Race | 55 | 0.8% |
| Total | 6,879 | 100.0% |
Ancestry in Schuyler County
The most populous ancestries reported in Schuyler County are German (1,459 | 21.2%), English (1,086 | 15.8%), Irish (686 | 10.0%), American (592 | 8.6%), and French (190 | 2.8%), together accounting for 58.3% of all Schuyler County residents.
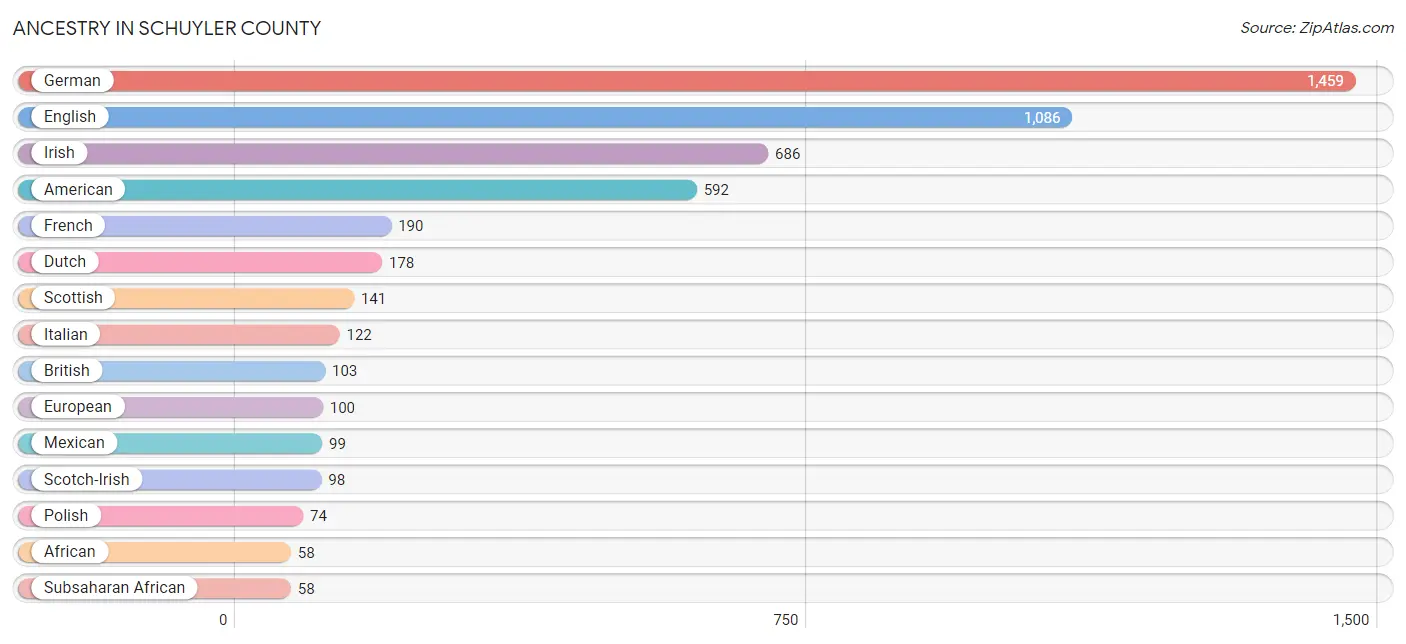
| Ancestry | # Population | % Population |
| African | 58 | 0.8% |
| American | 592 | 8.6% |
| Arab | 53 | 0.8% |
| British | 103 | 1.5% |
| Canadian | 9 | 0.1% |
| Central American | 46 | 0.7% |
| Cherokee | 15 | 0.2% |
| Czech | 11 | 0.2% |
| Danish | 25 | 0.4% |
| Dutch | 178 | 2.6% |
| English | 1,086 | 15.8% |
| European | 100 | 1.5% |
| French | 190 | 2.8% |
| French Canadian | 19 | 0.3% |
| German | 1,459 | 21.2% |
| Guatemalan | 46 | 0.7% |
| Hungarian | 11 | 0.2% |
| Irish | 686 | 10.0% |
| Italian | 122 | 1.8% |
| Korean | 30 | 0.4% |
| Mexican | 99 | 1.4% |
| Moroccan | 53 | 0.8% |
| Northern European | 3 | 0.0% |
| Norwegian | 26 | 0.4% |
| Pennsylvania German | 16 | 0.2% |
| Polish | 74 | 1.1% |
| Puerto Rican | 3 | 0.0% |
| Romanian | 6 | 0.1% |
| Scandinavian | 16 | 0.2% |
| Scotch-Irish | 98 | 1.4% |
| Scottish | 141 | 2.1% |
| Sioux | 2 | 0.0% |
| Slovak | 4 | 0.1% |
| Spaniard | 5 | 0.1% |
| Subsaharan African | 58 | 0.8% |
| Swedish | 12 | 0.2% |
| Swiss | 24 | 0.4% |
| Thai | 15 | 0.2% |
| Welsh | 53 | 0.8% | View All 39 Rows |
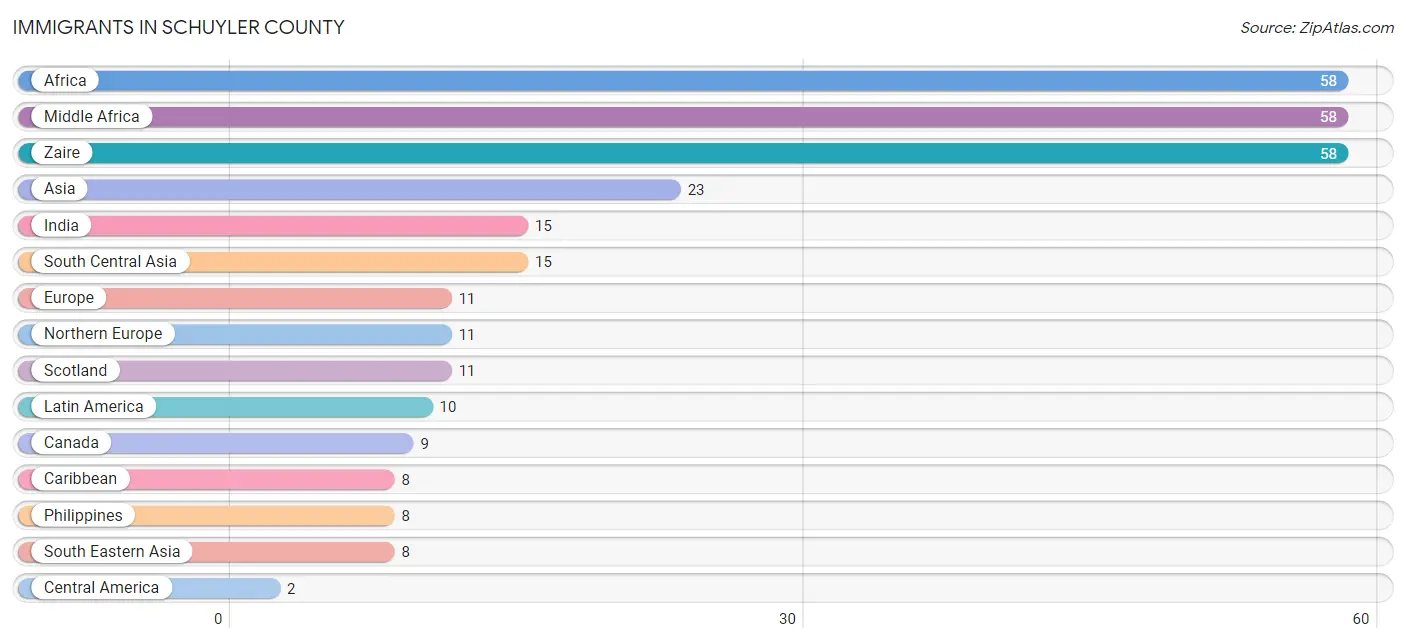
Immigrants in Schuyler County
The most numerous immigrant groups reported in Schuyler County came from Africa (58 | 0.8%), Middle Africa (58 | 0.8%), Zaire (58 | 0.8%), Asia (23 | 0.3%), and India (15 | 0.2%), together accounting for 3.1% of all Schuyler County residents.
| Immigration Origin | # Population | % Population |
| Africa | 58 | 0.8% |
| Asia | 23 | 0.3% |
| Canada | 9 | 0.1% |
| Caribbean | 8 | 0.1% |
| Central America | 2 | 0.0% |
| Europe | 11 | 0.2% |
| India | 15 | 0.2% |
| Latin America | 10 | 0.2% |
| Mexico | 2 | 0.0% |
| Middle Africa | 58 | 0.8% |
| Northern Europe | 11 | 0.2% |
| Philippines | 8 | 0.1% |
| Scotland | 11 | 0.2% |
| South Central Asia | 15 | 0.2% |
| South Eastern Asia | 8 | 0.1% |
| Zaire | 58 | 0.8% | View All 16 Rows |
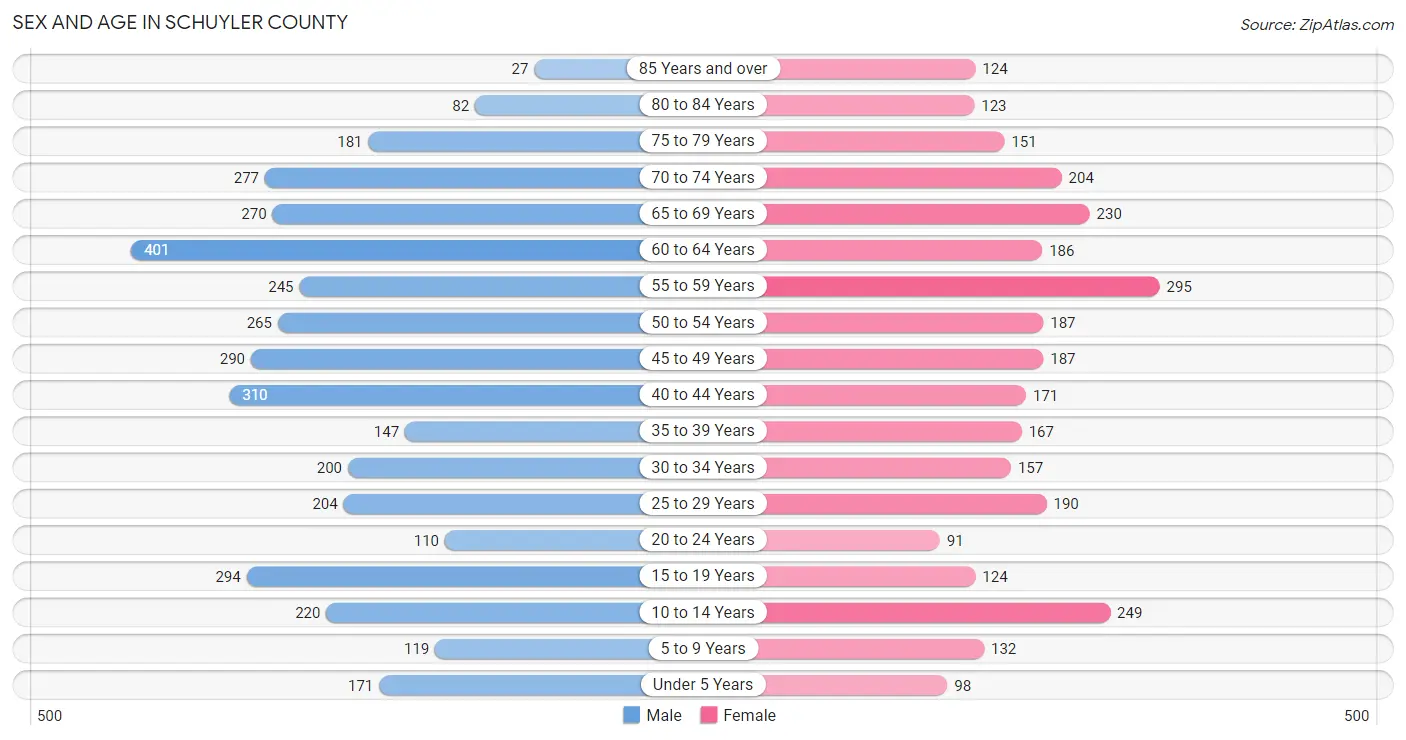
Sex and Age in Schuyler County
Sex and Age in Schuyler County
The most populous age groups in Schuyler County are 60 to 64 Years (401 | 10.5%) for men and 55 to 59 Years (295 | 9.6%) for women.
| Age Bracket | Male | Female |
| Under 5 Years | 171 (4.5%) | 98 (3.2%) |
| 5 to 9 Years | 119 (3.1%) | 132 (4.3%) |
| 10 to 14 Years | 220 (5.8%) | 249 (8.1%) |
| 15 to 19 Years | 294 (7.7%) | 124 (4.0%) |
| 20 to 24 Years | 110 (2.9%) | 91 (3.0%) |
| 25 to 29 Years | 204 (5.3%) | 190 (6.2%) |
| 30 to 34 Years | 200 (5.2%) | 157 (5.1%) |
| 35 to 39 Years | 147 (3.9%) | 167 (5.4%) |
| 40 to 44 Years | 310 (8.1%) | 171 (5.6%) |
| 45 to 49 Years | 290 (7.6%) | 187 (6.1%) |
| 50 to 54 Years | 265 (7.0%) | 187 (6.1%) |
| 55 to 59 Years | 245 (6.4%) | 295 (9.6%) |
| 60 to 64 Years | 401 (10.5%) | 186 (6.1%) |
| 65 to 69 Years | 270 (7.1%) | 230 (7.5%) |
| 70 to 74 Years | 277 (7.3%) | 204 (6.7%) |
| 75 to 79 Years | 181 (4.8%) | 151 (4.9%) |
| 80 to 84 Years | 82 (2.1%) | 123 (4.0%) |
| 85 Years and over | 27 (0.7%) | 124 (4.0%) |
| Total | 3,813 (100.0%) | 3,066 (100.0%) |
Families and Households in Schuyler County
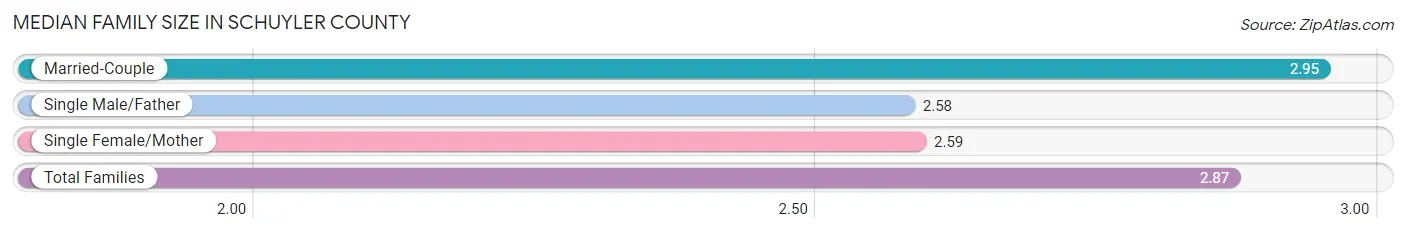
Median Family Size in Schuyler County
The median family size in Schuyler County is 2.87 persons per family, with married-couple families (1,239 | 77.6%) accounting for the largest median family size of 2.95 persons per family. On the other hand, single male/father families (97 | 6.1%) represent the smallest median family size with 2.58 persons per family.
| Family Type | # Families | Family Size |
| Married-Couple | 1,239 (77.6%) | 2.95 |
| Single Male/Father | 97 (6.1%) | 2.58 |
| Single Female/Mother | 260 (16.3%) | 2.59 |
| Total Families | 1,596 (100.0%) | 2.87 |
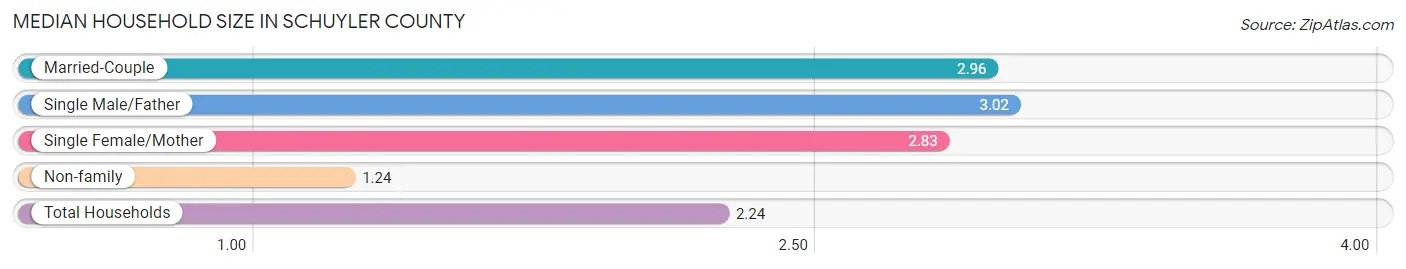
Median Household Size in Schuyler County
The median household size in Schuyler County is 2.24 persons per household, with single male/father households (97 | 3.6%) accounting for the largest median household size of 3.02 persons per household. non-family households (1,129 | 41.4%) represent the smallest median household size with 1.24 persons per household.
| Household Type | # Households | Household Size |
| Married-Couple | 1,239 (45.5%) | 2.96 |
| Single Male/Father | 97 (3.6%) | 3.02 |
| Single Female/Mother | 260 (9.5%) | 2.83 |
| Non-family | 1,129 (41.4%) | 1.24 |
| Total Households | 2,725 (100.0%) | 2.24 |
Household Size by Marriage Status in Schuyler County
Out of a total of 2,725 households in Schuyler County, 1,596 (58.6%) are family households, while 1,129 (41.4%) are nonfamily households. The most numerous type of family households are 2-person households, comprising 848, and the most common type of nonfamily households are 1-person households, comprising 852.
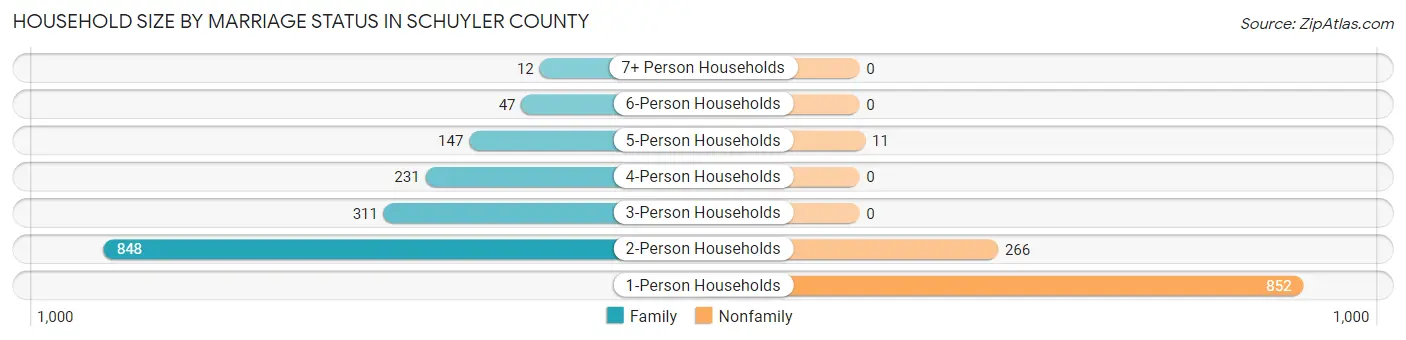
| Household Size | Family Households | Nonfamily Households |
| 1-Person Households | - | 852 (31.3%) |
| 2-Person Households | 848 (31.1%) | 266 (9.8%) |
| 3-Person Households | 311 (11.4%) | 0 (0.0%) |
| 4-Person Households | 231 (8.5%) | 0 (0.0%) |
| 5-Person Households | 147 (5.4%) | 11 (0.4%) |
| 6-Person Households | 47 (1.7%) | 0 (0.0%) |
| 7+ Person Households | 12 (0.4%) | 0 (0.0%) |
| Total | 1,596 (58.6%) | 1,129 (41.4%) |
Female Fertility in Schuyler County
Fertility by Age in Schuyler County
Average fertility rate in Schuyler County is 51.0 births per 1,000 women. Women in the age bracket of 20 to 34 years have the highest fertility rate with 105.0 births per 1,000 women. Women in the age bracket of 20 to 34 years acount for 79.3% of all women with births.
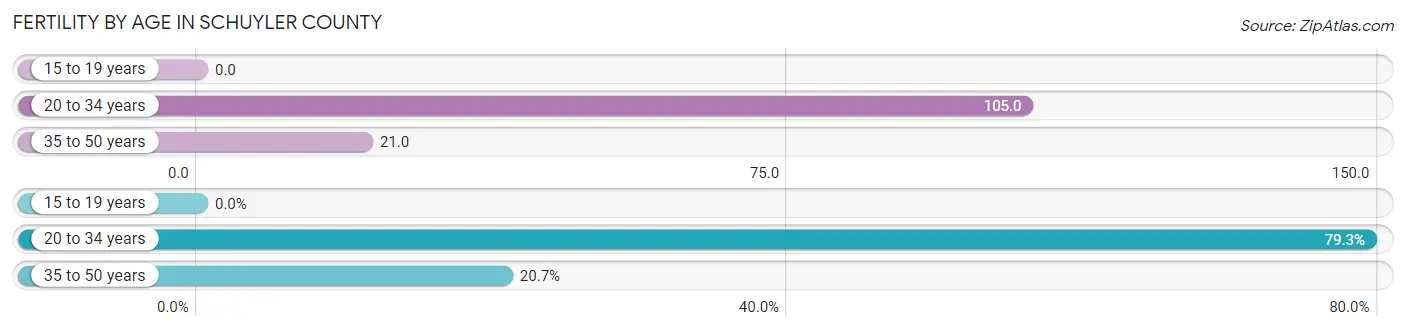
| Age Bracket | Women with Births | Births / 1,000 Women |
| 15 to 19 years | 0 (0.0%) | 0.0 |
| 20 to 34 years | 46 (79.3%) | 105.0 |
| 35 to 50 years | 12 (20.7%) | 21.0 |
| Total | 58 (100.0%) | 51.0 |
Fertility by Age by Marriage Status in Schuyler County
48.3% of women with births (58) in Schuyler County are married. The highest percentage of unmarried women with births falls into 35 to 50 years age bracket with 100.0% of them unmarried at the time of birth, while the lowest percentage of unmarried women with births belong to 20 to 34 years age bracket with 39.1% of them unmarried.
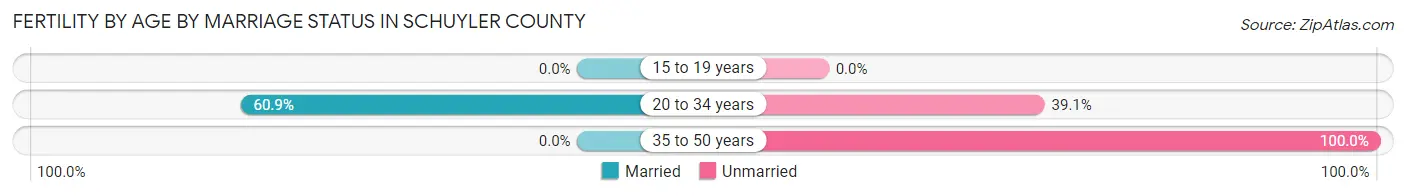
| Age Bracket | Married | Unmarried |
| 15 to 19 years | 0 (0.0%) | 0 (0.0%) |
| 20 to 34 years | 28 (60.9%) | 18 (39.1%) |
| 35 to 50 years | 0 (0.0%) | 12 (100.0%) |
| Total | 28 (48.3%) | 30 (51.7%) |
Fertility by Education in Schuyler County
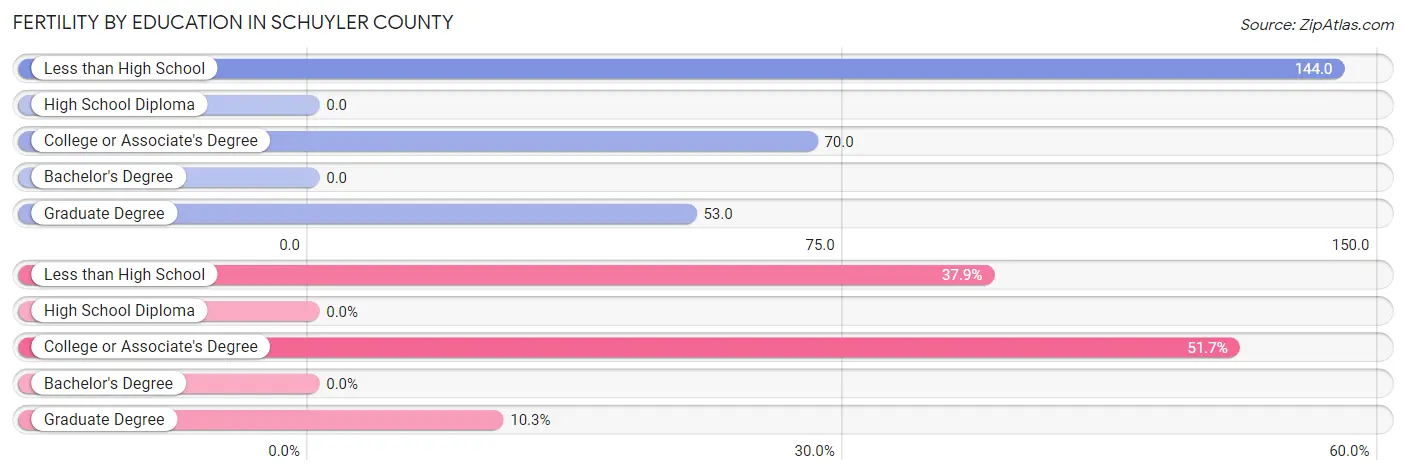
| Educational Attainment | Women with Births | Births / 1,000 Women |
| Less than High School | 22 (37.9%) | 144.0 |
| High School Diploma | 0 (0.0%) | 0.0 |
| College or Associate's Degree | 30 (51.7%) | 70.0 |
| Bachelor's Degree | 0 (0.0%) | 0.0 |
| Graduate Degree | 6 (10.3%) | 53.0 |
| Total | 58 (100.0%) | 51.0 |
Fertility by Education by Marriage Status in Schuyler County
51.7% of women with births in Schuyler County are unmarried. Women with the educational attainment of less than high school are most likely to be married with 100.0% of them married at childbirth, while women with the educational attainment of college or associate's degree are least likely to be married with 100.0% of them unmarried at childbirth.
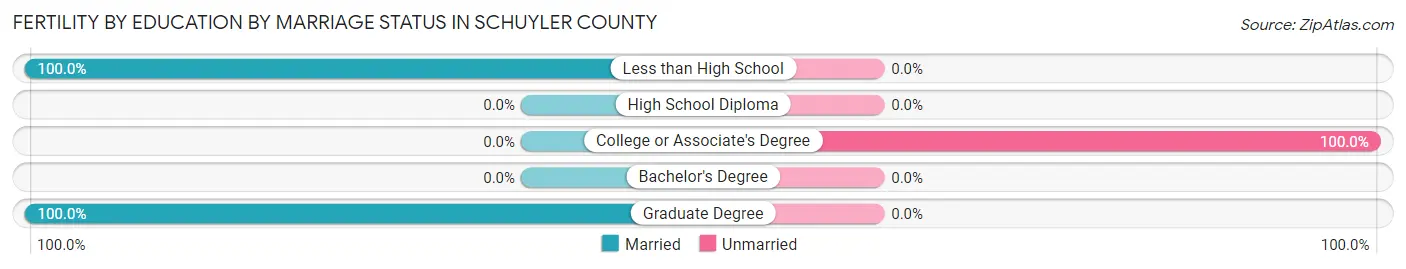
| Educational Attainment | Married | Unmarried |
| Less than High School | 22 (100.0%) | 0 (0.0%) |
| High School Diploma | 0 (0.0%) | 0 (0.0%) |
| College or Associate's Degree | 0 (0.0%) | 30 (100.0%) |
| Bachelor's Degree | 0 (0.0%) | 0 (0.0%) |
| Graduate Degree | 6 (100.0%) | 0 (0.0%) |
| Total | 28 (48.3%) | 30 (51.7%) |
Employment Characteristics in Schuyler County
Employment by Class of Employer in Schuyler County
Among the 2,946 employed individuals in Schuyler County, private company employees (1,665 | 56.5%), local government employees (391 | 13.3%), and state government employees (317 | 10.8%) make up the most common classes of employment.
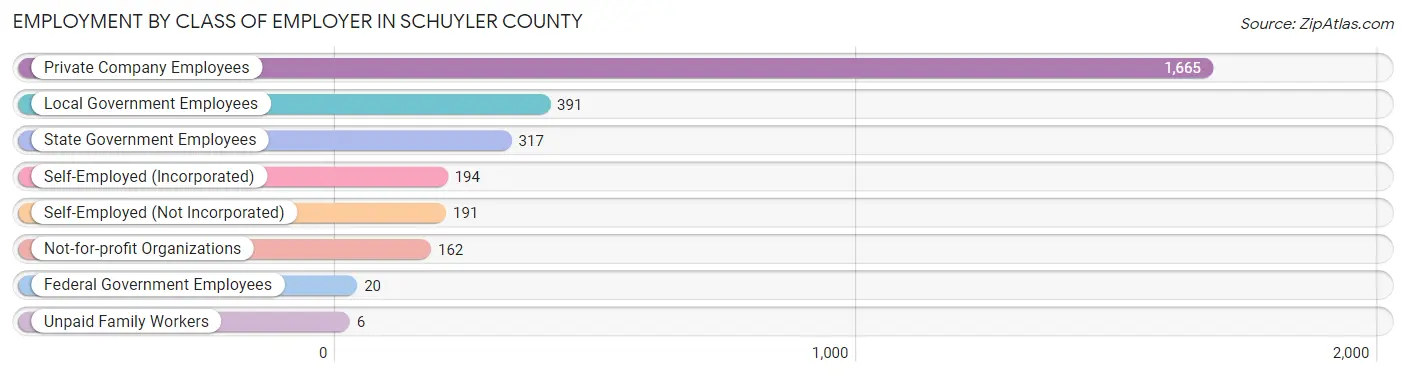
| Employer Class | # Employees | % Employees |
| Private Company Employees | 1,665 | 56.5% |
| Self-Employed (Incorporated) | 194 | 6.6% |
| Self-Employed (Not Incorporated) | 191 | 6.5% |
| Not-for-profit Organizations | 162 | 5.5% |
| Local Government Employees | 391 | 13.3% |
| State Government Employees | 317 | 10.8% |
| Federal Government Employees | 20 | 0.7% |
| Unpaid Family Workers | 6 | 0.2% |
| Total | 2,946 | 100.0% |
Employment Status by Age in Schuyler County
According to the labor force statistics for Schuyler County, out of the total population over 16 years of age (5,779), 55.4% or 3,202 individuals are in the labor force, with 6.7% or 215 of them unemployed. The age group with the highest labor force participation rate is 20 to 24 years, with 87.1% or 175 individuals in the labor force. Within the labor force, the 20 to 24 years age range has the highest percentage of unemployed individuals, with 27.4% or 48 of them being unemployed.
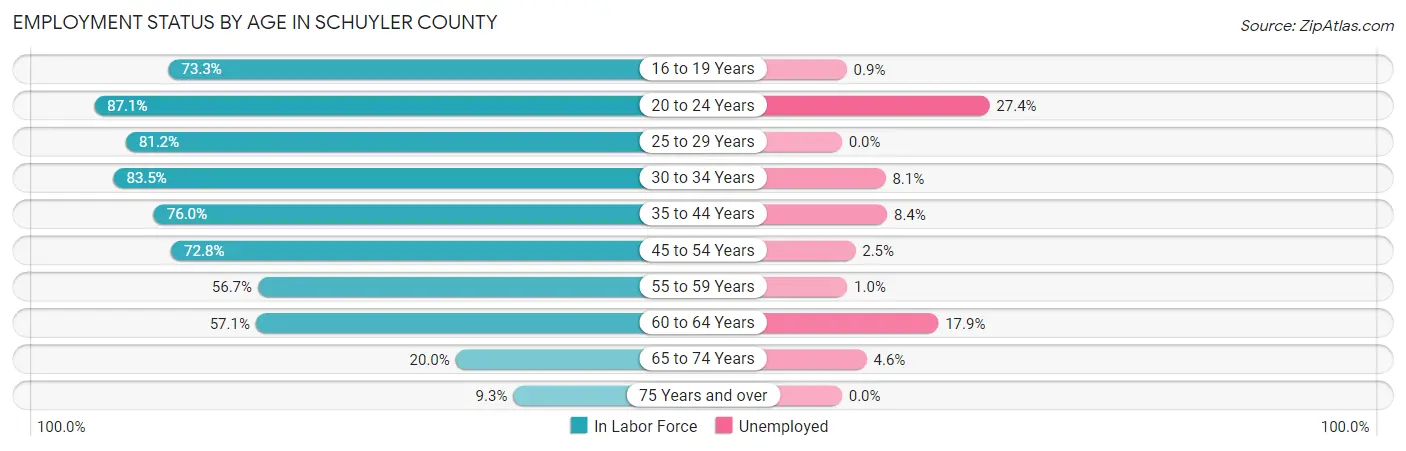
| Age Bracket | In Labor Force | Unemployed |
| 16 to 19 Years | 225 (73.3%) | 2 (0.9%) |
| 20 to 24 Years | 175 (87.1%) | 48 (27.4%) |
| 25 to 29 Years | 320 (81.2%) | 0 (0.0%) |
| 30 to 34 Years | 298 (83.5%) | 24 (8.1%) |
| 35 to 44 Years | 604 (76.0%) | 51 (8.4%) |
| 45 to 54 Years | 676 (72.8%) | 17 (2.5%) |
| 55 to 59 Years | 306 (56.7%) | 3 (1.0%) |
| 60 to 64 Years | 335 (57.1%) | 60 (17.9%) |
| 65 to 74 Years | 196 (20.0%) | 9 (4.6%) |
| 75 Years and over | 64 (9.3%) | 0 (0.0%) |
| Total | 3,202 (55.4%) | 215 (6.7%) |
Employment Status by Educational Attainment in Schuyler County
According to labor force statistics for Schuyler County, 70.5% of individuals (2,539) out of the total population between 25 and 64 years of age (3,602) are in the labor force, with 6.1% or 155 of them being unemployed. The group with the highest labor force participation rate are those with the educational attainment of bachelor's degree or higher, with 88.6% or 619 individuals in the labor force. Within the labor force, individuals with less than high school education have the highest percentage of unemployment, with 45.2% or 47 of them being unemployed.
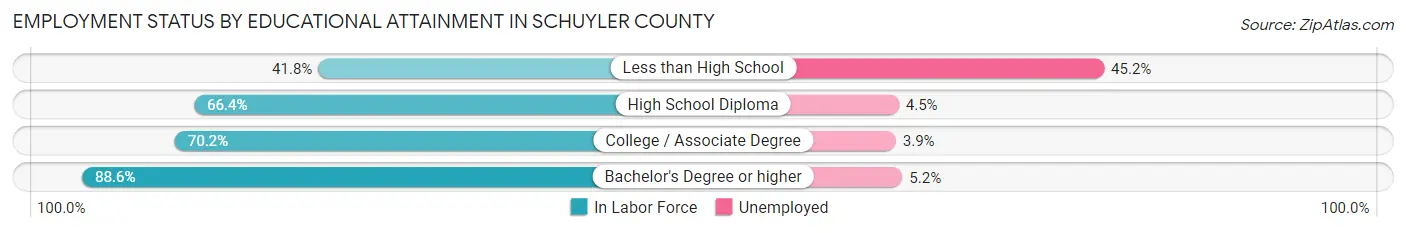
| Educational Attainment | In Labor Force | Unemployed |
| Less than High School | 104 (41.8%) | 113 (45.2%) |
| High School Diploma | 817 (66.4%) | 55 (4.5%) |
| College / Associate Degree | 1,000 (70.2%) | 56 (3.9%) |
| Bachelor's Degree or higher | 619 (88.6%) | 36 (5.2%) |
| Total | 2,539 (70.5%) | 220 (6.1%) |
Employment Occupations by Sex in Schuyler County
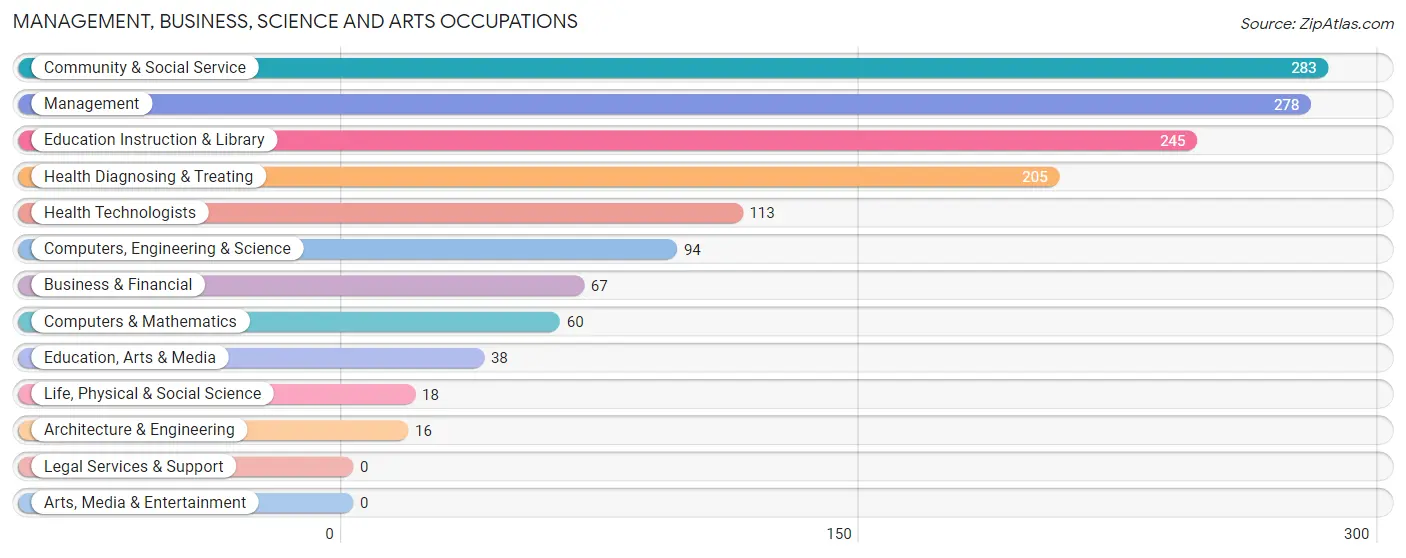
Management, Business, Science and Arts Occupations
The most common Management, Business, Science and Arts occupations in Schuyler County are Community & Social Service (283 | 9.5%), Management (278 | 9.3%), Education Instruction & Library (245 | 8.2%), Health Diagnosing & Treating (205 | 6.9%), and Health Technologists (113 | 3.8%).
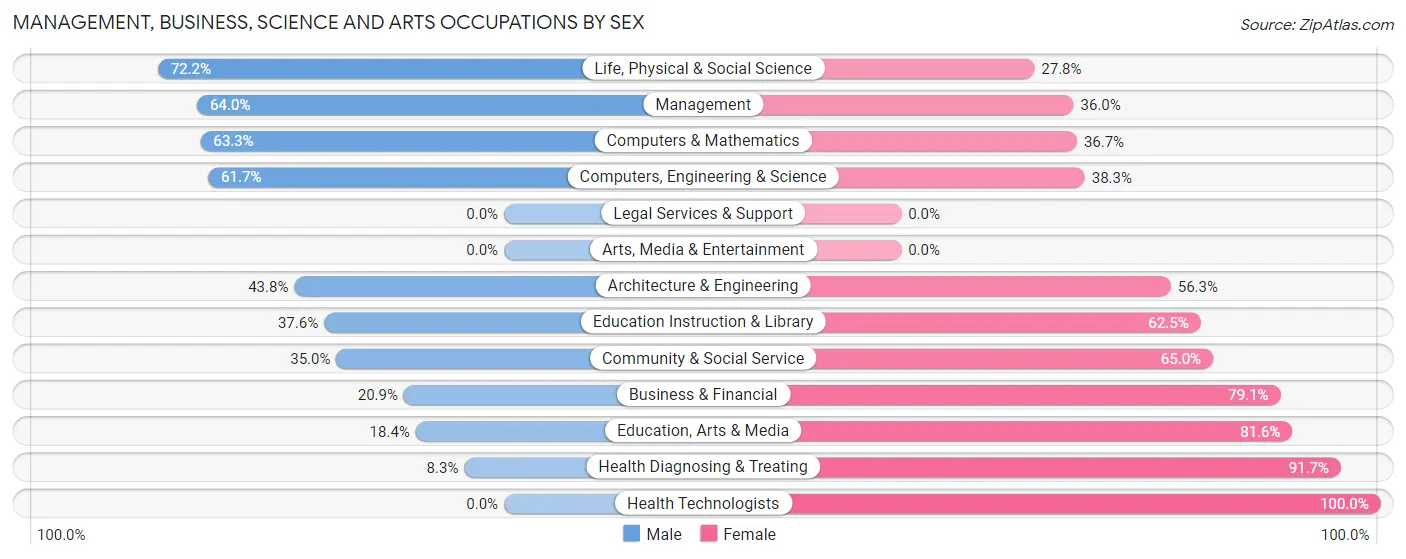
Management, Business, Science and Arts Occupations by Sex
Within the Management, Business, Science and Arts occupations in Schuyler County, the most male-oriented occupations are Life, Physical & Social Science (72.2%), Management (64.0%), and Computers & Mathematics (63.3%), while the most female-oriented occupations are Health Technologists (100.0%), Health Diagnosing & Treating (91.7%), and Education, Arts & Media (81.6%).
| Occupation | Male | Female |
| Management | 178 (64.0%) | 100 (36.0%) |
| Business & Financial | 14 (20.9%) | 53 (79.1%) |
| Computers, Engineering & Science | 58 (61.7%) | 36 (38.3%) |
| Computers & Mathematics | 38 (63.3%) | 22 (36.7%) |
| Architecture & Engineering | 7 (43.8%) | 9 (56.2%) |
| Life, Physical & Social Science | 13 (72.2%) | 5 (27.8%) |
| Community & Social Service | 99 (35.0%) | 184 (65.0%) |
| Education, Arts & Media | 7 (18.4%) | 31 (81.6%) |
| Legal Services & Support | 0 (0.0%) | 0 (0.0%) |
| Education Instruction & Library | 92 (37.6%) | 153 (62.5%) |
| Arts, Media & Entertainment | 0 (0.0%) | 0 (0.0%) |
| Health Diagnosing & Treating | 17 (8.3%) | 188 (91.7%) |
| Health Technologists | 0 (0.0%) | 113 (100.0%) |
| Total (Category) | 366 (39.5%) | 561 (60.5%) |
| Total (Overall) | 1,609 (53.9%) | 1,376 (46.1%) |
Services Occupations
The most common Services occupations in Schuyler County are Cleaning & Maintenance (217 | 7.3%), Healthcare Support (122 | 4.1%), Security & Protection (101 | 3.4%), Law Enforcement (81 | 2.7%), and Food Preparation & Serving (74 | 2.5%).

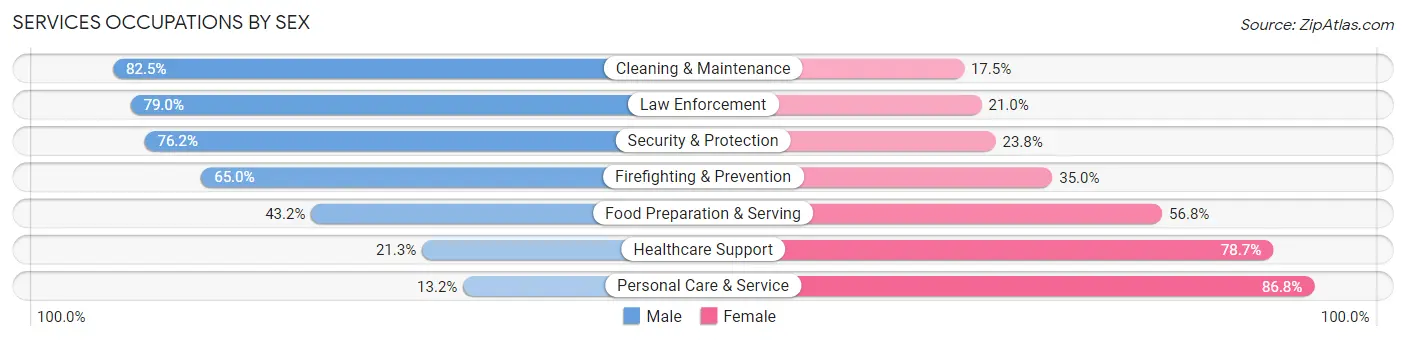
Services Occupations by Sex
Within the Services occupations in Schuyler County, the most male-oriented occupations are Cleaning & Maintenance (82.5%), Law Enforcement (79.0%), and Security & Protection (76.2%), while the most female-oriented occupations are Personal Care & Service (86.8%), Healthcare Support (78.7%), and Food Preparation & Serving (56.8%).
| Occupation | Male | Female |
| Healthcare Support | 26 (21.3%) | 96 (78.7%) |
| Security & Protection | 77 (76.2%) | 24 (23.8%) |
| Firefighting & Prevention | 13 (65.0%) | 7 (35.0%) |
| Law Enforcement | 64 (79.0%) | 17 (21.0%) |
| Food Preparation & Serving | 32 (43.2%) | 42 (56.8%) |
| Cleaning & Maintenance | 179 (82.5%) | 38 (17.5%) |
| Personal Care & Service | 5 (13.2%) | 33 (86.8%) |
| Total (Category) | 319 (57.8%) | 233 (42.2%) |
| Total (Overall) | 1,609 (53.9%) | 1,376 (46.1%) |
Sales and Office Occupations
The most common Sales and Office occupations in Schuyler County are Sales & Related (371 | 12.4%), and Office & Administration (277 | 9.3%).

Sales and Office Occupations by Sex
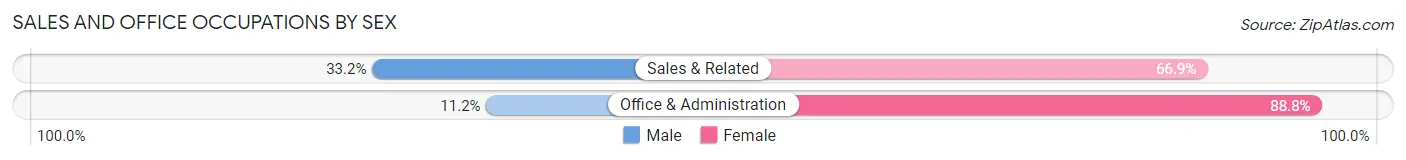
| Occupation | Male | Female |
| Sales & Related | 123 (33.2%) | 248 (66.8%) |
| Office & Administration | 31 (11.2%) | 246 (88.8%) |
| Total (Category) | 154 (23.8%) | 494 (76.2%) |
| Total (Overall) | 1,609 (53.9%) | 1,376 (46.1%) |
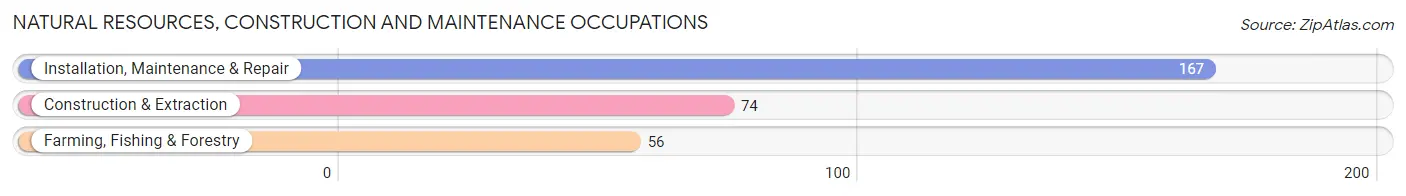
Natural Resources, Construction and Maintenance Occupations
The most common Natural Resources, Construction and Maintenance occupations in Schuyler County are Installation, Maintenance & Repair (167 | 5.6%), Construction & Extraction (74 | 2.5%), and Farming, Fishing & Forestry (56 | 1.9%).
Natural Resources, Construction and Maintenance Occupations by Sex
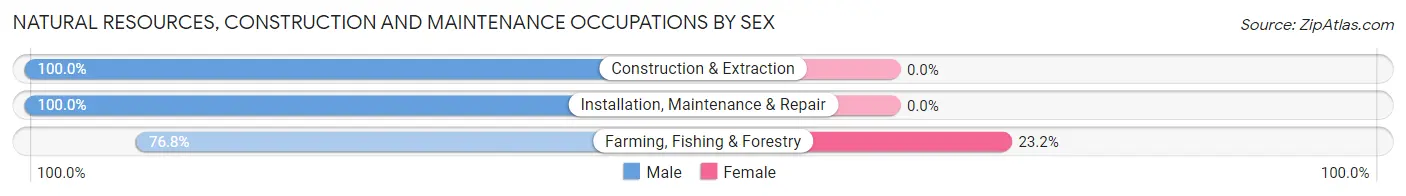
| Occupation | Male | Female |
| Farming, Fishing & Forestry | 43 (76.8%) | 13 (23.2%) |
| Construction & Extraction | 74 (100.0%) | 0 (0.0%) |
| Installation, Maintenance & Repair | 167 (100.0%) | 0 (0.0%) |
| Total (Category) | 284 (95.6%) | 13 (4.4%) |
| Total (Overall) | 1,609 (53.9%) | 1,376 (46.1%) |
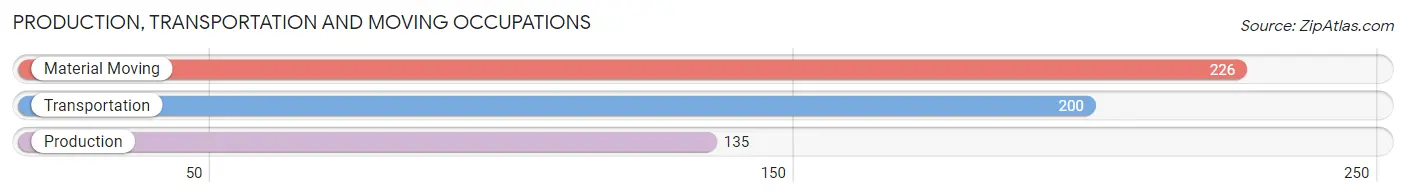
Production, Transportation and Moving Occupations
The most common Production, Transportation and Moving occupations in Schuyler County are Material Moving (226 | 7.6%), Transportation (200 | 6.7%), and Production (135 | 4.5%).
Production, Transportation and Moving Occupations by Sex
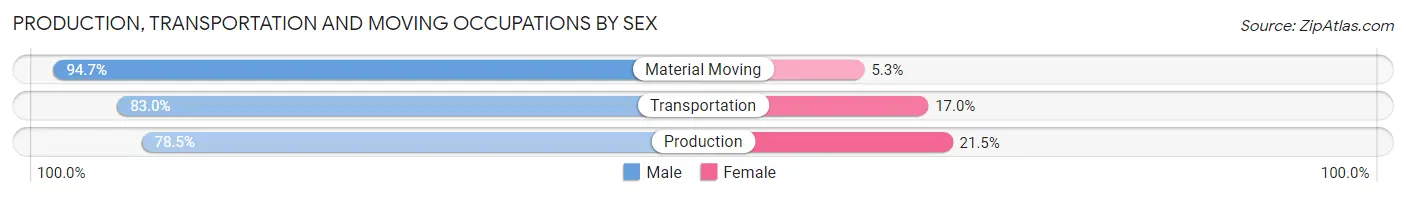
| Occupation | Male | Female |
| Production | 106 (78.5%) | 29 (21.5%) |
| Transportation | 166 (83.0%) | 34 (17.0%) |
| Material Moving | 214 (94.7%) | 12 (5.3%) |
| Total (Category) | 486 (86.6%) | 75 (13.4%) |
| Total (Overall) | 1,609 (53.9%) | 1,376 (46.1%) |
Employment Industries by Sex in Schuyler County
Employment Industries in Schuyler County
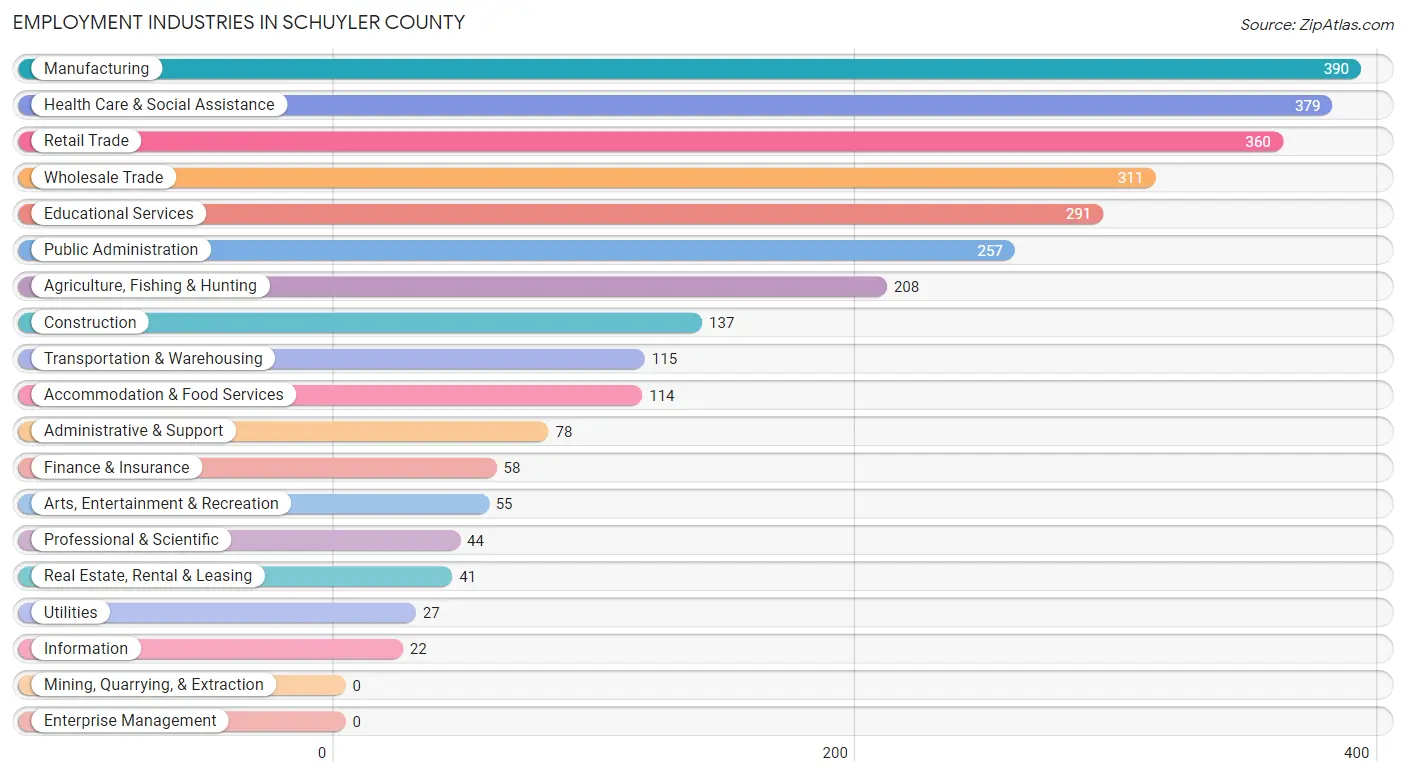
The major employment industries in Schuyler County include Manufacturing (390 | 13.1%), Health Care & Social Assistance (379 | 12.7%), Retail Trade (360 | 12.1%), Wholesale Trade (311 | 10.4%), and Educational Services (291 | 9.8%).
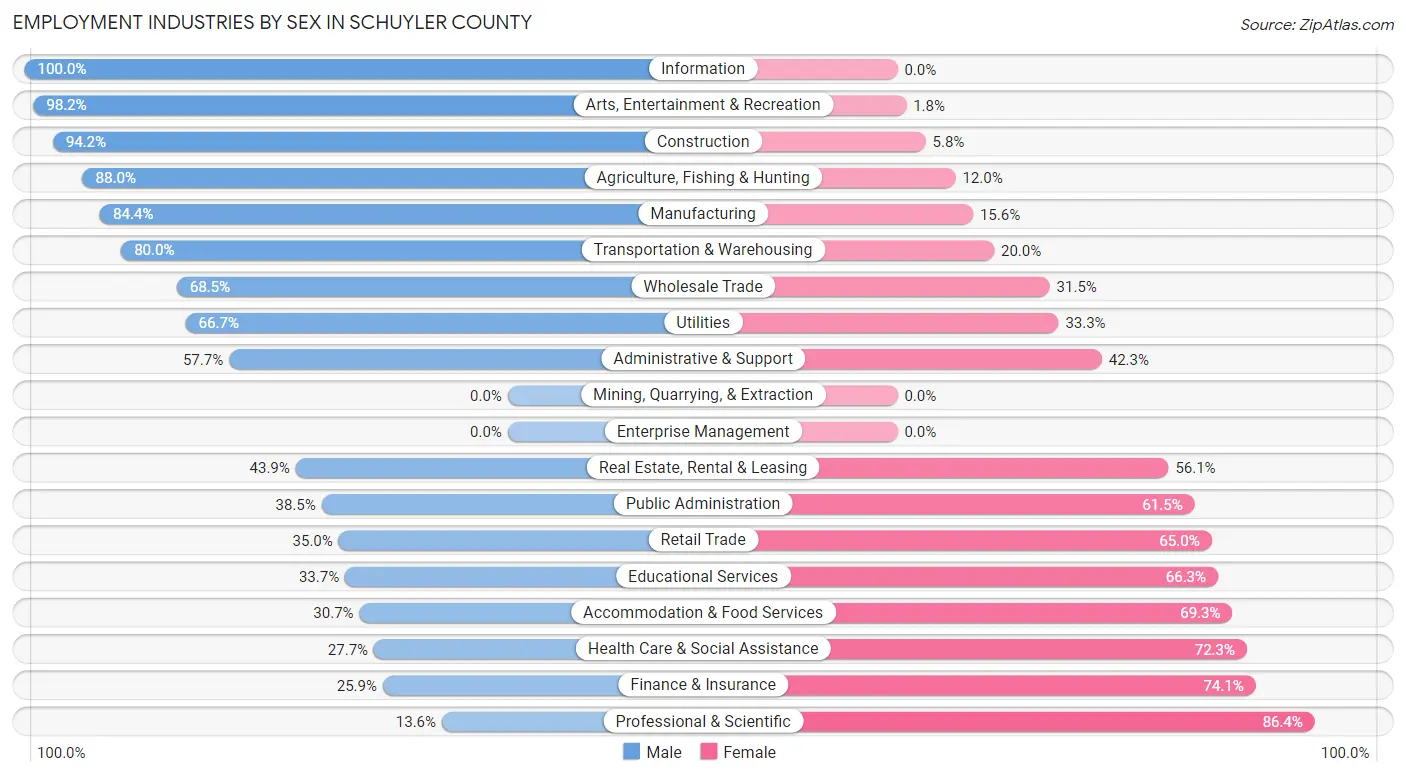
Employment Industries by Sex in Schuyler County
The Schuyler County industries that see more men than women are Information (100.0%), Arts, Entertainment & Recreation (98.2%), and Construction (94.2%), whereas the industries that tend to have a higher number of women are Professional & Scientific (86.4%), Finance & Insurance (74.1%), and Health Care & Social Assistance (72.3%).
| Industry | Male | Female |
| Agriculture, Fishing & Hunting | 183 (88.0%) | 25 (12.0%) |
| Mining, Quarrying, & Extraction | 0 (0.0%) | 0 (0.0%) |
| Construction | 129 (94.2%) | 8 (5.8%) |
| Manufacturing | 329 (84.4%) | 61 (15.6%) |
| Wholesale Trade | 213 (68.5%) | 98 (31.5%) |
| Retail Trade | 126 (35.0%) | 234 (65.0%) |
| Transportation & Warehousing | 92 (80.0%) | 23 (20.0%) |
| Utilities | 18 (66.7%) | 9 (33.3%) |
| Information | 22 (100.0%) | 0 (0.0%) |
| Finance & Insurance | 15 (25.9%) | 43 (74.1%) |
| Real Estate, Rental & Leasing | 18 (43.9%) | 23 (56.1%) |
| Professional & Scientific | 6 (13.6%) | 38 (86.4%) |
| Enterprise Management | 0 (0.0%) | 0 (0.0%) |
| Administrative & Support | 45 (57.7%) | 33 (42.3%) |
| Educational Services | 98 (33.7%) | 193 (66.3%) |
| Health Care & Social Assistance | 105 (27.7%) | 274 (72.3%) |
| Arts, Entertainment & Recreation | 54 (98.2%) | 1 (1.8%) |
| Accommodation & Food Services | 35 (30.7%) | 79 (69.3%) |
| Public Administration | 99 (38.5%) | 158 (61.5%) |
| Total | 1,609 (53.9%) | 1,376 (46.1%) |
Education in Schuyler County
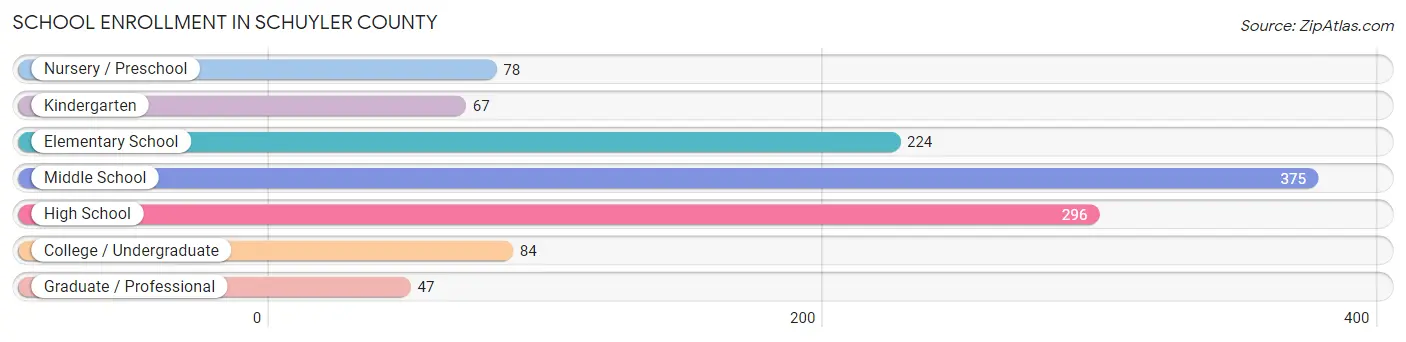
School Enrollment in Schuyler County
The most common levels of schooling among the 1,171 students in Schuyler County are middle school (375 | 32.0%), high school (296 | 25.3%), and elementary school (224 | 19.1%).
| School Level | # Students | % Students |
| Nursery / Preschool | 78 | 6.7% |
| Kindergarten | 67 | 5.7% |
| Elementary School | 224 | 19.1% |
| Middle School | 375 | 32.0% |
| High School | 296 | 25.3% |
| College / Undergraduate | 84 | 7.2% |
| Graduate / Professional | 47 | 4.0% |
| Total | 1,171 | 100.0% |
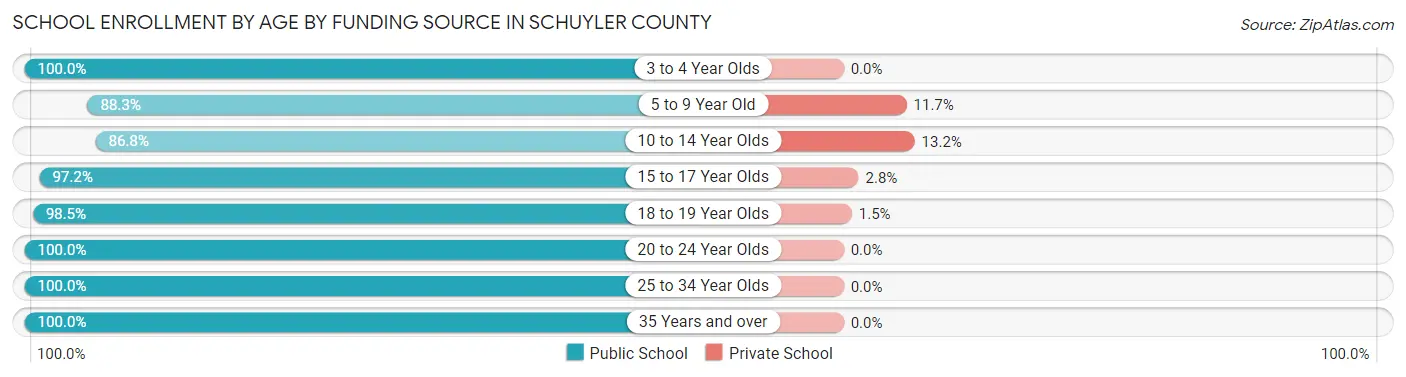
School Enrollment by Age by Funding Source in Schuyler County
Out of a total of 1,171 students who are enrolled in schools in Schuyler County, 98 (8.4%) attend a private institution, while the remaining 1,073 (91.6%) are enrolled in public schools. The age group of 10 to 14 year olds has the highest likelihood of being enrolled in private schools, with 62 (13.2% in the age bracket) enrolled. Conversely, the age group of 3 to 4 year olds has the lowest likelihood of being enrolled in a private school, with 47 (100.0% in the age bracket) attending a public institution.
| Age Bracket | Public School | Private School |
| 3 to 4 Year Olds | 47 (100.0%) | 0 (0.0%) |
| 5 to 9 Year Old | 211 (88.3%) | 28 (11.7%) |
| 10 to 14 Year Olds | 407 (86.8%) | 62 (13.2%) |
| 15 to 17 Year Olds | 210 (97.2%) | 6 (2.8%) |
| 18 to 19 Year Olds | 130 (98.5%) | 2 (1.5%) |
| 20 to 24 Year Olds | 10 (100.0%) | 0 (0.0%) |
| 25 to 34 Year Olds | 18 (100.0%) | 0 (0.0%) |
| 35 Years and over | 40 (100.0%) | 0 (0.0%) |
| Total | 1,073 (91.6%) | 98 (8.4%) |
Educational Attainment by Field of Study in Schuyler County
Education (290 | 31.1%), business (99 | 10.6%), arts & humanities (87 | 9.3%), bio, nature & agricultural (78 | 8.4%), and communications (74 | 8.0%) are the most common fields of study among 931 individuals in Schuyler County who have obtained a bachelor's degree or higher.
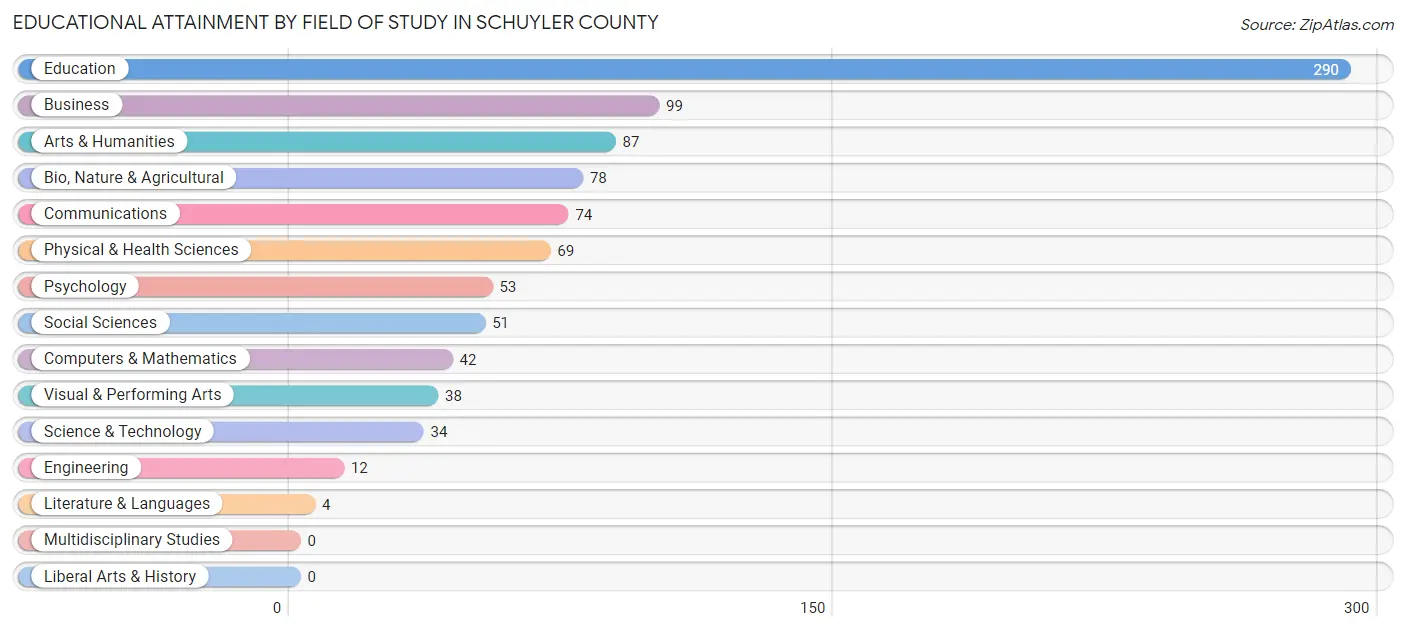
| Field of Study | # Graduates | % Graduates |
| Computers & Mathematics | 42 | 4.5% |
| Bio, Nature & Agricultural | 78 | 8.4% |
| Physical & Health Sciences | 69 | 7.4% |
| Psychology | 53 | 5.7% |
| Social Sciences | 51 | 5.5% |
| Engineering | 12 | 1.3% |
| Multidisciplinary Studies | 0 | 0.0% |
| Science & Technology | 34 | 3.6% |
| Business | 99 | 10.6% |
| Education | 290 | 31.1% |
| Literature & Languages | 4 | 0.4% |
| Liberal Arts & History | 0 | 0.0% |
| Visual & Performing Arts | 38 | 4.1% |
| Communications | 74 | 8.0% |
| Arts & Humanities | 87 | 9.3% |
| Total | 931 | 100.0% |
Transportation & Commute in Schuyler County
Vehicle Availability by Sex in Schuyler County
The most prevalent vehicle ownership categories in Schuyler County are males with 2 vehicles (773, accounting for 50.2%) and females with 2 vehicles (589, making up 57.3%).
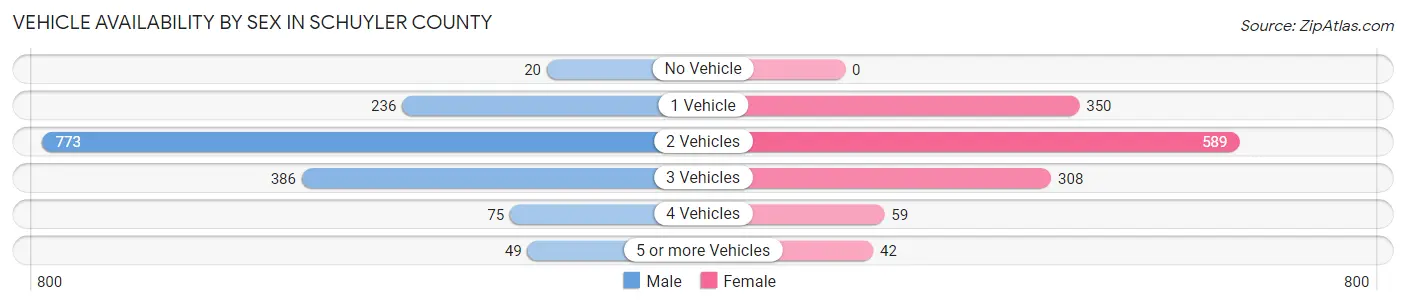
| Vehicles Available | Male | Female |
| No Vehicle | 20 (1.3%) | 0 (0.0%) |
| 1 Vehicle | 236 (15.3%) | 350 (26.0%) |
| 2 Vehicles | 773 (50.2%) | 589 (43.7%) |
| 3 Vehicles | 386 (25.1%) | 308 (22.9%) |
| 4 Vehicles | 75 (4.9%) | 59 (4.4%) |
| 5 or more Vehicles | 49 (3.2%) | 42 (3.1%) |
| Total | 1,539 (100.0%) | 1,348 (100.0%) |
Commute Time in Schuyler County
The most frequently occuring commute durations in Schuyler County are 5 to 9 minutes (703 commuters, 24.9%), 10 to 14 minutes (455 commuters, 16.1%), and 20 to 24 minutes (376 commuters, 13.3%).
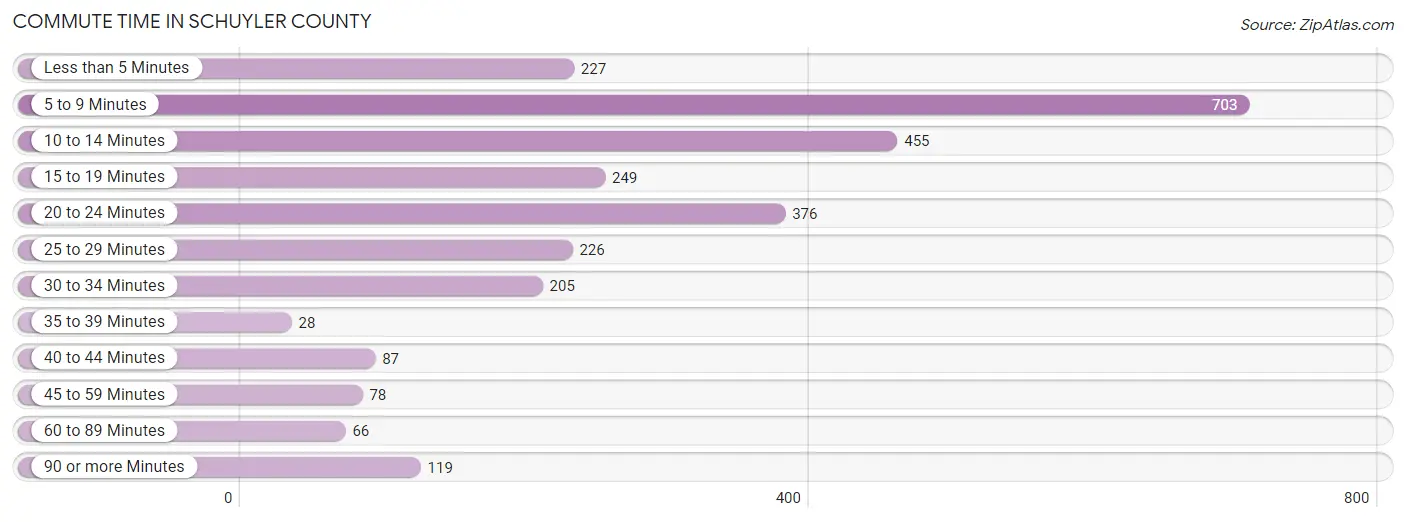
| Commute Time | # Commuters | % Commuters |
| Less than 5 Minutes | 227 | 8.1% |
| 5 to 9 Minutes | 703 | 24.9% |
| 10 to 14 Minutes | 455 | 16.1% |
| 15 to 19 Minutes | 249 | 8.8% |
| 20 to 24 Minutes | 376 | 13.3% |
| 25 to 29 Minutes | 226 | 8.0% |
| 30 to 34 Minutes | 205 | 7.3% |
| 35 to 39 Minutes | 28 | 1.0% |
| 40 to 44 Minutes | 87 | 3.1% |
| 45 to 59 Minutes | 78 | 2.8% |
| 60 to 89 Minutes | 66 | 2.3% |
| 90 or more Minutes | 119 | 4.2% |
Commute Time by Sex in Schuyler County
The most common commute times in Schuyler County are 5 to 9 minutes (332 commuters, 21.5%) for males and 5 to 9 minutes (371 commuters, 29.1%) for females.
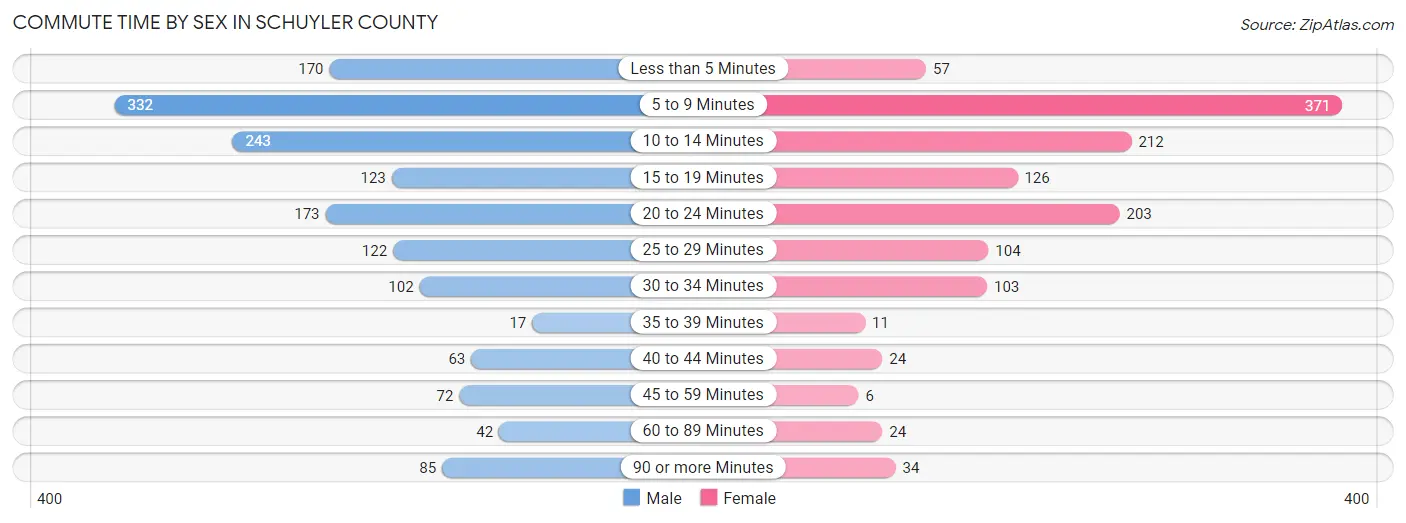
| Commute Time | Male | Female |
| Less than 5 Minutes | 170 (11.0%) | 57 (4.5%) |
| 5 to 9 Minutes | 332 (21.5%) | 371 (29.1%) |
| 10 to 14 Minutes | 243 (15.7%) | 212 (16.6%) |
| 15 to 19 Minutes | 123 (8.0%) | 126 (9.9%) |
| 20 to 24 Minutes | 173 (11.2%) | 203 (15.9%) |
| 25 to 29 Minutes | 122 (7.9%) | 104 (8.2%) |
| 30 to 34 Minutes | 102 (6.6%) | 103 (8.1%) |
| 35 to 39 Minutes | 17 (1.1%) | 11 (0.9%) |
| 40 to 44 Minutes | 63 (4.1%) | 24 (1.9%) |
| 45 to 59 Minutes | 72 (4.7%) | 6 (0.5%) |
| 60 to 89 Minutes | 42 (2.7%) | 24 (1.9%) |
| 90 or more Minutes | 85 (5.5%) | 34 (2.7%) |
Time of Departure to Work by Sex in Schuyler County
The most frequent times of departure to work in Schuyler County are 7:00 AM to 7:29 AM (230, 14.9%) for males and 7:30 AM to 7:59 AM (315, 24.7%) for females.
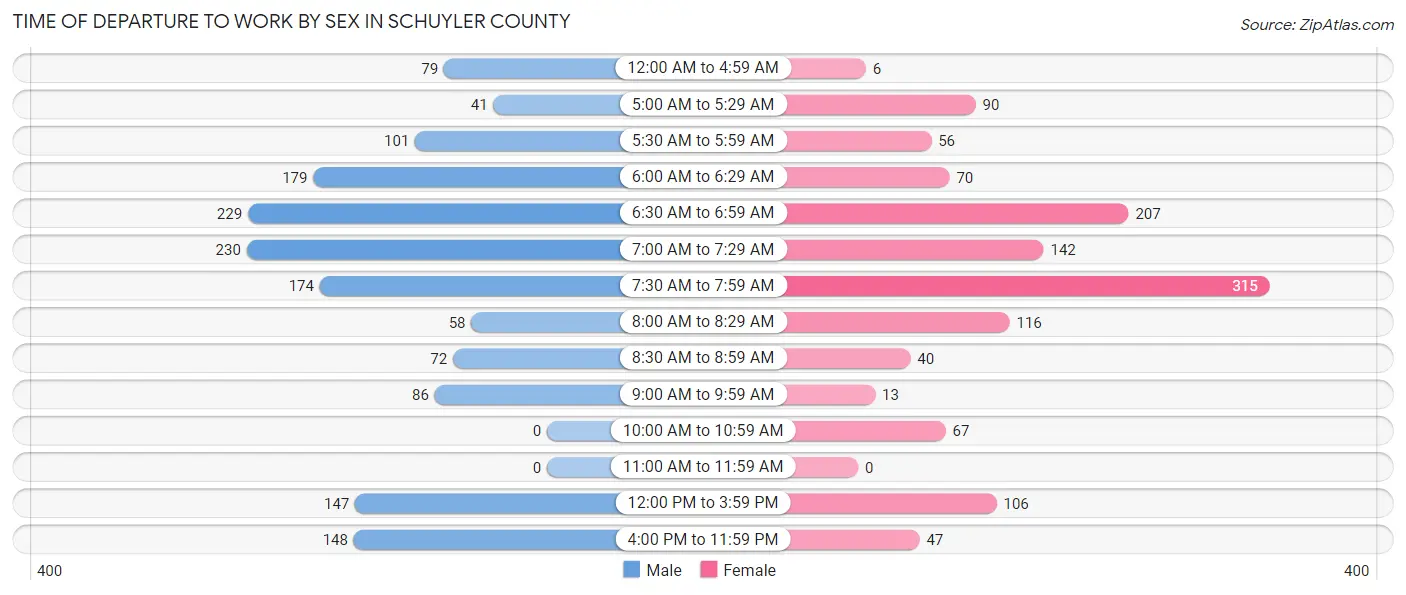
| Time of Departure | Male | Female |
| 12:00 AM to 4:59 AM | 79 (5.1%) | 6 (0.5%) |
| 5:00 AM to 5:29 AM | 41 (2.7%) | 90 (7.1%) |
| 5:30 AM to 5:59 AM | 101 (6.5%) | 56 (4.4%) |
| 6:00 AM to 6:29 AM | 179 (11.6%) | 70 (5.5%) |
| 6:30 AM to 6:59 AM | 229 (14.8%) | 207 (16.2%) |
| 7:00 AM to 7:29 AM | 230 (14.9%) | 142 (11.1%) |
| 7:30 AM to 7:59 AM | 174 (11.3%) | 315 (24.7%) |
| 8:00 AM to 8:29 AM | 58 (3.8%) | 116 (9.1%) |
| 8:30 AM to 8:59 AM | 72 (4.7%) | 40 (3.1%) |
| 9:00 AM to 9:59 AM | 86 (5.6%) | 13 (1.0%) |
| 10:00 AM to 10:59 AM | 0 (0.0%) | 67 (5.2%) |
| 11:00 AM to 11:59 AM | 0 (0.0%) | 0 (0.0%) |
| 12:00 PM to 3:59 PM | 147 (9.5%) | 106 (8.3%) |
| 4:00 PM to 11:59 PM | 148 (9.6%) | 47 (3.7%) |
| Total | 1,544 (100.0%) | 1,275 (100.0%) |
Housing Occupancy in Schuyler County
Occupancy by Ownership in Schuyler County
Of the total 2,725 dwellings in Schuyler County, owner-occupied units account for 2,199 (80.7%), while renter-occupied units make up 526 (19.3%).
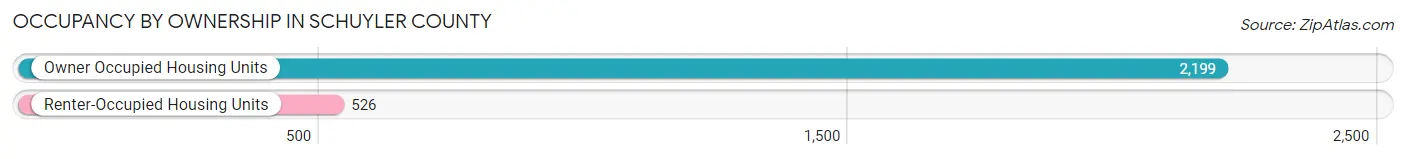
| Occupancy | # Housing Units | % Housing Units |
| Owner Occupied Housing Units | 2,199 | 80.7% |
| Renter-Occupied Housing Units | 526 | 19.3% |
| Total Occupied Housing Units | 2,725 | 100.0% |
Occupancy by Household Size in Schuyler County

| Household Size | # Housing Units | % Housing Units |
| 1-Person Household | 852 | 31.3% |
| 2-Person Household | 1,114 | 40.9% |
| 3-Person Household | 311 | 11.4% |
| 4+ Person Household | 448 | 16.4% |
| Total Housing Units | 2,725 | 100.0% |
Occupancy by Ownership by Household Size in Schuyler County
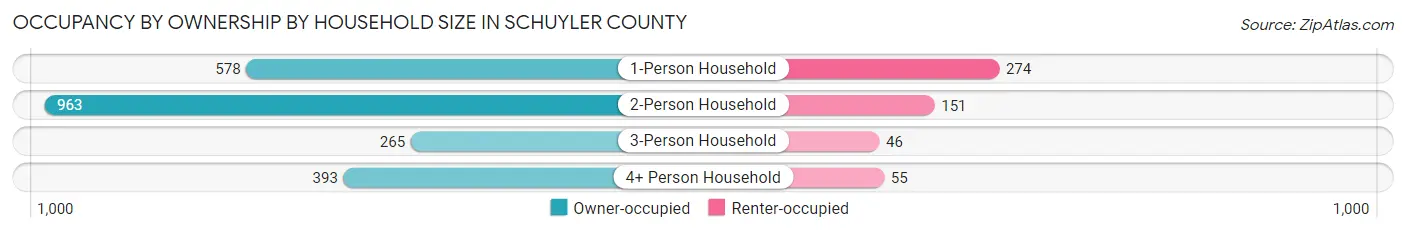
| Household Size | Owner-occupied | Renter-occupied |
| 1-Person Household | 578 (67.8%) | 274 (32.2%) |
| 2-Person Household | 963 (86.5%) | 151 (13.6%) |
| 3-Person Household | 265 (85.2%) | 46 (14.8%) |
| 4+ Person Household | 393 (87.7%) | 55 (12.3%) |
| Total Housing Units | 2,199 (80.7%) | 526 (19.3%) |
Occupancy by Educational Attainment in Schuyler County
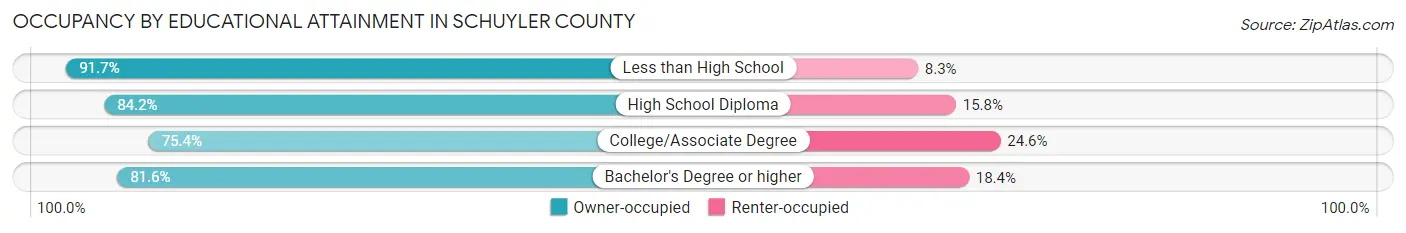
| Household Size | Owner-occupied | Renter-occupied |
| Less than High School | 111 (91.7%) | 10 (8.3%) |
| High School Diploma | 901 (84.2%) | 169 (15.8%) |
| College/Associate Degree | 787 (75.4%) | 257 (24.6%) |
| Bachelor's Degree or higher | 400 (81.6%) | 90 (18.4%) |
Occupancy by Age of Householder in Schuyler County
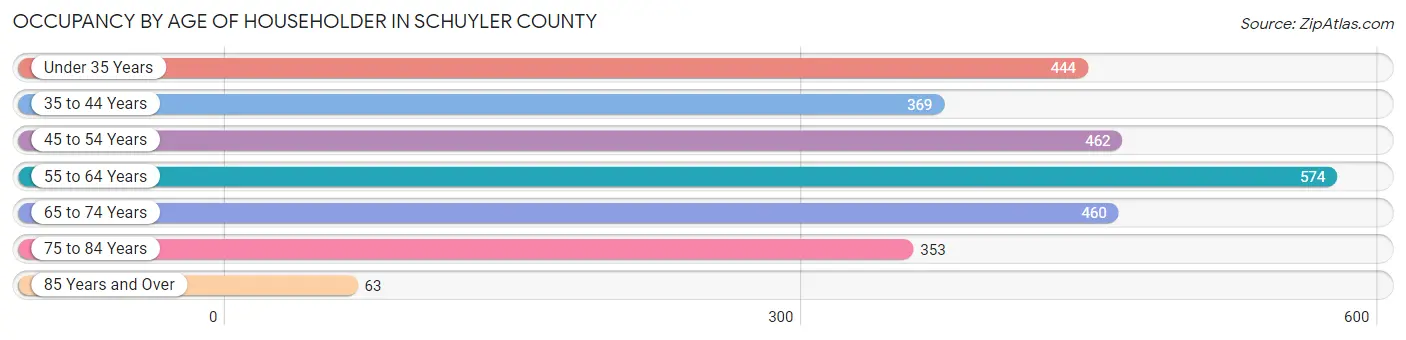
| Age Bracket | # Households | % Households |
| Under 35 Years | 444 | 16.3% |
| 35 to 44 Years | 369 | 13.5% |
| 45 to 54 Years | 462 | 17.0% |
| 55 to 64 Years | 574 | 21.1% |
| 65 to 74 Years | 460 | 16.9% |
| 75 to 84 Years | 353 | 13.0% |
| 85 Years and Over | 63 | 2.3% |
| Total | 2,725 | 100.0% |
Housing Finances in Schuyler County
Median Income by Occupancy in Schuyler County
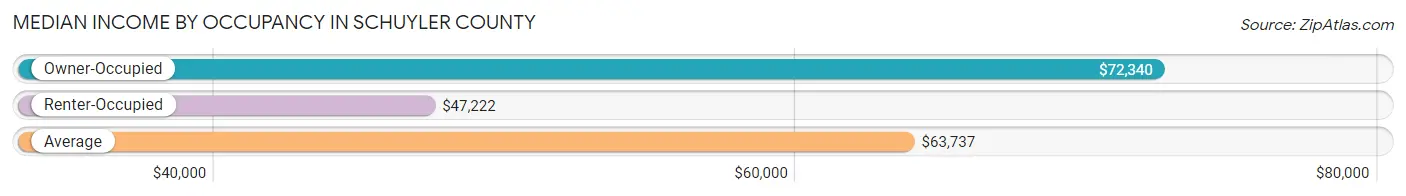
| Occupancy Type | # Households | Median Income |
| Owner-Occupied | 2,199 (80.7%) | $72,340 |
| Renter-Occupied | 526 (19.3%) | $47,222 |
| Average | 2,725 (100.0%) | $63,737 |
Occupancy by Householder Income Bracket in Schuyler County

| Income Bracket | Owner-occupied | Renter-occupied |
| Less than $5,000 | 34 (1.5%) | 22 (4.2%) |
| $5,000 to $9,999 | 5 (0.2%) | 23 (4.4%) |
| $10,000 to $14,999 | 69 (3.1%) | 37 (7.0%) |
| $15,000 to $19,999 | 63 (2.9%) | 0 (0.0%) |
| $20,000 to $24,999 | 159 (7.2%) | 14 (2.7%) |
| $25,000 to $34,999 | 165 (7.5%) | 83 (15.8%) |
| $35,000 to $49,999 | 226 (10.3%) | 170 (32.3%) |
| $50,000 to $74,999 | 414 (18.8%) | 100 (19.0%) |
| $75,000 to $99,999 | 432 (19.7%) | 38 (7.2%) |
| $100,000 to $149,999 | 359 (16.3%) | 31 (5.9%) |
| $150,000 or more | 273 (12.4%) | 8 (1.5%) |
| Total | 2,199 (100.0%) | 526 (100.0%) |
Monthly Housing Cost Tiers in Schuyler County
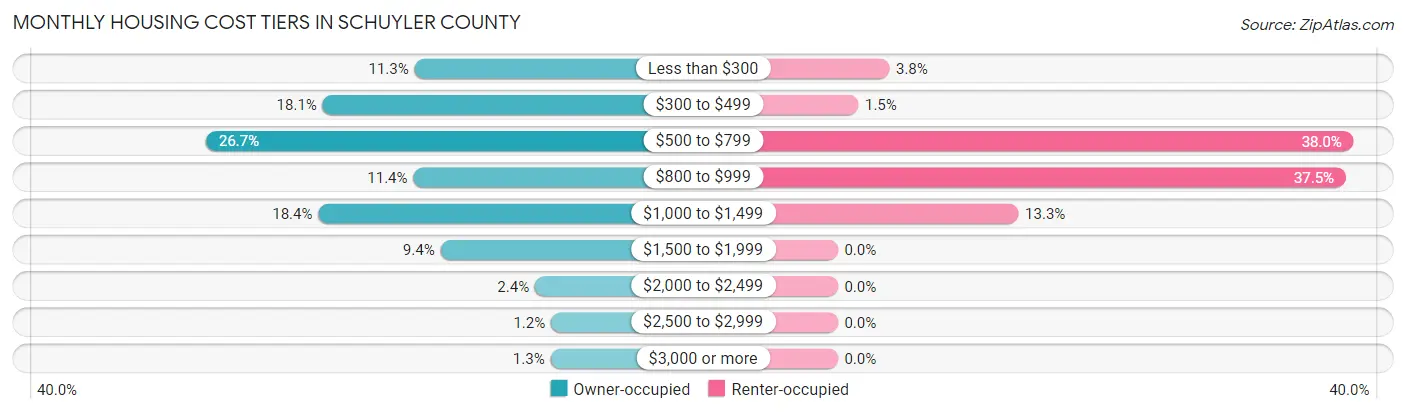
| Monthly Cost | Owner-occupied | Renter-occupied |
| Less than $300 | 248 (11.3%) | 20 (3.8%) |
| $300 to $499 | 397 (18.0%) | 8 (1.5%) |
| $500 to $799 | 586 (26.7%) | 200 (38.0%) |
| $800 to $999 | 250 (11.4%) | 197 (37.4%) |
| $1,000 to $1,499 | 404 (18.4%) | 70 (13.3%) |
| $1,500 to $1,999 | 206 (9.4%) | 0 (0.0%) |
| $2,000 to $2,499 | 53 (2.4%) | 0 (0.0%) |
| $2,500 to $2,999 | 27 (1.2%) | 0 (0.0%) |
| $3,000 or more | 28 (1.3%) | 0 (0.0%) |
| Total | 2,199 (100.0%) | 526 (100.0%) |
Physical Housing Characteristics in Schuyler County
Housing Structures in Schuyler County
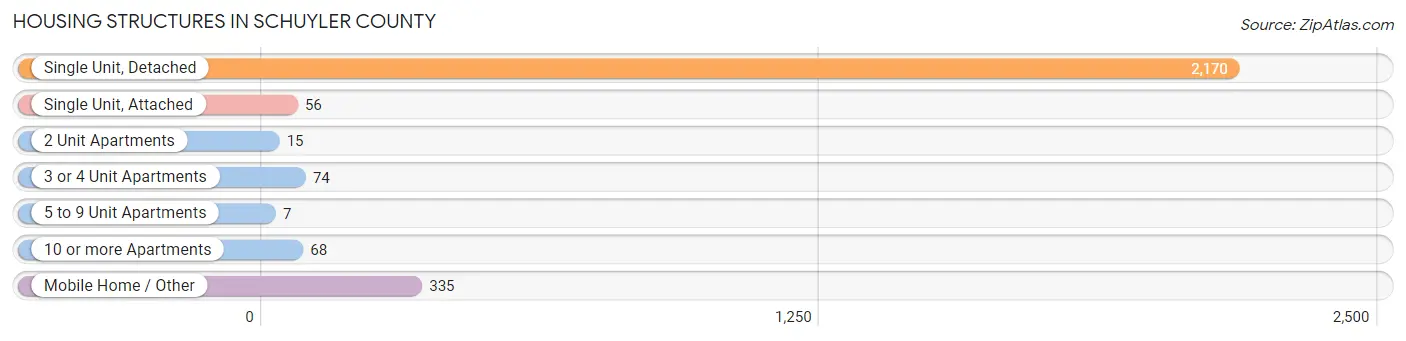
| Structure Type | # Housing Units | % Housing Units |
| Single Unit, Detached | 2,170 | 79.6% |
| Single Unit, Attached | 56 | 2.1% |
| 2 Unit Apartments | 15 | 0.5% |
| 3 or 4 Unit Apartments | 74 | 2.7% |
| 5 to 9 Unit Apartments | 7 | 0.3% |
| 10 or more Apartments | 68 | 2.5% |
| Mobile Home / Other | 335 | 12.3% |
| Total | 2,725 | 100.0% |
Housing Structures by Occupancy in Schuyler County
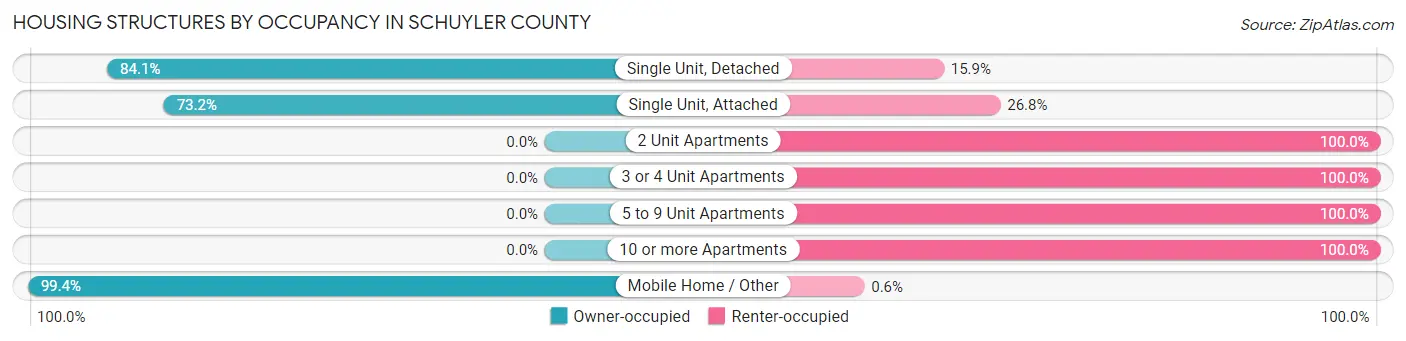
| Structure Type | Owner-occupied | Renter-occupied |
| Single Unit, Detached | 1,825 (84.1%) | 345 (15.9%) |
| Single Unit, Attached | 41 (73.2%) | 15 (26.8%) |
| 2 Unit Apartments | 0 (0.0%) | 15 (100.0%) |
| 3 or 4 Unit Apartments | 0 (0.0%) | 74 (100.0%) |
| 5 to 9 Unit Apartments | 0 (0.0%) | 7 (100.0%) |
| 10 or more Apartments | 0 (0.0%) | 68 (100.0%) |
| Mobile Home / Other | 333 (99.4%) | 2 (0.6%) |
| Total | 2,199 (80.7%) | 526 (19.3%) |
Housing Structures by Number of Rooms in Schuyler County
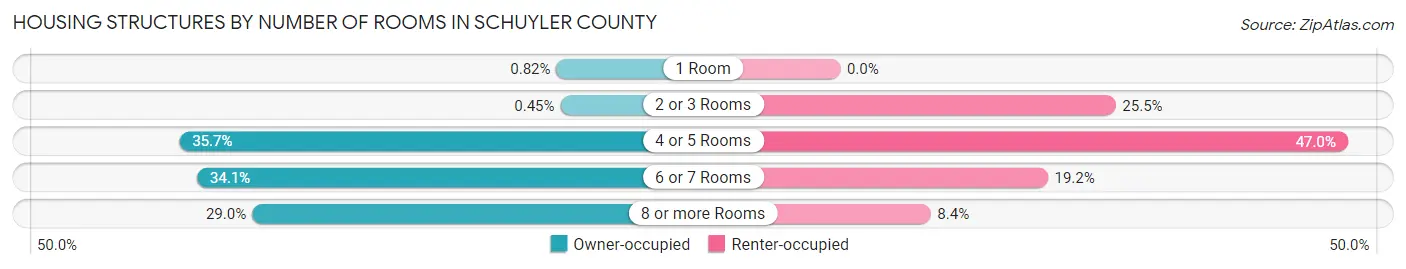
| Number of Rooms | Owner-occupied | Renter-occupied |
| 1 Room | 18 (0.8%) | 0 (0.0%) |
| 2 or 3 Rooms | 10 (0.4%) | 134 (25.5%) |
| 4 or 5 Rooms | 785 (35.7%) | 247 (47.0%) |
| 6 or 7 Rooms | 749 (34.1%) | 101 (19.2%) |
| 8 or more Rooms | 637 (29.0%) | 44 (8.4%) |
| Total | 2,199 (100.0%) | 526 (100.0%) |
Housing Structure by Heating Type in Schuyler County
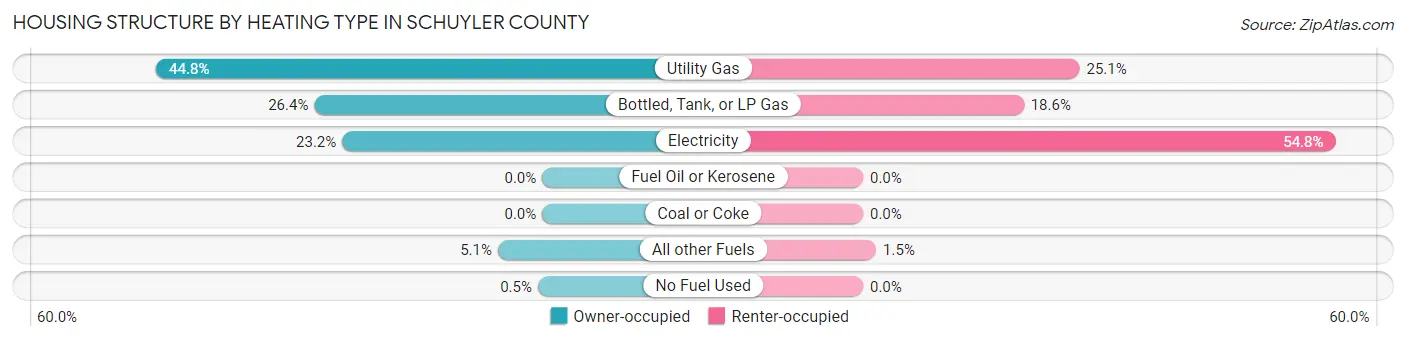
| Heating Type | Owner-occupied | Renter-occupied |
| Utility Gas | 984 (44.8%) | 132 (25.1%) |
| Bottled, Tank, or LP Gas | 581 (26.4%) | 98 (18.6%) |
| Electricity | 510 (23.2%) | 288 (54.7%) |
| Fuel Oil or Kerosene | 0 (0.0%) | 0 (0.0%) |
| Coal or Coke | 0 (0.0%) | 0 (0.0%) |
| All other Fuels | 113 (5.1%) | 8 (1.5%) |
| No Fuel Used | 11 (0.5%) | 0 (0.0%) |
| Total | 2,199 (100.0%) | 526 (100.0%) |
Household Vehicle Usage in Schuyler County
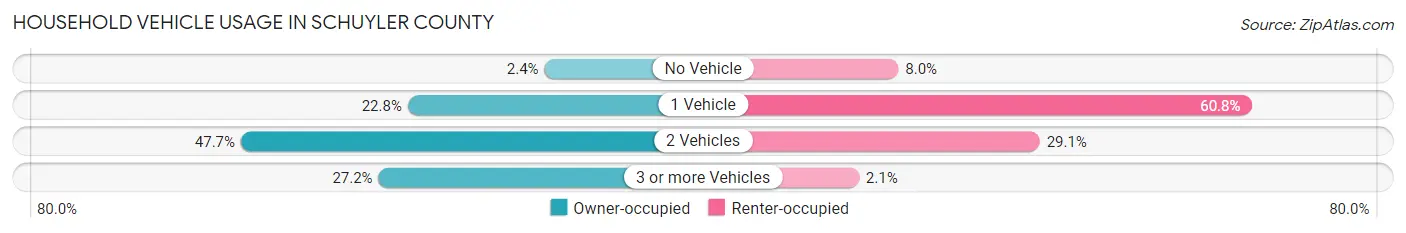
| Vehicles per Household | Owner-occupied | Renter-occupied |
| No Vehicle | 52 (2.4%) | 42 (8.0%) |
| 1 Vehicle | 501 (22.8%) | 320 (60.8%) |
| 2 Vehicles | 1,049 (47.7%) | 153 (29.1%) |
| 3 or more Vehicles | 597 (27.2%) | 11 (2.1%) |
| Total | 2,199 (100.0%) | 526 (100.0%) |
Real Estate & Mortgages in Schuyler County
Real Estate and Mortgage Overview in Schuyler County
| Characteristic | Without Mortgage | With Mortgage |
| Housing Units | 1,209 | 990 |
| Median Property Value | $92,700 | $117,300 |
| Median Household Income | $64,157 | $112 |
| Monthly Housing Costs | $482 | $27 |
| Real Estate Taxes | $1,512 | $31 |
Property Value by Mortgage Status in Schuyler County
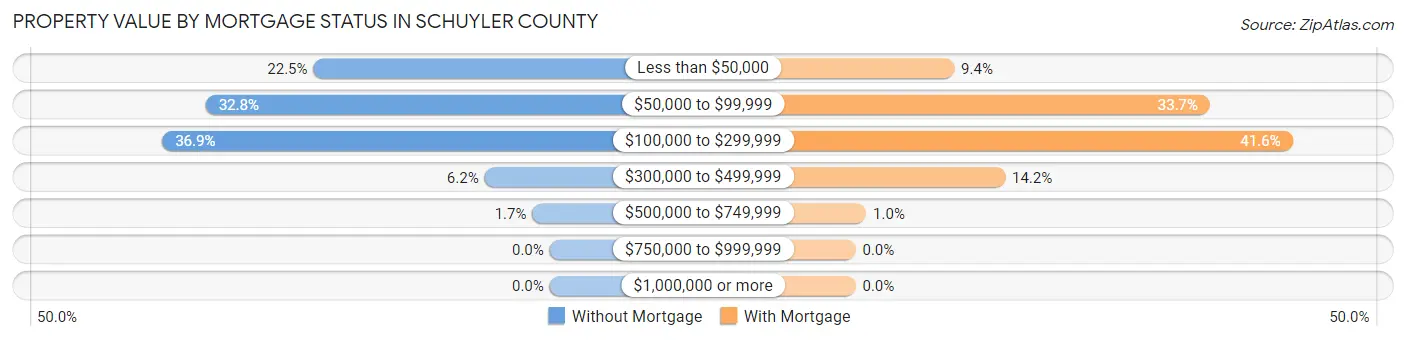
| Property Value | Without Mortgage | With Mortgage |
| Less than $50,000 | 272 (22.5%) | 93 (9.4%) |
| $50,000 to $99,999 | 396 (32.8%) | 334 (33.7%) |
| $100,000 to $299,999 | 446 (36.9%) | 412 (41.6%) |
| $300,000 to $499,999 | 75 (6.2%) | 141 (14.2%) |
| $500,000 to $749,999 | 20 (1.7%) | 10 (1.0%) |
| $750,000 to $999,999 | 0 (0.0%) | 0 (0.0%) |
| $1,000,000 or more | 0 (0.0%) | 0 (0.0%) |
| Total | 1,209 (100.0%) | 990 (100.0%) |
Household Income by Mortgage Status in Schuyler County
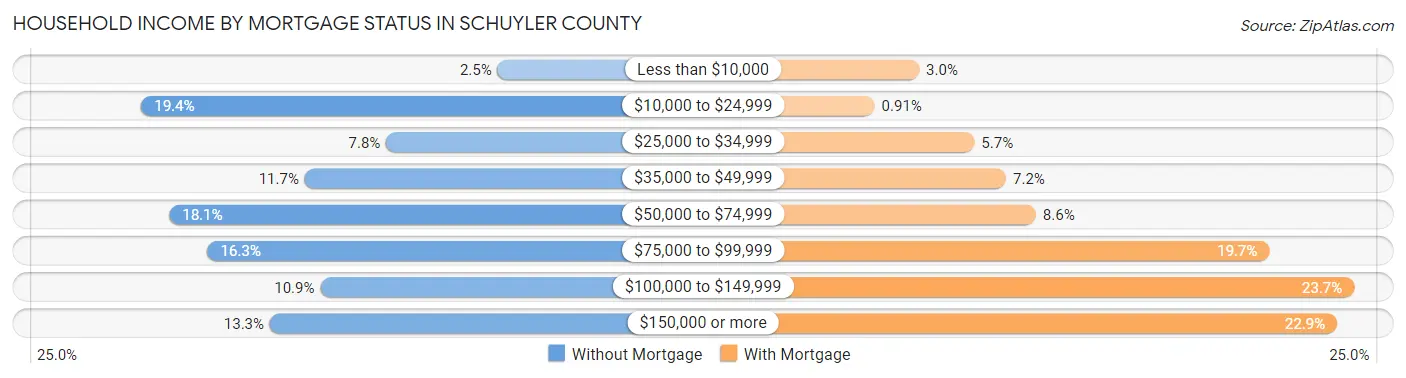
| Household Income | Without Mortgage | With Mortgage |
| Less than $10,000 | 30 (2.5%) | 30 (3.0%) |
| $10,000 to $24,999 | 235 (19.4%) | 9 (0.9%) |
| $25,000 to $34,999 | 94 (7.8%) | 56 (5.7%) |
| $35,000 to $49,999 | 141 (11.7%) | 71 (7.2%) |
| $50,000 to $74,999 | 219 (18.1%) | 85 (8.6%) |
| $75,000 to $99,999 | 197 (16.3%) | 195 (19.7%) |
| $100,000 to $149,999 | 132 (10.9%) | 235 (23.7%) |
| $150,000 or more | 161 (13.3%) | 227 (22.9%) |
| Total | 1,209 (100.0%) | 990 (100.0%) |
Property Value to Household Income Ratio in Schuyler County
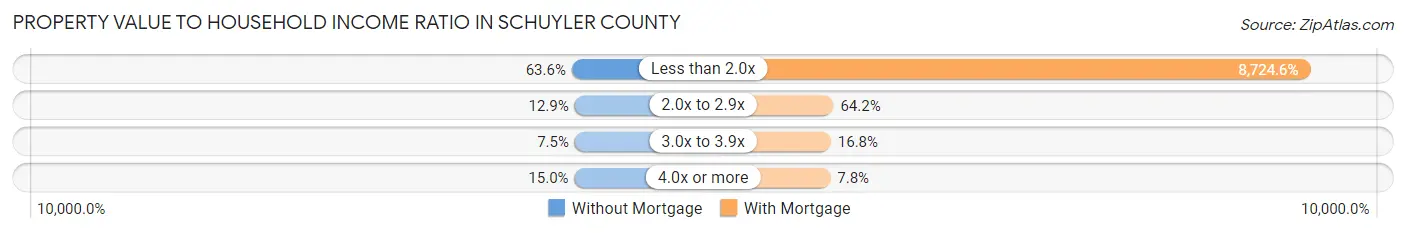
| Value-to-Income Ratio | Without Mortgage | With Mortgage |
| Less than 2.0x | 769 (63.6%) | 86,373 (8,724.6%) |
| 2.0x to 2.9x | 156 (12.9%) | 636 (64.2%) |
| 3.0x to 3.9x | 91 (7.5%) | 166 (16.8%) |
| 4.0x or more | 181 (15.0%) | 77 (7.8%) |
| Total | 1,209 (100.0%) | 990 (100.0%) |
Real Estate Taxes by Mortgage Status in Schuyler County
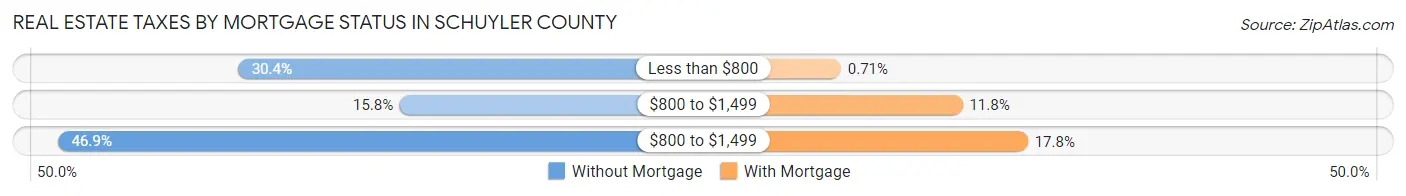
| Property Taxes | Without Mortgage | With Mortgage |
| Less than $800 | 368 (30.4%) | 7 (0.7%) |
| $800 to $1,499 | 191 (15.8%) | 117 (11.8%) |
| $800 to $1,499 | 567 (46.9%) | 176 (17.8%) |
| Total | 1,209 (100.0%) | 990 (100.0%) |
Health & Disability in Schuyler County
Health Insurance Coverage by Age in Schuyler County
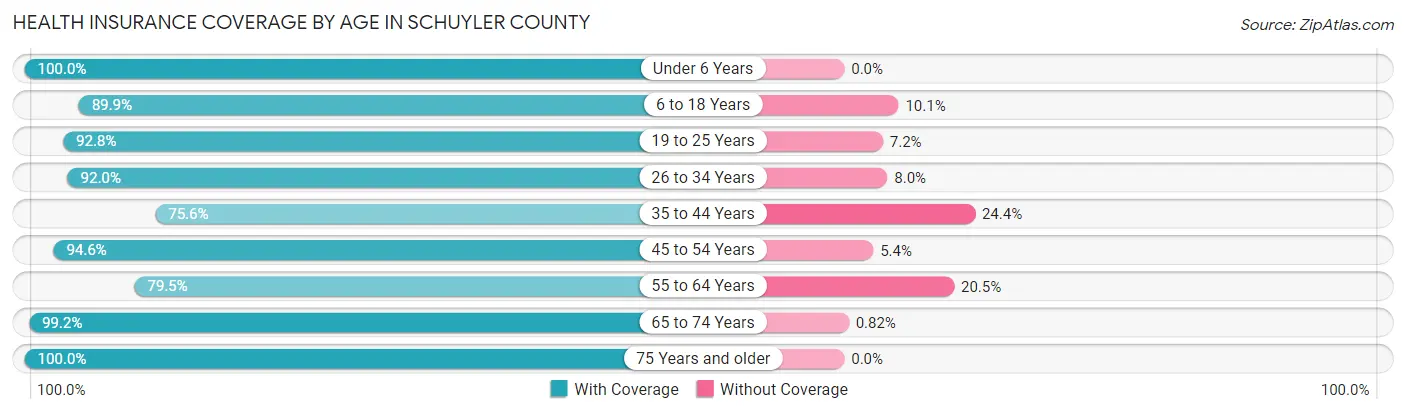
| Age Bracket | With Coverage | Without Coverage |
| Under 6 Years | 362 (100.0%) | 0 (0.0%) |
| 6 to 18 Years | 890 (89.9%) | 100 (10.1%) |
| 19 to 25 Years | 271 (92.8%) | 21 (7.2%) |
| 26 to 34 Years | 641 (92.0%) | 56 (8.0%) |
| 35 to 44 Years | 599 (75.6%) | 193 (24.4%) |
| 45 to 54 Years | 878 (94.6%) | 50 (5.4%) |
| 55 to 64 Years | 878 (79.5%) | 226 (20.5%) |
| 65 to 74 Years | 973 (99.2%) | 8 (0.8%) |
| 75 Years and older | 651 (100.0%) | 0 (0.0%) |
| Total | 6,143 (90.4%) | 654 (9.6%) |
Health Insurance Coverage by Citizenship Status in Schuyler County
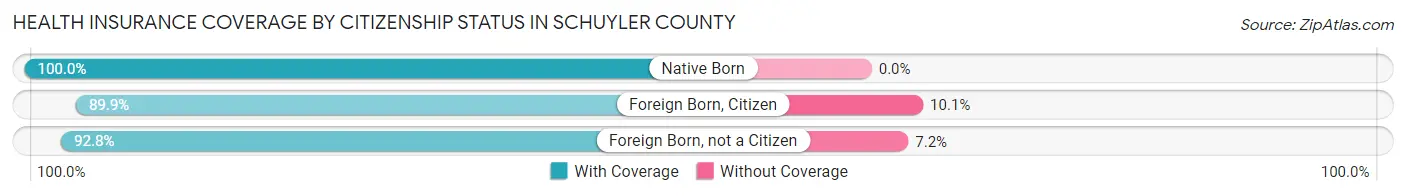
| Citizenship Status | With Coverage | Without Coverage |
| Native Born | 362 (100.0%) | 0 (0.0%) |
| Foreign Born, Citizen | 890 (89.9%) | 100 (10.1%) |
| Foreign Born, not a Citizen | 271 (92.8%) | 21 (7.2%) |
Health Insurance Coverage by Household Income in Schuyler County
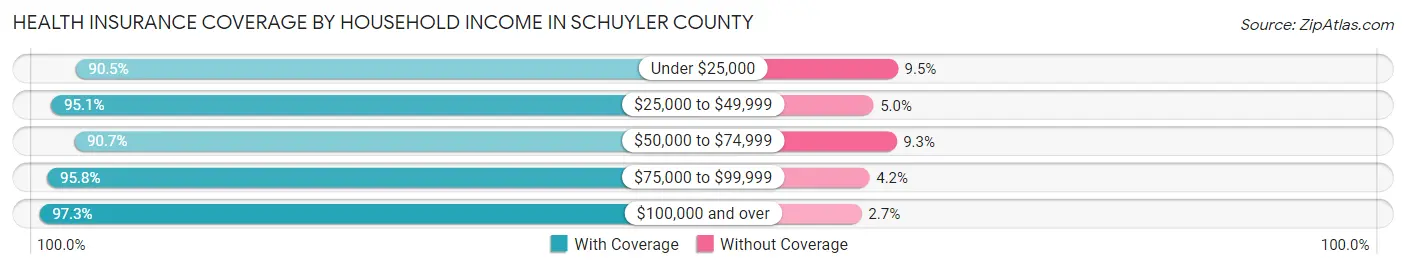
| Household Income | With Coverage | Without Coverage |
| Under $25,000 | 589 (90.5%) | 62 (9.5%) |
| $25,000 to $49,999 | 1,037 (95.1%) | 54 (5.0%) |
| $50,000 to $74,999 | 1,185 (90.7%) | 121 (9.3%) |
| $75,000 to $99,999 | 1,275 (95.8%) | 56 (4.2%) |
| $100,000 and over | 1,667 (97.3%) | 47 (2.7%) |
Public vs Private Health Insurance Coverage by Age in Schuyler County
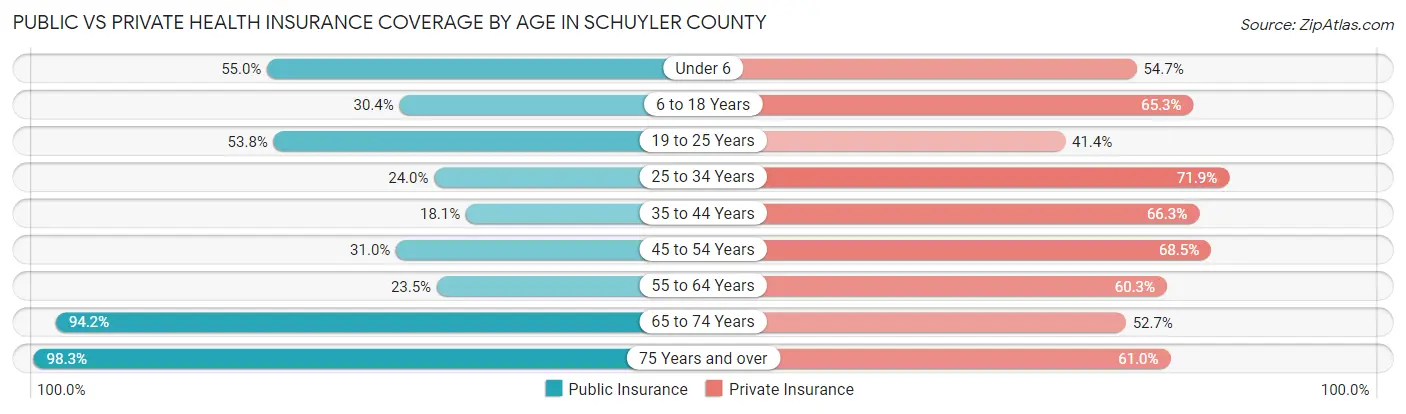
| Age Bracket | Public Insurance | Private Insurance |
| Under 6 | 199 (55.0%) | 198 (54.7%) |
| 6 to 18 Years | 301 (30.4%) | 646 (65.2%) |
| 19 to 25 Years | 157 (53.8%) | 121 (41.4%) |
| 25 to 34 Years | 167 (24.0%) | 501 (71.9%) |
| 35 to 44 Years | 143 (18.1%) | 525 (66.3%) |
| 45 to 54 Years | 288 (31.0%) | 636 (68.5%) |
| 55 to 64 Years | 259 (23.5%) | 666 (60.3%) |
| 65 to 74 Years | 924 (94.2%) | 517 (52.7%) |
| 75 Years and over | 640 (98.3%) | 397 (61.0%) |
| Total | 3,078 (45.3%) | 4,207 (61.9%) |
Disability Status by Sex by Age in Schuyler County
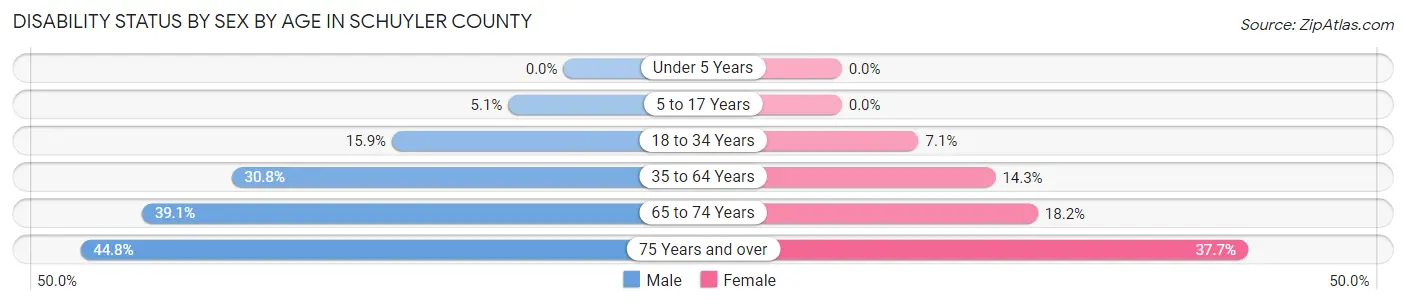
| Age Bracket | Male | Female |
| Under 5 Years | 0 (0.0%) | 0 (0.0%) |
| 5 to 17 Years | 25 (5.1%) | 0 (0.0%) |
| 18 to 34 Years | 102 (15.9%) | 35 (7.1%) |
| 35 to 64 Years | 509 (30.8%) | 167 (14.3%) |
| 65 to 74 Years | 214 (39.1%) | 79 (18.2%) |
| 75 Years and over | 130 (44.8%) | 136 (37.7%) |
Disability Class by Sex by Age in Schuyler County
Disability Class: Hearing Difficulty
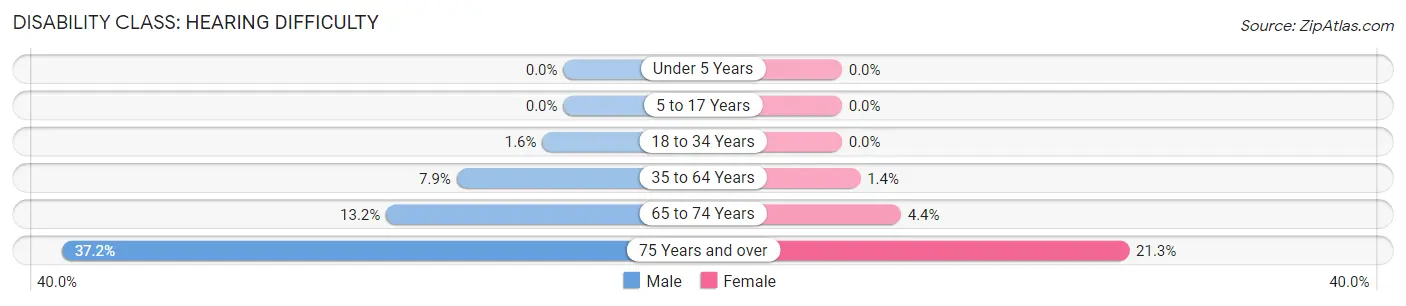
| Age Bracket | Male | Female |
| Under 5 Years | 0 (0.0%) | 0 (0.0%) |
| 5 to 17 Years | 0 (0.0%) | 0 (0.0%) |
| 18 to 34 Years | 10 (1.6%) | 0 (0.0%) |
| 35 to 64 Years | 131 (7.9%) | 16 (1.4%) |
| 65 to 74 Years | 72 (13.2%) | 19 (4.4%) |
| 75 Years and over | 108 (37.2%) | 77 (21.3%) |
Disability Class: Vision Difficulty
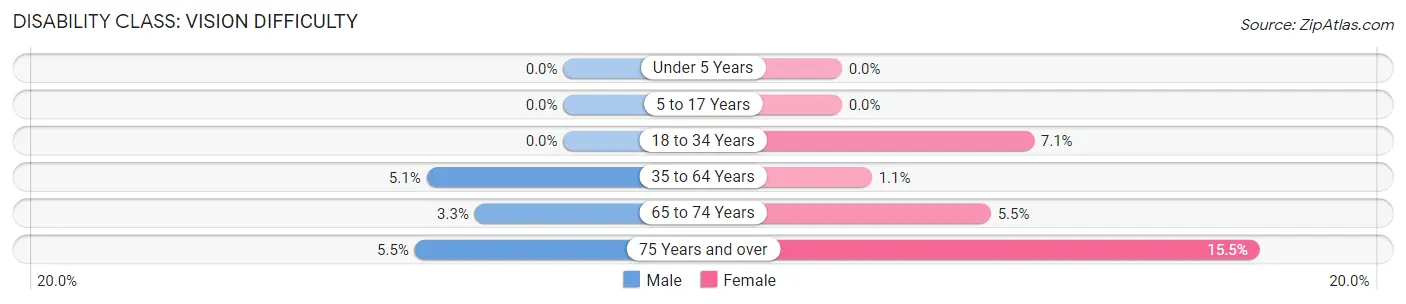
| Age Bracket | Male | Female |
| Under 5 Years | 0 (0.0%) | 0 (0.0%) |
| 5 to 17 Years | 0 (0.0%) | 0 (0.0%) |
| 18 to 34 Years | 0 (0.0%) | 35 (7.1%) |
| 35 to 64 Years | 84 (5.1%) | 13 (1.1%) |
| 65 to 74 Years | 18 (3.3%) | 24 (5.5%) |
| 75 Years and over | 16 (5.5%) | 56 (15.5%) |
Disability Class: Cognitive Difficulty
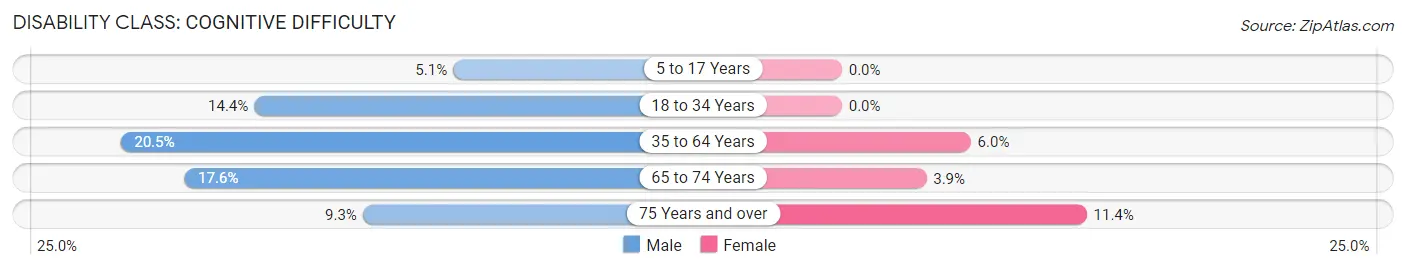
| Age Bracket | Male | Female |
| 5 to 17 Years | 25 (5.1%) | 0 (0.0%) |
| 18 to 34 Years | 92 (14.3%) | 0 (0.0%) |
| 35 to 64 Years | 339 (20.5%) | 70 (6.0%) |
| 65 to 74 Years | 96 (17.5%) | 17 (3.9%) |
| 75 Years and over | 27 (9.3%) | 41 (11.4%) |
Disability Class: Ambulatory Difficulty
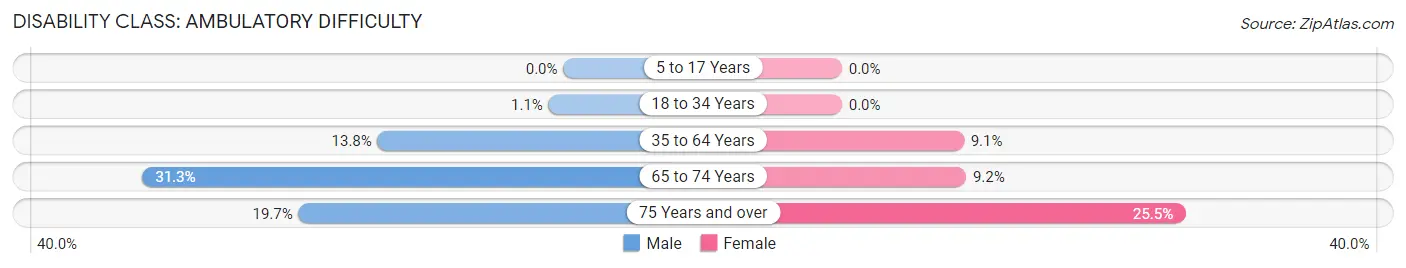
| Age Bracket | Male | Female |
| 5 to 17 Years | 0 (0.0%) | 0 (0.0%) |
| 18 to 34 Years | 7 (1.1%) | 0 (0.0%) |
| 35 to 64 Years | 228 (13.8%) | 106 (9.0%) |
| 65 to 74 Years | 171 (31.3%) | 40 (9.2%) |
| 75 Years and over | 57 (19.7%) | 92 (25.5%) |
Disability Class: Self-Care Difficulty
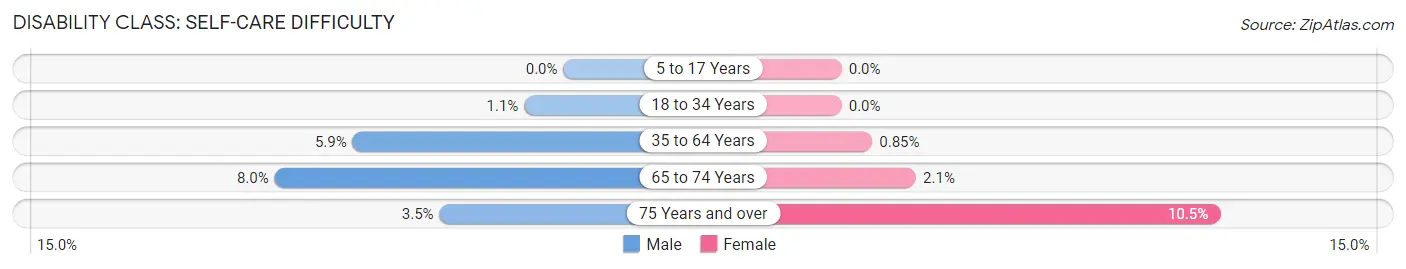
| Age Bracket | Male | Female |
| 5 to 17 Years | 0 (0.0%) | 0 (0.0%) |
| 18 to 34 Years | 7 (1.1%) | 0 (0.0%) |
| 35 to 64 Years | 97 (5.9%) | 10 (0.9%) |
| 65 to 74 Years | 44 (8.0%) | 9 (2.1%) |
| 75 Years and over | 10 (3.5%) | 38 (10.5%) |
Technology Access in Schuyler County
Computing Device Access in Schuyler County
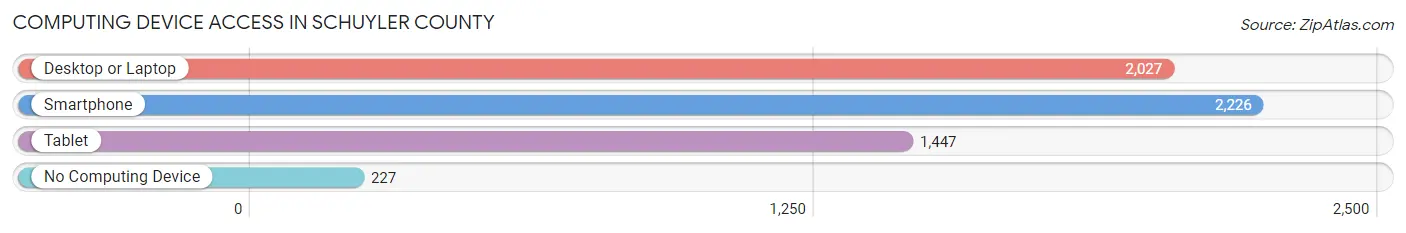
| Device Type | # Households | % Households |
| Desktop or Laptop | 2,027 | 74.4% |
| Smartphone | 2,226 | 81.7% |
| Tablet | 1,447 | 53.1% |
| No Computing Device | 227 | 8.3% |
| Total | 2,725 | 100.0% |
Internet Access in Schuyler County
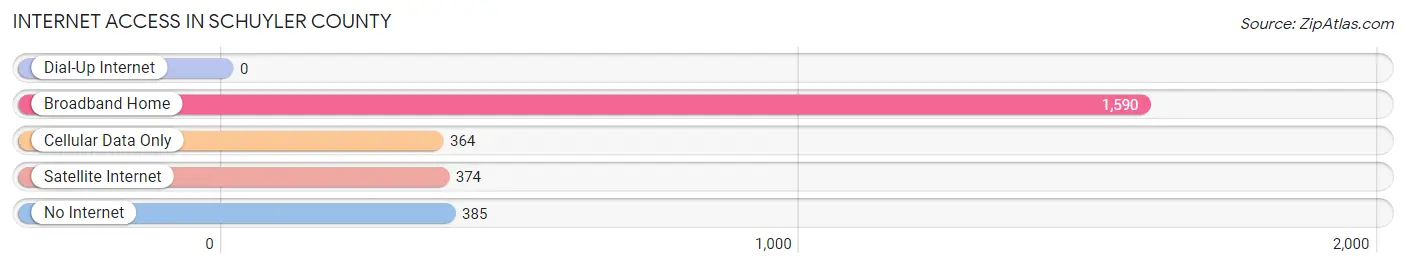
| Internet Type | # Households | % Households |
| Dial-Up Internet | 0 | 0.0% |
| Broadband Home | 1,590 | 58.4% |
| Cellular Data Only | 364 | 13.4% |
| Satellite Internet | 374 | 13.7% |
| No Internet | 385 | 14.1% |
| Total | 2,725 | 100.0% |
Schuyler County Summary
Schuyler County is located in the western part of Illinois, in the United States. It is part of the Quincy, IL–MO Micropolitan Statistical Area. The county was established in 1825 and named after Philip Schuyler, a Revolutionary War general. As of the 2010 census, the population was 7,544. The county seat is Rushville.
Geography
Schuyler County is located in the western part of Illinois, in the United States. It is part of the Quincy, IL–MO Micropolitan Statistical Area. The county has a total area of 517 square miles, of which 514 square miles is land and 3.2 square miles (0.6%) is water. The county is bordered by Brown County to the north, Hancock County to the east, McDonough County to the south, and Adams County to the west.
The terrain of Schuyler County is generally flat, with some rolling hills in the northern part of the county. The highest point in the county is located in the northwest corner, at an elevation of 890 feet. The county is drained by the La Moine River, which flows through the center of the county.
Economy
The economy of Schuyler County is largely based on agriculture. The county is home to a variety of crops, including corn, soybeans, wheat, oats, hay, and sorghum. Livestock production is also important to the local economy, with beef cattle, dairy cattle, and hogs being the most common animals raised in the county.
In addition to agriculture, Schuyler County is home to a number of manufacturing and service-based businesses. The county is home to several food processing plants, as well as a number of metal fabrication and machine shops. The county is also home to a number of retail stores, restaurants, and other service-based businesses.
Demographics
As of the 2010 census, there were 7,544 people, 2,945 households, and 2,039 families residing in the county. The population density was 15 people per square mile. There were 3,232 housing units at an average density of 6 per square mile. The racial makeup of the county was 97.3% White, 0.4% Black or African American, 0.2% Native American, 0.2% Asian, 0.2% from other races, and 1.7% from two or more races. 1.3% of the population were Hispanic or Latino of any race.
There were 2,945 households, out of which 30.2% had children under the age of 18 living with them, 57.2% were married couples living together, 8.7% had a female householder with no husband present, and 30.2% were non-families. 26.2% of all households were made up of individuals, and 13.2% had someone living alone who was 65 years of age or older. The average household size was 2.51 and the average family size was 3.02.
In the county, the population was spread out, with 25.2% under the age of 18, 7.2% from 18 to 24, 25.2% from 25 to 44, 25.2% from 45 to 64, and 17.2% who were 65 years of age or older. The median age was 39 years. For every 100 females there were 97.2 males. For every 100 females age 18 and over, there were 94.2 males.
The median income for a household in the county was $37,917, and the median income for a family was $45,938. Males had a median income of $31,917 versus $21,917 for females. The per capita income for the county was $17,917. About 8.2% of families and 11.2% of the population were below the poverty line, including 14.2% of those under age 18 and 8.2% of those age 65 or over.
Conclusion
Schuyler County is a rural county located in the western part of Illinois. The county is home to a variety of crops and livestock, as well as a number of manufacturing and service-based businesses. The population of the county is largely white, with a small percentage of other races. The median household income is slightly below the state average, and the poverty rate is slightly higher than the state average.
Common Questions
What is Per Capita Income in Schuyler County?
Per Capita income in Schuyler County is $31,679.
What is the Median Family Income in Schuyler County?
Median Family Income in Schuyler County is $81,591.
What is the Median Household income in Schuyler County?
Median Household Income in Schuyler County is $63,737.
What is Income or Wage Gap in Schuyler County?
Income or Wage Gap in Schuyler County is 20.9%.
Women in Schuyler County earn 79.1 cents for every dollar earned by a man.
What is Inequality or Gini Index in Schuyler County?
Inequality or Gini Index in Schuyler County is 0.41.
What is the Total Population of Schuyler County?
Total Population of Schuyler County is 6,879.
What is the Total Male Population of Schuyler County?
Total Male Population of Schuyler County is 3,813.
What is the Total Female Population of Schuyler County?
Total Female Population of Schuyler County is 3,066.
What is the Ratio of Males per 100 Females in Schuyler County?
There are 124.36 Males per 100 Females in Schuyler County.
What is the Ratio of Females per 100 Males in Schuyler County?
There are 80.41 Females per 100 Males in Schuyler County.
What is the Median Population Age in Schuyler County?
Median Population Age in Schuyler County is 48.2 Years.
What is the Average Family Size in Schuyler County
Average Family Size in Schuyler County is 2.9 People.
What is the Average Household Size in Schuyler County
Average Household Size in Schuyler County is 2.2 People.
How Large is the Labor Force in Schuyler County?
There are 3,202 People in the Labor Forcein in Schuyler County.
What is the Percentage of People in the Labor Force in Schuyler County?
55.4% of People are in the Labor Force in Schuyler County.
What is the Unemployment Rate in Schuyler County?
Unemployment Rate in Schuyler County is 6.7%.