Piatt County, IL Map & Demographics
Piatt County Map
Piatt County Overview
$41,429
PER CAPITA INCOME
$100,231
AVG FAMILY INCOME
$81,151
AVG HOUSEHOLD INCOME
27.7%
WAGE / INCOME GAP [ % ]
72.3¢/ $1
WAGE / INCOME GAP [ $ ]
0.42
INEQUALITY / GINI INDEX
16,698
TOTAL POPULATION
8,227
MALE POPULATION
8,471
FEMALE POPULATION
97.12
MALES / 100 FEMALES
102.97
FEMALES / 100 MALES
41.8
MEDIAN AGE
3.0
AVG FAMILY SIZE
2.5
AVG HOUSEHOLD SIZE
8,681
LABOR FORCE [ PEOPLE ]
64.7%
PERCENT IN LABOR FORCE
4.7%
UNEMPLOYMENT RATE
Piatt County Area Codes
Income in Piatt County
Income Overview in Piatt County
Per Capita Income in Piatt County is $41,429, while median incomes of families and households are $100,231 and $81,151 respectively.
| Characteristic | Number | Measure |
| Per Capita Income | 16,698 | $41,429 |
| Median Family Income | 4,628 | $100,231 |
| Mean Family Income | 4,628 | $118,930 |
| Median Household Income | 6,783 | $81,151 |
| Mean Household Income | 6,783 | $100,385 |
| Income Deficit | 4,628 | $0 |
| Wage / Income Gap (%) | 16,698 | 27.73% |
| Wage / Income Gap ($) | 16,698 | 72.27¢ per $1 |
| Gini / Inequality Index | 16,698 | 0.42 |
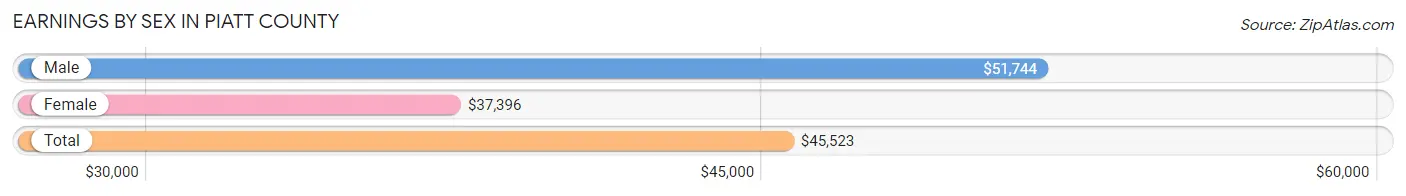
Earnings by Sex in Piatt County
Average Earnings in Piatt County are $45,523, $51,744 for men and $37,396 for women, a difference of 27.7%.
| Sex | Number | Average Earnings |
| Male | 5,005 (54.4%) | $51,744 |
| Female | 4,202 (45.6%) | $37,396 |
| Total | 9,207 (100.0%) | $45,523 |
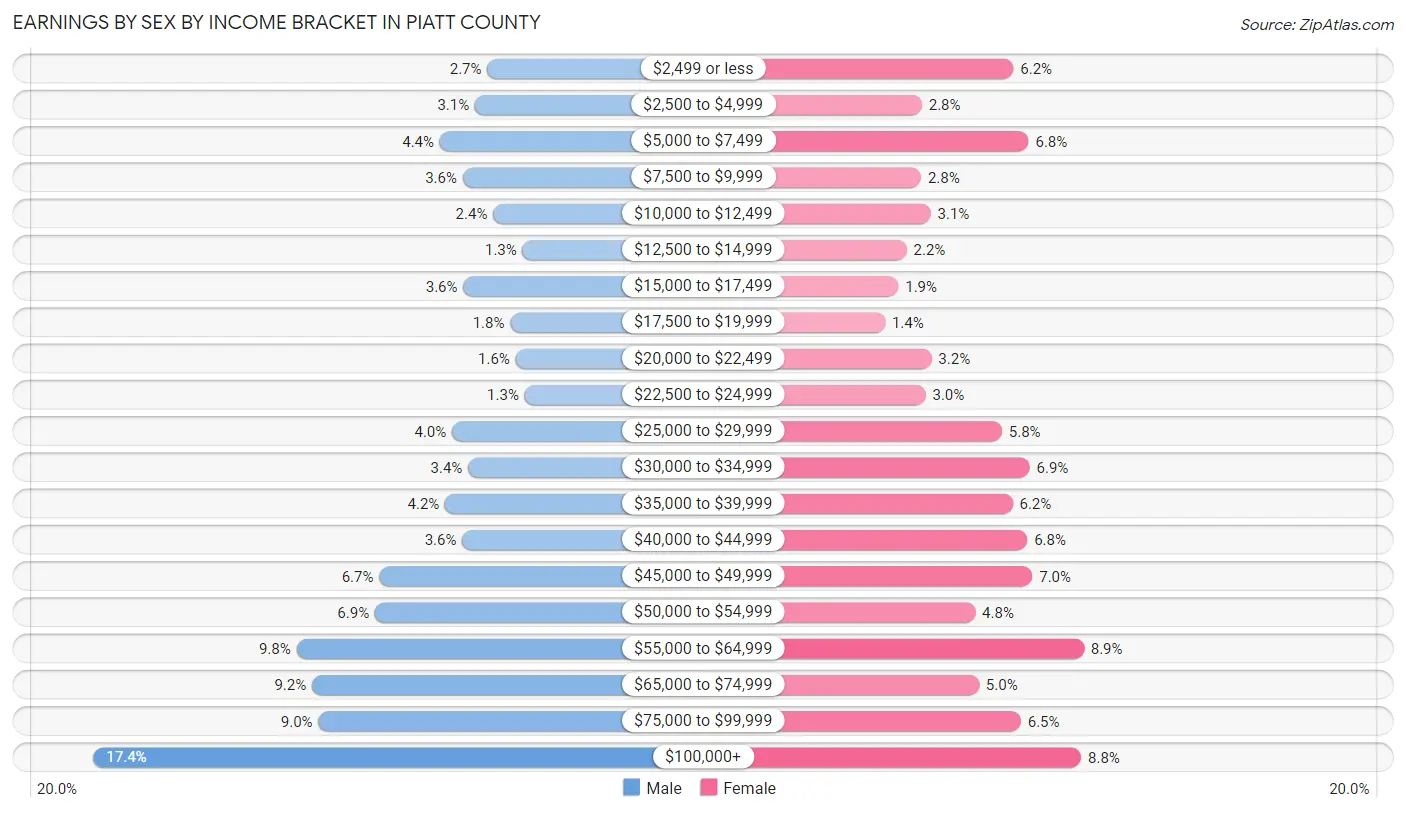
Earnings by Sex by Income Bracket in Piatt County
The most common earnings brackets in Piatt County are $100,000+ for men (872 | 17.4%) and $55,000 to $64,999 for women (373 | 8.9%).
| Income | Male | Female |
| $2,499 or less | 133 (2.7%) | 262 (6.2%) |
| $2,500 to $4,999 | 156 (3.1%) | 118 (2.8%) |
| $5,000 to $7,499 | 222 (4.4%) | 286 (6.8%) |
| $7,500 to $9,999 | 179 (3.6%) | 117 (2.8%) |
| $10,000 to $12,499 | 122 (2.4%) | 132 (3.1%) |
| $12,500 to $14,999 | 67 (1.3%) | 94 (2.2%) |
| $15,000 to $17,499 | 178 (3.6%) | 81 (1.9%) |
| $17,500 to $19,999 | 90 (1.8%) | 60 (1.4%) |
| $20,000 to $22,499 | 80 (1.6%) | 133 (3.2%) |
| $22,500 to $24,999 | 63 (1.3%) | 124 (2.9%) |
| $25,000 to $29,999 | 199 (4.0%) | 244 (5.8%) |
| $30,000 to $34,999 | 169 (3.4%) | 288 (6.9%) |
| $35,000 to $39,999 | 212 (4.2%) | 261 (6.2%) |
| $40,000 to $44,999 | 180 (3.6%) | 284 (6.8%) |
| $45,000 to $49,999 | 336 (6.7%) | 292 (7.0%) |
| $50,000 to $54,999 | 344 (6.9%) | 202 (4.8%) |
| $55,000 to $64,999 | 491 (9.8%) | 373 (8.9%) |
| $65,000 to $74,999 | 462 (9.2%) | 208 (5.0%) |
| $75,000 to $99,999 | 450 (9.0%) | 274 (6.5%) |
| $100,000+ | 872 (17.4%) | 369 (8.8%) |
| Total | 5,005 (100.0%) | 4,202 (100.0%) |
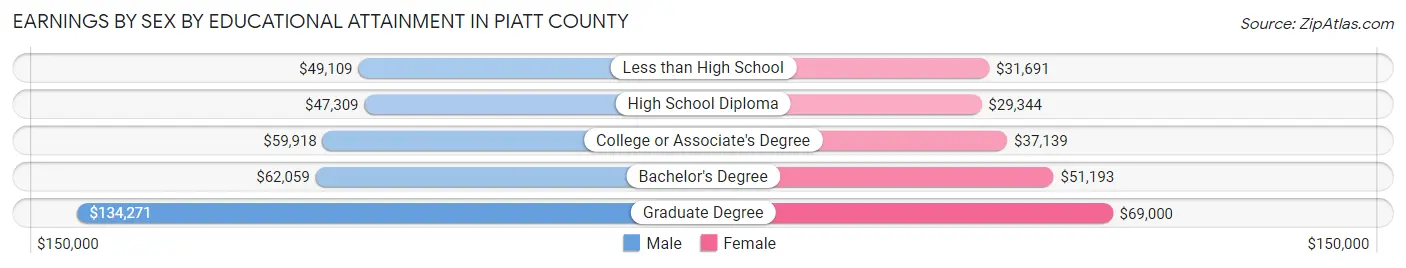
Earnings by Sex by Educational Attainment in Piatt County
Average earnings in Piatt County are $56,323 for men and $42,603 for women, a difference of 24.4%. Men with an educational attainment of graduate degree enjoy the highest average annual earnings of $134,271, while those with high school diploma education earn the least with $47,309. Women with an educational attainment of graduate degree earn the most with the average annual earnings of $69,000, while those with high school diploma education have the smallest earnings of $29,344.
| Educational Attainment | Male Income | Female Income |
| Less than High School | $49,109 | $31,691 |
| High School Diploma | $47,309 | $29,344 |
| College or Associate's Degree | $59,918 | $37,139 |
| Bachelor's Degree | $62,059 | $51,193 |
| Graduate Degree | $134,271 | $69,000 |
| Total | $56,323 | $42,603 |
Family Income in Piatt County
Family Income Brackets in Piatt County
According to the Piatt County family income data, there are 1,291 families falling into the $100,000 to $149,999 income range, which is the most common income bracket and makes up 27.9% of all families. Conversely, the $10,000 to $14,999 income bracket is the least frequent group with only 37 families (0.8%) belonging to this category.
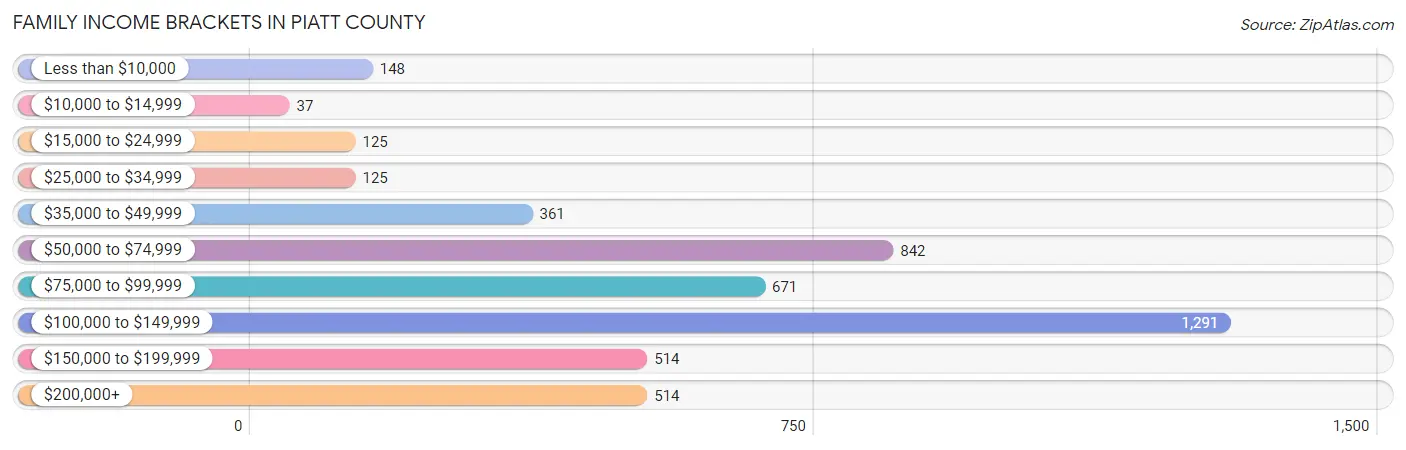
| Income Bracket | # Families | % Families |
| Less than $10,000 | 148 | 3.2% |
| $10,000 to $14,999 | 37 | 0.8% |
| $15,000 to $24,999 | 125 | 2.7% |
| $25,000 to $34,999 | 125 | 2.7% |
| $35,000 to $49,999 | 361 | 7.8% |
| $50,000 to $74,999 | 842 | 18.2% |
| $75,000 to $99,999 | 671 | 14.5% |
| $100,000 to $149,999 | 1,291 | 27.9% |
| $150,000 to $199,999 | 514 | 11.1% |
| $200,000+ | 514 | 11.1% |
Family Income by Famaliy Size in Piatt County
5-person families (376 | 8.1%) account for the highest median family income in Piatt County with $135,395 per family, while 2-person families (2,588 | 55.9%) have the highest median income of $44,552 per family member.
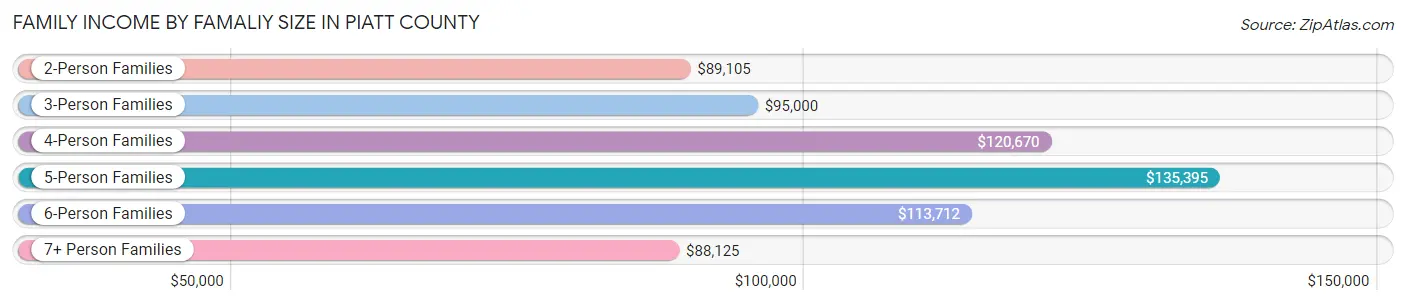
| Income Bracket | # Families | Median Income |
| 2-Person Families | 2,588 (55.9%) | $89,105 |
| 3-Person Families | 896 (19.4%) | $95,000 |
| 4-Person Families | 699 (15.1%) | $120,670 |
| 5-Person Families | 376 (8.1%) | $135,395 |
| 6-Person Families | 64 (1.4%) | $113,712 |
| 7+ Person Families | 5 (0.1%) | $88,125 |
| Total | 4,628 (100.0%) | $100,231 |
Family Income by Number of Earners in Piatt County
The median family income in Piatt County is $100,231, with families comprising 3+ earners (476) having the highest median family income of $151,250, while families with 1 earner (1,205) have the lowest median family income of $61,042, accounting for 10.3% and 26.0% of families, respectively.
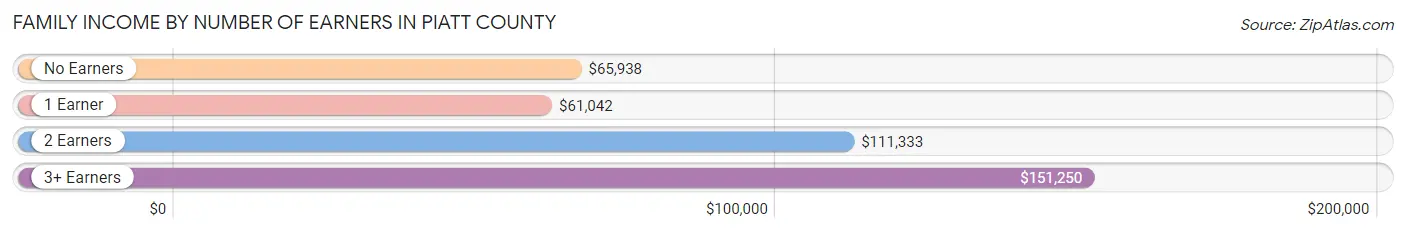
| Number of Earners | # Families | Median Income |
| No Earners | 695 (15.0%) | $65,938 |
| 1 Earner | 1,205 (26.0%) | $61,042 |
| 2 Earners | 2,252 (48.7%) | $111,333 |
| 3+ Earners | 476 (10.3%) | $151,250 |
| Total | 4,628 (100.0%) | $100,231 |
Household Income in Piatt County
Household Income Brackets in Piatt County
With 1,614 households falling in the category, the $100,000 to $149,999 income range is the most frequent in Piatt County, accounting for 23.8% of all households. In contrast, only 156 households (2.3%) fall into the $10,000 to $14,999 income bracket, making it the least populous group.
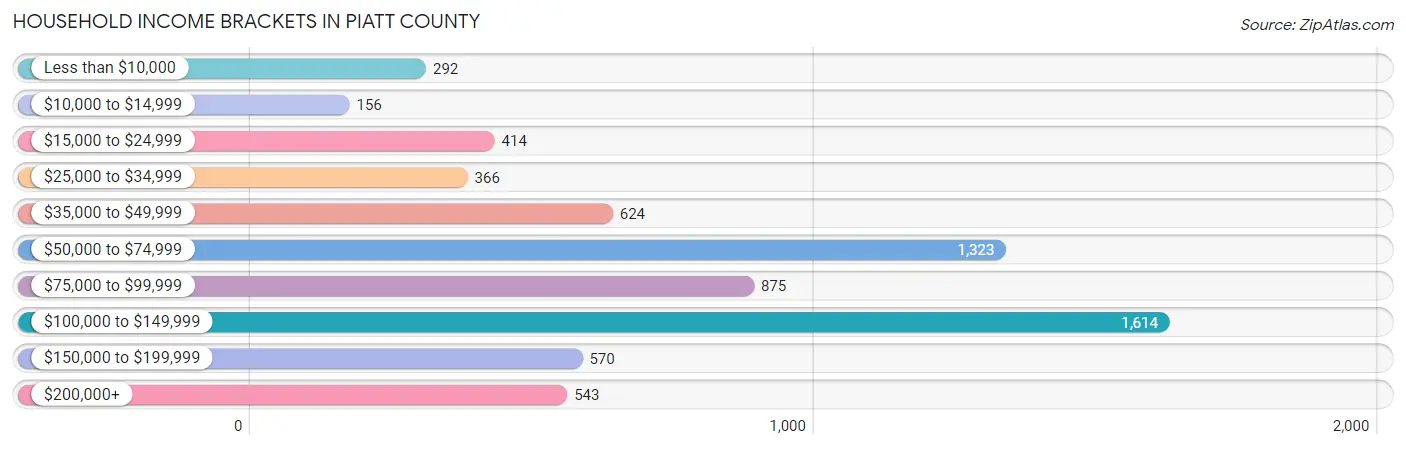
| Income Bracket | # Households | % Households |
| Less than $10,000 | 292 | 4.3% |
| $10,000 to $14,999 | 156 | 2.3% |
| $15,000 to $24,999 | 414 | 6.1% |
| $25,000 to $34,999 | 366 | 5.4% |
| $35,000 to $49,999 | 624 | 9.2% |
| $50,000 to $74,999 | 1,323 | 19.5% |
| $75,000 to $99,999 | 875 | 12.9% |
| $100,000 to $149,999 | 1,614 | 23.8% |
| $150,000 to $199,999 | 570 | 8.4% |
| $200,000+ | 543 | 8.0% |
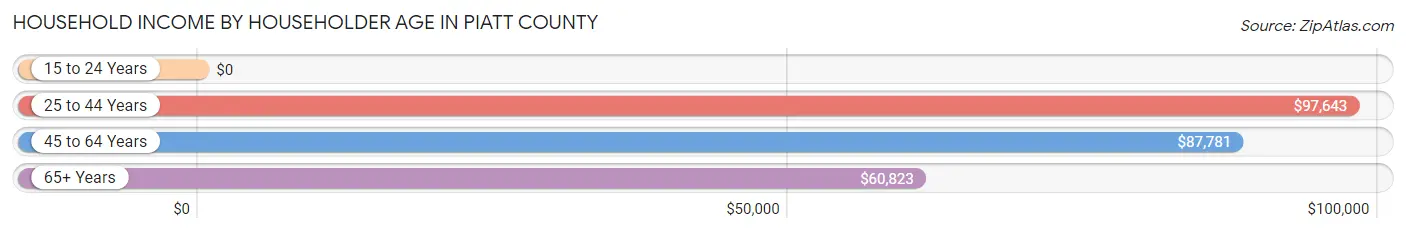
Household Income by Householder Age in Piatt County
The median household income in Piatt County is $81,151, with the highest median household income of $97,643 found in the 25 to 44 years age bracket for the primary householder. A total of 1,840 households (27.1%) fall into this category. Meanwhile, the 15 to 24 years age bracket for the primary householder has the lowest median household income of $0, with 189 households (2.8%) in this group.
| Income Bracket | # Households | Median Income |
| 15 to 24 Years | 189 (2.8%) | $0 |
| 25 to 44 Years | 1,840 (27.1%) | $97,643 |
| 45 to 64 Years | 2,618 (38.6%) | $87,781 |
| 65+ Years | 2,136 (31.5%) | $60,823 |
| Total | 6,783 (100.0%) | $81,151 |
Poverty in Piatt County
Income Below Poverty by Sex and Age in Piatt County
With 6.5% poverty level for males and 7.8% for females among the residents of Piatt County, 5 year old males and 5 year old females are the most vulnerable to poverty, with 34 males (17.4%) and 14 females (17.1%) in their respective age groups living below the poverty level.
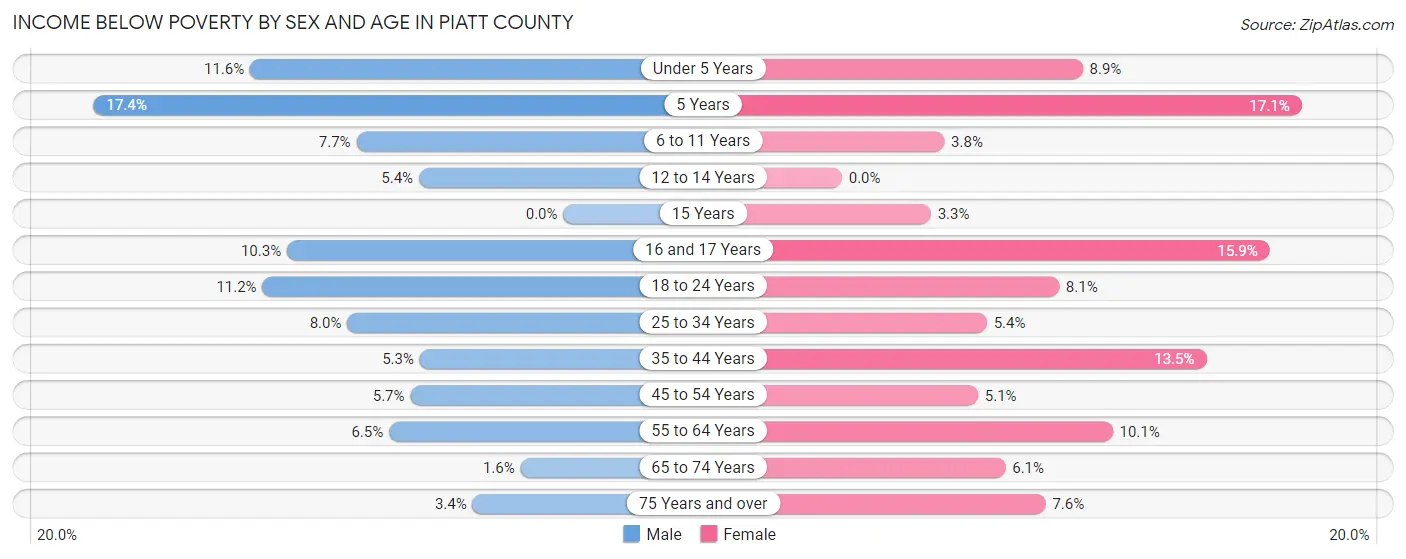
| Age Bracket | Male | Female |
| Under 5 Years | 52 (11.6%) | 43 (8.9%) |
| 5 Years | 34 (17.4%) | 14 (17.1%) |
| 6 to 11 Years | 40 (7.7%) | 27 (3.8%) |
| 12 to 14 Years | 15 (5.4%) | 0 (0.0%) |
| 15 Years | 0 (0.0%) | 3 (3.3%) |
| 16 and 17 Years | 16 (10.3%) | 37 (15.9%) |
| 18 to 24 Years | 69 (11.2%) | 46 (8.1%) |
| 25 to 34 Years | 77 (8.0%) | 48 (5.4%) |
| 35 to 44 Years | 56 (5.3%) | 141 (13.5%) |
| 45 to 54 Years | 57 (5.7%) | 50 (5.1%) |
| 55 to 64 Years | 80 (6.5%) | 128 (10.1%) |
| 65 to 74 Years | 15 (1.6%) | 60 (6.1%) |
| 75 Years and over | 20 (3.4%) | 61 (7.6%) |
| Total | 531 (6.5%) | 658 (7.8%) |
Income Above Poverty by Sex and Age in Piatt County
According to the poverty statistics in Piatt County, males aged 15 years and females aged 12 to 14 years are the age groups that are most secure financially, with 100.0% of males and 100.0% of females in these age groups living above the poverty line.
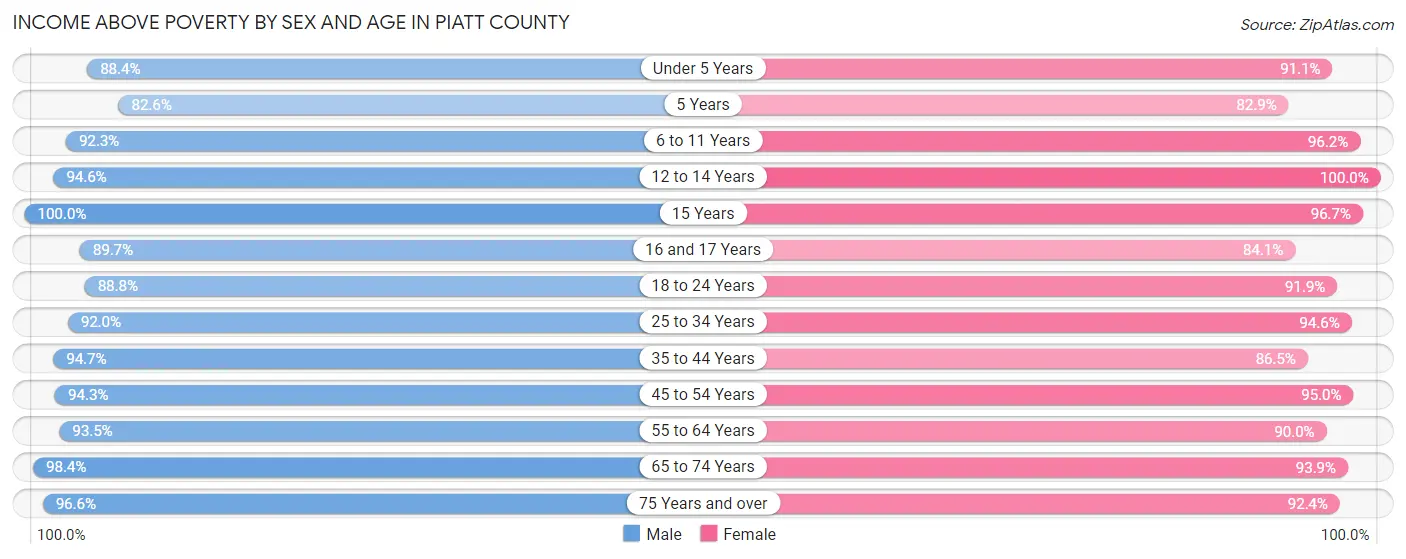
| Age Bracket | Male | Female |
| Under 5 Years | 395 (88.4%) | 438 (91.1%) |
| 5 Years | 161 (82.6%) | 68 (82.9%) |
| 6 to 11 Years | 481 (92.3%) | 683 (96.2%) |
| 12 to 14 Years | 265 (94.6%) | 262 (100.0%) |
| 15 Years | 193 (100.0%) | 88 (96.7%) |
| 16 and 17 Years | 140 (89.7%) | 196 (84.1%) |
| 18 to 24 Years | 549 (88.8%) | 525 (91.9%) |
| 25 to 34 Years | 883 (92.0%) | 844 (94.6%) |
| 35 to 44 Years | 994 (94.7%) | 901 (86.5%) |
| 45 to 54 Years | 947 (94.3%) | 940 (95.0%) |
| 55 to 64 Years | 1,157 (93.5%) | 1,145 (89.9%) |
| 65 to 74 Years | 930 (98.4%) | 929 (93.9%) |
| 75 Years and over | 573 (96.6%) | 746 (92.4%) |
| Total | 7,668 (93.5%) | 7,765 (92.2%) |
Income Below Poverty Among Married-Couple Families in Piatt County
The poverty statistics for married-couple families in Piatt County show that 2.0% or 78 of the total 3,836 families live below the poverty line. Families with 1 or 2 children have the highest poverty rate of 3.6%, comprising of 39 families. On the other hand, families with 3 or 4 children have the lowest poverty rate of 0.0%, which includes 0 families.
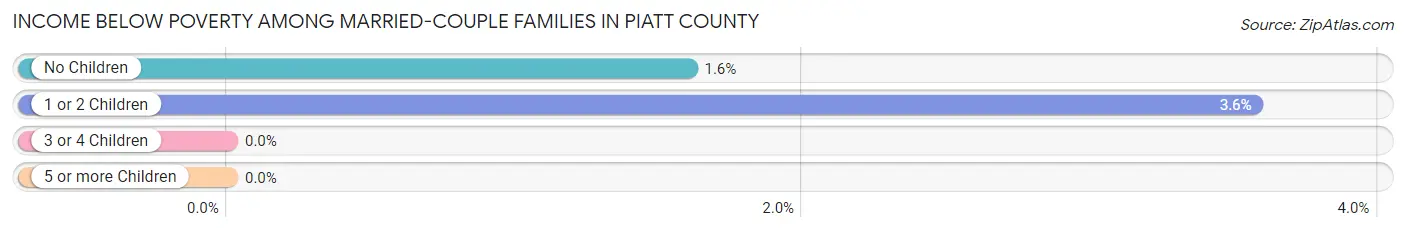
| Children | Above Poverty | Below Poverty |
| No Children | 2,403 (98.4%) | 39 (1.6%) |
| 1 or 2 Children | 1,053 (96.4%) | 39 (3.6%) |
| 3 or 4 Children | 300 (100.0%) | 0 (0.0%) |
| 5 or more Children | 2 (100.0%) | 0 (0.0%) |
| Total | 3,758 (98.0%) | 78 (2.0%) |
Income Below Poverty Among Single-Parent Households in Piatt County
According to the poverty data in Piatt County, 3.7% or 8 single-father households and 21.3% or 123 single-mother households are living below the poverty line. Among single-father households, those with 1 or 2 children have the highest poverty rate, with 6 households (5.4%) experiencing poverty. Likewise, among single-mother households, those with 3 or 4 children have the highest poverty rate, with 24 households (47.1%) falling below the poverty line.
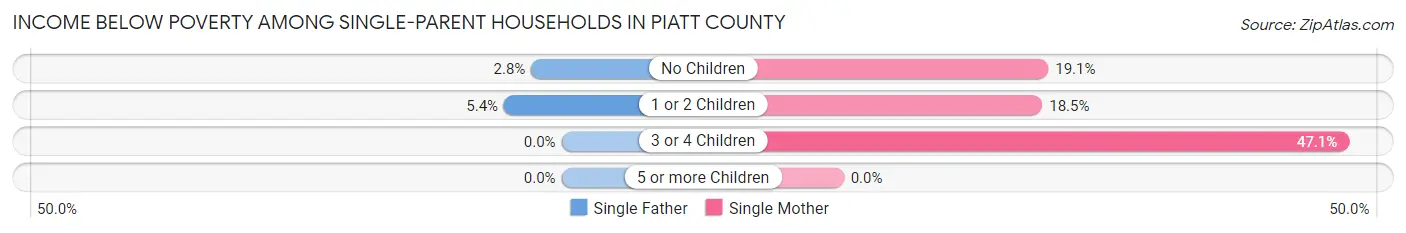
| Children | Single Father | Single Mother |
| No Children | 2 (2.8%) | 57 (19.1%) |
| 1 or 2 Children | 6 (5.4%) | 42 (18.5%) |
| 3 or 4 Children | 0 (0.0%) | 24 (47.1%) |
| 5 or more Children | 0 (0.0%) | 0 (0.0%) |
| Total | 8 (3.7%) | 123 (21.3%) |
Income Below Poverty Among Married-Couple vs Single-Parent Households in Piatt County
The poverty data for Piatt County shows that 78 of the married-couple family households (2.0%) and 131 of the single-parent households (16.5%) are living below the poverty level. Within the married-couple family households, those with 1 or 2 children have the highest poverty rate, with 39 households (3.6%) falling below the poverty line. Among the single-parent households, those with 3 or 4 children have the highest poverty rate, with 24 household (28.9%) living below poverty.
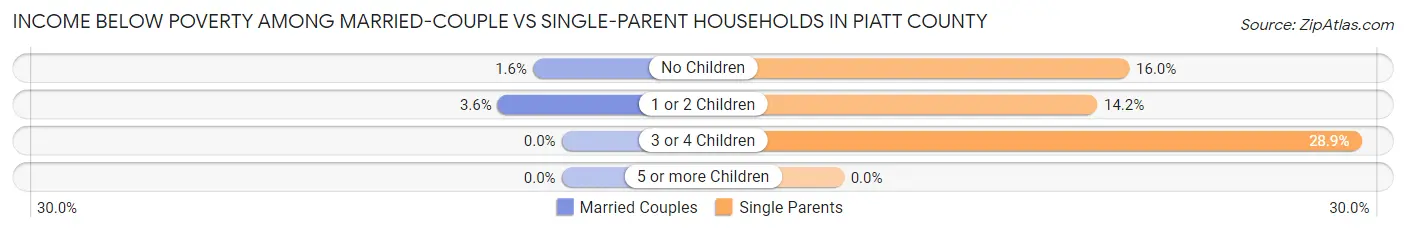
| Children | Married-Couple Families | Single-Parent Households |
| No Children | 39 (1.6%) | 59 (16.0%) |
| 1 or 2 Children | 39 (3.6%) | 48 (14.2%) |
| 3 or 4 Children | 0 (0.0%) | 24 (28.9%) |
| 5 or more Children | 0 (0.0%) | 0 (0.0%) |
| Total | 78 (2.0%) | 131 (16.5%) |
Race in Piatt County
The most populous races in Piatt County are White / Caucasian (16,035 | 96.0%), Two or more Races (439 | 2.6%), and Hispanic or Latino (251 | 1.5%).
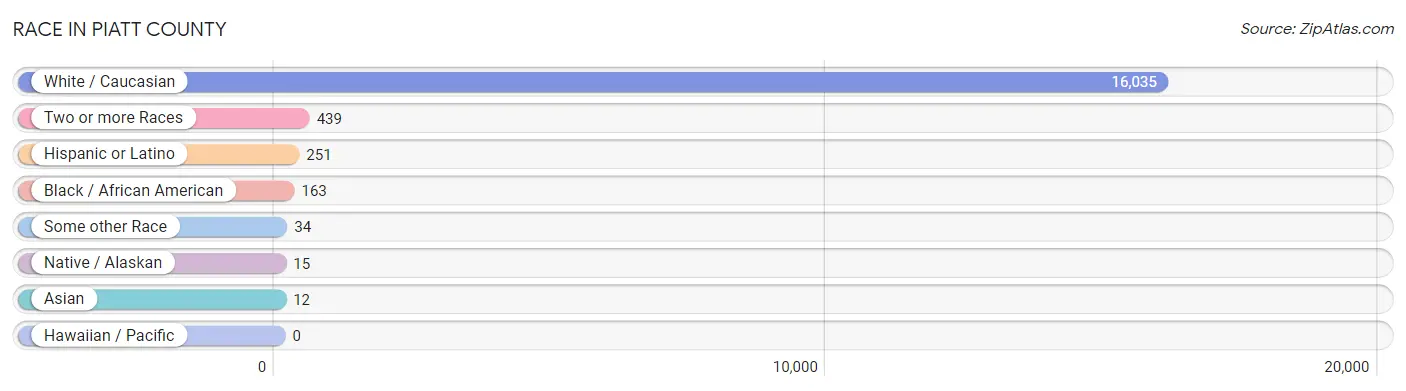
| Race | # Population | % Population |
| Asian | 12 | 0.1% |
| Black / African American | 163 | 1.0% |
| Hawaiian / Pacific | 0 | 0.0% |
| Hispanic or Latino | 251 | 1.5% |
| Native / Alaskan | 15 | 0.1% |
| White / Caucasian | 16,035 | 96.0% |
| Two or more Races | 439 | 2.6% |
| Some other Race | 34 | 0.2% |
| Total | 16,698 | 100.0% |
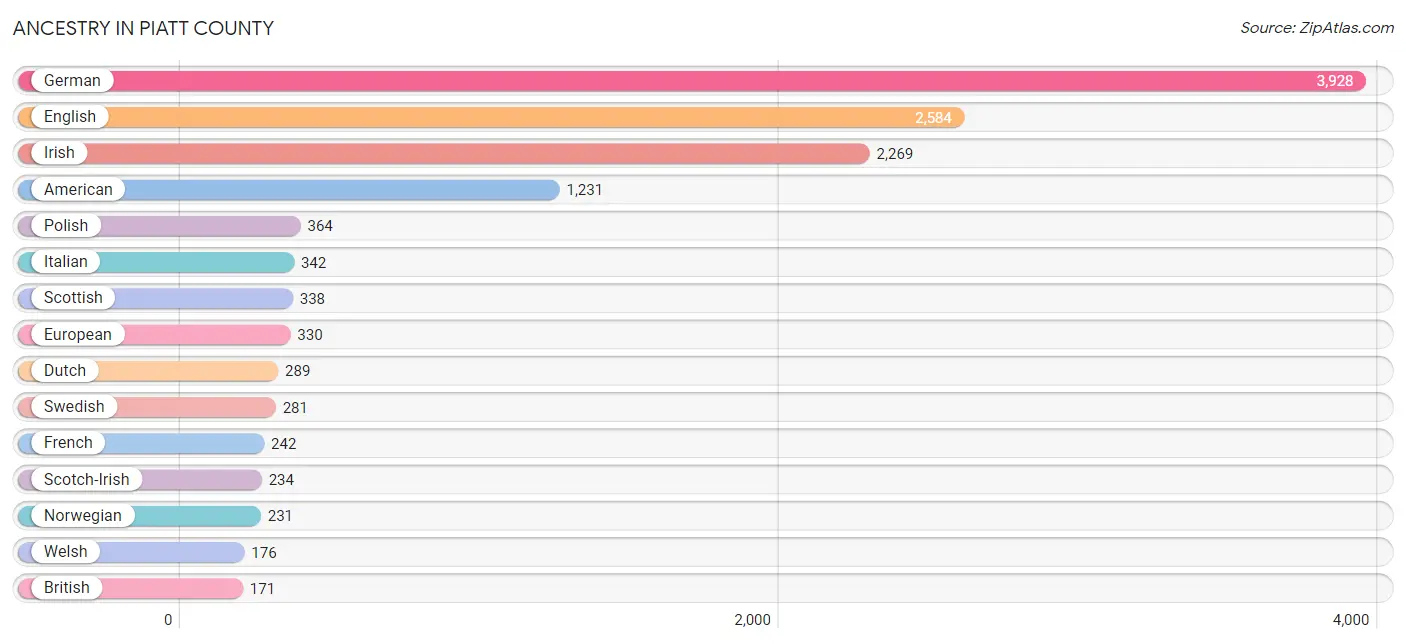
Ancestry in Piatt County
The most populous ancestries reported in Piatt County are German (3,928 | 23.5%), English (2,584 | 15.5%), Irish (2,269 | 13.6%), American (1,231 | 7.4%), and Polish (364 | 2.2%), together accounting for 62.1% of all Piatt County residents.
| Ancestry | # Population | % Population |
| Alsatian | 15 | 0.1% |
| American | 1,231 | 7.4% |
| Arab | 27 | 0.2% |
| Austrian | 46 | 0.3% |
| Belgian | 5 | 0.0% |
| Bhutanese | 1 | 0.0% |
| British | 171 | 1.0% |
| Burmese | 14 | 0.1% |
| Canadian | 16 | 0.1% |
| Central American | 5 | 0.0% |
| Central American Indian | 50 | 0.3% |
| Cherokee | 69 | 0.4% |
| Croatian | 7 | 0.0% |
| Czech | 108 | 0.6% |
| Czechoslovakian | 16 | 0.1% |
| Danish | 7 | 0.0% |
| Dutch | 289 | 1.7% |
| Eastern European | 42 | 0.3% |
| Egyptian | 7 | 0.0% |
| English | 2,584 | 15.5% |
| European | 330 | 2.0% |
| French | 242 | 1.5% |
| French Canadian | 26 | 0.2% |
| German | 3,928 | 23.5% |
| Greek | 71 | 0.4% |
| Honduran | 3 | 0.0% |
| Hungarian | 102 | 0.6% |
| Indian (Asian) | 5 | 0.0% |
| Irish | 2,269 | 13.6% |
| Italian | 342 | 2.1% |
| Korean | 30 | 0.2% |
| Lebanese | 20 | 0.1% |
| Lithuanian | 3 | 0.0% |
| Menominee | 1 | 0.0% |
| Mexican | 109 | 0.6% |
| Northern European | 17 | 0.1% |
| Norwegian | 231 | 1.4% |
| Pennsylvania German | 7 | 0.0% |
| Polish | 364 | 2.2% |
| Portuguese | 53 | 0.3% |
| Puerto Rican | 63 | 0.4% |
| Russian | 81 | 0.5% |
| Salvadoran | 2 | 0.0% |
| Scandinavian | 13 | 0.1% |
| Scotch-Irish | 234 | 1.4% |
| Scottish | 338 | 2.0% |
| Sioux | 1 | 0.0% |
| Slovak | 29 | 0.2% |
| Slovene | 3 | 0.0% |
| Spaniard | 52 | 0.3% |
| Spanish | 16 | 0.1% |
| Swedish | 281 | 1.7% |
| Swiss | 63 | 0.4% |
| Welsh | 176 | 1.1% |
| West Indian | 13 | 0.1% | View All 55 Rows |
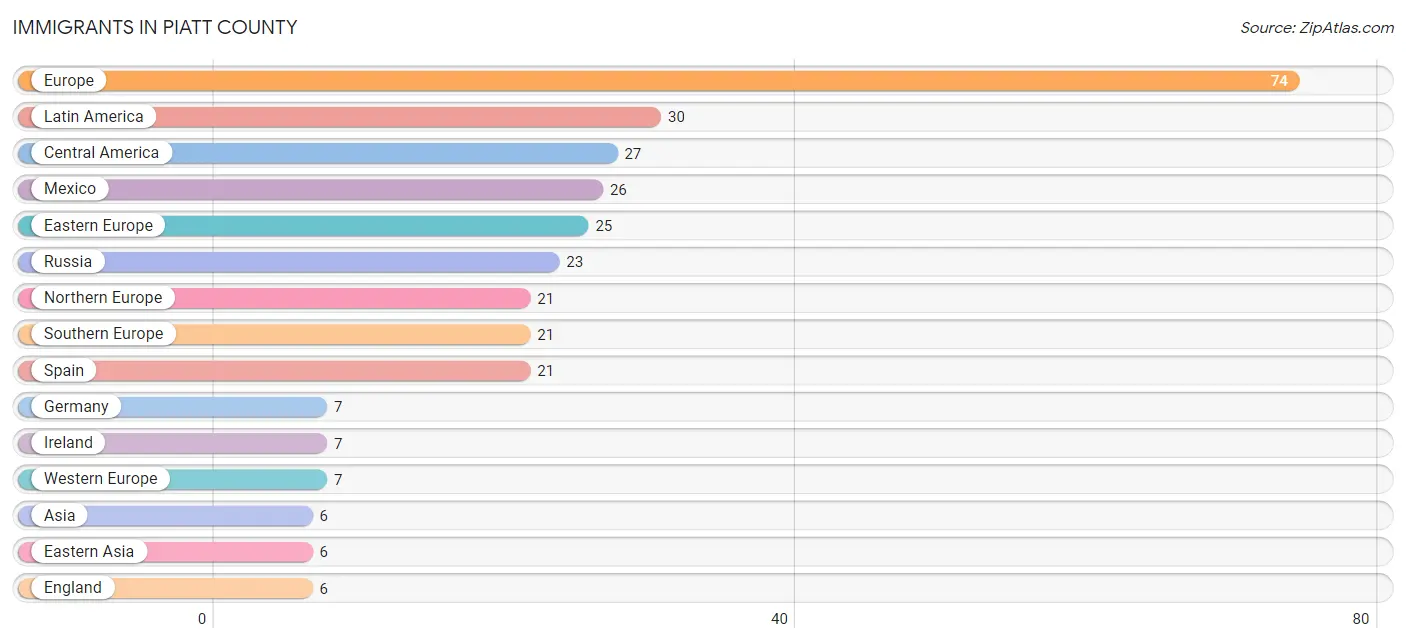
Immigrants in Piatt County
The most numerous immigrant groups reported in Piatt County came from Europe (74 | 0.4%), Latin America (30 | 0.2%), Central America (27 | 0.2%), Mexico (26 | 0.2%), and Eastern Europe (25 | 0.2%), together accounting for 1.1% of all Piatt County residents.
| Immigration Origin | # Population | % Population |
| Africa | 2 | 0.0% |
| Asia | 6 | 0.0% |
| Canada | 2 | 0.0% |
| Caribbean | 3 | 0.0% |
| Central America | 27 | 0.2% |
| Czechoslovakia | 2 | 0.0% |
| Denmark | 2 | 0.0% |
| Eastern Asia | 6 | 0.0% |
| Eastern Europe | 25 | 0.2% |
| England | 6 | 0.0% |
| Europe | 74 | 0.4% |
| Germany | 7 | 0.0% |
| Honduras | 1 | 0.0% |
| Ireland | 7 | 0.0% |
| Korea | 6 | 0.0% |
| Latin America | 30 | 0.2% |
| Mexico | 26 | 0.2% |
| Middle Africa | 2 | 0.0% |
| Northern Europe | 21 | 0.1% |
| Russia | 23 | 0.1% |
| Southern Europe | 21 | 0.1% |
| Spain | 21 | 0.1% |
| Trinidad and Tobago | 3 | 0.0% |
| Western Europe | 7 | 0.0% |
| Zaire | 2 | 0.0% | View All 25 Rows |
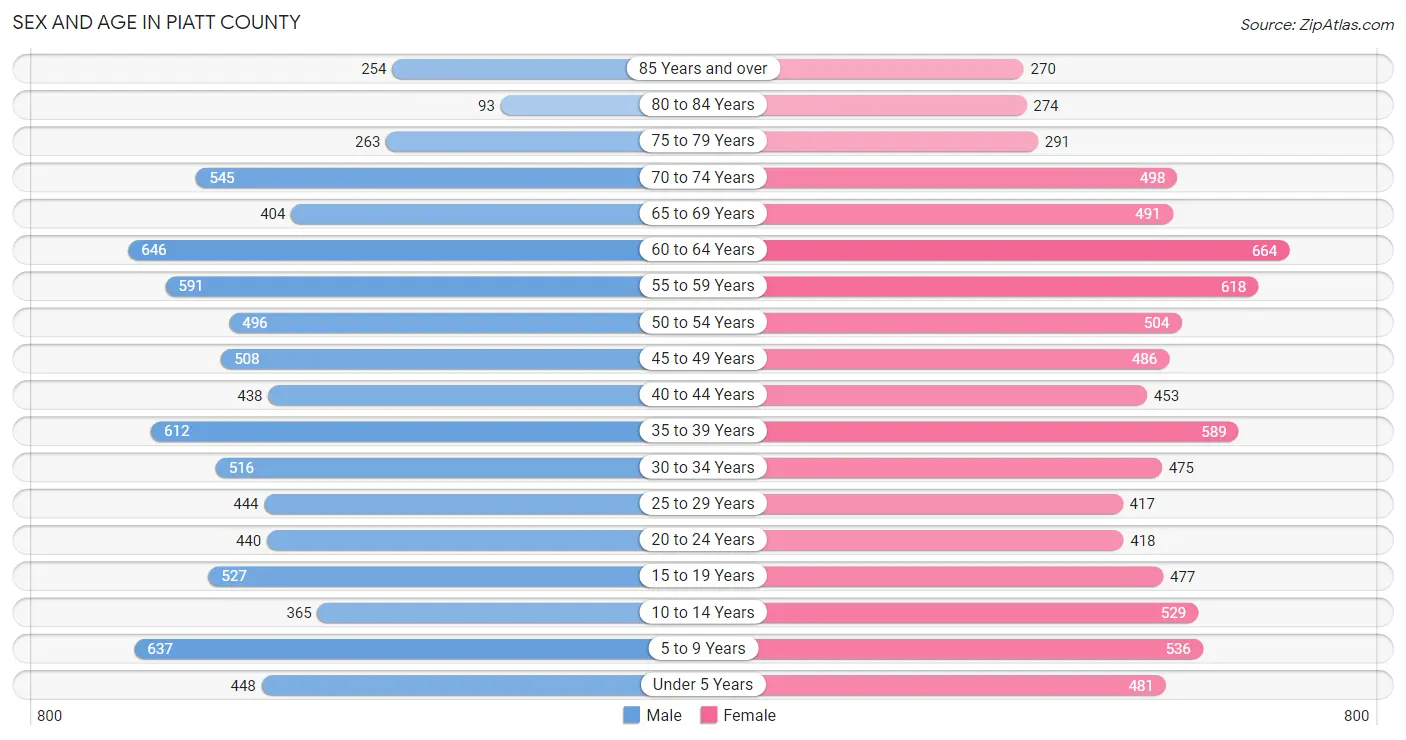
Sex and Age in Piatt County
Sex and Age in Piatt County
The most populous age groups in Piatt County are 60 to 64 Years (646 | 7.9%) for men and 60 to 64 Years (664 | 7.8%) for women.
| Age Bracket | Male | Female |
| Under 5 Years | 448 (5.4%) | 481 (5.7%) |
| 5 to 9 Years | 637 (7.7%) | 536 (6.3%) |
| 10 to 14 Years | 365 (4.4%) | 529 (6.2%) |
| 15 to 19 Years | 527 (6.4%) | 477 (5.6%) |
| 20 to 24 Years | 440 (5.3%) | 418 (4.9%) |
| 25 to 29 Years | 444 (5.4%) | 417 (4.9%) |
| 30 to 34 Years | 516 (6.3%) | 475 (5.6%) |
| 35 to 39 Years | 612 (7.4%) | 589 (7.0%) |
| 40 to 44 Years | 438 (5.3%) | 453 (5.3%) |
| 45 to 49 Years | 508 (6.2%) | 486 (5.7%) |
| 50 to 54 Years | 496 (6.0%) | 504 (5.9%) |
| 55 to 59 Years | 591 (7.2%) | 618 (7.3%) |
| 60 to 64 Years | 646 (7.9%) | 664 (7.8%) |
| 65 to 69 Years | 404 (4.9%) | 491 (5.8%) |
| 70 to 74 Years | 545 (6.6%) | 498 (5.9%) |
| 75 to 79 Years | 263 (3.2%) | 291 (3.4%) |
| 80 to 84 Years | 93 (1.1%) | 274 (3.2%) |
| 85 Years and over | 254 (3.1%) | 270 (3.2%) |
| Total | 8,227 (100.0%) | 8,471 (100.0%) |
Families and Households in Piatt County
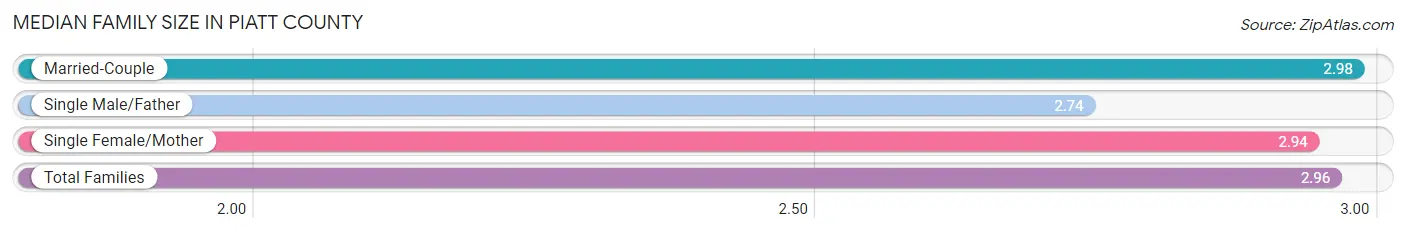
Median Family Size in Piatt County
The median family size in Piatt County is 2.96 persons per family, with married-couple families (3,836 | 82.9%) accounting for the largest median family size of 2.98 persons per family. On the other hand, single male/father families (215 | 4.6%) represent the smallest median family size with 2.74 persons per family.
| Family Type | # Families | Family Size |
| Married-Couple | 3,836 (82.9%) | 2.98 |
| Single Male/Father | 215 (4.6%) | 2.74 |
| Single Female/Mother | 577 (12.5%) | 2.94 |
| Total Families | 4,628 (100.0%) | 2.96 |
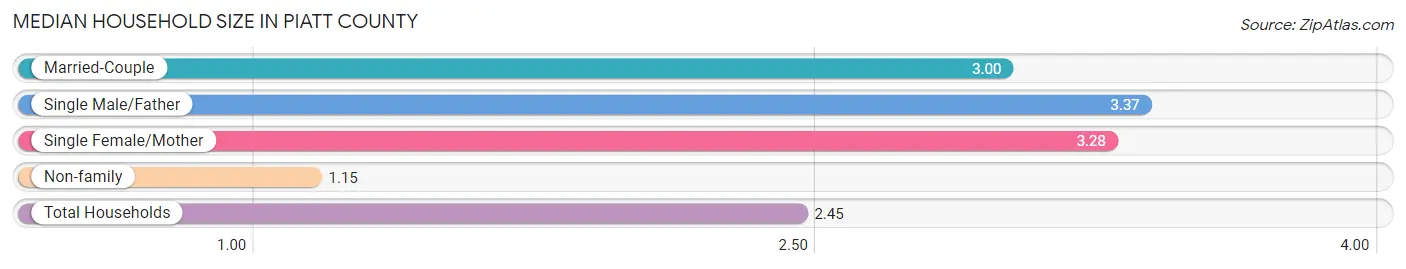
Median Household Size in Piatt County
The median household size in Piatt County is 2.45 persons per household, with single male/father households (215 | 3.2%) accounting for the largest median household size of 3.37 persons per household. non-family households (2,155 | 31.8%) represent the smallest median household size with 1.15 persons per household.
| Household Type | # Households | Household Size |
| Married-Couple | 3,836 (56.6%) | 3.00 |
| Single Male/Father | 215 (3.2%) | 3.37 |
| Single Female/Mother | 577 (8.5%) | 3.28 |
| Non-family | 2,155 (31.8%) | 1.15 |
| Total Households | 6,783 (100.0%) | 2.45 |
Household Size by Marriage Status in Piatt County
Out of a total of 6,783 households in Piatt County, 4,628 (68.2%) are family households, while 2,155 (31.8%) are nonfamily households. The most numerous type of family households are 2-person households, comprising 2,362, and the most common type of nonfamily households are 1-person households, comprising 1,921.
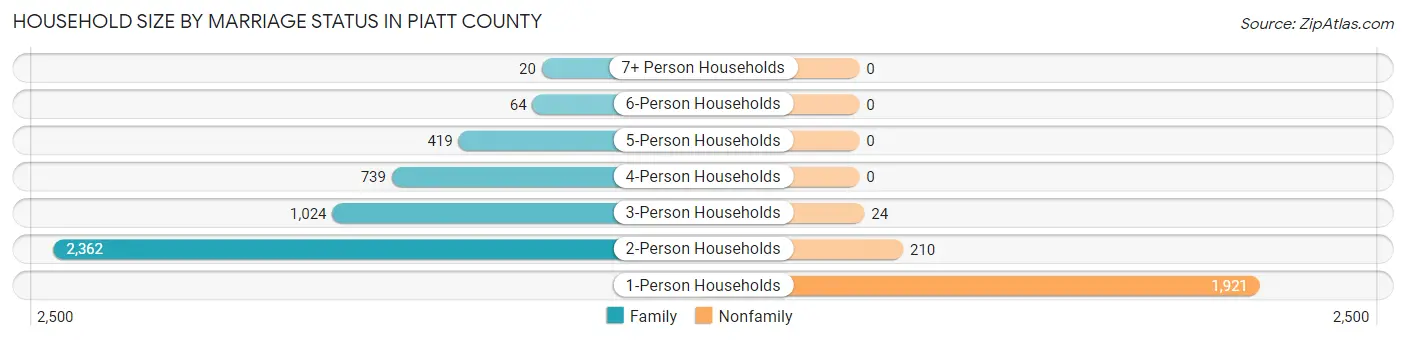
| Household Size | Family Households | Nonfamily Households |
| 1-Person Households | - | 1,921 (28.3%) |
| 2-Person Households | 2,362 (34.8%) | 210 (3.1%) |
| 3-Person Households | 1,024 (15.1%) | 24 (0.4%) |
| 4-Person Households | 739 (10.9%) | 0 (0.0%) |
| 5-Person Households | 419 (6.2%) | 0 (0.0%) |
| 6-Person Households | 64 (0.9%) | 0 (0.0%) |
| 7+ Person Households | 20 (0.3%) | 0 (0.0%) |
| Total | 4,628 (68.2%) | 2,155 (31.8%) |
Female Fertility in Piatt County
Fertility by Age in Piatt County
Average fertility rate in Piatt County is 46.0 births per 1,000 women. Women in the age bracket of 20 to 34 years have the highest fertility rate with 82.0 births per 1,000 women. Women in the age bracket of 20 to 34 years acount for 68.3% of all women with births.
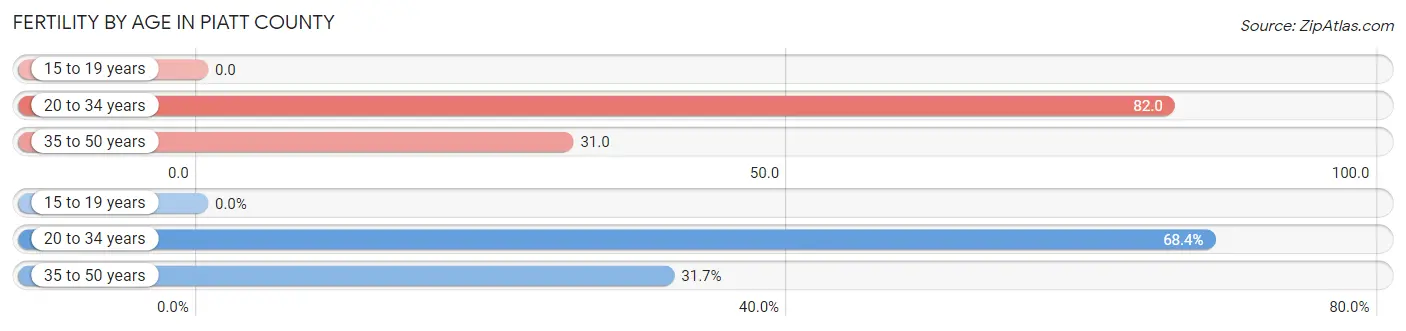
| Age Bracket | Women with Births | Births / 1,000 Women |
| 15 to 19 years | 0 (0.0%) | 0.0 |
| 20 to 34 years | 108 (68.3%) | 82.0 |
| 35 to 50 years | 50 (31.7%) | 31.0 |
| Total | 158 (100.0%) | 46.0 |
Fertility by Age by Marriage Status in Piatt County
59.5% of women with births (158) in Piatt County are married. The highest percentage of unmarried women with births falls into 20 to 34 years age bracket with 43.5% of them unmarried at the time of birth, while the lowest percentage of unmarried women with births belong to 35 to 50 years age bracket with 34.0% of them unmarried.
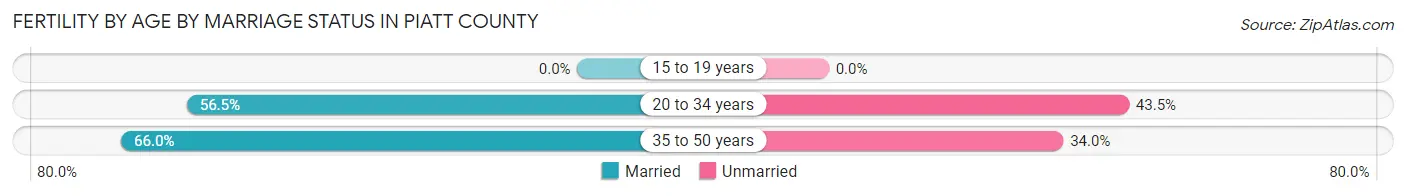
| Age Bracket | Married | Unmarried |
| 15 to 19 years | 0 (0.0%) | 0 (0.0%) |
| 20 to 34 years | 61 (56.5%) | 47 (43.5%) |
| 35 to 50 years | 33 (66.0%) | 17 (34.0%) |
| Total | 94 (59.5%) | 64 (40.5%) |
Fertility by Education in Piatt County
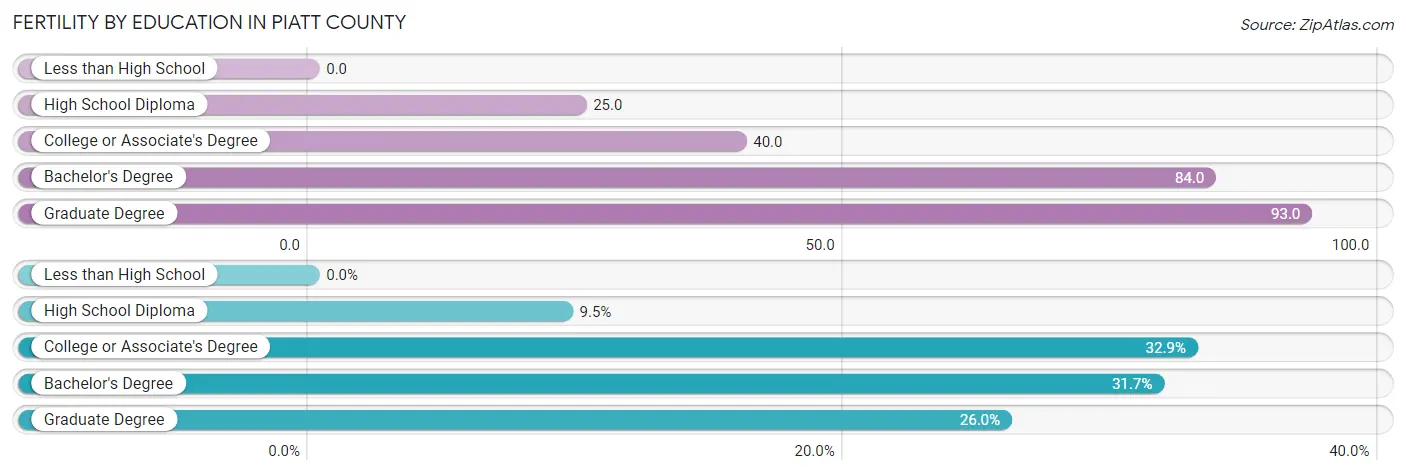
| Educational Attainment | Women with Births | Births / 1,000 Women |
| Less than High School | 0 (0.0%) | 0.0 |
| High School Diploma | 15 (9.5%) | 25.0 |
| College or Associate's Degree | 52 (32.9%) | 40.0 |
| Bachelor's Degree | 50 (31.7%) | 84.0 |
| Graduate Degree | 41 (26.0%) | 93.0 |
| Total | 158 (100.0%) | 46.0 |
Fertility by Education by Marriage Status in Piatt County
40.5% of women with births in Piatt County are unmarried. Women with the educational attainment of graduate degree are most likely to be married with 100.0% of them married at childbirth, while women with the educational attainment of college or associate's degree are least likely to be married with 63.5% of them unmarried at childbirth.
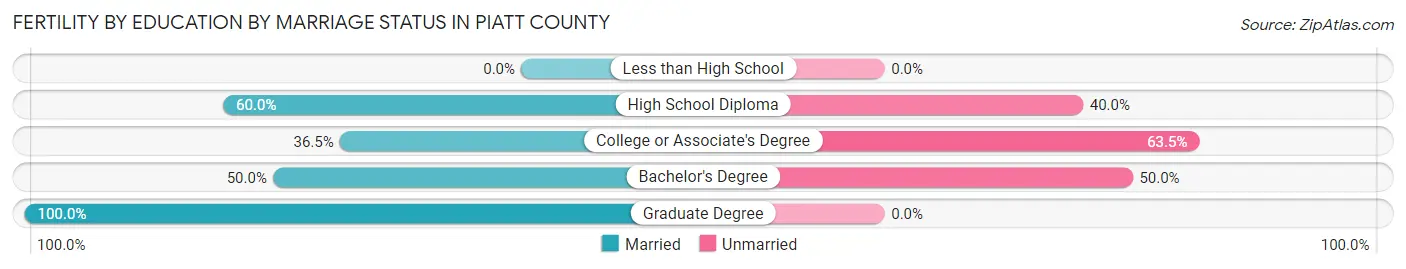
| Educational Attainment | Married | Unmarried |
| Less than High School | 0 (0.0%) | 0 (0.0%) |
| High School Diploma | 9 (60.0%) | 6 (40.0%) |
| College or Associate's Degree | 19 (36.5%) | 33 (63.5%) |
| Bachelor's Degree | 25 (50.0%) | 25 (50.0%) |
| Graduate Degree | 41 (100.0%) | 0 (0.0%) |
| Total | 94 (59.5%) | 64 (40.5%) |
Employment Characteristics in Piatt County
Employment by Class of Employer in Piatt County
Among the 8,230 employed individuals in Piatt County, private company employees (4,999 | 60.7%), not-for-profit organizations (937 | 11.4%), and local government employees (837 | 10.2%) make up the most common classes of employment.
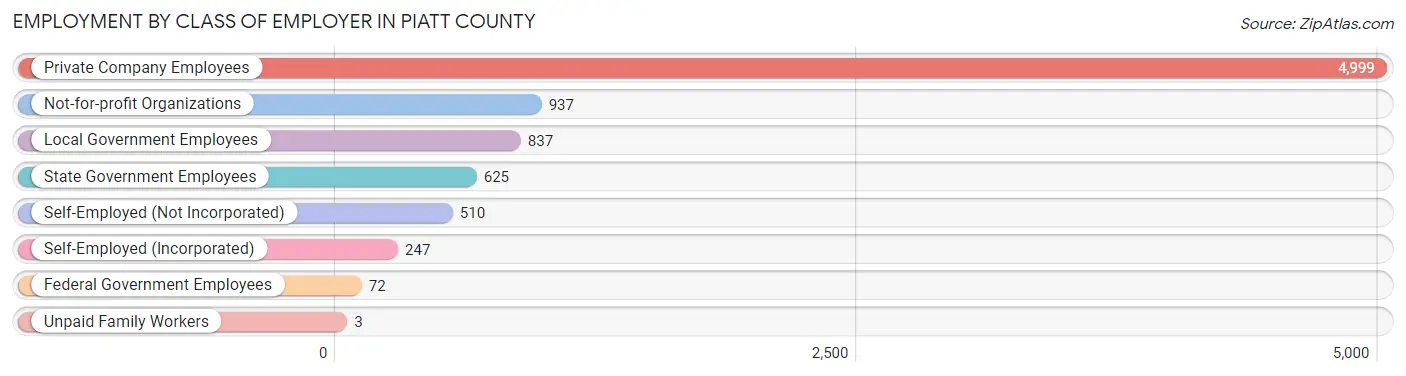
| Employer Class | # Employees | % Employees |
| Private Company Employees | 4,999 | 60.7% |
| Self-Employed (Incorporated) | 247 | 3.0% |
| Self-Employed (Not Incorporated) | 510 | 6.2% |
| Not-for-profit Organizations | 937 | 11.4% |
| Local Government Employees | 837 | 10.2% |
| State Government Employees | 625 | 7.6% |
| Federal Government Employees | 72 | 0.9% |
| Unpaid Family Workers | 3 | 0.0% |
| Total | 8,230 | 100.0% |
Employment Status by Age in Piatt County
According to the labor force statistics for Piatt County, out of the total population over 16 years of age (13,418), 64.7% or 8,681 individuals are in the labor force, with 4.7% or 408 of them unemployed. The age group with the highest labor force participation rate is 20 to 24 years, with 90.3% or 775 individuals in the labor force. Within the labor force, the 75 years and over age range has the highest percentage of unemployed individuals, with 15.7% or 8 of them being unemployed.
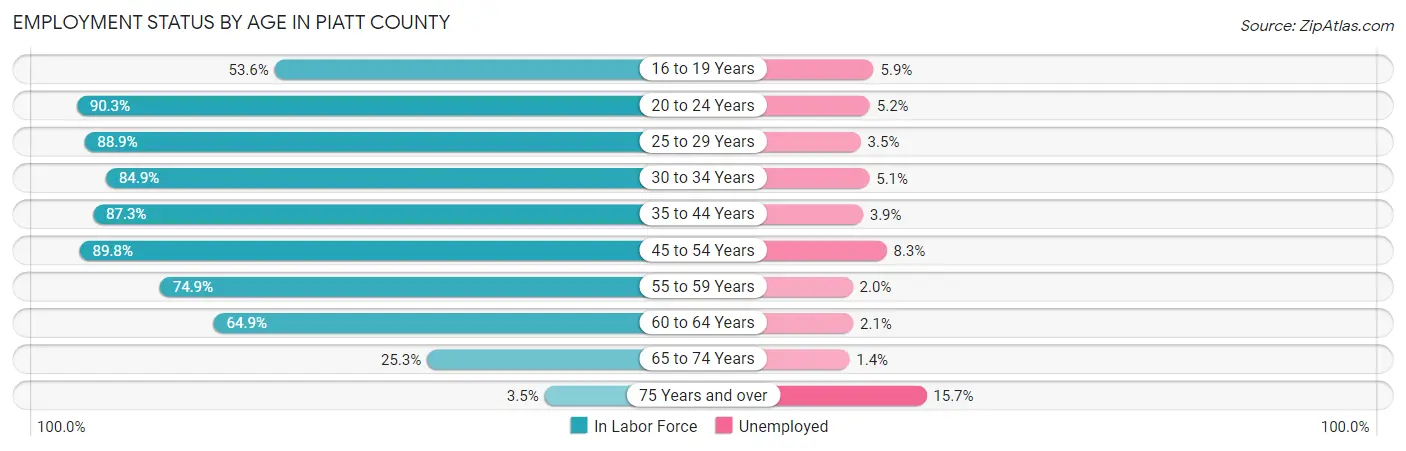
| Age Bracket | In Labor Force | Unemployed |
| 16 to 19 Years | 386 (53.6%) | 23 (5.9%) |
| 20 to 24 Years | 775 (90.3%) | 40 (5.2%) |
| 25 to 29 Years | 765 (88.9%) | 27 (3.5%) |
| 30 to 34 Years | 841 (84.9%) | 43 (5.1%) |
| 35 to 44 Years | 1,826 (87.3%) | 71 (3.9%) |
| 45 to 54 Years | 1,791 (89.8%) | 149 (8.3%) |
| 55 to 59 Years | 906 (74.9%) | 18 (2.0%) |
| 60 to 64 Years | 850 (64.9%) | 18 (2.1%) |
| 65 to 74 Years | 490 (25.3%) | 7 (1.4%) |
| 75 Years and over | 51 (3.5%) | 8 (15.7%) |
| Total | 8,681 (64.7%) | 408 (4.7%) |
Employment Status by Educational Attainment in Piatt County
According to labor force statistics for Piatt County, 82.5% of individuals (6,977) out of the total population between 25 and 64 years of age (8,457) are in the labor force, with 4.7% or 328 of them being unemployed. The group with the highest labor force participation rate are those with the educational attainment of bachelor's degree or higher, with 92.3% or 2,601 individuals in the labor force. Within the labor force, individuals with less than high school education have the highest percentage of unemployment, with 26.0% or 81 of them being unemployed.
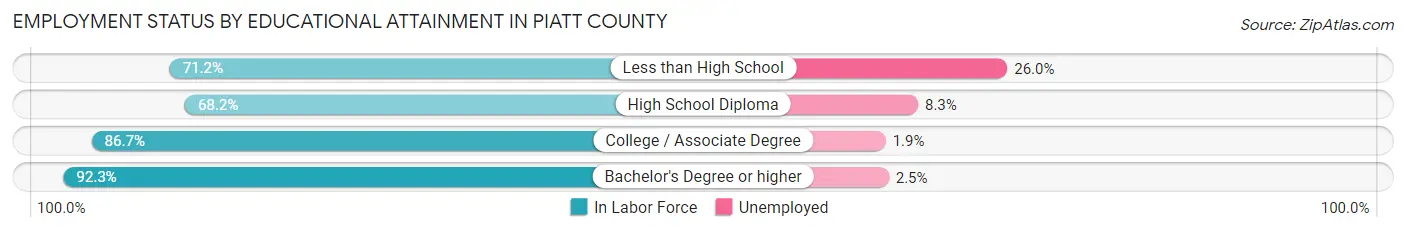
| Educational Attainment | In Labor Force | Unemployed |
| Less than High School | 312 (71.2%) | 114 (26.0%) |
| High School Diploma | 1,635 (68.2%) | 199 (8.3%) |
| College / Associate Degree | 2,431 (86.7%) | 53 (1.9%) |
| Bachelor's Degree or higher | 2,601 (92.3%) | 70 (2.5%) |
| Total | 6,977 (82.5%) | 397 (4.7%) |
Employment Occupations by Sex in Piatt County
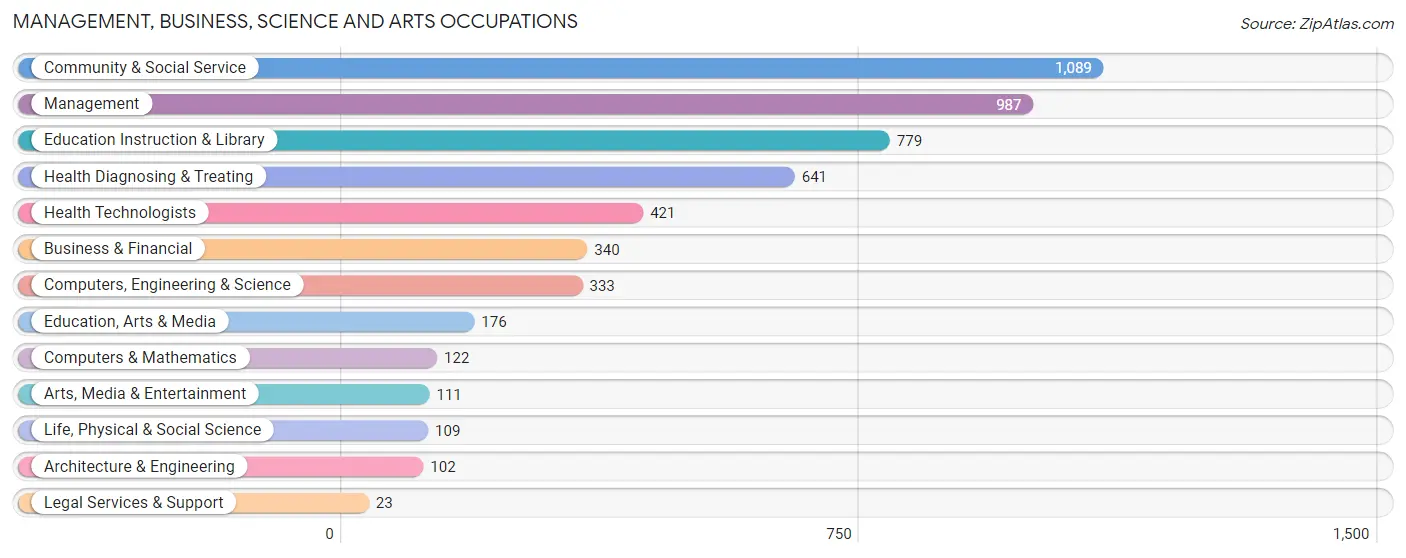
Management, Business, Science and Arts Occupations
The most common Management, Business, Science and Arts occupations in Piatt County are Community & Social Service (1,089 | 13.2%), Management (987 | 11.9%), Education Instruction & Library (779 | 9.4%), Health Diagnosing & Treating (641 | 7.8%), and Health Technologists (421 | 5.1%).
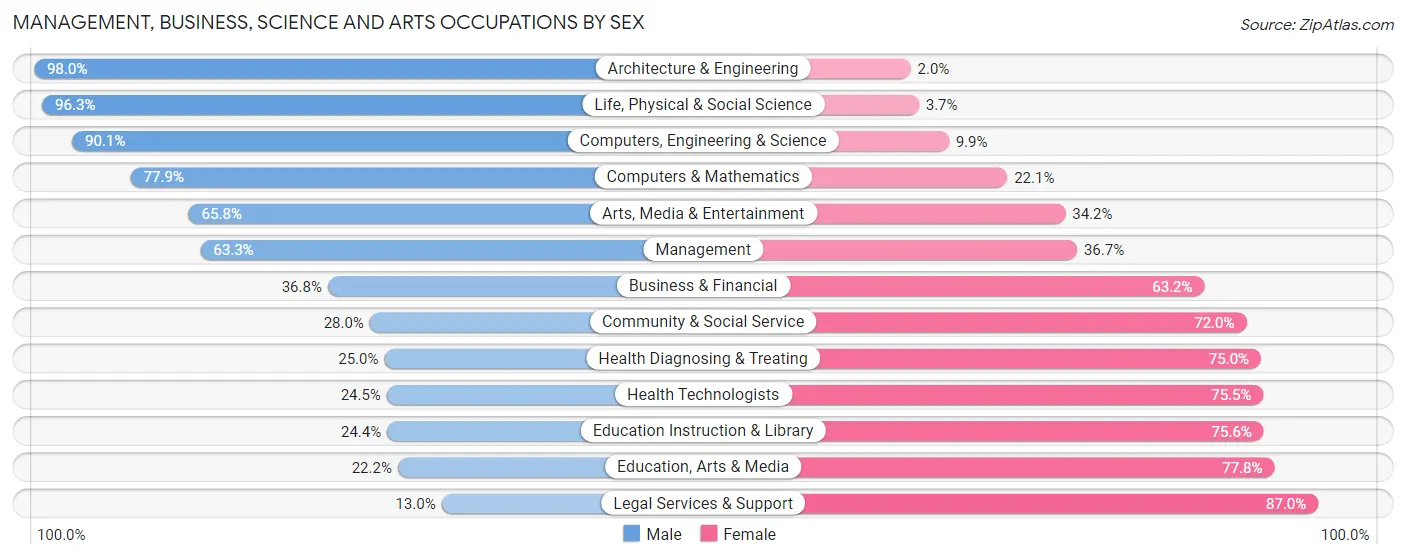
Management, Business, Science and Arts Occupations by Sex
Within the Management, Business, Science and Arts occupations in Piatt County, the most male-oriented occupations are Architecture & Engineering (98.0%), Life, Physical & Social Science (96.3%), and Computers, Engineering & Science (90.1%), while the most female-oriented occupations are Legal Services & Support (87.0%), Education, Arts & Media (77.8%), and Education Instruction & Library (75.6%).
| Occupation | Male | Female |
| Management | 625 (63.3%) | 362 (36.7%) |
| Business & Financial | 125 (36.8%) | 215 (63.2%) |
| Computers, Engineering & Science | 300 (90.1%) | 33 (9.9%) |
| Computers & Mathematics | 95 (77.9%) | 27 (22.1%) |
| Architecture & Engineering | 100 (98.0%) | 2 (2.0%) |
| Life, Physical & Social Science | 105 (96.3%) | 4 (3.7%) |
| Community & Social Service | 305 (28.0%) | 784 (72.0%) |
| Education, Arts & Media | 39 (22.2%) | 137 (77.8%) |
| Legal Services & Support | 3 (13.0%) | 20 (87.0%) |
| Education Instruction & Library | 190 (24.4%) | 589 (75.6%) |
| Arts, Media & Entertainment | 73 (65.8%) | 38 (34.2%) |
| Health Diagnosing & Treating | 160 (25.0%) | 481 (75.0%) |
| Health Technologists | 103 (24.5%) | 318 (75.5%) |
| Total (Category) | 1,515 (44.7%) | 1,875 (55.3%) |
| Total (Overall) | 4,434 (53.7%) | 3,829 (46.3%) |
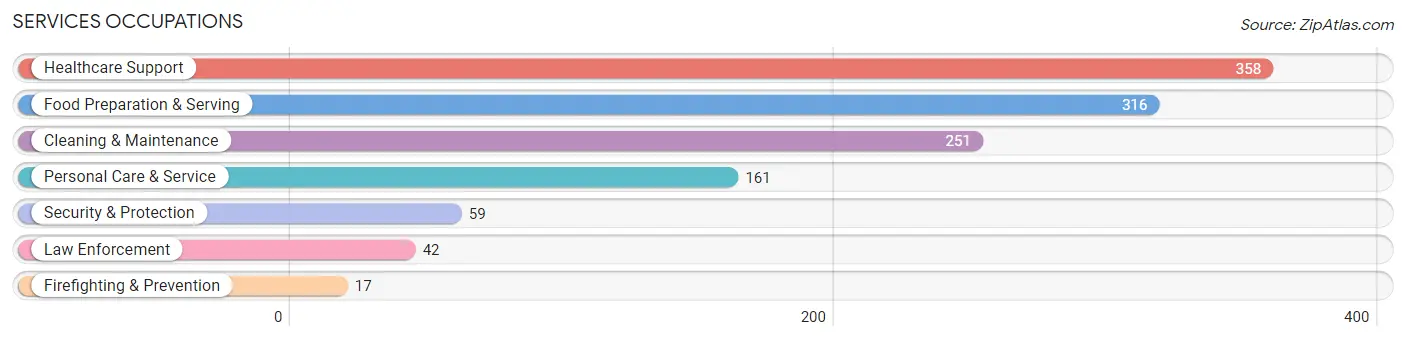
Services Occupations
The most common Services occupations in Piatt County are Healthcare Support (358 | 4.3%), Food Preparation & Serving (316 | 3.8%), Cleaning & Maintenance (251 | 3.0%), Personal Care & Service (161 | 1.9%), and Security & Protection (59 | 0.7%).
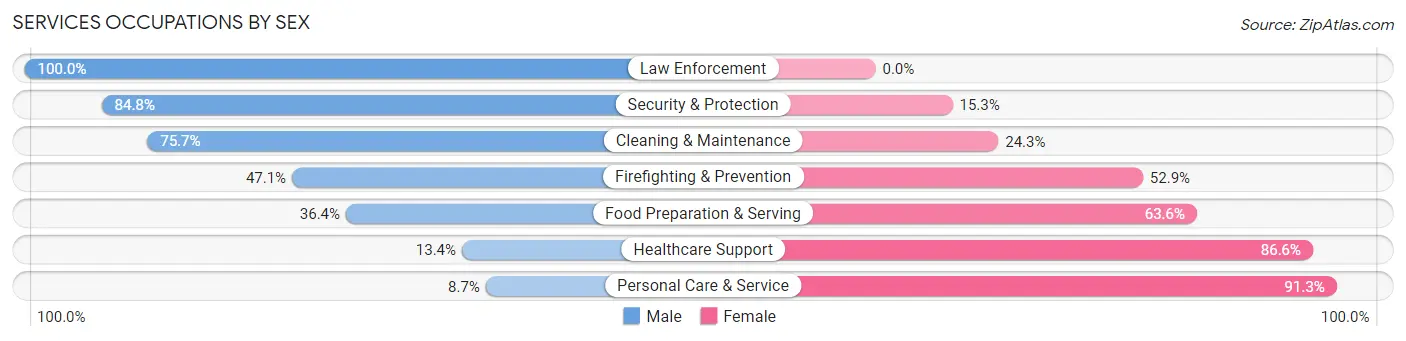
Services Occupations by Sex
Within the Services occupations in Piatt County, the most male-oriented occupations are Law Enforcement (100.0%), Security & Protection (84.8%), and Cleaning & Maintenance (75.7%), while the most female-oriented occupations are Personal Care & Service (91.3%), Healthcare Support (86.6%), and Food Preparation & Serving (63.6%).
| Occupation | Male | Female |
| Healthcare Support | 48 (13.4%) | 310 (86.6%) |
| Security & Protection | 50 (84.8%) | 9 (15.2%) |
| Firefighting & Prevention | 8 (47.1%) | 9 (52.9%) |
| Law Enforcement | 42 (100.0%) | 0 (0.0%) |
| Food Preparation & Serving | 115 (36.4%) | 201 (63.6%) |
| Cleaning & Maintenance | 190 (75.7%) | 61 (24.3%) |
| Personal Care & Service | 14 (8.7%) | 147 (91.3%) |
| Total (Category) | 417 (36.4%) | 728 (63.6%) |
| Total (Overall) | 4,434 (53.7%) | 3,829 (46.3%) |
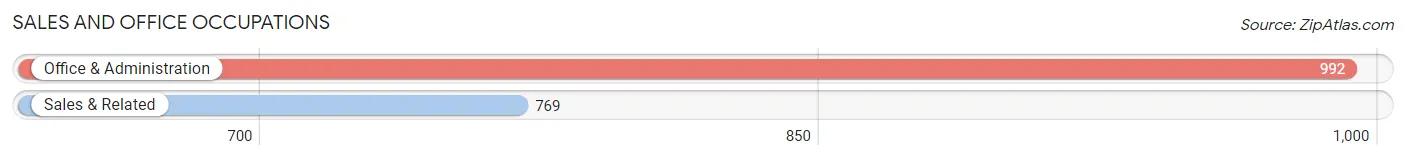
Sales and Office Occupations
The most common Sales and Office occupations in Piatt County are Office & Administration (992 | 12.0%), and Sales & Related (769 | 9.3%).
Sales and Office Occupations by Sex
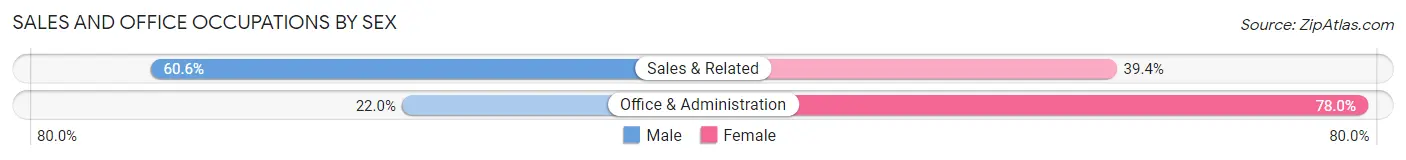
| Occupation | Male | Female |
| Sales & Related | 466 (60.6%) | 303 (39.4%) |
| Office & Administration | 218 (22.0%) | 774 (78.0%) |
| Total (Category) | 684 (38.8%) | 1,077 (61.2%) |
| Total (Overall) | 4,434 (53.7%) | 3,829 (46.3%) |
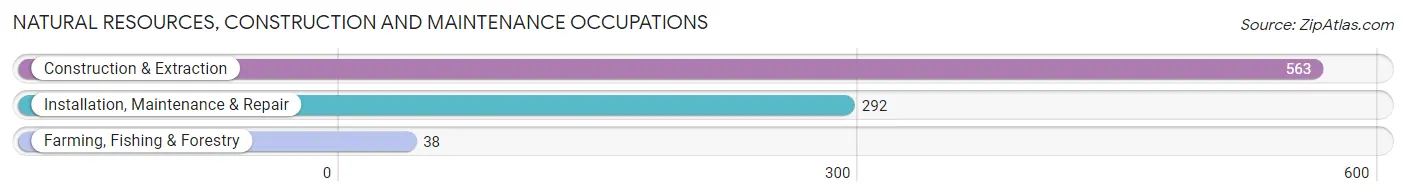
Natural Resources, Construction and Maintenance Occupations
The most common Natural Resources, Construction and Maintenance occupations in Piatt County are Construction & Extraction (563 | 6.8%), Installation, Maintenance & Repair (292 | 3.5%), and Farming, Fishing & Forestry (38 | 0.5%).
Natural Resources, Construction and Maintenance Occupations by Sex
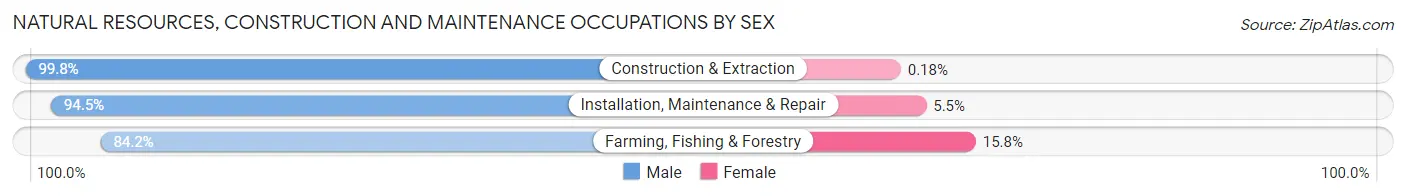
| Occupation | Male | Female |
| Farming, Fishing & Forestry | 32 (84.2%) | 6 (15.8%) |
| Construction & Extraction | 562 (99.8%) | 1 (0.2%) |
| Installation, Maintenance & Repair | 276 (94.5%) | 16 (5.5%) |
| Total (Category) | 870 (97.4%) | 23 (2.6%) |
| Total (Overall) | 4,434 (53.7%) | 3,829 (46.3%) |
Production, Transportation and Moving Occupations
The most common Production, Transportation and Moving occupations in Piatt County are Production (494 | 6.0%), Transportation (302 | 3.6%), and Material Moving (278 | 3.4%).
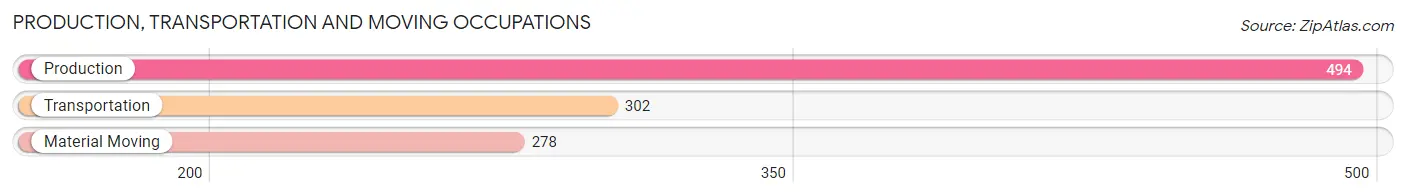
Production, Transportation and Moving Occupations by Sex
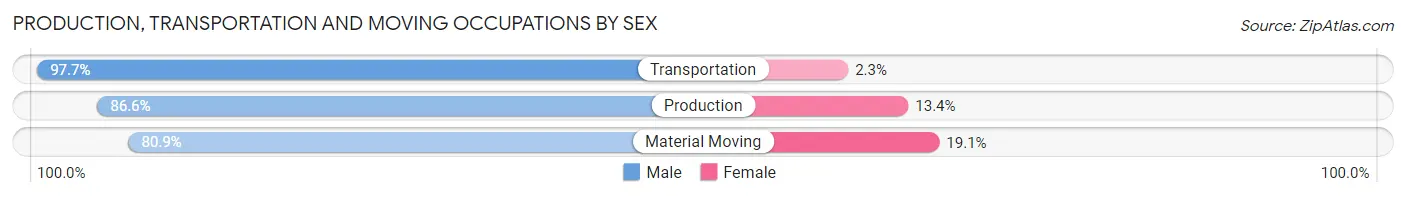
| Occupation | Male | Female |
| Production | 428 (86.6%) | 66 (13.4%) |
| Transportation | 295 (97.7%) | 7 (2.3%) |
| Material Moving | 225 (80.9%) | 53 (19.1%) |
| Total (Category) | 948 (88.3%) | 126 (11.7%) |
| Total (Overall) | 4,434 (53.7%) | 3,829 (46.3%) |
Employment Industries by Sex in Piatt County
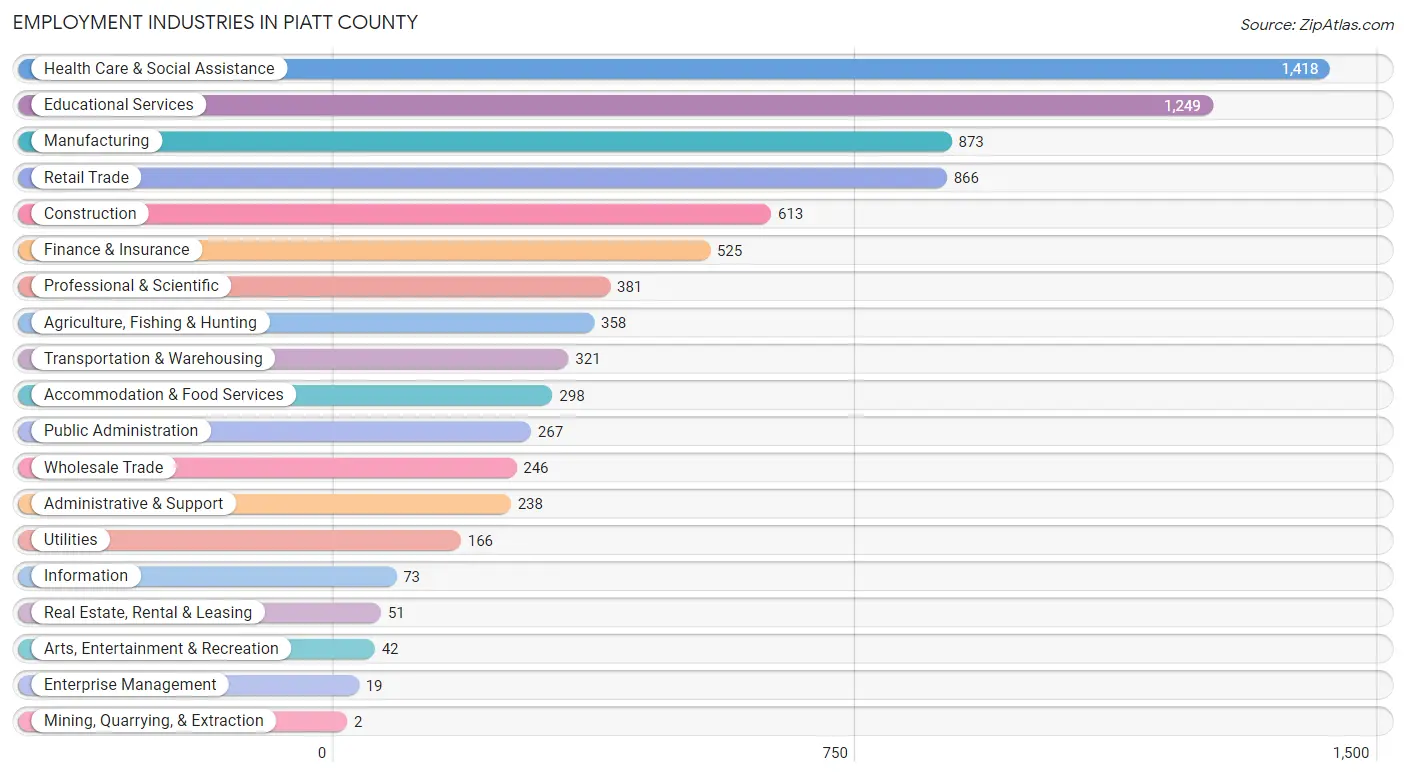
Employment Industries in Piatt County
The major employment industries in Piatt County include Health Care & Social Assistance (1,418 | 17.2%), Educational Services (1,249 | 15.1%), Manufacturing (873 | 10.6%), Retail Trade (866 | 10.5%), and Construction (613 | 7.4%).
Employment Industries by Sex in Piatt County
The Piatt County industries that see more men than women are Mining, Quarrying, & Extraction (100.0%), Construction (95.9%), and Agriculture, Fishing & Hunting (89.4%), whereas the industries that tend to have a higher number of women are Arts, Entertainment & Recreation (83.3%), Health Care & Social Assistance (79.2%), and Enterprise Management (78.9%).
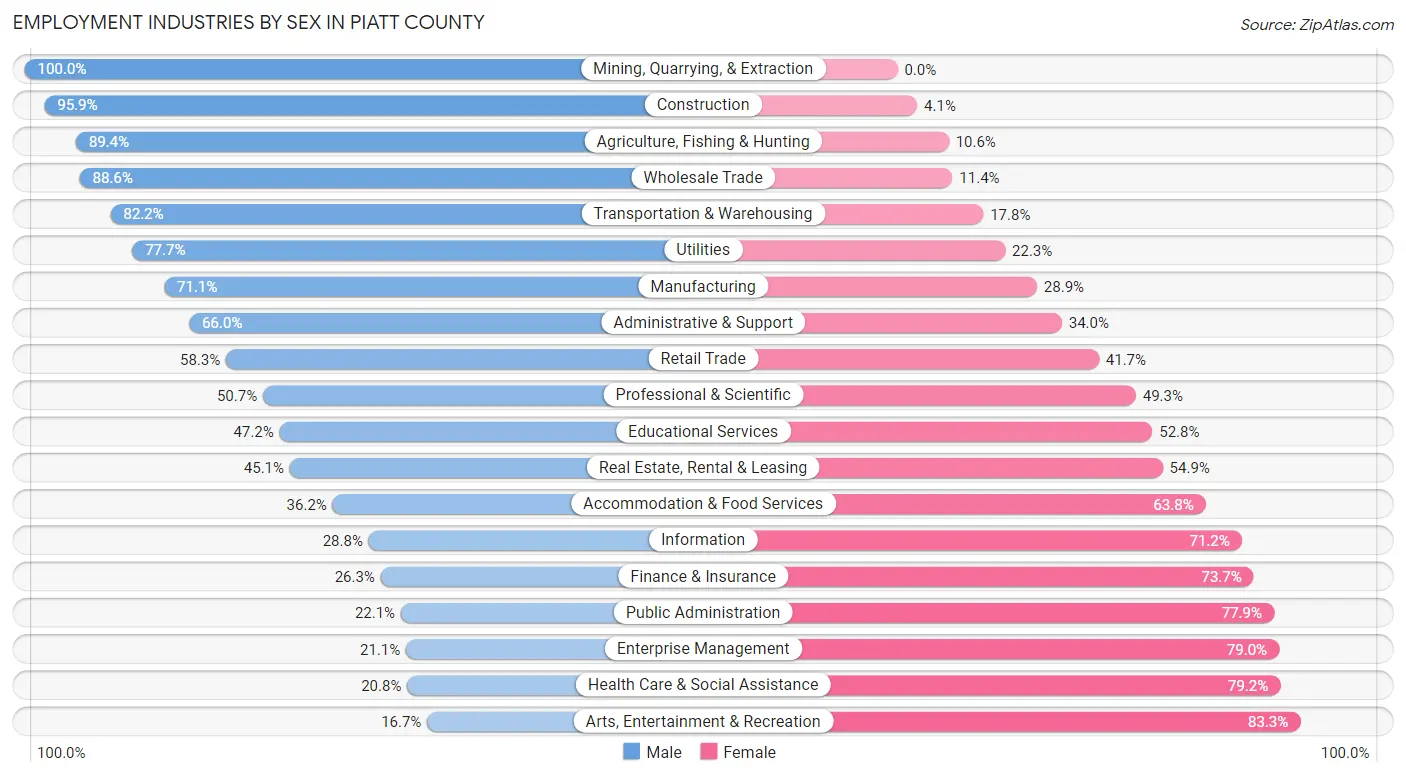
| Industry | Male | Female |
| Agriculture, Fishing & Hunting | 320 (89.4%) | 38 (10.6%) |
| Mining, Quarrying, & Extraction | 2 (100.0%) | 0 (0.0%) |
| Construction | 588 (95.9%) | 25 (4.1%) |
| Manufacturing | 621 (71.1%) | 252 (28.9%) |
| Wholesale Trade | 218 (88.6%) | 28 (11.4%) |
| Retail Trade | 505 (58.3%) | 361 (41.7%) |
| Transportation & Warehousing | 264 (82.2%) | 57 (17.8%) |
| Utilities | 129 (77.7%) | 37 (22.3%) |
| Information | 21 (28.8%) | 52 (71.2%) |
| Finance & Insurance | 138 (26.3%) | 387 (73.7%) |
| Real Estate, Rental & Leasing | 23 (45.1%) | 28 (54.9%) |
| Professional & Scientific | 193 (50.7%) | 188 (49.3%) |
| Enterprise Management | 4 (21.0%) | 15 (78.9%) |
| Administrative & Support | 157 (66.0%) | 81 (34.0%) |
| Educational Services | 590 (47.2%) | 659 (52.8%) |
| Health Care & Social Assistance | 295 (20.8%) | 1,123 (79.2%) |
| Arts, Entertainment & Recreation | 7 (16.7%) | 35 (83.3%) |
| Accommodation & Food Services | 108 (36.2%) | 190 (63.8%) |
| Public Administration | 59 (22.1%) | 208 (77.9%) |
| Total | 4,434 (53.7%) | 3,829 (46.3%) |
Education in Piatt County
School Enrollment in Piatt County
The most common levels of schooling among the 3,482 students in Piatt County are middle school (850 | 24.4%), elementary school (765 | 22.0%), and high school (729 | 20.9%).
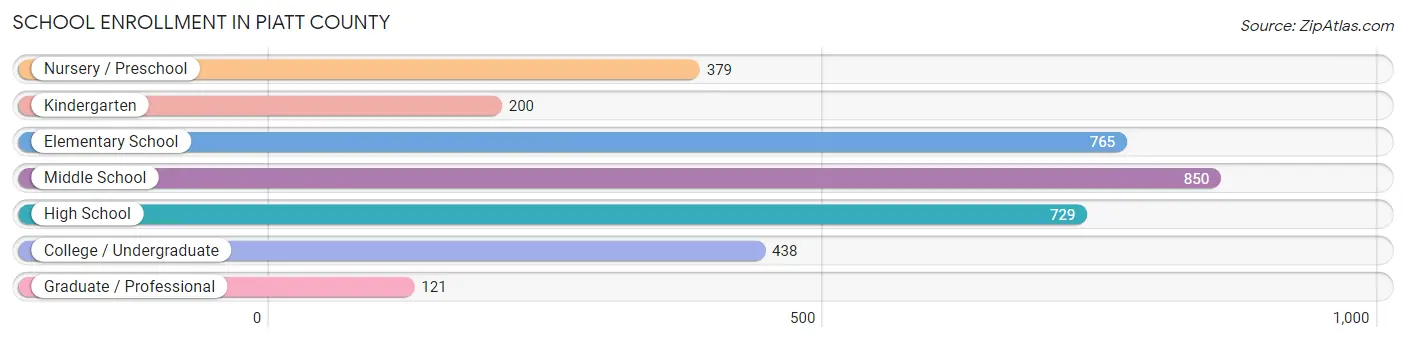
| School Level | # Students | % Students |
| Nursery / Preschool | 379 | 10.9% |
| Kindergarten | 200 | 5.7% |
| Elementary School | 765 | 22.0% |
| Middle School | 850 | 24.4% |
| High School | 729 | 20.9% |
| College / Undergraduate | 438 | 12.6% |
| Graduate / Professional | 121 | 3.5% |
| Total | 3,482 | 100.0% |
School Enrollment by Age by Funding Source in Piatt County
Out of a total of 3,482 students who are enrolled in schools in Piatt County, 400 (11.5%) attend a private institution, while the remaining 3,082 (88.5%) are enrolled in public schools. The age group of 3 to 4 year olds has the highest likelihood of being enrolled in private schools, with 67 (32.7% in the age bracket) enrolled. Conversely, the age group of 15 to 17 year olds has the lowest likelihood of being enrolled in a private school, with 649 (99.1% in the age bracket) attending a public institution.
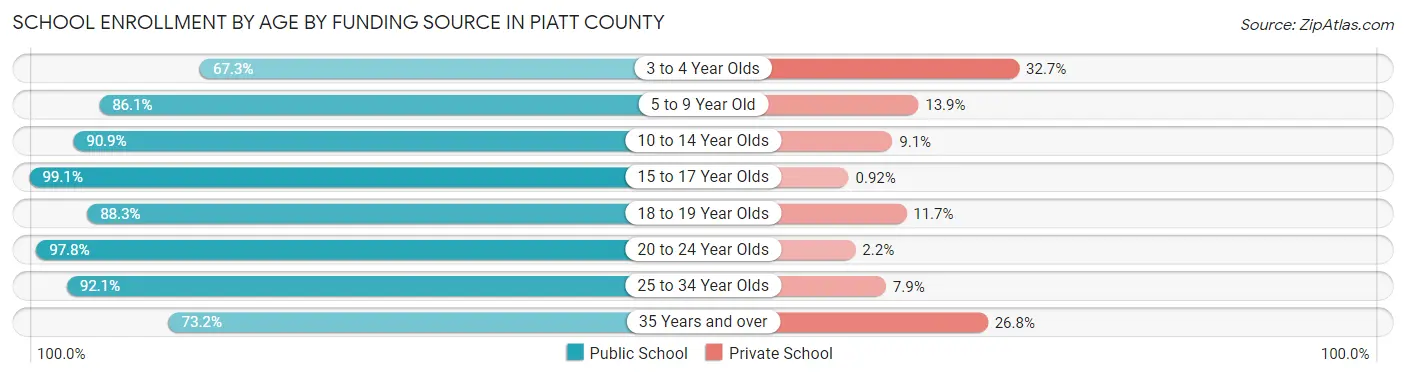
| Age Bracket | Public School | Private School |
| 3 to 4 Year Olds | 138 (67.3%) | 67 (32.7%) |
| 5 to 9 Year Old | 979 (86.1%) | 158 (13.9%) |
| 10 to 14 Year Olds | 812 (90.9%) | 81 (9.1%) |
| 15 to 17 Year Olds | 649 (99.1%) | 6 (0.9%) |
| 18 to 19 Year Olds | 106 (88.3%) | 14 (11.7%) |
| 20 to 24 Year Olds | 134 (97.8%) | 3 (2.2%) |
| 25 to 34 Year Olds | 82 (92.1%) | 7 (7.9%) |
| 35 Years and over | 180 (73.2%) | 66 (26.8%) |
| Total | 3,082 (88.5%) | 400 (11.5%) |
Educational Attainment by Field of Study in Piatt County
Education (782 | 20.1%), business (523 | 13.4%), bio, nature & agricultural (455 | 11.7%), science & technology (435 | 11.2%), and arts & humanities (274 | 7.0%) are the most common fields of study among 3,892 individuals in Piatt County who have obtained a bachelor's degree or higher.
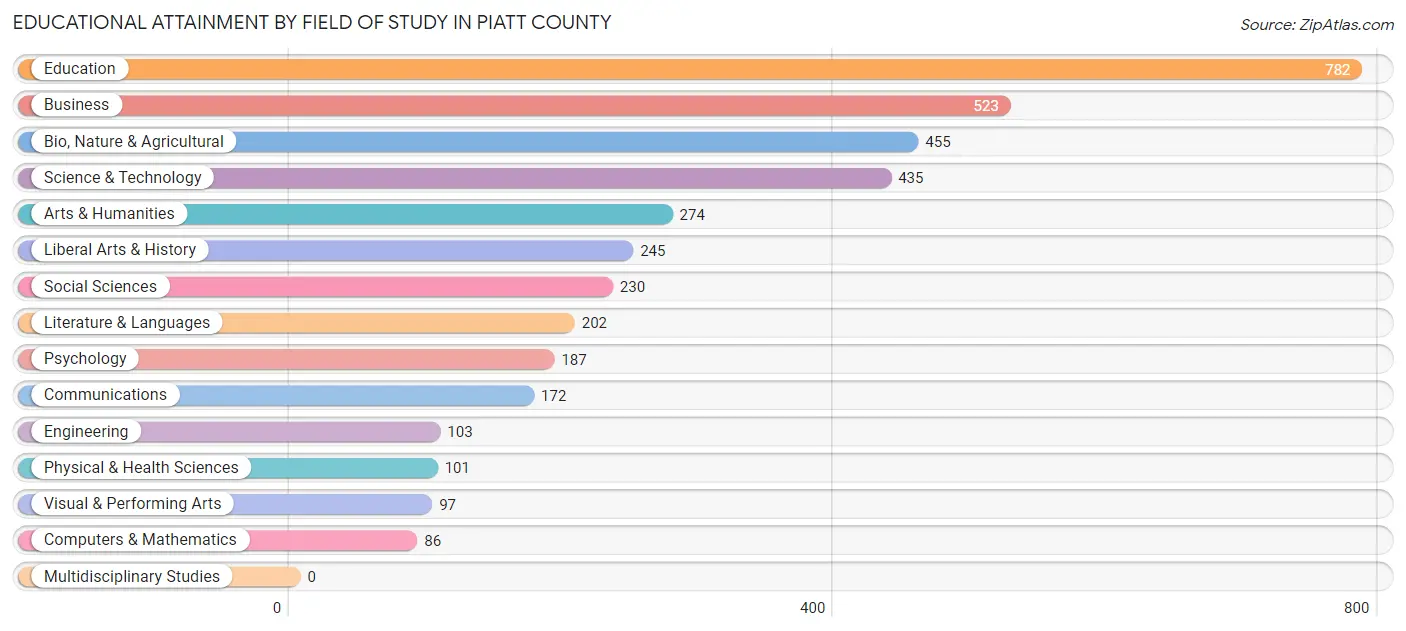
| Field of Study | # Graduates | % Graduates |
| Computers & Mathematics | 86 | 2.2% |
| Bio, Nature & Agricultural | 455 | 11.7% |
| Physical & Health Sciences | 101 | 2.6% |
| Psychology | 187 | 4.8% |
| Social Sciences | 230 | 5.9% |
| Engineering | 103 | 2.6% |
| Multidisciplinary Studies | 0 | 0.0% |
| Science & Technology | 435 | 11.2% |
| Business | 523 | 13.4% |
| Education | 782 | 20.1% |
| Literature & Languages | 202 | 5.2% |
| Liberal Arts & History | 245 | 6.3% |
| Visual & Performing Arts | 97 | 2.5% |
| Communications | 172 | 4.4% |
| Arts & Humanities | 274 | 7.0% |
| Total | 3,892 | 100.0% |
Transportation & Commute in Piatt County
Vehicle Availability by Sex in Piatt County
The most prevalent vehicle ownership categories in Piatt County are males with 2 vehicles (2,004, accounting for 45.4%) and females with 2 vehicles (1,606, making up 52.7%).
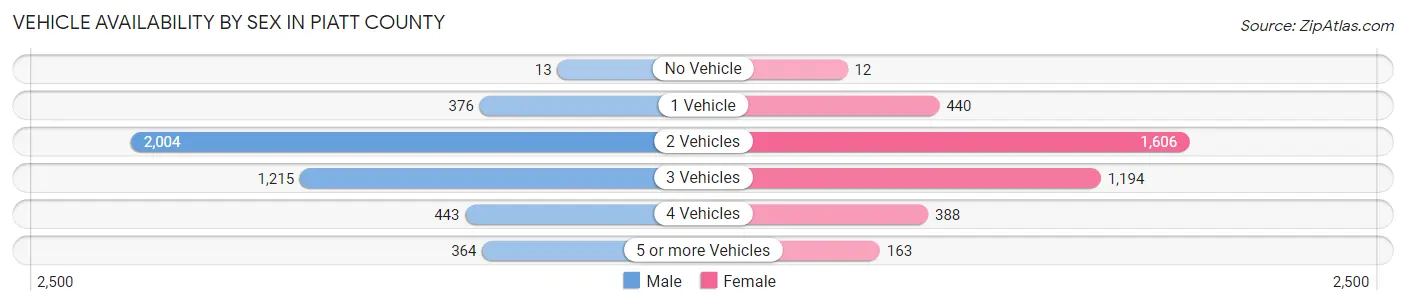
| Vehicles Available | Male | Female |
| No Vehicle | 13 (0.3%) | 12 (0.3%) |
| 1 Vehicle | 376 (8.5%) | 440 (11.6%) |
| 2 Vehicles | 2,004 (45.4%) | 1,606 (42.2%) |
| 3 Vehicles | 1,215 (27.5%) | 1,194 (31.4%) |
| 4 Vehicles | 443 (10.0%) | 388 (10.2%) |
| 5 or more Vehicles | 364 (8.2%) | 163 (4.3%) |
| Total | 4,415 (100.0%) | 3,803 (100.0%) |
Commute Time in Piatt County
The most frequently occuring commute durations in Piatt County are 30 to 34 minutes (1,589 commuters, 20.7%), 20 to 24 minutes (1,240 commuters, 16.2%), and 25 to 29 minutes (920 commuters, 12.0%).
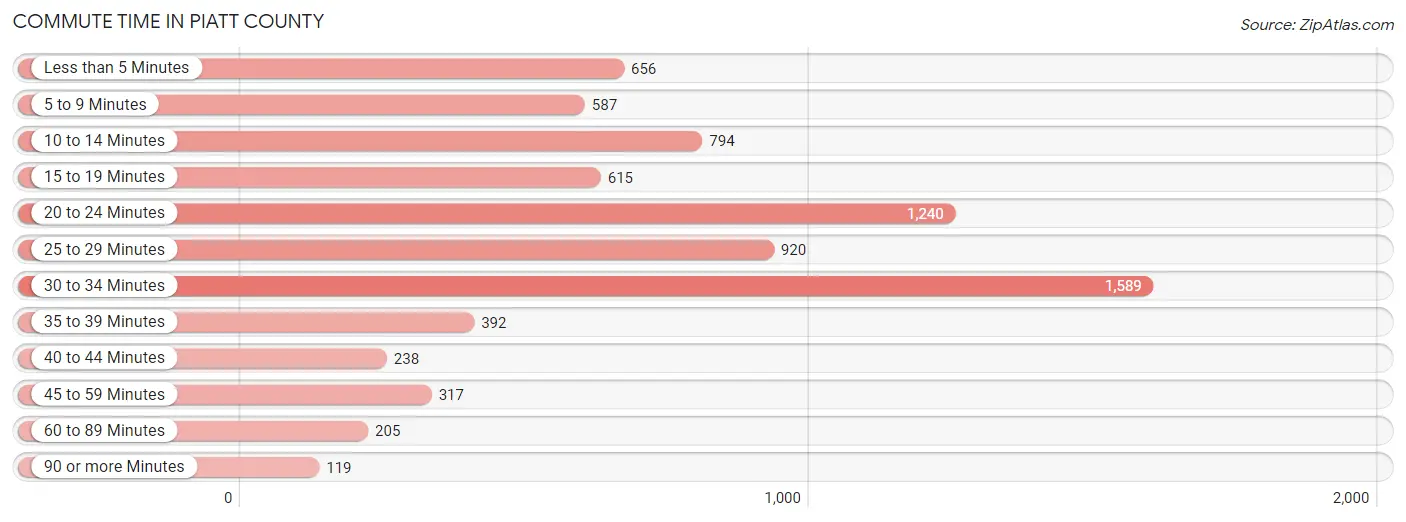
| Commute Time | # Commuters | % Commuters |
| Less than 5 Minutes | 656 | 8.6% |
| 5 to 9 Minutes | 587 | 7.6% |
| 10 to 14 Minutes | 794 | 10.3% |
| 15 to 19 Minutes | 615 | 8.0% |
| 20 to 24 Minutes | 1,240 | 16.2% |
| 25 to 29 Minutes | 920 | 12.0% |
| 30 to 34 Minutes | 1,589 | 20.7% |
| 35 to 39 Minutes | 392 | 5.1% |
| 40 to 44 Minutes | 238 | 3.1% |
| 45 to 59 Minutes | 317 | 4.1% |
| 60 to 89 Minutes | 205 | 2.7% |
| 90 or more Minutes | 119 | 1.5% |
Commute Time by Sex in Piatt County
The most common commute times in Piatt County are 30 to 34 minutes (977 commuters, 23.2%) for males and 30 to 34 minutes (612 commuters, 17.7%) for females.
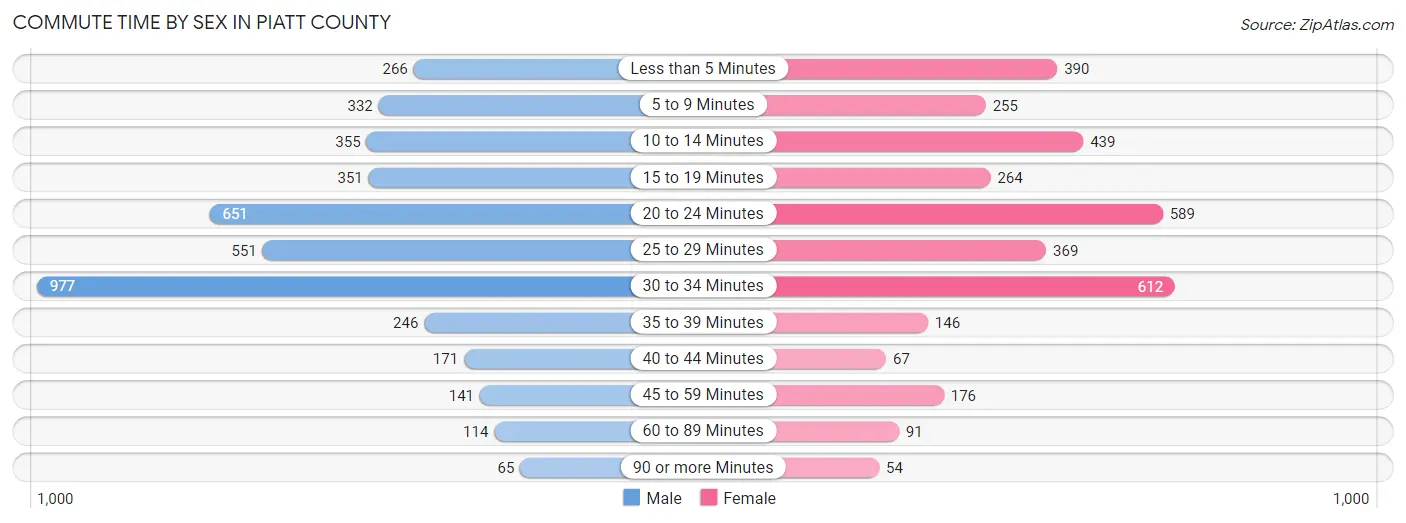
| Commute Time | Male | Female |
| Less than 5 Minutes | 266 (6.3%) | 390 (11.3%) |
| 5 to 9 Minutes | 332 (7.9%) | 255 (7.4%) |
| 10 to 14 Minutes | 355 (8.4%) | 439 (12.7%) |
| 15 to 19 Minutes | 351 (8.3%) | 264 (7.6%) |
| 20 to 24 Minutes | 651 (15.4%) | 589 (17.1%) |
| 25 to 29 Minutes | 551 (13.1%) | 369 (10.7%) |
| 30 to 34 Minutes | 977 (23.2%) | 612 (17.7%) |
| 35 to 39 Minutes | 246 (5.8%) | 146 (4.2%) |
| 40 to 44 Minutes | 171 (4.1%) | 67 (1.9%) |
| 45 to 59 Minutes | 141 (3.3%) | 176 (5.1%) |
| 60 to 89 Minutes | 114 (2.7%) | 91 (2.6%) |
| 90 or more Minutes | 65 (1.5%) | 54 (1.6%) |
Time of Departure to Work by Sex in Piatt County
The most frequent times of departure to work in Piatt County are 7:00 AM to 7:29 AM (1,003, 23.8%) for males and 7:00 AM to 7:29 AM (881, 25.5%) for females.
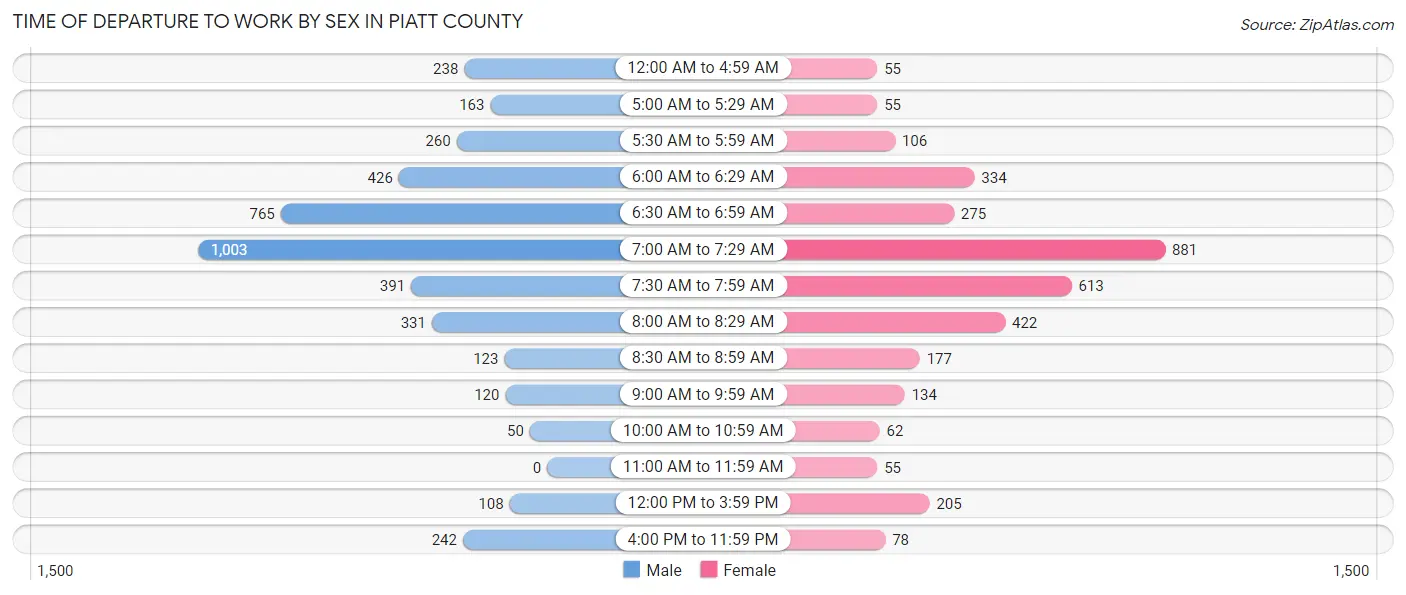
| Time of Departure | Male | Female |
| 12:00 AM to 4:59 AM | 238 (5.6%) | 55 (1.6%) |
| 5:00 AM to 5:29 AM | 163 (3.9%) | 55 (1.6%) |
| 5:30 AM to 5:59 AM | 260 (6.2%) | 106 (3.1%) |
| 6:00 AM to 6:29 AM | 426 (10.1%) | 334 (9.7%) |
| 6:30 AM to 6:59 AM | 765 (18.1%) | 275 (8.0%) |
| 7:00 AM to 7:29 AM | 1,003 (23.8%) | 881 (25.5%) |
| 7:30 AM to 7:59 AM | 391 (9.3%) | 613 (17.8%) |
| 8:00 AM to 8:29 AM | 331 (7.8%) | 422 (12.2%) |
| 8:30 AM to 8:59 AM | 123 (2.9%) | 177 (5.1%) |
| 9:00 AM to 9:59 AM | 120 (2.8%) | 134 (3.9%) |
| 10:00 AM to 10:59 AM | 50 (1.2%) | 62 (1.8%) |
| 11:00 AM to 11:59 AM | 0 (0.0%) | 55 (1.6%) |
| 12:00 PM to 3:59 PM | 108 (2.6%) | 205 (5.9%) |
| 4:00 PM to 11:59 PM | 242 (5.7%) | 78 (2.3%) |
| Total | 4,220 (100.0%) | 3,452 (100.0%) |
Housing Occupancy in Piatt County
Occupancy by Ownership in Piatt County
Of the total 6,783 dwellings in Piatt County, owner-occupied units account for 5,651 (83.3%), while renter-occupied units make up 1,132 (16.7%).
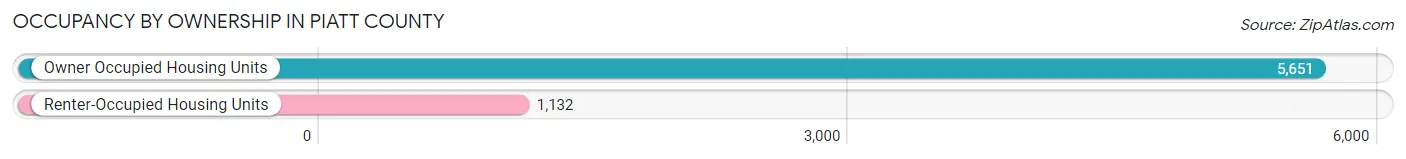
| Occupancy | # Housing Units | % Housing Units |
| Owner Occupied Housing Units | 5,651 | 83.3% |
| Renter-Occupied Housing Units | 1,132 | 16.7% |
| Total Occupied Housing Units | 6,783 | 100.0% |
Occupancy by Household Size in Piatt County
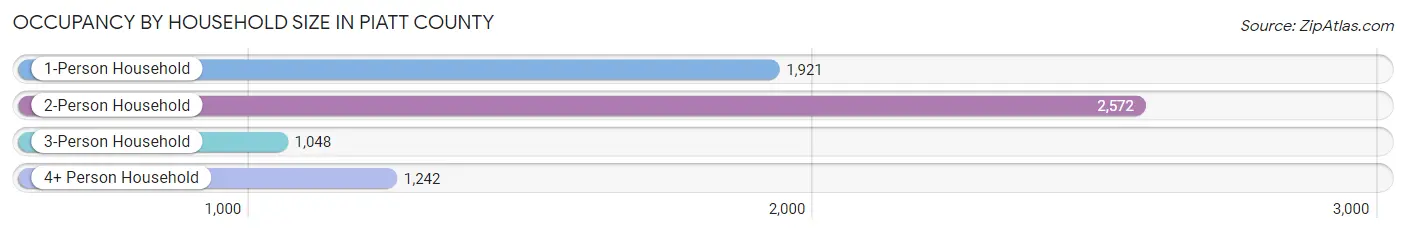
| Household Size | # Housing Units | % Housing Units |
| 1-Person Household | 1,921 | 28.3% |
| 2-Person Household | 2,572 | 37.9% |
| 3-Person Household | 1,048 | 15.4% |
| 4+ Person Household | 1,242 | 18.3% |
| Total Housing Units | 6,783 | 100.0% |
Occupancy by Ownership by Household Size in Piatt County
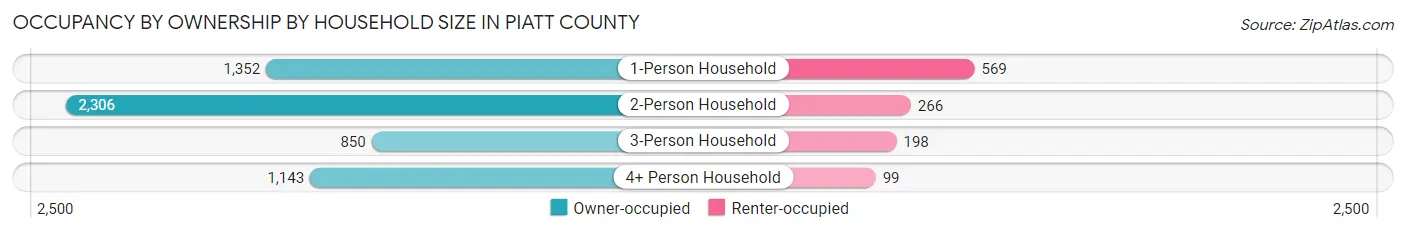
| Household Size | Owner-occupied | Renter-occupied |
| 1-Person Household | 1,352 (70.4%) | 569 (29.6%) |
| 2-Person Household | 2,306 (89.7%) | 266 (10.3%) |
| 3-Person Household | 850 (81.1%) | 198 (18.9%) |
| 4+ Person Household | 1,143 (92.0%) | 99 (8.0%) |
| Total Housing Units | 5,651 (83.3%) | 1,132 (16.7%) |
Occupancy by Educational Attainment in Piatt County
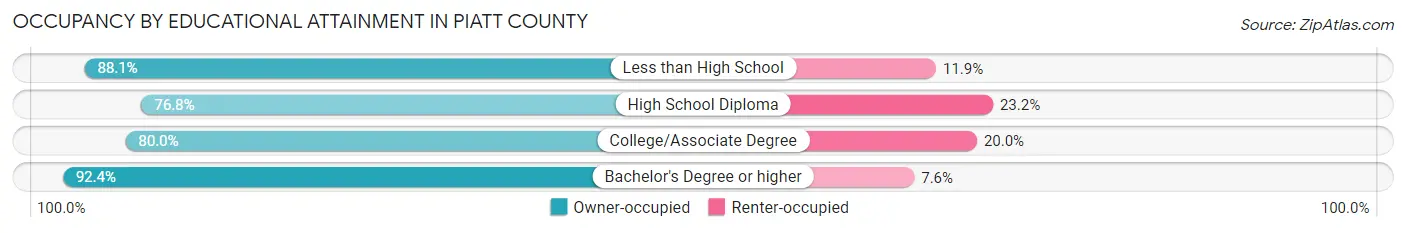
| Household Size | Owner-occupied | Renter-occupied |
| Less than High School | 245 (88.1%) | 33 (11.9%) |
| High School Diploma | 1,622 (76.8%) | 489 (23.2%) |
| College/Associate Degree | 1,790 (80.0%) | 447 (20.0%) |
| Bachelor's Degree or higher | 1,994 (92.4%) | 163 (7.6%) |
Occupancy by Age of Householder in Piatt County
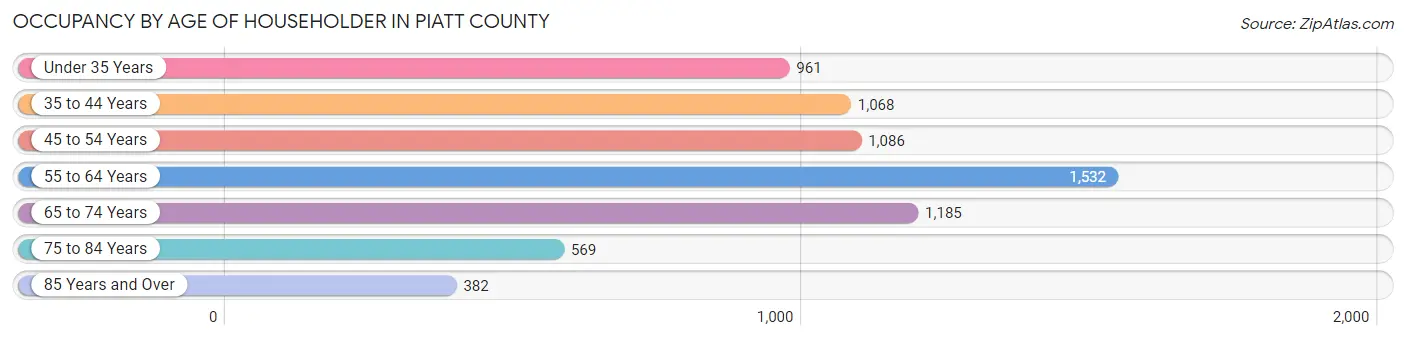
| Age Bracket | # Households | % Households |
| Under 35 Years | 961 | 14.2% |
| 35 to 44 Years | 1,068 | 15.8% |
| 45 to 54 Years | 1,086 | 16.0% |
| 55 to 64 Years | 1,532 | 22.6% |
| 65 to 74 Years | 1,185 | 17.5% |
| 75 to 84 Years | 569 | 8.4% |
| 85 Years and Over | 382 | 5.6% |
| Total | 6,783 | 100.0% |
Housing Finances in Piatt County
Median Income by Occupancy in Piatt County
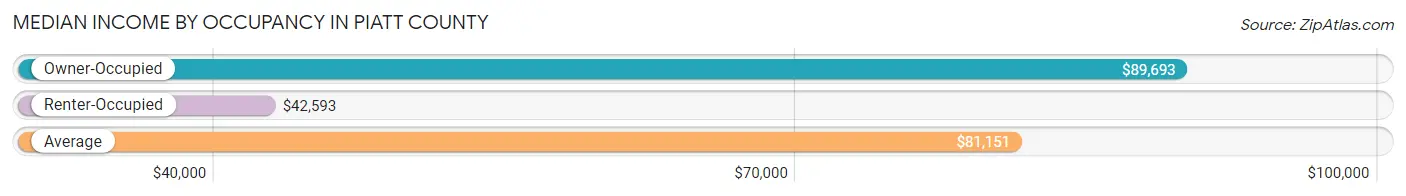
| Occupancy Type | # Households | Median Income |
| Owner-Occupied | 5,651 (83.3%) | $89,693 |
| Renter-Occupied | 1,132 (16.7%) | $42,593 |
| Average | 6,783 (100.0%) | $81,151 |
Occupancy by Householder Income Bracket in Piatt County
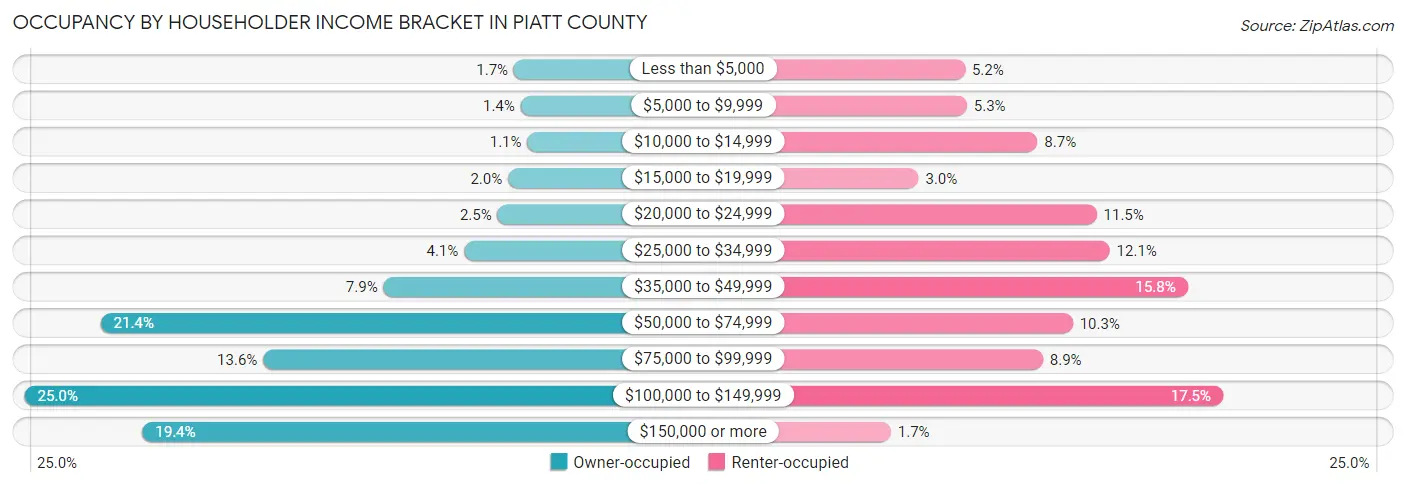
| Income Bracket | Owner-occupied | Renter-occupied |
| Less than $5,000 | 96 (1.7%) | 59 (5.2%) |
| $5,000 to $9,999 | 78 (1.4%) | 60 (5.3%) |
| $10,000 to $14,999 | 60 (1.1%) | 98 (8.7%) |
| $15,000 to $19,999 | 112 (2.0%) | 34 (3.0%) |
| $20,000 to $24,999 | 140 (2.5%) | 130 (11.5%) |
| $25,000 to $34,999 | 230 (4.1%) | 137 (12.1%) |
| $35,000 to $49,999 | 447 (7.9%) | 179 (15.8%) |
| $50,000 to $74,999 | 1,208 (21.4%) | 117 (10.3%) |
| $75,000 to $99,999 | 771 (13.6%) | 101 (8.9%) |
| $100,000 to $149,999 | 1,413 (25.0%) | 198 (17.5%) |
| $150,000 or more | 1,096 (19.4%) | 19 (1.7%) |
| Total | 5,651 (100.0%) | 1,132 (100.0%) |
Monthly Housing Cost Tiers in Piatt County
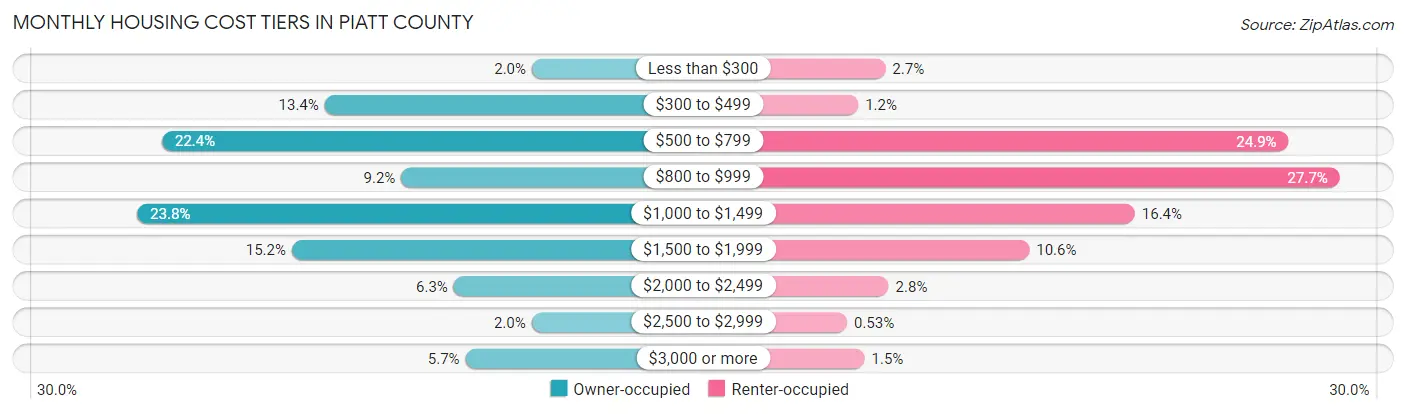
| Monthly Cost | Owner-occupied | Renter-occupied |
| Less than $300 | 112 (2.0%) | 30 (2.6%) |
| $300 to $499 | 759 (13.4%) | 13 (1.1%) |
| $500 to $799 | 1,267 (22.4%) | 282 (24.9%) |
| $800 to $999 | 520 (9.2%) | 314 (27.7%) |
| $1,000 to $1,499 | 1,344 (23.8%) | 186 (16.4%) |
| $1,500 to $1,999 | 861 (15.2%) | 120 (10.6%) |
| $2,000 to $2,499 | 356 (6.3%) | 32 (2.8%) |
| $2,500 to $2,999 | 113 (2.0%) | 6 (0.5%) |
| $3,000 or more | 319 (5.7%) | 17 (1.5%) |
| Total | 5,651 (100.0%) | 1,132 (100.0%) |
Physical Housing Characteristics in Piatt County
Housing Structures in Piatt County
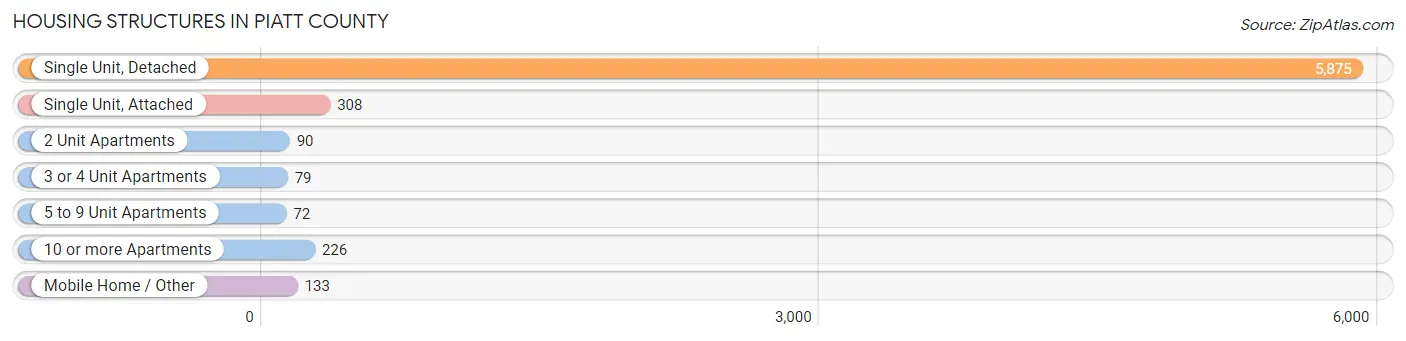
| Structure Type | # Housing Units | % Housing Units |
| Single Unit, Detached | 5,875 | 86.6% |
| Single Unit, Attached | 308 | 4.5% |
| 2 Unit Apartments | 90 | 1.3% |
| 3 or 4 Unit Apartments | 79 | 1.2% |
| 5 to 9 Unit Apartments | 72 | 1.1% |
| 10 or more Apartments | 226 | 3.3% |
| Mobile Home / Other | 133 | 2.0% |
| Total | 6,783 | 100.0% |
Housing Structures by Occupancy in Piatt County
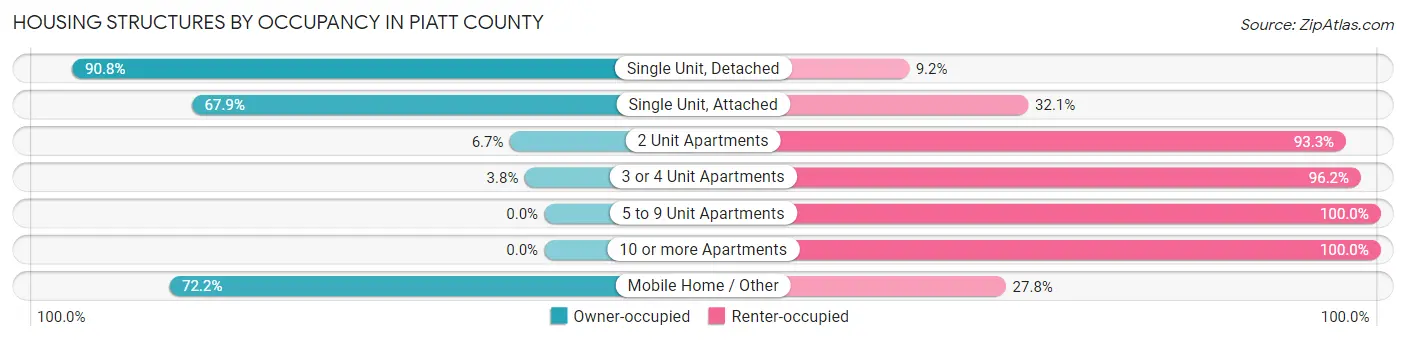
| Structure Type | Owner-occupied | Renter-occupied |
| Single Unit, Detached | 5,337 (90.8%) | 538 (9.2%) |
| Single Unit, Attached | 209 (67.9%) | 99 (32.1%) |
| 2 Unit Apartments | 6 (6.7%) | 84 (93.3%) |
| 3 or 4 Unit Apartments | 3 (3.8%) | 76 (96.2%) |
| 5 to 9 Unit Apartments | 0 (0.0%) | 72 (100.0%) |
| 10 or more Apartments | 0 (0.0%) | 226 (100.0%) |
| Mobile Home / Other | 96 (72.2%) | 37 (27.8%) |
| Total | 5,651 (83.3%) | 1,132 (16.7%) |
Housing Structures by Number of Rooms in Piatt County
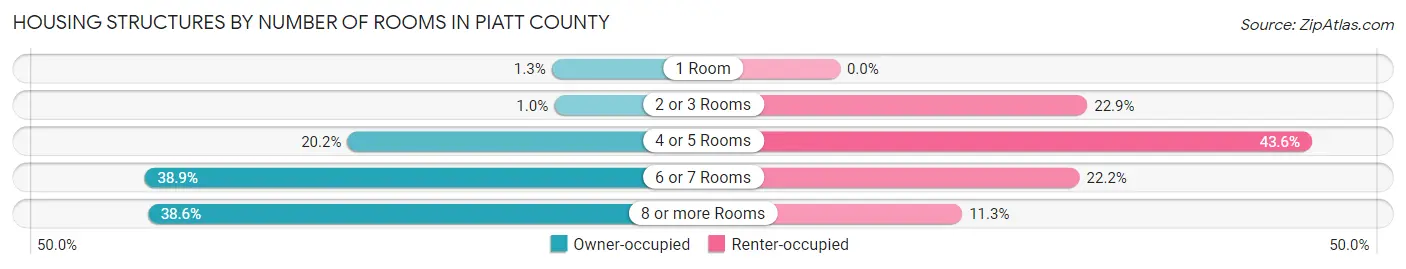
| Number of Rooms | Owner-occupied | Renter-occupied |
| 1 Room | 72 (1.3%) | 0 (0.0%) |
| 2 or 3 Rooms | 59 (1.0%) | 259 (22.9%) |
| 4 or 5 Rooms | 1,139 (20.2%) | 494 (43.6%) |
| 6 or 7 Rooms | 2,199 (38.9%) | 251 (22.2%) |
| 8 or more Rooms | 2,182 (38.6%) | 128 (11.3%) |
| Total | 5,651 (100.0%) | 1,132 (100.0%) |
Housing Structure by Heating Type in Piatt County
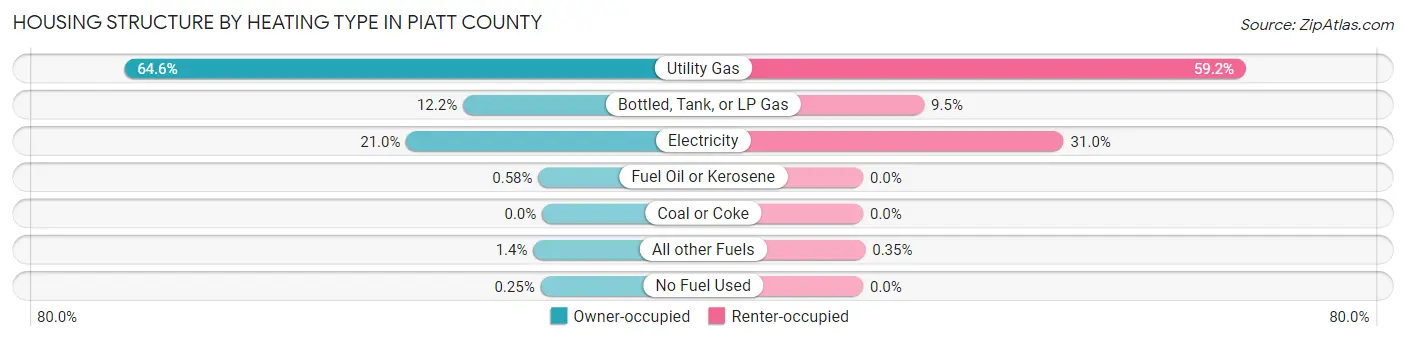
| Heating Type | Owner-occupied | Renter-occupied |
| Utility Gas | 3,650 (64.6%) | 670 (59.2%) |
| Bottled, Tank, or LP Gas | 691 (12.2%) | 107 (9.5%) |
| Electricity | 1,186 (21.0%) | 351 (31.0%) |
| Fuel Oil or Kerosene | 33 (0.6%) | 0 (0.0%) |
| Coal or Coke | 0 (0.0%) | 0 (0.0%) |
| All other Fuels | 77 (1.4%) | 4 (0.4%) |
| No Fuel Used | 14 (0.3%) | 0 (0.0%) |
| Total | 5,651 (100.0%) | 1,132 (100.0%) |
Household Vehicle Usage in Piatt County
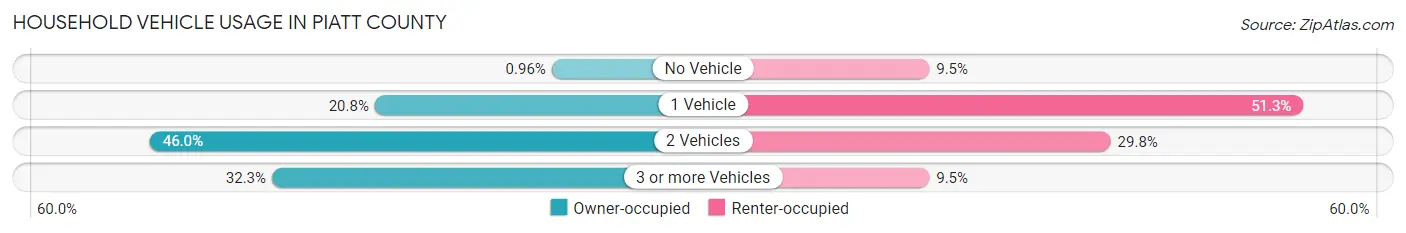
| Vehicles per Household | Owner-occupied | Renter-occupied |
| No Vehicle | 54 (1.0%) | 107 (9.5%) |
| 1 Vehicle | 1,174 (20.8%) | 581 (51.3%) |
| 2 Vehicles | 2,598 (46.0%) | 337 (29.8%) |
| 3 or more Vehicles | 1,825 (32.3%) | 107 (9.5%) |
| Total | 5,651 (100.0%) | 1,132 (100.0%) |
Real Estate & Mortgages in Piatt County
Real Estate and Mortgage Overview in Piatt County
| Characteristic | Without Mortgage | With Mortgage |
| Housing Units | 2,330 | 3,321 |
| Median Property Value | $142,200 | $180,300 |
| Median Household Income | $63,750 | $663 |
| Monthly Housing Costs | $561 | $309 |
| Real Estate Taxes | $2,470 | $16 |
Property Value by Mortgage Status in Piatt County
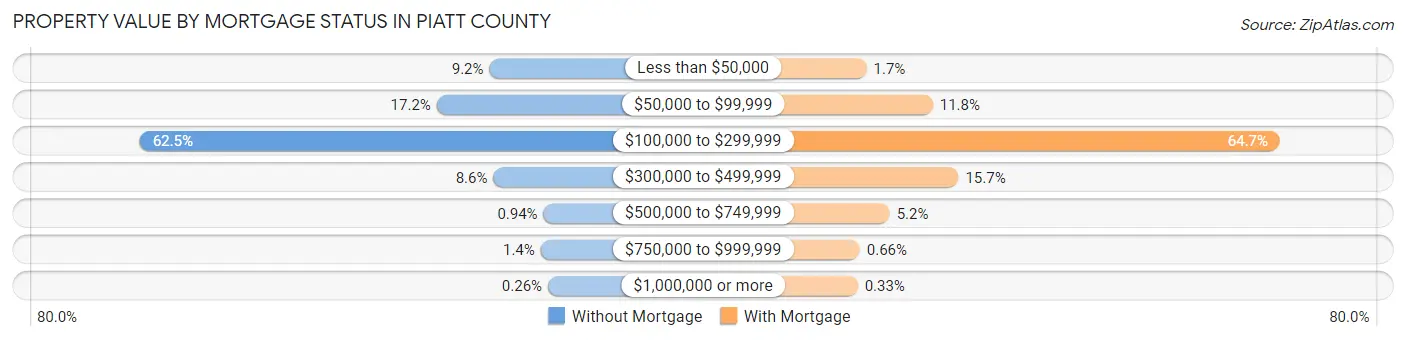
| Property Value | Without Mortgage | With Mortgage |
| Less than $50,000 | 214 (9.2%) | 56 (1.7%) |
| $50,000 to $99,999 | 401 (17.2%) | 391 (11.8%) |
| $100,000 to $299,999 | 1,455 (62.5%) | 2,147 (64.6%) |
| $300,000 to $499,999 | 200 (8.6%) | 521 (15.7%) |
| $500,000 to $749,999 | 22 (0.9%) | 173 (5.2%) |
| $750,000 to $999,999 | 32 (1.4%) | 22 (0.7%) |
| $1,000,000 or more | 6 (0.3%) | 11 (0.3%) |
| Total | 2,330 (100.0%) | 3,321 (100.0%) |
Household Income by Mortgage Status in Piatt County
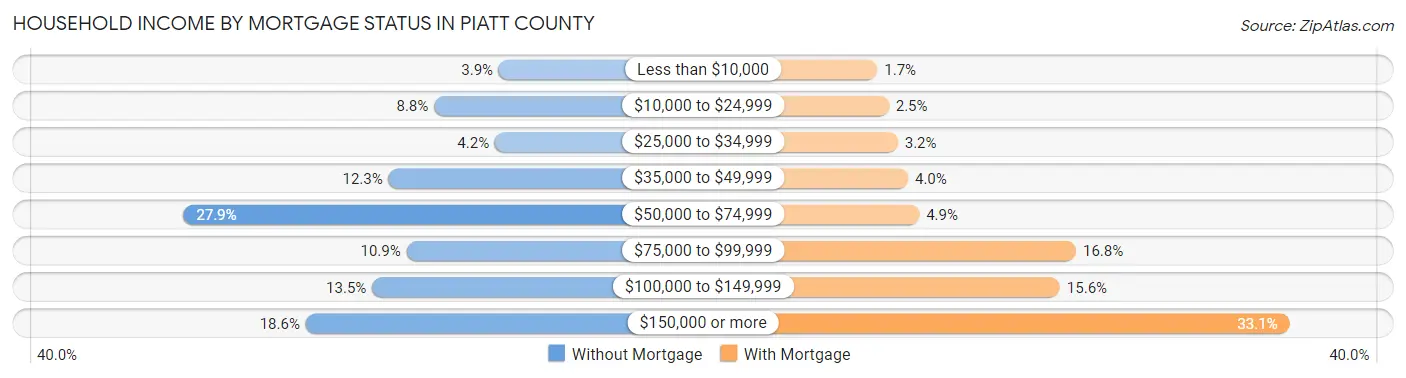
| Household Income | Without Mortgage | With Mortgage |
| Less than $10,000 | 90 (3.9%) | 55 (1.7%) |
| $10,000 to $24,999 | 205 (8.8%) | 84 (2.5%) |
| $25,000 to $34,999 | 97 (4.2%) | 107 (3.2%) |
| $35,000 to $49,999 | 286 (12.3%) | 133 (4.0%) |
| $50,000 to $74,999 | 650 (27.9%) | 161 (4.9%) |
| $75,000 to $99,999 | 254 (10.9%) | 558 (16.8%) |
| $100,000 to $149,999 | 315 (13.5%) | 517 (15.6%) |
| $150,000 or more | 433 (18.6%) | 1,098 (33.1%) |
| Total | 2,330 (100.0%) | 3,321 (100.0%) |
Property Value to Household Income Ratio in Piatt County
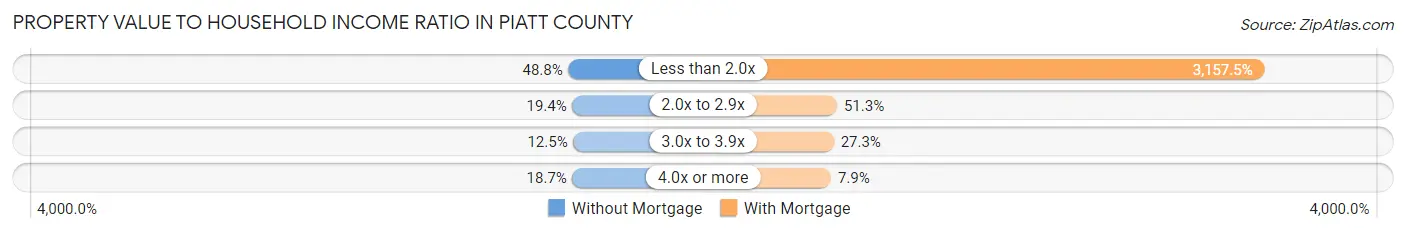
| Value-to-Income Ratio | Without Mortgage | With Mortgage |
| Less than 2.0x | 1,137 (48.8%) | 104,861 (3,157.5%) |
| 2.0x to 2.9x | 452 (19.4%) | 1,702 (51.2%) |
| 3.0x to 3.9x | 291 (12.5%) | 908 (27.3%) |
| 4.0x or more | 435 (18.7%) | 262 (7.9%) |
| Total | 2,330 (100.0%) | 3,321 (100.0%) |
Real Estate Taxes by Mortgage Status in Piatt County
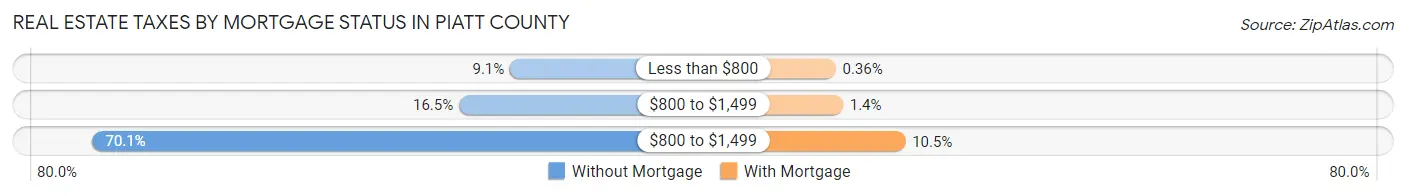
| Property Taxes | Without Mortgage | With Mortgage |
| Less than $800 | 211 (9.1%) | 12 (0.4%) |
| $800 to $1,499 | 385 (16.5%) | 47 (1.4%) |
| $800 to $1,499 | 1,633 (70.1%) | 350 (10.5%) |
| Total | 2,330 (100.0%) | 3,321 (100.0%) |
Health & Disability in Piatt County
Health Insurance Coverage by Age in Piatt County
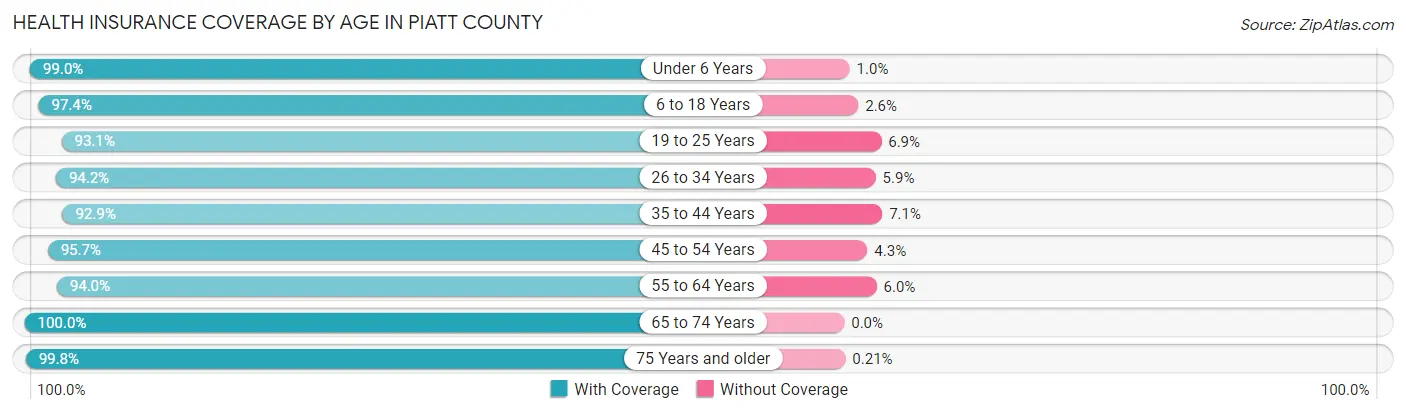
| Age Bracket | With Coverage | Without Coverage |
| Under 6 Years | 1,194 (99.0%) | 12 (1.0%) |
| 6 to 18 Years | 2,540 (97.4%) | 68 (2.6%) |
| 19 to 25 Years | 1,093 (93.1%) | 81 (6.9%) |
| 26 to 34 Years | 1,608 (94.2%) | 100 (5.9%) |
| 35 to 44 Years | 1,944 (92.9%) | 148 (7.1%) |
| 45 to 54 Years | 1,908 (95.7%) | 86 (4.3%) |
| 55 to 64 Years | 2,359 (94.0%) | 151 (6.0%) |
| 65 to 74 Years | 1,934 (100.0%) | 0 (0.0%) |
| 75 Years and older | 1,397 (99.8%) | 3 (0.2%) |
| Total | 15,977 (96.1%) | 649 (3.9%) |
Health Insurance Coverage by Citizenship Status in Piatt County
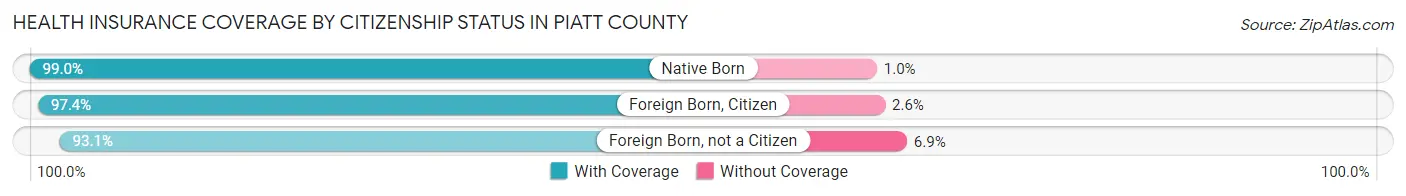
| Citizenship Status | With Coverage | Without Coverage |
| Native Born | 1,194 (99.0%) | 12 (1.0%) |
| Foreign Born, Citizen | 2,540 (97.4%) | 68 (2.6%) |
| Foreign Born, not a Citizen | 1,093 (93.1%) | 81 (6.9%) |
Health Insurance Coverage by Household Income in Piatt County
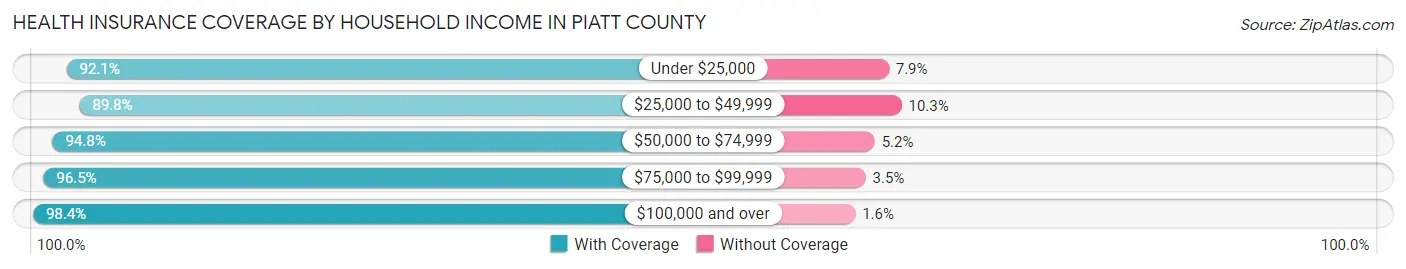
| Household Income | With Coverage | Without Coverage |
| Under $25,000 | 1,230 (92.1%) | 105 (7.9%) |
| $25,000 to $49,999 | 1,524 (89.7%) | 174 (10.2%) |
| $50,000 to $74,999 | 2,862 (94.8%) | 158 (5.2%) |
| $75,000 to $99,999 | 2,293 (96.5%) | 84 (3.5%) |
| $100,000 and over | 8,017 (98.4%) | 128 (1.6%) |
Public vs Private Health Insurance Coverage by Age in Piatt County
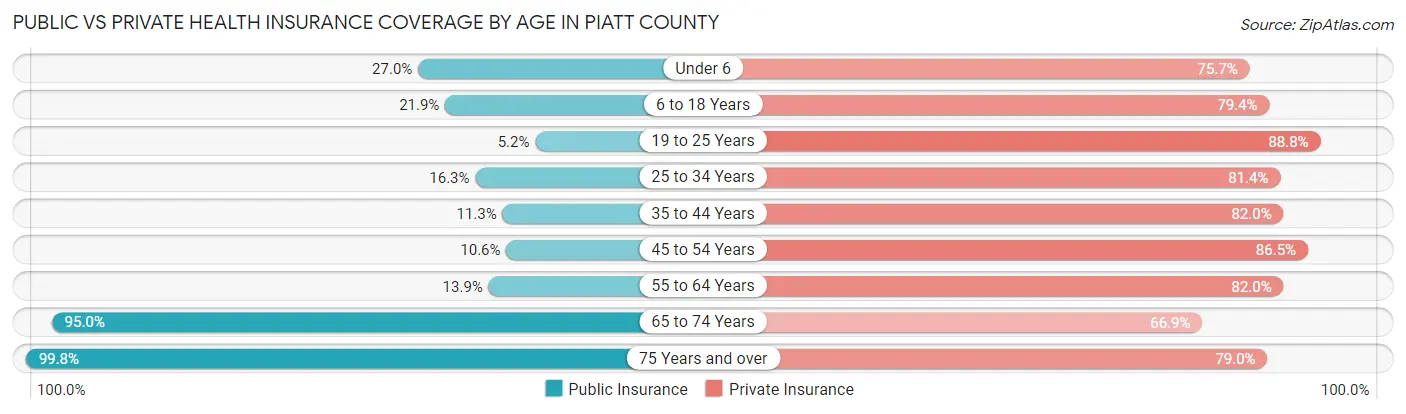
| Age Bracket | Public Insurance | Private Insurance |
| Under 6 | 325 (27.0%) | 913 (75.7%) |
| 6 to 18 Years | 572 (21.9%) | 2,070 (79.4%) |
| 19 to 25 Years | 61 (5.2%) | 1,043 (88.8%) |
| 25 to 34 Years | 279 (16.3%) | 1,390 (81.4%) |
| 35 to 44 Years | 236 (11.3%) | 1,715 (82.0%) |
| 45 to 54 Years | 211 (10.6%) | 1,725 (86.5%) |
| 55 to 64 Years | 348 (13.9%) | 2,058 (82.0%) |
| 65 to 74 Years | 1,837 (95.0%) | 1,294 (66.9%) |
| 75 Years and over | 1,397 (99.8%) | 1,106 (79.0%) |
| Total | 5,266 (31.7%) | 13,314 (80.1%) |
Disability Status by Sex by Age in Piatt County
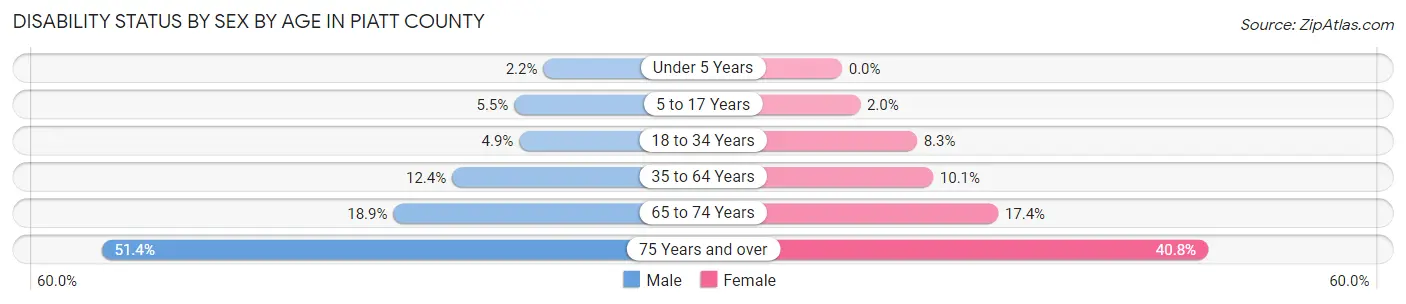
| Age Bracket | Male | Female |
| Under 5 Years | 10 (2.2%) | 0 (0.0%) |
| 5 to 17 Years | 74 (5.5%) | 28 (2.0%) |
| 18 to 34 Years | 77 (4.9%) | 122 (8.3%) |
| 35 to 64 Years | 408 (12.4%) | 335 (10.1%) |
| 65 to 74 Years | 179 (18.9%) | 172 (17.4%) |
| 75 Years and over | 305 (51.4%) | 329 (40.8%) |
Disability Class by Sex by Age in Piatt County
Disability Class: Hearing Difficulty
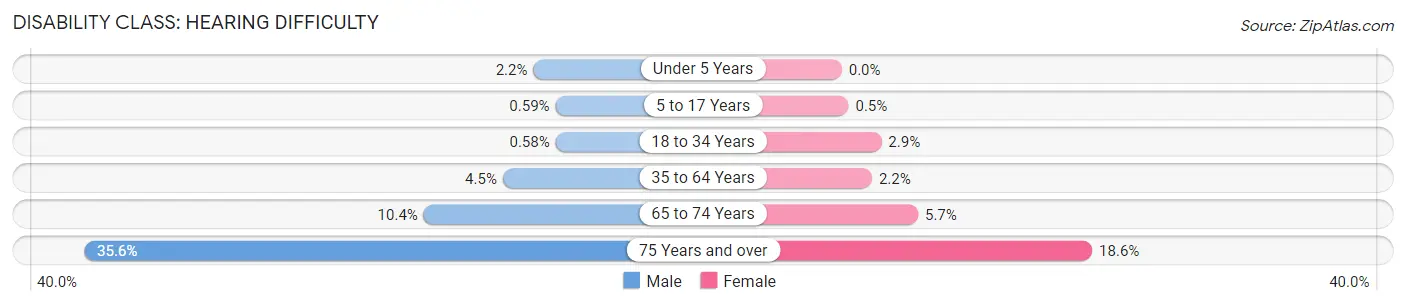
| Age Bracket | Male | Female |
| Under 5 Years | 10 (2.2%) | 0 (0.0%) |
| 5 to 17 Years | 8 (0.6%) | 7 (0.5%) |
| 18 to 34 Years | 9 (0.6%) | 43 (2.9%) |
| 35 to 64 Years | 148 (4.5%) | 74 (2.2%) |
| 65 to 74 Years | 98 (10.4%) | 56 (5.7%) |
| 75 Years and over | 211 (35.6%) | 150 (18.6%) |
Disability Class: Vision Difficulty
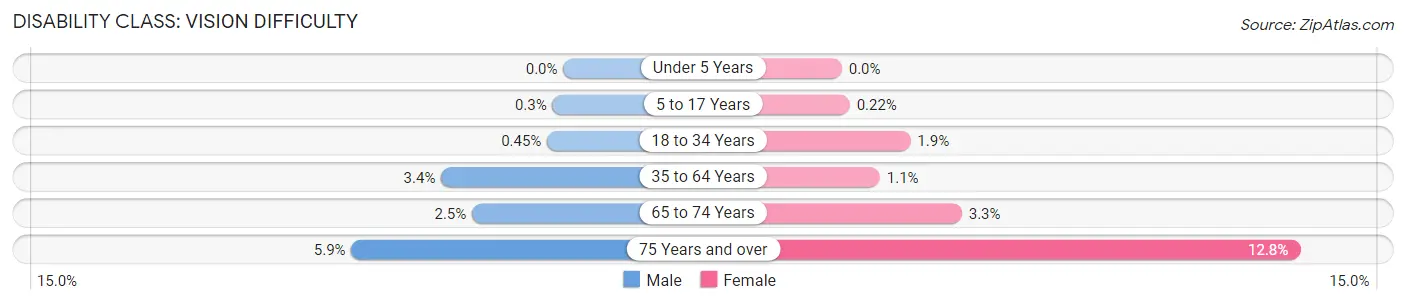
| Age Bracket | Male | Female |
| Under 5 Years | 0 (0.0%) | 0 (0.0%) |
| 5 to 17 Years | 4 (0.3%) | 3 (0.2%) |
| 18 to 34 Years | 7 (0.4%) | 28 (1.9%) |
| 35 to 64 Years | 112 (3.4%) | 35 (1.1%) |
| 65 to 74 Years | 24 (2.5%) | 33 (3.3%) |
| 75 Years and over | 35 (5.9%) | 103 (12.8%) |
Disability Class: Cognitive Difficulty
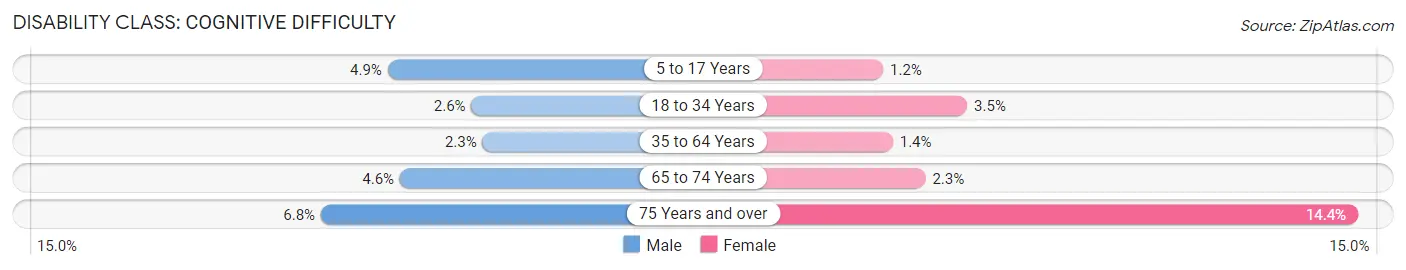
| Age Bracket | Male | Female |
| 5 to 17 Years | 66 (4.9%) | 16 (1.1%) |
| 18 to 34 Years | 40 (2.6%) | 51 (3.5%) |
| 35 to 64 Years | 74 (2.2%) | 47 (1.4%) |
| 65 to 74 Years | 43 (4.5%) | 23 (2.3%) |
| 75 Years and over | 40 (6.8%) | 116 (14.4%) |
Disability Class: Ambulatory Difficulty
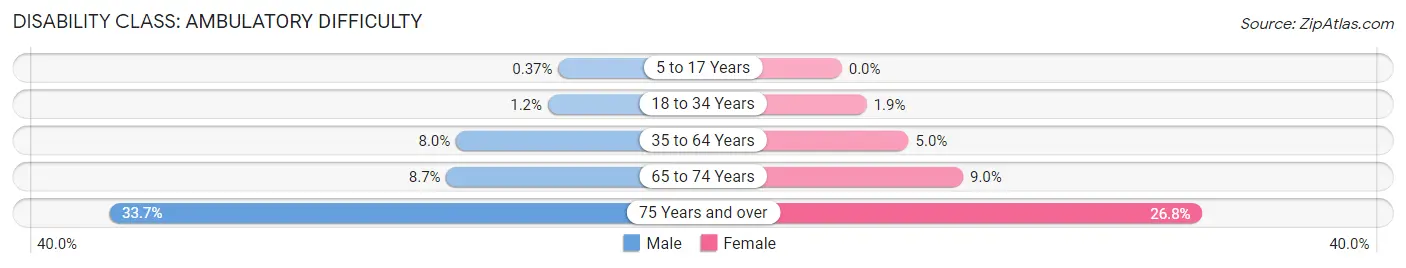
| Age Bracket | Male | Female |
| 5 to 17 Years | 5 (0.4%) | 0 (0.0%) |
| 18 to 34 Years | 18 (1.1%) | 27 (1.8%) |
| 35 to 64 Years | 262 (8.0%) | 164 (5.0%) |
| 65 to 74 Years | 82 (8.7%) | 89 (9.0%) |
| 75 Years and over | 200 (33.7%) | 216 (26.8%) |
Disability Class: Self-Care Difficulty
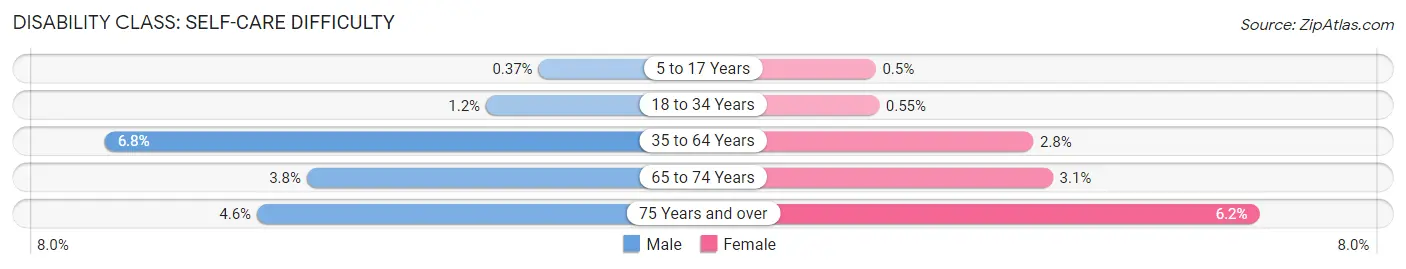
| Age Bracket | Male | Female |
| 5 to 17 Years | 5 (0.4%) | 7 (0.5%) |
| 18 to 34 Years | 18 (1.1%) | 8 (0.5%) |
| 35 to 64 Years | 224 (6.8%) | 94 (2.8%) |
| 65 to 74 Years | 36 (3.8%) | 31 (3.1%) |
| 75 Years and over | 27 (4.5%) | 50 (6.2%) |
Technology Access in Piatt County
Computing Device Access in Piatt County
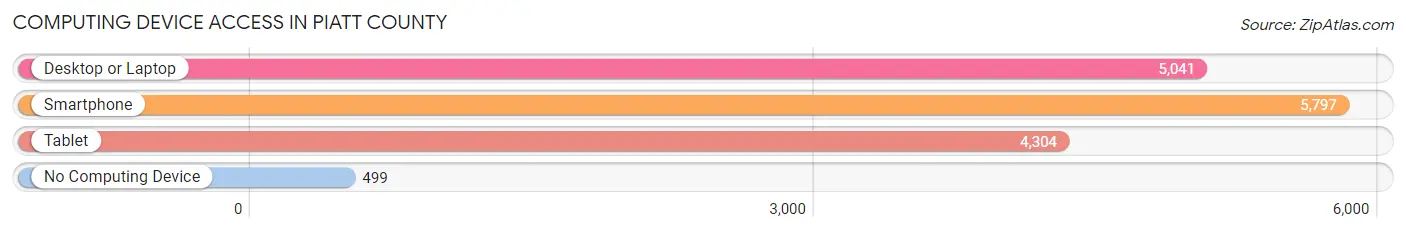
| Device Type | # Households | % Households |
| Desktop or Laptop | 5,041 | 74.3% |
| Smartphone | 5,797 | 85.5% |
| Tablet | 4,304 | 63.4% |
| No Computing Device | 499 | 7.4% |
| Total | 6,783 | 100.0% |
Internet Access in Piatt County
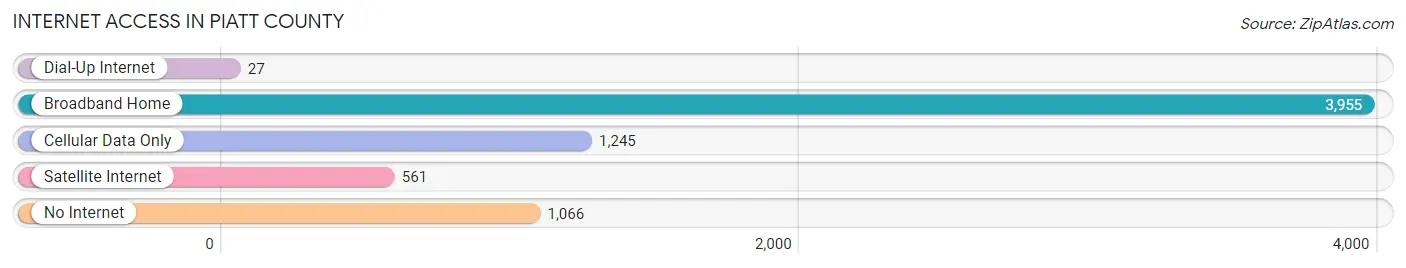
| Internet Type | # Households | % Households |
| Dial-Up Internet | 27 | 0.4% |
| Broadband Home | 3,955 | 58.3% |
| Cellular Data Only | 1,245 | 18.3% |
| Satellite Internet | 561 | 8.3% |
| No Internet | 1,066 | 15.7% |
| Total | 6,783 | 100.0% |
Piatt County Summary
Piatt County is located in the central part of the state of Illinois, in the United States. It is bordered by Champaign, DeWitt, Macon, Moultrie, and Shelby counties. The county seat is Monticello. As of the 2010 census, the population was 16,869.
History
Piatt County was formed in 1841 from parts of Macon and Champaign counties. It was named for John Piatt, a prominent early settler and state legislator. The county was largely agricultural in its early years, with corn, wheat, and oats being the main crops. The county also had a number of small towns, including Monticello, Bement, Cerro Gordo, and White Heath.
In the late 19th century, the county began to industrialize, with the construction of a number of factories. The most notable of these was the Monticello Car Works, which produced railroad cars from 1887 to 1902. The county also had a number of coal mines, which provided employment for many of the county's residents.
Geography
Piatt County is located in the central part of the state of Illinois. It is bordered by Champaign, DeWitt, Macon, Moultrie, and Shelby counties. The county has a total area of 441 square miles, of which 437 square miles is land and 4.2 square miles is water. The county is mostly flat, with some rolling hills in the northern part of the county. The Sangamon River runs through the county, and there are several small lakes and ponds.
The county is divided into twelve townships: Bement, Cerro Gordo, DeWitt, Goose Creek, Harristown, Monticello, Piatt, Sangamon, Scott, White Heath, and Willow Branch.
Economy
The economy of Piatt County is largely based on agriculture. The county is home to a number of farms, which produce corn, soybeans, wheat, and oats. The county also has a number of small businesses, including manufacturing, retail, and service industries.
The county is also home to a number of state parks and recreational areas, including Allerton Park, Lake Piatt, and Sangamon River State Park. These parks provide a number of recreational activities, including camping, fishing, boating, and hiking.
Demographics
As of the 2010 census, the population of Piatt County was 16,869. The population was spread out, with 49.3% male and 50.7% female. The median age was 40.7 years.
The racial makeup of the county was 97.2% White, 0.7% African American, 0.2% Native American, 0.4% Asian, 0.1% Pacific Islander, 0.5% from other races, and 0.9% from two or more races. Hispanic or Latino of any race were 1.7% of the population.
The median household income was $50,945, and the median family income was $60,945. The per capita income was $24,945. About 8.3% of families and 11.2% of the population were below the poverty line.
Common Questions
What is Per Capita Income in Piatt County?
Per Capita income in Piatt County is $41,429.
What is the Median Family Income in Piatt County?
Median Family Income in Piatt County is $100,231.
What is the Median Household income in Piatt County?
Median Household Income in Piatt County is $81,151.
What is Income or Wage Gap in Piatt County?
Income or Wage Gap in Piatt County is 27.7%.
Women in Piatt County earn 72.3 cents for every dollar earned by a man.
What is Inequality or Gini Index in Piatt County?
Inequality or Gini Index in Piatt County is 0.42.
What is the Total Population of Piatt County?
Total Population of Piatt County is 16,698.
What is the Total Male Population of Piatt County?
Total Male Population of Piatt County is 8,227.
What is the Total Female Population of Piatt County?
Total Female Population of Piatt County is 8,471.
What is the Ratio of Males per 100 Females in Piatt County?
There are 97.12 Males per 100 Females in Piatt County.
What is the Ratio of Females per 100 Males in Piatt County?
There are 102.97 Females per 100 Males in Piatt County.
What is the Median Population Age in Piatt County?
Median Population Age in Piatt County is 41.8 Years.
What is the Average Family Size in Piatt County
Average Family Size in Piatt County is 3.0 People.
What is the Average Household Size in Piatt County
Average Household Size in Piatt County is 2.5 People.
How Large is the Labor Force in Piatt County?
There are 8,681 People in the Labor Forcein in Piatt County.
What is the Percentage of People in the Labor Force in Piatt County?
64.7% of People are in the Labor Force in Piatt County.
What is the Unemployment Rate in Piatt County?
Unemployment Rate in Piatt County is 4.7%.