Morgan County, IL Map & Demographics
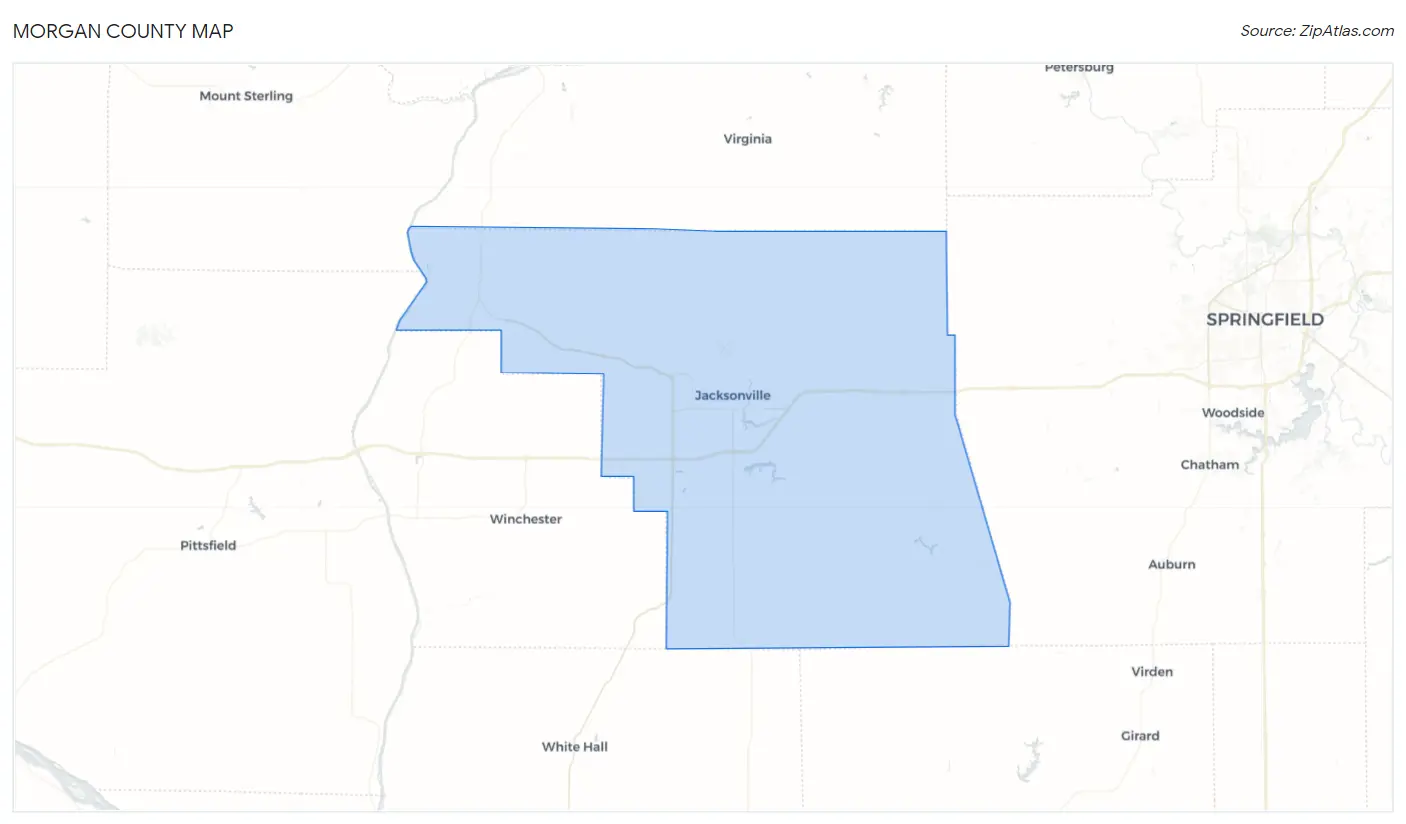
Morgan County Map
Morgan County Overview
$34,098
PER CAPITA INCOME
$81,405
AVG FAMILY INCOME
$61,188
AVG HOUSEHOLD INCOME
34.6%
WAGE / INCOME GAP [ % ]
65.4¢/ $1
WAGE / INCOME GAP [ $ ]
$9,758
FAMILY INCOME DEFICIT
0.44
INEQUALITY / GINI INDEX
32,882
TOTAL POPULATION
16,317
MALE POPULATION
16,565
FEMALE POPULATION
98.50
MALES / 100 FEMALES
101.52
FEMALES / 100 MALES
41.4
MEDIAN AGE
3.0
AVG FAMILY SIZE
2.3
AVG HOUSEHOLD SIZE
15,314
LABOR FORCE [ PEOPLE ]
56.0%
PERCENT IN LABOR FORCE
6.4%
UNEMPLOYMENT RATE
Morgan County Area Codes
Income in Morgan County
Income Overview in Morgan County
Per Capita Income in Morgan County is $34,098, while median incomes of families and households are $81,405 and $61,188 respectively.
| Characteristic | Number | Measure |
| Per Capita Income | 32,882 | $34,098 |
| Median Family Income | 7,853 | $81,405 |
| Mean Family Income | 7,853 | $97,006 |
| Median Household Income | 13,293 | $61,188 |
| Mean Household Income | 13,293 | $80,285 |
| Income Deficit | 7,853 | $9,758 |
| Wage / Income Gap (%) | 32,882 | 34.65% |
| Wage / Income Gap ($) | 32,882 | 65.35¢ per $1 |
| Gini / Inequality Index | 32,882 | 0.44 |
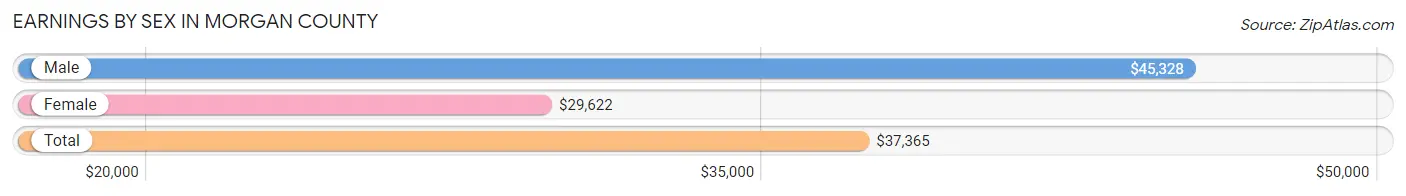
Earnings by Sex in Morgan County
Average Earnings in Morgan County are $37,365, $45,328 for men and $29,622 for women, a difference of 34.6%.
| Sex | Number | Average Earnings |
| Male | 8,597 (53.4%) | $45,328 |
| Female | 7,494 (46.6%) | $29,622 |
| Total | 16,091 (100.0%) | $37,365 |
Earnings by Sex by Income Bracket in Morgan County
The most common earnings brackets in Morgan County are $100,000+ for men (1,024 | 11.9%) and $25,000 to $29,999 for women (618 | 8.3%).
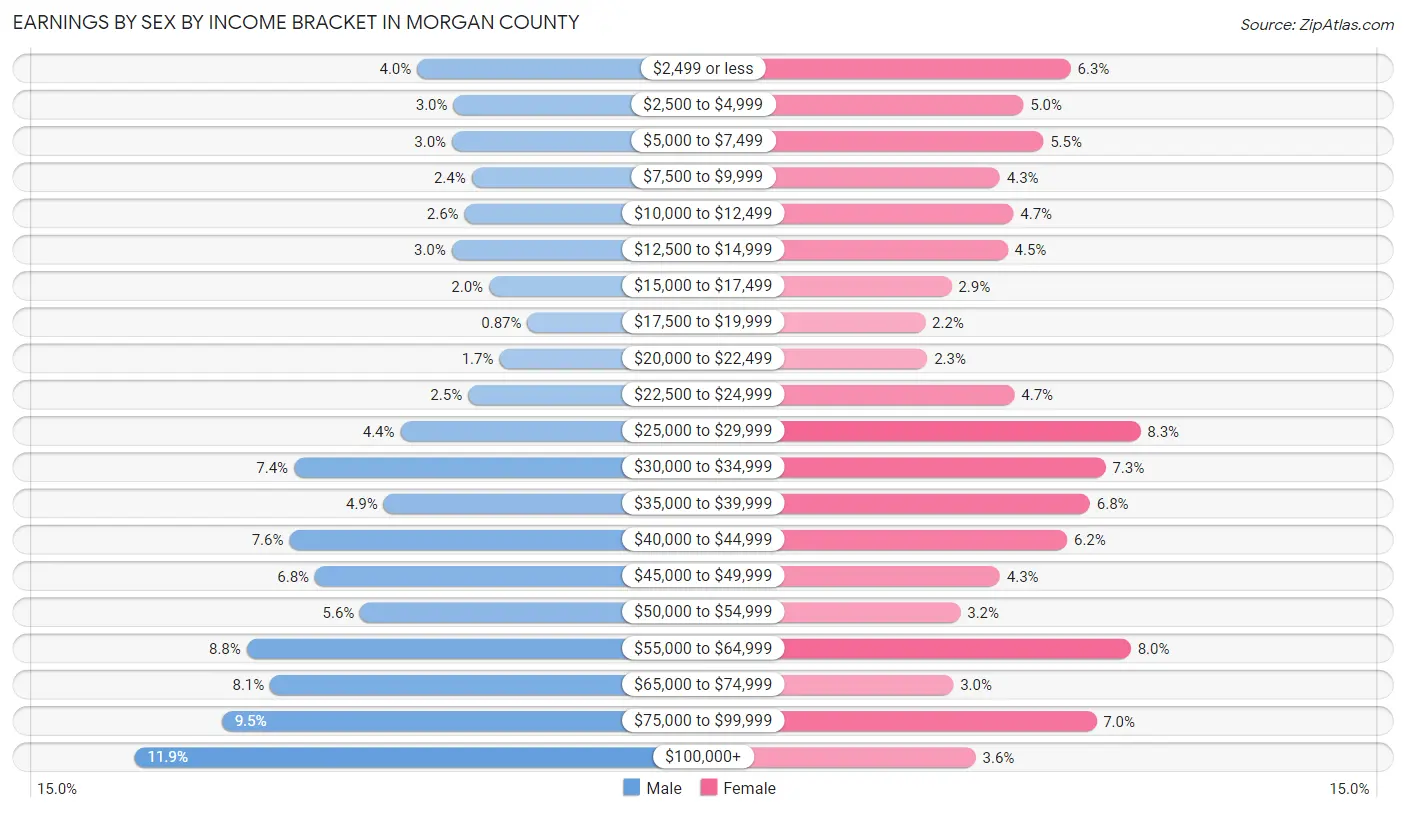
| Income | Male | Female |
| $2,499 or less | 341 (4.0%) | 471 (6.3%) |
| $2,500 to $4,999 | 254 (2.9%) | 372 (5.0%) |
| $5,000 to $7,499 | 257 (3.0%) | 414 (5.5%) |
| $7,500 to $9,999 | 210 (2.4%) | 322 (4.3%) |
| $10,000 to $12,499 | 227 (2.6%) | 351 (4.7%) |
| $12,500 to $14,999 | 258 (3.0%) | 339 (4.5%) |
| $15,000 to $17,499 | 168 (1.9%) | 220 (2.9%) |
| $17,500 to $19,999 | 75 (0.9%) | 165 (2.2%) |
| $20,000 to $22,499 | 143 (1.7%) | 169 (2.3%) |
| $22,500 to $24,999 | 218 (2.5%) | 353 (4.7%) |
| $25,000 to $29,999 | 382 (4.4%) | 618 (8.3%) |
| $30,000 to $34,999 | 639 (7.4%) | 545 (7.3%) |
| $35,000 to $39,999 | 422 (4.9%) | 512 (6.8%) |
| $40,000 to $44,999 | 650 (7.6%) | 464 (6.2%) |
| $45,000 to $49,999 | 588 (6.8%) | 322 (4.3%) |
| $50,000 to $54,999 | 479 (5.6%) | 239 (3.2%) |
| $55,000 to $64,999 | 753 (8.8%) | 598 (8.0%) |
| $65,000 to $74,999 | 696 (8.1%) | 224 (3.0%) |
| $75,000 to $99,999 | 813 (9.5%) | 525 (7.0%) |
| $100,000+ | 1,024 (11.9%) | 271 (3.6%) |
| Total | 8,597 (100.0%) | 7,494 (100.0%) |
Earnings by Sex by Educational Attainment in Morgan County
Average earnings in Morgan County are $49,702 for men and $35,092 for women, a difference of 29.4%. Men with an educational attainment of graduate degree enjoy the highest average annual earnings of $67,740, while those with high school diploma education earn the least with $44,351. Women with an educational attainment of graduate degree earn the most with the average annual earnings of $55,978, while those with less than high school education have the smallest earnings of $29,219.
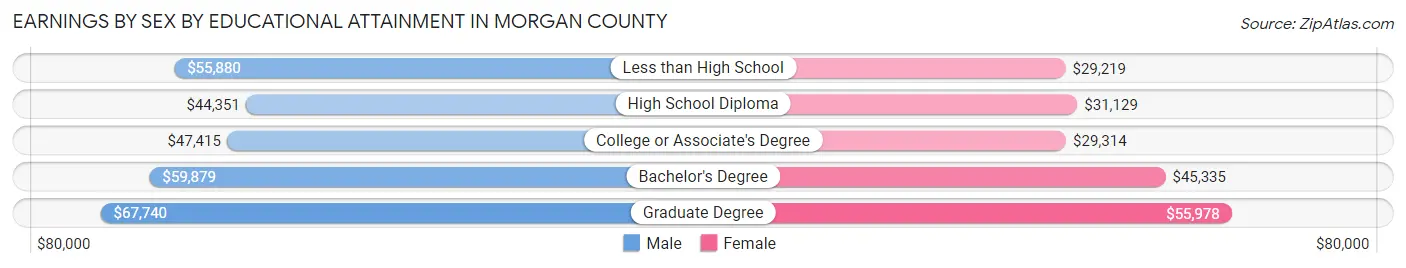
| Educational Attainment | Male Income | Female Income |
| Less than High School | $55,880 | $29,219 |
| High School Diploma | $44,351 | $31,129 |
| College or Associate's Degree | $47,415 | $29,314 |
| Bachelor's Degree | $59,879 | $45,335 |
| Graduate Degree | $67,740 | $55,978 |
| Total | $49,702 | $35,092 |
Family Income in Morgan County
Family Income Brackets in Morgan County
According to the Morgan County family income data, there are 1,798 families falling into the $100,000 to $149,999 income range, which is the most common income bracket and makes up 22.9% of all families. Conversely, the $10,000 to $14,999 income bracket is the least frequent group with only 165 families (2.1%) belonging to this category.
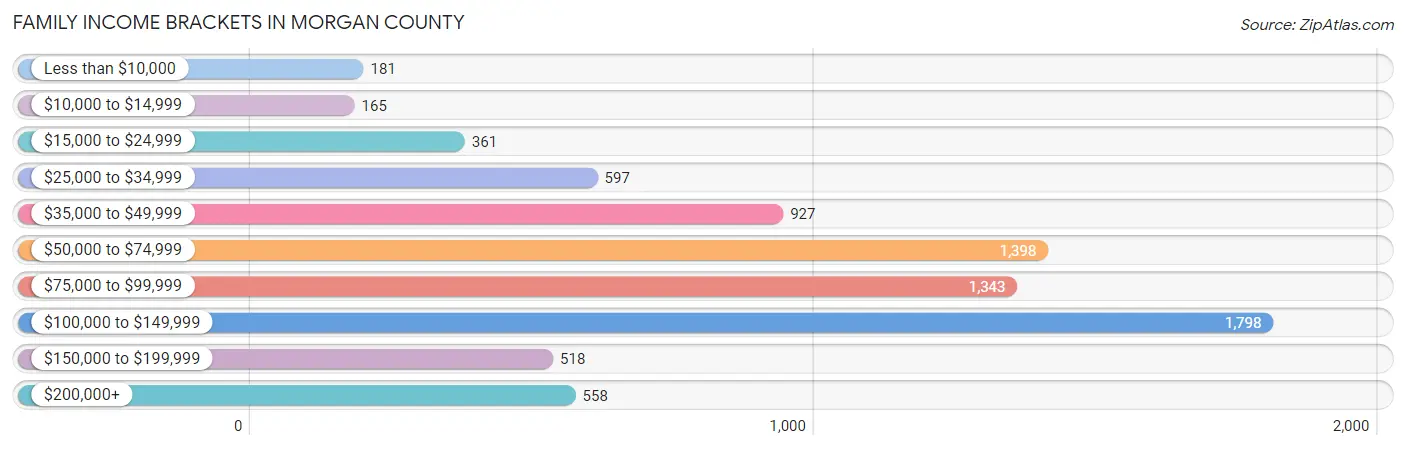
| Income Bracket | # Families | % Families |
| Less than $10,000 | 181 | 2.3% |
| $10,000 to $14,999 | 165 | 2.1% |
| $15,000 to $24,999 | 361 | 4.6% |
| $25,000 to $34,999 | 597 | 7.6% |
| $35,000 to $49,999 | 927 | 11.8% |
| $50,000 to $74,999 | 1,398 | 17.8% |
| $75,000 to $99,999 | 1,343 | 17.1% |
| $100,000 to $149,999 | 1,798 | 22.9% |
| $150,000 to $199,999 | 518 | 6.6% |
| $200,000+ | 558 | 7.1% |
Family Income by Famaliy Size in Morgan County
7+ person families (117 | 1.5%) account for the highest median family income in Morgan County with $149,375 per family, while 2-person families (4,785 | 60.9%) have the highest median income of $39,016 per family member.
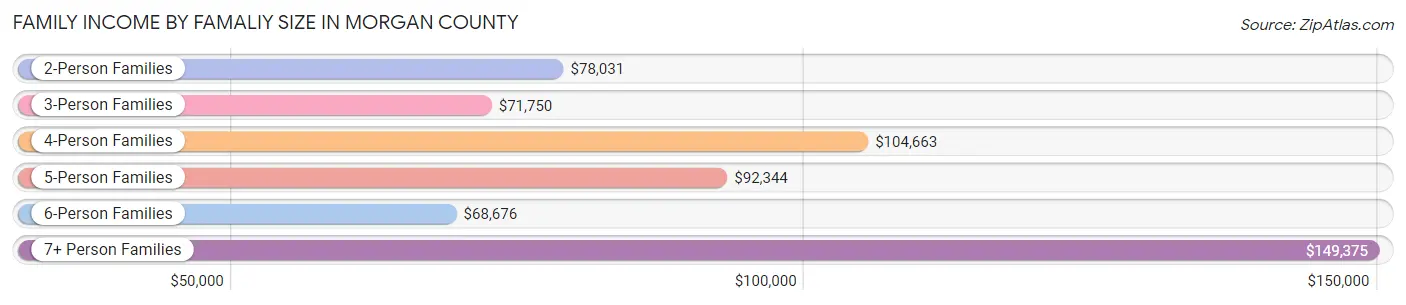
| Income Bracket | # Families | Median Income |
| 2-Person Families | 4,785 (60.9%) | $78,031 |
| 3-Person Families | 1,339 (17.1%) | $71,750 |
| 4-Person Families | 1,031 (13.1%) | $104,663 |
| 5-Person Families | 457 (5.8%) | $92,344 |
| 6-Person Families | 124 (1.6%) | $68,676 |
| 7+ Person Families | 117 (1.5%) | $149,375 |
| Total | 7,853 (100.0%) | $81,405 |
Family Income by Number of Earners in Morgan County
The median family income in Morgan County is $81,405, with families comprising 3+ earners (634) having the highest median family income of $141,563, while families with 1 earner (2,546) have the lowest median family income of $53,543, accounting for 8.1% and 32.4% of families, respectively.
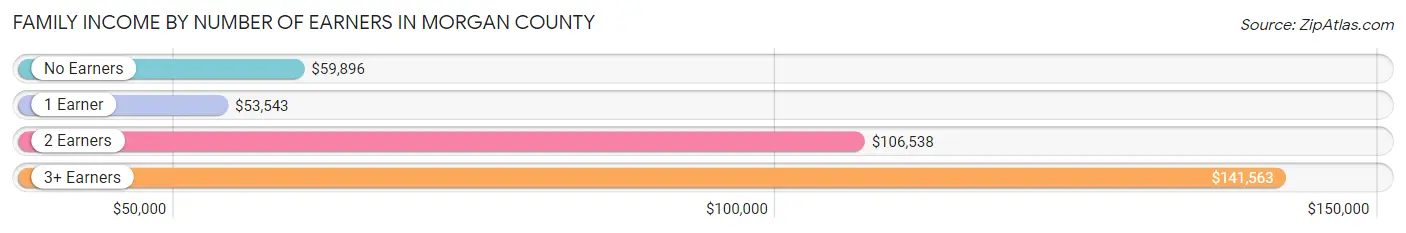
| Number of Earners | # Families | Median Income |
| No Earners | 1,785 (22.7%) | $59,896 |
| 1 Earner | 2,546 (32.4%) | $53,543 |
| 2 Earners | 2,888 (36.8%) | $106,538 |
| 3+ Earners | 634 (8.1%) | $141,563 |
| Total | 7,853 (100.0%) | $81,405 |
Household Income in Morgan County
Household Income Brackets in Morgan County
With 2,193 households falling in the category, the $50,000 to $74,999 income range is the most frequent in Morgan County, accounting for 16.5% of all households. In contrast, only 558 households (4.2%) fall into the less than $10,000 income bracket, making it the least populous group.
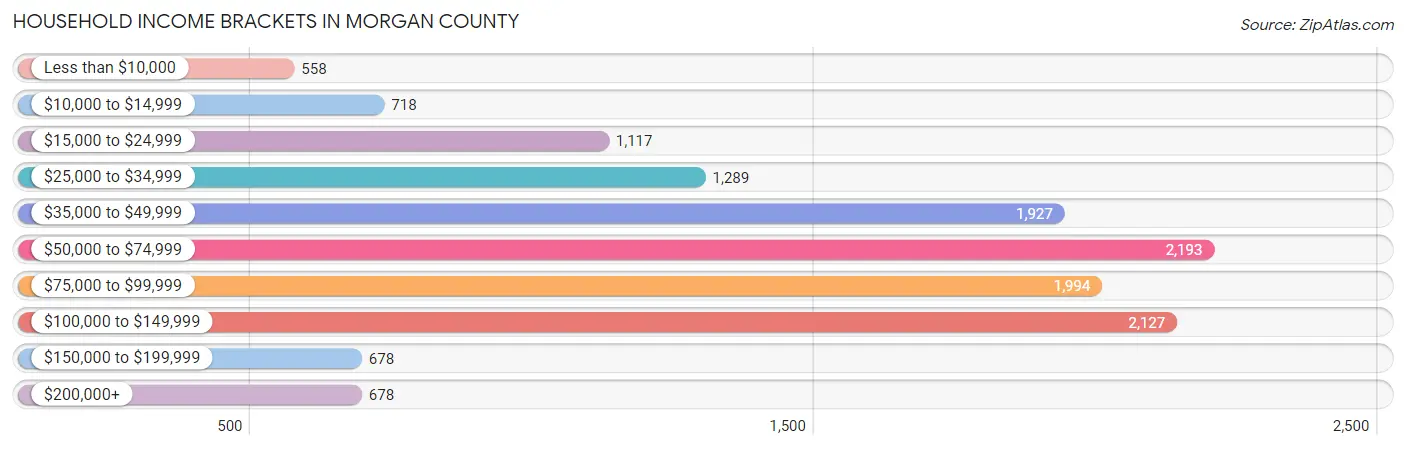
| Income Bracket | # Households | % Households |
| Less than $10,000 | 558 | 4.2% |
| $10,000 to $14,999 | 718 | 5.4% |
| $15,000 to $24,999 | 1,117 | 8.4% |
| $25,000 to $34,999 | 1,289 | 9.7% |
| $35,000 to $49,999 | 1,927 | 14.5% |
| $50,000 to $74,999 | 2,193 | 16.5% |
| $75,000 to $99,999 | 1,994 | 15.0% |
| $100,000 to $149,999 | 2,127 | 16.0% |
| $150,000 to $199,999 | 678 | 5.1% |
| $200,000+ | 678 | 5.1% |
Household Income by Householder Age in Morgan County
The median household income in Morgan County is $61,188, with the highest median household income of $72,348 found in the 45 to 64 years age bracket for the primary householder. A total of 4,979 households (37.5%) fall into this category. Meanwhile, the 15 to 24 years age bracket for the primary householder has the lowest median household income of $34,706, with 394 households (3.0%) in this group.
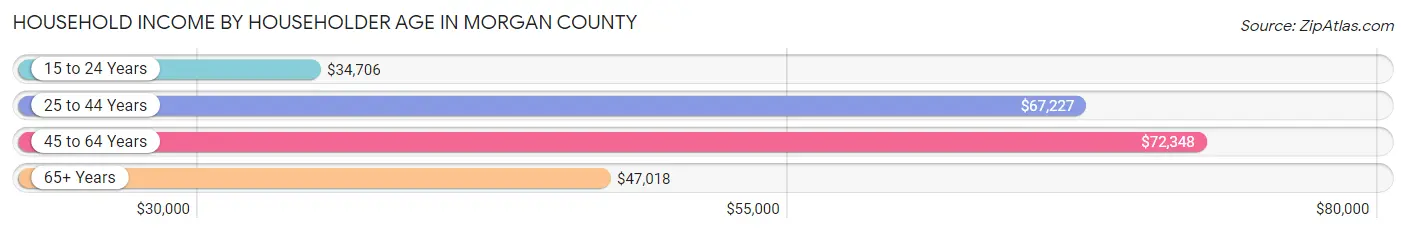
| Income Bracket | # Households | Median Income |
| 15 to 24 Years | 394 (3.0%) | $34,706 |
| 25 to 44 Years | 3,631 (27.3%) | $67,227 |
| 45 to 64 Years | 4,979 (37.5%) | $72,348 |
| 65+ Years | 4,289 (32.3%) | $47,018 |
| Total | 13,293 (100.0%) | $61,188 |
Poverty in Morgan County
Income Below Poverty by Sex and Age in Morgan County
With 12.2% poverty level for males and 13.6% for females among the residents of Morgan County, 18 to 24 year old males and under 5 year old females are the most vulnerable to poverty, with 292 males (21.7%) and 293 females (30.5%) in their respective age groups living below the poverty level.
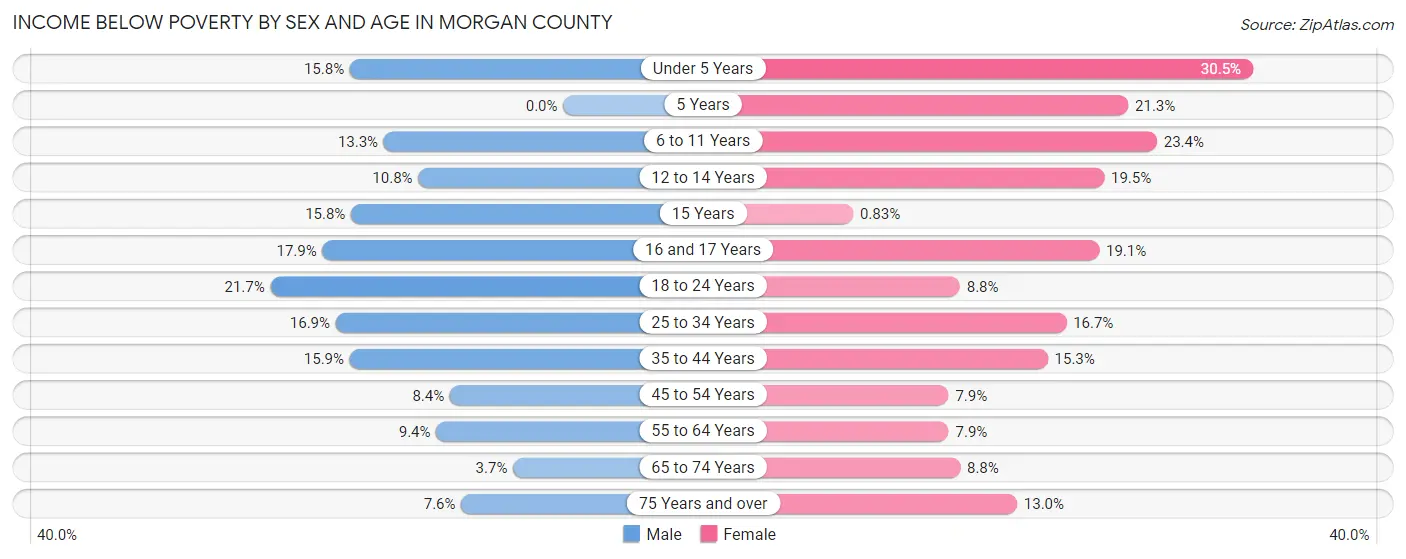
| Age Bracket | Male | Female |
| Under 5 Years | 115 (15.8%) | 293 (30.5%) |
| 5 Years | 0 (0.0%) | 27 (21.3%) |
| 6 to 11 Years | 120 (13.3%) | 251 (23.4%) |
| 12 to 14 Years | 65 (10.8%) | 126 (19.5%) |
| 15 Years | 23 (15.8%) | 1 (0.8%) |
| 16 and 17 Years | 69 (17.9%) | 64 (19.1%) |
| 18 to 24 Years | 292 (21.7%) | 105 (8.8%) |
| 25 to 34 Years | 334 (16.9%) | 297 (16.7%) |
| 35 to 44 Years | 285 (15.9%) | 264 (15.3%) |
| 45 to 54 Years | 148 (8.4%) | 142 (7.9%) |
| 55 to 64 Years | 207 (9.4%) | 194 (7.9%) |
| 65 to 74 Years | 66 (3.7%) | 168 (8.8%) |
| 75 Years and over | 83 (7.6%) | 199 (13.0%) |
| Total | 1,807 (12.2%) | 2,131 (13.6%) |
Income Above Poverty by Sex and Age in Morgan County
According to the poverty statistics in Morgan County, males aged 5 years and females aged 15 years are the age groups that are most secure financially, with 100.0% of males and 99.2% of females in these age groups living above the poverty line.
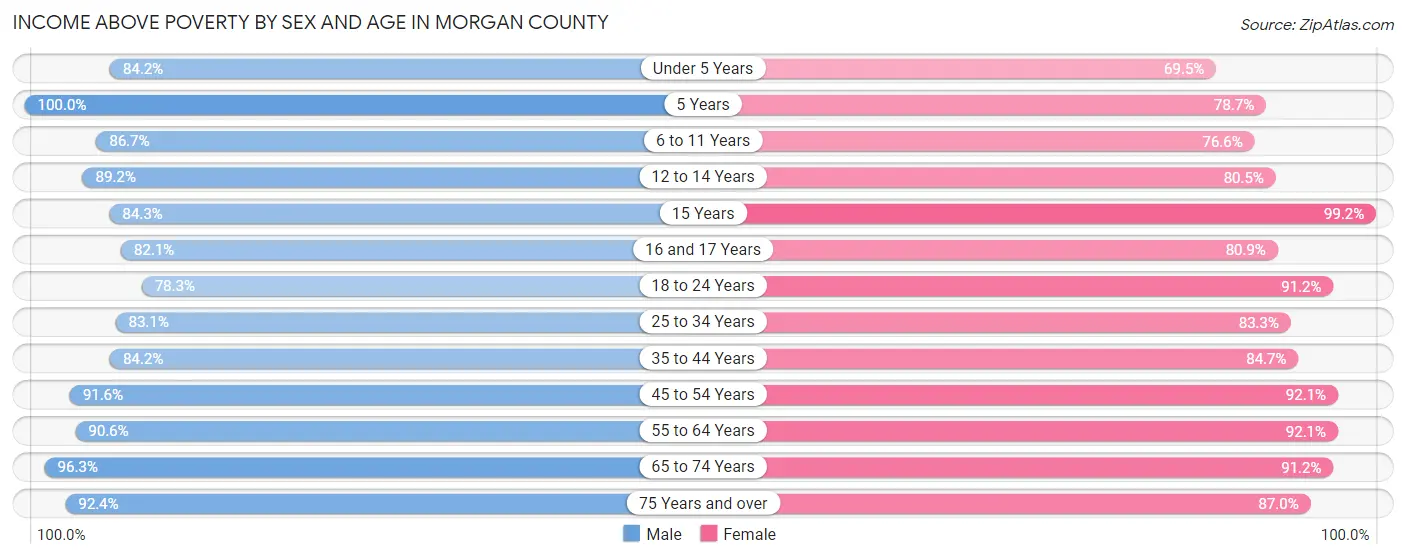
| Age Bracket | Male | Female |
| Under 5 Years | 611 (84.2%) | 667 (69.5%) |
| 5 Years | 140 (100.0%) | 100 (78.7%) |
| 6 to 11 Years | 781 (86.7%) | 822 (76.6%) |
| 12 to 14 Years | 539 (89.2%) | 521 (80.5%) |
| 15 Years | 123 (84.3%) | 120 (99.2%) |
| 16 and 17 Years | 317 (82.1%) | 271 (80.9%) |
| 18 to 24 Years | 1,051 (78.3%) | 1,093 (91.2%) |
| 25 to 34 Years | 1,644 (83.1%) | 1,486 (83.3%) |
| 35 to 44 Years | 1,513 (84.2%) | 1,464 (84.7%) |
| 45 to 54 Years | 1,611 (91.6%) | 1,652 (92.1%) |
| 55 to 64 Years | 1,989 (90.6%) | 2,252 (92.1%) |
| 65 to 74 Years | 1,709 (96.3%) | 1,746 (91.2%) |
| 75 Years and over | 1,013 (92.4%) | 1,332 (87.0%) |
| Total | 13,041 (87.8%) | 13,526 (86.4%) |
Income Below Poverty Among Married-Couple Families in Morgan County
The poverty statistics for married-couple families in Morgan County show that 3.2% or 183 of the total 5,741 families live below the poverty line. Families with 1 or 2 children have the highest poverty rate of 7.4%, comprising of 104 families. On the other hand, families with 5 or more children have the lowest poverty rate of 0.0%, which includes 0 families.
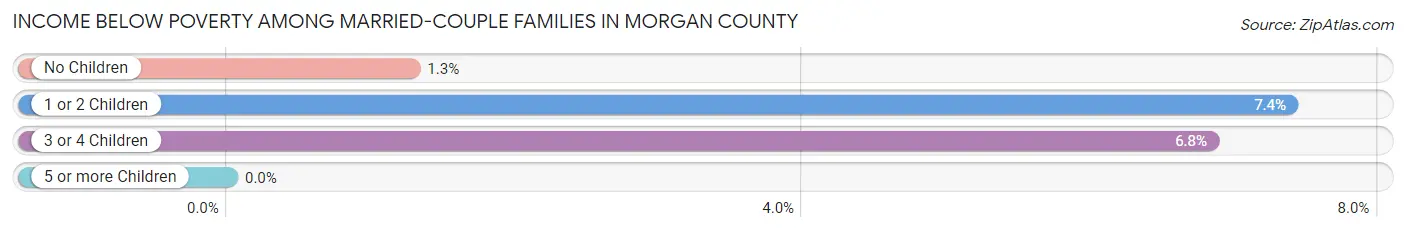
| Children | Above Poverty | Below Poverty |
| No Children | 3,816 (98.7%) | 49 (1.3%) |
| 1 or 2 Children | 1,306 (92.6%) | 104 (7.4%) |
| 3 or 4 Children | 409 (93.2%) | 30 (6.8%) |
| 5 or more Children | 27 (100.0%) | 0 (0.0%) |
| Total | 5,558 (96.8%) | 183 (3.2%) |
Income Below Poverty Among Single-Parent Households in Morgan County
According to the poverty data in Morgan County, 15.5% or 94 single-father households and 19.2% or 289 single-mother households are living below the poverty line. Among single-father households, those with 3 or 4 children have the highest poverty rate, with 16 households (100.0%) experiencing poverty. Likewise, among single-mother households, those with 3 or 4 children have the highest poverty rate, with 74 households (66.1%) falling below the poverty line.
| Children | Single Father | Single Mother |
| No Children | 28 (6.9%) | 34 (7.6%) |
| 1 or 2 Children | 50 (27.2%) | 181 (19.3%) |
| 3 or 4 Children | 16 (100.0%) | 74 (66.1%) |
| 5 or more Children | 0 (0.0%) | 0 (0.0%) |
| Total | 94 (15.5%) | 289 (19.2%) |
Income Below Poverty Among Married-Couple vs Single-Parent Households in Morgan County
The poverty data for Morgan County shows that 183 of the married-couple family households (3.2%) and 383 of the single-parent households (18.1%) are living below the poverty level. Within the married-couple family households, those with 1 or 2 children have the highest poverty rate, with 104 households (7.4%) falling below the poverty line. Among the single-parent households, those with 3 or 4 children have the highest poverty rate, with 90 household (70.3%) living below poverty.
| Children | Married-Couple Families | Single-Parent Households |
| No Children | 49 (1.3%) | 62 (7.2%) |
| 1 or 2 Children | 104 (7.4%) | 231 (20.6%) |
| 3 or 4 Children | 30 (6.8%) | 90 (70.3%) |
| 5 or more Children | 0 (0.0%) | 0 (0.0%) |
| Total | 183 (3.2%) | 383 (18.1%) |
Race in Morgan County
The most populous races in Morgan County are White / Caucasian (29,200 | 88.8%), Black / African American (1,678 | 5.1%), and Two or more Races (1,472 | 4.5%).
| Race | # Population | % Population |
| Asian | 253 | 0.8% |
| Black / African American | 1,678 | 5.1% |
| Hawaiian / Pacific | 0 | 0.0% |
| Hispanic or Latino | 887 | 2.7% |
| Native / Alaskan | 42 | 0.1% |
| White / Caucasian | 29,200 | 88.8% |
| Two or more Races | 1,472 | 4.5% |
| Some other Race | 237 | 0.7% |
| Total | 32,882 | 100.0% |
Ancestry in Morgan County
The most populous ancestries reported in Morgan County are German (6,671 | 20.3%), English (4,405 | 13.4%), Irish (4,045 | 12.3%), American (2,221 | 6.8%), and Italian (1,287 | 3.9%), together accounting for 56.7% of all Morgan County residents.
| Ancestry | # Population | % Population |
| African | 54 | 0.2% |
| American | 2,221 | 6.8% |
| Arab | 23 | 0.1% |
| Austrian | 20 | 0.1% |
| Basque | 2 | 0.0% |
| Belgian | 21 | 0.1% |
| Blackfeet | 23 | 0.1% |
| Bolivian | 12 | 0.0% |
| British | 47 | 0.1% |
| British West Indian | 7 | 0.0% |
| Burmese | 15 | 0.1% |
| Canadian | 28 | 0.1% |
| Central American | 77 | 0.2% |
| Cherokee | 34 | 0.1% |
| Chilean | 2 | 0.0% |
| Choctaw | 9 | 0.0% |
| Costa Rican | 31 | 0.1% |
| Cuban | 14 | 0.0% |
| Czech | 70 | 0.2% |
| Czechoslovakian | 2 | 0.0% |
| Danish | 37 | 0.1% |
| Dutch | 513 | 1.6% |
| Eastern European | 36 | 0.1% |
| English | 4,405 | 13.4% |
| European | 406 | 1.2% |
| Filipino | 19 | 0.1% |
| Finnish | 2 | 0.0% |
| French | 688 | 2.1% |
| French Canadian | 10 | 0.0% |
| German | 6,671 | 20.3% |
| Greek | 70 | 0.2% |
| Guatemalan | 5 | 0.0% |
| Haitian | 36 | 0.1% |
| Honduran | 38 | 0.1% |
| Hungarian | 23 | 0.1% |
| Indian (Asian) | 41 | 0.1% |
| Iranian | 9 | 0.0% |
| Irish | 4,045 | 12.3% |
| Italian | 1,287 | 3.9% |
| Jamaican | 7 | 0.0% |
| Jordanian | 3 | 0.0% |
| Korean | 201 | 0.6% |
| Lithuanian | 1 | 0.0% |
| Mexican | 648 | 2.0% |
| Native Hawaiian | 4 | 0.0% |
| Nicaraguan | 3 | 0.0% |
| Nigerian | 16 | 0.1% |
| Northern European | 57 | 0.2% |
| Norwegian | 203 | 0.6% |
| Palestinian | 12 | 0.0% |
| Polish | 284 | 0.9% |
| Portuguese | 174 | 0.5% |
| Puerto Rican | 61 | 0.2% |
| Russian | 11 | 0.0% |
| Samoan | 4 | 0.0% |
| Scandinavian | 75 | 0.2% |
| Scotch-Irish | 299 | 0.9% |
| Scottish | 426 | 1.3% |
| Seminole | 5 | 0.0% |
| Sioux | 1 | 0.0% |
| Slovak | 15 | 0.1% |
| South American | 45 | 0.1% |
| Spaniard | 25 | 0.1% |
| Spanish | 14 | 0.0% |
| Sri Lankan | 20 | 0.1% |
| Subsaharan African | 70 | 0.2% |
| Swedish | 245 | 0.7% |
| Swiss | 62 | 0.2% |
| Thai | 67 | 0.2% |
| Ukrainian | 31 | 0.1% |
| Venezuelan | 31 | 0.1% |
| Welsh | 240 | 0.7% | View All 72 Rows |
Immigrants in Morgan County
The most numerous immigrant groups reported in Morgan County came from Asia (171 | 0.5%), Latin America (163 | 0.5%), Central America (104 | 0.3%), Mexico (100 | 0.3%), and South Central Asia (67 | 0.2%), together accounting for 1.8% of all Morgan County residents.
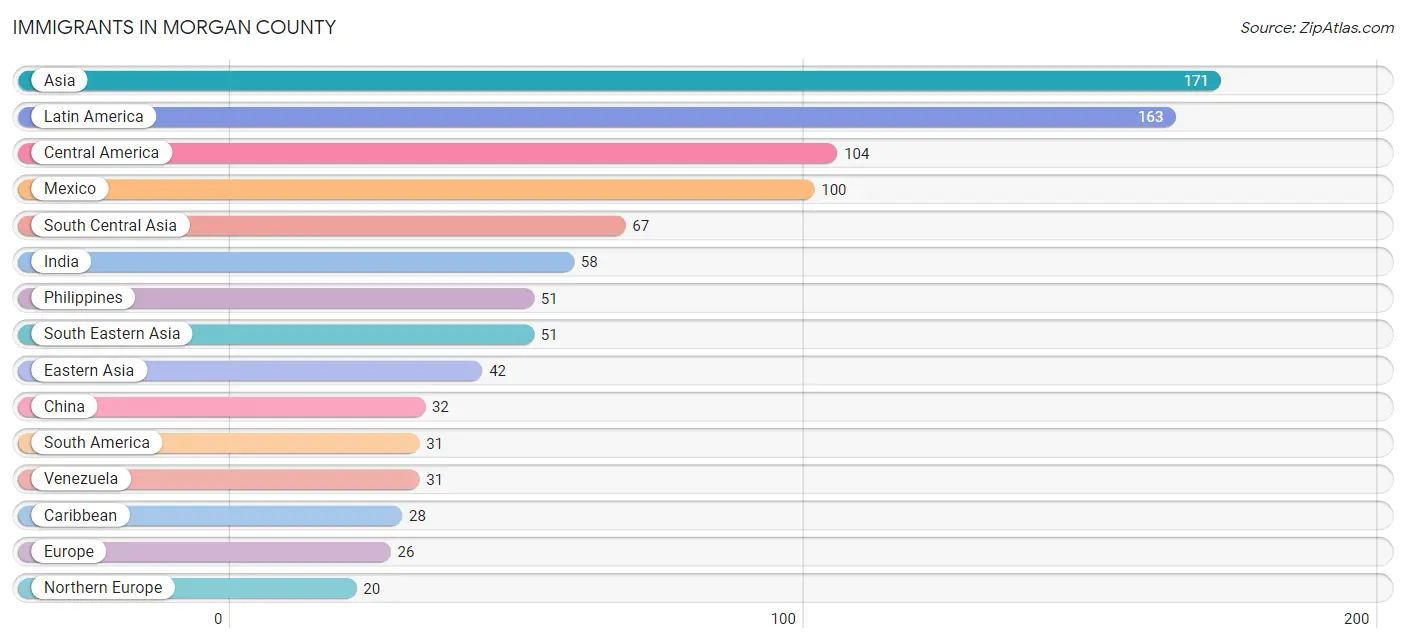
| Immigration Origin | # Population | % Population |
| Asia | 171 | 0.5% |
| Canada | 6 | 0.0% |
| Caribbean | 28 | 0.1% |
| Central America | 104 | 0.3% |
| China | 32 | 0.1% |
| Cuba | 14 | 0.0% |
| Eastern Asia | 42 | 0.1% |
| Eastern Europe | 1 | 0.0% |
| England | 10 | 0.0% |
| Europe | 26 | 0.1% |
| France | 5 | 0.0% |
| Hong Kong | 2 | 0.0% |
| India | 58 | 0.2% |
| Iran | 9 | 0.0% |
| Iraq | 11 | 0.0% |
| Jamaica | 7 | 0.0% |
| Korea | 10 | 0.0% |
| Latin America | 163 | 0.5% |
| Mexico | 100 | 0.3% |
| Nicaragua | 3 | 0.0% |
| Northern Europe | 20 | 0.1% |
| Panama | 1 | 0.0% |
| Philippines | 51 | 0.2% |
| Poland | 1 | 0.0% |
| Scotland | 10 | 0.0% |
| South America | 31 | 0.1% |
| South Central Asia | 67 | 0.2% |
| South Eastern Asia | 51 | 0.2% |
| Venezuela | 31 | 0.1% |
| Western Asia | 11 | 0.0% |
| Western Europe | 5 | 0.0% | View All 31 Rows |
Sex and Age in Morgan County
Sex and Age in Morgan County
The most populous age groups in Morgan County are 30 to 34 Years (1,248 | 7.6%) for men and 60 to 64 Years (1,520 | 9.2%) for women.
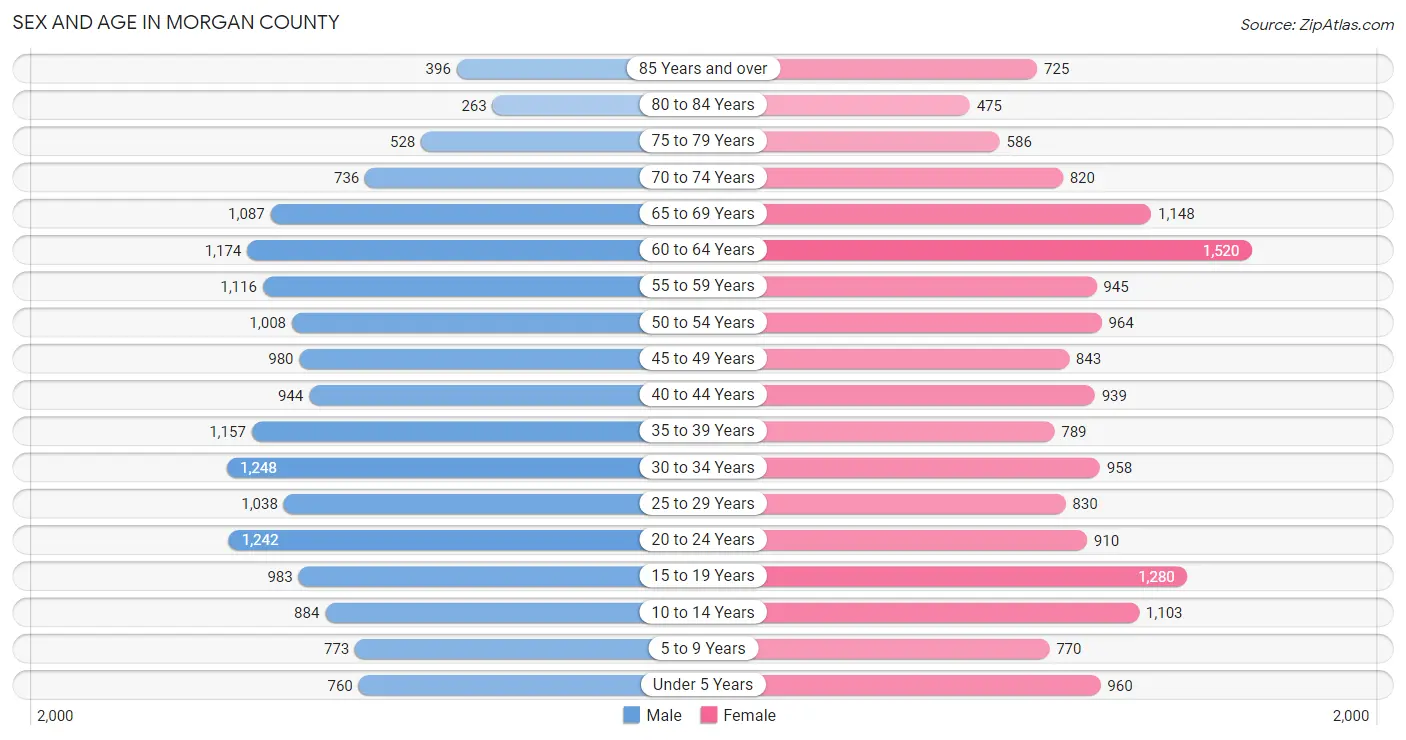
| Age Bracket | Male | Female |
| Under 5 Years | 760 (4.7%) | 960 (5.8%) |
| 5 to 9 Years | 773 (4.7%) | 770 (4.6%) |
| 10 to 14 Years | 884 (5.4%) | 1,103 (6.7%) |
| 15 to 19 Years | 983 (6.0%) | 1,280 (7.7%) |
| 20 to 24 Years | 1,242 (7.6%) | 910 (5.5%) |
| 25 to 29 Years | 1,038 (6.4%) | 830 (5.0%) |
| 30 to 34 Years | 1,248 (7.6%) | 958 (5.8%) |
| 35 to 39 Years | 1,157 (7.1%) | 789 (4.8%) |
| 40 to 44 Years | 944 (5.8%) | 939 (5.7%) |
| 45 to 49 Years | 980 (6.0%) | 843 (5.1%) |
| 50 to 54 Years | 1,008 (6.2%) | 964 (5.8%) |
| 55 to 59 Years | 1,116 (6.8%) | 945 (5.7%) |
| 60 to 64 Years | 1,174 (7.2%) | 1,520 (9.2%) |
| 65 to 69 Years | 1,087 (6.7%) | 1,148 (6.9%) |
| 70 to 74 Years | 736 (4.5%) | 820 (5.0%) |
| 75 to 79 Years | 528 (3.2%) | 586 (3.5%) |
| 80 to 84 Years | 263 (1.6%) | 475 (2.9%) |
| 85 Years and over | 396 (2.4%) | 725 (4.4%) |
| Total | 16,317 (100.0%) | 16,565 (100.0%) |
Families and Households in Morgan County
Median Family Size in Morgan County
The median family size in Morgan County is 2.95 persons per family, with single female/mother families (1,507 | 19.2%) accounting for the largest median family size of 3.16 persons per family. On the other hand, single male/father families (605 | 7.7%) represent the smallest median family size with 2.69 persons per family.

| Family Type | # Families | Family Size |
| Married-Couple | 5,741 (73.1%) | 2.92 |
| Single Male/Father | 605 (7.7%) | 2.69 |
| Single Female/Mother | 1,507 (19.2%) | 3.16 |
| Total Families | 7,853 (100.0%) | 2.95 |
Median Household Size in Morgan County
The median household size in Morgan County is 2.28 persons per household, with single female/mother households (1,507 | 11.3%) accounting for the largest median household size of 3.65 persons per household. non-family households (5,440 | 40.9%) represent the smallest median household size with 1.15 persons per household.

| Household Type | # Households | Household Size |
| Married-Couple | 5,741 (43.2%) | 2.93 |
| Single Male/Father | 605 (4.5%) | 2.94 |
| Single Female/Mother | 1,507 (11.3%) | 3.65 |
| Non-family | 5,440 (40.9%) | 1.15 |
| Total Households | 13,293 (100.0%) | 2.28 |
Household Size by Marriage Status in Morgan County
Out of a total of 13,293 households in Morgan County, 7,853 (59.1%) are family households, while 5,440 (40.9%) are nonfamily households. The most numerous type of family households are 2-person households, comprising 4,458, and the most common type of nonfamily households are 1-person households, comprising 4,740.
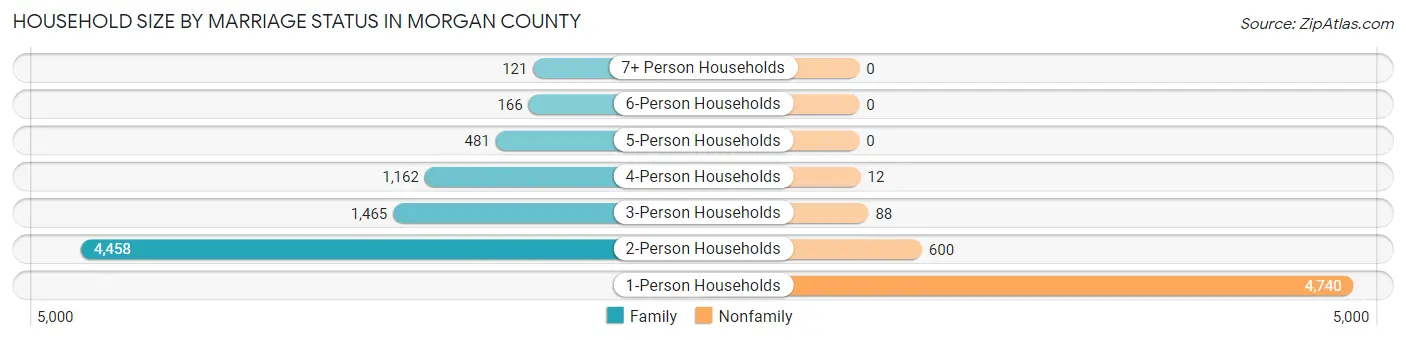
| Household Size | Family Households | Nonfamily Households |
| 1-Person Households | - | 4,740 (35.7%) |
| 2-Person Households | 4,458 (33.5%) | 600 (4.5%) |
| 3-Person Households | 1,465 (11.0%) | 88 (0.7%) |
| 4-Person Households | 1,162 (8.7%) | 12 (0.1%) |
| 5-Person Households | 481 (3.6%) | 0 (0.0%) |
| 6-Person Households | 166 (1.3%) | 0 (0.0%) |
| 7+ Person Households | 121 (0.9%) | 0 (0.0%) |
| Total | 7,853 (59.1%) | 5,440 (40.9%) |
Female Fertility in Morgan County
Fertility by Age in Morgan County
Average fertility rate in Morgan County is 52.0 births per 1,000 women. Women in the age bracket of 35 to 50 years have the highest fertility rate with 72.0 births per 1,000 women. Women in the age bracket of 35 to 50 years acount for 56.6% of all women with births.
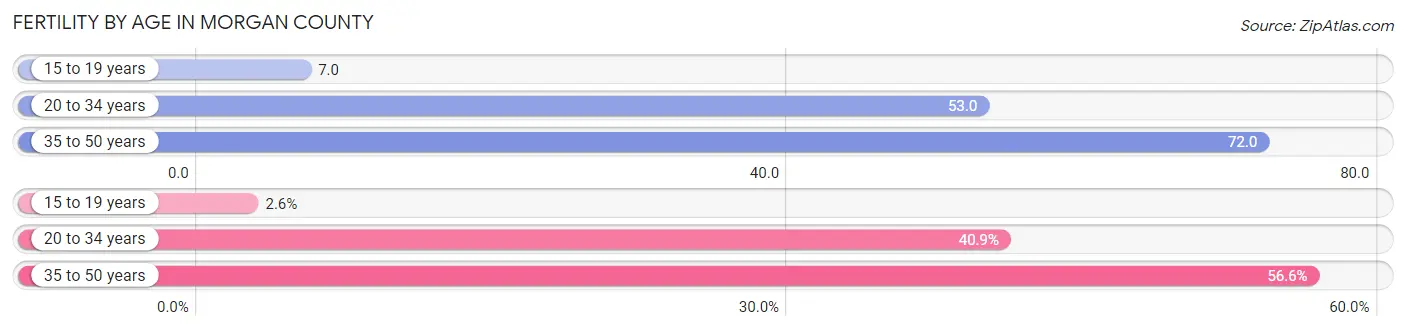
| Age Bracket | Women with Births | Births / 1,000 Women |
| 15 to 19 years | 9 (2.6%) | 7.0 |
| 20 to 34 years | 143 (40.9%) | 53.0 |
| 35 to 50 years | 198 (56.6%) | 72.0 |
| Total | 350 (100.0%) | 52.0 |
Fertility by Age by Marriage Status in Morgan County
77.4% of women with births (350) in Morgan County are married. The highest percentage of unmarried women with births falls into 15 to 19 years age bracket with 100.0% of them unmarried at the time of birth, while the lowest percentage of unmarried women with births belong to 35 to 50 years age bracket with 7.1% of them unmarried.
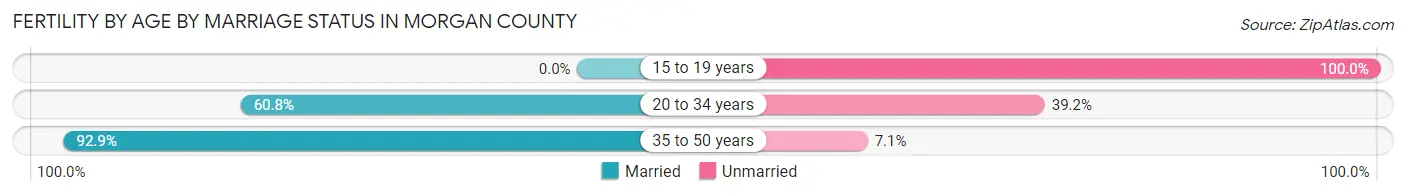
| Age Bracket | Married | Unmarried |
| 15 to 19 years | 0 (0.0%) | 9 (100.0%) |
| 20 to 34 years | 87 (60.8%) | 56 (39.2%) |
| 35 to 50 years | 184 (92.9%) | 14 (7.1%) |
| Total | 271 (77.4%) | 79 (22.6%) |
Fertility by Education in Morgan County
Average fertility rate in Morgan County is 52.0 births per 1,000 women. Women with the education attainment of bachelor's degree have the highest fertility rate of 171.0 births per 1,000 women, while women with the education attainment of less than high school have the lowest fertility at 11.0 births per 1,000 women. Women with the education attainment of bachelor's degree represent 59.1% of all women with births.
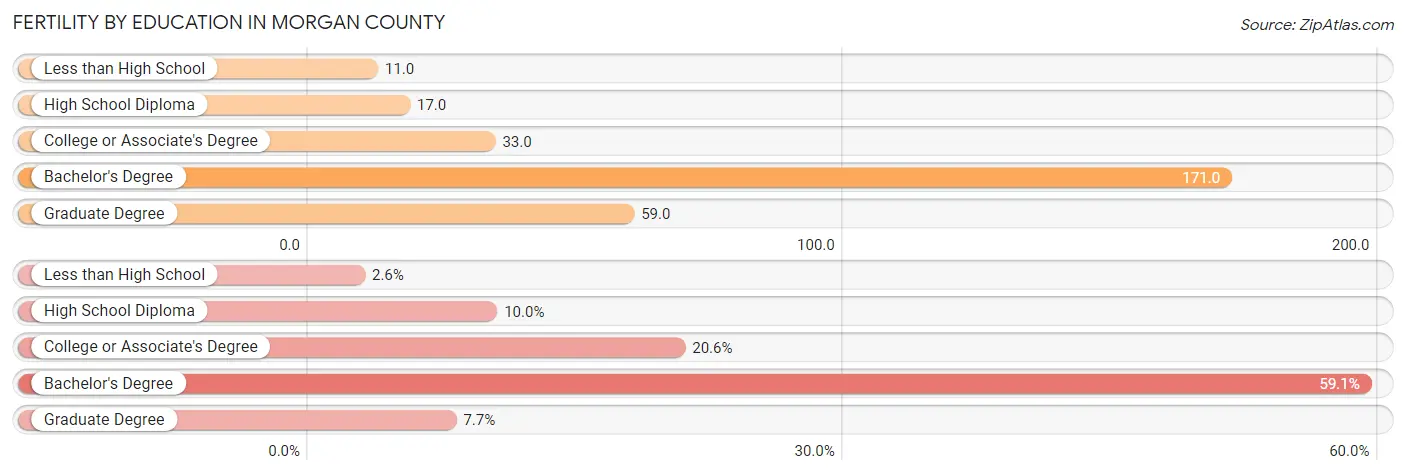
| Educational Attainment | Women with Births | Births / 1,000 Women |
| Less than High School | 9 (2.6%) | 11.0 |
| High School Diploma | 35 (10.0%) | 17.0 |
| College or Associate's Degree | 72 (20.6%) | 33.0 |
| Bachelor's Degree | 207 (59.1%) | 171.0 |
| Graduate Degree | 27 (7.7%) | 59.0 |
| Total | 350 (100.0%) | 52.0 |
Fertility by Education by Marriage Status in Morgan County
22.6% of women with births in Morgan County are unmarried. Women with the educational attainment of graduate degree are most likely to be married with 100.0% of them married at childbirth, while women with the educational attainment of high school diploma are least likely to be married with 60.0% of them unmarried at childbirth.
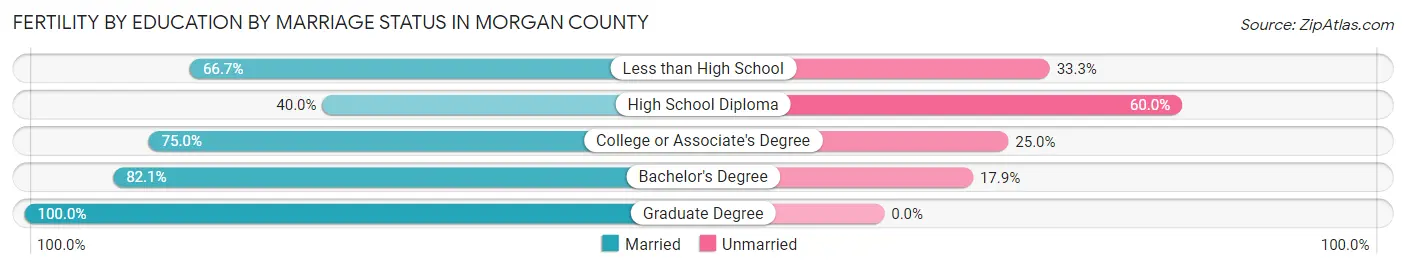
| Educational Attainment | Married | Unmarried |
| Less than High School | 6 (66.7%) | 3 (33.3%) |
| High School Diploma | 14 (40.0%) | 21 (60.0%) |
| College or Associate's Degree | 54 (75.0%) | 18 (25.0%) |
| Bachelor's Degree | 170 (82.1%) | 37 (17.9%) |
| Graduate Degree | 27 (100.0%) | 0 (0.0%) |
| Total | 271 (77.4%) | 79 (22.6%) |
Employment Characteristics in Morgan County
Employment by Class of Employer in Morgan County
Among the 14,173 employed individuals in Morgan County, private company employees (8,762 | 61.8%), not-for-profit organizations (1,666 | 11.7%), and local government employees (1,261 | 8.9%) make up the most common classes of employment.
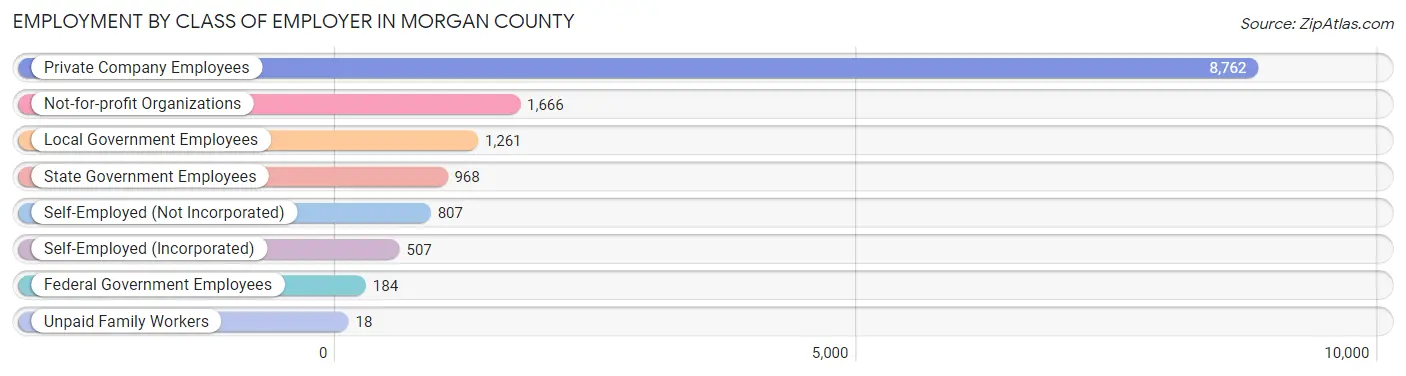
| Employer Class | # Employees | % Employees |
| Private Company Employees | 8,762 | 61.8% |
| Self-Employed (Incorporated) | 507 | 3.6% |
| Self-Employed (Not Incorporated) | 807 | 5.7% |
| Not-for-profit Organizations | 1,666 | 11.7% |
| Local Government Employees | 1,261 | 8.9% |
| State Government Employees | 968 | 6.8% |
| Federal Government Employees | 184 | 1.3% |
| Unpaid Family Workers | 18 | 0.1% |
| Total | 14,173 | 100.0% |
Employment Status by Age in Morgan County
According to the labor force statistics for Morgan County, out of the total population over 16 years of age (27,347), 56.0% or 15,314 individuals are in the labor force, with 6.4% or 980 of them unemployed. The age group with the highest labor force participation rate is 25 to 29 years, with 83.9% or 1,567 individuals in the labor force. Within the labor force, the 20 to 24 years age range has the highest percentage of unemployed individuals, with 25.9% or 416 of them being unemployed.
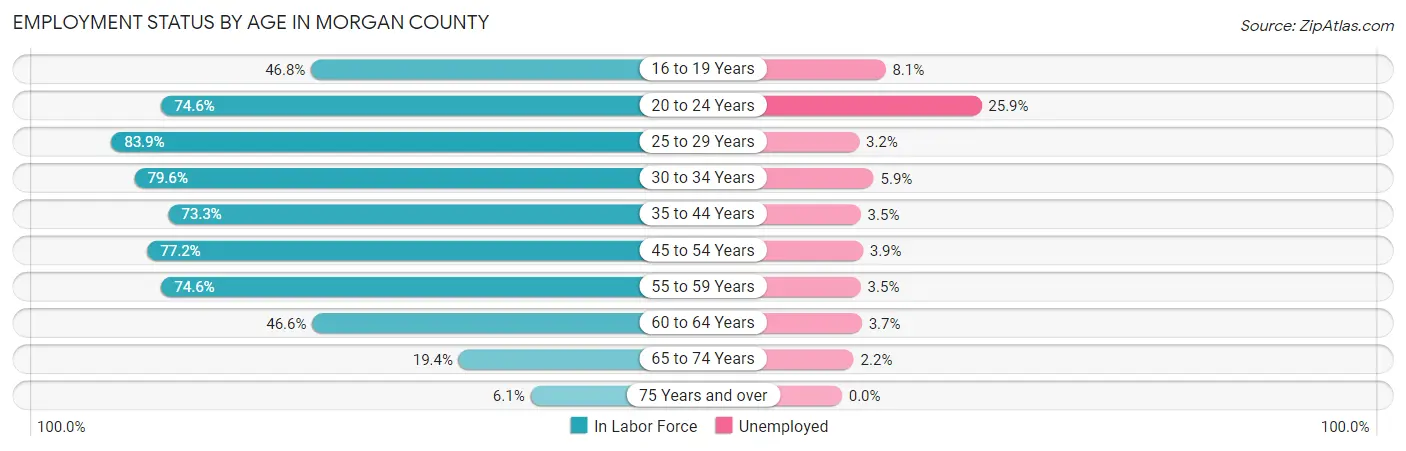
| Age Bracket | In Labor Force | Unemployed |
| 16 to 19 Years | 926 (46.8%) | 75 (8.1%) |
| 20 to 24 Years | 1,605 (74.6%) | 416 (25.9%) |
| 25 to 29 Years | 1,567 (83.9%) | 50 (3.2%) |
| 30 to 34 Years | 1,756 (79.6%) | 104 (5.9%) |
| 35 to 44 Years | 2,807 (73.3%) | 98 (3.5%) |
| 45 to 54 Years | 2,930 (77.2%) | 114 (3.9%) |
| 55 to 59 Years | 1,538 (74.6%) | 54 (3.5%) |
| 60 to 64 Years | 1,255 (46.6%) | 46 (3.7%) |
| 65 to 74 Years | 735 (19.4%) | 16 (2.2%) |
| 75 Years and over | 181 (6.1%) | 0 (0.0%) |
| Total | 15,314 (56.0%) | 980 (6.4%) |
Employment Status by Educational Attainment in Morgan County
According to labor force statistics for Morgan County, 72.0% of individuals (11,846) out of the total population between 25 and 64 years of age (16,453) are in the labor force, with 3.9% or 462 of them being unemployed. The group with the highest labor force participation rate are those with the educational attainment of bachelor's degree or higher, with 83.4% or 3,402 individuals in the labor force. Within the labor force, individuals with less than high school education have the highest percentage of unemployment, with 10.4% or 81 of them being unemployed.
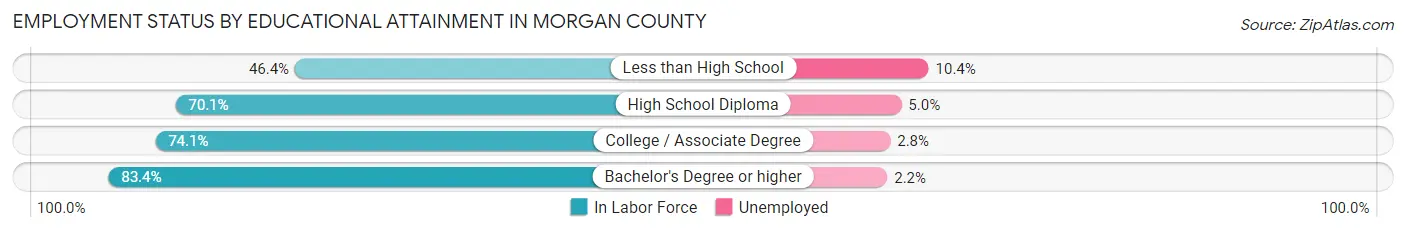
| Educational Attainment | In Labor Force | Unemployed |
| Less than High School | 780 (46.4%) | 175 (10.4%) |
| High School Diploma | 4,422 (70.1%) | 315 (5.0%) |
| College / Associate Degree | 3,250 (74.1%) | 123 (2.8%) |
| Bachelor's Degree or higher | 3,402 (83.4%) | 90 (2.2%) |
| Total | 11,846 (72.0%) | 642 (3.9%) |
Employment Occupations by Sex in Morgan County
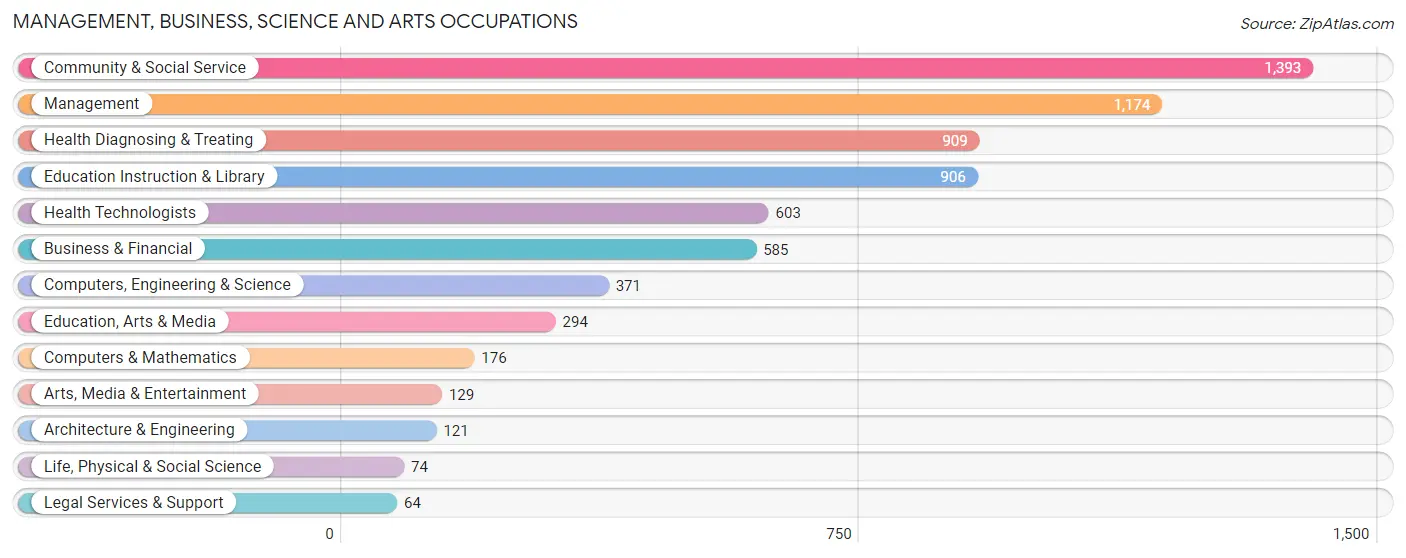
Management, Business, Science and Arts Occupations
The most common Management, Business, Science and Arts occupations in Morgan County are Community & Social Service (1,393 | 9.8%), Management (1,174 | 8.2%), Health Diagnosing & Treating (909 | 6.4%), Education Instruction & Library (906 | 6.3%), and Health Technologists (603 | 4.2%).
Management, Business, Science and Arts Occupations by Sex
Within the Management, Business, Science and Arts occupations in Morgan County, the most male-oriented occupations are Architecture & Engineering (93.4%), Computers, Engineering & Science (83.3%), and Computers & Mathematics (80.1%), while the most female-oriented occupations are Health Technologists (81.4%), Health Diagnosing & Treating (81.3%), and Education Instruction & Library (71.6%).
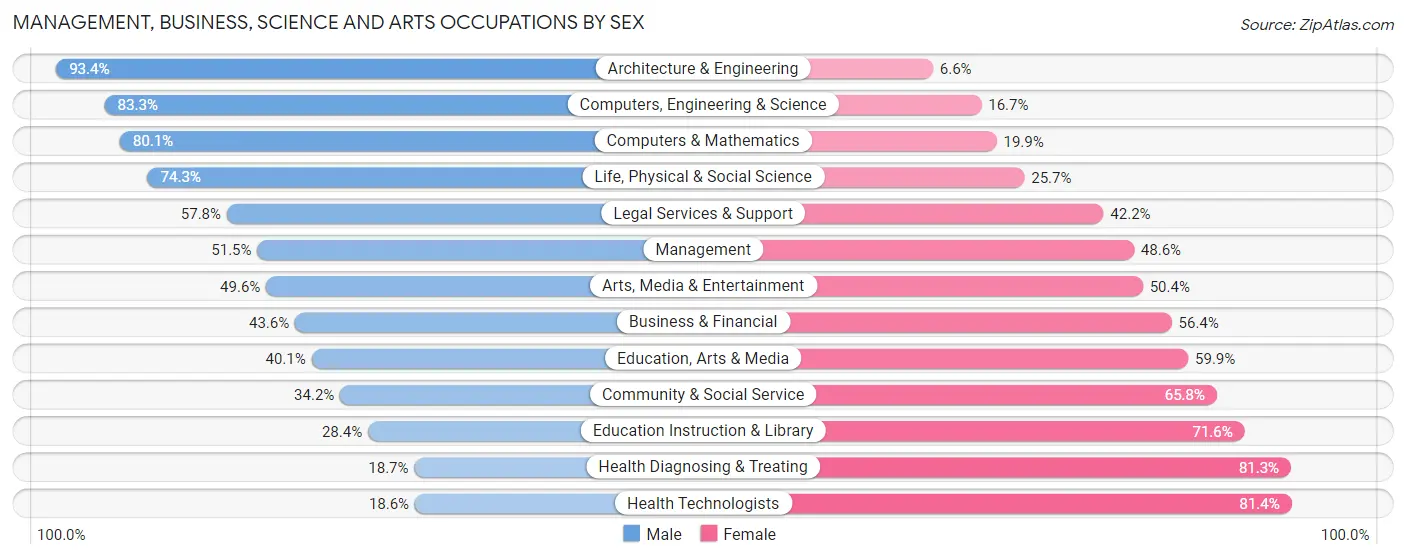
| Occupation | Male | Female |
| Management | 604 (51.4%) | 570 (48.5%) |
| Business & Financial | 255 (43.6%) | 330 (56.4%) |
| Computers, Engineering & Science | 309 (83.3%) | 62 (16.7%) |
| Computers & Mathematics | 141 (80.1%) | 35 (19.9%) |
| Architecture & Engineering | 113 (93.4%) | 8 (6.6%) |
| Life, Physical & Social Science | 55 (74.3%) | 19 (25.7%) |
| Community & Social Service | 476 (34.2%) | 917 (65.8%) |
| Education, Arts & Media | 118 (40.1%) | 176 (59.9%) |
| Legal Services & Support | 37 (57.8%) | 27 (42.2%) |
| Education Instruction & Library | 257 (28.4%) | 649 (71.6%) |
| Arts, Media & Entertainment | 64 (49.6%) | 65 (50.4%) |
| Health Diagnosing & Treating | 170 (18.7%) | 739 (81.3%) |
| Health Technologists | 112 (18.6%) | 491 (81.4%) |
| Total (Category) | 1,814 (40.9%) | 2,618 (59.1%) |
| Total (Overall) | 7,554 (52.8%) | 6,738 (47.1%) |
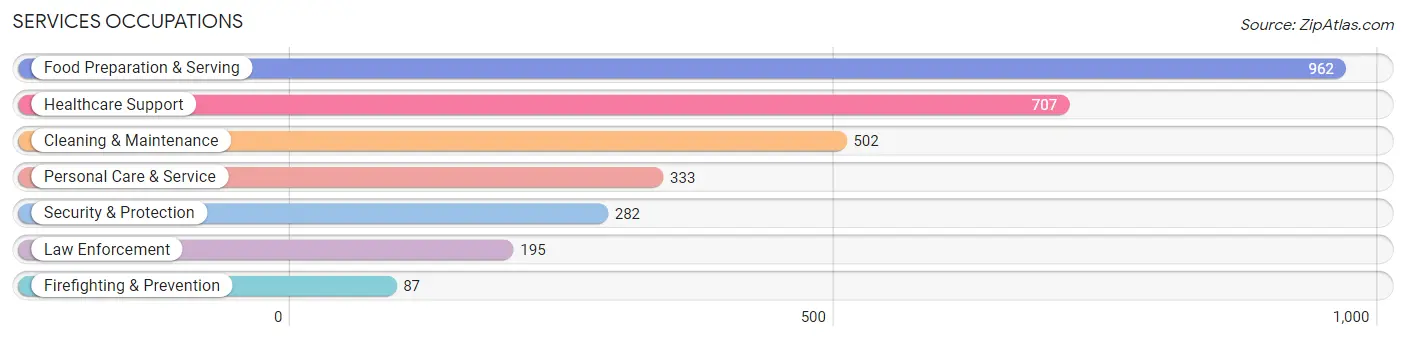
Services Occupations
The most common Services occupations in Morgan County are Food Preparation & Serving (962 | 6.7%), Healthcare Support (707 | 5.0%), Cleaning & Maintenance (502 | 3.5%), Personal Care & Service (333 | 2.3%), and Security & Protection (282 | 2.0%).
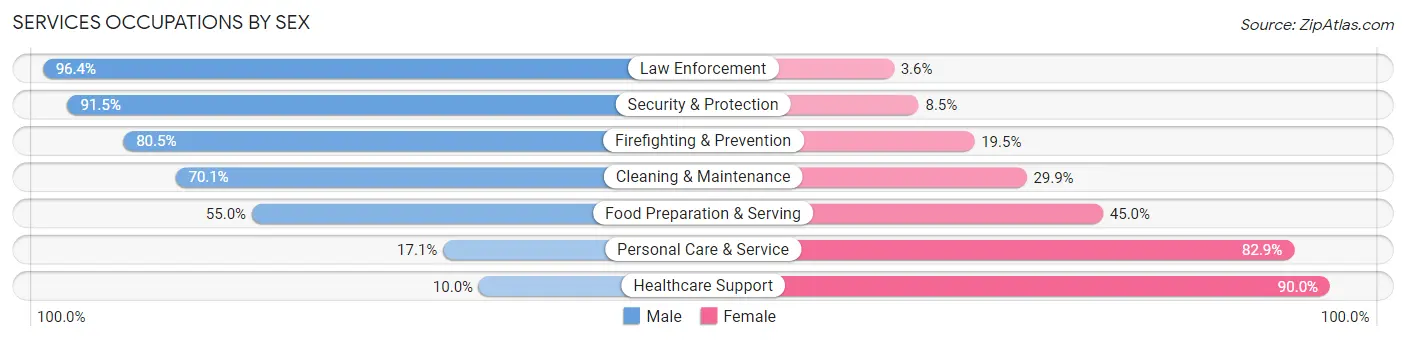
Services Occupations by Sex
Within the Services occupations in Morgan County, the most male-oriented occupations are Law Enforcement (96.4%), Security & Protection (91.5%), and Firefighting & Prevention (80.5%), while the most female-oriented occupations are Healthcare Support (90.0%), Personal Care & Service (82.9%), and Food Preparation & Serving (45.0%).
| Occupation | Male | Female |
| Healthcare Support | 71 (10.0%) | 636 (90.0%) |
| Security & Protection | 258 (91.5%) | 24 (8.5%) |
| Firefighting & Prevention | 70 (80.5%) | 17 (19.5%) |
| Law Enforcement | 188 (96.4%) | 7 (3.6%) |
| Food Preparation & Serving | 529 (55.0%) | 433 (45.0%) |
| Cleaning & Maintenance | 352 (70.1%) | 150 (29.9%) |
| Personal Care & Service | 57 (17.1%) | 276 (82.9%) |
| Total (Category) | 1,267 (45.5%) | 1,519 (54.5%) |
| Total (Overall) | 7,554 (52.8%) | 6,738 (47.1%) |
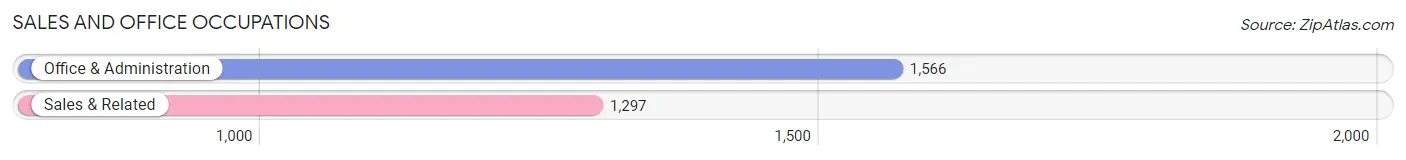
Sales and Office Occupations
The most common Sales and Office occupations in Morgan County are Office & Administration (1,566 | 11.0%), and Sales & Related (1,297 | 9.1%).
Sales and Office Occupations by Sex
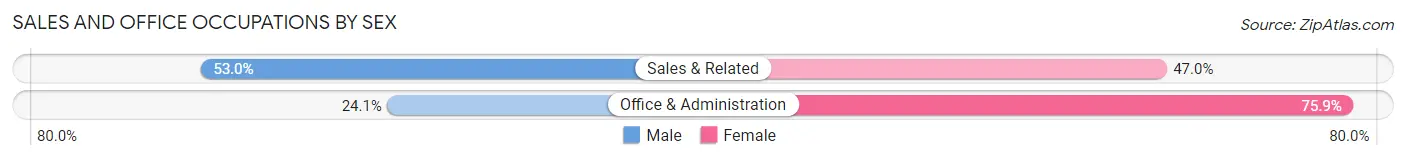
| Occupation | Male | Female |
| Sales & Related | 687 (53.0%) | 610 (47.0%) |
| Office & Administration | 378 (24.1%) | 1,188 (75.9%) |
| Total (Category) | 1,065 (37.2%) | 1,798 (62.8%) |
| Total (Overall) | 7,554 (52.8%) | 6,738 (47.1%) |
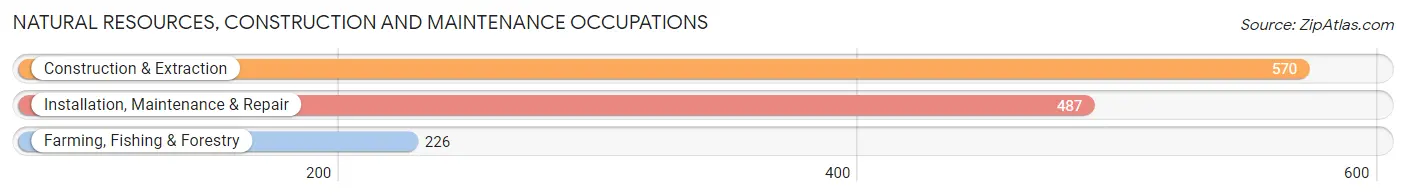
Natural Resources, Construction and Maintenance Occupations
The most common Natural Resources, Construction and Maintenance occupations in Morgan County are Construction & Extraction (570 | 4.0%), Installation, Maintenance & Repair (487 | 3.4%), and Farming, Fishing & Forestry (226 | 1.6%).
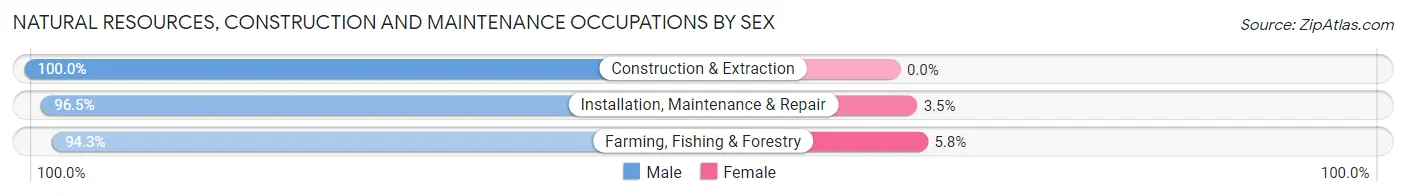
Natural Resources, Construction and Maintenance Occupations by Sex
| Occupation | Male | Female |
| Farming, Fishing & Forestry | 213 (94.3%) | 13 (5.8%) |
| Construction & Extraction | 570 (100.0%) | 0 (0.0%) |
| Installation, Maintenance & Repair | 470 (96.5%) | 17 (3.5%) |
| Total (Category) | 1,253 (97.7%) | 30 (2.3%) |
| Total (Overall) | 7,554 (52.8%) | 6,738 (47.1%) |
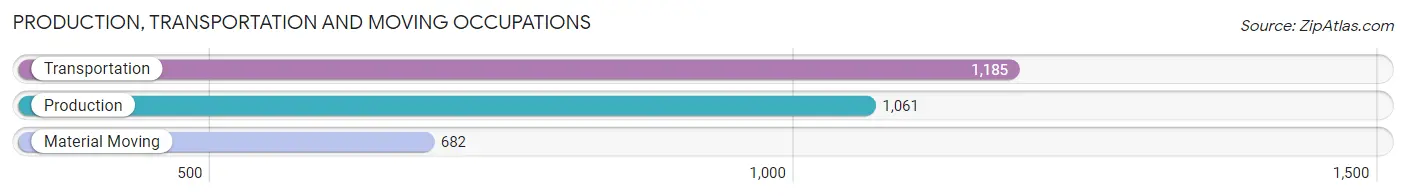
Production, Transportation and Moving Occupations
The most common Production, Transportation and Moving occupations in Morgan County are Transportation (1,185 | 8.3%), Production (1,061 | 7.4%), and Material Moving (682 | 4.8%).
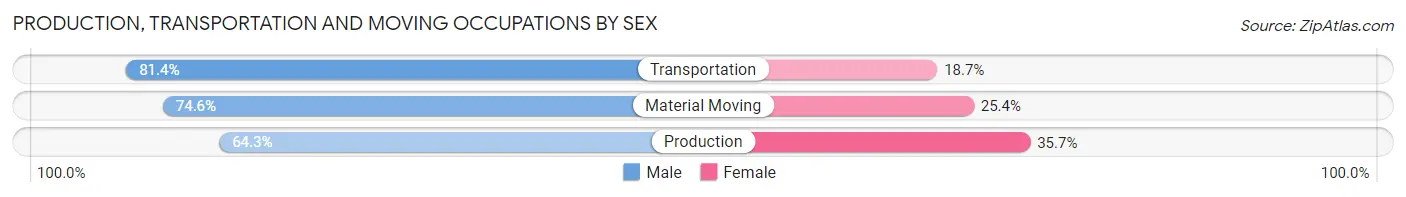
Production, Transportation and Moving Occupations by Sex
| Occupation | Male | Female |
| Production | 682 (64.3%) | 379 (35.7%) |
| Transportation | 964 (81.4%) | 221 (18.6%) |
| Material Moving | 509 (74.6%) | 173 (25.4%) |
| Total (Category) | 2,155 (73.6%) | 773 (26.4%) |
| Total (Overall) | 7,554 (52.8%) | 6,738 (47.1%) |
Employment Industries by Sex in Morgan County
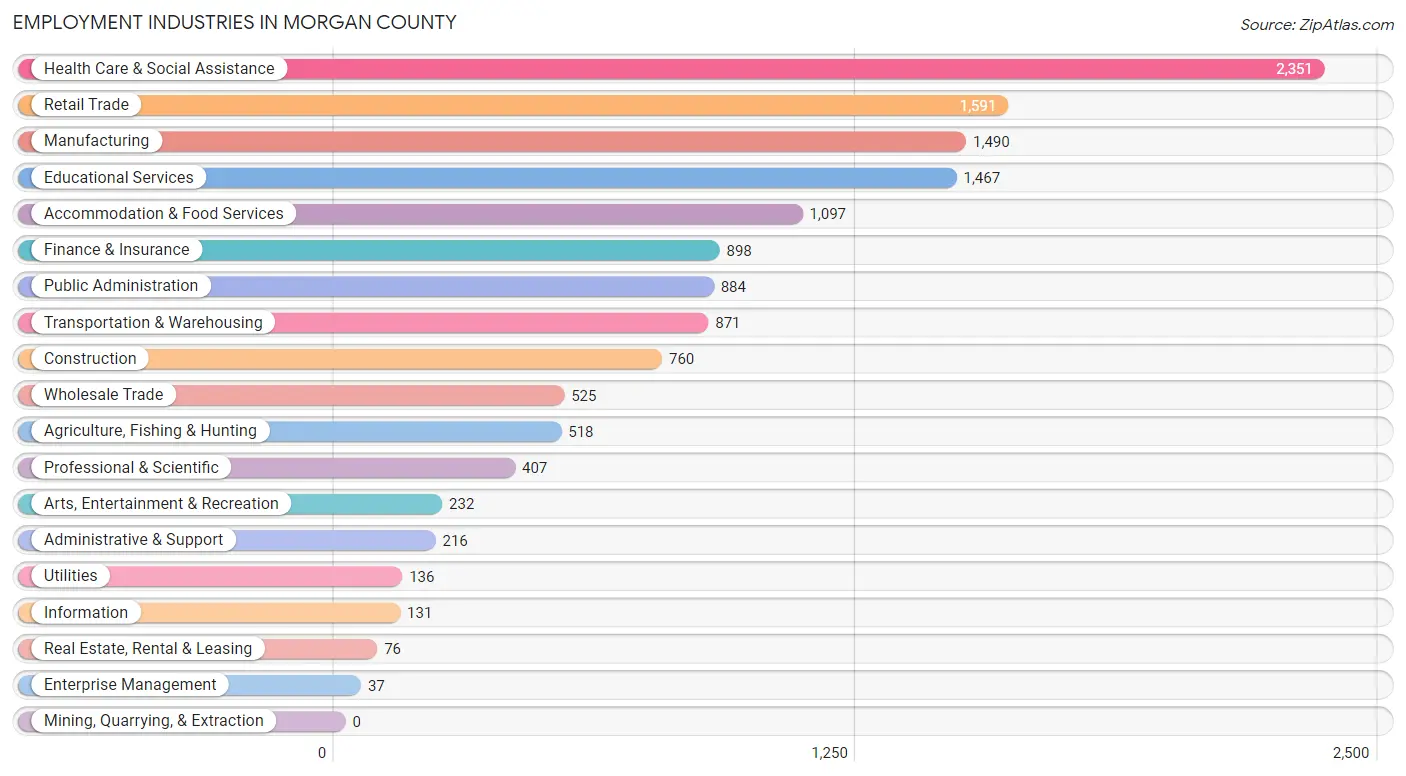
Employment Industries in Morgan County
The major employment industries in Morgan County include Health Care & Social Assistance (2,351 | 16.5%), Retail Trade (1,591 | 11.1%), Manufacturing (1,490 | 10.4%), Educational Services (1,467 | 10.3%), and Accommodation & Food Services (1,097 | 7.7%).
Employment Industries by Sex in Morgan County
The Morgan County industries that see more men than women are Construction (94.9%), Transportation & Warehousing (93.7%), and Agriculture, Fishing & Hunting (91.9%), whereas the industries that tend to have a higher number of women are Enterprise Management (100.0%), Health Care & Social Assistance (79.9%), and Finance & Insurance (79.3%).
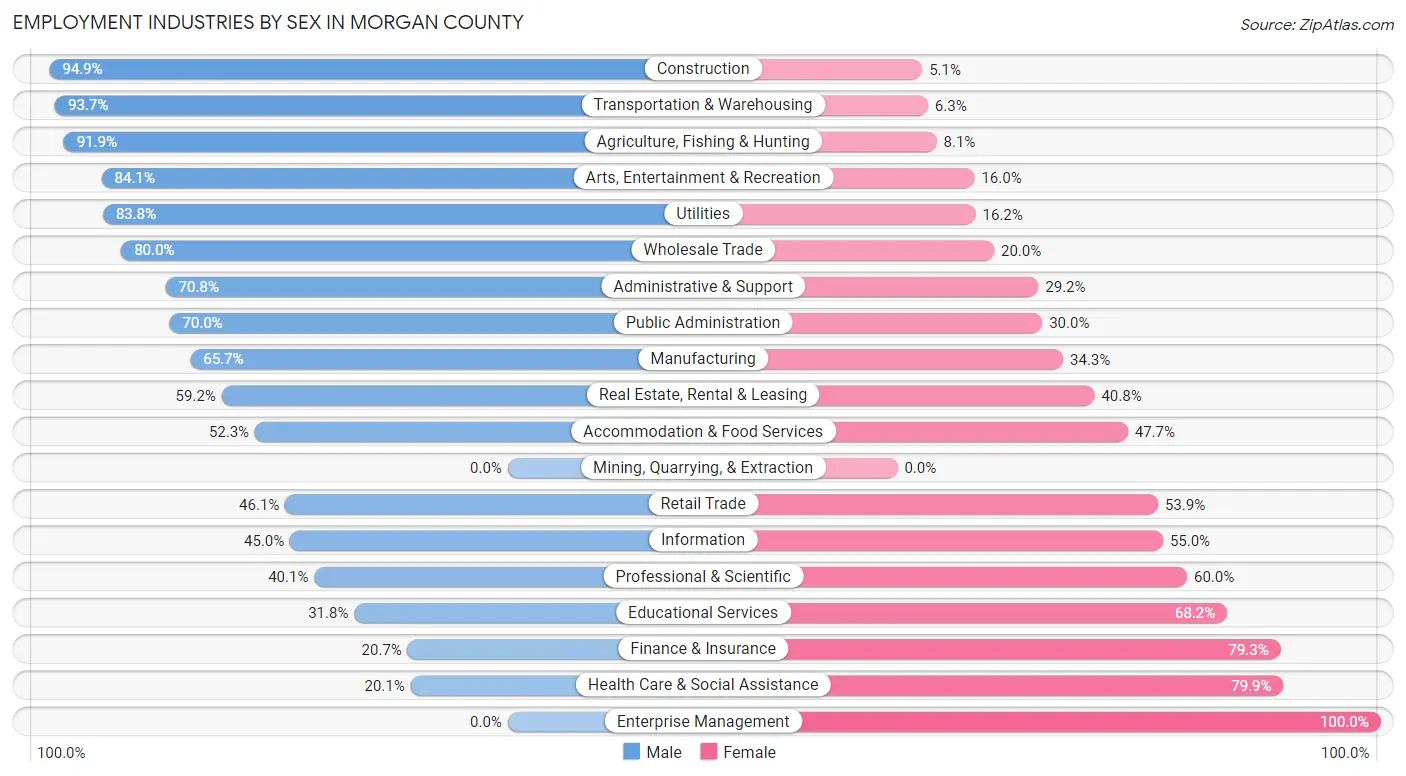
| Industry | Male | Female |
| Agriculture, Fishing & Hunting | 476 (91.9%) | 42 (8.1%) |
| Mining, Quarrying, & Extraction | 0 (0.0%) | 0 (0.0%) |
| Construction | 721 (94.9%) | 39 (5.1%) |
| Manufacturing | 979 (65.7%) | 511 (34.3%) |
| Wholesale Trade | 420 (80.0%) | 105 (20.0%) |
| Retail Trade | 733 (46.1%) | 858 (53.9%) |
| Transportation & Warehousing | 816 (93.7%) | 55 (6.3%) |
| Utilities | 114 (83.8%) | 22 (16.2%) |
| Information | 59 (45.0%) | 72 (55.0%) |
| Finance & Insurance | 186 (20.7%) | 712 (79.3%) |
| Real Estate, Rental & Leasing | 45 (59.2%) | 31 (40.8%) |
| Professional & Scientific | 163 (40.1%) | 244 (60.0%) |
| Enterprise Management | 0 (0.0%) | 37 (100.0%) |
| Administrative & Support | 153 (70.8%) | 63 (29.2%) |
| Educational Services | 466 (31.8%) | 1,001 (68.2%) |
| Health Care & Social Assistance | 473 (20.1%) | 1,878 (79.9%) |
| Arts, Entertainment & Recreation | 195 (84.1%) | 37 (16.0%) |
| Accommodation & Food Services | 574 (52.3%) | 523 (47.7%) |
| Public Administration | 619 (70.0%) | 265 (30.0%) |
| Total | 7,554 (52.8%) | 6,738 (47.1%) |
Education in Morgan County
School Enrollment in Morgan County
The most common levels of schooling among the 6,911 students in Morgan County are middle school (1,693 | 24.5%), high school (1,596 | 23.1%), and college / undergraduate (1,579 | 22.9%).
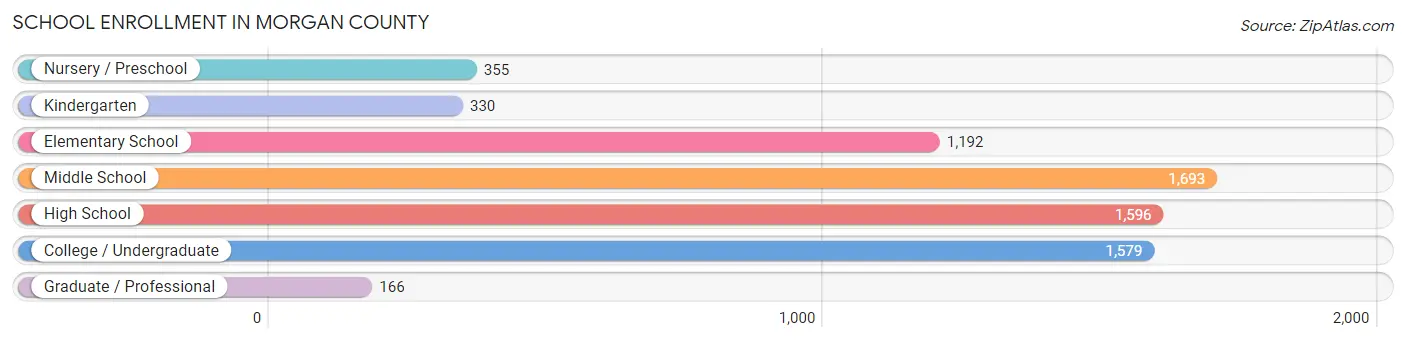
| School Level | # Students | % Students |
| Nursery / Preschool | 355 | 5.1% |
| Kindergarten | 330 | 4.8% |
| Elementary School | 1,192 | 17.2% |
| Middle School | 1,693 | 24.5% |
| High School | 1,596 | 23.1% |
| College / Undergraduate | 1,579 | 22.9% |
| Graduate / Professional | 166 | 2.4% |
| Total | 6,911 | 100.0% |
School Enrollment by Age by Funding Source in Morgan County
Out of a total of 6,911 students who are enrolled in schools in Morgan County, 1,437 (20.8%) attend a private institution, while the remaining 5,474 (79.2%) are enrolled in public schools. The age group of 25 to 34 year olds has the highest likelihood of being enrolled in private schools, with 99 (49.7% in the age bracket) enrolled. Conversely, the age group of 10 to 14 year olds has the lowest likelihood of being enrolled in a private school, with 1,810 (94.1% in the age bracket) attending a public institution.
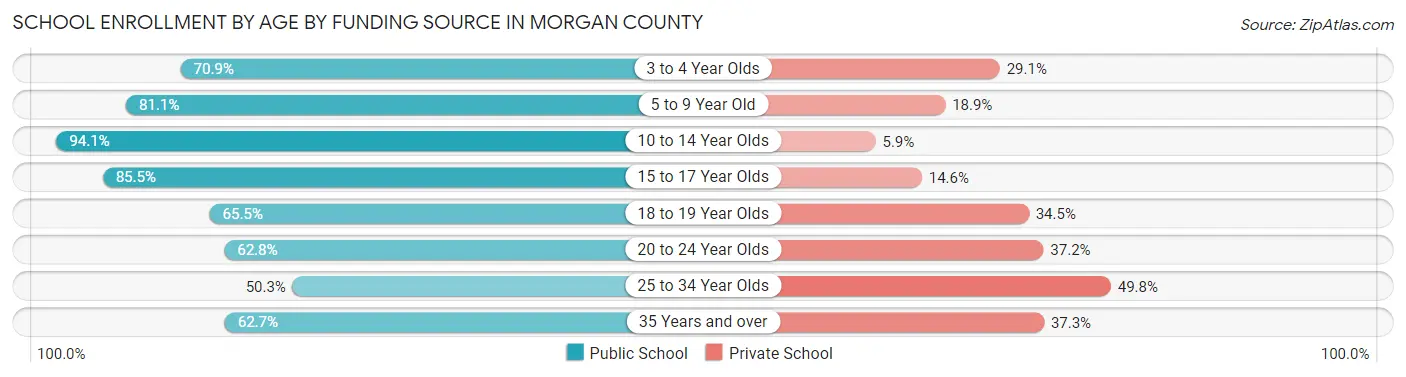
| Age Bracket | Public School | Private School |
| 3 to 4 Year Olds | 183 (70.9%) | 75 (29.1%) |
| 5 to 9 Year Old | 1,235 (81.1%) | 288 (18.9%) |
| 10 to 14 Year Olds | 1,810 (94.1%) | 114 (5.9%) |
| 15 to 17 Year Olds | 875 (85.5%) | 149 (14.5%) |
| 18 to 19 Year Olds | 597 (65.5%) | 314 (34.5%) |
| 20 to 24 Year Olds | 520 (62.8%) | 308 (37.2%) |
| 25 to 34 Year Olds | 100 (50.2%) | 99 (49.7%) |
| 35 Years and over | 153 (62.7%) | 91 (37.3%) |
| Total | 5,474 (79.2%) | 1,437 (20.8%) |
Educational Attainment by Field of Study in Morgan County
Education (1,151 | 20.9%), business (936 | 17.0%), science & technology (869 | 15.8%), bio, nature & agricultural (536 | 9.8%), and arts & humanities (525 | 9.6%) are the most common fields of study among 5,500 individuals in Morgan County who have obtained a bachelor's degree or higher.
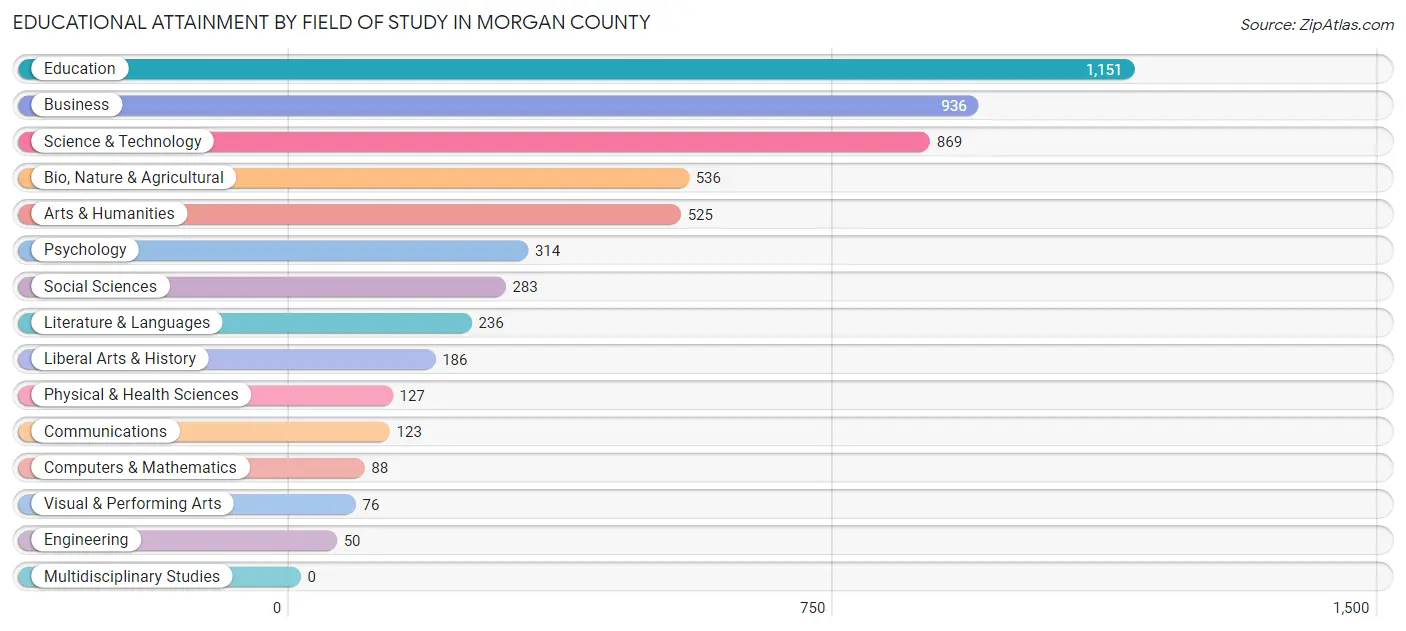
| Field of Study | # Graduates | % Graduates |
| Computers & Mathematics | 88 | 1.6% |
| Bio, Nature & Agricultural | 536 | 9.8% |
| Physical & Health Sciences | 127 | 2.3% |
| Psychology | 314 | 5.7% |
| Social Sciences | 283 | 5.1% |
| Engineering | 50 | 0.9% |
| Multidisciplinary Studies | 0 | 0.0% |
| Science & Technology | 869 | 15.8% |
| Business | 936 | 17.0% |
| Education | 1,151 | 20.9% |
| Literature & Languages | 236 | 4.3% |
| Liberal Arts & History | 186 | 3.4% |
| Visual & Performing Arts | 76 | 1.4% |
| Communications | 123 | 2.2% |
| Arts & Humanities | 525 | 9.6% |
| Total | 5,500 | 100.0% |
Transportation & Commute in Morgan County
Vehicle Availability by Sex in Morgan County
The most prevalent vehicle ownership categories in Morgan County are males with 2 vehicles (3,407, accounting for 46.1%) and females with 2 vehicles (2,795, making up 52.0%).
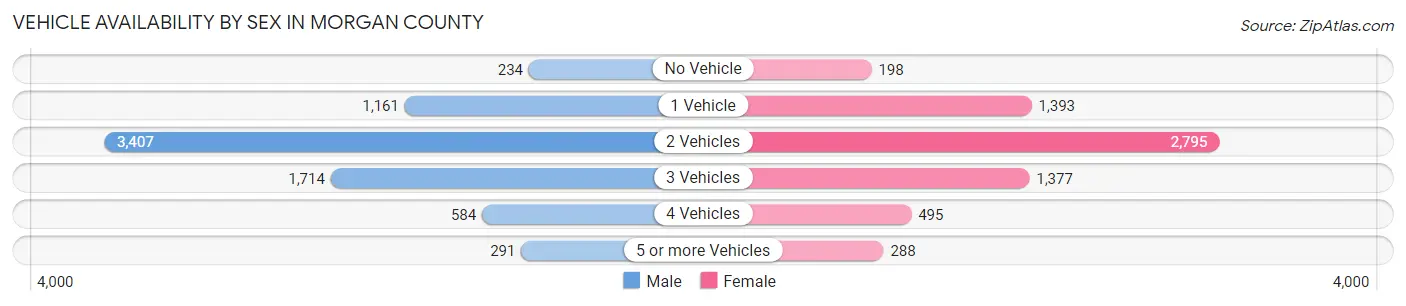
| Vehicles Available | Male | Female |
| No Vehicle | 234 (3.2%) | 198 (3.0%) |
| 1 Vehicle | 1,161 (15.7%) | 1,393 (21.3%) |
| 2 Vehicles | 3,407 (46.1%) | 2,795 (42.7%) |
| 3 Vehicles | 1,714 (23.2%) | 1,377 (21.0%) |
| 4 Vehicles | 584 (7.9%) | 495 (7.6%) |
| 5 or more Vehicles | 291 (3.9%) | 288 (4.4%) |
| Total | 7,391 (100.0%) | 6,546 (100.0%) |
Commute Time in Morgan County
The most frequently occuring commute durations in Morgan County are 5 to 9 minutes (2,803 commuters, 21.4%), 10 to 14 minutes (2,750 commuters, 21.0%), and 15 to 19 minutes (1,635 commuters, 12.5%).
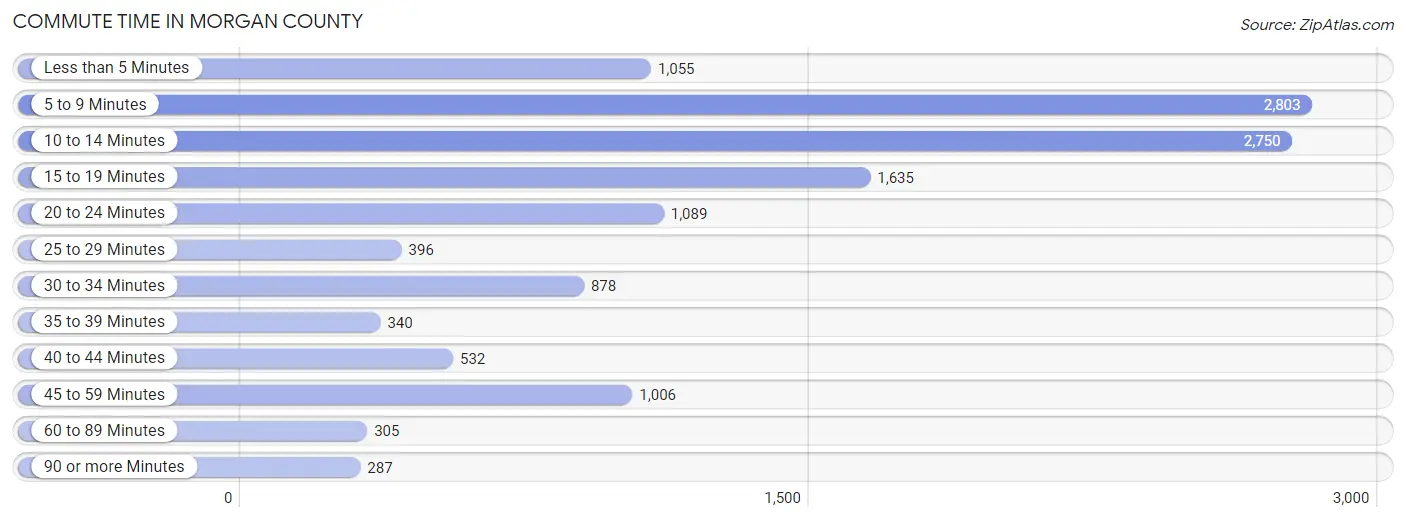
| Commute Time | # Commuters | % Commuters |
| Less than 5 Minutes | 1,055 | 8.1% |
| 5 to 9 Minutes | 2,803 | 21.4% |
| 10 to 14 Minutes | 2,750 | 21.0% |
| 15 to 19 Minutes | 1,635 | 12.5% |
| 20 to 24 Minutes | 1,089 | 8.3% |
| 25 to 29 Minutes | 396 | 3.0% |
| 30 to 34 Minutes | 878 | 6.7% |
| 35 to 39 Minutes | 340 | 2.6% |
| 40 to 44 Minutes | 532 | 4.1% |
| 45 to 59 Minutes | 1,006 | 7.7% |
| 60 to 89 Minutes | 305 | 2.3% |
| 90 or more Minutes | 287 | 2.2% |
Commute Time by Sex in Morgan County
The most common commute times in Morgan County are 5 to 9 minutes (1,403 commuters, 20.1%) for males and 5 to 9 minutes (1,400 commuters, 23.0%) for females.
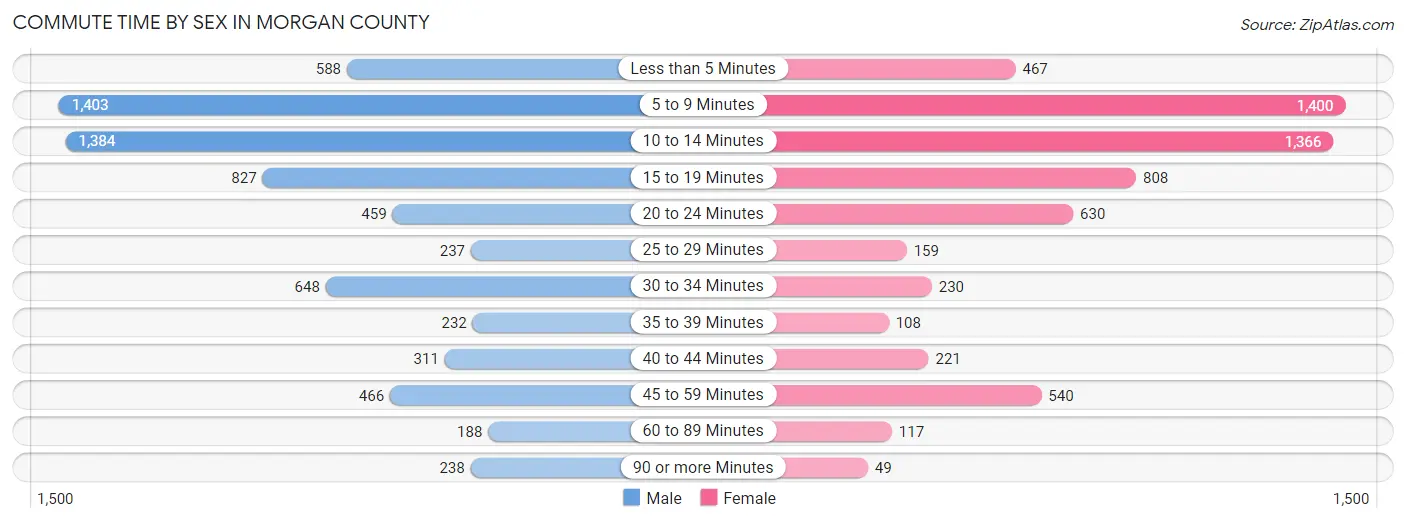
| Commute Time | Male | Female |
| Less than 5 Minutes | 588 (8.4%) | 467 (7.7%) |
| 5 to 9 Minutes | 1,403 (20.1%) | 1,400 (23.0%) |
| 10 to 14 Minutes | 1,384 (19.8%) | 1,366 (22.4%) |
| 15 to 19 Minutes | 827 (11.8%) | 808 (13.3%) |
| 20 to 24 Minutes | 459 (6.6%) | 630 (10.3%) |
| 25 to 29 Minutes | 237 (3.4%) | 159 (2.6%) |
| 30 to 34 Minutes | 648 (9.3%) | 230 (3.8%) |
| 35 to 39 Minutes | 232 (3.3%) | 108 (1.8%) |
| 40 to 44 Minutes | 311 (4.4%) | 221 (3.6%) |
| 45 to 59 Minutes | 466 (6.7%) | 540 (8.9%) |
| 60 to 89 Minutes | 188 (2.7%) | 117 (1.9%) |
| 90 or more Minutes | 238 (3.4%) | 49 (0.8%) |
Time of Departure to Work by Sex in Morgan County
The most frequent times of departure to work in Morgan County are 7:00 AM to 7:29 AM (1,005, 14.4%) for males and 7:30 AM to 7:59 AM (1,156, 19.0%) for females.
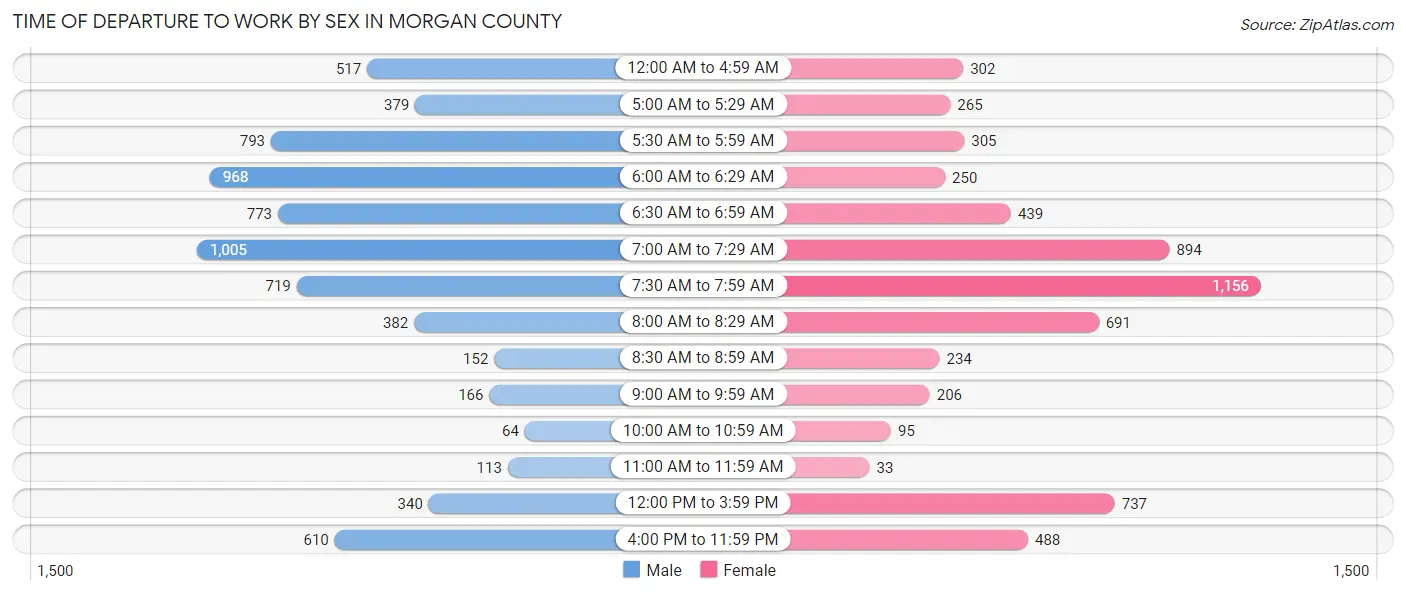
| Time of Departure | Male | Female |
| 12:00 AM to 4:59 AM | 517 (7.4%) | 302 (5.0%) |
| 5:00 AM to 5:29 AM | 379 (5.4%) | 265 (4.3%) |
| 5:30 AM to 5:59 AM | 793 (11.4%) | 305 (5.0%) |
| 6:00 AM to 6:29 AM | 968 (13.9%) | 250 (4.1%) |
| 6:30 AM to 6:59 AM | 773 (11.1%) | 439 (7.2%) |
| 7:00 AM to 7:29 AM | 1,005 (14.4%) | 894 (14.7%) |
| 7:30 AM to 7:59 AM | 719 (10.3%) | 1,156 (19.0%) |
| 8:00 AM to 8:29 AM | 382 (5.5%) | 691 (11.3%) |
| 8:30 AM to 8:59 AM | 152 (2.2%) | 234 (3.8%) |
| 9:00 AM to 9:59 AM | 166 (2.4%) | 206 (3.4%) |
| 10:00 AM to 10:59 AM | 64 (0.9%) | 95 (1.6%) |
| 11:00 AM to 11:59 AM | 113 (1.6%) | 33 (0.5%) |
| 12:00 PM to 3:59 PM | 340 (4.9%) | 737 (12.1%) |
| 4:00 PM to 11:59 PM | 610 (8.7%) | 488 (8.0%) |
| Total | 6,981 (100.0%) | 6,095 (100.0%) |
Housing Occupancy in Morgan County
Occupancy by Ownership in Morgan County
Of the total 13,293 dwellings in Morgan County, owner-occupied units account for 9,439 (71.0%), while renter-occupied units make up 3,854 (29.0%).
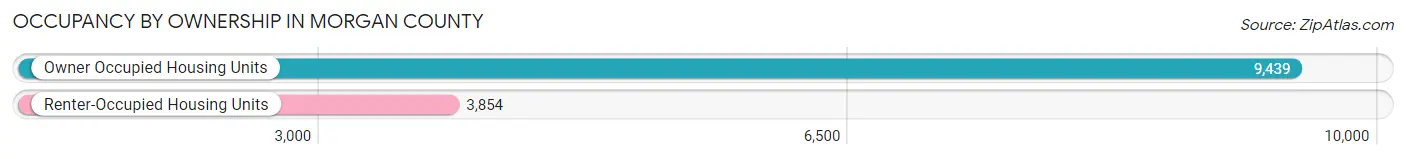
| Occupancy | # Housing Units | % Housing Units |
| Owner Occupied Housing Units | 9,439 | 71.0% |
| Renter-Occupied Housing Units | 3,854 | 29.0% |
| Total Occupied Housing Units | 13,293 | 100.0% |
Occupancy by Household Size in Morgan County
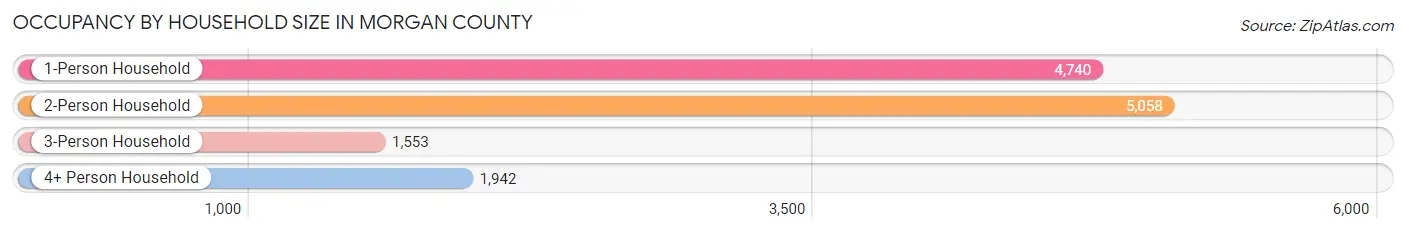
| Household Size | # Housing Units | % Housing Units |
| 1-Person Household | 4,740 | 35.7% |
| 2-Person Household | 5,058 | 38.1% |
| 3-Person Household | 1,553 | 11.7% |
| 4+ Person Household | 1,942 | 14.6% |
| Total Housing Units | 13,293 | 100.0% |
Occupancy by Ownership by Household Size in Morgan County
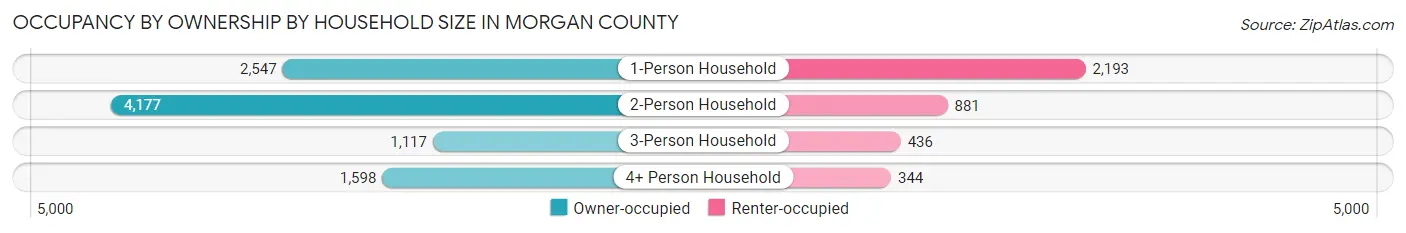
| Household Size | Owner-occupied | Renter-occupied |
| 1-Person Household | 2,547 (53.7%) | 2,193 (46.3%) |
| 2-Person Household | 4,177 (82.6%) | 881 (17.4%) |
| 3-Person Household | 1,117 (71.9%) | 436 (28.1%) |
| 4+ Person Household | 1,598 (82.3%) | 344 (17.7%) |
| Total Housing Units | 9,439 (71.0%) | 3,854 (29.0%) |
Occupancy by Educational Attainment in Morgan County
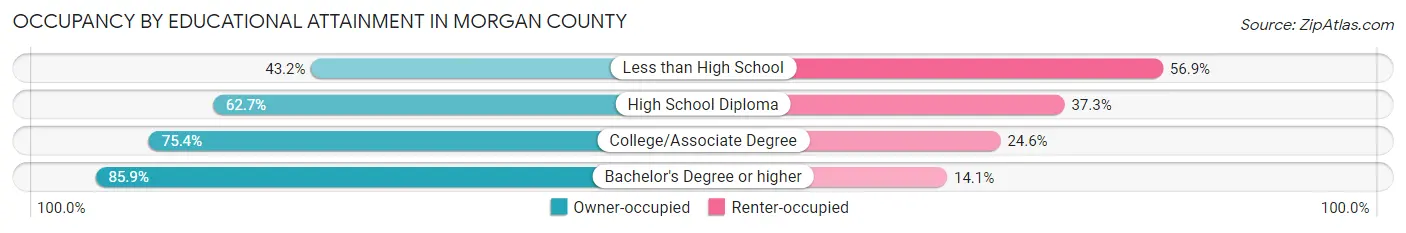
| Household Size | Owner-occupied | Renter-occupied |
| Less than High School | 435 (43.1%) | 573 (56.9%) |
| High School Diploma | 3,021 (62.7%) | 1,800 (37.3%) |
| College/Associate Degree | 3,073 (75.4%) | 1,005 (24.6%) |
| Bachelor's Degree or higher | 2,910 (85.9%) | 476 (14.1%) |
Occupancy by Age of Householder in Morgan County
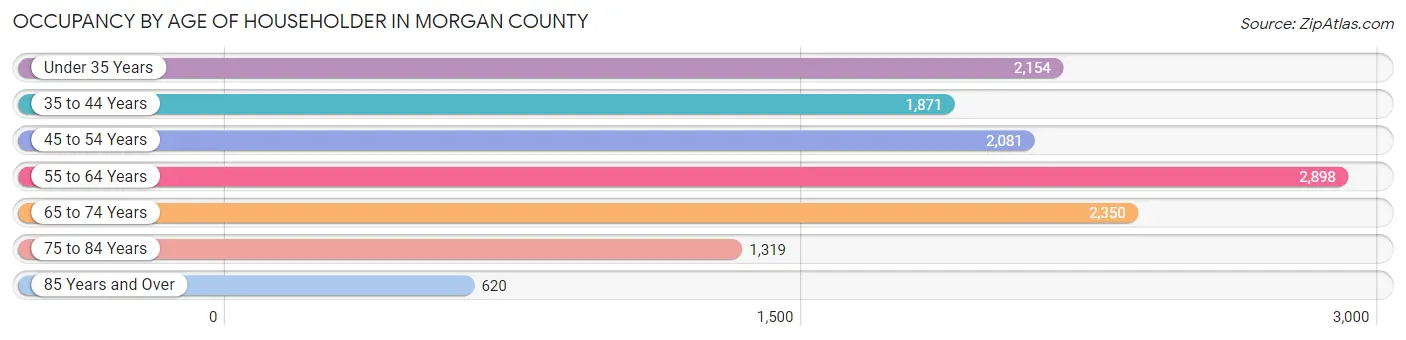
| Age Bracket | # Households | % Households |
| Under 35 Years | 2,154 | 16.2% |
| 35 to 44 Years | 1,871 | 14.1% |
| 45 to 54 Years | 2,081 | 15.7% |
| 55 to 64 Years | 2,898 | 21.8% |
| 65 to 74 Years | 2,350 | 17.7% |
| 75 to 84 Years | 1,319 | 9.9% |
| 85 Years and Over | 620 | 4.7% |
| Total | 13,293 | 100.0% |
Housing Finances in Morgan County
Median Income by Occupancy in Morgan County
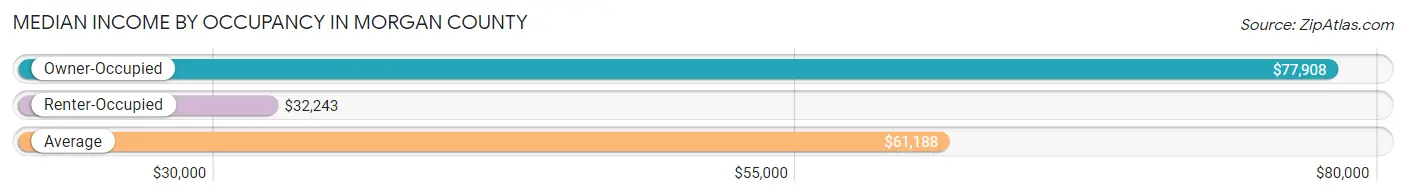
| Occupancy Type | # Households | Median Income |
| Owner-Occupied | 9,439 (71.0%) | $77,908 |
| Renter-Occupied | 3,854 (29.0%) | $32,243 |
| Average | 13,293 (100.0%) | $61,188 |
Occupancy by Householder Income Bracket in Morgan County
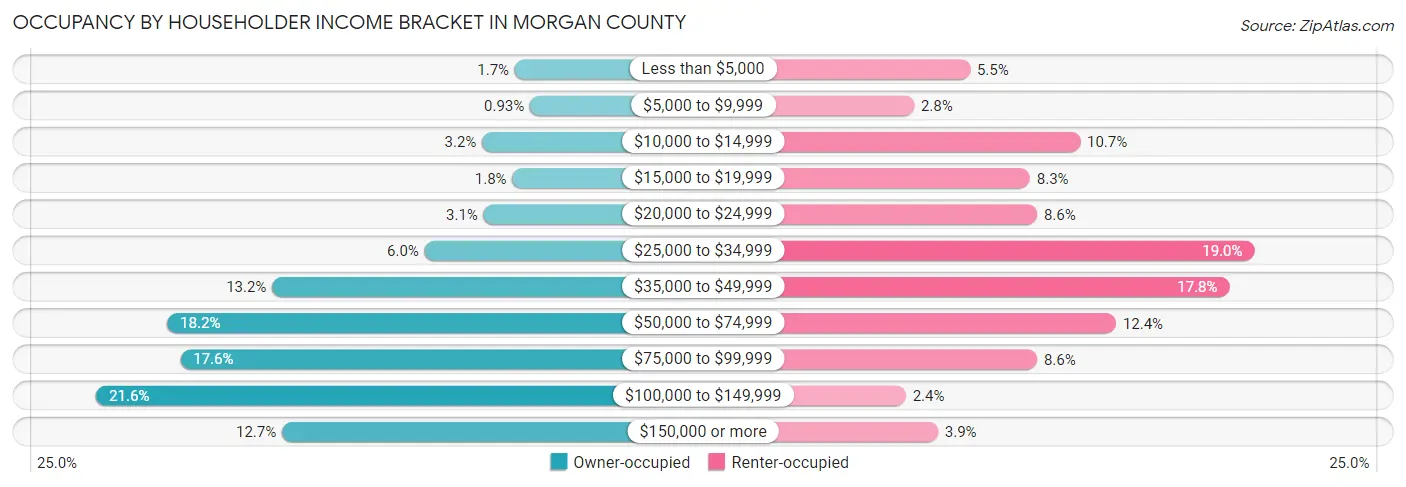
| Income Bracket | Owner-occupied | Renter-occupied |
| Less than $5,000 | 156 (1.7%) | 210 (5.4%) |
| $5,000 to $9,999 | 88 (0.9%) | 107 (2.8%) |
| $10,000 to $14,999 | 303 (3.2%) | 412 (10.7%) |
| $15,000 to $19,999 | 167 (1.8%) | 320 (8.3%) |
| $20,000 to $24,999 | 296 (3.1%) | 333 (8.6%) |
| $25,000 to $34,999 | 562 (5.9%) | 732 (19.0%) |
| $35,000 to $49,999 | 1,247 (13.2%) | 686 (17.8%) |
| $50,000 to $74,999 | 1,719 (18.2%) | 478 (12.4%) |
| $75,000 to $99,999 | 1,660 (17.6%) | 333 (8.6%) |
| $100,000 to $149,999 | 2,038 (21.6%) | 92 (2.4%) |
| $150,000 or more | 1,203 (12.7%) | 151 (3.9%) |
| Total | 9,439 (100.0%) | 3,854 (100.0%) |
Monthly Housing Cost Tiers in Morgan County
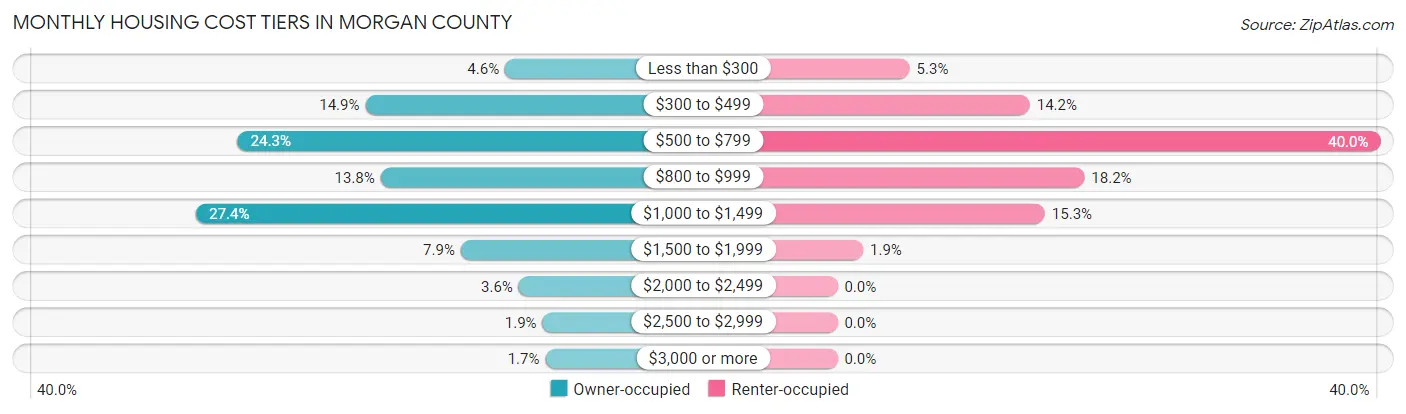
| Monthly Cost | Owner-occupied | Renter-occupied |
| Less than $300 | 436 (4.6%) | 205 (5.3%) |
| $300 to $499 | 1,407 (14.9%) | 546 (14.2%) |
| $500 to $799 | 2,295 (24.3%) | 1,541 (40.0%) |
| $800 to $999 | 1,301 (13.8%) | 701 (18.2%) |
| $1,000 to $1,499 | 2,583 (27.4%) | 589 (15.3%) |
| $1,500 to $1,999 | 744 (7.9%) | 73 (1.9%) |
| $2,000 to $2,499 | 341 (3.6%) | 0 (0.0%) |
| $2,500 to $2,999 | 176 (1.9%) | 0 (0.0%) |
| $3,000 or more | 156 (1.7%) | 0 (0.0%) |
| Total | 9,439 (100.0%) | 3,854 (100.0%) |
Physical Housing Characteristics in Morgan County
Housing Structures in Morgan County

| Structure Type | # Housing Units | % Housing Units |
| Single Unit, Detached | 10,341 | 77.8% |
| Single Unit, Attached | 310 | 2.3% |
| 2 Unit Apartments | 336 | 2.5% |
| 3 or 4 Unit Apartments | 531 | 4.0% |
| 5 to 9 Unit Apartments | 308 | 2.3% |
| 10 or more Apartments | 656 | 4.9% |
| Mobile Home / Other | 811 | 6.1% |
| Total | 13,293 | 100.0% |
Housing Structures by Occupancy in Morgan County
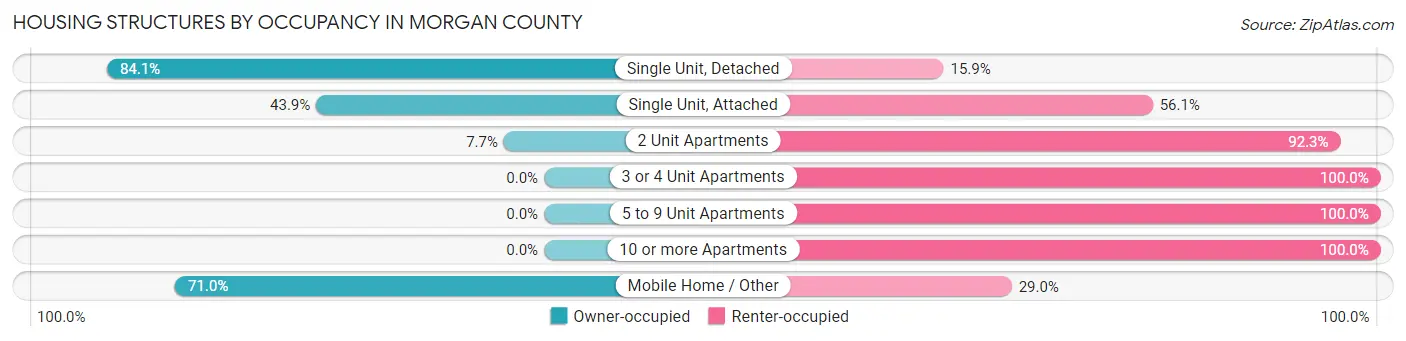
| Structure Type | Owner-occupied | Renter-occupied |
| Single Unit, Detached | 8,701 (84.1%) | 1,640 (15.9%) |
| Single Unit, Attached | 136 (43.9%) | 174 (56.1%) |
| 2 Unit Apartments | 26 (7.7%) | 310 (92.3%) |
| 3 or 4 Unit Apartments | 0 (0.0%) | 531 (100.0%) |
| 5 to 9 Unit Apartments | 0 (0.0%) | 308 (100.0%) |
| 10 or more Apartments | 0 (0.0%) | 656 (100.0%) |
| Mobile Home / Other | 576 (71.0%) | 235 (29.0%) |
| Total | 9,439 (71.0%) | 3,854 (29.0%) |
Housing Structures by Number of Rooms in Morgan County
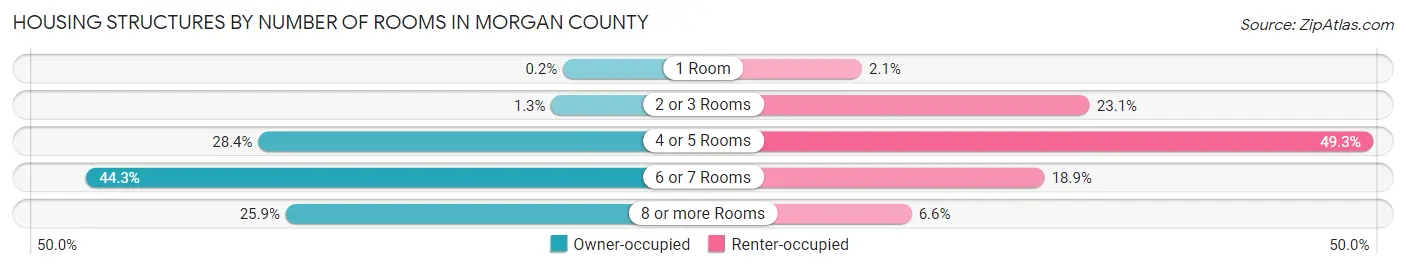
| Number of Rooms | Owner-occupied | Renter-occupied |
| 1 Room | 19 (0.2%) | 79 (2.1%) |
| 2 or 3 Rooms | 121 (1.3%) | 891 (23.1%) |
| 4 or 5 Rooms | 2,679 (28.4%) | 1,898 (49.2%) |
| 6 or 7 Rooms | 4,180 (44.3%) | 730 (18.9%) |
| 8 or more Rooms | 2,440 (25.9%) | 256 (6.6%) |
| Total | 9,439 (100.0%) | 3,854 (100.0%) |
Housing Structure by Heating Type in Morgan County
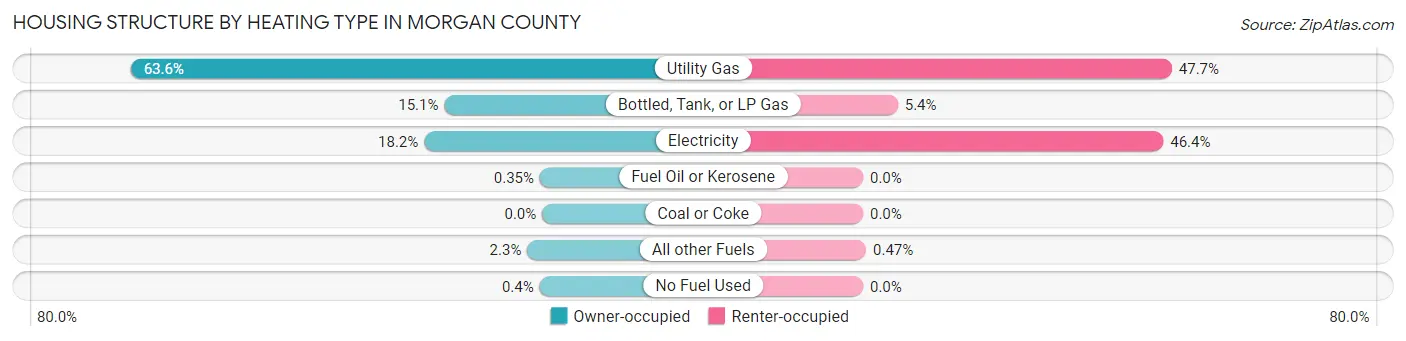
| Heating Type | Owner-occupied | Renter-occupied |
| Utility Gas | 6,002 (63.6%) | 1,840 (47.7%) |
| Bottled, Tank, or LP Gas | 1,427 (15.1%) | 207 (5.4%) |
| Electricity | 1,722 (18.2%) | 1,789 (46.4%) |
| Fuel Oil or Kerosene | 33 (0.4%) | 0 (0.0%) |
| Coal or Coke | 0 (0.0%) | 0 (0.0%) |
| All other Fuels | 217 (2.3%) | 18 (0.5%) |
| No Fuel Used | 38 (0.4%) | 0 (0.0%) |
| Total | 9,439 (100.0%) | 3,854 (100.0%) |
Household Vehicle Usage in Morgan County
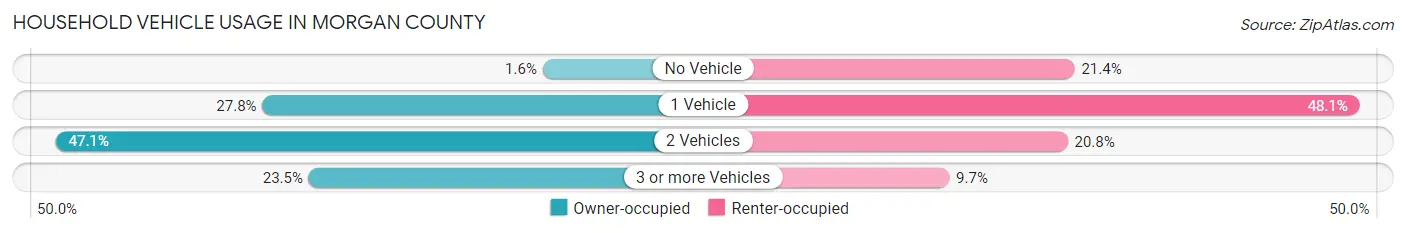
| Vehicles per Household | Owner-occupied | Renter-occupied |
| No Vehicle | 154 (1.6%) | 826 (21.4%) |
| 1 Vehicle | 2,624 (27.8%) | 1,852 (48.0%) |
| 2 Vehicles | 4,446 (47.1%) | 801 (20.8%) |
| 3 or more Vehicles | 2,215 (23.5%) | 375 (9.7%) |
| Total | 9,439 (100.0%) | 3,854 (100.0%) |
Real Estate & Mortgages in Morgan County
Real Estate and Mortgage Overview in Morgan County
| Characteristic | Without Mortgage | With Mortgage |
| Housing Units | 4,009 | 5,430 |
| Median Property Value | $122,900 | $121,500 |
| Median Household Income | $64,436 | $814 |
| Monthly Housing Costs | $542 | $152 |
| Real Estate Taxes | $2,177 | $98 |
Property Value by Mortgage Status in Morgan County
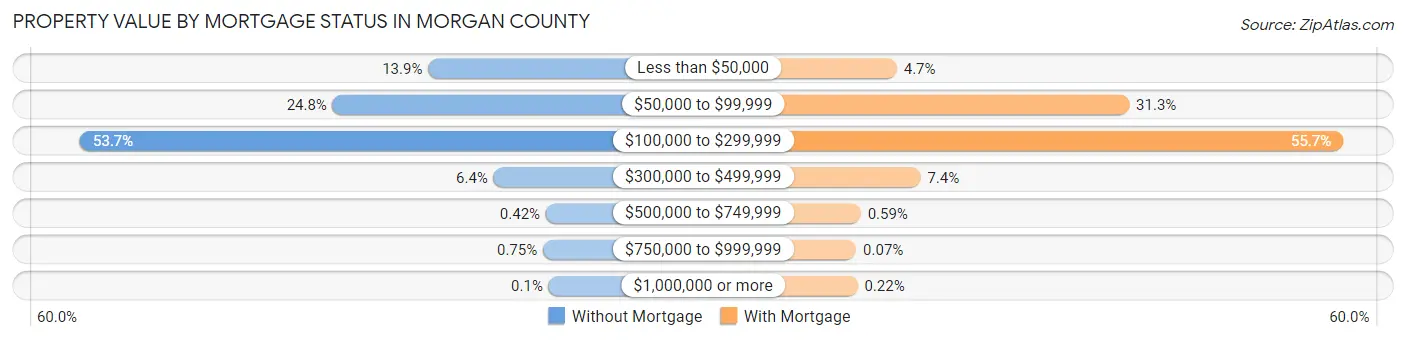
| Property Value | Without Mortgage | With Mortgage |
| Less than $50,000 | 556 (13.9%) | 256 (4.7%) |
| $50,000 to $99,999 | 994 (24.8%) | 1,698 (31.3%) |
| $100,000 to $299,999 | 2,152 (53.7%) | 3,025 (55.7%) |
| $300,000 to $499,999 | 256 (6.4%) | 403 (7.4%) |
| $500,000 to $749,999 | 17 (0.4%) | 32 (0.6%) |
| $750,000 to $999,999 | 30 (0.7%) | 4 (0.1%) |
| $1,000,000 or more | 4 (0.1%) | 12 (0.2%) |
| Total | 4,009 (100.0%) | 5,430 (100.0%) |
Household Income by Mortgage Status in Morgan County
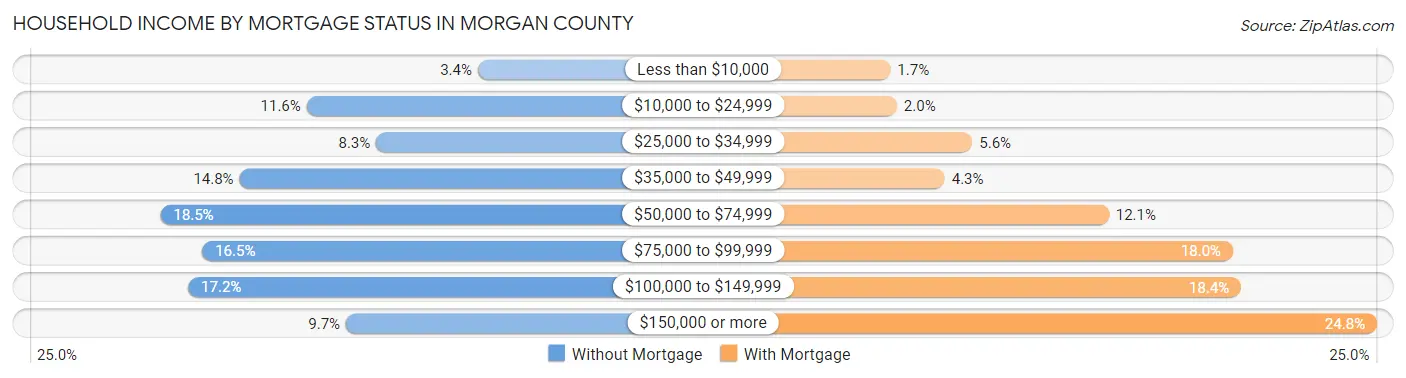
| Household Income | Without Mortgage | With Mortgage |
| Less than $10,000 | 137 (3.4%) | 90 (1.7%) |
| $10,000 to $24,999 | 464 (11.6%) | 107 (2.0%) |
| $25,000 to $34,999 | 331 (8.3%) | 302 (5.6%) |
| $35,000 to $49,999 | 592 (14.8%) | 231 (4.3%) |
| $50,000 to $74,999 | 743 (18.5%) | 655 (12.1%) |
| $75,000 to $99,999 | 663 (16.5%) | 976 (18.0%) |
| $100,000 to $149,999 | 690 (17.2%) | 997 (18.4%) |
| $150,000 or more | 389 (9.7%) | 1,348 (24.8%) |
| Total | 4,009 (100.0%) | 5,430 (100.0%) |
Property Value to Household Income Ratio in Morgan County
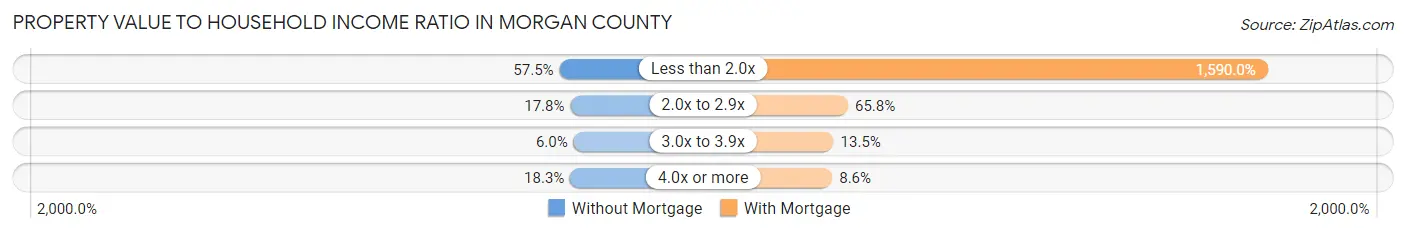
| Value-to-Income Ratio | Without Mortgage | With Mortgage |
| Less than 2.0x | 2,305 (57.5%) | 86,337 (1,590.0%) |
| 2.0x to 2.9x | 712 (17.8%) | 3,574 (65.8%) |
| 3.0x to 3.9x | 242 (6.0%) | 733 (13.5%) |
| 4.0x or more | 734 (18.3%) | 468 (8.6%) |
| Total | 4,009 (100.0%) | 5,430 (100.0%) |
Real Estate Taxes by Mortgage Status in Morgan County
| Property Taxes | Without Mortgage | With Mortgage |
| Less than $800 | 722 (18.0%) | 10 (0.2%) |
| $800 to $1,499 | 591 (14.7%) | 243 (4.5%) |
| $800 to $1,499 | 2,579 (64.3%) | 972 (17.9%) |
| Total | 4,009 (100.0%) | 5,430 (100.0%) |
Health & Disability in Morgan County
Health Insurance Coverage by Age in Morgan County
| Age Bracket | With Coverage | Without Coverage |
| Under 6 Years | 1,989 (100.0%) | 0 (0.0%) |
| 6 to 18 Years | 4,744 (99.6%) | 21 (0.4%) |
| 19 to 25 Years | 2,924 (93.3%) | 211 (6.7%) |
| 26 to 34 Years | 2,951 (88.2%) | 396 (11.8%) |
| 35 to 44 Years | 3,254 (92.4%) | 266 (7.6%) |
| 45 to 54 Years | 3,305 (93.6%) | 226 (6.4%) |
| 55 to 64 Years | 4,408 (95.0%) | 234 (5.0%) |
| 65 to 74 Years | 3,682 (99.8%) | 7 (0.2%) |
| 75 Years and older | 2,627 (100.0%) | 0 (0.0%) |
| Total | 29,884 (95.6%) | 1,361 (4.4%) |
Health Insurance Coverage by Citizenship Status in Morgan County
| Citizenship Status | With Coverage | Without Coverage |
| Native Born | 1,989 (100.0%) | 0 (0.0%) |
| Foreign Born, Citizen | 4,744 (99.6%) | 21 (0.4%) |
| Foreign Born, not a Citizen | 2,924 (93.3%) | 211 (6.7%) |
Health Insurance Coverage by Household Income in Morgan County
| Household Income | With Coverage | Without Coverage |
| Under $25,000 | 3,834 (97.9%) | 83 (2.1%) |
| $25,000 to $49,999 | 5,995 (93.8%) | 396 (6.2%) |
| $50,000 to $74,999 | 4,704 (92.7%) | 368 (7.3%) |
| $75,000 to $99,999 | 4,425 (93.7%) | 299 (6.3%) |
| $100,000 and over | 10,065 (98.4%) | 159 (1.6%) |
Public vs Private Health Insurance Coverage by Age in Morgan County
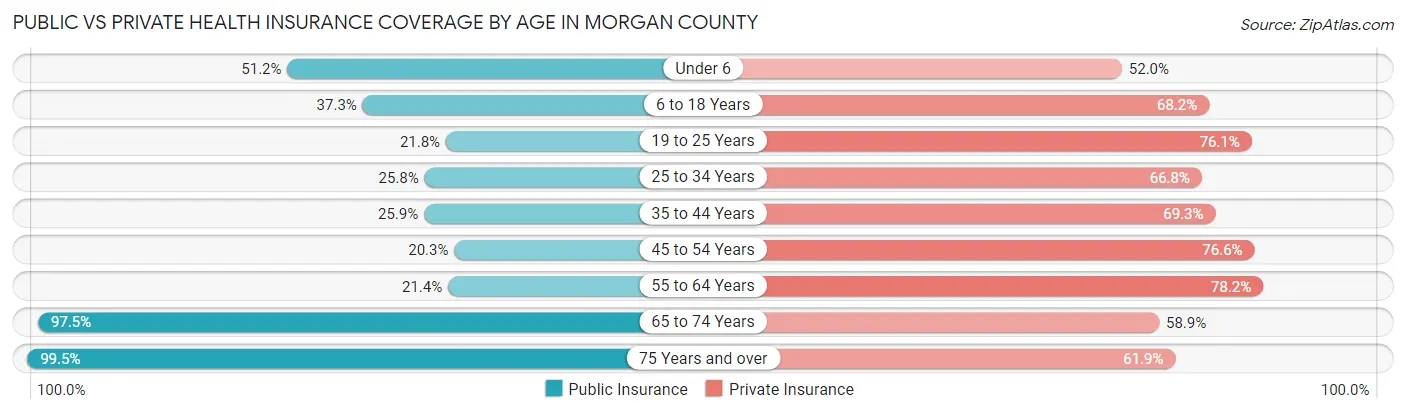
| Age Bracket | Public Insurance | Private Insurance |
| Under 6 | 1,019 (51.2%) | 1,034 (52.0%) |
| 6 to 18 Years | 1,775 (37.2%) | 3,248 (68.2%) |
| 19 to 25 Years | 683 (21.8%) | 2,385 (76.1%) |
| 25 to 34 Years | 862 (25.8%) | 2,236 (66.8%) |
| 35 to 44 Years | 910 (25.9%) | 2,440 (69.3%) |
| 45 to 54 Years | 715 (20.3%) | 2,704 (76.6%) |
| 55 to 64 Years | 994 (21.4%) | 3,630 (78.2%) |
| 65 to 74 Years | 3,598 (97.5%) | 2,172 (58.9%) |
| 75 Years and over | 2,614 (99.5%) | 1,626 (61.9%) |
| Total | 13,170 (42.1%) | 21,475 (68.7%) |
Disability Status by Sex by Age in Morgan County
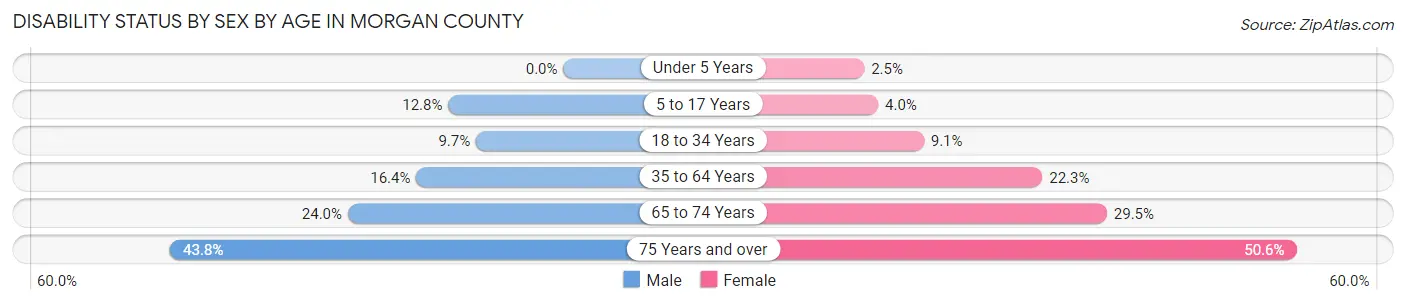
| Age Bracket | Male | Female |
| Under 5 Years | 0 (0.0%) | 24 (2.5%) |
| 5 to 17 Years | 280 (12.8%) | 94 (4.0%) |
| 18 to 34 Years | 341 (9.7%) | 319 (9.1%) |
| 35 to 64 Years | 939 (16.4%) | 1,331 (22.3%) |
| 65 to 74 Years | 426 (24.0%) | 565 (29.5%) |
| 75 Years and over | 480 (43.8%) | 775 (50.6%) |
Disability Class by Sex by Age in Morgan County
Disability Class: Hearing Difficulty
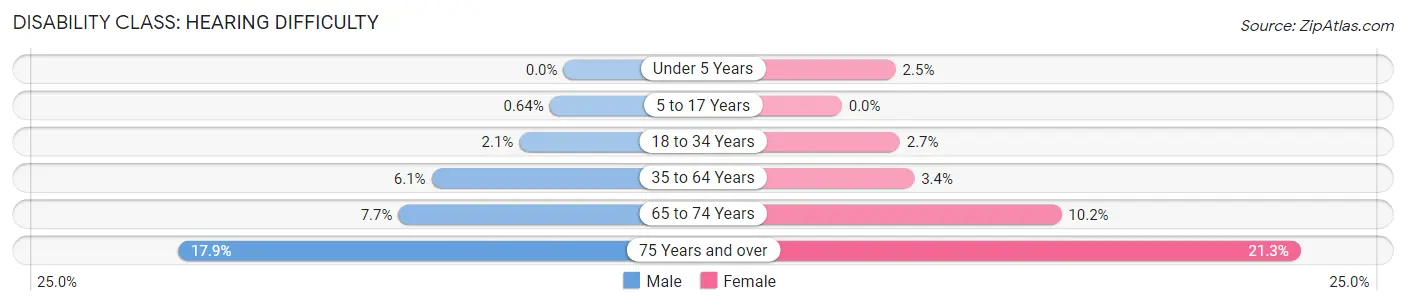
| Age Bracket | Male | Female |
| Under 5 Years | 0 (0.0%) | 24 (2.5%) |
| 5 to 17 Years | 14 (0.6%) | 0 (0.0%) |
| 18 to 34 Years | 72 (2.1%) | 94 (2.7%) |
| 35 to 64 Years | 351 (6.1%) | 200 (3.4%) |
| 65 to 74 Years | 136 (7.7%) | 195 (10.2%) |
| 75 Years and over | 196 (17.9%) | 326 (21.3%) |
Disability Class: Vision Difficulty
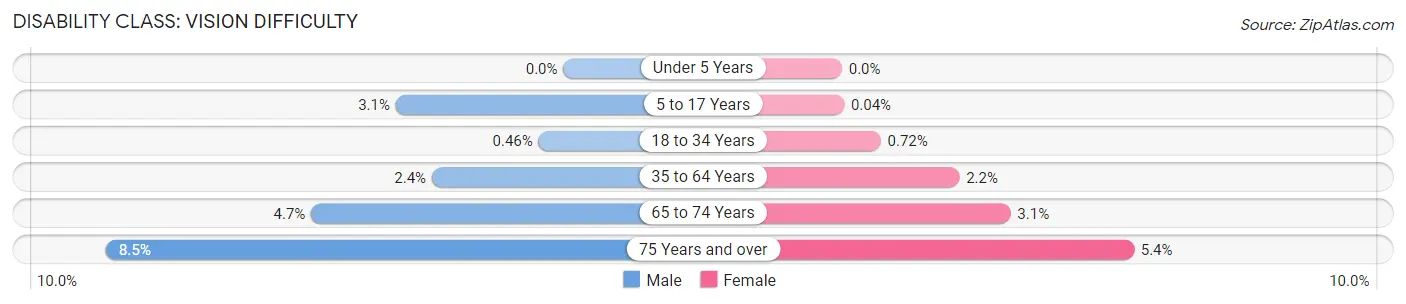
| Age Bracket | Male | Female |
| Under 5 Years | 0 (0.0%) | 0 (0.0%) |
| 5 to 17 Years | 68 (3.1%) | 1 (0.0%) |
| 18 to 34 Years | 16 (0.5%) | 25 (0.7%) |
| 35 to 64 Years | 140 (2.4%) | 130 (2.2%) |
| 65 to 74 Years | 83 (4.7%) | 60 (3.1%) |
| 75 Years and over | 93 (8.5%) | 83 (5.4%) |
Disability Class: Cognitive Difficulty
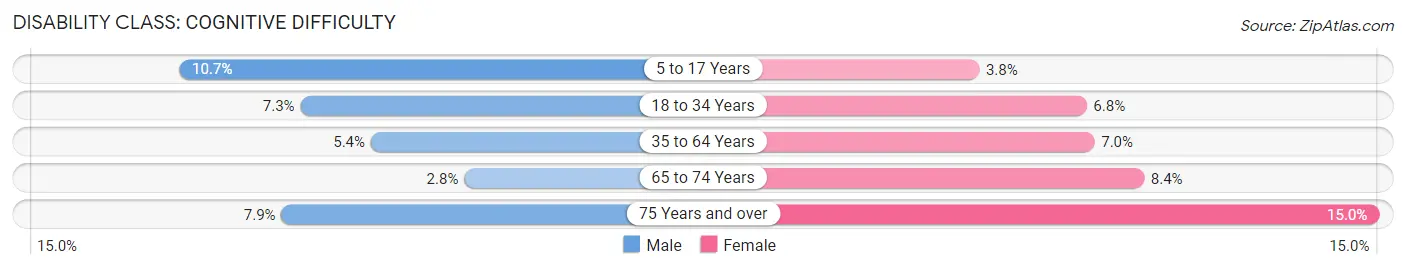
| Age Bracket | Male | Female |
| 5 to 17 Years | 234 (10.7%) | 89 (3.8%) |
| 18 to 34 Years | 257 (7.3%) | 238 (6.8%) |
| 35 to 64 Years | 307 (5.4%) | 419 (7.0%) |
| 65 to 74 Years | 49 (2.8%) | 161 (8.4%) |
| 75 Years and over | 86 (7.9%) | 229 (15.0%) |
Disability Class: Ambulatory Difficulty
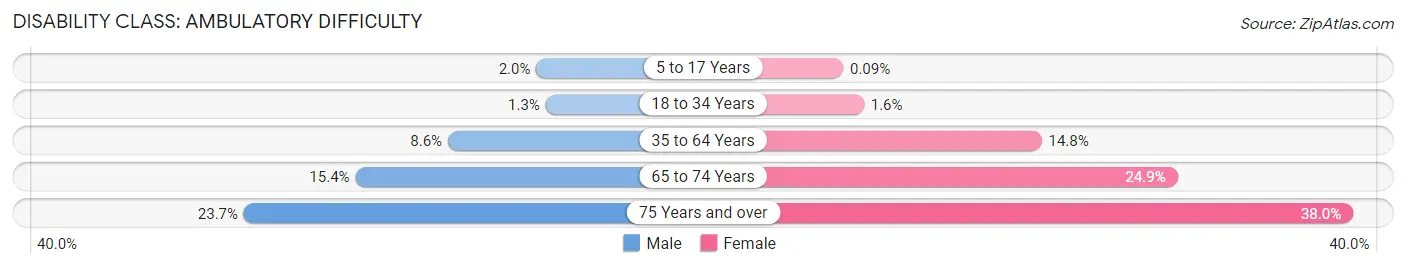
| Age Bracket | Male | Female |
| 5 to 17 Years | 44 (2.0%) | 2 (0.1%) |
| 18 to 34 Years | 46 (1.3%) | 57 (1.6%) |
| 35 to 64 Years | 491 (8.6%) | 884 (14.8%) |
| 65 to 74 Years | 274 (15.4%) | 477 (24.9%) |
| 75 Years and over | 260 (23.7%) | 581 (38.0%) |
Disability Class: Self-Care Difficulty
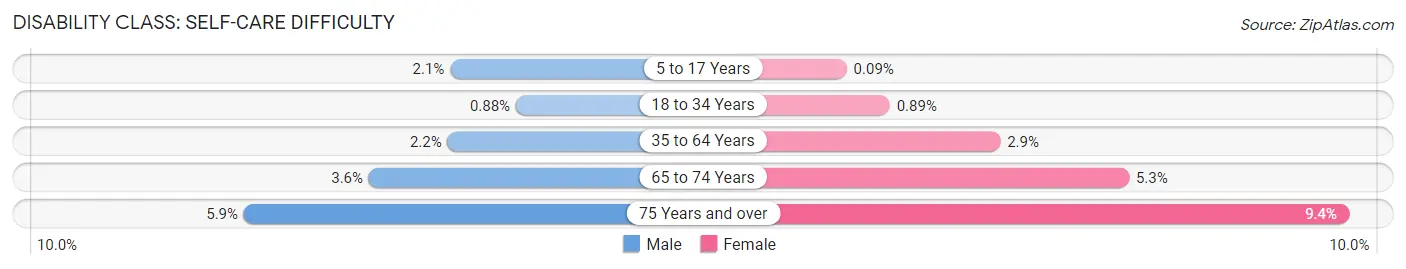
| Age Bracket | Male | Female |
| 5 to 17 Years | 46 (2.1%) | 2 (0.1%) |
| 18 to 34 Years | 31 (0.9%) | 31 (0.9%) |
| 35 to 64 Years | 123 (2.1%) | 175 (2.9%) |
| 65 to 74 Years | 64 (3.6%) | 102 (5.3%) |
| 75 Years and over | 65 (5.9%) | 144 (9.4%) |
Technology Access in Morgan County
Computing Device Access in Morgan County
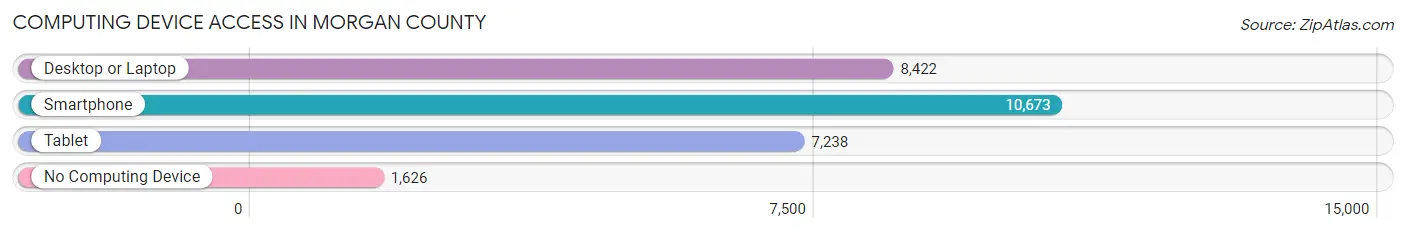
| Device Type | # Households | % Households |
| Desktop or Laptop | 8,422 | 63.4% |
| Smartphone | 10,673 | 80.3% |
| Tablet | 7,238 | 54.4% |
| No Computing Device | 1,626 | 12.2% |
| Total | 13,293 | 100.0% |
Internet Access in Morgan County
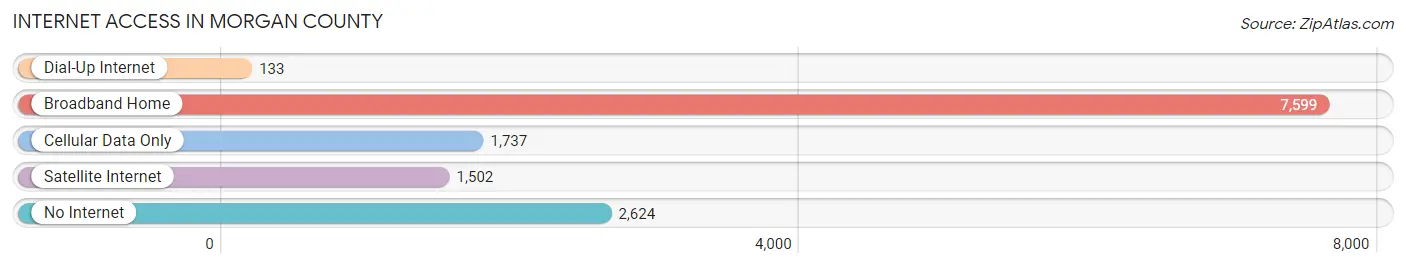
| Internet Type | # Households | % Households |
| Dial-Up Internet | 133 | 1.0% |
| Broadband Home | 7,599 | 57.2% |
| Cellular Data Only | 1,737 | 13.1% |
| Satellite Internet | 1,502 | 11.3% |
| No Internet | 2,624 | 19.7% |
| Total | 13,293 | 100.0% |
Morgan County Summary
Morgan County is located in the central part of the state of Illinois, in the United States. It is part of the Springfield, Illinois Metropolitan Statistical Area. The county was established in 1823 and named after General Daniel Morgan, a Revolutionary War hero. As of the 2010 census, the population was 35,547.
Geography
Morgan County is located in the central part of the state of Illinois, in the United States. It is part of the Springfield, Illinois Metropolitan Statistical Area. The county is bordered by Sangamon County to the north, Scott County to the east, Greene County to the south, and Macoupin County to the west. The county has a total area of 576 square miles, of which 574 square miles is land and 2 square miles (0.3%) is water.
The county is mostly flat, with some rolling hills in the northern and western parts. The highest point in the county is located in the northwest corner, at an elevation of 890 feet. The county is drained by the Sangamon River, which flows through the northern part of the county.
History
Morgan County was established in 1823 and named after General Daniel Morgan, a Revolutionary War hero. The county was originally part of Sangamon County, but was split off in 1823. The county seat is Jacksonville, which was established in 1825.
The county was largely agricultural in the 19th century, with corn, wheat, and oats being the main crops. The county also had a number of coal mines, which provided employment for many of the residents.
In the 20th century, the county experienced a population boom, as people moved to the area for jobs in the manufacturing and service industries. The county also became a popular tourist destination, with many people visiting the nearby Lincoln Memorial Gardens and the Illinois State Fairgrounds.
Economy
The economy of Morgan County is largely based on agriculture, manufacturing, and services. The county is home to a number of large employers, including Caterpillar, Inc., A.E. Staley Manufacturing Company, and the Jacksonville Correctional Center.
Agriculture is the main industry in the county, with corn, soybeans, and wheat being the main crops. Livestock production is also important, with cattle, hogs, and sheep being raised in the county.
Manufacturing is also an important part of the economy, with Caterpillar, Inc. and A.E. Staley Manufacturing Company being the two largest employers in the county. Other major employers include the Jacksonville Correctional Center, the Jacksonville Developmental Center, and the Jacksonville Mental Health Center.
Demographics
As of the 2010 census, the population of Morgan County was 35,547. The population was spread out, with 24.3% under the age of 18, 8.2% from 18 to 24, 28.2% from 25 to 44, 24.7% from 45 to 64, and 14.6% who were 65 years of age or older. The median age was 37.4 years.
The racial makeup of the county was 95.2% White, 1.3% African American, 0.3% Native American, 0.7% Asian, 0.1% Pacific Islander, 1.3% from other races, and 1.2% from two or more races. Hispanic or Latino of any race were 3.2% of the population.
The median income for a household in the county was $50,945, and the median income for a family was $60,945. The per capita income for the county was $24,845. About 8.2% of families and 11.2% of the population were below the poverty line, including 15.2% of those under age 18 and 6.7% of those age 65 or over.
Common Questions
What is Per Capita Income in Morgan County?
Per Capita income in Morgan County is $34,098.
What is the Median Family Income in Morgan County?
Median Family Income in Morgan County is $81,405.
What is the Median Household income in Morgan County?
Median Household Income in Morgan County is $61,188.
What is Income or Wage Gap in Morgan County?
Income or Wage Gap in Morgan County is 34.6%.
Women in Morgan County earn 65.4 cents for every dollar earned by a man.
What is Family Income Deficit in Morgan County?
Family Income Deficit in Morgan County is $9,758.
Families that are below poverty line in Morgan County earn $9,758 less on average than the poverty threshold level.
What is Inequality or Gini Index in Morgan County?
Inequality or Gini Index in Morgan County is 0.44.
What is the Total Population of Morgan County?
Total Population of Morgan County is 32,882.
What is the Total Male Population of Morgan County?
Total Male Population of Morgan County is 16,317.
What is the Total Female Population of Morgan County?
Total Female Population of Morgan County is 16,565.
What is the Ratio of Males per 100 Females in Morgan County?
There are 98.50 Males per 100 Females in Morgan County.
What is the Ratio of Females per 100 Males in Morgan County?
There are 101.52 Females per 100 Males in Morgan County.
What is the Median Population Age in Morgan County?
Median Population Age in Morgan County is 41.4 Years.
What is the Average Family Size in Morgan County
Average Family Size in Morgan County is 3.0 People.
What is the Average Household Size in Morgan County
Average Household Size in Morgan County is 2.3 People.
How Large is the Labor Force in Morgan County?
There are 15,314 People in the Labor Forcein in Morgan County.
What is the Percentage of People in the Labor Force in Morgan County?
56.0% of People are in the Labor Force in Morgan County.
What is the Unemployment Rate in Morgan County?
Unemployment Rate in Morgan County is 6.4%.