McDonough County, IL Map & Demographics
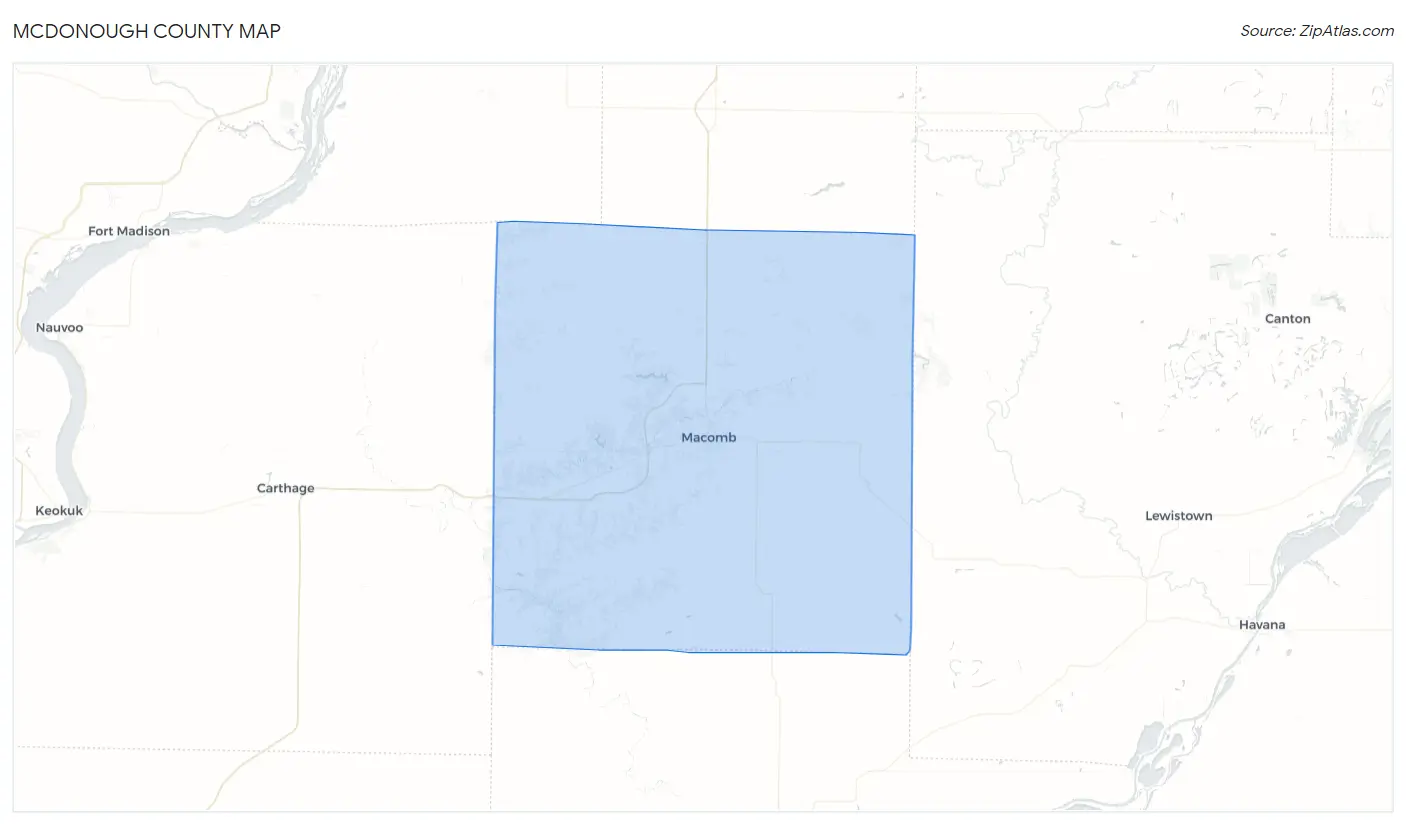
McDonough County Map
McDonough County Overview
$29,658
PER CAPITA INCOME
$76,161
AVG FAMILY INCOME
$48,904
AVG HOUSEHOLD INCOME
31.2%
WAGE / INCOME GAP [ % ]
68.8¢/ $1
WAGE / INCOME GAP [ $ ]
$8,720
FAMILY INCOME DEFICIT
0.49
INEQUALITY / GINI INDEX
27,370
TOTAL POPULATION
13,336
MALE POPULATION
14,034
FEMALE POPULATION
95.03
MALES / 100 FEMALES
105.23
FEMALES / 100 MALES
34.9
MEDIAN AGE
2.9
AVG FAMILY SIZE
2.1
AVG HOUSEHOLD SIZE
14,015
LABOR FORCE [ PEOPLE ]
60.5%
PERCENT IN LABOR FORCE
8.0%
UNEMPLOYMENT RATE
Income in McDonough County
Income Overview in McDonough County
Per Capita Income in McDonough County is $29,658, while median incomes of families and households are $76,161 and $48,904 respectively.
| Characteristic | Number | Measure |
| Per Capita Income | 27,370 | $29,658 |
| Median Family Income | 5,737 | $76,161 |
| Mean Family Income | 5,737 | $92,621 |
| Median Household Income | 11,600 | $48,904 |
| Mean Household Income | 11,600 | $67,033 |
| Income Deficit | 5,737 | $8,720 |
| Wage / Income Gap (%) | 27,370 | 31.24% |
| Wage / Income Gap ($) | 27,370 | 68.76¢ per $1 |
| Gini / Inequality Index | 27,370 | 0.49 |
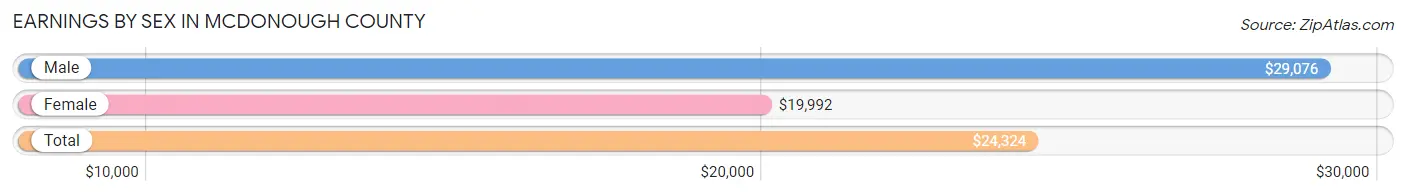
Earnings by Sex in McDonough County
Average Earnings in McDonough County are $24,324, $29,076 for men and $19,992 for women, a difference of 31.2%.
| Sex | Number | Average Earnings |
| Male | 8,043 (51.4%) | $29,076 |
| Female | 7,600 (48.6%) | $19,992 |
| Total | 15,643 (100.0%) | $24,324 |
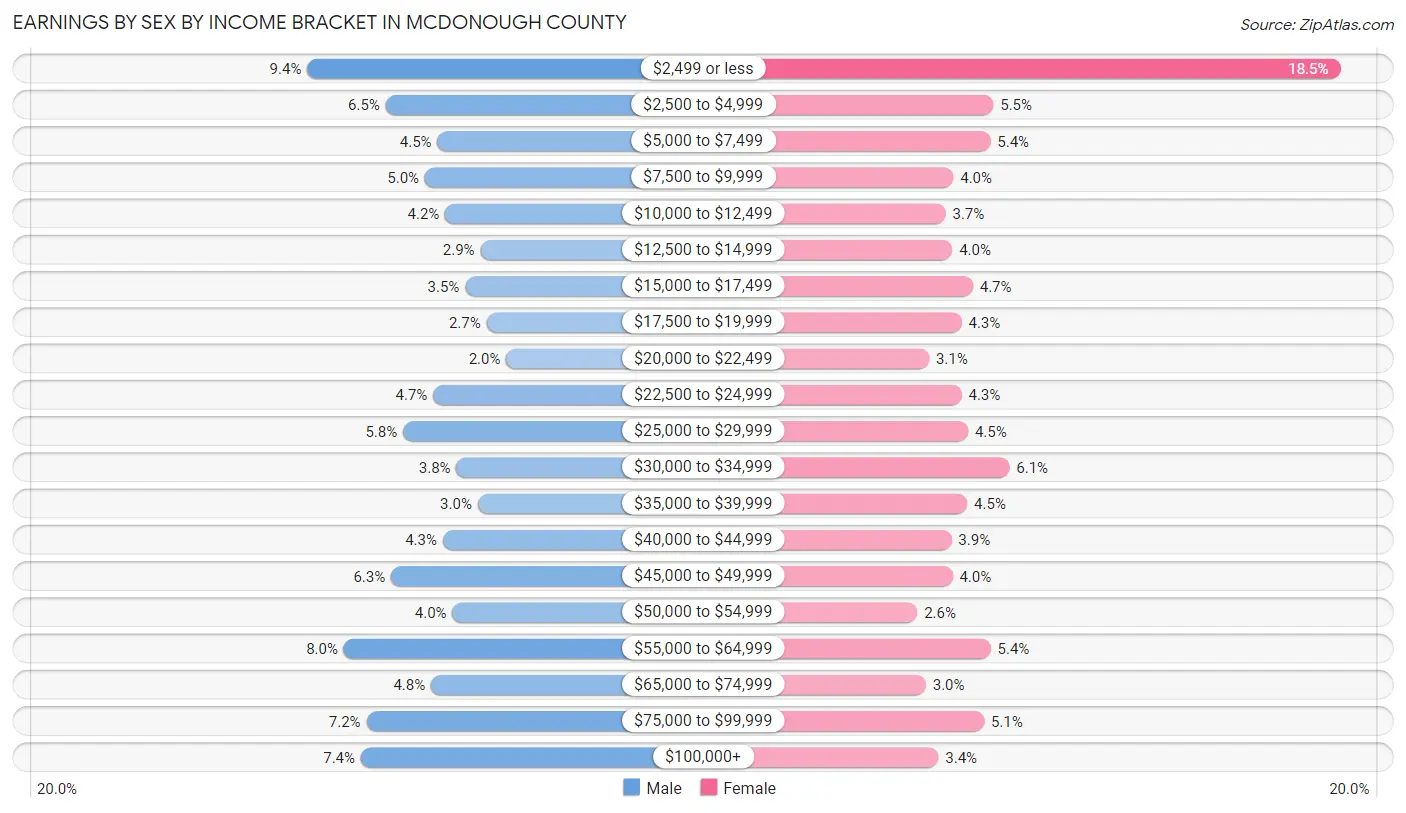
Earnings by Sex by Income Bracket in McDonough County
The most common earnings brackets in McDonough County are $2,499 or less for men (757 | 9.4%) and $2,499 or less for women (1,405 | 18.5%).
| Income | Male | Female |
| $2,499 or less | 757 (9.4%) | 1,405 (18.5%) |
| $2,500 to $4,999 | 520 (6.5%) | 417 (5.5%) |
| $5,000 to $7,499 | 364 (4.5%) | 409 (5.4%) |
| $7,500 to $9,999 | 402 (5.0%) | 303 (4.0%) |
| $10,000 to $12,499 | 341 (4.2%) | 281 (3.7%) |
| $12,500 to $14,999 | 235 (2.9%) | 300 (4.0%) |
| $15,000 to $17,499 | 281 (3.5%) | 359 (4.7%) |
| $17,500 to $19,999 | 216 (2.7%) | 327 (4.3%) |
| $20,000 to $22,499 | 157 (1.9%) | 234 (3.1%) |
| $22,500 to $24,999 | 377 (4.7%) | 327 (4.3%) |
| $25,000 to $29,999 | 468 (5.8%) | 345 (4.5%) |
| $30,000 to $34,999 | 307 (3.8%) | 463 (6.1%) |
| $35,000 to $39,999 | 243 (3.0%) | 343 (4.5%) |
| $40,000 to $44,999 | 348 (4.3%) | 298 (3.9%) |
| $45,000 to $49,999 | 504 (6.3%) | 301 (4.0%) |
| $50,000 to $54,999 | 319 (4.0%) | 201 (2.6%) |
| $55,000 to $64,999 | 647 (8.0%) | 410 (5.4%) |
| $65,000 to $74,999 | 384 (4.8%) | 225 (3.0%) |
| $75,000 to $99,999 | 578 (7.2%) | 391 (5.1%) |
| $100,000+ | 595 (7.4%) | 261 (3.4%) |
| Total | 8,043 (100.0%) | 7,600 (100.0%) |
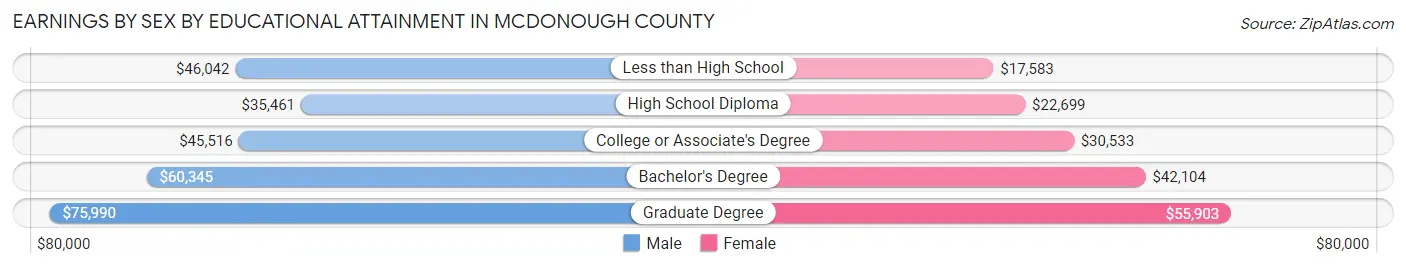
Earnings by Sex by Educational Attainment in McDonough County
Average earnings in McDonough County are $46,354 for men and $33,175 for women, a difference of 28.4%. Men with an educational attainment of graduate degree enjoy the highest average annual earnings of $75,990, while those with high school diploma education earn the least with $35,461. Women with an educational attainment of graduate degree earn the most with the average annual earnings of $55,903, while those with less than high school education have the smallest earnings of $17,583.
| Educational Attainment | Male Income | Female Income |
| Less than High School | $46,042 | $17,583 |
| High School Diploma | $35,461 | $22,699 |
| College or Associate's Degree | $45,516 | $30,533 |
| Bachelor's Degree | $60,345 | $42,104 |
| Graduate Degree | $75,990 | $55,903 |
| Total | $46,354 | $33,175 |
Family Income in McDonough County
Family Income Brackets in McDonough County
According to the McDonough County family income data, there are 1,102 families falling into the $100,000 to $149,999 income range, which is the most common income bracket and makes up 19.2% of all families. Conversely, the $10,000 to $14,999 income bracket is the least frequent group with only 143 families (2.5%) belonging to this category.
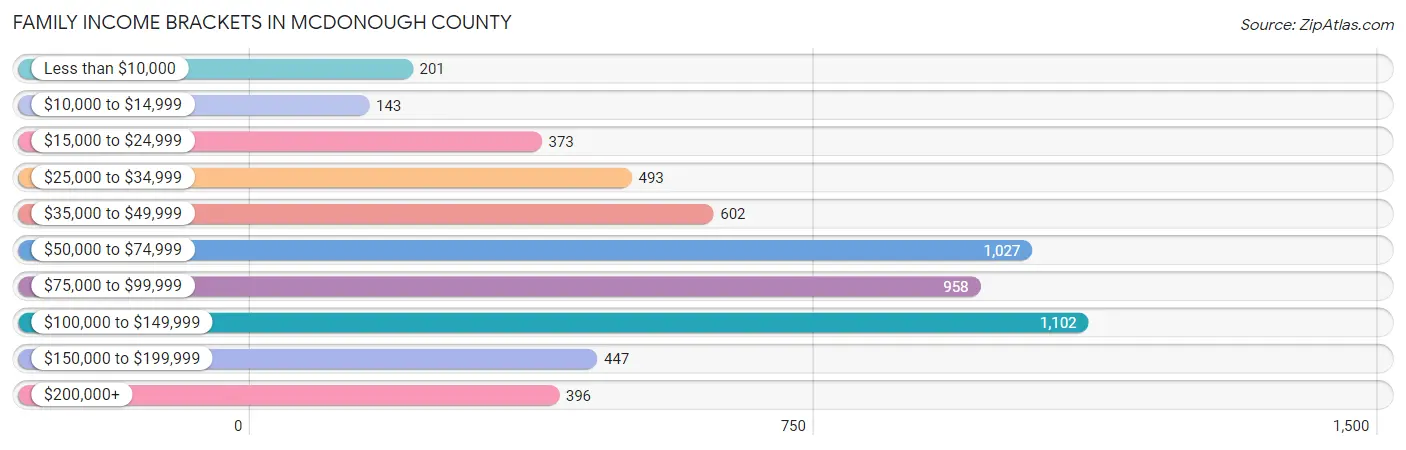
| Income Bracket | # Families | % Families |
| Less than $10,000 | 201 | 3.5% |
| $10,000 to $14,999 | 143 | 2.5% |
| $15,000 to $24,999 | 373 | 6.5% |
| $25,000 to $34,999 | 493 | 8.6% |
| $35,000 to $49,999 | 602 | 10.5% |
| $50,000 to $74,999 | 1,027 | 17.9% |
| $75,000 to $99,999 | 958 | 16.7% |
| $100,000 to $149,999 | 1,102 | 19.2% |
| $150,000 to $199,999 | 447 | 7.8% |
| $200,000+ | 396 | 6.9% |
Family Income by Famaliy Size in McDonough County
5-person families (298 | 5.2%) account for the highest median family income in McDonough County with $144,500 per family, while 2-person families (3,389 | 59.1%) have the highest median income of $35,030 per family member.
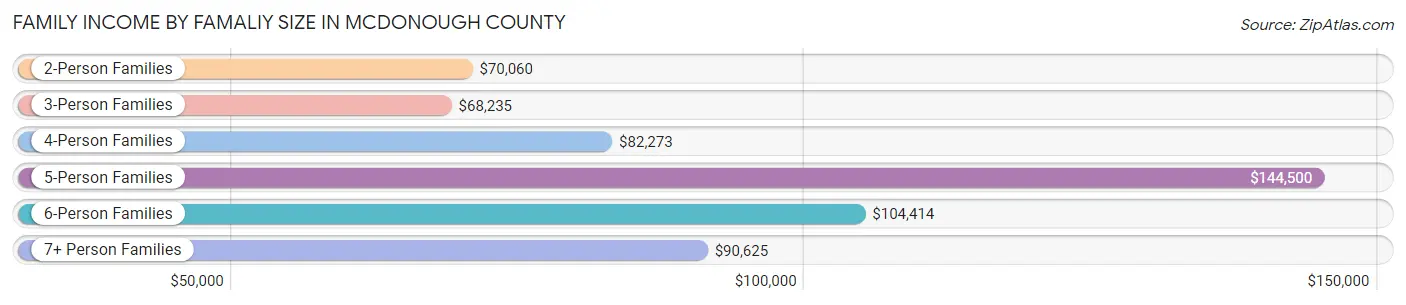
| Income Bracket | # Families | Median Income |
| 2-Person Families | 3,389 (59.1%) | $70,060 |
| 3-Person Families | 1,088 (19.0%) | $68,235 |
| 4-Person Families | 774 (13.5%) | $82,273 |
| 5-Person Families | 298 (5.2%) | $144,500 |
| 6-Person Families | 163 (2.8%) | $104,414 |
| 7+ Person Families | 25 (0.4%) | $90,625 |
| Total | 5,737 (100.0%) | $76,161 |
Family Income by Number of Earners in McDonough County
The median family income in McDonough County is $76,161, with families comprising 3+ earners (461) having the highest median family income of $118,438, while families with 1 earner (1,926) have the lowest median family income of $46,813, accounting for 8.0% and 33.6% of families, respectively.
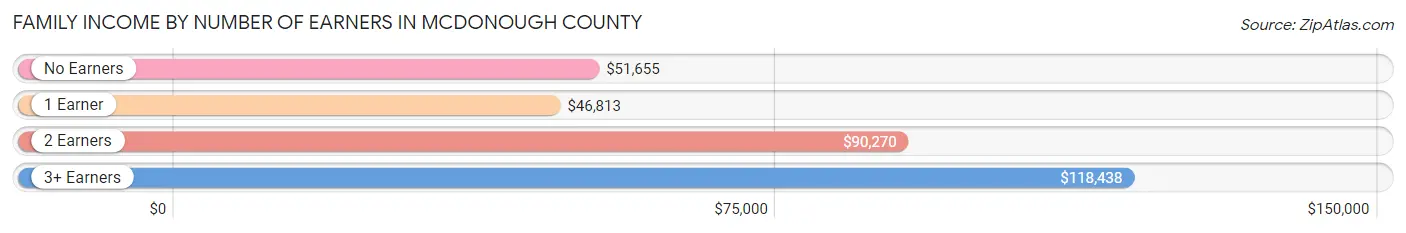
| Number of Earners | # Families | Median Income |
| No Earners | 1,037 (18.1%) | $51,655 |
| 1 Earner | 1,926 (33.6%) | $46,813 |
| 2 Earners | 2,313 (40.3%) | $90,270 |
| 3+ Earners | 461 (8.0%) | $118,438 |
| Total | 5,737 (100.0%) | $76,161 |
Household Income in McDonough County
Household Income Brackets in McDonough County
With 1,902 households falling in the category, the $50,000 to $74,999 income range is the most frequent in McDonough County, accounting for 16.4% of all households. In contrast, only 452 households (3.9%) fall into the $200,000+ income bracket, making it the least populous group.
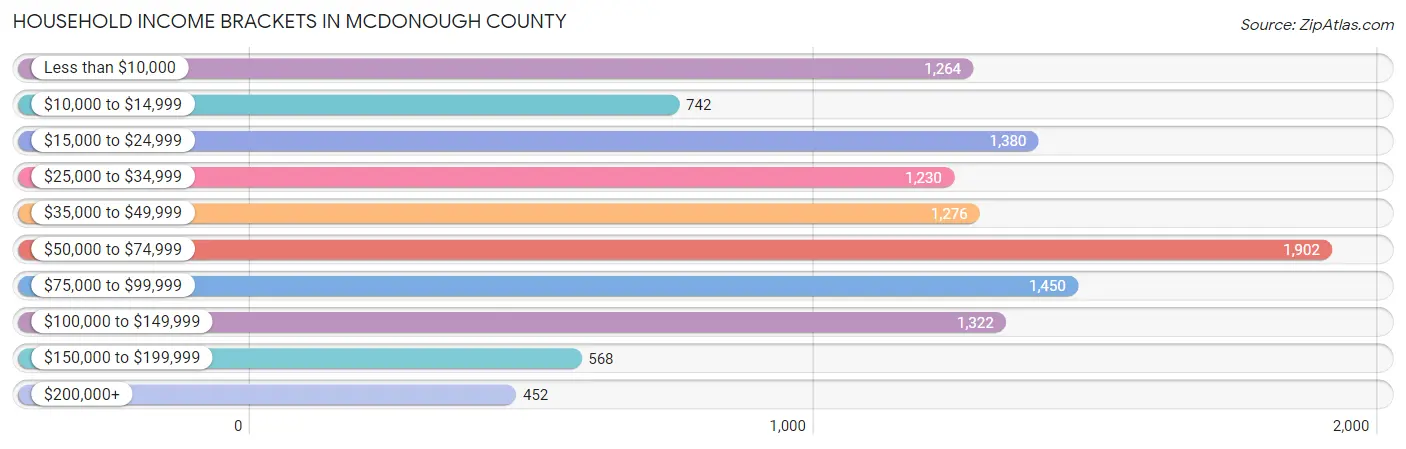
| Income Bracket | # Households | % Households |
| Less than $10,000 | 1,264 | 10.9% |
| $10,000 to $14,999 | 742 | 6.4% |
| $15,000 to $24,999 | 1,380 | 11.9% |
| $25,000 to $34,999 | 1,230 | 10.6% |
| $35,000 to $49,999 | 1,276 | 11.0% |
| $50,000 to $74,999 | 1,902 | 16.4% |
| $75,000 to $99,999 | 1,450 | 12.5% |
| $100,000 to $149,999 | 1,322 | 11.4% |
| $150,000 to $199,999 | 568 | 4.9% |
| $200,000+ | 452 | 3.9% |
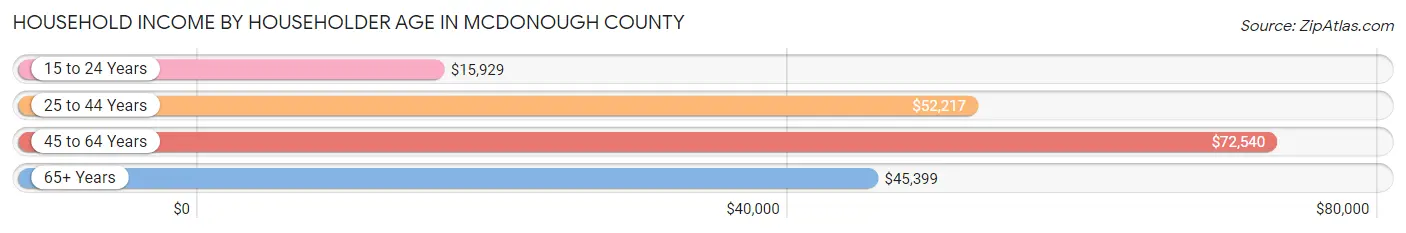
Household Income by Householder Age in McDonough County
The median household income in McDonough County is $48,904, with the highest median household income of $72,540 found in the 45 to 64 years age bracket for the primary householder. A total of 3,280 households (28.3%) fall into this category. Meanwhile, the 15 to 24 years age bracket for the primary householder has the lowest median household income of $15,929, with 1,773 households (15.3%) in this group.
| Income Bracket | # Households | Median Income |
| 15 to 24 Years | 1,773 (15.3%) | $15,929 |
| 25 to 44 Years | 3,195 (27.5%) | $52,217 |
| 45 to 64 Years | 3,280 (28.3%) | $72,540 |
| 65+ Years | 3,352 (28.9%) | $45,399 |
| Total | 11,600 (100.0%) | $48,904 |
Poverty in McDonough County
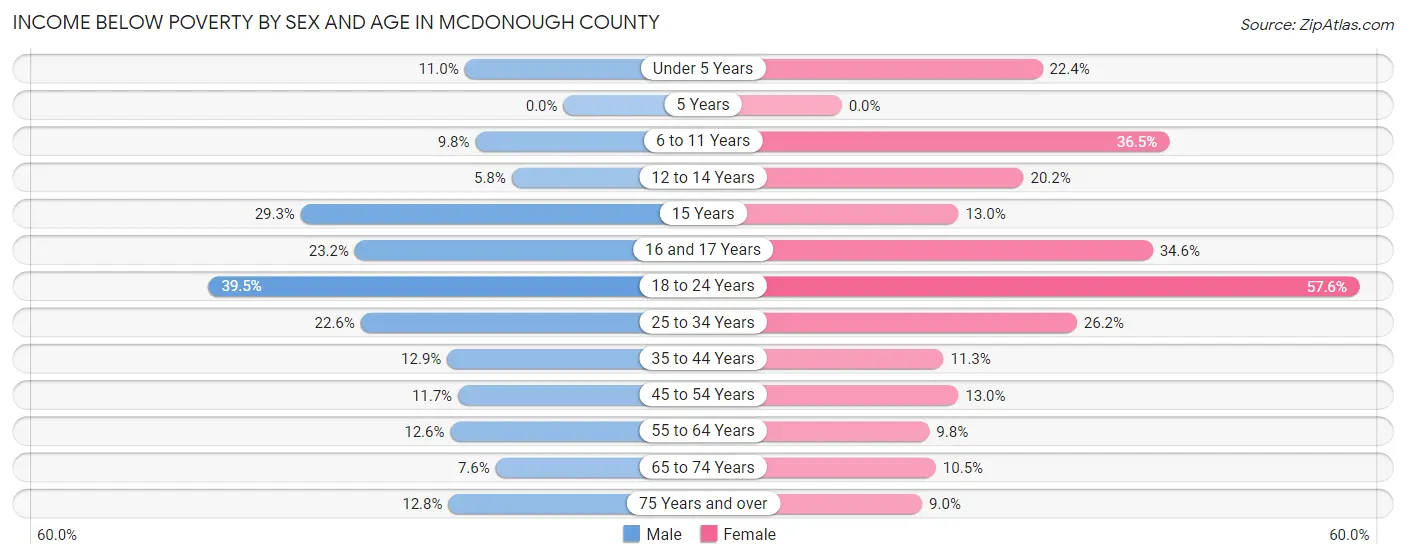
Income Below Poverty by Sex and Age in McDonough County
With 17.1% poverty level for males and 22.4% for females among the residents of McDonough County, 18 to 24 year old males and 18 to 24 year old females are the most vulnerable to poverty, with 722 males (39.5%) and 1,067 females (57.6%) in their respective age groups living below the poverty level.
| Age Bracket | Male | Female |
| Under 5 Years | 70 (11.0%) | 133 (22.4%) |
| 5 Years | 0 (0.0%) | 0 (0.0%) |
| 6 to 11 Years | 73 (9.8%) | 296 (36.4%) |
| 12 to 14 Years | 31 (5.8%) | 83 (20.2%) |
| 15 Years | 31 (29.2%) | 13 (13.0%) |
| 16 and 17 Years | 72 (23.2%) | 98 (34.6%) |
| 18 to 24 Years | 722 (39.5%) | 1,067 (57.6%) |
| 25 to 34 Years | 368 (22.6%) | 366 (26.2%) |
| 35 to 44 Years | 174 (12.9%) | 170 (11.3%) |
| 45 to 54 Years | 142 (11.7%) | 160 (13.0%) |
| 55 to 64 Years | 198 (12.6%) | 155 (9.8%) |
| 65 to 74 Years | 101 (7.5%) | 156 (10.5%) |
| 75 Years and over | 103 (12.8%) | 105 (8.9%) |
| Total | 2,085 (17.1%) | 2,802 (22.4%) |
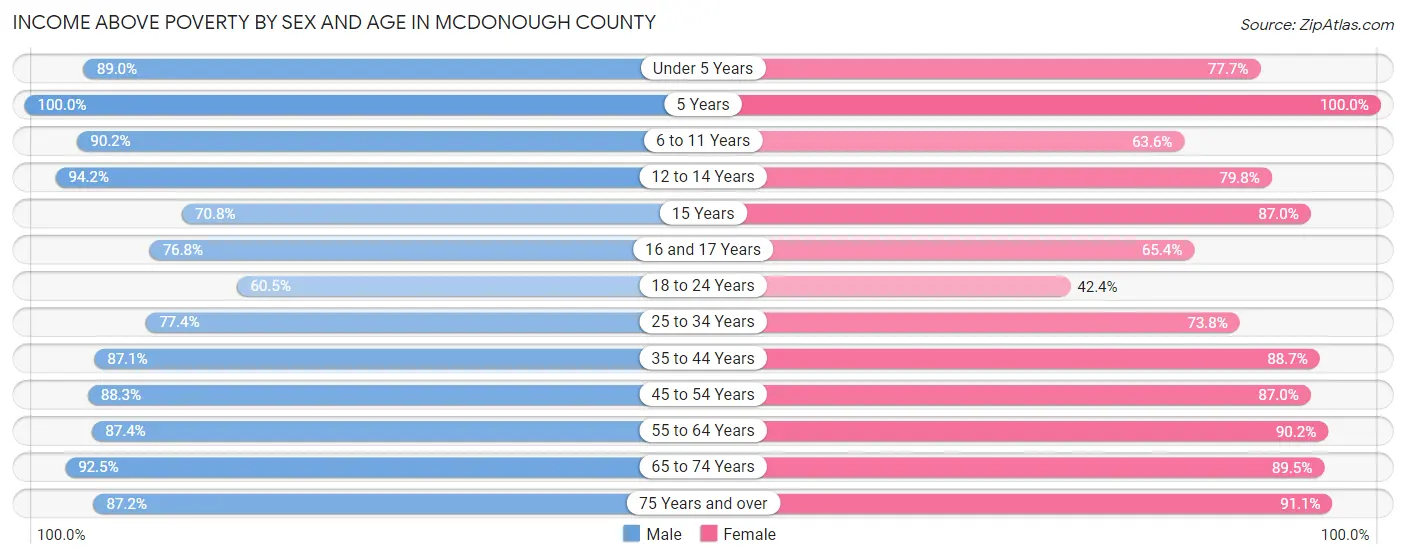
Income Above Poverty by Sex and Age in McDonough County
According to the poverty statistics in McDonough County, males aged 5 years and females aged 5 years are the age groups that are most secure financially, with 100.0% of males and 100.0% of females in these age groups living above the poverty line.
| Age Bracket | Male | Female |
| Under 5 Years | 566 (89.0%) | 462 (77.6%) |
| 5 Years | 112 (100.0%) | 85 (100.0%) |
| 6 to 11 Years | 672 (90.2%) | 516 (63.5%) |
| 12 to 14 Years | 507 (94.2%) | 327 (79.8%) |
| 15 Years | 75 (70.8%) | 87 (87.0%) |
| 16 and 17 Years | 238 (76.8%) | 185 (65.4%) |
| 18 to 24 Years | 1,105 (60.5%) | 786 (42.4%) |
| 25 to 34 Years | 1,262 (77.4%) | 1,032 (73.8%) |
| 35 to 44 Years | 1,171 (87.1%) | 1,329 (88.7%) |
| 45 to 54 Years | 1,068 (88.3%) | 1,073 (87.0%) |
| 55 to 64 Years | 1,375 (87.4%) | 1,433 (90.2%) |
| 65 to 74 Years | 1,237 (92.4%) | 1,332 (89.5%) |
| 75 Years and over | 701 (87.2%) | 1,068 (91.0%) |
| Total | 10,089 (82.9%) | 9,715 (77.6%) |
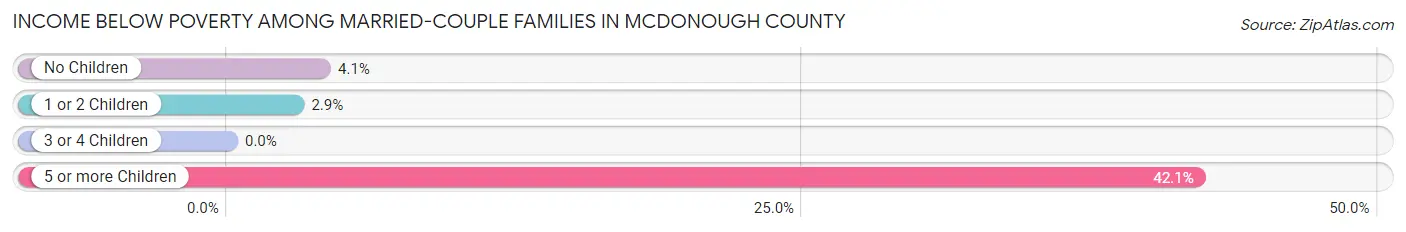
Income Below Poverty Among Married-Couple Families in McDonough County
The poverty statistics for married-couple families in McDonough County show that 3.6% or 155 of the total 4,286 families live below the poverty line. Families with 5 or more children have the highest poverty rate of 42.1%, comprising of 8 families. On the other hand, families with 3 or 4 children have the lowest poverty rate of 0.0%, which includes 0 families.
| Children | Above Poverty | Below Poverty |
| No Children | 2,725 (96.0%) | 115 (4.1%) |
| 1 or 2 Children | 1,076 (97.1%) | 32 (2.9%) |
| 3 or 4 Children | 319 (100.0%) | 0 (0.0%) |
| 5 or more Children | 11 (57.9%) | 8 (42.1%) |
| Total | 4,131 (96.4%) | 155 (3.6%) |
Income Below Poverty Among Single-Parent Households in McDonough County
According to the poverty data in McDonough County, 26.9% or 94 single-father households and 33.0% or 363 single-mother households are living below the poverty line. Among single-father households, those with 1 or 2 children have the highest poverty rate, with 78 households (34.2%) experiencing poverty. Likewise, among single-mother households, those with 3 or 4 children have the highest poverty rate, with 48 households (76.2%) falling below the poverty line.
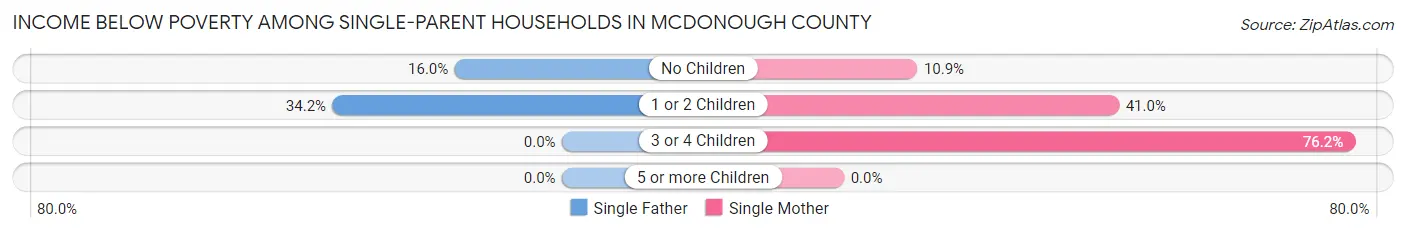
| Children | Single Father | Single Mother |
| No Children | 16 (16.0%) | 38 (10.9%) |
| 1 or 2 Children | 78 (34.2%) | 277 (41.0%) |
| 3 or 4 Children | 0 (0.0%) | 48 (76.2%) |
| 5 or more Children | 0 (0.0%) | 0 (0.0%) |
| Total | 94 (26.9%) | 363 (33.0%) |
Income Below Poverty Among Married-Couple vs Single-Parent Households in McDonough County
The poverty data for McDonough County shows that 155 of the married-couple family households (3.6%) and 457 of the single-parent households (31.5%) are living below the poverty level. Within the married-couple family households, those with 5 or more children have the highest poverty rate, with 8 households (42.1%) falling below the poverty line. Among the single-parent households, those with 3 or 4 children have the highest poverty rate, with 48 household (56.5%) living below poverty.
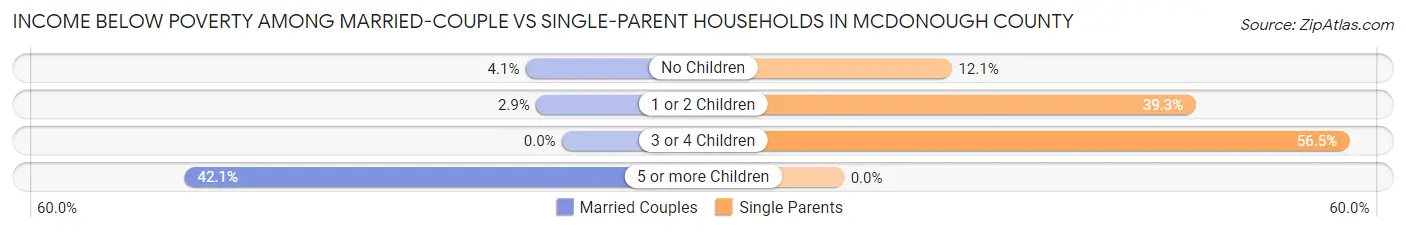
| Children | Married-Couple Families | Single-Parent Households |
| No Children | 115 (4.1%) | 54 (12.0%) |
| 1 or 2 Children | 32 (2.9%) | 355 (39.3%) |
| 3 or 4 Children | 0 (0.0%) | 48 (56.5%) |
| 5 or more Children | 8 (42.1%) | 0 (0.0%) |
| Total | 155 (3.6%) | 457 (31.5%) |
Race in McDonough County
The most populous races in McDonough County are White / Caucasian (24,124 | 88.1%), Black / African American (1,463 | 5.3%), and Two or more Races (905 | 3.3%).
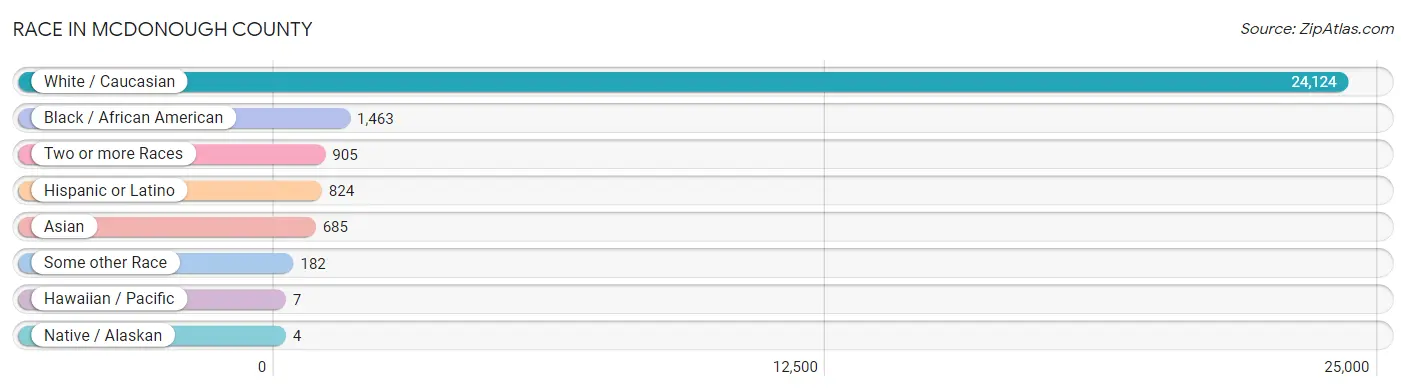
| Race | # Population | % Population |
| Asian | 685 | 2.5% |
| Black / African American | 1,463 | 5.3% |
| Hawaiian / Pacific | 7 | 0.0% |
| Hispanic or Latino | 824 | 3.0% |
| Native / Alaskan | 4 | 0.0% |
| White / Caucasian | 24,124 | 88.1% |
| Two or more Races | 905 | 3.3% |
| Some other Race | 182 | 0.7% |
| Total | 27,370 | 100.0% |
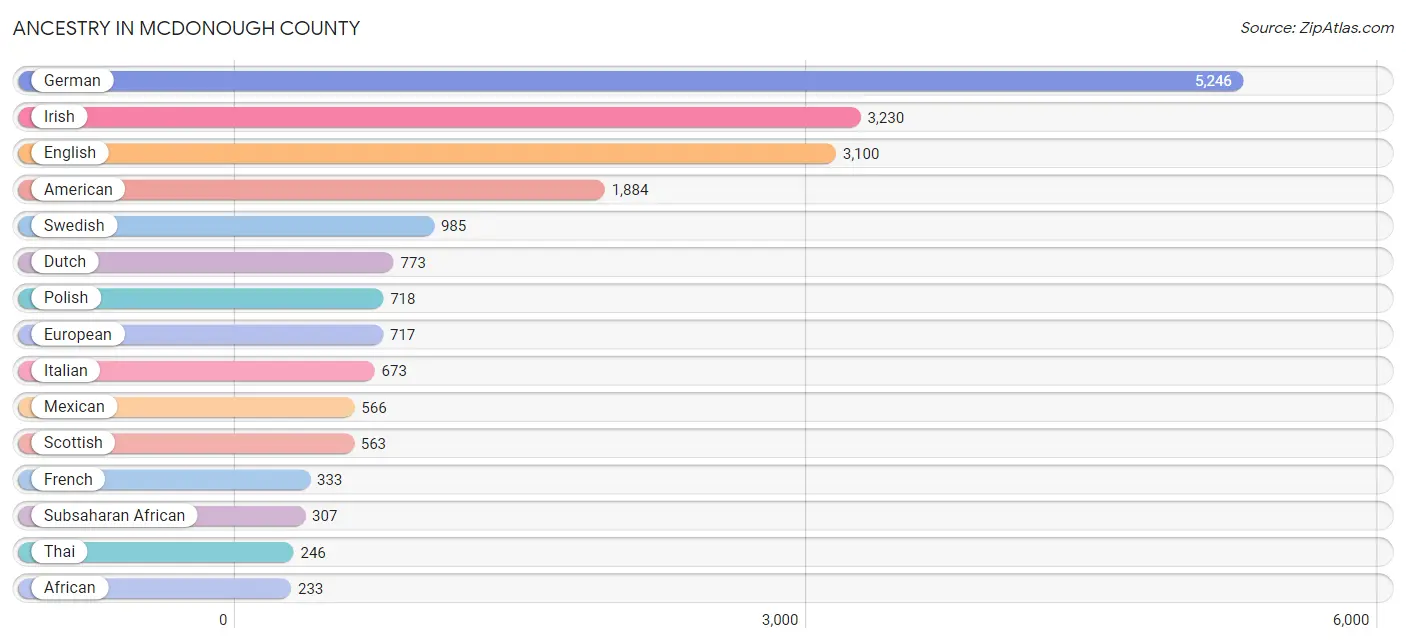
Ancestry in McDonough County
The most populous ancestries reported in McDonough County are German (5,246 | 19.2%), Irish (3,230 | 11.8%), English (3,100 | 11.3%), American (1,884 | 6.9%), and Swedish (985 | 3.6%), together accounting for 52.8% of all McDonough County residents.
| Ancestry | # Population | % Population |
| African | 233 | 0.9% |
| American | 1,884 | 6.9% |
| Arab | 18 | 0.1% |
| Argentinean | 11 | 0.0% |
| Austrian | 8 | 0.0% |
| Barbadian | 10 | 0.0% |
| Belgian | 43 | 0.2% |
| Bermudan | 10 | 0.0% |
| Bhutanese | 16 | 0.1% |
| Blackfeet | 1 | 0.0% |
| Brazilian | 9 | 0.0% |
| British | 169 | 0.6% |
| Burmese | 69 | 0.3% |
| Central American | 23 | 0.1% |
| Cherokee | 20 | 0.1% |
| Chippewa | 5 | 0.0% |
| Choctaw | 1 | 0.0% |
| Costa Rican | 6 | 0.0% |
| Croatian | 17 | 0.1% |
| Cuban | 37 | 0.1% |
| Czech | 43 | 0.2% |
| Danish | 105 | 0.4% |
| Dutch | 773 | 2.8% |
| Eastern European | 20 | 0.1% |
| English | 3,100 | 11.3% |
| Ethiopian | 2 | 0.0% |
| European | 717 | 2.6% |
| Finnish | 66 | 0.2% |
| French | 333 | 1.2% |
| French Canadian | 66 | 0.2% |
| German | 5,246 | 19.2% |
| Greek | 107 | 0.4% |
| Guatemalan | 17 | 0.1% |
| Hungarian | 47 | 0.2% |
| Indian (Asian) | 216 | 0.8% |
| Iranian | 18 | 0.1% |
| Irish | 3,230 | 11.8% |
| Italian | 673 | 2.5% |
| Korean | 153 | 0.6% |
| Laotian | 3 | 0.0% |
| Lebanese | 18 | 0.1% |
| Lithuanian | 71 | 0.3% |
| Maltese | 5 | 0.0% |
| Mexican | 566 | 2.1% |
| Mexican American Indian | 2 | 0.0% |
| Mongolian | 13 | 0.1% |
| Native Hawaiian | 7 | 0.0% |
| Nigerian | 58 | 0.2% |
| Northern European | 41 | 0.2% |
| Norwegian | 219 | 0.8% |
| Pennsylvania German | 16 | 0.1% |
| Peruvian | 23 | 0.1% |
| Polish | 718 | 2.6% |
| Portuguese | 7 | 0.0% |
| Puerto Rican | 79 | 0.3% |
| Romanian | 13 | 0.1% |
| Russian | 59 | 0.2% |
| Scandinavian | 49 | 0.2% |
| Scotch-Irish | 201 | 0.7% |
| Scottish | 563 | 2.1% |
| Serbian | 10 | 0.0% |
| Shoshone | 22 | 0.1% |
| Sioux | 7 | 0.0% |
| South American | 46 | 0.2% |
| Spaniard | 10 | 0.0% |
| Spanish | 13 | 0.1% |
| Subsaharan African | 307 | 1.1% |
| Swedish | 985 | 3.6% |
| Swiss | 70 | 0.3% |
| Thai | 246 | 0.9% |
| Tongan | 4 | 0.0% |
| Trinidadian and Tobagonian | 74 | 0.3% |
| Venezuelan | 12 | 0.0% |
| Welsh | 137 | 0.5% |
| West Indian | 11 | 0.0% |
| Yugoslavian | 13 | 0.1% | View All 76 Rows |
Immigrants in McDonough County
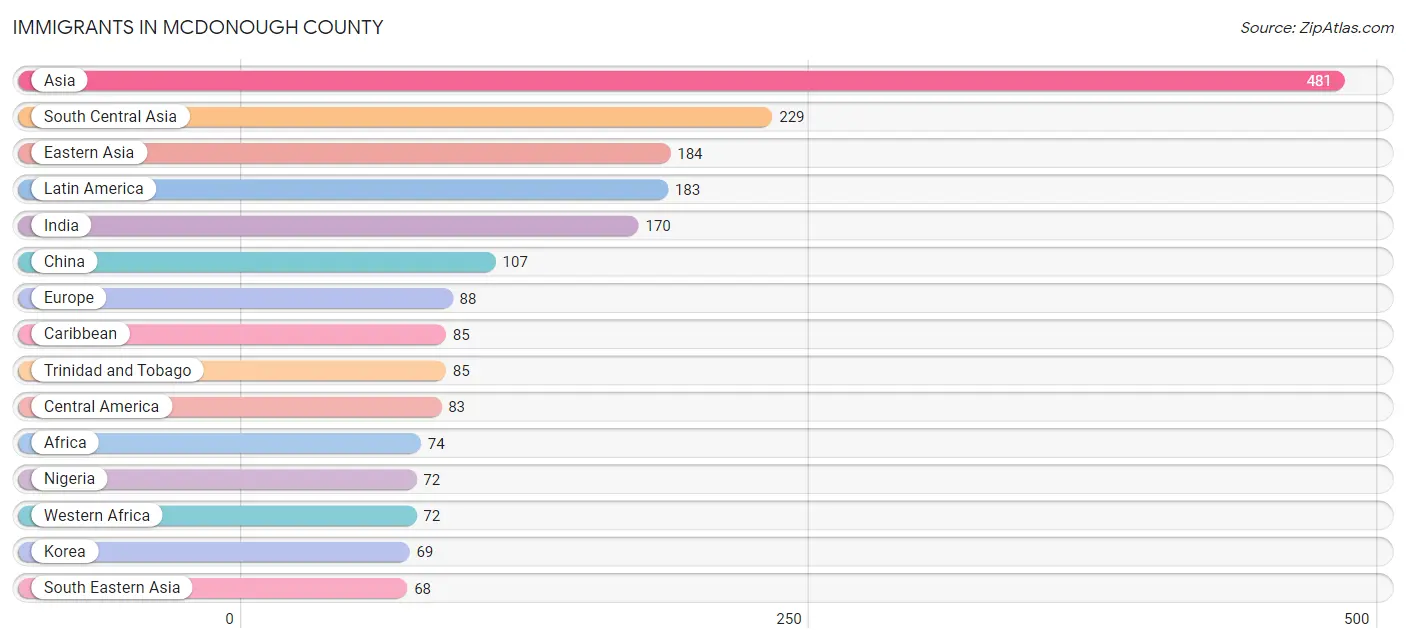
The most numerous immigrant groups reported in McDonough County came from Asia (481 | 1.8%), South Central Asia (229 | 0.8%), Eastern Asia (184 | 0.7%), Latin America (183 | 0.7%), and India (170 | 0.6%), together accounting for 4.6% of all McDonough County residents.
| Immigration Origin | # Population | % Population |
| Africa | 74 | 0.3% |
| Asia | 481 | 1.8% |
| Brazil | 9 | 0.0% |
| Caribbean | 85 | 0.3% |
| Central America | 83 | 0.3% |
| China | 107 | 0.4% |
| Costa Rica | 6 | 0.0% |
| Croatia | 11 | 0.0% |
| Czechoslovakia | 8 | 0.0% |
| Eastern Africa | 2 | 0.0% |
| Eastern Asia | 184 | 0.7% |
| Eastern Europe | 50 | 0.2% |
| England | 9 | 0.0% |
| Ethiopia | 2 | 0.0% |
| Europe | 88 | 0.3% |
| Germany | 13 | 0.1% |
| Guatemala | 11 | 0.0% |
| India | 170 | 0.6% |
| Indonesia | 1 | 0.0% |
| Ireland | 13 | 0.1% |
| Japan | 8 | 0.0% |
| Kazakhstan | 20 | 0.1% |
| Korea | 69 | 0.3% |
| Latin America | 183 | 0.7% |
| Malaysia | 16 | 0.1% |
| Mexico | 66 | 0.2% |
| Nigeria | 72 | 0.3% |
| Northern Europe | 22 | 0.1% |
| Oceania | 6 | 0.0% |
| Pakistan | 39 | 0.1% |
| Peru | 6 | 0.0% |
| Philippines | 51 | 0.2% |
| Poland | 12 | 0.0% |
| Romania | 19 | 0.1% |
| South America | 15 | 0.1% |
| South Central Asia | 229 | 0.8% |
| South Eastern Asia | 68 | 0.3% |
| Southern Europe | 3 | 0.0% |
| Spain | 3 | 0.0% |
| Taiwan | 36 | 0.1% |
| Trinidad and Tobago | 85 | 0.3% |
| Western Africa | 72 | 0.3% |
| Western Europe | 13 | 0.1% | View All 43 Rows |
Sex and Age in McDonough County
Sex and Age in McDonough County
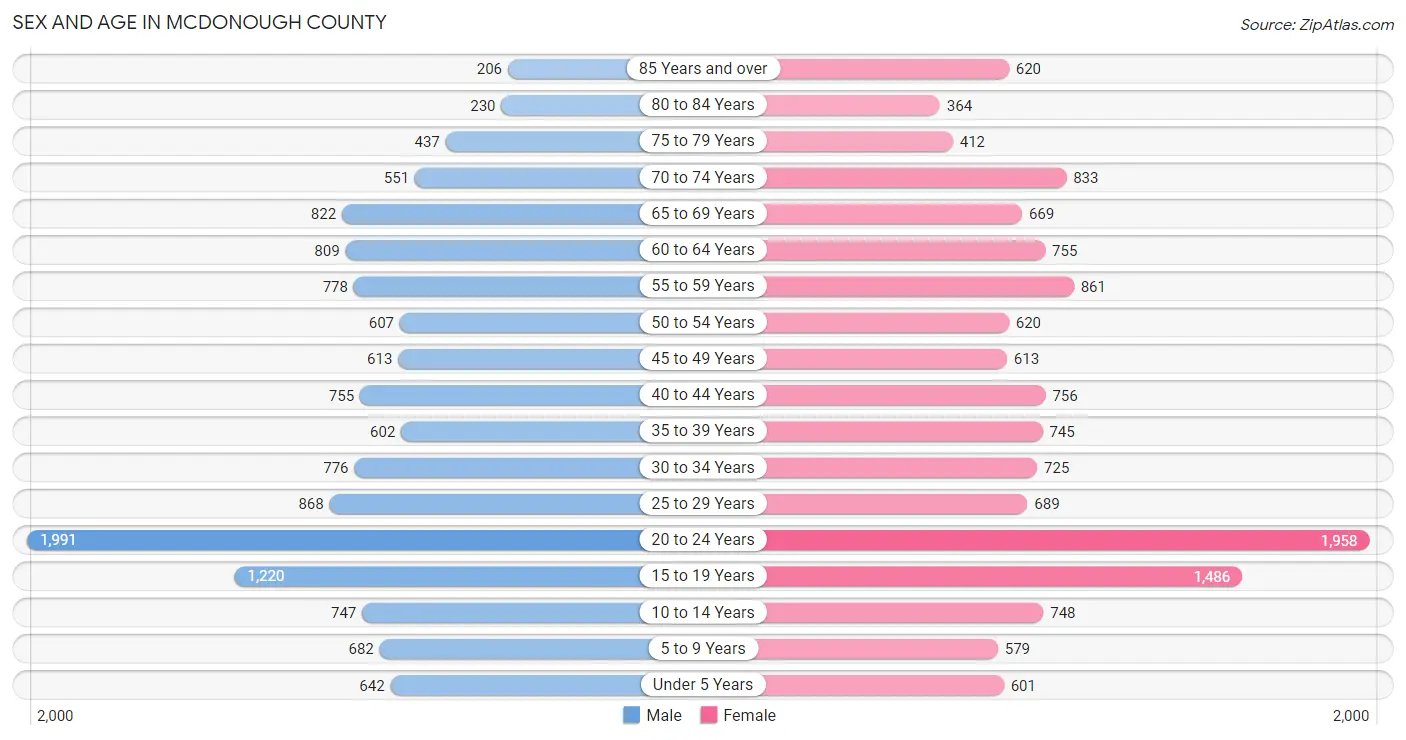
The most populous age groups in McDonough County are 20 to 24 Years (1,991 | 14.9%) for men and 20 to 24 Years (1,958 | 14.0%) for women.
| Age Bracket | Male | Female |
| Under 5 Years | 642 (4.8%) | 601 (4.3%) |
| 5 to 9 Years | 682 (5.1%) | 579 (4.1%) |
| 10 to 14 Years | 747 (5.6%) | 748 (5.3%) |
| 15 to 19 Years | 1,220 (9.1%) | 1,486 (10.6%) |
| 20 to 24 Years | 1,991 (14.9%) | 1,958 (14.0%) |
| 25 to 29 Years | 868 (6.5%) | 689 (4.9%) |
| 30 to 34 Years | 776 (5.8%) | 725 (5.2%) |
| 35 to 39 Years | 602 (4.5%) | 745 (5.3%) |
| 40 to 44 Years | 755 (5.7%) | 756 (5.4%) |
| 45 to 49 Years | 613 (4.6%) | 613 (4.4%) |
| 50 to 54 Years | 607 (4.5%) | 620 (4.4%) |
| 55 to 59 Years | 778 (5.8%) | 861 (6.1%) |
| 60 to 64 Years | 809 (6.1%) | 755 (5.4%) |
| 65 to 69 Years | 822 (6.2%) | 669 (4.8%) |
| 70 to 74 Years | 551 (4.1%) | 833 (5.9%) |
| 75 to 79 Years | 437 (3.3%) | 412 (2.9%) |
| 80 to 84 Years | 230 (1.7%) | 364 (2.6%) |
| 85 Years and over | 206 (1.5%) | 620 (4.4%) |
| Total | 13,336 (100.0%) | 14,034 (100.0%) |
Families and Households in McDonough County
Median Family Size in McDonough County
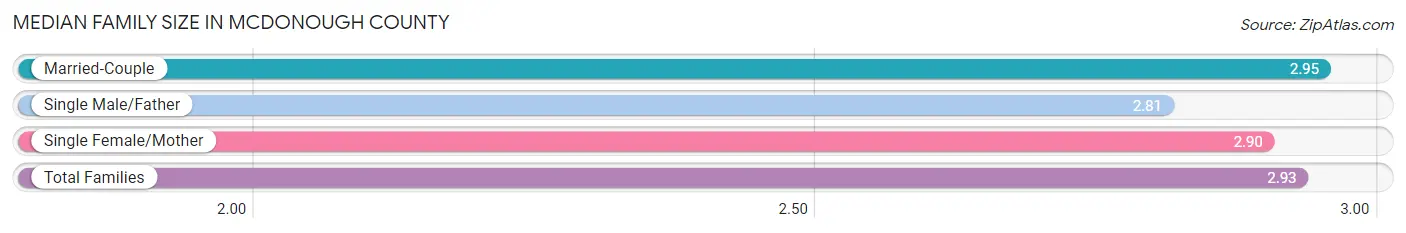
The median family size in McDonough County is 2.93 persons per family, with married-couple families (4,286 | 74.7%) accounting for the largest median family size of 2.95 persons per family. On the other hand, single male/father families (350 | 6.1%) represent the smallest median family size with 2.81 persons per family.
| Family Type | # Families | Family Size |
| Married-Couple | 4,286 (74.7%) | 2.95 |
| Single Male/Father | 350 (6.1%) | 2.81 |
| Single Female/Mother | 1,101 (19.2%) | 2.90 |
| Total Families | 5,737 (100.0%) | 2.93 |
Median Household Size in McDonough County
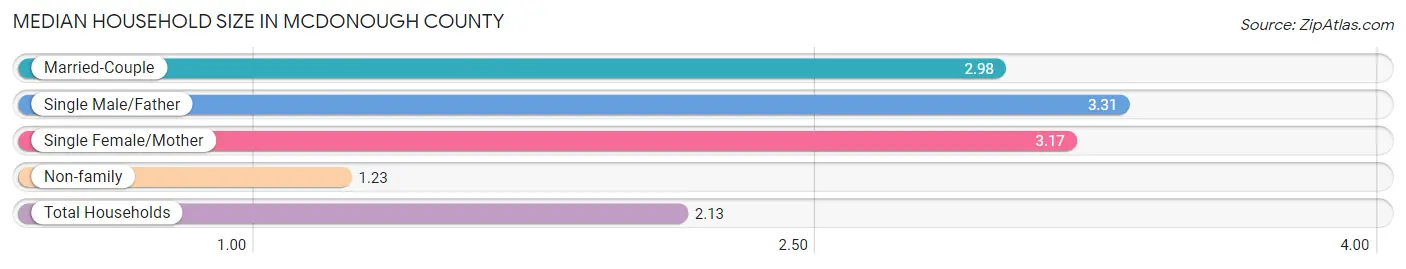
The median household size in McDonough County is 2.13 persons per household, with single male/father households (350 | 3.0%) accounting for the largest median household size of 3.31 persons per household. non-family households (5,863 | 50.5%) represent the smallest median household size with 1.23 persons per household.
| Household Type | # Households | Household Size |
| Married-Couple | 4,286 (36.9%) | 2.98 |
| Single Male/Father | 350 (3.0%) | 3.31 |
| Single Female/Mother | 1,101 (9.5%) | 3.17 |
| Non-family | 5,863 (50.5%) | 1.23 |
| Total Households | 11,600 (100.0%) | 2.13 |
Household Size by Marriage Status in McDonough County
Out of a total of 11,600 households in McDonough County, 5,737 (49.5%) are family households, while 5,863 (50.5%) are nonfamily households. The most numerous type of family households are 2-person households, comprising 3,186, and the most common type of nonfamily households are 1-person households, comprising 4,803.
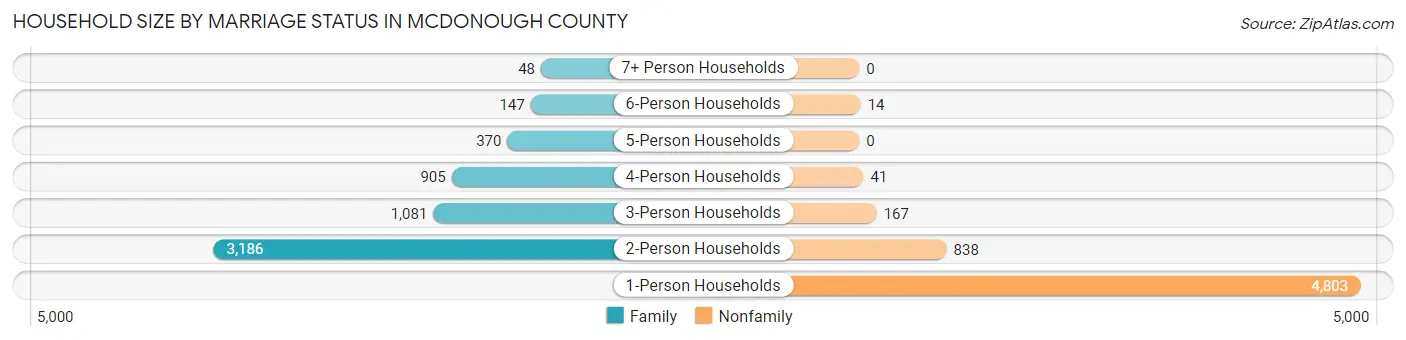
| Household Size | Family Households | Nonfamily Households |
| 1-Person Households | - | 4,803 (41.4%) |
| 2-Person Households | 3,186 (27.5%) | 838 (7.2%) |
| 3-Person Households | 1,081 (9.3%) | 167 (1.4%) |
| 4-Person Households | 905 (7.8%) | 41 (0.4%) |
| 5-Person Households | 370 (3.2%) | 0 (0.0%) |
| 6-Person Households | 147 (1.3%) | 14 (0.1%) |
| 7+ Person Households | 48 (0.4%) | 0 (0.0%) |
| Total | 5,737 (49.5%) | 5,863 (50.5%) |
Female Fertility in McDonough County
Fertility by Age in McDonough County
Average fertility rate in McDonough County is 20.0 births per 1,000 women. Women in the age bracket of 20 to 34 years have the highest fertility rate with 38.0 births per 1,000 women. Women in the age bracket of 20 to 34 years acount for 90.1% of all women with births.
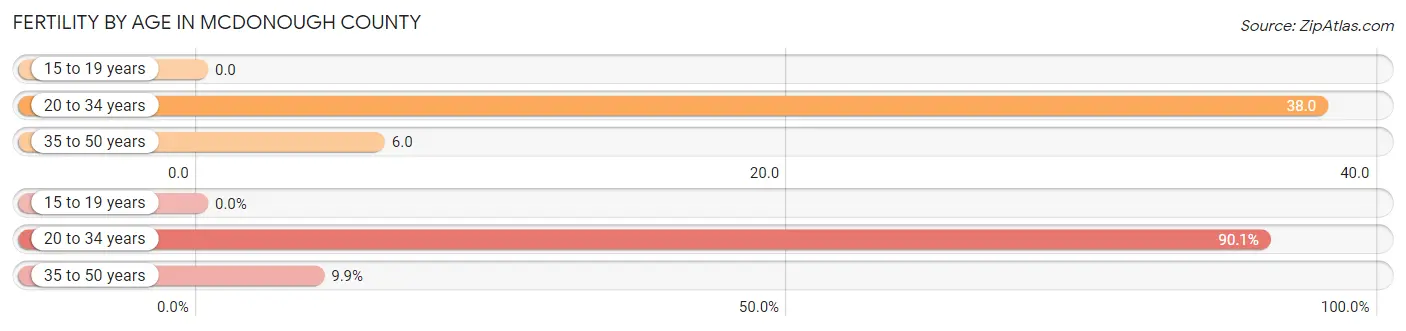
| Age Bracket | Women with Births | Births / 1,000 Women |
| 15 to 19 years | 0 (0.0%) | 0.0 |
| 20 to 34 years | 128 (90.1%) | 38.0 |
| 35 to 50 years | 14 (9.9%) | 6.0 |
| Total | 142 (100.0%) | 20.0 |
Fertility by Age by Marriage Status in McDonough County
42.3% of women with births (142) in McDonough County are married. The highest percentage of unmarried women with births falls into 20 to 34 years age bracket with 64.1% of them unmarried at the time of birth, while the lowest percentage of unmarried women with births belong to 35 to 50 years age bracket with 0.0% of them unmarried.
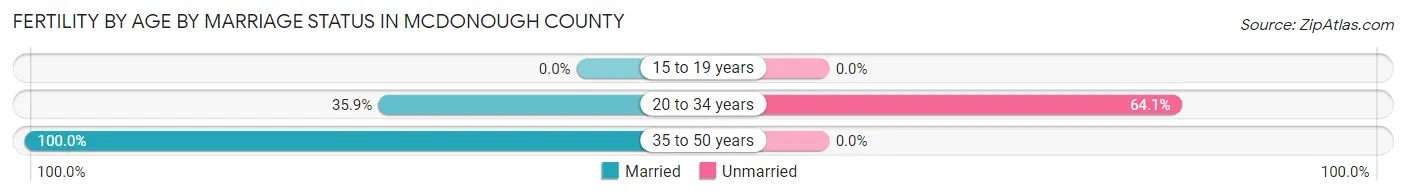
| Age Bracket | Married | Unmarried |
| 15 to 19 years | 0 (0.0%) | 0 (0.0%) |
| 20 to 34 years | 46 (35.9%) | 82 (64.1%) |
| 35 to 50 years | 14 (100.0%) | 0 (0.0%) |
| Total | 60 (42.2%) | 82 (57.8%) |
Fertility by Education in McDonough County
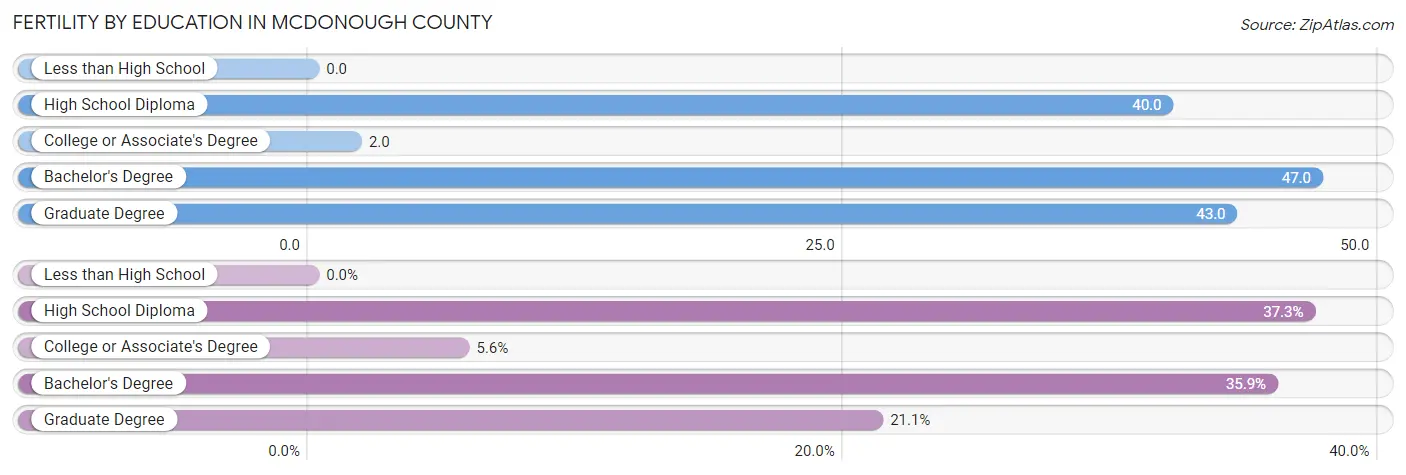
| Educational Attainment | Women with Births | Births / 1,000 Women |
| Less than High School | 0 (0.0%) | 0.0 |
| High School Diploma | 53 (37.3%) | 40.0 |
| College or Associate's Degree | 8 (5.6%) | 2.0 |
| Bachelor's Degree | 51 (35.9%) | 47.0 |
| Graduate Degree | 30 (21.1%) | 43.0 |
| Total | 142 (100.0%) | 20.0 |
Fertility by Education by Marriage Status in McDonough County
57.8% of women with births in McDonough County are unmarried. Women with the educational attainment of college or associate's degree are most likely to be married with 100.0% of them married at childbirth, while women with the educational attainment of high school diploma are least likely to be married with 88.7% of them unmarried at childbirth.
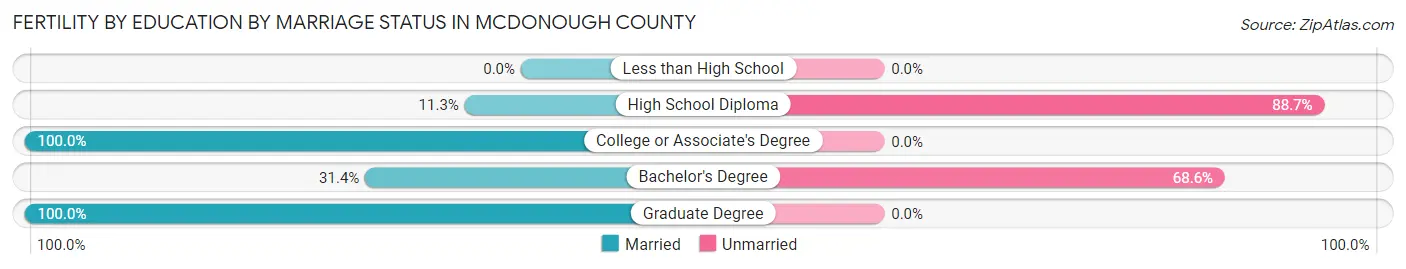
| Educational Attainment | Married | Unmarried |
| Less than High School | 0 (0.0%) | 0 (0.0%) |
| High School Diploma | 6 (11.3%) | 47 (88.7%) |
| College or Associate's Degree | 8 (100.0%) | 0 (0.0%) |
| Bachelor's Degree | 16 (31.4%) | 35 (68.6%) |
| Graduate Degree | 30 (100.0%) | 0 (0.0%) |
| Total | 60 (42.2%) | 82 (57.8%) |
Employment Characteristics in McDonough County
Employment by Class of Employer in McDonough County
Among the 12,596 employed individuals in McDonough County, private company employees (7,449 | 59.1%), state government employees (1,884 | 15.0%), and not-for-profit organizations (1,006 | 8.0%) make up the most common classes of employment.
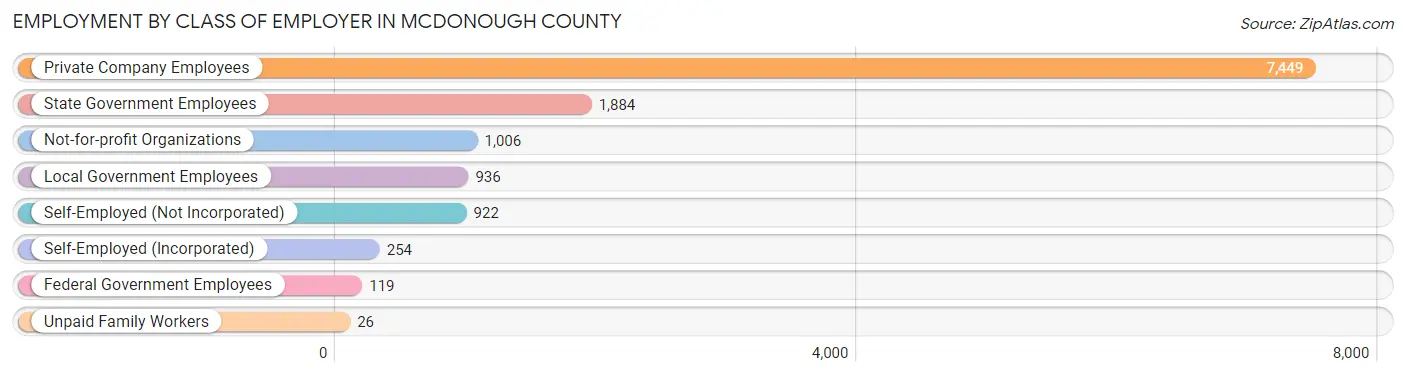
| Employer Class | # Employees | % Employees |
| Private Company Employees | 7,449 | 59.1% |
| Self-Employed (Incorporated) | 254 | 2.0% |
| Self-Employed (Not Incorporated) | 922 | 7.3% |
| Not-for-profit Organizations | 1,006 | 8.0% |
| Local Government Employees | 936 | 7.4% |
| State Government Employees | 1,884 | 15.0% |
| Federal Government Employees | 119 | 0.9% |
| Unpaid Family Workers | 26 | 0.2% |
| Total | 12,596 | 100.0% |
Employment Status by Age in McDonough County
According to the labor force statistics for McDonough County, out of the total population over 16 years of age (23,165), 60.5% or 14,015 individuals are in the labor force, with 8.0% or 1,121 of them unemployed. The age group with the highest labor force participation rate is 25 to 29 years, with 88.6% or 1,380 individuals in the labor force. Within the labor force, the 16 to 19 years age range has the highest percentage of unemployed individuals, with 16.4% or 158 of them being unemployed.
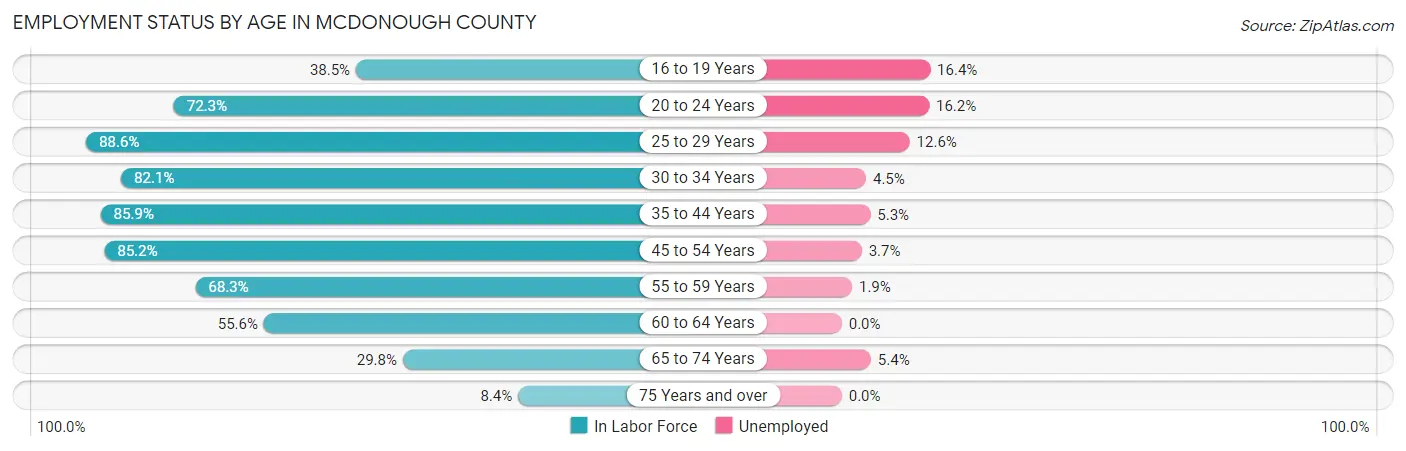
| Age Bracket | In Labor Force | Unemployed |
| 16 to 19 Years | 962 (38.5%) | 158 (16.4%) |
| 20 to 24 Years | 2,855 (72.3%) | 463 (16.2%) |
| 25 to 29 Years | 1,380 (88.6%) | 174 (12.6%) |
| 30 to 34 Years | 1,232 (82.1%) | 55 (4.5%) |
| 35 to 44 Years | 2,455 (85.9%) | 130 (5.3%) |
| 45 to 54 Years | 2,090 (85.2%) | 77 (3.7%) |
| 55 to 59 Years | 1,119 (68.3%) | 21 (1.9%) |
| 60 to 64 Years | 870 (55.6%) | 0 (0.0%) |
| 65 to 74 Years | 857 (29.8%) | 46 (5.4%) |
| 75 Years and over | 191 (8.4%) | 0 (0.0%) |
| Total | 14,015 (60.5%) | 1,121 (8.0%) |
Employment Status by Educational Attainment in McDonough County
According to labor force statistics for McDonough County, 79.1% of individuals (9,153) out of the total population between 25 and 64 years of age (11,572) are in the labor force, with 5.0% or 458 of them being unemployed. The group with the highest labor force participation rate are those with the educational attainment of bachelor's degree or higher, with 88.3% or 3,334 individuals in the labor force. Within the labor force, individuals with high school diploma education have the highest percentage of unemployment, with 9.2% or 249 of them being unemployed.
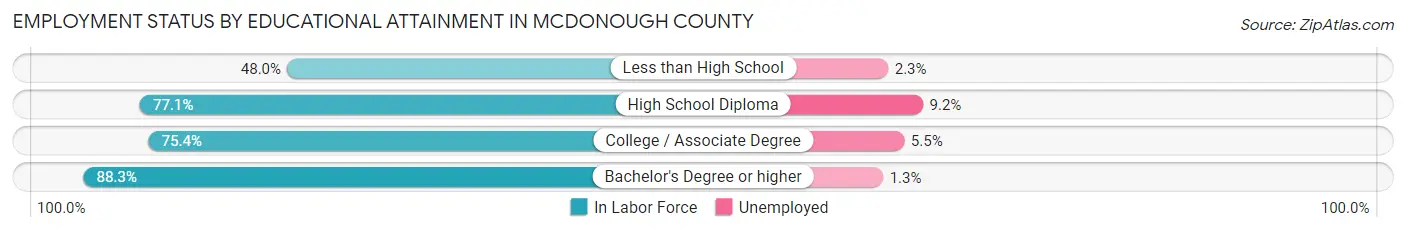
| Educational Attainment | In Labor Force | Unemployed |
| Less than High School | 214 (48.0%) | 10 (2.3%) |
| High School Diploma | 2,705 (77.1%) | 323 (9.2%) |
| College / Associate Degree | 2,897 (75.4%) | 211 (5.5%) |
| Bachelor's Degree or higher | 3,334 (88.3%) | 49 (1.3%) |
| Total | 9,153 (79.1%) | 579 (5.0%) |
Employment Occupations by Sex in McDonough County
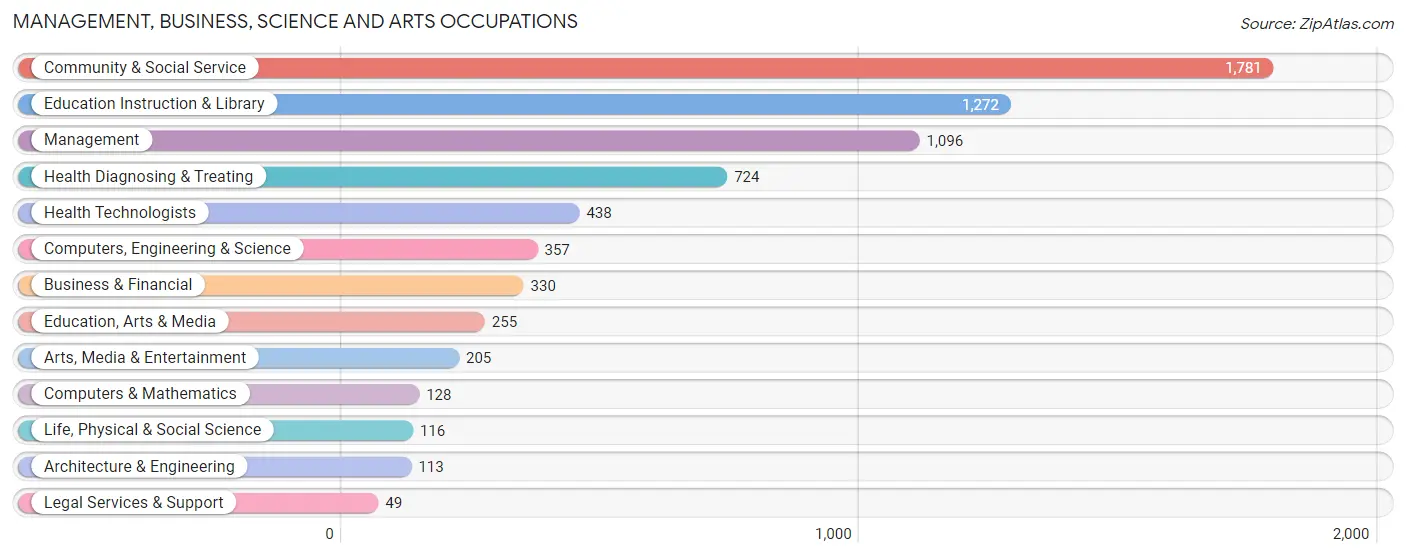
Management, Business, Science and Arts Occupations
The most common Management, Business, Science and Arts occupations in McDonough County are Community & Social Service (1,781 | 13.8%), Education Instruction & Library (1,272 | 9.9%), Management (1,096 | 8.5%), Health Diagnosing & Treating (724 | 5.6%), and Health Technologists (438 | 3.4%).
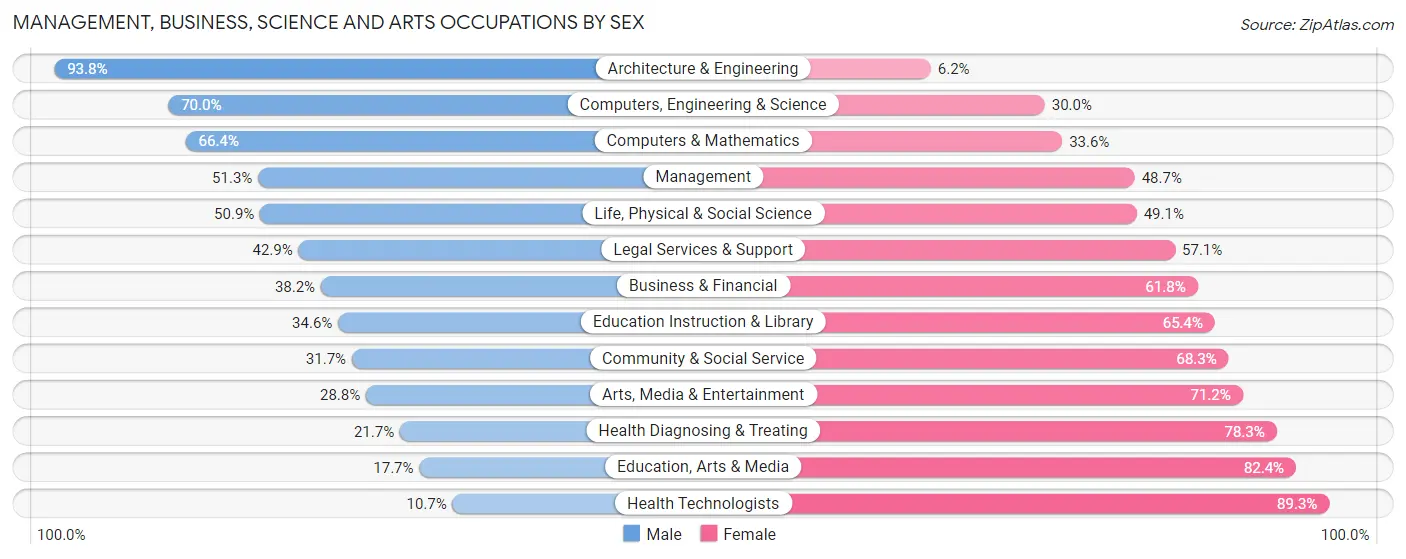
Management, Business, Science and Arts Occupations by Sex
Within the Management, Business, Science and Arts occupations in McDonough County, the most male-oriented occupations are Architecture & Engineering (93.8%), Computers, Engineering & Science (70.0%), and Computers & Mathematics (66.4%), while the most female-oriented occupations are Health Technologists (89.3%), Education, Arts & Media (82.4%), and Health Diagnosing & Treating (78.3%).
| Occupation | Male | Female |
| Management | 562 (51.3%) | 534 (48.7%) |
| Business & Financial | 126 (38.2%) | 204 (61.8%) |
| Computers, Engineering & Science | 250 (70.0%) | 107 (30.0%) |
| Computers & Mathematics | 85 (66.4%) | 43 (33.6%) |
| Architecture & Engineering | 106 (93.8%) | 7 (6.2%) |
| Life, Physical & Social Science | 59 (50.9%) | 57 (49.1%) |
| Community & Social Service | 565 (31.7%) | 1,216 (68.3%) |
| Education, Arts & Media | 45 (17.6%) | 210 (82.4%) |
| Legal Services & Support | 21 (42.9%) | 28 (57.1%) |
| Education Instruction & Library | 440 (34.6%) | 832 (65.4%) |
| Arts, Media & Entertainment | 59 (28.8%) | 146 (71.2%) |
| Health Diagnosing & Treating | 157 (21.7%) | 567 (78.3%) |
| Health Technologists | 47 (10.7%) | 391 (89.3%) |
| Total (Category) | 1,660 (38.7%) | 2,628 (61.3%) |
| Total (Overall) | 6,584 (51.1%) | 6,291 (48.9%) |
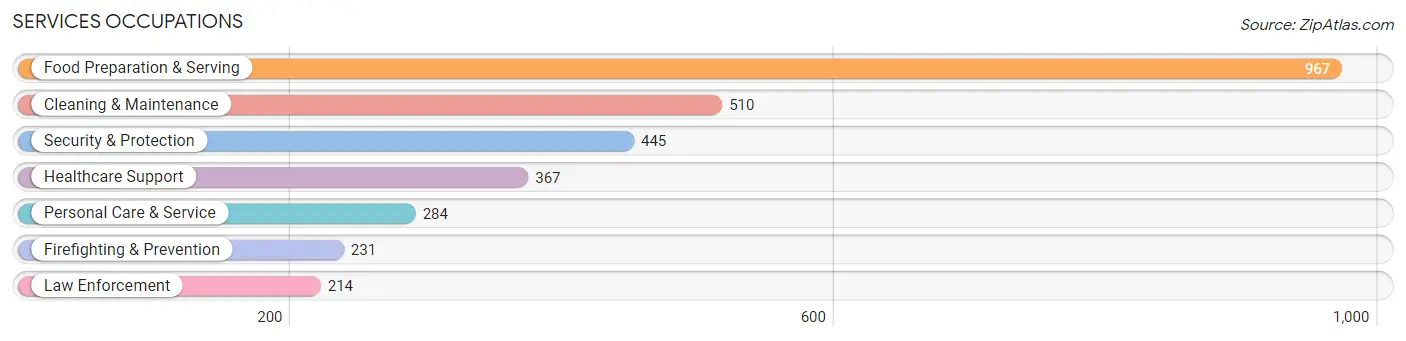
Services Occupations
The most common Services occupations in McDonough County are Food Preparation & Serving (967 | 7.5%), Cleaning & Maintenance (510 | 4.0%), Security & Protection (445 | 3.5%), Healthcare Support (367 | 2.9%), and Personal Care & Service (284 | 2.2%).
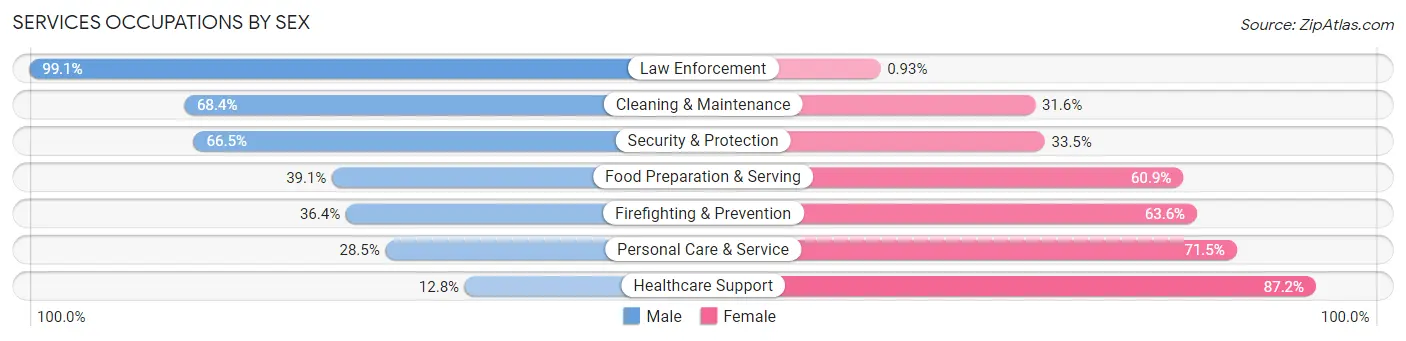
Services Occupations by Sex
Within the Services occupations in McDonough County, the most male-oriented occupations are Law Enforcement (99.1%), Cleaning & Maintenance (68.4%), and Security & Protection (66.5%), while the most female-oriented occupations are Healthcare Support (87.2%), Personal Care & Service (71.5%), and Firefighting & Prevention (63.6%).
| Occupation | Male | Female |
| Healthcare Support | 47 (12.8%) | 320 (87.2%) |
| Security & Protection | 296 (66.5%) | 149 (33.5%) |
| Firefighting & Prevention | 84 (36.4%) | 147 (63.6%) |
| Law Enforcement | 212 (99.1%) | 2 (0.9%) |
| Food Preparation & Serving | 378 (39.1%) | 589 (60.9%) |
| Cleaning & Maintenance | 349 (68.4%) | 161 (31.6%) |
| Personal Care & Service | 81 (28.5%) | 203 (71.5%) |
| Total (Category) | 1,151 (44.7%) | 1,422 (55.3%) |
| Total (Overall) | 6,584 (51.1%) | 6,291 (48.9%) |
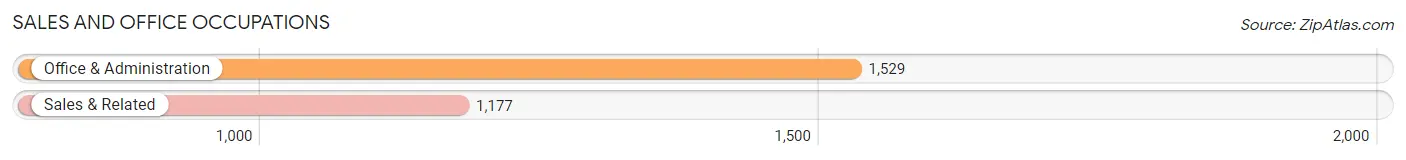
Sales and Office Occupations
The most common Sales and Office occupations in McDonough County are Office & Administration (1,529 | 11.9%), and Sales & Related (1,177 | 9.1%).
Sales and Office Occupations by Sex
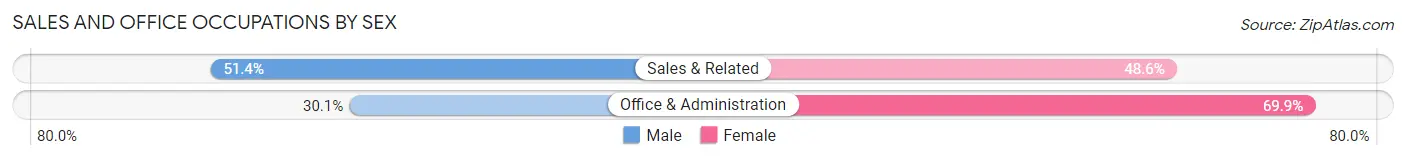
| Occupation | Male | Female |
| Sales & Related | 605 (51.4%) | 572 (48.6%) |
| Office & Administration | 460 (30.1%) | 1,069 (69.9%) |
| Total (Category) | 1,065 (39.4%) | 1,641 (60.6%) |
| Total (Overall) | 6,584 (51.1%) | 6,291 (48.9%) |
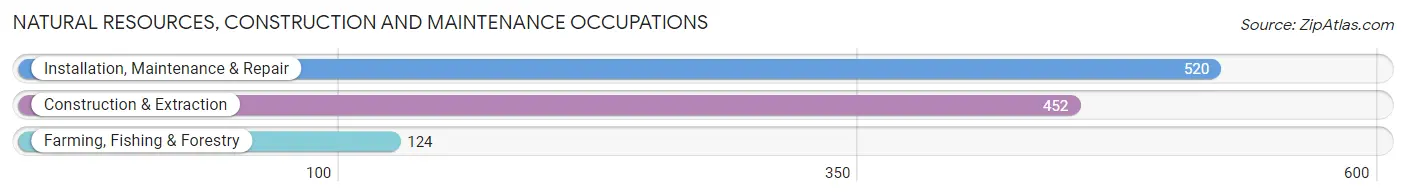
Natural Resources, Construction and Maintenance Occupations
The most common Natural Resources, Construction and Maintenance occupations in McDonough County are Installation, Maintenance & Repair (520 | 4.0%), Construction & Extraction (452 | 3.5%), and Farming, Fishing & Forestry (124 | 1.0%).
Natural Resources, Construction and Maintenance Occupations by Sex
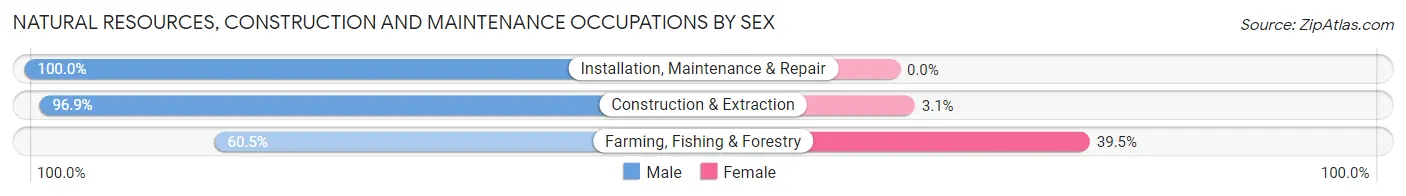
| Occupation | Male | Female |
| Farming, Fishing & Forestry | 75 (60.5%) | 49 (39.5%) |
| Construction & Extraction | 438 (96.9%) | 14 (3.1%) |
| Installation, Maintenance & Repair | 520 (100.0%) | 0 (0.0%) |
| Total (Category) | 1,033 (94.3%) | 63 (5.8%) |
| Total (Overall) | 6,584 (51.1%) | 6,291 (48.9%) |
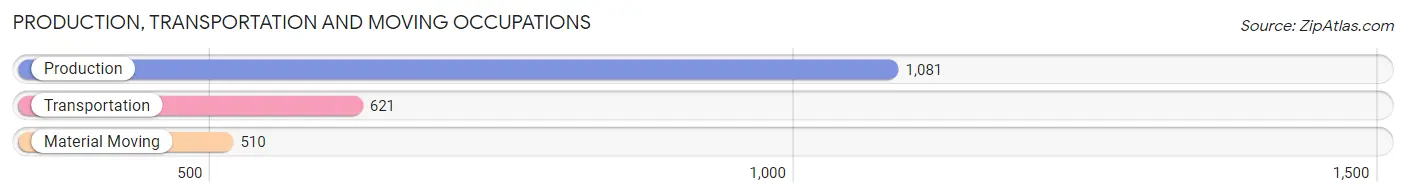
Production, Transportation and Moving Occupations
The most common Production, Transportation and Moving occupations in McDonough County are Production (1,081 | 8.4%), Transportation (621 | 4.8%), and Material Moving (510 | 4.0%).
Production, Transportation and Moving Occupations by Sex
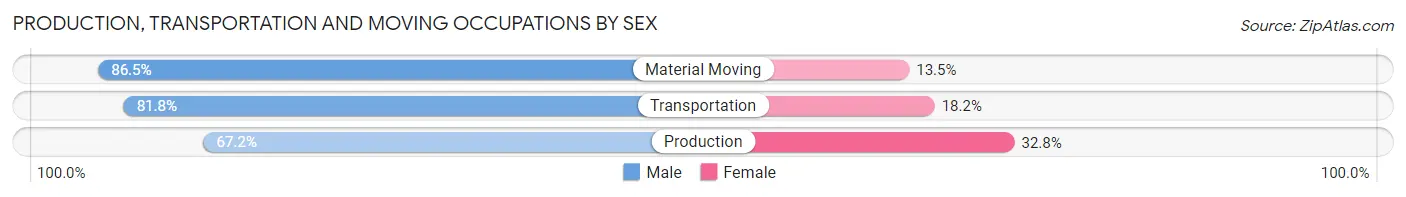
| Occupation | Male | Female |
| Production | 726 (67.2%) | 355 (32.8%) |
| Transportation | 508 (81.8%) | 113 (18.2%) |
| Material Moving | 441 (86.5%) | 69 (13.5%) |
| Total (Category) | 1,675 (75.7%) | 537 (24.3%) |
| Total (Overall) | 6,584 (51.1%) | 6,291 (48.9%) |
Employment Industries by Sex in McDonough County
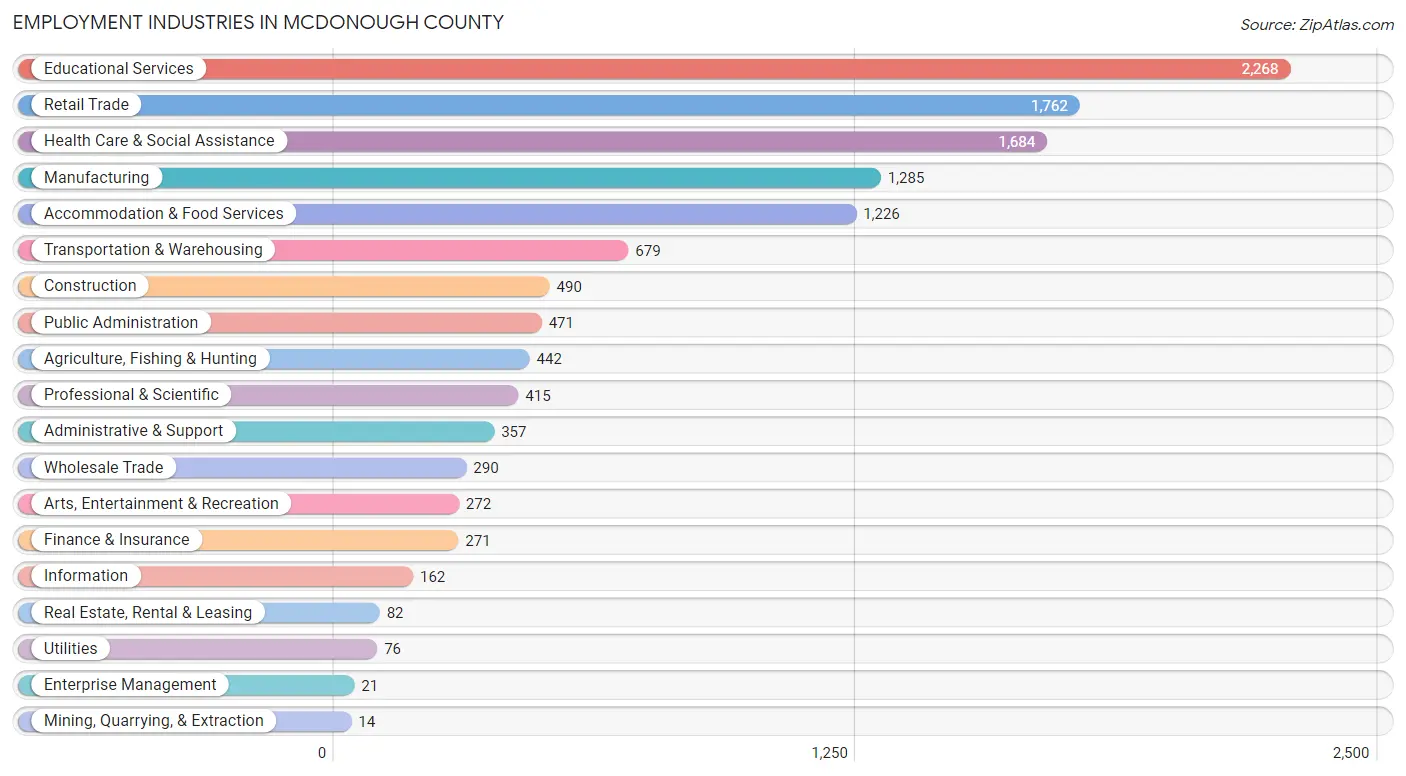
Employment Industries in McDonough County
The major employment industries in McDonough County include Educational Services (2,268 | 17.6%), Retail Trade (1,762 | 13.7%), Health Care & Social Assistance (1,684 | 13.1%), Manufacturing (1,285 | 10.0%), and Accommodation & Food Services (1,226 | 9.5%).
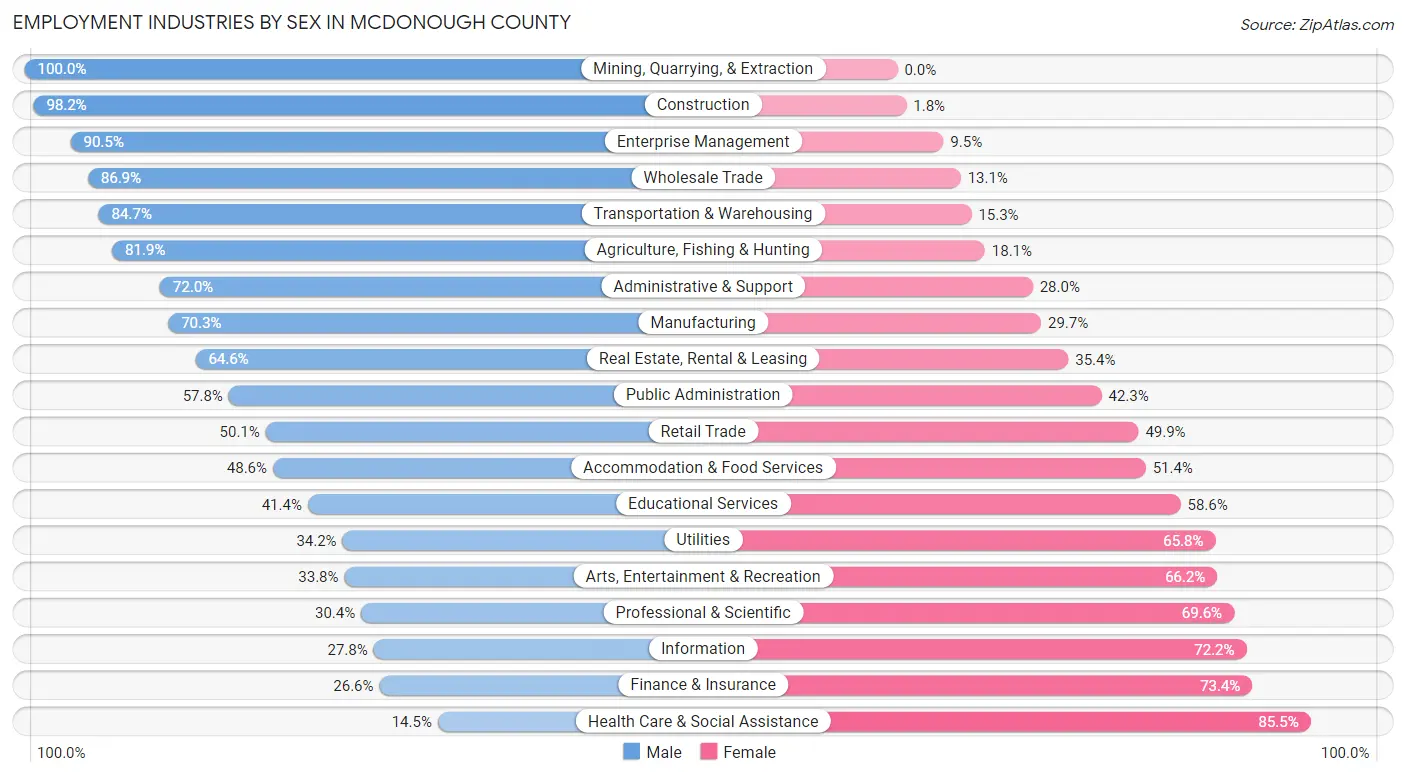
Employment Industries by Sex in McDonough County
The McDonough County industries that see more men than women are Mining, Quarrying, & Extraction (100.0%), Construction (98.2%), and Enterprise Management (90.5%), whereas the industries that tend to have a higher number of women are Health Care & Social Assistance (85.5%), Finance & Insurance (73.4%), and Information (72.2%).
| Industry | Male | Female |
| Agriculture, Fishing & Hunting | 362 (81.9%) | 80 (18.1%) |
| Mining, Quarrying, & Extraction | 14 (100.0%) | 0 (0.0%) |
| Construction | 481 (98.2%) | 9 (1.8%) |
| Manufacturing | 903 (70.3%) | 382 (29.7%) |
| Wholesale Trade | 252 (86.9%) | 38 (13.1%) |
| Retail Trade | 883 (50.1%) | 879 (49.9%) |
| Transportation & Warehousing | 575 (84.7%) | 104 (15.3%) |
| Utilities | 26 (34.2%) | 50 (65.8%) |
| Information | 45 (27.8%) | 117 (72.2%) |
| Finance & Insurance | 72 (26.6%) | 199 (73.4%) |
| Real Estate, Rental & Leasing | 53 (64.6%) | 29 (35.4%) |
| Professional & Scientific | 126 (30.4%) | 289 (69.6%) |
| Enterprise Management | 19 (90.5%) | 2 (9.5%) |
| Administrative & Support | 257 (72.0%) | 100 (28.0%) |
| Educational Services | 939 (41.4%) | 1,329 (58.6%) |
| Health Care & Social Assistance | 244 (14.5%) | 1,440 (85.5%) |
| Arts, Entertainment & Recreation | 92 (33.8%) | 180 (66.2%) |
| Accommodation & Food Services | 596 (48.6%) | 630 (51.4%) |
| Public Administration | 272 (57.8%) | 199 (42.2%) |
| Total | 6,584 (51.1%) | 6,291 (48.9%) |
Education in McDonough County
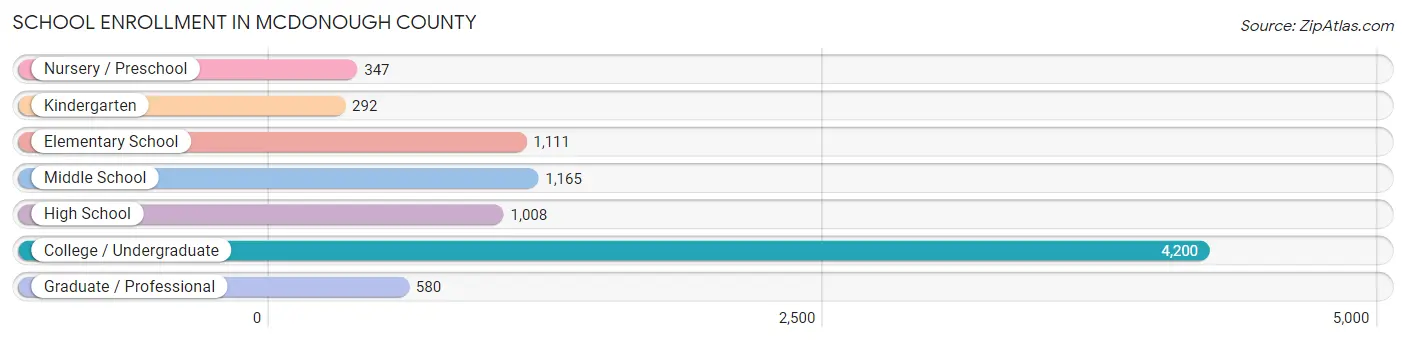
School Enrollment in McDonough County
The most common levels of schooling among the 8,703 students in McDonough County are college / undergraduate (4,200 | 48.3%), middle school (1,165 | 13.4%), and elementary school (1,111 | 12.8%).
| School Level | # Students | % Students |
| Nursery / Preschool | 347 | 4.0% |
| Kindergarten | 292 | 3.4% |
| Elementary School | 1,111 | 12.8% |
| Middle School | 1,165 | 13.4% |
| High School | 1,008 | 11.6% |
| College / Undergraduate | 4,200 | 48.3% |
| Graduate / Professional | 580 | 6.7% |
| Total | 8,703 | 100.0% |
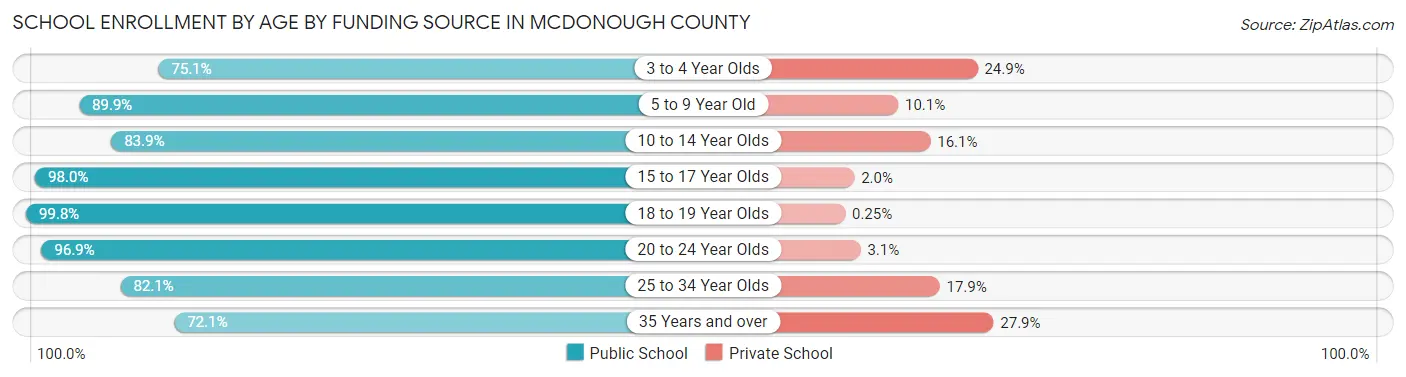
School Enrollment by Age by Funding Source in McDonough County
Out of a total of 8,703 students who are enrolled in schools in McDonough County, 705 (8.1%) attend a private institution, while the remaining 7,998 (91.9%) are enrolled in public schools. The age group of 35 years and over has the highest likelihood of being enrolled in private schools, with 63 (27.9% in the age bracket) enrolled. Conversely, the age group of 18 to 19 year olds has the lowest likelihood of being enrolled in a private school, with 1,622 (99.8% in the age bracket) attending a public institution.
| Age Bracket | Public School | Private School |
| 3 to 4 Year Olds | 250 (75.1%) | 83 (24.9%) |
| 5 to 9 Year Old | 1,109 (89.9%) | 125 (10.1%) |
| 10 to 14 Year Olds | 1,242 (83.9%) | 239 (16.1%) |
| 15 to 17 Year Olds | 751 (98.0%) | 15 (2.0%) |
| 18 to 19 Year Olds | 1,622 (99.8%) | 4 (0.3%) |
| 20 to 24 Year Olds | 2,416 (96.9%) | 78 (3.1%) |
| 25 to 34 Year Olds | 446 (82.1%) | 97 (17.9%) |
| 35 Years and over | 163 (72.1%) | 63 (27.9%) |
| Total | 7,998 (91.9%) | 705 (8.1%) |
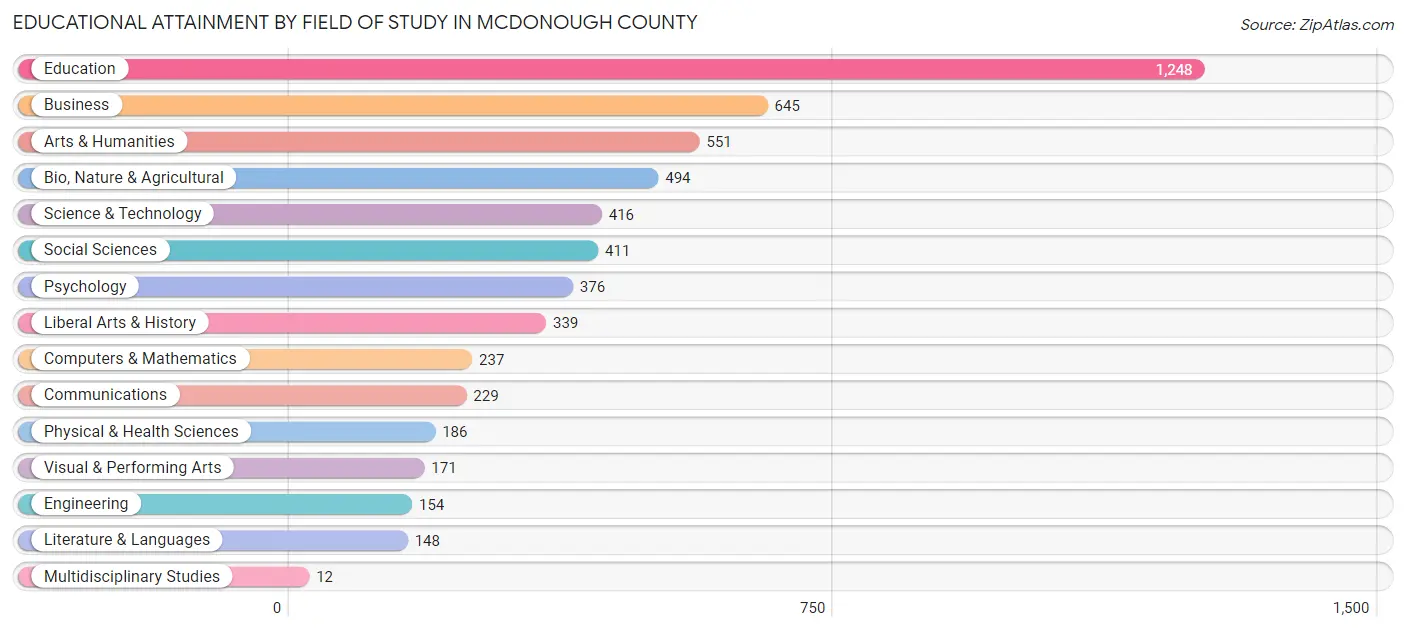
Educational Attainment by Field of Study in McDonough County
Education (1,248 | 22.2%), business (645 | 11.5%), arts & humanities (551 | 9.8%), bio, nature & agricultural (494 | 8.8%), and science & technology (416 | 7.4%) are the most common fields of study among 5,617 individuals in McDonough County who have obtained a bachelor's degree or higher.
| Field of Study | # Graduates | % Graduates |
| Computers & Mathematics | 237 | 4.2% |
| Bio, Nature & Agricultural | 494 | 8.8% |
| Physical & Health Sciences | 186 | 3.3% |
| Psychology | 376 | 6.7% |
| Social Sciences | 411 | 7.3% |
| Engineering | 154 | 2.7% |
| Multidisciplinary Studies | 12 | 0.2% |
| Science & Technology | 416 | 7.4% |
| Business | 645 | 11.5% |
| Education | 1,248 | 22.2% |
| Literature & Languages | 148 | 2.6% |
| Liberal Arts & History | 339 | 6.0% |
| Visual & Performing Arts | 171 | 3.0% |
| Communications | 229 | 4.1% |
| Arts & Humanities | 551 | 9.8% |
| Total | 5,617 | 100.0% |
Transportation & Commute in McDonough County
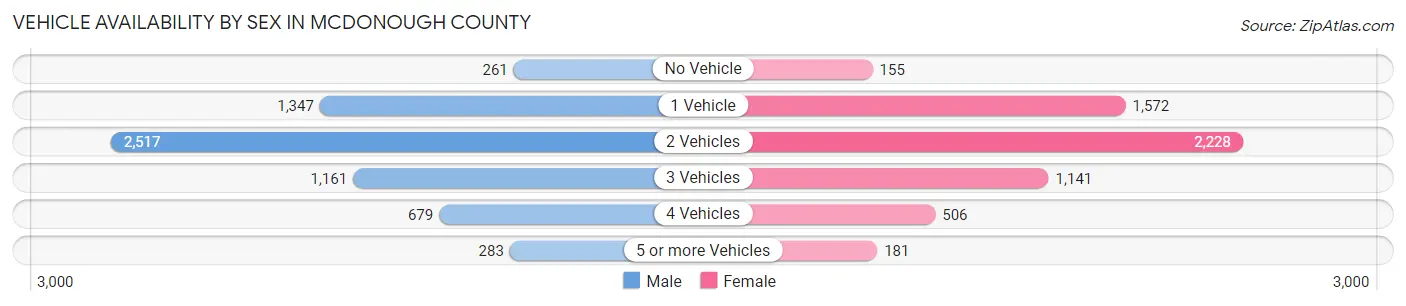
Vehicle Availability by Sex in McDonough County
The most prevalent vehicle ownership categories in McDonough County are males with 2 vehicles (2,517, accounting for 40.3%) and females with 2 vehicles (2,228, making up 43.5%).
| Vehicles Available | Male | Female |
| No Vehicle | 261 (4.2%) | 155 (2.7%) |
| 1 Vehicle | 1,347 (21.6%) | 1,572 (27.2%) |
| 2 Vehicles | 2,517 (40.3%) | 2,228 (38.5%) |
| 3 Vehicles | 1,161 (18.6%) | 1,141 (19.7%) |
| 4 Vehicles | 679 (10.9%) | 506 (8.7%) |
| 5 or more Vehicles | 283 (4.5%) | 181 (3.1%) |
| Total | 6,248 (100.0%) | 5,783 (100.0%) |
Commute Time in McDonough County
The most frequently occuring commute durations in McDonough County are 5 to 9 minutes (3,027 commuters, 25.4%), 10 to 14 minutes (2,198 commuters, 18.4%), and 15 to 19 minutes (1,492 commuters, 12.5%).
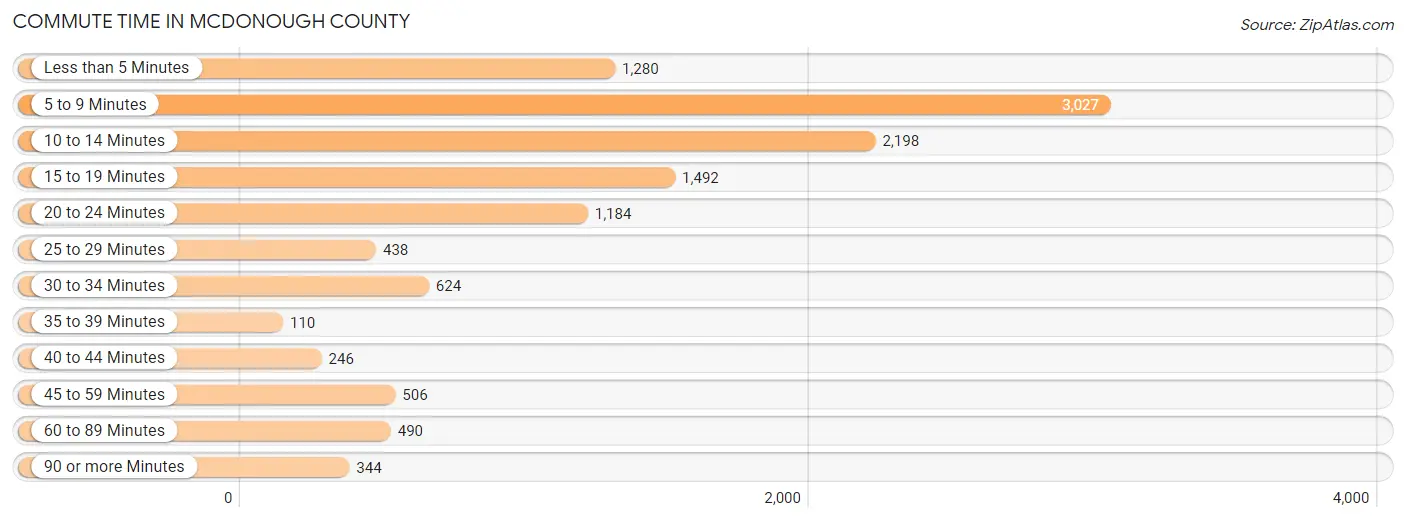
| Commute Time | # Commuters | % Commuters |
| Less than 5 Minutes | 1,280 | 10.7% |
| 5 to 9 Minutes | 3,027 | 25.4% |
| 10 to 14 Minutes | 2,198 | 18.4% |
| 15 to 19 Minutes | 1,492 | 12.5% |
| 20 to 24 Minutes | 1,184 | 9.9% |
| 25 to 29 Minutes | 438 | 3.7% |
| 30 to 34 Minutes | 624 | 5.2% |
| 35 to 39 Minutes | 110 | 0.9% |
| 40 to 44 Minutes | 246 | 2.1% |
| 45 to 59 Minutes | 506 | 4.2% |
| 60 to 89 Minutes | 490 | 4.1% |
| 90 or more Minutes | 344 | 2.9% |
Commute Time by Sex in McDonough County
The most common commute times in McDonough County are 5 to 9 minutes (1,416 commuters, 22.8%) for males and 5 to 9 minutes (1,611 commuters, 28.2%) for females.
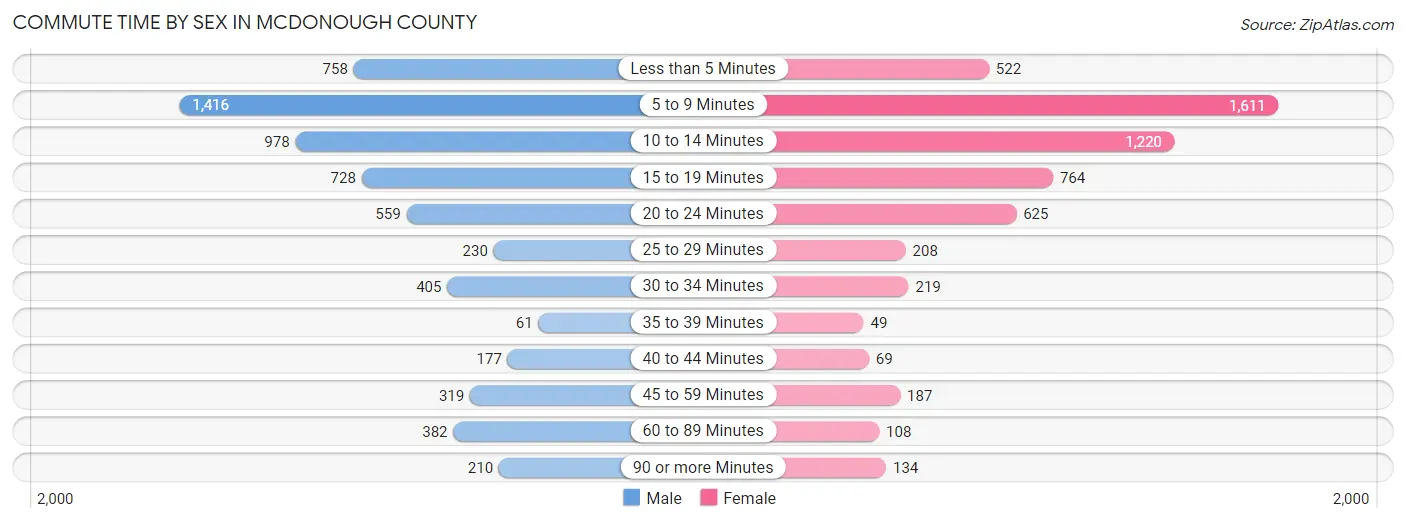
| Commute Time | Male | Female |
| Less than 5 Minutes | 758 (12.2%) | 522 (9.1%) |
| 5 to 9 Minutes | 1,416 (22.8%) | 1,611 (28.2%) |
| 10 to 14 Minutes | 978 (15.7%) | 1,220 (21.3%) |
| 15 to 19 Minutes | 728 (11.7%) | 764 (13.4%) |
| 20 to 24 Minutes | 559 (9.0%) | 625 (10.9%) |
| 25 to 29 Minutes | 230 (3.7%) | 208 (3.6%) |
| 30 to 34 Minutes | 405 (6.5%) | 219 (3.8%) |
| 35 to 39 Minutes | 61 (1.0%) | 49 (0.9%) |
| 40 to 44 Minutes | 177 (2.8%) | 69 (1.2%) |
| 45 to 59 Minutes | 319 (5.1%) | 187 (3.3%) |
| 60 to 89 Minutes | 382 (6.1%) | 108 (1.9%) |
| 90 or more Minutes | 210 (3.4%) | 134 (2.3%) |
Time of Departure to Work by Sex in McDonough County
The most frequent times of departure to work in McDonough County are 7:00 AM to 7:29 AM (988, 15.9%) for males and 7:30 AM to 7:59 AM (985, 17.2%) for females.
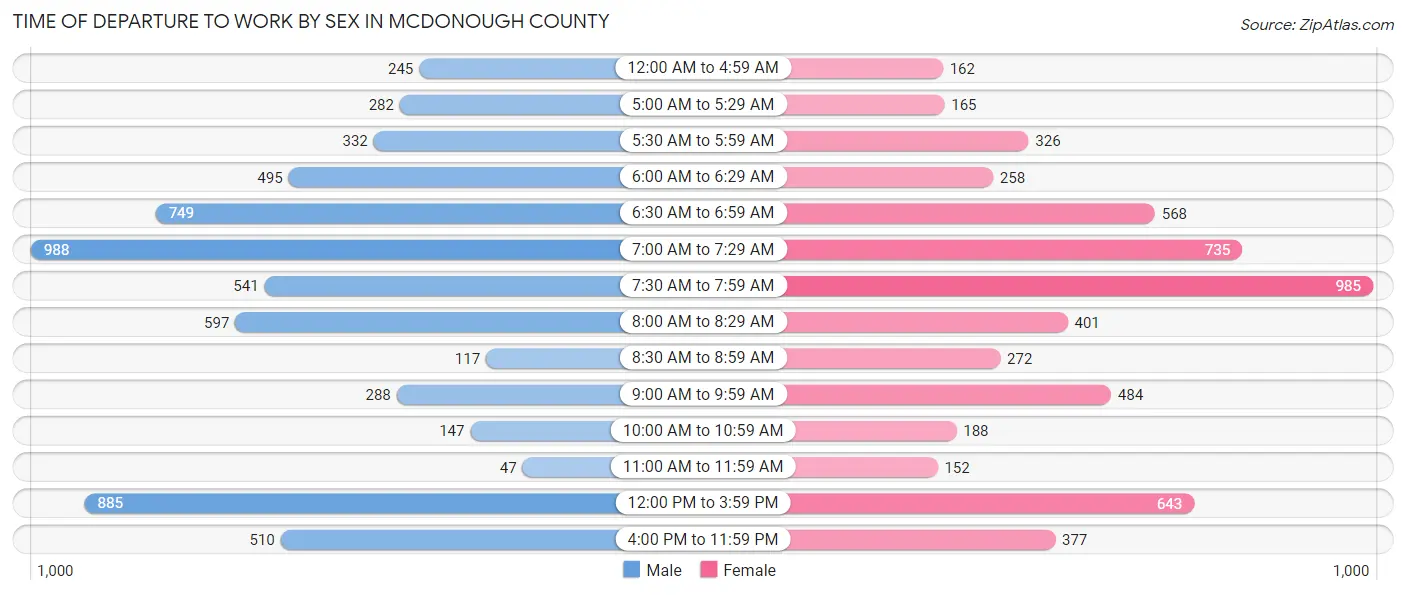
| Time of Departure | Male | Female |
| 12:00 AM to 4:59 AM | 245 (3.9%) | 162 (2.8%) |
| 5:00 AM to 5:29 AM | 282 (4.5%) | 165 (2.9%) |
| 5:30 AM to 5:59 AM | 332 (5.3%) | 326 (5.7%) |
| 6:00 AM to 6:29 AM | 495 (8.0%) | 258 (4.5%) |
| 6:30 AM to 6:59 AM | 749 (12.0%) | 568 (9.9%) |
| 7:00 AM to 7:29 AM | 988 (15.9%) | 735 (12.9%) |
| 7:30 AM to 7:59 AM | 541 (8.7%) | 985 (17.2%) |
| 8:00 AM to 8:29 AM | 597 (9.6%) | 401 (7.0%) |
| 8:30 AM to 8:59 AM | 117 (1.9%) | 272 (4.8%) |
| 9:00 AM to 9:59 AM | 288 (4.6%) | 484 (8.5%) |
| 10:00 AM to 10:59 AM | 147 (2.4%) | 188 (3.3%) |
| 11:00 AM to 11:59 AM | 47 (0.8%) | 152 (2.7%) |
| 12:00 PM to 3:59 PM | 885 (14.2%) | 643 (11.3%) |
| 4:00 PM to 11:59 PM | 510 (8.2%) | 377 (6.6%) |
| Total | 6,223 (100.0%) | 5,716 (100.0%) |
Housing Occupancy in McDonough County
Occupancy by Ownership in McDonough County
Of the total 11,600 dwellings in McDonough County, owner-occupied units account for 7,106 (61.3%), while renter-occupied units make up 4,494 (38.7%).
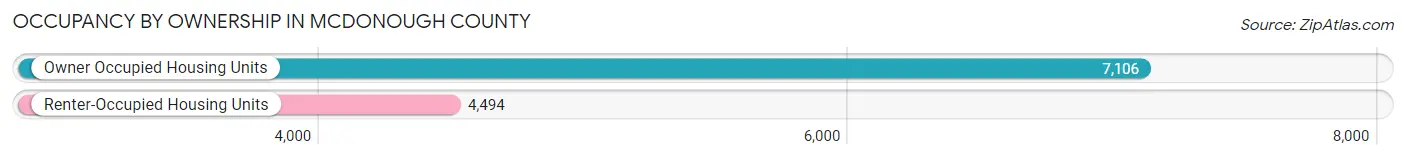
| Occupancy | # Housing Units | % Housing Units |
| Owner Occupied Housing Units | 7,106 | 61.3% |
| Renter-Occupied Housing Units | 4,494 | 38.7% |
| Total Occupied Housing Units | 11,600 | 100.0% |
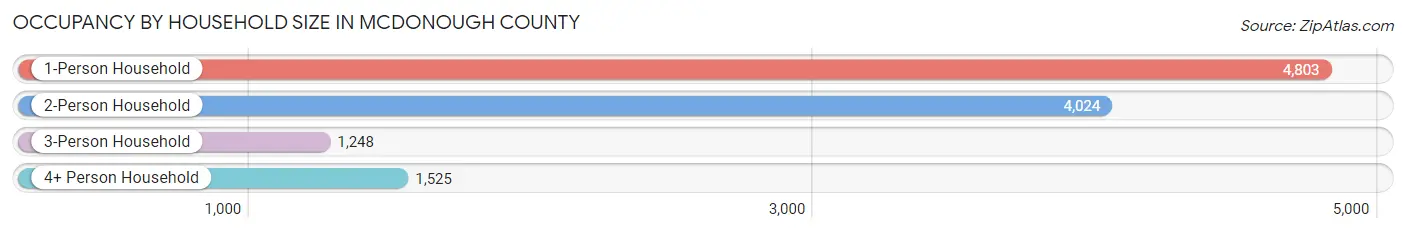
Occupancy by Household Size in McDonough County
| Household Size | # Housing Units | % Housing Units |
| 1-Person Household | 4,803 | 41.4% |
| 2-Person Household | 4,024 | 34.7% |
| 3-Person Household | 1,248 | 10.8% |
| 4+ Person Household | 1,525 | 13.2% |
| Total Housing Units | 11,600 | 100.0% |
Occupancy by Ownership by Household Size in McDonough County
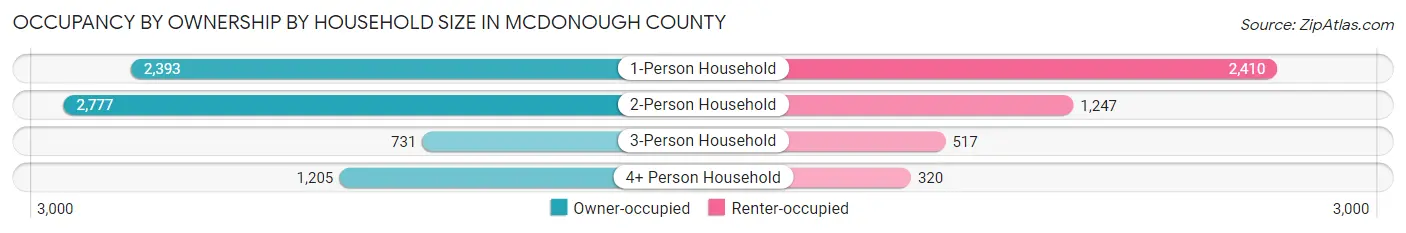
| Household Size | Owner-occupied | Renter-occupied |
| 1-Person Household | 2,393 (49.8%) | 2,410 (50.2%) |
| 2-Person Household | 2,777 (69.0%) | 1,247 (31.0%) |
| 3-Person Household | 731 (58.6%) | 517 (41.4%) |
| 4+ Person Household | 1,205 (79.0%) | 320 (21.0%) |
| Total Housing Units | 7,106 (61.3%) | 4,494 (38.7%) |
Occupancy by Educational Attainment in McDonough County
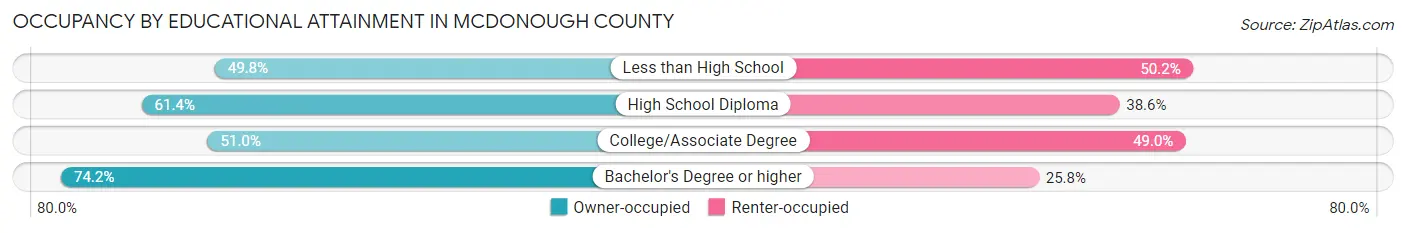
| Household Size | Owner-occupied | Renter-occupied |
| Less than High School | 435 (49.8%) | 438 (50.2%) |
| High School Diploma | 2,020 (61.4%) | 1,268 (38.6%) |
| College/Associate Degree | 1,909 (51.0%) | 1,835 (49.0%) |
| Bachelor's Degree or higher | 2,742 (74.2%) | 953 (25.8%) |
Occupancy by Age of Householder in McDonough County
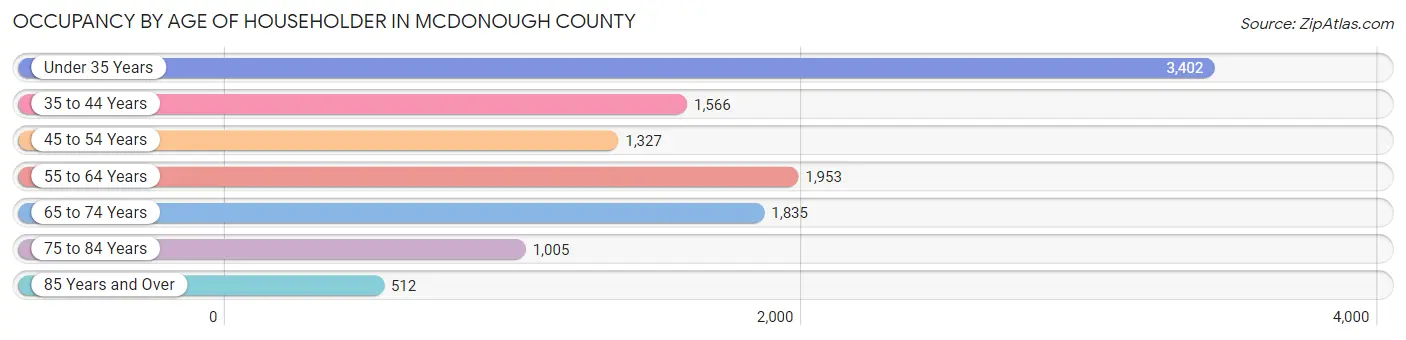
| Age Bracket | # Households | % Households |
| Under 35 Years | 3,402 | 29.3% |
| 35 to 44 Years | 1,566 | 13.5% |
| 45 to 54 Years | 1,327 | 11.4% |
| 55 to 64 Years | 1,953 | 16.8% |
| 65 to 74 Years | 1,835 | 15.8% |
| 75 to 84 Years | 1,005 | 8.7% |
| 85 Years and Over | 512 | 4.4% |
| Total | 11,600 | 100.0% |
Housing Finances in McDonough County
Median Income by Occupancy in McDonough County
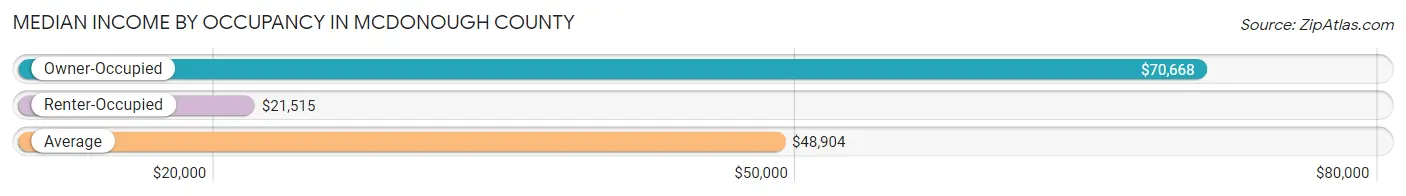
| Occupancy Type | # Households | Median Income |
| Owner-Occupied | 7,106 (61.3%) | $70,668 |
| Renter-Occupied | 4,494 (38.7%) | $21,515 |
| Average | 11,600 (100.0%) | $48,904 |
Occupancy by Householder Income Bracket in McDonough County
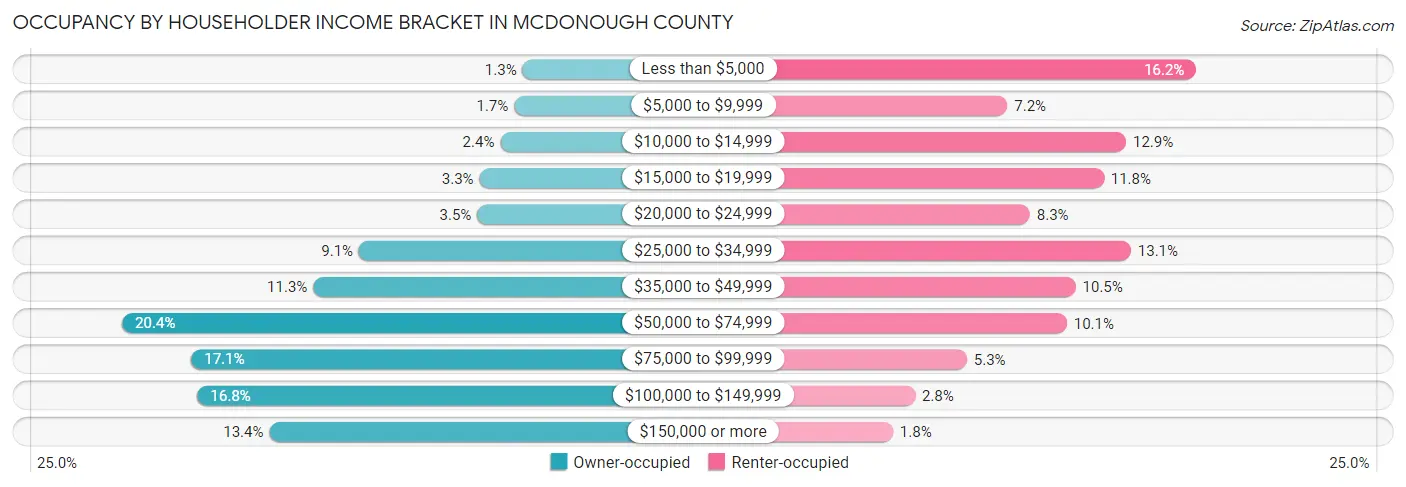
| Income Bracket | Owner-occupied | Renter-occupied |
| Less than $5,000 | 92 (1.3%) | 729 (16.2%) |
| $5,000 to $9,999 | 120 (1.7%) | 325 (7.2%) |
| $10,000 to $14,999 | 167 (2.4%) | 579 (12.9%) |
| $15,000 to $19,999 | 237 (3.3%) | 531 (11.8%) |
| $20,000 to $24,999 | 245 (3.5%) | 373 (8.3%) |
| $25,000 to $34,999 | 645 (9.1%) | 589 (13.1%) |
| $35,000 to $49,999 | 800 (11.3%) | 471 (10.5%) |
| $50,000 to $74,999 | 1,447 (20.4%) | 452 (10.1%) |
| $75,000 to $99,999 | 1,212 (17.1%) | 238 (5.3%) |
| $100,000 to $149,999 | 1,192 (16.8%) | 127 (2.8%) |
| $150,000 or more | 949 (13.4%) | 80 (1.8%) |
| Total | 7,106 (100.0%) | 4,494 (100.0%) |
Monthly Housing Cost Tiers in McDonough County
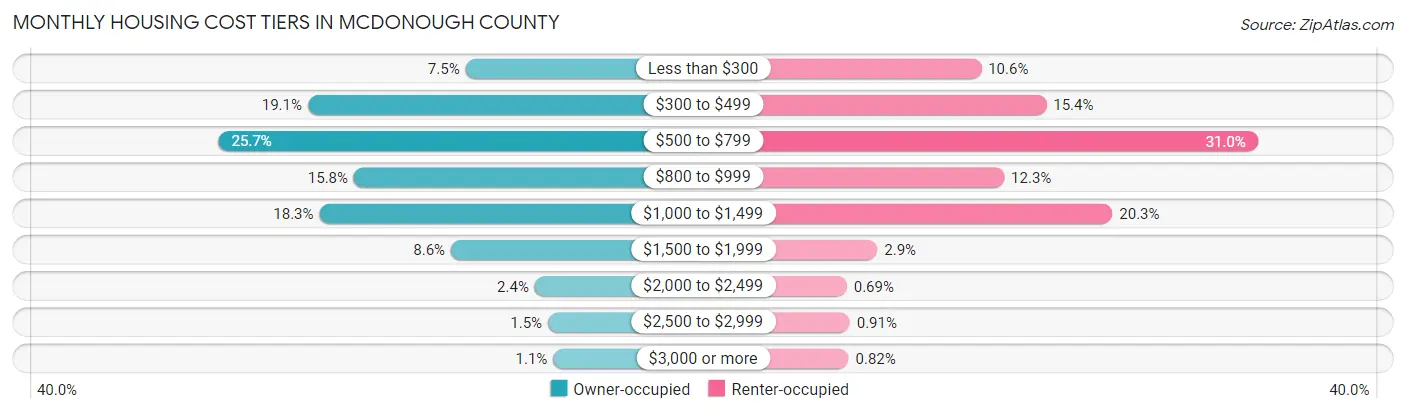
| Monthly Cost | Owner-occupied | Renter-occupied |
| Less than $300 | 535 (7.5%) | 476 (10.6%) |
| $300 to $499 | 1,360 (19.1%) | 691 (15.4%) |
| $500 to $799 | 1,828 (25.7%) | 1,391 (30.9%) |
| $800 to $999 | 1,119 (15.8%) | 552 (12.3%) |
| $1,000 to $1,499 | 1,300 (18.3%) | 910 (20.3%) |
| $1,500 to $1,999 | 611 (8.6%) | 132 (2.9%) |
| $2,000 to $2,499 | 173 (2.4%) | 31 (0.7%) |
| $2,500 to $2,999 | 104 (1.5%) | 41 (0.9%) |
| $3,000 or more | 76 (1.1%) | 37 (0.8%) |
| Total | 7,106 (100.0%) | 4,494 (100.0%) |
Physical Housing Characteristics in McDonough County
Housing Structures in McDonough County
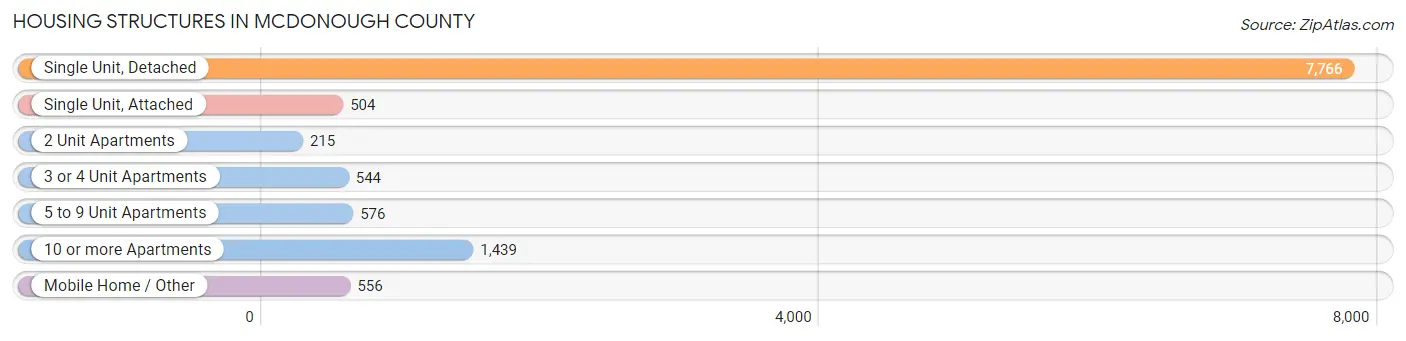
| Structure Type | # Housing Units | % Housing Units |
| Single Unit, Detached | 7,766 | 66.9% |
| Single Unit, Attached | 504 | 4.3% |
| 2 Unit Apartments | 215 | 1.8% |
| 3 or 4 Unit Apartments | 544 | 4.7% |
| 5 to 9 Unit Apartments | 576 | 5.0% |
| 10 or more Apartments | 1,439 | 12.4% |
| Mobile Home / Other | 556 | 4.8% |
| Total | 11,600 | 100.0% |
Housing Structures by Occupancy in McDonough County
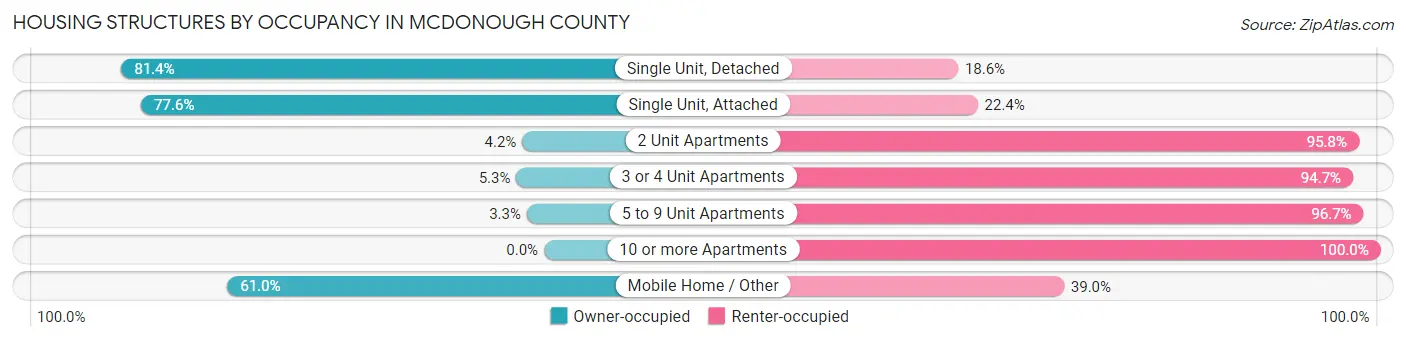
| Structure Type | Owner-occupied | Renter-occupied |
| Single Unit, Detached | 6,319 (81.4%) | 1,447 (18.6%) |
| Single Unit, Attached | 391 (77.6%) | 113 (22.4%) |
| 2 Unit Apartments | 9 (4.2%) | 206 (95.8%) |
| 3 or 4 Unit Apartments | 29 (5.3%) | 515 (94.7%) |
| 5 to 9 Unit Apartments | 19 (3.3%) | 557 (96.7%) |
| 10 or more Apartments | 0 (0.0%) | 1,439 (100.0%) |
| Mobile Home / Other | 339 (61.0%) | 217 (39.0%) |
| Total | 7,106 (61.3%) | 4,494 (38.7%) |
Housing Structures by Number of Rooms in McDonough County
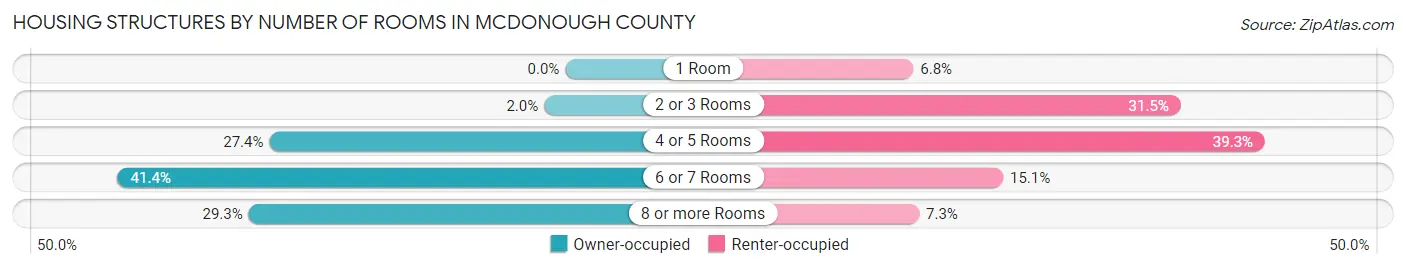
| Number of Rooms | Owner-occupied | Renter-occupied |
| 1 Room | 0 (0.0%) | 305 (6.8%) |
| 2 or 3 Rooms | 139 (2.0%) | 1,416 (31.5%) |
| 4 or 5 Rooms | 1,945 (27.4%) | 1,766 (39.3%) |
| 6 or 7 Rooms | 2,941 (41.4%) | 678 (15.1%) |
| 8 or more Rooms | 2,081 (29.3%) | 329 (7.3%) |
| Total | 7,106 (100.0%) | 4,494 (100.0%) |
Housing Structure by Heating Type in McDonough County
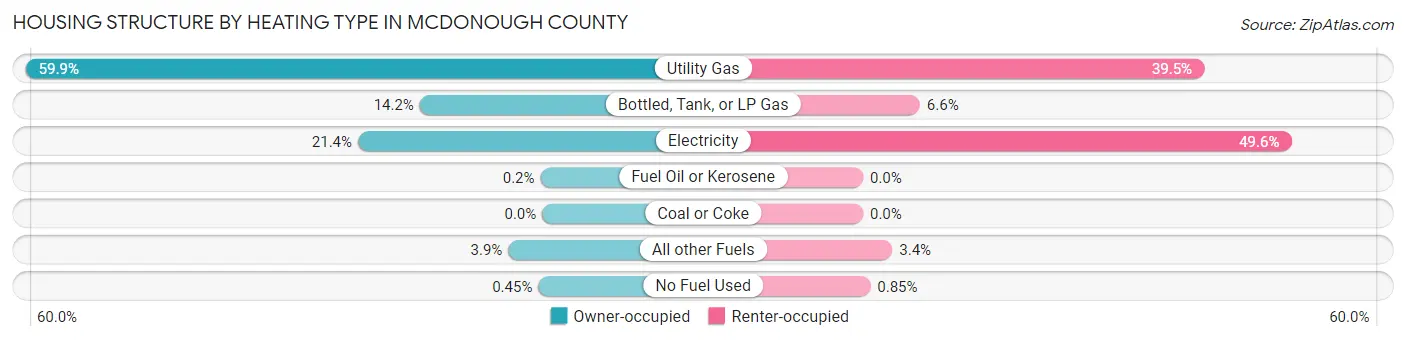
| Heating Type | Owner-occupied | Renter-occupied |
| Utility Gas | 4,255 (59.9%) | 1,776 (39.5%) |
| Bottled, Tank, or LP Gas | 1,008 (14.2%) | 296 (6.6%) |
| Electricity | 1,518 (21.4%) | 2,231 (49.6%) |
| Fuel Oil or Kerosene | 14 (0.2%) | 0 (0.0%) |
| Coal or Coke | 0 (0.0%) | 0 (0.0%) |
| All other Fuels | 279 (3.9%) | 153 (3.4%) |
| No Fuel Used | 32 (0.4%) | 38 (0.9%) |
| Total | 7,106 (100.0%) | 4,494 (100.0%) |
Household Vehicle Usage in McDonough County
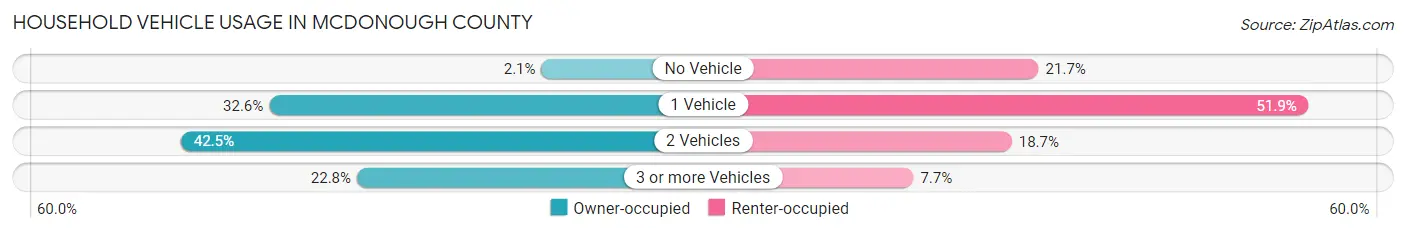
| Vehicles per Household | Owner-occupied | Renter-occupied |
| No Vehicle | 150 (2.1%) | 975 (21.7%) |
| 1 Vehicle | 2,317 (32.6%) | 2,334 (51.9%) |
| 2 Vehicles | 3,020 (42.5%) | 840 (18.7%) |
| 3 or more Vehicles | 1,619 (22.8%) | 345 (7.7%) |
| Total | 7,106 (100.0%) | 4,494 (100.0%) |
Real Estate & Mortgages in McDonough County
Real Estate and Mortgage Overview in McDonough County
| Characteristic | Without Mortgage | With Mortgage |
| Housing Units | 3,414 | 3,692 |
| Median Property Value | $94,700 | $105,400 |
| Median Household Income | $64,194 | $592 |
| Monthly Housing Costs | $497 | $76 |
| Real Estate Taxes | $2,146 | $79 |
Property Value by Mortgage Status in McDonough County
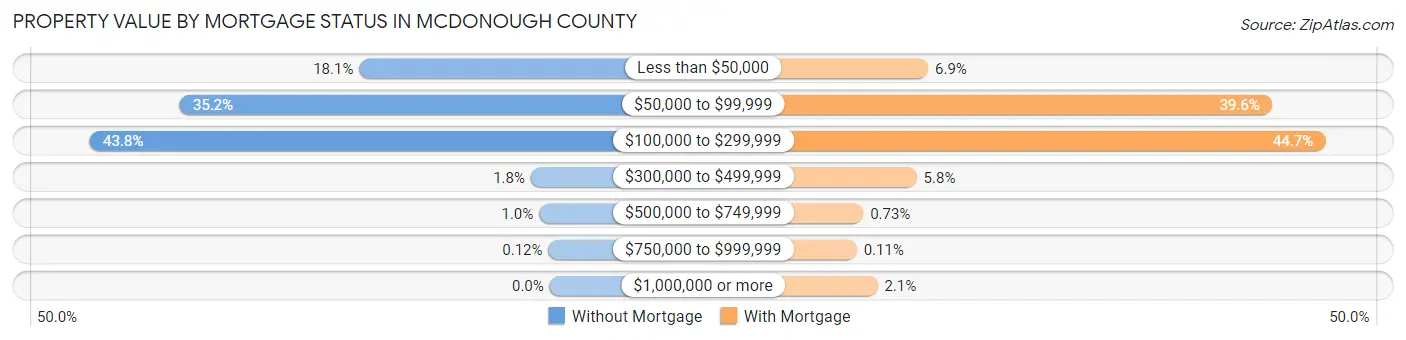
| Property Value | Without Mortgage | With Mortgage |
| Less than $50,000 | 619 (18.1%) | 255 (6.9%) |
| $50,000 to $99,999 | 1,202 (35.2%) | 1,463 (39.6%) |
| $100,000 to $299,999 | 1,494 (43.8%) | 1,651 (44.7%) |
| $300,000 to $499,999 | 61 (1.8%) | 215 (5.8%) |
| $500,000 to $749,999 | 34 (1.0%) | 27 (0.7%) |
| $750,000 to $999,999 | 4 (0.1%) | 4 (0.1%) |
| $1,000,000 or more | 0 (0.0%) | 77 (2.1%) |
| Total | 3,414 (100.0%) | 3,692 (100.0%) |
Household Income by Mortgage Status in McDonough County
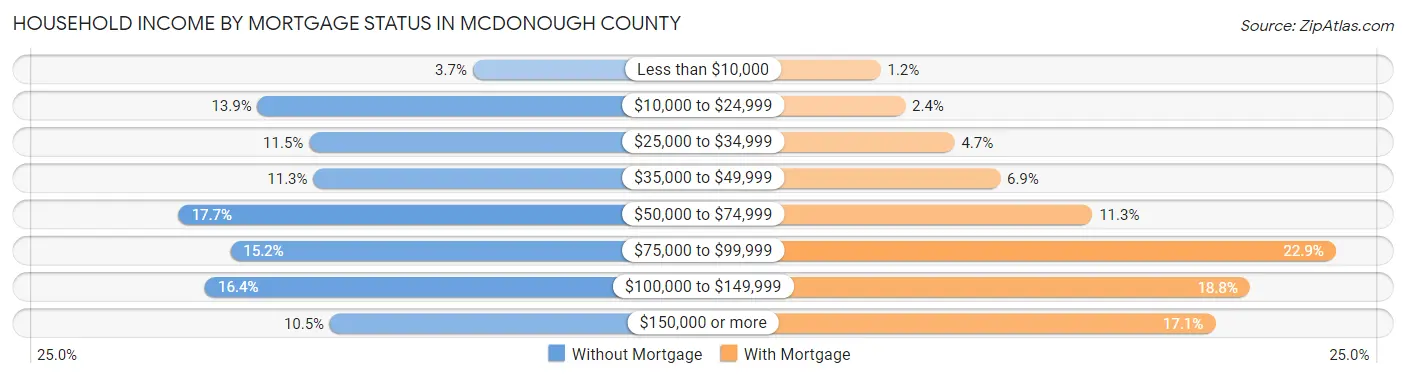
| Household Income | Without Mortgage | With Mortgage |
| Less than $10,000 | 125 (3.7%) | 44 (1.2%) |
| $10,000 to $24,999 | 475 (13.9%) | 87 (2.4%) |
| $25,000 to $34,999 | 391 (11.5%) | 174 (4.7%) |
| $35,000 to $49,999 | 384 (11.3%) | 254 (6.9%) |
| $50,000 to $74,999 | 603 (17.7%) | 416 (11.3%) |
| $75,000 to $99,999 | 519 (15.2%) | 844 (22.9%) |
| $100,000 to $149,999 | 560 (16.4%) | 693 (18.8%) |
| $150,000 or more | 357 (10.5%) | 632 (17.1%) |
| Total | 3,414 (100.0%) | 3,692 (100.0%) |
Property Value to Household Income Ratio in McDonough County
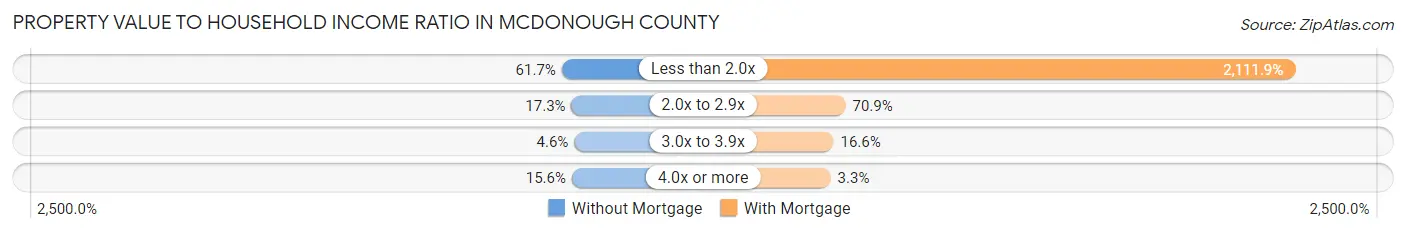
| Value-to-Income Ratio | Without Mortgage | With Mortgage |
| Less than 2.0x | 2,106 (61.7%) | 77,972 (2,111.9%) |
| 2.0x to 2.9x | 590 (17.3%) | 2,618 (70.9%) |
| 3.0x to 3.9x | 158 (4.6%) | 611 (16.6%) |
| 4.0x or more | 534 (15.6%) | 122 (3.3%) |
| Total | 3,414 (100.0%) | 3,692 (100.0%) |
Real Estate Taxes by Mortgage Status in McDonough County
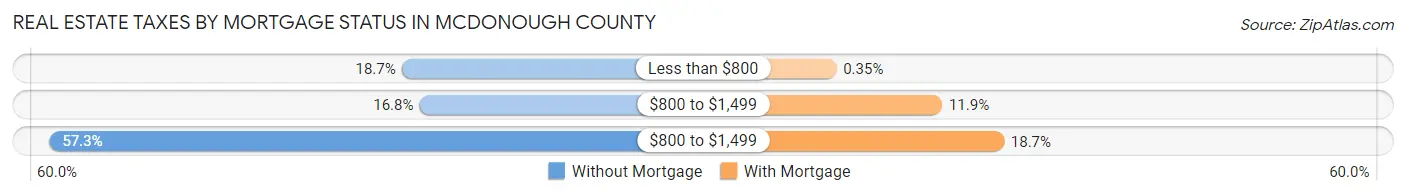
| Property Taxes | Without Mortgage | With Mortgage |
| Less than $800 | 638 (18.7%) | 13 (0.4%) |
| $800 to $1,499 | 572 (16.8%) | 441 (11.9%) |
| $800 to $1,499 | 1,956 (57.3%) | 691 (18.7%) |
| Total | 3,414 (100.0%) | 3,692 (100.0%) |
Health & Disability in McDonough County
Health Insurance Coverage by Age in McDonough County
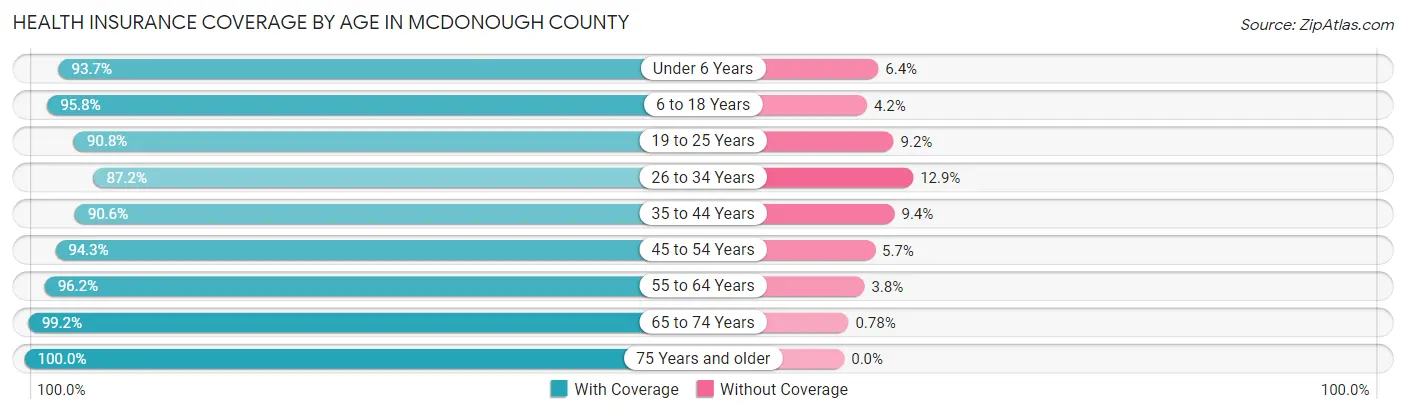
| Age Bracket | With Coverage | Without Coverage |
| Under 6 Years | 1,357 (93.6%) | 92 (6.4%) |
| 6 to 18 Years | 4,099 (95.8%) | 181 (4.2%) |
| 19 to 25 Years | 4,765 (90.8%) | 483 (9.2%) |
| 26 to 34 Years | 2,373 (87.2%) | 350 (12.9%) |
| 35 to 44 Years | 2,583 (90.6%) | 267 (9.4%) |
| 45 to 54 Years | 2,303 (94.3%) | 140 (5.7%) |
| 55 to 64 Years | 3,042 (96.2%) | 119 (3.8%) |
| 65 to 74 Years | 2,804 (99.2%) | 22 (0.8%) |
| 75 Years and older | 1,977 (100.0%) | 0 (0.0%) |
| Total | 25,303 (93.9%) | 1,654 (6.1%) |
Health Insurance Coverage by Citizenship Status in McDonough County
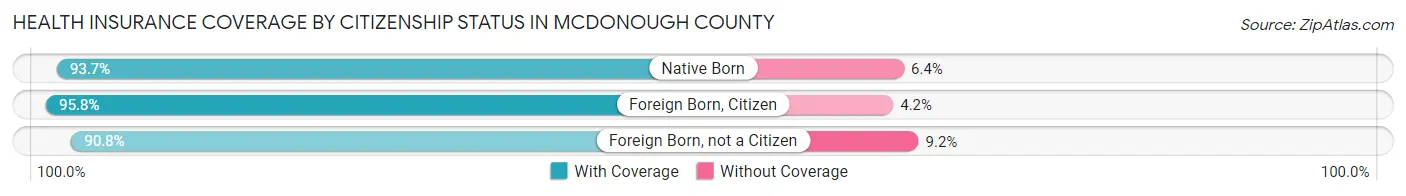
| Citizenship Status | With Coverage | Without Coverage |
| Native Born | 1,357 (93.6%) | 92 (6.4%) |
| Foreign Born, Citizen | 4,099 (95.8%) | 181 (4.2%) |
| Foreign Born, not a Citizen | 4,765 (90.8%) | 483 (9.2%) |
Health Insurance Coverage by Household Income in McDonough County
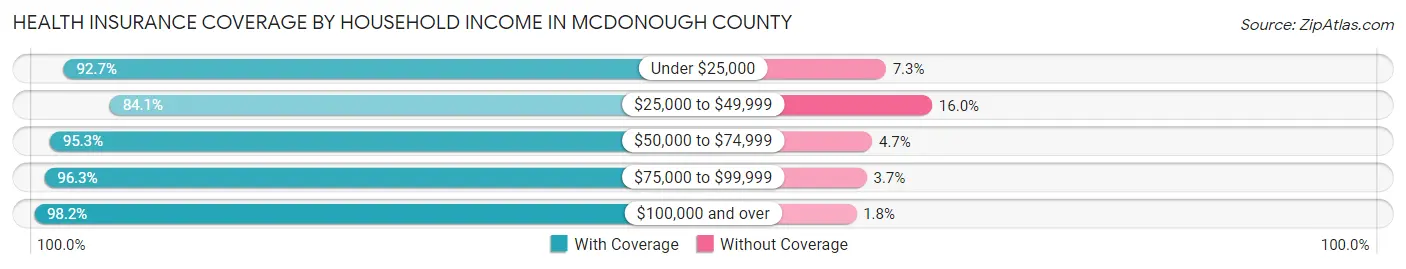
| Household Income | With Coverage | Without Coverage |
| Under $25,000 | 4,831 (92.7%) | 380 (7.3%) |
| $25,000 to $49,999 | 3,863 (84.1%) | 733 (16.0%) |
| $50,000 to $74,999 | 4,092 (95.3%) | 203 (4.7%) |
| $75,000 to $99,999 | 3,382 (96.3%) | 130 (3.7%) |
| $100,000 and over | 6,906 (98.2%) | 124 (1.8%) |
Public vs Private Health Insurance Coverage by Age in McDonough County
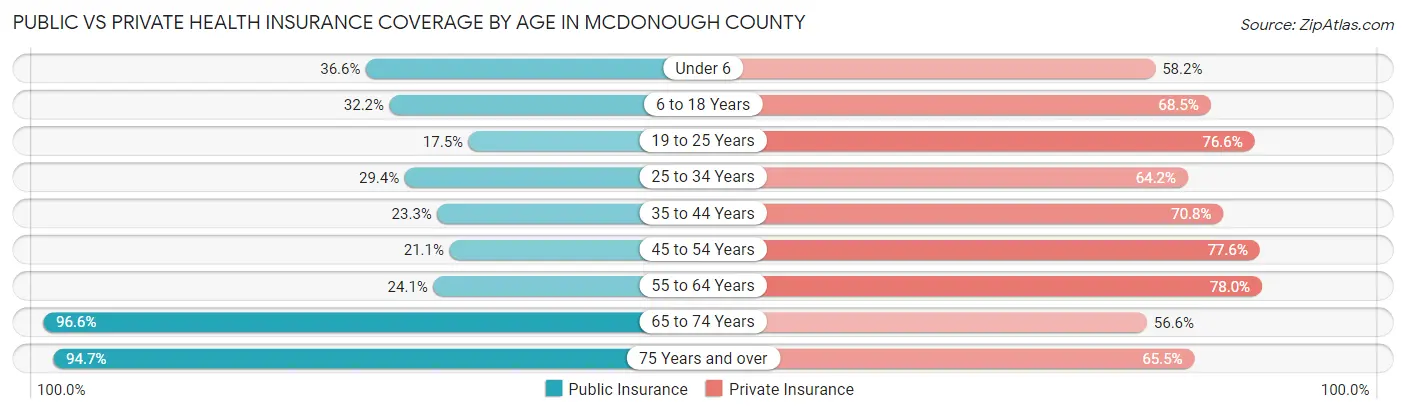
| Age Bracket | Public Insurance | Private Insurance |
| Under 6 | 530 (36.6%) | 843 (58.2%) |
| 6 to 18 Years | 1,378 (32.2%) | 2,930 (68.5%) |
| 19 to 25 Years | 920 (17.5%) | 4,020 (76.6%) |
| 25 to 34 Years | 800 (29.4%) | 1,749 (64.2%) |
| 35 to 44 Years | 665 (23.3%) | 2,018 (70.8%) |
| 45 to 54 Years | 515 (21.1%) | 1,895 (77.6%) |
| 55 to 64 Years | 761 (24.1%) | 2,465 (78.0%) |
| 65 to 74 Years | 2,729 (96.6%) | 1,600 (56.6%) |
| 75 Years and over | 1,872 (94.7%) | 1,294 (65.4%) |
| Total | 10,170 (37.7%) | 18,814 (69.8%) |
Disability Status by Sex by Age in McDonough County
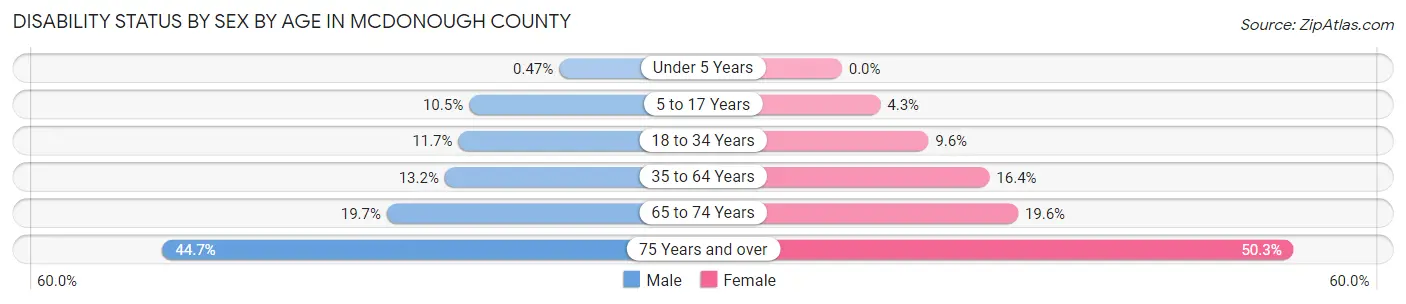
| Age Bracket | Male | Female |
| Under 5 Years | 3 (0.5%) | 0 (0.0%) |
| 5 to 17 Years | 194 (10.5%) | 74 (4.3%) |
| 18 to 34 Years | 519 (11.7%) | 429 (9.6%) |
| 35 to 64 Years | 546 (13.2%) | 710 (16.4%) |
| 65 to 74 Years | 263 (19.7%) | 292 (19.6%) |
| 75 Years and over | 359 (44.7%) | 590 (50.3%) |
Disability Class by Sex by Age in McDonough County
Disability Class: Hearing Difficulty
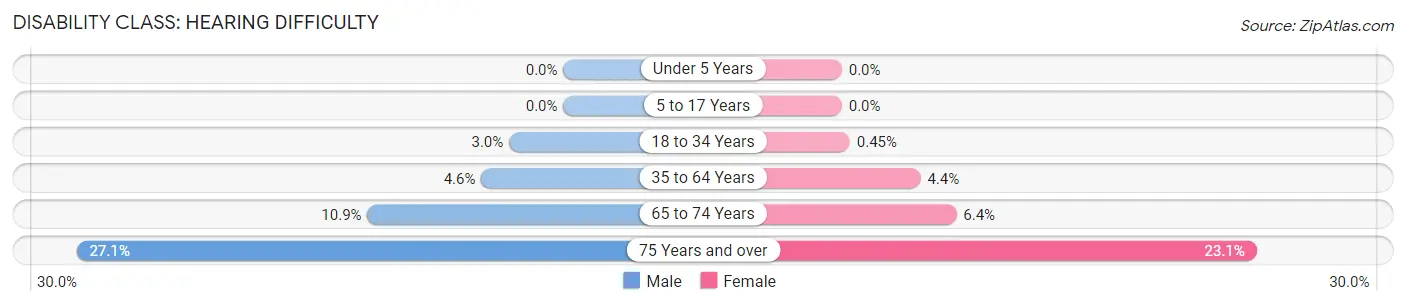
| Age Bracket | Male | Female |
| Under 5 Years | 0 (0.0%) | 0 (0.0%) |
| 5 to 17 Years | 0 (0.0%) | 0 (0.0%) |
| 18 to 34 Years | 134 (3.0%) | 20 (0.4%) |
| 35 to 64 Years | 189 (4.6%) | 189 (4.4%) |
| 65 to 74 Years | 146 (10.9%) | 95 (6.4%) |
| 75 Years and over | 218 (27.1%) | 271 (23.1%) |
Disability Class: Vision Difficulty
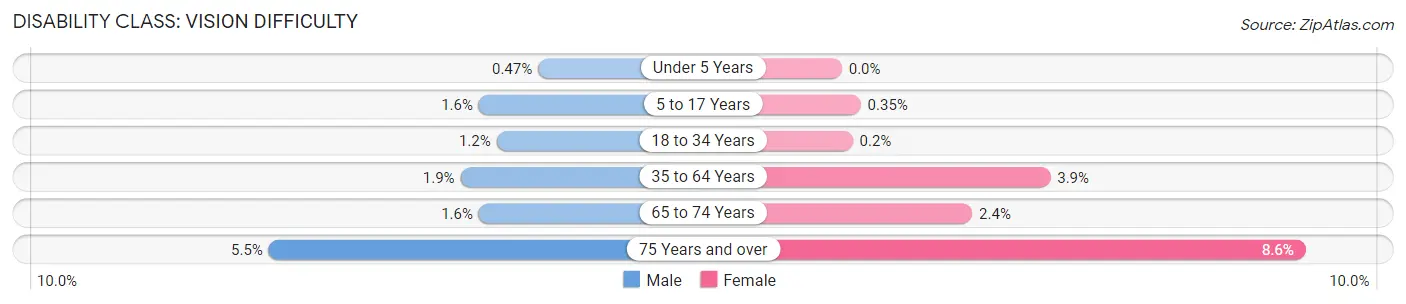
| Age Bracket | Male | Female |
| Under 5 Years | 3 (0.5%) | 0 (0.0%) |
| 5 to 17 Years | 29 (1.6%) | 6 (0.4%) |
| 18 to 34 Years | 55 (1.2%) | 9 (0.2%) |
| 35 to 64 Years | 79 (1.9%) | 167 (3.9%) |
| 65 to 74 Years | 21 (1.6%) | 36 (2.4%) |
| 75 Years and over | 44 (5.5%) | 101 (8.6%) |
Disability Class: Cognitive Difficulty
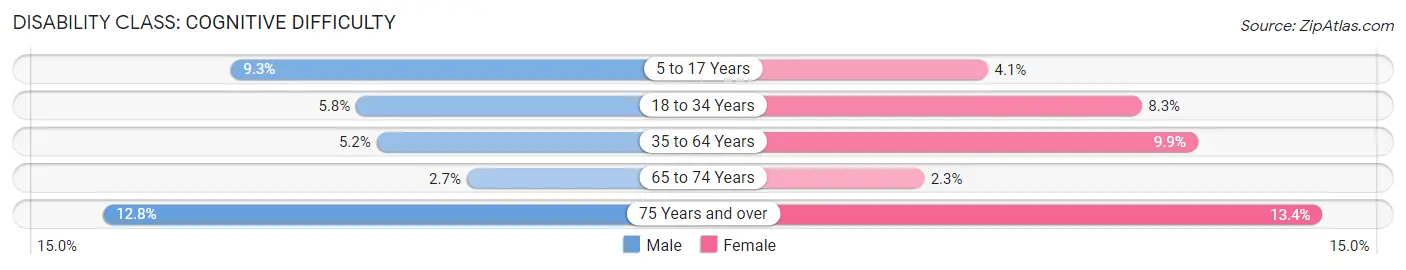
| Age Bracket | Male | Female |
| 5 to 17 Years | 171 (9.3%) | 70 (4.1%) |
| 18 to 34 Years | 256 (5.8%) | 371 (8.3%) |
| 35 to 64 Years | 215 (5.2%) | 428 (9.9%) |
| 65 to 74 Years | 36 (2.7%) | 34 (2.3%) |
| 75 Years and over | 103 (12.8%) | 157 (13.4%) |
Disability Class: Ambulatory Difficulty
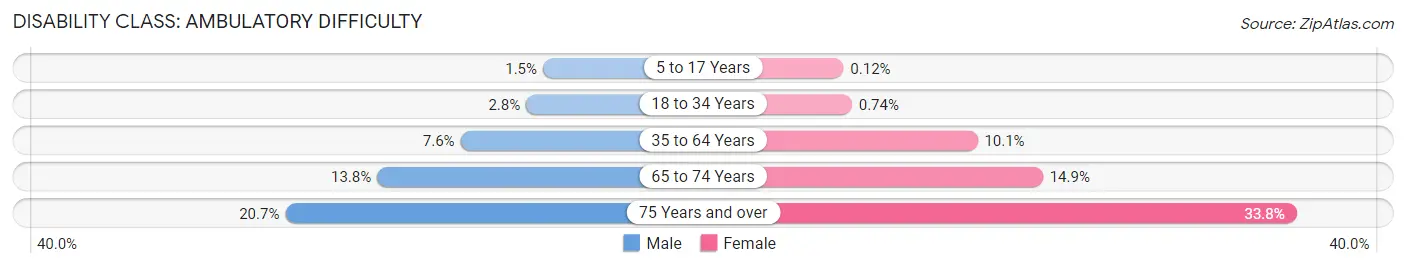
| Age Bracket | Male | Female |
| 5 to 17 Years | 28 (1.5%) | 2 (0.1%) |
| 18 to 34 Years | 123 (2.8%) | 33 (0.7%) |
| 35 to 64 Years | 316 (7.6%) | 435 (10.1%) |
| 65 to 74 Years | 185 (13.8%) | 222 (14.9%) |
| 75 Years and over | 166 (20.6%) | 396 (33.8%) |
Disability Class: Self-Care Difficulty
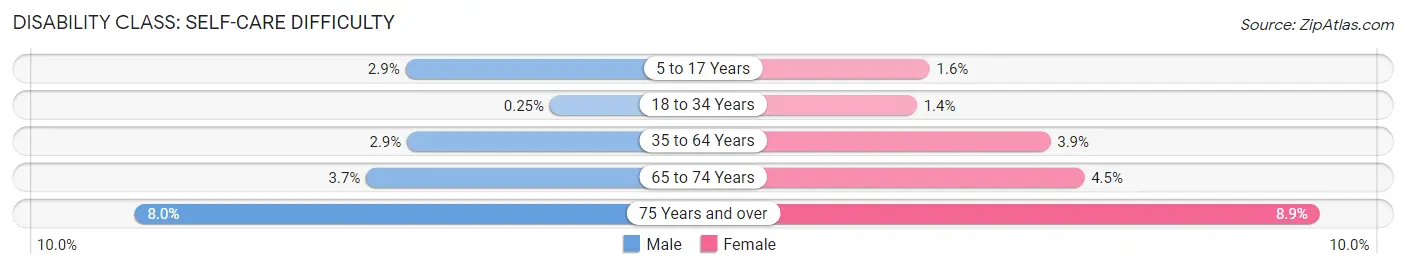
| Age Bracket | Male | Female |
| 5 to 17 Years | 54 (2.9%) | 28 (1.6%) |
| 18 to 34 Years | 11 (0.3%) | 62 (1.4%) |
| 35 to 64 Years | 120 (2.9%) | 167 (3.9%) |
| 65 to 74 Years | 49 (3.7%) | 67 (4.5%) |
| 75 Years and over | 64 (8.0%) | 104 (8.9%) |
Technology Access in McDonough County
Computing Device Access in McDonough County

| Device Type | # Households | % Households |
| Desktop or Laptop | 8,618 | 74.3% |
| Smartphone | 9,491 | 81.8% |
| Tablet | 6,358 | 54.8% |
| No Computing Device | 1,297 | 11.2% |
| Total | 11,600 | 100.0% |
Internet Access in McDonough County
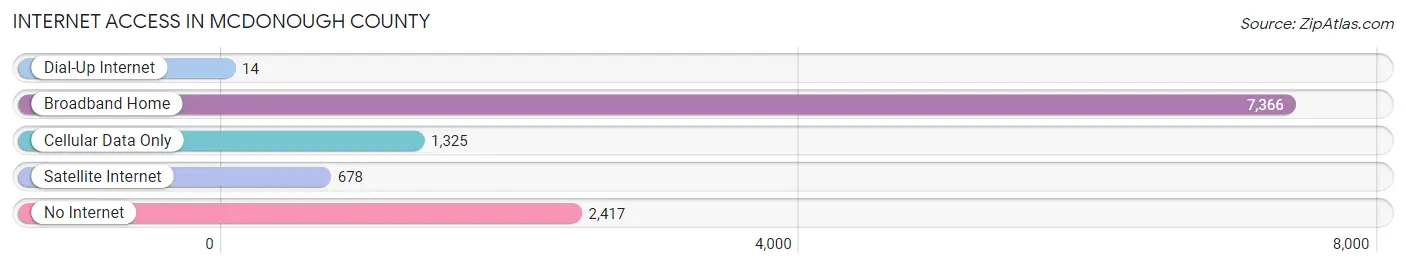
| Internet Type | # Households | % Households |
| Dial-Up Internet | 14 | 0.1% |
| Broadband Home | 7,366 | 63.5% |
| Cellular Data Only | 1,325 | 11.4% |
| Satellite Internet | 678 | 5.8% |
| No Internet | 2,417 | 20.8% |
| Total | 11,600 | 100.0% |
McDonough County Summary
McDonough County is located in the western part of the state of Illinois, in the United States. It is part of the Macomb-Western Illinois Metropolitan Statistical Area. The county seat is Macomb, and the largest city is Macomb. As of the 2010 census, the population was 32,612.
Geography
McDonough County is located in the western part of the state of Illinois, in the United States. It is part of the Macomb-Western Illinois Metropolitan Statistical Area. The county has a total area of 576 square miles, of which 574 square miles is land and 2.2 square miles is water. The county is bordered by Fulton County to the north, Hancock County to the east, Schuyler County to the south, and Warren County to the west.
The terrain of McDonough County is generally flat, with some rolling hills in the northern and western parts of the county. The highest point in the county is located in the northwest corner, at an elevation of 890 feet. The county is drained by the La Moine River, which flows through the center of the county from north to south.
History
McDonough County was formed in 1826 from parts of Fulton and Schuyler counties. It was named for Commodore Thomas Macdonough, a hero of the War of 1812. The county seat was established at Macomb in 1829.
The first settlers in the county were mostly of English and Irish descent. The first industry in the county was lumbering, and the first railroad was built in 1854. The county was an important center of the Underground Railroad, with many of the county's residents helping to hide and transport escaped slaves.
Economy
The economy of McDonough County is largely based on agriculture and manufacturing. The county is home to several large agricultural operations, including grain and livestock farms. The county is also home to several manufacturing companies, including a Caterpillar plant in Macomb.
The county is also home to Western Illinois University, which is located in Macomb. The university is the largest employer in the county, with over 3,000 employees.
Demographics
As of the 2010 census, there were 32,612 people, 12,845 households, and 7,845 families living in the county. The population density was 56.7 people per square mile. The racial makeup of the county was 92.3% White, 4.2% African American, 0.5% Native American, 0.7% Asian, 0.2% Pacific Islander, 0.9% from other races, and 1.3% from two or more races. Hispanic or Latino of any race were 2.7% of the population.
The median income for a household in the county was $41,945, and the median income for a family was $51,945. The per capita income for the county was $20,845. About 11.2% of families and 16.2% of the population were below the poverty line, including 22.2% of those under age 18 and 8.2% of those age 65 or over.
Common Questions
What is Per Capita Income in McDonough County?
Per Capita income in McDonough County is $29,658.
What is the Median Family Income in McDonough County?
Median Family Income in McDonough County is $76,161.
What is the Median Household income in McDonough County?
Median Household Income in McDonough County is $48,904.
What is Income or Wage Gap in McDonough County?
Income or Wage Gap in McDonough County is 31.2%.
Women in McDonough County earn 68.8 cents for every dollar earned by a man.
What is Family Income Deficit in McDonough County?
Family Income Deficit in McDonough County is $8,720.
Families that are below poverty line in McDonough County earn $8,720 less on average than the poverty threshold level.
What is Inequality or Gini Index in McDonough County?
Inequality or Gini Index in McDonough County is 0.49.
What is the Total Population of McDonough County?
Total Population of McDonough County is 27,370.
What is the Total Male Population of McDonough County?
Total Male Population of McDonough County is 13,336.
What is the Total Female Population of McDonough County?
Total Female Population of McDonough County is 14,034.
What is the Ratio of Males per 100 Females in McDonough County?
There are 95.03 Males per 100 Females in McDonough County.
What is the Ratio of Females per 100 Males in McDonough County?
There are 105.23 Females per 100 Males in McDonough County.
What is the Median Population Age in McDonough County?
Median Population Age in McDonough County is 34.9 Years.
What is the Average Family Size in McDonough County
Average Family Size in McDonough County is 2.9 People.
What is the Average Household Size in McDonough County
Average Household Size in McDonough County is 2.1 People.
How Large is the Labor Force in McDonough County?
There are 14,015 People in the Labor Forcein in McDonough County.
What is the Percentage of People in the Labor Force in McDonough County?
60.5% of People are in the Labor Force in McDonough County.
What is the Unemployment Rate in McDonough County?
Unemployment Rate in McDonough County is 8.0%.