Macoupin County, IL Map & Demographics
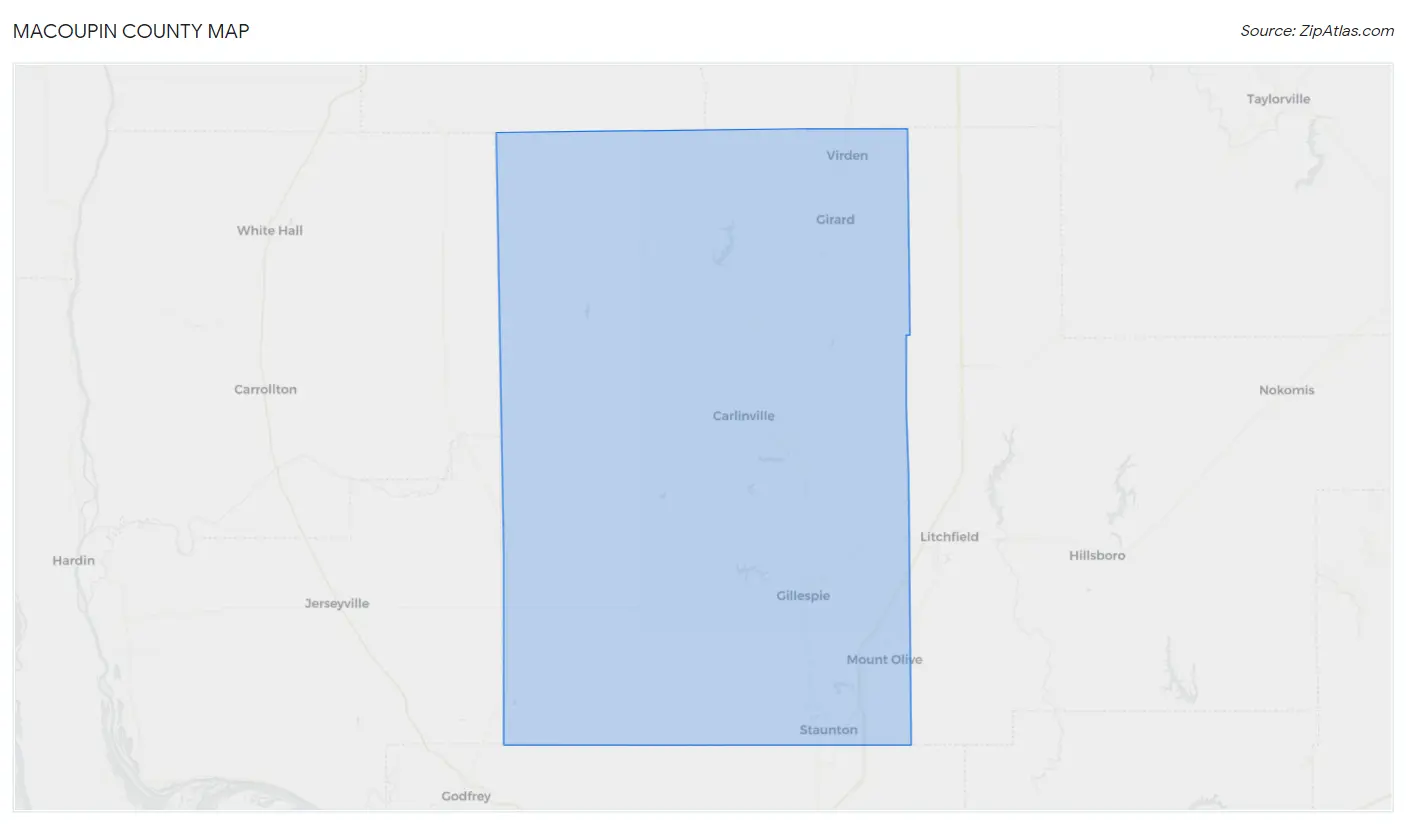
Macoupin County Map
Macoupin County Overview
$33,665
PER CAPITA INCOME
$80,507
AVG FAMILY INCOME
$64,706
AVG HOUSEHOLD INCOME
29.6%
WAGE / INCOME GAP [ % ]
70.4¢/ $1
WAGE / INCOME GAP [ $ ]
$9,792
FAMILY INCOME DEFICIT
0.43
INEQUALITY / GINI INDEX
44,907
TOTAL POPULATION
22,332
MALE POPULATION
22,575
FEMALE POPULATION
98.92
MALES / 100 FEMALES
101.09
FEMALES / 100 MALES
44.0
MEDIAN AGE
3.0
AVG FAMILY SIZE
2.5
AVG HOUSEHOLD SIZE
21,152
LABOR FORCE [ PEOPLE ]
57.6%
PERCENT IN LABOR FORCE
4.6%
UNEMPLOYMENT RATE
Income in Macoupin County
Income Overview in Macoupin County
Per Capita Income in Macoupin County is $33,665, while median incomes of families and households are $80,507 and $64,706 respectively.
| Characteristic | Number | Measure |
| Per Capita Income | 44,907 | $33,665 |
| Median Family Income | 11,721 | $80,507 |
| Mean Family Income | 11,721 | $95,731 |
| Median Household Income | 17,567 | $64,706 |
| Mean Household Income | 17,567 | $82,453 |
| Income Deficit | 11,721 | $9,792 |
| Wage / Income Gap (%) | 44,907 | 29.56% |
| Wage / Income Gap ($) | 44,907 | 70.44¢ per $1 |
| Gini / Inequality Index | 44,907 | 0.43 |
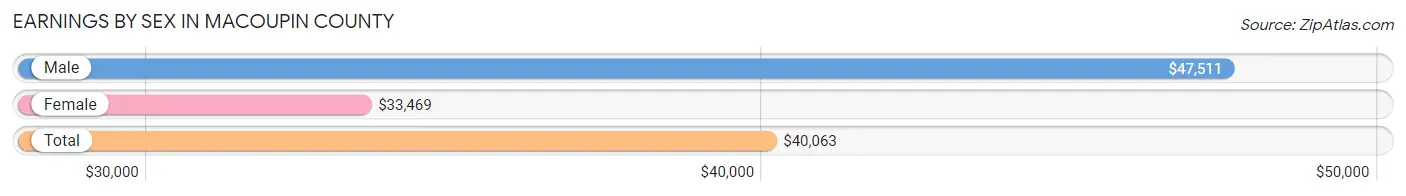
Earnings by Sex in Macoupin County
Average Earnings in Macoupin County are $40,063, $47,511 for men and $33,469 for women, a difference of 29.6%.
| Sex | Number | Average Earnings |
| Male | 11,633 (52.3%) | $47,511 |
| Female | 10,591 (47.7%) | $33,469 |
| Total | 22,224 (100.0%) | $40,063 |
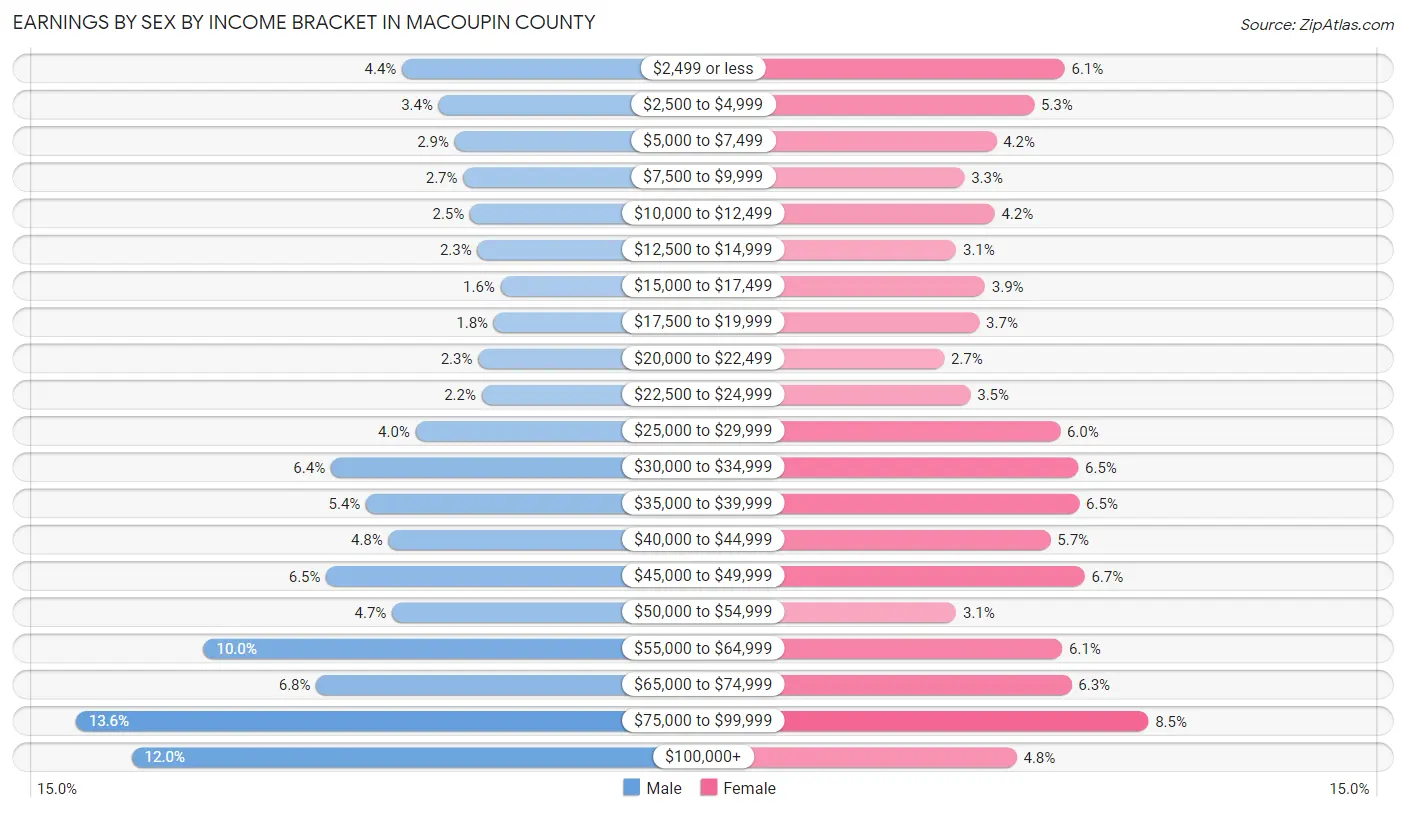
Earnings by Sex by Income Bracket in Macoupin County
The most common earnings brackets in Macoupin County are $75,000 to $99,999 for men (1,578 | 13.6%) and $75,000 to $99,999 for women (897 | 8.5%).
| Income | Male | Female |
| $2,499 or less | 511 (4.4%) | 648 (6.1%) |
| $2,500 to $4,999 | 391 (3.4%) | 557 (5.3%) |
| $5,000 to $7,499 | 338 (2.9%) | 445 (4.2%) |
| $7,500 to $9,999 | 311 (2.7%) | 350 (3.3%) |
| $10,000 to $12,499 | 288 (2.5%) | 440 (4.2%) |
| $12,500 to $14,999 | 264 (2.3%) | 325 (3.1%) |
| $15,000 to $17,499 | 189 (1.6%) | 411 (3.9%) |
| $17,500 to $19,999 | 211 (1.8%) | 394 (3.7%) |
| $20,000 to $22,499 | 262 (2.2%) | 289 (2.7%) |
| $22,500 to $24,999 | 250 (2.1%) | 368 (3.5%) |
| $25,000 to $29,999 | 467 (4.0%) | 634 (6.0%) |
| $30,000 to $34,999 | 743 (6.4%) | 688 (6.5%) |
| $35,000 to $39,999 | 628 (5.4%) | 692 (6.5%) |
| $40,000 to $44,999 | 555 (4.8%) | 606 (5.7%) |
| $45,000 to $49,999 | 758 (6.5%) | 708 (6.7%) |
| $50,000 to $54,999 | 543 (4.7%) | 325 (3.1%) |
| $55,000 to $64,999 | 1,160 (10.0%) | 641 (6.0%) |
| $65,000 to $74,999 | 791 (6.8%) | 668 (6.3%) |
| $75,000 to $99,999 | 1,578 (13.6%) | 897 (8.5%) |
| $100,000+ | 1,395 (12.0%) | 505 (4.8%) |
| Total | 11,633 (100.0%) | 10,591 (100.0%) |
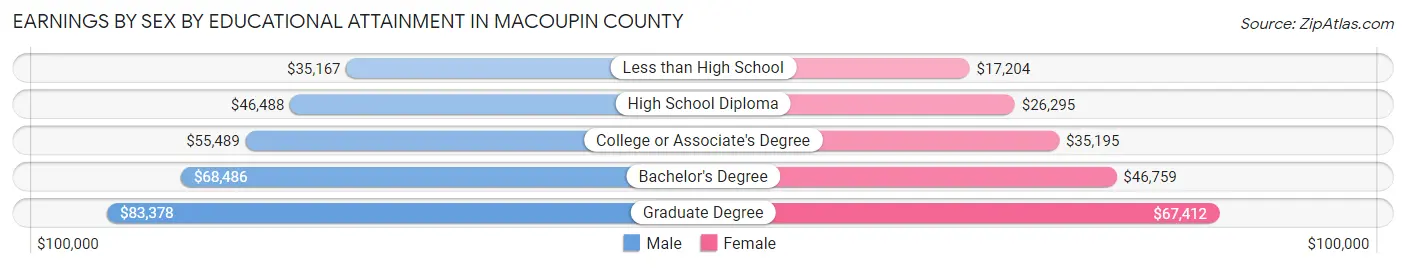
Earnings by Sex by Educational Attainment in Macoupin County
Average earnings in Macoupin County are $53,290 for men and $37,722 for women, a difference of 29.2%. Men with an educational attainment of graduate degree enjoy the highest average annual earnings of $83,378, while those with less than high school education earn the least with $35,167. Women with an educational attainment of graduate degree earn the most with the average annual earnings of $67,412, while those with less than high school education have the smallest earnings of $17,204.
| Educational Attainment | Male Income | Female Income |
| Less than High School | $35,167 | $17,204 |
| High School Diploma | $46,488 | $26,295 |
| College or Associate's Degree | $55,489 | $35,195 |
| Bachelor's Degree | $68,486 | $46,759 |
| Graduate Degree | $83,378 | $67,412 |
| Total | $53,290 | $37,722 |
Family Income in Macoupin County
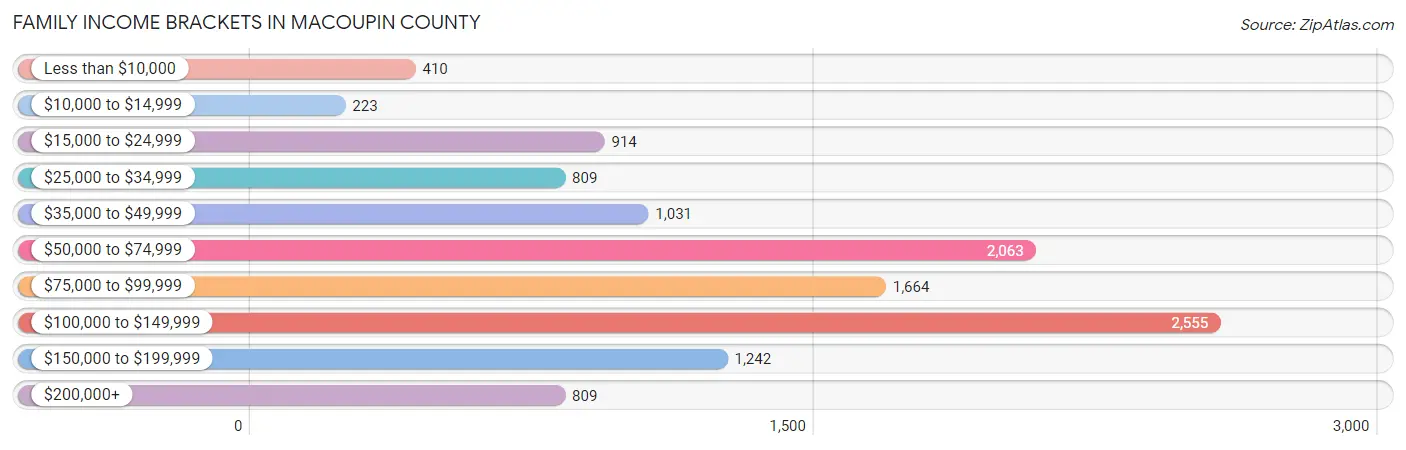
Family Income Brackets in Macoupin County
According to the Macoupin County family income data, there are 2,555 families falling into the $100,000 to $149,999 income range, which is the most common income bracket and makes up 21.8% of all families. Conversely, the $10,000 to $14,999 income bracket is the least frequent group with only 223 families (1.9%) belonging to this category.
| Income Bracket | # Families | % Families |
| Less than $10,000 | 410 | 3.5% |
| $10,000 to $14,999 | 223 | 1.9% |
| $15,000 to $24,999 | 914 | 7.8% |
| $25,000 to $34,999 | 809 | 6.9% |
| $35,000 to $49,999 | 1,031 | 8.8% |
| $50,000 to $74,999 | 2,063 | 17.6% |
| $75,000 to $99,999 | 1,664 | 14.2% |
| $100,000 to $149,999 | 2,555 | 21.8% |
| $150,000 to $199,999 | 1,242 | 10.6% |
| $200,000+ | 809 | 6.9% |
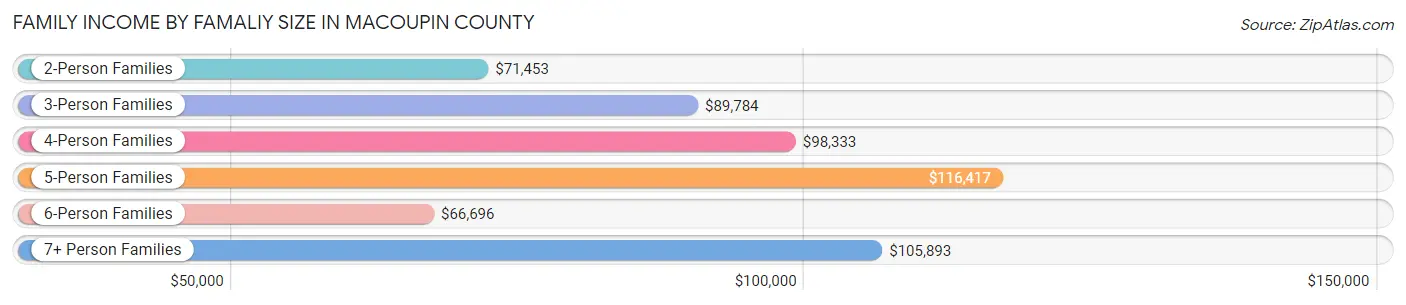
Family Income by Famaliy Size in Macoupin County
5-person families (685 | 5.8%) account for the highest median family income in Macoupin County with $116,417 per family, while 2-person families (6,509 | 55.5%) have the highest median income of $35,726 per family member.
| Income Bracket | # Families | Median Income |
| 2-Person Families | 6,509 (55.5%) | $71,453 |
| 3-Person Families | 2,337 (19.9%) | $89,784 |
| 4-Person Families | 1,954 (16.7%) | $98,333 |
| 5-Person Families | 685 (5.8%) | $116,417 |
| 6-Person Families | 153 (1.3%) | $66,696 |
| 7+ Person Families | 83 (0.7%) | $105,893 |
| Total | 11,721 (100.0%) | $80,507 |
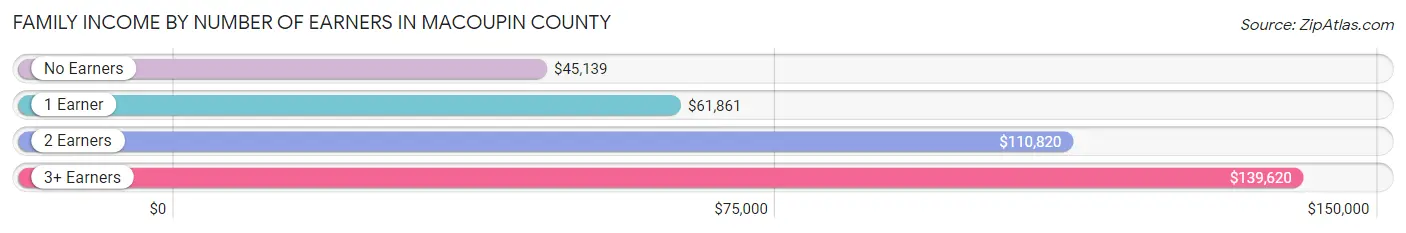
Family Income by Number of Earners in Macoupin County
The median family income in Macoupin County is $80,507, with families comprising 3+ earners (1,007) having the highest median family income of $139,620, while families with no earners (2,649) have the lowest median family income of $45,139, accounting for 8.6% and 22.6% of families, respectively.
| Number of Earners | # Families | Median Income |
| No Earners | 2,649 (22.6%) | $45,139 |
| 1 Earner | 3,587 (30.6%) | $61,861 |
| 2 Earners | 4,478 (38.2%) | $110,820 |
| 3+ Earners | 1,007 (8.6%) | $139,620 |
| Total | 11,721 (100.0%) | $80,507 |
Household Income in Macoupin County
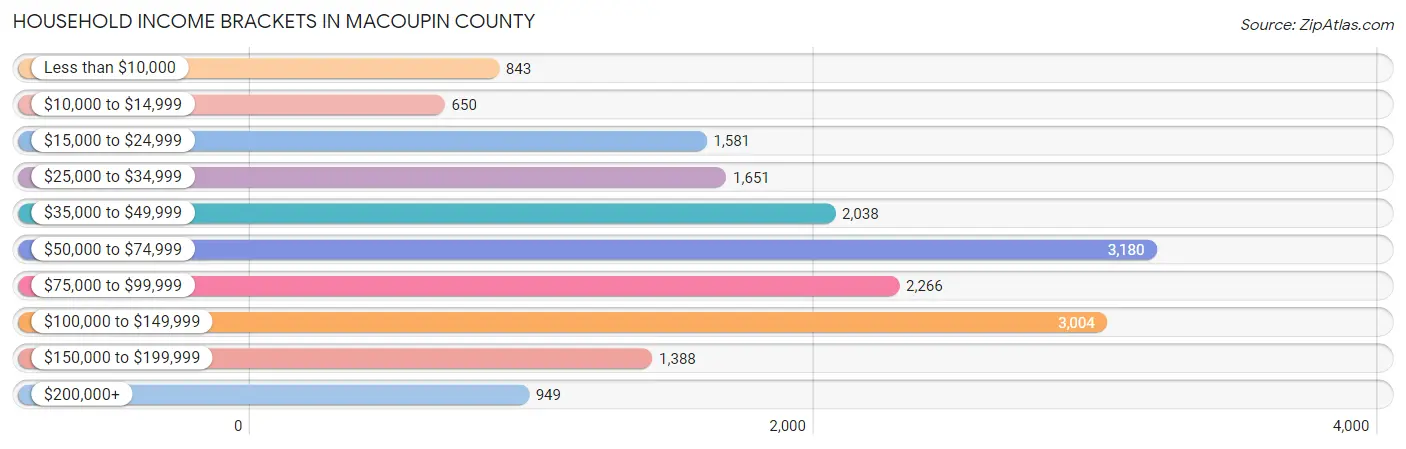
Household Income Brackets in Macoupin County
With 3,180 households falling in the category, the $50,000 to $74,999 income range is the most frequent in Macoupin County, accounting for 18.1% of all households. In contrast, only 650 households (3.7%) fall into the $10,000 to $14,999 income bracket, making it the least populous group.
| Income Bracket | # Households | % Households |
| Less than $10,000 | 843 | 4.8% |
| $10,000 to $14,999 | 650 | 3.7% |
| $15,000 to $24,999 | 1,581 | 9.0% |
| $25,000 to $34,999 | 1,651 | 9.4% |
| $35,000 to $49,999 | 2,038 | 11.6% |
| $50,000 to $74,999 | 3,180 | 18.1% |
| $75,000 to $99,999 | 2,266 | 12.9% |
| $100,000 to $149,999 | 3,004 | 17.1% |
| $150,000 to $199,999 | 1,388 | 7.9% |
| $200,000+ | 949 | 5.4% |
Household Income by Householder Age in Macoupin County
The median household income in Macoupin County is $64,706, with the highest median household income of $77,807 found in the 25 to 44 years age bracket for the primary householder. A total of 4,709 households (26.8%) fall into this category. Meanwhile, the 15 to 24 years age bracket for the primary householder has the lowest median household income of $47,625, with 427 households (2.4%) in this group.
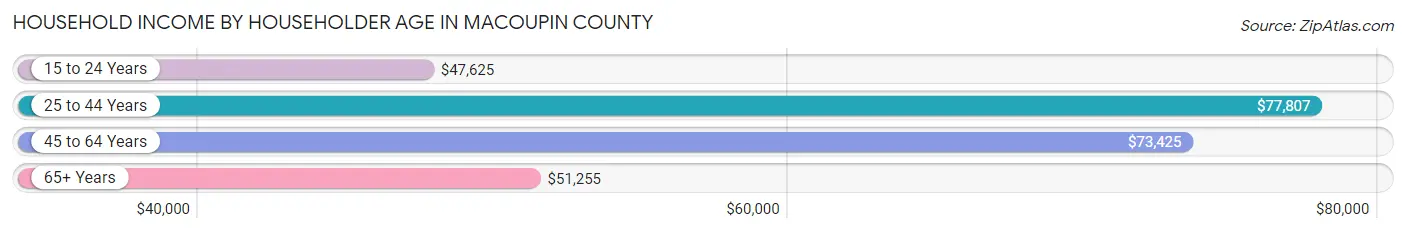
| Income Bracket | # Households | Median Income |
| 15 to 24 Years | 427 (2.4%) | $47,625 |
| 25 to 44 Years | 4,709 (26.8%) | $77,807 |
| 45 to 64 Years | 6,690 (38.1%) | $73,425 |
| 65+ Years | 5,741 (32.7%) | $51,255 |
| Total | 17,567 (100.0%) | $64,706 |
Poverty in Macoupin County
Income Below Poverty by Sex and Age in Macoupin County
With 13.3% poverty level for males and 16.0% for females among the residents of Macoupin County, under 5 year old males and 5 year old females are the most vulnerable to poverty, with 379 males (32.2%) and 59 females (36.2%) in their respective age groups living below the poverty level.
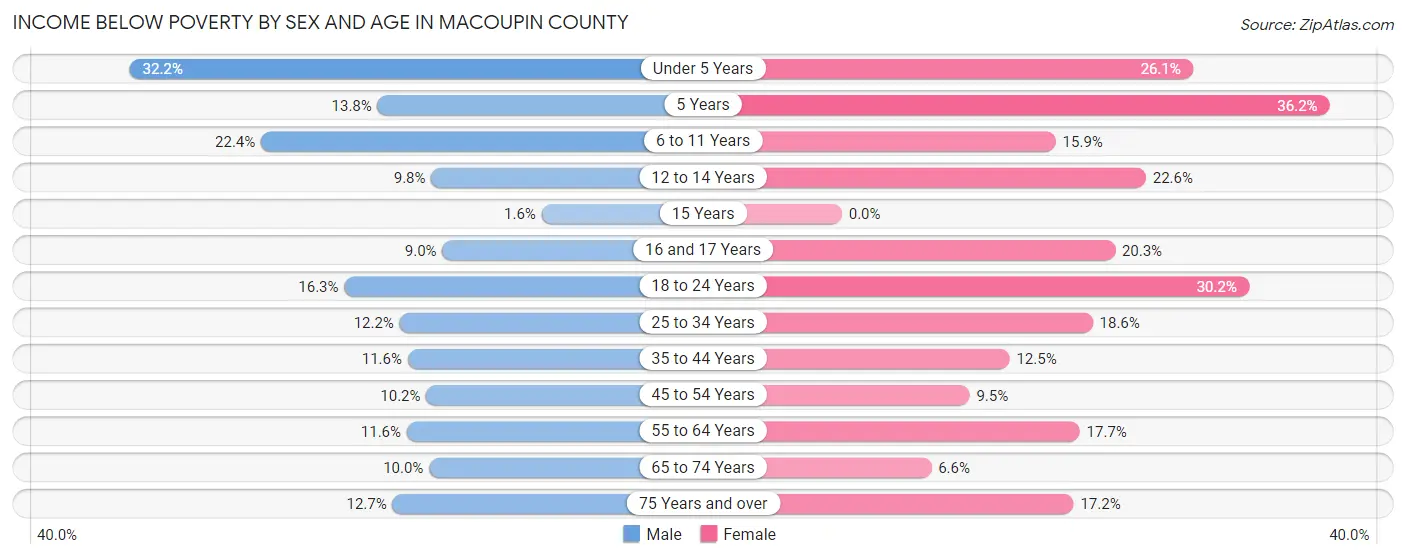
| Age Bracket | Male | Female |
| Under 5 Years | 379 (32.2%) | 266 (26.1%) |
| 5 Years | 20 (13.8%) | 59 (36.2%) |
| 6 to 11 Years | 370 (22.4%) | 241 (15.9%) |
| 12 to 14 Years | 88 (9.8%) | 181 (22.6%) |
| 15 Years | 6 (1.6%) | 0 (0.0%) |
| 16 and 17 Years | 52 (9.0%) | 115 (20.3%) |
| 18 to 24 Years | 278 (16.3%) | 455 (30.2%) |
| 25 to 34 Years | 290 (12.1%) | 457 (18.6%) |
| 35 to 44 Years | 316 (11.6%) | 333 (12.4%) |
| 45 to 54 Years | 284 (10.2%) | 253 (9.5%) |
| 55 to 64 Years | 403 (11.6%) | 609 (17.7%) |
| 65 to 74 Years | 255 (10.0%) | 182 (6.6%) |
| 75 Years and over | 198 (12.7%) | 363 (17.2%) |
| Total | 2,939 (13.3%) | 3,514 (16.0%) |
Income Above Poverty by Sex and Age in Macoupin County
According to the poverty statistics in Macoupin County, males aged 15 years and females aged 15 years are the age groups that are most secure financially, with 98.4% of males and 100.0% of females in these age groups living above the poverty line.
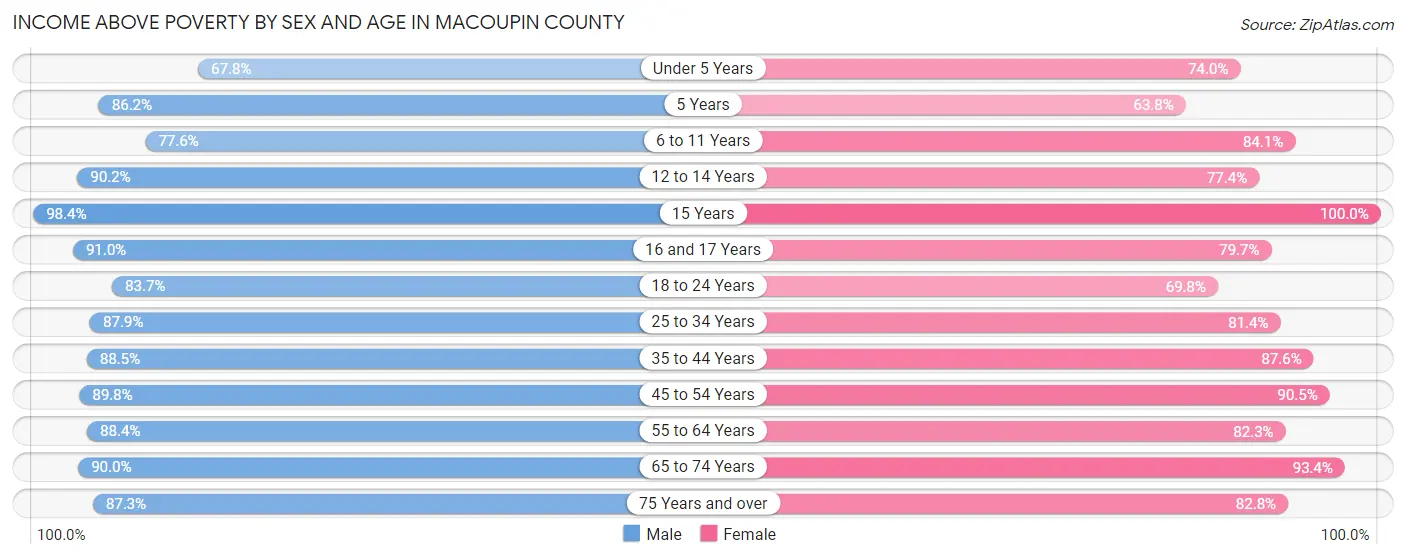
| Age Bracket | Male | Female |
| Under 5 Years | 798 (67.8%) | 755 (74.0%) |
| 5 Years | 125 (86.2%) | 104 (63.8%) |
| 6 to 11 Years | 1,279 (77.6%) | 1,277 (84.1%) |
| 12 to 14 Years | 810 (90.2%) | 621 (77.4%) |
| 15 Years | 367 (98.4%) | 277 (100.0%) |
| 16 and 17 Years | 527 (91.0%) | 452 (79.7%) |
| 18 to 24 Years | 1,432 (83.7%) | 1,051 (69.8%) |
| 25 to 34 Years | 2,097 (87.8%) | 1,998 (81.4%) |
| 35 to 44 Years | 2,420 (88.4%) | 2,341 (87.5%) |
| 45 to 54 Years | 2,508 (89.8%) | 2,416 (90.5%) |
| 55 to 64 Years | 3,065 (88.4%) | 2,839 (82.3%) |
| 65 to 74 Years | 2,305 (90.0%) | 2,561 (93.4%) |
| 75 Years and over | 1,363 (87.3%) | 1,748 (82.8%) |
| Total | 19,096 (86.7%) | 18,440 (84.0%) |
Income Below Poverty Among Married-Couple Families in Macoupin County
The poverty statistics for married-couple families in Macoupin County show that 6.5% or 570 of the total 8,823 families live below the poverty line. Families with 3 or 4 children have the highest poverty rate of 11.7%, comprising of 68 families. On the other hand, families with 5 or more children have the lowest poverty rate of 4.3%, which includes 2 families.
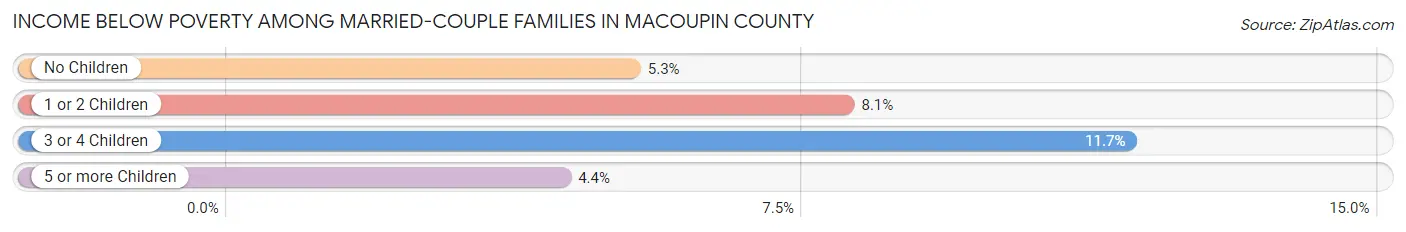
| Children | Above Poverty | Below Poverty |
| No Children | 5,435 (94.7%) | 302 (5.3%) |
| 1 or 2 Children | 2,263 (91.9%) | 198 (8.1%) |
| 3 or 4 Children | 511 (88.3%) | 68 (11.7%) |
| 5 or more Children | 44 (95.7%) | 2 (4.3%) |
| Total | 8,253 (93.5%) | 570 (6.5%) |
Income Below Poverty Among Single-Parent Households in Macoupin County
According to the poverty data in Macoupin County, 19.9% or 185 single-father households and 27.6% or 543 single-mother households are living below the poverty line. Among single-father households, those with 3 or 4 children have the highest poverty rate, with 49 households (50.5%) experiencing poverty. Likewise, among single-mother households, those with 5 or more children have the highest poverty rate, with 27 households (100.0%) falling below the poverty line.
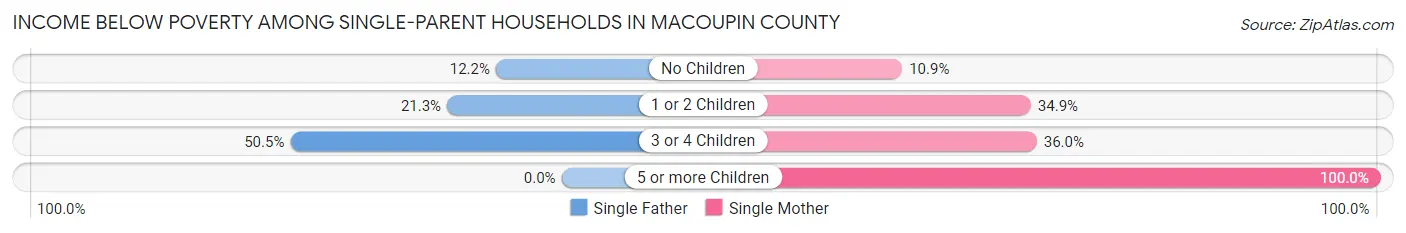
| Children | Single Father | Single Mother |
| No Children | 56 (12.2%) | 74 (10.9%) |
| 1 or 2 Children | 80 (21.3%) | 392 (34.9%) |
| 3 or 4 Children | 49 (50.5%) | 50 (36.0%) |
| 5 or more Children | 0 (0.0%) | 27 (100.0%) |
| Total | 185 (19.9%) | 543 (27.6%) |
Income Below Poverty Among Married-Couple vs Single-Parent Households in Macoupin County
The poverty data for Macoupin County shows that 570 of the married-couple family households (6.5%) and 728 of the single-parent households (25.1%) are living below the poverty level. Within the married-couple family households, those with 3 or 4 children have the highest poverty rate, with 68 households (11.7%) falling below the poverty line. Among the single-parent households, those with 5 or more children have the highest poverty rate, with 27 household (100.0%) living below poverty.
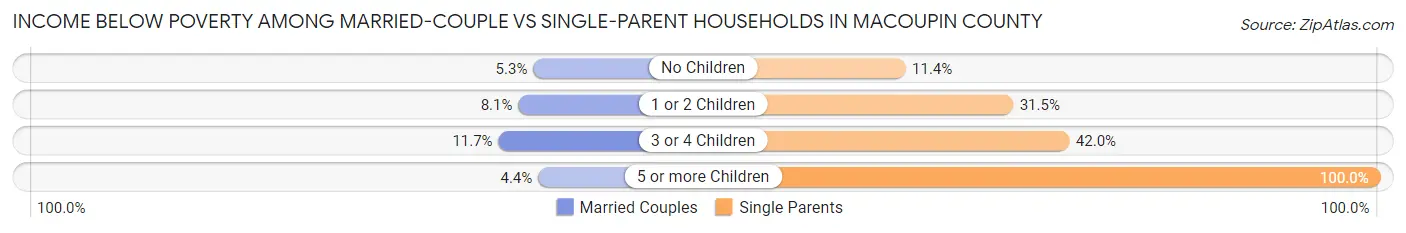
| Children | Married-Couple Families | Single-Parent Households |
| No Children | 302 (5.3%) | 130 (11.4%) |
| 1 or 2 Children | 198 (8.1%) | 472 (31.5%) |
| 3 or 4 Children | 68 (11.7%) | 99 (41.9%) |
| 5 or more Children | 2 (4.3%) | 27 (100.0%) |
| Total | 570 (6.5%) | 728 (25.1%) |
Race in Macoupin County
The most populous races in Macoupin County are White / Caucasian (42,815 | 95.3%), Two or more Races (1,094 | 2.4%), and Hispanic or Latino (582 | 1.3%).
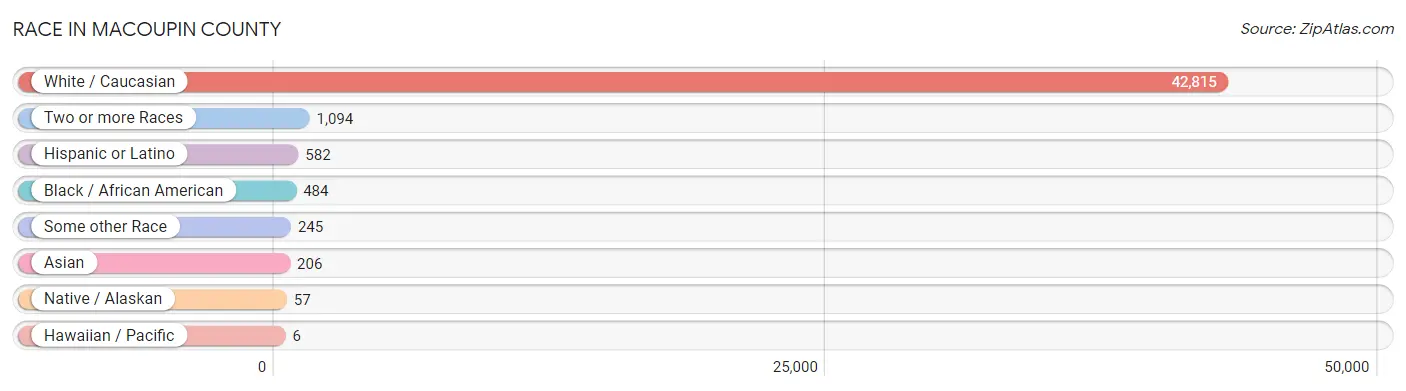
| Race | # Population | % Population |
| Asian | 206 | 0.5% |
| Black / African American | 484 | 1.1% |
| Hawaiian / Pacific | 6 | 0.0% |
| Hispanic or Latino | 582 | 1.3% |
| Native / Alaskan | 57 | 0.1% |
| White / Caucasian | 42,815 | 95.3% |
| Two or more Races | 1,094 | 2.4% |
| Some other Race | 245 | 0.5% |
| Total | 44,907 | 100.0% |
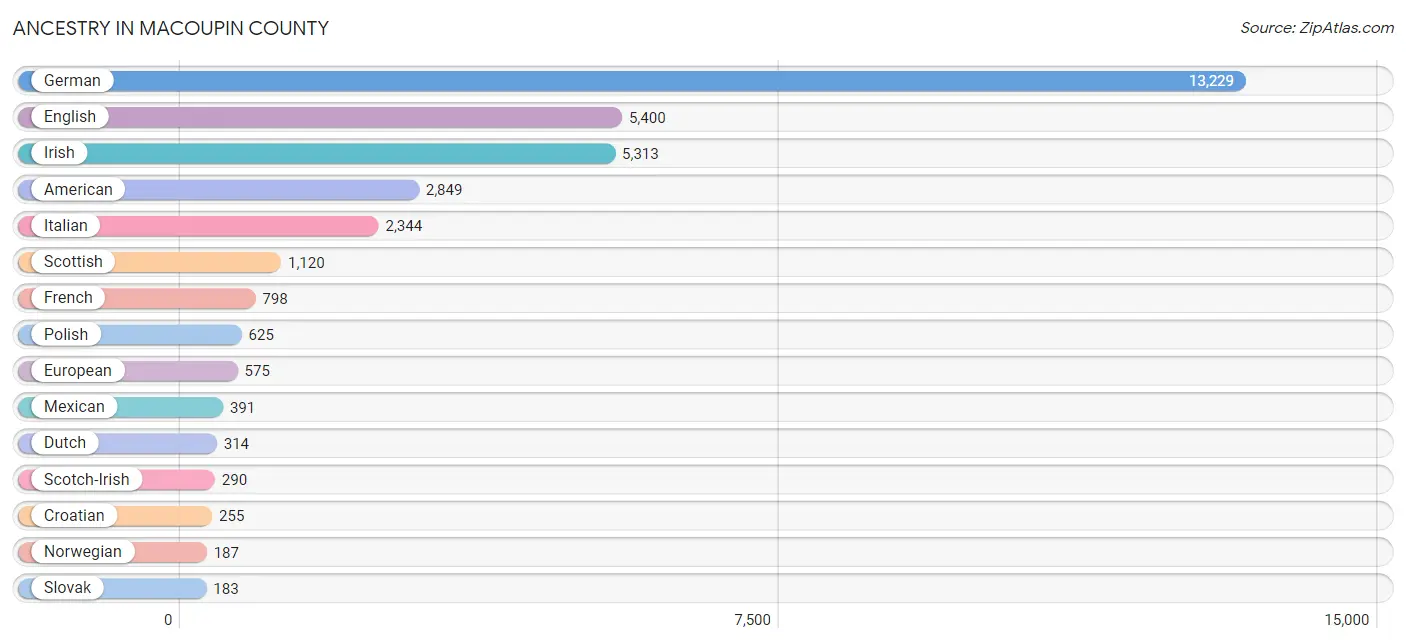
Ancestry in Macoupin County
The most populous ancestries reported in Macoupin County are German (13,229 | 29.5%), English (5,400 | 12.0%), Irish (5,313 | 11.8%), American (2,849 | 6.3%), and Italian (2,344 | 5.2%), together accounting for 64.9% of all Macoupin County residents.
| Ancestry | # Population | % Population |
| African | 68 | 0.2% |
| Alaskan Athabascan | 13 | 0.0% |
| American | 2,849 | 6.3% |
| Apache | 15 | 0.0% |
| Austrian | 39 | 0.1% |
| Belgian | 45 | 0.1% |
| Bhutanese | 7 | 0.0% |
| Blackfeet | 23 | 0.1% |
| Bolivian | 3 | 0.0% |
| British | 143 | 0.3% |
| Burmese | 125 | 0.3% |
| Canadian | 8 | 0.0% |
| Carpatho Rusyn | 4 | 0.0% |
| Central American | 83 | 0.2% |
| Cherokee | 33 | 0.1% |
| Chickasaw | 4 | 0.0% |
| Chippewa | 12 | 0.0% |
| Choctaw | 14 | 0.0% |
| Colombian | 13 | 0.0% |
| Costa Rican | 40 | 0.1% |
| Croatian | 255 | 0.6% |
| Cuban | 12 | 0.0% |
| Czech | 77 | 0.2% |
| Czechoslovakian | 35 | 0.1% |
| Danish | 79 | 0.2% |
| Dominican | 8 | 0.0% |
| Dutch | 314 | 0.7% |
| Eastern European | 64 | 0.1% |
| English | 5,400 | 12.0% |
| European | 575 | 1.3% |
| Finnish | 21 | 0.1% |
| French | 798 | 1.8% |
| French Canadian | 32 | 0.1% |
| German | 13,229 | 29.5% |
| Greek | 10 | 0.0% |
| Guatemalan | 26 | 0.1% |
| Hungarian | 103 | 0.2% |
| Indian (Asian) | 94 | 0.2% |
| Irish | 5,313 | 11.8% |
| Iroquois | 2 | 0.0% |
| Italian | 2,344 | 5.2% |
| Jamaican | 8 | 0.0% |
| Kenyan | 12 | 0.0% |
| Korean | 60 | 0.1% |
| Lithuanian | 158 | 0.4% |
| Macedonian | 8 | 0.0% |
| Mexican | 391 | 0.9% |
| Nicaraguan | 10 | 0.0% |
| Northern European | 13 | 0.0% |
| Norwegian | 187 | 0.4% |
| Pennsylvania German | 26 | 0.1% |
| Peruvian | 15 | 0.0% |
| Polish | 625 | 1.4% |
| Portuguese | 38 | 0.1% |
| Puerto Rican | 28 | 0.1% |
| Romanian | 6 | 0.0% |
| Russian | 118 | 0.3% |
| Salvadoran | 7 | 0.0% |
| Samoan | 11 | 0.0% |
| Scandinavian | 52 | 0.1% |
| Scotch-Irish | 290 | 0.6% |
| Scottish | 1,120 | 2.5% |
| Serbian | 27 | 0.1% |
| Sioux | 2 | 0.0% |
| Slavic | 27 | 0.1% |
| Slovak | 183 | 0.4% |
| Slovene | 57 | 0.1% |
| South American | 31 | 0.1% |
| South American Indian | 14 | 0.0% |
| Spanish | 9 | 0.0% |
| Sri Lankan | 2 | 0.0% |
| Subsaharan African | 80 | 0.2% |
| Swedish | 176 | 0.4% |
| Swiss | 109 | 0.2% |
| Turkish | 8 | 0.0% |
| Ukrainian | 63 | 0.1% |
| Welsh | 146 | 0.3% |
| Yugoslavian | 35 | 0.1% |
| Yup'ik | 12 | 0.0% | View All 79 Rows |
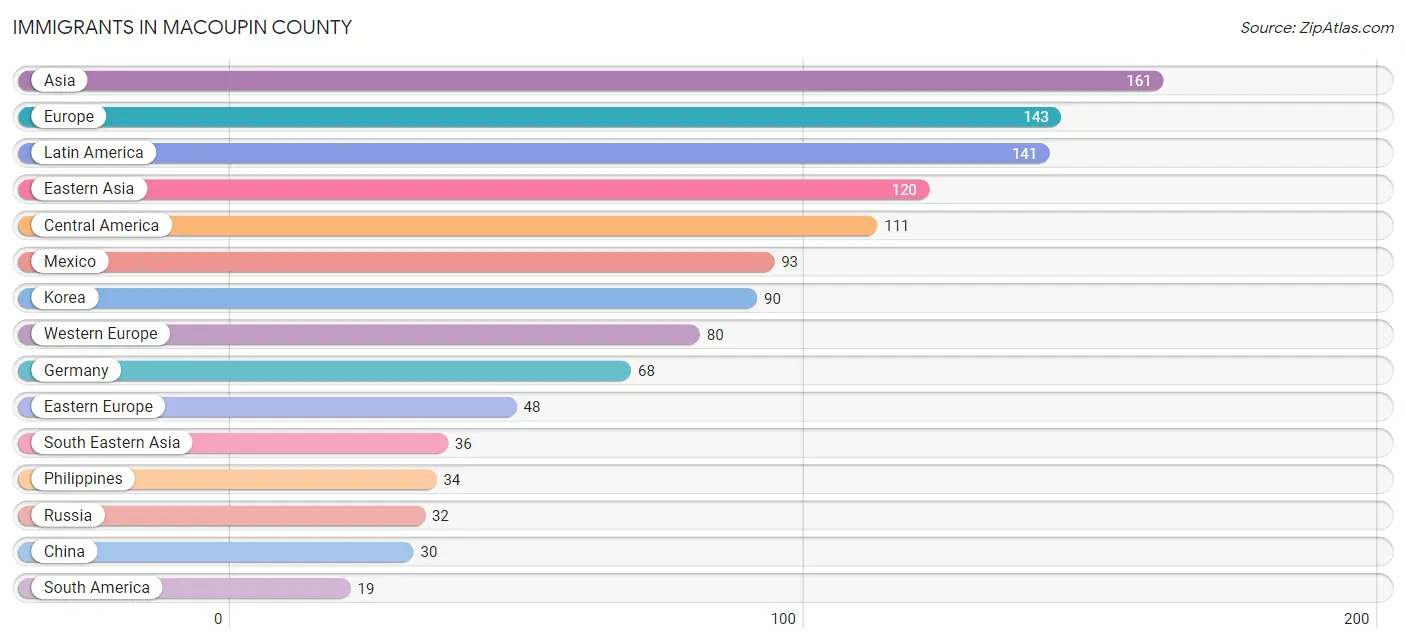
Immigrants in Macoupin County
The most numerous immigrant groups reported in Macoupin County came from Asia (161 | 0.4%), Europe (143 | 0.3%), Latin America (141 | 0.3%), Eastern Asia (120 | 0.3%), and Central America (111 | 0.3%), together accounting for 1.5% of all Macoupin County residents.
| Immigration Origin | # Population | % Population |
| Africa | 14 | 0.0% |
| Asia | 161 | 0.4% |
| Azores | 9 | 0.0% |
| Canada | 3 | 0.0% |
| Caribbean | 11 | 0.0% |
| Central America | 111 | 0.3% |
| China | 30 | 0.1% |
| Colombia | 10 | 0.0% |
| Costa Rica | 18 | 0.0% |
| Eastern Africa | 14 | 0.0% |
| Eastern Asia | 120 | 0.3% |
| Eastern Europe | 48 | 0.1% |
| Europe | 143 | 0.3% |
| Germany | 68 | 0.2% |
| India | 5 | 0.0% |
| Jamaica | 11 | 0.0% |
| Korea | 90 | 0.2% |
| Latin America | 141 | 0.3% |
| Mexico | 93 | 0.2% |
| Netherlands | 12 | 0.0% |
| Northern Europe | 6 | 0.0% |
| Peru | 9 | 0.0% |
| Philippines | 34 | 0.1% |
| Poland | 3 | 0.0% |
| Portugal | 9 | 0.0% |
| Russia | 32 | 0.1% |
| Scotland | 6 | 0.0% |
| South America | 19 | 0.0% |
| South Central Asia | 5 | 0.0% |
| South Eastern Asia | 36 | 0.1% |
| Southern Europe | 9 | 0.0% |
| Ukraine | 13 | 0.0% |
| Vietnam | 2 | 0.0% |
| Western Europe | 80 | 0.2% | View All 34 Rows |
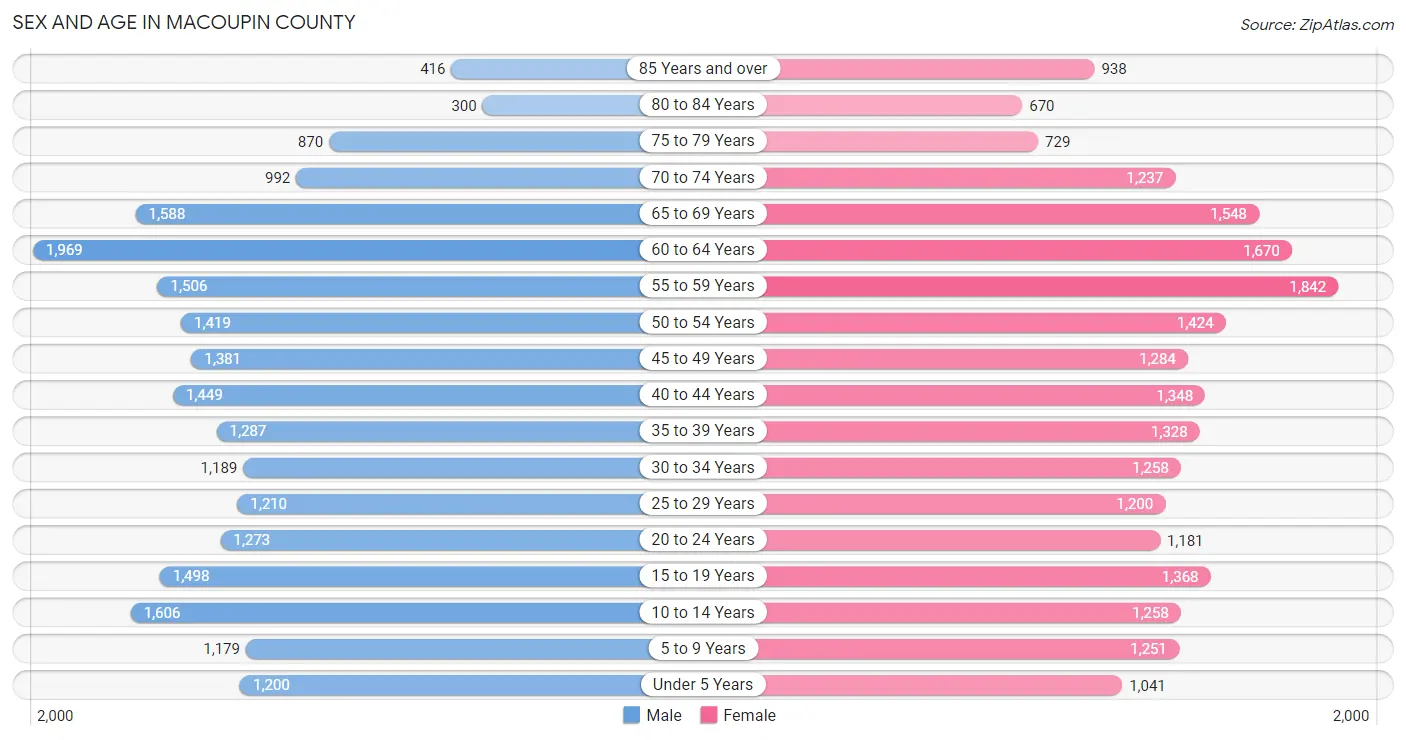
Sex and Age in Macoupin County
Sex and Age in Macoupin County
The most populous age groups in Macoupin County are 60 to 64 Years (1,969 | 8.8%) for men and 55 to 59 Years (1,842 | 8.2%) for women.
| Age Bracket | Male | Female |
| Under 5 Years | 1,200 (5.4%) | 1,041 (4.6%) |
| 5 to 9 Years | 1,179 (5.3%) | 1,251 (5.5%) |
| 10 to 14 Years | 1,606 (7.2%) | 1,258 (5.6%) |
| 15 to 19 Years | 1,498 (6.7%) | 1,368 (6.1%) |
| 20 to 24 Years | 1,273 (5.7%) | 1,181 (5.2%) |
| 25 to 29 Years | 1,210 (5.4%) | 1,200 (5.3%) |
| 30 to 34 Years | 1,189 (5.3%) | 1,258 (5.6%) |
| 35 to 39 Years | 1,287 (5.8%) | 1,328 (5.9%) |
| 40 to 44 Years | 1,449 (6.5%) | 1,348 (6.0%) |
| 45 to 49 Years | 1,381 (6.2%) | 1,284 (5.7%) |
| 50 to 54 Years | 1,419 (6.4%) | 1,424 (6.3%) |
| 55 to 59 Years | 1,506 (6.7%) | 1,842 (8.2%) |
| 60 to 64 Years | 1,969 (8.8%) | 1,670 (7.4%) |
| 65 to 69 Years | 1,588 (7.1%) | 1,548 (6.9%) |
| 70 to 74 Years | 992 (4.4%) | 1,237 (5.5%) |
| 75 to 79 Years | 870 (3.9%) | 729 (3.2%) |
| 80 to 84 Years | 300 (1.3%) | 670 (3.0%) |
| 85 Years and over | 416 (1.9%) | 938 (4.2%) |
| Total | 22,332 (100.0%) | 22,575 (100.0%) |
Families and Households in Macoupin County
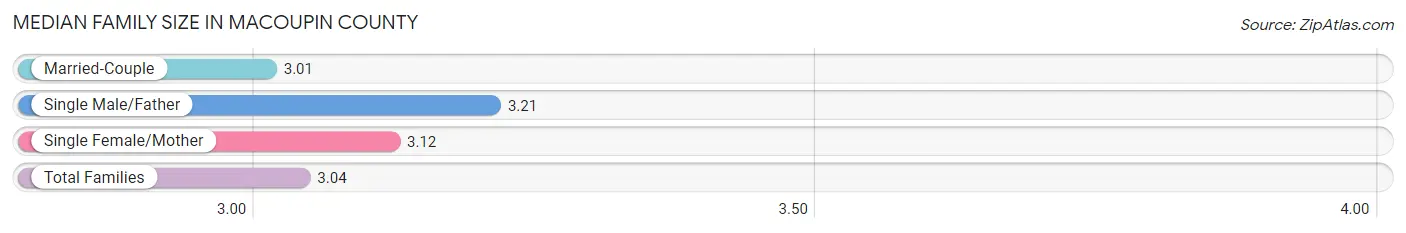
Median Family Size in Macoupin County
The median family size in Macoupin County is 3.04 persons per family, with single male/father families (930 | 7.9%) accounting for the largest median family size of 3.21 persons per family. On the other hand, married-couple families (8,823 | 75.3%) represent the smallest median family size with 3.01 persons per family.
| Family Type | # Families | Family Size |
| Married-Couple | 8,823 (75.3%) | 3.01 |
| Single Male/Father | 930 (7.9%) | 3.21 |
| Single Female/Mother | 1,968 (16.8%) | 3.12 |
| Total Families | 11,721 (100.0%) | 3.04 |
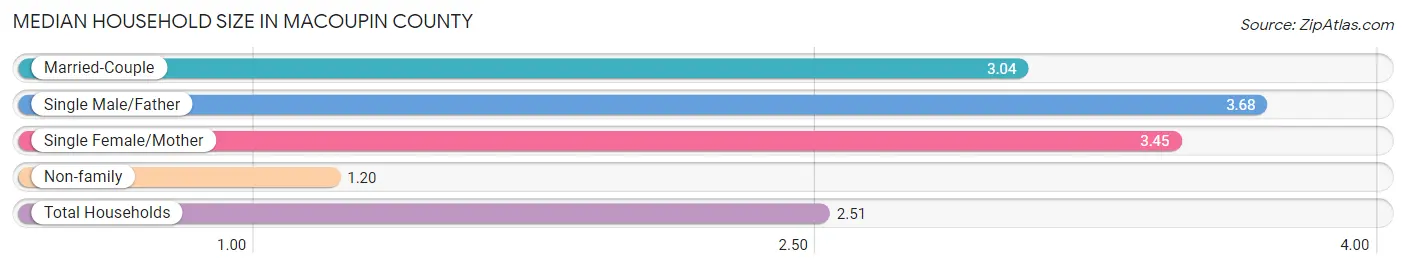
Median Household Size in Macoupin County
The median household size in Macoupin County is 2.51 persons per household, with single male/father households (930 | 5.3%) accounting for the largest median household size of 3.68 persons per household. non-family households (5,846 | 33.3%) represent the smallest median household size with 1.20 persons per household.
| Household Type | # Households | Household Size |
| Married-Couple | 8,823 (50.2%) | 3.04 |
| Single Male/Father | 930 (5.3%) | 3.68 |
| Single Female/Mother | 1,968 (11.2%) | 3.45 |
| Non-family | 5,846 (33.3%) | 1.20 |
| Total Households | 17,567 (100.0%) | 2.51 |
Household Size by Marriage Status in Macoupin County
Out of a total of 17,567 households in Macoupin County, 11,721 (66.7%) are family households, while 5,846 (33.3%) are nonfamily households. The most numerous type of family households are 2-person households, comprising 5,952, and the most common type of nonfamily households are 1-person households, comprising 4,905.
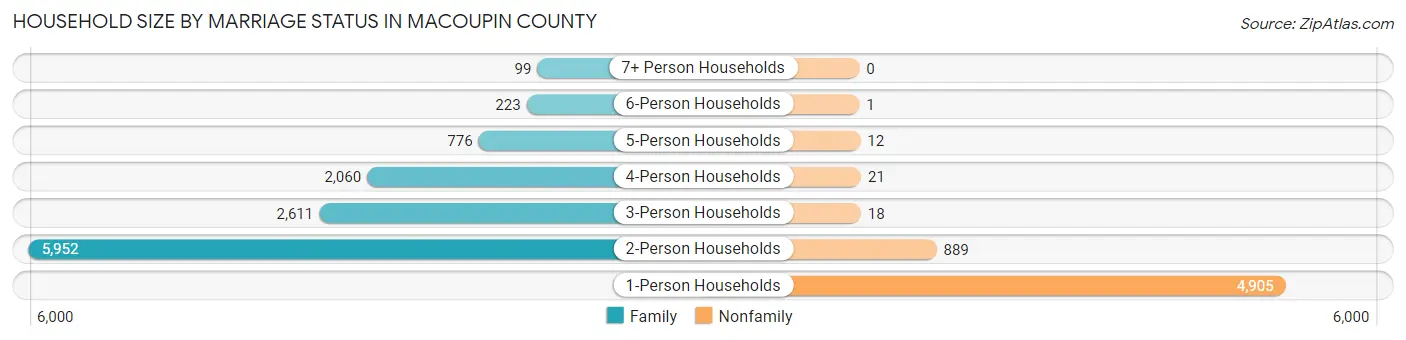
| Household Size | Family Households | Nonfamily Households |
| 1-Person Households | - | 4,905 (27.9%) |
| 2-Person Households | 5,952 (33.9%) | 889 (5.1%) |
| 3-Person Households | 2,611 (14.9%) | 18 (0.1%) |
| 4-Person Households | 2,060 (11.7%) | 21 (0.1%) |
| 5-Person Households | 776 (4.4%) | 12 (0.1%) |
| 6-Person Households | 223 (1.3%) | 1 (0.0%) |
| 7+ Person Households | 99 (0.6%) | 0 (0.0%) |
| Total | 11,721 (66.7%) | 5,846 (33.3%) |
Female Fertility in Macoupin County
Fertility by Age in Macoupin County
Average fertility rate in Macoupin County is 53.0 births per 1,000 women. Women in the age bracket of 20 to 34 years have the highest fertility rate with 109.0 births per 1,000 women. Women in the age bracket of 20 to 34 years acount for 82.4% of all women with births.
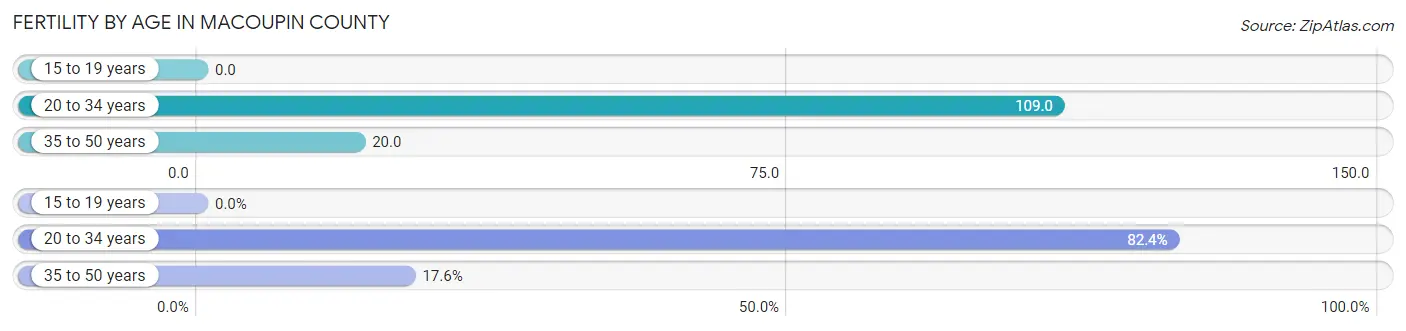
| Age Bracket | Women with Births | Births / 1,000 Women |
| 15 to 19 years | 0 (0.0%) | 0.0 |
| 20 to 34 years | 398 (82.4%) | 109.0 |
| 35 to 50 years | 85 (17.6%) | 20.0 |
| Total | 483 (100.0%) | 53.0 |
Fertility by Age by Marriage Status in Macoupin County
71.2% of women with births (483) in Macoupin County are married. The highest percentage of unmarried women with births falls into 35 to 50 years age bracket with 38.8% of them unmarried at the time of birth, while the lowest percentage of unmarried women with births belong to 20 to 34 years age bracket with 26.6% of them unmarried.
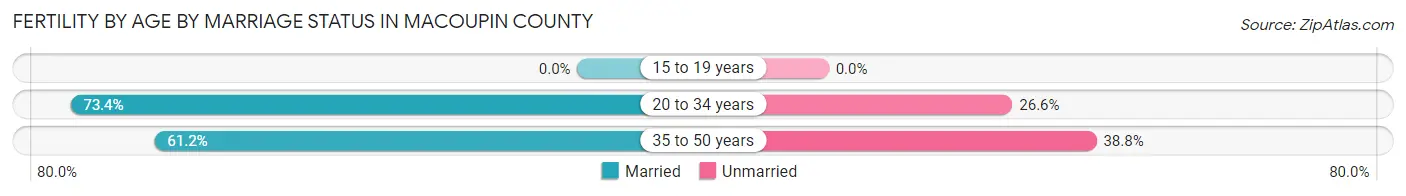
| Age Bracket | Married | Unmarried |
| 15 to 19 years | 0 (0.0%) | 0 (0.0%) |
| 20 to 34 years | 292 (73.4%) | 106 (26.6%) |
| 35 to 50 years | 52 (61.2%) | 33 (38.8%) |
| Total | 344 (71.2%) | 139 (28.8%) |
Fertility by Education in Macoupin County
Average fertility rate in Macoupin County is 53.0 births per 1,000 women. Women with the education attainment of bachelor's degree have the highest fertility rate of 86.0 births per 1,000 women, while women with the education attainment of less than high school have the lowest fertility at 2.0 births per 1,000 women. Women with the education attainment of high school diploma represent 37.3% of all women with births.
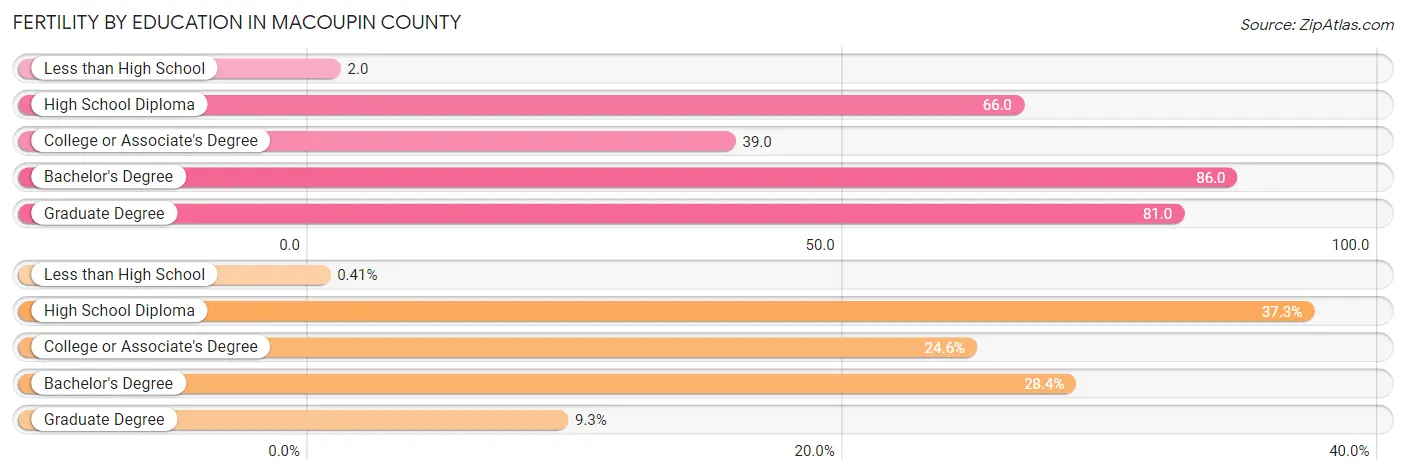
| Educational Attainment | Women with Births | Births / 1,000 Women |
| Less than High School | 2 (0.4%) | 2.0 |
| High School Diploma | 180 (37.3%) | 66.0 |
| College or Associate's Degree | 119 (24.6%) | 39.0 |
| Bachelor's Degree | 137 (28.4%) | 86.0 |
| Graduate Degree | 45 (9.3%) | 81.0 |
| Total | 483 (100.0%) | 53.0 |
Fertility by Education by Marriage Status in Macoupin County
28.8% of women with births in Macoupin County are unmarried. Women with the educational attainment of graduate degree are most likely to be married with 100.0% of them married at childbirth, while women with the educational attainment of less than high school are least likely to be married with 100.0% of them unmarried at childbirth.
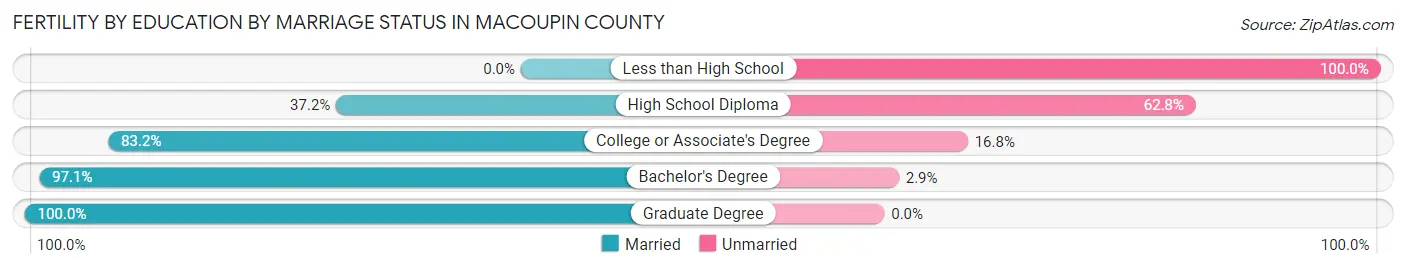
| Educational Attainment | Married | Unmarried |
| Less than High School | 0 (0.0%) | 2 (100.0%) |
| High School Diploma | 67 (37.2%) | 113 (62.8%) |
| College or Associate's Degree | 99 (83.2%) | 20 (16.8%) |
| Bachelor's Degree | 133 (97.1%) | 4 (2.9%) |
| Graduate Degree | 45 (100.0%) | 0 (0.0%) |
| Total | 344 (71.2%) | 139 (28.8%) |
Employment Characteristics in Macoupin County
Employment by Class of Employer in Macoupin County
Among the 19,857 employed individuals in Macoupin County, private company employees (13,766 | 69.3%), not-for-profit organizations (1,392 | 7.0%), and state government employees (1,275 | 6.4%) make up the most common classes of employment.
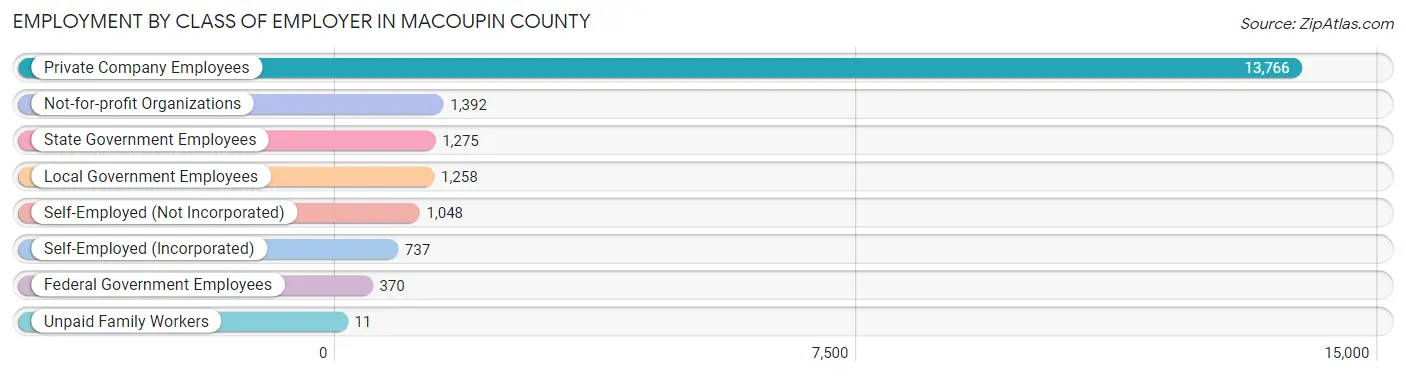
| Employer Class | # Employees | % Employees |
| Private Company Employees | 13,766 | 69.3% |
| Self-Employed (Incorporated) | 737 | 3.7% |
| Self-Employed (Not Incorporated) | 1,048 | 5.3% |
| Not-for-profit Organizations | 1,392 | 7.0% |
| Local Government Employees | 1,258 | 6.3% |
| State Government Employees | 1,275 | 6.4% |
| Federal Government Employees | 370 | 1.9% |
| Unpaid Family Workers | 11 | 0.1% |
| Total | 19,857 | 100.0% |
Employment Status by Age in Macoupin County
According to the labor force statistics for Macoupin County, out of the total population over 16 years of age (36,722), 57.6% or 21,152 individuals are in the labor force, with 4.6% or 973 of them unemployed. The age group with the highest labor force participation rate is 35 to 44 years, with 85.5% or 4,627 individuals in the labor force. Within the labor force, the 16 to 19 years age range has the highest percentage of unemployed individuals, with 12.0% or 111 of them being unemployed.
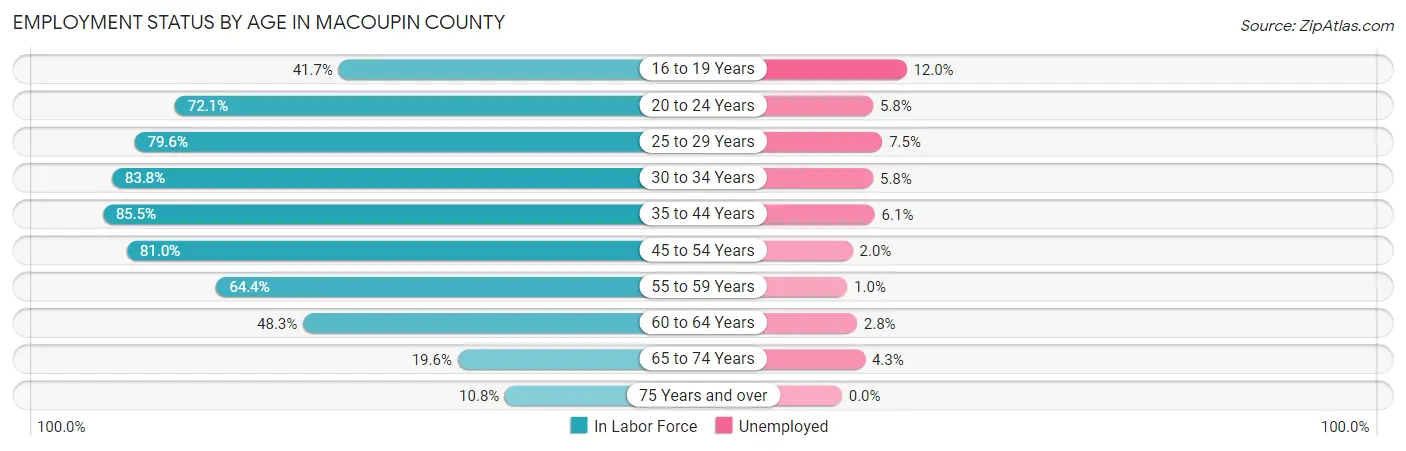
| Age Bracket | In Labor Force | Unemployed |
| 16 to 19 Years | 924 (41.7%) | 111 (12.0%) |
| 20 to 24 Years | 1,769 (72.1%) | 103 (5.8%) |
| 25 to 29 Years | 1,918 (79.6%) | 144 (7.5%) |
| 30 to 34 Years | 2,051 (83.8%) | 119 (5.8%) |
| 35 to 44 Years | 4,627 (85.5%) | 282 (6.1%) |
| 45 to 54 Years | 4,461 (81.0%) | 89 (2.0%) |
| 55 to 59 Years | 2,156 (64.4%) | 22 (1.0%) |
| 60 to 64 Years | 1,758 (48.3%) | 49 (2.8%) |
| 65 to 74 Years | 1,052 (19.6%) | 45 (4.3%) |
| 75 Years and over | 424 (10.8%) | 0 (0.0%) |
| Total | 21,152 (57.6%) | 973 (4.6%) |
Employment Status by Educational Attainment in Macoupin County
According to labor force statistics for Macoupin County, 74.6% of individuals (16,982) out of the total population between 25 and 64 years of age (22,764) are in the labor force, with 4.2% or 713 of them being unemployed. The group with the highest labor force participation rate are those with the educational attainment of bachelor's degree or higher, with 88.4% or 4,226 individuals in the labor force. Within the labor force, individuals with less than high school education have the highest percentage of unemployment, with 7.1% or 57 of them being unemployed.
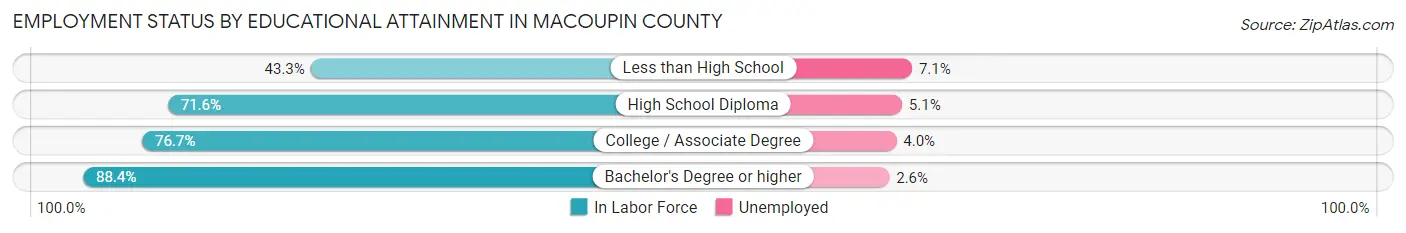
| Educational Attainment | In Labor Force | Unemployed |
| Less than High School | 804 (43.3%) | 132 (7.1%) |
| High School Diploma | 5,941 (71.6%) | 423 (5.1%) |
| College / Associate Degree | 6,006 (76.7%) | 313 (4.0%) |
| Bachelor's Degree or higher | 4,226 (88.4%) | 124 (2.6%) |
| Total | 16,982 (74.6%) | 956 (4.2%) |
Employment Occupations by Sex in Macoupin County
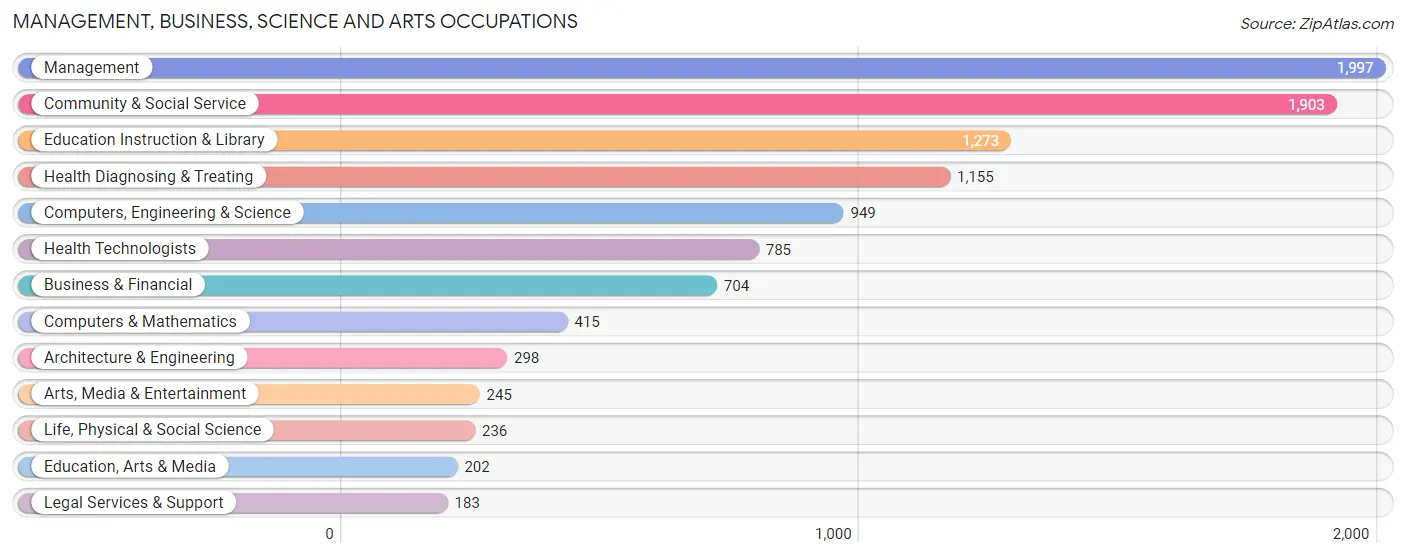
Management, Business, Science and Arts Occupations
The most common Management, Business, Science and Arts occupations in Macoupin County are Management (1,997 | 9.9%), Community & Social Service (1,903 | 9.4%), Education Instruction & Library (1,273 | 6.3%), Health Diagnosing & Treating (1,155 | 5.7%), and Computers, Engineering & Science (949 | 4.7%).
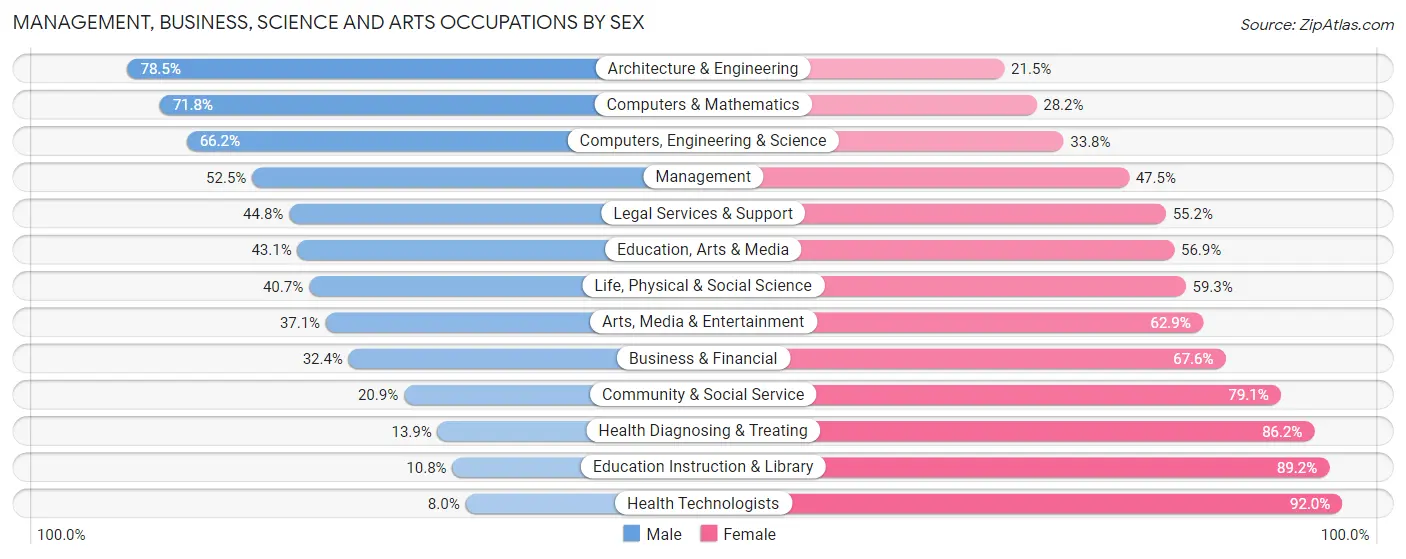
Management, Business, Science and Arts Occupations by Sex
Within the Management, Business, Science and Arts occupations in Macoupin County, the most male-oriented occupations are Architecture & Engineering (78.5%), Computers & Mathematics (71.8%), and Computers, Engineering & Science (66.2%), while the most female-oriented occupations are Health Technologists (92.0%), Education Instruction & Library (89.2%), and Health Diagnosing & Treating (86.2%).
| Occupation | Male | Female |
| Management | 1,049 (52.5%) | 948 (47.5%) |
| Business & Financial | 228 (32.4%) | 476 (67.6%) |
| Computers, Engineering & Science | 628 (66.2%) | 321 (33.8%) |
| Computers & Mathematics | 298 (71.8%) | 117 (28.2%) |
| Architecture & Engineering | 234 (78.5%) | 64 (21.5%) |
| Life, Physical & Social Science | 96 (40.7%) | 140 (59.3%) |
| Community & Social Service | 397 (20.9%) | 1,506 (79.1%) |
| Education, Arts & Media | 87 (43.1%) | 115 (56.9%) |
| Legal Services & Support | 82 (44.8%) | 101 (55.2%) |
| Education Instruction & Library | 137 (10.8%) | 1,136 (89.2%) |
| Arts, Media & Entertainment | 91 (37.1%) | 154 (62.9%) |
| Health Diagnosing & Treating | 160 (13.9%) | 995 (86.2%) |
| Health Technologists | 63 (8.0%) | 722 (92.0%) |
| Total (Category) | 2,462 (36.7%) | 4,246 (63.3%) |
| Total (Overall) | 10,520 (52.1%) | 9,656 (47.9%) |
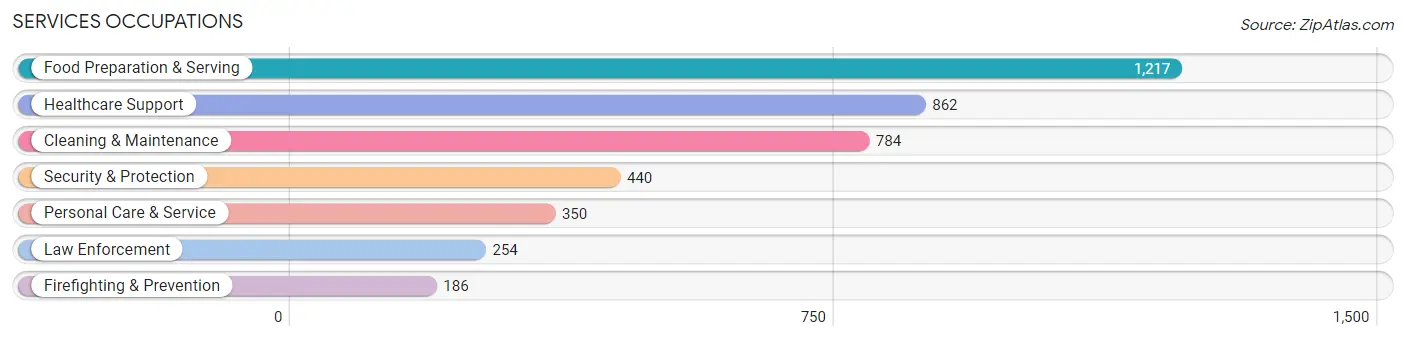
Services Occupations
The most common Services occupations in Macoupin County are Food Preparation & Serving (1,217 | 6.0%), Healthcare Support (862 | 4.3%), Cleaning & Maintenance (784 | 3.9%), Security & Protection (440 | 2.2%), and Personal Care & Service (350 | 1.7%).
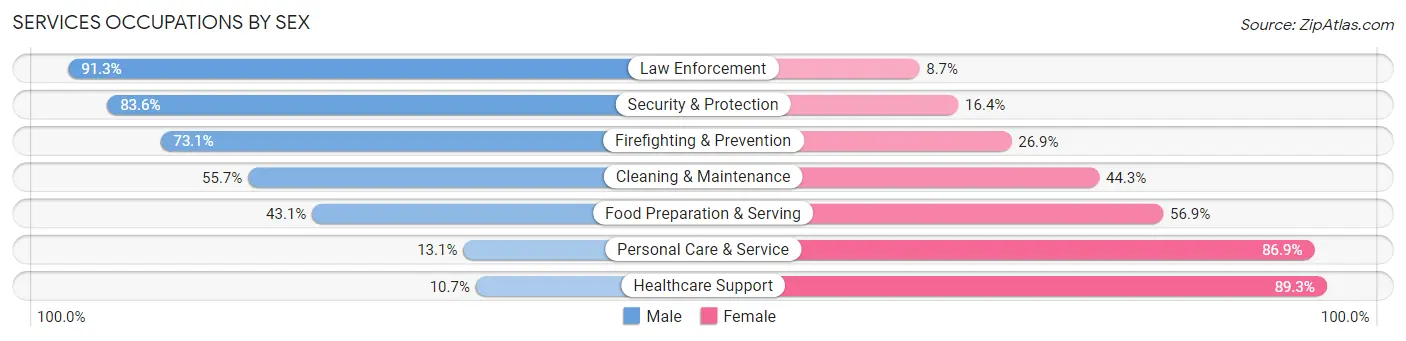
Services Occupations by Sex
Within the Services occupations in Macoupin County, the most male-oriented occupations are Law Enforcement (91.3%), Security & Protection (83.6%), and Firefighting & Prevention (73.1%), while the most female-oriented occupations are Healthcare Support (89.3%), Personal Care & Service (86.9%), and Food Preparation & Serving (56.9%).
| Occupation | Male | Female |
| Healthcare Support | 92 (10.7%) | 770 (89.3%) |
| Security & Protection | 368 (83.6%) | 72 (16.4%) |
| Firefighting & Prevention | 136 (73.1%) | 50 (26.9%) |
| Law Enforcement | 232 (91.3%) | 22 (8.7%) |
| Food Preparation & Serving | 524 (43.1%) | 693 (56.9%) |
| Cleaning & Maintenance | 437 (55.7%) | 347 (44.3%) |
| Personal Care & Service | 46 (13.1%) | 304 (86.9%) |
| Total (Category) | 1,467 (40.2%) | 2,186 (59.8%) |
| Total (Overall) | 10,520 (52.1%) | 9,656 (47.9%) |
Sales and Office Occupations
The most common Sales and Office occupations in Macoupin County are Office & Administration (2,068 | 10.2%), and Sales & Related (1,805 | 8.9%).

Sales and Office Occupations by Sex
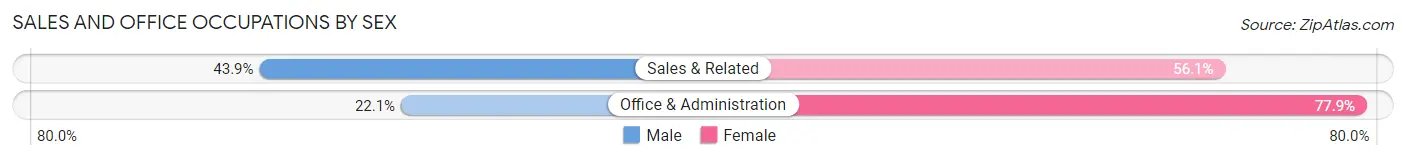
| Occupation | Male | Female |
| Sales & Related | 792 (43.9%) | 1,013 (56.1%) |
| Office & Administration | 457 (22.1%) | 1,611 (77.9%) |
| Total (Category) | 1,249 (32.3%) | 2,624 (67.7%) |
| Total (Overall) | 10,520 (52.1%) | 9,656 (47.9%) |
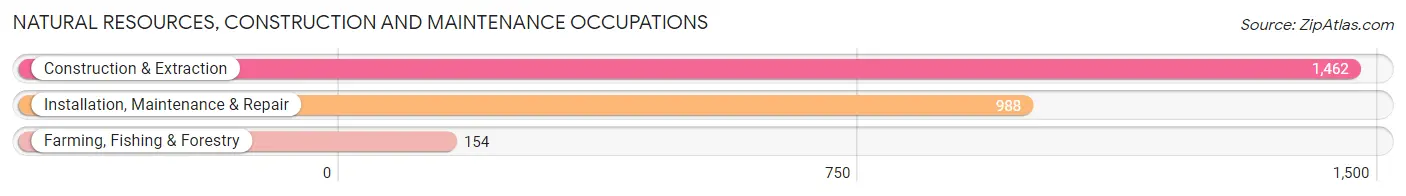
Natural Resources, Construction and Maintenance Occupations
The most common Natural Resources, Construction and Maintenance occupations in Macoupin County are Construction & Extraction (1,462 | 7.2%), Installation, Maintenance & Repair (988 | 4.9%), and Farming, Fishing & Forestry (154 | 0.8%).
Natural Resources, Construction and Maintenance Occupations by Sex
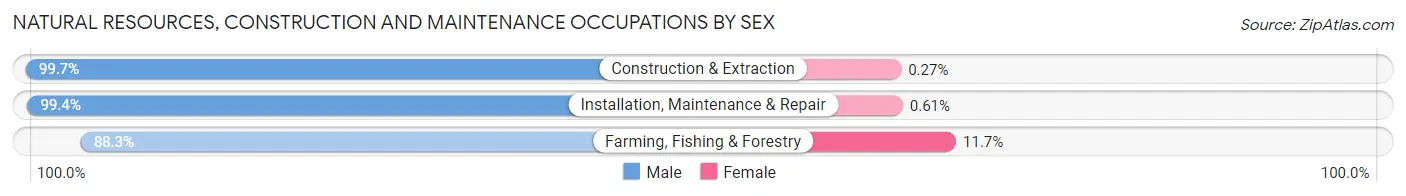
| Occupation | Male | Female |
| Farming, Fishing & Forestry | 136 (88.3%) | 18 (11.7%) |
| Construction & Extraction | 1,458 (99.7%) | 4 (0.3%) |
| Installation, Maintenance & Repair | 982 (99.4%) | 6 (0.6%) |
| Total (Category) | 2,576 (98.9%) | 28 (1.1%) |
| Total (Overall) | 10,520 (52.1%) | 9,656 (47.9%) |
Production, Transportation and Moving Occupations
The most common Production, Transportation and Moving occupations in Macoupin County are Production (1,323 | 6.6%), Transportation (1,019 | 5.1%), and Material Moving (996 | 4.9%).

Production, Transportation and Moving Occupations by Sex
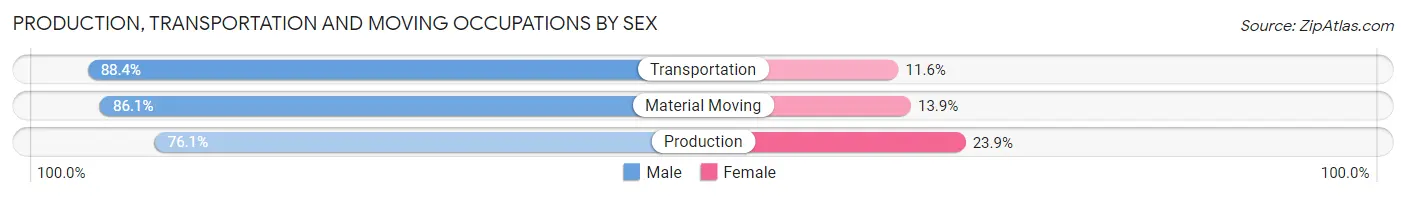
| Occupation | Male | Female |
| Production | 1,007 (76.1%) | 316 (23.9%) |
| Transportation | 901 (88.4%) | 118 (11.6%) |
| Material Moving | 858 (86.1%) | 138 (13.9%) |
| Total (Category) | 2,766 (82.9%) | 572 (17.1%) |
| Total (Overall) | 10,520 (52.1%) | 9,656 (47.9%) |
Employment Industries by Sex in Macoupin County
Employment Industries in Macoupin County
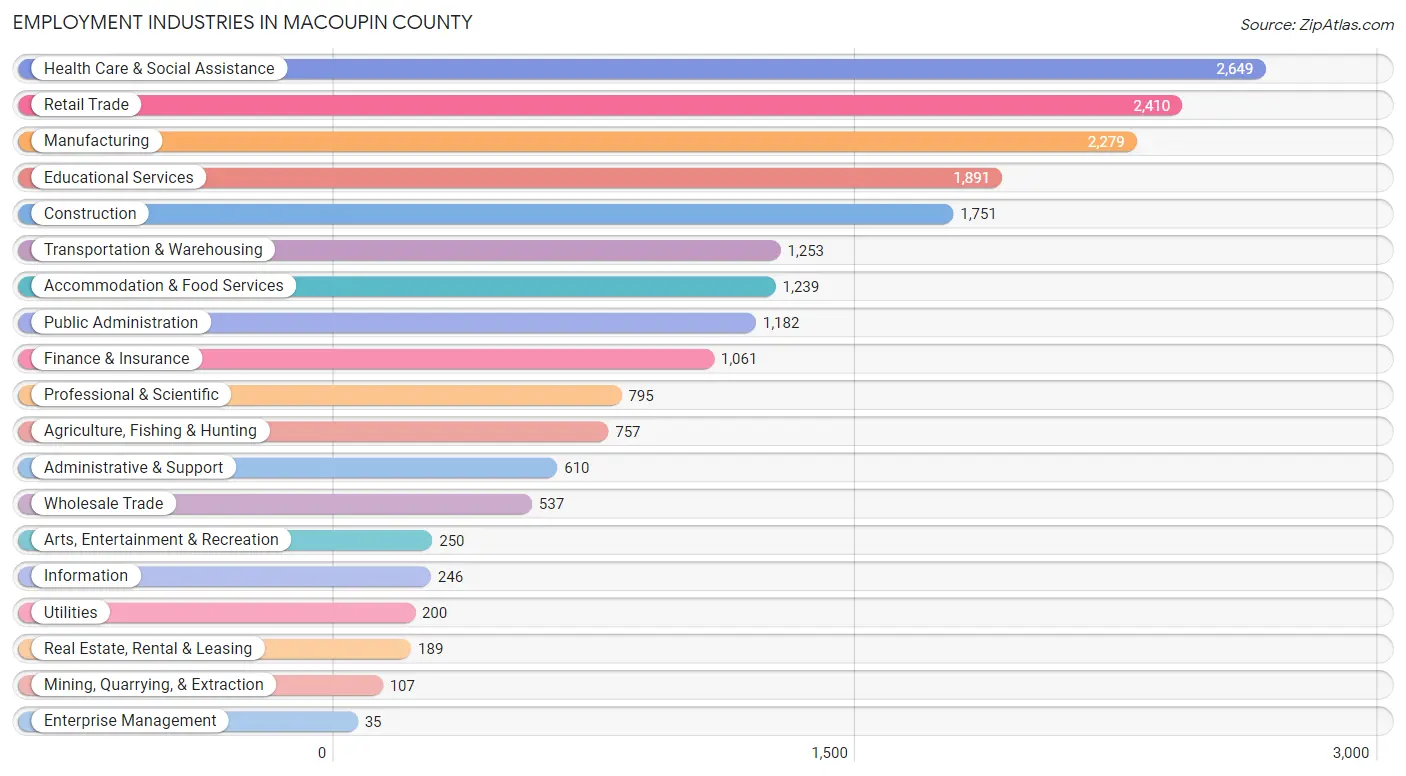
The major employment industries in Macoupin County include Health Care & Social Assistance (2,649 | 13.1%), Retail Trade (2,410 | 11.9%), Manufacturing (2,279 | 11.3%), Educational Services (1,891 | 9.4%), and Construction (1,751 | 8.7%).
Employment Industries by Sex in Macoupin County
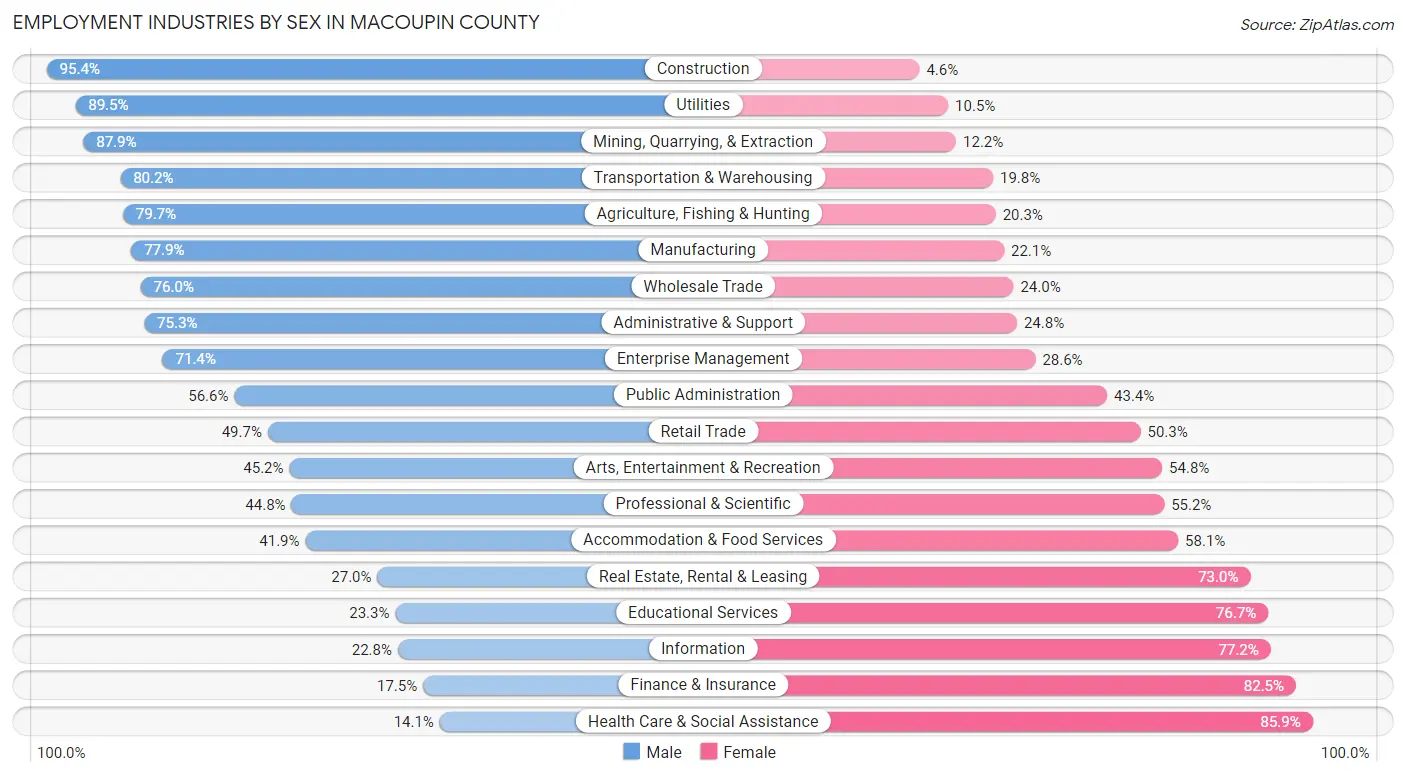
The Macoupin County industries that see more men than women are Construction (95.4%), Utilities (89.5%), and Mining, Quarrying, & Extraction (87.8%), whereas the industries that tend to have a higher number of women are Health Care & Social Assistance (85.9%), Finance & Insurance (82.5%), and Information (77.2%).
| Industry | Male | Female |
| Agriculture, Fishing & Hunting | 603 (79.7%) | 154 (20.3%) |
| Mining, Quarrying, & Extraction | 94 (87.8%) | 13 (12.1%) |
| Construction | 1,671 (95.4%) | 80 (4.6%) |
| Manufacturing | 1,776 (77.9%) | 503 (22.1%) |
| Wholesale Trade | 408 (76.0%) | 129 (24.0%) |
| Retail Trade | 1,197 (49.7%) | 1,213 (50.3%) |
| Transportation & Warehousing | 1,005 (80.2%) | 248 (19.8%) |
| Utilities | 179 (89.5%) | 21 (10.5%) |
| Information | 56 (22.8%) | 190 (77.2%) |
| Finance & Insurance | 186 (17.5%) | 875 (82.5%) |
| Real Estate, Rental & Leasing | 51 (27.0%) | 138 (73.0%) |
| Professional & Scientific | 356 (44.8%) | 439 (55.2%) |
| Enterprise Management | 25 (71.4%) | 10 (28.6%) |
| Administrative & Support | 459 (75.2%) | 151 (24.7%) |
| Educational Services | 440 (23.3%) | 1,451 (76.7%) |
| Health Care & Social Assistance | 373 (14.1%) | 2,276 (85.9%) |
| Arts, Entertainment & Recreation | 113 (45.2%) | 137 (54.8%) |
| Accommodation & Food Services | 519 (41.9%) | 720 (58.1%) |
| Public Administration | 669 (56.6%) | 513 (43.4%) |
| Total | 10,520 (52.1%) | 9,656 (47.9%) |
Education in Macoupin County
School Enrollment in Macoupin County
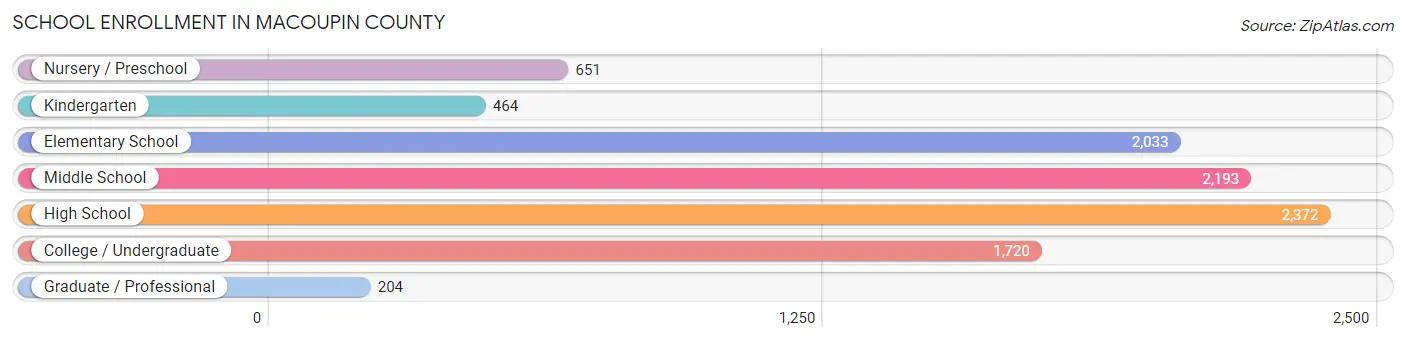
The most common levels of schooling among the 9,637 students in Macoupin County are high school (2,372 | 24.6%), middle school (2,193 | 22.8%), and elementary school (2,033 | 21.1%).
| School Level | # Students | % Students |
| Nursery / Preschool | 651 | 6.8% |
| Kindergarten | 464 | 4.8% |
| Elementary School | 2,033 | 21.1% |
| Middle School | 2,193 | 22.8% |
| High School | 2,372 | 24.6% |
| College / Undergraduate | 1,720 | 17.8% |
| Graduate / Professional | 204 | 2.1% |
| Total | 9,637 | 100.0% |
School Enrollment by Age by Funding Source in Macoupin County
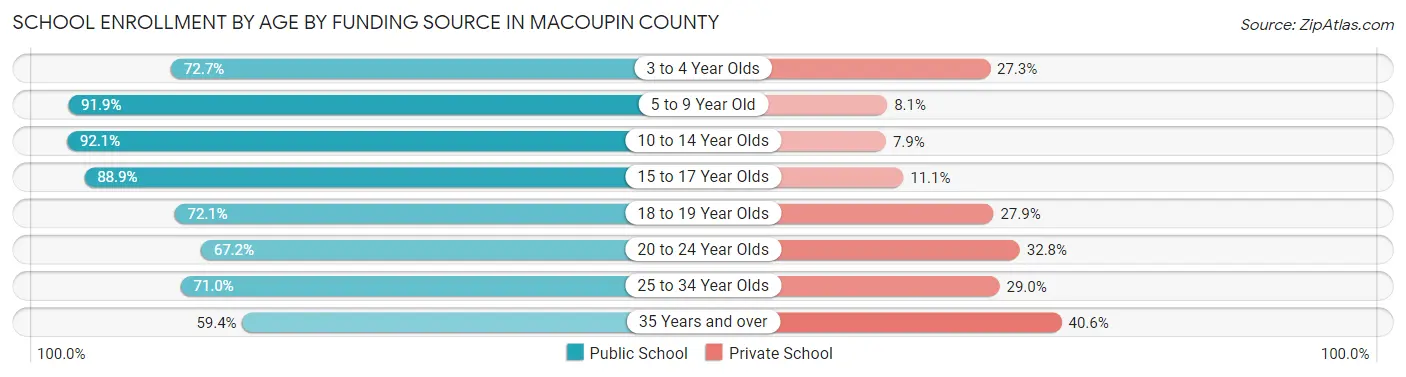
Out of a total of 9,637 students who are enrolled in schools in Macoupin County, 1,465 (15.2%) attend a private institution, while the remaining 8,172 (84.8%) are enrolled in public schools. The age group of 35 years and over has the highest likelihood of being enrolled in private schools, with 140 (40.6% in the age bracket) enrolled. Conversely, the age group of 10 to 14 year olds has the lowest likelihood of being enrolled in a private school, with 2,550 (92.1% in the age bracket) attending a public institution.
| Age Bracket | Public School | Private School |
| 3 to 4 Year Olds | 408 (72.7%) | 153 (27.3%) |
| 5 to 9 Year Old | 2,163 (91.9%) | 191 (8.1%) |
| 10 to 14 Year Olds | 2,550 (92.1%) | 218 (7.9%) |
| 15 to 17 Year Olds | 1,536 (88.9%) | 192 (11.1%) |
| 18 to 19 Year Olds | 429 (72.1%) | 166 (27.9%) |
| 20 to 24 Year Olds | 614 (67.2%) | 300 (32.8%) |
| 25 to 34 Year Olds | 264 (71.0%) | 108 (29.0%) |
| 35 Years and over | 205 (59.4%) | 140 (40.6%) |
| Total | 8,172 (84.8%) | 1,465 (15.2%) |
Educational Attainment by Field of Study in Macoupin County
Education (1,477 | 22.8%), business (1,031 | 15.9%), science & technology (887 | 13.7%), bio, nature & agricultural (692 | 10.7%), and social sciences (416 | 6.4%) are the most common fields of study among 6,493 individuals in Macoupin County who have obtained a bachelor's degree or higher.
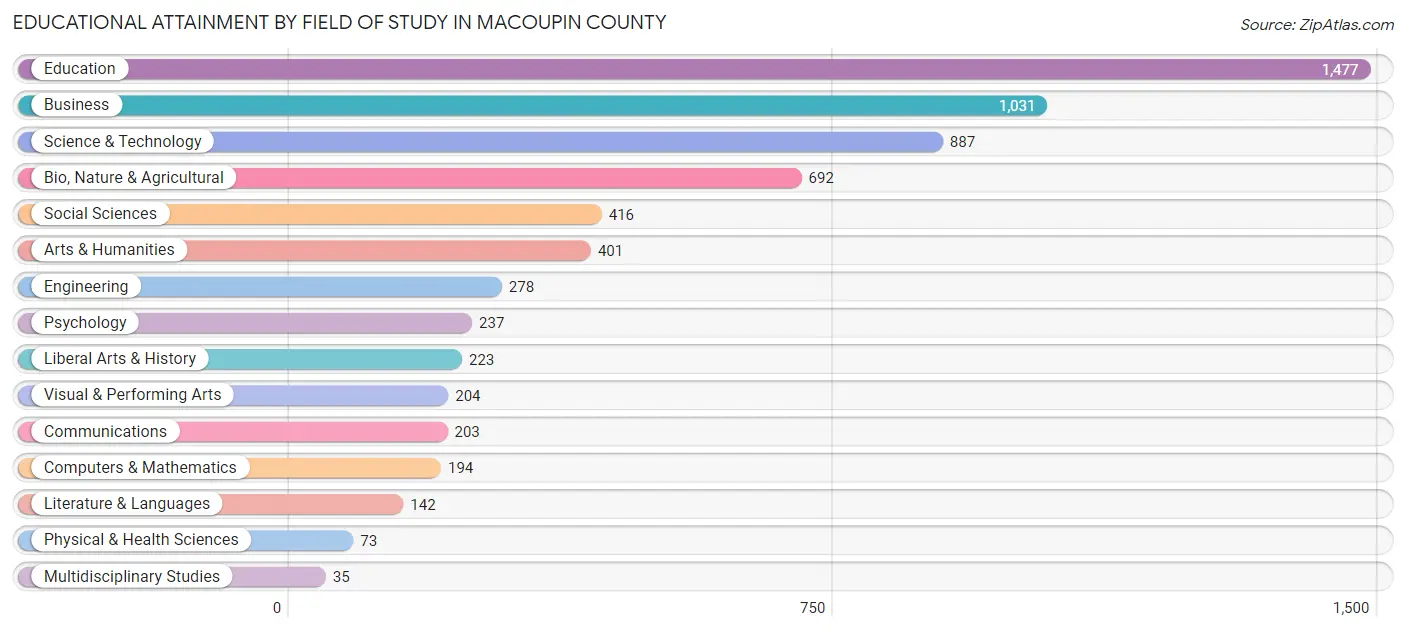
| Field of Study | # Graduates | % Graduates |
| Computers & Mathematics | 194 | 3.0% |
| Bio, Nature & Agricultural | 692 | 10.7% |
| Physical & Health Sciences | 73 | 1.1% |
| Psychology | 237 | 3.6% |
| Social Sciences | 416 | 6.4% |
| Engineering | 278 | 4.3% |
| Multidisciplinary Studies | 35 | 0.5% |
| Science & Technology | 887 | 13.7% |
| Business | 1,031 | 15.9% |
| Education | 1,477 | 22.8% |
| Literature & Languages | 142 | 2.2% |
| Liberal Arts & History | 223 | 3.4% |
| Visual & Performing Arts | 204 | 3.1% |
| Communications | 203 | 3.1% |
| Arts & Humanities | 401 | 6.2% |
| Total | 6,493 | 100.0% |
Transportation & Commute in Macoupin County
Vehicle Availability by Sex in Macoupin County
The most prevalent vehicle ownership categories in Macoupin County are males with 2 vehicles (4,171, accounting for 40.4%) and females with 2 vehicles (3,891, making up 44.9%).
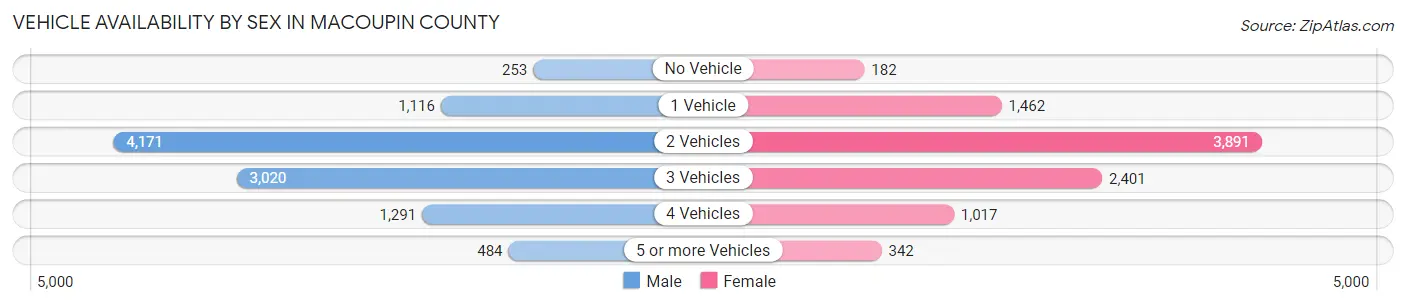
| Vehicles Available | Male | Female |
| No Vehicle | 253 (2.5%) | 182 (2.0%) |
| 1 Vehicle | 1,116 (10.8%) | 1,462 (15.7%) |
| 2 Vehicles | 4,171 (40.4%) | 3,891 (41.9%) |
| 3 Vehicles | 3,020 (29.2%) | 2,401 (25.8%) |
| 4 Vehicles | 1,291 (12.5%) | 1,017 (10.9%) |
| 5 or more Vehicles | 484 (4.7%) | 342 (3.7%) |
| Total | 10,335 (100.0%) | 9,295 (100.0%) |
Commute Time in Macoupin County
The most frequently occuring commute durations in Macoupin County are 5 to 9 minutes (2,570 commuters, 13.9%), 45 to 59 minutes (2,391 commuters, 12.9%), and 20 to 24 minutes (2,126 commuters, 11.5%).
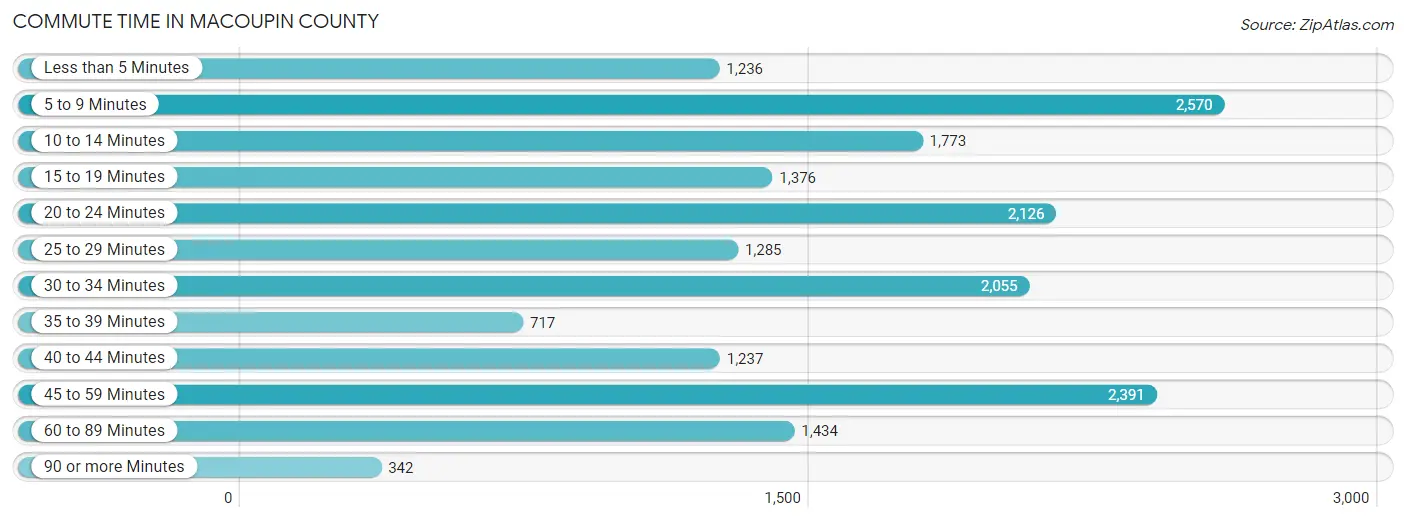
| Commute Time | # Commuters | % Commuters |
| Less than 5 Minutes | 1,236 | 6.7% |
| 5 to 9 Minutes | 2,570 | 13.9% |
| 10 to 14 Minutes | 1,773 | 9.6% |
| 15 to 19 Minutes | 1,376 | 7.4% |
| 20 to 24 Minutes | 2,126 | 11.5% |
| 25 to 29 Minutes | 1,285 | 6.9% |
| 30 to 34 Minutes | 2,055 | 11.1% |
| 35 to 39 Minutes | 717 | 3.9% |
| 40 to 44 Minutes | 1,237 | 6.7% |
| 45 to 59 Minutes | 2,391 | 12.9% |
| 60 to 89 Minutes | 1,434 | 7.7% |
| 90 or more Minutes | 342 | 1.8% |
Commute Time by Sex in Macoupin County
The most common commute times in Macoupin County are 45 to 59 minutes (1,517 commuters, 15.4%) for males and 5 to 9 minutes (1,375 commuters, 15.8%) for females.
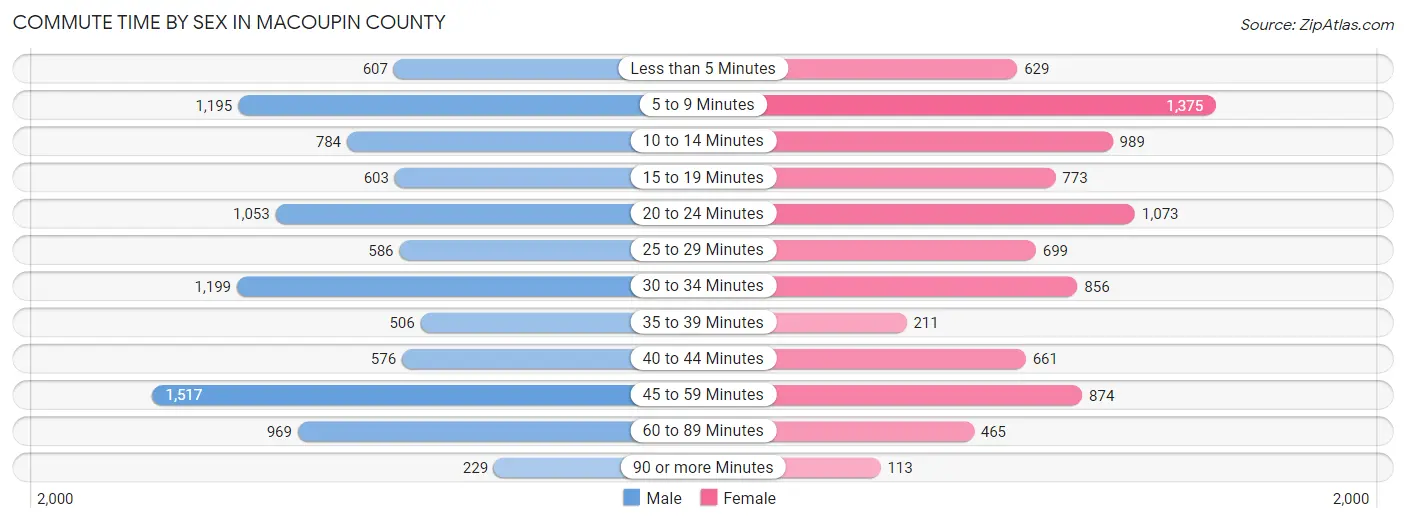
| Commute Time | Male | Female |
| Less than 5 Minutes | 607 (6.2%) | 629 (7.2%) |
| 5 to 9 Minutes | 1,195 (12.2%) | 1,375 (15.8%) |
| 10 to 14 Minutes | 784 (8.0%) | 989 (11.3%) |
| 15 to 19 Minutes | 603 (6.1%) | 773 (8.9%) |
| 20 to 24 Minutes | 1,053 (10.7%) | 1,073 (12.3%) |
| 25 to 29 Minutes | 586 (6.0%) | 699 (8.0%) |
| 30 to 34 Minutes | 1,199 (12.2%) | 856 (9.8%) |
| 35 to 39 Minutes | 506 (5.1%) | 211 (2.4%) |
| 40 to 44 Minutes | 576 (5.9%) | 661 (7.6%) |
| 45 to 59 Minutes | 1,517 (15.4%) | 874 (10.0%) |
| 60 to 89 Minutes | 969 (9.9%) | 465 (5.3%) |
| 90 or more Minutes | 229 (2.3%) | 113 (1.3%) |
Time of Departure to Work by Sex in Macoupin County
The most frequent times of departure to work in Macoupin County are 6:00 AM to 6:29 AM (1,386, 14.1%) for males and 7:00 AM to 7:29 AM (1,635, 18.8%) for females.
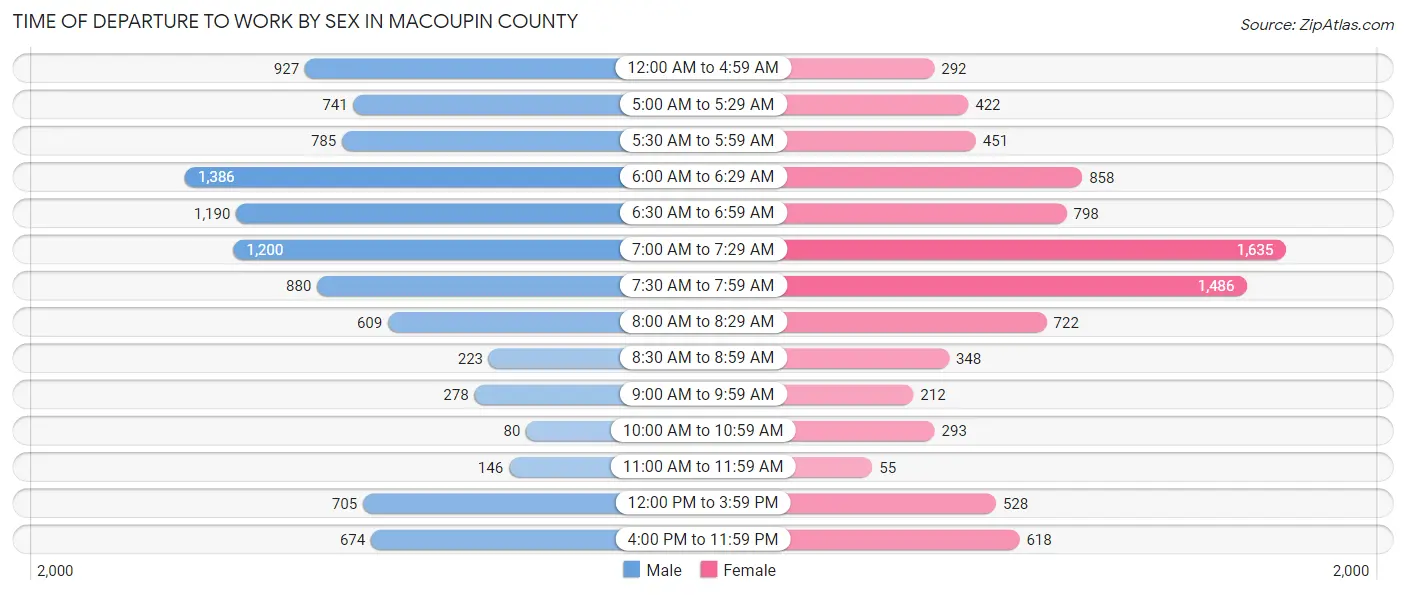
| Time of Departure | Male | Female |
| 12:00 AM to 4:59 AM | 927 (9.4%) | 292 (3.4%) |
| 5:00 AM to 5:29 AM | 741 (7.5%) | 422 (4.8%) |
| 5:30 AM to 5:59 AM | 785 (8.0%) | 451 (5.2%) |
| 6:00 AM to 6:29 AM | 1,386 (14.1%) | 858 (9.8%) |
| 6:30 AM to 6:59 AM | 1,190 (12.1%) | 798 (9.1%) |
| 7:00 AM to 7:29 AM | 1,200 (12.2%) | 1,635 (18.8%) |
| 7:30 AM to 7:59 AM | 880 (9.0%) | 1,486 (17.1%) |
| 8:00 AM to 8:29 AM | 609 (6.2%) | 722 (8.3%) |
| 8:30 AM to 8:59 AM | 223 (2.3%) | 348 (4.0%) |
| 9:00 AM to 9:59 AM | 278 (2.8%) | 212 (2.4%) |
| 10:00 AM to 10:59 AM | 80 (0.8%) | 293 (3.4%) |
| 11:00 AM to 11:59 AM | 146 (1.5%) | 55 (0.6%) |
| 12:00 PM to 3:59 PM | 705 (7.2%) | 528 (6.1%) |
| 4:00 PM to 11:59 PM | 674 (6.9%) | 618 (7.1%) |
| Total | 9,824 (100.0%) | 8,718 (100.0%) |
Housing Occupancy in Macoupin County
Occupancy by Ownership in Macoupin County
Of the total 17,567 dwellings in Macoupin County, owner-occupied units account for 13,660 (77.8%), while renter-occupied units make up 3,907 (22.2%).
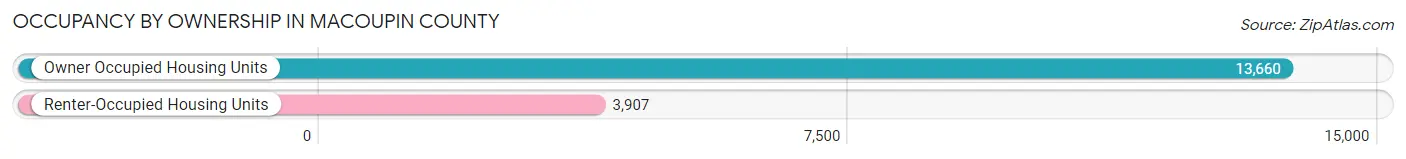
| Occupancy | # Housing Units | % Housing Units |
| Owner Occupied Housing Units | 13,660 | 77.8% |
| Renter-Occupied Housing Units | 3,907 | 22.2% |
| Total Occupied Housing Units | 17,567 | 100.0% |
Occupancy by Household Size in Macoupin County
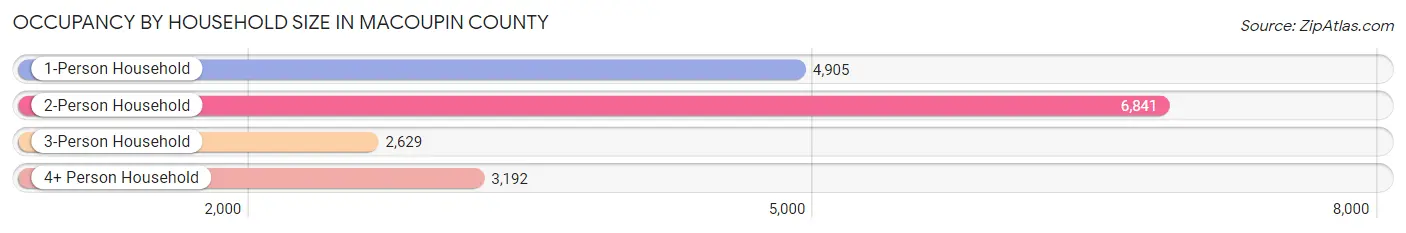
| Household Size | # Housing Units | % Housing Units |
| 1-Person Household | 4,905 | 27.9% |
| 2-Person Household | 6,841 | 38.9% |
| 3-Person Household | 2,629 | 15.0% |
| 4+ Person Household | 3,192 | 18.2% |
| Total Housing Units | 17,567 | 100.0% |
Occupancy by Ownership by Household Size in Macoupin County
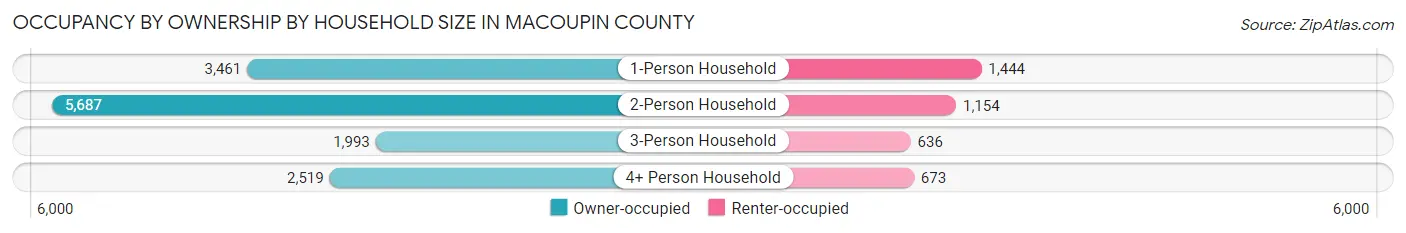
| Household Size | Owner-occupied | Renter-occupied |
| 1-Person Household | 3,461 (70.6%) | 1,444 (29.4%) |
| 2-Person Household | 5,687 (83.1%) | 1,154 (16.9%) |
| 3-Person Household | 1,993 (75.8%) | 636 (24.2%) |
| 4+ Person Household | 2,519 (78.9%) | 673 (21.1%) |
| Total Housing Units | 13,660 (77.8%) | 3,907 (22.2%) |
Occupancy by Educational Attainment in Macoupin County
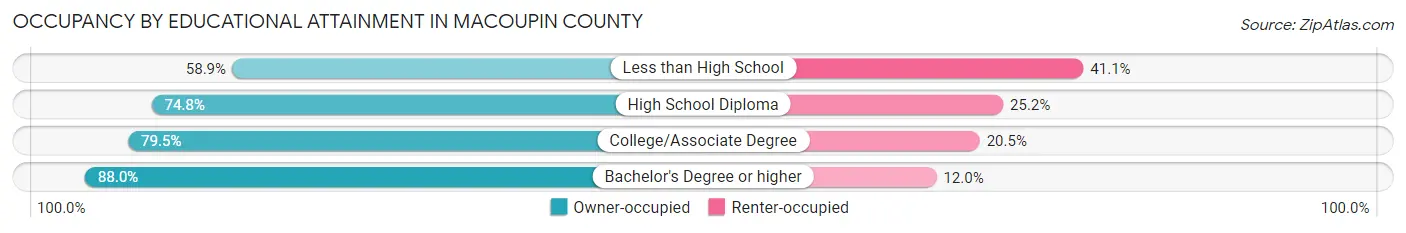
| Household Size | Owner-occupied | Renter-occupied |
| Less than High School | 850 (58.9%) | 593 (41.1%) |
| High School Diploma | 4,821 (74.8%) | 1,622 (25.2%) |
| College/Associate Degree | 4,956 (79.5%) | 1,280 (20.5%) |
| Bachelor's Degree or higher | 3,033 (88.0%) | 412 (12.0%) |
Occupancy by Age of Householder in Macoupin County
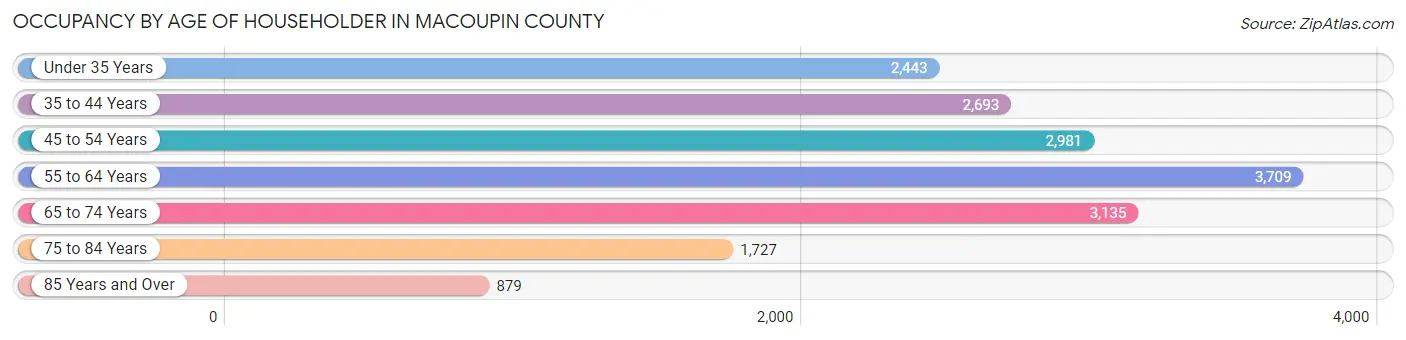
| Age Bracket | # Households | % Households |
| Under 35 Years | 2,443 | 13.9% |
| 35 to 44 Years | 2,693 | 15.3% |
| 45 to 54 Years | 2,981 | 17.0% |
| 55 to 64 Years | 3,709 | 21.1% |
| 65 to 74 Years | 3,135 | 17.8% |
| 75 to 84 Years | 1,727 | 9.8% |
| 85 Years and Over | 879 | 5.0% |
| Total | 17,567 | 100.0% |
Housing Finances in Macoupin County
Median Income by Occupancy in Macoupin County
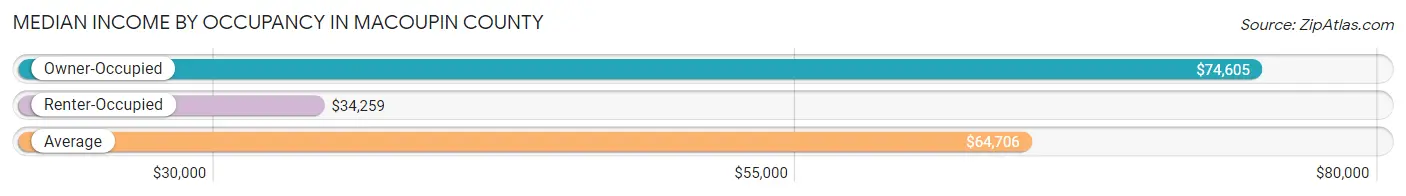
| Occupancy Type | # Households | Median Income |
| Owner-Occupied | 13,660 (77.8%) | $74,605 |
| Renter-Occupied | 3,907 (22.2%) | $34,259 |
| Average | 17,567 (100.0%) | $64,706 |
Occupancy by Householder Income Bracket in Macoupin County
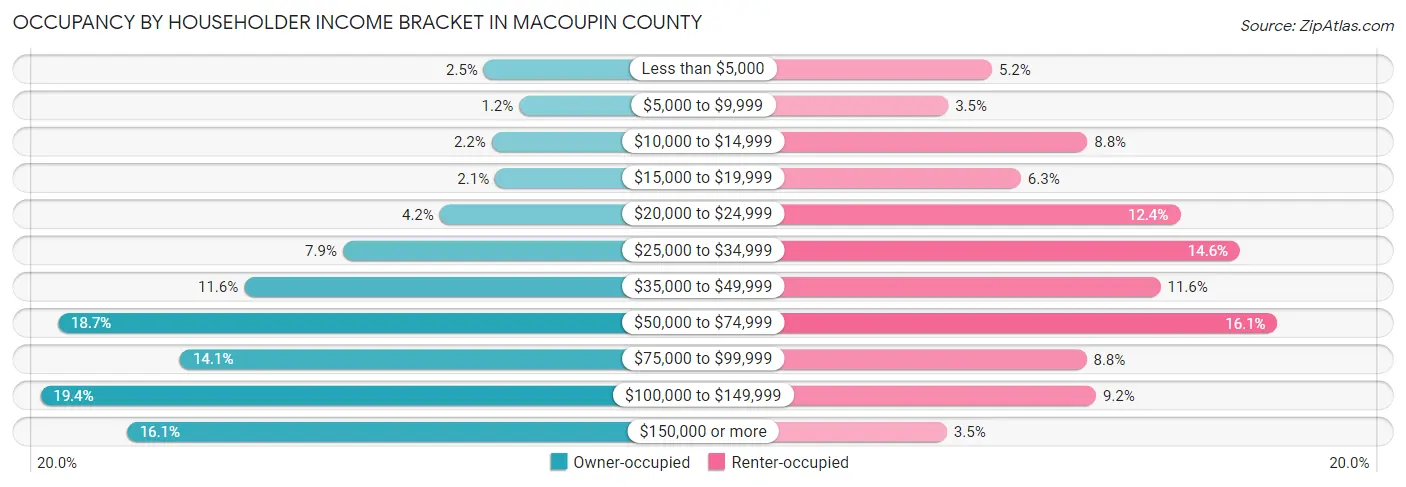
| Income Bracket | Owner-occupied | Renter-occupied |
| Less than $5,000 | 343 (2.5%) | 203 (5.2%) |
| $5,000 to $9,999 | 159 (1.2%) | 138 (3.5%) |
| $10,000 to $14,999 | 302 (2.2%) | 345 (8.8%) |
| $15,000 to $19,999 | 284 (2.1%) | 246 (6.3%) |
| $20,000 to $24,999 | 572 (4.2%) | 483 (12.4%) |
| $25,000 to $34,999 | 1,076 (7.9%) | 572 (14.6%) |
| $35,000 to $49,999 | 1,590 (11.6%) | 454 (11.6%) |
| $50,000 to $74,999 | 2,559 (18.7%) | 628 (16.1%) |
| $75,000 to $99,999 | 1,924 (14.1%) | 344 (8.8%) |
| $100,000 to $149,999 | 2,650 (19.4%) | 358 (9.2%) |
| $150,000 or more | 2,201 (16.1%) | 136 (3.5%) |
| Total | 13,660 (100.0%) | 3,907 (100.0%) |
Monthly Housing Cost Tiers in Macoupin County
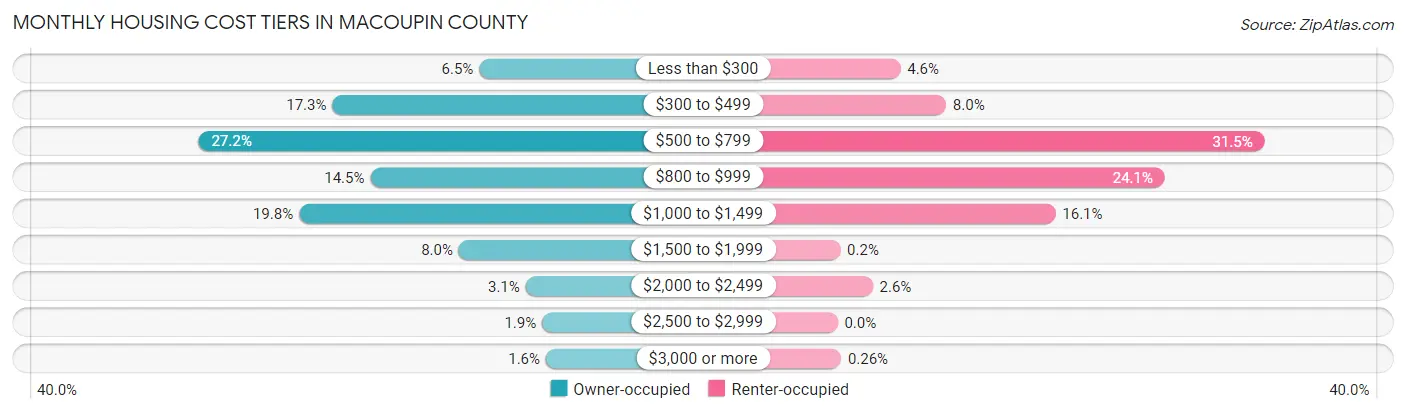
| Monthly Cost | Owner-occupied | Renter-occupied |
| Less than $300 | 890 (6.5%) | 181 (4.6%) |
| $300 to $499 | 2,369 (17.3%) | 312 (8.0%) |
| $500 to $799 | 3,714 (27.2%) | 1,229 (31.5%) |
| $800 to $999 | 1,986 (14.5%) | 942 (24.1%) |
| $1,000 to $1,499 | 2,703 (19.8%) | 627 (16.1%) |
| $1,500 to $1,999 | 1,096 (8.0%) | 8 (0.2%) |
| $2,000 to $2,499 | 424 (3.1%) | 101 (2.6%) |
| $2,500 to $2,999 | 258 (1.9%) | 0 (0.0%) |
| $3,000 or more | 220 (1.6%) | 10 (0.3%) |
| Total | 13,660 (100.0%) | 3,907 (100.0%) |
Physical Housing Characteristics in Macoupin County
Housing Structures in Macoupin County
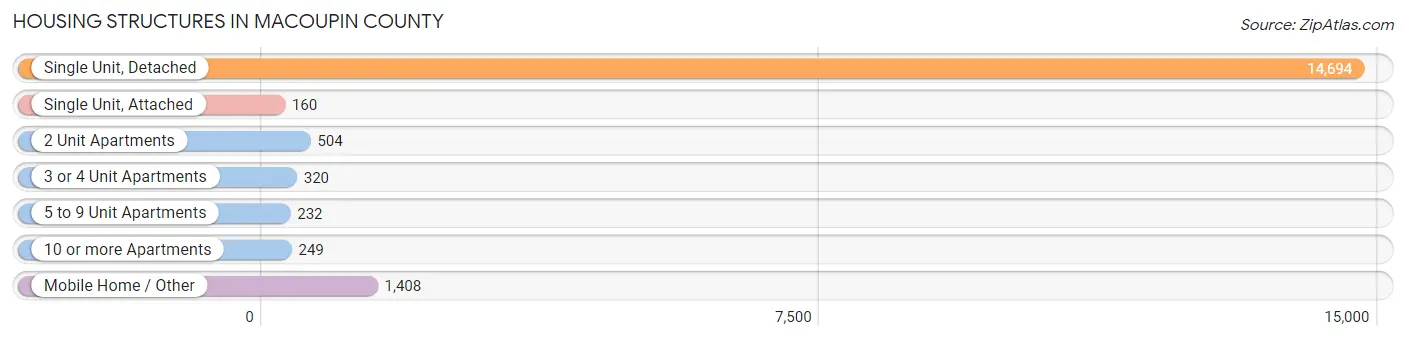
| Structure Type | # Housing Units | % Housing Units |
| Single Unit, Detached | 14,694 | 83.7% |
| Single Unit, Attached | 160 | 0.9% |
| 2 Unit Apartments | 504 | 2.9% |
| 3 or 4 Unit Apartments | 320 | 1.8% |
| 5 to 9 Unit Apartments | 232 | 1.3% |
| 10 or more Apartments | 249 | 1.4% |
| Mobile Home / Other | 1,408 | 8.0% |
| Total | 17,567 | 100.0% |
Housing Structures by Occupancy in Macoupin County
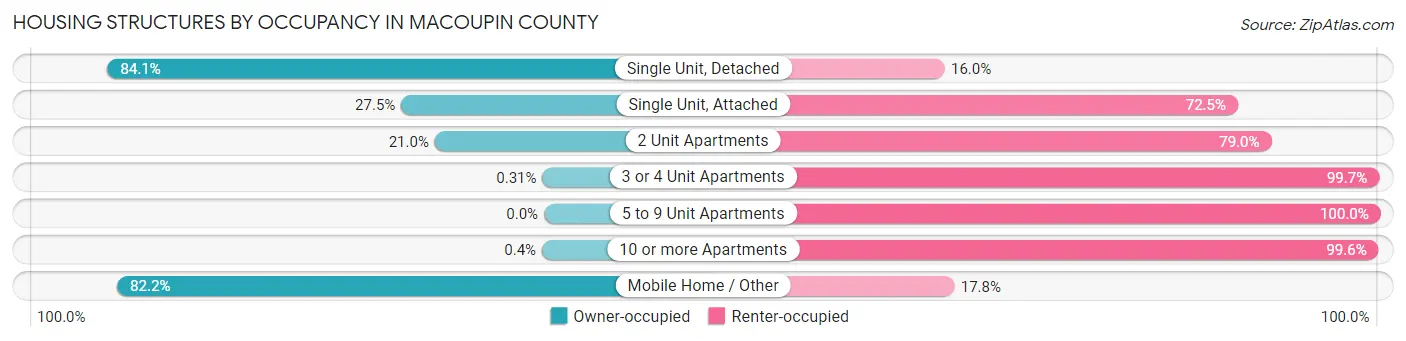
| Structure Type | Owner-occupied | Renter-occupied |
| Single Unit, Detached | 12,351 (84.1%) | 2,343 (16.0%) |
| Single Unit, Attached | 44 (27.5%) | 116 (72.5%) |
| 2 Unit Apartments | 106 (21.0%) | 398 (79.0%) |
| 3 or 4 Unit Apartments | 1 (0.3%) | 319 (99.7%) |
| 5 to 9 Unit Apartments | 0 (0.0%) | 232 (100.0%) |
| 10 or more Apartments | 1 (0.4%) | 248 (99.6%) |
| Mobile Home / Other | 1,157 (82.2%) | 251 (17.8%) |
| Total | 13,660 (77.8%) | 3,907 (22.2%) |
Housing Structures by Number of Rooms in Macoupin County

| Number of Rooms | Owner-occupied | Renter-occupied |
| 1 Room | 6 (0.0%) | 9 (0.2%) |
| 2 or 3 Rooms | 329 (2.4%) | 593 (15.2%) |
| 4 or 5 Rooms | 4,640 (34.0%) | 2,227 (57.0%) |
| 6 or 7 Rooms | 5,237 (38.3%) | 818 (20.9%) |
| 8 or more Rooms | 3,448 (25.2%) | 260 (6.7%) |
| Total | 13,660 (100.0%) | 3,907 (100.0%) |
Housing Structure by Heating Type in Macoupin County
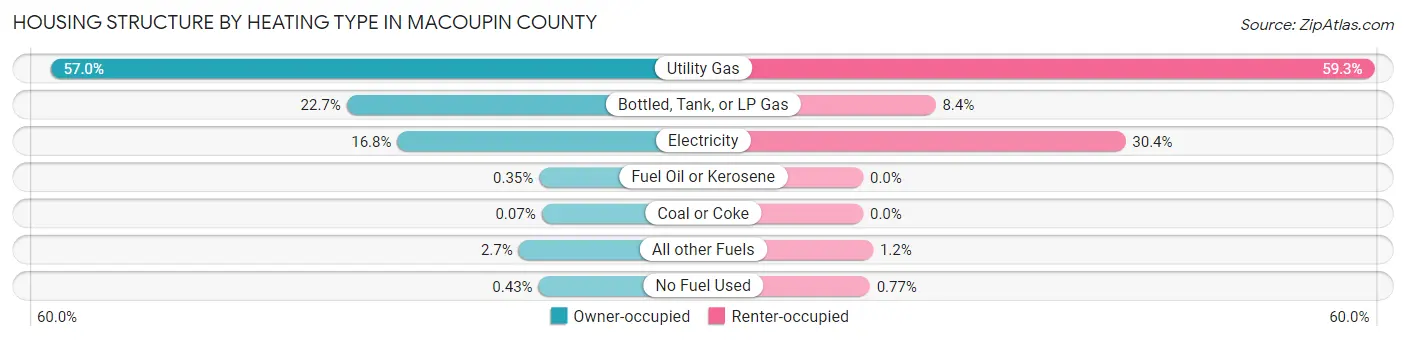
| Heating Type | Owner-occupied | Renter-occupied |
| Utility Gas | 7,783 (57.0%) | 2,316 (59.3%) |
| Bottled, Tank, or LP Gas | 3,095 (22.7%) | 328 (8.4%) |
| Electricity | 2,293 (16.8%) | 1,188 (30.4%) |
| Fuel Oil or Kerosene | 48 (0.4%) | 0 (0.0%) |
| Coal or Coke | 9 (0.1%) | 0 (0.0%) |
| All other Fuels | 373 (2.7%) | 45 (1.1%) |
| No Fuel Used | 59 (0.4%) | 30 (0.8%) |
| Total | 13,660 (100.0%) | 3,907 (100.0%) |
Household Vehicle Usage in Macoupin County
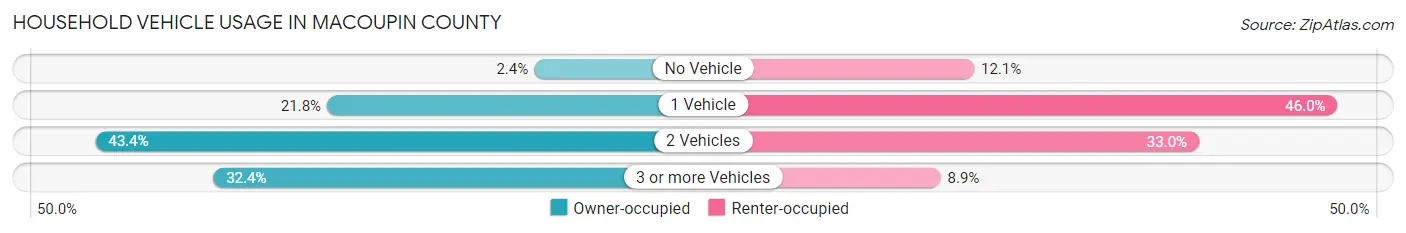
| Vehicles per Household | Owner-occupied | Renter-occupied |
| No Vehicle | 333 (2.4%) | 471 (12.1%) |
| 1 Vehicle | 2,975 (21.8%) | 1,796 (46.0%) |
| 2 Vehicles | 5,928 (43.4%) | 1,291 (33.0%) |
| 3 or more Vehicles | 4,424 (32.4%) | 349 (8.9%) |
| Total | 13,660 (100.0%) | 3,907 (100.0%) |
Real Estate & Mortgages in Macoupin County
Real Estate and Mortgage Overview in Macoupin County
| Characteristic | Without Mortgage | With Mortgage |
| Housing Units | 6,769 | 6,891 |
| Median Property Value | $111,600 | $129,100 |
| Median Household Income | $61,078 | $1,423 |
| Monthly Housing Costs | $519 | $210 |
| Real Estate Taxes | $1,828 | $115 |
Property Value by Mortgage Status in Macoupin County
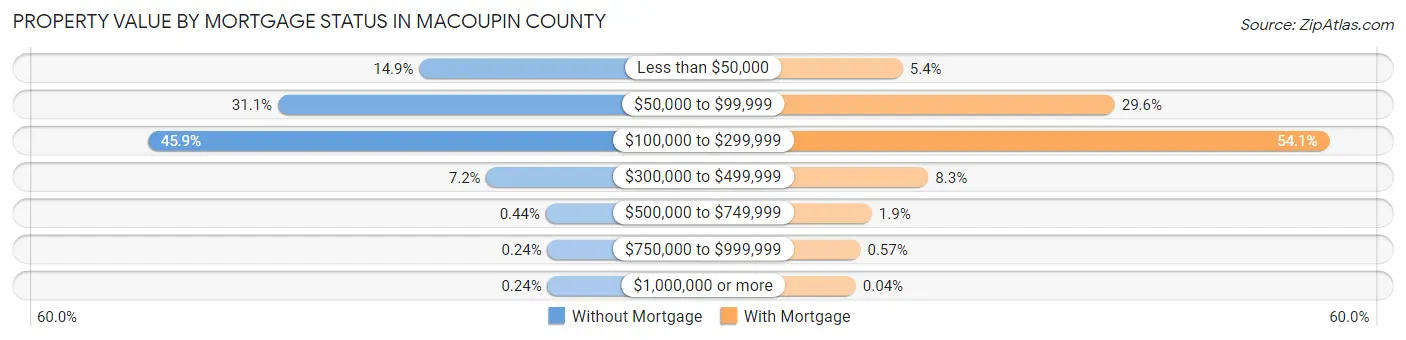
| Property Value | Without Mortgage | With Mortgage |
| Less than $50,000 | 1,008 (14.9%) | 373 (5.4%) |
| $50,000 to $99,999 | 2,102 (31.0%) | 2,042 (29.6%) |
| $100,000 to $299,999 | 3,108 (45.9%) | 3,731 (54.1%) |
| $300,000 to $499,999 | 489 (7.2%) | 574 (8.3%) |
| $500,000 to $749,999 | 30 (0.4%) | 129 (1.9%) |
| $750,000 to $999,999 | 16 (0.2%) | 39 (0.6%) |
| $1,000,000 or more | 16 (0.2%) | 3 (0.0%) |
| Total | 6,769 (100.0%) | 6,891 (100.0%) |
Household Income by Mortgage Status in Macoupin County
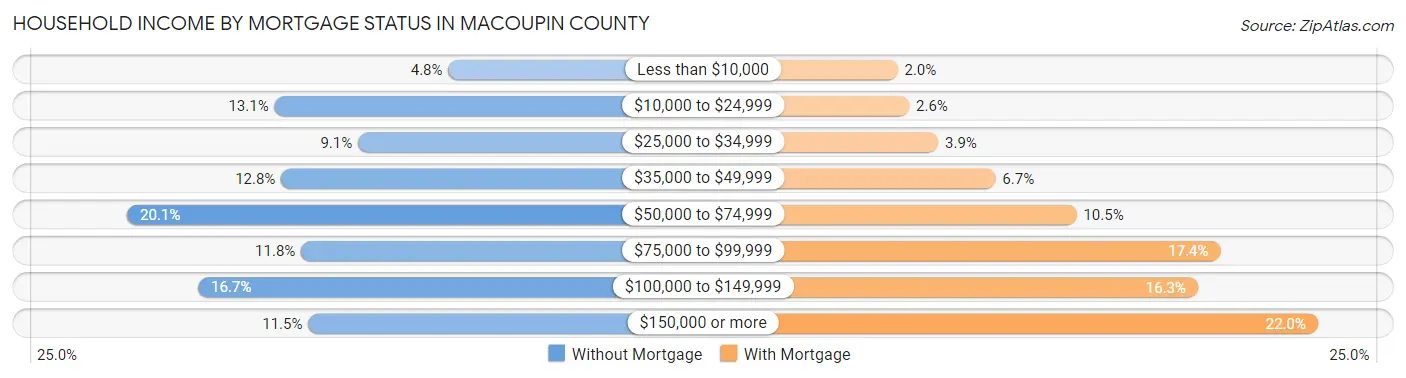
| Household Income | Without Mortgage | With Mortgage |
| Less than $10,000 | 326 (4.8%) | 138 (2.0%) |
| $10,000 to $24,999 | 887 (13.1%) | 176 (2.5%) |
| $25,000 to $34,999 | 617 (9.1%) | 271 (3.9%) |
| $35,000 to $49,999 | 865 (12.8%) | 459 (6.7%) |
| $50,000 to $74,999 | 1,362 (20.1%) | 725 (10.5%) |
| $75,000 to $99,999 | 801 (11.8%) | 1,197 (17.4%) |
| $100,000 to $149,999 | 1,133 (16.7%) | 1,123 (16.3%) |
| $150,000 or more | 778 (11.5%) | 1,517 (22.0%) |
| Total | 6,769 (100.0%) | 6,891 (100.0%) |
Property Value to Household Income Ratio in Macoupin County
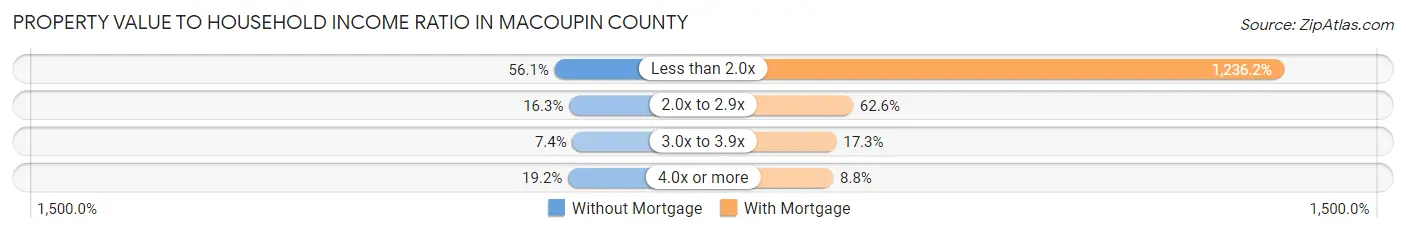
| Value-to-Income Ratio | Without Mortgage | With Mortgage |
| Less than 2.0x | 3,795 (56.1%) | 85,186 (1,236.2%) |
| 2.0x to 2.9x | 1,104 (16.3%) | 4,312 (62.6%) |
| 3.0x to 3.9x | 498 (7.4%) | 1,189 (17.2%) |
| 4.0x or more | 1,300 (19.2%) | 604 (8.8%) |
| Total | 6,769 (100.0%) | 6,891 (100.0%) |
Real Estate Taxes by Mortgage Status in Macoupin County
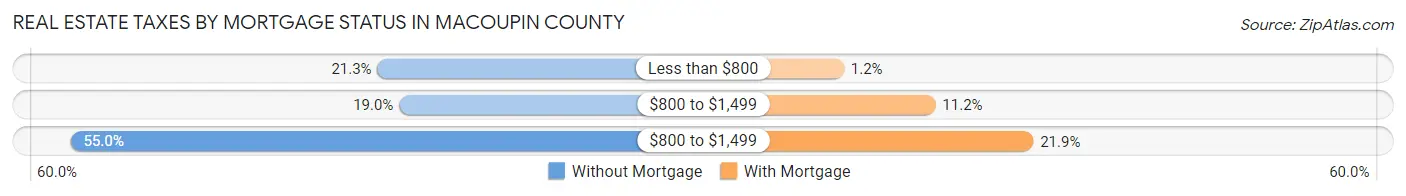
| Property Taxes | Without Mortgage | With Mortgage |
| Less than $800 | 1,444 (21.3%) | 81 (1.2%) |
| $800 to $1,499 | 1,283 (19.0%) | 773 (11.2%) |
| $800 to $1,499 | 3,721 (55.0%) | 1,512 (21.9%) |
| Total | 6,769 (100.0%) | 6,891 (100.0%) |
Health & Disability in Macoupin County
Health Insurance Coverage by Age in Macoupin County
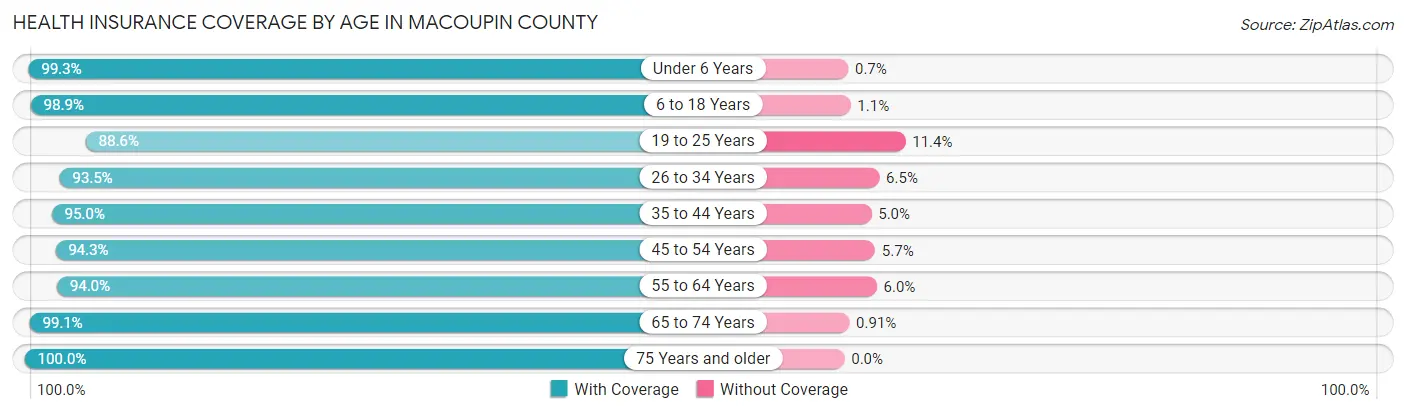
| Age Bracket | With Coverage | Without Coverage |
| Under 6 Years | 2,554 (99.3%) | 18 (0.7%) |
| 6 to 18 Years | 7,178 (98.9%) | 83 (1.1%) |
| 19 to 25 Years | 3,169 (88.6%) | 407 (11.4%) |
| 26 to 34 Years | 4,000 (93.5%) | 278 (6.5%) |
| 35 to 44 Years | 5,138 (95.0%) | 272 (5.0%) |
| 45 to 54 Years | 5,149 (94.3%) | 312 (5.7%) |
| 55 to 64 Years | 6,500 (94.0%) | 416 (6.0%) |
| 65 to 74 Years | 5,255 (99.1%) | 48 (0.9%) |
| 75 Years and older | 3,672 (100.0%) | 0 (0.0%) |
| Total | 42,615 (95.9%) | 1,834 (4.1%) |
Health Insurance Coverage by Citizenship Status in Macoupin County
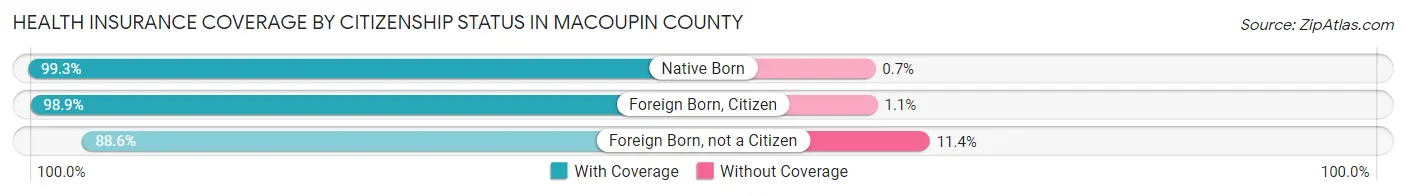
| Citizenship Status | With Coverage | Without Coverage |
| Native Born | 2,554 (99.3%) | 18 (0.7%) |
| Foreign Born, Citizen | 7,178 (98.9%) | 83 (1.1%) |
| Foreign Born, not a Citizen | 3,169 (88.6%) | 407 (11.4%) |
Health Insurance Coverage by Household Income in Macoupin County
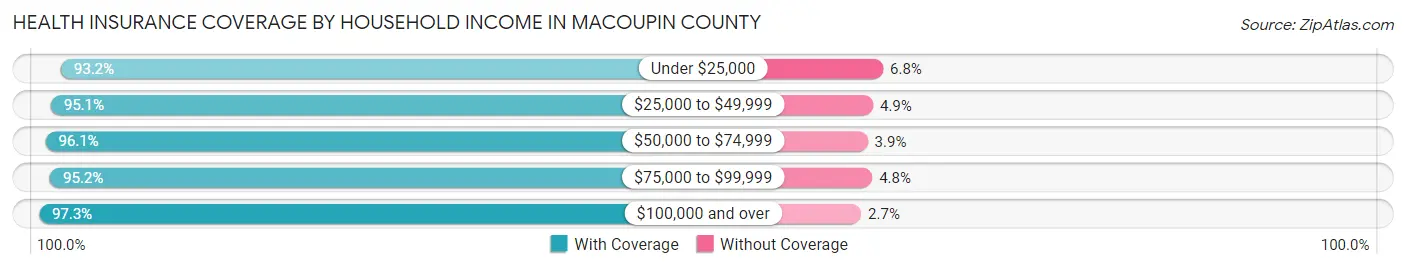
| Household Income | With Coverage | Without Coverage |
| Under $25,000 | 5,411 (93.2%) | 395 (6.8%) |
| $25,000 to $49,999 | 7,538 (95.1%) | 390 (4.9%) |
| $50,000 to $74,999 | 7,098 (96.1%) | 289 (3.9%) |
| $75,000 to $99,999 | 5,836 (95.2%) | 292 (4.8%) |
| $100,000 and over | 16,388 (97.3%) | 453 (2.7%) |
Public vs Private Health Insurance Coverage by Age in Macoupin County
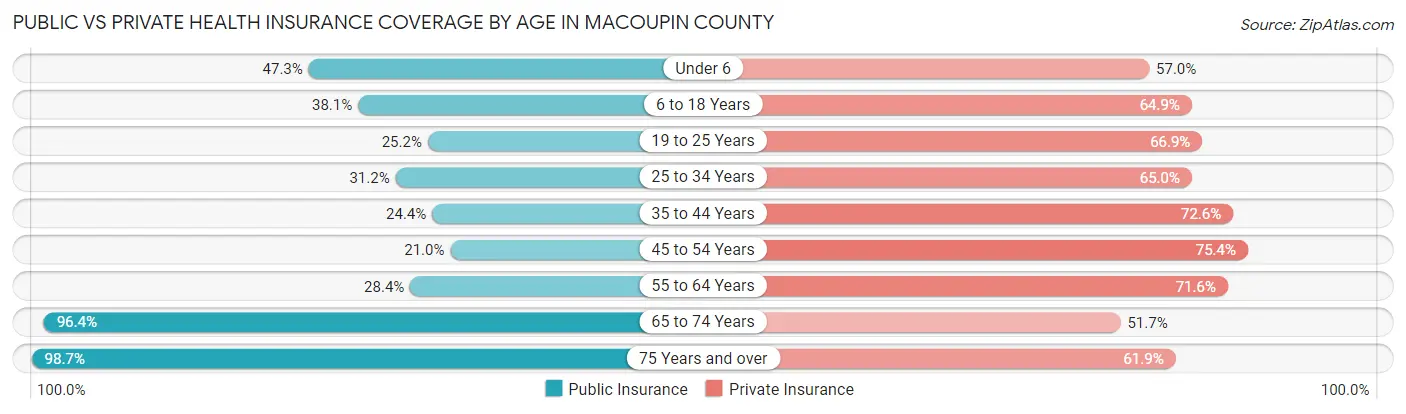
| Age Bracket | Public Insurance | Private Insurance |
| Under 6 | 1,216 (47.3%) | 1,467 (57.0%) |
| 6 to 18 Years | 2,767 (38.1%) | 4,715 (64.9%) |
| 19 to 25 Years | 900 (25.2%) | 2,392 (66.9%) |
| 25 to 34 Years | 1,333 (31.2%) | 2,779 (65.0%) |
| 35 to 44 Years | 1,318 (24.4%) | 3,928 (72.6%) |
| 45 to 54 Years | 1,146 (21.0%) | 4,115 (75.3%) |
| 55 to 64 Years | 1,966 (28.4%) | 4,954 (71.6%) |
| 65 to 74 Years | 5,114 (96.4%) | 2,743 (51.7%) |
| 75 Years and over | 3,624 (98.7%) | 2,274 (61.9%) |
| Total | 19,384 (43.6%) | 29,367 (66.1%) |
Disability Status by Sex by Age in Macoupin County
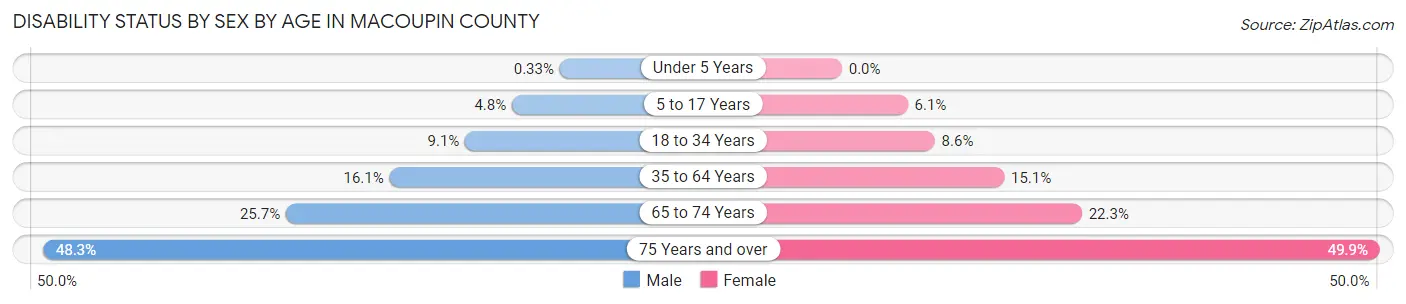
| Age Bracket | Male | Female |
| Under 5 Years | 4 (0.3%) | 0 (0.0%) |
| 5 to 17 Years | 178 (4.8%) | 205 (6.1%) |
| 18 to 34 Years | 382 (9.1%) | 359 (8.6%) |
| 35 to 64 Years | 1,451 (16.1%) | 1,324 (15.1%) |
| 65 to 74 Years | 659 (25.7%) | 611 (22.3%) |
| 75 Years and over | 754 (48.3%) | 1,054 (49.9%) |
Disability Class by Sex by Age in Macoupin County
Disability Class: Hearing Difficulty
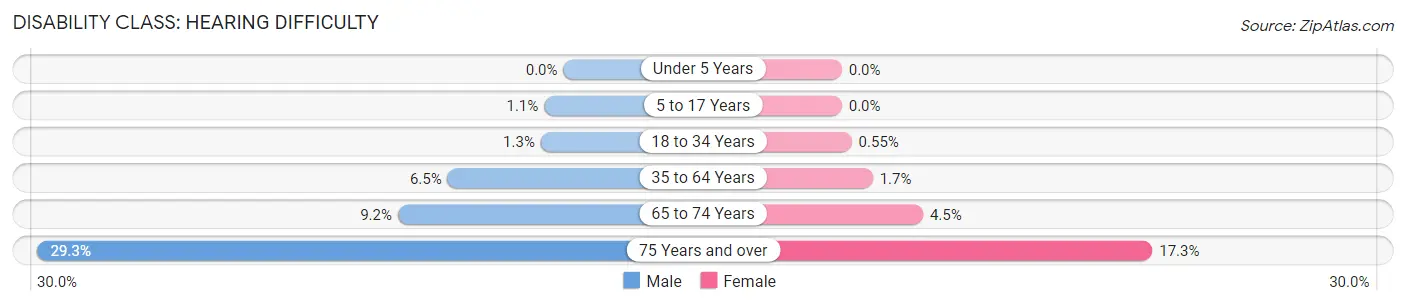
| Age Bracket | Male | Female |
| Under 5 Years | 0 (0.0%) | 0 (0.0%) |
| 5 to 17 Years | 40 (1.1%) | 0 (0.0%) |
| 18 to 34 Years | 53 (1.3%) | 23 (0.5%) |
| 35 to 64 Years | 580 (6.5%) | 151 (1.7%) |
| 65 to 74 Years | 236 (9.2%) | 124 (4.5%) |
| 75 Years and over | 457 (29.3%) | 365 (17.3%) |
Disability Class: Vision Difficulty
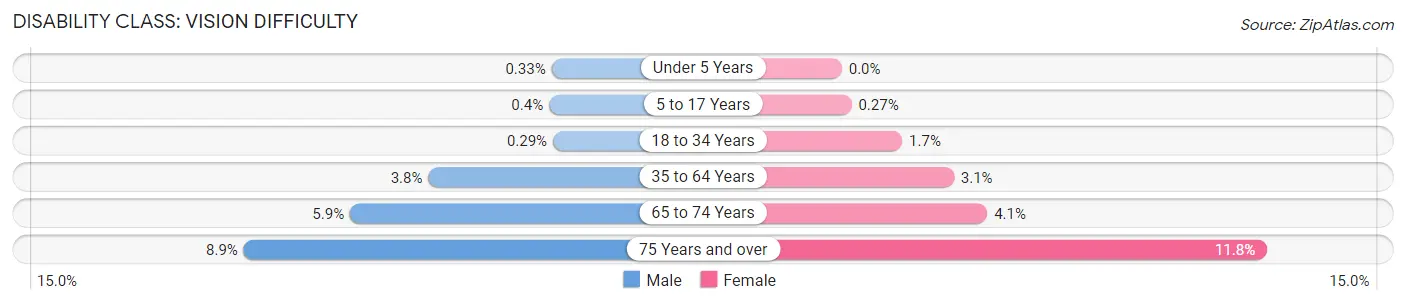
| Age Bracket | Male | Female |
| Under 5 Years | 4 (0.3%) | 0 (0.0%) |
| 5 to 17 Years | 15 (0.4%) | 9 (0.3%) |
| 18 to 34 Years | 12 (0.3%) | 70 (1.7%) |
| 35 to 64 Years | 338 (3.8%) | 274 (3.1%) |
| 65 to 74 Years | 152 (5.9%) | 111 (4.1%) |
| 75 Years and over | 139 (8.9%) | 250 (11.8%) |
Disability Class: Cognitive Difficulty
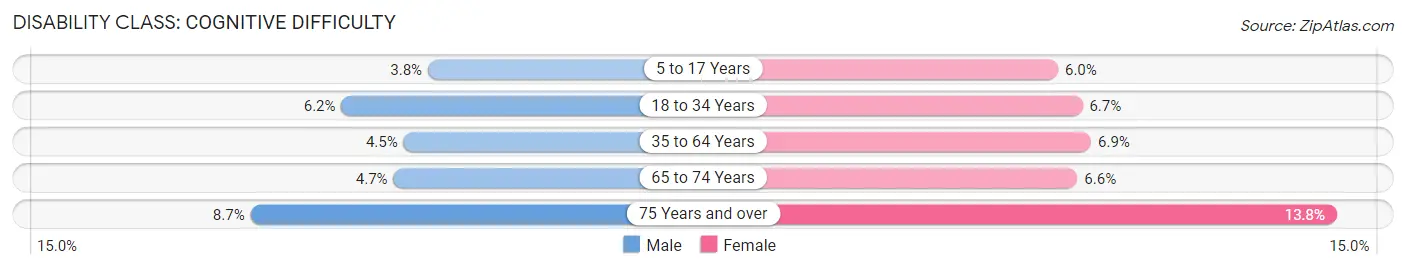
| Age Bracket | Male | Female |
| 5 to 17 Years | 141 (3.8%) | 202 (6.0%) |
| 18 to 34 Years | 259 (6.2%) | 279 (6.7%) |
| 35 to 64 Years | 400 (4.4%) | 610 (6.9%) |
| 65 to 74 Years | 121 (4.7%) | 180 (6.6%) |
| 75 Years and over | 136 (8.7%) | 291 (13.8%) |
Disability Class: Ambulatory Difficulty
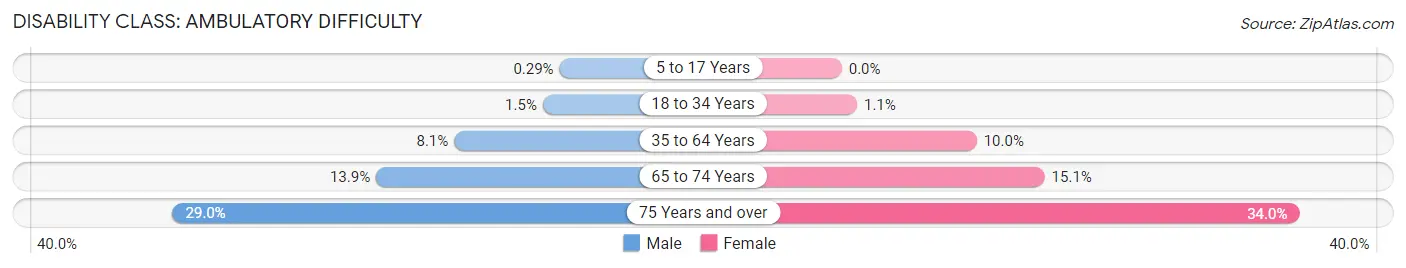
| Age Bracket | Male | Female |
| 5 to 17 Years | 11 (0.3%) | 0 (0.0%) |
| 18 to 34 Years | 64 (1.5%) | 47 (1.1%) |
| 35 to 64 Years | 730 (8.1%) | 881 (10.0%) |
| 65 to 74 Years | 356 (13.9%) | 413 (15.1%) |
| 75 Years and over | 453 (29.0%) | 717 (34.0%) |
Disability Class: Self-Care Difficulty
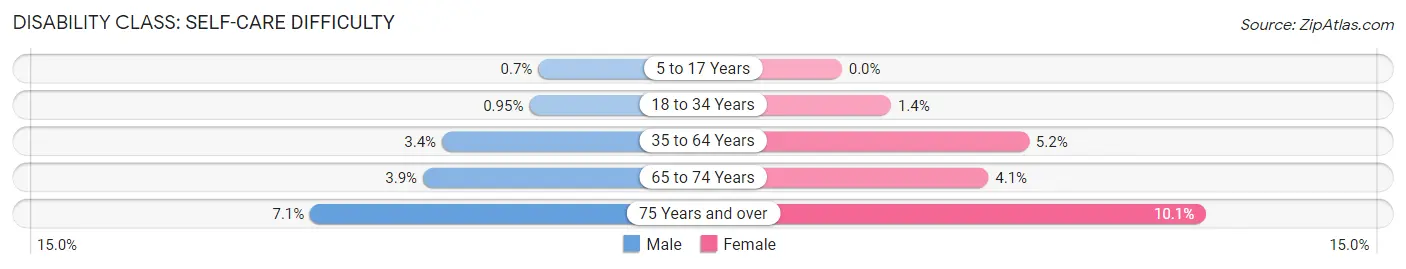
| Age Bracket | Male | Female |
| 5 to 17 Years | 26 (0.7%) | 0 (0.0%) |
| 18 to 34 Years | 40 (0.9%) | 57 (1.4%) |
| 35 to 64 Years | 304 (3.4%) | 458 (5.2%) |
| 65 to 74 Years | 100 (3.9%) | 112 (4.1%) |
| 75 Years and over | 110 (7.0%) | 214 (10.1%) |
Technology Access in Macoupin County
Computing Device Access in Macoupin County

| Device Type | # Households | % Households |
| Desktop or Laptop | 11,271 | 64.2% |
| Smartphone | 14,292 | 81.4% |
| Tablet | 9,603 | 54.7% |
| No Computing Device | 1,767 | 10.1% |
| Total | 17,567 | 100.0% |
Internet Access in Macoupin County
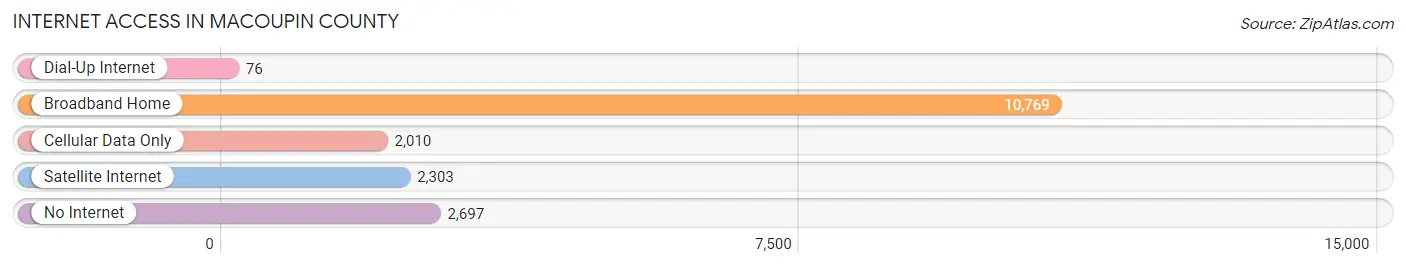
| Internet Type | # Households | % Households |
| Dial-Up Internet | 76 | 0.4% |
| Broadband Home | 10,769 | 61.3% |
| Cellular Data Only | 2,010 | 11.4% |
| Satellite Internet | 2,303 | 13.1% |
| No Internet | 2,697 | 15.3% |
| Total | 17,567 | 100.0% |
Macoupin County Summary
Macoupin County is located in the central part of the state of Illinois, in the United States. It is part of the Metro-East region of the state, and is bordered by Montgomery, Christian, Madison, Jersey, Greene, and Sangamon counties. The county seat is Carlinville, and the largest city is Gillespie. The county was established in 1829 and named after the Macoupin Creek, which runs through the county.
Geography
Macoupin County covers an area of 845 square miles, making it the fourth largest county in Illinois. The terrain is mostly flat, with some rolling hills in the northern part of the county. The county is drained by the Macoupin Creek, which flows through the center of the county, and by the South Fork of the Macoupin Creek, which flows through the western part of the county. The county is also home to several small lakes, including Lake Carlinville, Lake Gillespie, and Lake Palmyra.
The climate of Macoupin County is humid continental, with hot, humid summers and cold, snowy winters. The average annual temperature is around 50°F, and the average annual precipitation is around 40 inches.
Demographics
As of the 2010 census, Macoupin County had a population of 47,765. The racial makeup of the county was 95.2% White, 1.3% African American, 0.4% Native American, 0.5% Asian, 0.1% Pacific Islander, 1.3% from other races, and 1.2% from two or more races. Hispanic or Latino of any race were 3.2% of the population.
The median household income in Macoupin County was $45,945, and the median family income was $54,945. The per capita income was $21,945. About 11.2% of the population was below the poverty line.
Economy
Agriculture is the main economic activity in Macoupin County. The county is home to a large number of farms, and the main crops grown are corn, soybeans, wheat, and hay. Livestock production is also important, with cattle, hogs, and sheep being the main animals raised.
Manufacturing is also an important part of the economy. The county is home to several factories, including a Caterpillar plant in Carlinville, a John Deere plant in Gillespie, and a General Motors plant in Virden.
The county is also home to several tourist attractions, including the Macoupin County Historical Society Museum in Carlinville, the Macoupin County Fairgrounds in Carlinville, and the Macoupin Creek State Fish and Wildlife Area in Palmyra.
History
Macoupin County was first settled in the early 1800s by settlers from the eastern United States. The county was officially established in 1829, and the county seat was established in Carlinville in 1831.
The county was an important agricultural center in the 19th century, and the county seat of Carlinville was an important trading center. The county was also home to several coal mines, which provided employment for many of the county's residents.
In the 20th century, the county continued to be an important agricultural center, and the manufacturing industry also grew. The county was also home to several military bases during World War II, including the Gillespie Army Airfield and the Carlinville Army Airfield.
Today, Macoupin County is a rural county with a strong agricultural base. The county is also home to several tourist attractions, and is a popular destination for outdoor recreation.
Common Questions
What is Per Capita Income in Macoupin County?
Per Capita income in Macoupin County is $33,665.
What is the Median Family Income in Macoupin County?
Median Family Income in Macoupin County is $80,507.
What is the Median Household income in Macoupin County?
Median Household Income in Macoupin County is $64,706.
What is Income or Wage Gap in Macoupin County?
Income or Wage Gap in Macoupin County is 29.6%.
Women in Macoupin County earn 70.4 cents for every dollar earned by a man.
What is Family Income Deficit in Macoupin County?
Family Income Deficit in Macoupin County is $9,792.
Families that are below poverty line in Macoupin County earn $9,792 less on average than the poverty threshold level.
What is Inequality or Gini Index in Macoupin County?
Inequality or Gini Index in Macoupin County is 0.43.
What is the Total Population of Macoupin County?
Total Population of Macoupin County is 44,907.
What is the Total Male Population of Macoupin County?
Total Male Population of Macoupin County is 22,332.
What is the Total Female Population of Macoupin County?
Total Female Population of Macoupin County is 22,575.
What is the Ratio of Males per 100 Females in Macoupin County?
There are 98.92 Males per 100 Females in Macoupin County.
What is the Ratio of Females per 100 Males in Macoupin County?
There are 101.09 Females per 100 Males in Macoupin County.
What is the Median Population Age in Macoupin County?
Median Population Age in Macoupin County is 44.0 Years.
What is the Average Family Size in Macoupin County
Average Family Size in Macoupin County is 3.0 People.
What is the Average Household Size in Macoupin County
Average Household Size in Macoupin County is 2.5 People.
How Large is the Labor Force in Macoupin County?
There are 21,152 People in the Labor Forcein in Macoupin County.
What is the Percentage of People in the Labor Force in Macoupin County?
57.6% of People are in the Labor Force in Macoupin County.
What is the Unemployment Rate in Macoupin County?
Unemployment Rate in Macoupin County is 4.6%.