Jo Daviess County, IL Map & Demographics
Jo Daviess County Map
Jo Daviess County Overview
$39,477
PER CAPITA INCOME
$86,871
AVG FAMILY INCOME
$67,729
AVG HOUSEHOLD INCOME
24.6%
WAGE / INCOME GAP [ % ]
75.4¢/ $1
WAGE / INCOME GAP [ $ ]
$10,763
FAMILY INCOME DEFICIT
0.42
INEQUALITY / GINI INDEX
21,942
TOTAL POPULATION
11,058
MALE POPULATION
10,884
FEMALE POPULATION
101.60
MALES / 100 FEMALES
98.43
FEMALES / 100 MALES
50.8
MEDIAN AGE
2.7
AVG FAMILY SIZE
2.2
AVG HOUSEHOLD SIZE
11,148
LABOR FORCE [ PEOPLE ]
60.9%
PERCENT IN LABOR FORCE
2.7%
UNEMPLOYMENT RATE
Income in Jo Daviess County
Income Overview in Jo Daviess County
Per Capita Income in Jo Daviess County is $39,477, while median incomes of families and households are $86,871 and $67,729 respectively.
| Characteristic | Number | Measure |
| Per Capita Income | 21,942 | $39,477 |
| Median Family Income | 6,414 | $86,871 |
| Mean Family Income | 6,414 | $103,548 |
| Median Household Income | 10,074 | $67,729 |
| Mean Household Income | 10,074 | $85,711 |
| Income Deficit | 6,414 | $10,763 |
| Wage / Income Gap (%) | 21,942 | 24.62% |
| Wage / Income Gap ($) | 21,942 | 75.38¢ per $1 |
| Gini / Inequality Index | 21,942 | 0.42 |
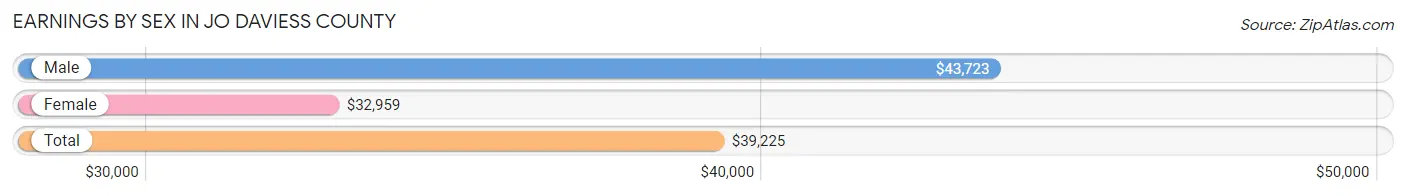
Earnings by Sex in Jo Daviess County
Average Earnings in Jo Daviess County are $39,225, $43,723 for men and $32,959 for women, a difference of 24.6%.
| Sex | Number | Average Earnings |
| Male | 6,476 (54.5%) | $43,723 |
| Female | 5,414 (45.5%) | $32,959 |
| Total | 11,890 (100.0%) | $39,225 |
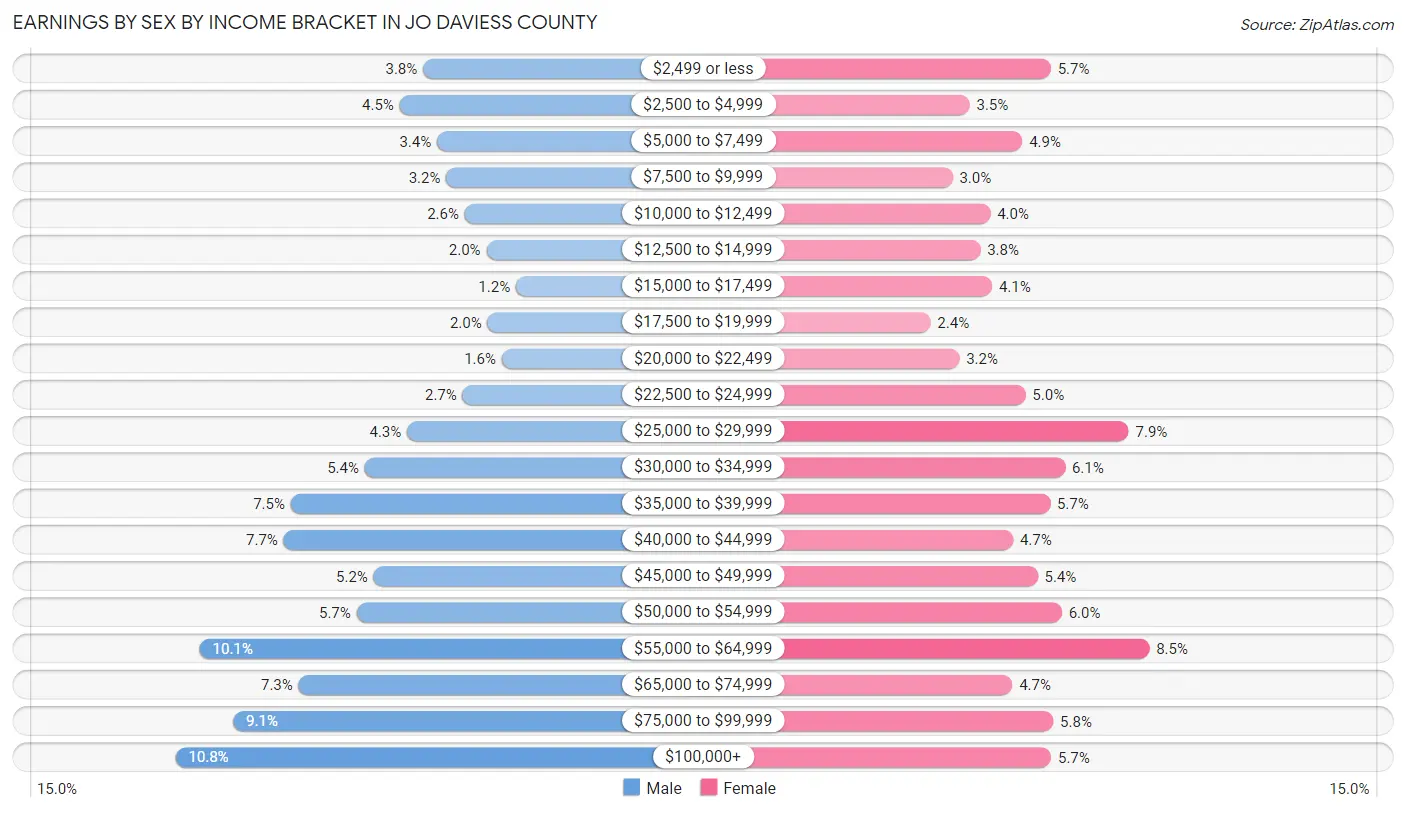
Earnings by Sex by Income Bracket in Jo Daviess County
The most common earnings brackets in Jo Daviess County are $100,000+ for men (697 | 10.8%) and $55,000 to $64,999 for women (460 | 8.5%).
| Income | Male | Female |
| $2,499 or less | 246 (3.8%) | 310 (5.7%) |
| $2,500 to $4,999 | 289 (4.5%) | 187 (3.5%) |
| $5,000 to $7,499 | 221 (3.4%) | 267 (4.9%) |
| $7,500 to $9,999 | 204 (3.2%) | 161 (3.0%) |
| $10,000 to $12,499 | 170 (2.6%) | 218 (4.0%) |
| $12,500 to $14,999 | 131 (2.0%) | 203 (3.7%) |
| $15,000 to $17,499 | 77 (1.2%) | 221 (4.1%) |
| $17,500 to $19,999 | 129 (2.0%) | 127 (2.4%) |
| $20,000 to $22,499 | 103 (1.6%) | 171 (3.2%) |
| $22,500 to $24,999 | 174 (2.7%) | 272 (5.0%) |
| $25,000 to $29,999 | 275 (4.3%) | 429 (7.9%) |
| $30,000 to $34,999 | 352 (5.4%) | 332 (6.1%) |
| $35,000 to $39,999 | 487 (7.5%) | 309 (5.7%) |
| $40,000 to $44,999 | 500 (7.7%) | 253 (4.7%) |
| $45,000 to $49,999 | 336 (5.2%) | 290 (5.4%) |
| $50,000 to $54,999 | 367 (5.7%) | 327 (6.0%) |
| $55,000 to $64,999 | 653 (10.1%) | 460 (8.5%) |
| $65,000 to $74,999 | 473 (7.3%) | 252 (4.6%) |
| $75,000 to $99,999 | 592 (9.1%) | 314 (5.8%) |
| $100,000+ | 697 (10.8%) | 311 (5.7%) |
| Total | 6,476 (100.0%) | 5,414 (100.0%) |
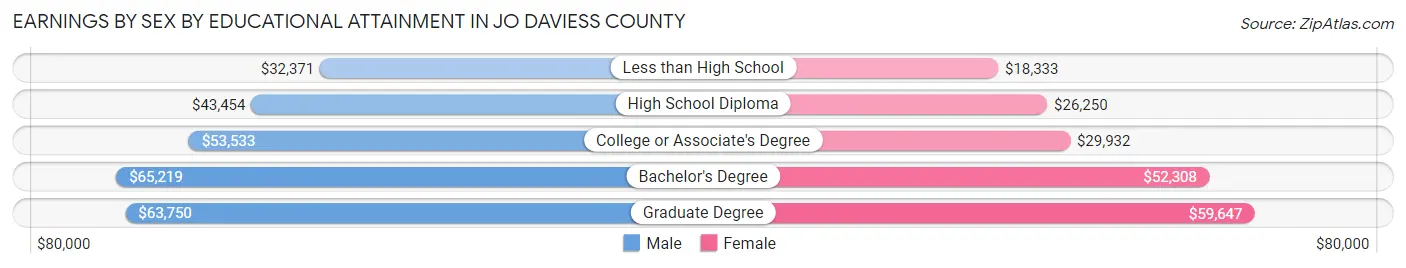
Earnings by Sex by Educational Attainment in Jo Daviess County
Average earnings in Jo Daviess County are $47,343 for men and $35,379 for women, a difference of 25.3%. Men with an educational attainment of bachelor's degree enjoy the highest average annual earnings of $65,219, while those with less than high school education earn the least with $32,371. Women with an educational attainment of graduate degree earn the most with the average annual earnings of $59,647, while those with less than high school education have the smallest earnings of $18,333.
| Educational Attainment | Male Income | Female Income |
| Less than High School | $32,371 | $18,333 |
| High School Diploma | $43,454 | $26,250 |
| College or Associate's Degree | $53,533 | $29,932 |
| Bachelor's Degree | $65,219 | $52,308 |
| Graduate Degree | $63,750 | $59,647 |
| Total | $47,343 | $35,379 |
Family Income in Jo Daviess County
Family Income Brackets in Jo Daviess County
According to the Jo Daviess County family income data, there are 1,392 families falling into the $100,000 to $149,999 income range, which is the most common income bracket and makes up 21.7% of all families. Conversely, the $10,000 to $14,999 income bracket is the least frequent group with only 58 families (0.9%) belonging to this category.
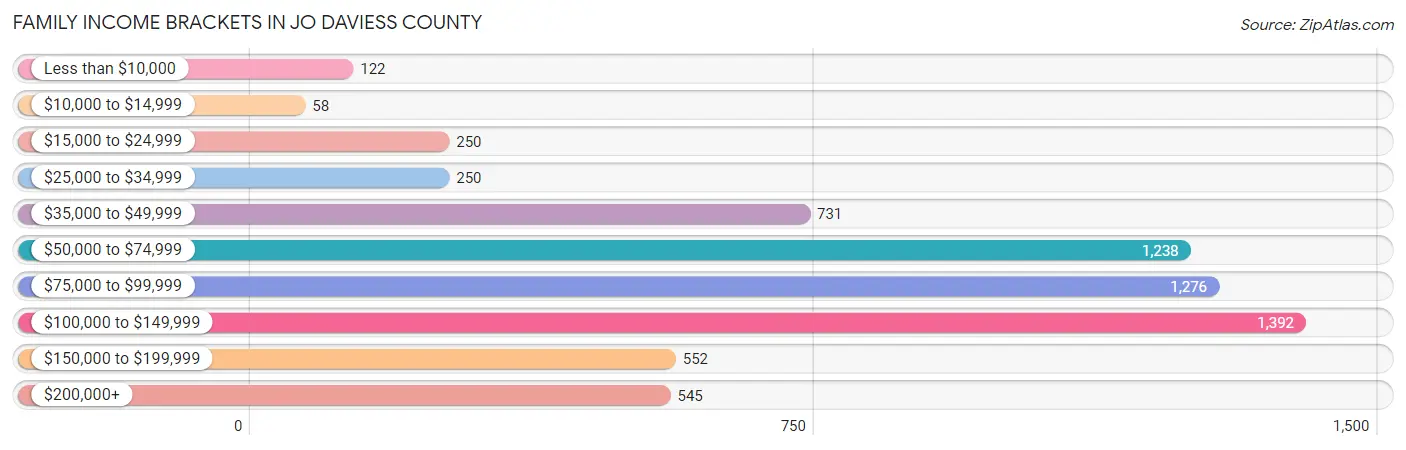
| Income Bracket | # Families | % Families |
| Less than $10,000 | 122 | 1.9% |
| $10,000 to $14,999 | 58 | 0.9% |
| $15,000 to $24,999 | 250 | 3.9% |
| $25,000 to $34,999 | 250 | 3.9% |
| $35,000 to $49,999 | 731 | 11.4% |
| $50,000 to $74,999 | 1,238 | 19.3% |
| $75,000 to $99,999 | 1,276 | 19.9% |
| $100,000 to $149,999 | 1,392 | 21.7% |
| $150,000 to $199,999 | 552 | 8.6% |
| $200,000+ | 545 | 8.5% |
Family Income by Famaliy Size in Jo Daviess County
6-person families (130 | 2.0%) account for the highest median family income in Jo Daviess County with $188,241 per family, while 2-person families (3,990 | 62.2%) have the highest median income of $39,788 per family member.
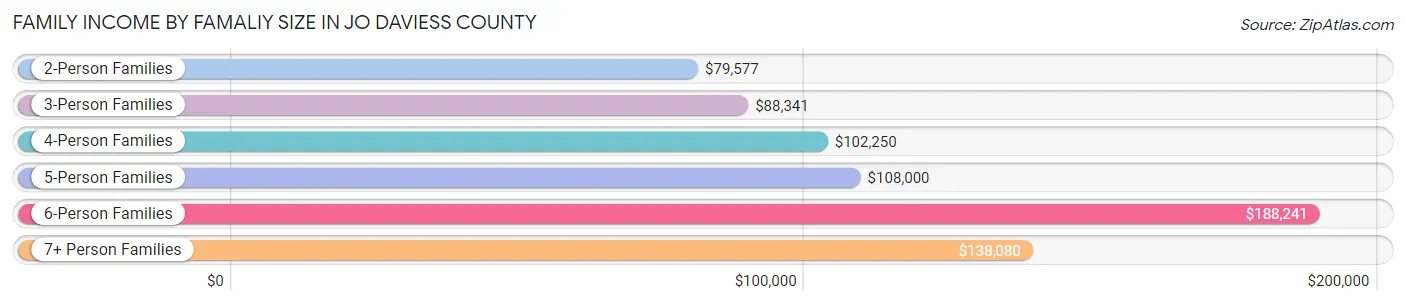
| Income Bracket | # Families | Median Income |
| 2-Person Families | 3,990 (62.2%) | $79,577 |
| 3-Person Families | 995 (15.5%) | $88,341 |
| 4-Person Families | 858 (13.4%) | $102,250 |
| 5-Person Families | 366 (5.7%) | $108,000 |
| 6-Person Families | 130 (2.0%) | $188,241 |
| 7+ Person Families | 75 (1.2%) | $138,080 |
| Total | 6,414 (100.0%) | $86,871 |
Family Income by Number of Earners in Jo Daviess County
The median family income in Jo Daviess County is $86,871, with families comprising 3+ earners (681) having the highest median family income of $140,551, while families with 1 earner (1,807) have the lowest median family income of $65,662, accounting for 10.6% and 28.2% of families, respectively.
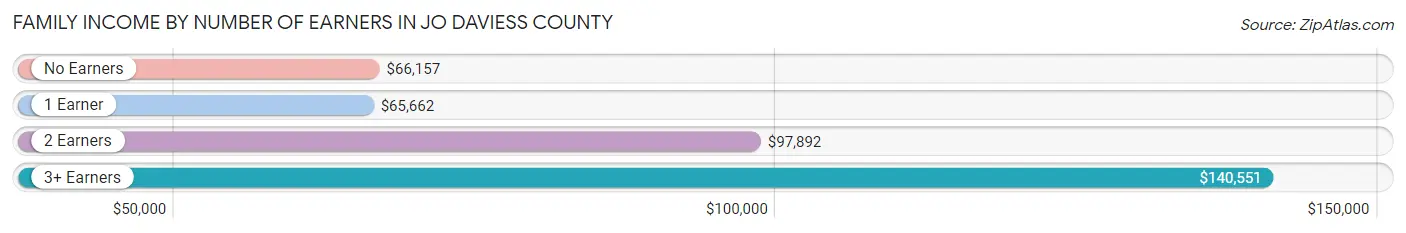
| Number of Earners | # Families | Median Income |
| No Earners | 1,289 (20.1%) | $66,157 |
| 1 Earner | 1,807 (28.2%) | $65,662 |
| 2 Earners | 2,637 (41.1%) | $97,892 |
| 3+ Earners | 681 (10.6%) | $140,551 |
| Total | 6,414 (100.0%) | $86,871 |
Household Income in Jo Daviess County
Household Income Brackets in Jo Daviess County
With 1,914 households falling in the category, the $50,000 to $74,999 income range is the most frequent in Jo Daviess County, accounting for 19.0% of all households. In contrast, only 292 households (2.9%) fall into the $10,000 to $14,999 income bracket, making it the least populous group.
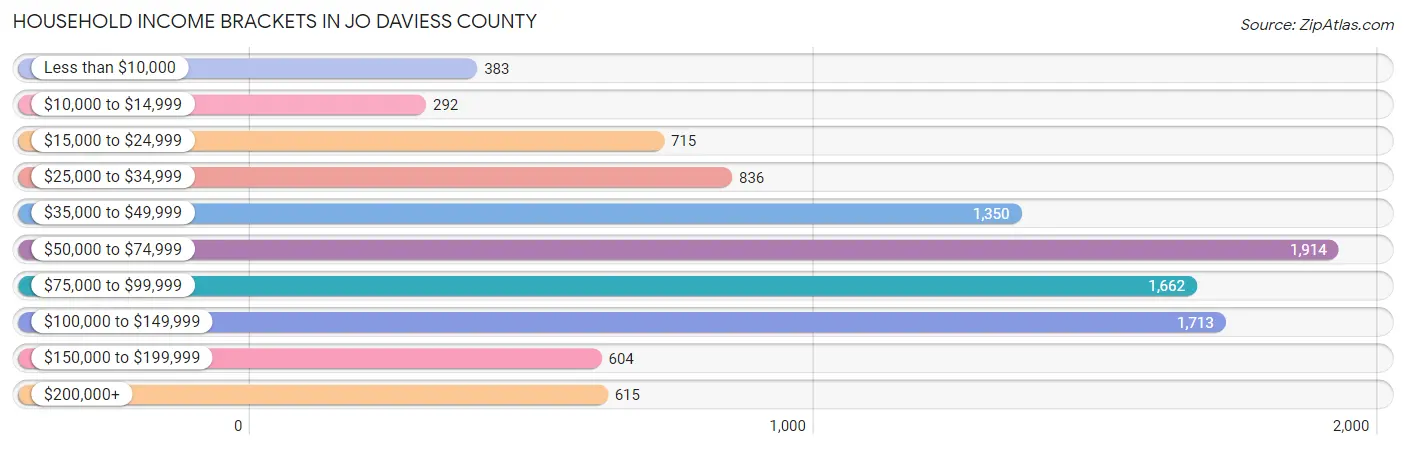
| Income Bracket | # Households | % Households |
| Less than $10,000 | 383 | 3.8% |
| $10,000 to $14,999 | 292 | 2.9% |
| $15,000 to $24,999 | 715 | 7.1% |
| $25,000 to $34,999 | 836 | 8.3% |
| $35,000 to $49,999 | 1,350 | 13.4% |
| $50,000 to $74,999 | 1,914 | 19.0% |
| $75,000 to $99,999 | 1,662 | 16.5% |
| $100,000 to $149,999 | 1,713 | 17.0% |
| $150,000 to $199,999 | 604 | 6.0% |
| $200,000+ | 615 | 6.1% |
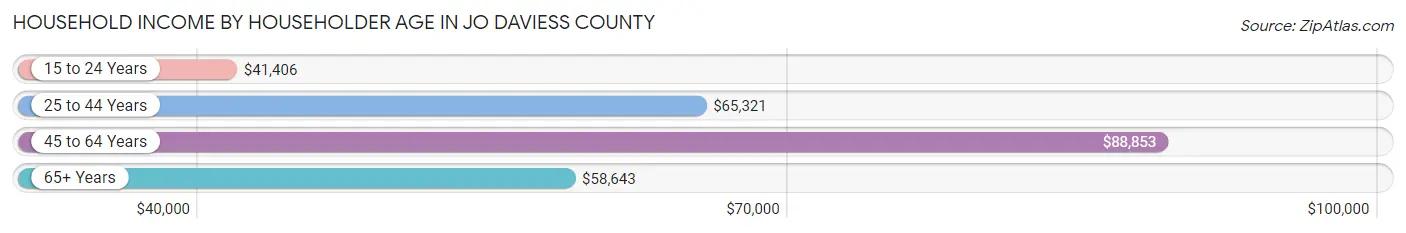
Household Income by Householder Age in Jo Daviess County
The median household income in Jo Daviess County is $67,729, with the highest median household income of $88,853 found in the 45 to 64 years age bracket for the primary householder. A total of 3,354 households (33.3%) fall into this category. Meanwhile, the 15 to 24 years age bracket for the primary householder has the lowest median household income of $41,406, with 391 households (3.9%) in this group.
| Income Bracket | # Households | Median Income |
| 15 to 24 Years | 391 (3.9%) | $41,406 |
| 25 to 44 Years | 2,227 (22.1%) | $65,321 |
| 45 to 64 Years | 3,354 (33.3%) | $88,853 |
| 65+ Years | 4,102 (40.7%) | $58,643 |
| Total | 10,074 (100.0%) | $67,729 |
Poverty in Jo Daviess County
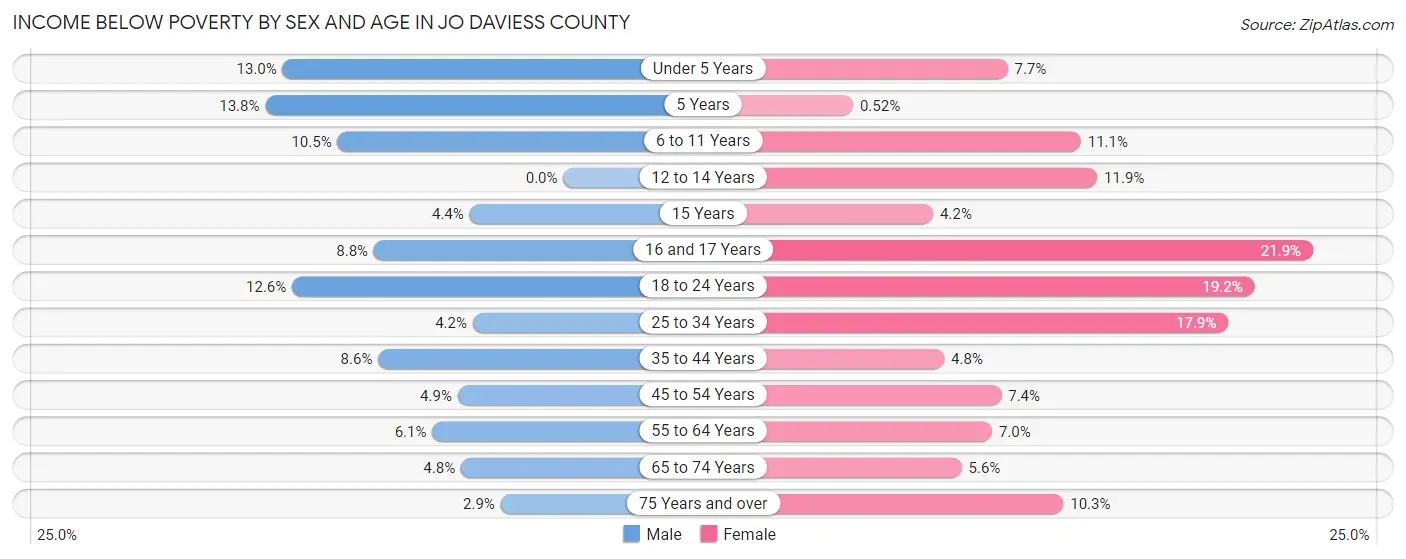
Income Below Poverty by Sex and Age in Jo Daviess County
With 6.4% poverty level for males and 9.1% for females among the residents of Jo Daviess County, 5 year old males and 16 and 17 year old females are the most vulnerable to poverty, with 13 males (13.8%) and 40 females (21.9%) in their respective age groups living below the poverty level.
| Age Bracket | Male | Female |
| Under 5 Years | 62 (13.0%) | 33 (7.7%) |
| 5 Years | 13 (13.8%) | 1 (0.5%) |
| 6 to 11 Years | 78 (10.5%) | 74 (11.1%) |
| 12 to 14 Years | 0 (0.0%) | 34 (11.8%) |
| 15 Years | 7 (4.3%) | 7 (4.2%) |
| 16 and 17 Years | 21 (8.8%) | 40 (21.9%) |
| 18 to 24 Years | 91 (12.6%) | 117 (19.2%) |
| 25 to 34 Years | 42 (4.2%) | 168 (17.9%) |
| 35 to 44 Years | 102 (8.6%) | 51 (4.8%) |
| 45 to 54 Years | 62 (4.9%) | 91 (7.4%) |
| 55 to 64 Years | 103 (6.1%) | 121 (7.0%) |
| 65 to 74 Years | 86 (4.8%) | 102 (5.6%) |
| 75 Years and over | 34 (2.9%) | 149 (10.3%) |
| Total | 701 (6.4%) | 988 (9.1%) |
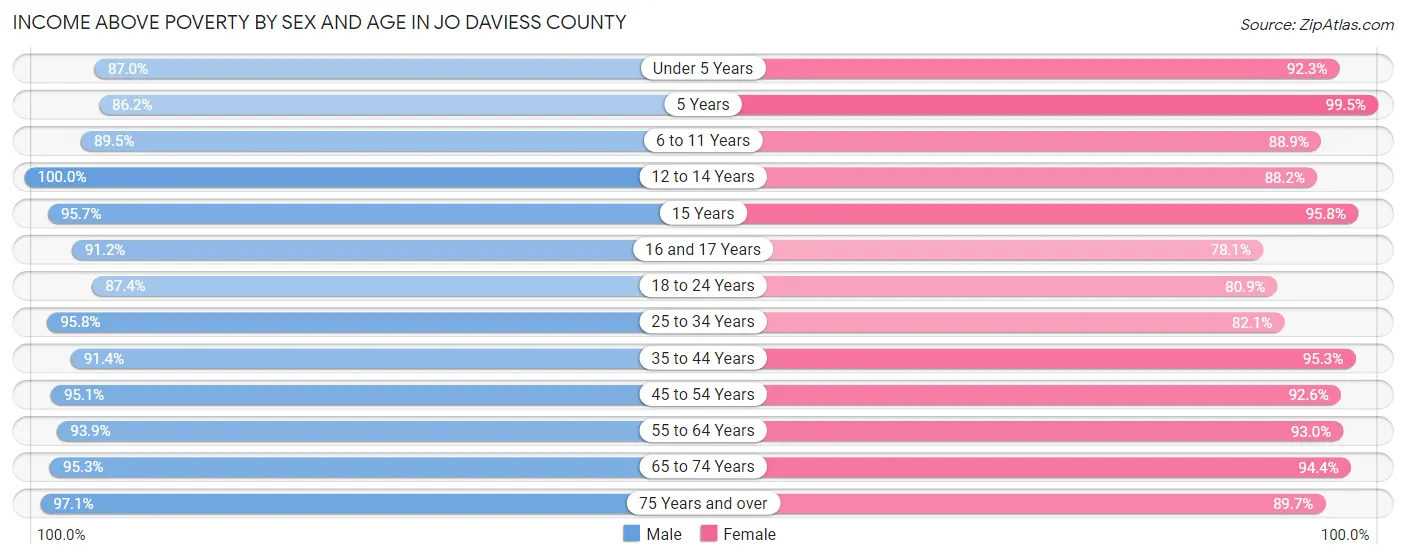
Income Above Poverty by Sex and Age in Jo Daviess County
According to the poverty statistics in Jo Daviess County, males aged 12 to 14 years and females aged 5 years are the age groups that are most secure financially, with 100.0% of males and 99.5% of females in these age groups living above the poverty line.
| Age Bracket | Male | Female |
| Under 5 Years | 414 (87.0%) | 396 (92.3%) |
| 5 Years | 81 (86.2%) | 191 (99.5%) |
| 6 to 11 Years | 666 (89.5%) | 593 (88.9%) |
| 12 to 14 Years | 373 (100.0%) | 253 (88.1%) |
| 15 Years | 154 (95.7%) | 158 (95.8%) |
| 16 and 17 Years | 218 (91.2%) | 143 (78.1%) |
| 18 to 24 Years | 632 (87.4%) | 494 (80.8%) |
| 25 to 34 Years | 958 (95.8%) | 769 (82.1%) |
| 35 to 44 Years | 1,086 (91.4%) | 1,023 (95.3%) |
| 45 to 54 Years | 1,203 (95.1%) | 1,138 (92.6%) |
| 55 to 64 Years | 1,592 (93.9%) | 1,614 (93.0%) |
| 65 to 74 Years | 1,724 (95.3%) | 1,733 (94.4%) |
| 75 Years and over | 1,136 (97.1%) | 1,300 (89.7%) |
| Total | 10,237 (93.6%) | 9,805 (90.8%) |
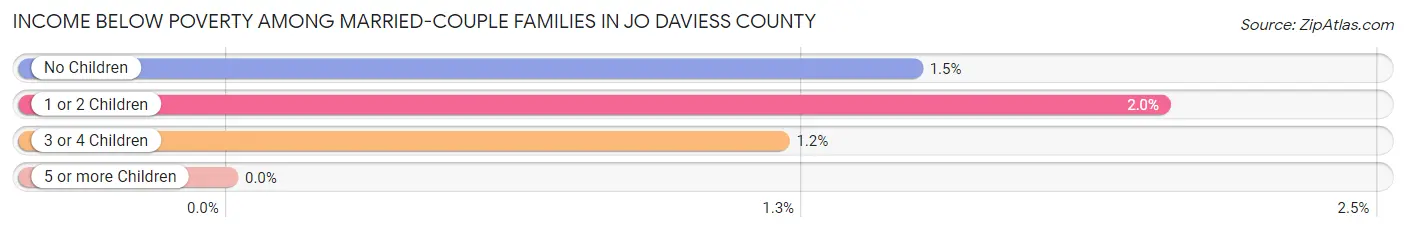
Income Below Poverty Among Married-Couple Families in Jo Daviess County
The poverty statistics for married-couple families in Jo Daviess County show that 1.6% or 84 of the total 5,323 families live below the poverty line. Families with 1 or 2 children have the highest poverty rate of 2.0%, comprising of 22 families. On the other hand, families with 5 or more children have the lowest poverty rate of 0.0%, which includes 0 families.
| Children | Above Poverty | Below Poverty |
| No Children | 3,835 (98.5%) | 58 (1.5%) |
| 1 or 2 Children | 1,060 (98.0%) | 22 (2.0%) |
| 3 or 4 Children | 328 (98.8%) | 4 (1.2%) |
| 5 or more Children | 16 (100.0%) | 0 (0.0%) |
| Total | 5,239 (98.4%) | 84 (1.6%) |
Income Below Poverty Among Single-Parent Households in Jo Daviess County
According to the poverty data in Jo Daviess County, 10.9% or 33 single-father households and 22.5% or 177 single-mother households are living below the poverty line. Among single-father households, those with 5 or more children have the highest poverty rate, with 5 households (100.0%) experiencing poverty. Likewise, among single-mother households, those with 1 or 2 children have the highest poverty rate, with 149 households (34.8%) falling below the poverty line.
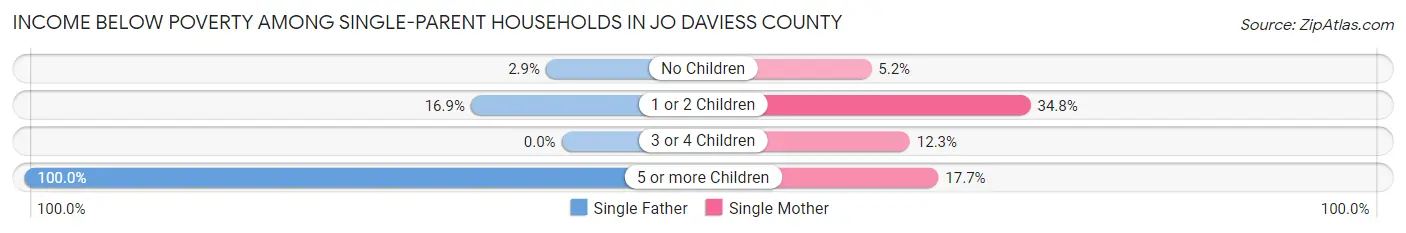
| Children | Single Father | Single Mother |
| No Children | 4 (2.9%) | 13 (5.2%) |
| 1 or 2 Children | 24 (16.9%) | 149 (34.8%) |
| 3 or 4 Children | 0 (0.0%) | 9 (12.3%) |
| 5 or more Children | 5 (100.0%) | 6 (17.6%) |
| Total | 33 (10.9%) | 177 (22.5%) |
Income Below Poverty Among Married-Couple vs Single-Parent Households in Jo Daviess County
The poverty data for Jo Daviess County shows that 84 of the married-couple family households (1.6%) and 210 of the single-parent households (19.3%) are living below the poverty level. Within the married-couple family households, those with 1 or 2 children have the highest poverty rate, with 22 households (2.0%) falling below the poverty line. Among the single-parent households, those with 1 or 2 children have the highest poverty rate, with 173 household (30.3%) living below poverty.
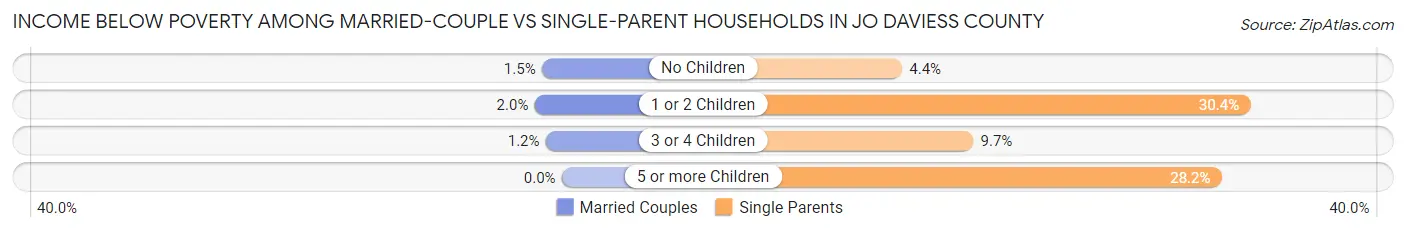
| Children | Married-Couple Families | Single-Parent Households |
| No Children | 58 (1.5%) | 17 (4.4%) |
| 1 or 2 Children | 22 (2.0%) | 173 (30.3%) |
| 3 or 4 Children | 4 (1.2%) | 9 (9.7%) |
| 5 or more Children | 0 (0.0%) | 11 (28.2%) |
| Total | 84 (1.6%) | 210 (19.3%) |
Race in Jo Daviess County
The most populous races in Jo Daviess County are White / Caucasian (20,798 | 94.8%), Hispanic or Latino (725 | 3.3%), and Two or more Races (676 | 3.1%).
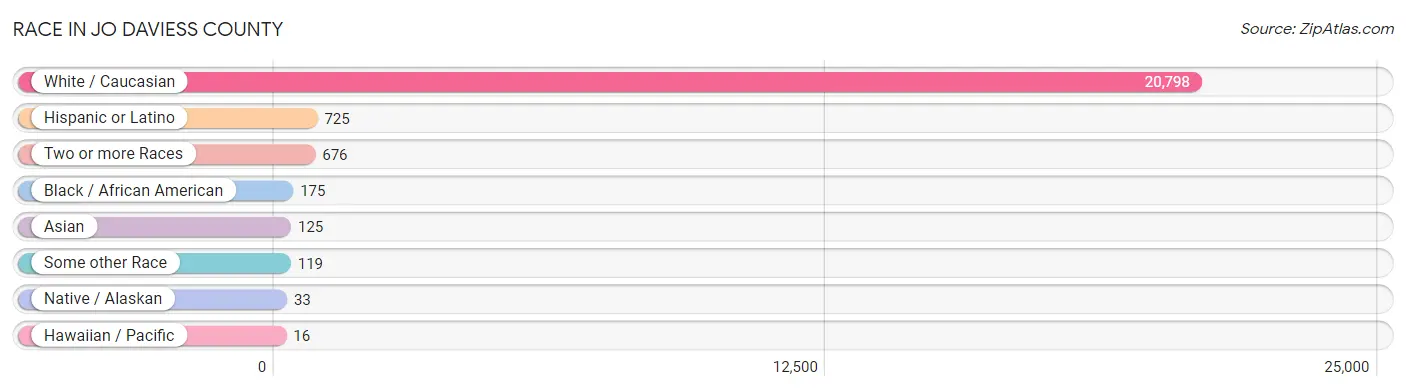
| Race | # Population | % Population |
| Asian | 125 | 0.6% |
| Black / African American | 175 | 0.8% |
| Hawaiian / Pacific | 16 | 0.1% |
| Hispanic or Latino | 725 | 3.3% |
| Native / Alaskan | 33 | 0.2% |
| White / Caucasian | 20,798 | 94.8% |
| Two or more Races | 676 | 3.1% |
| Some other Race | 119 | 0.5% |
| Total | 21,942 | 100.0% |
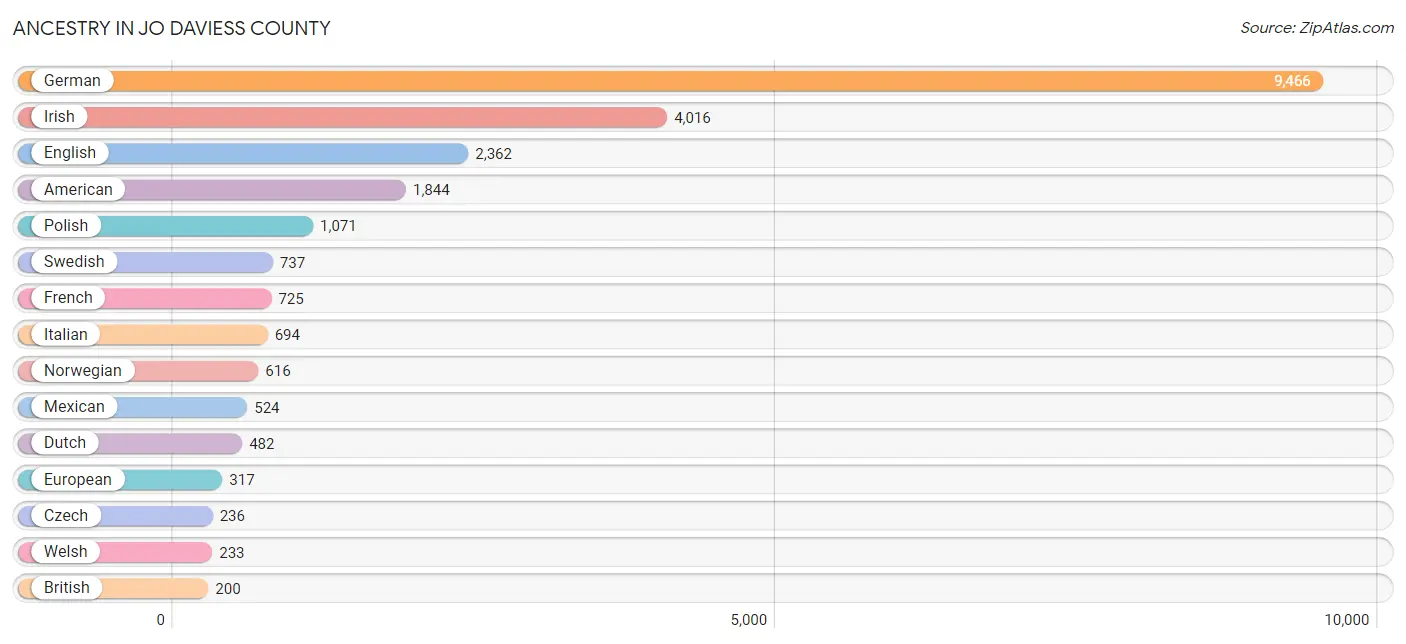
Ancestry in Jo Daviess County
The most populous ancestries reported in Jo Daviess County are German (9,466 | 43.1%), Irish (4,016 | 18.3%), English (2,362 | 10.8%), American (1,844 | 8.4%), and Polish (1,071 | 4.9%), together accounting for 85.5% of all Jo Daviess County residents.
| Ancestry | # Population | % Population |
| Albanian | 27 | 0.1% |
| American | 1,844 | 8.4% |
| Apache | 1 | 0.0% |
| Arab | 15 | 0.1% |
| Argentinean | 57 | 0.3% |
| Armenian | 6 | 0.0% |
| Assyrian / Chaldean / Syriac | 2 | 0.0% |
| Austrian | 22 | 0.1% |
| Belgian | 43 | 0.2% |
| Bhutanese | 84 | 0.4% |
| British | 200 | 0.9% |
| Burmese | 60 | 0.3% |
| Cajun | 27 | 0.1% |
| Central American | 10 | 0.1% |
| Central American Indian | 5 | 0.0% |
| Cherokee | 48 | 0.2% |
| Chinese | 2 | 0.0% |
| Chippewa | 4 | 0.0% |
| Colombian | 7 | 0.0% |
| Cree | 2 | 0.0% |
| Croatian | 90 | 0.4% |
| Czech | 236 | 1.1% |
| Czechoslovakian | 10 | 0.1% |
| Danish | 109 | 0.5% |
| Dutch | 482 | 2.2% |
| Eastern European | 35 | 0.2% |
| Egyptian | 2 | 0.0% |
| English | 2,362 | 10.8% |
| European | 317 | 1.4% |
| Finnish | 70 | 0.3% |
| French | 725 | 3.3% |
| French Canadian | 54 | 0.3% |
| German | 9,466 | 43.1% |
| Greek | 90 | 0.4% |
| Guamanian / Chamorro | 84 | 0.4% |
| Guatemalan | 10 | 0.1% |
| Hungarian | 34 | 0.2% |
| Indian (Asian) | 49 | 0.2% |
| Iranian | 11 | 0.1% |
| Irish | 4,016 | 18.3% |
| Italian | 694 | 3.2% |
| Korean | 98 | 0.4% |
| Latvian | 13 | 0.1% |
| Lebanese | 2 | 0.0% |
| Lithuanian | 45 | 0.2% |
| Luxembourger | 41 | 0.2% |
| Mexican | 524 | 2.4% |
| Mexican American Indian | 12 | 0.1% |
| Native Hawaiian | 25 | 0.1% |
| Northern European | 13 | 0.1% |
| Norwegian | 616 | 2.8% |
| Pakistani | 1 | 0.0% |
| Pennsylvania German | 18 | 0.1% |
| Peruvian | 6 | 0.0% |
| Polish | 1,071 | 4.9% |
| Potawatomi | 5 | 0.0% |
| Puerto Rican | 19 | 0.1% |
| Romanian | 12 | 0.1% |
| Russian | 62 | 0.3% |
| Samoan | 72 | 0.3% |
| Scandinavian | 59 | 0.3% |
| Scotch-Irish | 167 | 0.8% |
| Scottish | 146 | 0.7% |
| Serbian | 8 | 0.0% |
| Sioux | 1 | 0.0% |
| Slovak | 63 | 0.3% |
| Slovene | 20 | 0.1% |
| South American | 70 | 0.3% |
| Spanish | 11 | 0.1% |
| Sri Lankan | 147 | 0.7% |
| Swedish | 737 | 3.4% |
| Swiss | 167 | 0.8% |
| Syrian | 11 | 0.1% |
| Thai | 78 | 0.4% |
| Ukrainian | 133 | 0.6% |
| Welsh | 233 | 1.1% | View All 76 Rows |
Immigrants in Jo Daviess County
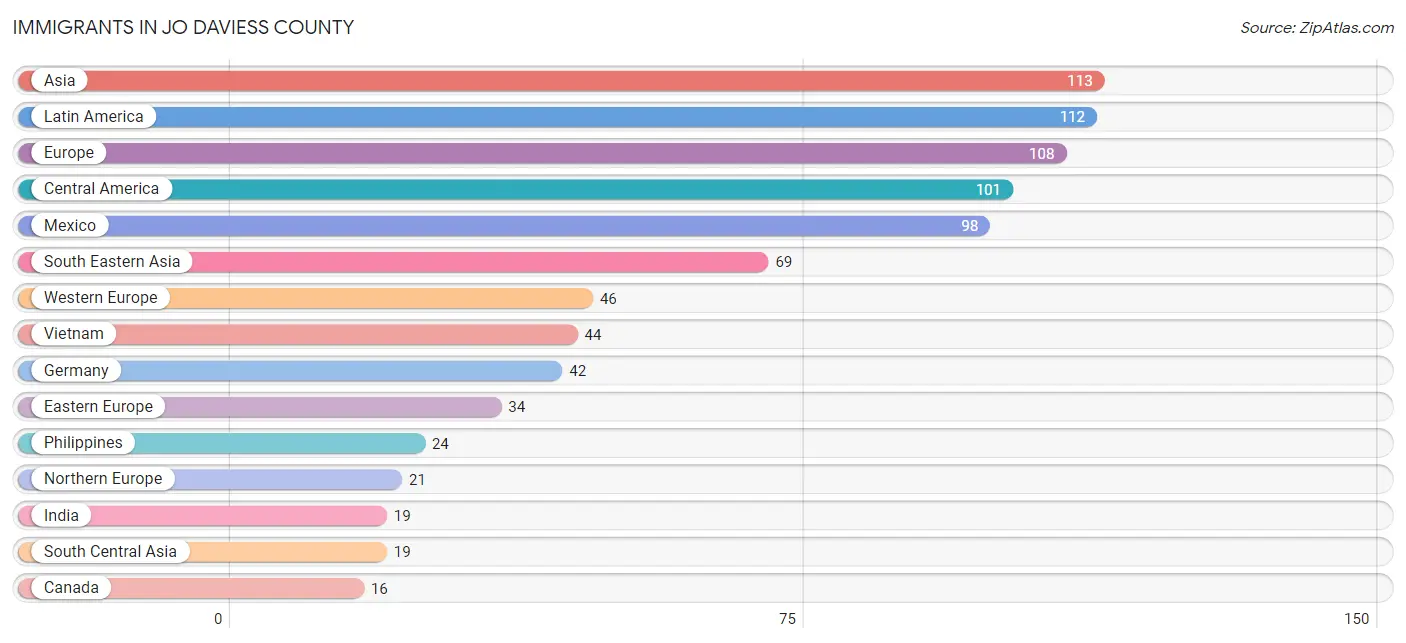
The most numerous immigrant groups reported in Jo Daviess County came from Asia (113 | 0.5%), Latin America (112 | 0.5%), Europe (108 | 0.5%), Central America (101 | 0.5%), and Mexico (98 | 0.4%), together accounting for 2.4% of all Jo Daviess County residents.
| Immigration Origin | # Population | % Population |
| Asia | 113 | 0.5% |
| Austria | 4 | 0.0% |
| Bosnia and Herzegovina | 2 | 0.0% |
| Canada | 16 | 0.1% |
| Central America | 101 | 0.5% |
| China | 15 | 0.1% |
| Colombia | 5 | 0.0% |
| Eastern Asia | 16 | 0.1% |
| Eastern Europe | 34 | 0.2% |
| England | 4 | 0.0% |
| Europe | 108 | 0.5% |
| Germany | 42 | 0.2% |
| Guatemala | 3 | 0.0% |
| Hong Kong | 5 | 0.0% |
| Hungary | 3 | 0.0% |
| India | 19 | 0.1% |
| Ireland | 7 | 0.0% |
| Italy | 7 | 0.0% |
| Korea | 1 | 0.0% |
| Latin America | 112 | 0.5% |
| Latvia | 13 | 0.1% |
| Mexico | 98 | 0.4% |
| Northern Europe | 21 | 0.1% |
| Peru | 6 | 0.0% |
| Philippines | 24 | 0.1% |
| Poland | 14 | 0.1% |
| Saudi Arabia | 3 | 0.0% |
| South America | 11 | 0.1% |
| South Central Asia | 19 | 0.1% |
| South Eastern Asia | 69 | 0.3% |
| Southern Europe | 7 | 0.0% |
| Syria | 6 | 0.0% |
| Thailand | 1 | 0.0% |
| Ukraine | 2 | 0.0% |
| Vietnam | 44 | 0.2% |
| Western Asia | 9 | 0.0% |
| Western Europe | 46 | 0.2% | View All 37 Rows |
Sex and Age in Jo Daviess County
Sex and Age in Jo Daviess County
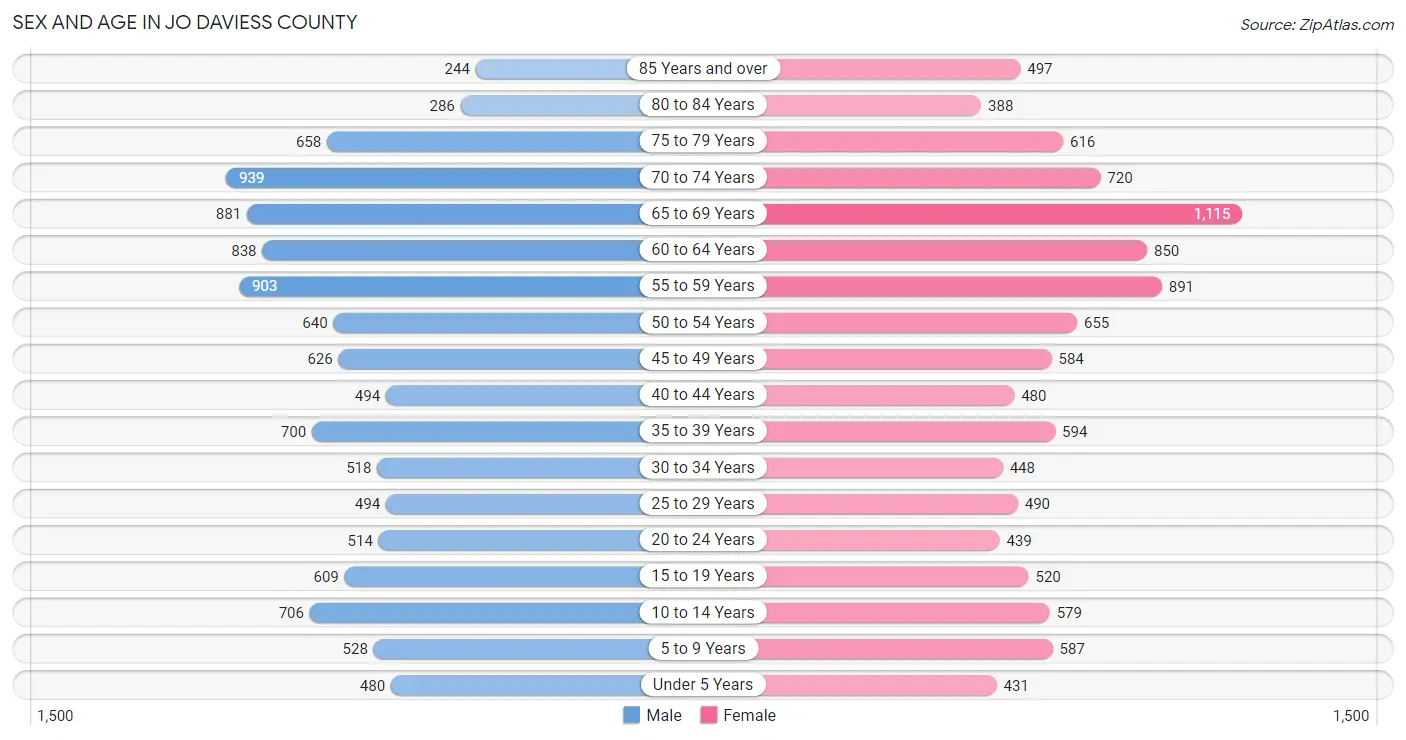
The most populous age groups in Jo Daviess County are 70 to 74 Years (939 | 8.5%) for men and 65 to 69 Years (1,115 | 10.2%) for women.
| Age Bracket | Male | Female |
| Under 5 Years | 480 (4.3%) | 431 (4.0%) |
| 5 to 9 Years | 528 (4.8%) | 587 (5.4%) |
| 10 to 14 Years | 706 (6.4%) | 579 (5.3%) |
| 15 to 19 Years | 609 (5.5%) | 520 (4.8%) |
| 20 to 24 Years | 514 (4.6%) | 439 (4.0%) |
| 25 to 29 Years | 494 (4.5%) | 490 (4.5%) |
| 30 to 34 Years | 518 (4.7%) | 448 (4.1%) |
| 35 to 39 Years | 700 (6.3%) | 594 (5.5%) |
| 40 to 44 Years | 494 (4.5%) | 480 (4.4%) |
| 45 to 49 Years | 626 (5.7%) | 584 (5.4%) |
| 50 to 54 Years | 640 (5.8%) | 655 (6.0%) |
| 55 to 59 Years | 903 (8.2%) | 891 (8.2%) |
| 60 to 64 Years | 838 (7.6%) | 850 (7.8%) |
| 65 to 69 Years | 881 (8.0%) | 1,115 (10.2%) |
| 70 to 74 Years | 939 (8.5%) | 720 (6.6%) |
| 75 to 79 Years | 658 (5.9%) | 616 (5.7%) |
| 80 to 84 Years | 286 (2.6%) | 388 (3.6%) |
| 85 Years and over | 244 (2.2%) | 497 (4.6%) |
| Total | 11,058 (100.0%) | 10,884 (100.0%) |
Families and Households in Jo Daviess County
Median Family Size in Jo Daviess County
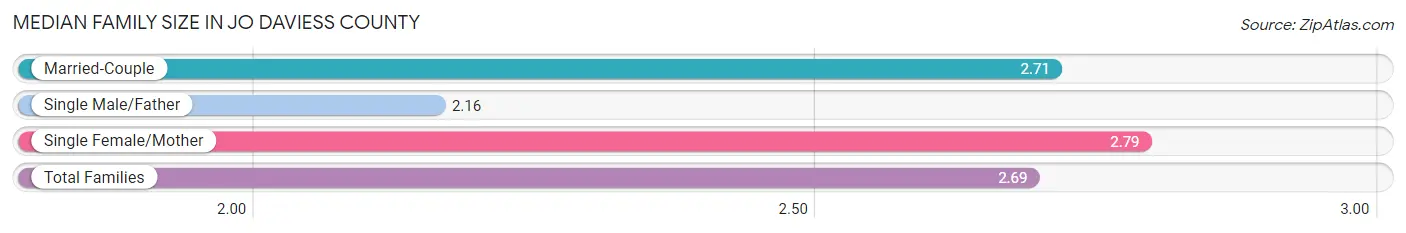
The median family size in Jo Daviess County is 2.69 persons per family, with single female/mother families (787 | 12.3%) accounting for the largest median family size of 2.79 persons per family. On the other hand, single male/father families (304 | 4.7%) represent the smallest median family size with 2.16 persons per family.
| Family Type | # Families | Family Size |
| Married-Couple | 5,323 (83.0%) | 2.71 |
| Single Male/Father | 304 (4.7%) | 2.16 |
| Single Female/Mother | 787 (12.3%) | 2.79 |
| Total Families | 6,414 (100.0%) | 2.69 |
Median Household Size in Jo Daviess County
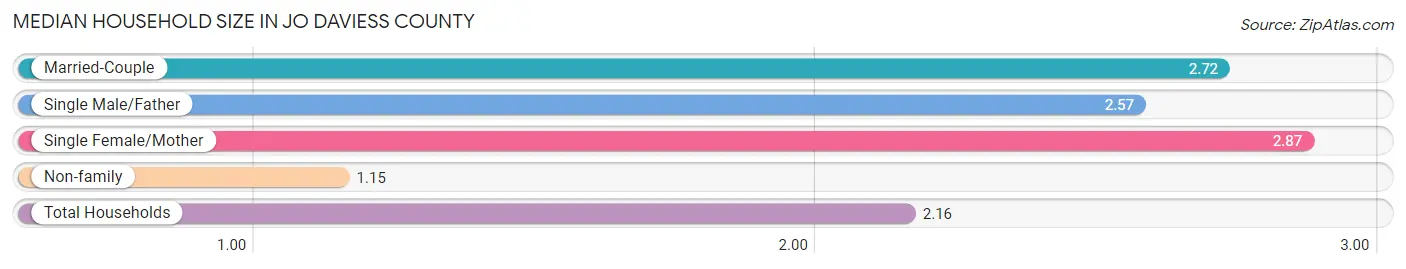
The median household size in Jo Daviess County is 2.16 persons per household, with single female/mother households (787 | 7.8%) accounting for the largest median household size of 2.87 persons per household. non-family households (3,660 | 36.3%) represent the smallest median household size with 1.15 persons per household.
| Household Type | # Households | Household Size |
| Married-Couple | 5,323 (52.8%) | 2.72 |
| Single Male/Father | 304 (3.0%) | 2.57 |
| Single Female/Mother | 787 (7.8%) | 2.87 |
| Non-family | 3,660 (36.3%) | 1.15 |
| Total Households | 10,074 (100.0%) | 2.16 |
Household Size by Marriage Status in Jo Daviess County
Out of a total of 10,074 households in Jo Daviess County, 6,414 (63.7%) are family households, while 3,660 (36.3%) are nonfamily households. The most numerous type of family households are 2-person households, comprising 3,834, and the most common type of nonfamily households are 1-person households, comprising 3,173.
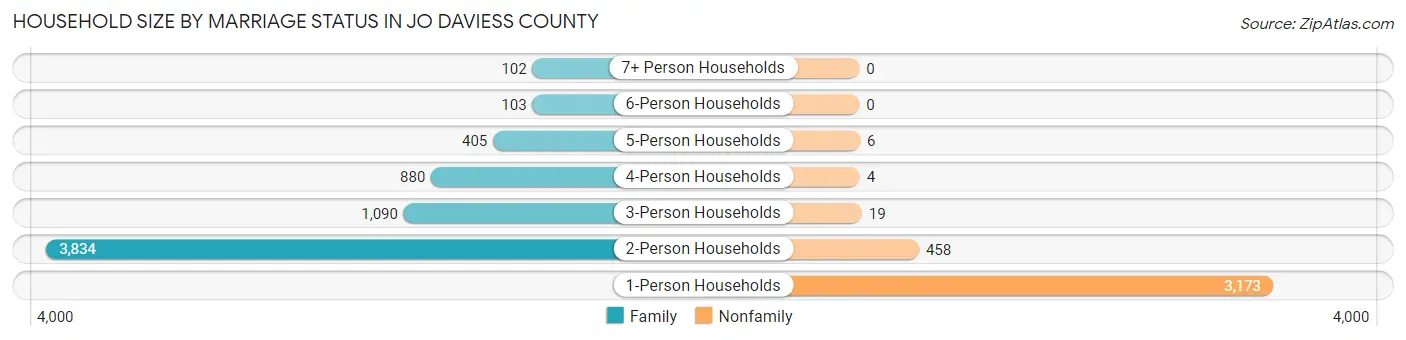
| Household Size | Family Households | Nonfamily Households |
| 1-Person Households | - | 3,173 (31.5%) |
| 2-Person Households | 3,834 (38.1%) | 458 (4.5%) |
| 3-Person Households | 1,090 (10.8%) | 19 (0.2%) |
| 4-Person Households | 880 (8.7%) | 4 (0.0%) |
| 5-Person Households | 405 (4.0%) | 6 (0.1%) |
| 6-Person Households | 103 (1.0%) | 0 (0.0%) |
| 7+ Person Households | 102 (1.0%) | 0 (0.0%) |
| Total | 6,414 (63.7%) | 3,660 (36.3%) |
Female Fertility in Jo Daviess County
Fertility by Age in Jo Daviess County
Average fertility rate in Jo Daviess County is 39.0 births per 1,000 women. Women in the age bracket of 20 to 34 years have the highest fertility rate with 89.0 births per 1,000 women. Women in the age bracket of 20 to 34 years acount for 86.5% of all women with births.
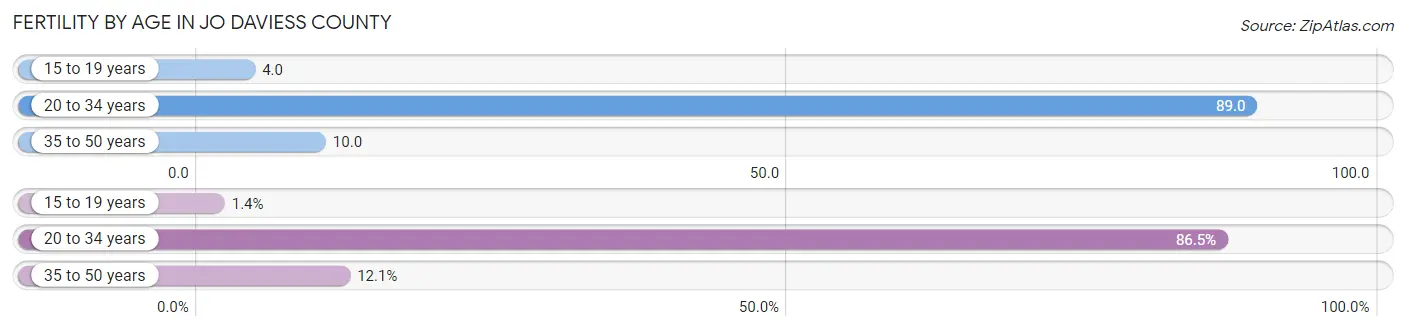
| Age Bracket | Women with Births | Births / 1,000 Women |
| 15 to 19 years | 2 (1.4%) | 4.0 |
| 20 to 34 years | 122 (86.5%) | 89.0 |
| 35 to 50 years | 17 (12.1%) | 10.0 |
| Total | 141 (100.0%) | 39.0 |
Fertility by Age by Marriage Status in Jo Daviess County
73.8% of women with births (141) in Jo Daviess County are married. The highest percentage of unmarried women with births falls into 15 to 19 years age bracket with 100.0% of them unmarried at the time of birth, while the lowest percentage of unmarried women with births belong to 35 to 50 years age bracket with 0.0% of them unmarried.
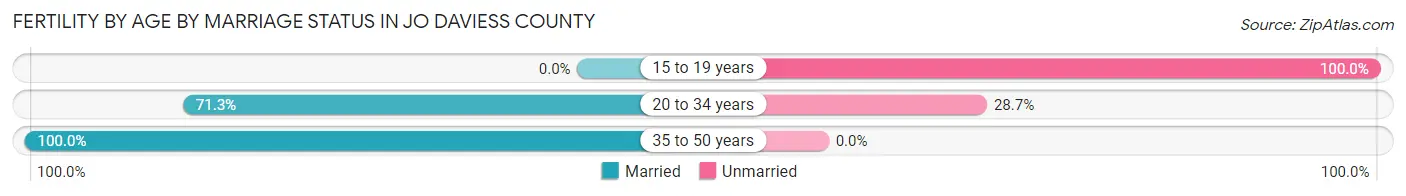
| Age Bracket | Married | Unmarried |
| 15 to 19 years | 0 (0.0%) | 2 (100.0%) |
| 20 to 34 years | 87 (71.3%) | 35 (28.7%) |
| 35 to 50 years | 17 (100.0%) | 0 (0.0%) |
| Total | 104 (73.8%) | 37 (26.2%) |
Fertility by Education in Jo Daviess County
Average fertility rate in Jo Daviess County is 39.0 births per 1,000 women. Women with the education attainment of college or associate's degree have the highest fertility rate of 72.0 births per 1,000 women, while women with the education attainment of bachelor's degree have the lowest fertility at 10.0 births per 1,000 women. Women with the education attainment of college or associate's degree represent 66.7% of all women with births.
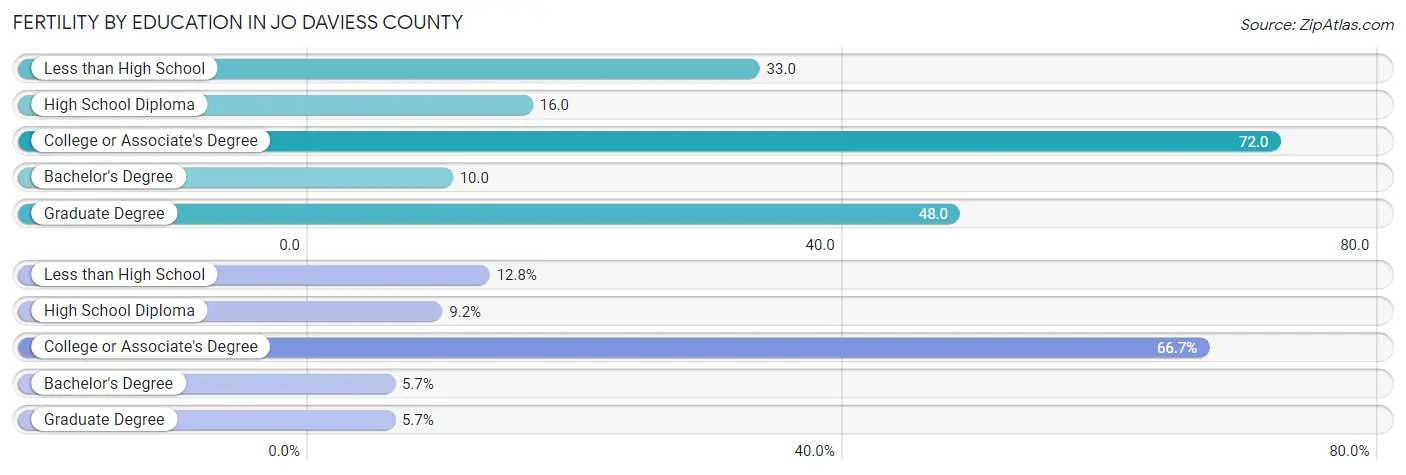
| Educational Attainment | Women with Births | Births / 1,000 Women |
| Less than High School | 18 (12.8%) | 33.0 |
| High School Diploma | 13 (9.2%) | 16.0 |
| College or Associate's Degree | 94 (66.7%) | 72.0 |
| Bachelor's Degree | 8 (5.7%) | 10.0 |
| Graduate Degree | 8 (5.7%) | 48.0 |
| Total | 141 (100.0%) | 39.0 |
Fertility by Education by Marriage Status in Jo Daviess County
26.2% of women with births in Jo Daviess County are unmarried. Women with the educational attainment of bachelor's degree are most likely to be married with 100.0% of them married at childbirth, while women with the educational attainment of less than high school are least likely to be married with 100.0% of them unmarried at childbirth.
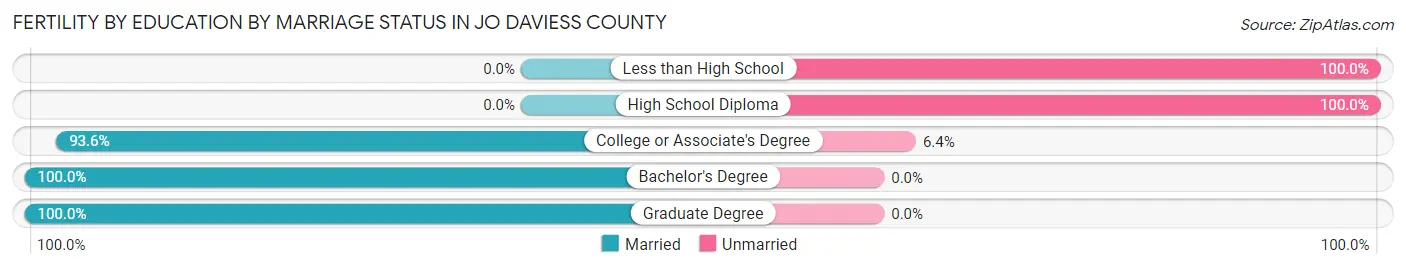
| Educational Attainment | Married | Unmarried |
| Less than High School | 0 (0.0%) | 18 (100.0%) |
| High School Diploma | 0 (0.0%) | 13 (100.0%) |
| College or Associate's Degree | 88 (93.6%) | 6 (6.4%) |
| Bachelor's Degree | 8 (100.0%) | 0 (0.0%) |
| Graduate Degree | 8 (100.0%) | 0 (0.0%) |
| Total | 104 (73.8%) | 37 (26.2%) |
Employment Characteristics in Jo Daviess County
Employment by Class of Employer in Jo Daviess County
Among the 10,721 employed individuals in Jo Daviess County, private company employees (6,656 | 62.1%), not-for-profit organizations (991 | 9.2%), and self-employed (not incorporated) (897 | 8.4%) make up the most common classes of employment.
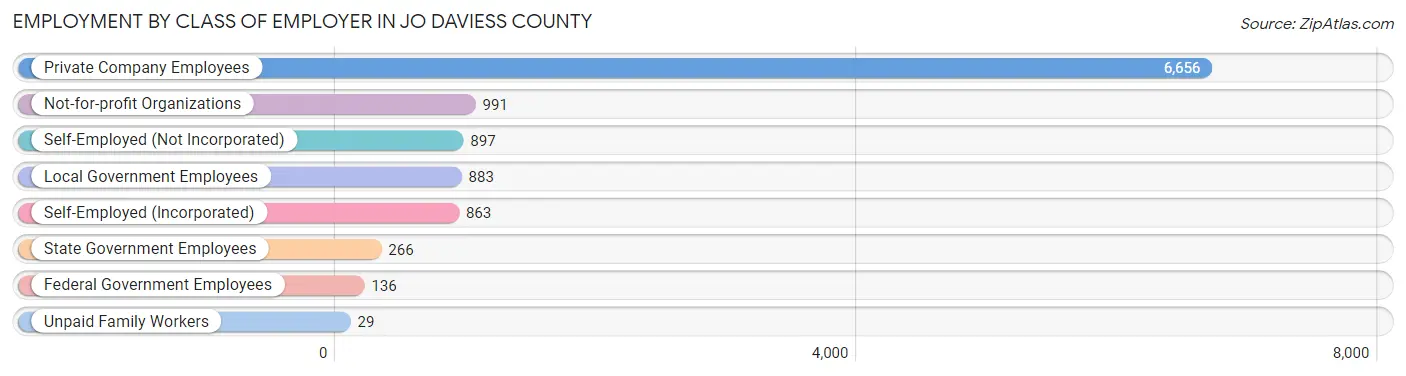
| Employer Class | # Employees | % Employees |
| Private Company Employees | 6,656 | 62.1% |
| Self-Employed (Incorporated) | 863 | 8.1% |
| Self-Employed (Not Incorporated) | 897 | 8.4% |
| Not-for-profit Organizations | 991 | 9.2% |
| Local Government Employees | 883 | 8.2% |
| State Government Employees | 266 | 2.5% |
| Federal Government Employees | 136 | 1.3% |
| Unpaid Family Workers | 29 | 0.3% |
| Total | 10,721 | 100.0% |
Employment Status by Age in Jo Daviess County
According to the labor force statistics for Jo Daviess County, out of the total population over 16 years of age (18,305), 60.9% or 11,148 individuals are in the labor force, with 2.7% or 301 of them unemployed. The age group with the highest labor force participation rate is 25 to 29 years, with 93.5% or 920 individuals in the labor force. Within the labor force, the 16 to 19 years age range has the highest percentage of unemployed individuals, with 11.0% or 42 of them being unemployed.
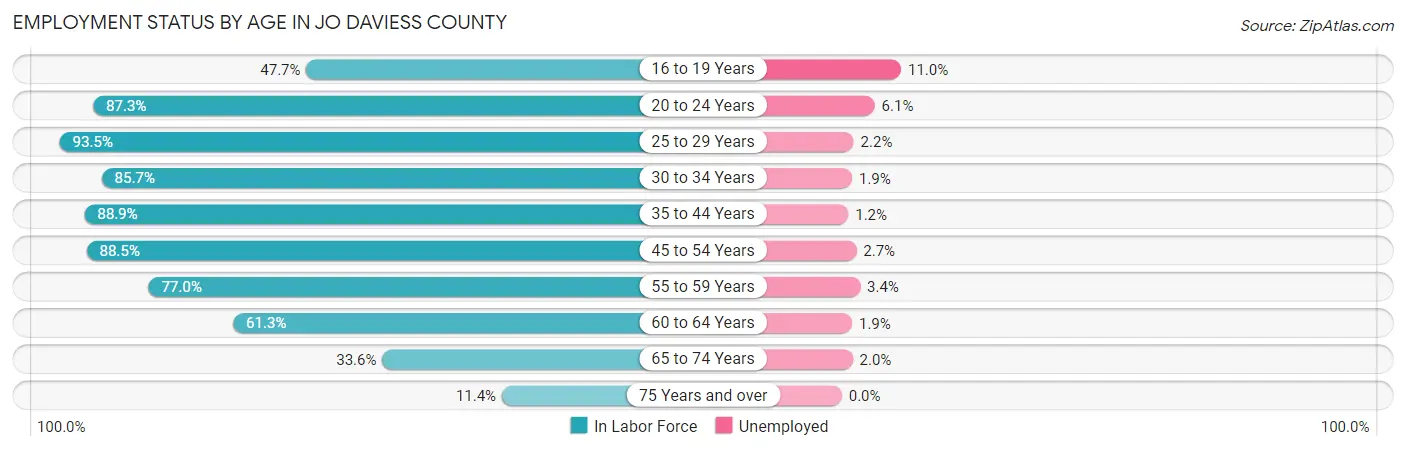
| Age Bracket | In Labor Force | Unemployed |
| 16 to 19 Years | 383 (47.7%) | 42 (11.0%) |
| 20 to 24 Years | 832 (87.3%) | 51 (6.1%) |
| 25 to 29 Years | 920 (93.5%) | 20 (2.2%) |
| 30 to 34 Years | 828 (85.7%) | 16 (1.9%) |
| 35 to 44 Years | 2,016 (88.9%) | 24 (1.2%) |
| 45 to 54 Years | 2,217 (88.5%) | 60 (2.7%) |
| 55 to 59 Years | 1,381 (77.0%) | 47 (3.4%) |
| 60 to 64 Years | 1,035 (61.3%) | 20 (1.9%) |
| 65 to 74 Years | 1,228 (33.6%) | 25 (2.0%) |
| 75 Years and over | 307 (11.4%) | 0 (0.0%) |
| Total | 11,148 (60.9%) | 301 (2.7%) |
Employment Status by Educational Attainment in Jo Daviess County
According to labor force statistics for Jo Daviess County, 82.3% of individuals (8,399) out of the total population between 25 and 64 years of age (10,205) are in the labor force, with 2.2% or 185 of them being unemployed. The group with the highest labor force participation rate are those with the educational attainment of bachelor's degree or higher, with 85.2% or 2,381 individuals in the labor force. Within the labor force, individuals with less than high school education have the highest percentage of unemployment, with 6.9% or 26 of them being unemployed.
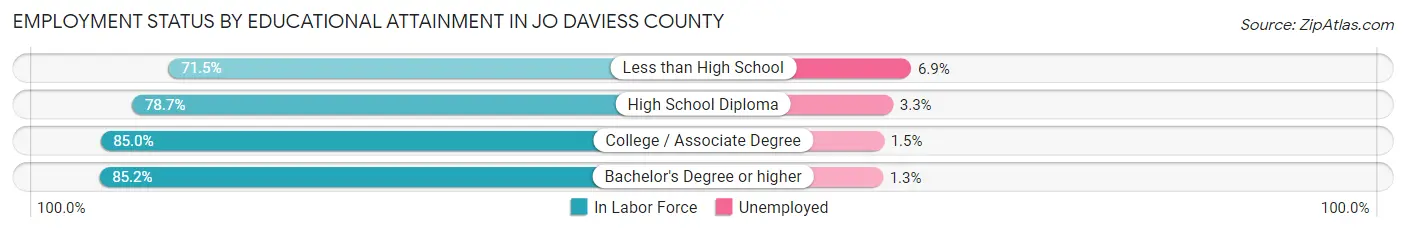
| Educational Attainment | In Labor Force | Unemployed |
| Less than High School | 377 (71.5%) | 36 (6.9%) |
| High School Diploma | 2,675 (78.7%) | 112 (3.3%) |
| College / Associate Degree | 2,961 (85.0%) | 52 (1.5%) |
| Bachelor's Degree or higher | 2,381 (85.2%) | 36 (1.3%) |
| Total | 8,399 (82.3%) | 225 (2.2%) |
Employment Occupations by Sex in Jo Daviess County
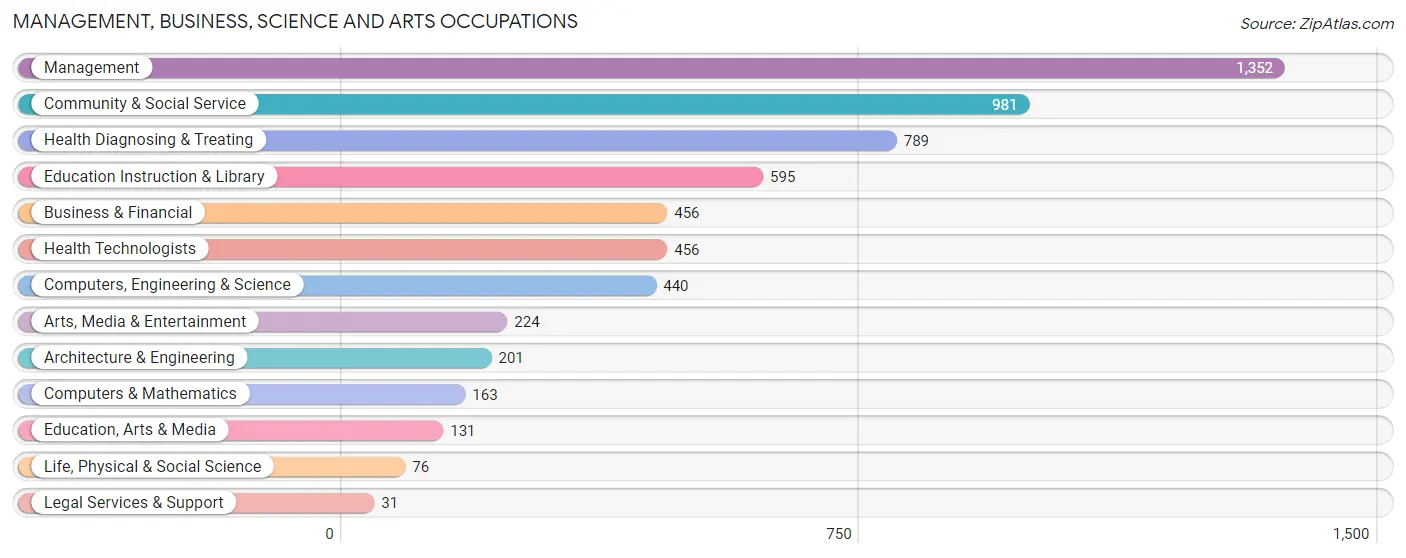
Management, Business, Science and Arts Occupations
The most common Management, Business, Science and Arts occupations in Jo Daviess County are Management (1,352 | 12.5%), Community & Social Service (981 | 9.0%), Health Diagnosing & Treating (789 | 7.3%), Education Instruction & Library (595 | 5.5%), and Business & Financial (456 | 4.2%).
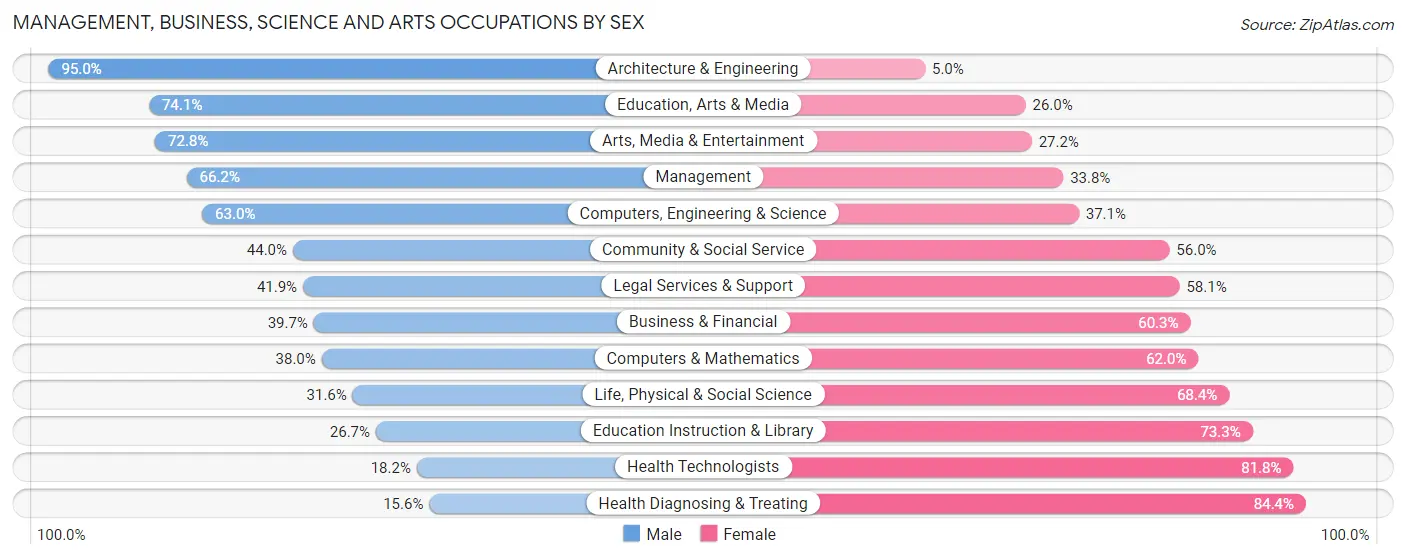
Management, Business, Science and Arts Occupations by Sex
Within the Management, Business, Science and Arts occupations in Jo Daviess County, the most male-oriented occupations are Architecture & Engineering (95.0%), Education, Arts & Media (74.1%), and Arts, Media & Entertainment (72.8%), while the most female-oriented occupations are Health Diagnosing & Treating (84.4%), Health Technologists (81.8%), and Education Instruction & Library (73.3%).
| Occupation | Male | Female |
| Management | 895 (66.2%) | 457 (33.8%) |
| Business & Financial | 181 (39.7%) | 275 (60.3%) |
| Computers, Engineering & Science | 277 (62.9%) | 163 (37.0%) |
| Computers & Mathematics | 62 (38.0%) | 101 (62.0%) |
| Architecture & Engineering | 191 (95.0%) | 10 (5.0%) |
| Life, Physical & Social Science | 24 (31.6%) | 52 (68.4%) |
| Community & Social Service | 432 (44.0%) | 549 (56.0%) |
| Education, Arts & Media | 97 (74.1%) | 34 (26.0%) |
| Legal Services & Support | 13 (41.9%) | 18 (58.1%) |
| Education Instruction & Library | 159 (26.7%) | 436 (73.3%) |
| Arts, Media & Entertainment | 163 (72.8%) | 61 (27.2%) |
| Health Diagnosing & Treating | 123 (15.6%) | 666 (84.4%) |
| Health Technologists | 83 (18.2%) | 373 (81.8%) |
| Total (Category) | 1,908 (47.5%) | 2,110 (52.5%) |
| Total (Overall) | 5,907 (54.5%) | 4,930 (45.5%) |
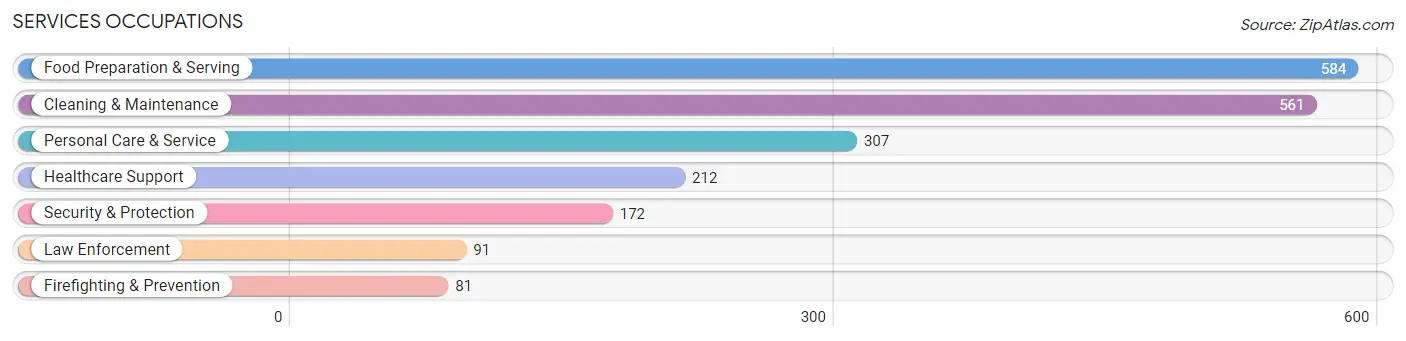
Services Occupations
The most common Services occupations in Jo Daviess County are Food Preparation & Serving (584 | 5.4%), Cleaning & Maintenance (561 | 5.2%), Personal Care & Service (307 | 2.8%), Healthcare Support (212 | 2.0%), and Security & Protection (172 | 1.6%).
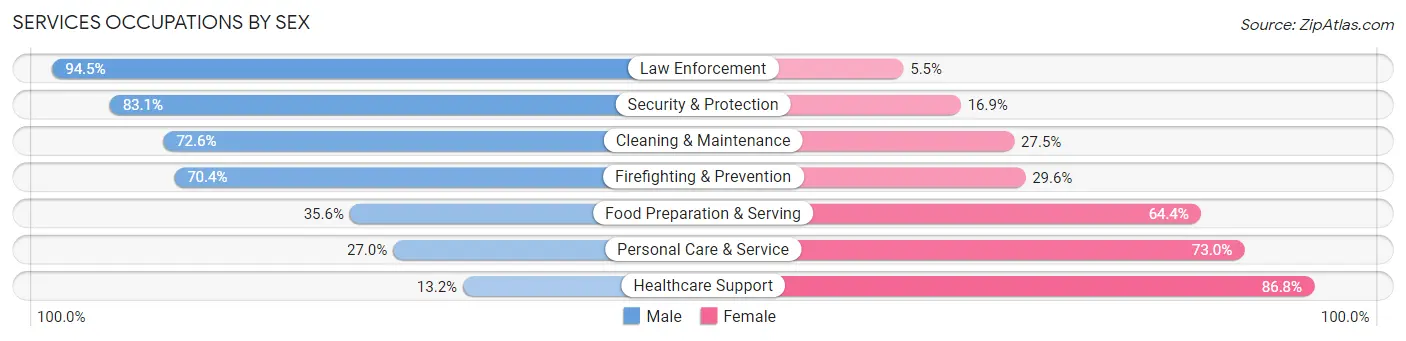
Services Occupations by Sex
Within the Services occupations in Jo Daviess County, the most male-oriented occupations are Law Enforcement (94.5%), Security & Protection (83.1%), and Cleaning & Maintenance (72.6%), while the most female-oriented occupations are Healthcare Support (86.8%), Personal Care & Service (73.0%), and Food Preparation & Serving (64.4%).
| Occupation | Male | Female |
| Healthcare Support | 28 (13.2%) | 184 (86.8%) |
| Security & Protection | 143 (83.1%) | 29 (16.9%) |
| Firefighting & Prevention | 57 (70.4%) | 24 (29.6%) |
| Law Enforcement | 86 (94.5%) | 5 (5.5%) |
| Food Preparation & Serving | 208 (35.6%) | 376 (64.4%) |
| Cleaning & Maintenance | 407 (72.6%) | 154 (27.5%) |
| Personal Care & Service | 83 (27.0%) | 224 (73.0%) |
| Total (Category) | 869 (47.3%) | 967 (52.7%) |
| Total (Overall) | 5,907 (54.5%) | 4,930 (45.5%) |
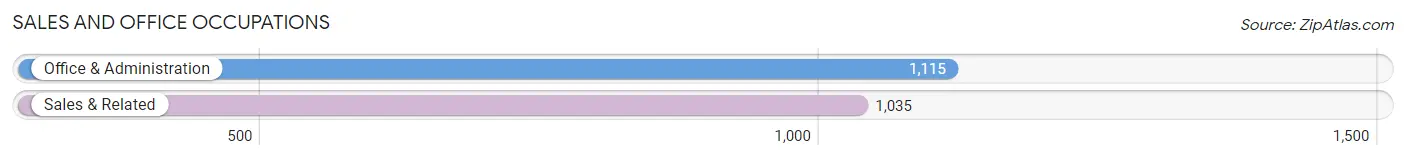
Sales and Office Occupations
The most common Sales and Office occupations in Jo Daviess County are Office & Administration (1,115 | 10.3%), and Sales & Related (1,035 | 9.6%).
Sales and Office Occupations by Sex
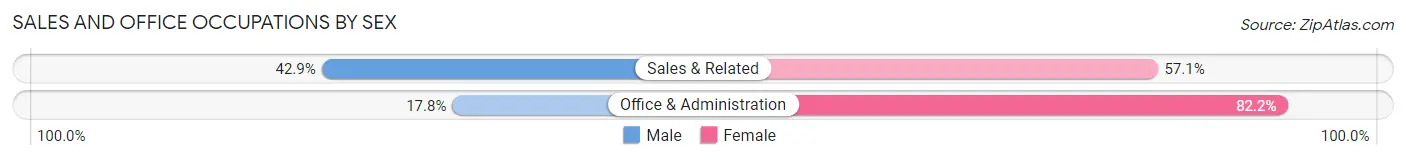
| Occupation | Male | Female |
| Sales & Related | 444 (42.9%) | 591 (57.1%) |
| Office & Administration | 198 (17.8%) | 917 (82.2%) |
| Total (Category) | 642 (29.9%) | 1,508 (70.1%) |
| Total (Overall) | 5,907 (54.5%) | 4,930 (45.5%) |
Natural Resources, Construction and Maintenance Occupations
The most common Natural Resources, Construction and Maintenance occupations in Jo Daviess County are Construction & Extraction (613 | 5.7%), Installation, Maintenance & Repair (456 | 4.2%), and Farming, Fishing & Forestry (89 | 0.8%).

Natural Resources, Construction and Maintenance Occupations by Sex
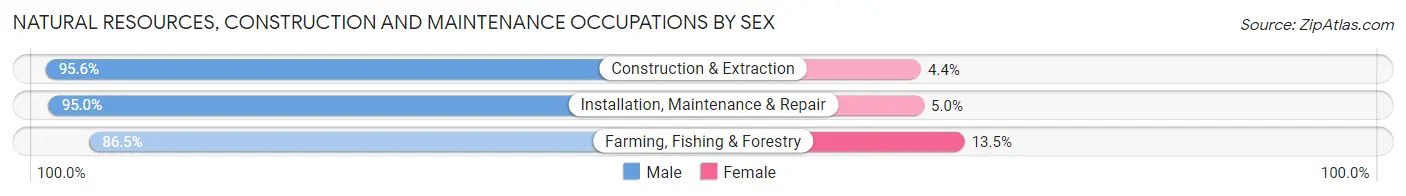
| Occupation | Male | Female |
| Farming, Fishing & Forestry | 77 (86.5%) | 12 (13.5%) |
| Construction & Extraction | 586 (95.6%) | 27 (4.4%) |
| Installation, Maintenance & Repair | 433 (95.0%) | 23 (5.0%) |
| Total (Category) | 1,096 (94.7%) | 62 (5.3%) |
| Total (Overall) | 5,907 (54.5%) | 4,930 (45.5%) |
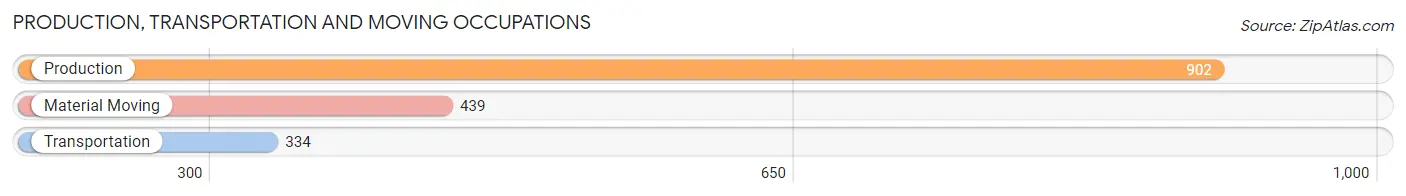
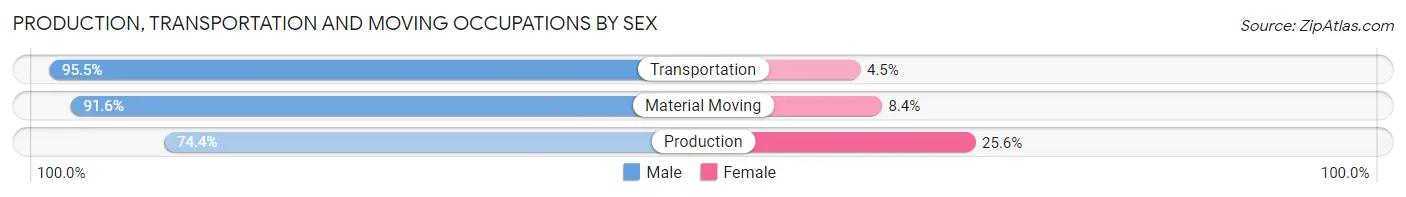
Production, Transportation and Moving Occupations
The most common Production, Transportation and Moving occupations in Jo Daviess County are Production (902 | 8.3%), Material Moving (439 | 4.1%), and Transportation (334 | 3.1%).
Production, Transportation and Moving Occupations by Sex
| Occupation | Male | Female |
| Production | 671 (74.4%) | 231 (25.6%) |
| Transportation | 319 (95.5%) | 15 (4.5%) |
| Material Moving | 402 (91.6%) | 37 (8.4%) |
| Total (Category) | 1,392 (83.1%) | 283 (16.9%) |
| Total (Overall) | 5,907 (54.5%) | 4,930 (45.5%) |
Employment Industries by Sex in Jo Daviess County
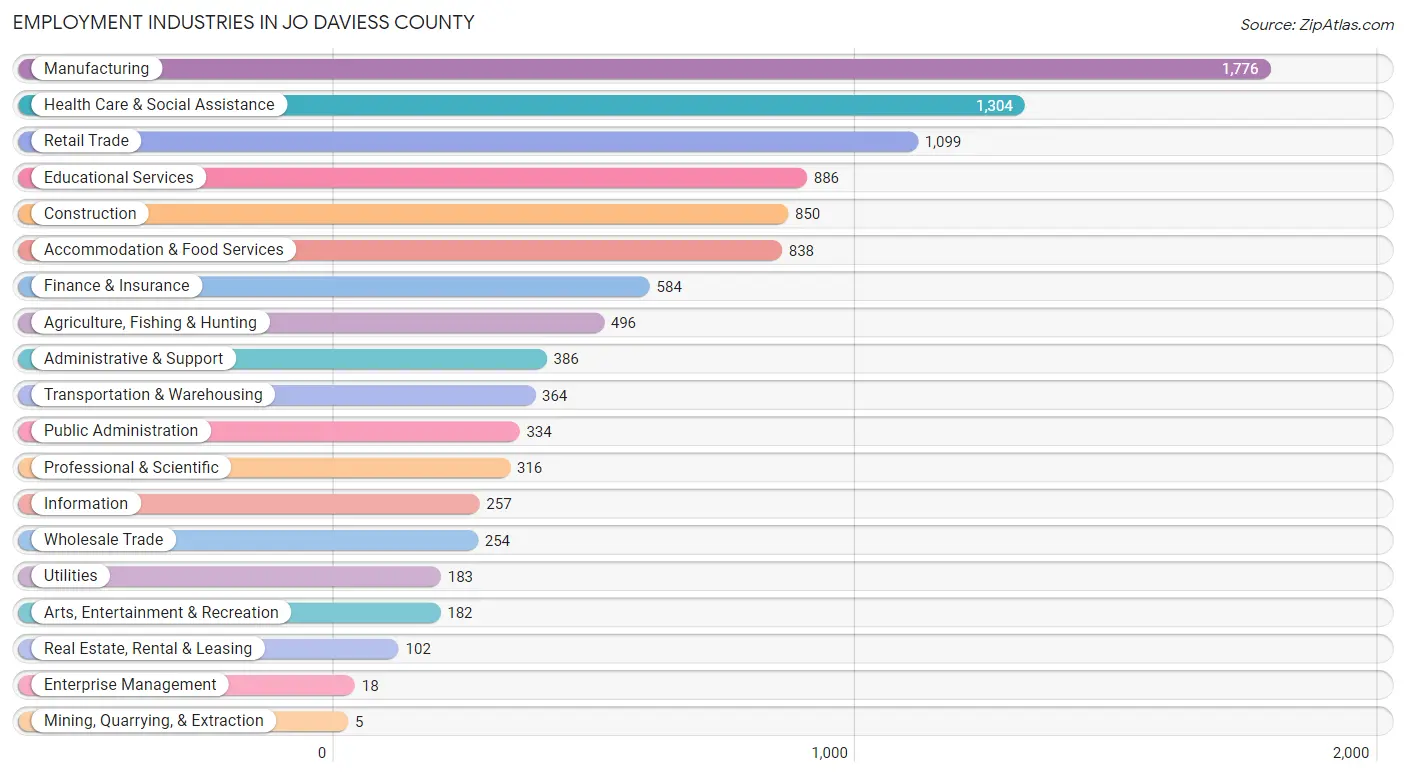
Employment Industries in Jo Daviess County
The major employment industries in Jo Daviess County include Manufacturing (1,776 | 16.4%), Health Care & Social Assistance (1,304 | 12.0%), Retail Trade (1,099 | 10.1%), Educational Services (886 | 8.2%), and Construction (850 | 7.8%).
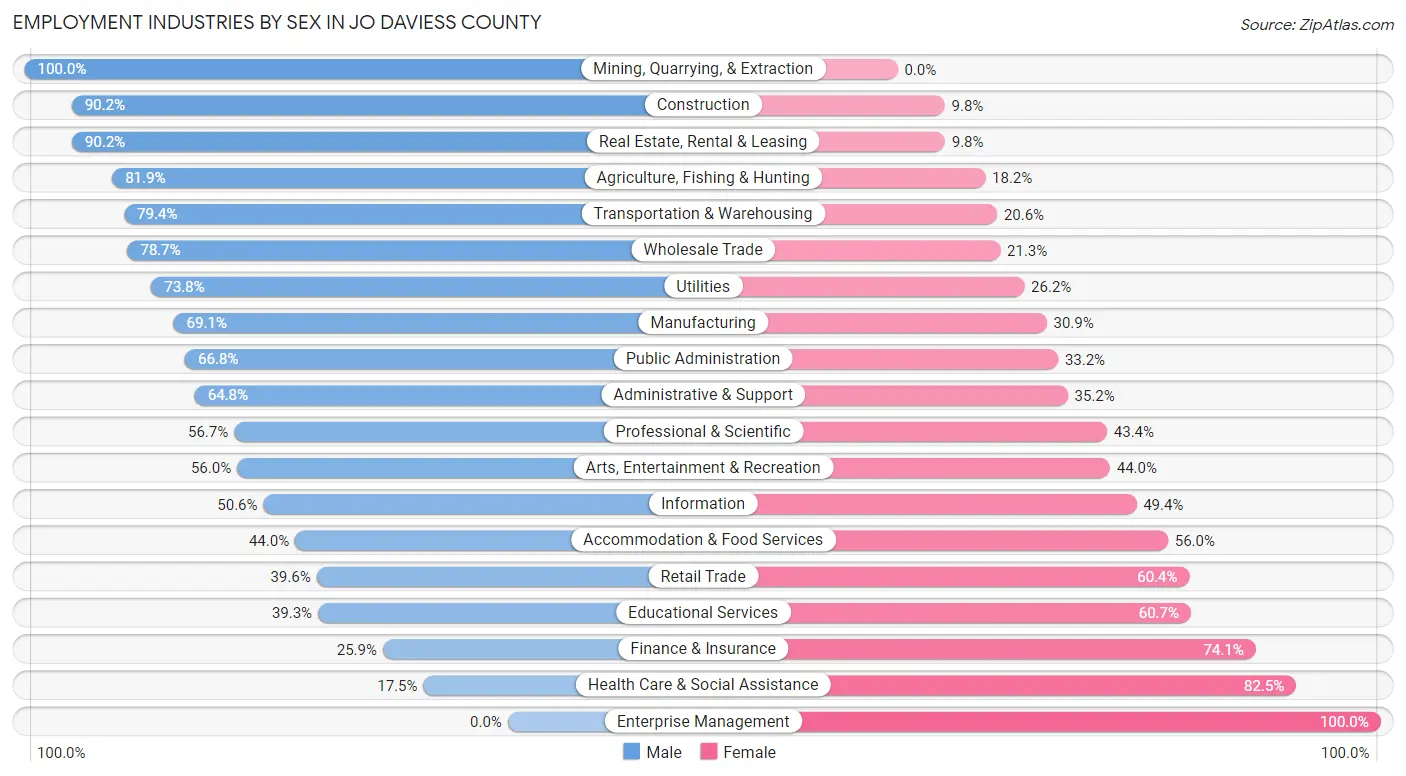
Employment Industries by Sex in Jo Daviess County
The Jo Daviess County industries that see more men than women are Mining, Quarrying, & Extraction (100.0%), Construction (90.2%), and Real Estate, Rental & Leasing (90.2%), whereas the industries that tend to have a higher number of women are Enterprise Management (100.0%), Health Care & Social Assistance (82.5%), and Finance & Insurance (74.1%).
| Industry | Male | Female |
| Agriculture, Fishing & Hunting | 406 (81.9%) | 90 (18.1%) |
| Mining, Quarrying, & Extraction | 5 (100.0%) | 0 (0.0%) |
| Construction | 767 (90.2%) | 83 (9.8%) |
| Manufacturing | 1,228 (69.1%) | 548 (30.9%) |
| Wholesale Trade | 200 (78.7%) | 54 (21.3%) |
| Retail Trade | 435 (39.6%) | 664 (60.4%) |
| Transportation & Warehousing | 289 (79.4%) | 75 (20.6%) |
| Utilities | 135 (73.8%) | 48 (26.2%) |
| Information | 130 (50.6%) | 127 (49.4%) |
| Finance & Insurance | 151 (25.9%) | 433 (74.1%) |
| Real Estate, Rental & Leasing | 92 (90.2%) | 10 (9.8%) |
| Professional & Scientific | 179 (56.7%) | 137 (43.3%) |
| Enterprise Management | 0 (0.0%) | 18 (100.0%) |
| Administrative & Support | 250 (64.8%) | 136 (35.2%) |
| Educational Services | 348 (39.3%) | 538 (60.7%) |
| Health Care & Social Assistance | 228 (17.5%) | 1,076 (82.5%) |
| Arts, Entertainment & Recreation | 102 (56.0%) | 80 (44.0%) |
| Accommodation & Food Services | 369 (44.0%) | 469 (56.0%) |
| Public Administration | 223 (66.8%) | 111 (33.2%) |
| Total | 5,907 (54.5%) | 4,930 (45.5%) |
Education in Jo Daviess County
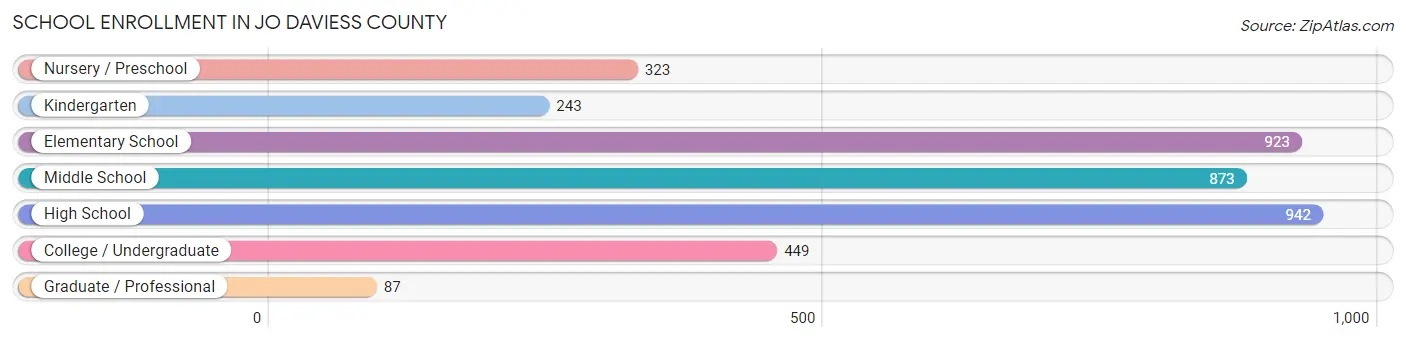
School Enrollment in Jo Daviess County
The most common levels of schooling among the 3,840 students in Jo Daviess County are high school (942 | 24.5%), elementary school (923 | 24.0%), and middle school (873 | 22.7%).
| School Level | # Students | % Students |
| Nursery / Preschool | 323 | 8.4% |
| Kindergarten | 243 | 6.3% |
| Elementary School | 923 | 24.0% |
| Middle School | 873 | 22.7% |
| High School | 942 | 24.5% |
| College / Undergraduate | 449 | 11.7% |
| Graduate / Professional | 87 | 2.3% |
| Total | 3,840 | 100.0% |
School Enrollment by Age by Funding Source in Jo Daviess County
Out of a total of 3,840 students who are enrolled in schools in Jo Daviess County, 434 (11.3%) attend a private institution, while the remaining 3,406 (88.7%) are enrolled in public schools. The age group of 25 to 34 year olds has the highest likelihood of being enrolled in private schools, with 18 (25.0% in the age bracket) enrolled. Conversely, the age group of 3 to 4 year olds has the lowest likelihood of being enrolled in a private school, with 191 (93.6% in the age bracket) attending a public institution.
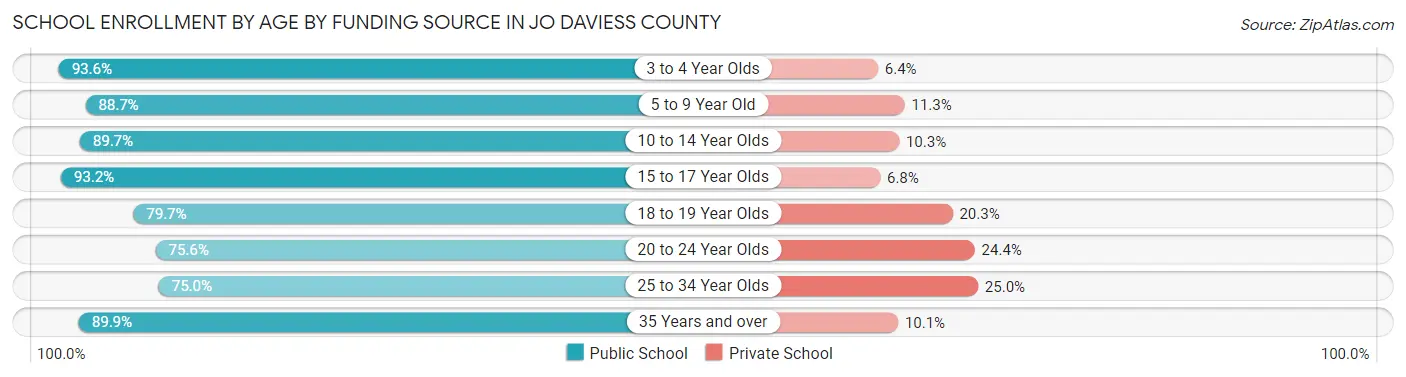
| Age Bracket | Public School | Private School |
| 3 to 4 Year Olds | 191 (93.6%) | 13 (6.4%) |
| 5 to 9 Year Old | 969 (88.7%) | 124 (11.3%) |
| 10 to 14 Year Olds | 1,115 (89.7%) | 128 (10.3%) |
| 15 to 17 Year Olds | 606 (93.2%) | 44 (6.8%) |
| 18 to 19 Year Olds | 177 (79.7%) | 45 (20.3%) |
| 20 to 24 Year Olds | 127 (75.6%) | 41 (24.4%) |
| 25 to 34 Year Olds | 54 (75.0%) | 18 (25.0%) |
| 35 Years and over | 169 (89.9%) | 19 (10.1%) |
| Total | 3,410 (88.8%) | 434 (11.3%) |
Educational Attainment by Field of Study in Jo Daviess County
Business (982 | 19.4%), education (980 | 19.3%), bio, nature & agricultural (473 | 9.3%), science & technology (429 | 8.5%), and arts & humanities (405 | 8.0%) are the most common fields of study among 5,066 individuals in Jo Daviess County who have obtained a bachelor's degree or higher.
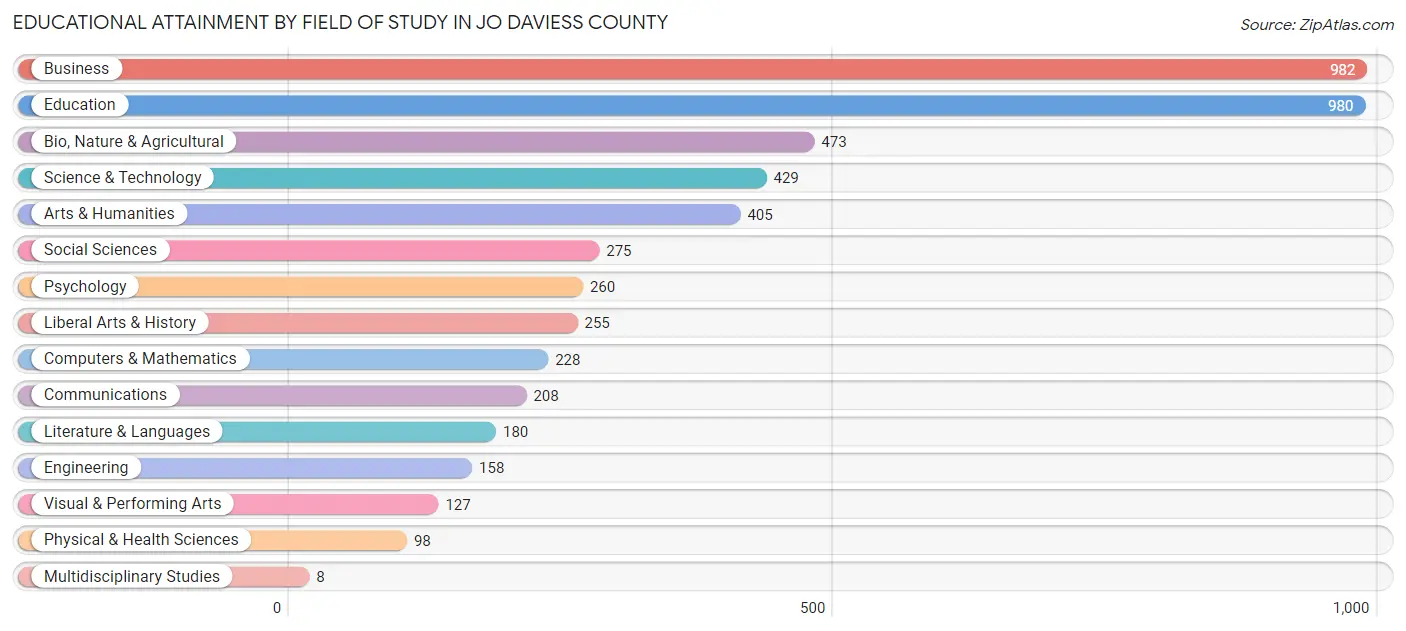
| Field of Study | # Graduates | % Graduates |
| Computers & Mathematics | 228 | 4.5% |
| Bio, Nature & Agricultural | 473 | 9.3% |
| Physical & Health Sciences | 98 | 1.9% |
| Psychology | 260 | 5.1% |
| Social Sciences | 275 | 5.4% |
| Engineering | 158 | 3.1% |
| Multidisciplinary Studies | 8 | 0.2% |
| Science & Technology | 429 | 8.5% |
| Business | 982 | 19.4% |
| Education | 980 | 19.3% |
| Literature & Languages | 180 | 3.5% |
| Liberal Arts & History | 255 | 5.0% |
| Visual & Performing Arts | 127 | 2.5% |
| Communications | 208 | 4.1% |
| Arts & Humanities | 405 | 8.0% |
| Total | 5,066 | 100.0% |
Transportation & Commute in Jo Daviess County
Vehicle Availability by Sex in Jo Daviess County
The most prevalent vehicle ownership categories in Jo Daviess County are males with 2 vehicles (2,578, accounting for 43.9%) and females with 2 vehicles (2,144, making up 53.2%).
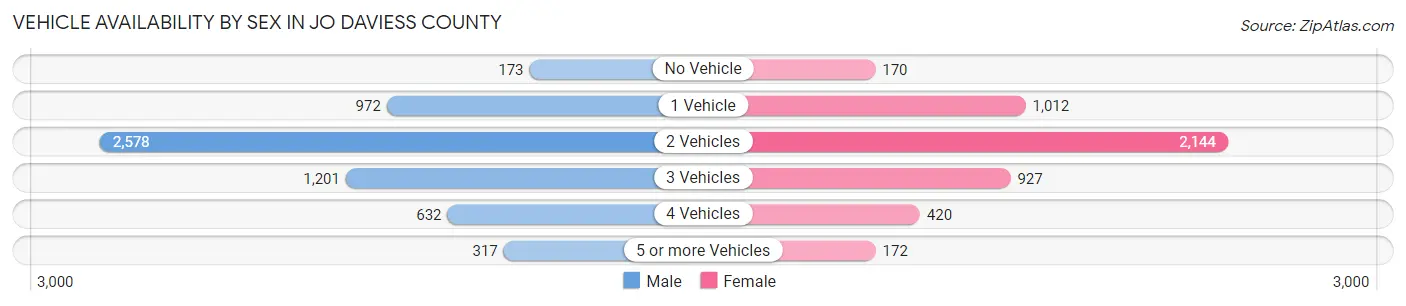
| Vehicles Available | Male | Female |
| No Vehicle | 173 (2.9%) | 170 (3.5%) |
| 1 Vehicle | 972 (16.6%) | 1,012 (20.9%) |
| 2 Vehicles | 2,578 (43.9%) | 2,144 (44.3%) |
| 3 Vehicles | 1,201 (20.4%) | 927 (19.1%) |
| 4 Vehicles | 632 (10.8%) | 420 (8.7%) |
| 5 or more Vehicles | 317 (5.4%) | 172 (3.5%) |
| Total | 5,873 (100.0%) | 4,845 (100.0%) |
Commute Time in Jo Daviess County
The most frequently occuring commute durations in Jo Daviess County are 5 to 9 minutes (1,628 commuters, 17.2%), 10 to 14 minutes (1,521 commuters, 16.0%), and 20 to 24 minutes (1,418 commuters, 14.9%).
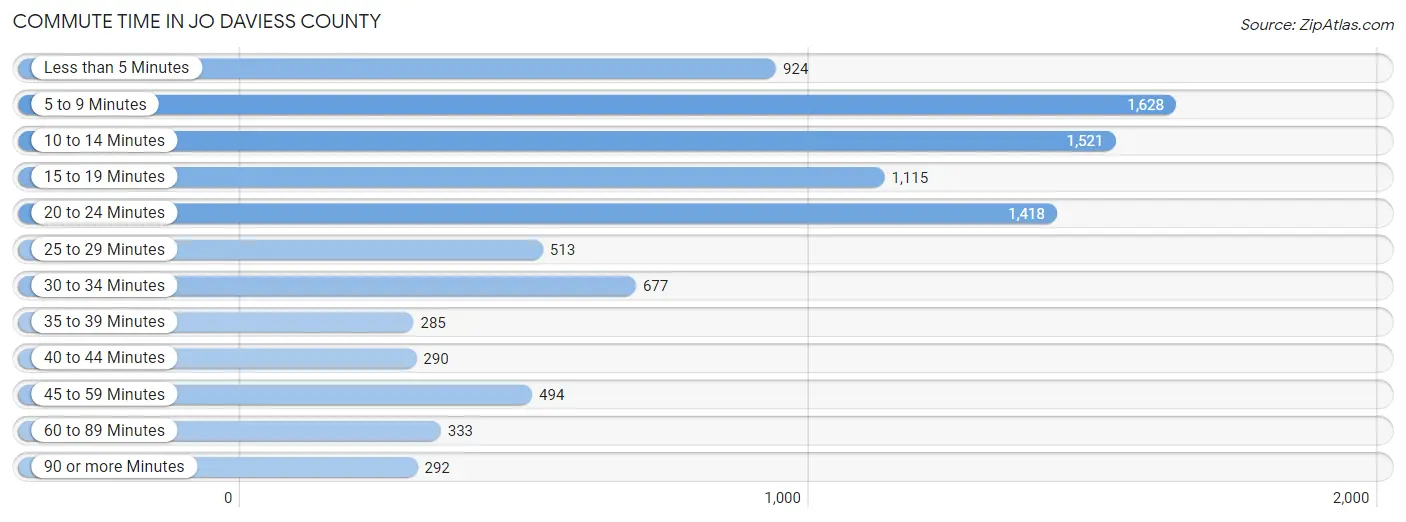
| Commute Time | # Commuters | % Commuters |
| Less than 5 Minutes | 924 | 9.7% |
| 5 to 9 Minutes | 1,628 | 17.2% |
| 10 to 14 Minutes | 1,521 | 16.0% |
| 15 to 19 Minutes | 1,115 | 11.7% |
| 20 to 24 Minutes | 1,418 | 14.9% |
| 25 to 29 Minutes | 513 | 5.4% |
| 30 to 34 Minutes | 677 | 7.1% |
| 35 to 39 Minutes | 285 | 3.0% |
| 40 to 44 Minutes | 290 | 3.1% |
| 45 to 59 Minutes | 494 | 5.2% |
| 60 to 89 Minutes | 333 | 3.5% |
| 90 or more Minutes | 292 | 3.1% |
Commute Time by Sex in Jo Daviess County
The most common commute times in Jo Daviess County are 5 to 9 minutes (973 commuters, 19.0%) for males and 10 to 14 minutes (778 commuters, 17.8%) for females.
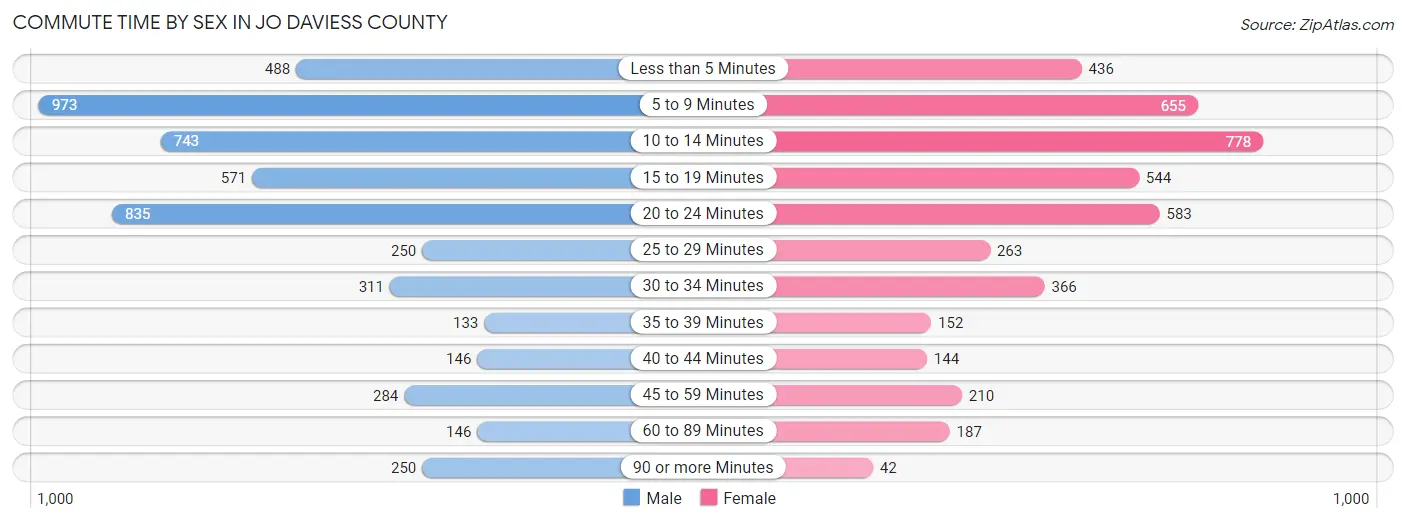
| Commute Time | Male | Female |
| Less than 5 Minutes | 488 (9.5%) | 436 (10.0%) |
| 5 to 9 Minutes | 973 (19.0%) | 655 (15.0%) |
| 10 to 14 Minutes | 743 (14.5%) | 778 (17.8%) |
| 15 to 19 Minutes | 571 (11.1%) | 544 (12.5%) |
| 20 to 24 Minutes | 835 (16.3%) | 583 (13.4%) |
| 25 to 29 Minutes | 250 (4.9%) | 263 (6.0%) |
| 30 to 34 Minutes | 311 (6.1%) | 366 (8.4%) |
| 35 to 39 Minutes | 133 (2.6%) | 152 (3.5%) |
| 40 to 44 Minutes | 146 (2.9%) | 144 (3.3%) |
| 45 to 59 Minutes | 284 (5.5%) | 210 (4.8%) |
| 60 to 89 Minutes | 146 (2.9%) | 187 (4.3%) |
| 90 or more Minutes | 250 (4.9%) | 42 (1.0%) |
Time of Departure to Work by Sex in Jo Daviess County
The most frequent times of departure to work in Jo Daviess County are 6:00 AM to 6:29 AM (589, 11.5%) for males and 7:00 AM to 7:29 AM (750, 17.2%) for females.
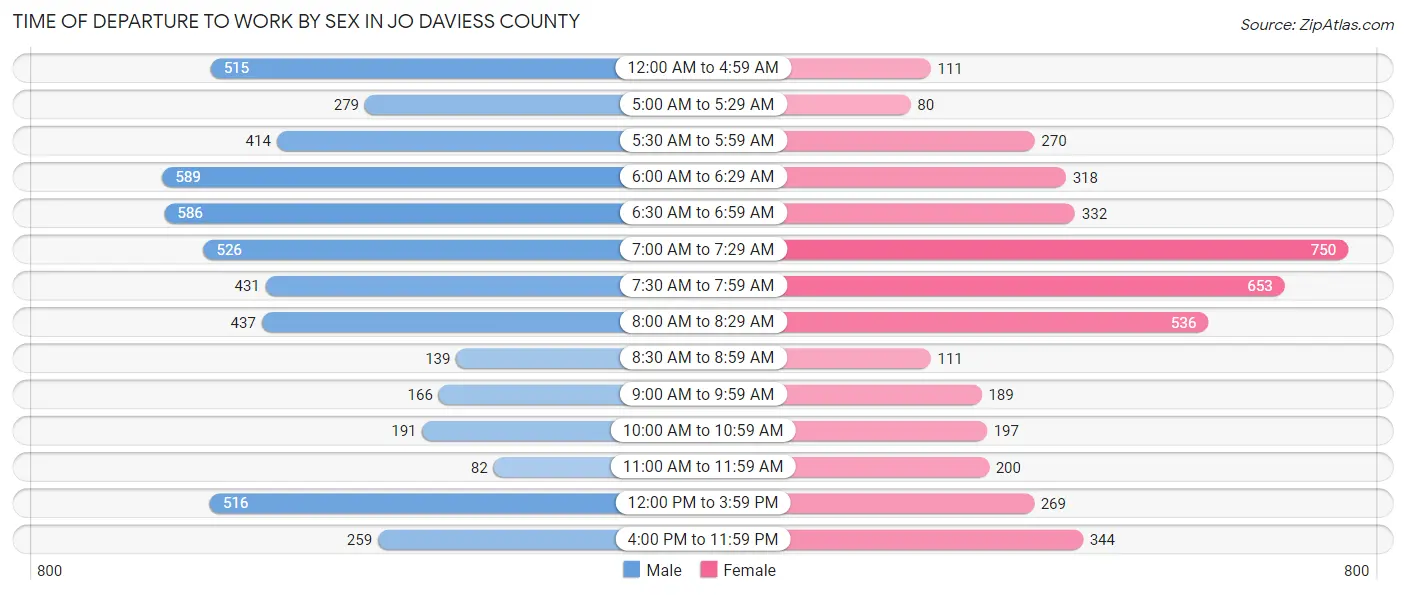
| Time of Departure | Male | Female |
| 12:00 AM to 4:59 AM | 515 (10.0%) | 111 (2.5%) |
| 5:00 AM to 5:29 AM | 279 (5.4%) | 80 (1.8%) |
| 5:30 AM to 5:59 AM | 414 (8.1%) | 270 (6.2%) |
| 6:00 AM to 6:29 AM | 589 (11.5%) | 318 (7.3%) |
| 6:30 AM to 6:59 AM | 586 (11.4%) | 332 (7.6%) |
| 7:00 AM to 7:29 AM | 526 (10.2%) | 750 (17.2%) |
| 7:30 AM to 7:59 AM | 431 (8.4%) | 653 (15.0%) |
| 8:00 AM to 8:29 AM | 437 (8.5%) | 536 (12.3%) |
| 8:30 AM to 8:59 AM | 139 (2.7%) | 111 (2.5%) |
| 9:00 AM to 9:59 AM | 166 (3.2%) | 189 (4.3%) |
| 10:00 AM to 10:59 AM | 191 (3.7%) | 197 (4.5%) |
| 11:00 AM to 11:59 AM | 82 (1.6%) | 200 (4.6%) |
| 12:00 PM to 3:59 PM | 516 (10.1%) | 269 (6.2%) |
| 4:00 PM to 11:59 PM | 259 (5.1%) | 344 (7.9%) |
| Total | 5,130 (100.0%) | 4,360 (100.0%) |
Housing Occupancy in Jo Daviess County
Occupancy by Ownership in Jo Daviess County
Of the total 10,074 dwellings in Jo Daviess County, owner-occupied units account for 8,045 (79.9%), while renter-occupied units make up 2,029 (20.1%).
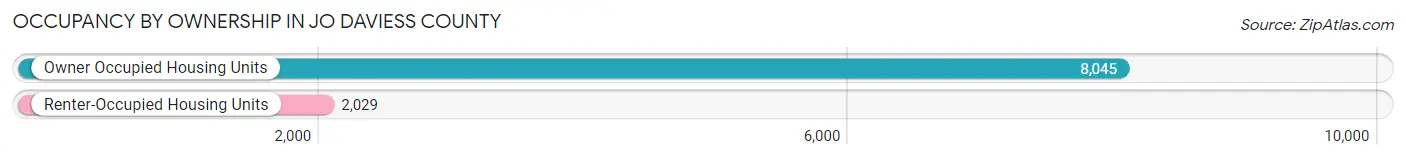
| Occupancy | # Housing Units | % Housing Units |
| Owner Occupied Housing Units | 8,045 | 79.9% |
| Renter-Occupied Housing Units | 2,029 | 20.1% |
| Total Occupied Housing Units | 10,074 | 100.0% |
Occupancy by Household Size in Jo Daviess County
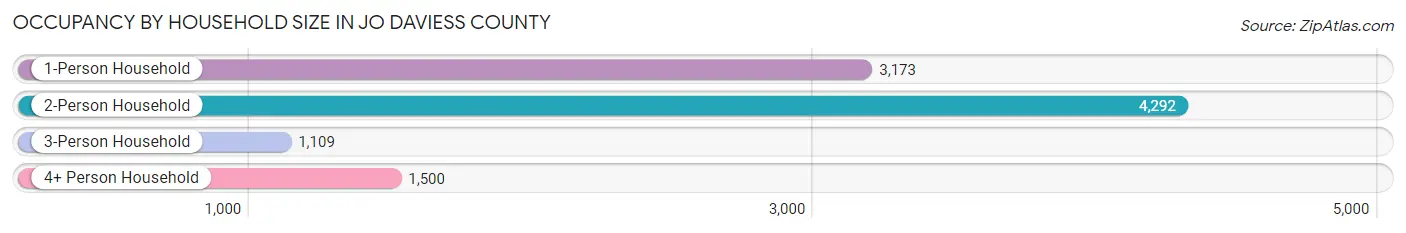
| Household Size | # Housing Units | % Housing Units |
| 1-Person Household | 3,173 | 31.5% |
| 2-Person Household | 4,292 | 42.6% |
| 3-Person Household | 1,109 | 11.0% |
| 4+ Person Household | 1,500 | 14.9% |
| Total Housing Units | 10,074 | 100.0% |
Occupancy by Ownership by Household Size in Jo Daviess County
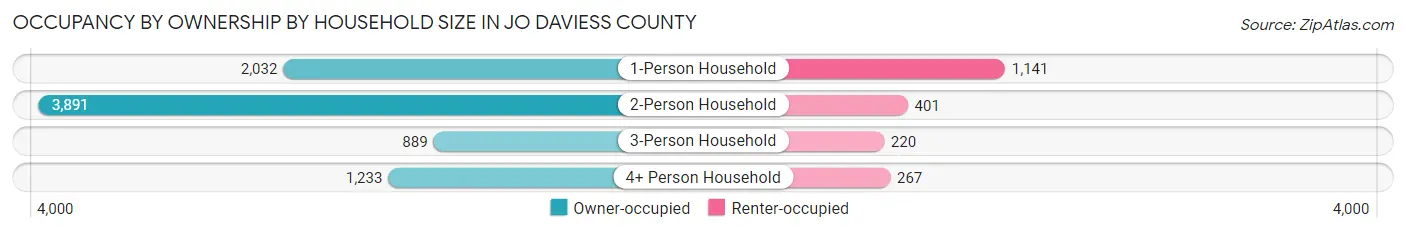
| Household Size | Owner-occupied | Renter-occupied |
| 1-Person Household | 2,032 (64.0%) | 1,141 (36.0%) |
| 2-Person Household | 3,891 (90.7%) | 401 (9.3%) |
| 3-Person Household | 889 (80.2%) | 220 (19.8%) |
| 4+ Person Household | 1,233 (82.2%) | 267 (17.8%) |
| Total Housing Units | 8,045 (79.9%) | 2,029 (20.1%) |
Occupancy by Educational Attainment in Jo Daviess County
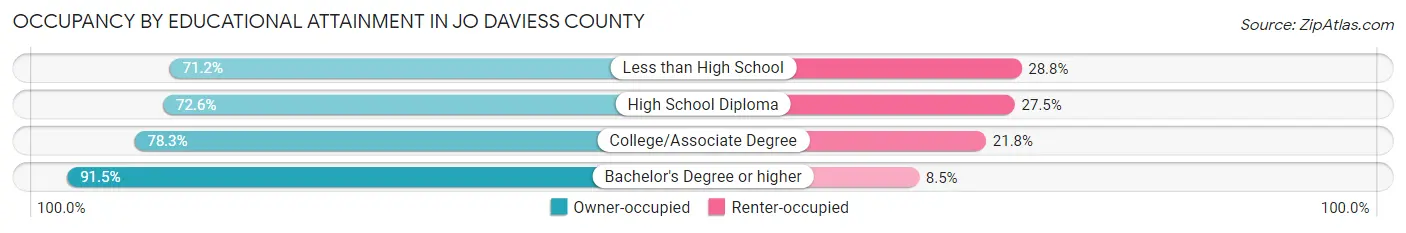
| Household Size | Owner-occupied | Renter-occupied |
| Less than High School | 411 (71.2%) | 166 (28.8%) |
| High School Diploma | 2,336 (72.6%) | 884 (27.5%) |
| College/Associate Degree | 2,637 (78.2%) | 733 (21.7%) |
| Bachelor's Degree or higher | 2,661 (91.5%) | 246 (8.5%) |
Occupancy by Age of Householder in Jo Daviess County
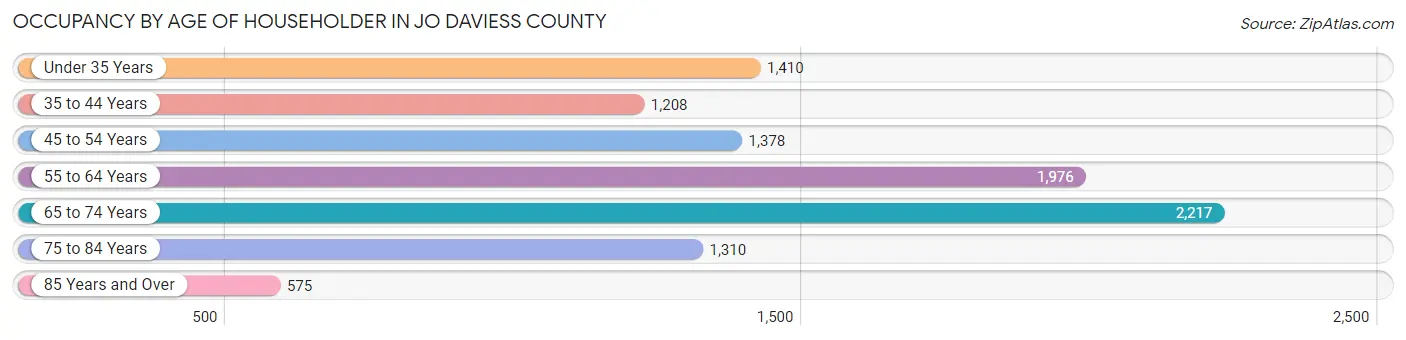
| Age Bracket | # Households | % Households |
| Under 35 Years | 1,410 | 14.0% |
| 35 to 44 Years | 1,208 | 12.0% |
| 45 to 54 Years | 1,378 | 13.7% |
| 55 to 64 Years | 1,976 | 19.6% |
| 65 to 74 Years | 2,217 | 22.0% |
| 75 to 84 Years | 1,310 | 13.0% |
| 85 Years and Over | 575 | 5.7% |
| Total | 10,074 | 100.0% |
Housing Finances in Jo Daviess County
Median Income by Occupancy in Jo Daviess County
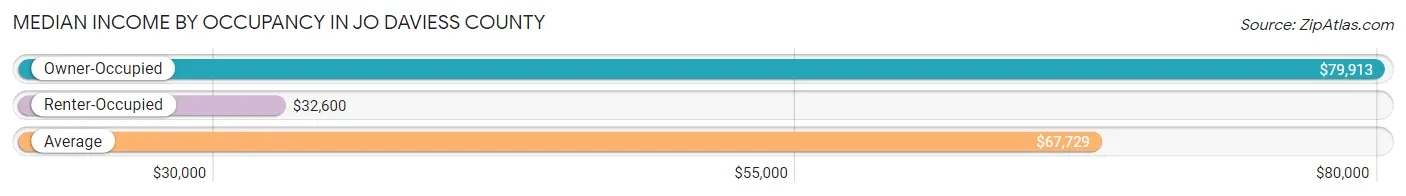
| Occupancy Type | # Households | Median Income |
| Owner-Occupied | 8,045 (79.9%) | $79,913 |
| Renter-Occupied | 2,029 (20.1%) | $32,600 |
| Average | 10,074 (100.0%) | $67,729 |
Occupancy by Householder Income Bracket in Jo Daviess County
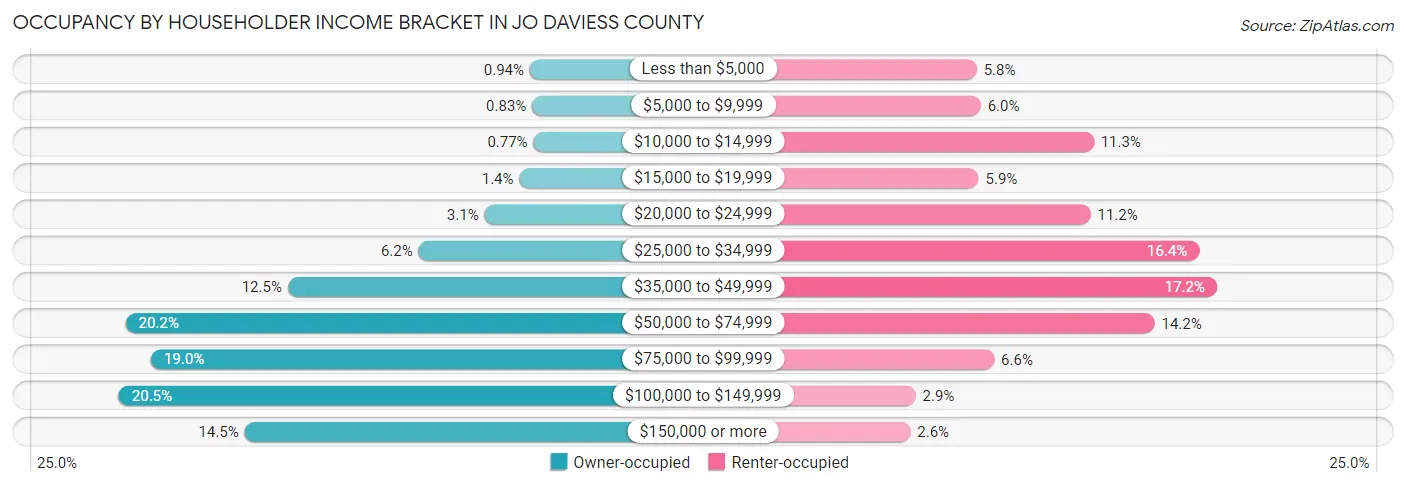
| Income Bracket | Owner-occupied | Renter-occupied |
| Less than $5,000 | 76 (0.9%) | 117 (5.8%) |
| $5,000 to $9,999 | 67 (0.8%) | 121 (6.0%) |
| $10,000 to $14,999 | 62 (0.8%) | 230 (11.3%) |
| $15,000 to $19,999 | 116 (1.4%) | 119 (5.9%) |
| $20,000 to $24,999 | 249 (3.1%) | 227 (11.2%) |
| $25,000 to $34,999 | 502 (6.2%) | 332 (16.4%) |
| $35,000 to $49,999 | 1,003 (12.5%) | 349 (17.2%) |
| $50,000 to $74,999 | 1,624 (20.2%) | 289 (14.2%) |
| $75,000 to $99,999 | 1,527 (19.0%) | 134 (6.6%) |
| $100,000 to $149,999 | 1,650 (20.5%) | 58 (2.9%) |
| $150,000 or more | 1,169 (14.5%) | 53 (2.6%) |
| Total | 8,045 (100.0%) | 2,029 (100.0%) |
Monthly Housing Cost Tiers in Jo Daviess County
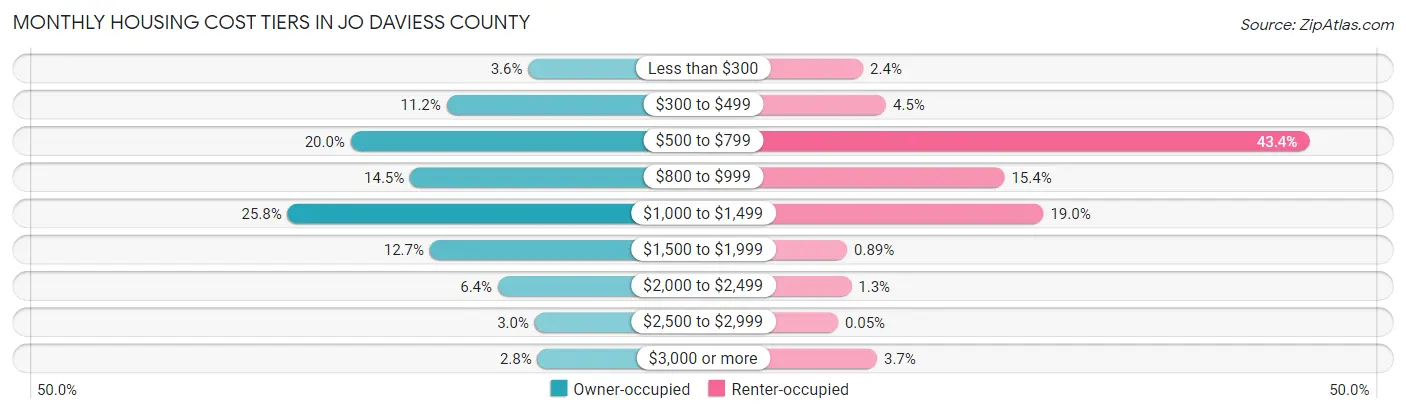
| Monthly Cost | Owner-occupied | Renter-occupied |
| Less than $300 | 292 (3.6%) | 48 (2.4%) |
| $300 to $499 | 897 (11.2%) | 91 (4.5%) |
| $500 to $799 | 1,607 (20.0%) | 881 (43.4%) |
| $800 to $999 | 1,167 (14.5%) | 312 (15.4%) |
| $1,000 to $1,499 | 2,075 (25.8%) | 385 (19.0%) |
| $1,500 to $1,999 | 1,022 (12.7%) | 18 (0.9%) |
| $2,000 to $2,499 | 517 (6.4%) | 26 (1.3%) |
| $2,500 to $2,999 | 244 (3.0%) | 1 (0.1%) |
| $3,000 or more | 224 (2.8%) | 74 (3.6%) |
| Total | 8,045 (100.0%) | 2,029 (100.0%) |
Physical Housing Characteristics in Jo Daviess County
Housing Structures in Jo Daviess County

| Structure Type | # Housing Units | % Housing Units |
| Single Unit, Detached | 8,519 | 84.6% |
| Single Unit, Attached | 252 | 2.5% |
| 2 Unit Apartments | 136 | 1.3% |
| 3 or 4 Unit Apartments | 404 | 4.0% |
| 5 to 9 Unit Apartments | 225 | 2.2% |
| 10 or more Apartments | 339 | 3.4% |
| Mobile Home / Other | 199 | 2.0% |
| Total | 10,074 | 100.0% |
Housing Structures by Occupancy in Jo Daviess County
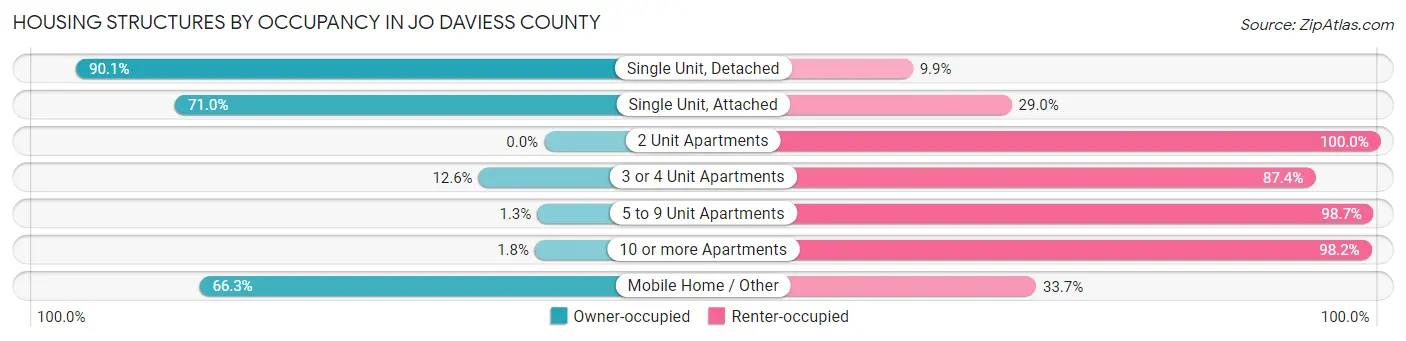
| Structure Type | Owner-occupied | Renter-occupied |
| Single Unit, Detached | 7,674 (90.1%) | 845 (9.9%) |
| Single Unit, Attached | 179 (71.0%) | 73 (29.0%) |
| 2 Unit Apartments | 0 (0.0%) | 136 (100.0%) |
| 3 or 4 Unit Apartments | 51 (12.6%) | 353 (87.4%) |
| 5 to 9 Unit Apartments | 3 (1.3%) | 222 (98.7%) |
| 10 or more Apartments | 6 (1.8%) | 333 (98.2%) |
| Mobile Home / Other | 132 (66.3%) | 67 (33.7%) |
| Total | 8,045 (79.9%) | 2,029 (20.1%) |
Housing Structures by Number of Rooms in Jo Daviess County
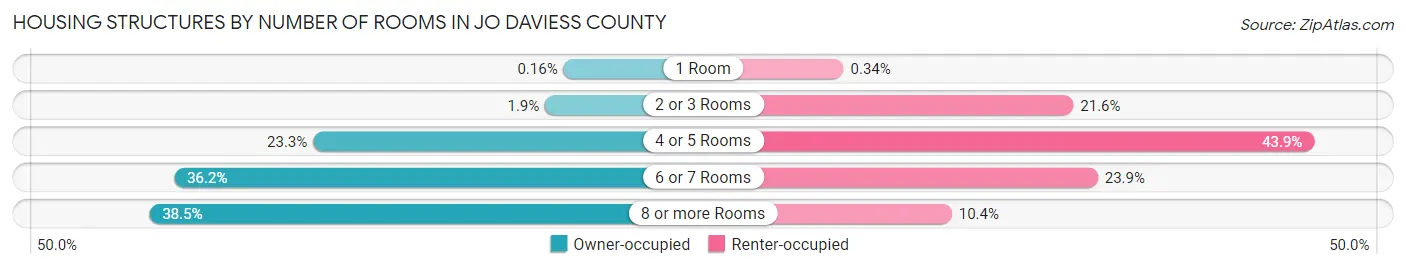
| Number of Rooms | Owner-occupied | Renter-occupied |
| 1 Room | 13 (0.2%) | 7 (0.3%) |
| 2 or 3 Rooms | 150 (1.9%) | 438 (21.6%) |
| 4 or 5 Rooms | 1,876 (23.3%) | 890 (43.9%) |
| 6 or 7 Rooms | 2,911 (36.2%) | 484 (23.8%) |
| 8 or more Rooms | 3,095 (38.5%) | 210 (10.3%) |
| Total | 8,045 (100.0%) | 2,029 (100.0%) |
Housing Structure by Heating Type in Jo Daviess County
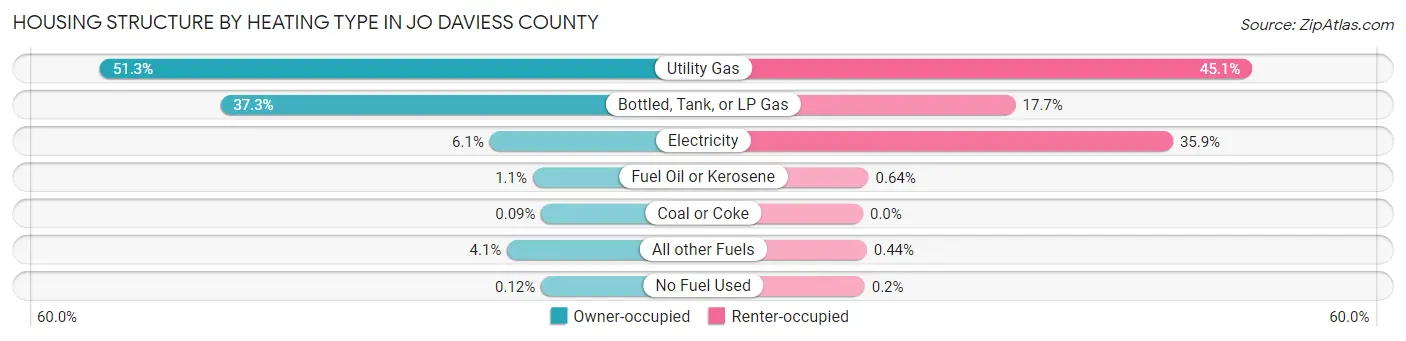
| Heating Type | Owner-occupied | Renter-occupied |
| Utility Gas | 4,125 (51.3%) | 915 (45.1%) |
| Bottled, Tank, or LP Gas | 3,002 (37.3%) | 359 (17.7%) |
| Electricity | 488 (6.1%) | 729 (35.9%) |
| Fuel Oil or Kerosene | 87 (1.1%) | 13 (0.6%) |
| Coal or Coke | 7 (0.1%) | 0 (0.0%) |
| All other Fuels | 326 (4.1%) | 9 (0.4%) |
| No Fuel Used | 10 (0.1%) | 4 (0.2%) |
| Total | 8,045 (100.0%) | 2,029 (100.0%) |
Household Vehicle Usage in Jo Daviess County
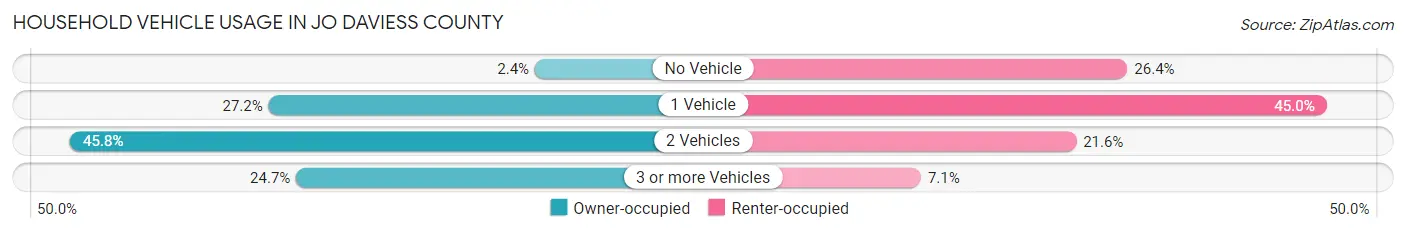
| Vehicles per Household | Owner-occupied | Renter-occupied |
| No Vehicle | 190 (2.4%) | 535 (26.4%) |
| 1 Vehicle | 2,191 (27.2%) | 912 (45.0%) |
| 2 Vehicles | 3,681 (45.8%) | 438 (21.6%) |
| 3 or more Vehicles | 1,983 (24.6%) | 144 (7.1%) |
| Total | 8,045 (100.0%) | 2,029 (100.0%) |
Real Estate & Mortgages in Jo Daviess County
Real Estate and Mortgage Overview in Jo Daviess County
| Characteristic | Without Mortgage | With Mortgage |
| Housing Units | 3,497 | 4,548 |
| Median Property Value | $176,000 | $181,600 |
| Median Household Income | $75,159 | $832 |
| Monthly Housing Costs | $627 | $224 |
| Real Estate Taxes | $3,267 | $35 |
Property Value by Mortgage Status in Jo Daviess County
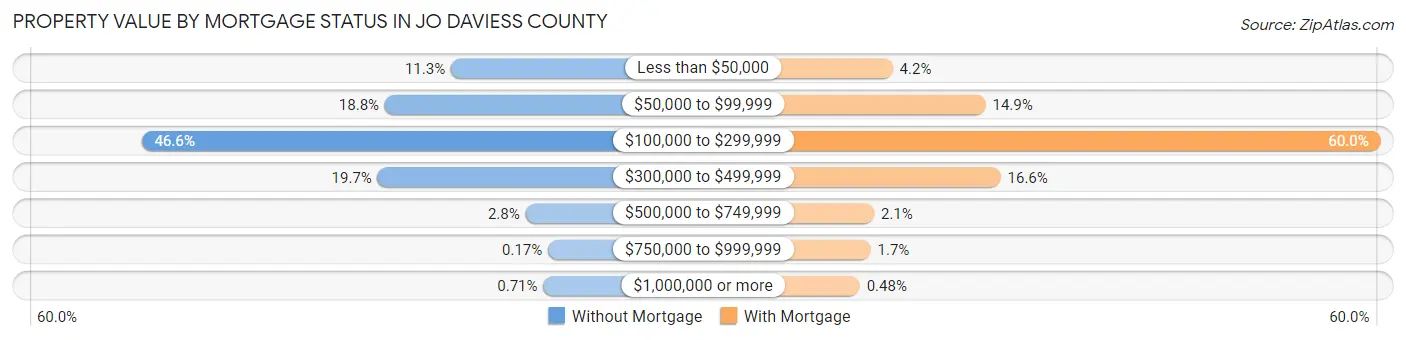
| Property Value | Without Mortgage | With Mortgage |
| Less than $50,000 | 394 (11.3%) | 193 (4.2%) |
| $50,000 to $99,999 | 658 (18.8%) | 676 (14.9%) |
| $100,000 to $299,999 | 1,631 (46.6%) | 2,729 (60.0%) |
| $300,000 to $499,999 | 687 (19.7%) | 754 (16.6%) |
| $500,000 to $749,999 | 96 (2.8%) | 96 (2.1%) |
| $750,000 to $999,999 | 6 (0.2%) | 78 (1.7%) |
| $1,000,000 or more | 25 (0.7%) | 22 (0.5%) |
| Total | 3,497 (100.0%) | 4,548 (100.0%) |
Household Income by Mortgage Status in Jo Daviess County
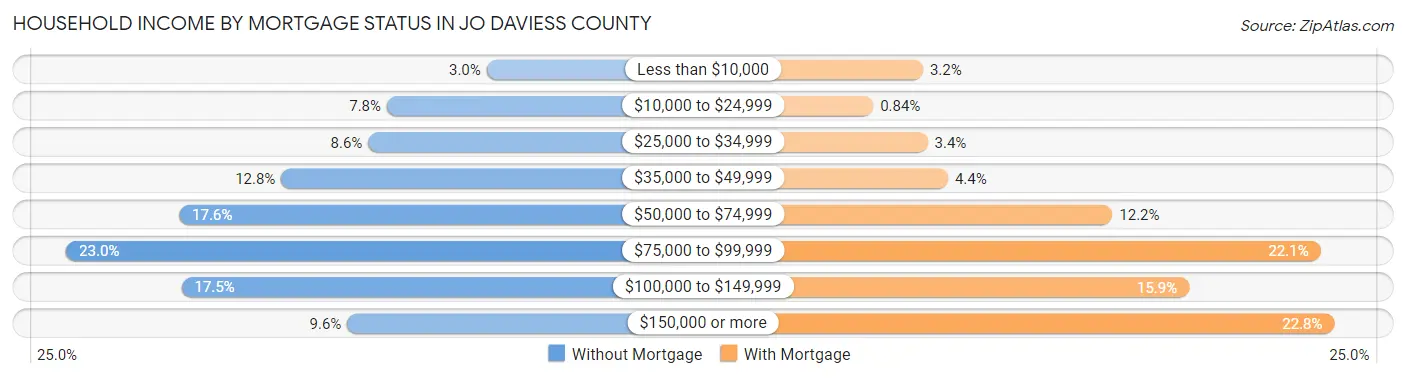
| Household Income | Without Mortgage | With Mortgage |
| Less than $10,000 | 105 (3.0%) | 146 (3.2%) |
| $10,000 to $24,999 | 271 (7.7%) | 38 (0.8%) |
| $25,000 to $34,999 | 302 (8.6%) | 156 (3.4%) |
| $35,000 to $49,999 | 447 (12.8%) | 200 (4.4%) |
| $50,000 to $74,999 | 617 (17.6%) | 556 (12.2%) |
| $75,000 to $99,999 | 805 (23.0%) | 1,007 (22.1%) |
| $100,000 to $149,999 | 613 (17.5%) | 722 (15.9%) |
| $150,000 or more | 337 (9.6%) | 1,037 (22.8%) |
| Total | 3,497 (100.0%) | 4,548 (100.0%) |
Property Value to Household Income Ratio in Jo Daviess County
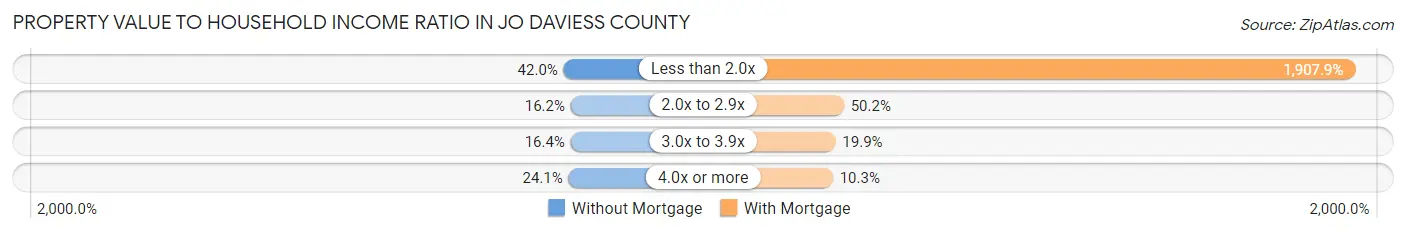
| Value-to-Income Ratio | Without Mortgage | With Mortgage |
| Less than 2.0x | 1,469 (42.0%) | 86,770 (1,907.9%) |
| 2.0x to 2.9x | 565 (16.2%) | 2,282 (50.2%) |
| 3.0x to 3.9x | 575 (16.4%) | 905 (19.9%) |
| 4.0x or more | 844 (24.1%) | 466 (10.2%) |
| Total | 3,497 (100.0%) | 4,548 (100.0%) |
Real Estate Taxes by Mortgage Status in Jo Daviess County
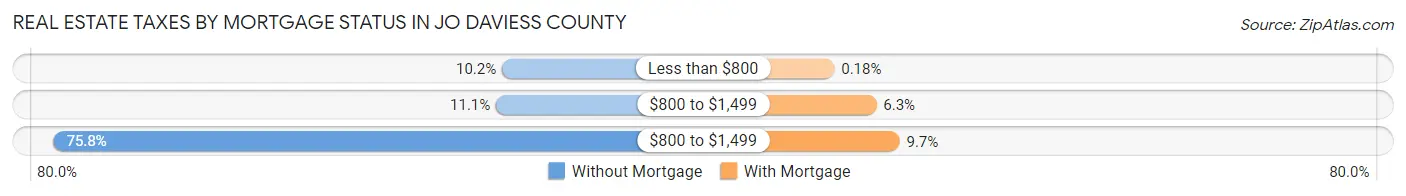
| Property Taxes | Without Mortgage | With Mortgage |
| Less than $800 | 358 (10.2%) | 8 (0.2%) |
| $800 to $1,499 | 388 (11.1%) | 288 (6.3%) |
| $800 to $1,499 | 2,650 (75.8%) | 442 (9.7%) |
| Total | 3,497 (100.0%) | 4,548 (100.0%) |
Health & Disability in Jo Daviess County
Health Insurance Coverage by Age in Jo Daviess County
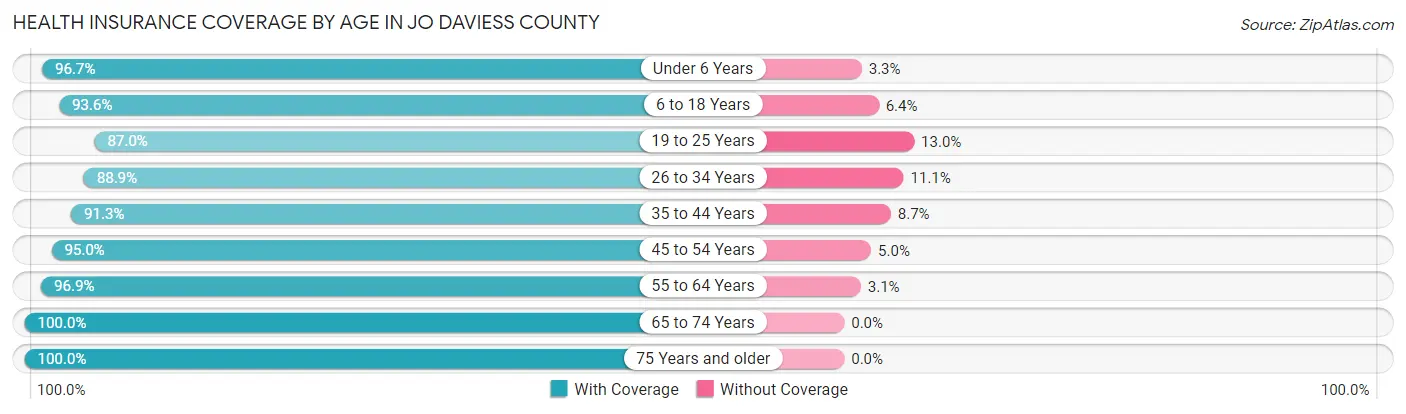
| Age Bracket | With Coverage | Without Coverage |
| Under 6 Years | 1,158 (96.7%) | 39 (3.3%) |
| 6 to 18 Years | 2,870 (93.6%) | 197 (6.4%) |
| 19 to 25 Years | 1,235 (87.0%) | 185 (13.0%) |
| 26 to 34 Years | 1,464 (88.9%) | 182 (11.1%) |
| 35 to 44 Years | 2,062 (91.3%) | 196 (8.7%) |
| 45 to 54 Years | 2,369 (95.0%) | 125 (5.0%) |
| 55 to 64 Years | 3,324 (96.9%) | 106 (3.1%) |
| 65 to 74 Years | 3,645 (100.0%) | 0 (0.0%) |
| 75 Years and older | 2,619 (100.0%) | 0 (0.0%) |
| Total | 20,746 (95.3%) | 1,030 (4.7%) |
Health Insurance Coverage by Citizenship Status in Jo Daviess County
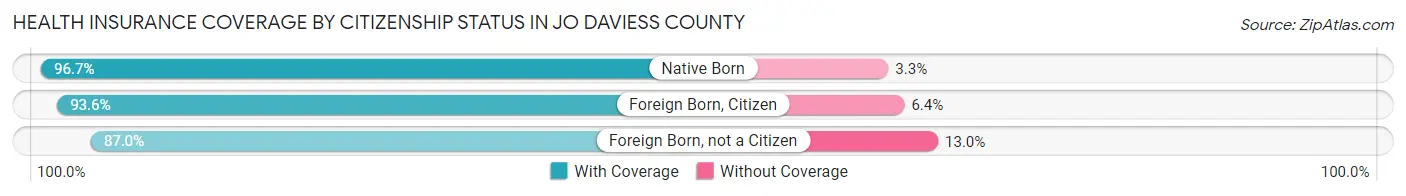
| Citizenship Status | With Coverage | Without Coverage |
| Native Born | 1,158 (96.7%) | 39 (3.3%) |
| Foreign Born, Citizen | 2,870 (93.6%) | 197 (6.4%) |
| Foreign Born, not a Citizen | 1,235 (87.0%) | 185 (13.0%) |
Health Insurance Coverage by Household Income in Jo Daviess County
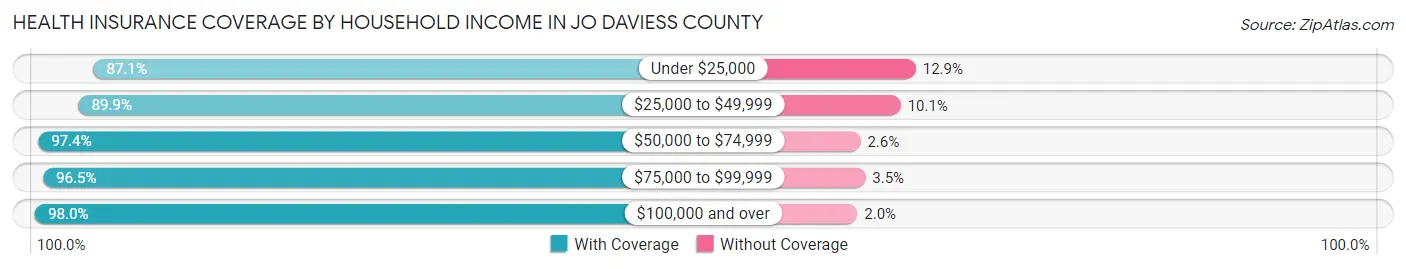
| Household Income | With Coverage | Without Coverage |
| Under $25,000 | 1,757 (87.1%) | 261 (12.9%) |
| $25,000 to $49,999 | 3,284 (89.9%) | 369 (10.1%) |
| $50,000 to $74,999 | 3,955 (97.4%) | 104 (2.6%) |
| $75,000 to $99,999 | 3,640 (96.5%) | 131 (3.5%) |
| $100,000 and over | 8,061 (98.0%) | 163 (2.0%) |
Public vs Private Health Insurance Coverage by Age in Jo Daviess County
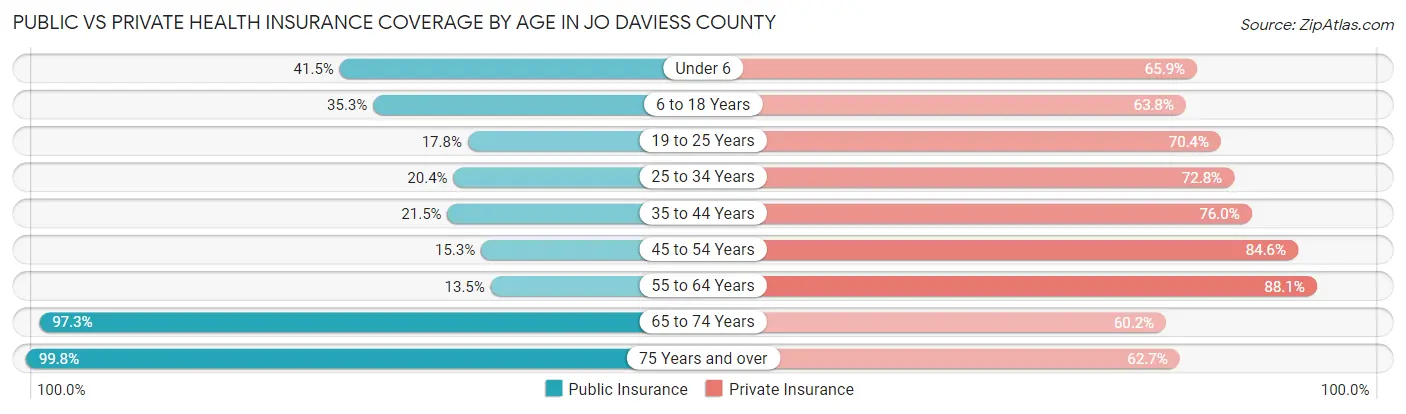
| Age Bracket | Public Insurance | Private Insurance |
| Under 6 | 497 (41.5%) | 789 (65.9%) |
| 6 to 18 Years | 1,083 (35.3%) | 1,958 (63.8%) |
| 19 to 25 Years | 252 (17.7%) | 999 (70.4%) |
| 25 to 34 Years | 336 (20.4%) | 1,198 (72.8%) |
| 35 to 44 Years | 486 (21.5%) | 1,717 (76.0%) |
| 45 to 54 Years | 381 (15.3%) | 2,111 (84.6%) |
| 55 to 64 Years | 463 (13.5%) | 3,023 (88.1%) |
| 65 to 74 Years | 3,546 (97.3%) | 2,193 (60.2%) |
| 75 Years and over | 2,613 (99.8%) | 1,642 (62.7%) |
| Total | 9,657 (44.4%) | 15,630 (71.8%) |
Disability Status by Sex by Age in Jo Daviess County
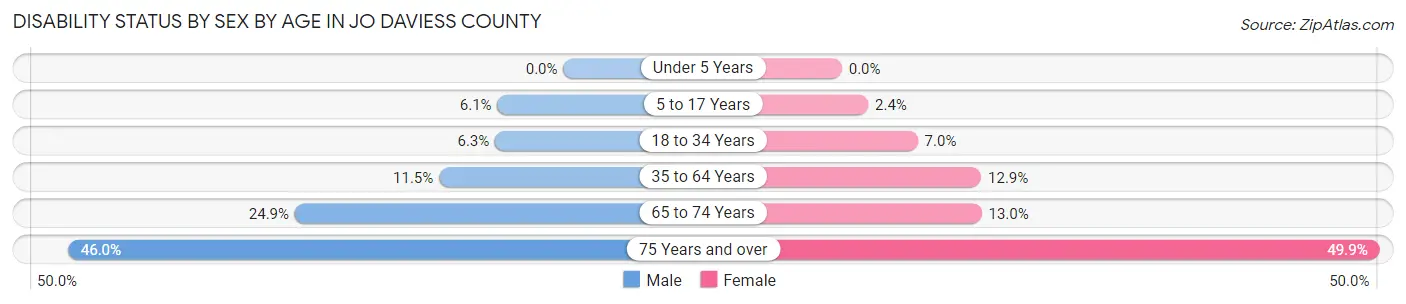
| Age Bracket | Male | Female |
| Under 5 Years | 0 (0.0%) | 0 (0.0%) |
| 5 to 17 Years | 100 (6.1%) | 37 (2.4%) |
| 18 to 34 Years | 109 (6.3%) | 109 (7.0%) |
| 35 to 64 Years | 478 (11.5%) | 522 (12.9%) |
| 65 to 74 Years | 451 (24.9%) | 238 (13.0%) |
| 75 Years and over | 538 (46.0%) | 723 (49.9%) |
Disability Class by Sex by Age in Jo Daviess County
Disability Class: Hearing Difficulty
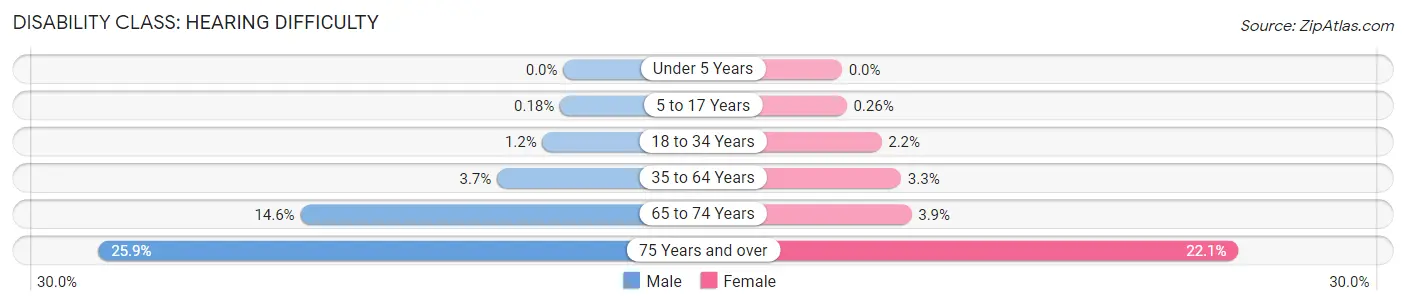
| Age Bracket | Male | Female |
| Under 5 Years | 0 (0.0%) | 0 (0.0%) |
| 5 to 17 Years | 3 (0.2%) | 4 (0.3%) |
| 18 to 34 Years | 20 (1.2%) | 34 (2.2%) |
| 35 to 64 Years | 153 (3.7%) | 133 (3.3%) |
| 65 to 74 Years | 265 (14.6%) | 71 (3.9%) |
| 75 Years and over | 303 (25.9%) | 320 (22.1%) |
Disability Class: Vision Difficulty
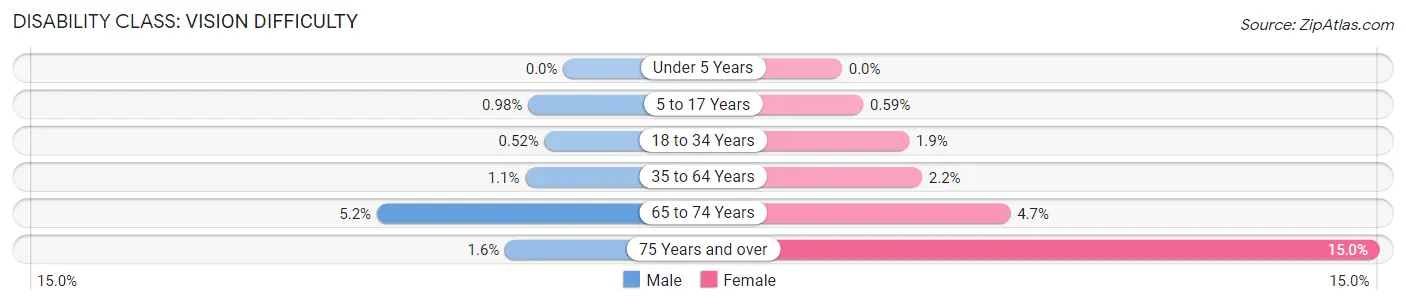
| Age Bracket | Male | Female |
| Under 5 Years | 0 (0.0%) | 0 (0.0%) |
| 5 to 17 Years | 16 (1.0%) | 9 (0.6%) |
| 18 to 34 Years | 9 (0.5%) | 29 (1.9%) |
| 35 to 64 Years | 44 (1.1%) | 90 (2.2%) |
| 65 to 74 Years | 94 (5.2%) | 86 (4.7%) |
| 75 Years and over | 19 (1.6%) | 217 (15.0%) |
Disability Class: Cognitive Difficulty
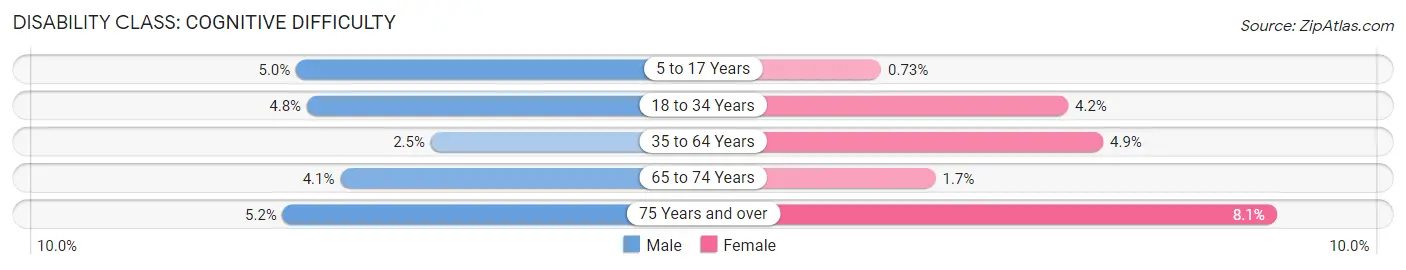
| Age Bracket | Male | Female |
| 5 to 17 Years | 81 (5.0%) | 11 (0.7%) |
| 18 to 34 Years | 82 (4.8%) | 65 (4.2%) |
| 35 to 64 Years | 102 (2.5%) | 196 (4.9%) |
| 65 to 74 Years | 75 (4.1%) | 32 (1.7%) |
| 75 Years and over | 61 (5.2%) | 117 (8.1%) |
Disability Class: Ambulatory Difficulty
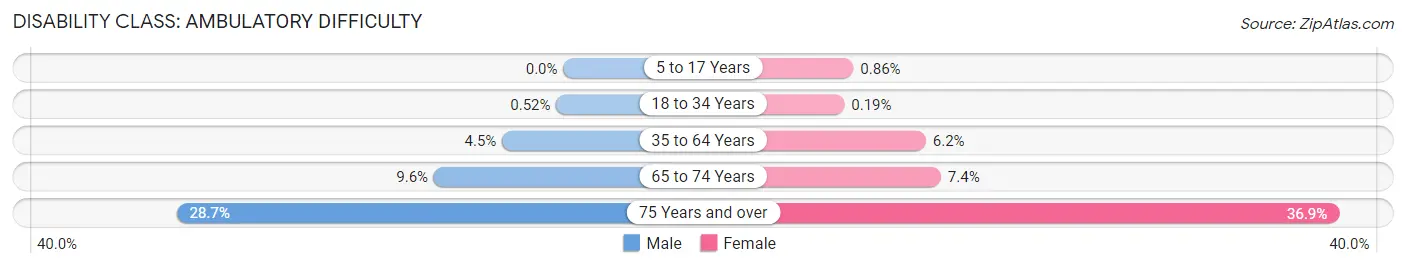
| Age Bracket | Male | Female |
| 5 to 17 Years | 0 (0.0%) | 13 (0.9%) |
| 18 to 34 Years | 9 (0.5%) | 3 (0.2%) |
| 35 to 64 Years | 188 (4.5%) | 252 (6.2%) |
| 65 to 74 Years | 174 (9.6%) | 135 (7.4%) |
| 75 Years and over | 336 (28.7%) | 535 (36.9%) |
Disability Class: Self-Care Difficulty
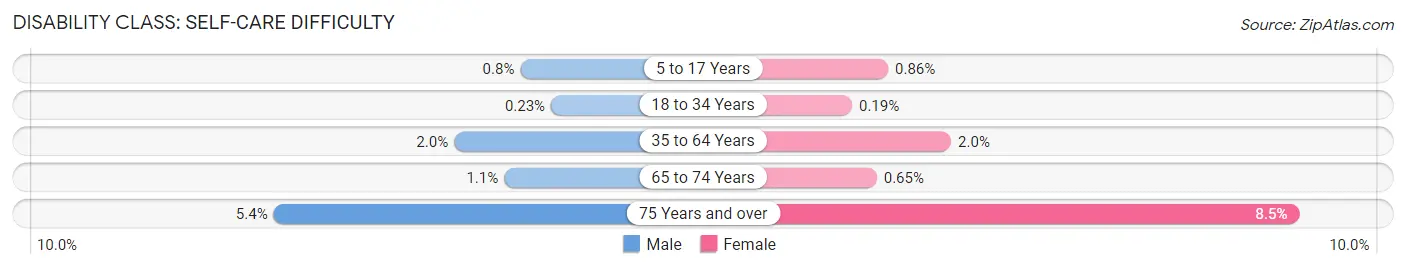
| Age Bracket | Male | Female |
| 5 to 17 Years | 13 (0.8%) | 13 (0.9%) |
| 18 to 34 Years | 4 (0.2%) | 3 (0.2%) |
| 35 to 64 Years | 84 (2.0%) | 82 (2.0%) |
| 65 to 74 Years | 20 (1.1%) | 12 (0.6%) |
| 75 Years and over | 63 (5.4%) | 123 (8.5%) |
Technology Access in Jo Daviess County
Computing Device Access in Jo Daviess County
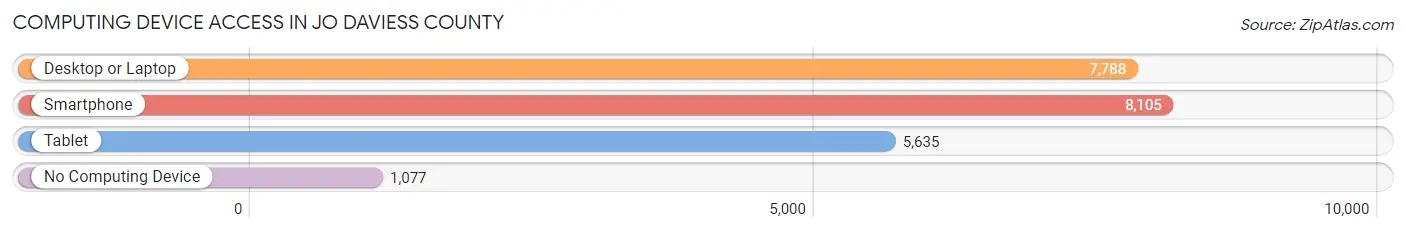
| Device Type | # Households | % Households |
| Desktop or Laptop | 7,788 | 77.3% |
| Smartphone | 8,105 | 80.4% |
| Tablet | 5,635 | 55.9% |
| No Computing Device | 1,077 | 10.7% |
| Total | 10,074 | 100.0% |
Internet Access in Jo Daviess County
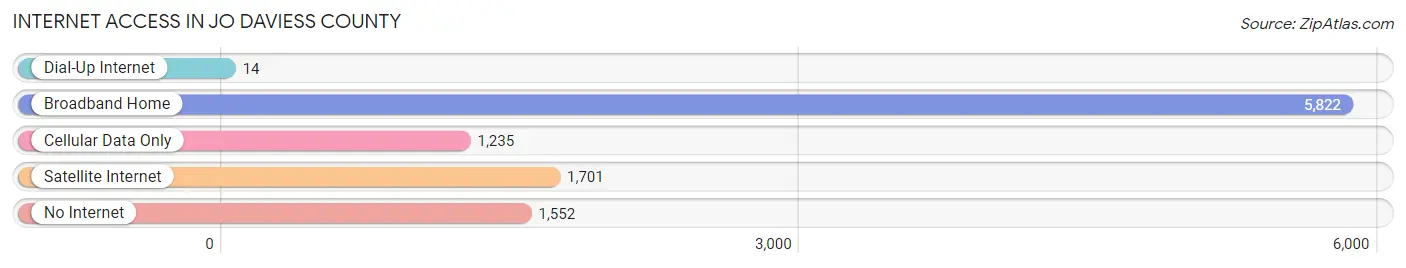
| Internet Type | # Households | % Households |
| Dial-Up Internet | 14 | 0.1% |
| Broadband Home | 5,822 | 57.8% |
| Cellular Data Only | 1,235 | 12.3% |
| Satellite Internet | 1,701 | 16.9% |
| No Internet | 1,552 | 15.4% |
| Total | 10,074 | 100.0% |
Jo Daviess County Summary
Daviess County, Illinois is located in the northwest corner of the state, bordered by Wisconsin to the north and Iowa to the west. It is part of the Galena-Jo Daviess County Metropolitan Statistical Area, which includes all of Jo Daviess County and parts of Carroll, Stephenson, and Winnebago counties. The county seat is Galena, and the largest city is East Dubuque.
History
Jo Daviess County was formed in 1827 from part of Henry County. It was named for Major General Joseph Hamilton Daveiss, a Kentucky lawyer and soldier who was killed in the Battle of Tippecanoe in 1811. The county was originally part of the Northwest Territory, and was later part of the Illinois Territory.
The first settlers in the area were French fur traders, who established trading posts in the area in the late 1700s. The first permanent settlers arrived in the early 1800s, and the county was officially organized in 1827.
The county was an important center of lead mining in the 19th century, and the city of Galena was a major port for the shipment of lead ore. The county was also an important center of agriculture, with many farms producing corn, wheat, and other crops.
Geography
Jo Daviess County covers an area of 845 square miles, making it the fourth-largest county in Illinois. It is located in the northwest corner of the state, bordered by Wisconsin to the north and Iowa to the west. The county is mostly rural, with rolling hills and valleys. The highest point in the county is Apple River Bluff, which has an elevation of 1,068 feet.
The county is drained by the Apple River, which flows through the center of the county. Other major rivers in the county include the Galena, the Pecatonica, and the Fever. The county also contains several lakes, including Lake Galena, Lake Le-Aqua-Na, and Lake Carroll.
Economy
The economy of Jo Daviess County is largely based on agriculture and tourism. The county is home to several wineries, and the city of Galena is a popular tourist destination. The county is also home to several manufacturing companies, including a paper mill in East Dubuque and a steel mill in Galena.
The county is also home to several state parks, including Apple River Canyon State Park, Hennepin Canal Parkway State Park, and White Pines Forest State Park. These parks attract visitors from all over the state and beyond.
Demographics
As of the 2010 census, Jo Daviess County had a population of 22,678. The racial makeup of the county was 97.2% White, 0.5% African American, 0.3% Native American, 0.4% Asian, 0.1% Pacific Islander, 0.7% from other races, and 0.8% from two or more races. Hispanic or Latino of any race were 2.2% of the population.
The median income for a household in the county was $45,945, and the median income for a family was $54,945. The per capita income for the county was $24,845. About 8.2% of families and 11.2% of the population were below the poverty line, including 15.2% of those under age 18 and 6.7% of those age 65 or over.
Common Questions
What is Per Capita Income in Jo Daviess County?
Per Capita income in Jo Daviess County is $39,477.
What is the Median Family Income in Jo Daviess County?
Median Family Income in Jo Daviess County is $86,871.
What is the Median Household income in Jo Daviess County?
Median Household Income in Jo Daviess County is $67,729.
What is Income or Wage Gap in Jo Daviess County?
Income or Wage Gap in Jo Daviess County is 24.6%.
Women in Jo Daviess County earn 75.4 cents for every dollar earned by a man.
What is Family Income Deficit in Jo Daviess County?
Family Income Deficit in Jo Daviess County is $10,763.
Families that are below poverty line in Jo Daviess County earn $10,763 less on average than the poverty threshold level.
What is Inequality or Gini Index in Jo Daviess County?
Inequality or Gini Index in Jo Daviess County is 0.42.
What is the Total Population of Jo Daviess County?
Total Population of Jo Daviess County is 21,942.
What is the Total Male Population of Jo Daviess County?
Total Male Population of Jo Daviess County is 11,058.
What is the Total Female Population of Jo Daviess County?
Total Female Population of Jo Daviess County is 10,884.
What is the Ratio of Males per 100 Females in Jo Daviess County?
There are 101.60 Males per 100 Females in Jo Daviess County.
What is the Ratio of Females per 100 Males in Jo Daviess County?
There are 98.43 Females per 100 Males in Jo Daviess County.
What is the Median Population Age in Jo Daviess County?
Median Population Age in Jo Daviess County is 50.8 Years.
What is the Average Family Size in Jo Daviess County
Average Family Size in Jo Daviess County is 2.7 People.
What is the Average Household Size in Jo Daviess County
Average Household Size in Jo Daviess County is 2.2 People.
How Large is the Labor Force in Jo Daviess County?
There are 11,148 People in the Labor Forcein in Jo Daviess County.
What is the Percentage of People in the Labor Force in Jo Daviess County?
60.9% of People are in the Labor Force in Jo Daviess County.
What is the Unemployment Rate in Jo Daviess County?
Unemployment Rate in Jo Daviess County is 2.7%.