Jasper County, IL Map & Demographics
Jasper County Map
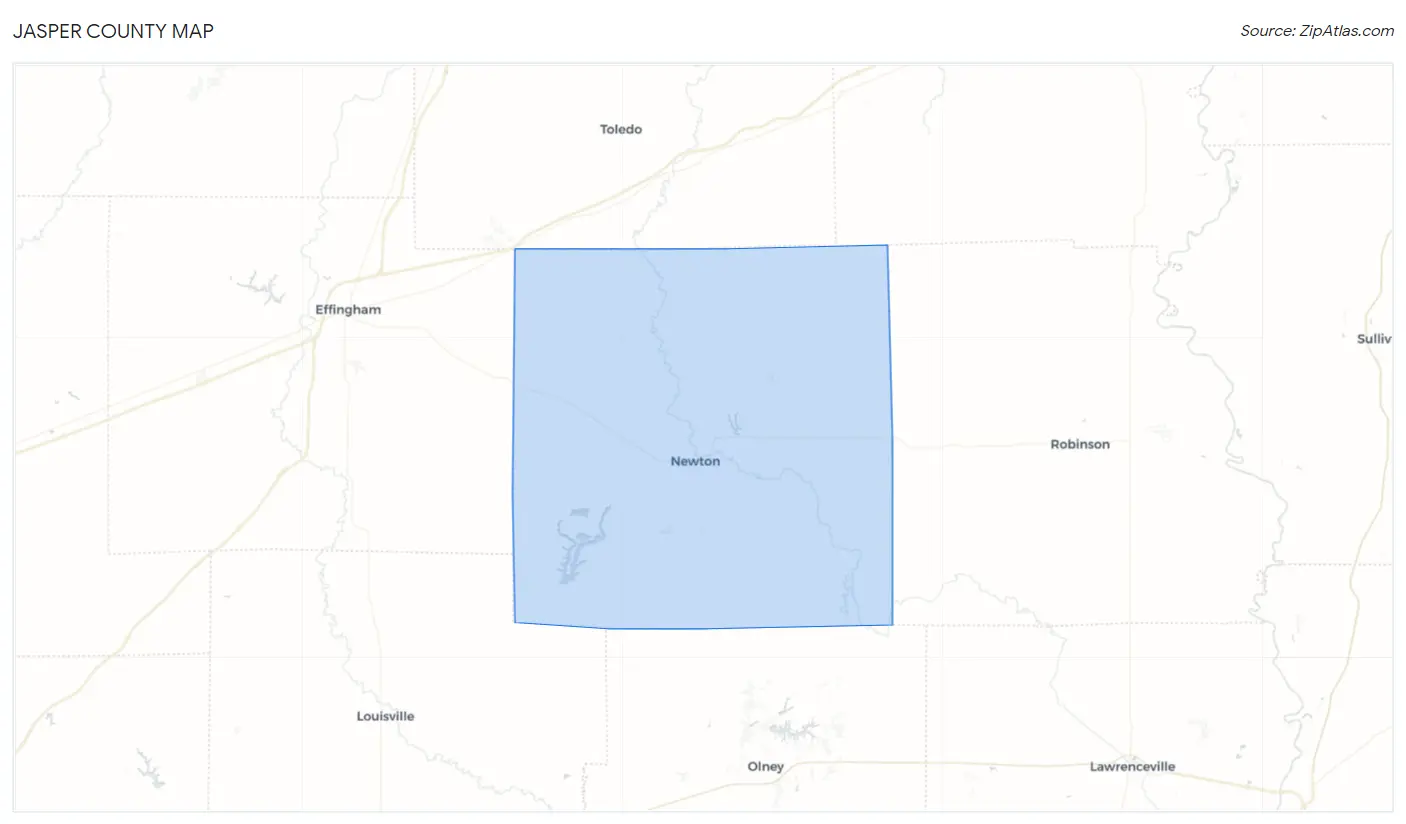
Jasper County Overview
$33,353
PER CAPITA INCOME
$79,933
AVG FAMILY INCOME
$67,429
AVG HOUSEHOLD INCOME
50.9%
WAGE / INCOME GAP [ % ]
49.1¢/ $1
WAGE / INCOME GAP [ $ ]
0.40
INEQUALITY / GINI INDEX
9,295
TOTAL POPULATION
4,713
MALE POPULATION
4,582
FEMALE POPULATION
102.86
MALES / 100 FEMALES
97.22
FEMALES / 100 MALES
44.0
MEDIAN AGE
3.0
AVG FAMILY SIZE
2.5
AVG HOUSEHOLD SIZE
4,866
LABOR FORCE [ PEOPLE ]
65.3%
PERCENT IN LABOR FORCE
4.9%
UNEMPLOYMENT RATE
Income in Jasper County
Income Overview in Jasper County
Per Capita Income in Jasper County is $33,353, while median incomes of families and households are $79,933 and $67,429 respectively.
| Characteristic | Number | Measure |
| Per Capita Income | 9,295 | $33,353 |
| Median Family Income | 2,551 | $79,933 |
| Mean Family Income | 2,551 | $97,022 |
| Median Household Income | 3,710 | $67,429 |
| Mean Household Income | 3,710 | $82,197 |
| Income Deficit | 2,551 | $0 |
| Wage / Income Gap (%) | 9,295 | 50.90% |
| Wage / Income Gap ($) | 9,295 | 49.10¢ per $1 |
| Gini / Inequality Index | 9,295 | 0.40 |
Earnings by Sex in Jasper County
Average Earnings in Jasper County are $38,125, $50,872 for men and $24,977 for women, a difference of 50.9%.
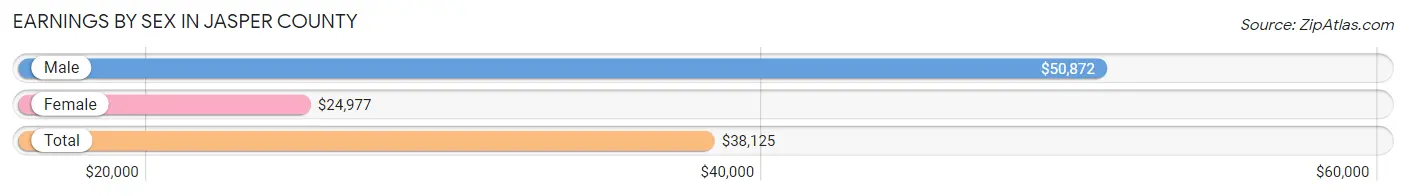
| Sex | Number | Average Earnings |
| Male | 2,822 (55.5%) | $50,872 |
| Female | 2,260 (44.5%) | $24,977 |
| Total | 5,082 (100.0%) | $38,125 |
Earnings by Sex by Income Bracket in Jasper County
The most common earnings brackets in Jasper County are $100,000+ for men (470 | 16.7%) and $40,000 to $44,999 for women (184 | 8.1%).
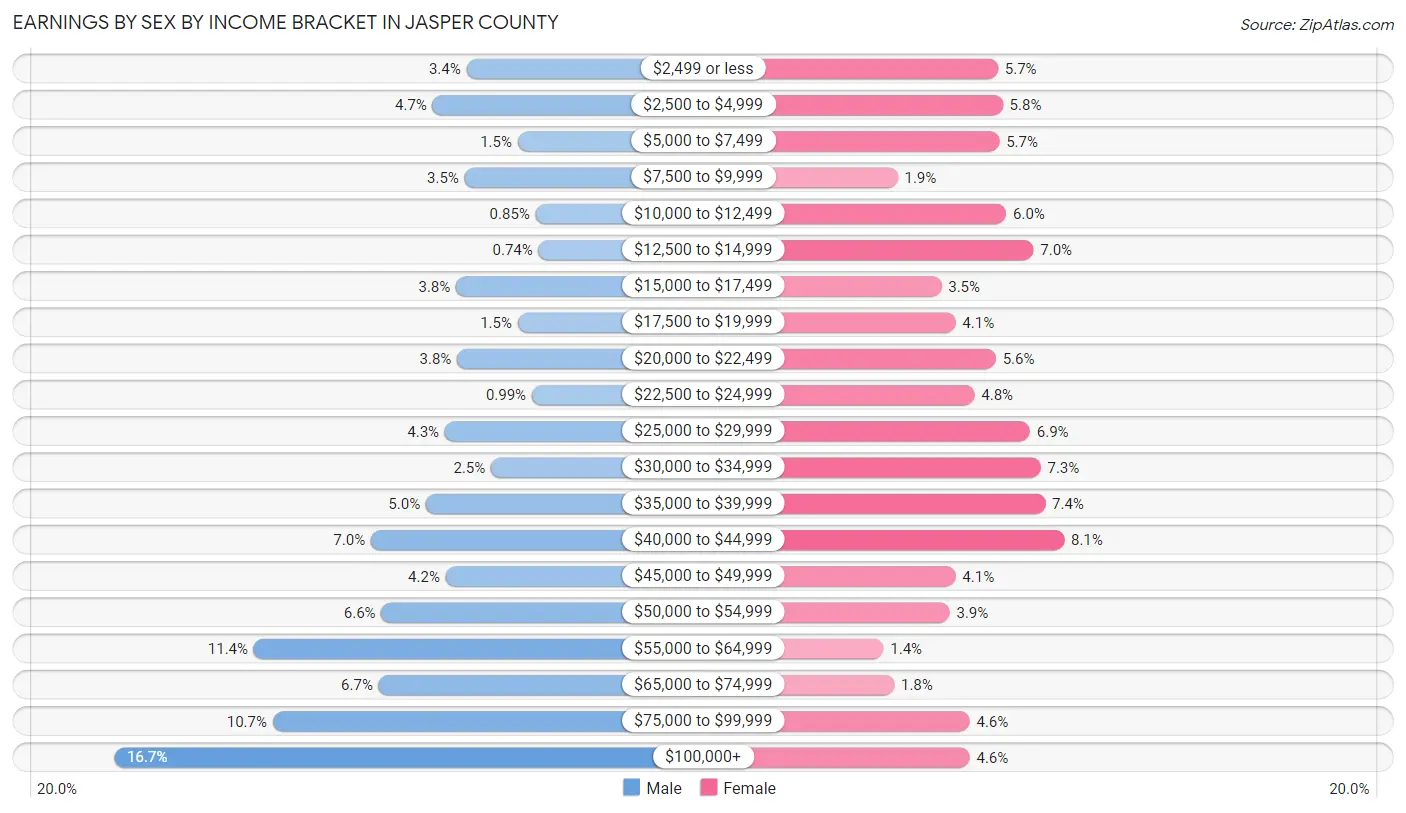
| Income | Male | Female |
| $2,499 or less | 97 (3.4%) | 128 (5.7%) |
| $2,500 to $4,999 | 133 (4.7%) | 132 (5.8%) |
| $5,000 to $7,499 | 43 (1.5%) | 129 (5.7%) |
| $7,500 to $9,999 | 99 (3.5%) | 43 (1.9%) |
| $10,000 to $12,499 | 24 (0.9%) | 135 (6.0%) |
| $12,500 to $14,999 | 21 (0.7%) | 158 (7.0%) |
| $15,000 to $17,499 | 108 (3.8%) | 80 (3.5%) |
| $17,500 to $19,999 | 43 (1.5%) | 92 (4.1%) |
| $20,000 to $22,499 | 107 (3.8%) | 126 (5.6%) |
| $22,500 to $24,999 | 28 (1.0%) | 108 (4.8%) |
| $25,000 to $29,999 | 120 (4.3%) | 155 (6.9%) |
| $30,000 to $34,999 | 71 (2.5%) | 164 (7.3%) |
| $35,000 to $39,999 | 140 (5.0%) | 168 (7.4%) |
| $40,000 to $44,999 | 198 (7.0%) | 184 (8.1%) |
| $45,000 to $49,999 | 119 (4.2%) | 92 (4.1%) |
| $50,000 to $54,999 | 187 (6.6%) | 87 (3.8%) |
| $55,000 to $64,999 | 322 (11.4%) | 31 (1.4%) |
| $65,000 to $74,999 | 190 (6.7%) | 40 (1.8%) |
| $75,000 to $99,999 | 302 (10.7%) | 104 (4.6%) |
| $100,000+ | 470 (16.7%) | 104 (4.6%) |
| Total | 2,822 (100.0%) | 2,260 (100.0%) |
Earnings by Sex by Educational Attainment in Jasper County
Average earnings in Jasper County are $56,332 for men and $30,596 for women, a difference of 45.7%. Men with an educational attainment of graduate degree enjoy the highest average annual earnings of $143,346, while those with high school diploma education earn the least with $45,147. Women with an educational attainment of graduate degree earn the most with the average annual earnings of $46,012, while those with high school diploma education have the smallest earnings of $23,245.
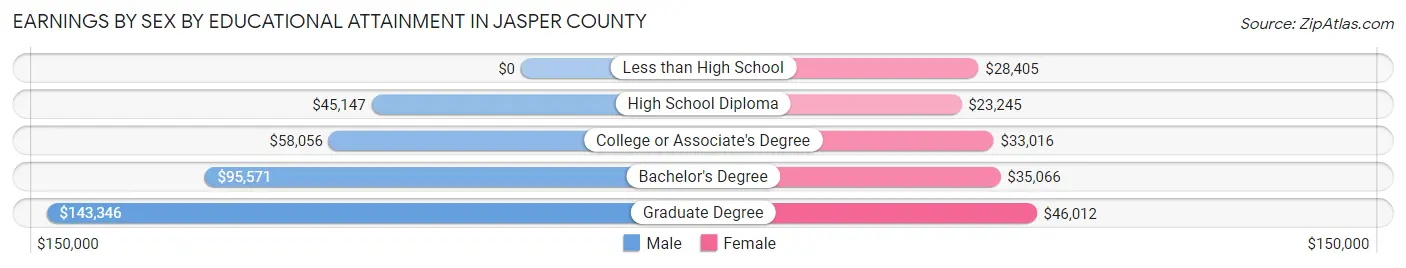
| Educational Attainment | Male Income | Female Income |
| Less than High School | - | - |
| High School Diploma | $45,147 | $23,245 |
| College or Associate's Degree | $58,056 | $33,016 |
| Bachelor's Degree | $95,571 | $35,066 |
| Graduate Degree | $143,346 | $46,012 |
| Total | $56,332 | $30,596 |
Family Income in Jasper County
Family Income Brackets in Jasper County
According to the Jasper County family income data, there are 630 families falling into the $100,000 to $149,999 income range, which is the most common income bracket and makes up 24.7% of all families. Conversely, the less than $10,000 income bracket is the least frequent group with only 41 families (1.6%) belonging to this category.
| Income Bracket | # Families | % Families |
| Less than $10,000 | 41 | 1.6% |
| $10,000 to $14,999 | 87 | 3.4% |
| $15,000 to $24,999 | 87 | 3.4% |
| $25,000 to $34,999 | 89 | 3.5% |
| $35,000 to $49,999 | 360 | 14.1% |
| $50,000 to $74,999 | 503 | 19.7% |
| $75,000 to $99,999 | 327 | 12.8% |
| $100,000 to $149,999 | 630 | 24.7% |
| $150,000 to $199,999 | 316 | 12.4% |
| $200,000+ | 115 | 4.5% |
Family Income by Famaliy Size in Jasper County
5-person families (220 | 8.6%) account for the highest median family income in Jasper County with $130,556 per family, while 3-person families (515 | 20.2%) have the highest median income of $37,396 per family member.
| Income Bracket | # Families | Median Income |
| 2-Person Families | 1,265 (49.6%) | $70,313 |
| 3-Person Families | 515 (20.2%) | $112,188 |
| 4-Person Families | 439 (17.2%) | $99,875 |
| 5-Person Families | 220 (8.6%) | $130,556 |
| 6-Person Families | 70 (2.7%) | $106,563 |
| 7+ Person Families | 42 (1.7%) | $0 |
| Total | 2,551 (100.0%) | $79,933 |
Family Income by Number of Earners in Jasper County
The median family income in Jasper County is $79,933, with families comprising 3+ earners (527) having the highest median family income of $131,582, while families with no earners (381) have the lowest median family income of $40,083, accounting for 20.7% and 14.9% of families, respectively.
| Number of Earners | # Families | Median Income |
| No Earners | 381 (14.9%) | $40,083 |
| 1 Earner | 616 (24.1%) | $52,083 |
| 2 Earners | 1,027 (40.3%) | $99,550 |
| 3+ Earners | 527 (20.7%) | $131,582 |
| Total | 2,551 (100.0%) | $79,933 |
Household Income in Jasper County
Household Income Brackets in Jasper County
With 705 households falling in the category, the $50,000 to $74,999 income range is the most frequent in Jasper County, accounting for 19.0% of all households. In contrast, only 130 households (3.5%) fall into the $200,000+ income bracket, making it the least populous group.
| Income Bracket | # Households | % Households |
| Less than $10,000 | 160 | 4.3% |
| $10,000 to $14,999 | 134 | 3.6% |
| $15,000 to $24,999 | 260 | 7.0% |
| $25,000 to $34,999 | 219 | 5.9% |
| $35,000 to $49,999 | 631 | 17.0% |
| $50,000 to $74,999 | 705 | 19.0% |
| $75,000 to $99,999 | 445 | 12.0% |
| $100,000 to $149,999 | 679 | 18.3% |
| $150,000 to $199,999 | 349 | 9.4% |
| $200,000+ | 130 | 3.5% |
Household Income by Householder Age in Jasper County
The median household income in Jasper County is $67,429, with the highest median household income of $77,946 found in the 45 to 64 years age bracket for the primary householder. A total of 1,560 households (42.0%) fall into this category. Meanwhile, the 65+ years age bracket for the primary householder has the lowest median household income of $46,324, with 1,150 households (31.0%) in this group.
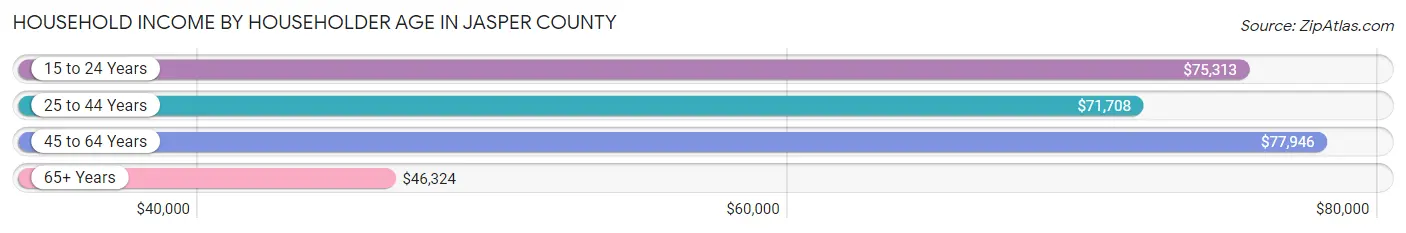
| Income Bracket | # Households | Median Income |
| 15 to 24 Years | 63 (1.7%) | $75,313 |
| 25 to 44 Years | 937 (25.3%) | $71,708 |
| 45 to 64 Years | 1,560 (42.0%) | $77,946 |
| 65+ Years | 1,150 (31.0%) | $46,324 |
| Total | 3,710 (100.0%) | $67,429 |
Poverty in Jasper County
Income Below Poverty by Sex and Age in Jasper County
With 7.1% poverty level for males and 11.3% for females among the residents of Jasper County, under 5 year old males and 6 to 11 year old females are the most vulnerable to poverty, with 72 males (26.7%) and 92 females (24.4%) in their respective age groups living below the poverty level.
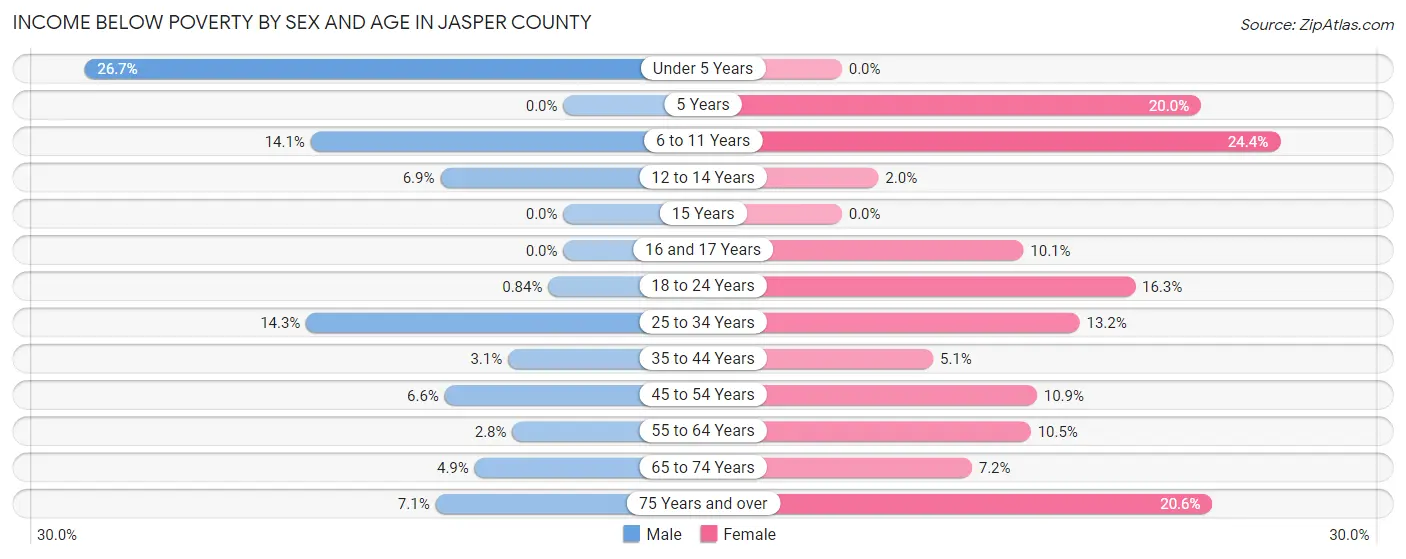
| Age Bracket | Male | Female |
| Under 5 Years | 72 (26.7%) | 0 (0.0%) |
| 5 Years | 0 (0.0%) | 5 (20.0%) |
| 6 to 11 Years | 46 (14.1%) | 92 (24.4%) |
| 12 to 14 Years | 15 (6.9%) | 3 (2.0%) |
| 15 Years | 0 (0.0%) | 0 (0.0%) |
| 16 and 17 Years | 0 (0.0%) | 9 (10.1%) |
| 18 to 24 Years | 3 (0.8%) | 57 (16.3%) |
| 25 to 34 Years | 66 (14.3%) | 63 (13.2%) |
| 35 to 44 Years | 17 (3.1%) | 25 (5.1%) |
| 45 to 54 Years | 40 (6.6%) | 62 (10.9%) |
| 55 to 64 Years | 21 (2.8%) | 75 (10.5%) |
| 65 to 74 Years | 26 (4.9%) | 39 (7.2%) |
| 75 Years and over | 24 (7.1%) | 85 (20.6%) |
| Total | 330 (7.1%) | 515 (11.3%) |
Income Above Poverty by Sex and Age in Jasper County
According to the poverty statistics in Jasper County, males aged 5 years and females aged under 5 years are the age groups that are most secure financially, with 100.0% of males and 100.0% of females in these age groups living above the poverty line.
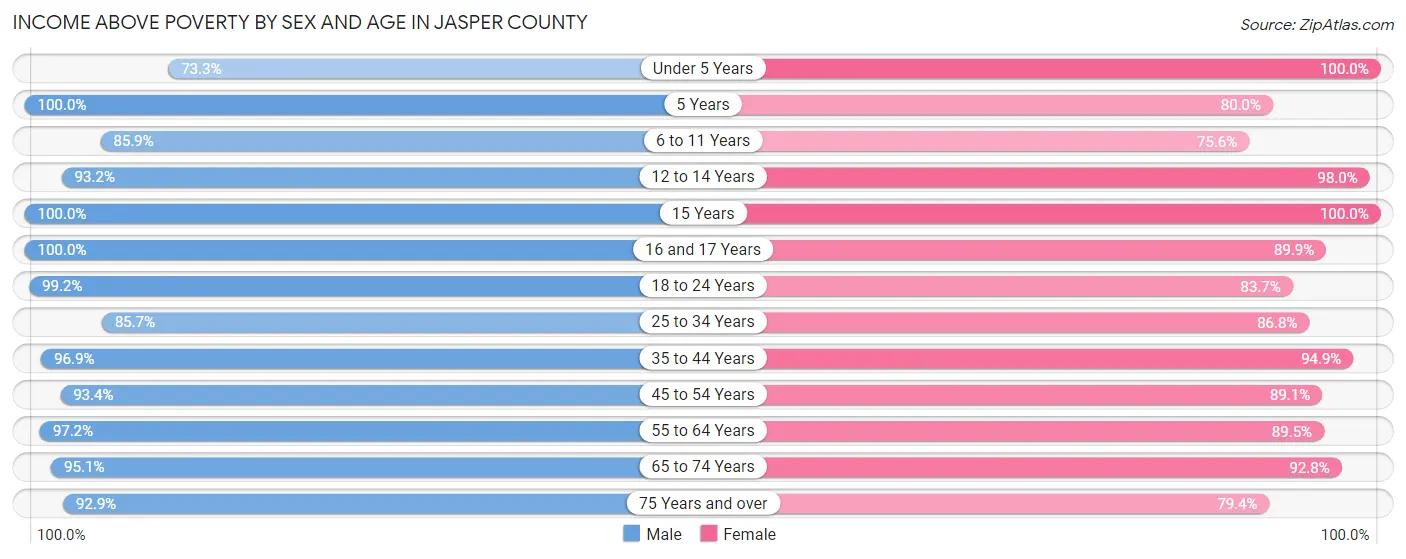
| Age Bracket | Male | Female |
| Under 5 Years | 198 (73.3%) | 267 (100.0%) |
| 5 Years | 45 (100.0%) | 20 (80.0%) |
| 6 to 11 Years | 281 (85.9%) | 285 (75.6%) |
| 12 to 14 Years | 204 (93.1%) | 144 (98.0%) |
| 15 Years | 53 (100.0%) | 85 (100.0%) |
| 16 and 17 Years | 158 (100.0%) | 80 (89.9%) |
| 18 to 24 Years | 356 (99.2%) | 292 (83.7%) |
| 25 to 34 Years | 395 (85.7%) | 413 (86.8%) |
| 35 to 44 Years | 535 (96.9%) | 467 (94.9%) |
| 45 to 54 Years | 565 (93.4%) | 509 (89.1%) |
| 55 to 64 Years | 719 (97.2%) | 638 (89.5%) |
| 65 to 74 Years | 500 (95.1%) | 500 (92.8%) |
| 75 Years and over | 313 (92.9%) | 327 (79.4%) |
| Total | 4,322 (92.9%) | 4,027 (88.7%) |
Income Below Poverty Among Married-Couple Families in Jasper County
The poverty statistics for married-couple families in Jasper County show that 3.3% or 70 of the total 2,095 families live below the poverty line. Families with 3 or 4 children have the highest poverty rate of 8.5%, comprising of 18 families. On the other hand, families with 5 or more children have the lowest poverty rate of 0.0%, which includes 0 families.
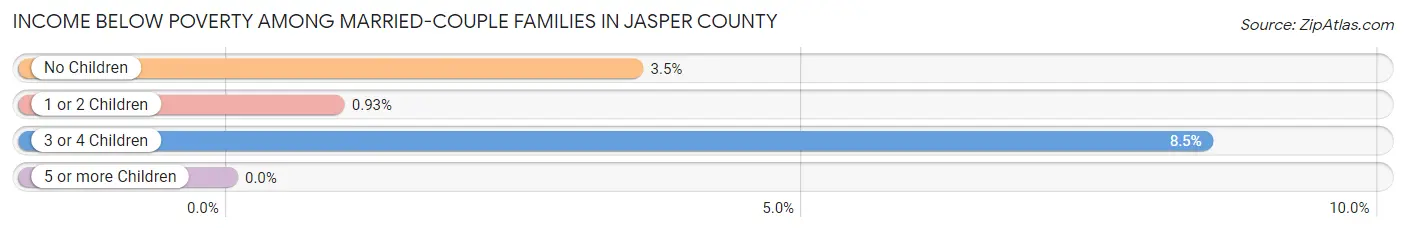
| Children | Above Poverty | Below Poverty |
| No Children | 1,283 (96.5%) | 47 (3.5%) |
| 1 or 2 Children | 535 (99.1%) | 5 (0.9%) |
| 3 or 4 Children | 194 (91.5%) | 18 (8.5%) |
| 5 or more Children | 13 (100.0%) | 0 (0.0%) |
| Total | 2,025 (96.7%) | 70 (3.3%) |
Income Below Poverty Among Single-Parent Households in Jasper County
According to the poverty data in Jasper County, 10.2% or 17 single-father households and 25.3% or 73 single-mother households are living below the poverty line. Among single-father households, those with 1 or 2 children have the highest poverty rate, with 17 households (25.8%) experiencing poverty. Likewise, among single-mother households, those with 3 or 4 children have the highest poverty rate, with 4 households (33.3%) falling below the poverty line.
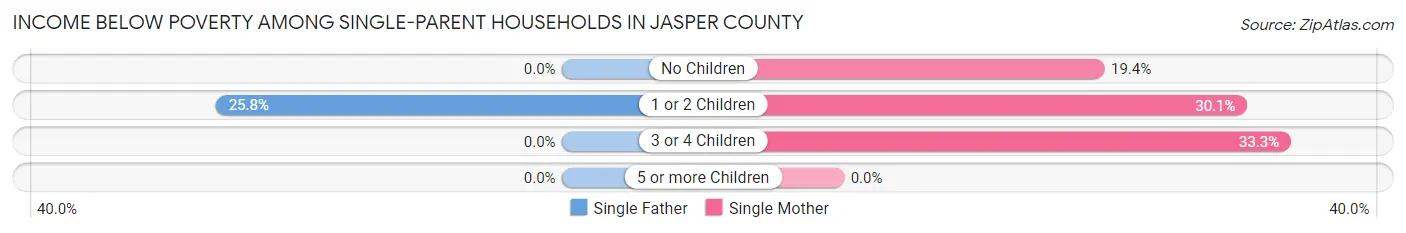
| Children | Single Father | Single Mother |
| No Children | 0 (0.0%) | 26 (19.4%) |
| 1 or 2 Children | 17 (25.8%) | 43 (30.1%) |
| 3 or 4 Children | 0 (0.0%) | 4 (33.3%) |
| 5 or more Children | 0 (0.0%) | 0 (0.0%) |
| Total | 17 (10.2%) | 73 (25.3%) |
Income Below Poverty Among Married-Couple vs Single-Parent Households in Jasper County
The poverty data for Jasper County shows that 70 of the married-couple family households (3.3%) and 90 of the single-parent households (19.7%) are living below the poverty level. Within the married-couple family households, those with 3 or 4 children have the highest poverty rate, with 18 households (8.5%) falling below the poverty line. Among the single-parent households, those with 1 or 2 children have the highest poverty rate, with 60 household (28.7%) living below poverty.
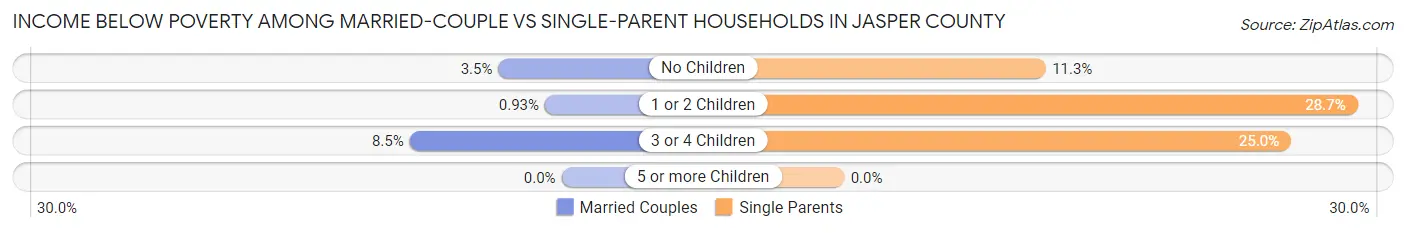
| Children | Married-Couple Families | Single-Parent Households |
| No Children | 47 (3.5%) | 26 (11.3%) |
| 1 or 2 Children | 5 (0.9%) | 60 (28.7%) |
| 3 or 4 Children | 18 (8.5%) | 4 (25.0%) |
| 5 or more Children | 0 (0.0%) | 0 (0.0%) |
| Total | 70 (3.3%) | 90 (19.7%) |
Race in Jasper County
The most populous races in Jasper County are White / Caucasian (8,970 | 96.5%), Two or more Races (220 | 2.4%), and Hispanic or Latino (170 | 1.8%).
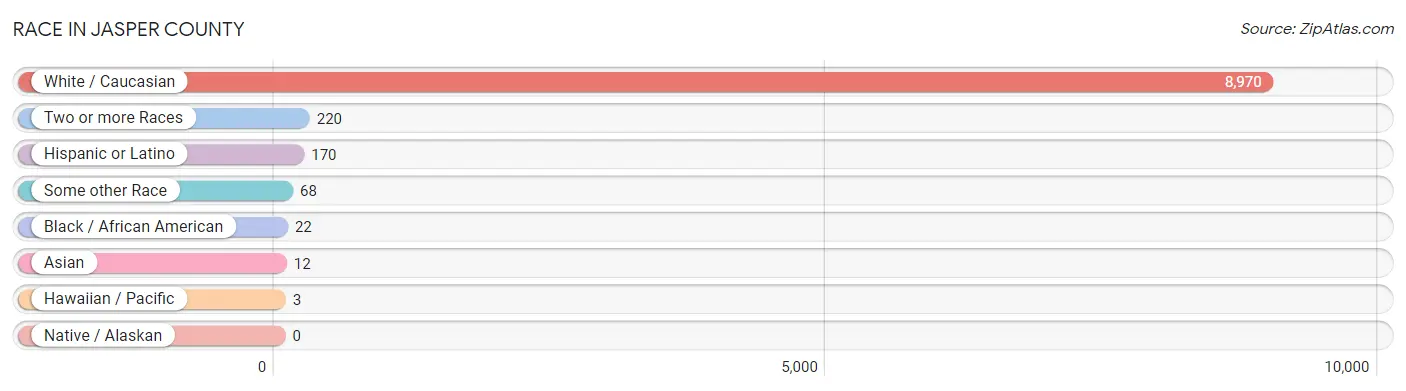
| Race | # Population | % Population |
| Asian | 12 | 0.1% |
| Black / African American | 22 | 0.2% |
| Hawaiian / Pacific | 3 | 0.0% |
| Hispanic or Latino | 170 | 1.8% |
| Native / Alaskan | 0 | 0.0% |
| White / Caucasian | 8,970 | 96.5% |
| Two or more Races | 220 | 2.4% |
| Some other Race | 68 | 0.7% |
| Total | 9,295 | 100.0% |
Ancestry in Jasper County
The most populous ancestries reported in Jasper County are German (3,440 | 37.0%), English (901 | 9.7%), Irish (895 | 9.6%), American (879 | 9.5%), and Mexican (161 | 1.7%), together accounting for 67.5% of all Jasper County residents.
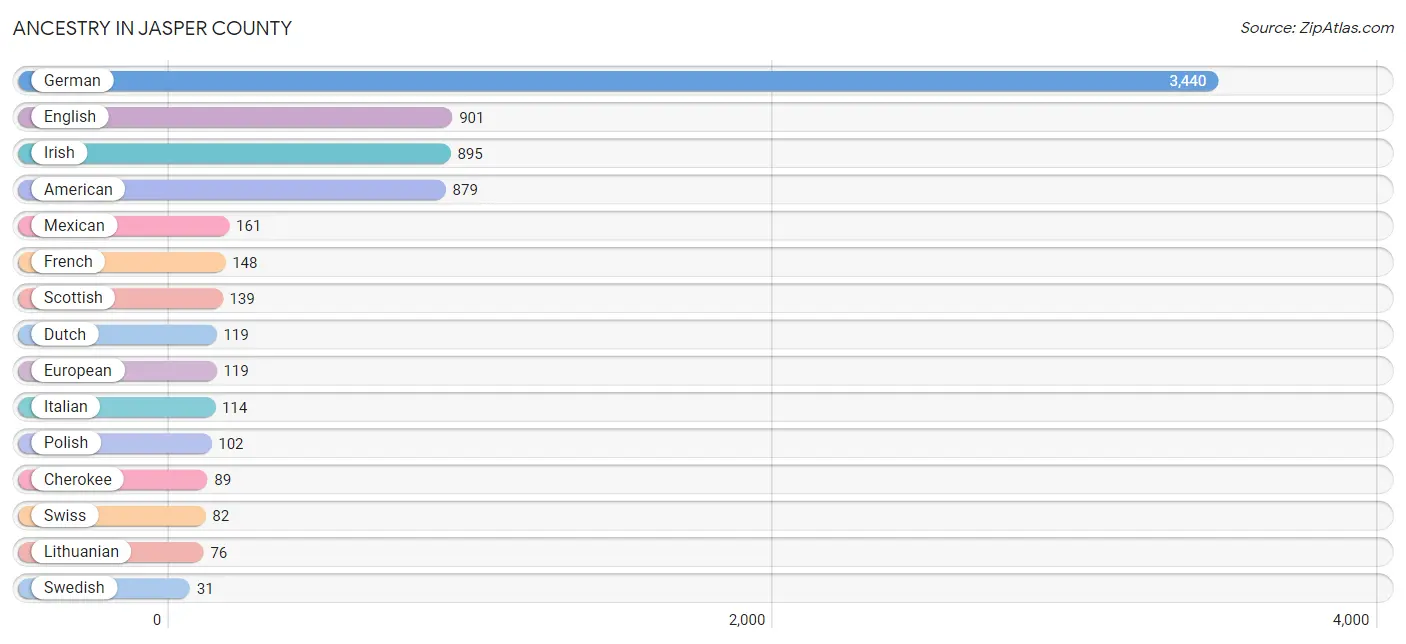
| Ancestry | # Population | % Population |
| American | 879 | 9.5% |
| Apache | 4 | 0.0% |
| Bhutanese | 9 | 0.1% |
| Cherokee | 89 | 1.0% |
| Danish | 6 | 0.1% |
| Dutch | 119 | 1.3% |
| English | 901 | 9.7% |
| European | 119 | 1.3% |
| French | 148 | 1.6% |
| French Canadian | 12 | 0.1% |
| German | 3,440 | 37.0% |
| Hungarian | 8 | 0.1% |
| Irish | 895 | 9.6% |
| Italian | 114 | 1.2% |
| Korean | 1 | 0.0% |
| Lithuanian | 76 | 0.8% |
| Mexican | 161 | 1.7% |
| Norwegian | 7 | 0.1% |
| Pakistani | 22 | 0.2% |
| Peruvian | 1 | 0.0% |
| Polish | 102 | 1.1% |
| Romanian | 3 | 0.0% |
| Samoan | 3 | 0.0% |
| Scandinavian | 3 | 0.0% |
| Scotch-Irish | 22 | 0.2% |
| Scottish | 139 | 1.5% |
| South American | 1 | 0.0% |
| Swedish | 31 | 0.3% |
| Swiss | 82 | 0.9% |
| Ukrainian | 2 | 0.0% |
| Welsh | 22 | 0.2% | View All 31 Rows |
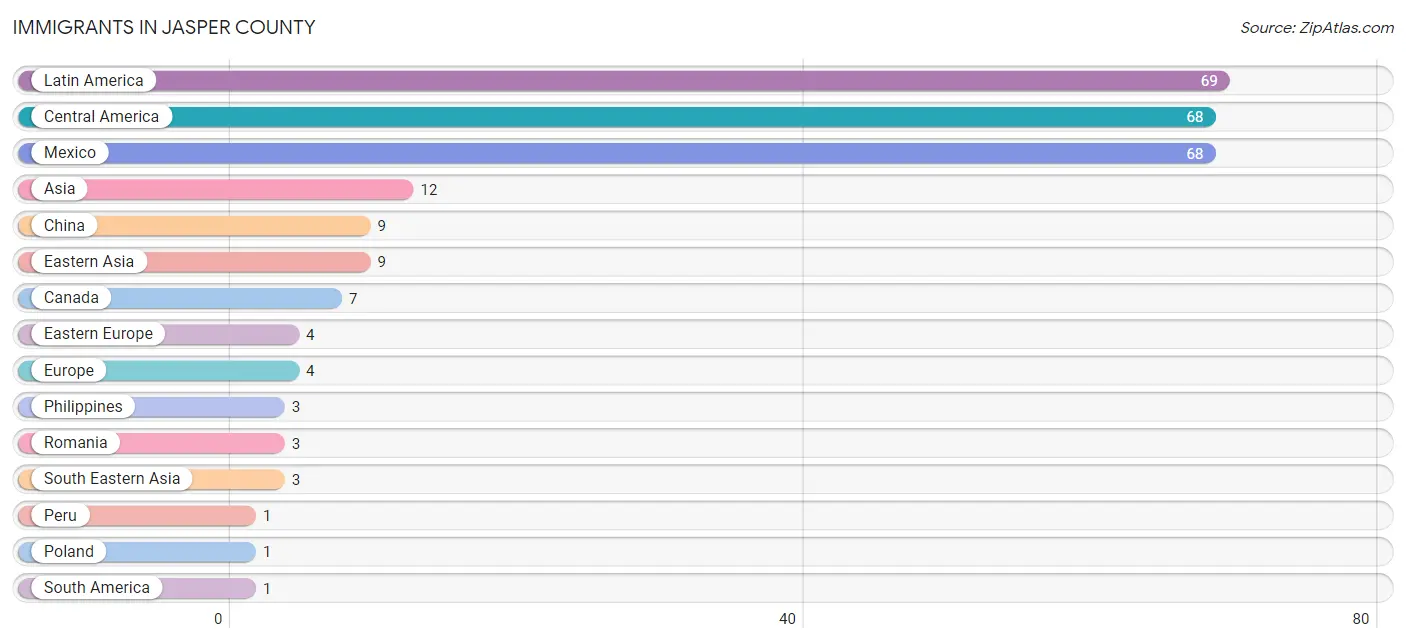
Immigrants in Jasper County
The most numerous immigrant groups reported in Jasper County came from Latin America (69 | 0.7%), Central America (68 | 0.7%), Mexico (68 | 0.7%), Asia (12 | 0.1%), and China (9 | 0.1%), together accounting for 2.4% of all Jasper County residents.
| Immigration Origin | # Population | % Population |
| Asia | 12 | 0.1% |
| Canada | 7 | 0.1% |
| Central America | 68 | 0.7% |
| China | 9 | 0.1% |
| Eastern Asia | 9 | 0.1% |
| Eastern Europe | 4 | 0.0% |
| Europe | 4 | 0.0% |
| Latin America | 69 | 0.7% |
| Mexico | 68 | 0.7% |
| Peru | 1 | 0.0% |
| Philippines | 3 | 0.0% |
| Poland | 1 | 0.0% |
| Romania | 3 | 0.0% |
| South America | 1 | 0.0% |
| South Eastern Asia | 3 | 0.0% | View All 15 Rows |
Sex and Age in Jasper County
Sex and Age in Jasper County
The most populous age groups in Jasper County are 60 to 64 Years (397 | 8.4%) for men and 60 to 64 Years (405 | 8.8%) for women.
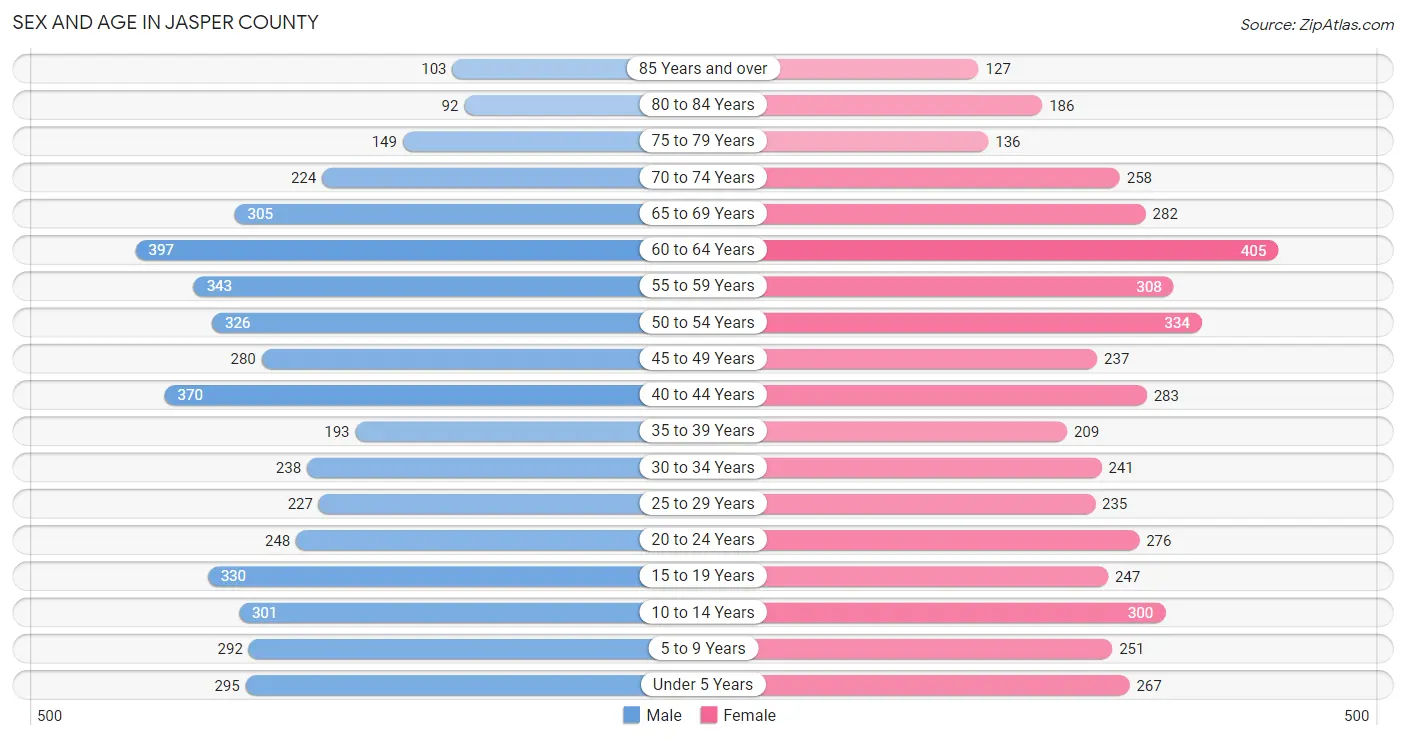
| Age Bracket | Male | Female |
| Under 5 Years | 295 (6.3%) | 267 (5.8%) |
| 5 to 9 Years | 292 (6.2%) | 251 (5.5%) |
| 10 to 14 Years | 301 (6.4%) | 300 (6.6%) |
| 15 to 19 Years | 330 (7.0%) | 247 (5.4%) |
| 20 to 24 Years | 248 (5.3%) | 276 (6.0%) |
| 25 to 29 Years | 227 (4.8%) | 235 (5.1%) |
| 30 to 34 Years | 238 (5.1%) | 241 (5.3%) |
| 35 to 39 Years | 193 (4.1%) | 209 (4.6%) |
| 40 to 44 Years | 370 (7.9%) | 283 (6.2%) |
| 45 to 49 Years | 280 (5.9%) | 237 (5.2%) |
| 50 to 54 Years | 326 (6.9%) | 334 (7.3%) |
| 55 to 59 Years | 343 (7.3%) | 308 (6.7%) |
| 60 to 64 Years | 397 (8.4%) | 405 (8.8%) |
| 65 to 69 Years | 305 (6.5%) | 282 (6.1%) |
| 70 to 74 Years | 224 (4.8%) | 258 (5.6%) |
| 75 to 79 Years | 149 (3.2%) | 136 (3.0%) |
| 80 to 84 Years | 92 (1.9%) | 186 (4.1%) |
| 85 Years and over | 103 (2.2%) | 127 (2.8%) |
| Total | 4,713 (100.0%) | 4,582 (100.0%) |
Families and Households in Jasper County
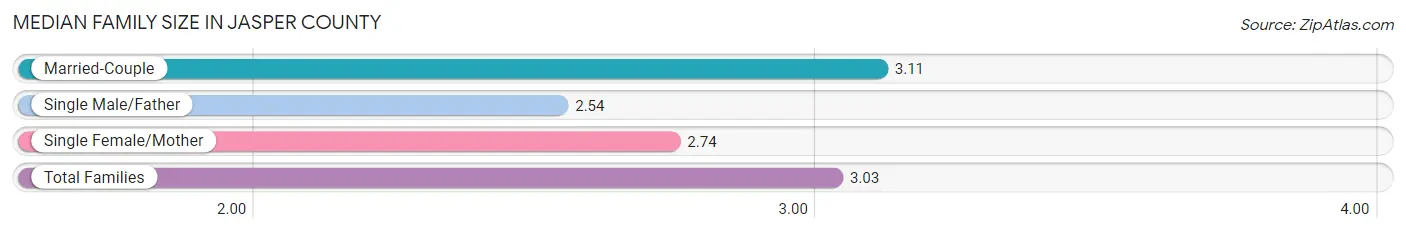
Median Family Size in Jasper County
The median family size in Jasper County is 3.03 persons per family, with married-couple families (2,095 | 82.1%) accounting for the largest median family size of 3.11 persons per family. On the other hand, single male/father families (167 | 6.6%) represent the smallest median family size with 2.54 persons per family.
| Family Type | # Families | Family Size |
| Married-Couple | 2,095 (82.1%) | 3.11 |
| Single Male/Father | 167 (6.6%) | 2.54 |
| Single Female/Mother | 289 (11.3%) | 2.74 |
| Total Families | 2,551 (100.0%) | 3.03 |
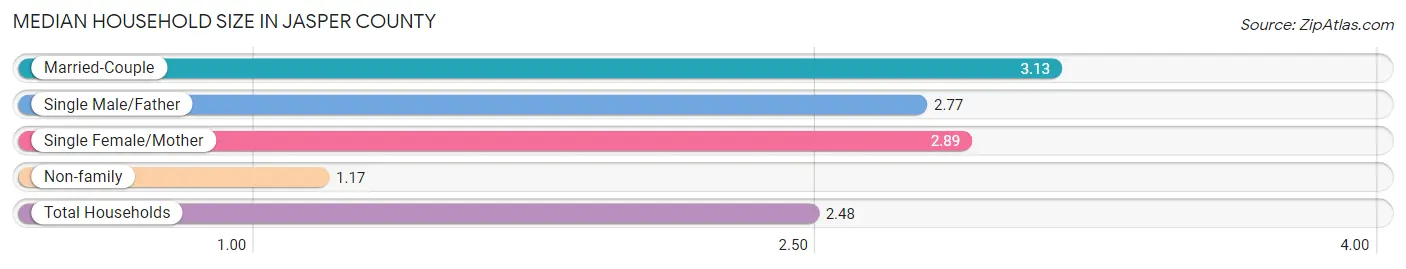
Median Household Size in Jasper County
The median household size in Jasper County is 2.48 persons per household, with married-couple households (2,095 | 56.5%) accounting for the largest median household size of 3.13 persons per household. non-family households (1,159 | 31.2%) represent the smallest median household size with 1.17 persons per household.
| Household Type | # Households | Household Size |
| Married-Couple | 2,095 (56.5%) | 3.13 |
| Single Male/Father | 167 (4.5%) | 2.77 |
| Single Female/Mother | 289 (7.8%) | 2.89 |
| Non-family | 1,159 (31.2%) | 1.17 |
| Total Households | 3,710 (100.0%) | 2.48 |
Household Size by Marriage Status in Jasper County
Out of a total of 3,710 households in Jasper County, 2,551 (68.8%) are family households, while 1,159 (31.2%) are nonfamily households. The most numerous type of family households are 2-person households, comprising 1,208, and the most common type of nonfamily households are 1-person households, comprising 980.
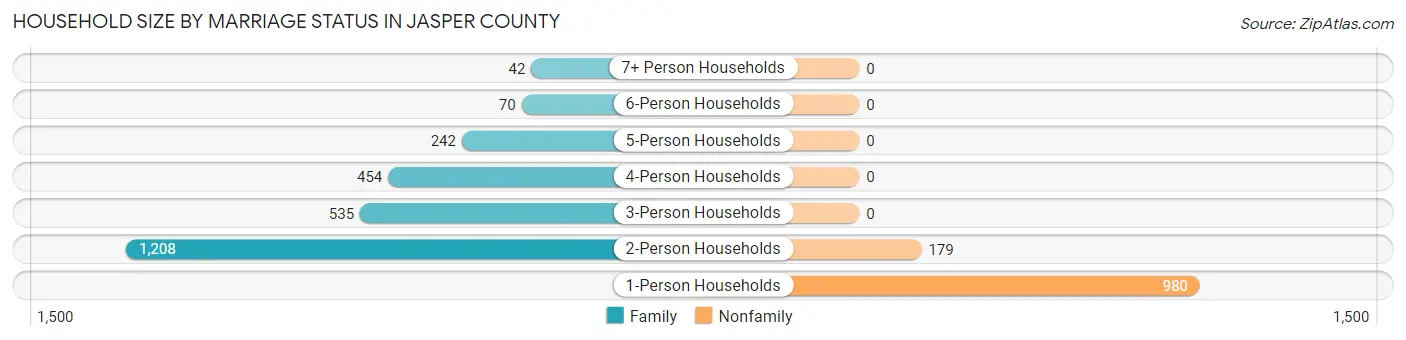
| Household Size | Family Households | Nonfamily Households |
| 1-Person Households | - | 980 (26.4%) |
| 2-Person Households | 1,208 (32.6%) | 179 (4.8%) |
| 3-Person Households | 535 (14.4%) | 0 (0.0%) |
| 4-Person Households | 454 (12.2%) | 0 (0.0%) |
| 5-Person Households | 242 (6.5%) | 0 (0.0%) |
| 6-Person Households | 70 (1.9%) | 0 (0.0%) |
| 7+ Person Households | 42 (1.1%) | 0 (0.0%) |
| Total | 2,551 (68.8%) | 1,159 (31.2%) |
Female Fertility in Jasper County
Fertility by Age in Jasper County
Average fertility rate in Jasper County is 58.0 births per 1,000 women. Women in the age bracket of 20 to 34 years have the highest fertility rate with 70.0 births per 1,000 women. Women in the age bracket of 20 to 34 years acount for 51.0% of all women with births.
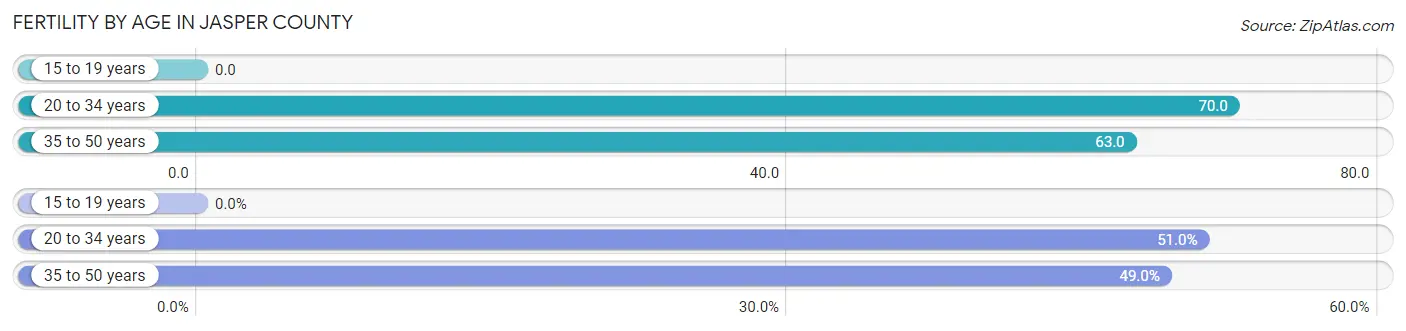
| Age Bracket | Women with Births | Births / 1,000 Women |
| 15 to 19 years | 0 (0.0%) | 0.0 |
| 20 to 34 years | 53 (51.0%) | 70.0 |
| 35 to 50 years | 51 (49.0%) | 63.0 |
| Total | 104 (100.0%) | 58.0 |
Fertility by Age by Marriage Status in Jasper County
80.8% of women with births (104) in Jasper County are married. The highest percentage of unmarried women with births falls into 20 to 34 years age bracket with 37.7% of them unmarried at the time of birth, while the lowest percentage of unmarried women with births belong to 35 to 50 years age bracket with 0.0% of them unmarried.
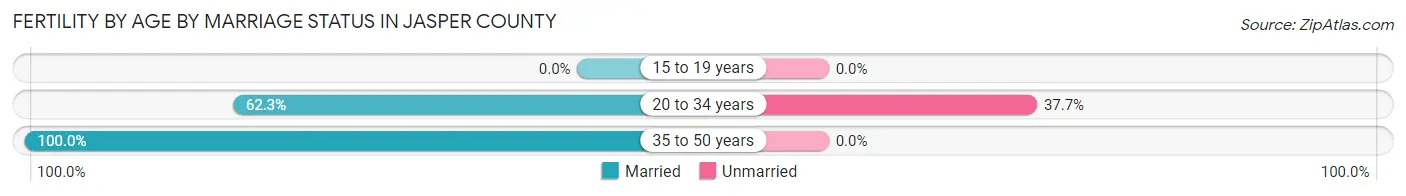
| Age Bracket | Married | Unmarried |
| 15 to 19 years | 0 (0.0%) | 0 (0.0%) |
| 20 to 34 years | 33 (62.3%) | 20 (37.7%) |
| 35 to 50 years | 51 (100.0%) | 0 (0.0%) |
| Total | 84 (80.8%) | 20 (19.2%) |
Fertility by Education in Jasper County
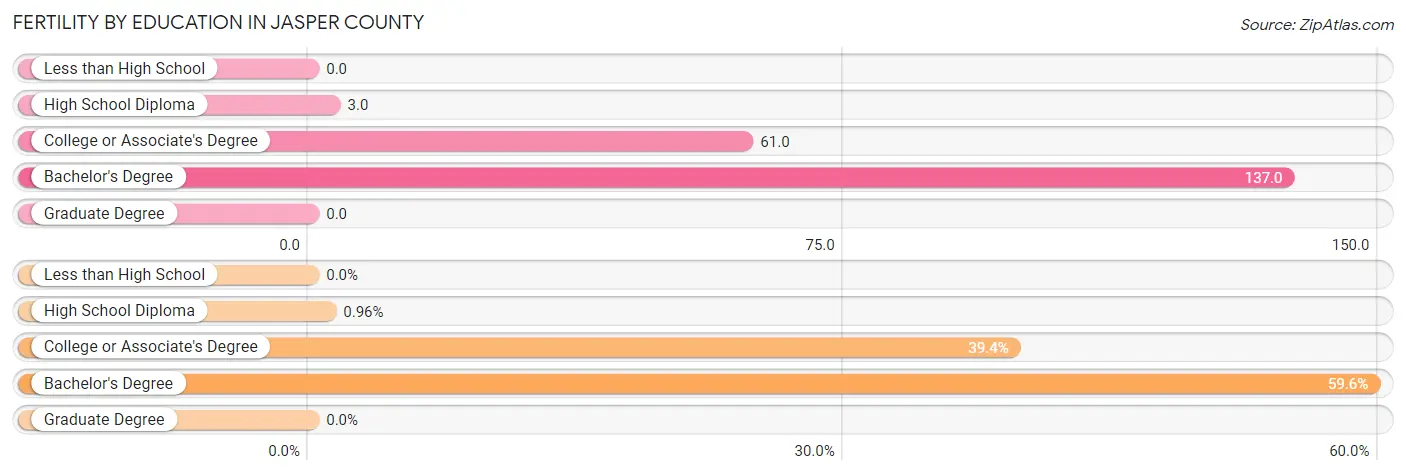
| Educational Attainment | Women with Births | Births / 1,000 Women |
| Less than High School | 0 (0.0%) | 0.0 |
| High School Diploma | 1 (1.0%) | 3.0 |
| College or Associate's Degree | 41 (39.4%) | 61.0 |
| Bachelor's Degree | 62 (59.6%) | 137.0 |
| Graduate Degree | 0 (0.0%) | 0.0 |
| Total | 104 (100.0%) | 58.0 |
Fertility by Education by Marriage Status in Jasper County
19.2% of women with births in Jasper County are unmarried. Women with the educational attainment of high school diploma are most likely to be married with 100.0% of them married at childbirth, while women with the educational attainment of college or associate's degree are least likely to be married with 29.3% of them unmarried at childbirth.
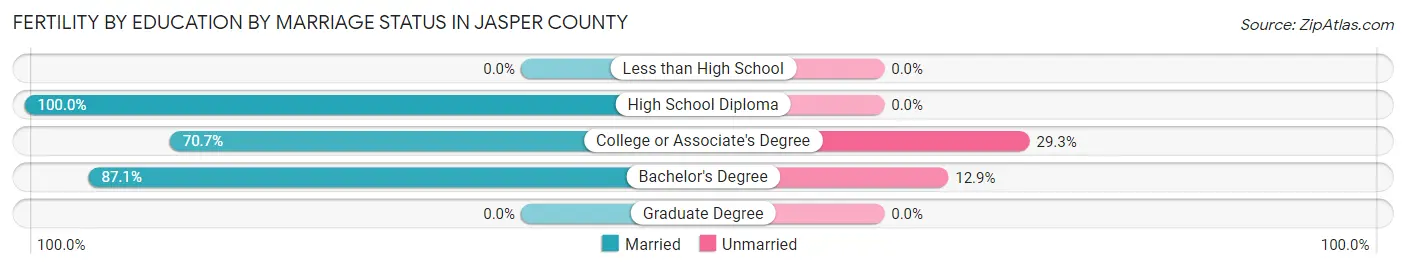
| Educational Attainment | Married | Unmarried |
| Less than High School | 0 (0.0%) | 0 (0.0%) |
| High School Diploma | 1 (100.0%) | 0 (0.0%) |
| College or Associate's Degree | 29 (70.7%) | 12 (29.3%) |
| Bachelor's Degree | 54 (87.1%) | 8 (12.9%) |
| Graduate Degree | 0 (0.0%) | 0 (0.0%) |
| Total | 84 (80.8%) | 20 (19.2%) |
Employment Characteristics in Jasper County
Employment by Class of Employer in Jasper County
Among the 4,584 employed individuals in Jasper County, private company employees (3,325 | 72.5%), local government employees (361 | 7.9%), and self-employed (not incorporated) (353 | 7.7%) make up the most common classes of employment.
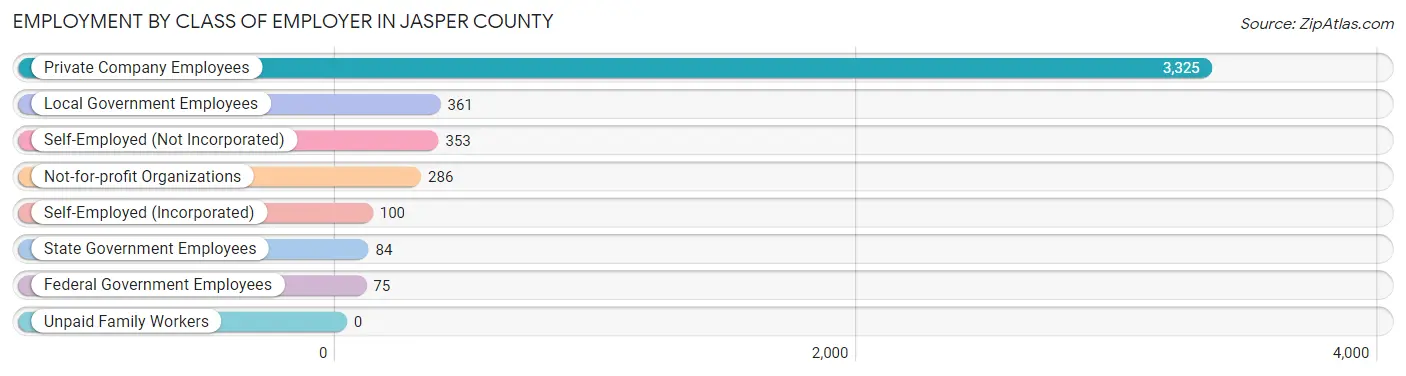
| Employer Class | # Employees | % Employees |
| Private Company Employees | 3,325 | 72.5% |
| Self-Employed (Incorporated) | 100 | 2.2% |
| Self-Employed (Not Incorporated) | 353 | 7.7% |
| Not-for-profit Organizations | 286 | 6.2% |
| Local Government Employees | 361 | 7.9% |
| State Government Employees | 84 | 1.8% |
| Federal Government Employees | 75 | 1.6% |
| Unpaid Family Workers | 0 | 0.0% |
| Total | 4,584 | 100.0% |
Employment Status by Age in Jasper County
According to the labor force statistics for Jasper County, out of the total population over 16 years of age (7,451), 65.3% or 4,866 individuals are in the labor force, with 4.9% or 238 of them unemployed. The age group with the highest labor force participation rate is 35 to 44 years, with 90.0% or 950 individuals in the labor force. Within the labor force, the 20 to 24 years age range has the highest percentage of unemployed individuals, with 11.0% or 47 of them being unemployed.
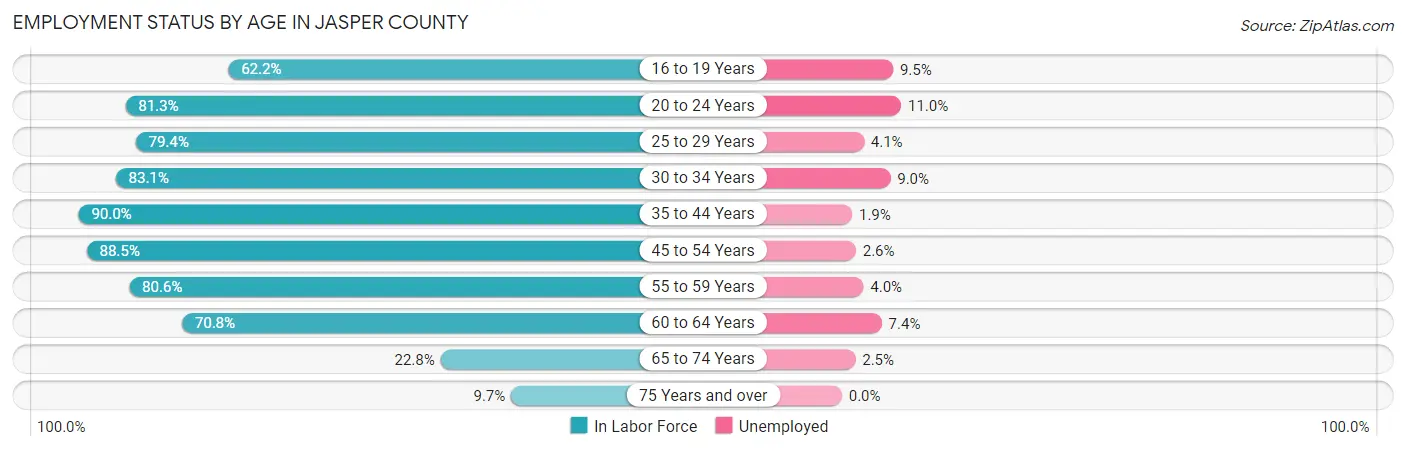
| Age Bracket | In Labor Force | Unemployed |
| 16 to 19 Years | 273 (62.2%) | 26 (9.5%) |
| 20 to 24 Years | 426 (81.3%) | 47 (11.0%) |
| 25 to 29 Years | 367 (79.4%) | 15 (4.1%) |
| 30 to 34 Years | 398 (83.1%) | 36 (9.0%) |
| 35 to 44 Years | 950 (90.0%) | 18 (1.9%) |
| 45 to 54 Years | 1,042 (88.5%) | 27 (2.6%) |
| 55 to 59 Years | 525 (80.6%) | 21 (4.0%) |
| 60 to 64 Years | 568 (70.8%) | 42 (7.4%) |
| 65 to 74 Years | 244 (22.8%) | 6 (2.5%) |
| 75 Years and over | 77 (9.7%) | 0 (0.0%) |
| Total | 4,866 (65.3%) | 238 (4.9%) |
Employment Status by Educational Attainment in Jasper County
According to labor force statistics for Jasper County, 83.2% of individuals (3,849) out of the total population between 25 and 64 years of age (4,626) are in the labor force, with 4.1% or 158 of them being unemployed. The group with the highest labor force participation rate are those with the educational attainment of college / associate degree, with 88.1% or 1,537 individuals in the labor force. Within the labor force, individuals with less than high school education have the highest percentage of unemployment, with 8.2% or 21 of them being unemployed.
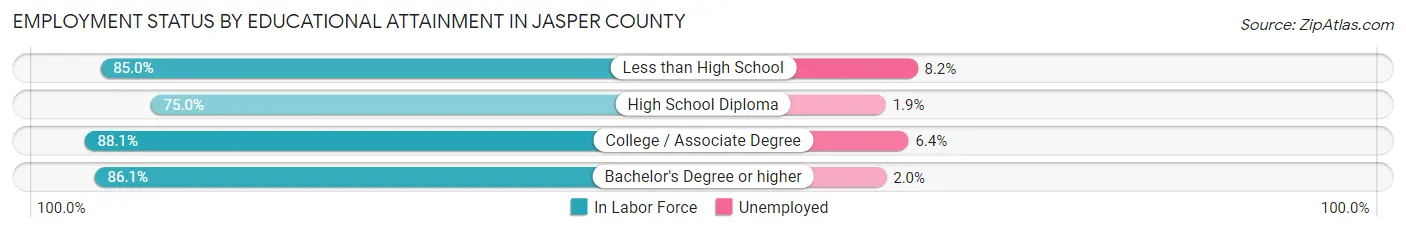
| Educational Attainment | In Labor Force | Unemployed |
| Less than High School | 255 (85.0%) | 25 (8.2%) |
| High School Diploma | 1,120 (75.0%) | 28 (1.9%) |
| College / Associate Degree | 1,537 (88.1%) | 112 (6.4%) |
| Bachelor's Degree or higher | 936 (86.1%) | 22 (2.0%) |
| Total | 3,849 (83.2%) | 190 (4.1%) |
Employment Occupations by Sex in Jasper County
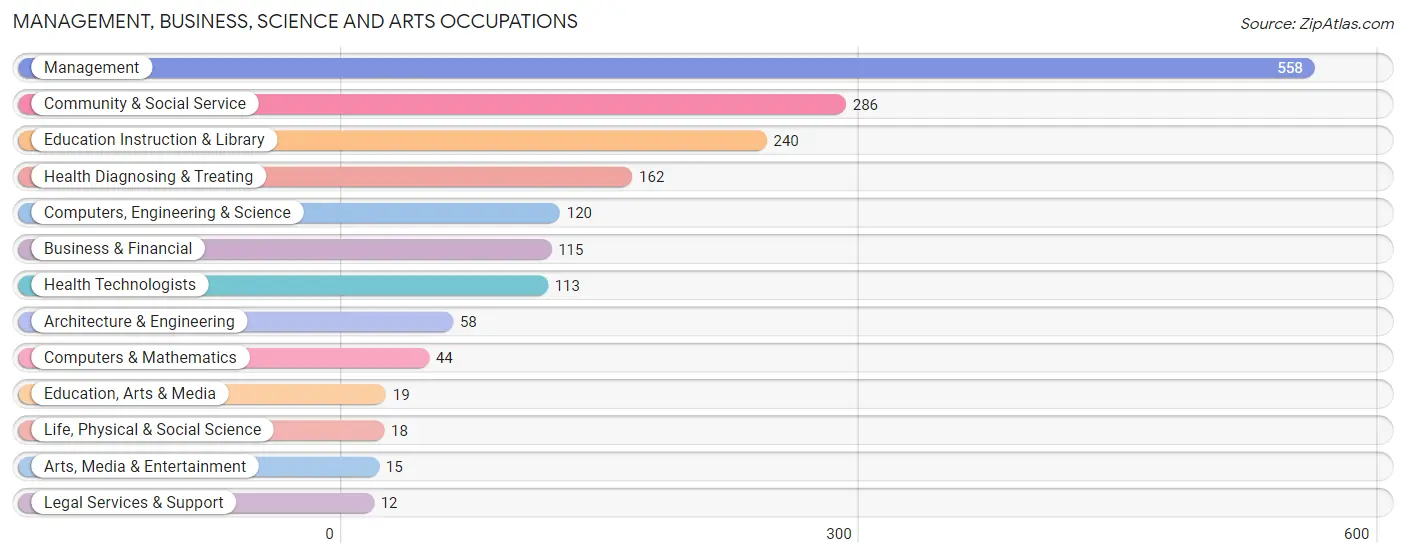
Management, Business, Science and Arts Occupations
The most common Management, Business, Science and Arts occupations in Jasper County are Management (558 | 12.0%), Community & Social Service (286 | 6.2%), Education Instruction & Library (240 | 5.2%), Health Diagnosing & Treating (162 | 3.5%), and Computers, Engineering & Science (120 | 2.6%).
Management, Business, Science and Arts Occupations by Sex
Within the Management, Business, Science and Arts occupations in Jasper County, the most male-oriented occupations are Legal Services & Support (100.0%), Computers & Mathematics (86.4%), and Education, Arts & Media (84.2%), while the most female-oriented occupations are Education Instruction & Library (88.7%), Health Technologists (85.0%), and Health Diagnosing & Treating (83.3%).
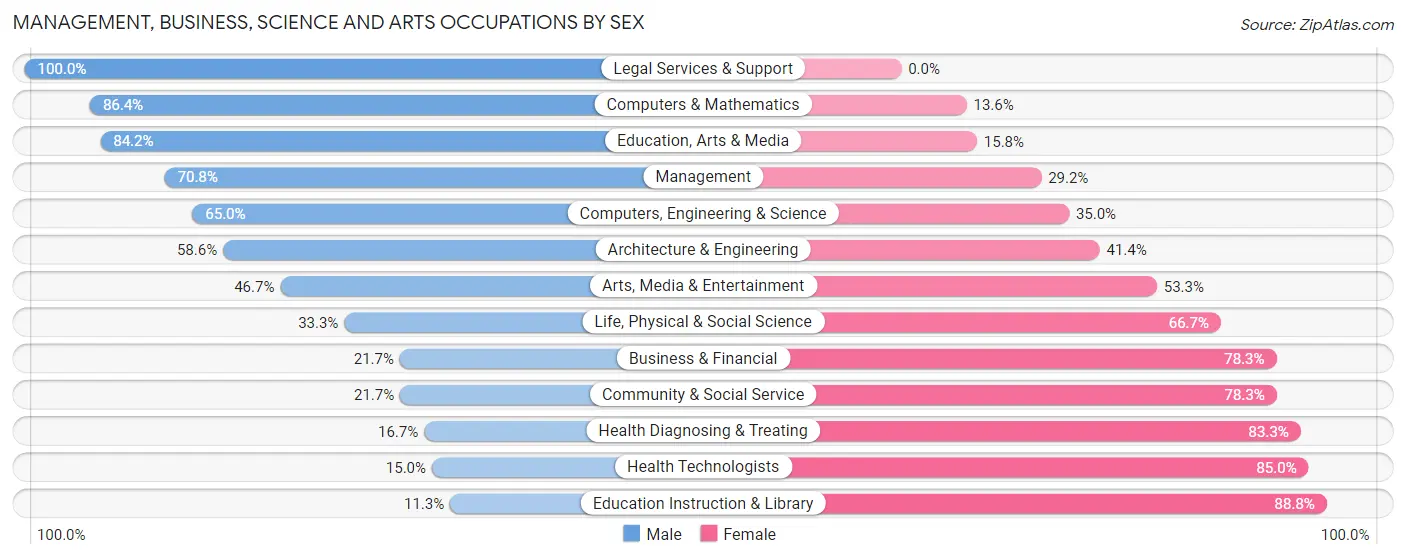
| Occupation | Male | Female |
| Management | 395 (70.8%) | 163 (29.2%) |
| Business & Financial | 25 (21.7%) | 90 (78.3%) |
| Computers, Engineering & Science | 78 (65.0%) | 42 (35.0%) |
| Computers & Mathematics | 38 (86.4%) | 6 (13.6%) |
| Architecture & Engineering | 34 (58.6%) | 24 (41.4%) |
| Life, Physical & Social Science | 6 (33.3%) | 12 (66.7%) |
| Community & Social Service | 62 (21.7%) | 224 (78.3%) |
| Education, Arts & Media | 16 (84.2%) | 3 (15.8%) |
| Legal Services & Support | 12 (100.0%) | 0 (0.0%) |
| Education Instruction & Library | 27 (11.3%) | 213 (88.7%) |
| Arts, Media & Entertainment | 7 (46.7%) | 8 (53.3%) |
| Health Diagnosing & Treating | 27 (16.7%) | 135 (83.3%) |
| Health Technologists | 17 (15.0%) | 96 (85.0%) |
| Total (Category) | 587 (47.3%) | 654 (52.7%) |
| Total (Overall) | 2,589 (55.9%) | 2,042 (44.1%) |
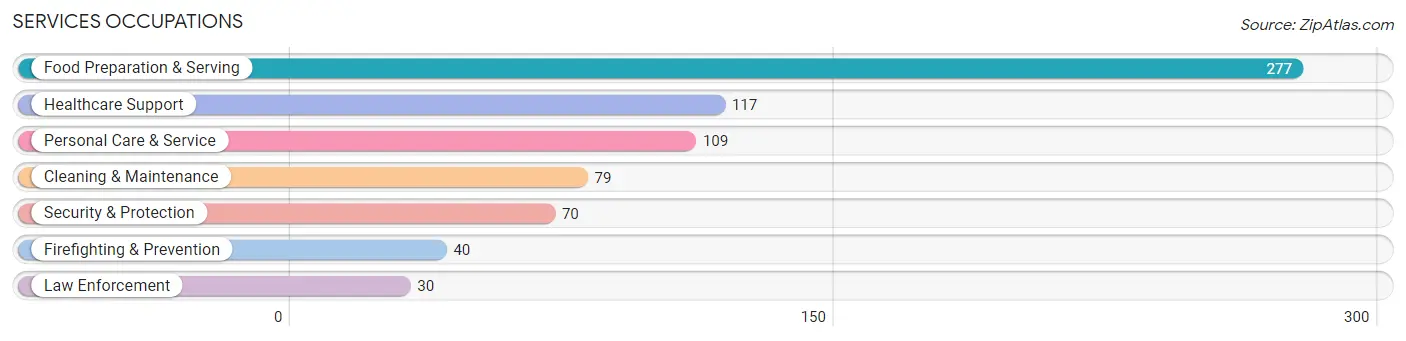
Services Occupations
The most common Services occupations in Jasper County are Food Preparation & Serving (277 | 6.0%), Healthcare Support (117 | 2.5%), Personal Care & Service (109 | 2.4%), Cleaning & Maintenance (79 | 1.7%), and Security & Protection (70 | 1.5%).
Services Occupations by Sex
Within the Services occupations in Jasper County, the most male-oriented occupations are Law Enforcement (100.0%), Security & Protection (84.3%), and Cleaning & Maintenance (83.5%), while the most female-oriented occupations are Healthcare Support (100.0%), Personal Care & Service (95.4%), and Food Preparation & Serving (79.8%).
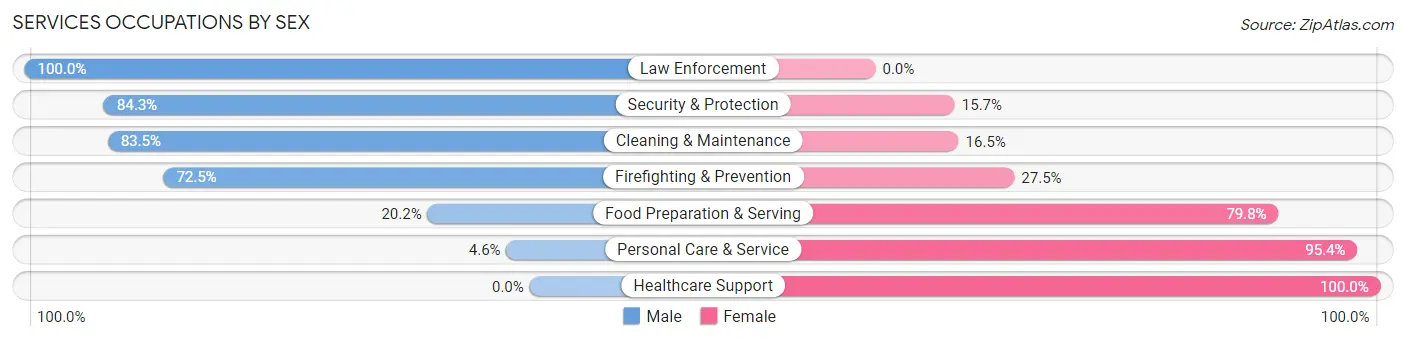
| Occupation | Male | Female |
| Healthcare Support | 0 (0.0%) | 117 (100.0%) |
| Security & Protection | 59 (84.3%) | 11 (15.7%) |
| Firefighting & Prevention | 29 (72.5%) | 11 (27.5%) |
| Law Enforcement | 30 (100.0%) | 0 (0.0%) |
| Food Preparation & Serving | 56 (20.2%) | 221 (79.8%) |
| Cleaning & Maintenance | 66 (83.5%) | 13 (16.5%) |
| Personal Care & Service | 5 (4.6%) | 104 (95.4%) |
| Total (Category) | 186 (28.5%) | 466 (71.5%) |
| Total (Overall) | 2,589 (55.9%) | 2,042 (44.1%) |
Sales and Office Occupations
The most common Sales and Office occupations in Jasper County are Office & Administration (589 | 12.7%), and Sales & Related (480 | 10.4%).
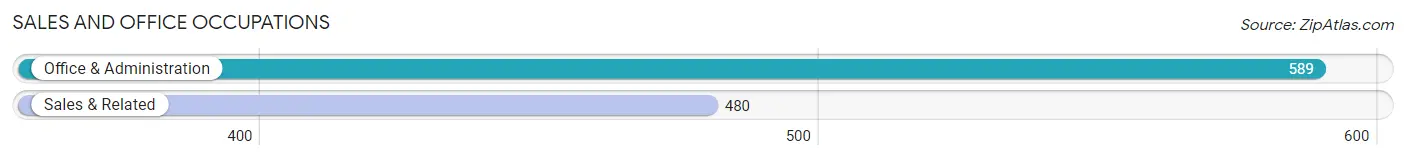
Sales and Office Occupations by Sex

| Occupation | Male | Female |
| Sales & Related | 178 (37.1%) | 302 (62.9%) |
| Office & Administration | 52 (8.8%) | 537 (91.2%) |
| Total (Category) | 230 (21.5%) | 839 (78.5%) |
| Total (Overall) | 2,589 (55.9%) | 2,042 (44.1%) |
Natural Resources, Construction and Maintenance Occupations
The most common Natural Resources, Construction and Maintenance occupations in Jasper County are Installation, Maintenance & Repair (363 | 7.8%), Construction & Extraction (230 | 5.0%), and Farming, Fishing & Forestry (105 | 2.3%).
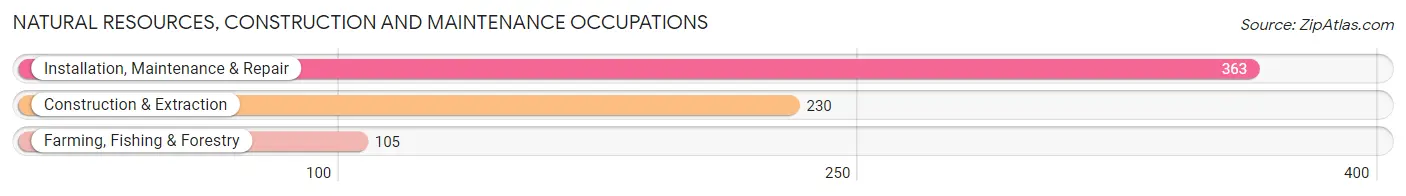
Natural Resources, Construction and Maintenance Occupations by Sex
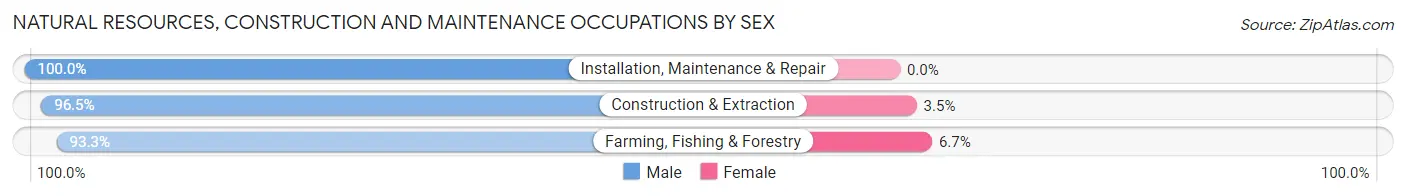
| Occupation | Male | Female |
| Farming, Fishing & Forestry | 98 (93.3%) | 7 (6.7%) |
| Construction & Extraction | 222 (96.5%) | 8 (3.5%) |
| Installation, Maintenance & Repair | 363 (100.0%) | 0 (0.0%) |
| Total (Category) | 683 (97.9%) | 15 (2.1%) |
| Total (Overall) | 2,589 (55.9%) | 2,042 (44.1%) |
Production, Transportation and Moving Occupations
The most common Production, Transportation and Moving occupations in Jasper County are Production (341 | 7.4%), Transportation (336 | 7.3%), and Material Moving (294 | 6.4%).
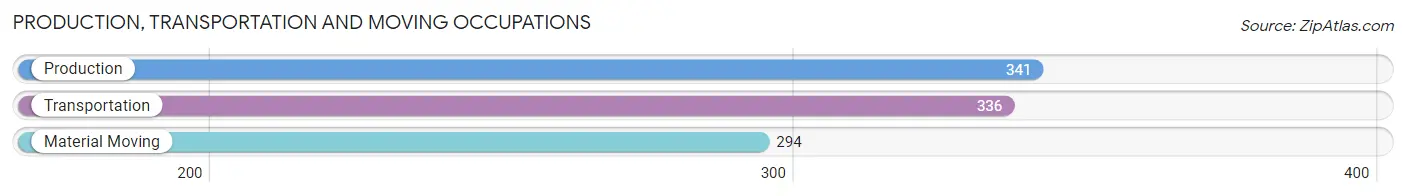
Production, Transportation and Moving Occupations by Sex
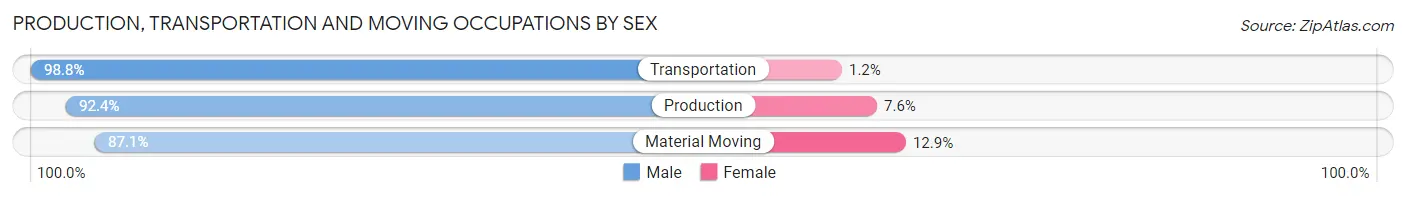
| Occupation | Male | Female |
| Production | 315 (92.4%) | 26 (7.6%) |
| Transportation | 332 (98.8%) | 4 (1.2%) |
| Material Moving | 256 (87.1%) | 38 (12.9%) |
| Total (Category) | 903 (93.0%) | 68 (7.0%) |
| Total (Overall) | 2,589 (55.9%) | 2,042 (44.1%) |
Employment Industries by Sex in Jasper County
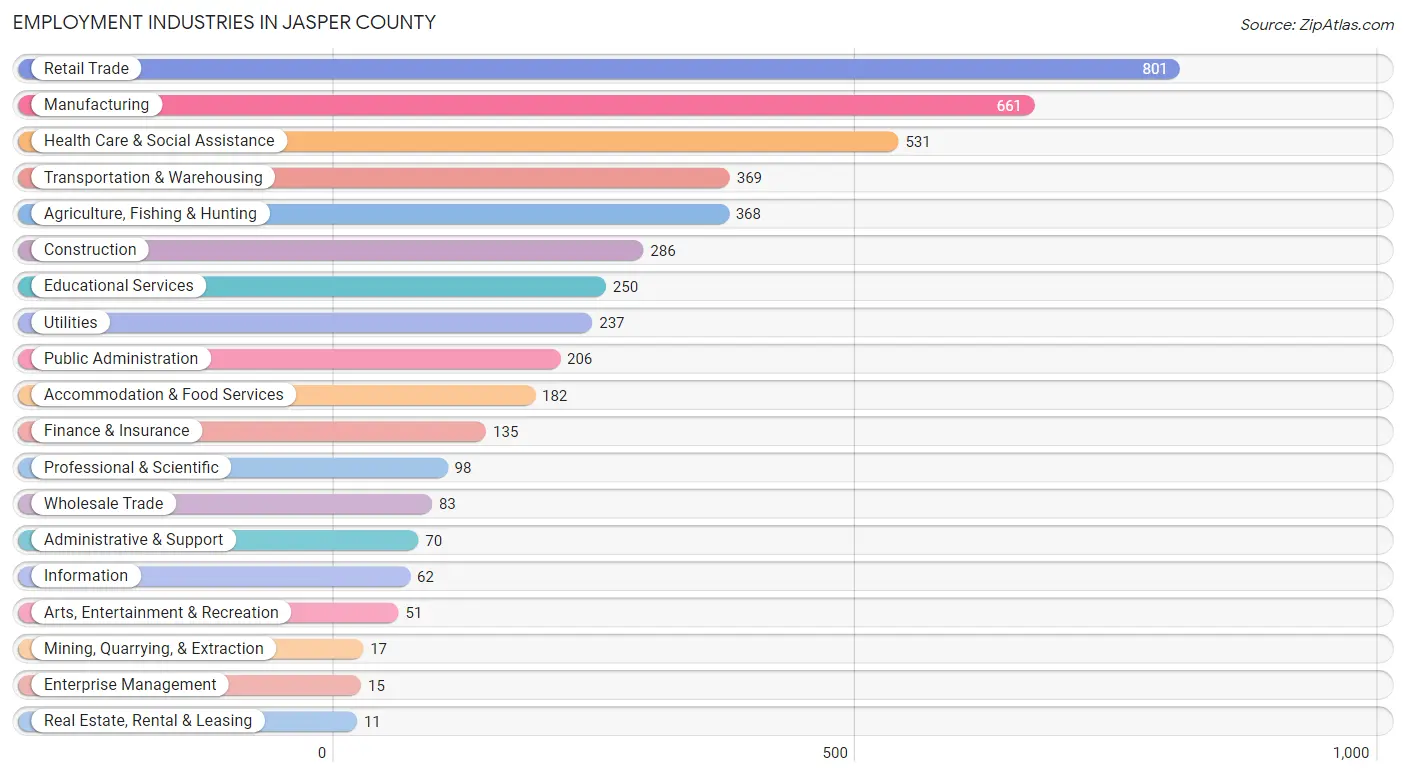
Employment Industries in Jasper County
The major employment industries in Jasper County include Retail Trade (801 | 17.3%), Manufacturing (661 | 14.3%), Health Care & Social Assistance (531 | 11.5%), Transportation & Warehousing (369 | 8.0%), and Agriculture, Fishing & Hunting (368 | 8.0%).
Employment Industries by Sex in Jasper County
The Jasper County industries that see more men than women are Mining, Quarrying, & Extraction (100.0%), Information (100.0%), and Construction (97.9%), whereas the industries that tend to have a higher number of women are Real Estate, Rental & Leasing (100.0%), Enterprise Management (100.0%), and Accommodation & Food Services (99.5%).
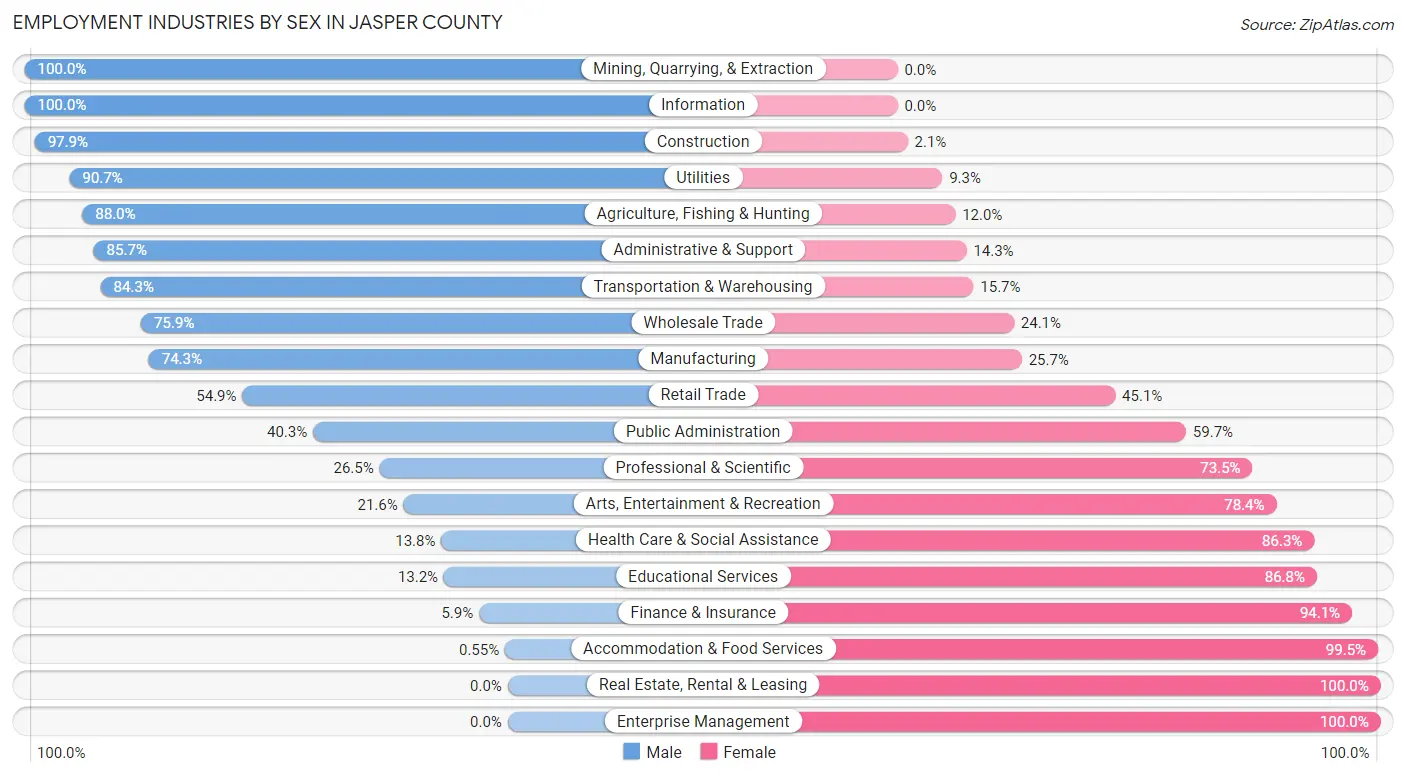
| Industry | Male | Female |
| Agriculture, Fishing & Hunting | 324 (88.0%) | 44 (12.0%) |
| Mining, Quarrying, & Extraction | 17 (100.0%) | 0 (0.0%) |
| Construction | 280 (97.9%) | 6 (2.1%) |
| Manufacturing | 491 (74.3%) | 170 (25.7%) |
| Wholesale Trade | 63 (75.9%) | 20 (24.1%) |
| Retail Trade | 440 (54.9%) | 361 (45.1%) |
| Transportation & Warehousing | 311 (84.3%) | 58 (15.7%) |
| Utilities | 215 (90.7%) | 22 (9.3%) |
| Information | 62 (100.0%) | 0 (0.0%) |
| Finance & Insurance | 8 (5.9%) | 127 (94.1%) |
| Real Estate, Rental & Leasing | 0 (0.0%) | 11 (100.0%) |
| Professional & Scientific | 26 (26.5%) | 72 (73.5%) |
| Enterprise Management | 0 (0.0%) | 15 (100.0%) |
| Administrative & Support | 60 (85.7%) | 10 (14.3%) |
| Educational Services | 33 (13.2%) | 217 (86.8%) |
| Health Care & Social Assistance | 73 (13.8%) | 458 (86.3%) |
| Arts, Entertainment & Recreation | 11 (21.6%) | 40 (78.4%) |
| Accommodation & Food Services | 1 (0.5%) | 181 (99.5%) |
| Public Administration | 83 (40.3%) | 123 (59.7%) |
| Total | 2,589 (55.9%) | 2,042 (44.1%) |
Education in Jasper County
School Enrollment in Jasper County
The most common levels of schooling among the 1,915 students in Jasper County are elementary school (517 | 27.0%), high school (472 | 24.6%), and middle school (471 | 24.6%).
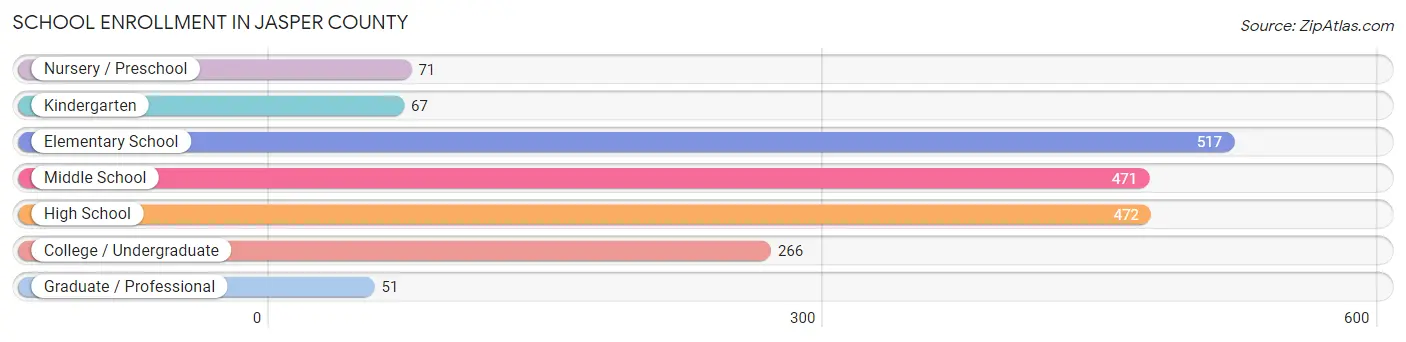
| School Level | # Students | % Students |
| Nursery / Preschool | 71 | 3.7% |
| Kindergarten | 67 | 3.5% |
| Elementary School | 517 | 27.0% |
| Middle School | 471 | 24.6% |
| High School | 472 | 24.6% |
| College / Undergraduate | 266 | 13.9% |
| Graduate / Professional | 51 | 2.7% |
| Total | 1,915 | 100.0% |
School Enrollment by Age by Funding Source in Jasper County
Out of a total of 1,915 students who are enrolled in schools in Jasper County, 329 (17.2%) attend a private institution, while the remaining 1,586 (82.8%) are enrolled in public schools. The age group of 35 years and over has the highest likelihood of being enrolled in private schools, with 16 (44.4% in the age bracket) enrolled. Conversely, the age group of 25 to 34 year olds has the lowest likelihood of being enrolled in a private school, with 2 (100.0% in the age bracket) attending a public institution.
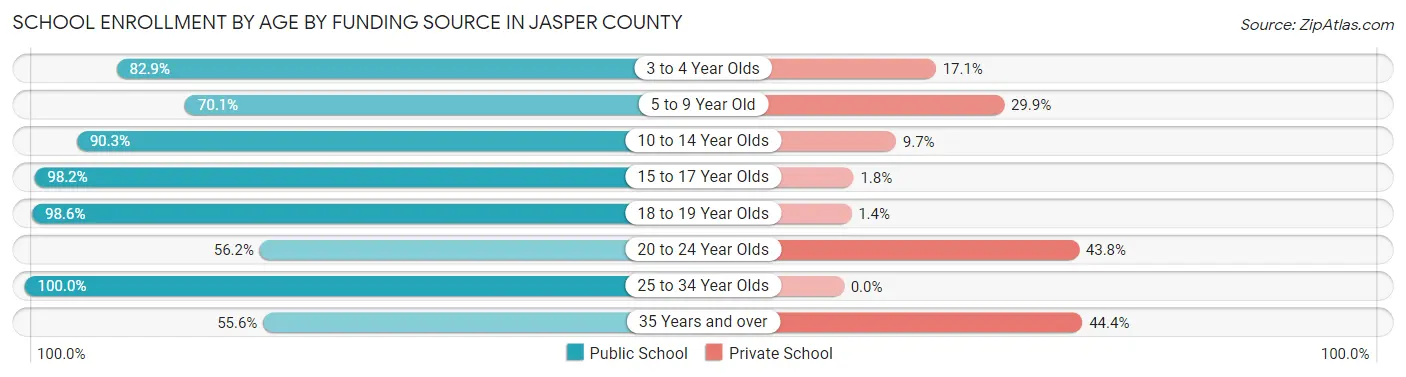
| Age Bracket | Public School | Private School |
| 3 to 4 Year Olds | 58 (82.9%) | 12 (17.1%) |
| 5 to 9 Year Old | 357 (70.1%) | 152 (29.9%) |
| 10 to 14 Year Olds | 520 (90.3%) | 56 (9.7%) |
| 15 to 17 Year Olds | 378 (98.2%) | 7 (1.8%) |
| 18 to 19 Year Olds | 141 (98.6%) | 2 (1.4%) |
| 20 to 24 Year Olds | 109 (56.2%) | 85 (43.8%) |
| 25 to 34 Year Olds | 2 (100.0%) | 0 (0.0%) |
| 35 Years and over | 20 (55.6%) | 16 (44.4%) |
| Total | 1,586 (82.8%) | 329 (17.2%) |
Educational Attainment by Field of Study in Jasper County
Bio, nature & agricultural (337 | 23.4%), education (300 | 20.8%), business (266 | 18.4%), science & technology (114 | 7.9%), and psychology (87 | 6.0%) are the most common fields of study among 1,443 individuals in Jasper County who have obtained a bachelor's degree or higher.
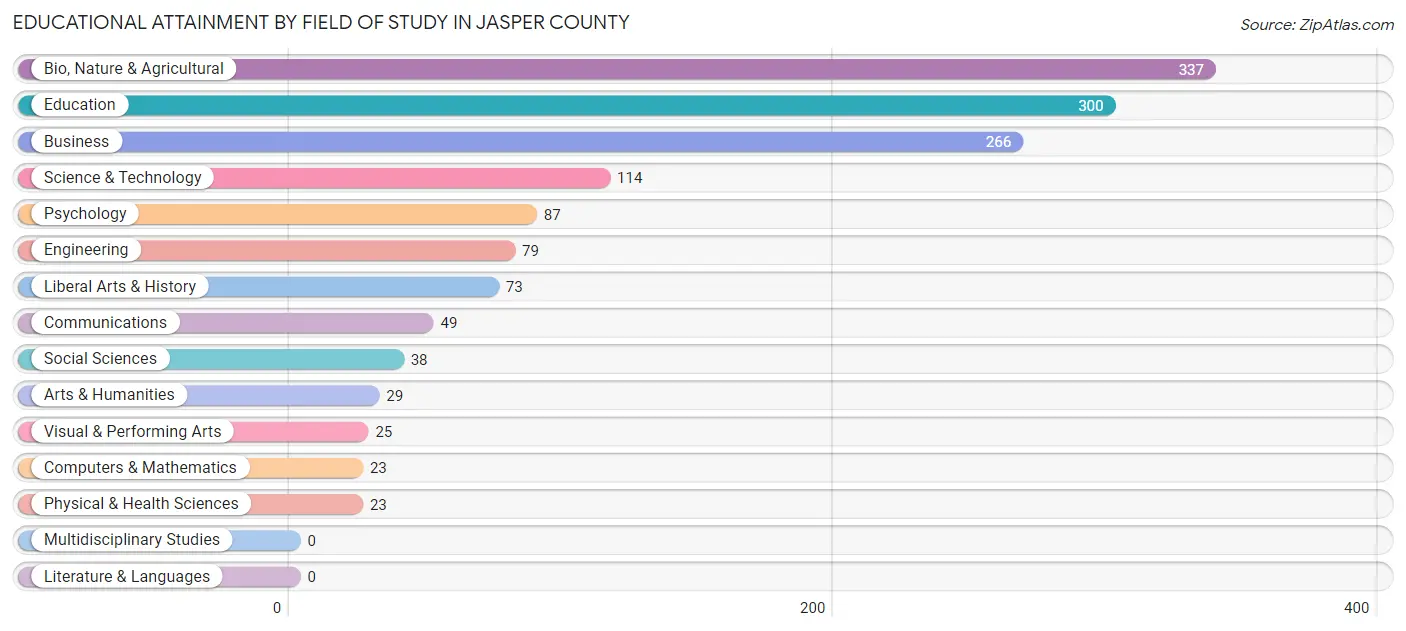
| Field of Study | # Graduates | % Graduates |
| Computers & Mathematics | 23 | 1.6% |
| Bio, Nature & Agricultural | 337 | 23.4% |
| Physical & Health Sciences | 23 | 1.6% |
| Psychology | 87 | 6.0% |
| Social Sciences | 38 | 2.6% |
| Engineering | 79 | 5.5% |
| Multidisciplinary Studies | 0 | 0.0% |
| Science & Technology | 114 | 7.9% |
| Business | 266 | 18.4% |
| Education | 300 | 20.8% |
| Literature & Languages | 0 | 0.0% |
| Liberal Arts & History | 73 | 5.1% |
| Visual & Performing Arts | 25 | 1.7% |
| Communications | 49 | 3.4% |
| Arts & Humanities | 29 | 2.0% |
| Total | 1,443 | 100.0% |
Transportation & Commute in Jasper County
Vehicle Availability by Sex in Jasper County
The most prevalent vehicle ownership categories in Jasper County are males with 2 vehicles (799, accounting for 31.4%) and females with 2 vehicles (637, making up 39.3%).
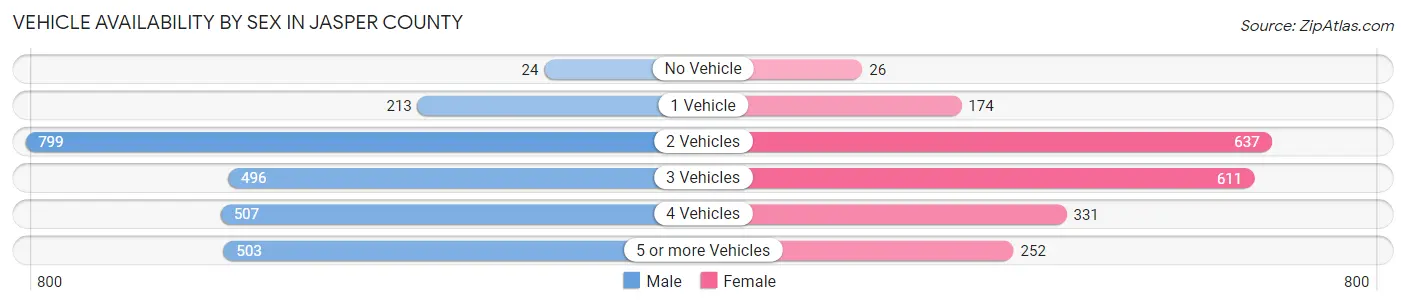
| Vehicles Available | Male | Female |
| No Vehicle | 24 (0.9%) | 26 (1.3%) |
| 1 Vehicle | 213 (8.4%) | 174 (8.6%) |
| 2 Vehicles | 799 (31.4%) | 637 (31.4%) |
| 3 Vehicles | 496 (19.5%) | 611 (30.1%) |
| 4 Vehicles | 507 (19.9%) | 331 (16.3%) |
| 5 or more Vehicles | 503 (19.8%) | 252 (12.4%) |
| Total | 2,542 (100.0%) | 2,031 (100.0%) |
Commute Time in Jasper County
The most frequently occuring commute durations in Jasper County are 30 to 34 minutes (719 commuters, 16.9%), 10 to 14 minutes (583 commuters, 13.7%), and 20 to 24 minutes (513 commuters, 12.1%).
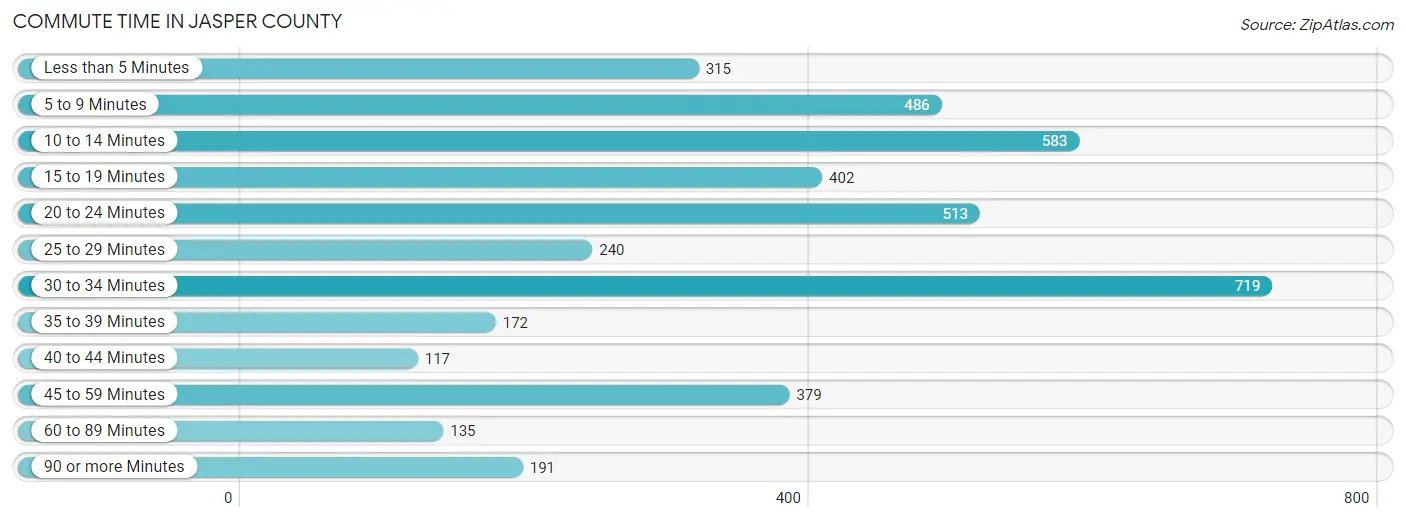
| Commute Time | # Commuters | % Commuters |
| Less than 5 Minutes | 315 | 7.4% |
| 5 to 9 Minutes | 486 | 11.4% |
| 10 to 14 Minutes | 583 | 13.7% |
| 15 to 19 Minutes | 402 | 9.5% |
| 20 to 24 Minutes | 513 | 12.1% |
| 25 to 29 Minutes | 240 | 5.6% |
| 30 to 34 Minutes | 719 | 16.9% |
| 35 to 39 Minutes | 172 | 4.1% |
| 40 to 44 Minutes | 117 | 2.8% |
| 45 to 59 Minutes | 379 | 8.9% |
| 60 to 89 Minutes | 135 | 3.2% |
| 90 or more Minutes | 191 | 4.5% |
Commute Time by Sex in Jasper County
The most common commute times in Jasper County are 30 to 34 minutes (460 commuters, 19.1%) for males and 10 to 14 minutes (295 commuters, 16.0%) for females.
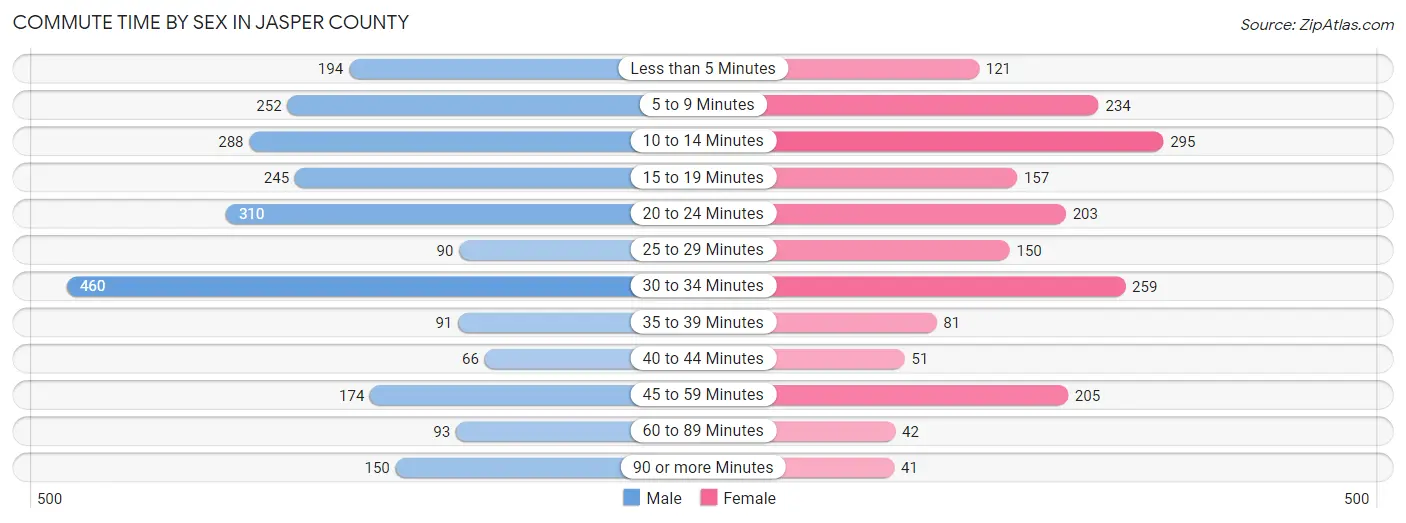
| Commute Time | Male | Female |
| Less than 5 Minutes | 194 (8.0%) | 121 (6.6%) |
| 5 to 9 Minutes | 252 (10.4%) | 234 (12.7%) |
| 10 to 14 Minutes | 288 (11.9%) | 295 (16.0%) |
| 15 to 19 Minutes | 245 (10.2%) | 157 (8.5%) |
| 20 to 24 Minutes | 310 (12.9%) | 203 (11.0%) |
| 25 to 29 Minutes | 90 (3.7%) | 150 (8.2%) |
| 30 to 34 Minutes | 460 (19.1%) | 259 (14.1%) |
| 35 to 39 Minutes | 91 (3.8%) | 81 (4.4%) |
| 40 to 44 Minutes | 66 (2.7%) | 51 (2.8%) |
| 45 to 59 Minutes | 174 (7.2%) | 205 (11.2%) |
| 60 to 89 Minutes | 93 (3.8%) | 42 (2.3%) |
| 90 or more Minutes | 150 (6.2%) | 41 (2.2%) |
Time of Departure to Work by Sex in Jasper County
The most frequent times of departure to work in Jasper County are 6:30 AM to 6:59 AM (542, 22.5%) for males and 7:30 AM to 7:59 AM (384, 20.9%) for females.
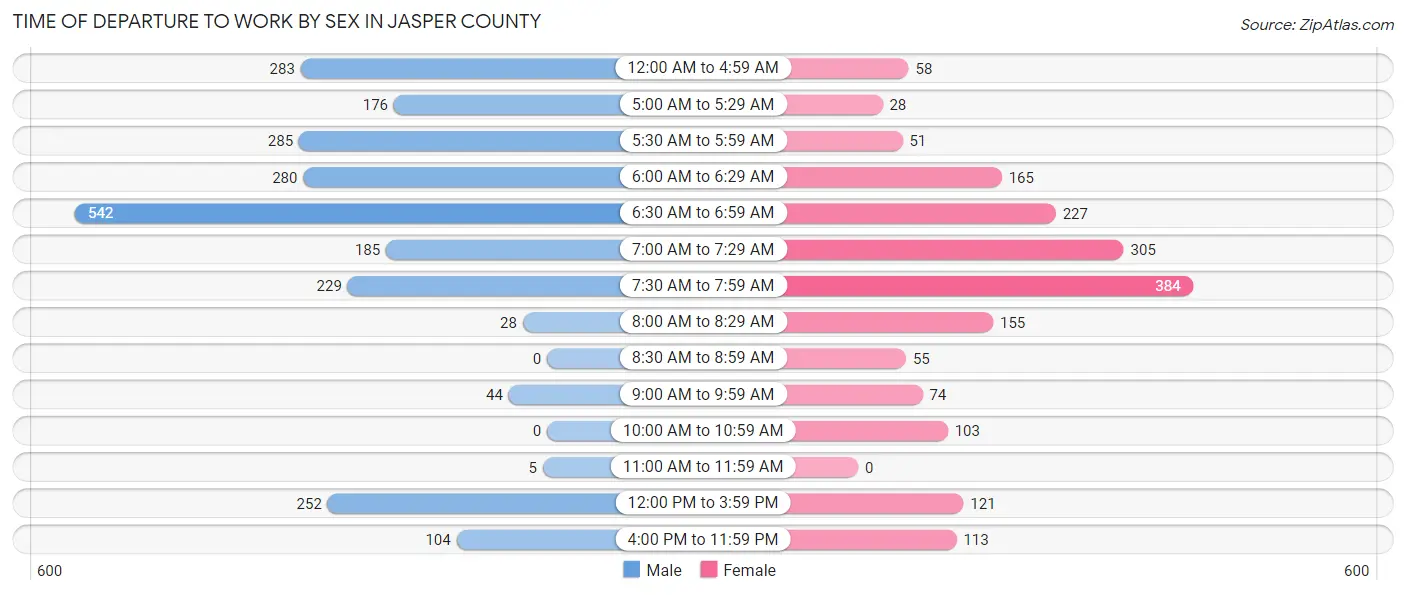
| Time of Departure | Male | Female |
| 12:00 AM to 4:59 AM | 283 (11.7%) | 58 (3.2%) |
| 5:00 AM to 5:29 AM | 176 (7.3%) | 28 (1.5%) |
| 5:30 AM to 5:59 AM | 285 (11.8%) | 51 (2.8%) |
| 6:00 AM to 6:29 AM | 280 (11.6%) | 165 (9.0%) |
| 6:30 AM to 6:59 AM | 542 (22.5%) | 227 (12.3%) |
| 7:00 AM to 7:29 AM | 185 (7.7%) | 305 (16.6%) |
| 7:30 AM to 7:59 AM | 229 (9.5%) | 384 (20.9%) |
| 8:00 AM to 8:29 AM | 28 (1.2%) | 155 (8.4%) |
| 8:30 AM to 8:59 AM | 0 (0.0%) | 55 (3.0%) |
| 9:00 AM to 9:59 AM | 44 (1.8%) | 74 (4.0%) |
| 10:00 AM to 10:59 AM | 0 (0.0%) | 103 (5.6%) |
| 11:00 AM to 11:59 AM | 5 (0.2%) | 0 (0.0%) |
| 12:00 PM to 3:59 PM | 252 (10.4%) | 121 (6.6%) |
| 4:00 PM to 11:59 PM | 104 (4.3%) | 113 (6.1%) |
| Total | 2,413 (100.0%) | 1,839 (100.0%) |
Housing Occupancy in Jasper County
Occupancy by Ownership in Jasper County
Of the total 3,710 dwellings in Jasper County, owner-occupied units account for 3,033 (81.8%), while renter-occupied units make up 677 (18.2%).
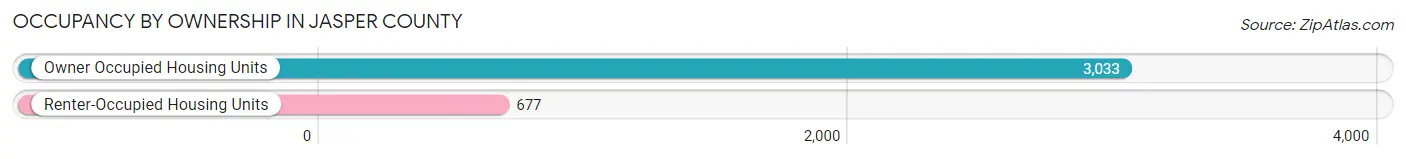
| Occupancy | # Housing Units | % Housing Units |
| Owner Occupied Housing Units | 3,033 | 81.8% |
| Renter-Occupied Housing Units | 677 | 18.2% |
| Total Occupied Housing Units | 3,710 | 100.0% |
Occupancy by Household Size in Jasper County
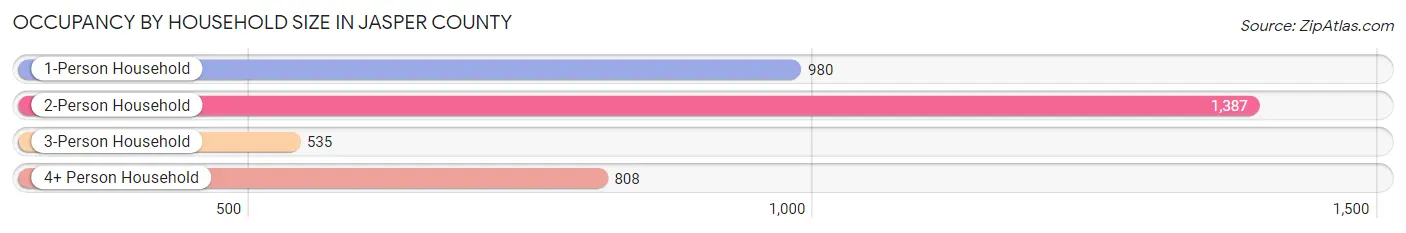
| Household Size | # Housing Units | % Housing Units |
| 1-Person Household | 980 | 26.4% |
| 2-Person Household | 1,387 | 37.4% |
| 3-Person Household | 535 | 14.4% |
| 4+ Person Household | 808 | 21.8% |
| Total Housing Units | 3,710 | 100.0% |
Occupancy by Ownership by Household Size in Jasper County
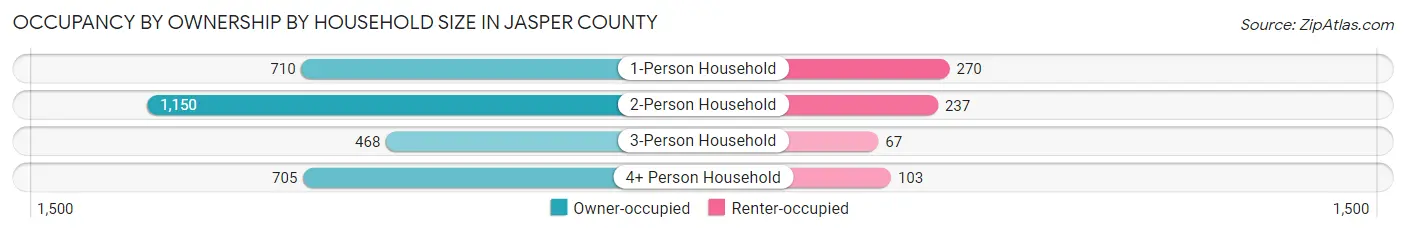
| Household Size | Owner-occupied | Renter-occupied |
| 1-Person Household | 710 (72.5%) | 270 (27.6%) |
| 2-Person Household | 1,150 (82.9%) | 237 (17.1%) |
| 3-Person Household | 468 (87.5%) | 67 (12.5%) |
| 4+ Person Household | 705 (87.3%) | 103 (12.8%) |
| Total Housing Units | 3,033 (81.8%) | 677 (18.2%) |
Occupancy by Educational Attainment in Jasper County
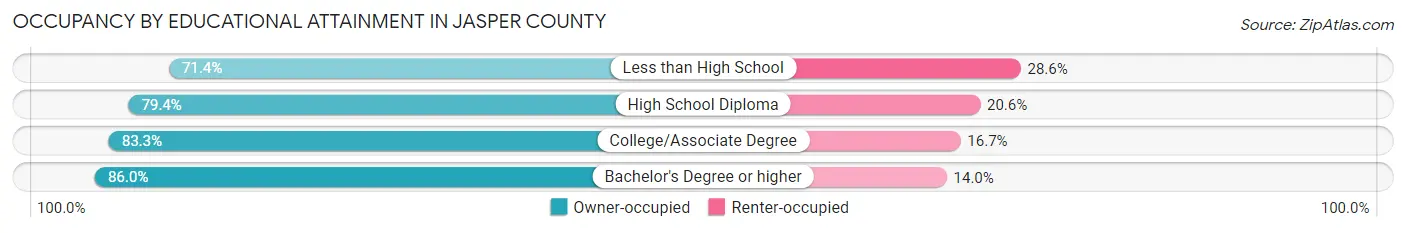
| Household Size | Owner-occupied | Renter-occupied |
| Less than High School | 187 (71.4%) | 75 (28.6%) |
| High School Diploma | 998 (79.4%) | 259 (20.6%) |
| College/Associate Degree | 1,127 (83.3%) | 226 (16.7%) |
| Bachelor's Degree or higher | 721 (86.0%) | 117 (14.0%) |
Occupancy by Age of Householder in Jasper County
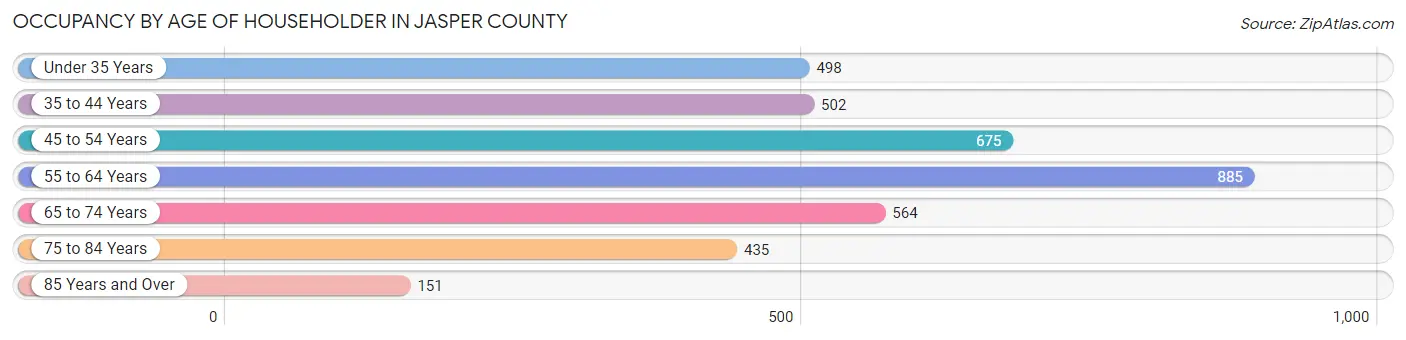
| Age Bracket | # Households | % Households |
| Under 35 Years | 498 | 13.4% |
| 35 to 44 Years | 502 | 13.5% |
| 45 to 54 Years | 675 | 18.2% |
| 55 to 64 Years | 885 | 23.8% |
| 65 to 74 Years | 564 | 15.2% |
| 75 to 84 Years | 435 | 11.7% |
| 85 Years and Over | 151 | 4.1% |
| Total | 3,710 | 100.0% |
Housing Finances in Jasper County
Median Income by Occupancy in Jasper County
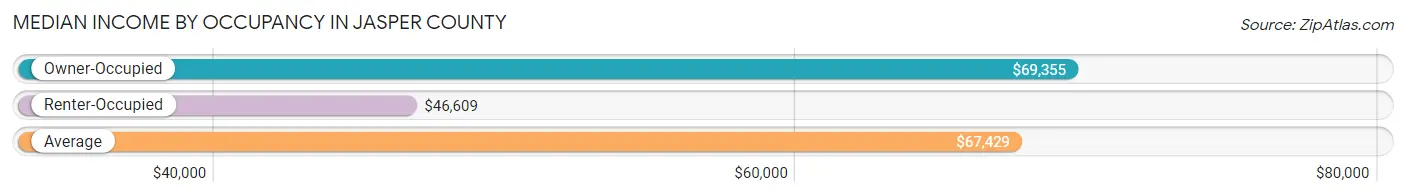
| Occupancy Type | # Households | Median Income |
| Owner-Occupied | 3,033 (81.8%) | $69,355 |
| Renter-Occupied | 677 (18.2%) | $46,609 |
| Average | 3,710 (100.0%) | $67,429 |
Occupancy by Householder Income Bracket in Jasper County
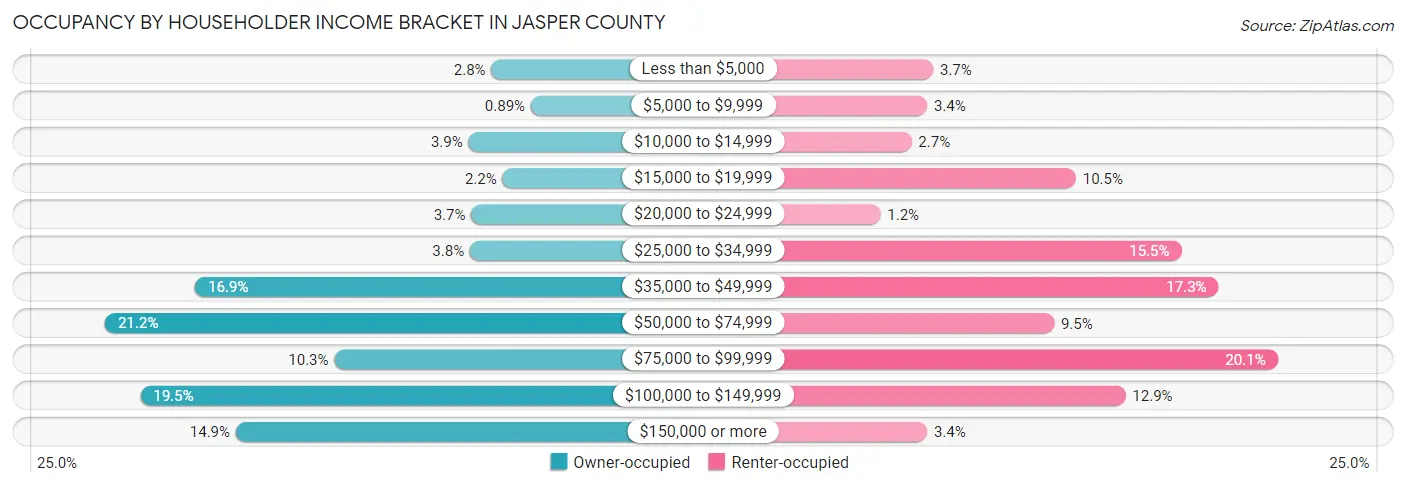
| Income Bracket | Owner-occupied | Renter-occupied |
| Less than $5,000 | 84 (2.8%) | 25 (3.7%) |
| $5,000 to $9,999 | 27 (0.9%) | 23 (3.4%) |
| $10,000 to $14,999 | 117 (3.9%) | 18 (2.7%) |
| $15,000 to $19,999 | 68 (2.2%) | 71 (10.5%) |
| $20,000 to $24,999 | 113 (3.7%) | 8 (1.2%) |
| $25,000 to $34,999 | 115 (3.8%) | 105 (15.5%) |
| $35,000 to $49,999 | 512 (16.9%) | 117 (17.3%) |
| $50,000 to $74,999 | 642 (21.2%) | 64 (9.5%) |
| $75,000 to $99,999 | 311 (10.2%) | 136 (20.1%) |
| $100,000 to $149,999 | 591 (19.5%) | 87 (12.9%) |
| $150,000 or more | 453 (14.9%) | 23 (3.4%) |
| Total | 3,033 (100.0%) | 677 (100.0%) |
Monthly Housing Cost Tiers in Jasper County
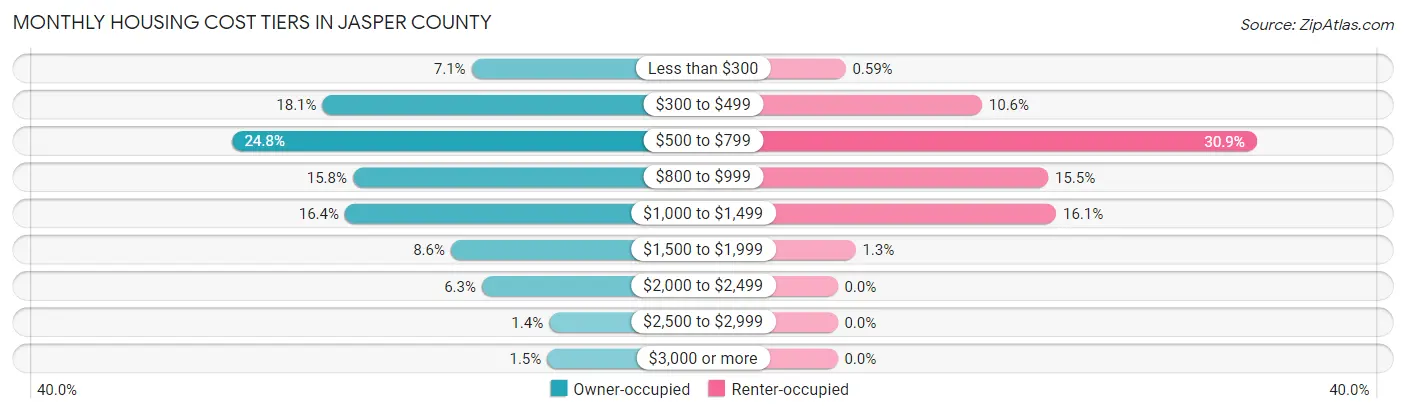
| Monthly Cost | Owner-occupied | Renter-occupied |
| Less than $300 | 215 (7.1%) | 4 (0.6%) |
| $300 to $499 | 548 (18.1%) | 72 (10.6%) |
| $500 to $799 | 751 (24.8%) | 209 (30.9%) |
| $800 to $999 | 480 (15.8%) | 105 (15.5%) |
| $1,000 to $1,499 | 498 (16.4%) | 109 (16.1%) |
| $1,500 to $1,999 | 261 (8.6%) | 9 (1.3%) |
| $2,000 to $2,499 | 192 (6.3%) | 0 (0.0%) |
| $2,500 to $2,999 | 42 (1.4%) | 0 (0.0%) |
| $3,000 or more | 46 (1.5%) | 0 (0.0%) |
| Total | 3,033 (100.0%) | 677 (100.0%) |
Physical Housing Characteristics in Jasper County
Housing Structures in Jasper County
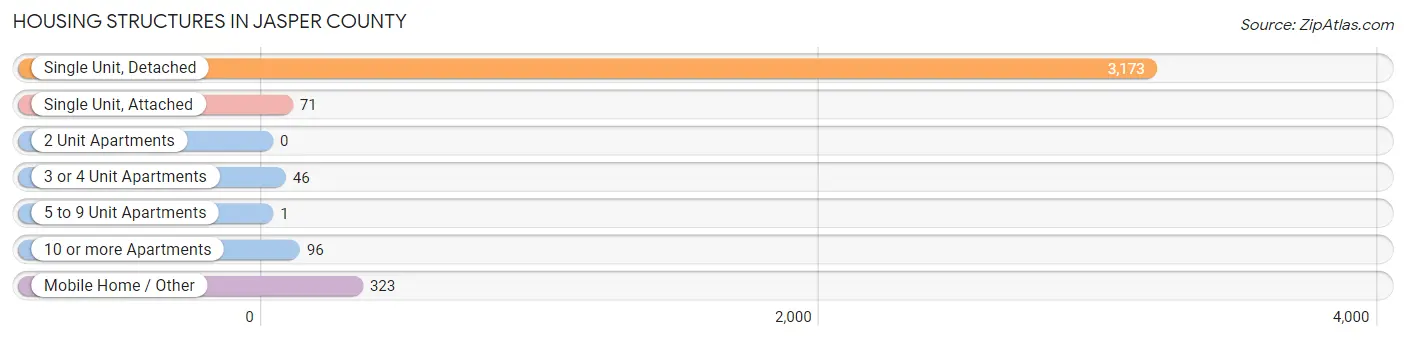
| Structure Type | # Housing Units | % Housing Units |
| Single Unit, Detached | 3,173 | 85.5% |
| Single Unit, Attached | 71 | 1.9% |
| 2 Unit Apartments | 0 | 0.0% |
| 3 or 4 Unit Apartments | 46 | 1.2% |
| 5 to 9 Unit Apartments | 1 | 0.0% |
| 10 or more Apartments | 96 | 2.6% |
| Mobile Home / Other | 323 | 8.7% |
| Total | 3,710 | 100.0% |
Housing Structures by Occupancy in Jasper County
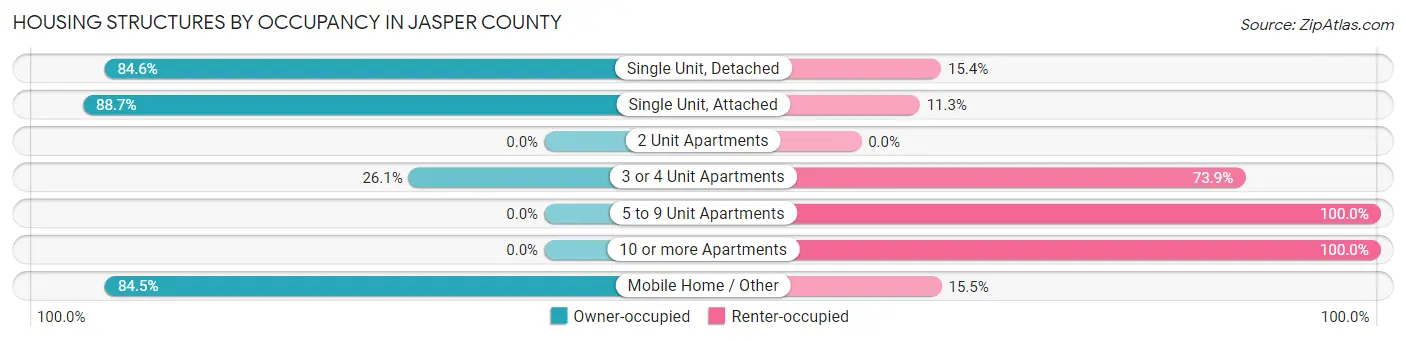
| Structure Type | Owner-occupied | Renter-occupied |
| Single Unit, Detached | 2,685 (84.6%) | 488 (15.4%) |
| Single Unit, Attached | 63 (88.7%) | 8 (11.3%) |
| 2 Unit Apartments | 0 (0.0%) | 0 (0.0%) |
| 3 or 4 Unit Apartments | 12 (26.1%) | 34 (73.9%) |
| 5 to 9 Unit Apartments | 0 (0.0%) | 1 (100.0%) |
| 10 or more Apartments | 0 (0.0%) | 96 (100.0%) |
| Mobile Home / Other | 273 (84.5%) | 50 (15.5%) |
| Total | 3,033 (81.8%) | 677 (18.2%) |
Housing Structures by Number of Rooms in Jasper County
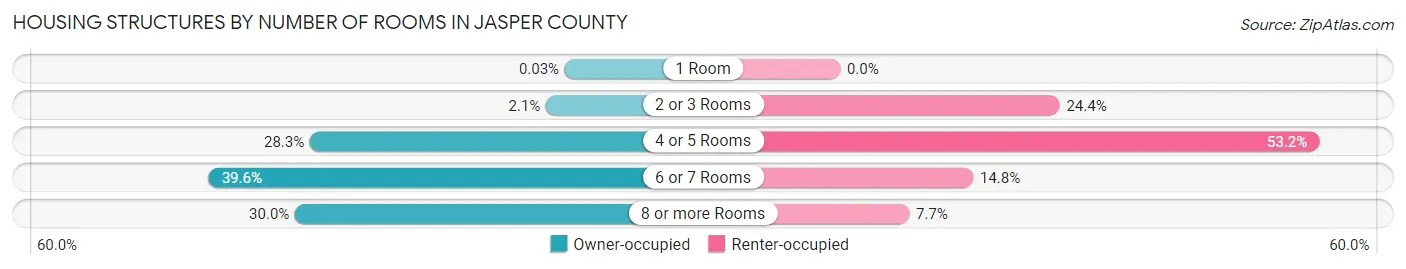
| Number of Rooms | Owner-occupied | Renter-occupied |
| 1 Room | 1 (0.0%) | 0 (0.0%) |
| 2 or 3 Rooms | 64 (2.1%) | 165 (24.4%) |
| 4 or 5 Rooms | 859 (28.3%) | 360 (53.2%) |
| 6 or 7 Rooms | 1,200 (39.6%) | 100 (14.8%) |
| 8 or more Rooms | 909 (30.0%) | 52 (7.7%) |
| Total | 3,033 (100.0%) | 677 (100.0%) |
Housing Structure by Heating Type in Jasper County
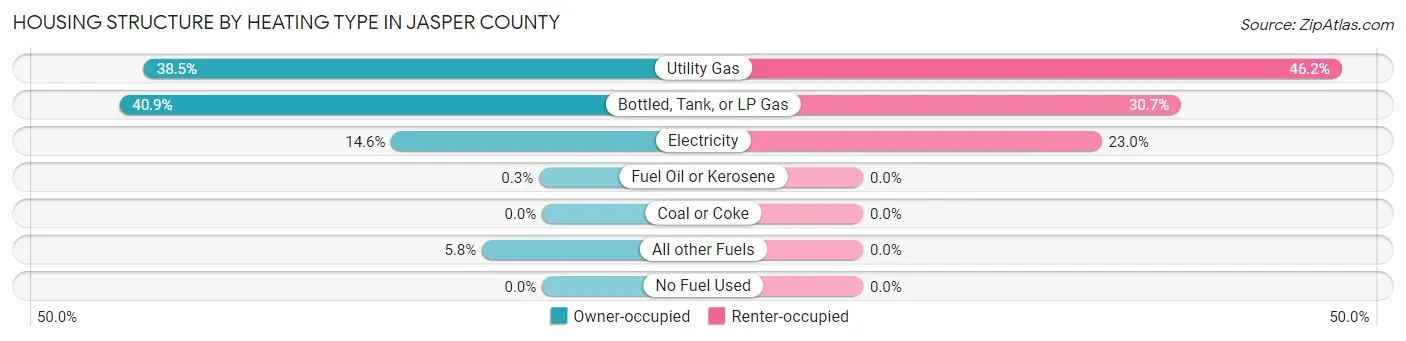
| Heating Type | Owner-occupied | Renter-occupied |
| Utility Gas | 1,167 (38.5%) | 313 (46.2%) |
| Bottled, Tank, or LP Gas | 1,239 (40.8%) | 208 (30.7%) |
| Electricity | 442 (14.6%) | 156 (23.0%) |
| Fuel Oil or Kerosene | 9 (0.3%) | 0 (0.0%) |
| Coal or Coke | 0 (0.0%) | 0 (0.0%) |
| All other Fuels | 176 (5.8%) | 0 (0.0%) |
| No Fuel Used | 0 (0.0%) | 0 (0.0%) |
| Total | 3,033 (100.0%) | 677 (100.0%) |
Household Vehicle Usage in Jasper County
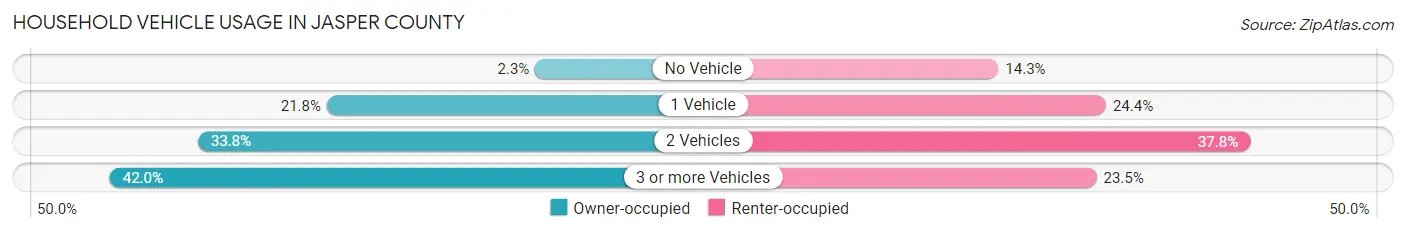
| Vehicles per Household | Owner-occupied | Renter-occupied |
| No Vehicle | 71 (2.3%) | 97 (14.3%) |
| 1 Vehicle | 661 (21.8%) | 165 (24.4%) |
| 2 Vehicles | 1,026 (33.8%) | 256 (37.8%) |
| 3 or more Vehicles | 1,275 (42.0%) | 159 (23.5%) |
| Total | 3,033 (100.0%) | 677 (100.0%) |
Real Estate & Mortgages in Jasper County
Real Estate and Mortgage Overview in Jasper County
| Characteristic | Without Mortgage | With Mortgage |
| Housing Units | 1,696 | 1,337 |
| Median Property Value | $107,500 | $138,600 |
| Median Household Income | $68,257 | $296 |
| Monthly Housing Costs | $534 | $33 |
| Real Estate Taxes | $1,781 | $18 |
Property Value by Mortgage Status in Jasper County
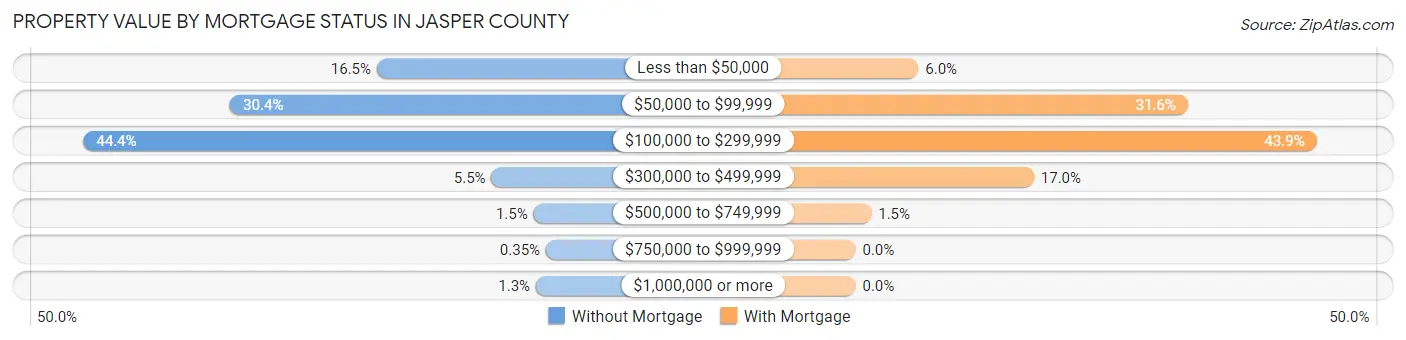
| Property Value | Without Mortgage | With Mortgage |
| Less than $50,000 | 279 (16.5%) | 80 (6.0%) |
| $50,000 to $99,999 | 516 (30.4%) | 423 (31.6%) |
| $100,000 to $299,999 | 753 (44.4%) | 587 (43.9%) |
| $300,000 to $499,999 | 94 (5.5%) | 227 (17.0%) |
| $500,000 to $749,999 | 26 (1.5%) | 20 (1.5%) |
| $750,000 to $999,999 | 6 (0.4%) | 0 (0.0%) |
| $1,000,000 or more | 22 (1.3%) | 0 (0.0%) |
| Total | 1,696 (100.0%) | 1,337 (100.0%) |
Household Income by Mortgage Status in Jasper County
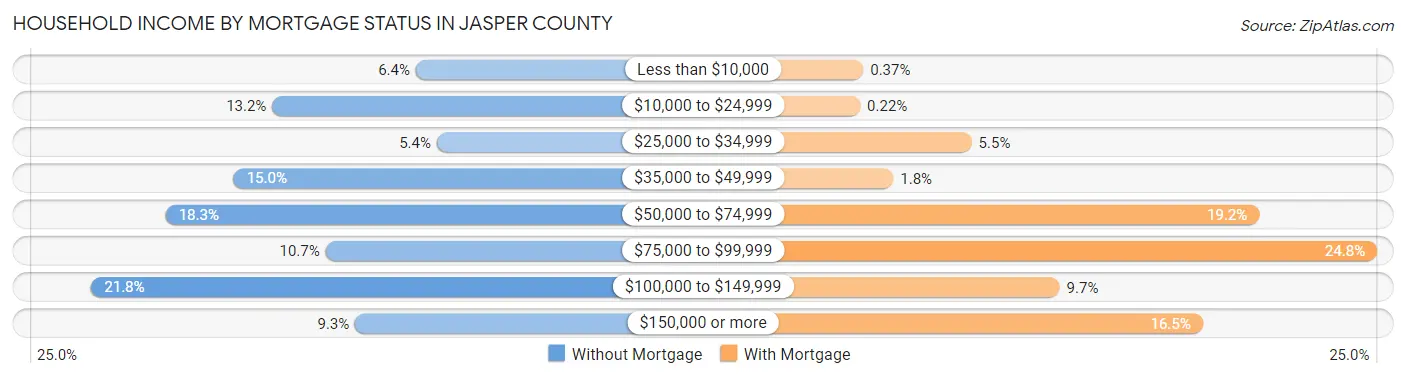
| Household Income | Without Mortgage | With Mortgage |
| Less than $10,000 | 108 (6.4%) | 5 (0.4%) |
| $10,000 to $24,999 | 224 (13.2%) | 3 (0.2%) |
| $25,000 to $34,999 | 91 (5.4%) | 74 (5.5%) |
| $35,000 to $49,999 | 255 (15.0%) | 24 (1.8%) |
| $50,000 to $74,999 | 310 (18.3%) | 257 (19.2%) |
| $75,000 to $99,999 | 181 (10.7%) | 332 (24.8%) |
| $100,000 to $149,999 | 370 (21.8%) | 130 (9.7%) |
| $150,000 or more | 157 (9.3%) | 221 (16.5%) |
| Total | 1,696 (100.0%) | 1,337 (100.0%) |
Property Value to Household Income Ratio in Jasper County
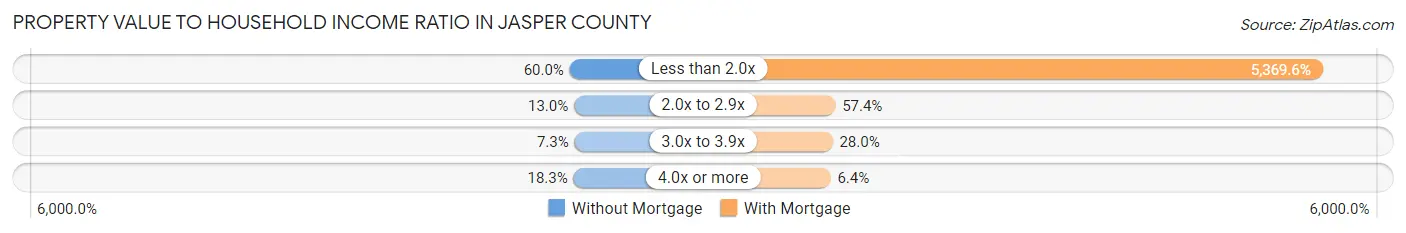
| Value-to-Income Ratio | Without Mortgage | With Mortgage |
| Less than 2.0x | 1,018 (60.0%) | 71,792 (5,369.6%) |
| 2.0x to 2.9x | 220 (13.0%) | 767 (57.4%) |
| 3.0x to 3.9x | 124 (7.3%) | 374 (28.0%) |
| 4.0x or more | 310 (18.3%) | 85 (6.4%) |
| Total | 1,696 (100.0%) | 1,337 (100.0%) |
Real Estate Taxes by Mortgage Status in Jasper County
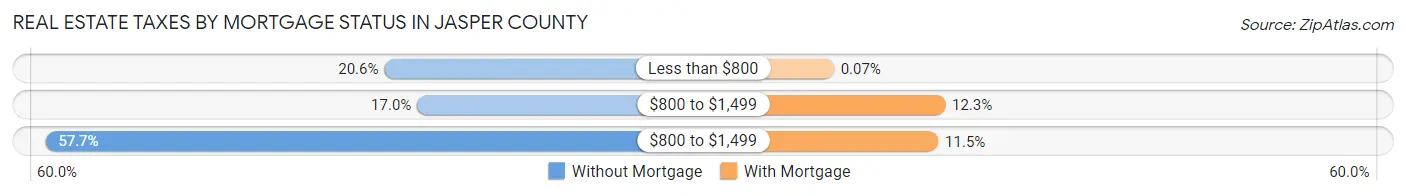
| Property Taxes | Without Mortgage | With Mortgage |
| Less than $800 | 349 (20.6%) | 1 (0.1%) |
| $800 to $1,499 | 288 (17.0%) | 164 (12.3%) |
| $800 to $1,499 | 979 (57.7%) | 154 (11.5%) |
| Total | 1,696 (100.0%) | 1,337 (100.0%) |
Health & Disability in Jasper County
Health Insurance Coverage by Age in Jasper County
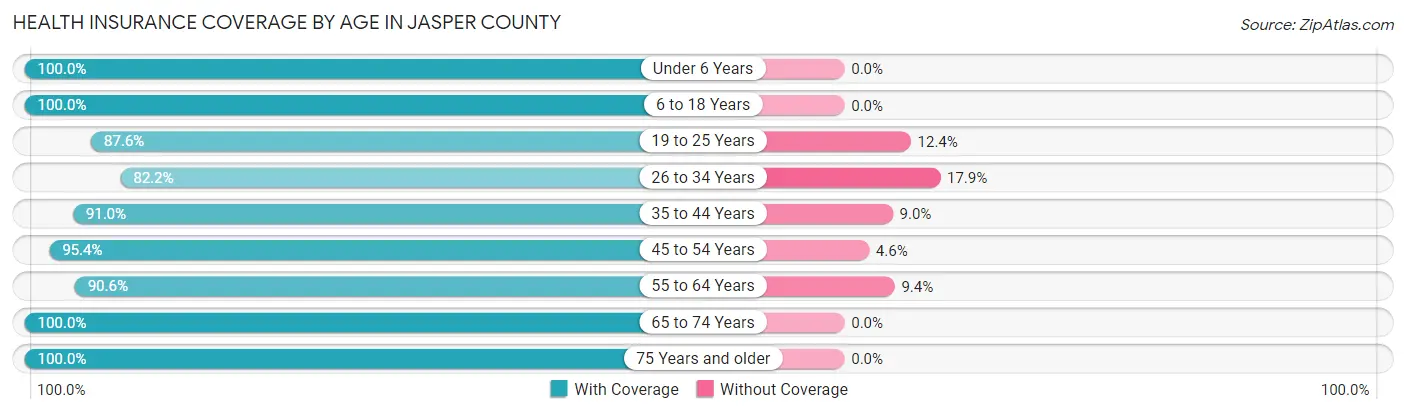
| Age Bracket | With Coverage | Without Coverage |
| Under 6 Years | 632 (100.0%) | 0 (0.0%) |
| 6 to 18 Years | 1,576 (100.0%) | 0 (0.0%) |
| 19 to 25 Years | 588 (87.6%) | 83 (12.4%) |
| 26 to 34 Years | 704 (82.2%) | 153 (17.8%) |
| 35 to 44 Years | 950 (91.0%) | 94 (9.0%) |
| 45 to 54 Years | 1,122 (95.4%) | 54 (4.6%) |
| 55 to 64 Years | 1,317 (90.6%) | 136 (9.4%) |
| 65 to 74 Years | 1,065 (100.0%) | 0 (0.0%) |
| 75 Years and older | 749 (100.0%) | 0 (0.0%) |
| Total | 8,703 (94.4%) | 520 (5.6%) |
Health Insurance Coverage by Citizenship Status in Jasper County
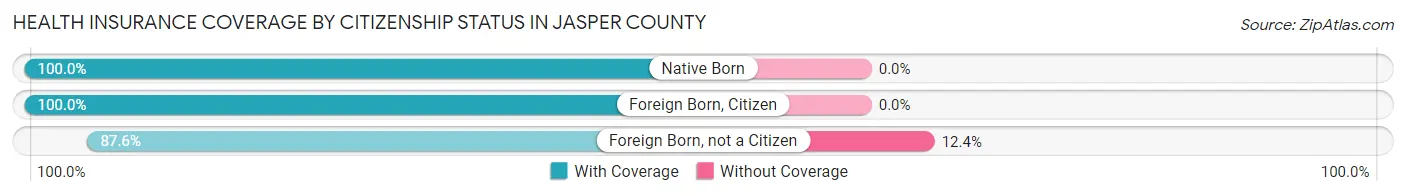
| Citizenship Status | With Coverage | Without Coverage |
| Native Born | 632 (100.0%) | 0 (0.0%) |
| Foreign Born, Citizen | 1,576 (100.0%) | 0 (0.0%) |
| Foreign Born, not a Citizen | 588 (87.6%) | 83 (12.4%) |
Health Insurance Coverage by Household Income in Jasper County
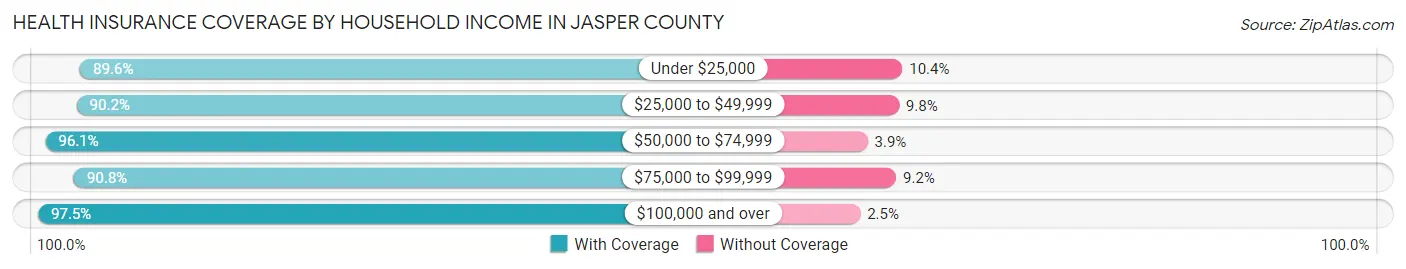
| Household Income | With Coverage | Without Coverage |
| Under $25,000 | 827 (89.6%) | 96 (10.4%) |
| $25,000 to $49,999 | 1,387 (90.2%) | 150 (9.8%) |
| $50,000 to $74,999 | 1,700 (96.1%) | 69 (3.9%) |
| $75,000 to $99,999 | 1,081 (90.8%) | 110 (9.2%) |
| $100,000 and over | 3,689 (97.5%) | 95 (2.5%) |
Public vs Private Health Insurance Coverage by Age in Jasper County
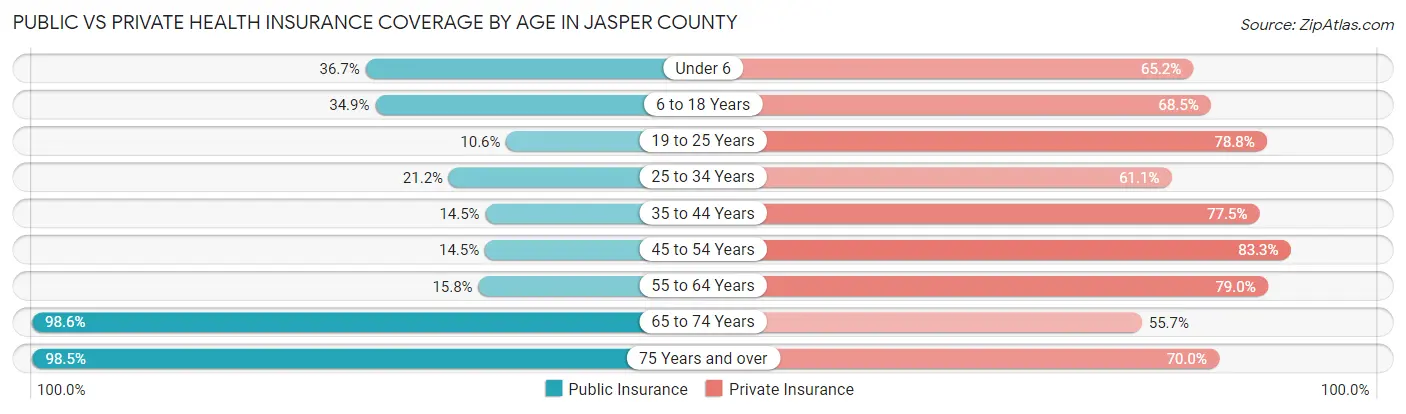
| Age Bracket | Public Insurance | Private Insurance |
| Under 6 | 232 (36.7%) | 412 (65.2%) |
| 6 to 18 Years | 550 (34.9%) | 1,079 (68.5%) |
| 19 to 25 Years | 71 (10.6%) | 529 (78.8%) |
| 25 to 34 Years | 182 (21.2%) | 524 (61.1%) |
| 35 to 44 Years | 151 (14.5%) | 809 (77.5%) |
| 45 to 54 Years | 171 (14.5%) | 979 (83.3%) |
| 55 to 64 Years | 229 (15.8%) | 1,148 (79.0%) |
| 65 to 74 Years | 1,050 (98.6%) | 593 (55.7%) |
| 75 Years and over | 738 (98.5%) | 524 (70.0%) |
| Total | 3,374 (36.6%) | 6,597 (71.5%) |
Disability Status by Sex by Age in Jasper County
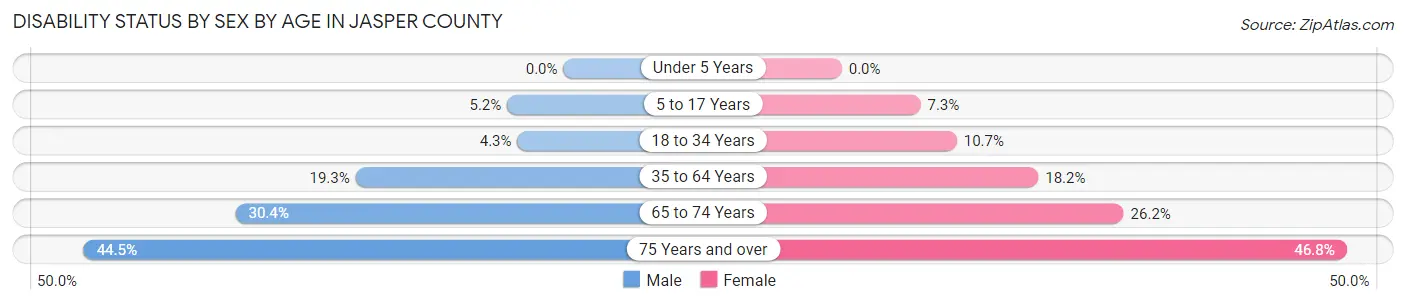
| Age Bracket | Male | Female |
| Under 5 Years | 0 (0.0%) | 0 (0.0%) |
| 5 to 17 Years | 42 (5.2%) | 53 (7.3%) |
| 18 to 34 Years | 35 (4.3%) | 88 (10.7%) |
| 35 to 64 Years | 366 (19.3%) | 324 (18.2%) |
| 65 to 74 Years | 160 (30.4%) | 141 (26.2%) |
| 75 Years and over | 150 (44.5%) | 193 (46.8%) |
Disability Class by Sex by Age in Jasper County
Disability Class: Hearing Difficulty
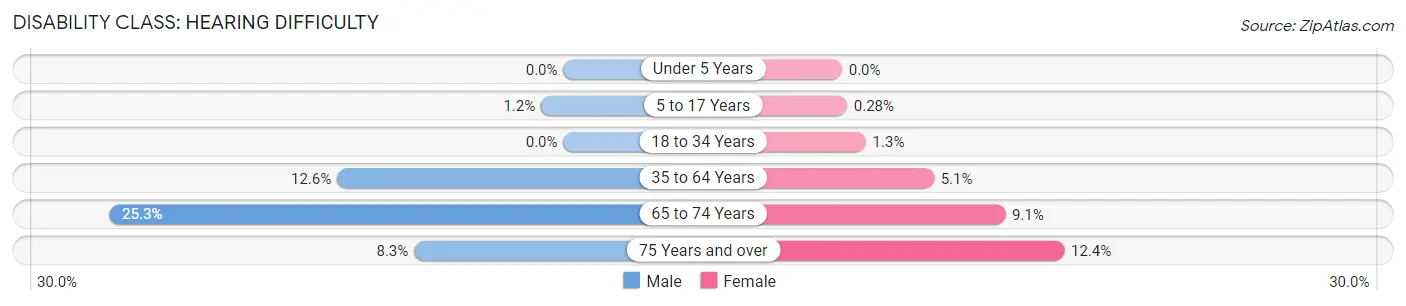
| Age Bracket | Male | Female |
| Under 5 Years | 0 (0.0%) | 0 (0.0%) |
| 5 to 17 Years | 10 (1.2%) | 2 (0.3%) |
| 18 to 34 Years | 0 (0.0%) | 11 (1.3%) |
| 35 to 64 Years | 239 (12.6%) | 91 (5.1%) |
| 65 to 74 Years | 133 (25.3%) | 49 (9.1%) |
| 75 Years and over | 28 (8.3%) | 51 (12.4%) |
Disability Class: Vision Difficulty
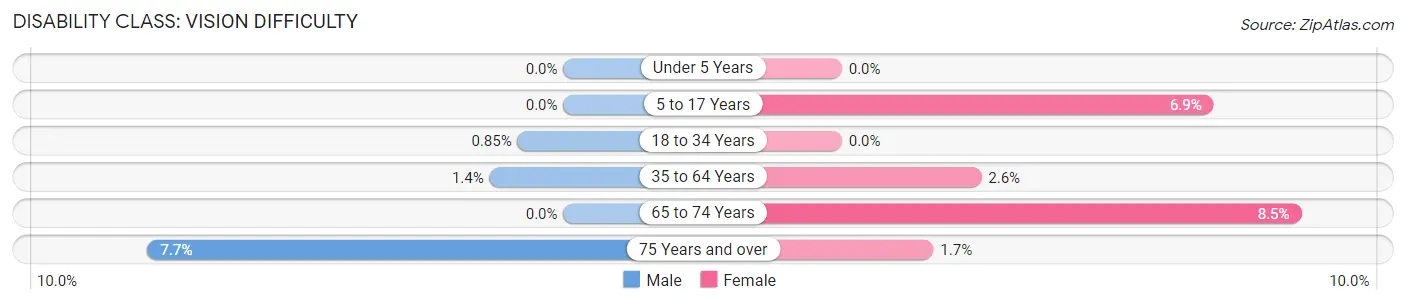
| Age Bracket | Male | Female |
| Under 5 Years | 0 (0.0%) | 0 (0.0%) |
| 5 to 17 Years | 0 (0.0%) | 50 (6.9%) |
| 18 to 34 Years | 7 (0.9%) | 0 (0.0%) |
| 35 to 64 Years | 26 (1.4%) | 46 (2.6%) |
| 65 to 74 Years | 0 (0.0%) | 46 (8.5%) |
| 75 Years and over | 26 (7.7%) | 7 (1.7%) |
Disability Class: Cognitive Difficulty
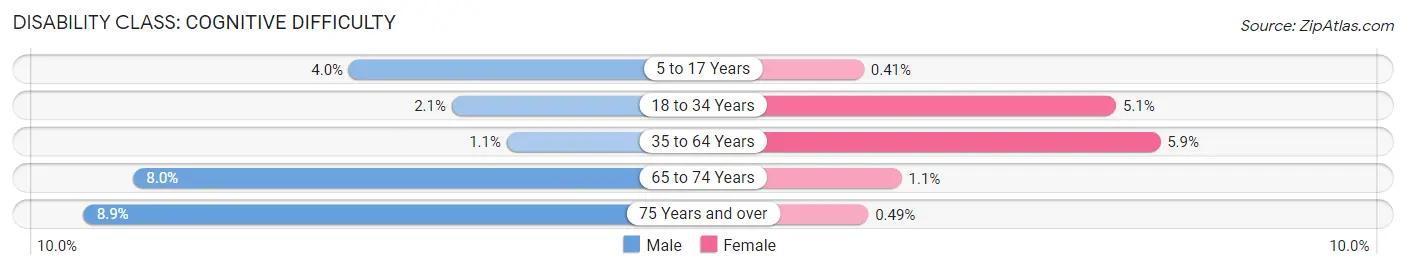
| Age Bracket | Male | Female |
| 5 to 17 Years | 32 (4.0%) | 3 (0.4%) |
| 18 to 34 Years | 17 (2.1%) | 42 (5.1%) |
| 35 to 64 Years | 20 (1.1%) | 105 (5.9%) |
| 65 to 74 Years | 42 (8.0%) | 6 (1.1%) |
| 75 Years and over | 30 (8.9%) | 2 (0.5%) |
Disability Class: Ambulatory Difficulty
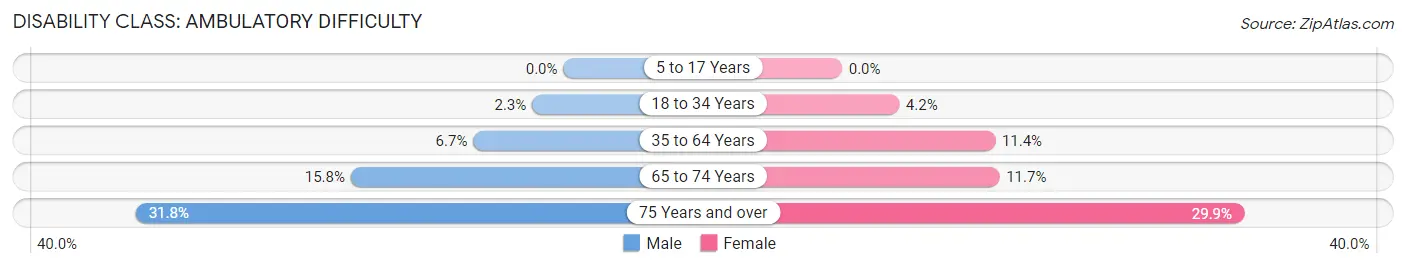
| Age Bracket | Male | Female |
| 5 to 17 Years | 0 (0.0%) | 0 (0.0%) |
| 18 to 34 Years | 19 (2.3%) | 35 (4.2%) |
| 35 to 64 Years | 127 (6.7%) | 202 (11.4%) |
| 65 to 74 Years | 83 (15.8%) | 63 (11.7%) |
| 75 Years and over | 107 (31.8%) | 123 (29.8%) |
Disability Class: Self-Care Difficulty
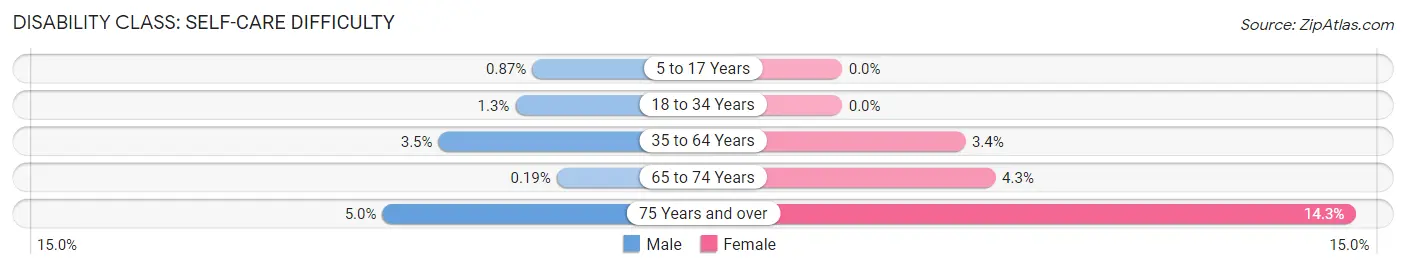
| Age Bracket | Male | Female |
| 5 to 17 Years | 7 (0.9%) | 0 (0.0%) |
| 18 to 34 Years | 11 (1.3%) | 0 (0.0%) |
| 35 to 64 Years | 66 (3.5%) | 61 (3.4%) |
| 65 to 74 Years | 1 (0.2%) | 23 (4.3%) |
| 75 Years and over | 17 (5.0%) | 59 (14.3%) |
Technology Access in Jasper County
Computing Device Access in Jasper County
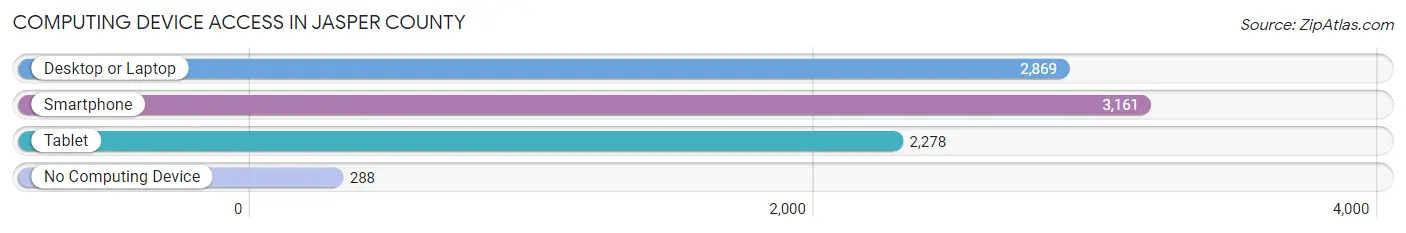
| Device Type | # Households | % Households |
| Desktop or Laptop | 2,869 | 77.3% |
| Smartphone | 3,161 | 85.2% |
| Tablet | 2,278 | 61.4% |
| No Computing Device | 288 | 7.8% |
| Total | 3,710 | 100.0% |
Internet Access in Jasper County
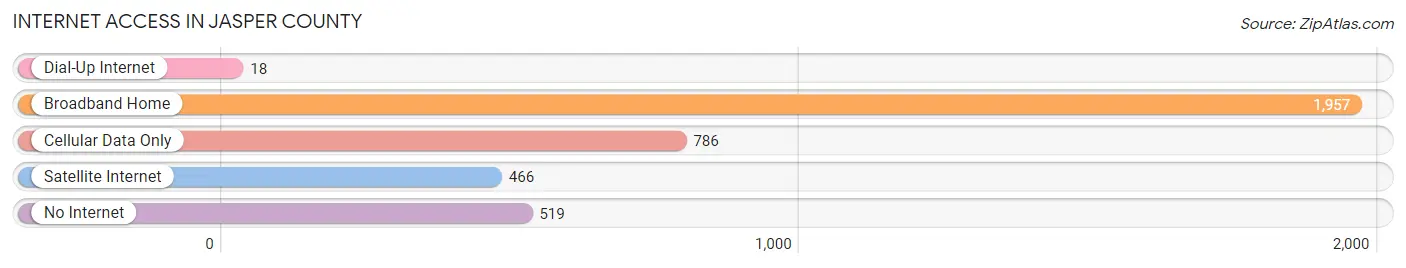
| Internet Type | # Households | % Households |
| Dial-Up Internet | 18 | 0.5% |
| Broadband Home | 1,957 | 52.7% |
| Cellular Data Only | 786 | 21.2% |
| Satellite Internet | 466 | 12.6% |
| No Internet | 519 | 14.0% |
| Total | 3,710 | 100.0% |
Jasper County Summary
Jasper County is located in the south-central region of Illinois, and is part of the greater Chicago metropolitan area. It is bordered by Iroquois County to the north, Effingham County to the east, Clay County to the south, and Richland County to the west. The county seat is Newton, and the largest city is Newton. The county has a total area of 545 square miles, and a population of approximately 9,000 people.
History
Jasper County was formed in 1831 from parts of Crawford and Edwards counties. It was named after William Jasper, a Revolutionary War hero who died in the Battle of Savannah. The county was initially settled by German immigrants, and the area was known for its coal mining industry. In the late 19th century, the county experienced a population boom due to the arrival of the railroad.
Geography
Jasper County is located in the south-central region of Illinois, and is part of the greater Chicago metropolitan area. It is bordered by Iroquois County to the north, Effingham County to the east, Clay County to the south, and Richland County to the west. The county has a total area of 545 square miles, and is mostly rural. The terrain is mostly flat, with some rolling hills in the northern part of the county. The Kaskaskia River runs through the county, and there are several small lakes and ponds scattered throughout the area.
Economy
Jasper County’s economy is largely based on agriculture and manufacturing. The county is home to several large farms, and the main crops grown are corn, soybeans, and wheat. The county also has several manufacturing plants, including a steel mill and a paper mill. In addition, the county is home to several small businesses, including restaurants, retail stores, and service providers.
Demographics
As of the 2010 census, Jasper County had a population of 8,902 people. The racial makeup of the county was 97.2% White, 0.7% African American, 0.3% Native American, 0.2% Asian, 0.1% Pacific Islander, 0.6% from other races, and 0.9% from two or more races. Hispanic or Latino of any race were 1.7% of the population.
The median income for a household in the county was $41,945, and the median income for a family was $50,945. The per capita income for the county was $20,945. About 11.2% of families and 14.2% of the population were below the poverty line, including 19.2% of those under age 18 and 8.2% of those age 65 or over.
Jasper County is a rural county with a small population and a largely agricultural economy. The county is home to several small businesses, and the main industries are agriculture and manufacturing. The county has a diverse population, with a mix of races and ethnicities.
Common Questions
What is Per Capita Income in Jasper County?
Per Capita income in Jasper County is $33,353.
What is the Median Family Income in Jasper County?
Median Family Income in Jasper County is $79,933.
What is the Median Household income in Jasper County?
Median Household Income in Jasper County is $67,429.
What is Income or Wage Gap in Jasper County?
Income or Wage Gap in Jasper County is 50.9%.
Women in Jasper County earn 49.1 cents for every dollar earned by a man.
What is Inequality or Gini Index in Jasper County?
Inequality or Gini Index in Jasper County is 0.40.
What is the Total Population of Jasper County?
Total Population of Jasper County is 9,295.
What is the Total Male Population of Jasper County?
Total Male Population of Jasper County is 4,713.
What is the Total Female Population of Jasper County?
Total Female Population of Jasper County is 4,582.
What is the Ratio of Males per 100 Females in Jasper County?
There are 102.86 Males per 100 Females in Jasper County.
What is the Ratio of Females per 100 Males in Jasper County?
There are 97.22 Females per 100 Males in Jasper County.
What is the Median Population Age in Jasper County?
Median Population Age in Jasper County is 44.0 Years.
What is the Average Family Size in Jasper County
Average Family Size in Jasper County is 3.0 People.
What is the Average Household Size in Jasper County
Average Household Size in Jasper County is 2.5 People.
How Large is the Labor Force in Jasper County?
There are 4,866 People in the Labor Forcein in Jasper County.
What is the Percentage of People in the Labor Force in Jasper County?
65.3% of People are in the Labor Force in Jasper County.
What is the Unemployment Rate in Jasper County?
Unemployment Rate in Jasper County is 4.9%.