Henderson County, IL Map & Demographics
Henderson County Overview
$34,734
PER CAPITA INCOME
$80,662
AVG FAMILY INCOME
$64,946
AVG HOUSEHOLD INCOME
24.8%
WAGE / INCOME GAP [ % ]
75.2¢/ $1
WAGE / INCOME GAP [ $ ]
0.39
INEQUALITY / GINI INDEX
6,374
TOTAL POPULATION
3,194
MALE POPULATION
3,180
FEMALE POPULATION
100.44
MALES / 100 FEMALES
99.56
FEMALES / 100 MALES
49.6
MEDIAN AGE
2.8
AVG FAMILY SIZE
2.3
AVG HOUSEHOLD SIZE
3,192
LABOR FORCE [ PEOPLE ]
60.5%
PERCENT IN LABOR FORCE
7.9%
UNEMPLOYMENT RATE
Income in Henderson County
Income Overview in Henderson County
Per Capita Income in Henderson County is $34,734, while median incomes of families and households are $80,662 and $64,946 respectively.
| Characteristic | Number | Measure |
| Per Capita Income | 6,374 | $34,734 |
| Median Family Income | 1,844 | $80,662 |
| Mean Family Income | 1,844 | $90,906 |
| Median Household Income | 2,745 | $64,946 |
| Mean Household Income | 2,745 | $78,911 |
| Income Deficit | 1,844 | $0 |
| Wage / Income Gap (%) | 6,374 | 24.84% |
| Wage / Income Gap ($) | 6,374 | 75.16¢ per $1 |
| Gini / Inequality Index | 6,374 | 0.39 |
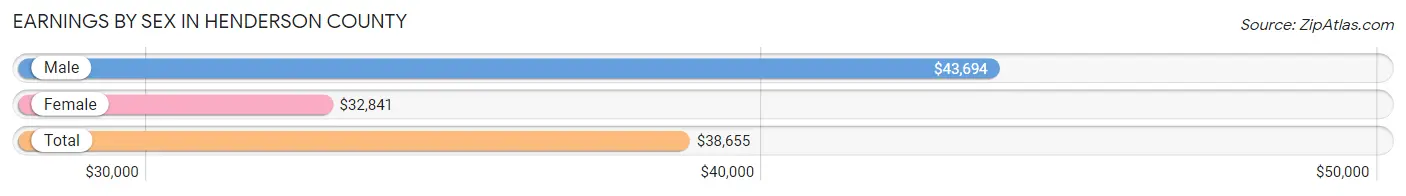
Earnings by Sex in Henderson County
Average Earnings in Henderson County are $38,655, $43,694 for men and $32,841 for women, a difference of 24.8%.
| Sex | Number | Average Earnings |
| Male | 1,824 (54.1%) | $43,694 |
| Female | 1,545 (45.9%) | $32,841 |
| Total | 3,369 (100.0%) | $38,655 |
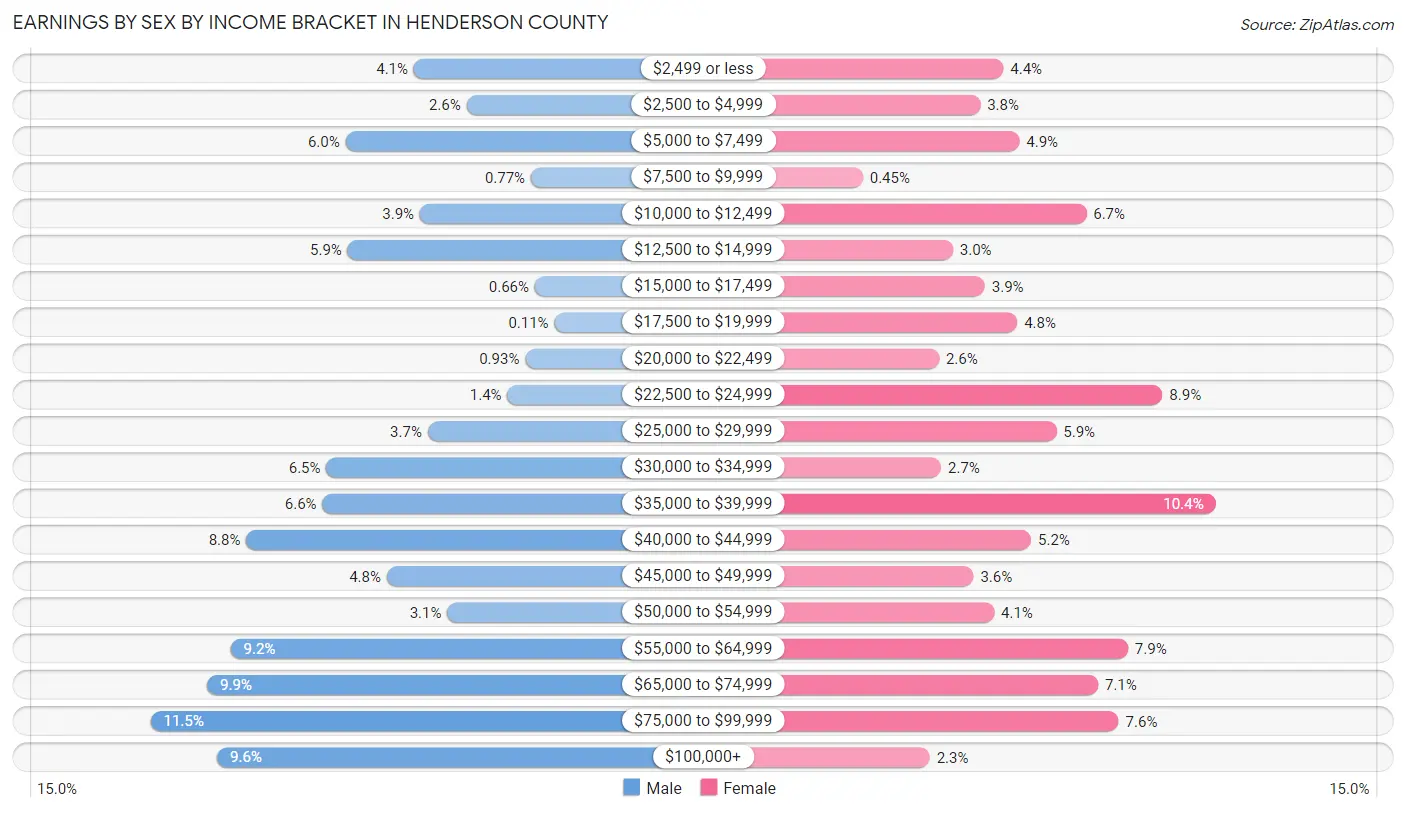
Earnings by Sex by Income Bracket in Henderson County
The most common earnings brackets in Henderson County are $75,000 to $99,999 for men (209 | 11.5%) and $35,000 to $39,999 for women (160 | 10.4%).
| Income | Male | Female |
| $2,499 or less | 74 (4.1%) | 68 (4.4%) |
| $2,500 to $4,999 | 47 (2.6%) | 58 (3.7%) |
| $5,000 to $7,499 | 109 (6.0%) | 75 (4.9%) |
| $7,500 to $9,999 | 14 (0.8%) | 7 (0.4%) |
| $10,000 to $12,499 | 71 (3.9%) | 104 (6.7%) |
| $12,500 to $14,999 | 108 (5.9%) | 46 (3.0%) |
| $15,000 to $17,499 | 12 (0.7%) | 60 (3.9%) |
| $17,500 to $19,999 | 2 (0.1%) | 74 (4.8%) |
| $20,000 to $22,499 | 17 (0.9%) | 40 (2.6%) |
| $22,500 to $24,999 | 26 (1.4%) | 137 (8.9%) |
| $25,000 to $29,999 | 67 (3.7%) | 91 (5.9%) |
| $30,000 to $34,999 | 119 (6.5%) | 41 (2.6%) |
| $35,000 to $39,999 | 121 (6.6%) | 160 (10.4%) |
| $40,000 to $44,999 | 160 (8.8%) | 80 (5.2%) |
| $45,000 to $49,999 | 88 (4.8%) | 55 (3.6%) |
| $50,000 to $54,999 | 57 (3.1%) | 64 (4.1%) |
| $55,000 to $64,999 | 168 (9.2%) | 122 (7.9%) |
| $65,000 to $74,999 | 180 (9.9%) | 109 (7.1%) |
| $75,000 to $99,999 | 209 (11.5%) | 118 (7.6%) |
| $100,000+ | 175 (9.6%) | 36 (2.3%) |
| Total | 1,824 (100.0%) | 1,545 (100.0%) |
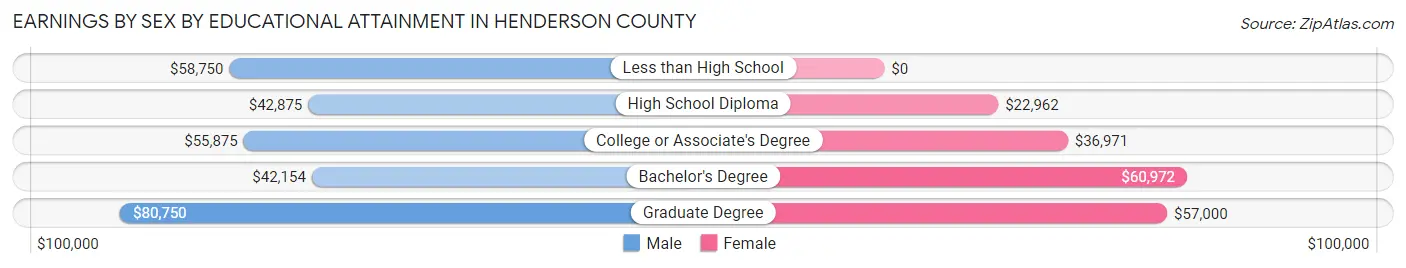
Earnings by Sex by Educational Attainment in Henderson County
Average earnings in Henderson County are $47,467 for men and $35,880 for women, a difference of 24.4%. Men with an educational attainment of graduate degree enjoy the highest average annual earnings of $80,750, while those with bachelor's degree education earn the least with $42,154. Women with an educational attainment of bachelor's degree earn the most with the average annual earnings of $60,972, while those with high school diploma education have the smallest earnings of $22,962.
| Educational Attainment | Male Income | Female Income |
| Less than High School | $58,750 | $0 |
| High School Diploma | $42,875 | $22,962 |
| College or Associate's Degree | $55,875 | $36,971 |
| Bachelor's Degree | $42,154 | $60,972 |
| Graduate Degree | $80,750 | $57,000 |
| Total | $47,467 | $35,880 |
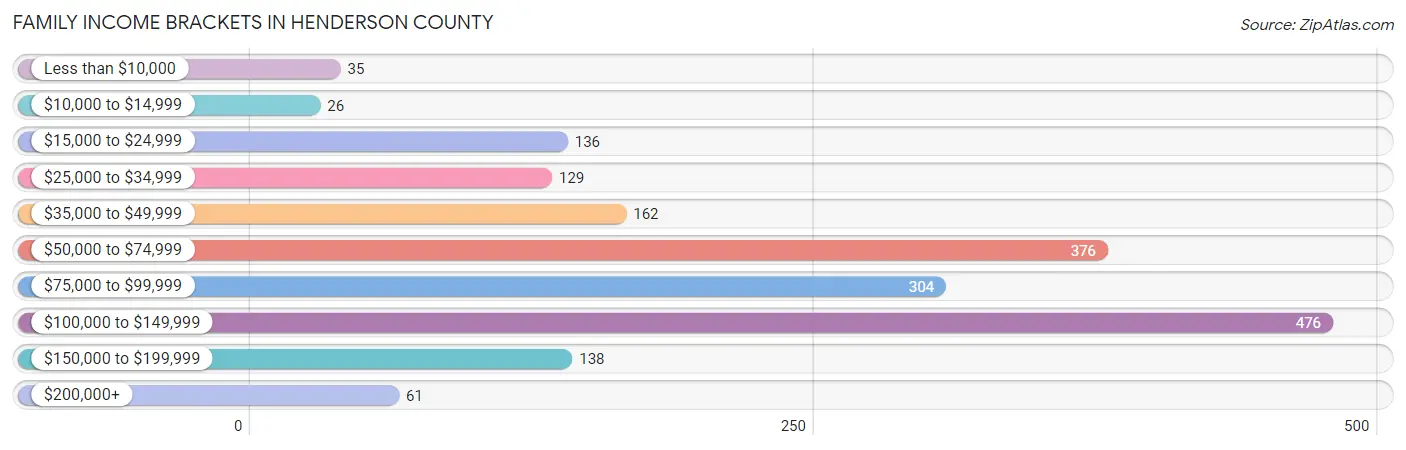
Family Income in Henderson County
Family Income Brackets in Henderson County
According to the Henderson County family income data, there are 476 families falling into the $100,000 to $149,999 income range, which is the most common income bracket and makes up 25.8% of all families. Conversely, the $10,000 to $14,999 income bracket is the least frequent group with only 26 families (1.4%) belonging to this category.
| Income Bracket | # Families | % Families |
| Less than $10,000 | 35 | 1.9% |
| $10,000 to $14,999 | 26 | 1.4% |
| $15,000 to $24,999 | 136 | 7.4% |
| $25,000 to $34,999 | 129 | 7.0% |
| $35,000 to $49,999 | 162 | 8.8% |
| $50,000 to $74,999 | 376 | 20.4% |
| $75,000 to $99,999 | 304 | 16.5% |
| $100,000 to $149,999 | 476 | 25.8% |
| $150,000 to $199,999 | 138 | 7.5% |
| $200,000+ | 61 | 3.3% |
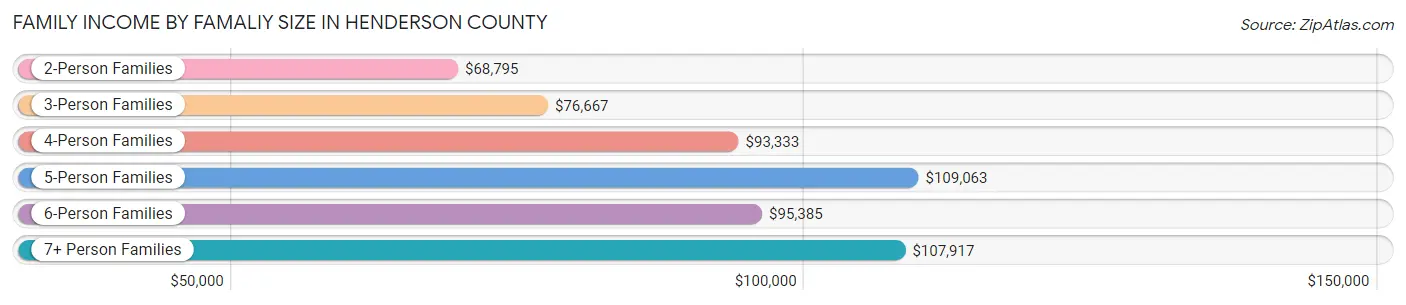
Family Income by Famaliy Size in Henderson County
5-person families (88 | 4.8%) account for the highest median family income in Henderson County with $109,063 per family, while 2-person families (1,163 | 63.1%) have the highest median income of $34,398 per family member.
| Income Bracket | # Families | Median Income |
| 2-Person Families | 1,163 (63.1%) | $68,795 |
| 3-Person Families | 250 (13.6%) | $76,667 |
| 4-Person Families | 284 (15.4%) | $93,333 |
| 5-Person Families | 88 (4.8%) | $109,063 |
| 6-Person Families | 42 (2.3%) | $95,385 |
| 7+ Person Families | 17 (0.9%) | $107,917 |
| Total | 1,844 (100.0%) | $80,662 |
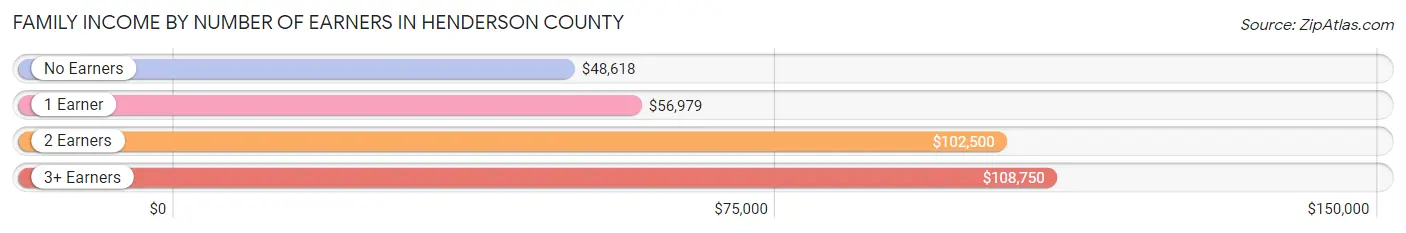
Family Income by Number of Earners in Henderson County
The median family income in Henderson County is $80,662, with families comprising 3+ earners (170) having the highest median family income of $108,750, while families with no earners (389) have the lowest median family income of $48,618, accounting for 9.2% and 21.1% of families, respectively.
| Number of Earners | # Families | Median Income |
| No Earners | 389 (21.1%) | $48,618 |
| 1 Earner | 491 (26.6%) | $56,979 |
| 2 Earners | 794 (43.1%) | $102,500 |
| 3+ Earners | 170 (9.2%) | $108,750 |
| Total | 1,844 (100.0%) | $80,662 |
Household Income in Henderson County
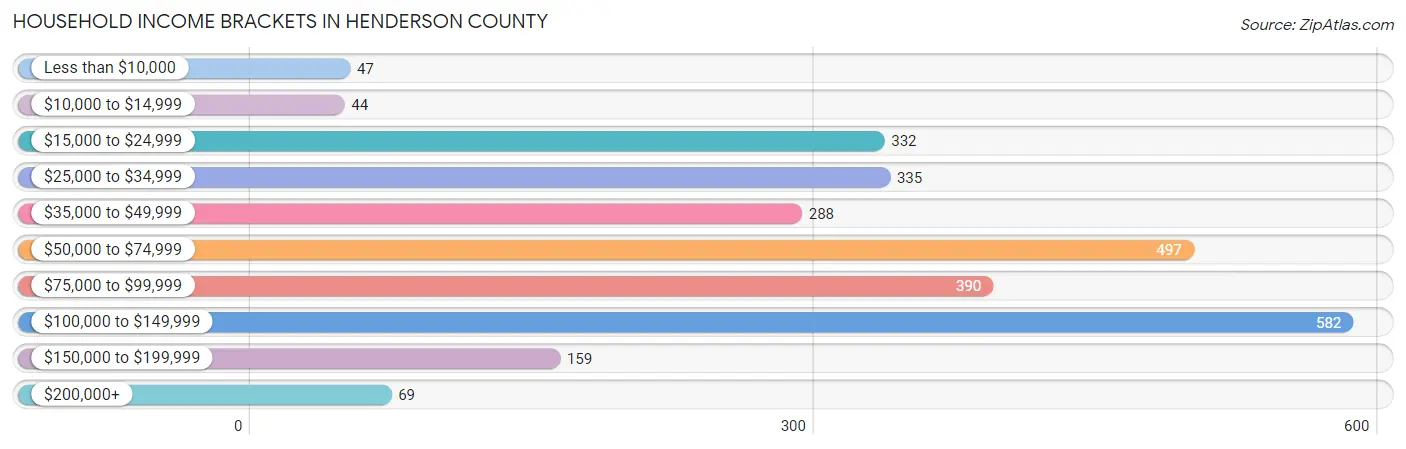
Household Income Brackets in Henderson County
With 582 households falling in the category, the $100,000 to $149,999 income range is the most frequent in Henderson County, accounting for 21.2% of all households. In contrast, only 44 households (1.6%) fall into the $10,000 to $14,999 income bracket, making it the least populous group.
| Income Bracket | # Households | % Households |
| Less than $10,000 | 47 | 1.7% |
| $10,000 to $14,999 | 44 | 1.6% |
| $15,000 to $24,999 | 332 | 12.1% |
| $25,000 to $34,999 | 335 | 12.2% |
| $35,000 to $49,999 | 288 | 10.5% |
| $50,000 to $74,999 | 497 | 18.1% |
| $75,000 to $99,999 | 390 | 14.2% |
| $100,000 to $149,999 | 582 | 21.2% |
| $150,000 to $199,999 | 159 | 5.8% |
| $200,000+ | 69 | 2.5% |
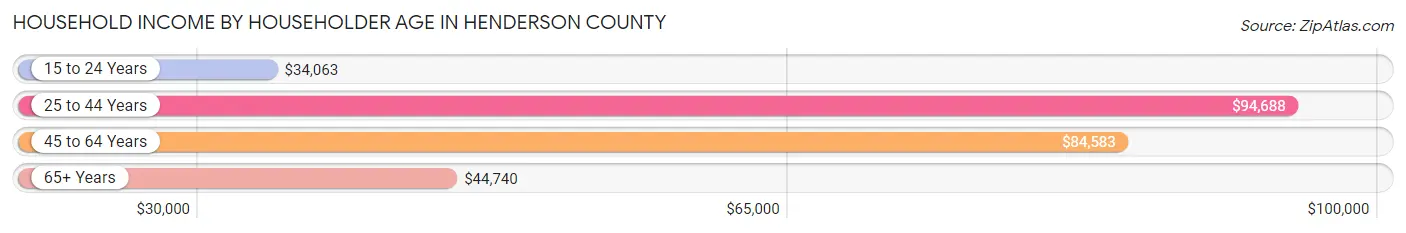
Household Income by Householder Age in Henderson County
The median household income in Henderson County is $64,946, with the highest median household income of $94,688 found in the 25 to 44 years age bracket for the primary householder. A total of 566 households (20.6%) fall into this category. Meanwhile, the 15 to 24 years age bracket for the primary householder has the lowest median household income of $34,063, with 79 households (2.9%) in this group.
| Income Bracket | # Households | Median Income |
| 15 to 24 Years | 79 (2.9%) | $34,063 |
| 25 to 44 Years | 566 (20.6%) | $94,688 |
| 45 to 64 Years | 1,043 (38.0%) | $84,583 |
| 65+ Years | 1,057 (38.5%) | $44,740 |
| Total | 2,745 (100.0%) | $64,946 |
Poverty in Henderson County
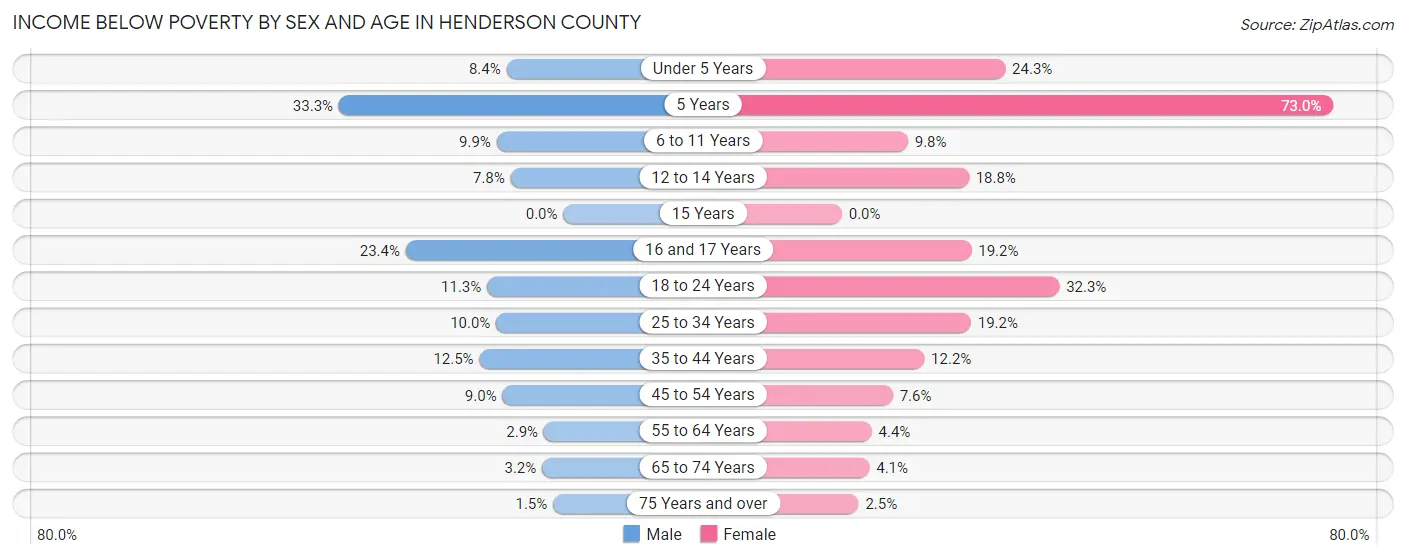
Income Below Poverty by Sex and Age in Henderson County
With 7.4% poverty level for males and 10.8% for females among the residents of Henderson County, 5 year old males and 5 year old females are the most vulnerable to poverty, with 17 males (33.3%) and 27 females (73.0%) in their respective age groups living below the poverty level.
| Age Bracket | Male | Female |
| Under 5 Years | 14 (8.4%) | 33 (24.3%) |
| 5 Years | 17 (33.3%) | 27 (73.0%) |
| 6 to 11 Years | 20 (9.9%) | 20 (9.8%) |
| 12 to 14 Years | 9 (7.8%) | 13 (18.8%) |
| 15 Years | 0 (0.0%) | 0 (0.0%) |
| 16 and 17 Years | 11 (23.4%) | 10 (19.2%) |
| 18 to 24 Years | 24 (11.3%) | 61 (32.3%) |
| 25 to 34 Years | 30 (10.0%) | 55 (19.2%) |
| 35 to 44 Years | 42 (12.5%) | 40 (12.2%) |
| 45 to 54 Years | 32 (9.0%) | 30 (7.6%) |
| 55 to 64 Years | 16 (2.9%) | 24 (4.4%) |
| 65 to 74 Years | 14 (3.2%) | 18 (4.1%) |
| 75 Years and over | 5 (1.5%) | 10 (2.5%) |
| Total | 234 (7.4%) | 341 (10.8%) |
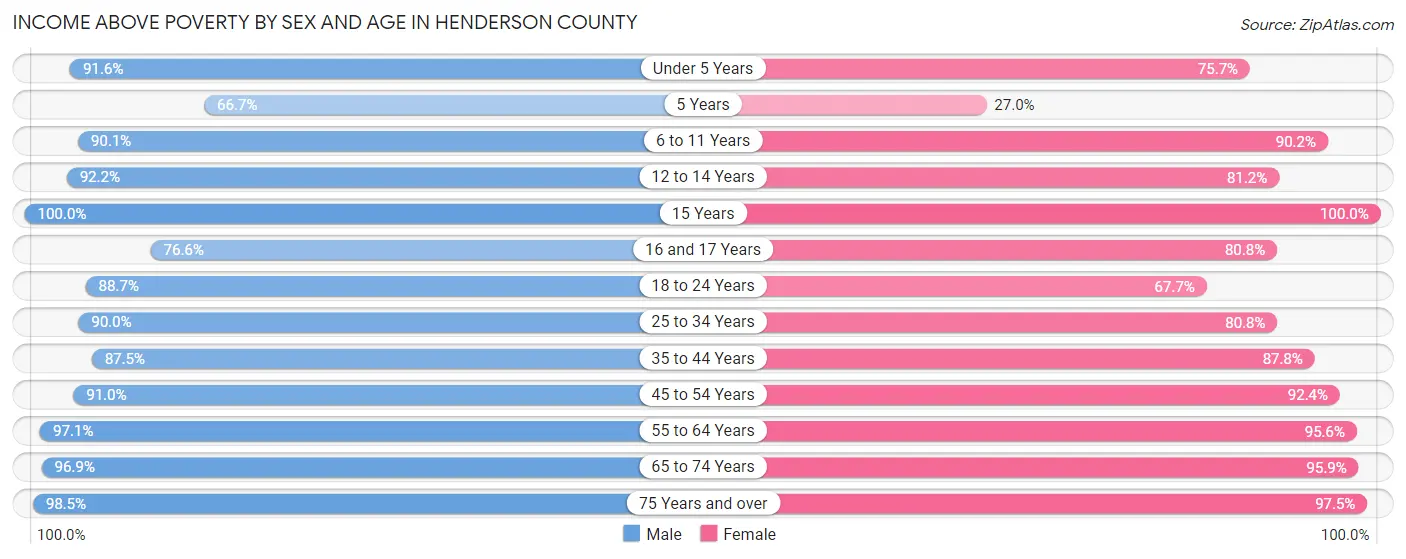
Income Above Poverty by Sex and Age in Henderson County
According to the poverty statistics in Henderson County, males aged 15 years and females aged 15 years are the age groups that are most secure financially, with 100.0% of males and 100.0% of females in these age groups living above the poverty line.
| Age Bracket | Male | Female |
| Under 5 Years | 152 (91.6%) | 103 (75.7%) |
| 5 Years | 34 (66.7%) | 10 (27.0%) |
| 6 to 11 Years | 182 (90.1%) | 184 (90.2%) |
| 12 to 14 Years | 106 (92.2%) | 56 (81.2%) |
| 15 Years | 59 (100.0%) | 59 (100.0%) |
| 16 and 17 Years | 36 (76.6%) | 42 (80.8%) |
| 18 to 24 Years | 188 (88.7%) | 128 (67.7%) |
| 25 to 34 Years | 271 (90.0%) | 232 (80.8%) |
| 35 to 44 Years | 295 (87.5%) | 287 (87.8%) |
| 45 to 54 Years | 322 (91.0%) | 367 (92.4%) |
| 55 to 64 Years | 540 (97.1%) | 519 (95.6%) |
| 65 to 74 Years | 430 (96.9%) | 423 (95.9%) |
| 75 Years and over | 324 (98.5%) | 394 (97.5%) |
| Total | 2,939 (92.6%) | 2,804 (89.2%) |
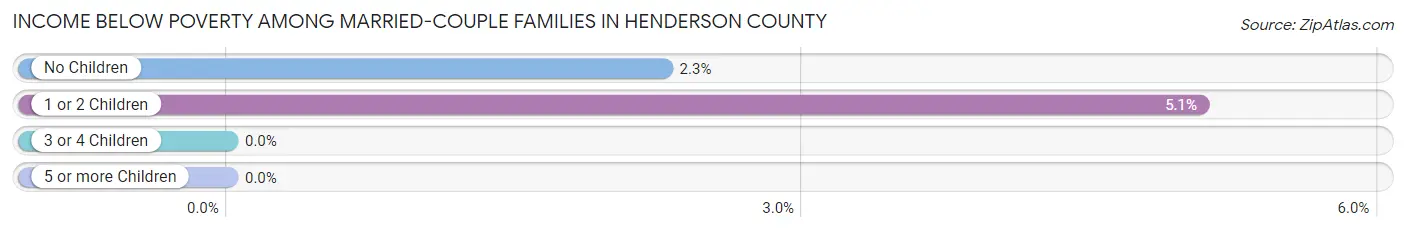
Income Below Poverty Among Married-Couple Families in Henderson County
The poverty statistics for married-couple families in Henderson County show that 2.6% or 40 of the total 1,512 families live below the poverty line. Families with 1 or 2 children have the highest poverty rate of 5.1%, comprising of 15 families. On the other hand, families with 3 or 4 children have the lowest poverty rate of 0.0%, which includes 0 families.
| Children | Above Poverty | Below Poverty |
| No Children | 1,075 (97.7%) | 25 (2.3%) |
| 1 or 2 Children | 281 (94.9%) | 15 (5.1%) |
| 3 or 4 Children | 116 (100.0%) | 0 (0.0%) |
| 5 or more Children | 0 (0.0%) | 0 (0.0%) |
| Total | 1,472 (97.4%) | 40 (2.6%) |
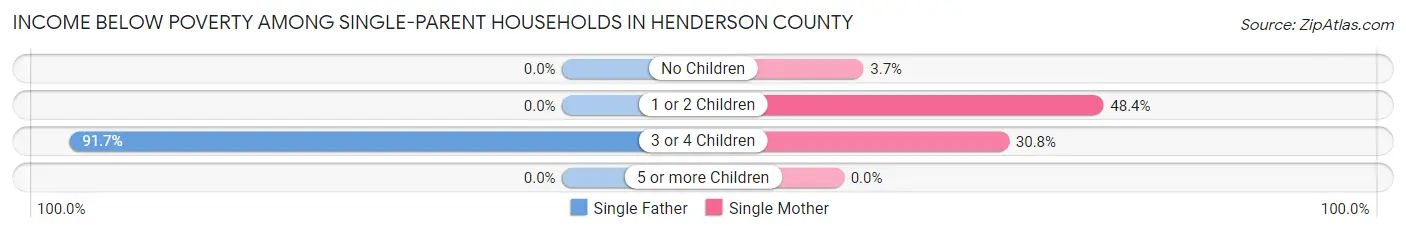
Income Below Poverty Among Single-Parent Households in Henderson County
According to the poverty data in Henderson County, 26.2% or 22 single-father households and 32.7% or 81 single-mother households are living below the poverty line. Among single-father households, those with 3 or 4 children have the highest poverty rate, with 22 households (91.7%) experiencing poverty. Likewise, among single-mother households, those with 1 or 2 children have the highest poverty rate, with 74 households (48.4%) falling below the poverty line.
| Children | Single Father | Single Mother |
| No Children | 0 (0.0%) | 3 (3.7%) |
| 1 or 2 Children | 0 (0.0%) | 74 (48.4%) |
| 3 or 4 Children | 22 (91.7%) | 4 (30.8%) |
| 5 or more Children | 0 (0.0%) | 0 (0.0%) |
| Total | 22 (26.2%) | 81 (32.7%) |
Income Below Poverty Among Married-Couple vs Single-Parent Households in Henderson County
The poverty data for Henderson County shows that 40 of the married-couple family households (2.6%) and 103 of the single-parent households (31.0%) are living below the poverty level. Within the married-couple family households, those with 1 or 2 children have the highest poverty rate, with 15 households (5.1%) falling below the poverty line. Among the single-parent households, those with 3 or 4 children have the highest poverty rate, with 26 household (70.3%) living below poverty.
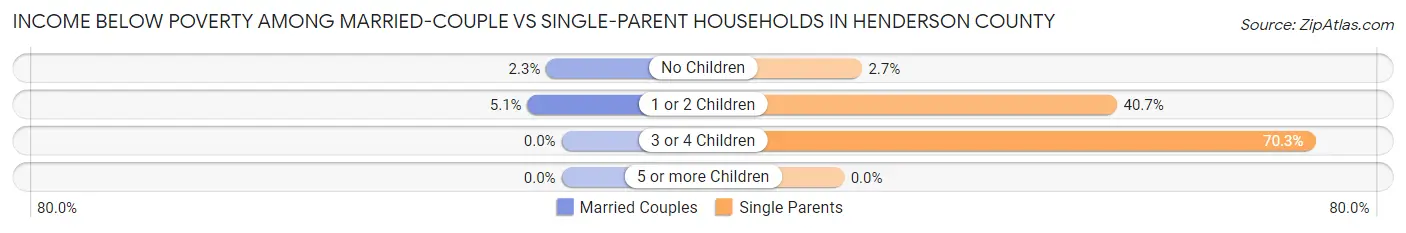
| Children | Married-Couple Families | Single-Parent Households |
| No Children | 25 (2.3%) | 3 (2.6%) |
| 1 or 2 Children | 15 (5.1%) | 74 (40.7%) |
| 3 or 4 Children | 0 (0.0%) | 26 (70.3%) |
| 5 or more Children | 0 (0.0%) | 0 (0.0%) |
| Total | 40 (2.6%) | 103 (31.0%) |
Race in Henderson County
The most populous races in Henderson County are White / Caucasian (6,088 | 95.5%), Two or more Races (195 | 3.1%), and Hispanic or Latino (120 | 1.9%).
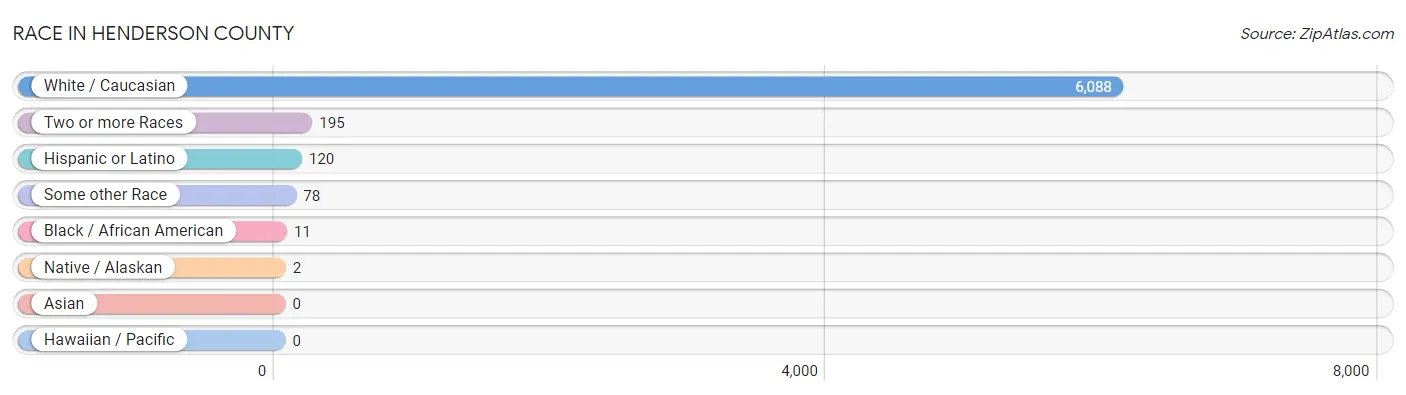
| Race | # Population | % Population |
| Asian | 0 | 0.0% |
| Black / African American | 11 | 0.2% |
| Hawaiian / Pacific | 0 | 0.0% |
| Hispanic or Latino | 120 | 1.9% |
| Native / Alaskan | 2 | 0.0% |
| White / Caucasian | 6,088 | 95.5% |
| Two or more Races | 195 | 3.1% |
| Some other Race | 78 | 1.2% |
| Total | 6,374 | 100.0% |
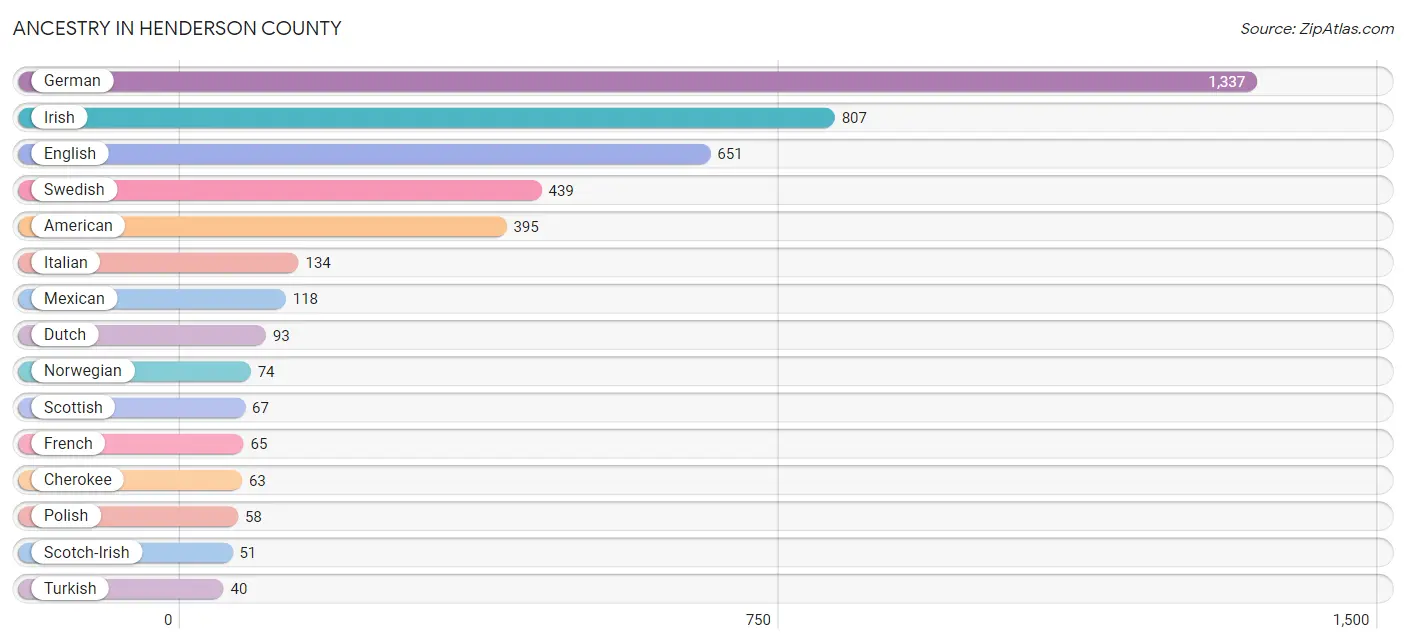
Ancestry in Henderson County
The most populous ancestries reported in Henderson County are German (1,337 | 21.0%), Irish (807 | 12.7%), English (651 | 10.2%), Swedish (439 | 6.9%), and American (395 | 6.2%), together accounting for 56.9% of all Henderson County residents.
| Ancestry | # Population | % Population |
| African | 1 | 0.0% |
| American | 395 | 6.2% |
| Austrian | 2 | 0.0% |
| British | 9 | 0.1% |
| Burmese | 3 | 0.1% |
| Canadian | 1 | 0.0% |
| Cherokee | 63 | 1.0% |
| Creek | 4 | 0.1% |
| Croatian | 34 | 0.5% |
| Czech | 24 | 0.4% |
| Danish | 5 | 0.1% |
| Dutch | 93 | 1.5% |
| English | 651 | 10.2% |
| European | 38 | 0.6% |
| French | 65 | 1.0% |
| French Canadian | 10 | 0.2% |
| German | 1,337 | 21.0% |
| Greek | 2 | 0.0% |
| Hungarian | 9 | 0.1% |
| Irish | 807 | 12.7% |
| Italian | 134 | 2.1% |
| Lithuanian | 17 | 0.3% |
| Mexican | 118 | 1.8% |
| Norwegian | 74 | 1.2% |
| Osage | 2 | 0.0% |
| Pennsylvania German | 12 | 0.2% |
| Polish | 58 | 0.9% |
| Puerto Rican | 2 | 0.0% |
| Scandinavian | 6 | 0.1% |
| Scotch-Irish | 51 | 0.8% |
| Scottish | 67 | 1.1% |
| Subsaharan African | 1 | 0.0% |
| Swedish | 439 | 6.9% |
| Swiss | 4 | 0.1% |
| Turkish | 40 | 0.6% |
| Welsh | 26 | 0.4% | View All 36 Rows |
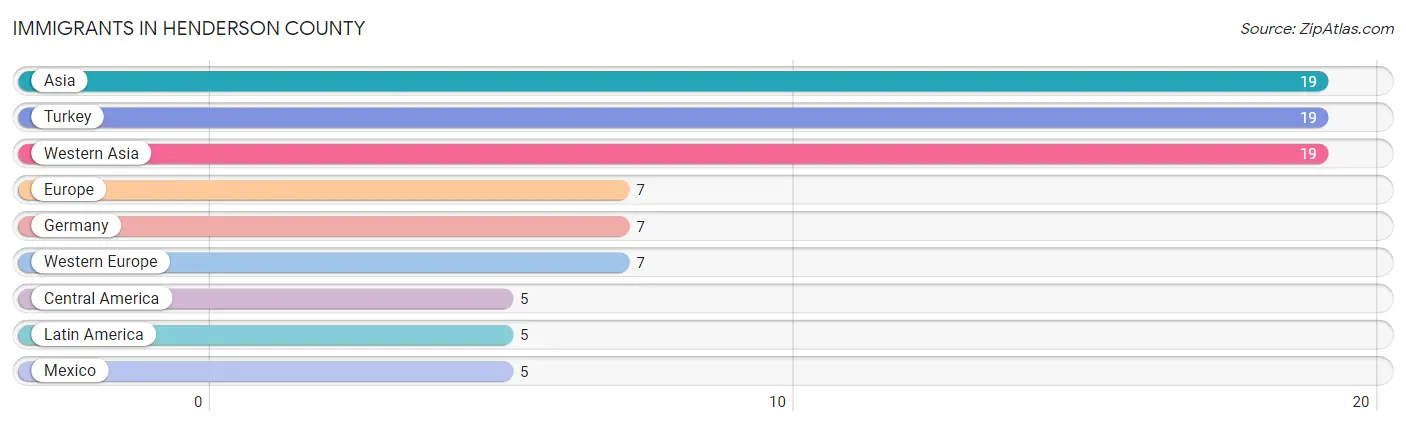
Immigrants in Henderson County
The most numerous immigrant groups reported in Henderson County came from Asia (19 | 0.3%), Turkey (19 | 0.3%), Western Asia (19 | 0.3%), Europe (7 | 0.1%), and Germany (7 | 0.1%), together accounting for 1.1% of all Henderson County residents.
| Immigration Origin | # Population | % Population |
| Asia | 19 | 0.3% |
| Central America | 5 | 0.1% |
| Europe | 7 | 0.1% |
| Germany | 7 | 0.1% |
| Latin America | 5 | 0.1% |
| Mexico | 5 | 0.1% |
| Turkey | 19 | 0.3% |
| Western Asia | 19 | 0.3% |
| Western Europe | 7 | 0.1% | View All 9 Rows |
Sex and Age in Henderson County
Sex and Age in Henderson County
The most populous age groups in Henderson County are 60 to 64 Years (331 | 10.4%) for men and 55 to 59 Years (279 | 8.8%) for women.
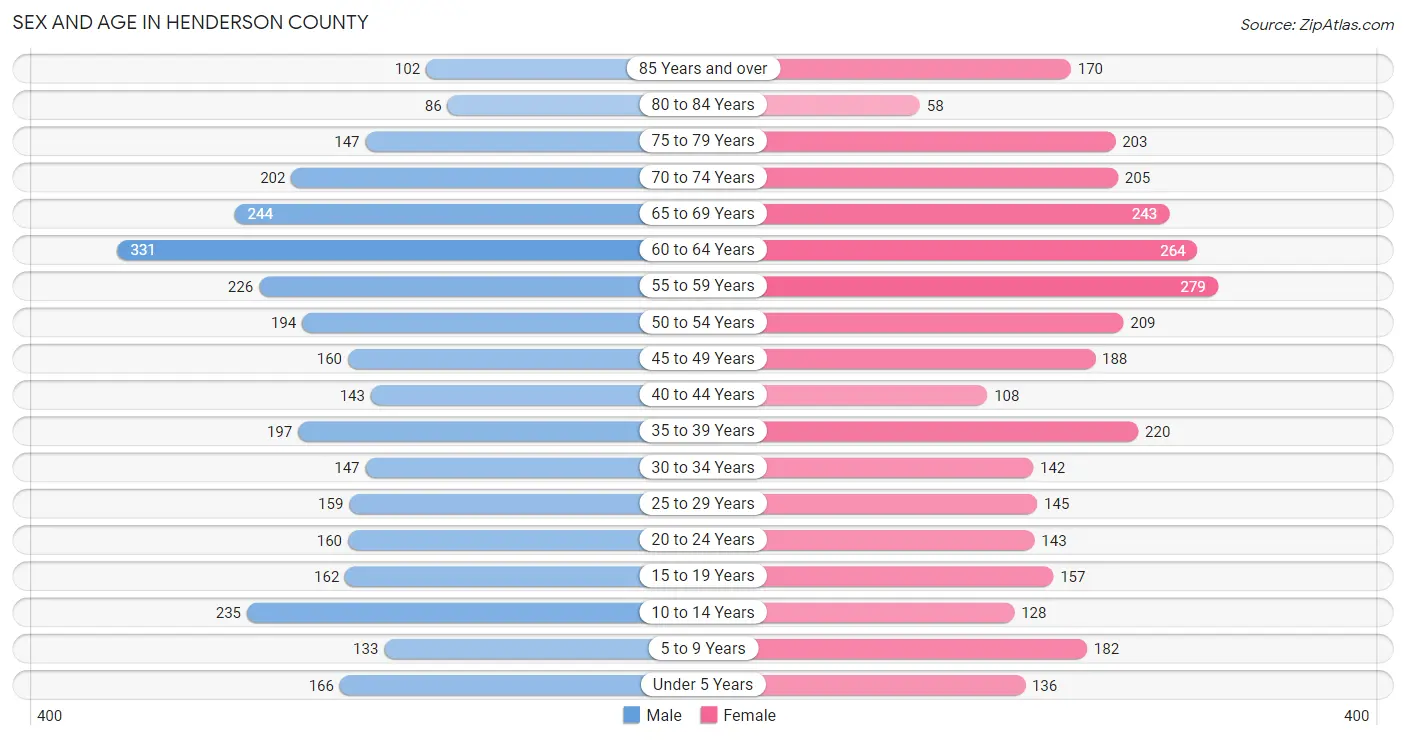
| Age Bracket | Male | Female |
| Under 5 Years | 166 (5.2%) | 136 (4.3%) |
| 5 to 9 Years | 133 (4.2%) | 182 (5.7%) |
| 10 to 14 Years | 235 (7.4%) | 128 (4.0%) |
| 15 to 19 Years | 162 (5.1%) | 157 (4.9%) |
| 20 to 24 Years | 160 (5.0%) | 143 (4.5%) |
| 25 to 29 Years | 159 (5.0%) | 145 (4.6%) |
| 30 to 34 Years | 147 (4.6%) | 142 (4.5%) |
| 35 to 39 Years | 197 (6.2%) | 220 (6.9%) |
| 40 to 44 Years | 143 (4.5%) | 108 (3.4%) |
| 45 to 49 Years | 160 (5.0%) | 188 (5.9%) |
| 50 to 54 Years | 194 (6.1%) | 209 (6.6%) |
| 55 to 59 Years | 226 (7.1%) | 279 (8.8%) |
| 60 to 64 Years | 331 (10.4%) | 264 (8.3%) |
| 65 to 69 Years | 244 (7.6%) | 243 (7.6%) |
| 70 to 74 Years | 202 (6.3%) | 205 (6.5%) |
| 75 to 79 Years | 147 (4.6%) | 203 (6.4%) |
| 80 to 84 Years | 86 (2.7%) | 58 (1.8%) |
| 85 Years and over | 102 (3.2%) | 170 (5.3%) |
| Total | 3,194 (100.0%) | 3,180 (100.0%) |
Families and Households in Henderson County
Median Family Size in Henderson County
The median family size in Henderson County is 2.77 persons per family, with married-couple families (1,512 | 82.0%) accounting for the largest median family size of 2.81 persons per family. On the other hand, single male/father families (84 | 4.6%) represent the smallest median family size with 2.32 persons per family.
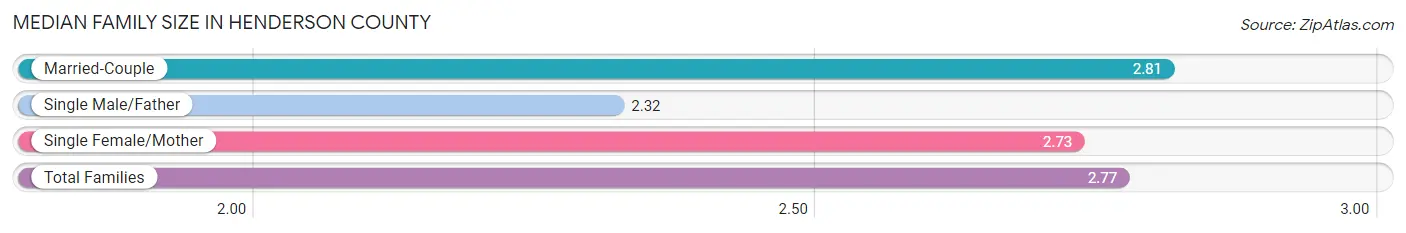
| Family Type | # Families | Family Size |
| Married-Couple | 1,512 (82.0%) | 2.81 |
| Single Male/Father | 84 (4.6%) | 2.32 |
| Single Female/Mother | 248 (13.5%) | 2.73 |
| Total Families | 1,844 (100.0%) | 2.77 |
Median Household Size in Henderson County
The median household size in Henderson County is 2.30 persons per household, with single female/mother households (248 | 9.0%) accounting for the largest median household size of 3.11 persons per household. non-family households (901 | 32.8%) represent the smallest median household size with 1.14 persons per household.
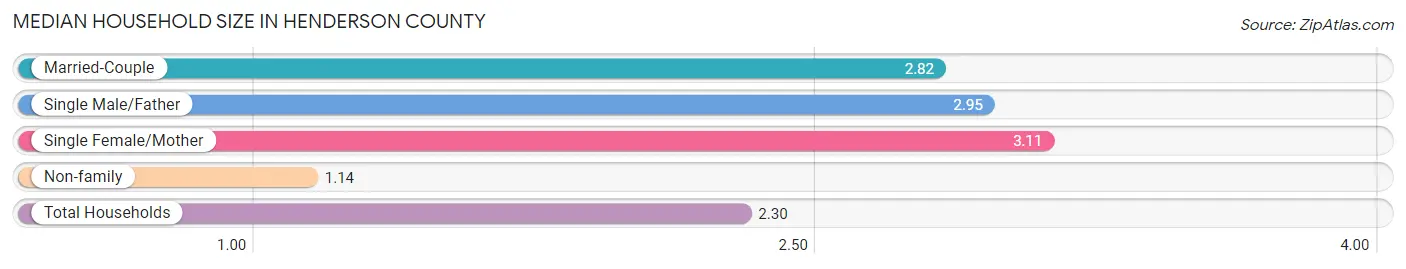
| Household Type | # Households | Household Size |
| Married-Couple | 1,512 (55.1%) | 2.82 |
| Single Male/Father | 84 (3.1%) | 2.95 |
| Single Female/Mother | 248 (9.0%) | 3.11 |
| Non-family | 901 (32.8%) | 1.14 |
| Total Households | 2,745 (100.0%) | 2.30 |
Household Size by Marriage Status in Henderson County
Out of a total of 2,745 households in Henderson County, 1,844 (67.2%) are family households, while 901 (32.8%) are nonfamily households. The most numerous type of family households are 2-person households, comprising 1,077, and the most common type of nonfamily households are 1-person households, comprising 773.
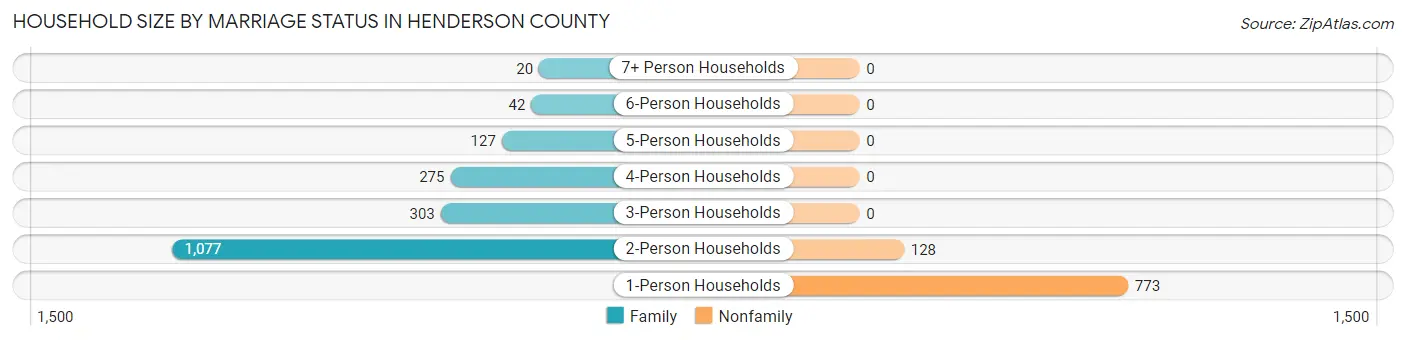
| Household Size | Family Households | Nonfamily Households |
| 1-Person Households | - | 773 (28.2%) |
| 2-Person Households | 1,077 (39.2%) | 128 (4.7%) |
| 3-Person Households | 303 (11.0%) | 0 (0.0%) |
| 4-Person Households | 275 (10.0%) | 0 (0.0%) |
| 5-Person Households | 127 (4.6%) | 0 (0.0%) |
| 6-Person Households | 42 (1.5%) | 0 (0.0%) |
| 7+ Person Households | 20 (0.7%) | 0 (0.0%) |
| Total | 1,844 (67.2%) | 901 (32.8%) |
Female Fertility in Henderson County
Fertility by Age in Henderson County
Average fertility rate in Henderson County is 62.0 births per 1,000 women. Women in the age bracket of 20 to 34 years have the highest fertility rate with 107.0 births per 1,000 women. Women in the age bracket of 20 to 34 years acount for 65.7% of all women with births.
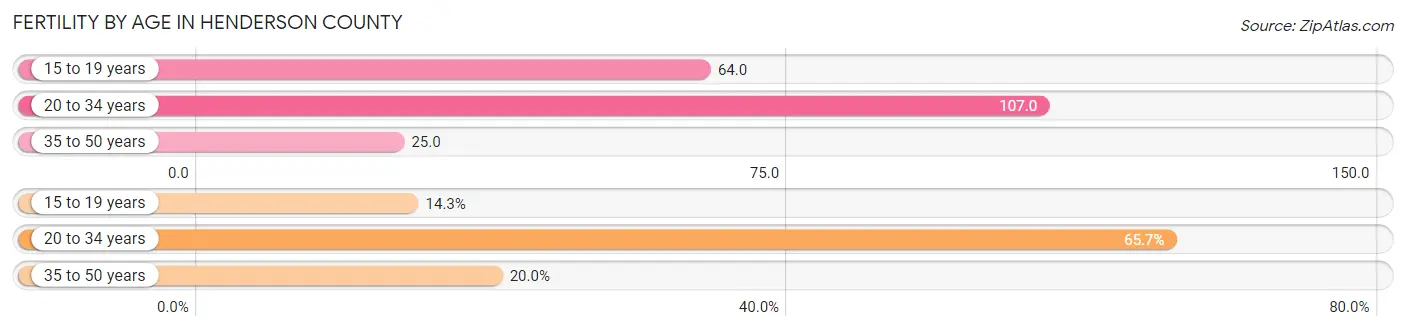
| Age Bracket | Women with Births | Births / 1,000 Women |
| 15 to 19 years | 10 (14.3%) | 64.0 |
| 20 to 34 years | 46 (65.7%) | 107.0 |
| 35 to 50 years | 14 (20.0%) | 25.0 |
| Total | 70 (100.0%) | 62.0 |
Fertility by Age by Marriage Status in Henderson County
41.4% of women with births (70) in Henderson County are married. The highest percentage of unmarried women with births falls into 15 to 19 years age bracket with 100.0% of them unmarried at the time of birth, while the lowest percentage of unmarried women with births belong to 35 to 50 years age bracket with 0.0% of them unmarried.
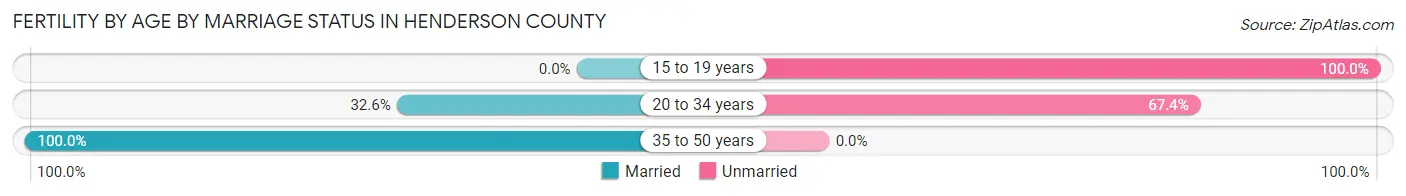
| Age Bracket | Married | Unmarried |
| 15 to 19 years | 0 (0.0%) | 10 (100.0%) |
| 20 to 34 years | 15 (32.6%) | 31 (67.4%) |
| 35 to 50 years | 14 (100.0%) | 0 (0.0%) |
| Total | 29 (41.4%) | 41 (58.6%) |
Fertility by Education in Henderson County
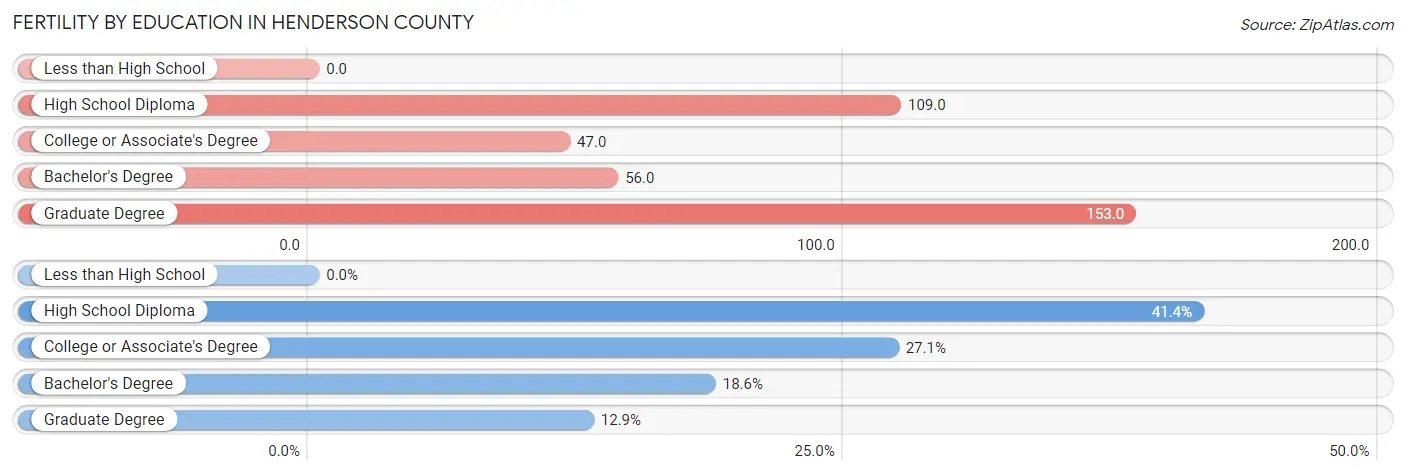
| Educational Attainment | Women with Births | Births / 1,000 Women |
| Less than High School | 0 (0.0%) | 0.0 |
| High School Diploma | 29 (41.4%) | 109.0 |
| College or Associate's Degree | 19 (27.1%) | 47.0 |
| Bachelor's Degree | 13 (18.6%) | 56.0 |
| Graduate Degree | 9 (12.9%) | 153.0 |
| Total | 70 (100.0%) | 62.0 |
Fertility by Education by Marriage Status in Henderson County
58.6% of women with births in Henderson County are unmarried. Women with the educational attainment of graduate degree are most likely to be married with 77.8% of them married at childbirth, while women with the educational attainment of high school diploma are least likely to be married with 79.3% of them unmarried at childbirth.
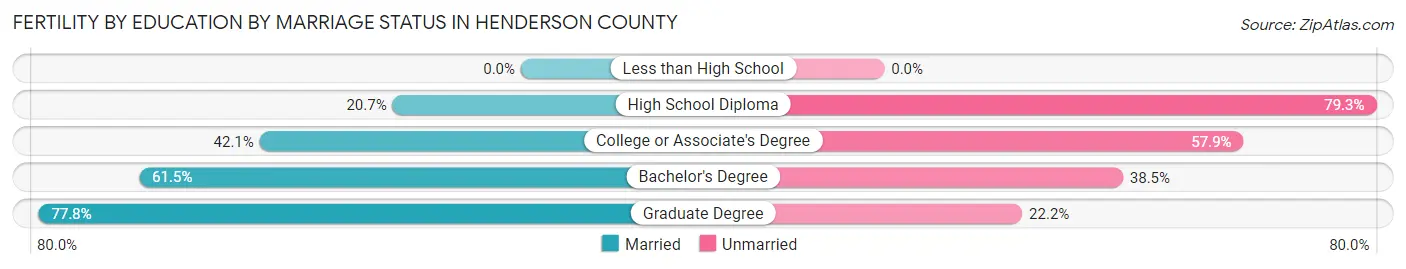
| Educational Attainment | Married | Unmarried |
| Less than High School | 0 (0.0%) | 0 (0.0%) |
| High School Diploma | 6 (20.7%) | 23 (79.3%) |
| College or Associate's Degree | 8 (42.1%) | 11 (57.9%) |
| Bachelor's Degree | 8 (61.5%) | 5 (38.5%) |
| Graduate Degree | 7 (77.8%) | 2 (22.2%) |
| Total | 29 (41.4%) | 41 (58.6%) |
Employment Characteristics in Henderson County
Employment by Class of Employer in Henderson County
Among the 2,896 employed individuals in Henderson County, private company employees (1,963 | 67.8%), self-employed (not incorporated) (280 | 9.7%), and not-for-profit organizations (203 | 7.0%) make up the most common classes of employment.
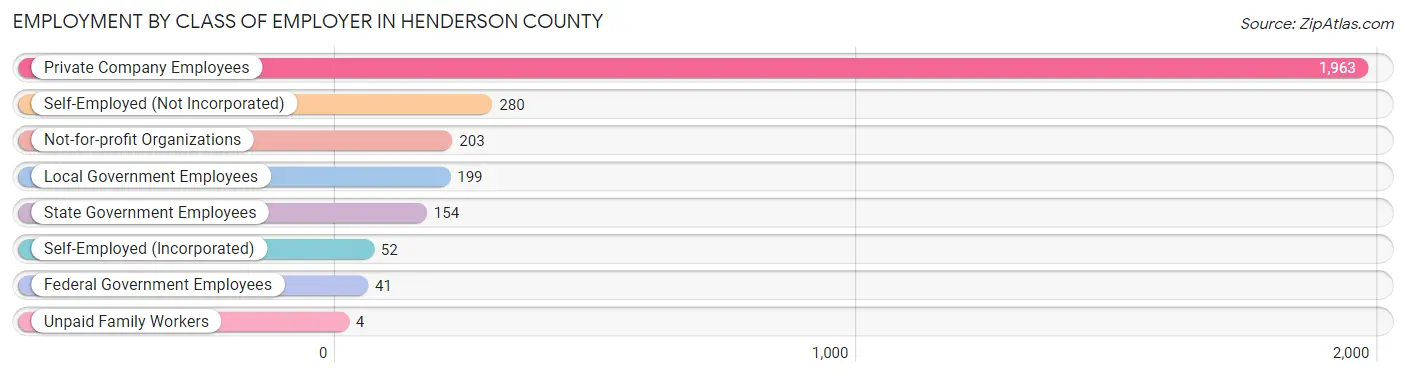
| Employer Class | # Employees | % Employees |
| Private Company Employees | 1,963 | 67.8% |
| Self-Employed (Incorporated) | 52 | 1.8% |
| Self-Employed (Not Incorporated) | 280 | 9.7% |
| Not-for-profit Organizations | 203 | 7.0% |
| Local Government Employees | 199 | 6.9% |
| State Government Employees | 154 | 5.3% |
| Federal Government Employees | 41 | 1.4% |
| Unpaid Family Workers | 4 | 0.1% |
| Total | 2,896 | 100.0% |
Employment Status by Age in Henderson County
According to the labor force statistics for Henderson County, out of the total population over 16 years of age (5,276), 60.5% or 3,192 individuals are in the labor force, with 7.9% or 252 of them unemployed. The age group with the highest labor force participation rate is 35 to 44 years, with 91.9% or 614 individuals in the labor force. Within the labor force, the 16 to 19 years age range has the highest percentage of unemployed individuals, with 19.2% or 20 of them being unemployed.
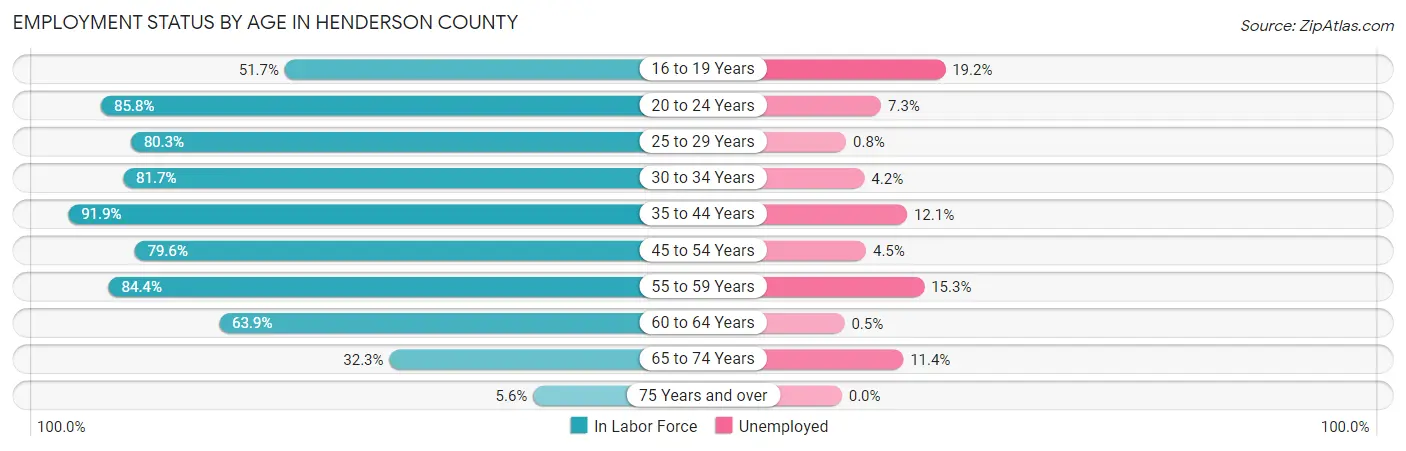
| Age Bracket | In Labor Force | Unemployed |
| 16 to 19 Years | 104 (51.7%) | 20 (19.2%) |
| 20 to 24 Years | 260 (85.8%) | 19 (7.3%) |
| 25 to 29 Years | 244 (80.3%) | 2 (0.8%) |
| 30 to 34 Years | 236 (81.7%) | 10 (4.2%) |
| 35 to 44 Years | 614 (91.9%) | 74 (12.1%) |
| 45 to 54 Years | 598 (79.6%) | 27 (4.5%) |
| 55 to 59 Years | 426 (84.4%) | 65 (15.3%) |
| 60 to 64 Years | 380 (63.9%) | 2 (0.5%) |
| 65 to 74 Years | 289 (32.3%) | 33 (11.4%) |
| 75 Years and over | 43 (5.6%) | 0 (0.0%) |
| Total | 3,192 (60.5%) | 252 (7.9%) |
Employment Status by Educational Attainment in Henderson County
According to labor force statistics for Henderson County, 80.3% of individuals (2,499) out of the total population between 25 and 64 years of age (3,112) are in the labor force, with 7.2% or 180 of them being unemployed. The group with the highest labor force participation rate are those with the educational attainment of bachelor's degree or higher, with 91.7% or 664 individuals in the labor force. Within the labor force, individuals with less than high school education have the highest percentage of unemployment, with 14.1% or 21 of them being unemployed.
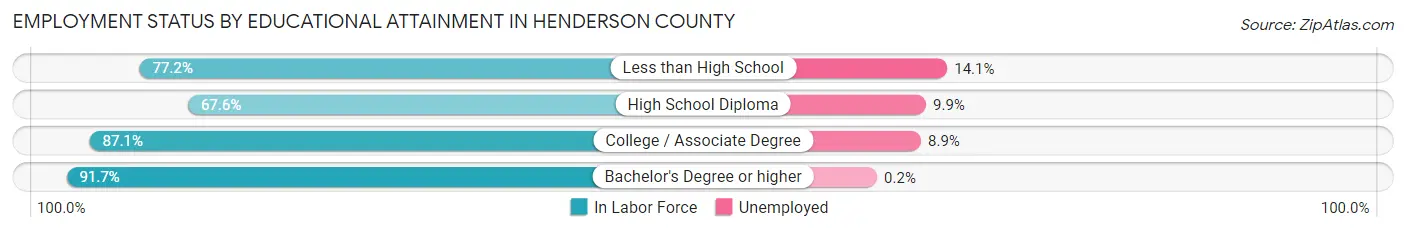
| Educational Attainment | In Labor Force | Unemployed |
| Less than High School | 149 (77.2%) | 27 (14.1%) |
| High School Diploma | 784 (67.6%) | 115 (9.9%) |
| College / Associate Degree | 901 (87.1%) | 92 (8.9%) |
| Bachelor's Degree or higher | 664 (91.7%) | 1 (0.2%) |
| Total | 2,499 (80.3%) | 224 (7.2%) |
Employment Occupations by Sex in Henderson County
Management, Business, Science and Arts Occupations
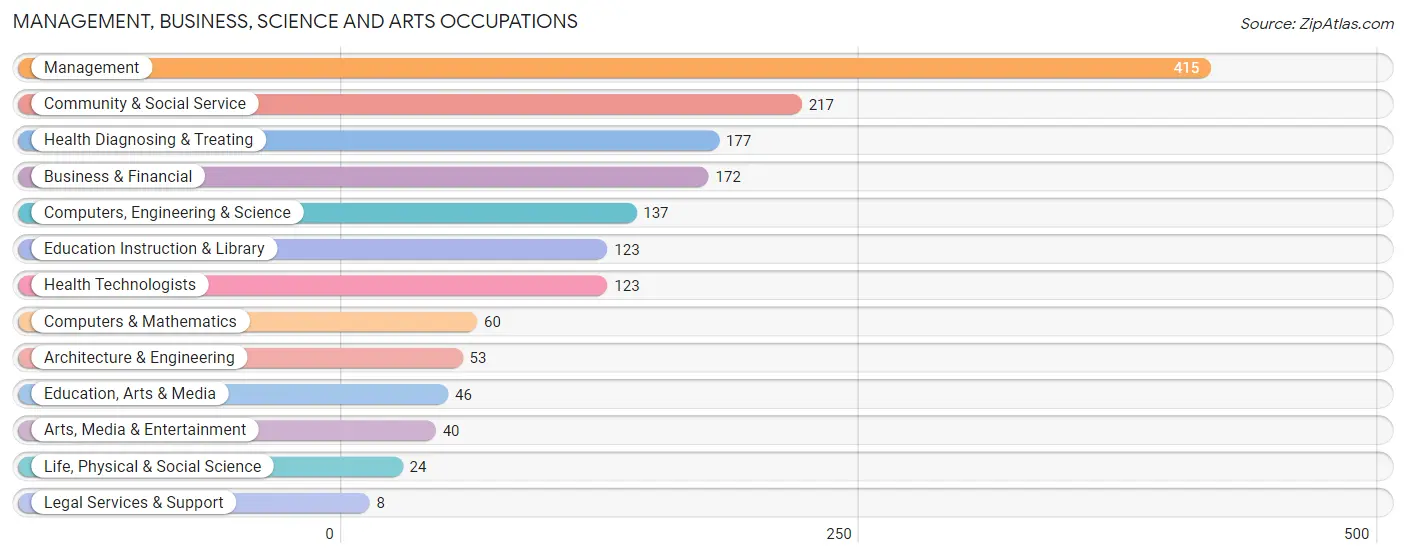
The most common Management, Business, Science and Arts occupations in Henderson County are Management (415 | 14.1%), Community & Social Service (217 | 7.4%), Health Diagnosing & Treating (177 | 6.0%), Business & Financial (172 | 5.9%), and Computers, Engineering & Science (137 | 4.7%).
Management, Business, Science and Arts Occupations by Sex
Within the Management, Business, Science and Arts occupations in Henderson County, the most male-oriented occupations are Architecture & Engineering (100.0%), Computers & Mathematics (95.0%), and Computers, Engineering & Science (91.2%), while the most female-oriented occupations are Legal Services & Support (100.0%), Education Instruction & Library (96.8%), and Health Technologists (96.8%).
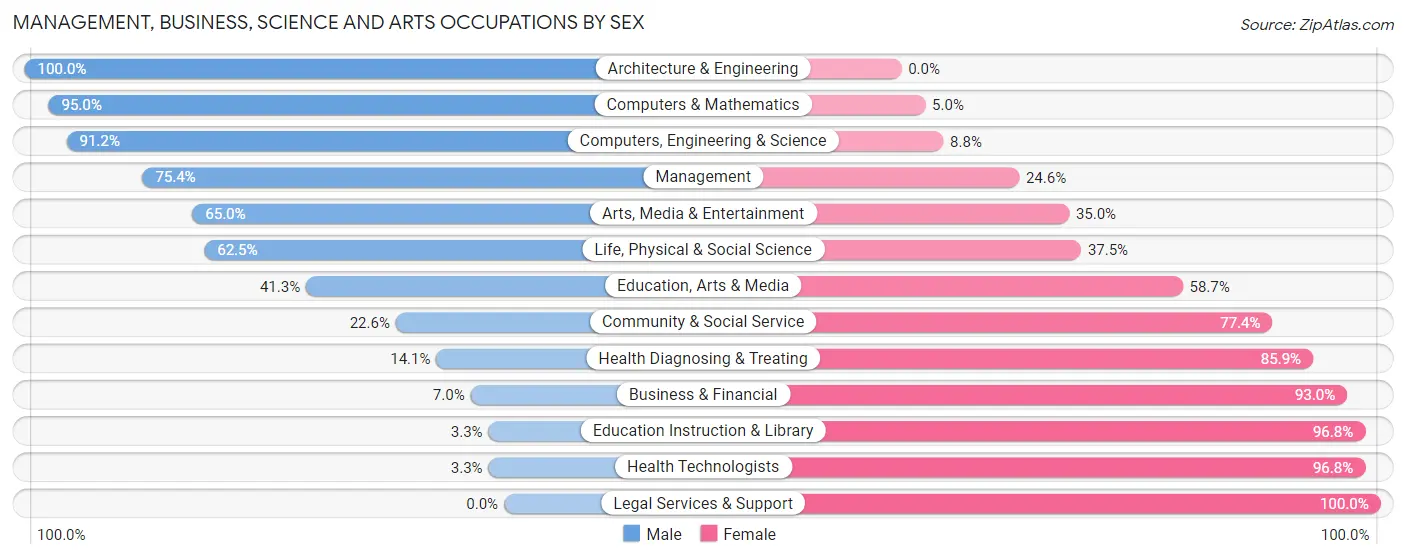
| Occupation | Male | Female |
| Management | 313 (75.4%) | 102 (24.6%) |
| Business & Financial | 12 (7.0%) | 160 (93.0%) |
| Computers, Engineering & Science | 125 (91.2%) | 12 (8.8%) |
| Computers & Mathematics | 57 (95.0%) | 3 (5.0%) |
| Architecture & Engineering | 53 (100.0%) | 0 (0.0%) |
| Life, Physical & Social Science | 15 (62.5%) | 9 (37.5%) |
| Community & Social Service | 49 (22.6%) | 168 (77.4%) |
| Education, Arts & Media | 19 (41.3%) | 27 (58.7%) |
| Legal Services & Support | 0 (0.0%) | 8 (100.0%) |
| Education Instruction & Library | 4 (3.3%) | 119 (96.8%) |
| Arts, Media & Entertainment | 26 (65.0%) | 14 (35.0%) |
| Health Diagnosing & Treating | 25 (14.1%) | 152 (85.9%) |
| Health Technologists | 4 (3.3%) | 119 (96.8%) |
| Total (Category) | 524 (46.9%) | 594 (53.1%) |
| Total (Overall) | 1,562 (53.1%) | 1,380 (46.9%) |
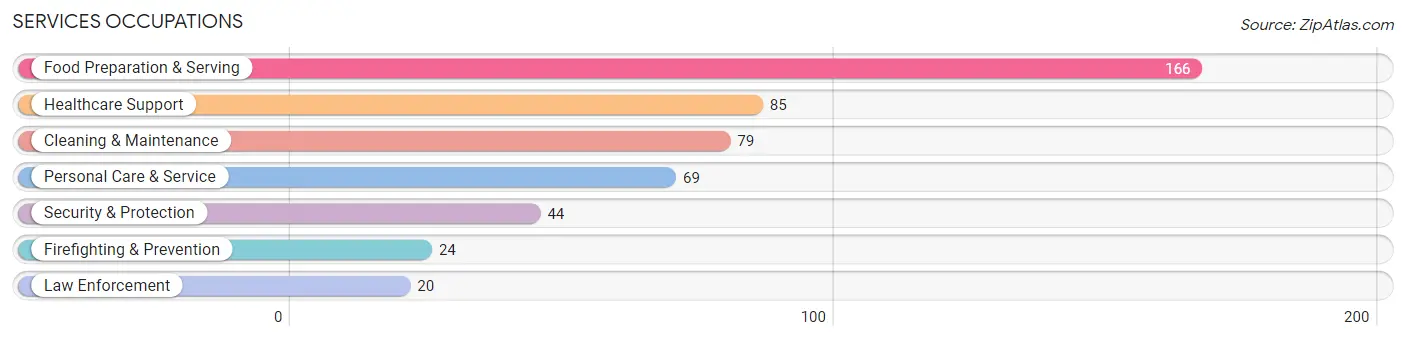
Services Occupations
The most common Services occupations in Henderson County are Food Preparation & Serving (166 | 5.6%), Healthcare Support (85 | 2.9%), Cleaning & Maintenance (79 | 2.7%), Personal Care & Service (69 | 2.4%), and Security & Protection (44 | 1.5%).
Services Occupations by Sex
Within the Services occupations in Henderson County, the most male-oriented occupations are Firefighting & Prevention (91.7%), Security & Protection (90.9%), and Law Enforcement (90.0%), while the most female-oriented occupations are Healthcare Support (100.0%), Personal Care & Service (100.0%), and Food Preparation & Serving (90.4%).
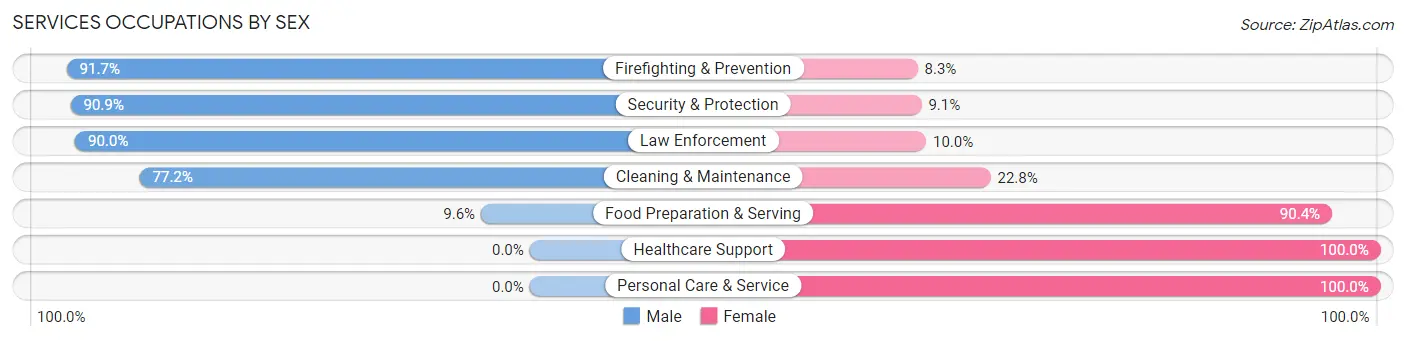
| Occupation | Male | Female |
| Healthcare Support | 0 (0.0%) | 85 (100.0%) |
| Security & Protection | 40 (90.9%) | 4 (9.1%) |
| Firefighting & Prevention | 22 (91.7%) | 2 (8.3%) |
| Law Enforcement | 18 (90.0%) | 2 (10.0%) |
| Food Preparation & Serving | 16 (9.6%) | 150 (90.4%) |
| Cleaning & Maintenance | 61 (77.2%) | 18 (22.8%) |
| Personal Care & Service | 0 (0.0%) | 69 (100.0%) |
| Total (Category) | 117 (26.4%) | 326 (73.6%) |
| Total (Overall) | 1,562 (53.1%) | 1,380 (46.9%) |
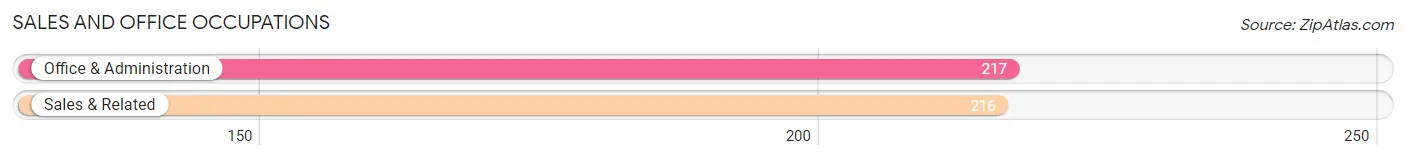
Sales and Office Occupations
The most common Sales and Office occupations in Henderson County are Office & Administration (217 | 7.4%), and Sales & Related (216 | 7.3%).
Sales and Office Occupations by Sex
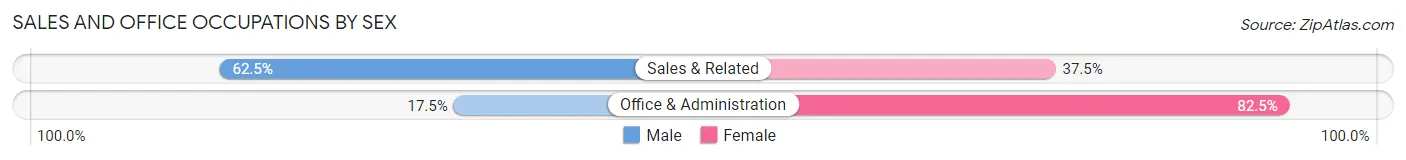
| Occupation | Male | Female |
| Sales & Related | 135 (62.5%) | 81 (37.5%) |
| Office & Administration | 38 (17.5%) | 179 (82.5%) |
| Total (Category) | 173 (40.0%) | 260 (60.1%) |
| Total (Overall) | 1,562 (53.1%) | 1,380 (46.9%) |
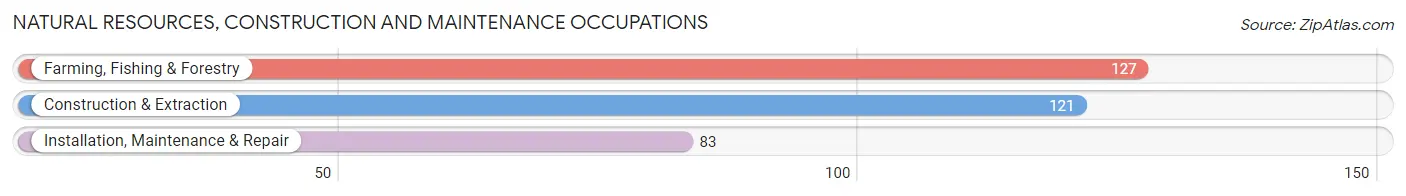
Natural Resources, Construction and Maintenance Occupations
The most common Natural Resources, Construction and Maintenance occupations in Henderson County are Farming, Fishing & Forestry (127 | 4.3%), Construction & Extraction (121 | 4.1%), and Installation, Maintenance & Repair (83 | 2.8%).
Natural Resources, Construction and Maintenance Occupations by Sex
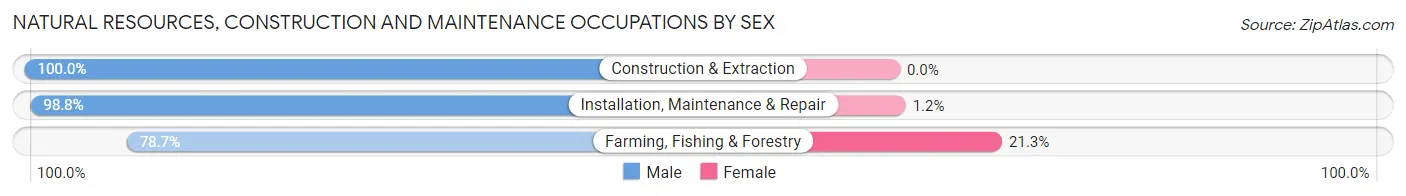
| Occupation | Male | Female |
| Farming, Fishing & Forestry | 100 (78.7%) | 27 (21.3%) |
| Construction & Extraction | 121 (100.0%) | 0 (0.0%) |
| Installation, Maintenance & Repair | 82 (98.8%) | 1 (1.2%) |
| Total (Category) | 303 (91.5%) | 28 (8.5%) |
| Total (Overall) | 1,562 (53.1%) | 1,380 (46.9%) |
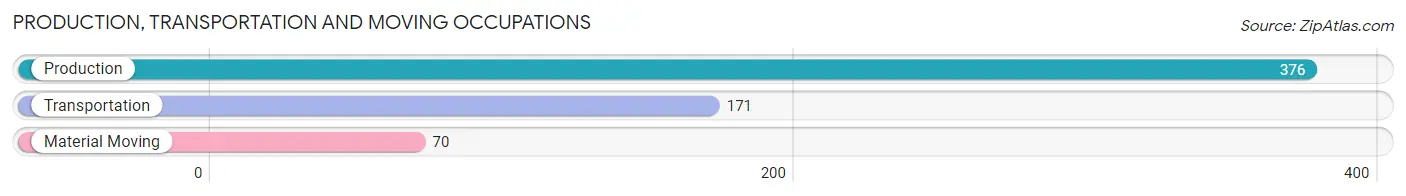
Production, Transportation and Moving Occupations
The most common Production, Transportation and Moving occupations in Henderson County are Production (376 | 12.8%), Transportation (171 | 5.8%), and Material Moving (70 | 2.4%).
Production, Transportation and Moving Occupations by Sex
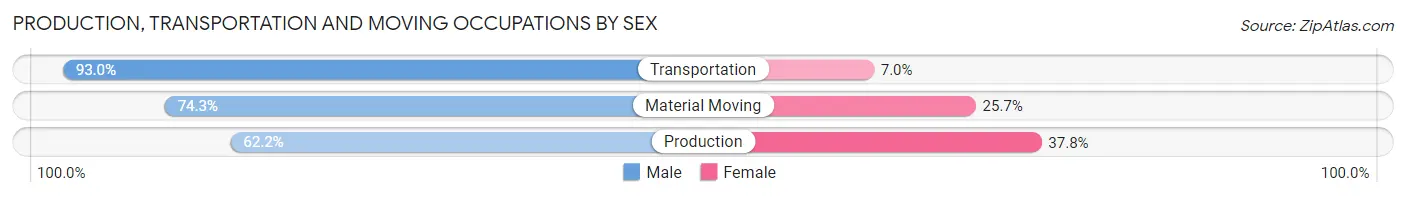
| Occupation | Male | Female |
| Production | 234 (62.2%) | 142 (37.8%) |
| Transportation | 159 (93.0%) | 12 (7.0%) |
| Material Moving | 52 (74.3%) | 18 (25.7%) |
| Total (Category) | 445 (72.1%) | 172 (27.9%) |
| Total (Overall) | 1,562 (53.1%) | 1,380 (46.9%) |
Employment Industries by Sex in Henderson County
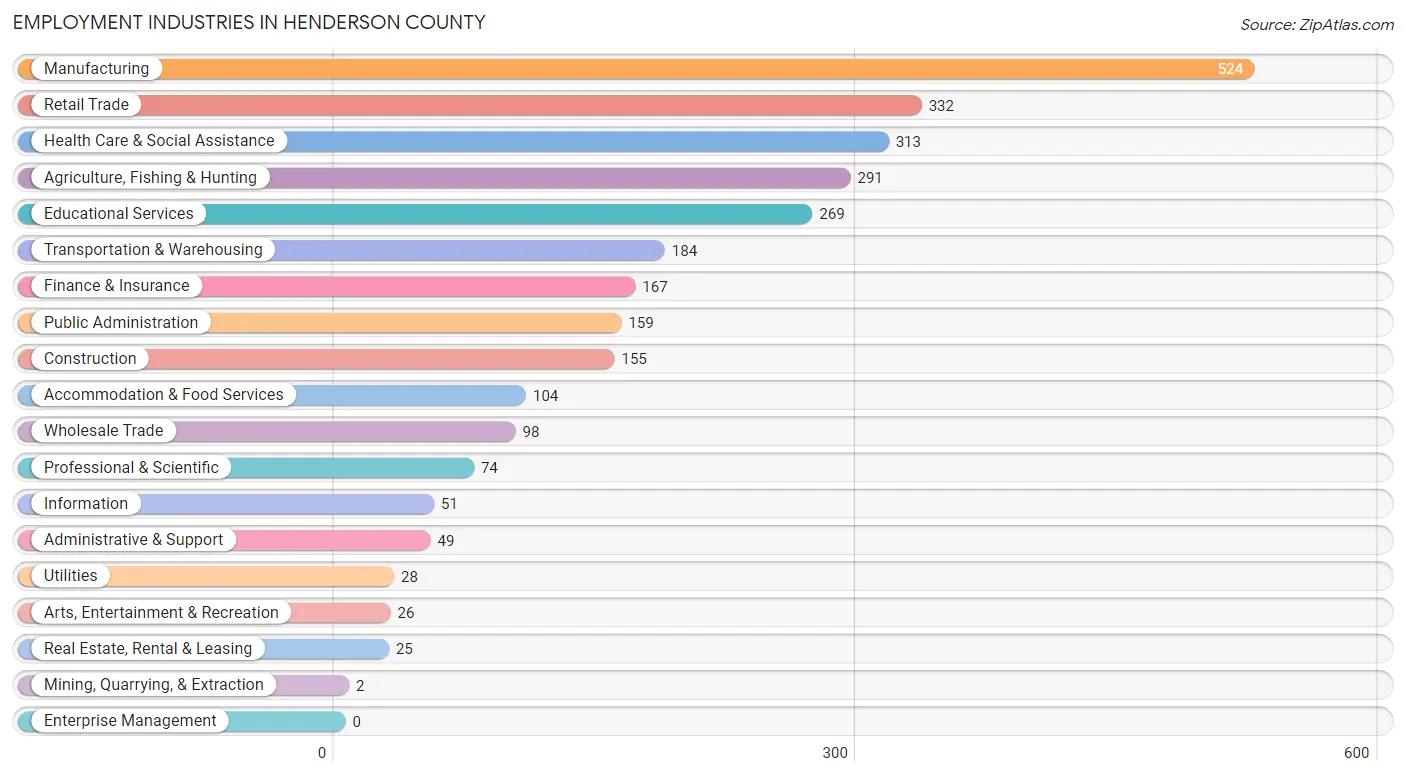
Employment Industries in Henderson County
The major employment industries in Henderson County include Manufacturing (524 | 17.8%), Retail Trade (332 | 11.3%), Health Care & Social Assistance (313 | 10.6%), Agriculture, Fishing & Hunting (291 | 9.9%), and Educational Services (269 | 9.1%).
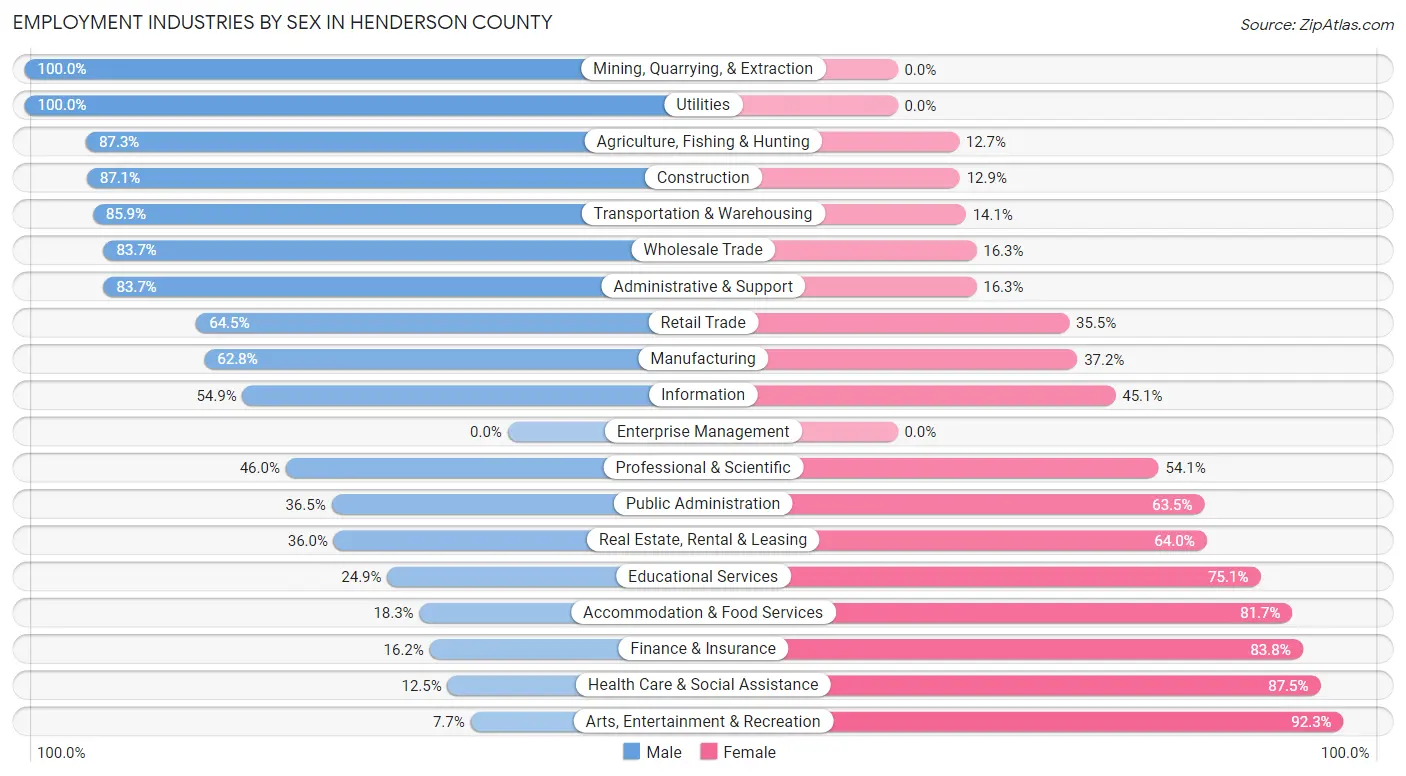
Employment Industries by Sex in Henderson County
The Henderson County industries that see more men than women are Mining, Quarrying, & Extraction (100.0%), Utilities (100.0%), and Agriculture, Fishing & Hunting (87.3%), whereas the industries that tend to have a higher number of women are Arts, Entertainment & Recreation (92.3%), Health Care & Social Assistance (87.5%), and Finance & Insurance (83.8%).
| Industry | Male | Female |
| Agriculture, Fishing & Hunting | 254 (87.3%) | 37 (12.7%) |
| Mining, Quarrying, & Extraction | 2 (100.0%) | 0 (0.0%) |
| Construction | 135 (87.1%) | 20 (12.9%) |
| Manufacturing | 329 (62.8%) | 195 (37.2%) |
| Wholesale Trade | 82 (83.7%) | 16 (16.3%) |
| Retail Trade | 214 (64.5%) | 118 (35.5%) |
| Transportation & Warehousing | 158 (85.9%) | 26 (14.1%) |
| Utilities | 28 (100.0%) | 0 (0.0%) |
| Information | 28 (54.9%) | 23 (45.1%) |
| Finance & Insurance | 27 (16.2%) | 140 (83.8%) |
| Real Estate, Rental & Leasing | 9 (36.0%) | 16 (64.0%) |
| Professional & Scientific | 34 (46.0%) | 40 (54.0%) |
| Enterprise Management | 0 (0.0%) | 0 (0.0%) |
| Administrative & Support | 41 (83.7%) | 8 (16.3%) |
| Educational Services | 67 (24.9%) | 202 (75.1%) |
| Health Care & Social Assistance | 39 (12.5%) | 274 (87.5%) |
| Arts, Entertainment & Recreation | 2 (7.7%) | 24 (92.3%) |
| Accommodation & Food Services | 19 (18.3%) | 85 (81.7%) |
| Public Administration | 58 (36.5%) | 101 (63.5%) |
| Total | 1,562 (53.1%) | 1,380 (46.9%) |
Education in Henderson County
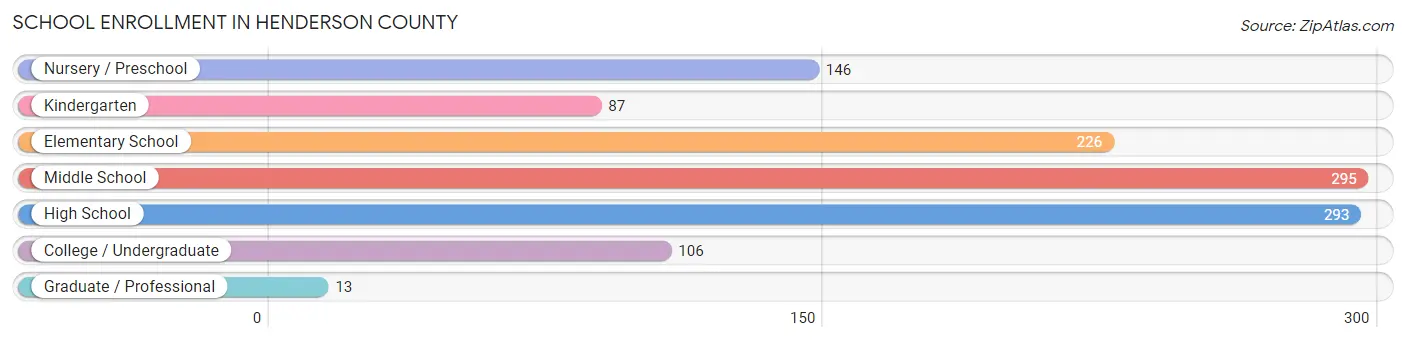
School Enrollment in Henderson County
The most common levels of schooling among the 1,166 students in Henderson County are middle school (295 | 25.3%), high school (293 | 25.1%), and elementary school (226 | 19.4%).
| School Level | # Students | % Students |
| Nursery / Preschool | 146 | 12.5% |
| Kindergarten | 87 | 7.5% |
| Elementary School | 226 | 19.4% |
| Middle School | 295 | 25.3% |
| High School | 293 | 25.1% |
| College / Undergraduate | 106 | 9.1% |
| Graduate / Professional | 13 | 1.1% |
| Total | 1,166 | 100.0% |
School Enrollment by Age by Funding Source in Henderson County
Out of a total of 1,166 students who are enrolled in schools in Henderson County, 195 (16.7%) attend a private institution, while the remaining 971 (83.3%) are enrolled in public schools. The age group of 3 to 4 year olds has the highest likelihood of being enrolled in private schools, with 66 (48.9% in the age bracket) enrolled. Conversely, the age group of 20 to 24 year olds has the lowest likelihood of being enrolled in a private school, with 40 (100.0% in the age bracket) attending a public institution.
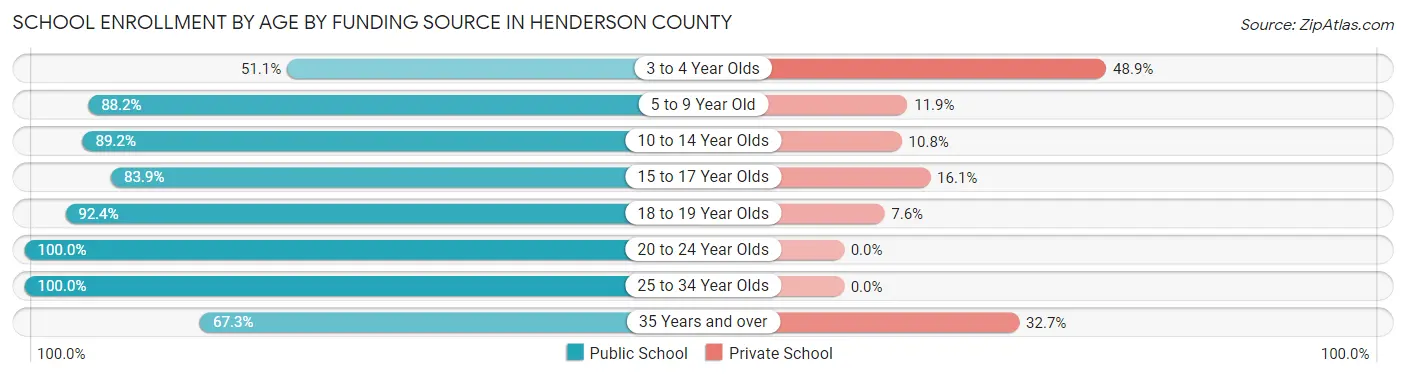
| Age Bracket | Public School | Private School |
| 3 to 4 Year Olds | 69 (51.1%) | 66 (48.9%) |
| 5 to 9 Year Old | 253 (88.1%) | 34 (11.8%) |
| 10 to 14 Year Olds | 322 (89.2%) | 39 (10.8%) |
| 15 to 17 Year Olds | 177 (83.9%) | 34 (16.1%) |
| 18 to 19 Year Olds | 61 (92.4%) | 5 (7.6%) |
| 20 to 24 Year Olds | 40 (100.0%) | 0 (0.0%) |
| 25 to 34 Year Olds | 14 (100.0%) | 0 (0.0%) |
| 35 Years and over | 35 (67.3%) | 17 (32.7%) |
| Total | 971 (83.3%) | 195 (16.7%) |
Educational Attainment by Field of Study in Henderson County
Education (262 | 25.2%), bio, nature & agricultural (173 | 16.6%), science & technology (138 | 13.3%), business (115 | 11.1%), and engineering (75 | 7.2%) are the most common fields of study among 1,041 individuals in Henderson County who have obtained a bachelor's degree or higher.
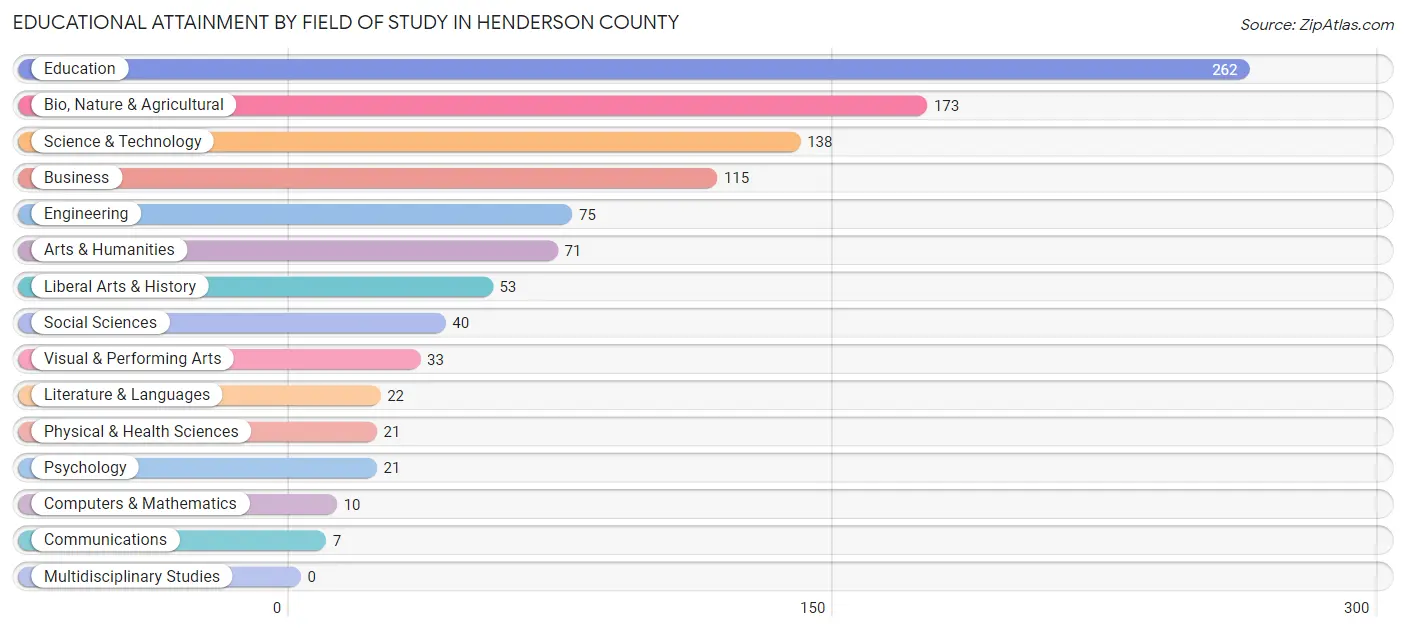
| Field of Study | # Graduates | % Graduates |
| Computers & Mathematics | 10 | 1.0% |
| Bio, Nature & Agricultural | 173 | 16.6% |
| Physical & Health Sciences | 21 | 2.0% |
| Psychology | 21 | 2.0% |
| Social Sciences | 40 | 3.8% |
| Engineering | 75 | 7.2% |
| Multidisciplinary Studies | 0 | 0.0% |
| Science & Technology | 138 | 13.3% |
| Business | 115 | 11.1% |
| Education | 262 | 25.2% |
| Literature & Languages | 22 | 2.1% |
| Liberal Arts & History | 53 | 5.1% |
| Visual & Performing Arts | 33 | 3.2% |
| Communications | 7 | 0.7% |
| Arts & Humanities | 71 | 6.8% |
| Total | 1,041 | 100.0% |
Transportation & Commute in Henderson County
Vehicle Availability by Sex in Henderson County
The most prevalent vehicle ownership categories in Henderson County are males with 2 vehicles (633, accounting for 41.0%) and females with 2 vehicles (595, making up 46.8%).
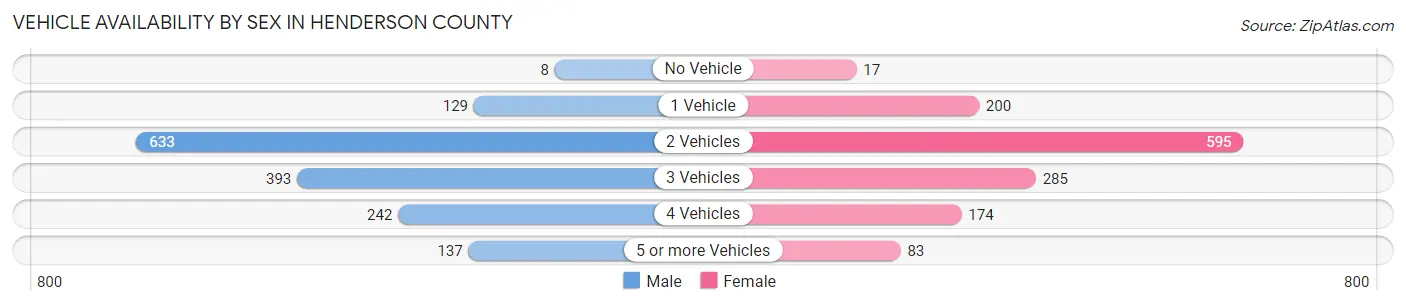
| Vehicles Available | Male | Female |
| No Vehicle | 8 (0.5%) | 17 (1.3%) |
| 1 Vehicle | 129 (8.4%) | 200 (14.8%) |
| 2 Vehicles | 633 (41.0%) | 595 (43.9%) |
| 3 Vehicles | 393 (25.5%) | 285 (21.0%) |
| 4 Vehicles | 242 (15.7%) | 174 (12.9%) |
| 5 or more Vehicles | 137 (8.9%) | 83 (6.1%) |
| Total | 1,542 (100.0%) | 1,354 (100.0%) |
Commute Time in Henderson County
The most frequently occuring commute durations in Henderson County are 20 to 24 minutes (466 commuters, 17.0%), 30 to 34 minutes (370 commuters, 13.5%), and 45 to 59 minutes (320 commuters, 11.7%).
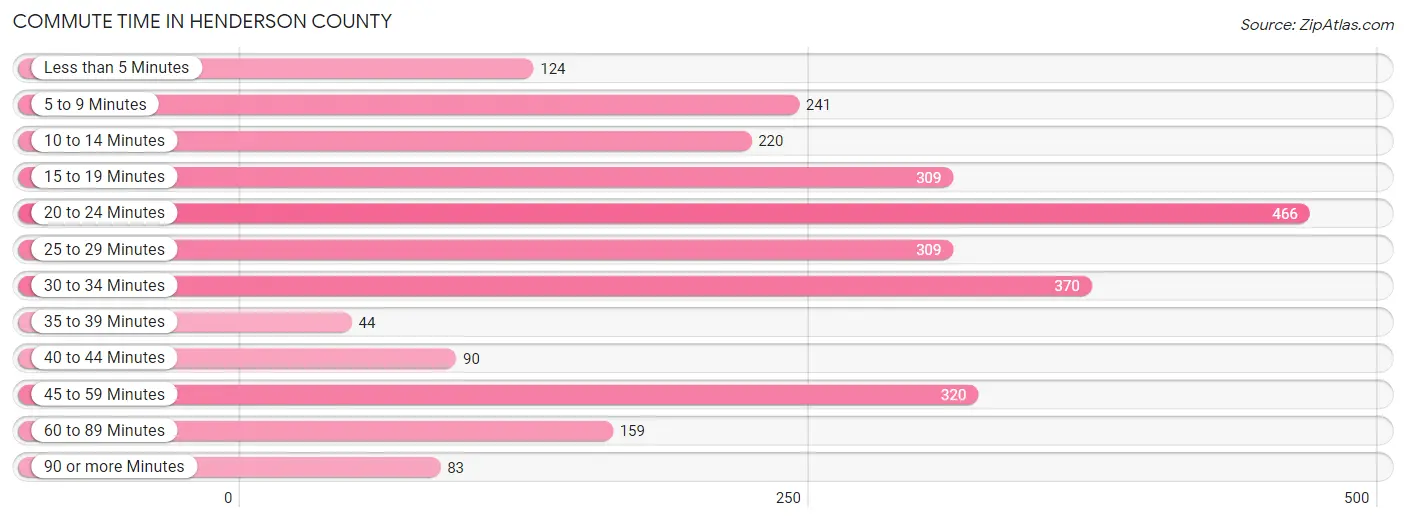
| Commute Time | # Commuters | % Commuters |
| Less than 5 Minutes | 124 | 4.5% |
| 5 to 9 Minutes | 241 | 8.8% |
| 10 to 14 Minutes | 220 | 8.0% |
| 15 to 19 Minutes | 309 | 11.3% |
| 20 to 24 Minutes | 466 | 17.0% |
| 25 to 29 Minutes | 309 | 11.3% |
| 30 to 34 Minutes | 370 | 13.5% |
| 35 to 39 Minutes | 44 | 1.6% |
| 40 to 44 Minutes | 90 | 3.3% |
| 45 to 59 Minutes | 320 | 11.7% |
| 60 to 89 Minutes | 159 | 5.8% |
| 90 or more Minutes | 83 | 3.0% |
Commute Time by Sex in Henderson County
The most common commute times in Henderson County are 20 to 24 minutes (248 commuters, 17.2%) for males and 20 to 24 minutes (218 commuters, 16.9%) for females.
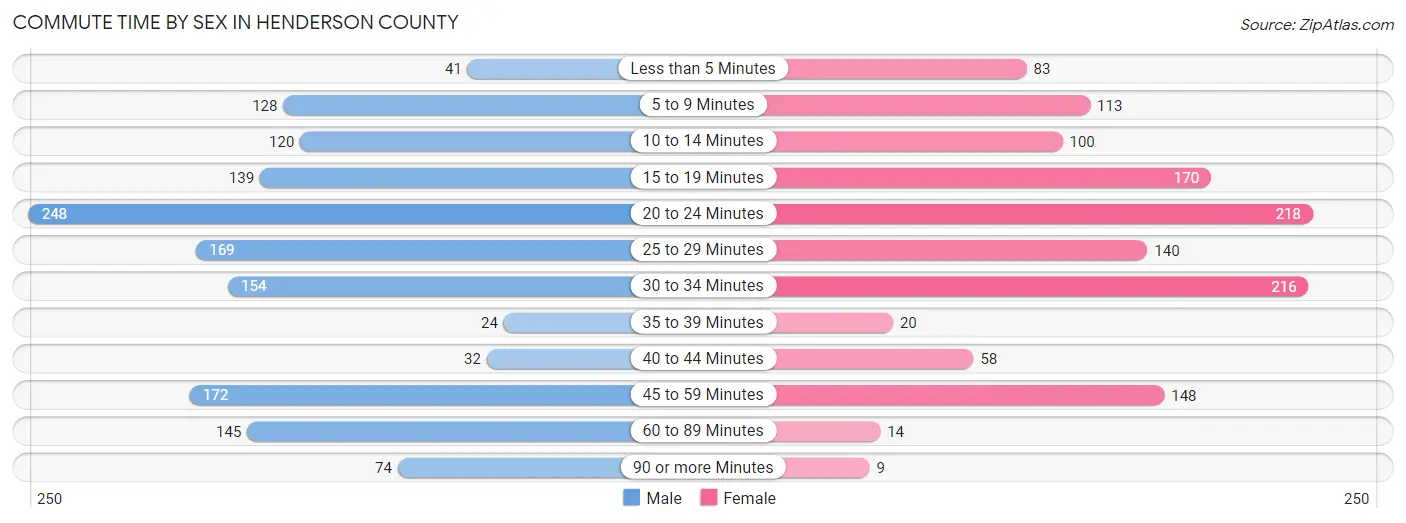
| Commute Time | Male | Female |
| Less than 5 Minutes | 41 (2.8%) | 83 (6.4%) |
| 5 to 9 Minutes | 128 (8.8%) | 113 (8.8%) |
| 10 to 14 Minutes | 120 (8.3%) | 100 (7.8%) |
| 15 to 19 Minutes | 139 (9.6%) | 170 (13.2%) |
| 20 to 24 Minutes | 248 (17.2%) | 218 (16.9%) |
| 25 to 29 Minutes | 169 (11.7%) | 140 (10.9%) |
| 30 to 34 Minutes | 154 (10.6%) | 216 (16.8%) |
| 35 to 39 Minutes | 24 (1.7%) | 20 (1.5%) |
| 40 to 44 Minutes | 32 (2.2%) | 58 (4.5%) |
| 45 to 59 Minutes | 172 (11.9%) | 148 (11.5%) |
| 60 to 89 Minutes | 145 (10.0%) | 14 (1.1%) |
| 90 or more Minutes | 74 (5.1%) | 9 (0.7%) |
Time of Departure to Work by Sex in Henderson County
The most frequent times of departure to work in Henderson County are 5:00 AM to 5:29 AM (194, 13.4%) for males and 7:30 AM to 7:59 AM (236, 18.3%) for females.
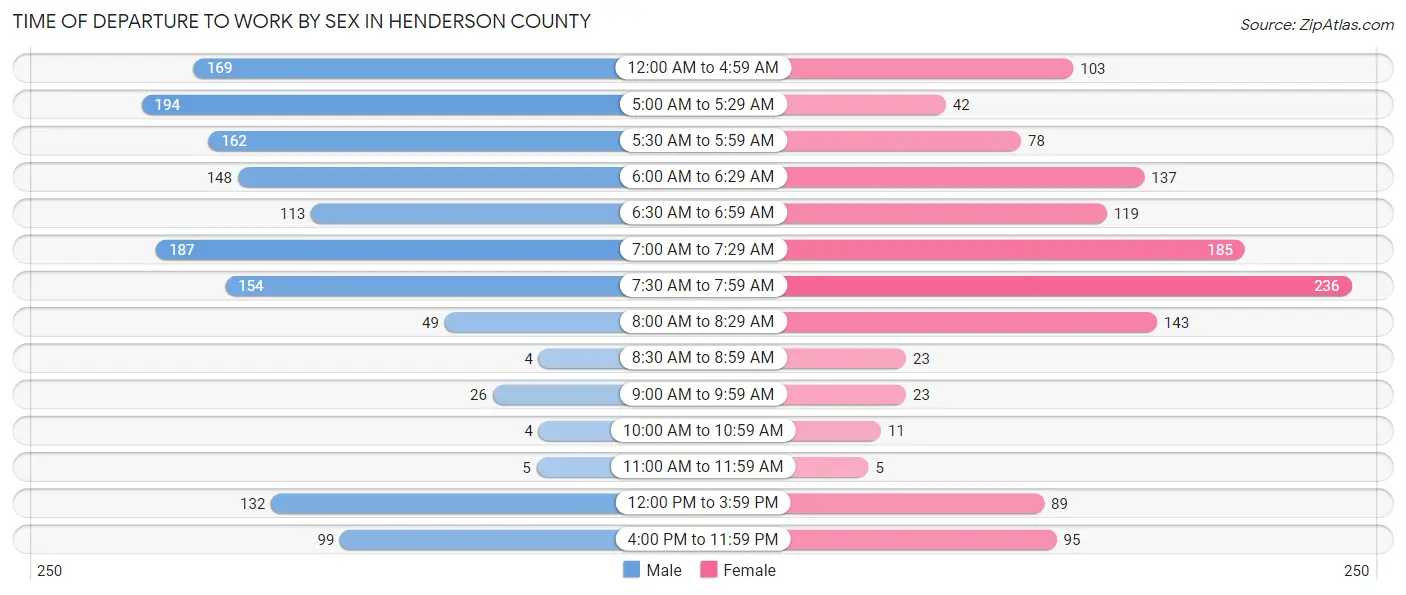
| Time of Departure | Male | Female |
| 12:00 AM to 4:59 AM | 169 (11.7%) | 103 (8.0%) |
| 5:00 AM to 5:29 AM | 194 (13.4%) | 42 (3.3%) |
| 5:30 AM to 5:59 AM | 162 (11.2%) | 78 (6.0%) |
| 6:00 AM to 6:29 AM | 148 (10.2%) | 137 (10.6%) |
| 6:30 AM to 6:59 AM | 113 (7.8%) | 119 (9.2%) |
| 7:00 AM to 7:29 AM | 187 (12.9%) | 185 (14.3%) |
| 7:30 AM to 7:59 AM | 154 (10.6%) | 236 (18.3%) |
| 8:00 AM to 8:29 AM | 49 (3.4%) | 143 (11.1%) |
| 8:30 AM to 8:59 AM | 4 (0.3%) | 23 (1.8%) |
| 9:00 AM to 9:59 AM | 26 (1.8%) | 23 (1.8%) |
| 10:00 AM to 10:59 AM | 4 (0.3%) | 11 (0.9%) |
| 11:00 AM to 11:59 AM | 5 (0.4%) | 5 (0.4%) |
| 12:00 PM to 3:59 PM | 132 (9.1%) | 89 (6.9%) |
| 4:00 PM to 11:59 PM | 99 (6.9%) | 95 (7.4%) |
| Total | 1,446 (100.0%) | 1,289 (100.0%) |
Housing Occupancy in Henderson County
Occupancy by Ownership in Henderson County
Of the total 2,745 dwellings in Henderson County, owner-occupied units account for 2,369 (86.3%), while renter-occupied units make up 376 (13.7%).
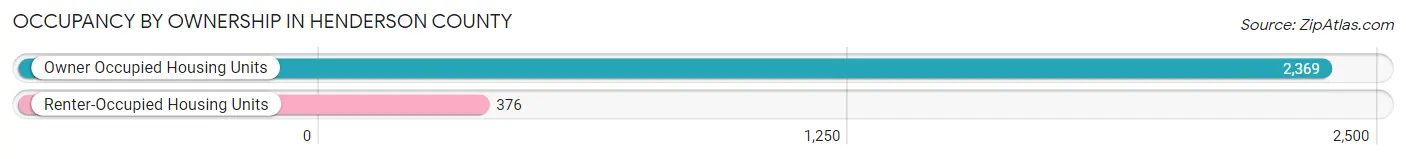
| Occupancy | # Housing Units | % Housing Units |
| Owner Occupied Housing Units | 2,369 | 86.3% |
| Renter-Occupied Housing Units | 376 | 13.7% |
| Total Occupied Housing Units | 2,745 | 100.0% |
Occupancy by Household Size in Henderson County
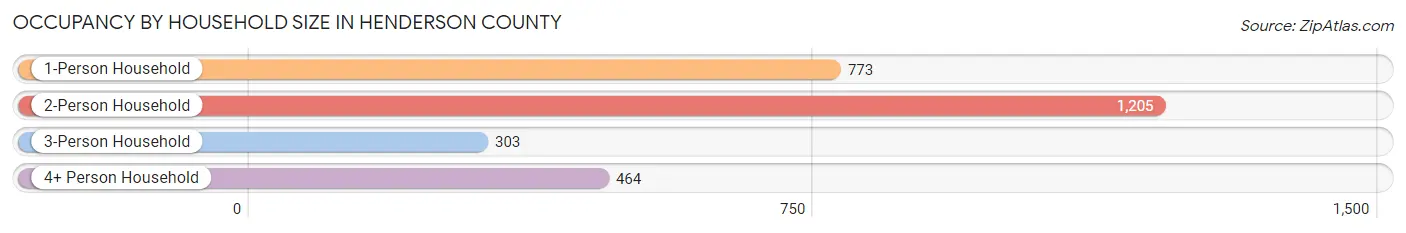
| Household Size | # Housing Units | % Housing Units |
| 1-Person Household | 773 | 28.2% |
| 2-Person Household | 1,205 | 43.9% |
| 3-Person Household | 303 | 11.0% |
| 4+ Person Household | 464 | 16.9% |
| Total Housing Units | 2,745 | 100.0% |
Occupancy by Ownership by Household Size in Henderson County
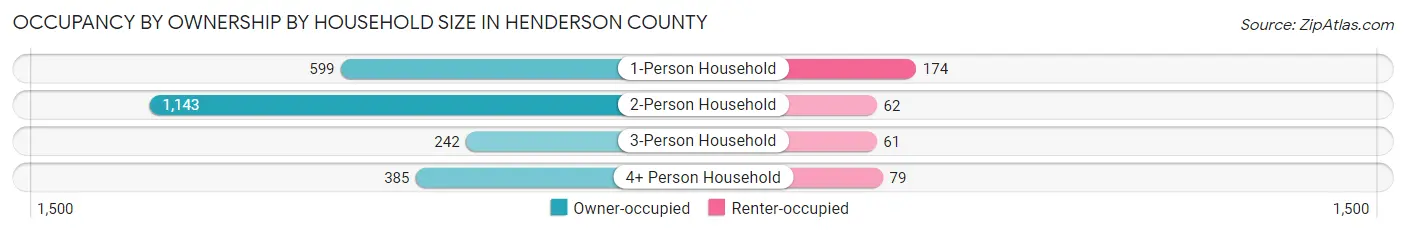
| Household Size | Owner-occupied | Renter-occupied |
| 1-Person Household | 599 (77.5%) | 174 (22.5%) |
| 2-Person Household | 1,143 (94.9%) | 62 (5.1%) |
| 3-Person Household | 242 (79.9%) | 61 (20.1%) |
| 4+ Person Household | 385 (83.0%) | 79 (17.0%) |
| Total Housing Units | 2,369 (86.3%) | 376 (13.7%) |
Occupancy by Educational Attainment in Henderson County
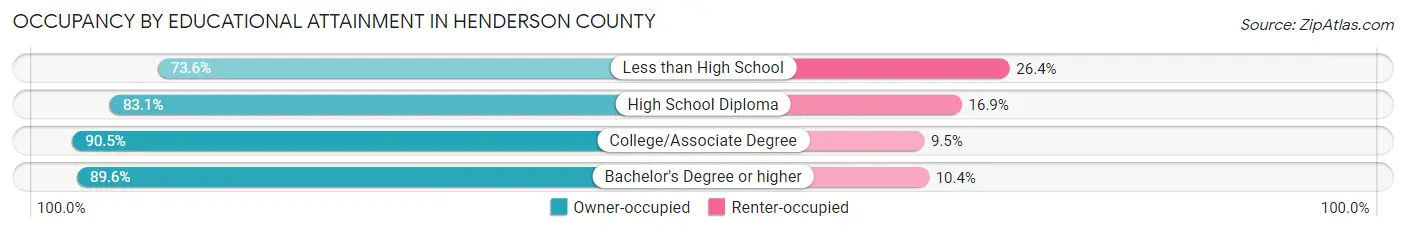
| Household Size | Owner-occupied | Renter-occupied |
| Less than High School | 142 (73.6%) | 51 (26.4%) |
| High School Diploma | 868 (83.1%) | 177 (16.9%) |
| College/Associate Degree | 877 (90.5%) | 92 (9.5%) |
| Bachelor's Degree or higher | 482 (89.6%) | 56 (10.4%) |
Occupancy by Age of Householder in Henderson County
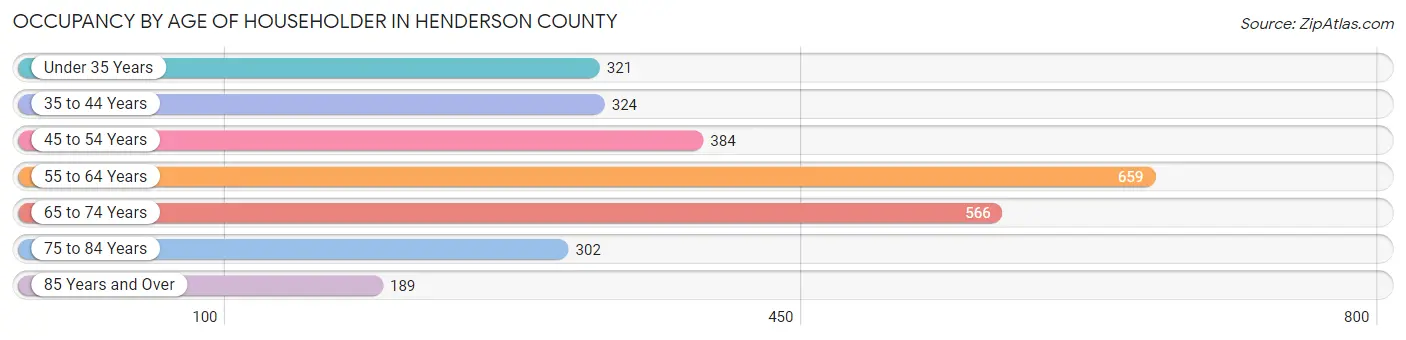
| Age Bracket | # Households | % Households |
| Under 35 Years | 321 | 11.7% |
| 35 to 44 Years | 324 | 11.8% |
| 45 to 54 Years | 384 | 14.0% |
| 55 to 64 Years | 659 | 24.0% |
| 65 to 74 Years | 566 | 20.6% |
| 75 to 84 Years | 302 | 11.0% |
| 85 Years and Over | 189 | 6.9% |
| Total | 2,745 | 100.0% |
Housing Finances in Henderson County
Median Income by Occupancy in Henderson County
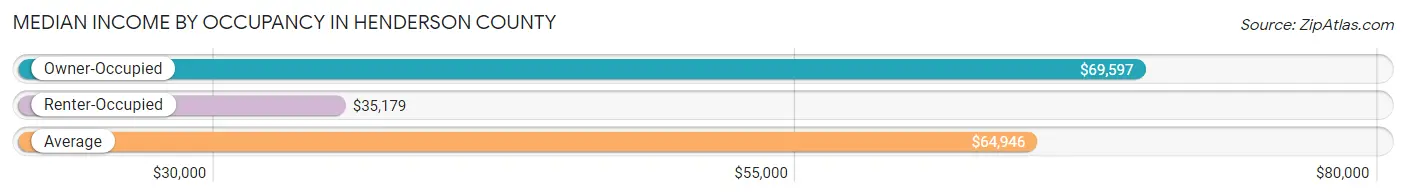
| Occupancy Type | # Households | Median Income |
| Owner-Occupied | 2,369 (86.3%) | $69,597 |
| Renter-Occupied | 376 (13.7%) | $35,179 |
| Average | 2,745 (100.0%) | $64,946 |
Occupancy by Householder Income Bracket in Henderson County
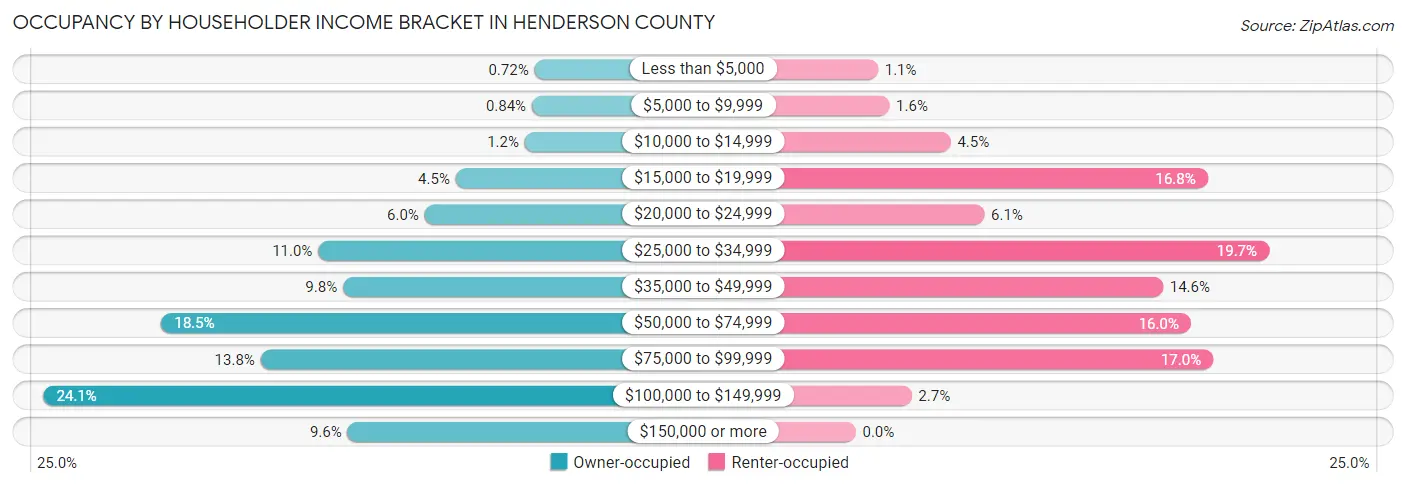
| Income Bracket | Owner-occupied | Renter-occupied |
| Less than $5,000 | 17 (0.7%) | 4 (1.1%) |
| $5,000 to $9,999 | 20 (0.8%) | 6 (1.6%) |
| $10,000 to $14,999 | 28 (1.2%) | 17 (4.5%) |
| $15,000 to $19,999 | 106 (4.5%) | 63 (16.8%) |
| $20,000 to $24,999 | 141 (5.9%) | 23 (6.1%) |
| $25,000 to $34,999 | 261 (11.0%) | 74 (19.7%) |
| $35,000 to $49,999 | 233 (9.8%) | 55 (14.6%) |
| $50,000 to $74,999 | 438 (18.5%) | 60 (16.0%) |
| $75,000 to $99,999 | 326 (13.8%) | 64 (17.0%) |
| $100,000 to $149,999 | 571 (24.1%) | 10 (2.7%) |
| $150,000 or more | 228 (9.6%) | 0 (0.0%) |
| Total | 2,369 (100.0%) | 376 (100.0%) |
Monthly Housing Cost Tiers in Henderson County
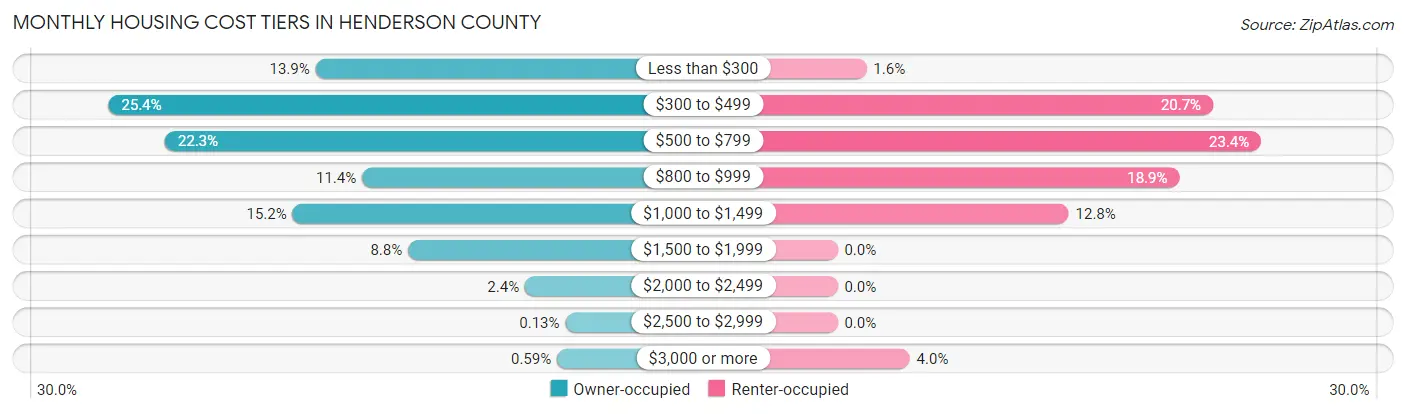
| Monthly Cost | Owner-occupied | Renter-occupied |
| Less than $300 | 330 (13.9%) | 6 (1.6%) |
| $300 to $499 | 601 (25.4%) | 78 (20.7%) |
| $500 to $799 | 527 (22.3%) | 88 (23.4%) |
| $800 to $999 | 269 (11.4%) | 71 (18.9%) |
| $1,000 to $1,499 | 360 (15.2%) | 48 (12.8%) |
| $1,500 to $1,999 | 209 (8.8%) | 0 (0.0%) |
| $2,000 to $2,499 | 56 (2.4%) | 0 (0.0%) |
| $2,500 to $2,999 | 3 (0.1%) | 0 (0.0%) |
| $3,000 or more | 14 (0.6%) | 15 (4.0%) |
| Total | 2,369 (100.0%) | 376 (100.0%) |
Physical Housing Characteristics in Henderson County
Housing Structures in Henderson County
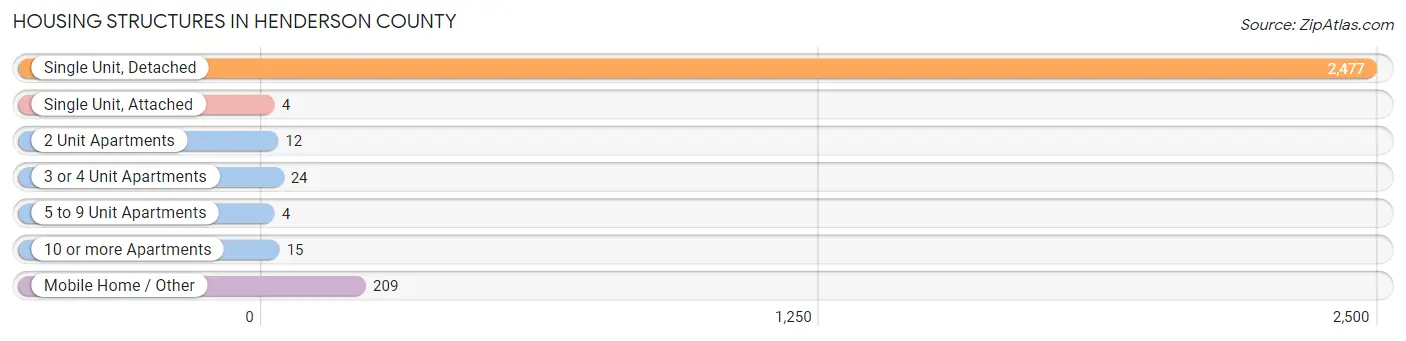
| Structure Type | # Housing Units | % Housing Units |
| Single Unit, Detached | 2,477 | 90.2% |
| Single Unit, Attached | 4 | 0.2% |
| 2 Unit Apartments | 12 | 0.4% |
| 3 or 4 Unit Apartments | 24 | 0.9% |
| 5 to 9 Unit Apartments | 4 | 0.2% |
| 10 or more Apartments | 15 | 0.5% |
| Mobile Home / Other | 209 | 7.6% |
| Total | 2,745 | 100.0% |
Housing Structures by Occupancy in Henderson County
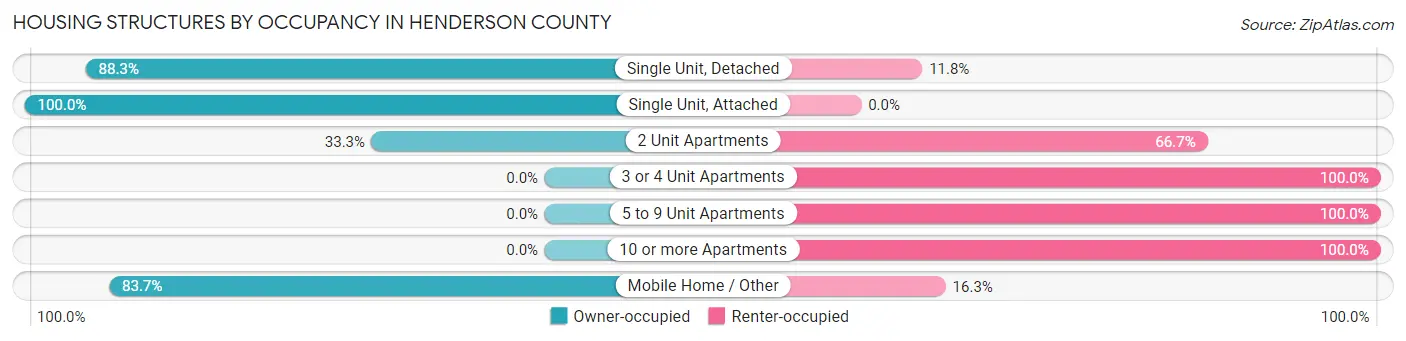
| Structure Type | Owner-occupied | Renter-occupied |
| Single Unit, Detached | 2,186 (88.2%) | 291 (11.7%) |
| Single Unit, Attached | 4 (100.0%) | 0 (0.0%) |
| 2 Unit Apartments | 4 (33.3%) | 8 (66.7%) |
| 3 or 4 Unit Apartments | 0 (0.0%) | 24 (100.0%) |
| 5 to 9 Unit Apartments | 0 (0.0%) | 4 (100.0%) |
| 10 or more Apartments | 0 (0.0%) | 15 (100.0%) |
| Mobile Home / Other | 175 (83.7%) | 34 (16.3%) |
| Total | 2,369 (86.3%) | 376 (13.7%) |
Housing Structures by Number of Rooms in Henderson County
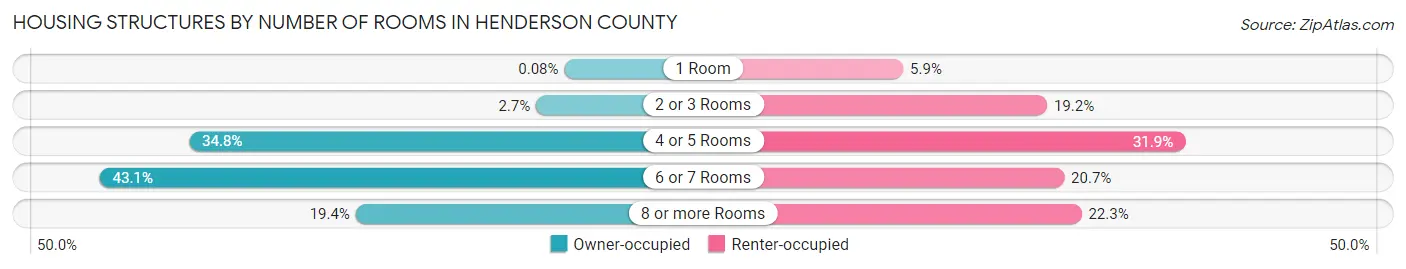
| Number of Rooms | Owner-occupied | Renter-occupied |
| 1 Room | 2 (0.1%) | 22 (5.9%) |
| 2 or 3 Rooms | 64 (2.7%) | 72 (19.2%) |
| 4 or 5 Rooms | 824 (34.8%) | 120 (31.9%) |
| 6 or 7 Rooms | 1,020 (43.1%) | 78 (20.7%) |
| 8 or more Rooms | 459 (19.4%) | 84 (22.3%) |
| Total | 2,369 (100.0%) | 376 (100.0%) |
Housing Structure by Heating Type in Henderson County
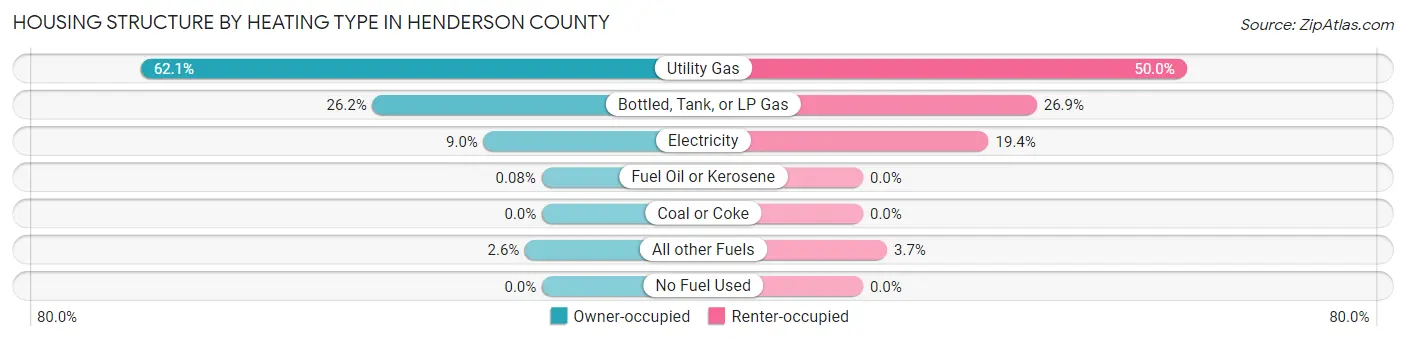
| Heating Type | Owner-occupied | Renter-occupied |
| Utility Gas | 1,470 (62.1%) | 188 (50.0%) |
| Bottled, Tank, or LP Gas | 621 (26.2%) | 101 (26.9%) |
| Electricity | 214 (9.0%) | 73 (19.4%) |
| Fuel Oil or Kerosene | 2 (0.1%) | 0 (0.0%) |
| Coal or Coke | 0 (0.0%) | 0 (0.0%) |
| All other Fuels | 62 (2.6%) | 14 (3.7%) |
| No Fuel Used | 0 (0.0%) | 0 (0.0%) |
| Total | 2,369 (100.0%) | 376 (100.0%) |
Household Vehicle Usage in Henderson County
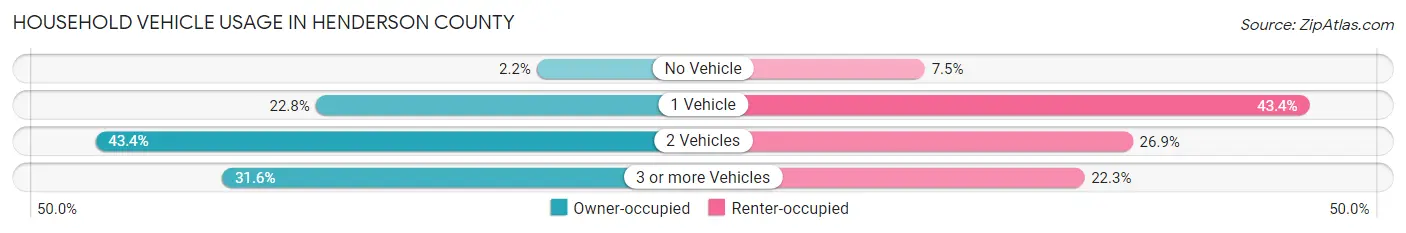
| Vehicles per Household | Owner-occupied | Renter-occupied |
| No Vehicle | 52 (2.2%) | 28 (7.4%) |
| 1 Vehicle | 541 (22.8%) | 163 (43.3%) |
| 2 Vehicles | 1,028 (43.4%) | 101 (26.9%) |
| 3 or more Vehicles | 748 (31.6%) | 84 (22.3%) |
| Total | 2,369 (100.0%) | 376 (100.0%) |
Real Estate & Mortgages in Henderson County
Real Estate and Mortgage Overview in Henderson County
| Characteristic | Without Mortgage | With Mortgage |
| Housing Units | 1,324 | 1,045 |
| Median Property Value | $89,100 | $120,900 |
| Median Household Income | $53,088 | $128 |
| Monthly Housing Costs | $433 | $14 |
| Real Estate Taxes | $1,595 | $13 |
Property Value by Mortgage Status in Henderson County
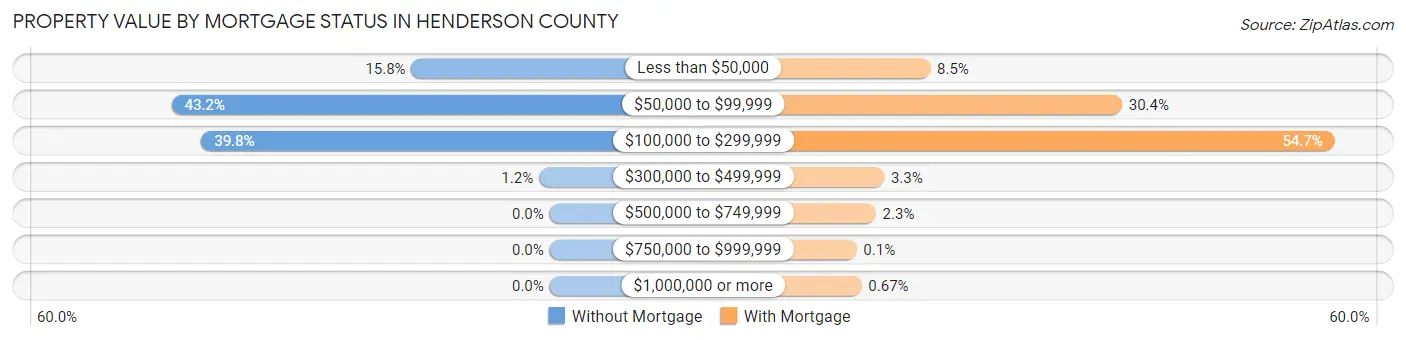
| Property Value | Without Mortgage | With Mortgage |
| Less than $50,000 | 209 (15.8%) | 89 (8.5%) |
| $50,000 to $99,999 | 572 (43.2%) | 318 (30.4%) |
| $100,000 to $299,999 | 527 (39.8%) | 572 (54.7%) |
| $300,000 to $499,999 | 16 (1.2%) | 34 (3.3%) |
| $500,000 to $749,999 | 0 (0.0%) | 24 (2.3%) |
| $750,000 to $999,999 | 0 (0.0%) | 1 (0.1%) |
| $1,000,000 or more | 0 (0.0%) | 7 (0.7%) |
| Total | 1,324 (100.0%) | 1,045 (100.0%) |
Household Income by Mortgage Status in Henderson County
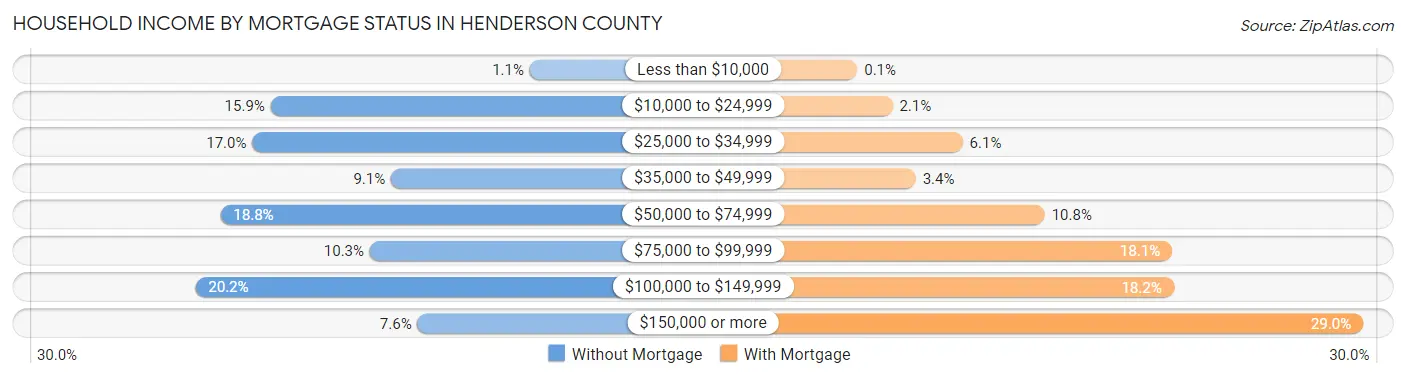
| Household Income | Without Mortgage | With Mortgage |
| Less than $10,000 | 15 (1.1%) | 1 (0.1%) |
| $10,000 to $24,999 | 211 (15.9%) | 22 (2.1%) |
| $25,000 to $34,999 | 225 (17.0%) | 64 (6.1%) |
| $35,000 to $49,999 | 120 (9.1%) | 36 (3.4%) |
| $50,000 to $74,999 | 249 (18.8%) | 113 (10.8%) |
| $75,000 to $99,999 | 136 (10.3%) | 189 (18.1%) |
| $100,000 to $149,999 | 268 (20.2%) | 190 (18.2%) |
| $150,000 or more | 100 (7.5%) | 303 (29.0%) |
| Total | 1,324 (100.0%) | 1,045 (100.0%) |
Property Value to Household Income Ratio in Henderson County
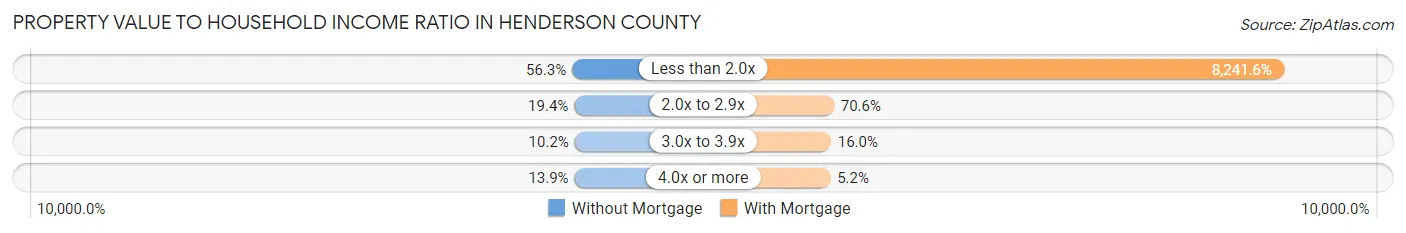
| Value-to-Income Ratio | Without Mortgage | With Mortgage |
| Less than 2.0x | 746 (56.3%) | 86,125 (8,241.6%) |
| 2.0x to 2.9x | 257 (19.4%) | 738 (70.6%) |
| 3.0x to 3.9x | 135 (10.2%) | 167 (16.0%) |
| 4.0x or more | 184 (13.9%) | 54 (5.2%) |
| Total | 1,324 (100.0%) | 1,045 (100.0%) |
Real Estate Taxes by Mortgage Status in Henderson County
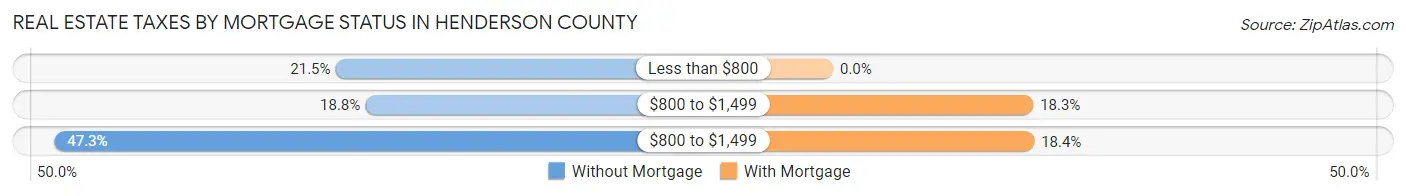
| Property Taxes | Without Mortgage | With Mortgage |
| Less than $800 | 285 (21.5%) | 0 (0.0%) |
| $800 to $1,499 | 249 (18.8%) | 191 (18.3%) |
| $800 to $1,499 | 626 (47.3%) | 192 (18.4%) |
| Total | 1,324 (100.0%) | 1,045 (100.0%) |
Health & Disability in Henderson County
Health Insurance Coverage by Age in Henderson County
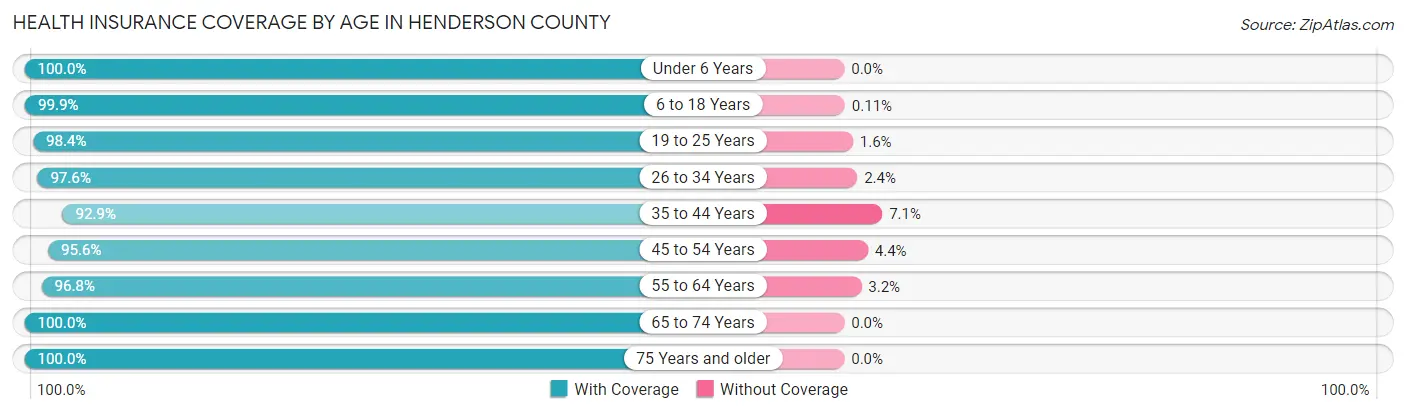
| Age Bracket | With Coverage | Without Coverage |
| Under 6 Years | 390 (100.0%) | 0 (0.0%) |
| 6 to 18 Years | 878 (99.9%) | 1 (0.1%) |
| 19 to 25 Years | 372 (98.4%) | 6 (1.6%) |
| 26 to 34 Years | 526 (97.6%) | 13 (2.4%) |
| 35 to 44 Years | 617 (92.9%) | 47 (7.1%) |
| 45 to 54 Years | 718 (95.6%) | 33 (4.4%) |
| 55 to 64 Years | 1,064 (96.8%) | 35 (3.2%) |
| 65 to 74 Years | 885 (100.0%) | 0 (0.0%) |
| 75 Years and older | 733 (100.0%) | 0 (0.0%) |
| Total | 6,183 (97.9%) | 135 (2.1%) |
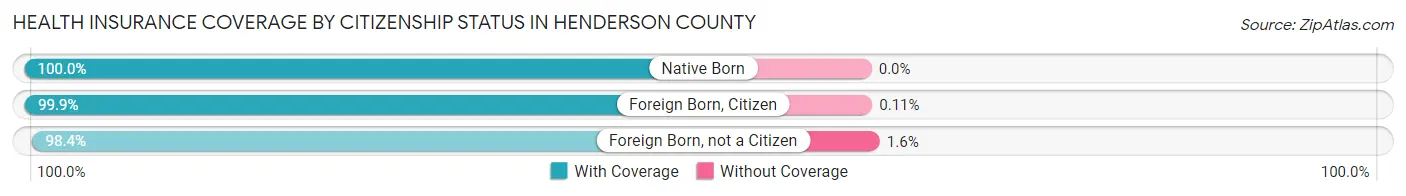
Health Insurance Coverage by Citizenship Status in Henderson County
| Citizenship Status | With Coverage | Without Coverage |
| Native Born | 390 (100.0%) | 0 (0.0%) |
| Foreign Born, Citizen | 878 (99.9%) | 1 (0.1%) |
| Foreign Born, not a Citizen | 372 (98.4%) | 6 (1.6%) |
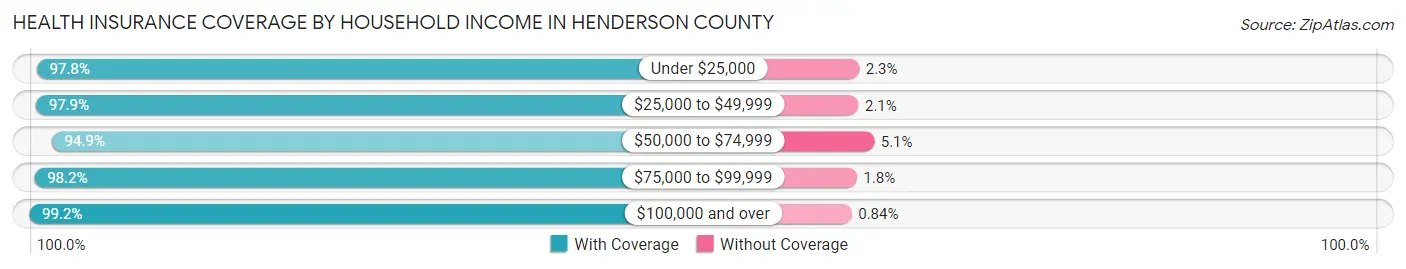
Health Insurance Coverage by Household Income in Henderson County
| Household Income | With Coverage | Without Coverage |
| Under $25,000 | 607 (97.8%) | 14 (2.2%) |
| $25,000 to $49,999 | 1,205 (97.9%) | 26 (2.1%) |
| $50,000 to $74,999 | 1,050 (94.9%) | 56 (5.1%) |
| $75,000 to $99,999 | 1,088 (98.2%) | 20 (1.8%) |
| $100,000 and over | 2,230 (99.2%) | 19 (0.8%) |
Public vs Private Health Insurance Coverage by Age in Henderson County
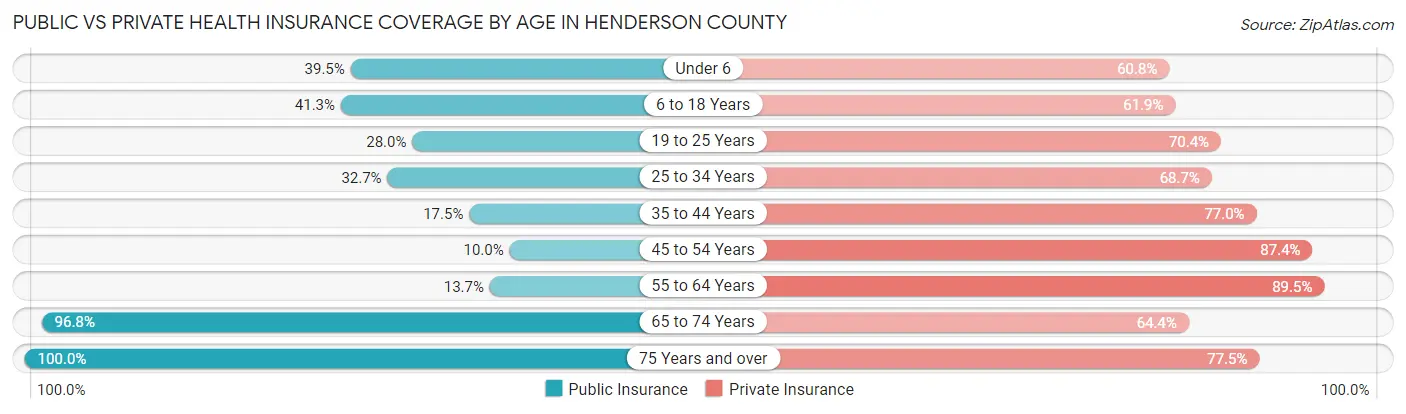
| Age Bracket | Public Insurance | Private Insurance |
| Under 6 | 154 (39.5%) | 237 (60.8%) |
| 6 to 18 Years | 363 (41.3%) | 544 (61.9%) |
| 19 to 25 Years | 106 (28.0%) | 266 (70.4%) |
| 25 to 34 Years | 176 (32.7%) | 370 (68.6%) |
| 35 to 44 Years | 116 (17.5%) | 511 (77.0%) |
| 45 to 54 Years | 75 (10.0%) | 656 (87.4%) |
| 55 to 64 Years | 150 (13.7%) | 984 (89.5%) |
| 65 to 74 Years | 857 (96.8%) | 570 (64.4%) |
| 75 Years and over | 733 (100.0%) | 568 (77.5%) |
| Total | 2,730 (43.2%) | 4,706 (74.5%) |
Disability Status by Sex by Age in Henderson County
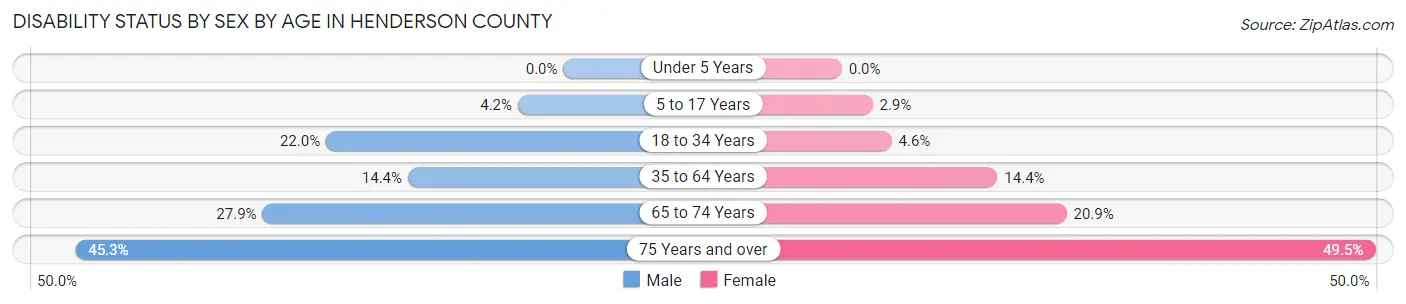
| Age Bracket | Male | Female |
| Under 5 Years | 0 (0.0%) | 0 (0.0%) |
| 5 to 17 Years | 20 (4.2%) | 12 (2.9%) |
| 18 to 34 Years | 113 (22.0%) | 22 (4.6%) |
| 35 to 64 Years | 180 (14.4%) | 183 (14.4%) |
| 65 to 74 Years | 124 (27.9%) | 92 (20.9%) |
| 75 Years and over | 149 (45.3%) | 200 (49.5%) |
Disability Class by Sex by Age in Henderson County
Disability Class: Hearing Difficulty
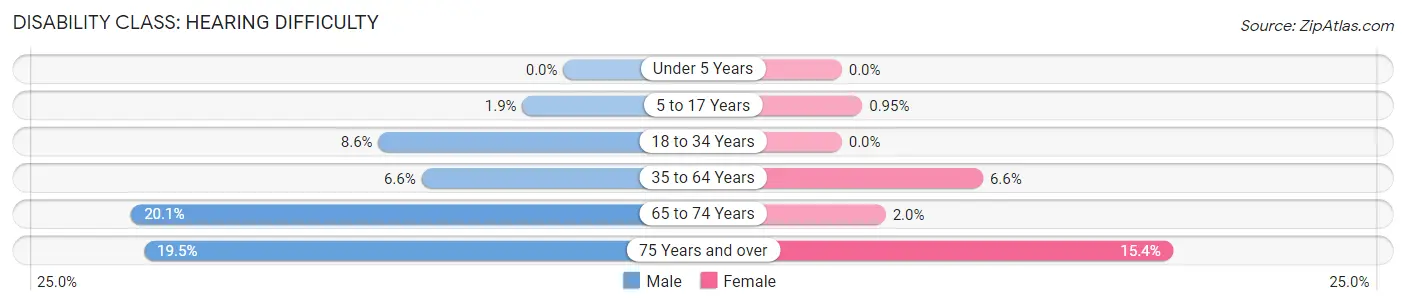
| Age Bracket | Male | Female |
| Under 5 Years | 0 (0.0%) | 0 (0.0%) |
| 5 to 17 Years | 9 (1.9%) | 4 (0.9%) |
| 18 to 34 Years | 44 (8.6%) | 0 (0.0%) |
| 35 to 64 Years | 82 (6.6%) | 83 (6.6%) |
| 65 to 74 Years | 89 (20.1%) | 9 (2.0%) |
| 75 Years and over | 64 (19.5%) | 62 (15.3%) |
Disability Class: Vision Difficulty
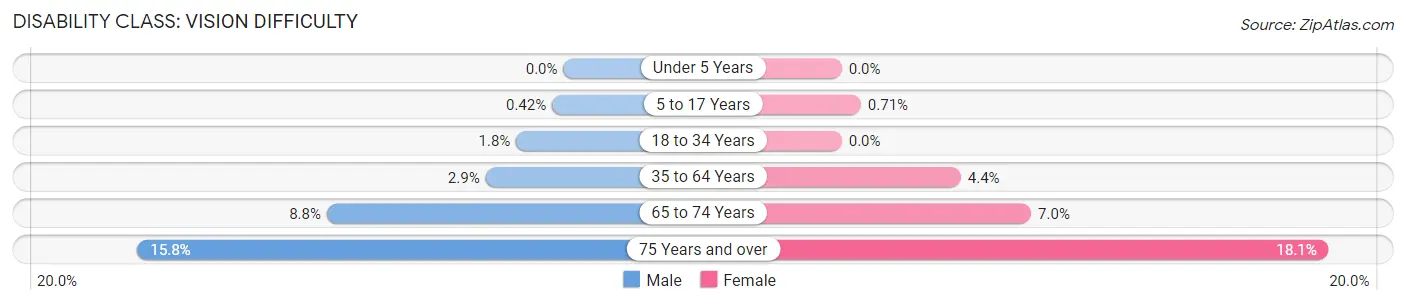
| Age Bracket | Male | Female |
| Under 5 Years | 0 (0.0%) | 0 (0.0%) |
| 5 to 17 Years | 2 (0.4%) | 3 (0.7%) |
| 18 to 34 Years | 9 (1.8%) | 0 (0.0%) |
| 35 to 64 Years | 36 (2.9%) | 56 (4.4%) |
| 65 to 74 Years | 39 (8.8%) | 31 (7.0%) |
| 75 Years and over | 52 (15.8%) | 73 (18.1%) |
Disability Class: Cognitive Difficulty
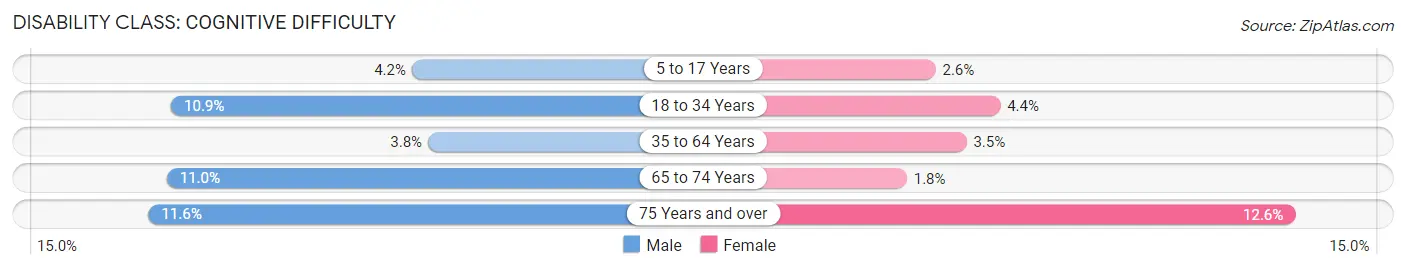
| Age Bracket | Male | Female |
| 5 to 17 Years | 20 (4.2%) | 11 (2.6%) |
| 18 to 34 Years | 56 (10.9%) | 21 (4.4%) |
| 35 to 64 Years | 47 (3.8%) | 44 (3.5%) |
| 65 to 74 Years | 49 (11.0%) | 8 (1.8%) |
| 75 Years and over | 38 (11.6%) | 51 (12.6%) |
Disability Class: Ambulatory Difficulty
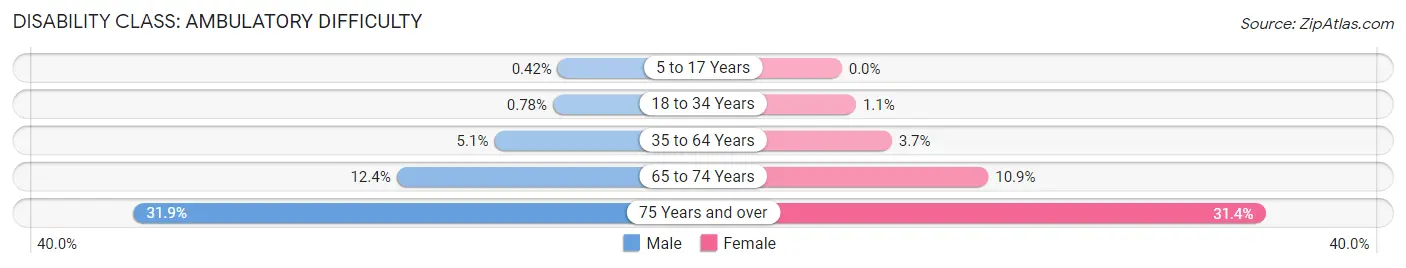
| Age Bracket | Male | Female |
| 5 to 17 Years | 2 (0.4%) | 0 (0.0%) |
| 18 to 34 Years | 4 (0.8%) | 5 (1.1%) |
| 35 to 64 Years | 64 (5.1%) | 47 (3.7%) |
| 65 to 74 Years | 55 (12.4%) | 48 (10.9%) |
| 75 Years and over | 105 (31.9%) | 127 (31.4%) |
Disability Class: Self-Care Difficulty
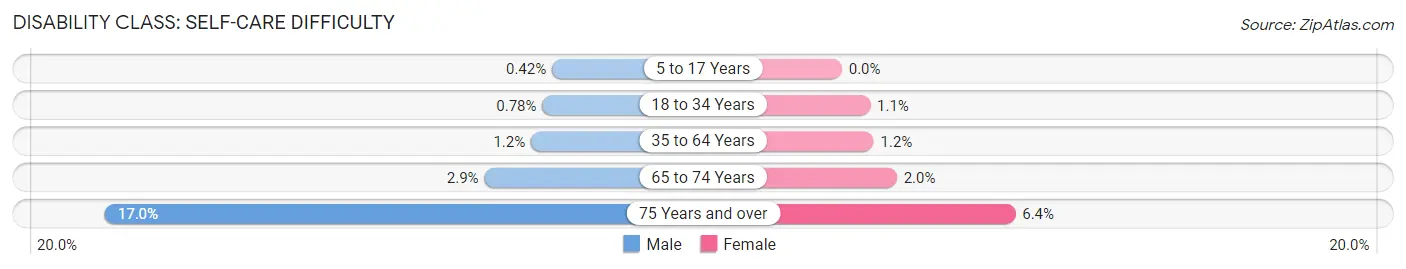
| Age Bracket | Male | Female |
| 5 to 17 Years | 2 (0.4%) | 0 (0.0%) |
| 18 to 34 Years | 4 (0.8%) | 5 (1.1%) |
| 35 to 64 Years | 15 (1.2%) | 15 (1.2%) |
| 65 to 74 Years | 13 (2.9%) | 9 (2.0%) |
| 75 Years and over | 56 (17.0%) | 26 (6.4%) |
Technology Access in Henderson County
Computing Device Access in Henderson County
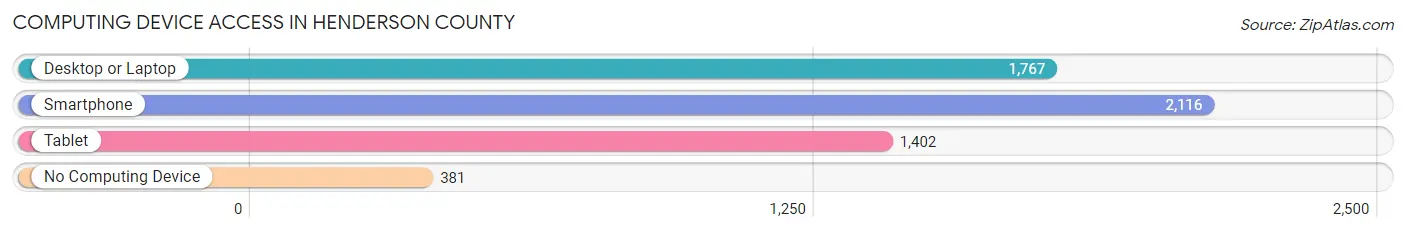
| Device Type | # Households | % Households |
| Desktop or Laptop | 1,767 | 64.4% |
| Smartphone | 2,116 | 77.1% |
| Tablet | 1,402 | 51.1% |
| No Computing Device | 381 | 13.9% |
| Total | 2,745 | 100.0% |
Internet Access in Henderson County
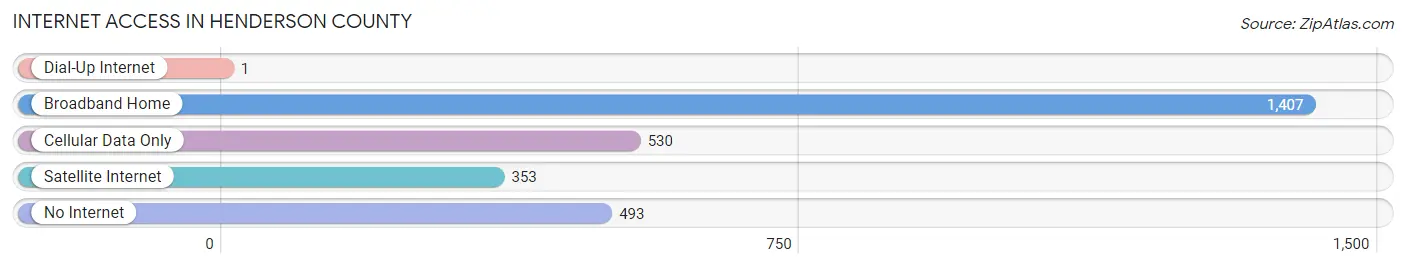
| Internet Type | # Households | % Households |
| Dial-Up Internet | 1 | 0.0% |
| Broadband Home | 1,407 | 51.3% |
| Cellular Data Only | 530 | 19.3% |
| Satellite Internet | 353 | 12.9% |
| No Internet | 493 | 18.0% |
| Total | 2,745 | 100.0% |
Henderson County Summary
Henderson County is located in the western part of the state of Illinois, in the United States. It is bordered by Warren County to the north, McDonough County to the east, Hancock County to the south, and Mercer County to the west. The county seat is Oquawka. The county was established in 1841 and named after Richard Henderson, a pioneer settler.
Geography
Henderson County covers an area of 576 square miles, making it the 33rd largest county in Illinois. The county is mostly flat, with some rolling hills in the northern and western parts. The highest point in the county is located in the northwest corner, at an elevation of 830 feet. The county is drained by the Mississippi River, which forms its western border. Other major waterways include the Henderson River, the Little Wabash River, and the Big Muddy River.
The county is mostly rural, with a few small towns and villages. The largest town is Oquawka, with a population of 1,845 in 2010. Other towns include Stronghurst, Lomax, and Raritan.
Climate
Henderson County has a humid continental climate, with hot, humid summers and cold, dry winters. The average annual temperature is 54°F, and the average annual precipitation is 37 inches.
Demographics
As of the 2010 census, Henderson County had a population of 7,331. The racial makeup of the county was 97.2% White, 0.7% African American, 0.3% Native American, 0.2% Asian, 0.1% Pacific Islander, 0.5% from other races, and 0.9% from two or more races. Hispanic or Latino of any race were 1.7% of the population.
The median income for a household in the county was $41,945, and the median income for a family was $50,945. The per capita income for the county was $20,945. About 11.2% of families and 14.2% of the population were below the poverty line, including 19.2% of those under age 18 and 8.2% of those age 65 or over.
Economy
Henderson County is primarily an agricultural county, with corn, soybeans, and wheat being the main crops. Livestock production is also important, with cattle, hogs, and sheep being raised. The county also has some manufacturing, with the largest employer being a plastics factory in Oquawka.
The county is served by two railroads, the Burlington Northern Santa Fe and the Union Pacific. The county also has two airports, the Oquawka Municipal Airport and the Stronghurst Municipal Airport.
History
Henderson County was first settled in the early 19th century by pioneers from the East Coast. The county was officially established in 1841 and named after Richard Henderson, a pioneer settler.
The county was largely agricultural throughout the 19th century, with corn, wheat, and livestock being the main crops. The county also had some manufacturing, with the first factory being established in Oquawka in 1854.
In the early 20th century, the county saw an influx of immigrants from Europe, particularly from Germany and Scandinavia. This led to the establishment of several small towns, such as Stronghurst and Raritan.
The county continued to be largely agricultural throughout the 20th century, with some manufacturing and tourism. The county also saw an influx of retirees in the late 20th century, as people moved to the area for its rural lifestyle and low cost of living.
Common Questions
What is Per Capita Income in Henderson County?
Per Capita income in Henderson County is $34,734.
What is the Median Family Income in Henderson County?
Median Family Income in Henderson County is $80,662.
What is the Median Household income in Henderson County?
Median Household Income in Henderson County is $64,946.
What is Income or Wage Gap in Henderson County?
Income or Wage Gap in Henderson County is 24.8%.
Women in Henderson County earn 75.2 cents for every dollar earned by a man.
What is Inequality or Gini Index in Henderson County?
Inequality or Gini Index in Henderson County is 0.39.
What is the Total Population of Henderson County?
Total Population of Henderson County is 6,374.
What is the Total Male Population of Henderson County?
Total Male Population of Henderson County is 3,194.
What is the Total Female Population of Henderson County?
Total Female Population of Henderson County is 3,180.
What is the Ratio of Males per 100 Females in Henderson County?
There are 100.44 Males per 100 Females in Henderson County.
What is the Ratio of Females per 100 Males in Henderson County?
There are 99.56 Females per 100 Males in Henderson County.
What is the Median Population Age in Henderson County?
Median Population Age in Henderson County is 49.6 Years.
What is the Average Family Size in Henderson County
Average Family Size in Henderson County is 2.8 People.
What is the Average Household Size in Henderson County
Average Household Size in Henderson County is 2.3 People.
How Large is the Labor Force in Henderson County?
There are 3,192 People in the Labor Forcein in Henderson County.
What is the Percentage of People in the Labor Force in Henderson County?
60.5% of People are in the Labor Force in Henderson County.
What is the Unemployment Rate in Henderson County?
Unemployment Rate in Henderson County is 7.9%.