Greene County, IL Map & Demographics
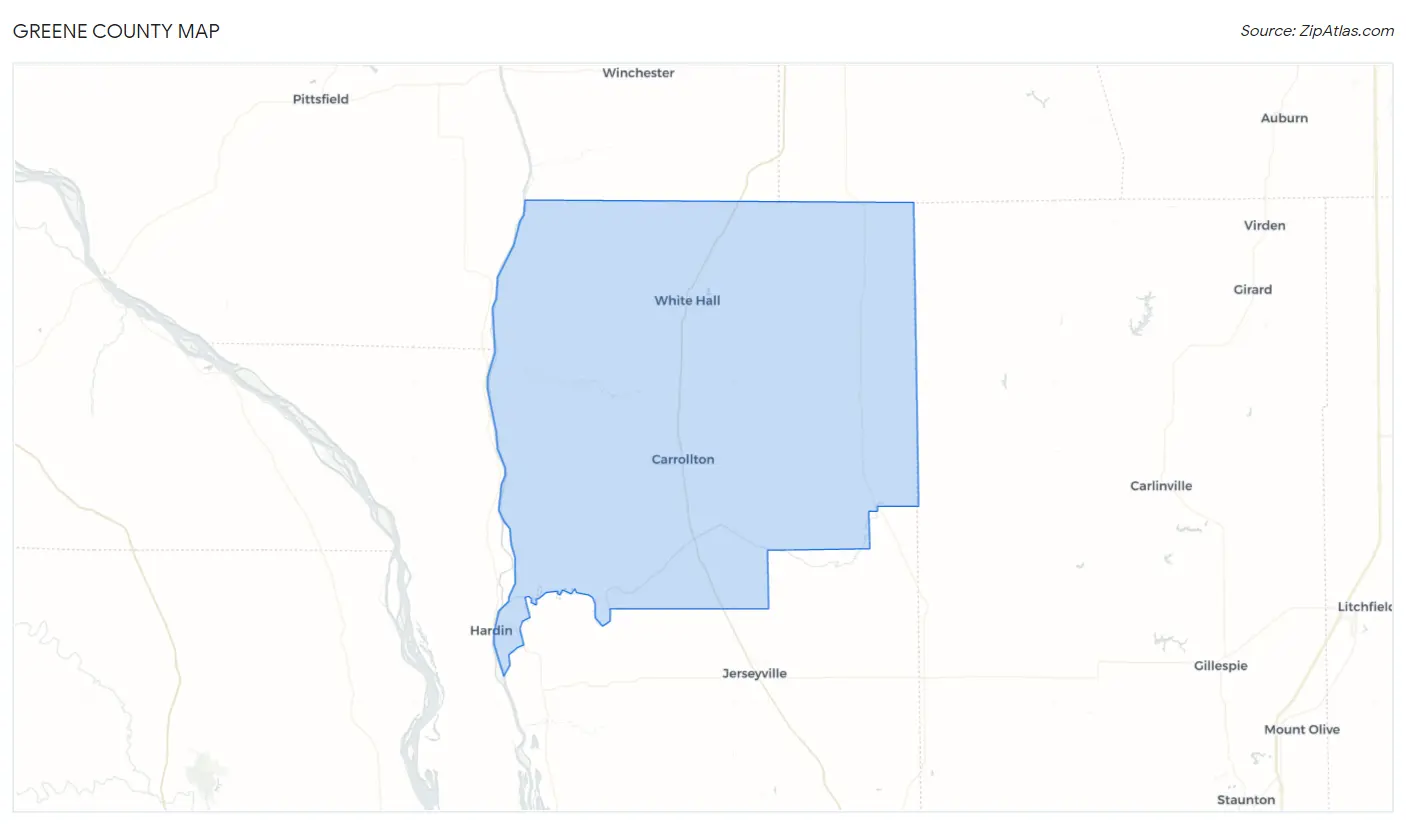
Greene County Map
Greene County Overview
$31,536
PER CAPITA INCOME
$71,354
AVG FAMILY INCOME
$58,900
AVG HOUSEHOLD INCOME
47.7%
WAGE / INCOME GAP [ % ]
52.3¢/ $1
WAGE / INCOME GAP [ $ ]
$10,947
FAMILY INCOME DEFICIT
0.44
INEQUALITY / GINI INDEX
12,015
TOTAL POPULATION
6,050
MALE POPULATION
5,965
FEMALE POPULATION
101.42
MALES / 100 FEMALES
98.60
FEMALES / 100 MALES
42.7
MEDIAN AGE
3.2
AVG FAMILY SIZE
2.6
AVG HOUSEHOLD SIZE
5,746
LABOR FORCE [ PEOPLE ]
58.7%
PERCENT IN LABOR FORCE
3.4%
UNEMPLOYMENT RATE
Income in Greene County
Income Overview in Greene County
Per Capita Income in Greene County is $31,536, while median incomes of families and households are $71,354 and $58,900 respectively.
| Characteristic | Number | Measure |
| Per Capita Income | 12,015 | $31,536 |
| Median Family Income | 2,952 | $71,354 |
| Mean Family Income | 2,952 | $90,396 |
| Median Household Income | 4,543 | $58,900 |
| Mean Household Income | 4,543 | $77,641 |
| Income Deficit | 2,952 | $10,947 |
| Wage / Income Gap (%) | 12,015 | 47.68% |
| Wage / Income Gap ($) | 12,015 | 52.32¢ per $1 |
| Gini / Inequality Index | 12,015 | 0.44 |
Earnings by Sex in Greene County
Average Earnings in Greene County are $32,485, $46,042 for men and $24,089 for women, a difference of 47.7%.
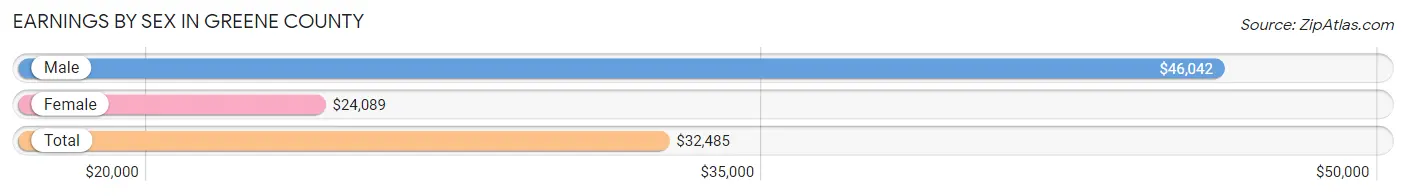
| Sex | Number | Average Earnings |
| Male | 3,057 (50.8%) | $46,042 |
| Female | 2,960 (49.2%) | $24,089 |
| Total | 6,017 (100.0%) | $32,485 |
Earnings by Sex by Income Bracket in Greene County
The most common earnings brackets in Greene County are $55,000 to $64,999 for men (418 | 13.7%) and $20,000 to $22,499 for women (282 | 9.5%).
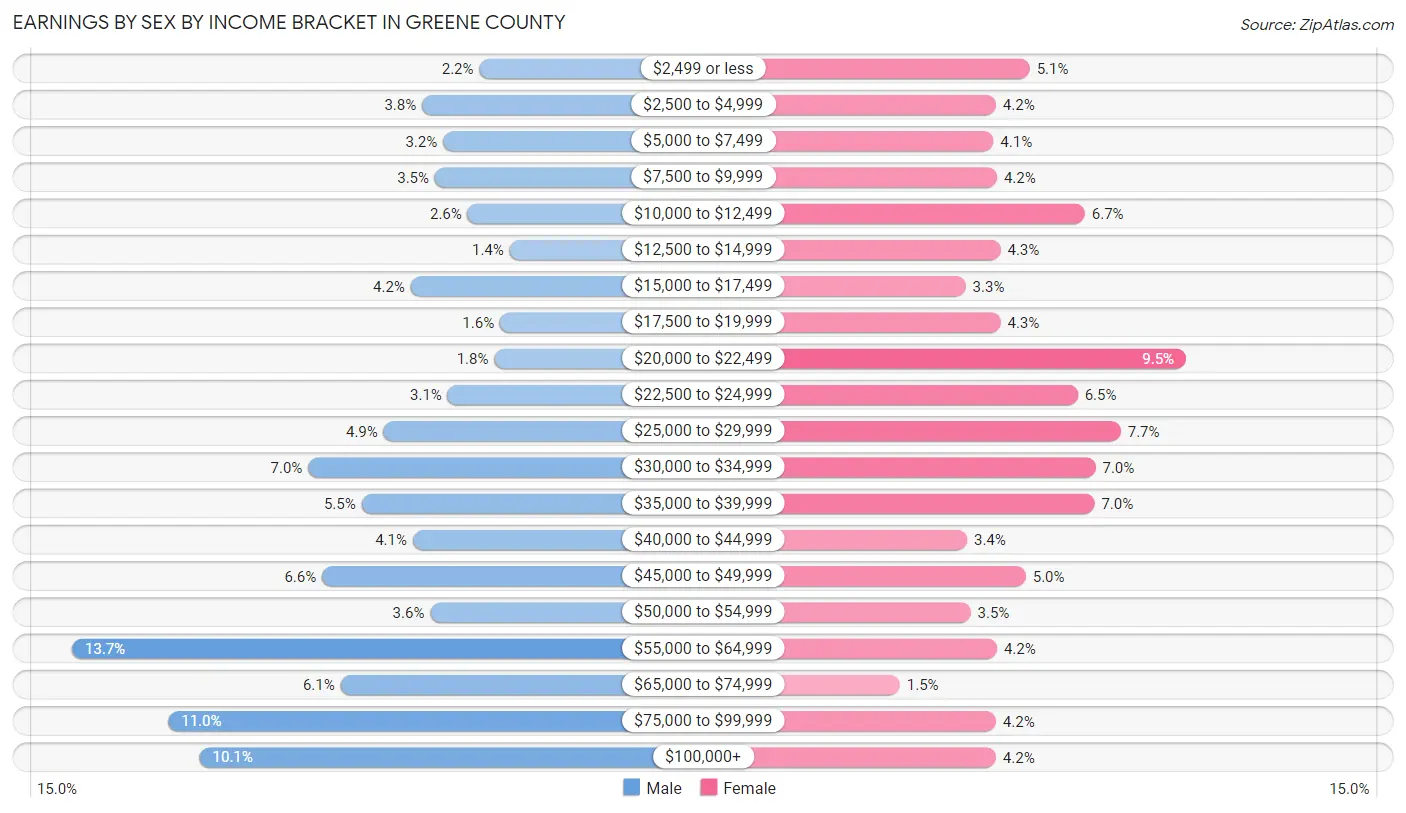
| Income | Male | Female |
| $2,499 or less | 68 (2.2%) | 152 (5.1%) |
| $2,500 to $4,999 | 117 (3.8%) | 124 (4.2%) |
| $5,000 to $7,499 | 99 (3.2%) | 122 (4.1%) |
| $7,500 to $9,999 | 106 (3.5%) | 125 (4.2%) |
| $10,000 to $12,499 | 78 (2.5%) | 198 (6.7%) |
| $12,500 to $14,999 | 42 (1.4%) | 128 (4.3%) |
| $15,000 to $17,499 | 127 (4.2%) | 99 (3.3%) |
| $17,500 to $19,999 | 50 (1.6%) | 128 (4.3%) |
| $20,000 to $22,499 | 55 (1.8%) | 282 (9.5%) |
| $22,500 to $24,999 | 95 (3.1%) | 192 (6.5%) |
| $25,000 to $29,999 | 150 (4.9%) | 228 (7.7%) |
| $30,000 to $34,999 | 215 (7.0%) | 207 (7.0%) |
| $35,000 to $39,999 | 169 (5.5%) | 206 (7.0%) |
| $40,000 to $44,999 | 125 (4.1%) | 100 (3.4%) |
| $45,000 to $49,999 | 203 (6.6%) | 149 (5.0%) |
| $50,000 to $54,999 | 110 (3.6%) | 103 (3.5%) |
| $55,000 to $64,999 | 418 (13.7%) | 125 (4.2%) |
| $65,000 to $74,999 | 187 (6.1%) | 44 (1.5%) |
| $75,000 to $99,999 | 335 (11.0%) | 124 (4.2%) |
| $100,000+ | 308 (10.1%) | 124 (4.2%) |
| Total | 3,057 (100.0%) | 2,960 (100.0%) |
Earnings by Sex by Educational Attainment in Greene County
Average earnings in Greene County are $51,582 for men and $27,831 for women, a difference of 46.1%. Men with an educational attainment of graduate degree enjoy the highest average annual earnings of $125,521, while those with less than high school education earn the least with $43,000. Women with an educational attainment of bachelor's degree earn the most with the average annual earnings of $46,891, while those with high school diploma education have the smallest earnings of $21,941.
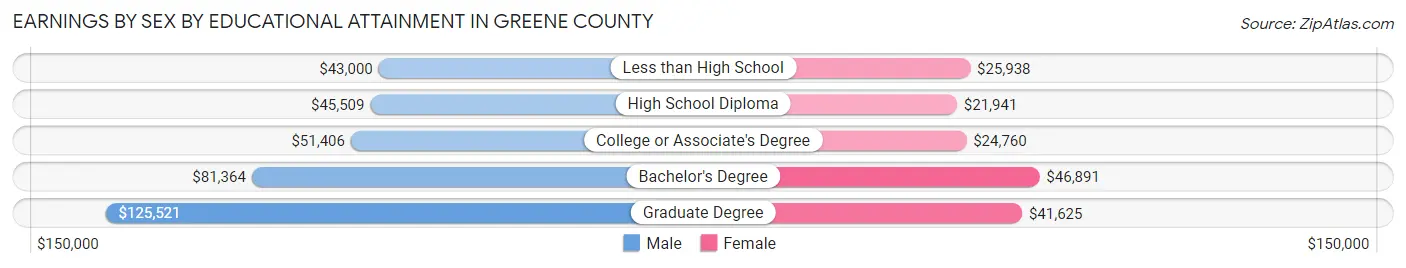
| Educational Attainment | Male Income | Female Income |
| Less than High School | $43,000 | $25,938 |
| High School Diploma | $45,509 | $21,941 |
| College or Associate's Degree | $51,406 | $24,760 |
| Bachelor's Degree | $81,364 | $46,891 |
| Graduate Degree | $125,521 | $41,625 |
| Total | $51,582 | $27,831 |
Family Income in Greene County
Family Income Brackets in Greene County
According to the Greene County family income data, there are 694 families falling into the $50,000 to $74,999 income range, which is the most common income bracket and makes up 23.5% of all families. Conversely, the $10,000 to $14,999 income bracket is the least frequent group with only 74 families (2.5%) belonging to this category.
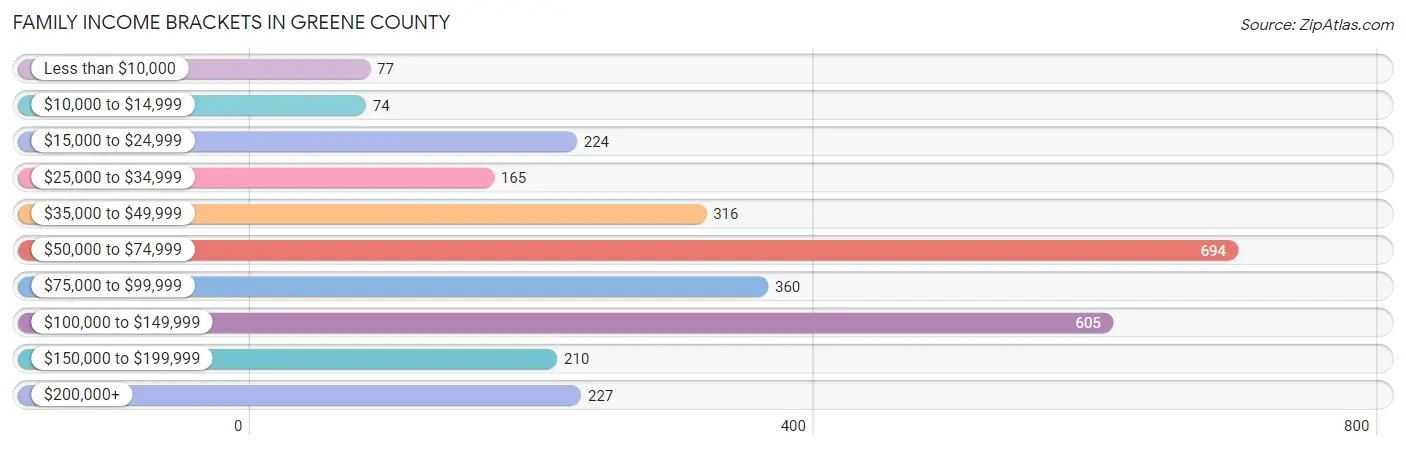
| Income Bracket | # Families | % Families |
| Less than $10,000 | 77 | 2.6% |
| $10,000 to $14,999 | 74 | 2.5% |
| $15,000 to $24,999 | 224 | 7.6% |
| $25,000 to $34,999 | 165 | 5.6% |
| $35,000 to $49,999 | 316 | 10.7% |
| $50,000 to $74,999 | 694 | 23.5% |
| $75,000 to $99,999 | 360 | 12.2% |
| $100,000 to $149,999 | 605 | 20.5% |
| $150,000 to $199,999 | 210 | 7.1% |
| $200,000+ | 227 | 7.7% |
Family Income by Famaliy Size in Greene County
6-person families (40 | 1.4%) account for the highest median family income in Greene County with $120,000 per family, while 2-person families (1,714 | 58.1%) have the highest median income of $33,472 per family member.
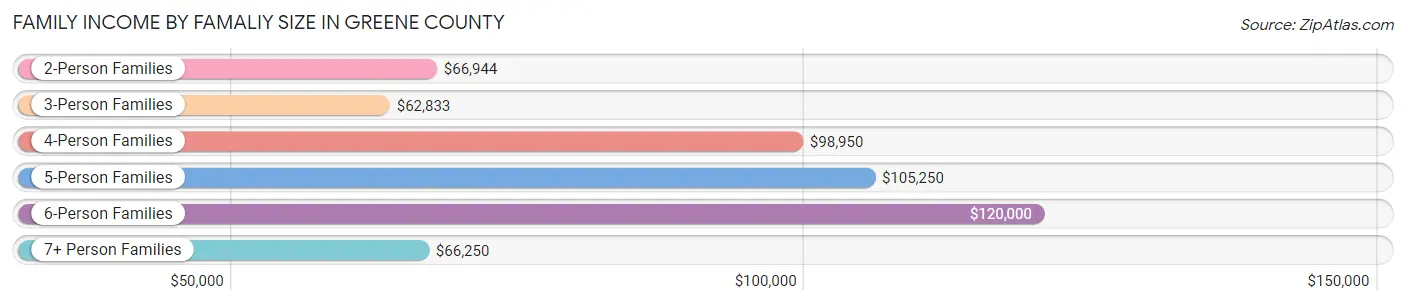
| Income Bracket | # Families | Median Income |
| 2-Person Families | 1,714 (58.1%) | $66,944 |
| 3-Person Families | 590 (20.0%) | $62,833 |
| 4-Person Families | 433 (14.7%) | $98,950 |
| 5-Person Families | 155 (5.2%) | $105,250 |
| 6-Person Families | 40 (1.4%) | $120,000 |
| 7+ Person Families | 20 (0.7%) | $66,250 |
| Total | 2,952 (100.0%) | $71,354 |
Family Income by Number of Earners in Greene County
The median family income in Greene County is $71,354, with families comprising 3+ earners (307) having the highest median family income of $120,114, while families with no earners (480) have the lowest median family income of $47,105, accounting for 10.4% and 16.3% of families, respectively.
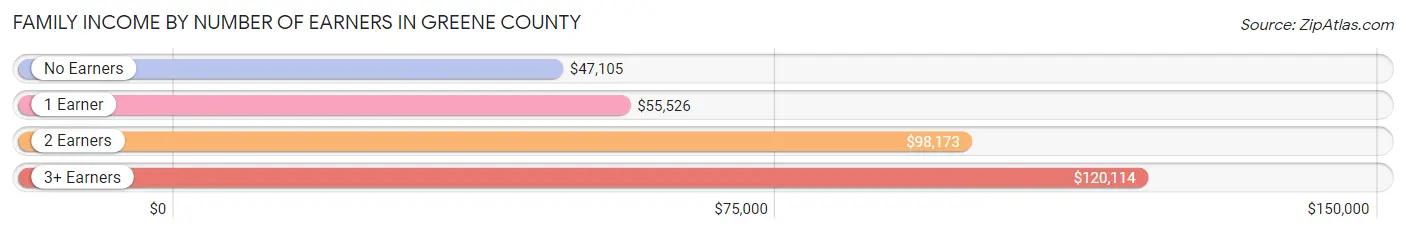
| Number of Earners | # Families | Median Income |
| No Earners | 480 (16.3%) | $47,105 |
| 1 Earner | 1,030 (34.9%) | $55,526 |
| 2 Earners | 1,135 (38.5%) | $98,173 |
| 3+ Earners | 307 (10.4%) | $120,114 |
| Total | 2,952 (100.0%) | $71,354 |
Household Income in Greene County
Household Income Brackets in Greene County
With 945 households falling in the category, the $50,000 to $74,999 income range is the most frequent in Greene County, accounting for 20.8% of all households. In contrast, only 177 households (3.9%) fall into the $10,000 to $14,999 income bracket, making it the least populous group.
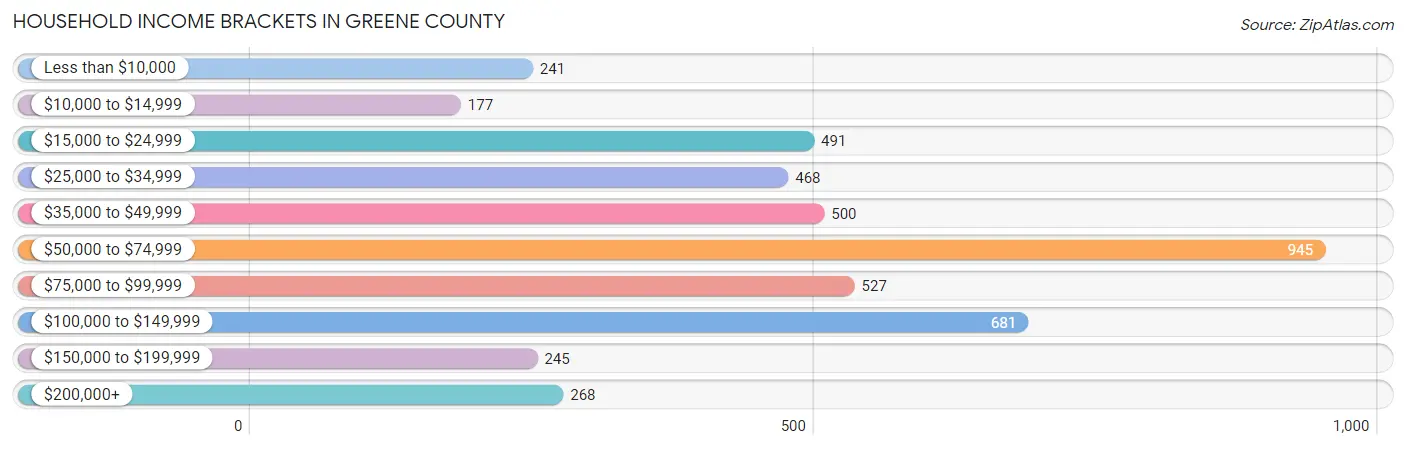
| Income Bracket | # Households | % Households |
| Less than $10,000 | 241 | 5.3% |
| $10,000 to $14,999 | 177 | 3.9% |
| $15,000 to $24,999 | 491 | 10.8% |
| $25,000 to $34,999 | 468 | 10.3% |
| $35,000 to $49,999 | 500 | 11.0% |
| $50,000 to $74,999 | 945 | 20.8% |
| $75,000 to $99,999 | 527 | 11.6% |
| $100,000 to $149,999 | 681 | 15.0% |
| $150,000 to $199,999 | 245 | 5.4% |
| $200,000+ | 268 | 5.9% |
Household Income by Householder Age in Greene County
The median household income in Greene County is $58,900, with the highest median household income of $68,854 found in the 45 to 64 years age bracket for the primary householder. A total of 1,765 households (38.9%) fall into this category. Meanwhile, the 65+ years age bracket for the primary householder has the lowest median household income of $46,422, with 1,525 households (33.6%) in this group.
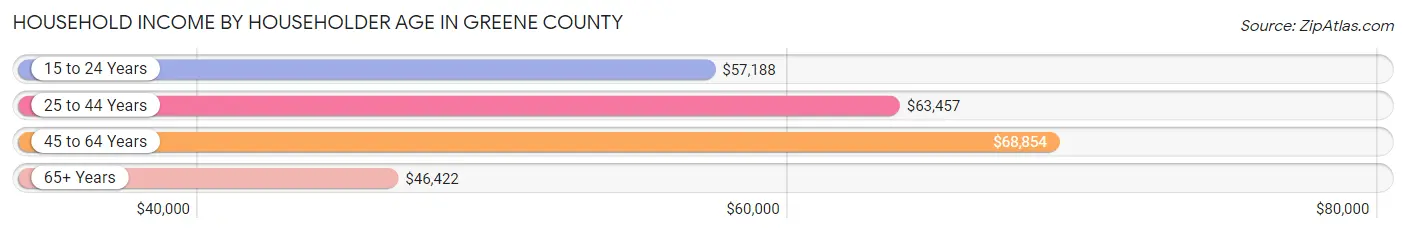
| Income Bracket | # Households | Median Income |
| 15 to 24 Years | 89 (2.0%) | $57,188 |
| 25 to 44 Years | 1,164 (25.6%) | $63,457 |
| 45 to 64 Years | 1,765 (38.9%) | $68,854 |
| 65+ Years | 1,525 (33.6%) | $46,422 |
| Total | 4,543 (100.0%) | $58,900 |
Poverty in Greene County
Income Below Poverty by Sex and Age in Greene County
With 13.8% poverty level for males and 13.6% for females among the residents of Greene County, 35 to 44 year old males and 12 to 14 year old females are the most vulnerable to poverty, with 179 males (25.4%) and 86 females (30.4%) in their respective age groups living below the poverty level.
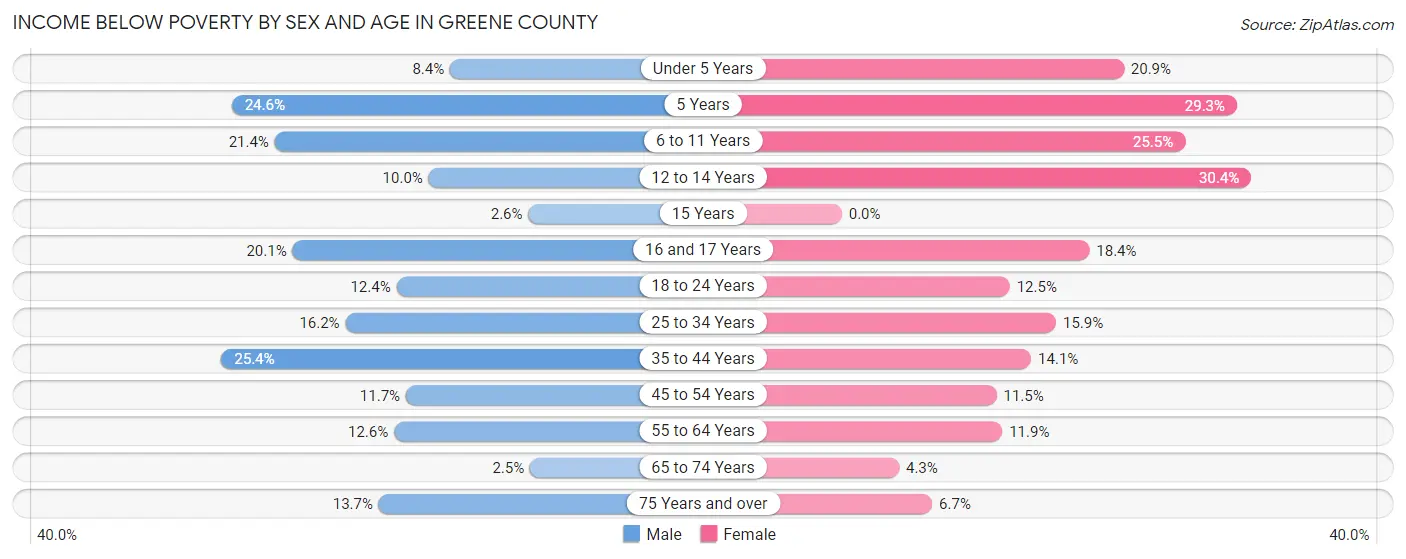
| Age Bracket | Male | Female |
| Under 5 Years | 26 (8.4%) | 58 (20.9%) |
| 5 Years | 16 (24.6%) | 22 (29.3%) |
| 6 to 11 Years | 81 (21.4%) | 93 (25.5%) |
| 12 to 14 Years | 28 (10.0%) | 86 (30.4%) |
| 15 Years | 2 (2.6%) | 0 (0.0%) |
| 16 and 17 Years | 35 (20.1%) | 34 (18.4%) |
| 18 to 24 Years | 56 (12.4%) | 54 (12.5%) |
| 25 to 34 Years | 106 (16.2%) | 98 (15.9%) |
| 35 to 44 Years | 179 (25.4%) | 90 (14.1%) |
| 45 to 54 Years | 88 (11.7%) | 88 (11.5%) |
| 55 to 64 Years | 118 (12.6%) | 108 (11.9%) |
| 65 to 74 Years | 16 (2.5%) | 29 (4.3%) |
| 75 Years and over | 57 (13.7%) | 38 (6.7%) |
| Total | 808 (13.8%) | 798 (13.6%) |
Income Above Poverty by Sex and Age in Greene County
According to the poverty statistics in Greene County, males aged 65 to 74 years and females aged 15 years are the age groups that are most secure financially, with 97.5% of males and 100.0% of females in these age groups living above the poverty line.
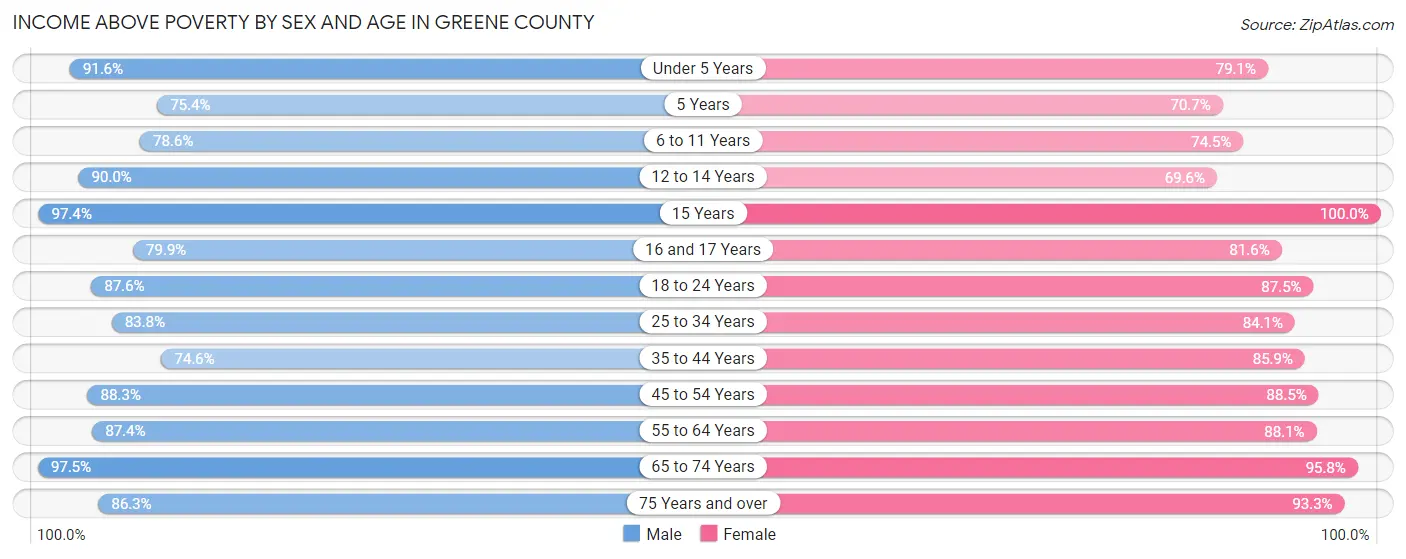
| Age Bracket | Male | Female |
| Under 5 Years | 283 (91.6%) | 219 (79.1%) |
| 5 Years | 49 (75.4%) | 53 (70.7%) |
| 6 to 11 Years | 297 (78.6%) | 272 (74.5%) |
| 12 to 14 Years | 252 (90.0%) | 197 (69.6%) |
| 15 Years | 75 (97.4%) | 63 (100.0%) |
| 16 and 17 Years | 139 (79.9%) | 151 (81.6%) |
| 18 to 24 Years | 396 (87.6%) | 379 (87.5%) |
| 25 to 34 Years | 549 (83.8%) | 518 (84.1%) |
| 35 to 44 Years | 526 (74.6%) | 550 (85.9%) |
| 45 to 54 Years | 665 (88.3%) | 678 (88.5%) |
| 55 to 64 Years | 821 (87.4%) | 799 (88.1%) |
| 65 to 74 Years | 633 (97.5%) | 653 (95.8%) |
| 75 Years and over | 359 (86.3%) | 528 (93.3%) |
| Total | 5,044 (86.2%) | 5,060 (86.4%) |
Income Below Poverty Among Married-Couple Families in Greene County
The poverty statistics for married-couple families in Greene County show that 4.6% or 101 of the total 2,200 families live below the poverty line. Families with 3 or 4 children have the highest poverty rate of 11.0%, comprising of 18 families. On the other hand, families with 5 or more children have the lowest poverty rate of 0.0%, which includes 0 families.
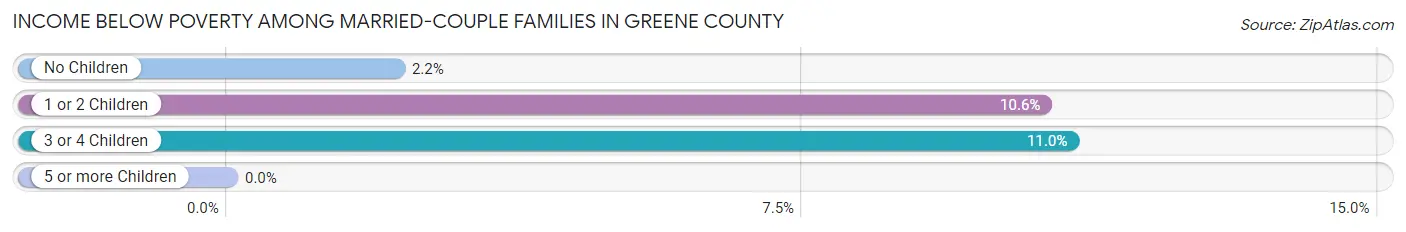
| Children | Above Poverty | Below Poverty |
| No Children | 1,528 (97.8%) | 34 (2.2%) |
| 1 or 2 Children | 412 (89.4%) | 49 (10.6%) |
| 3 or 4 Children | 146 (89.0%) | 18 (11.0%) |
| 5 or more Children | 13 (100.0%) | 0 (0.0%) |
| Total | 2,099 (95.4%) | 101 (4.6%) |
Income Below Poverty Among Single-Parent Households in Greene County
According to the poverty data in Greene County, 25.1% or 63 single-father households and 23.7% or 119 single-mother households are living below the poverty line. Among single-father households, those with 3 or 4 children have the highest poverty rate, with 15 households (83.3%) experiencing poverty. Likewise, among single-mother households, those with 3 or 4 children have the highest poverty rate, with 11 households (55.0%) falling below the poverty line.
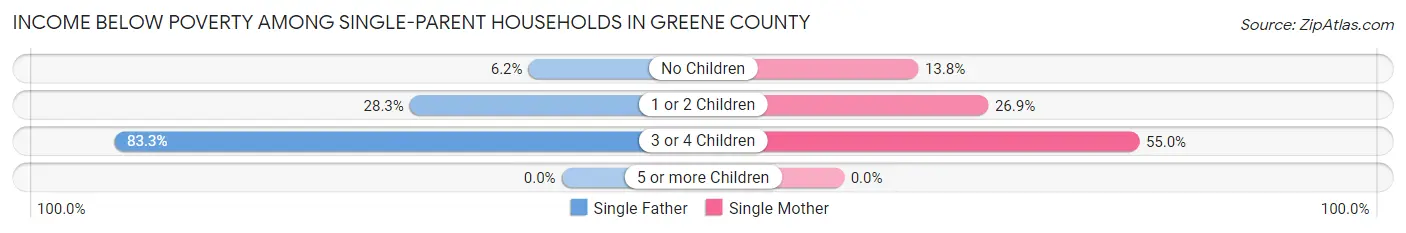
| Children | Single Father | Single Mother |
| No Children | 5 (6.2%) | 22 (13.8%) |
| 1 or 2 Children | 43 (28.3%) | 86 (26.9%) |
| 3 or 4 Children | 15 (83.3%) | 11 (55.0%) |
| 5 or more Children | 0 (0.0%) | 0 (0.0%) |
| Total | 63 (25.1%) | 119 (23.7%) |
Income Below Poverty Among Married-Couple vs Single-Parent Households in Greene County
The poverty data for Greene County shows that 101 of the married-couple family households (4.6%) and 182 of the single-parent households (24.2%) are living below the poverty level. Within the married-couple family households, those with 3 or 4 children have the highest poverty rate, with 18 households (11.0%) falling below the poverty line. Among the single-parent households, those with 3 or 4 children have the highest poverty rate, with 26 household (68.4%) living below poverty.
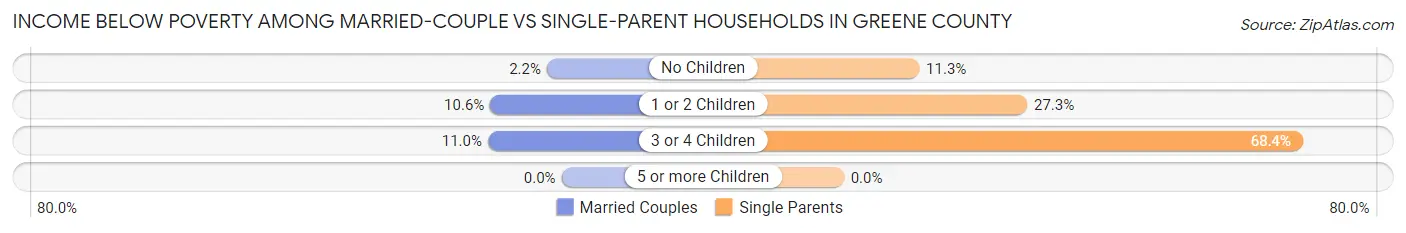
| Children | Married-Couple Families | Single-Parent Households |
| No Children | 34 (2.2%) | 27 (11.3%) |
| 1 or 2 Children | 49 (10.6%) | 129 (27.3%) |
| 3 or 4 Children | 18 (11.0%) | 26 (68.4%) |
| 5 or more Children | 0 (0.0%) | 0 (0.0%) |
| Total | 101 (4.6%) | 182 (24.2%) |
Race in Greene County
The most populous races in Greene County are White / Caucasian (11,619 | 96.7%), Two or more Races (201 | 1.7%), and Hispanic or Latino (158 | 1.3%).
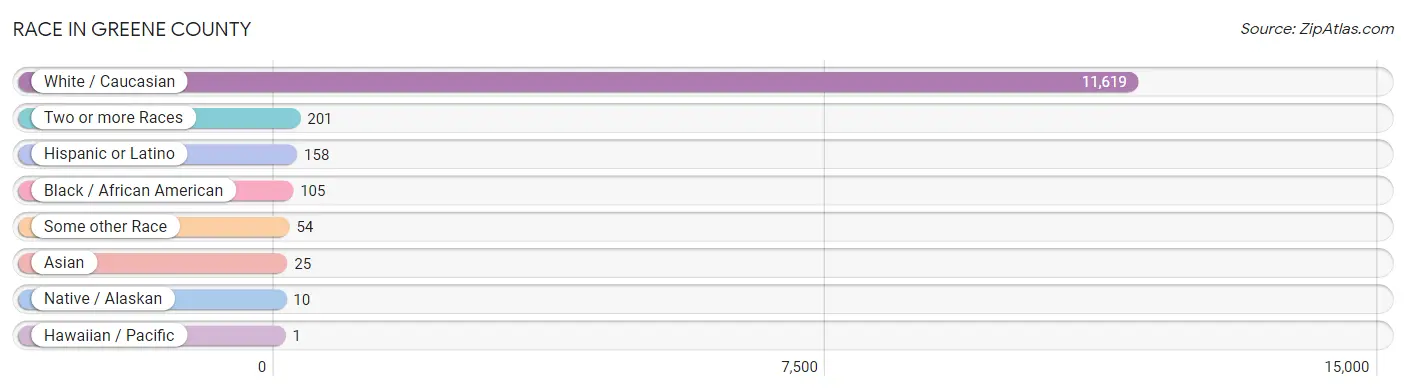
| Race | # Population | % Population |
| Asian | 25 | 0.2% |
| Black / African American | 105 | 0.9% |
| Hawaiian / Pacific | 1 | 0.0% |
| Hispanic or Latino | 158 | 1.3% |
| Native / Alaskan | 10 | 0.1% |
| White / Caucasian | 11,619 | 96.7% |
| Two or more Races | 201 | 1.7% |
| Some other Race | 54 | 0.4% |
| Total | 12,015 | 100.0% |
Ancestry in Greene County
The most populous ancestries reported in Greene County are German (3,699 | 30.8%), Irish (1,339 | 11.1%), English (1,221 | 10.2%), American (1,046 | 8.7%), and Scottish (246 | 2.1%), together accounting for 62.8% of all Greene County residents.
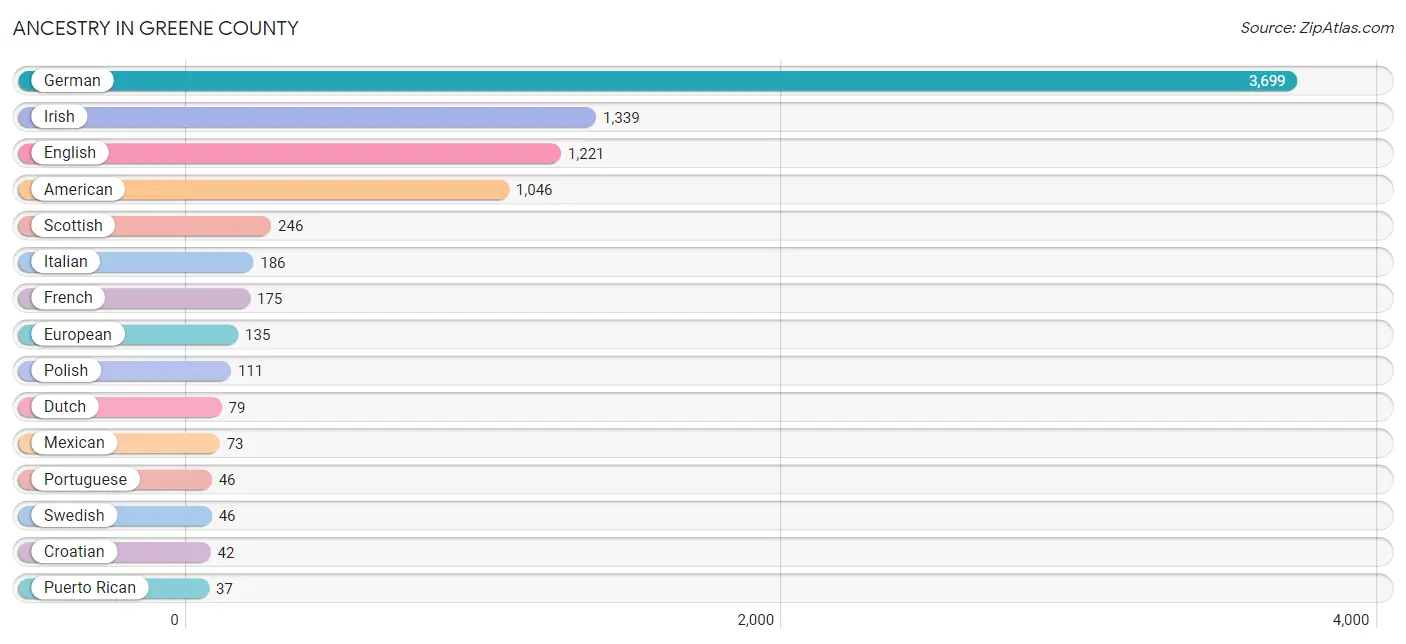
| Ancestry | # Population | % Population |
| American | 1,046 | 8.7% |
| Armenian | 15 | 0.1% |
| Austrian | 15 | 0.1% |
| Belgian | 2 | 0.0% |
| Blackfeet | 2 | 0.0% |
| Bolivian | 1 | 0.0% |
| British | 19 | 0.2% |
| Bulgarian | 3 | 0.0% |
| Central American | 1 | 0.0% |
| Cherokee | 31 | 0.3% |
| Cheyenne | 2 | 0.0% |
| Chilean | 1 | 0.0% |
| Croatian | 42 | 0.4% |
| Danish | 19 | 0.2% |
| Dominican | 33 | 0.3% |
| Dutch | 79 | 0.7% |
| Eastern European | 7 | 0.1% |
| English | 1,221 | 10.2% |
| European | 135 | 1.1% |
| French | 175 | 1.5% |
| French Canadian | 3 | 0.0% |
| German | 3,699 | 30.8% |
| German Russian | 1 | 0.0% |
| Greek | 27 | 0.2% |
| Hungarian | 5 | 0.0% |
| Indian (Asian) | 1 | 0.0% |
| Irish | 1,339 | 11.1% |
| Italian | 186 | 1.5% |
| Lithuanian | 11 | 0.1% |
| Mexican | 73 | 0.6% |
| Native Hawaiian | 4 | 0.0% |
| Norwegian | 16 | 0.1% |
| Pakistani | 21 | 0.2% |
| Polish | 111 | 0.9% |
| Portuguese | 46 | 0.4% |
| Puerto Rican | 37 | 0.3% |
| Russian | 24 | 0.2% |
| Salvadoran | 1 | 0.0% |
| Scandinavian | 2 | 0.0% |
| Scotch-Irish | 36 | 0.3% |
| Scottish | 246 | 2.1% |
| Serbian | 2 | 0.0% |
| Slavic | 2 | 0.0% |
| South American | 2 | 0.0% |
| Spaniard | 1 | 0.0% |
| Swedish | 46 | 0.4% |
| Swiss | 7 | 0.1% |
| Thai | 2 | 0.0% |
| Welsh | 25 | 0.2% | View All 49 Rows |
Immigrants in Greene County
The most numerous immigrant groups reported in Greene County came from Europe (26 | 0.2%), Germany (14 | 0.1%), Western Europe (14 | 0.1%), Eastern Europe (11 | 0.1%), and Asia (10 | 0.1%), together accounting for 0.6% of all Greene County residents.
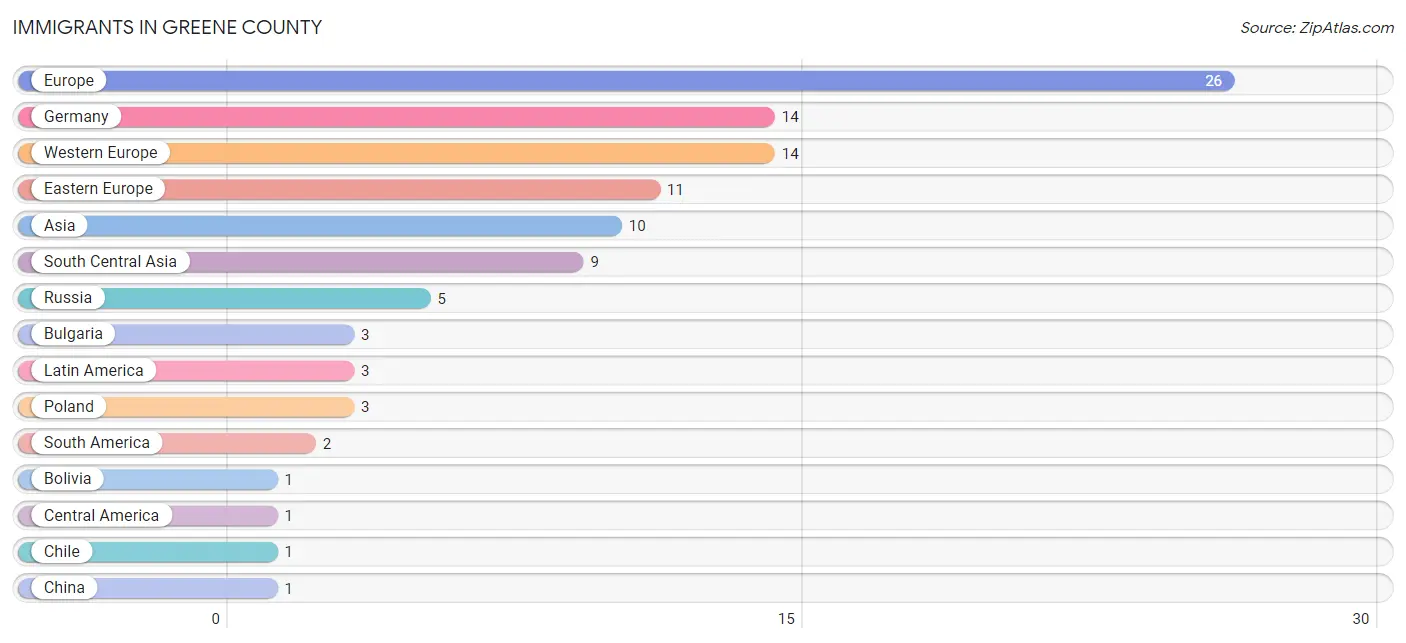
| Immigration Origin | # Population | % Population |
| Asia | 10 | 0.1% |
| Bolivia | 1 | 0.0% |
| Bulgaria | 3 | 0.0% |
| Central America | 1 | 0.0% |
| Chile | 1 | 0.0% |
| China | 1 | 0.0% |
| Eastern Asia | 1 | 0.0% |
| Eastern Europe | 11 | 0.1% |
| Europe | 26 | 0.2% |
| Germany | 14 | 0.1% |
| Italy | 1 | 0.0% |
| Latin America | 3 | 0.0% |
| Mexico | 1 | 0.0% |
| Poland | 3 | 0.0% |
| Russia | 5 | 0.0% |
| South America | 2 | 0.0% |
| South Central Asia | 9 | 0.1% |
| Southern Europe | 1 | 0.0% |
| Western Europe | 14 | 0.1% | View All 19 Rows |
Sex and Age in Greene County
Sex and Age in Greene County
The most populous age groups in Greene County are 60 to 64 Years (516 | 8.5%) for men and 60 to 64 Years (496 | 8.3%) for women.
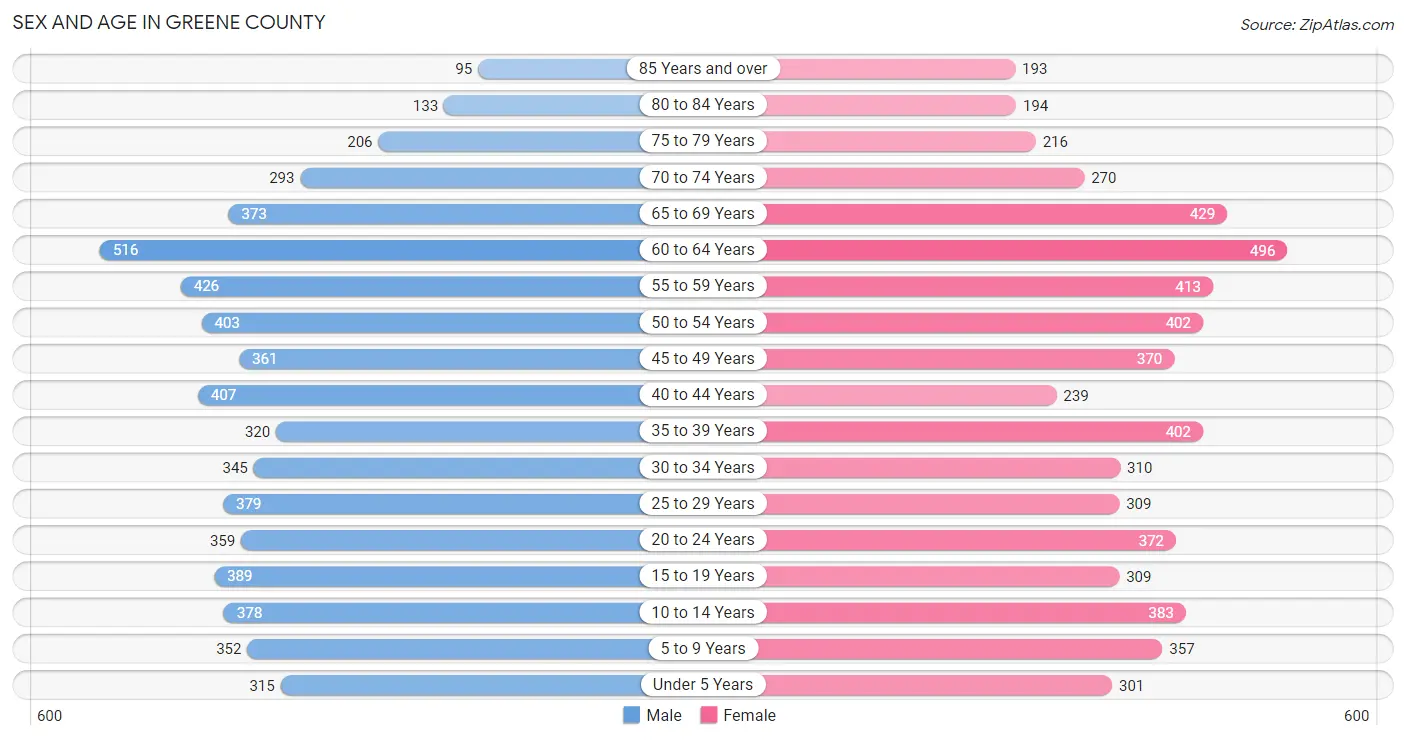
| Age Bracket | Male | Female |
| Under 5 Years | 315 (5.2%) | 301 (5.1%) |
| 5 to 9 Years | 352 (5.8%) | 357 (6.0%) |
| 10 to 14 Years | 378 (6.2%) | 383 (6.4%) |
| 15 to 19 Years | 389 (6.4%) | 309 (5.2%) |
| 20 to 24 Years | 359 (5.9%) | 372 (6.2%) |
| 25 to 29 Years | 379 (6.3%) | 309 (5.2%) |
| 30 to 34 Years | 345 (5.7%) | 310 (5.2%) |
| 35 to 39 Years | 320 (5.3%) | 402 (6.7%) |
| 40 to 44 Years | 407 (6.7%) | 239 (4.0%) |
| 45 to 49 Years | 361 (6.0%) | 370 (6.2%) |
| 50 to 54 Years | 403 (6.7%) | 402 (6.7%) |
| 55 to 59 Years | 426 (7.0%) | 413 (6.9%) |
| 60 to 64 Years | 516 (8.5%) | 496 (8.3%) |
| 65 to 69 Years | 373 (6.2%) | 429 (7.2%) |
| 70 to 74 Years | 293 (4.8%) | 270 (4.5%) |
| 75 to 79 Years | 206 (3.4%) | 216 (3.6%) |
| 80 to 84 Years | 133 (2.2%) | 194 (3.3%) |
| 85 Years and over | 95 (1.6%) | 193 (3.2%) |
| Total | 6,050 (100.0%) | 5,965 (100.0%) |
Families and Households in Greene County
Median Family Size in Greene County
The median family size in Greene County is 3.20 persons per family, with single female/mother families (501 | 17.0%) accounting for the largest median family size of 3.65 persons per family. On the other hand, married-couple families (2,200 | 74.5%) represent the smallest median family size with 3.09 persons per family.
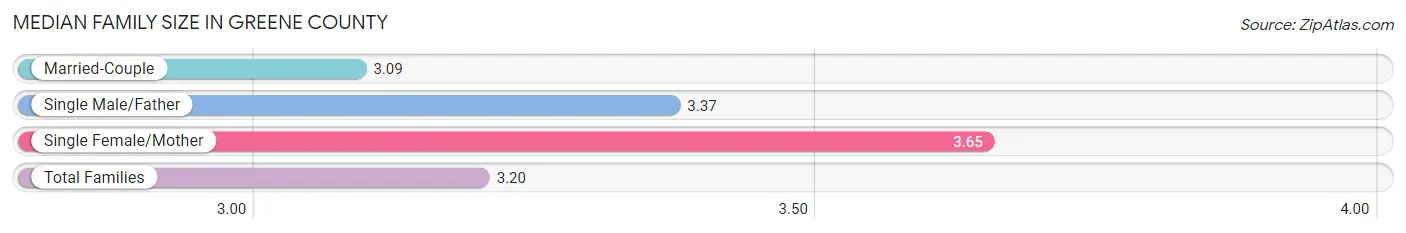
| Family Type | # Families | Family Size |
| Married-Couple | 2,200 (74.5%) | 3.09 |
| Single Male/Father | 251 (8.5%) | 3.37 |
| Single Female/Mother | 501 (17.0%) | 3.65 |
| Total Families | 2,952 (100.0%) | 3.20 |
Median Household Size in Greene County
The median household size in Greene County is 2.59 persons per household, with single male/father households (251 | 5.5%) accounting for the largest median household size of 4.04 persons per household. non-family households (1,591 | 35.0%) represent the smallest median household size with 1.15 persons per household.
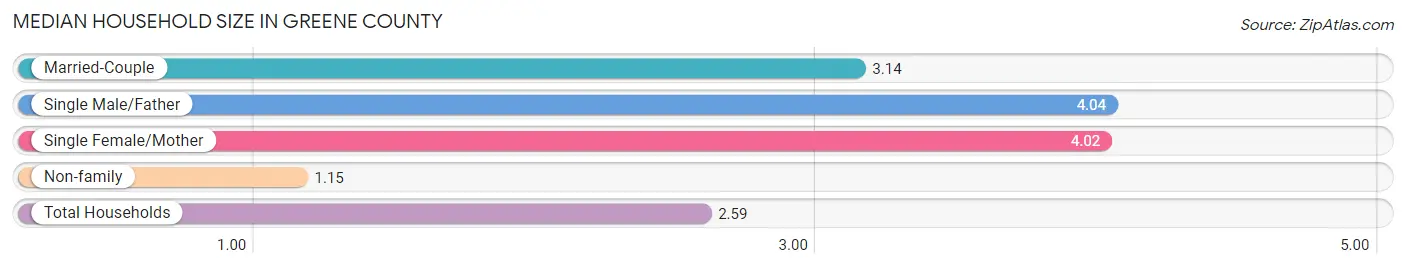
| Household Type | # Households | Household Size |
| Married-Couple | 2,200 (48.4%) | 3.14 |
| Single Male/Father | 251 (5.5%) | 4.04 |
| Single Female/Mother | 501 (11.0%) | 4.02 |
| Non-family | 1,591 (35.0%) | 1.15 |
| Total Households | 4,543 (100.0%) | 2.59 |
Household Size by Marriage Status in Greene County
Out of a total of 4,543 households in Greene County, 2,952 (65.0%) are family households, while 1,591 (35.0%) are nonfamily households. The most numerous type of family households are 2-person households, comprising 1,564, and the most common type of nonfamily households are 1-person households, comprising 1,392.
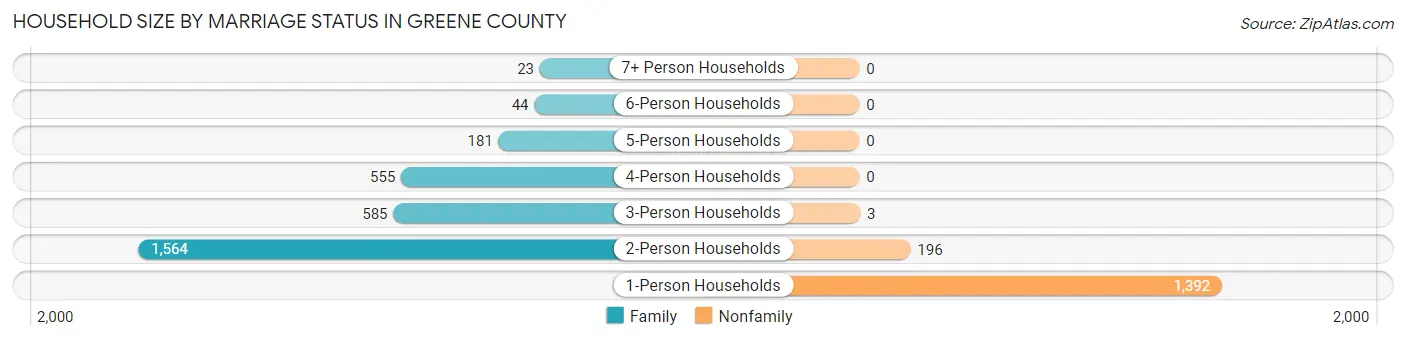
| Household Size | Family Households | Nonfamily Households |
| 1-Person Households | - | 1,392 (30.6%) |
| 2-Person Households | 1,564 (34.4%) | 196 (4.3%) |
| 3-Person Households | 585 (12.9%) | 3 (0.1%) |
| 4-Person Households | 555 (12.2%) | 0 (0.0%) |
| 5-Person Households | 181 (4.0%) | 0 (0.0%) |
| 6-Person Households | 44 (1.0%) | 0 (0.0%) |
| 7+ Person Households | 23 (0.5%) | 0 (0.0%) |
| Total | 2,952 (65.0%) | 1,591 (35.0%) |
Female Fertility in Greene County
Fertility by Age in Greene County
Average fertility rate in Greene County is 35.0 births per 1,000 women. Women in the age bracket of 20 to 34 years have the highest fertility rate with 76.0 births per 1,000 women. Women in the age bracket of 20 to 34 years acount for 90.4% of all women with births.
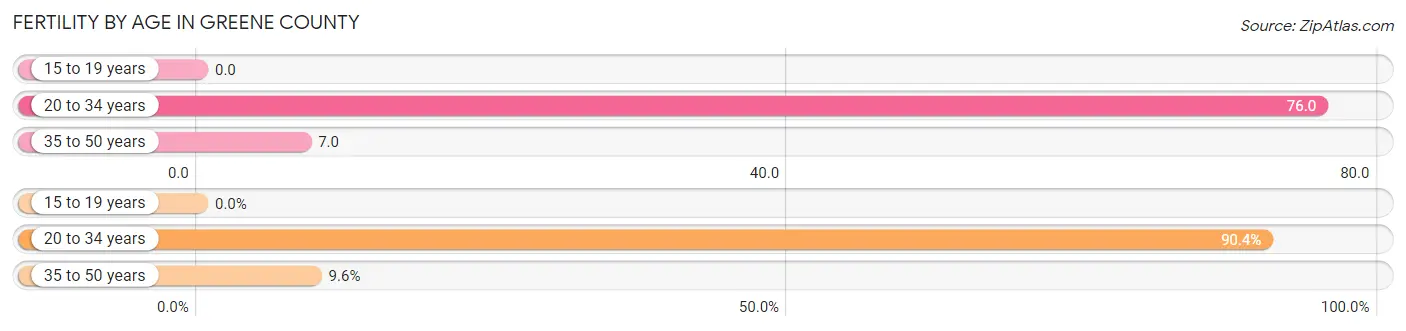
| Age Bracket | Women with Births | Births / 1,000 Women |
| 15 to 19 years | 0 (0.0%) | 0.0 |
| 20 to 34 years | 75 (90.4%) | 76.0 |
| 35 to 50 years | 8 (9.6%) | 7.0 |
| Total | 83 (100.0%) | 35.0 |
Fertility by Age by Marriage Status in Greene County
36.1% of women with births (83) in Greene County are married. The highest percentage of unmarried women with births falls into 20 to 34 years age bracket with 70.7% of them unmarried at the time of birth, while the lowest percentage of unmarried women with births belong to 35 to 50 years age bracket with 0.0% of them unmarried.
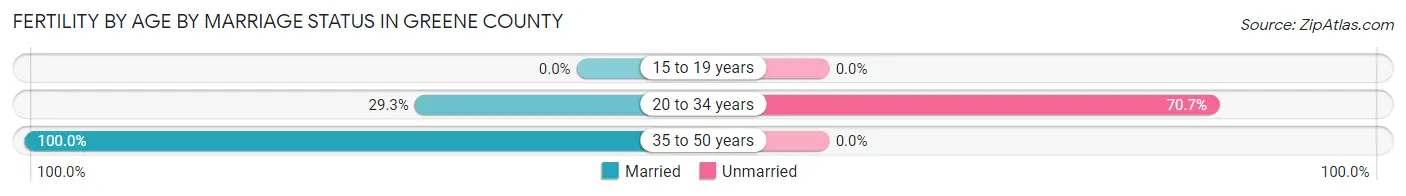
| Age Bracket | Married | Unmarried |
| 15 to 19 years | 0 (0.0%) | 0 (0.0%) |
| 20 to 34 years | 22 (29.3%) | 53 (70.7%) |
| 35 to 50 years | 8 (100.0%) | 0 (0.0%) |
| Total | 30 (36.1%) | 53 (63.9%) |
Fertility by Education in Greene County
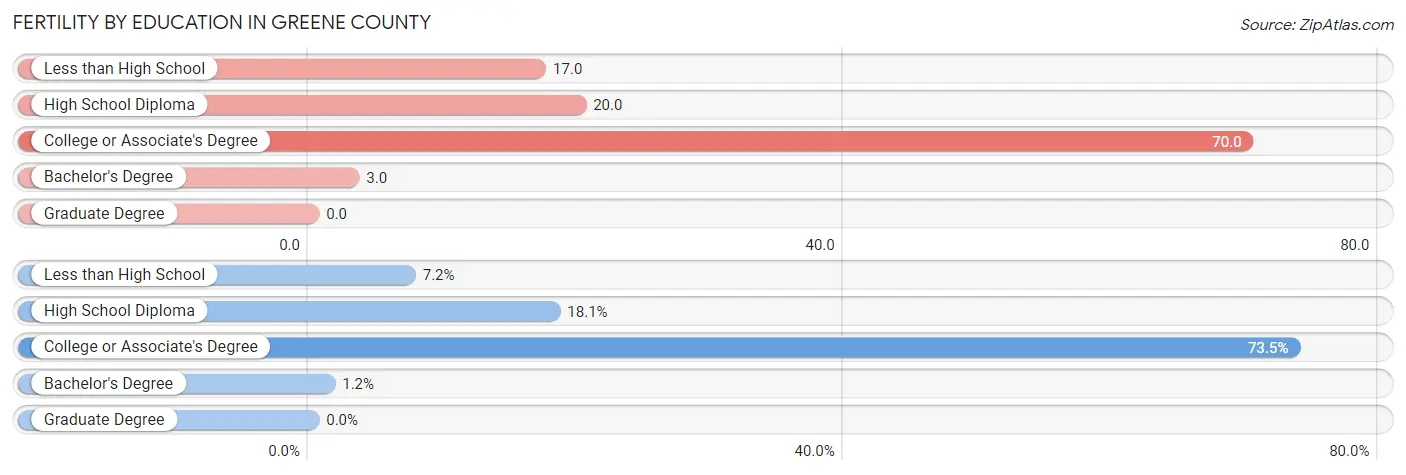
| Educational Attainment | Women with Births | Births / 1,000 Women |
| Less than High School | 6 (7.2%) | 17.0 |
| High School Diploma | 15 (18.1%) | 20.0 |
| College or Associate's Degree | 61 (73.5%) | 70.0 |
| Bachelor's Degree | 1 (1.2%) | 3.0 |
| Graduate Degree | 0 (0.0%) | 0.0 |
| Total | 83 (100.0%) | 35.0 |
Fertility by Education by Marriage Status in Greene County
63.9% of women with births in Greene County are unmarried. Women with the educational attainment of less than high school are most likely to be married with 100.0% of them married at childbirth, while women with the educational attainment of high school diploma are least likely to be married with 80.0% of them unmarried at childbirth.
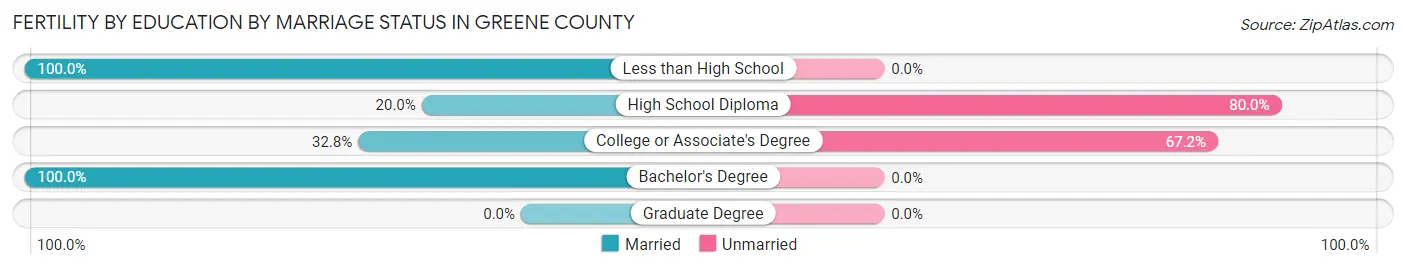
| Educational Attainment | Married | Unmarried |
| Less than High School | 6 (100.0%) | 0 (0.0%) |
| High School Diploma | 3 (20.0%) | 12 (80.0%) |
| College or Associate's Degree | 20 (32.8%) | 41 (67.2%) |
| Bachelor's Degree | 1 (100.0%) | 0 (0.0%) |
| Graduate Degree | 0 (0.0%) | 0 (0.0%) |
| Total | 30 (36.1%) | 53 (63.9%) |
Employment Characteristics in Greene County
Employment by Class of Employer in Greene County
Among the 5,447 employed individuals in Greene County, private company employees (3,515 | 64.5%), not-for-profit organizations (518 | 9.5%), and state government employees (434 | 8.0%) make up the most common classes of employment.
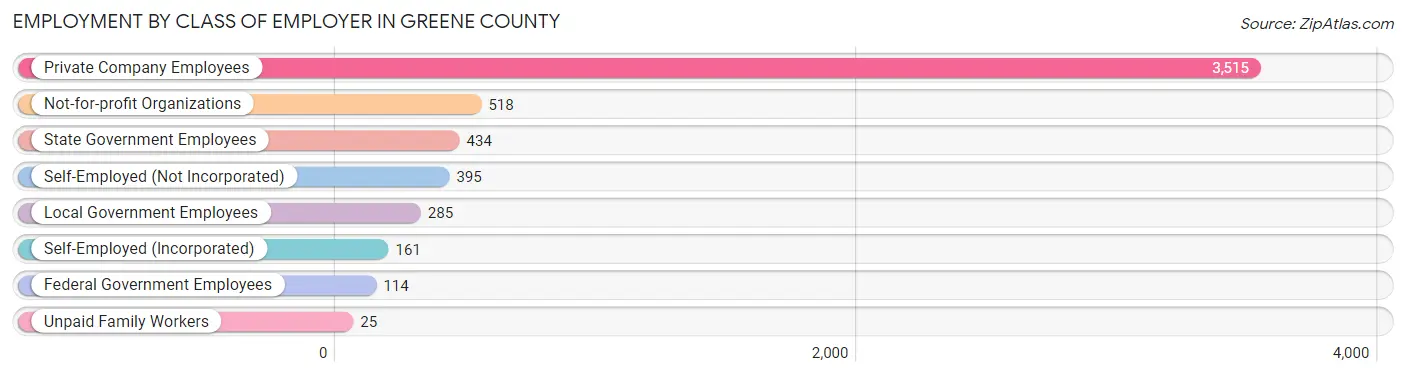
| Employer Class | # Employees | % Employees |
| Private Company Employees | 3,515 | 64.5% |
| Self-Employed (Incorporated) | 161 | 3.0% |
| Self-Employed (Not Incorporated) | 395 | 7.2% |
| Not-for-profit Organizations | 518 | 9.5% |
| Local Government Employees | 285 | 5.2% |
| State Government Employees | 434 | 8.0% |
| Federal Government Employees | 114 | 2.1% |
| Unpaid Family Workers | 25 | 0.5% |
| Total | 5,447 | 100.0% |
Employment Status by Age in Greene County
According to the labor force statistics for Greene County, out of the total population over 16 years of age (9,789), 58.7% or 5,746 individuals are in the labor force, with 3.4% or 195 of them unemployed. The age group with the highest labor force participation rate is 20 to 24 years, with 83.9% or 613 individuals in the labor force. Within the labor force, the 35 to 44 years age range has the highest percentage of unemployed individuals, with 5.4% or 55 of them being unemployed.
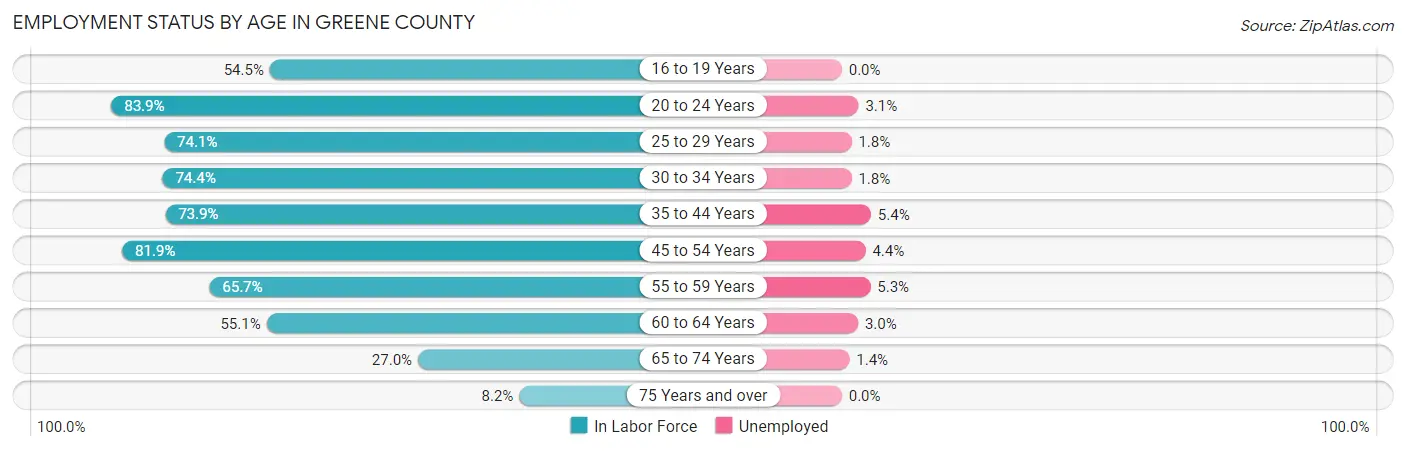
| Age Bracket | In Labor Force | Unemployed |
| 16 to 19 Years | 304 (54.5%) | 0 (0.0%) |
| 20 to 24 Years | 613 (83.9%) | 19 (3.1%) |
| 25 to 29 Years | 510 (74.1%) | 9 (1.8%) |
| 30 to 34 Years | 487 (74.4%) | 9 (1.8%) |
| 35 to 44 Years | 1,011 (73.9%) | 55 (5.4%) |
| 45 to 54 Years | 1,258 (81.9%) | 55 (4.4%) |
| 55 to 59 Years | 551 (65.7%) | 29 (5.3%) |
| 60 to 64 Years | 558 (55.1%) | 17 (3.0%) |
| 65 to 74 Years | 369 (27.0%) | 5 (1.4%) |
| 75 Years and over | 85 (8.2%) | 0 (0.0%) |
| Total | 5,746 (58.7%) | 195 (3.4%) |
Employment Status by Educational Attainment in Greene County
According to labor force statistics for Greene County, 71.7% of individuals (4,372) out of the total population between 25 and 64 years of age (6,098) are in the labor force, with 4.0% or 175 of them being unemployed. The group with the highest labor force participation rate are those with the educational attainment of bachelor's degree or higher, with 82.1% or 798 individuals in the labor force. Within the labor force, individuals with less than high school education have the highest percentage of unemployment, with 11.7% or 29 of them being unemployed.
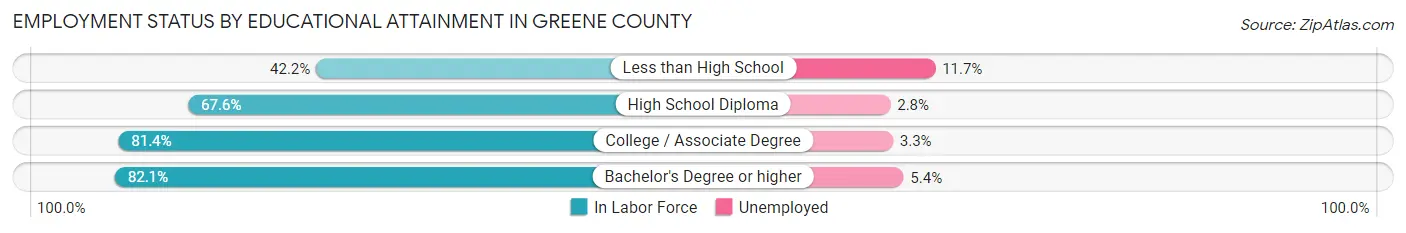
| Educational Attainment | In Labor Force | Unemployed |
| Less than High School | 248 (42.2%) | 69 (11.7%) |
| High School Diploma | 1,797 (67.6%) | 74 (2.8%) |
| College / Associate Degree | 1,531 (81.4%) | 62 (3.3%) |
| Bachelor's Degree or higher | 798 (82.1%) | 52 (5.4%) |
| Total | 4,372 (71.7%) | 244 (4.0%) |
Employment Occupations by Sex in Greene County
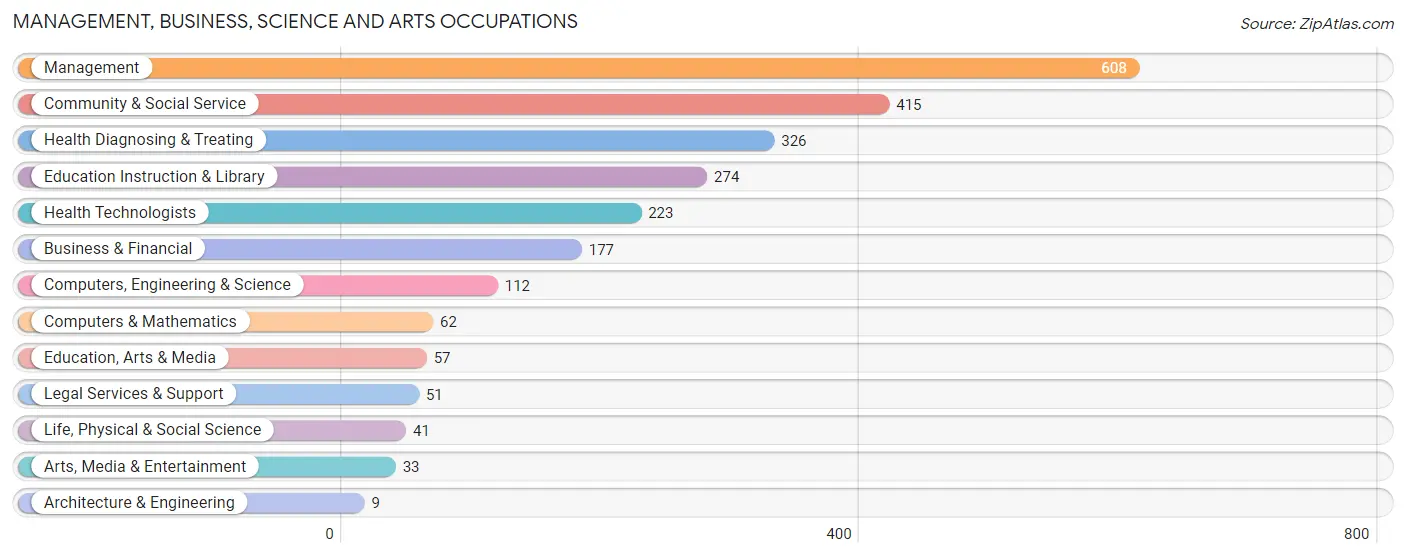
Management, Business, Science and Arts Occupations
The most common Management, Business, Science and Arts occupations in Greene County are Management (608 | 11.0%), Community & Social Service (415 | 7.5%), Health Diagnosing & Treating (326 | 5.9%), Education Instruction & Library (274 | 4.9%), and Health Technologists (223 | 4.0%).
Management, Business, Science and Arts Occupations by Sex
Within the Management, Business, Science and Arts occupations in Greene County, the most male-oriented occupations are Architecture & Engineering (100.0%), Legal Services & Support (94.1%), and Management (67.8%), while the most female-oriented occupations are Education Instruction & Library (86.1%), Health Diagnosing & Treating (82.2%), and Health Technologists (82.1%).
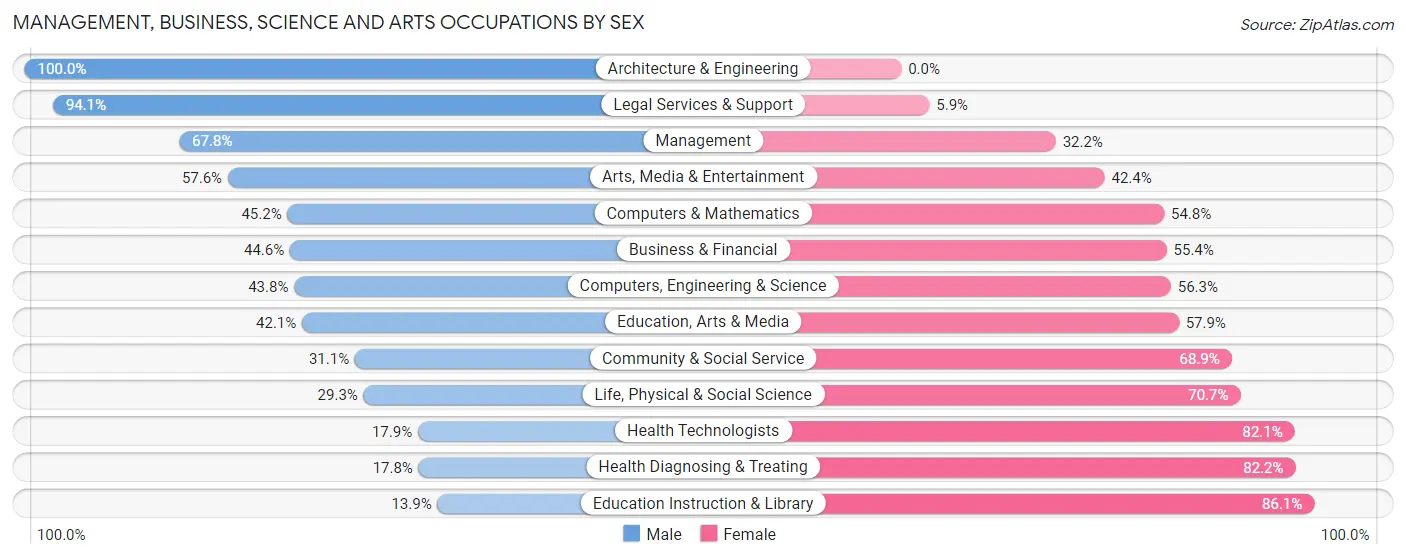
| Occupation | Male | Female |
| Management | 412 (67.8%) | 196 (32.2%) |
| Business & Financial | 79 (44.6%) | 98 (55.4%) |
| Computers, Engineering & Science | 49 (43.8%) | 63 (56.2%) |
| Computers & Mathematics | 28 (45.2%) | 34 (54.8%) |
| Architecture & Engineering | 9 (100.0%) | 0 (0.0%) |
| Life, Physical & Social Science | 12 (29.3%) | 29 (70.7%) |
| Community & Social Service | 129 (31.1%) | 286 (68.9%) |
| Education, Arts & Media | 24 (42.1%) | 33 (57.9%) |
| Legal Services & Support | 48 (94.1%) | 3 (5.9%) |
| Education Instruction & Library | 38 (13.9%) | 236 (86.1%) |
| Arts, Media & Entertainment | 19 (57.6%) | 14 (42.4%) |
| Health Diagnosing & Treating | 58 (17.8%) | 268 (82.2%) |
| Health Technologists | 40 (17.9%) | 183 (82.1%) |
| Total (Category) | 727 (44.4%) | 911 (55.6%) |
| Total (Overall) | 2,849 (51.4%) | 2,698 (48.6%) |
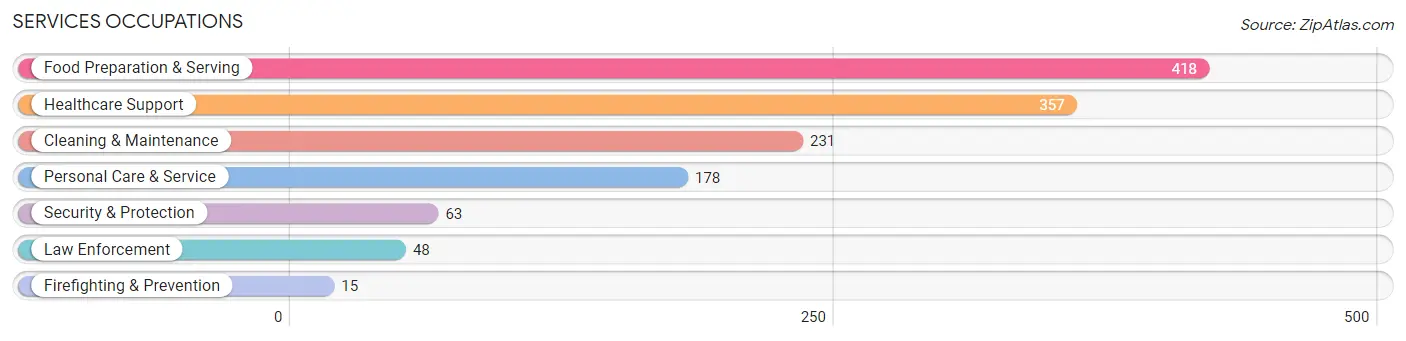
Services Occupations
The most common Services occupations in Greene County are Food Preparation & Serving (418 | 7.5%), Healthcare Support (357 | 6.4%), Cleaning & Maintenance (231 | 4.2%), Personal Care & Service (178 | 3.2%), and Security & Protection (63 | 1.1%).
Services Occupations by Sex
Within the Services occupations in Greene County, the most male-oriented occupations are Firefighting & Prevention (100.0%), Security & Protection (82.5%), and Law Enforcement (77.1%), while the most female-oriented occupations are Healthcare Support (95.2%), Personal Care & Service (91.0%), and Food Preparation & Serving (60.3%).
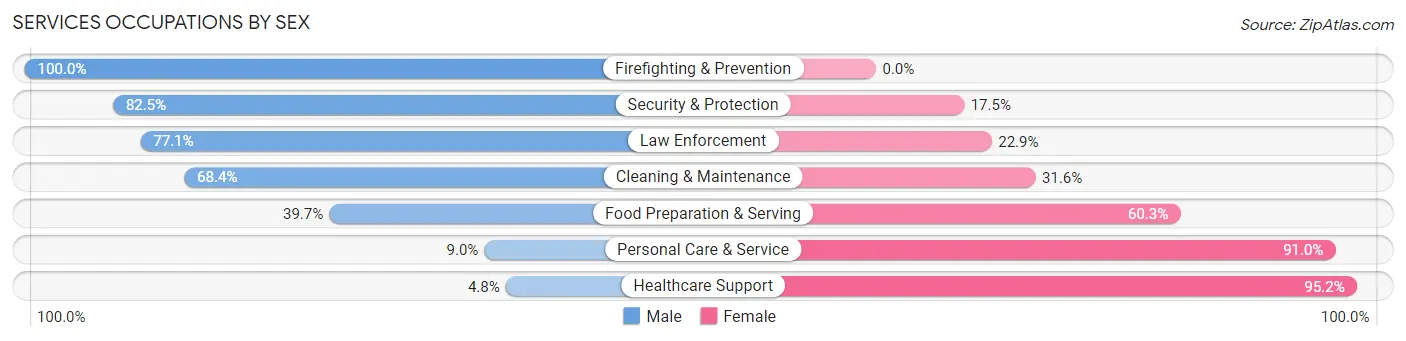
| Occupation | Male | Female |
| Healthcare Support | 17 (4.8%) | 340 (95.2%) |
| Security & Protection | 52 (82.5%) | 11 (17.5%) |
| Firefighting & Prevention | 15 (100.0%) | 0 (0.0%) |
| Law Enforcement | 37 (77.1%) | 11 (22.9%) |
| Food Preparation & Serving | 166 (39.7%) | 252 (60.3%) |
| Cleaning & Maintenance | 158 (68.4%) | 73 (31.6%) |
| Personal Care & Service | 16 (9.0%) | 162 (91.0%) |
| Total (Category) | 409 (32.8%) | 838 (67.2%) |
| Total (Overall) | 2,849 (51.4%) | 2,698 (48.6%) |
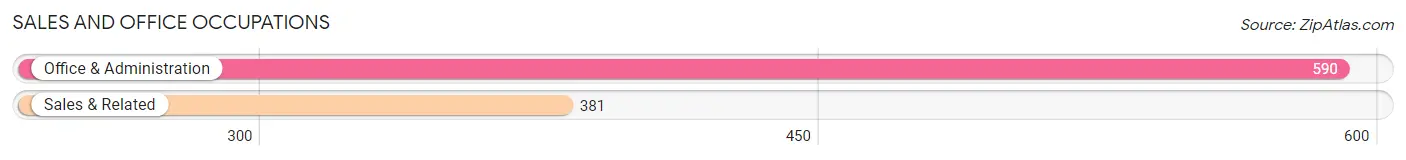
Sales and Office Occupations
The most common Sales and Office occupations in Greene County are Office & Administration (590 | 10.6%), and Sales & Related (381 | 6.9%).
Sales and Office Occupations by Sex
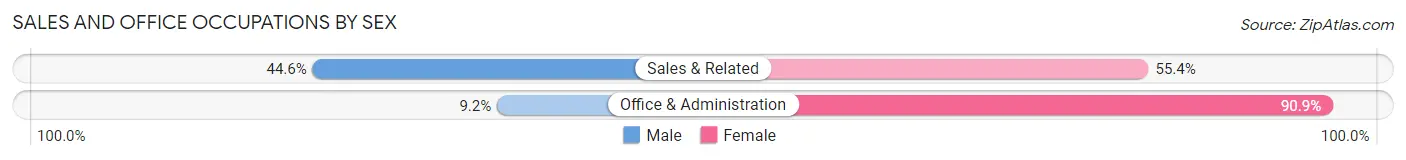
| Occupation | Male | Female |
| Sales & Related | 170 (44.6%) | 211 (55.4%) |
| Office & Administration | 54 (9.1%) | 536 (90.8%) |
| Total (Category) | 224 (23.1%) | 747 (76.9%) |
| Total (Overall) | 2,849 (51.4%) | 2,698 (48.6%) |
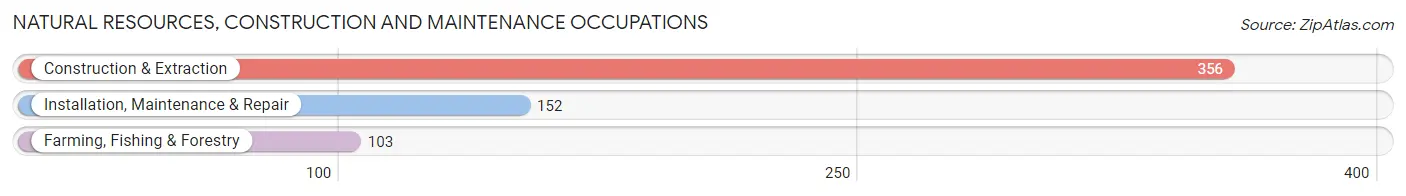
Natural Resources, Construction and Maintenance Occupations
The most common Natural Resources, Construction and Maintenance occupations in Greene County are Construction & Extraction (356 | 6.4%), Installation, Maintenance & Repair (152 | 2.7%), and Farming, Fishing & Forestry (103 | 1.9%).
Natural Resources, Construction and Maintenance Occupations by Sex
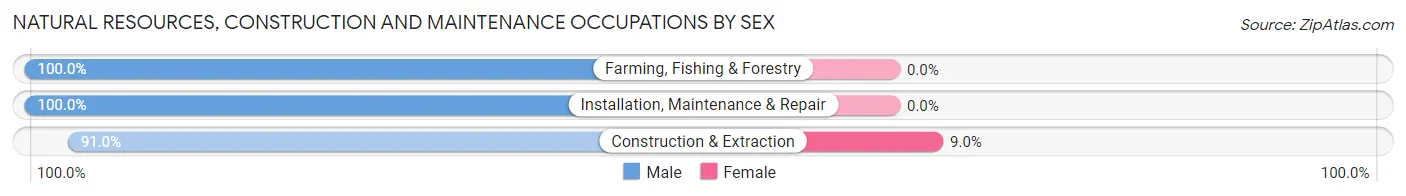
| Occupation | Male | Female |
| Farming, Fishing & Forestry | 103 (100.0%) | 0 (0.0%) |
| Construction & Extraction | 324 (91.0%) | 32 (9.0%) |
| Installation, Maintenance & Repair | 152 (100.0%) | 0 (0.0%) |
| Total (Category) | 579 (94.8%) | 32 (5.2%) |
| Total (Overall) | 2,849 (51.4%) | 2,698 (48.6%) |
Production, Transportation and Moving Occupations
The most common Production, Transportation and Moving occupations in Greene County are Production (492 | 8.9%), Transportation (300 | 5.4%), and Material Moving (288 | 5.2%).
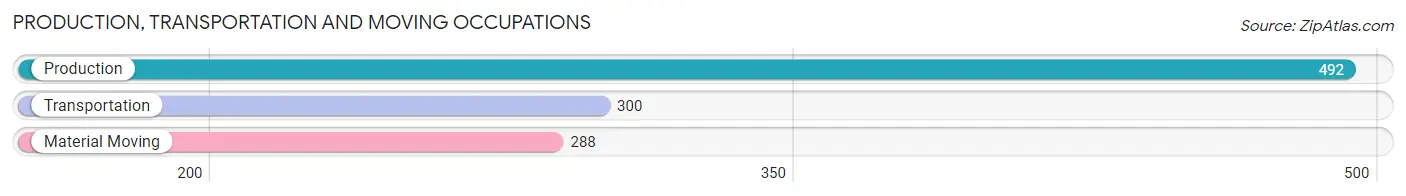
Production, Transportation and Moving Occupations by Sex
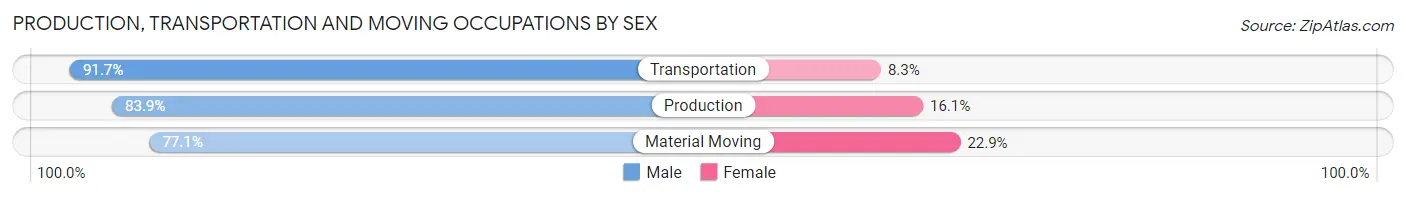
| Occupation | Male | Female |
| Production | 413 (83.9%) | 79 (16.1%) |
| Transportation | 275 (91.7%) | 25 (8.3%) |
| Material Moving | 222 (77.1%) | 66 (22.9%) |
| Total (Category) | 910 (84.3%) | 170 (15.7%) |
| Total (Overall) | 2,849 (51.4%) | 2,698 (48.6%) |
Employment Industries by Sex in Greene County
Employment Industries in Greene County
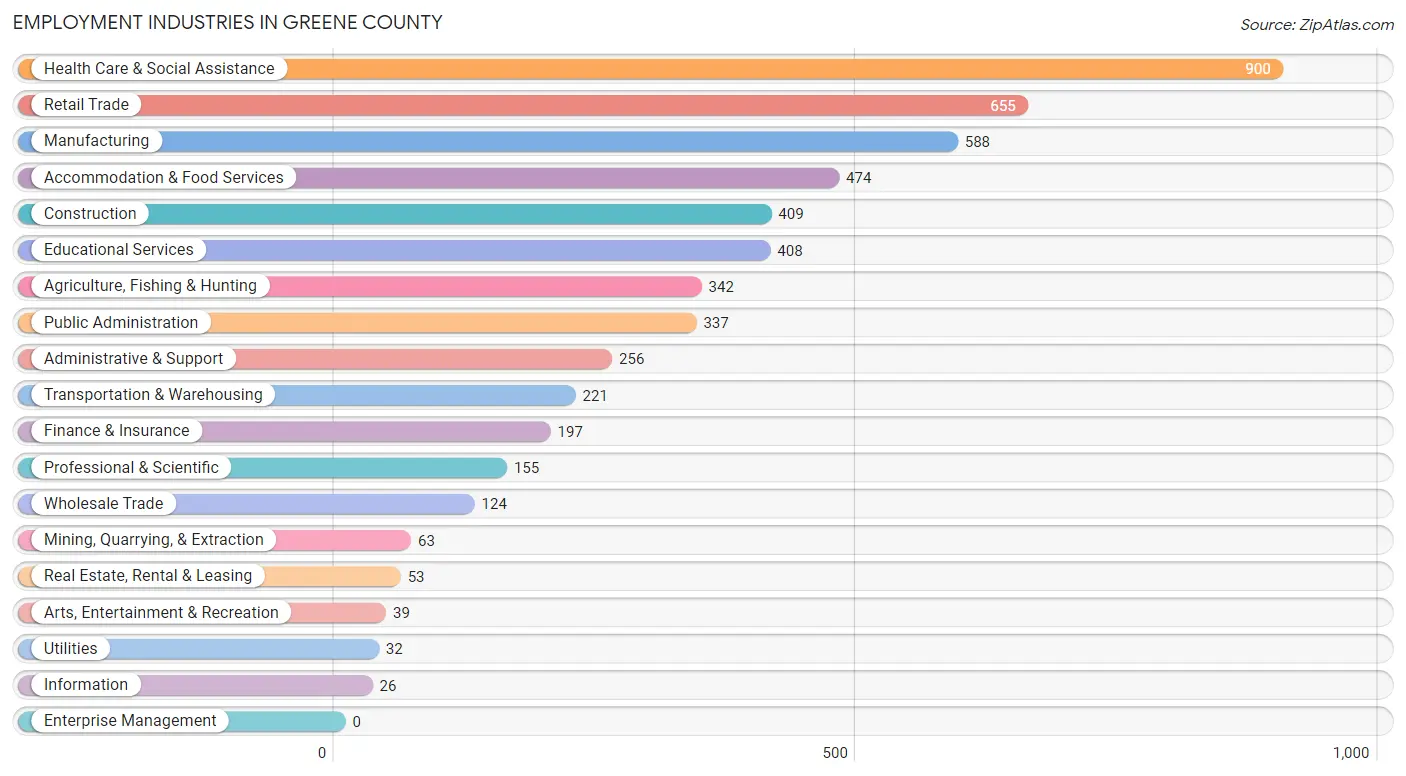
The major employment industries in Greene County include Health Care & Social Assistance (900 | 16.2%), Retail Trade (655 | 11.8%), Manufacturing (588 | 10.6%), Accommodation & Food Services (474 | 8.6%), and Construction (409 | 7.4%).
Employment Industries by Sex in Greene County
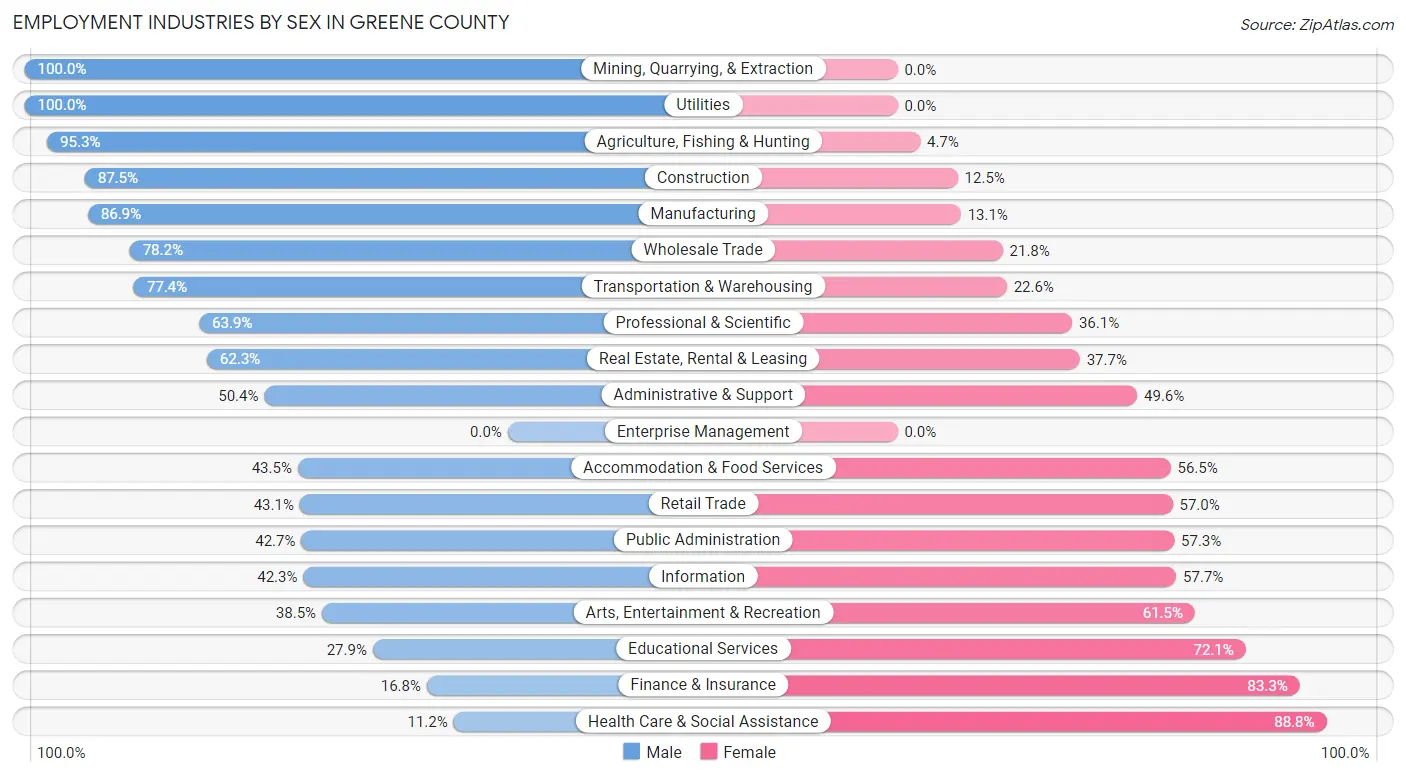
The Greene County industries that see more men than women are Mining, Quarrying, & Extraction (100.0%), Utilities (100.0%), and Agriculture, Fishing & Hunting (95.3%), whereas the industries that tend to have a higher number of women are Health Care & Social Assistance (88.8%), Finance & Insurance (83.3%), and Educational Services (72.1%).
| Industry | Male | Female |
| Agriculture, Fishing & Hunting | 326 (95.3%) | 16 (4.7%) |
| Mining, Quarrying, & Extraction | 63 (100.0%) | 0 (0.0%) |
| Construction | 358 (87.5%) | 51 (12.5%) |
| Manufacturing | 511 (86.9%) | 77 (13.1%) |
| Wholesale Trade | 97 (78.2%) | 27 (21.8%) |
| Retail Trade | 282 (43.0%) | 373 (57.0%) |
| Transportation & Warehousing | 171 (77.4%) | 50 (22.6%) |
| Utilities | 32 (100.0%) | 0 (0.0%) |
| Information | 11 (42.3%) | 15 (57.7%) |
| Finance & Insurance | 33 (16.8%) | 164 (83.3%) |
| Real Estate, Rental & Leasing | 33 (62.3%) | 20 (37.7%) |
| Professional & Scientific | 99 (63.9%) | 56 (36.1%) |
| Enterprise Management | 0 (0.0%) | 0 (0.0%) |
| Administrative & Support | 129 (50.4%) | 127 (49.6%) |
| Educational Services | 114 (27.9%) | 294 (72.1%) |
| Health Care & Social Assistance | 101 (11.2%) | 799 (88.8%) |
| Arts, Entertainment & Recreation | 15 (38.5%) | 24 (61.5%) |
| Accommodation & Food Services | 206 (43.5%) | 268 (56.5%) |
| Public Administration | 144 (42.7%) | 193 (57.3%) |
| Total | 2,849 (51.4%) | 2,698 (48.6%) |
Education in Greene County
School Enrollment in Greene County
The most common levels of schooling among the 2,550 students in Greene County are high school (698 | 27.4%), middle school (579 | 22.7%), and elementary school (513 | 20.1%).
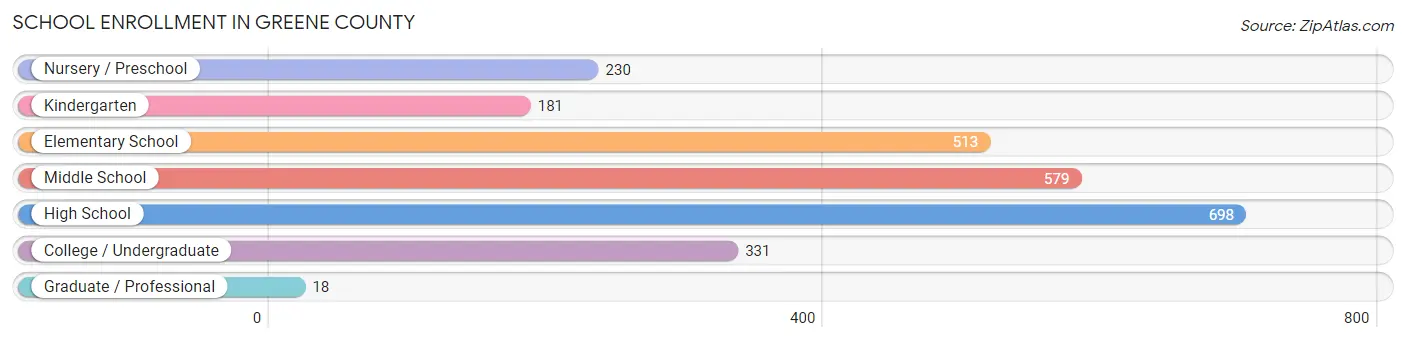
| School Level | # Students | % Students |
| Nursery / Preschool | 230 | 9.0% |
| Kindergarten | 181 | 7.1% |
| Elementary School | 513 | 20.1% |
| Middle School | 579 | 22.7% |
| High School | 698 | 27.4% |
| College / Undergraduate | 331 | 13.0% |
| Graduate / Professional | 18 | 0.7% |
| Total | 2,550 | 100.0% |
School Enrollment by Age by Funding Source in Greene County
Out of a total of 2,550 students who are enrolled in schools in Greene County, 423 (16.6%) attend a private institution, while the remaining 2,127 (83.4%) are enrolled in public schools. The age group of 35 years and over has the highest likelihood of being enrolled in private schools, with 67 (49.3% in the age bracket) enrolled. Conversely, the age group of 15 to 17 year olds has the lowest likelihood of being enrolled in a private school, with 447 (96.3% in the age bracket) attending a public institution.
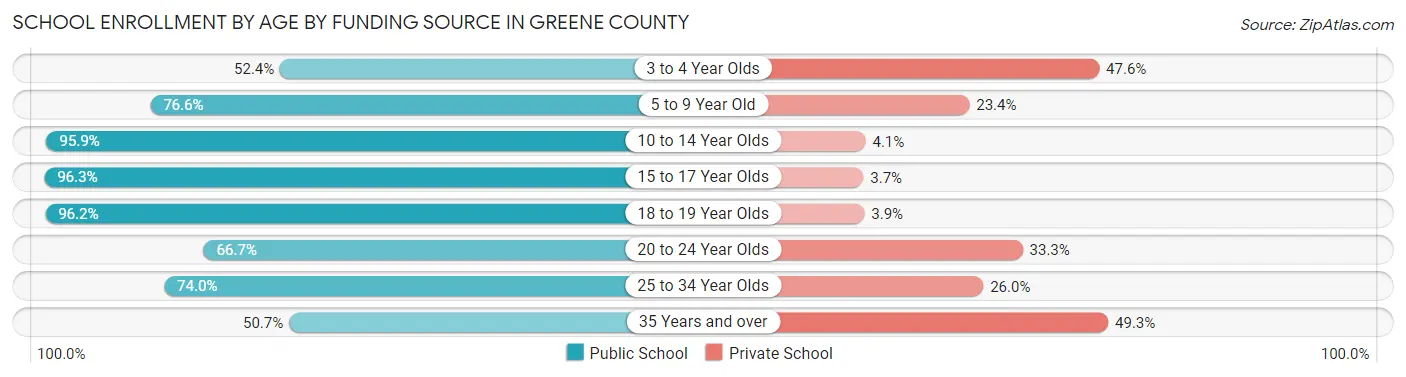
| Age Bracket | Public School | Private School |
| 3 to 4 Year Olds | 87 (52.4%) | 79 (47.6%) |
| 5 to 9 Year Old | 540 (76.6%) | 165 (23.4%) |
| 10 to 14 Year Olds | 730 (95.9%) | 31 (4.1%) |
| 15 to 17 Year Olds | 447 (96.3%) | 17 (3.7%) |
| 18 to 19 Year Olds | 125 (96.2%) | 5 (3.8%) |
| 20 to 24 Year Olds | 92 (66.7%) | 46 (33.3%) |
| 25 to 34 Year Olds | 37 (74.0%) | 13 (26.0%) |
| 35 Years and over | 69 (50.7%) | 67 (49.3%) |
| Total | 2,127 (83.4%) | 423 (16.6%) |
Educational Attainment by Field of Study in Greene County
Education (363 | 26.4%), science & technology (187 | 13.6%), business (180 | 13.1%), arts & humanities (122 | 8.9%), and bio, nature & agricultural (112 | 8.1%) are the most common fields of study among 1,376 individuals in Greene County who have obtained a bachelor's degree or higher.
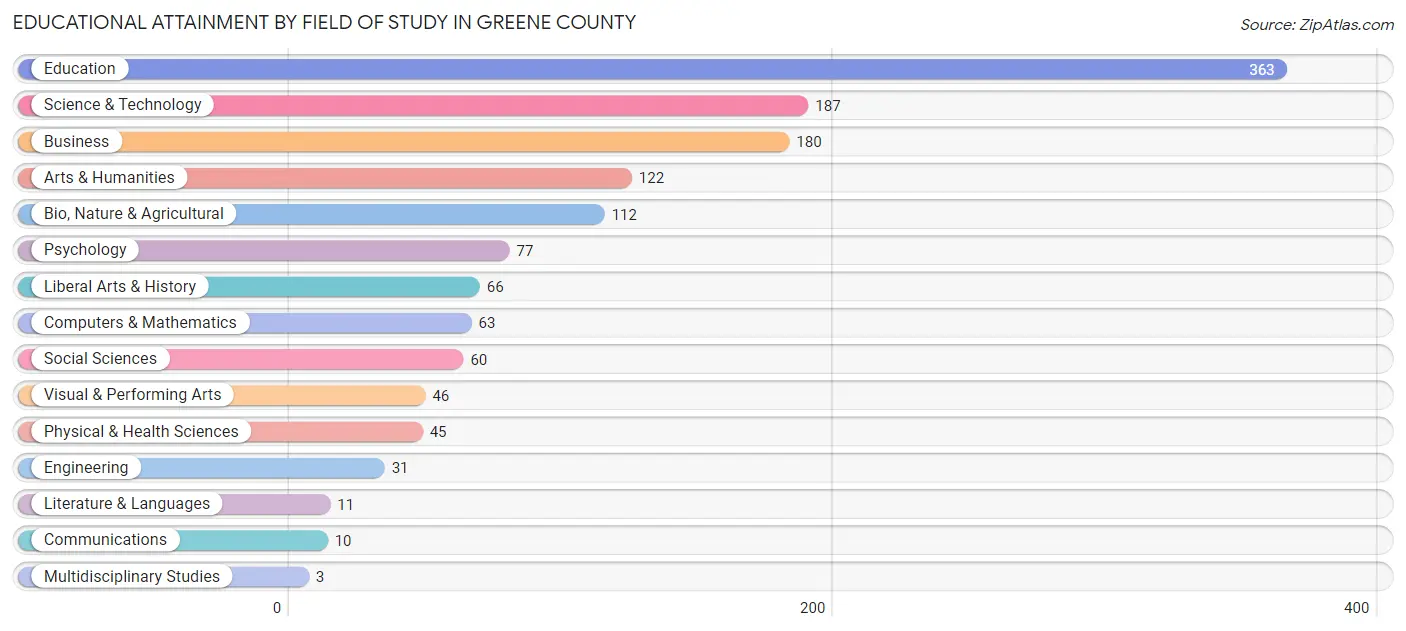
| Field of Study | # Graduates | % Graduates |
| Computers & Mathematics | 63 | 4.6% |
| Bio, Nature & Agricultural | 112 | 8.1% |
| Physical & Health Sciences | 45 | 3.3% |
| Psychology | 77 | 5.6% |
| Social Sciences | 60 | 4.4% |
| Engineering | 31 | 2.2% |
| Multidisciplinary Studies | 3 | 0.2% |
| Science & Technology | 187 | 13.6% |
| Business | 180 | 13.1% |
| Education | 363 | 26.4% |
| Literature & Languages | 11 | 0.8% |
| Liberal Arts & History | 66 | 4.8% |
| Visual & Performing Arts | 46 | 3.3% |
| Communications | 10 | 0.7% |
| Arts & Humanities | 122 | 8.9% |
| Total | 1,376 | 100.0% |
Transportation & Commute in Greene County
Vehicle Availability by Sex in Greene County
The most prevalent vehicle ownership categories in Greene County are males with 2 vehicles (1,000, accounting for 35.4%) and females with 2 vehicles (942, making up 38.2%).
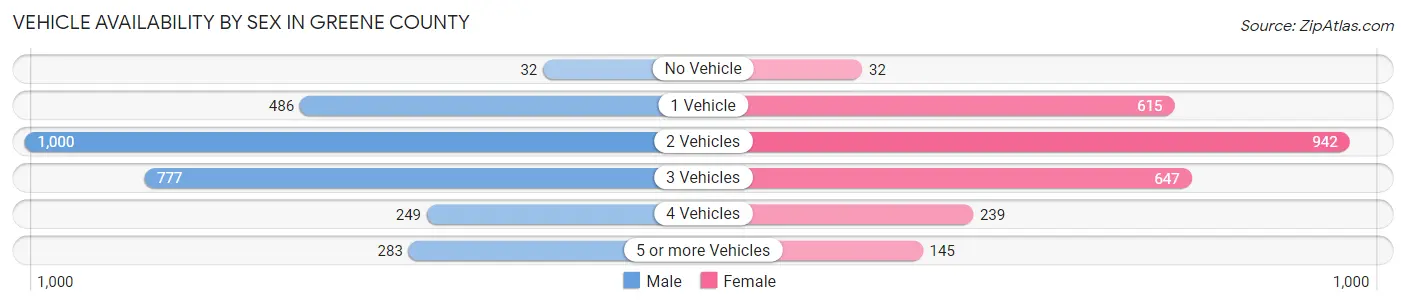
| Vehicles Available | Male | Female |
| No Vehicle | 32 (1.1%) | 32 (1.2%) |
| 1 Vehicle | 486 (17.2%) | 615 (23.5%) |
| 2 Vehicles | 1,000 (35.4%) | 942 (35.9%) |
| 3 Vehicles | 777 (27.5%) | 647 (24.7%) |
| 4 Vehicles | 249 (8.8%) | 239 (9.1%) |
| 5 or more Vehicles | 283 (10.0%) | 145 (5.5%) |
| Total | 2,827 (100.0%) | 2,620 (100.0%) |
Commute Time in Greene County
The most frequently occuring commute durations in Greene County are 60 to 89 minutes (744 commuters, 14.8%), 5 to 9 minutes (638 commuters, 12.7%), and 45 to 59 minutes (572 commuters, 11.4%).
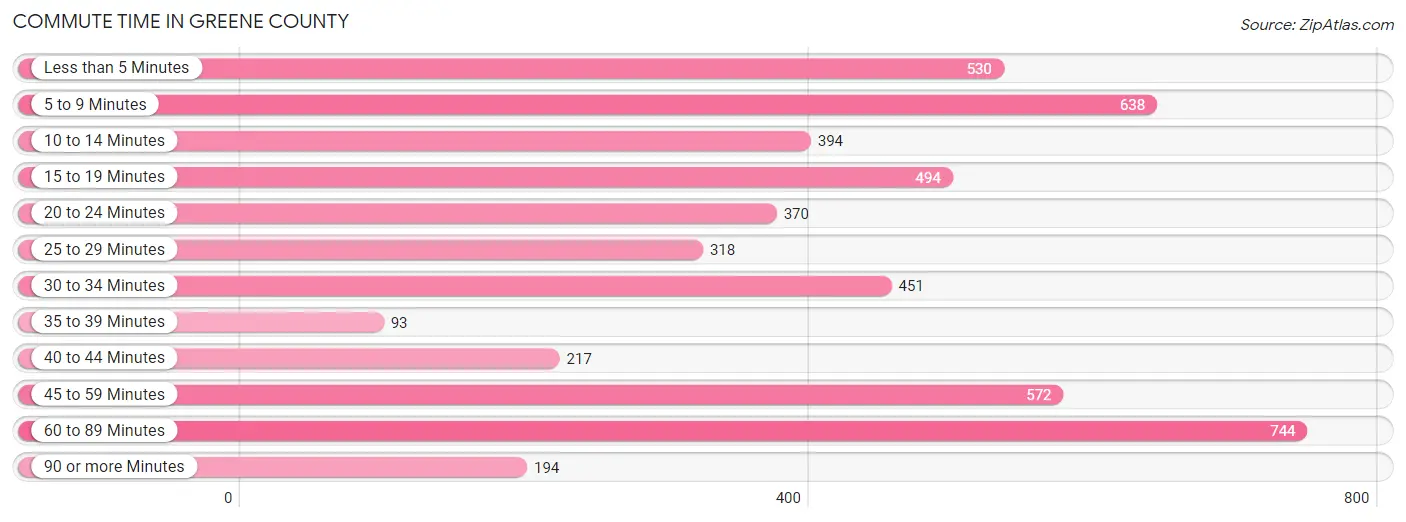
| Commute Time | # Commuters | % Commuters |
| Less than 5 Minutes | 530 | 10.6% |
| 5 to 9 Minutes | 638 | 12.7% |
| 10 to 14 Minutes | 394 | 7.9% |
| 15 to 19 Minutes | 494 | 9.9% |
| 20 to 24 Minutes | 370 | 7.4% |
| 25 to 29 Minutes | 318 | 6.3% |
| 30 to 34 Minutes | 451 | 9.0% |
| 35 to 39 Minutes | 93 | 1.8% |
| 40 to 44 Minutes | 217 | 4.3% |
| 45 to 59 Minutes | 572 | 11.4% |
| 60 to 89 Minutes | 744 | 14.8% |
| 90 or more Minutes | 194 | 3.9% |
Commute Time by Sex in Greene County
The most common commute times in Greene County are 60 to 89 minutes (464 commuters, 17.4%) for males and 5 to 9 minutes (369 commuters, 15.7%) for females.
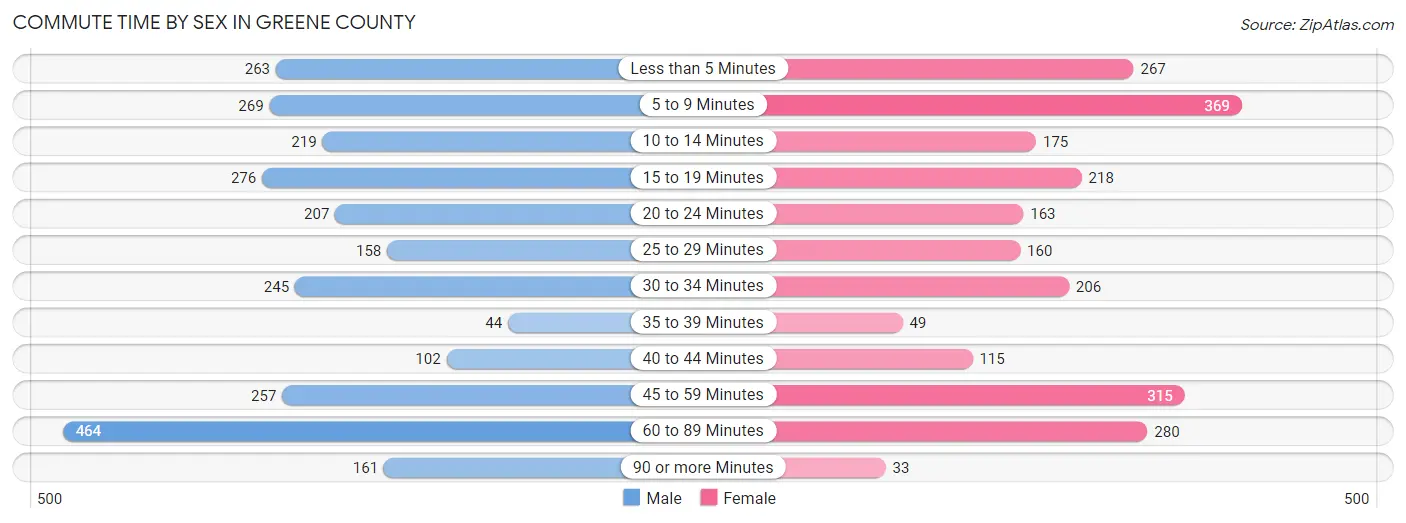
| Commute Time | Male | Female |
| Less than 5 Minutes | 263 (9.9%) | 267 (11.4%) |
| 5 to 9 Minutes | 269 (10.1%) | 369 (15.7%) |
| 10 to 14 Minutes | 219 (8.2%) | 175 (7.4%) |
| 15 to 19 Minutes | 276 (10.4%) | 218 (9.3%) |
| 20 to 24 Minutes | 207 (7.8%) | 163 (6.9%) |
| 25 to 29 Minutes | 158 (5.9%) | 160 (6.8%) |
| 30 to 34 Minutes | 245 (9.2%) | 206 (8.8%) |
| 35 to 39 Minutes | 44 (1.7%) | 49 (2.1%) |
| 40 to 44 Minutes | 102 (3.8%) | 115 (4.9%) |
| 45 to 59 Minutes | 257 (9.6%) | 315 (13.4%) |
| 60 to 89 Minutes | 464 (17.4%) | 280 (11.9%) |
| 90 or more Minutes | 161 (6.0%) | 33 (1.4%) |
Time of Departure to Work by Sex in Greene County
The most frequent times of departure to work in Greene County are 7:00 AM to 7:29 AM (445, 16.7%) for males and 7:00 AM to 7:29 AM (532, 22.6%) for females.
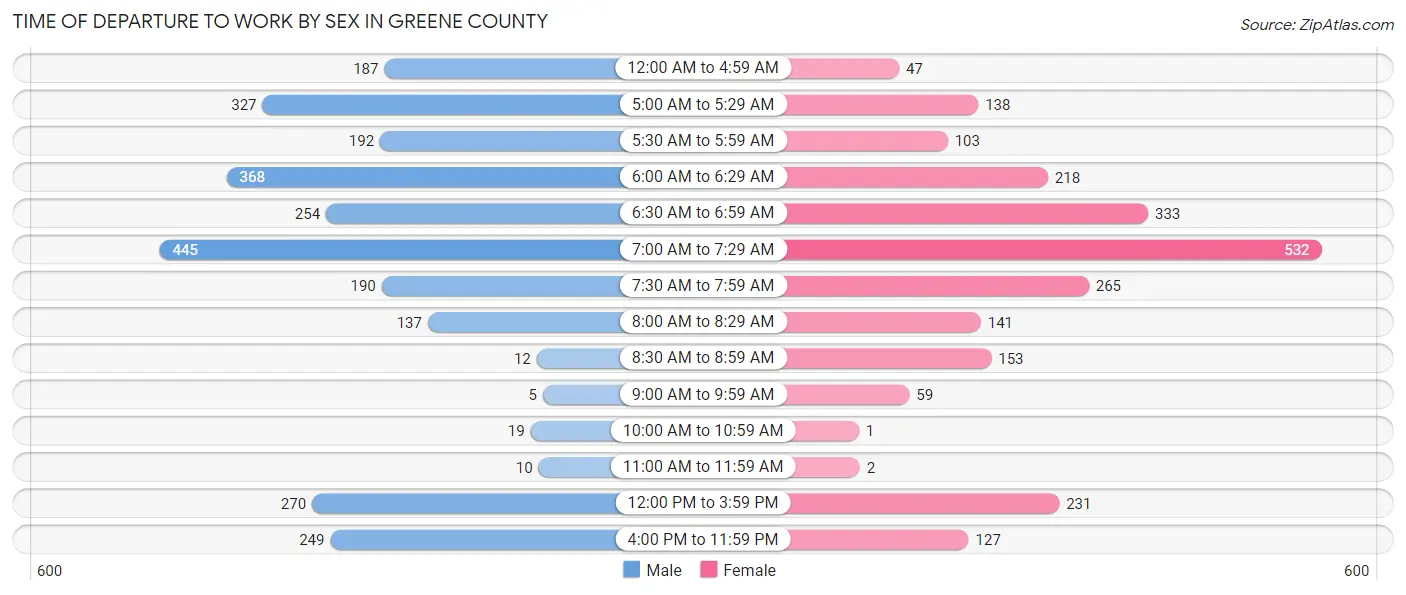
| Time of Departure | Male | Female |
| 12:00 AM to 4:59 AM | 187 (7.0%) | 47 (2.0%) |
| 5:00 AM to 5:29 AM | 327 (12.3%) | 138 (5.9%) |
| 5:30 AM to 5:59 AM | 192 (7.2%) | 103 (4.4%) |
| 6:00 AM to 6:29 AM | 368 (13.8%) | 218 (9.3%) |
| 6:30 AM to 6:59 AM | 254 (9.5%) | 333 (14.2%) |
| 7:00 AM to 7:29 AM | 445 (16.7%) | 532 (22.6%) |
| 7:30 AM to 7:59 AM | 190 (7.1%) | 265 (11.3%) |
| 8:00 AM to 8:29 AM | 137 (5.1%) | 141 (6.0%) |
| 8:30 AM to 8:59 AM | 12 (0.4%) | 153 (6.5%) |
| 9:00 AM to 9:59 AM | 5 (0.2%) | 59 (2.5%) |
| 10:00 AM to 10:59 AM | 19 (0.7%) | 1 (0.0%) |
| 11:00 AM to 11:59 AM | 10 (0.4%) | 2 (0.1%) |
| 12:00 PM to 3:59 PM | 270 (10.1%) | 231 (9.8%) |
| 4:00 PM to 11:59 PM | 249 (9.3%) | 127 (5.4%) |
| Total | 2,665 (100.0%) | 2,350 (100.0%) |
Housing Occupancy in Greene County
Occupancy by Ownership in Greene County
Of the total 4,543 dwellings in Greene County, owner-occupied units account for 3,495 (76.9%), while renter-occupied units make up 1,048 (23.1%).
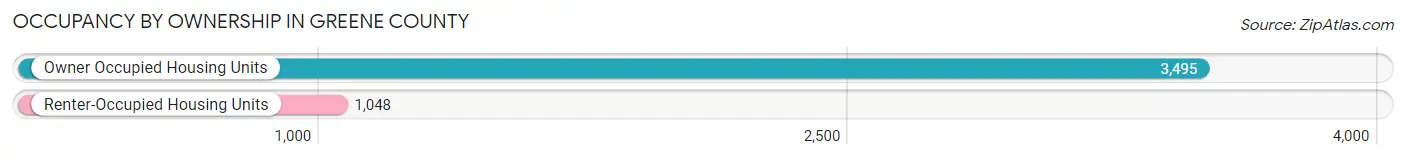
| Occupancy | # Housing Units | % Housing Units |
| Owner Occupied Housing Units | 3,495 | 76.9% |
| Renter-Occupied Housing Units | 1,048 | 23.1% |
| Total Occupied Housing Units | 4,543 | 100.0% |
Occupancy by Household Size in Greene County
| Household Size | # Housing Units | % Housing Units |
| 1-Person Household | 1,392 | 30.6% |
| 2-Person Household | 1,760 | 38.7% |
| 3-Person Household | 588 | 12.9% |
| 4+ Person Household | 803 | 17.7% |
| Total Housing Units | 4,543 | 100.0% |
Occupancy by Ownership by Household Size in Greene County
| Household Size | Owner-occupied | Renter-occupied |
| 1-Person Household | 944 (67.8%) | 448 (32.2%) |
| 2-Person Household | 1,518 (86.3%) | 242 (13.8%) |
| 3-Person Household | 397 (67.5%) | 191 (32.5%) |
| 4+ Person Household | 636 (79.2%) | 167 (20.8%) |
| Total Housing Units | 3,495 (76.9%) | 1,048 (23.1%) |
Occupancy by Educational Attainment in Greene County
| Household Size | Owner-occupied | Renter-occupied |
| Less than High School | 265 (70.7%) | 110 (29.3%) |
| High School Diploma | 1,424 (74.5%) | 488 (25.5%) |
| College/Associate Degree | 1,103 (75.4%) | 359 (24.6%) |
| Bachelor's Degree or higher | 703 (88.5%) | 91 (11.5%) |
Occupancy by Age of Householder in Greene County
| Age Bracket | # Households | % Households |
| Under 35 Years | 644 | 14.2% |
| 35 to 44 Years | 609 | 13.4% |
| 45 to 54 Years | 711 | 15.7% |
| 55 to 64 Years | 1,054 | 23.2% |
| 65 to 74 Years | 825 | 18.2% |
| 75 to 84 Years | 500 | 11.0% |
| 85 Years and Over | 200 | 4.4% |
| Total | 4,543 | 100.0% |
Housing Finances in Greene County
Median Income by Occupancy in Greene County
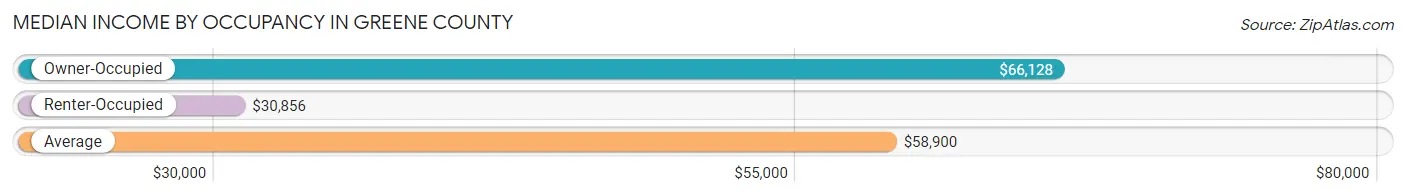
| Occupancy Type | # Households | Median Income |
| Owner-Occupied | 3,495 (76.9%) | $66,128 |
| Renter-Occupied | 1,048 (23.1%) | $30,856 |
| Average | 4,543 (100.0%) | $58,900 |
Occupancy by Householder Income Bracket in Greene County
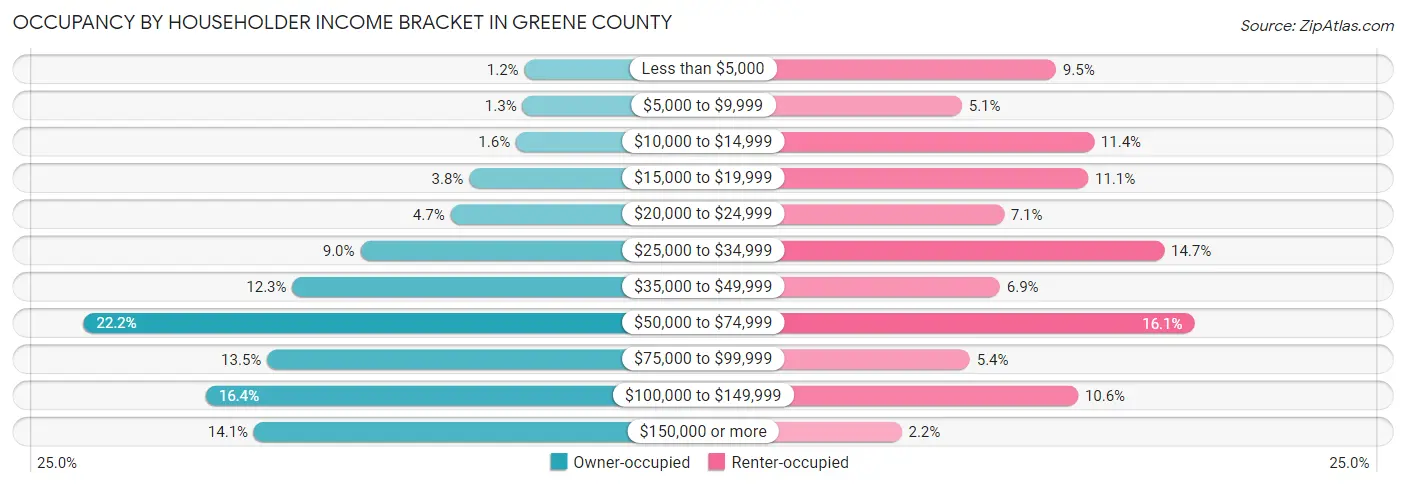
| Income Bracket | Owner-occupied | Renter-occupied |
| Less than $5,000 | 42 (1.2%) | 100 (9.5%) |
| $5,000 to $9,999 | 45 (1.3%) | 53 (5.1%) |
| $10,000 to $14,999 | 56 (1.6%) | 119 (11.4%) |
| $15,000 to $19,999 | 134 (3.8%) | 116 (11.1%) |
| $20,000 to $24,999 | 165 (4.7%) | 74 (7.1%) |
| $25,000 to $34,999 | 315 (9.0%) | 154 (14.7%) |
| $35,000 to $49,999 | 428 (12.2%) | 72 (6.9%) |
| $50,000 to $74,999 | 776 (22.2%) | 169 (16.1%) |
| $75,000 to $99,999 | 470 (13.5%) | 57 (5.4%) |
| $100,000 to $149,999 | 572 (16.4%) | 111 (10.6%) |
| $150,000 or more | 492 (14.1%) | 23 (2.2%) |
| Total | 3,495 (100.0%) | 1,048 (100.0%) |
Monthly Housing Cost Tiers in Greene County
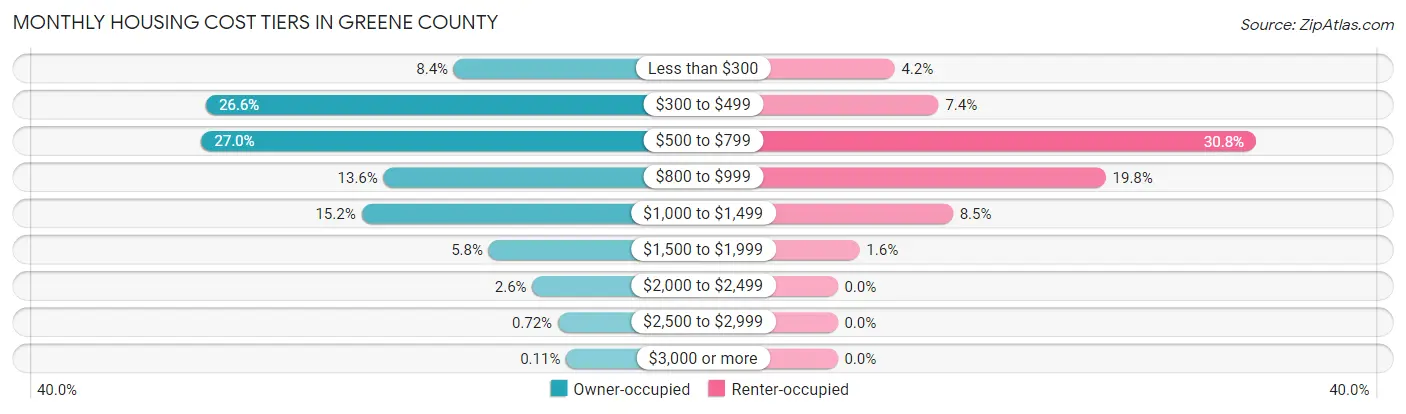
| Monthly Cost | Owner-occupied | Renter-occupied |
| Less than $300 | 293 (8.4%) | 44 (4.2%) |
| $300 to $499 | 931 (26.6%) | 78 (7.4%) |
| $500 to $799 | 943 (27.0%) | 323 (30.8%) |
| $800 to $999 | 474 (13.6%) | 207 (19.8%) |
| $1,000 to $1,499 | 531 (15.2%) | 89 (8.5%) |
| $1,500 to $1,999 | 203 (5.8%) | 17 (1.6%) |
| $2,000 to $2,499 | 91 (2.6%) | 0 (0.0%) |
| $2,500 to $2,999 | 25 (0.7%) | 0 (0.0%) |
| $3,000 or more | 4 (0.1%) | 0 (0.0%) |
| Total | 3,495 (100.0%) | 1,048 (100.0%) |
Physical Housing Characteristics in Greene County
Housing Structures in Greene County
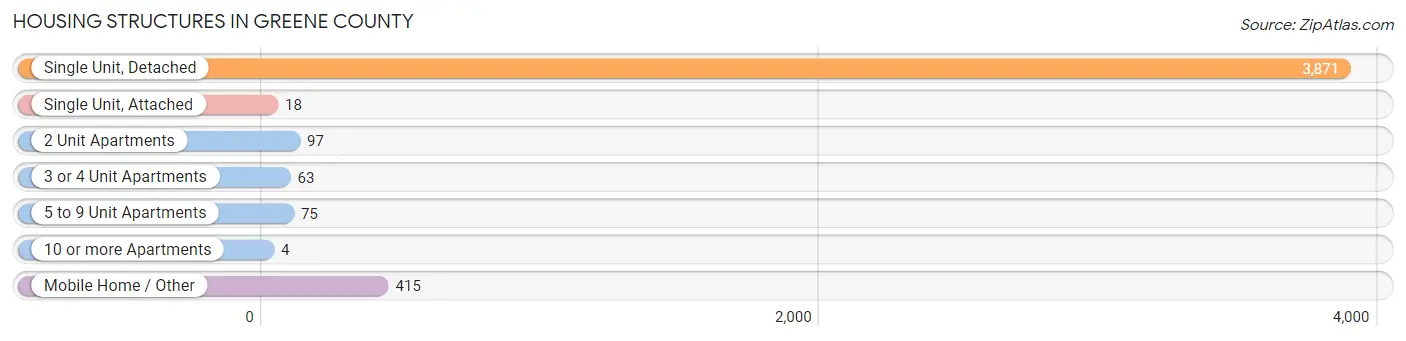
| Structure Type | # Housing Units | % Housing Units |
| Single Unit, Detached | 3,871 | 85.2% |
| Single Unit, Attached | 18 | 0.4% |
| 2 Unit Apartments | 97 | 2.1% |
| 3 or 4 Unit Apartments | 63 | 1.4% |
| 5 to 9 Unit Apartments | 75 | 1.7% |
| 10 or more Apartments | 4 | 0.1% |
| Mobile Home / Other | 415 | 9.1% |
| Total | 4,543 | 100.0% |
Housing Structures by Occupancy in Greene County
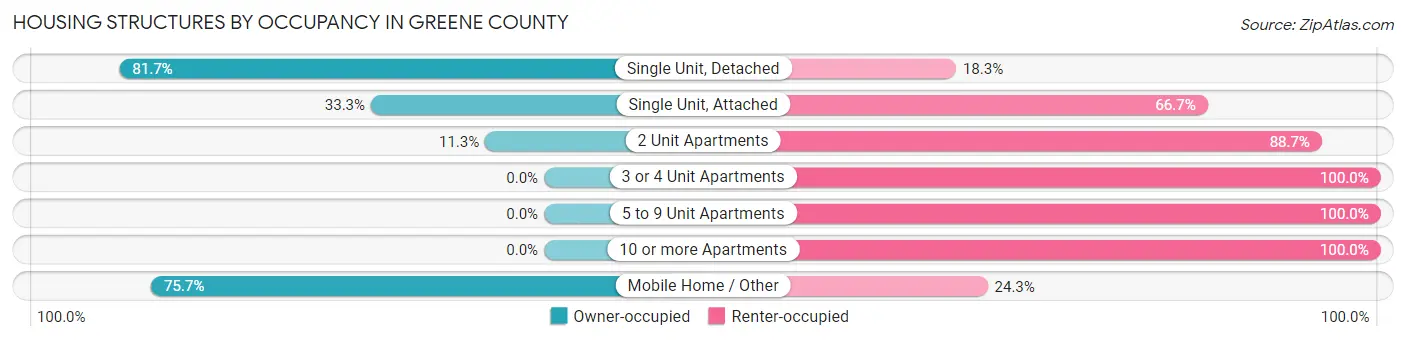
| Structure Type | Owner-occupied | Renter-occupied |
| Single Unit, Detached | 3,164 (81.7%) | 707 (18.3%) |
| Single Unit, Attached | 6 (33.3%) | 12 (66.7%) |
| 2 Unit Apartments | 11 (11.3%) | 86 (88.7%) |
| 3 or 4 Unit Apartments | 0 (0.0%) | 63 (100.0%) |
| 5 to 9 Unit Apartments | 0 (0.0%) | 75 (100.0%) |
| 10 or more Apartments | 0 (0.0%) | 4 (100.0%) |
| Mobile Home / Other | 314 (75.7%) | 101 (24.3%) |
| Total | 3,495 (76.9%) | 1,048 (23.1%) |
Housing Structures by Number of Rooms in Greene County
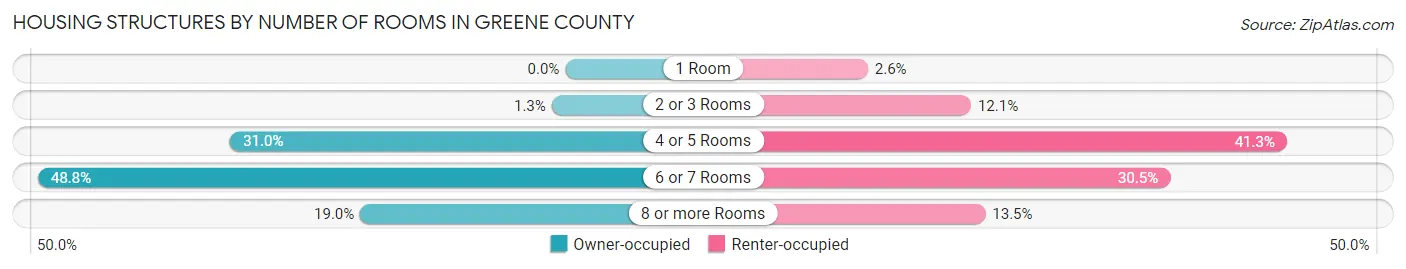
| Number of Rooms | Owner-occupied | Renter-occupied |
| 1 Room | 0 (0.0%) | 27 (2.6%) |
| 2 or 3 Rooms | 44 (1.3%) | 127 (12.1%) |
| 4 or 5 Rooms | 1,083 (31.0%) | 433 (41.3%) |
| 6 or 7 Rooms | 1,705 (48.8%) | 320 (30.5%) |
| 8 or more Rooms | 663 (19.0%) | 141 (13.5%) |
| Total | 3,495 (100.0%) | 1,048 (100.0%) |
Housing Structure by Heating Type in Greene County
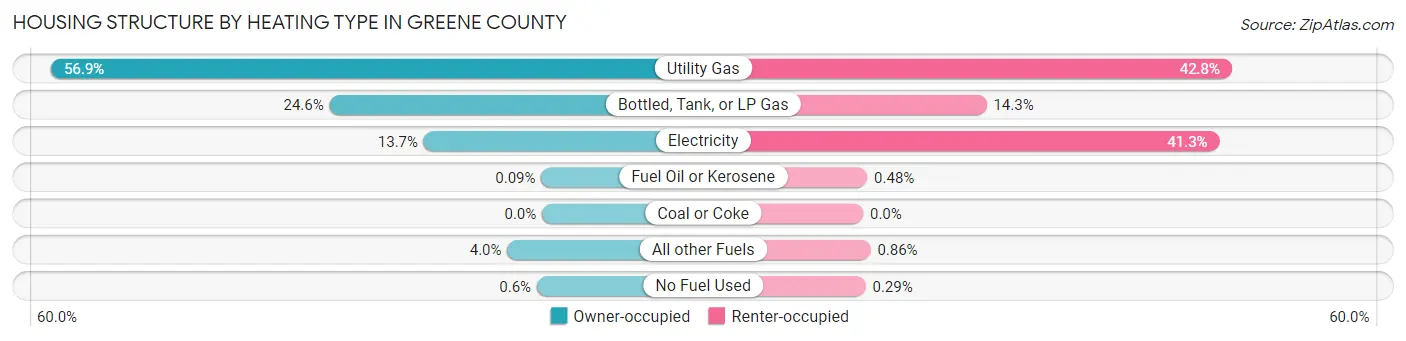
| Heating Type | Owner-occupied | Renter-occupied |
| Utility Gas | 1,990 (56.9%) | 448 (42.7%) |
| Bottled, Tank, or LP Gas | 861 (24.6%) | 150 (14.3%) |
| Electricity | 479 (13.7%) | 433 (41.3%) |
| Fuel Oil or Kerosene | 3 (0.1%) | 5 (0.5%) |
| Coal or Coke | 0 (0.0%) | 0 (0.0%) |
| All other Fuels | 141 (4.0%) | 9 (0.9%) |
| No Fuel Used | 21 (0.6%) | 3 (0.3%) |
| Total | 3,495 (100.0%) | 1,048 (100.0%) |
Household Vehicle Usage in Greene County
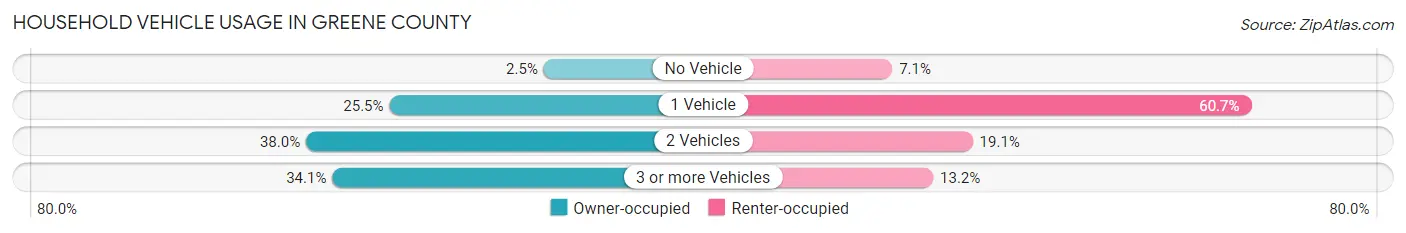
| Vehicles per Household | Owner-occupied | Renter-occupied |
| No Vehicle | 86 (2.5%) | 74 (7.1%) |
| 1 Vehicle | 892 (25.5%) | 636 (60.7%) |
| 2 Vehicles | 1,327 (38.0%) | 200 (19.1%) |
| 3 or more Vehicles | 1,190 (34.1%) | 138 (13.2%) |
| Total | 3,495 (100.0%) | 1,048 (100.0%) |
Real Estate & Mortgages in Greene County
Real Estate and Mortgage Overview in Greene County
| Characteristic | Without Mortgage | With Mortgage |
| Housing Units | 2,060 | 1,435 |
| Median Property Value | $85,000 | $98,700 |
| Median Household Income | $57,674 | $271 |
| Monthly Housing Costs | $458 | $2 |
| Real Estate Taxes | $1,212 | $37 |
Property Value by Mortgage Status in Greene County
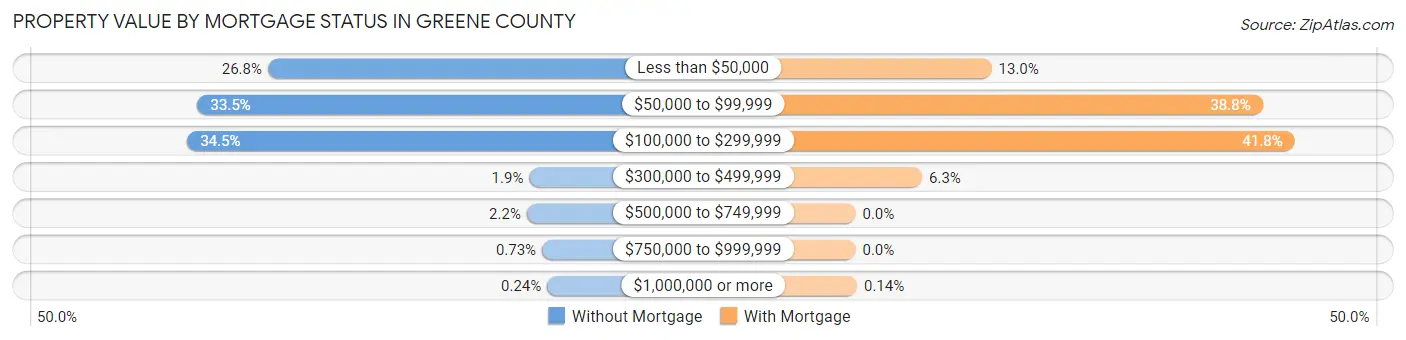
| Property Value | Without Mortgage | With Mortgage |
| Less than $50,000 | 553 (26.8%) | 186 (13.0%) |
| $50,000 to $99,999 | 691 (33.5%) | 556 (38.8%) |
| $100,000 to $299,999 | 711 (34.5%) | 600 (41.8%) |
| $300,000 to $499,999 | 40 (1.9%) | 91 (6.3%) |
| $500,000 to $749,999 | 45 (2.2%) | 0 (0.0%) |
| $750,000 to $999,999 | 15 (0.7%) | 0 (0.0%) |
| $1,000,000 or more | 5 (0.2%) | 2 (0.1%) |
| Total | 2,060 (100.0%) | 1,435 (100.0%) |
Household Income by Mortgage Status in Greene County
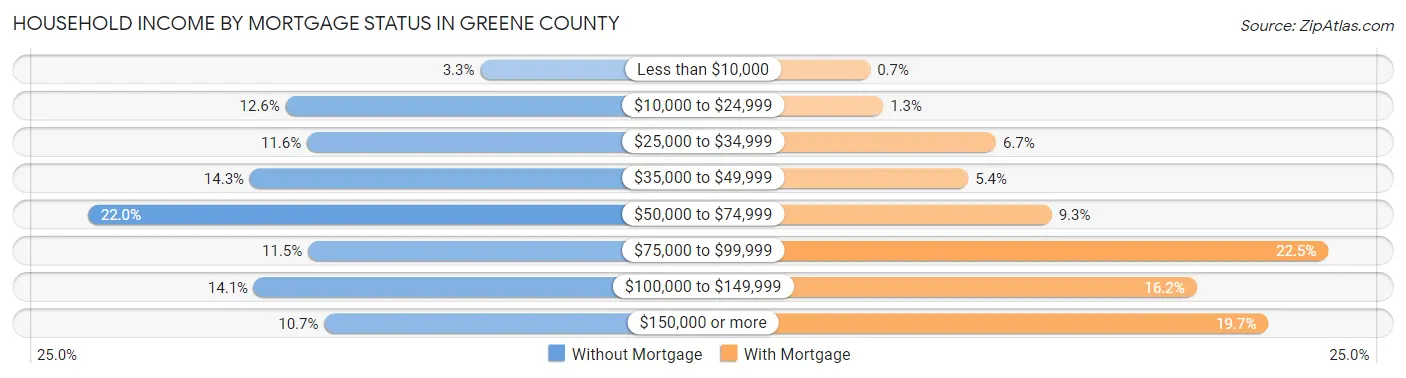
| Household Income | Without Mortgage | With Mortgage |
| Less than $10,000 | 68 (3.3%) | 10 (0.7%) |
| $10,000 to $24,999 | 259 (12.6%) | 19 (1.3%) |
| $25,000 to $34,999 | 238 (11.6%) | 96 (6.7%) |
| $35,000 to $49,999 | 294 (14.3%) | 77 (5.4%) |
| $50,000 to $74,999 | 453 (22.0%) | 134 (9.3%) |
| $75,000 to $99,999 | 237 (11.5%) | 323 (22.5%) |
| $100,000 to $149,999 | 290 (14.1%) | 233 (16.2%) |
| $150,000 or more | 221 (10.7%) | 282 (19.7%) |
| Total | 2,060 (100.0%) | 1,435 (100.0%) |
Property Value to Household Income Ratio in Greene County
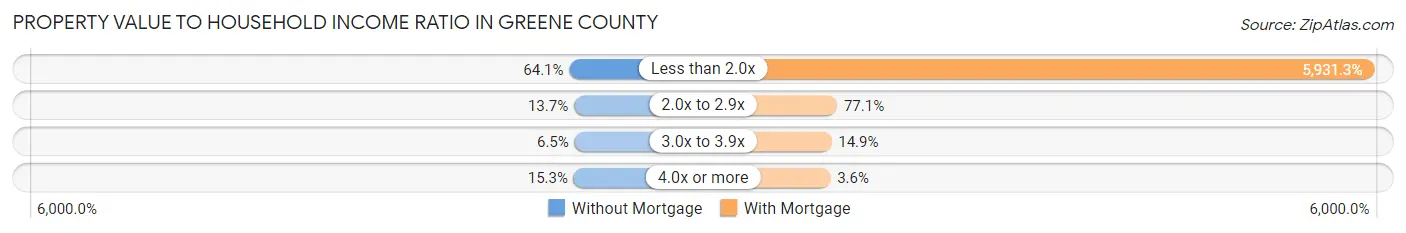
| Value-to-Income Ratio | Without Mortgage | With Mortgage |
| Less than 2.0x | 1,320 (64.1%) | 85,114 (5,931.3%) |
| 2.0x to 2.9x | 282 (13.7%) | 1,107 (77.1%) |
| 3.0x to 3.9x | 133 (6.5%) | 214 (14.9%) |
| 4.0x or more | 316 (15.3%) | 51 (3.5%) |
| Total | 2,060 (100.0%) | 1,435 (100.0%) |
Real Estate Taxes by Mortgage Status in Greene County
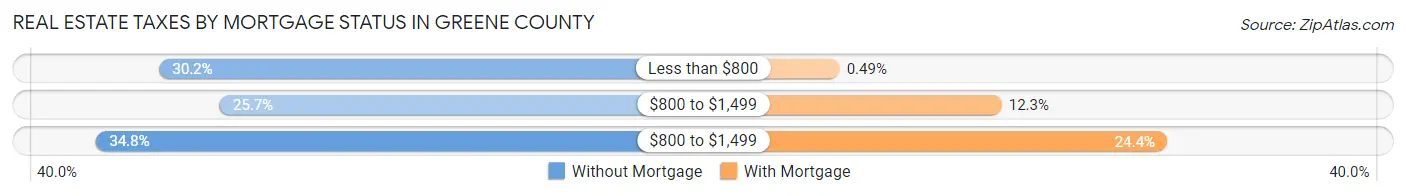
| Property Taxes | Without Mortgage | With Mortgage |
| Less than $800 | 621 (30.1%) | 7 (0.5%) |
| $800 to $1,499 | 530 (25.7%) | 177 (12.3%) |
| $800 to $1,499 | 716 (34.8%) | 350 (24.4%) |
| Total | 2,060 (100.0%) | 1,435 (100.0%) |
Health & Disability in Greene County
Health Insurance Coverage by Age in Greene County
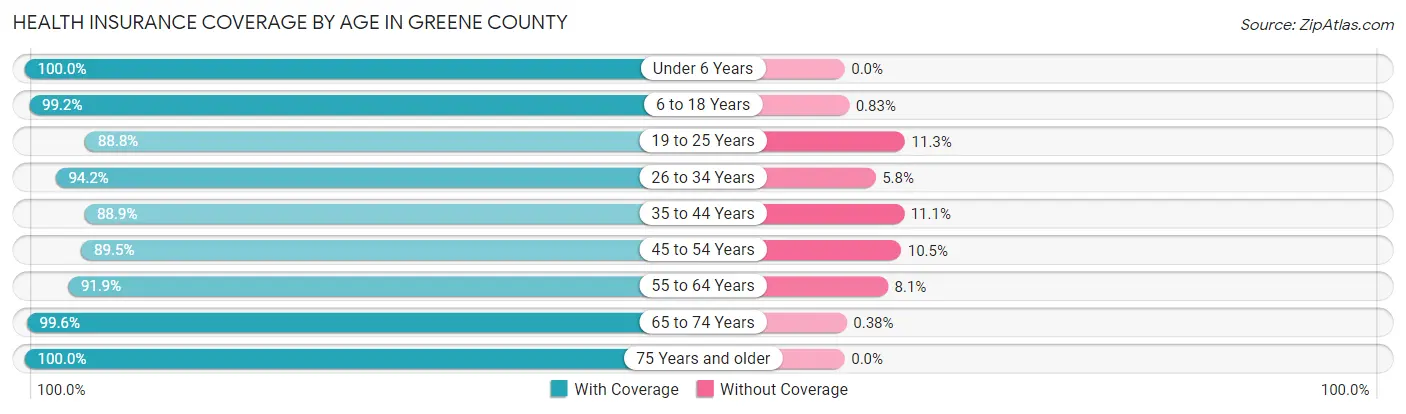
| Age Bracket | With Coverage | Without Coverage |
| Under 6 Years | 756 (100.0%) | 0 (0.0%) |
| 6 to 18 Years | 1,908 (99.2%) | 16 (0.8%) |
| 19 to 25 Years | 828 (88.7%) | 105 (11.3%) |
| 26 to 34 Years | 1,063 (94.2%) | 65 (5.8%) |
| 35 to 44 Years | 1,196 (88.9%) | 149 (11.1%) |
| 45 to 54 Years | 1,359 (89.5%) | 160 (10.5%) |
| 55 to 64 Years | 1,697 (91.9%) | 149 (8.1%) |
| 65 to 74 Years | 1,326 (99.6%) | 5 (0.4%) |
| 75 Years and older | 982 (100.0%) | 0 (0.0%) |
| Total | 11,115 (94.5%) | 649 (5.5%) |
Health Insurance Coverage by Citizenship Status in Greene County
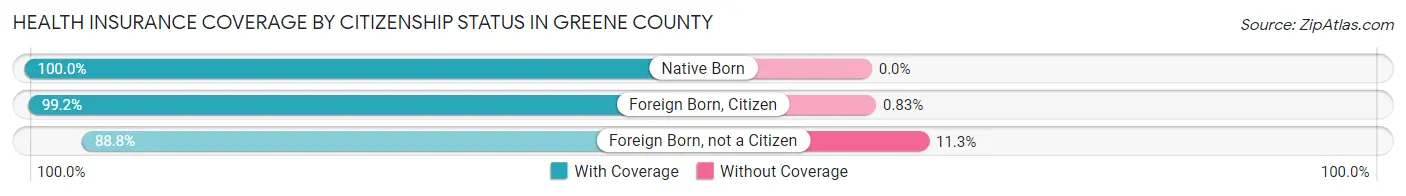
| Citizenship Status | With Coverage | Without Coverage |
| Native Born | 756 (100.0%) | 0 (0.0%) |
| Foreign Born, Citizen | 1,908 (99.2%) | 16 (0.8%) |
| Foreign Born, not a Citizen | 828 (88.7%) | 105 (11.3%) |
Health Insurance Coverage by Household Income in Greene County
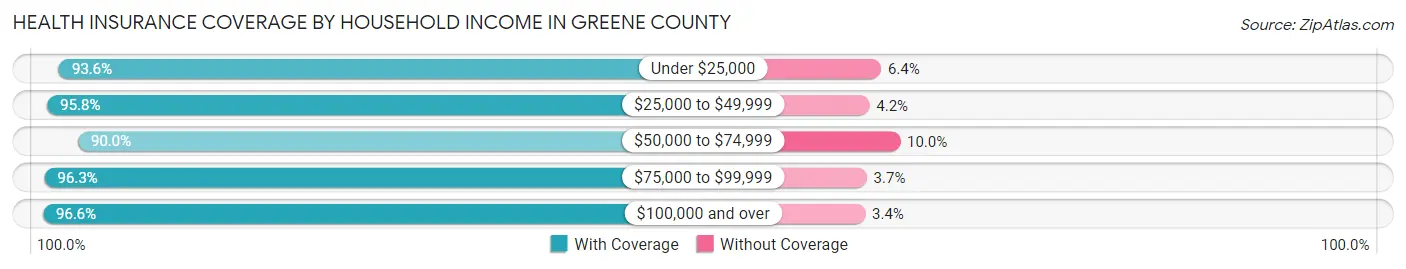
| Household Income | With Coverage | Without Coverage |
| Under $25,000 | 1,606 (93.6%) | 110 (6.4%) |
| $25,000 to $49,999 | 1,815 (95.8%) | 80 (4.2%) |
| $50,000 to $74,999 | 2,401 (90.0%) | 266 (10.0%) |
| $75,000 to $99,999 | 1,656 (96.3%) | 64 (3.7%) |
| $100,000 and over | 3,637 (96.6%) | 129 (3.4%) |
Public vs Private Health Insurance Coverage by Age in Greene County
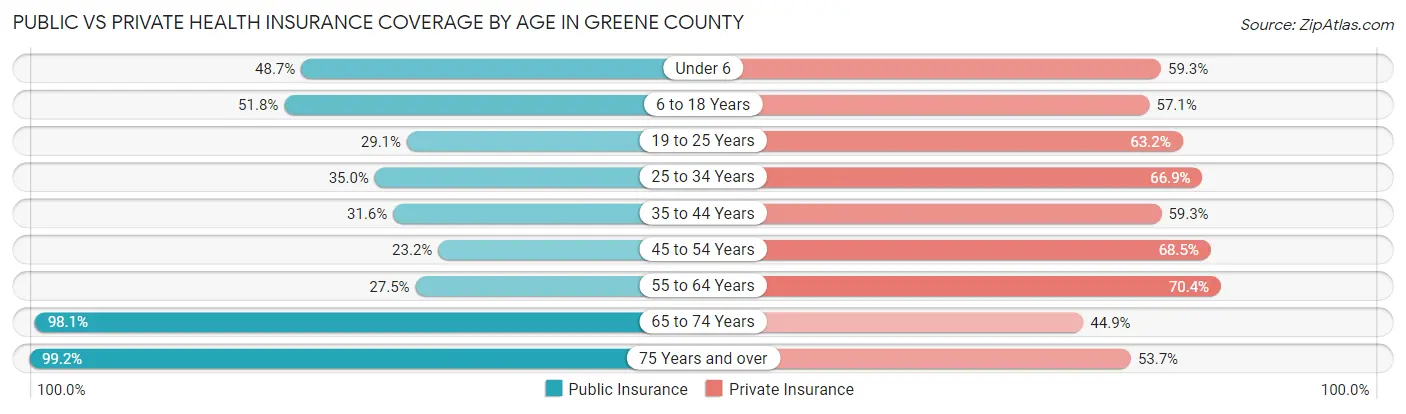
| Age Bracket | Public Insurance | Private Insurance |
| Under 6 | 368 (48.7%) | 448 (59.3%) |
| 6 to 18 Years | 997 (51.8%) | 1,099 (57.1%) |
| 19 to 25 Years | 271 (29.0%) | 590 (63.2%) |
| 25 to 34 Years | 395 (35.0%) | 755 (66.9%) |
| 35 to 44 Years | 425 (31.6%) | 798 (59.3%) |
| 45 to 54 Years | 353 (23.2%) | 1,040 (68.5%) |
| 55 to 64 Years | 507 (27.5%) | 1,299 (70.4%) |
| 65 to 74 Years | 1,306 (98.1%) | 597 (44.9%) |
| 75 Years and over | 974 (99.2%) | 527 (53.7%) |
| Total | 5,596 (47.6%) | 7,153 (60.8%) |
Disability Status by Sex by Age in Greene County
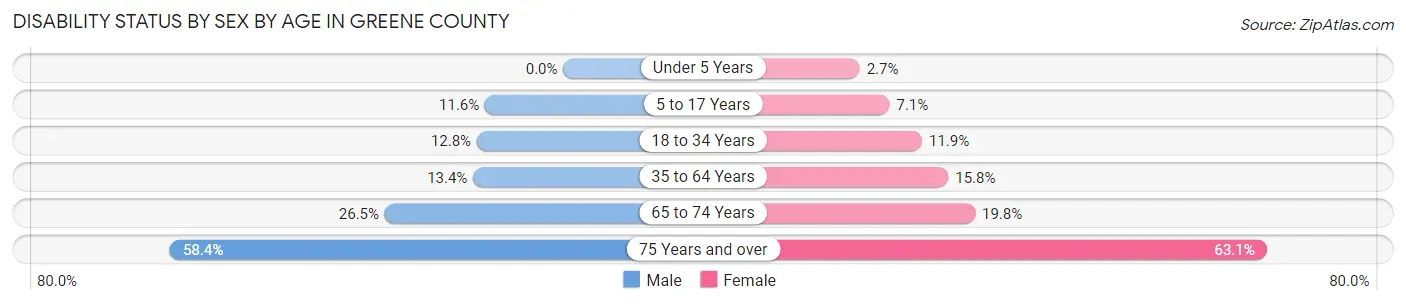
| Age Bracket | Male | Female |
| Under 5 Years | 0 (0.0%) | 8 (2.7%) |
| 5 to 17 Years | 114 (11.6%) | 70 (7.1%) |
| 18 to 34 Years | 142 (12.8%) | 125 (11.9%) |
| 35 to 64 Years | 321 (13.4%) | 366 (15.8%) |
| 65 to 74 Years | 172 (26.5%) | 135 (19.8%) |
| 75 Years and over | 243 (58.4%) | 357 (63.1%) |
Disability Class by Sex by Age in Greene County
Disability Class: Hearing Difficulty
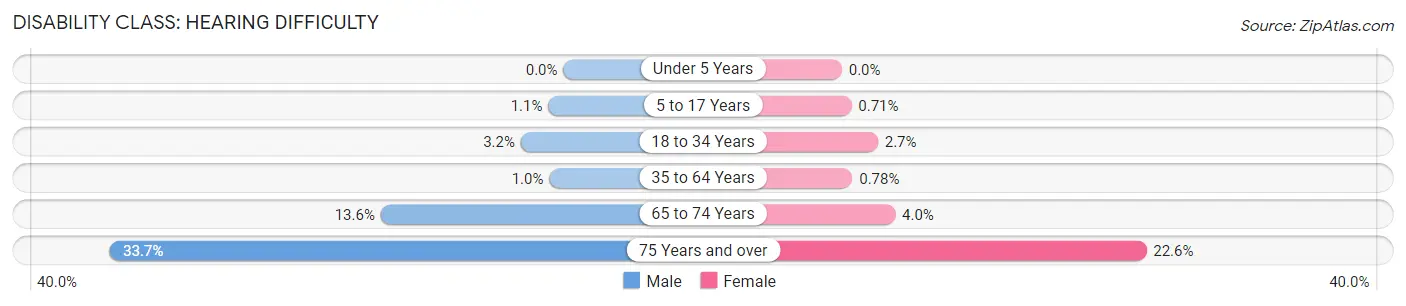
| Age Bracket | Male | Female |
| Under 5 Years | 0 (0.0%) | 0 (0.0%) |
| 5 to 17 Years | 11 (1.1%) | 7 (0.7%) |
| 18 to 34 Years | 35 (3.2%) | 28 (2.7%) |
| 35 to 64 Years | 25 (1.0%) | 18 (0.8%) |
| 65 to 74 Years | 88 (13.6%) | 27 (4.0%) |
| 75 Years and over | 140 (33.7%) | 128 (22.6%) |
Disability Class: Vision Difficulty
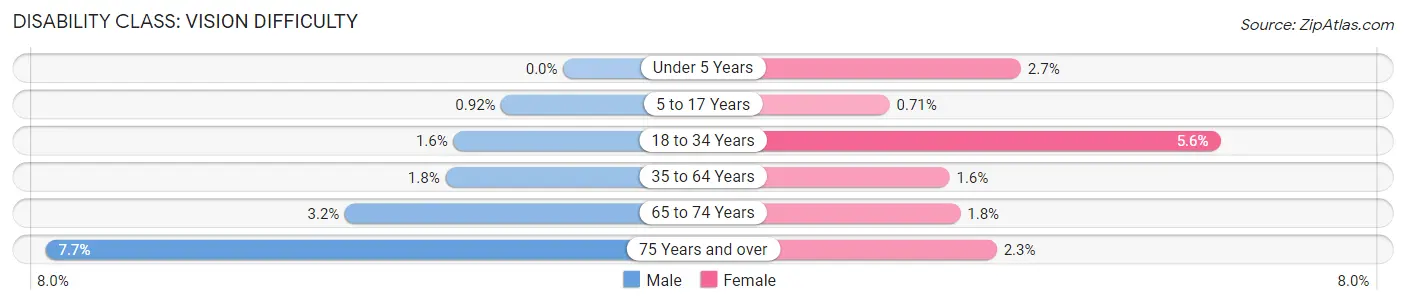
| Age Bracket | Male | Female |
| Under 5 Years | 0 (0.0%) | 8 (2.7%) |
| 5 to 17 Years | 9 (0.9%) | 7 (0.7%) |
| 18 to 34 Years | 18 (1.6%) | 59 (5.6%) |
| 35 to 64 Years | 42 (1.8%) | 37 (1.6%) |
| 65 to 74 Years | 21 (3.2%) | 12 (1.8%) |
| 75 Years and over | 32 (7.7%) | 13 (2.3%) |
Disability Class: Cognitive Difficulty
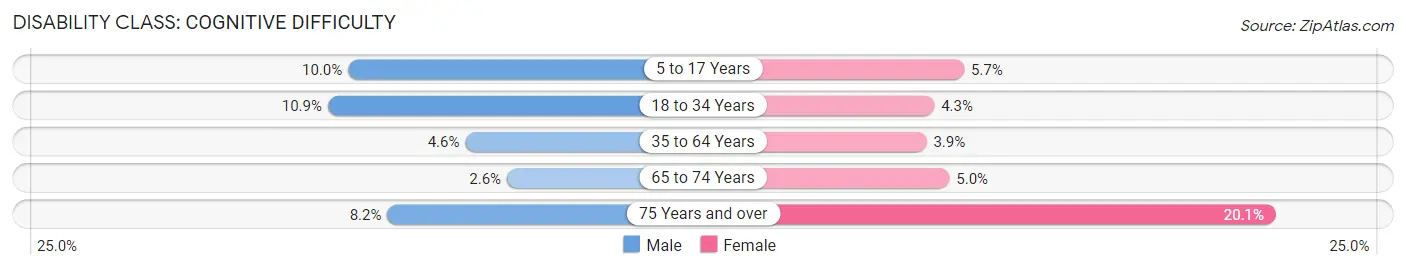
| Age Bracket | Male | Female |
| 5 to 17 Years | 98 (10.0%) | 56 (5.7%) |
| 18 to 34 Years | 121 (10.9%) | 45 (4.3%) |
| 35 to 64 Years | 109 (4.5%) | 91 (3.9%) |
| 65 to 74 Years | 17 (2.6%) | 34 (5.0%) |
| 75 Years and over | 34 (8.2%) | 114 (20.1%) |
Disability Class: Ambulatory Difficulty
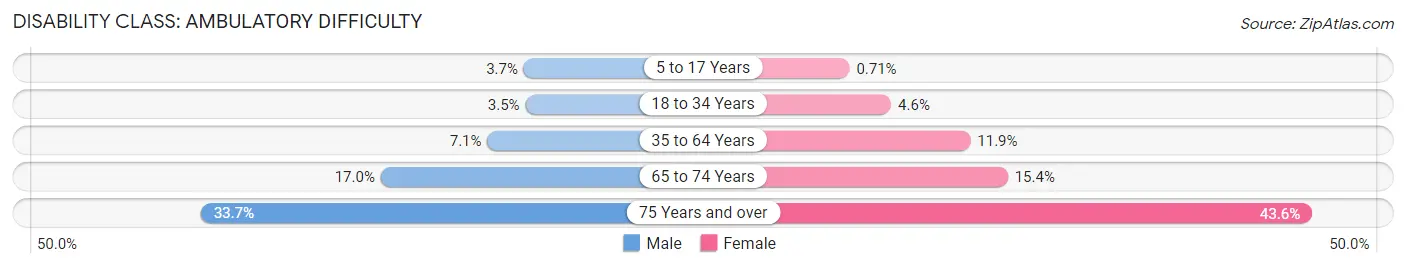
| Age Bracket | Male | Female |
| 5 to 17 Years | 36 (3.7%) | 7 (0.7%) |
| 18 to 34 Years | 39 (3.5%) | 48 (4.6%) |
| 35 to 64 Years | 169 (7.0%) | 276 (11.9%) |
| 65 to 74 Years | 110 (17.0%) | 105 (15.4%) |
| 75 Years and over | 140 (33.7%) | 247 (43.6%) |
Disability Class: Self-Care Difficulty
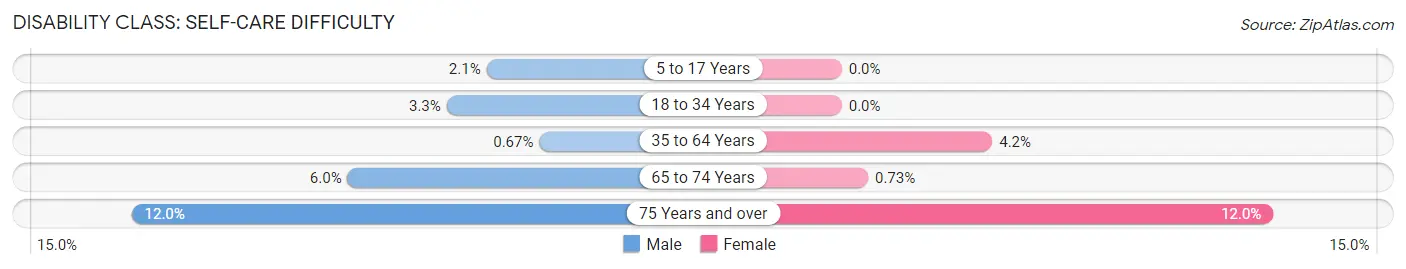
| Age Bracket | Male | Female |
| 5 to 17 Years | 21 (2.1%) | 0 (0.0%) |
| 18 to 34 Years | 36 (3.3%) | 0 (0.0%) |
| 35 to 64 Years | 16 (0.7%) | 97 (4.2%) |
| 65 to 74 Years | 39 (6.0%) | 5 (0.7%) |
| 75 Years and over | 50 (12.0%) | 68 (12.0%) |
Technology Access in Greene County
Computing Device Access in Greene County
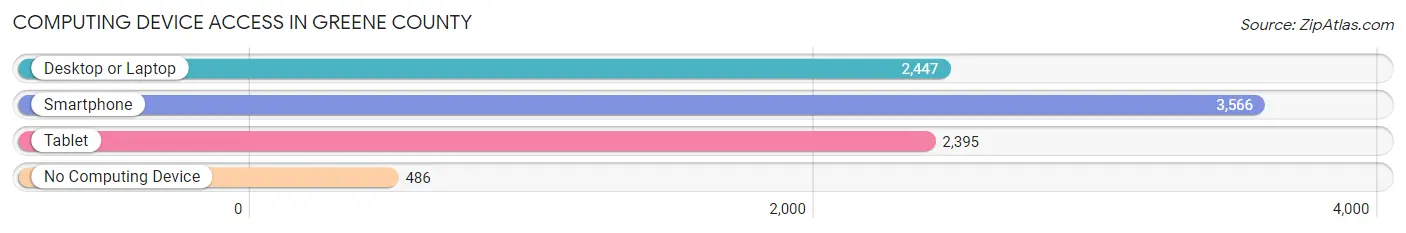
| Device Type | # Households | % Households |
| Desktop or Laptop | 2,447 | 53.9% |
| Smartphone | 3,566 | 78.5% |
| Tablet | 2,395 | 52.7% |
| No Computing Device | 486 | 10.7% |
| Total | 4,543 | 100.0% |
Internet Access in Greene County
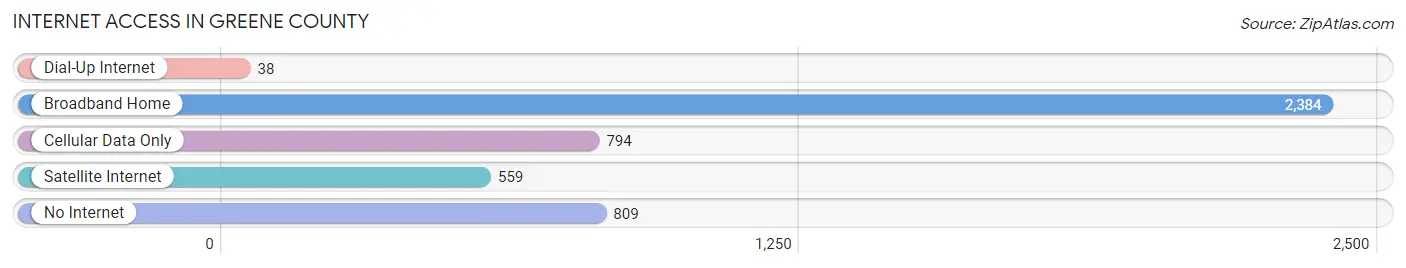
| Internet Type | # Households | % Households |
| Dial-Up Internet | 38 | 0.8% |
| Broadband Home | 2,384 | 52.5% |
| Cellular Data Only | 794 | 17.5% |
| Satellite Internet | 559 | 12.3% |
| No Internet | 809 | 17.8% |
| Total | 4,543 | 100.0% |
Greene County Summary
Greene County is located in the western part of the state of Illinois, in the United States. It is bordered by Jersey County to the north, Macoupin County to the east, Scott County to the south, and Morgan County to the west. The county seat is Carrollton, and the largest city is White Hall. The county was established in 1821 and named after General Nathanael Greene, a hero of the American Revolutionary War.
Geography
Greene County covers an area of 576 square miles, of which 574 square miles is land and 2 square miles is water. The county is located in the Central Till Plains region of Illinois, and is mostly flat with some rolling hills. The county is drained by the Macoupin Creek, which flows through the center of the county. The highest point in the county is located in the northwest corner, at an elevation of 890 feet.
The county is home to several state parks and wildlife areas, including the Apple Creek Conservation Area, the Green River State Wildlife Area, and the White Hall State Fish and Wildlife Area.
Demographics
As of the 2010 United States Census, there were 13,886 people, 5,541 households, and 3,845 families living in the county. The population density was 24.2 people per square mile. The racial makeup of the county was 97.2% White, 0.7% Black or African American, 0.2% Native American, 0.2% Asian, 0.2% from other races, and 1.7% from two or more races. 1.3% of the population were Hispanic or Latino of any race.
The median income for a household in the county was $41,945, and the median income for a family was $50,945. The per capita income for the county was $20,845. About 11.2% of families and 14.2% of the population were below the poverty line, including 19.2% of those under age 18 and 8.2% of those age 65 or over.
Economy
Greene County is largely rural, and the economy is largely based on agriculture. The county is home to several large farms, and the main crops grown in the county are corn, soybeans, and wheat. The county is also home to several small businesses, including manufacturing, retail, and service industries.
The county is home to several large employers, including the Greene County Hospital, the Greene County Sheriff's Office, and the White Hall School District. The county is also home to several small businesses, including restaurants, retail stores, and service providers.
The county is served by two major highways, Interstate 72 and U.S. Route 67. The county is also served by several smaller roads, including State Route 108, State Route 111, and State Route 159.
Conclusion
Greene County is a rural county located in the western part of the state of Illinois. The county is home to several state parks and wildlife areas, and the economy is largely based on agriculture. The county is home to several large employers, as well as small businesses, and is served by two major highways and several smaller roads.
Common Questions
What is Per Capita Income in Greene County?
Per Capita income in Greene County is $31,536.
What is the Median Family Income in Greene County?
Median Family Income in Greene County is $71,354.
What is the Median Household income in Greene County?
Median Household Income in Greene County is $58,900.
What is Income or Wage Gap in Greene County?
Income or Wage Gap in Greene County is 47.7%.
Women in Greene County earn 52.3 cents for every dollar earned by a man.
What is Family Income Deficit in Greene County?
Family Income Deficit in Greene County is $10,947.
Families that are below poverty line in Greene County earn $10,947 less on average than the poverty threshold level.
What is Inequality or Gini Index in Greene County?
Inequality or Gini Index in Greene County is 0.44.
What is the Total Population of Greene County?
Total Population of Greene County is 12,015.
What is the Total Male Population of Greene County?
Total Male Population of Greene County is 6,050.
What is the Total Female Population of Greene County?
Total Female Population of Greene County is 5,965.
What is the Ratio of Males per 100 Females in Greene County?
There are 101.42 Males per 100 Females in Greene County.
What is the Ratio of Females per 100 Males in Greene County?
There are 98.60 Females per 100 Males in Greene County.
What is the Median Population Age in Greene County?
Median Population Age in Greene County is 42.7 Years.
What is the Average Family Size in Greene County
Average Family Size in Greene County is 3.2 People.
What is the Average Household Size in Greene County
Average Household Size in Greene County is 2.6 People.
How Large is the Labor Force in Greene County?
There are 5,746 People in the Labor Forcein in Greene County.
What is the Percentage of People in the Labor Force in Greene County?
58.7% of People are in the Labor Force in Greene County.
What is the Unemployment Rate in Greene County?
Unemployment Rate in Greene County is 3.4%.