Effingham County, IL Map & Demographics
Effingham County Map
Effingham County Overview
$37,844
PER CAPITA INCOME
$89,840
AVG FAMILY INCOME
$73,181
AVG HOUSEHOLD INCOME
32.6%
WAGE / INCOME GAP [ % ]
67.4¢/ $1
WAGE / INCOME GAP [ $ ]
$11,589
FAMILY INCOME DEFICIT
0.44
INEQUALITY / GINI INDEX
34,594
TOTAL POPULATION
17,394
MALE POPULATION
17,200
FEMALE POPULATION
101.13
MALES / 100 FEMALES
98.88
FEMALES / 100 MALES
39.3
MEDIAN AGE
3.0
AVG FAMILY SIZE
2.4
AVG HOUSEHOLD SIZE
18,050
LABOR FORCE [ PEOPLE ]
66.4%
PERCENT IN LABOR FORCE
2.5%
UNEMPLOYMENT RATE
Income in Effingham County
Income Overview in Effingham County
Per Capita Income in Effingham County is $37,844, while median incomes of families and households are $89,840 and $73,181 respectively.
| Characteristic | Number | Measure |
| Per Capita Income | 34,594 | $37,844 |
| Median Family Income | 9,268 | $89,840 |
| Mean Family Income | 9,268 | $111,506 |
| Median Household Income | 14,098 | $73,181 |
| Mean Household Income | 14,098 | $93,523 |
| Income Deficit | 9,268 | $11,589 |
| Wage / Income Gap (%) | 34,594 | 32.56% |
| Wage / Income Gap ($) | 34,594 | 67.44¢ per $1 |
| Gini / Inequality Index | 34,594 | 0.44 |
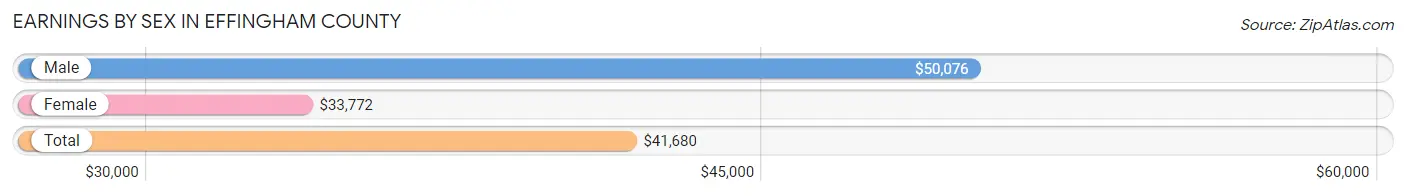
Earnings by Sex in Effingham County
Average Earnings in Effingham County are $41,680, $50,076 for men and $33,772 for women, a difference of 32.6%.
| Sex | Number | Average Earnings |
| Male | 10,027 (53.1%) | $50,076 |
| Female | 8,847 (46.9%) | $33,772 |
| Total | 18,874 (100.0%) | $41,680 |
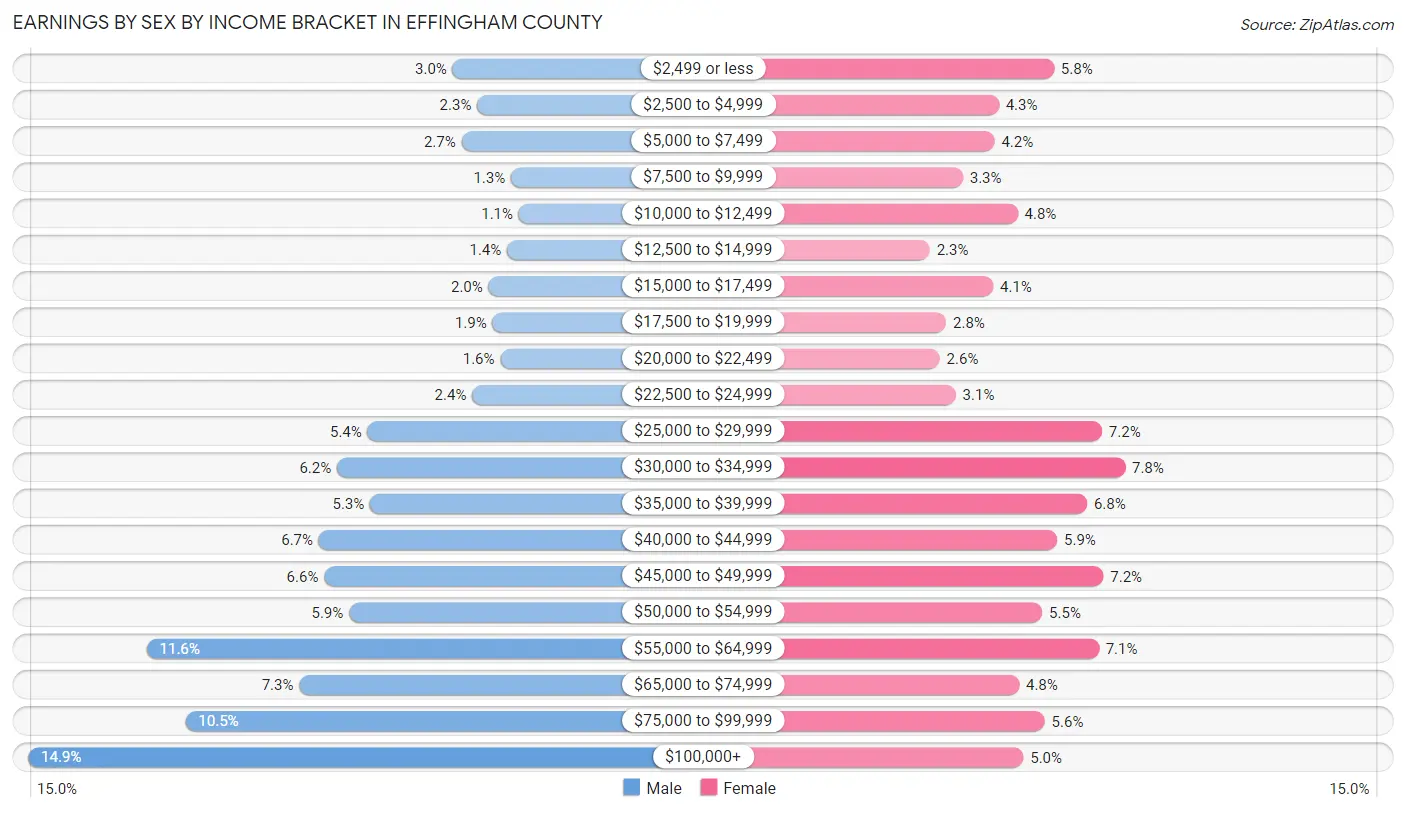
Earnings by Sex by Income Bracket in Effingham County
The most common earnings brackets in Effingham County are $100,000+ for men (1,494 | 14.9%) and $30,000 to $34,999 for women (692 | 7.8%).
| Income | Male | Female |
| $2,499 or less | 298 (3.0%) | 515 (5.8%) |
| $2,500 to $4,999 | 229 (2.3%) | 378 (4.3%) |
| $5,000 to $7,499 | 273 (2.7%) | 367 (4.2%) |
| $7,500 to $9,999 | 133 (1.3%) | 288 (3.3%) |
| $10,000 to $12,499 | 111 (1.1%) | 425 (4.8%) |
| $12,500 to $14,999 | 144 (1.4%) | 206 (2.3%) |
| $15,000 to $17,499 | 197 (2.0%) | 364 (4.1%) |
| $17,500 to $19,999 | 185 (1.8%) | 247 (2.8%) |
| $20,000 to $22,499 | 163 (1.6%) | 231 (2.6%) |
| $22,500 to $24,999 | 243 (2.4%) | 271 (3.1%) |
| $25,000 to $29,999 | 537 (5.4%) | 634 (7.2%) |
| $30,000 to $34,999 | 624 (6.2%) | 692 (7.8%) |
| $35,000 to $39,999 | 530 (5.3%) | 597 (6.8%) |
| $40,000 to $44,999 | 675 (6.7%) | 523 (5.9%) |
| $45,000 to $49,999 | 660 (6.6%) | 638 (7.2%) |
| $50,000 to $54,999 | 590 (5.9%) | 486 (5.5%) |
| $55,000 to $64,999 | 1,160 (11.6%) | 626 (7.1%) |
| $65,000 to $74,999 | 730 (7.3%) | 428 (4.8%) |
| $75,000 to $99,999 | 1,051 (10.5%) | 492 (5.6%) |
| $100,000+ | 1,494 (14.9%) | 439 (5.0%) |
| Total | 10,027 (100.0%) | 8,847 (100.0%) |
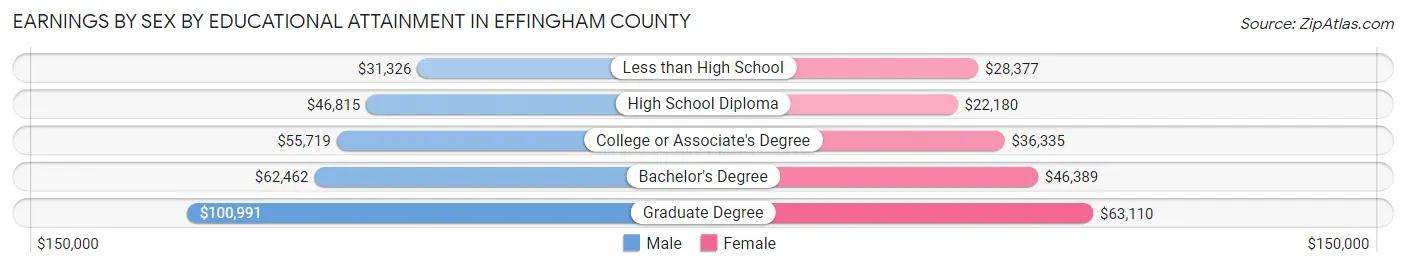
Earnings by Sex by Educational Attainment in Effingham County
Average earnings in Effingham County are $54,871 for men and $38,251 for women, a difference of 30.3%. Men with an educational attainment of graduate degree enjoy the highest average annual earnings of $100,991, while those with less than high school education earn the least with $31,326. Women with an educational attainment of graduate degree earn the most with the average annual earnings of $63,110, while those with high school diploma education have the smallest earnings of $22,180.
| Educational Attainment | Male Income | Female Income |
| Less than High School | $31,326 | $28,377 |
| High School Diploma | $46,815 | $22,180 |
| College or Associate's Degree | $55,719 | $36,335 |
| Bachelor's Degree | $62,462 | $46,389 |
| Graduate Degree | $100,991 | $63,110 |
| Total | $54,871 | $38,251 |
Family Income in Effingham County
Family Income Brackets in Effingham County
According to the Effingham County family income data, there are 2,308 families falling into the $100,000 to $149,999 income range, which is the most common income bracket and makes up 24.9% of all families. Conversely, the $10,000 to $14,999 income bracket is the least frequent group with only 102 families (1.1%) belonging to this category.
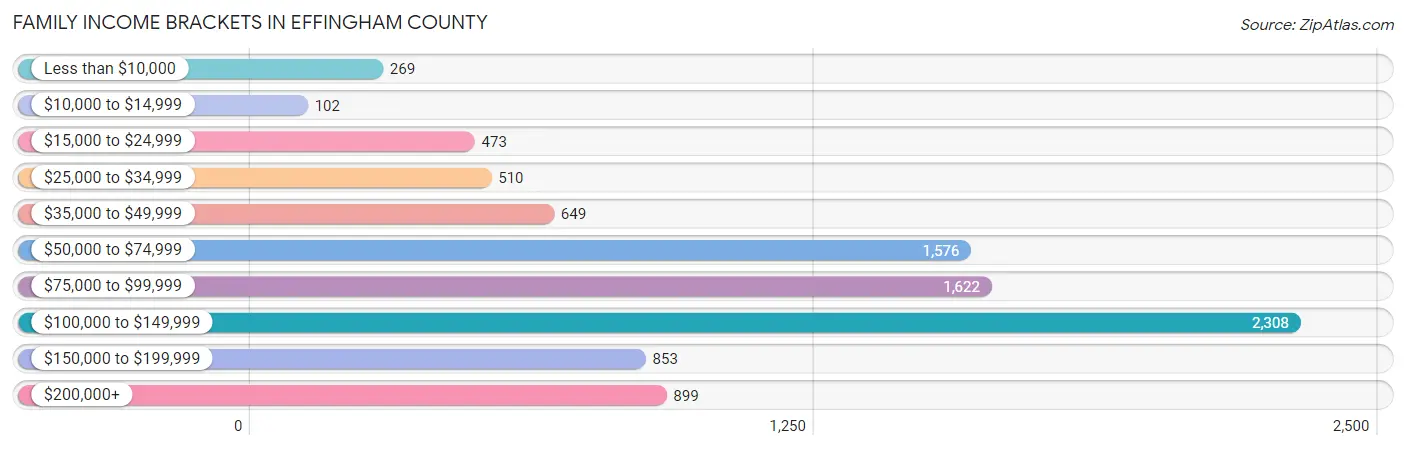
| Income Bracket | # Families | % Families |
| Less than $10,000 | 269 | 2.9% |
| $10,000 to $14,999 | 102 | 1.1% |
| $15,000 to $24,999 | 473 | 5.1% |
| $25,000 to $34,999 | 510 | 5.5% |
| $35,000 to $49,999 | 649 | 7.0% |
| $50,000 to $74,999 | 1,576 | 17.0% |
| $75,000 to $99,999 | 1,622 | 17.5% |
| $100,000 to $149,999 | 2,308 | 24.9% |
| $150,000 to $199,999 | 853 | 9.2% |
| $200,000+ | 899 | 9.7% |
Family Income by Famaliy Size in Effingham County
7+ person families (150 | 1.6%) account for the highest median family income in Effingham County with $156,250 per family, while 2-person families (4,382 | 47.3%) have the highest median income of $37,088 per family member.
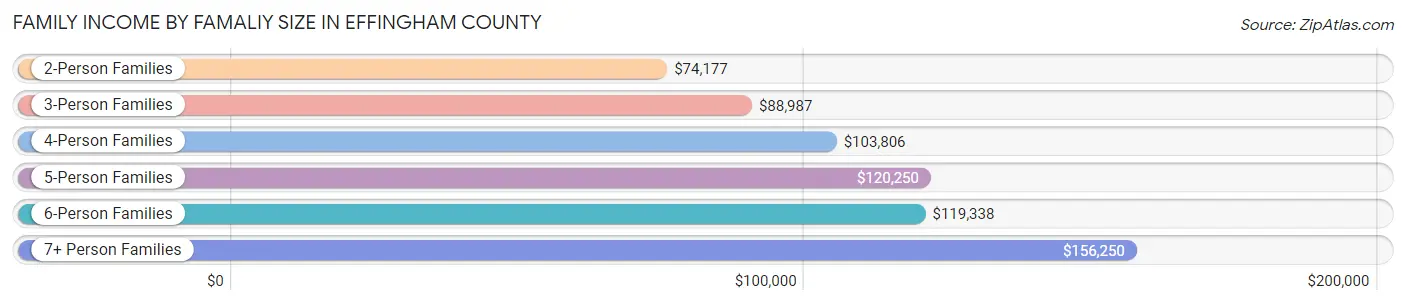
| Income Bracket | # Families | Median Income |
| 2-Person Families | 4,382 (47.3%) | $74,177 |
| 3-Person Families | 2,019 (21.8%) | $88,987 |
| 4-Person Families | 1,369 (14.8%) | $103,806 |
| 5-Person Families | 993 (10.7%) | $120,250 |
| 6-Person Families | 355 (3.8%) | $119,338 |
| 7+ Person Families | 150 (1.6%) | $156,250 |
| Total | 9,268 (100.0%) | $89,840 |
Family Income by Number of Earners in Effingham County
The median family income in Effingham County is $89,840, with families comprising 3+ earners (1,221) having the highest median family income of $128,103, while families with no earners (1,327) have the lowest median family income of $47,663, accounting for 13.2% and 14.3% of families, respectively.
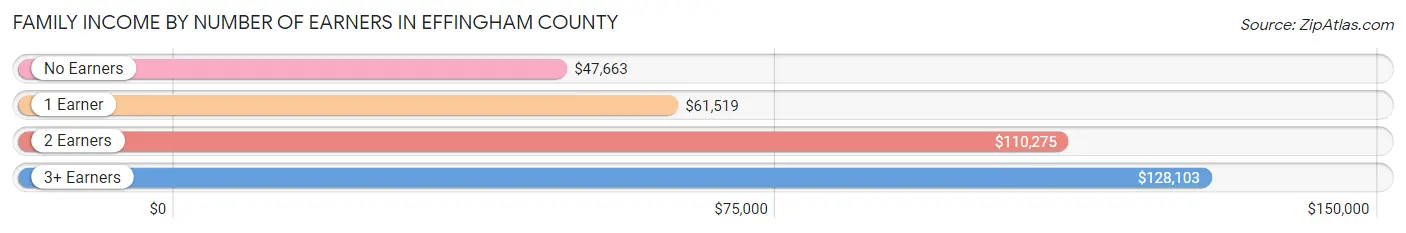
| Number of Earners | # Families | Median Income |
| No Earners | 1,327 (14.3%) | $47,663 |
| 1 Earner | 2,713 (29.3%) | $61,519 |
| 2 Earners | 4,007 (43.2%) | $110,275 |
| 3+ Earners | 1,221 (13.2%) | $128,103 |
| Total | 9,268 (100.0%) | $89,840 |
Household Income in Effingham County
Household Income Brackets in Effingham County
With 2,777 households falling in the category, the $100,000 to $149,999 income range is the most frequent in Effingham County, accounting for 19.7% of all households. In contrast, only 508 households (3.6%) fall into the $10,000 to $14,999 income bracket, making it the least populous group.
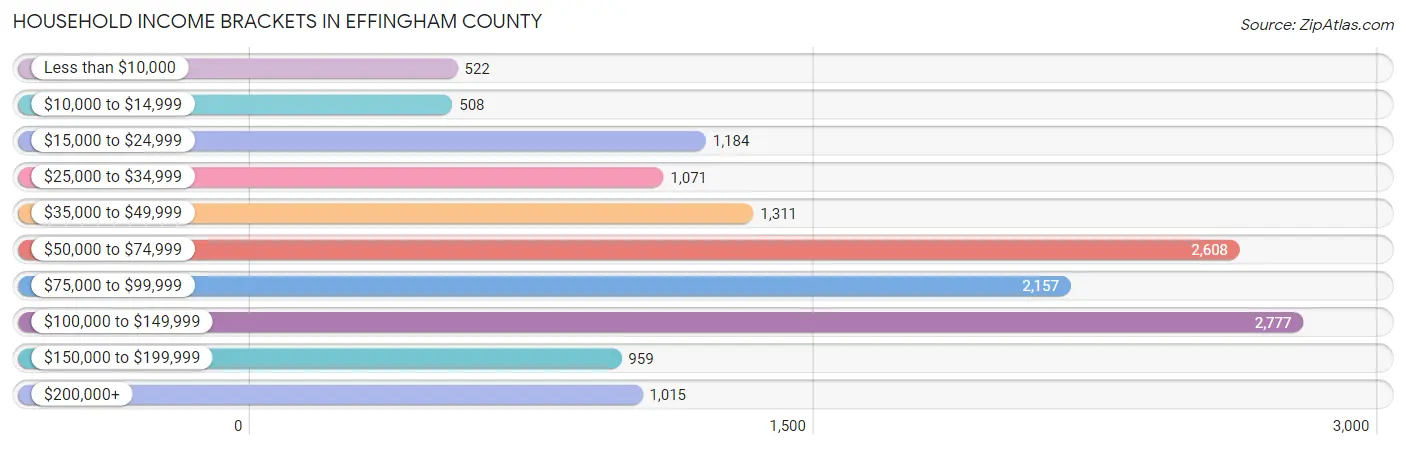
| Income Bracket | # Households | % Households |
| Less than $10,000 | 522 | 3.7% |
| $10,000 to $14,999 | 508 | 3.6% |
| $15,000 to $24,999 | 1,184 | 8.4% |
| $25,000 to $34,999 | 1,071 | 7.6% |
| $35,000 to $49,999 | 1,311 | 9.3% |
| $50,000 to $74,999 | 2,608 | 18.5% |
| $75,000 to $99,999 | 2,157 | 15.3% |
| $100,000 to $149,999 | 2,777 | 19.7% |
| $150,000 to $199,999 | 959 | 6.8% |
| $200,000+ | 1,015 | 7.2% |
Household Income by Householder Age in Effingham County
The median household income in Effingham County is $73,181, with the highest median household income of $89,330 found in the 45 to 64 years age bracket for the primary householder. A total of 5,032 households (35.7%) fall into this category. Meanwhile, the 65+ years age bracket for the primary householder has the lowest median household income of $53,731, with 3,922 households (27.8%) in this group.
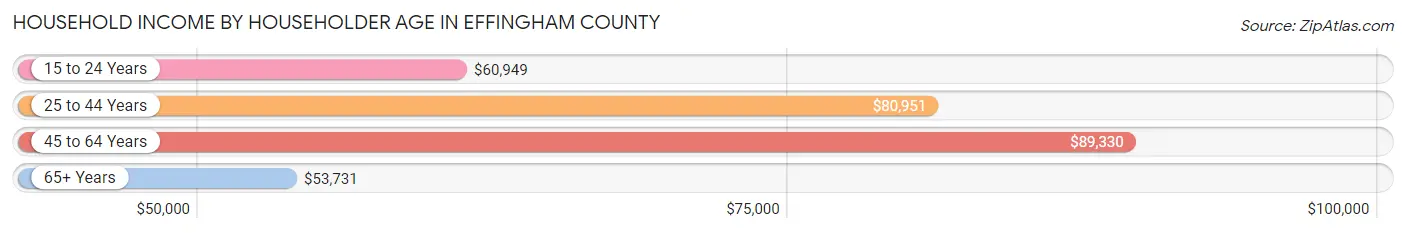
| Income Bracket | # Households | Median Income |
| 15 to 24 Years | 715 (5.1%) | $60,949 |
| 25 to 44 Years | 4,429 (31.4%) | $80,951 |
| 45 to 64 Years | 5,032 (35.7%) | $89,330 |
| 65+ Years | 3,922 (27.8%) | $53,731 |
| Total | 14,098 (100.0%) | $73,181 |
Poverty in Effingham County
Income Below Poverty by Sex and Age in Effingham County
With 8.6% poverty level for males and 13.1% for females among the residents of Effingham County, under 5 year old males and under 5 year old females are the most vulnerable to poverty, with 209 males (18.8%) and 284 females (25.8%) in their respective age groups living below the poverty level.
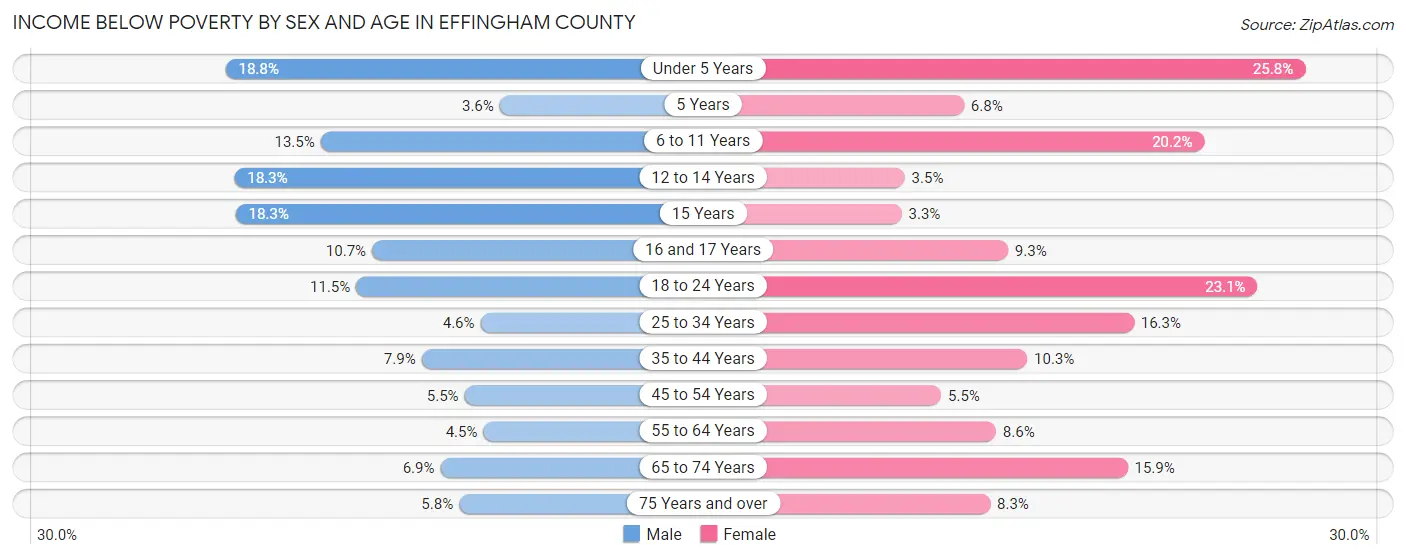
| Age Bracket | Male | Female |
| Under 5 Years | 209 (18.8%) | 284 (25.8%) |
| 5 Years | 7 (3.5%) | 10 (6.8%) |
| 6 to 11 Years | 175 (13.5%) | 287 (20.2%) |
| 12 to 14 Years | 153 (18.3%) | 22 (3.5%) |
| 15 Years | 50 (18.2%) | 8 (3.3%) |
| 16 and 17 Years | 50 (10.7%) | 36 (9.2%) |
| 18 to 24 Years | 154 (11.5%) | 289 (23.1%) |
| 25 to 34 Years | 108 (4.6%) | 354 (16.3%) |
| 35 to 44 Years | 169 (7.9%) | 201 (10.3%) |
| 45 to 54 Years | 110 (5.5%) | 107 (5.5%) |
| 55 to 64 Years | 110 (4.5%) | 212 (8.6%) |
| 65 to 74 Years | 116 (6.9%) | 285 (15.9%) |
| 75 Years and over | 60 (5.8%) | 114 (8.3%) |
| Total | 1,471 (8.6%) | 2,209 (13.1%) |
Income Above Poverty by Sex and Age in Effingham County
According to the poverty statistics in Effingham County, males aged 5 years and females aged 15 years are the age groups that are most secure financially, with 96.5% of males and 96.7% of females in these age groups living above the poverty line.
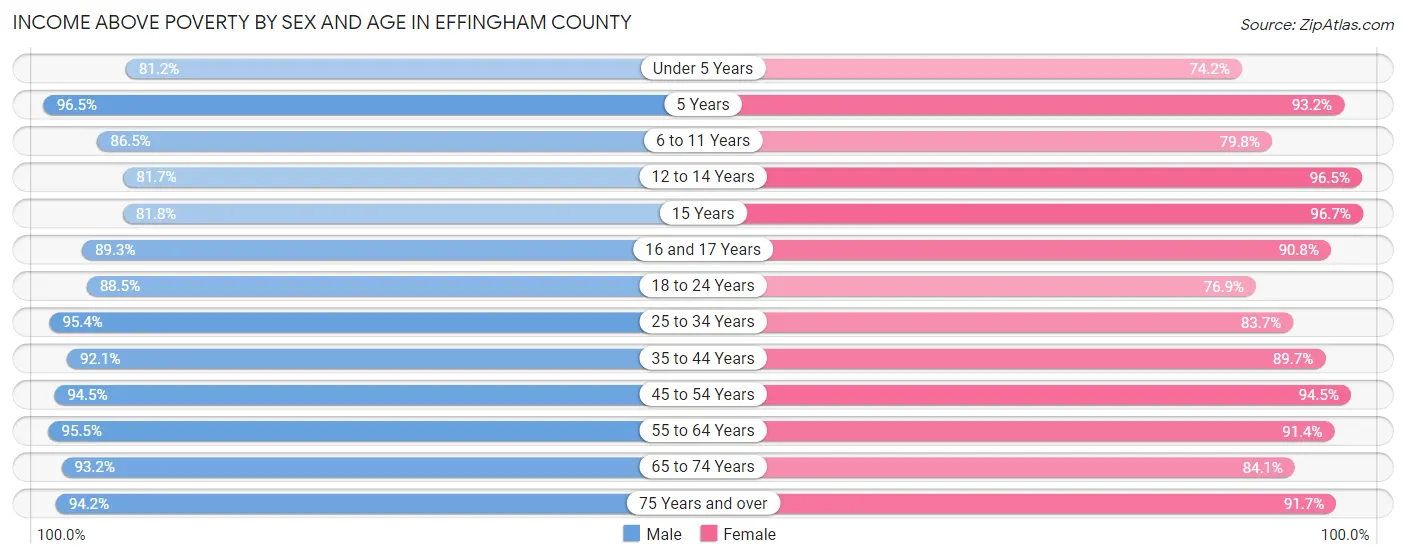
| Age Bracket | Male | Female |
| Under 5 Years | 902 (81.2%) | 817 (74.2%) |
| 5 Years | 190 (96.5%) | 137 (93.2%) |
| 6 to 11 Years | 1,119 (86.5%) | 1,135 (79.8%) |
| 12 to 14 Years | 682 (81.7%) | 606 (96.5%) |
| 15 Years | 224 (81.8%) | 232 (96.7%) |
| 16 and 17 Years | 419 (89.3%) | 353 (90.7%) |
| 18 to 24 Years | 1,181 (88.5%) | 960 (76.9%) |
| 25 to 34 Years | 2,232 (95.4%) | 1,823 (83.7%) |
| 35 to 44 Years | 1,970 (92.1%) | 1,747 (89.7%) |
| 45 to 54 Years | 1,885 (94.5%) | 1,828 (94.5%) |
| 55 to 64 Years | 2,357 (95.5%) | 2,260 (91.4%) |
| 65 to 74 Years | 1,577 (93.1%) | 1,506 (84.1%) |
| 75 Years and over | 972 (94.2%) | 1,266 (91.7%) |
| Total | 15,710 (91.4%) | 14,670 (86.9%) |
Income Below Poverty Among Married-Couple Families in Effingham County
The poverty statistics for married-couple families in Effingham County show that 3.4% or 252 of the total 7,391 families live below the poverty line. Families with 5 or more children have the highest poverty rate of 8.7%, comprising of 4 families. On the other hand, families with no children have the lowest poverty rate of 2.8%, which includes 119 families.
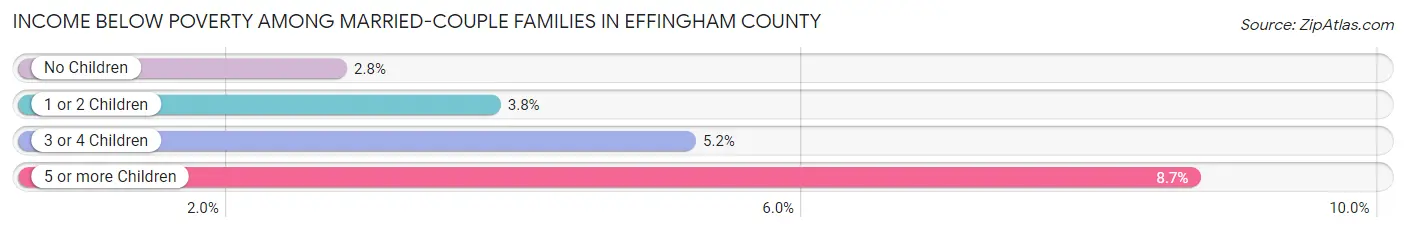
| Children | Above Poverty | Below Poverty |
| No Children | 4,185 (97.2%) | 119 (2.8%) |
| 1 or 2 Children | 2,035 (96.2%) | 81 (3.8%) |
| 3 or 4 Children | 877 (94.8%) | 48 (5.2%) |
| 5 or more Children | 42 (91.3%) | 4 (8.7%) |
| Total | 7,139 (96.6%) | 252 (3.4%) |
Income Below Poverty Among Single-Parent Households in Effingham County
According to the poverty data in Effingham County, 16.9% or 122 single-father households and 26.7% or 308 single-mother households are living below the poverty line. Among single-father households, those with 5 or more children have the highest poverty rate, with 11 households (91.7%) experiencing poverty. Likewise, among single-mother households, those with 5 or more children have the highest poverty rate, with 37 households (100.0%) falling below the poverty line.
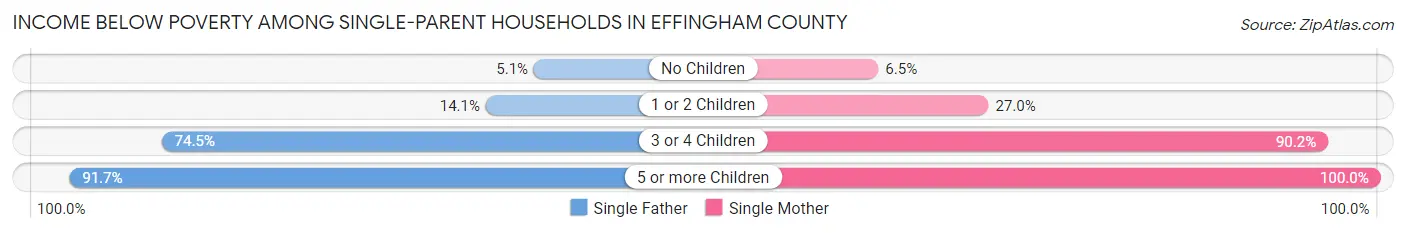
| Children | Single Father | Single Mother |
| No Children | 10 (5.1%) | 30 (6.5%) |
| 1 or 2 Children | 66 (14.1%) | 149 (27.0%) |
| 3 or 4 Children | 35 (74.5%) | 92 (90.2%) |
| 5 or more Children | 11 (91.7%) | 37 (100.0%) |
| Total | 122 (16.9%) | 308 (26.7%) |
Income Below Poverty Among Married-Couple vs Single-Parent Households in Effingham County
The poverty data for Effingham County shows that 252 of the married-couple family households (3.4%) and 430 of the single-parent households (22.9%) are living below the poverty level. Within the married-couple family households, those with 5 or more children have the highest poverty rate, with 4 households (8.7%) falling below the poverty line. Among the single-parent households, those with 5 or more children have the highest poverty rate, with 48 household (98.0%) living below poverty.
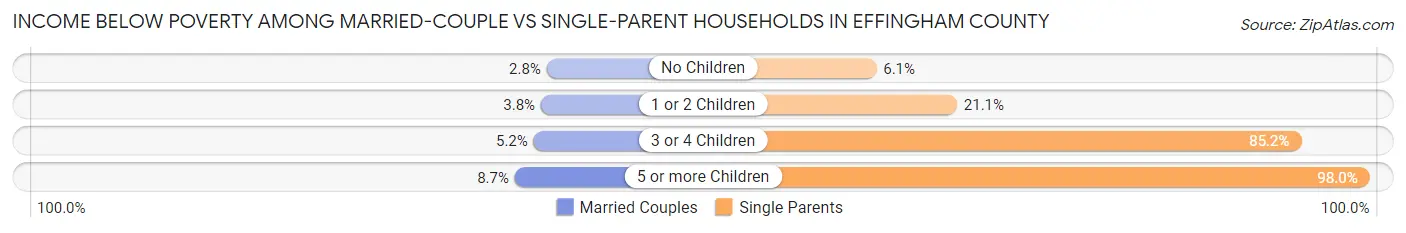
| Children | Married-Couple Families | Single-Parent Households |
| No Children | 119 (2.8%) | 40 (6.1%) |
| 1 or 2 Children | 81 (3.8%) | 215 (21.1%) |
| 3 or 4 Children | 48 (5.2%) | 127 (85.2%) |
| 5 or more Children | 4 (8.7%) | 48 (98.0%) |
| Total | 252 (3.4%) | 430 (22.9%) |
Race in Effingham County
The most populous races in Effingham County are White / Caucasian (33,404 | 96.6%), Hispanic or Latino (772 | 2.2%), and Two or more Races (526 | 1.5%).
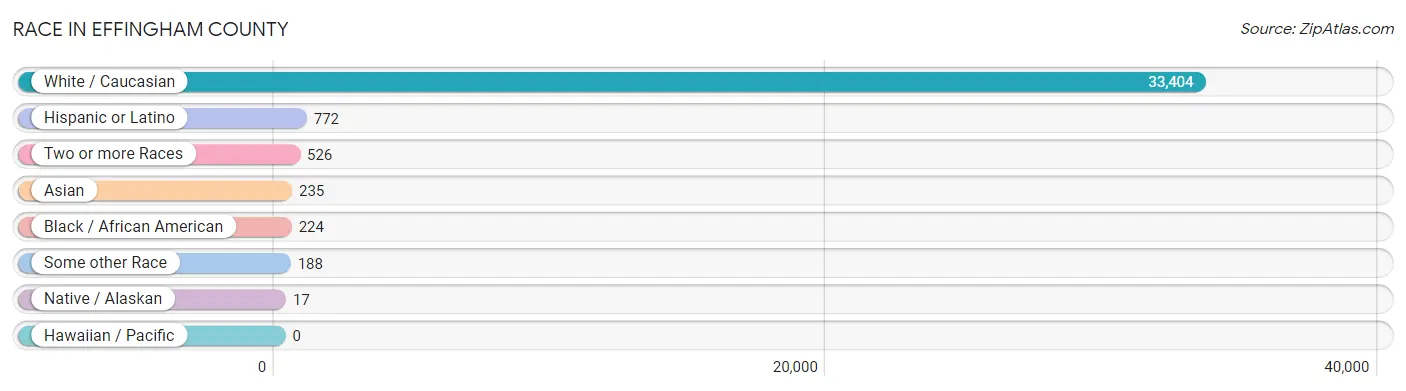
| Race | # Population | % Population |
| Asian | 235 | 0.7% |
| Black / African American | 224 | 0.6% |
| Hawaiian / Pacific | 0 | 0.0% |
| Hispanic or Latino | 772 | 2.2% |
| Native / Alaskan | 17 | 0.1% |
| White / Caucasian | 33,404 | 96.6% |
| Two or more Races | 526 | 1.5% |
| Some other Race | 188 | 0.5% |
| Total | 34,594 | 100.0% |
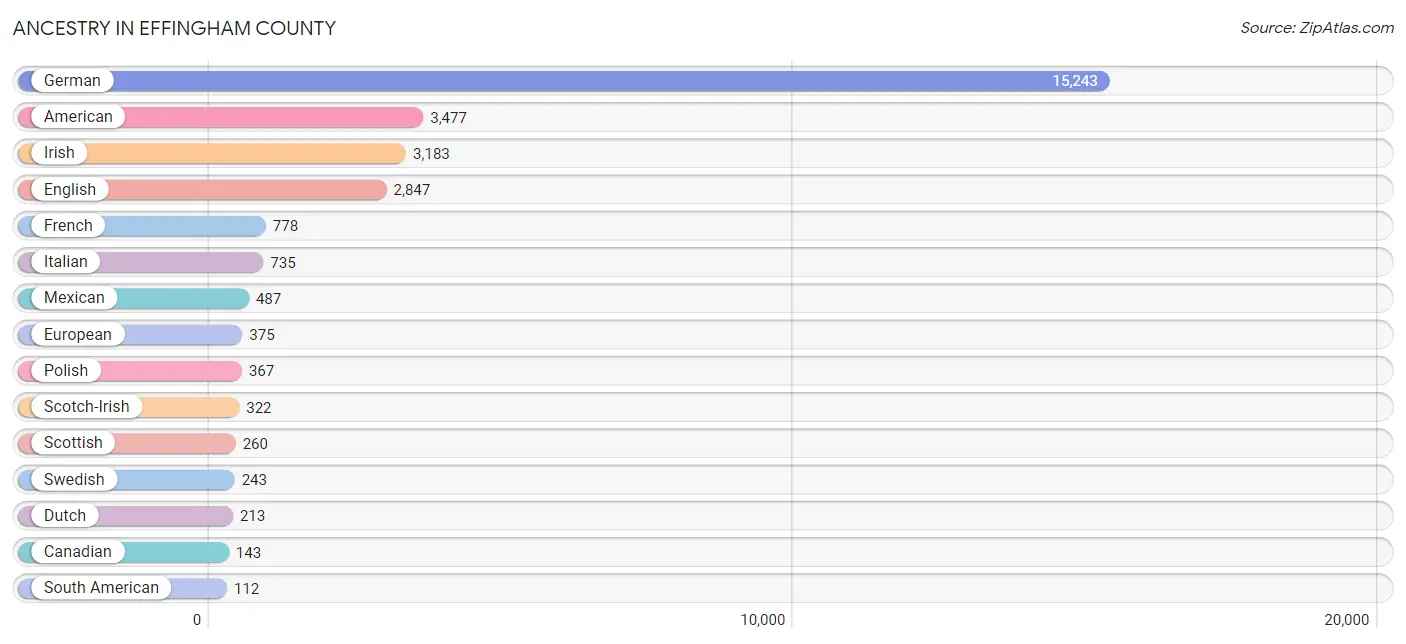
Ancestry in Effingham County
The most populous ancestries reported in Effingham County are German (15,243 | 44.1%), American (3,477 | 10.1%), Irish (3,183 | 9.2%), English (2,847 | 8.2%), and French (778 | 2.2%), together accounting for 73.8% of all Effingham County residents.
| Ancestry | # Population | % Population |
| African | 1 | 0.0% |
| American | 3,477 | 10.1% |
| Arab | 28 | 0.1% |
| Australian | 1 | 0.0% |
| Austrian | 4 | 0.0% |
| Belgian | 20 | 0.1% |
| Bhutanese | 7 | 0.0% |
| Blackfeet | 9 | 0.0% |
| British | 79 | 0.2% |
| Burmese | 41 | 0.1% |
| Canadian | 143 | 0.4% |
| Celtic | 22 | 0.1% |
| Central American | 15 | 0.0% |
| Cherokee | 55 | 0.2% |
| Croatian | 8 | 0.0% |
| Cuban | 1 | 0.0% |
| Czech | 7 | 0.0% |
| Czechoslovakian | 9 | 0.0% |
| Danish | 48 | 0.1% |
| Dutch | 213 | 0.6% |
| Eastern European | 28 | 0.1% |
| English | 2,847 | 8.2% |
| European | 375 | 1.1% |
| Finnish | 53 | 0.2% |
| French | 778 | 2.2% |
| French Canadian | 44 | 0.1% |
| German | 15,243 | 44.1% |
| Greek | 92 | 0.3% |
| Guatemalan | 15 | 0.0% |
| Hungarian | 57 | 0.2% |
| Indian (Asian) | 44 | 0.1% |
| Irish | 3,183 | 9.2% |
| Italian | 735 | 2.1% |
| Korean | 91 | 0.3% |
| Lithuanian | 17 | 0.1% |
| Mexican | 487 | 1.4% |
| Native Hawaiian | 14 | 0.0% |
| Norwegian | 107 | 0.3% |
| Pakistani | 16 | 0.1% |
| Pennsylvania German | 42 | 0.1% |
| Polish | 367 | 1.1% |
| Portuguese | 19 | 0.1% |
| Puerto Rican | 50 | 0.1% |
| Romanian | 68 | 0.2% |
| Russian | 3 | 0.0% |
| Scandinavian | 54 | 0.2% |
| Scotch-Irish | 322 | 0.9% |
| Scottish | 260 | 0.7% |
| Serbian | 13 | 0.0% |
| Sioux | 3 | 0.0% |
| Slavic | 14 | 0.0% |
| Slovene | 32 | 0.1% |
| South American | 112 | 0.3% |
| Sri Lankan | 8 | 0.0% |
| Subsaharan African | 1 | 0.0% |
| Swedish | 243 | 0.7% |
| Swiss | 81 | 0.2% |
| Thai | 77 | 0.2% |
| Venezuelan | 112 | 0.3% |
| Vietnamese | 24 | 0.1% |
| Welsh | 84 | 0.2% | View All 61 Rows |
Immigrants in Effingham County
The most numerous immigrant groups reported in Effingham County came from Latin America (392 | 1.1%), Central America (368 | 1.1%), Mexico (362 | 1.1%), Asia (202 | 0.6%), and Europe (126 | 0.4%), together accounting for 4.2% of all Effingham County residents.
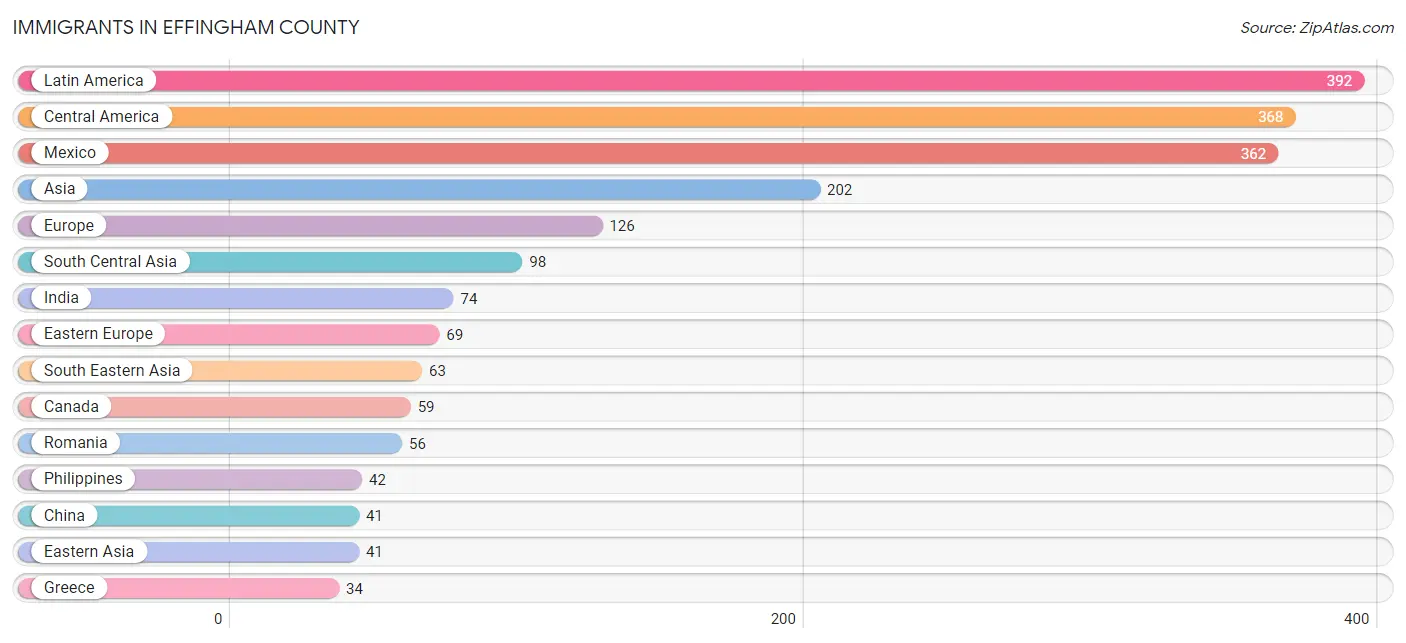
| Immigration Origin | # Population | % Population |
| Africa | 11 | 0.0% |
| Asia | 202 | 0.6% |
| Bangladesh | 24 | 0.1% |
| Canada | 59 | 0.2% |
| Central America | 368 | 1.1% |
| China | 41 | 0.1% |
| Eastern Africa | 11 | 0.0% |
| Eastern Asia | 41 | 0.1% |
| Eastern Europe | 69 | 0.2% |
| Ethiopia | 11 | 0.0% |
| Europe | 126 | 0.4% |
| Germany | 11 | 0.0% |
| Greece | 34 | 0.1% |
| Honduras | 6 | 0.0% |
| Hong Kong | 7 | 0.0% |
| India | 74 | 0.2% |
| Latin America | 392 | 1.1% |
| Mexico | 362 | 1.1% |
| Northern Europe | 12 | 0.0% |
| Philippines | 42 | 0.1% |
| Romania | 56 | 0.2% |
| South America | 24 | 0.1% |
| South Central Asia | 98 | 0.3% |
| South Eastern Asia | 63 | 0.2% |
| Southern Europe | 34 | 0.1% |
| Thailand | 13 | 0.0% |
| Venezuela | 24 | 0.1% |
| Vietnam | 8 | 0.0% |
| Western Europe | 11 | 0.0% | View All 29 Rows |
Sex and Age in Effingham County
Sex and Age in Effingham County
The most populous age groups in Effingham County are 55 to 59 Years (1,303 | 7.5%) for men and 60 to 64 Years (1,262 | 7.3%) for women.
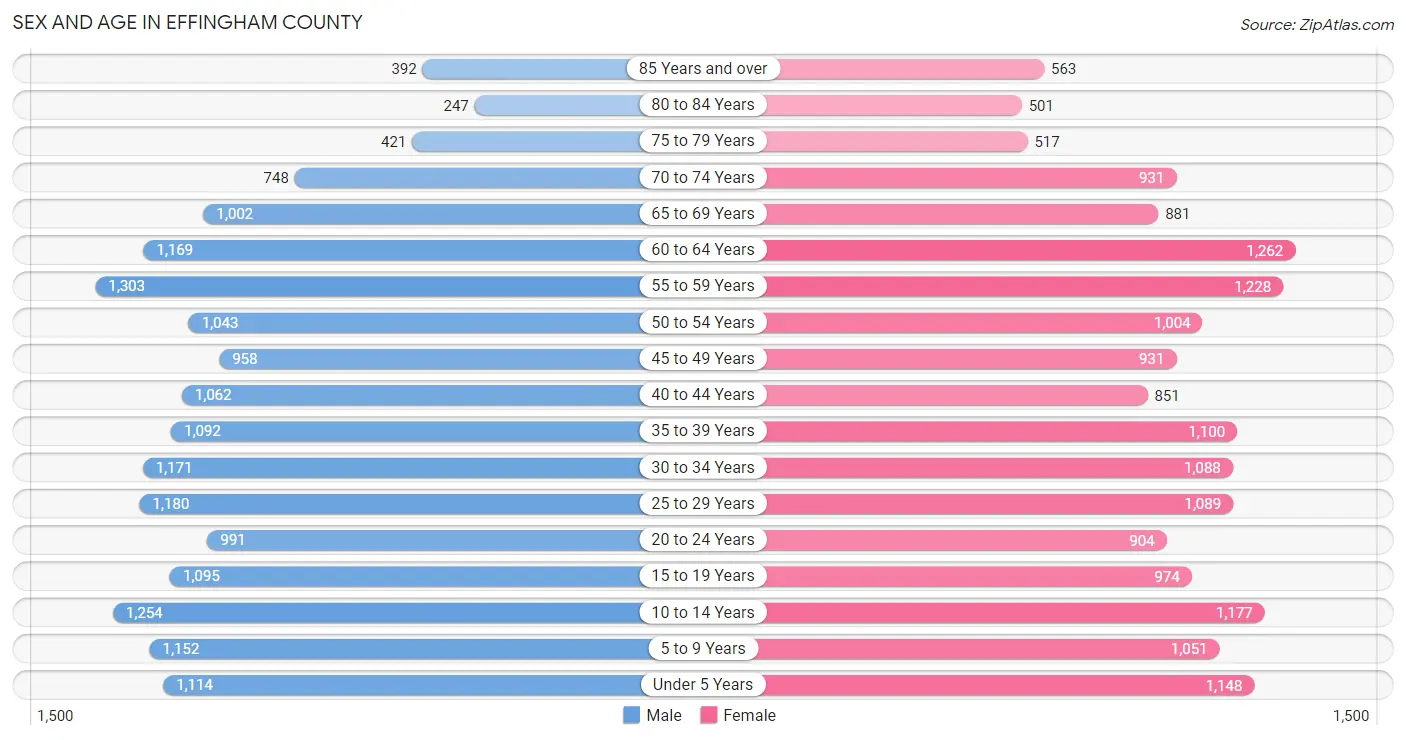
| Age Bracket | Male | Female |
| Under 5 Years | 1,114 (6.4%) | 1,148 (6.7%) |
| 5 to 9 Years | 1,152 (6.6%) | 1,051 (6.1%) |
| 10 to 14 Years | 1,254 (7.2%) | 1,177 (6.8%) |
| 15 to 19 Years | 1,095 (6.3%) | 974 (5.7%) |
| 20 to 24 Years | 991 (5.7%) | 904 (5.3%) |
| 25 to 29 Years | 1,180 (6.8%) | 1,089 (6.3%) |
| 30 to 34 Years | 1,171 (6.7%) | 1,088 (6.3%) |
| 35 to 39 Years | 1,092 (6.3%) | 1,100 (6.4%) |
| 40 to 44 Years | 1,062 (6.1%) | 851 (5.0%) |
| 45 to 49 Years | 958 (5.5%) | 931 (5.4%) |
| 50 to 54 Years | 1,043 (6.0%) | 1,004 (5.8%) |
| 55 to 59 Years | 1,303 (7.5%) | 1,228 (7.1%) |
| 60 to 64 Years | 1,169 (6.7%) | 1,262 (7.3%) |
| 65 to 69 Years | 1,002 (5.8%) | 881 (5.1%) |
| 70 to 74 Years | 748 (4.3%) | 931 (5.4%) |
| 75 to 79 Years | 421 (2.4%) | 517 (3.0%) |
| 80 to 84 Years | 247 (1.4%) | 501 (2.9%) |
| 85 Years and over | 392 (2.2%) | 563 (3.3%) |
| Total | 17,394 (100.0%) | 17,200 (100.0%) |
Families and Households in Effingham County
Median Family Size in Effingham County
The median family size in Effingham County is 2.98 persons per family, with married-couple families (7,391 | 79.7%) accounting for the largest median family size of 3.08 persons per family. On the other hand, single male/father families (722 | 7.8%) represent the smallest median family size with 2.50 persons per family.
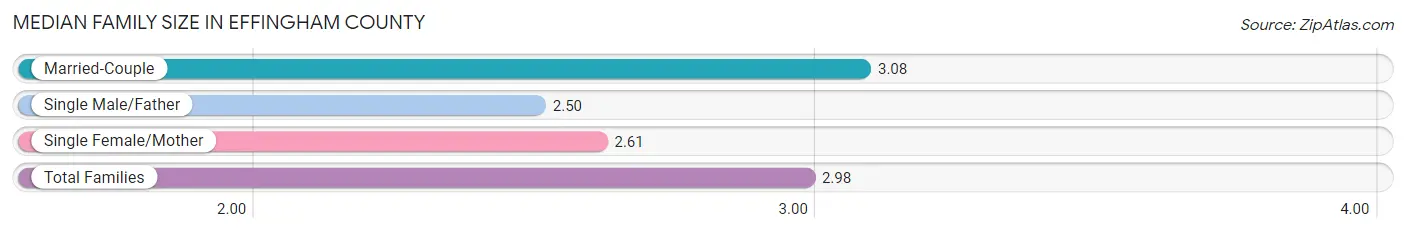
| Family Type | # Families | Family Size |
| Married-Couple | 7,391 (79.7%) | 3.08 |
| Single Male/Father | 722 (7.8%) | 2.50 |
| Single Female/Mother | 1,155 (12.5%) | 2.61 |
| Total Families | 9,268 (100.0%) | 2.98 |
Median Household Size in Effingham County
The median household size in Effingham County is 2.42 persons per household, with married-couple households (7,391 | 52.4%) accounting for the largest median household size of 3.1 persons per household. non-family households (4,830 | 34.3%) represent the smallest median household size with 1.22 persons per household.
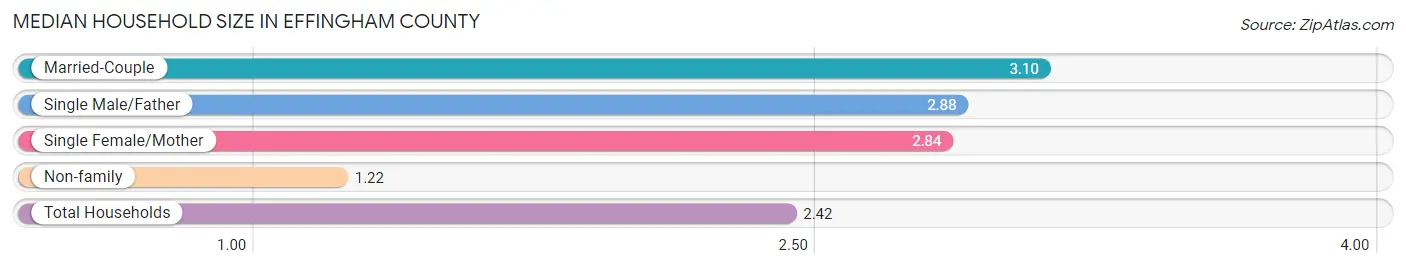
| Household Type | # Households | Household Size |
| Married-Couple | 7,391 (52.4%) | 3.10 |
| Single Male/Father | 722 (5.1%) | 2.88 |
| Single Female/Mother | 1,155 (8.2%) | 2.84 |
| Non-family | 4,830 (34.3%) | 1.22 |
| Total Households | 14,098 (100.0%) | 2.42 |
Household Size by Marriage Status in Effingham County
Out of a total of 14,098 households in Effingham County, 9,268 (65.7%) are family households, while 4,830 (34.3%) are nonfamily households. The most numerous type of family households are 2-person households, comprising 4,169, and the most common type of nonfamily households are 1-person households, comprising 3,875.
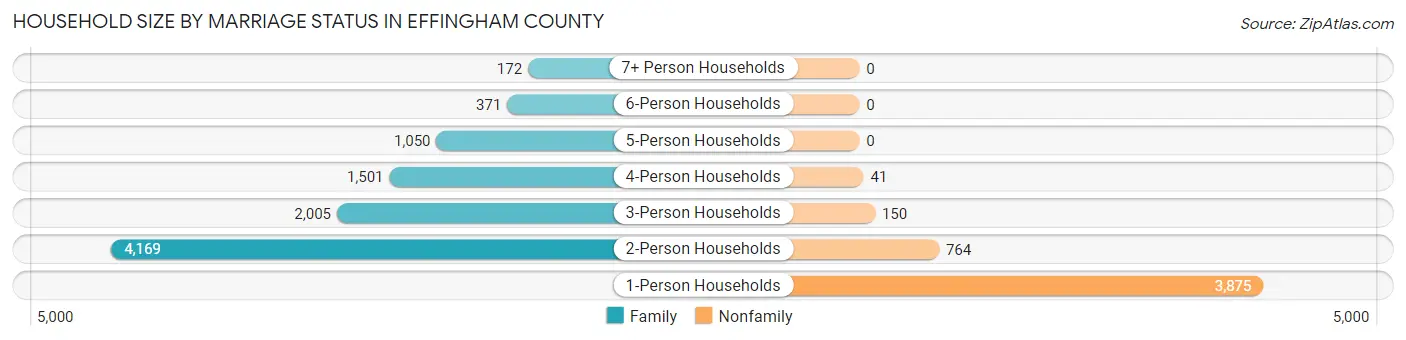
| Household Size | Family Households | Nonfamily Households |
| 1-Person Households | - | 3,875 (27.5%) |
| 2-Person Households | 4,169 (29.6%) | 764 (5.4%) |
| 3-Person Households | 2,005 (14.2%) | 150 (1.1%) |
| 4-Person Households | 1,501 (10.6%) | 41 (0.3%) |
| 5-Person Households | 1,050 (7.4%) | 0 (0.0%) |
| 6-Person Households | 371 (2.6%) | 0 (0.0%) |
| 7+ Person Households | 172 (1.2%) | 0 (0.0%) |
| Total | 9,268 (65.7%) | 4,830 (34.3%) |
Female Fertility in Effingham County
Fertility by Age in Effingham County
Average fertility rate in Effingham County is 74.0 births per 1,000 women. Women in the age bracket of 20 to 34 years have the highest fertility rate with 138.0 births per 1,000 women. Women in the age bracket of 20 to 34 years acount for 80.5% of all women with births.
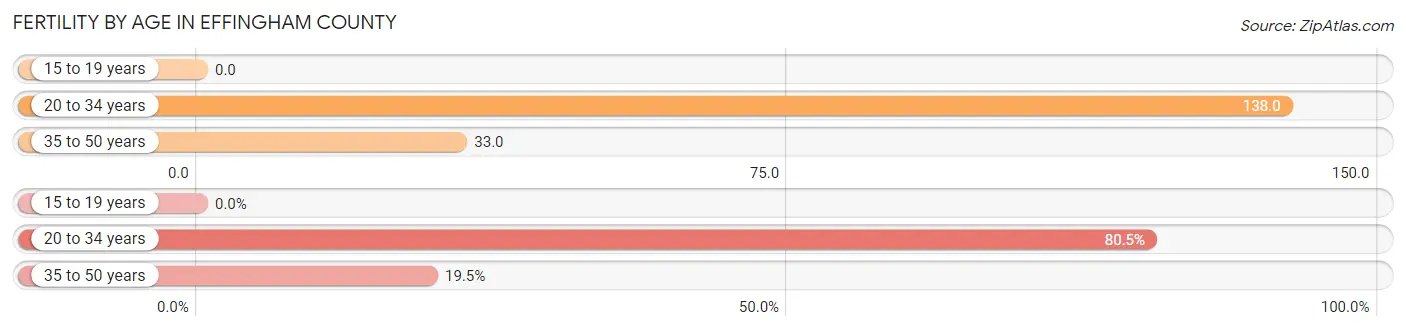
| Age Bracket | Women with Births | Births / 1,000 Women |
| 15 to 19 years | 0 (0.0%) | 0.0 |
| 20 to 34 years | 425 (80.5%) | 138.0 |
| 35 to 50 years | 103 (19.5%) | 33.0 |
| Total | 528 (100.0%) | 74.0 |
Fertility by Age by Marriage Status in Effingham County
76.9% of women with births (528) in Effingham County are married. The highest percentage of unmarried women with births falls into 20 to 34 years age bracket with 28.7% of them unmarried at the time of birth, while the lowest percentage of unmarried women with births belong to 35 to 50 years age bracket with 0.0% of them unmarried.
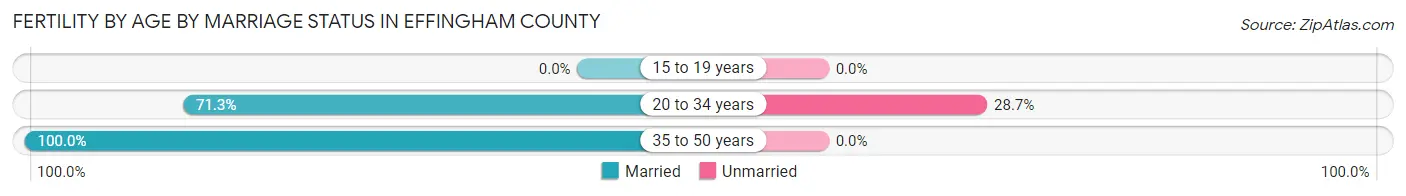
| Age Bracket | Married | Unmarried |
| 15 to 19 years | 0 (0.0%) | 0 (0.0%) |
| 20 to 34 years | 303 (71.3%) | 122 (28.7%) |
| 35 to 50 years | 103 (100.0%) | 0 (0.0%) |
| Total | 406 (76.9%) | 122 (23.1%) |
Fertility by Education in Effingham County
Average fertility rate in Effingham County is 74.0 births per 1,000 women. Women with the education attainment of bachelor's degree have the highest fertility rate of 136.0 births per 1,000 women, while women with the education attainment of high school diploma have the lowest fertility at 37.0 births per 1,000 women. Women with the education attainment of bachelor's degree represent 37.1% of all women with births.
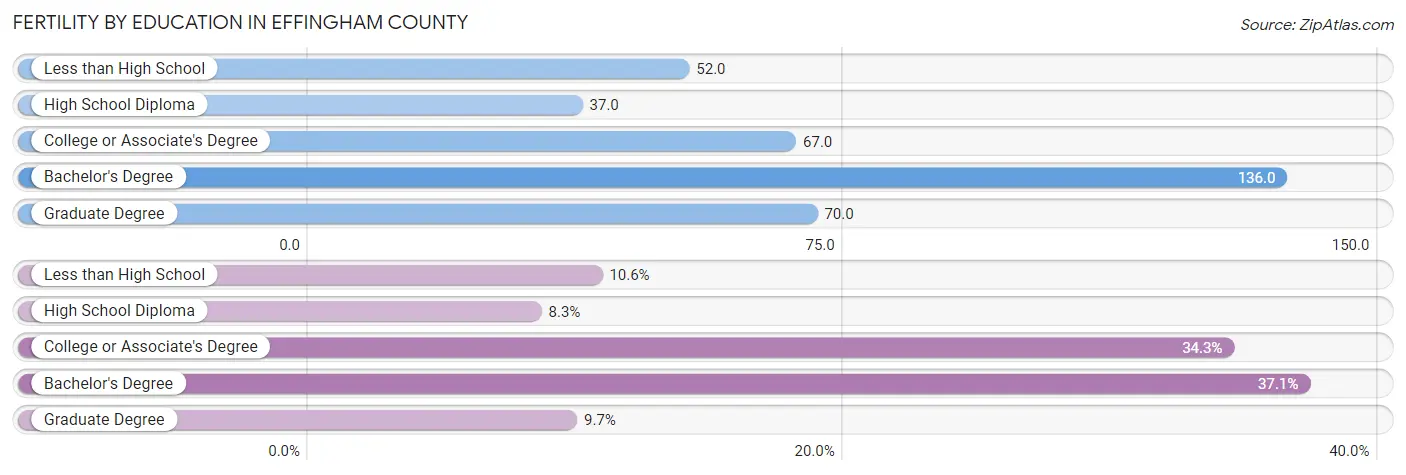
| Educational Attainment | Women with Births | Births / 1,000 Women |
| Less than High School | 56 (10.6%) | 52.0 |
| High School Diploma | 44 (8.3%) | 37.0 |
| College or Associate's Degree | 181 (34.3%) | 67.0 |
| Bachelor's Degree | 196 (37.1%) | 136.0 |
| Graduate Degree | 51 (9.7%) | 70.0 |
| Total | 528 (100.0%) | 74.0 |
Fertility by Education by Marriage Status in Effingham County
23.1% of women with births in Effingham County are unmarried. Women with the educational attainment of graduate degree are most likely to be married with 100.0% of them married at childbirth, while women with the educational attainment of less than high school are least likely to be married with 44.6% of them unmarried at childbirth.
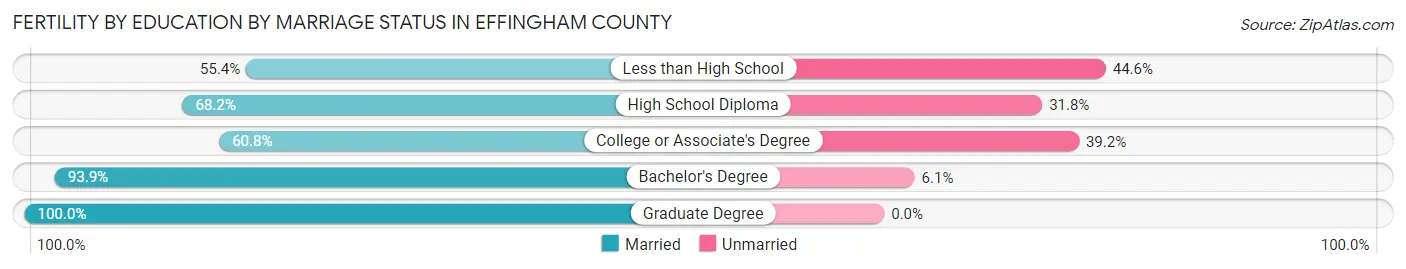
| Educational Attainment | Married | Unmarried |
| Less than High School | 31 (55.4%) | 25 (44.6%) |
| High School Diploma | 30 (68.2%) | 14 (31.8%) |
| College or Associate's Degree | 110 (60.8%) | 71 (39.2%) |
| Bachelor's Degree | 184 (93.9%) | 12 (6.1%) |
| Graduate Degree | 51 (100.0%) | 0 (0.0%) |
| Total | 406 (76.9%) | 122 (23.1%) |
Employment Characteristics in Effingham County
Employment by Class of Employer in Effingham County
Among the 17,381 employed individuals in Effingham County, private company employees (12,528 | 72.1%), local government employees (1,203 | 6.9%), and not-for-profit organizations (1,199 | 6.9%) make up the most common classes of employment.
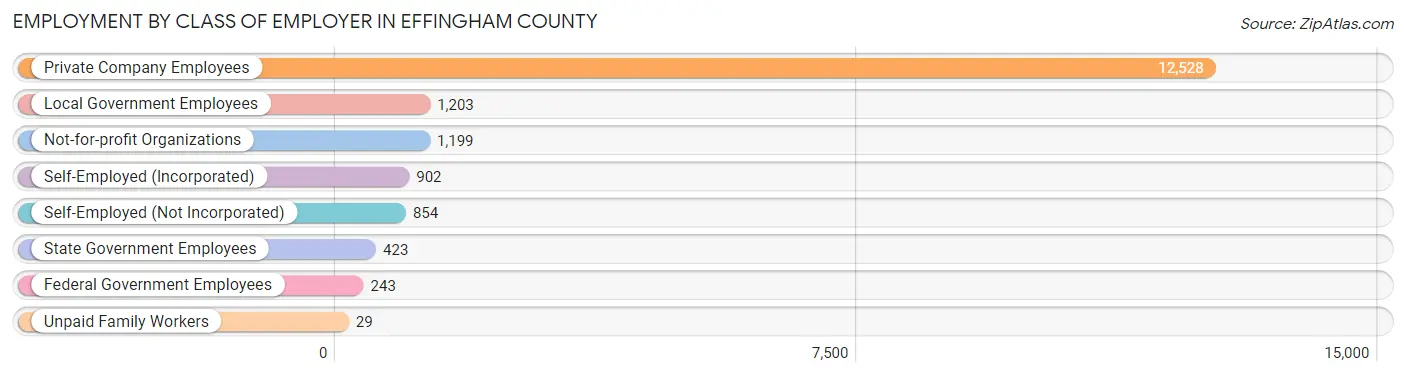
| Employer Class | # Employees | % Employees |
| Private Company Employees | 12,528 | 72.1% |
| Self-Employed (Incorporated) | 902 | 5.2% |
| Self-Employed (Not Incorporated) | 854 | 4.9% |
| Not-for-profit Organizations | 1,199 | 6.9% |
| Local Government Employees | 1,203 | 6.9% |
| State Government Employees | 423 | 2.4% |
| Federal Government Employees | 243 | 1.4% |
| Unpaid Family Workers | 29 | 0.2% |
| Total | 17,381 | 100.0% |
Employment Status by Age in Effingham County
According to the labor force statistics for Effingham County, out of the total population over 16 years of age (27,184), 66.4% or 18,050 individuals are in the labor force, with 2.5% or 451 of them unemployed. The age group with the highest labor force participation rate is 45 to 54 years, with 88.8% or 3,495 individuals in the labor force. Within the labor force, the 20 to 24 years age range has the highest percentage of unemployed individuals, with 3.2% or 51 of them being unemployed.
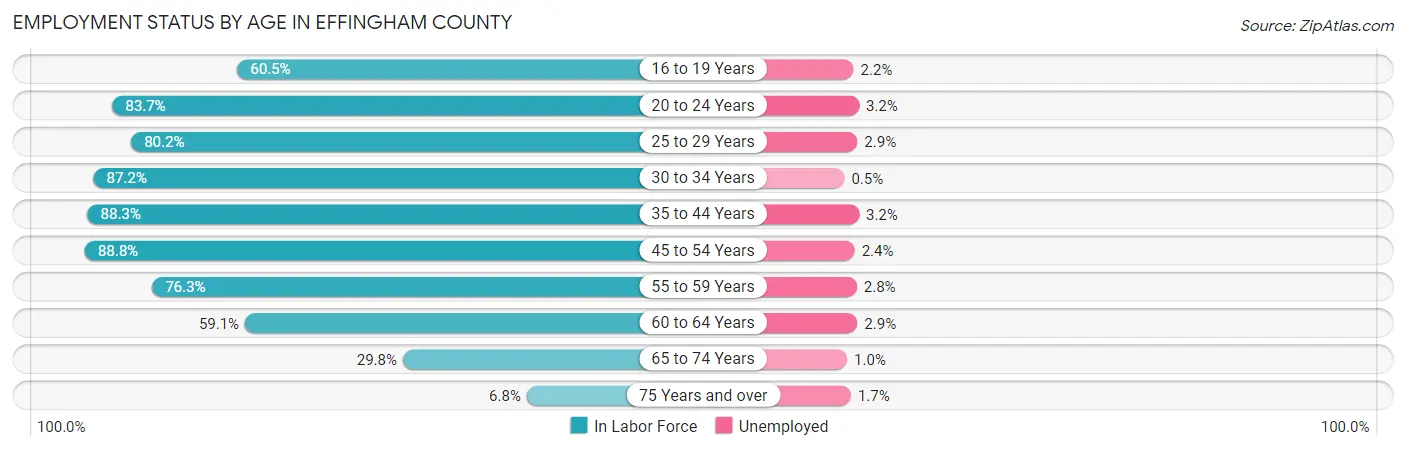
| Age Bracket | In Labor Force | Unemployed |
| 16 to 19 Years | 941 (60.5%) | 21 (2.2%) |
| 20 to 24 Years | 1,586 (83.7%) | 51 (3.2%) |
| 25 to 29 Years | 1,820 (80.2%) | 53 (2.9%) |
| 30 to 34 Years | 1,970 (87.2%) | 10 (0.5%) |
| 35 to 44 Years | 3,625 (88.3%) | 116 (3.2%) |
| 45 to 54 Years | 3,495 (88.8%) | 84 (2.4%) |
| 55 to 59 Years | 1,931 (76.3%) | 54 (2.8%) |
| 60 to 64 Years | 1,437 (59.1%) | 42 (2.9%) |
| 65 to 74 Years | 1,061 (29.8%) | 11 (1.0%) |
| 75 Years and over | 180 (6.8%) | 3 (1.7%) |
| Total | 18,050 (66.4%) | 451 (2.5%) |
Employment Status by Educational Attainment in Effingham County
According to labor force statistics for Effingham County, 81.4% of individuals (14,270) out of the total population between 25 and 64 years of age (17,531) are in the labor force, with 2.5% or 357 of them being unemployed. The group with the highest labor force participation rate are those with the educational attainment of bachelor's degree or higher, with 87.2% or 4,462 individuals in the labor force. Within the labor force, individuals with less than high school education have the highest percentage of unemployment, with 6.1% or 40 of them being unemployed.
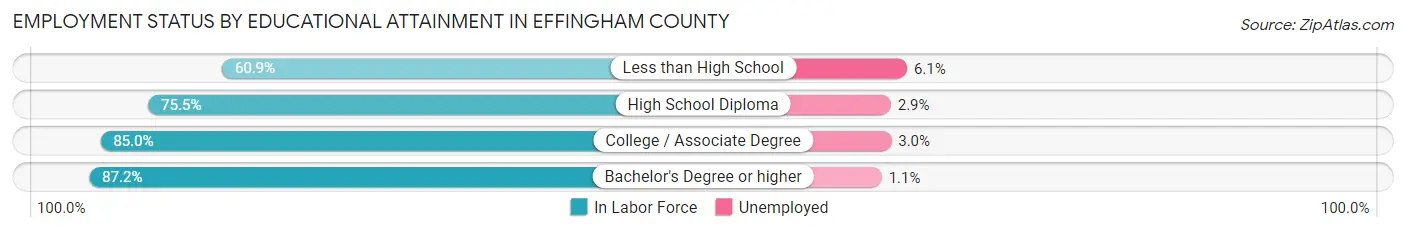
| Educational Attainment | In Labor Force | Unemployed |
| Less than High School | 654 (60.9%) | 66 (6.1%) |
| High School Diploma | 3,799 (75.5%) | 146 (2.9%) |
| College / Associate Degree | 5,362 (85.0%) | 189 (3.0%) |
| Bachelor's Degree or higher | 4,462 (87.2%) | 56 (1.1%) |
| Total | 14,270 (81.4%) | 438 (2.5%) |
Employment Occupations by Sex in Effingham County
Management, Business, Science and Arts Occupations
The most common Management, Business, Science and Arts occupations in Effingham County are Management (1,850 | 10.5%), Health Diagnosing & Treating (1,509 | 8.6%), Community & Social Service (1,178 | 6.7%), Health Technologists (1,039 | 5.9%), and Computers, Engineering & Science (778 | 4.4%).
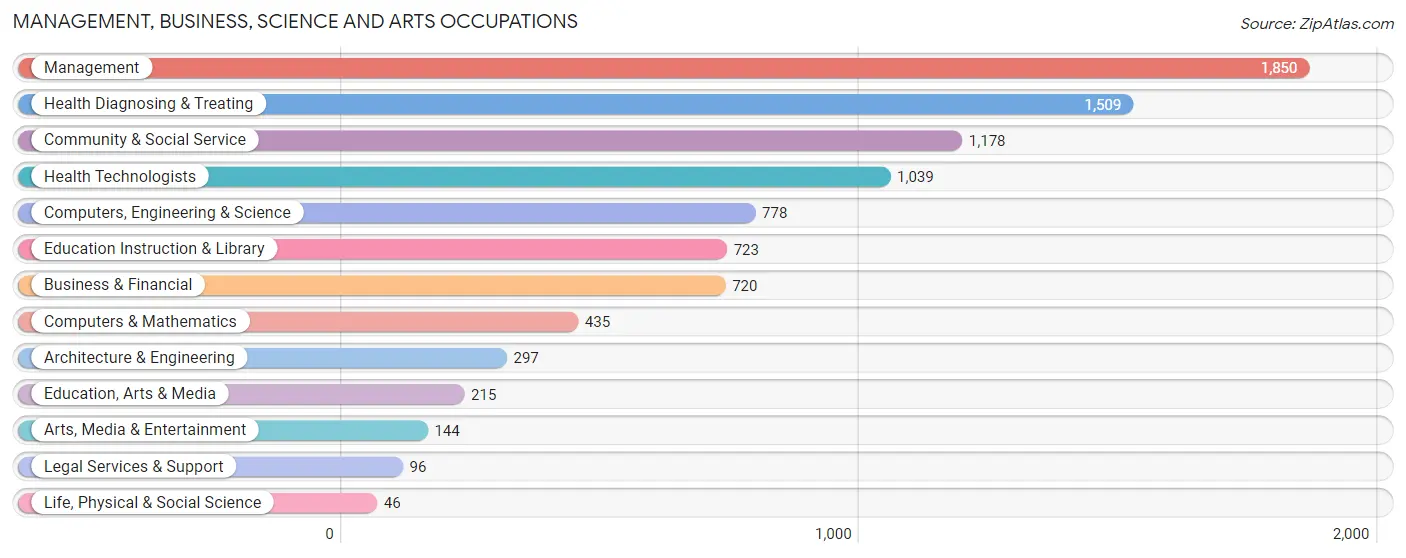
Management, Business, Science and Arts Occupations by Sex
Within the Management, Business, Science and Arts occupations in Effingham County, the most male-oriented occupations are Architecture & Engineering (73.4%), Computers, Engineering & Science (64.8%), and Computers & Mathematics (64.1%), while the most female-oriented occupations are Life, Physical & Social Science (84.8%), Health Diagnosing & Treating (83.2%), and Health Technologists (81.4%).

| Occupation | Male | Female |
| Management | 1,036 (56.0%) | 814 (44.0%) |
| Business & Financial | 334 (46.4%) | 386 (53.6%) |
| Computers, Engineering & Science | 504 (64.8%) | 274 (35.2%) |
| Computers & Mathematics | 279 (64.1%) | 156 (35.9%) |
| Architecture & Engineering | 218 (73.4%) | 79 (26.6%) |
| Life, Physical & Social Science | 7 (15.2%) | 39 (84.8%) |
| Community & Social Service | 358 (30.4%) | 820 (69.6%) |
| Education, Arts & Media | 60 (27.9%) | 155 (72.1%) |
| Legal Services & Support | 54 (56.2%) | 42 (43.8%) |
| Education Instruction & Library | 156 (21.6%) | 567 (78.4%) |
| Arts, Media & Entertainment | 88 (61.1%) | 56 (38.9%) |
| Health Diagnosing & Treating | 253 (16.8%) | 1,256 (83.2%) |
| Health Technologists | 193 (18.6%) | 846 (81.4%) |
| Total (Category) | 2,485 (41.2%) | 3,550 (58.8%) |
| Total (Overall) | 9,280 (52.7%) | 8,315 (47.3%) |
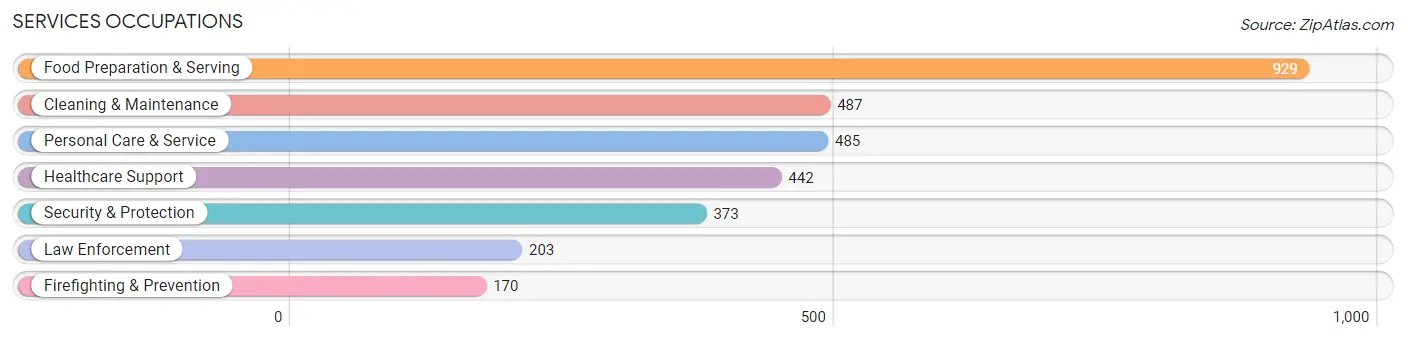
Services Occupations
The most common Services occupations in Effingham County are Food Preparation & Serving (929 | 5.3%), Cleaning & Maintenance (487 | 2.8%), Personal Care & Service (485 | 2.8%), Healthcare Support (442 | 2.5%), and Security & Protection (373 | 2.1%).
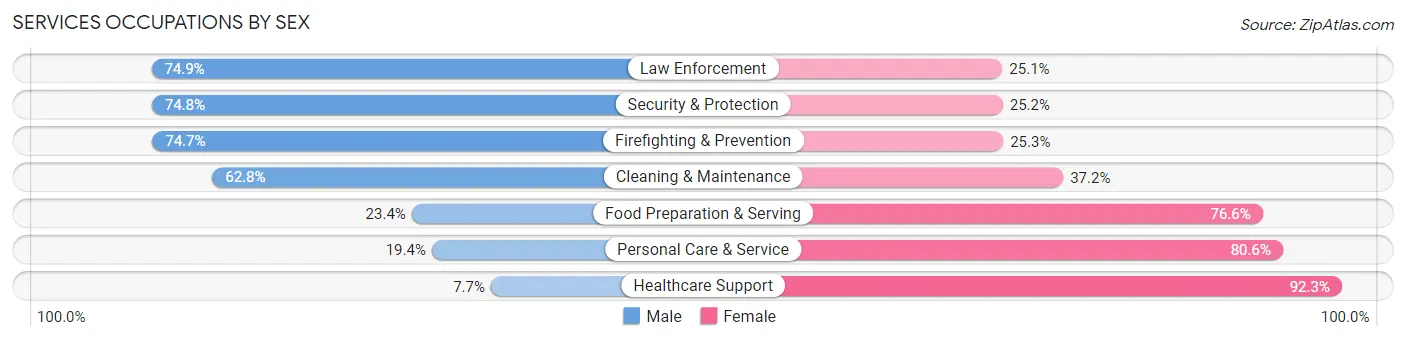
Services Occupations by Sex
Within the Services occupations in Effingham County, the most male-oriented occupations are Law Enforcement (74.9%), Security & Protection (74.8%), and Firefighting & Prevention (74.7%), while the most female-oriented occupations are Healthcare Support (92.3%), Personal Care & Service (80.6%), and Food Preparation & Serving (76.6%).
| Occupation | Male | Female |
| Healthcare Support | 34 (7.7%) | 408 (92.3%) |
| Security & Protection | 279 (74.8%) | 94 (25.2%) |
| Firefighting & Prevention | 127 (74.7%) | 43 (25.3%) |
| Law Enforcement | 152 (74.9%) | 51 (25.1%) |
| Food Preparation & Serving | 217 (23.4%) | 712 (76.6%) |
| Cleaning & Maintenance | 306 (62.8%) | 181 (37.2%) |
| Personal Care & Service | 94 (19.4%) | 391 (80.6%) |
| Total (Category) | 930 (34.2%) | 1,786 (65.8%) |
| Total (Overall) | 9,280 (52.7%) | 8,315 (47.3%) |
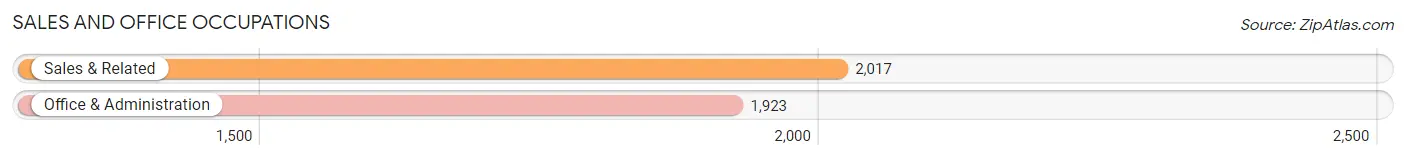
Sales and Office Occupations
The most common Sales and Office occupations in Effingham County are Sales & Related (2,017 | 11.5%), and Office & Administration (1,923 | 10.9%).
Sales and Office Occupations by Sex
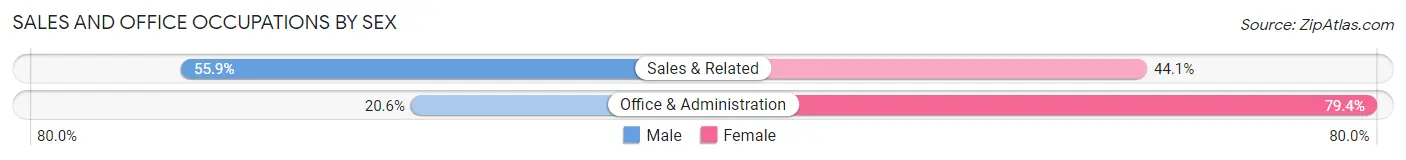
| Occupation | Male | Female |
| Sales & Related | 1,128 (55.9%) | 889 (44.1%) |
| Office & Administration | 396 (20.6%) | 1,527 (79.4%) |
| Total (Category) | 1,524 (38.7%) | 2,416 (61.3%) |
| Total (Overall) | 9,280 (52.7%) | 8,315 (47.3%) |
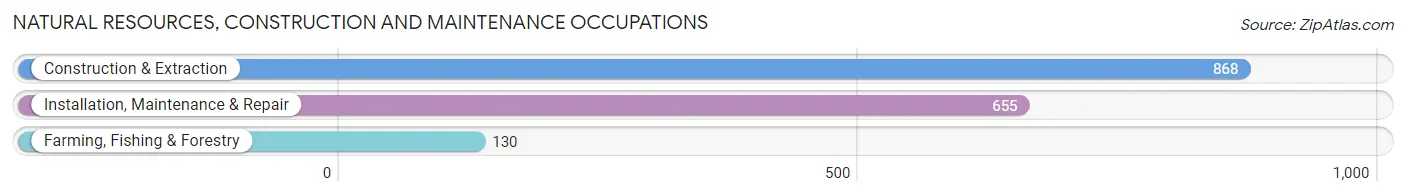
Natural Resources, Construction and Maintenance Occupations
The most common Natural Resources, Construction and Maintenance occupations in Effingham County are Construction & Extraction (868 | 4.9%), Installation, Maintenance & Repair (655 | 3.7%), and Farming, Fishing & Forestry (130 | 0.7%).
Natural Resources, Construction and Maintenance Occupations by Sex
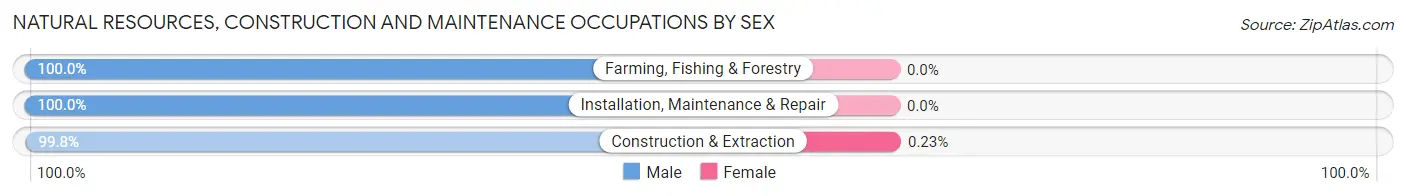
| Occupation | Male | Female |
| Farming, Fishing & Forestry | 130 (100.0%) | 0 (0.0%) |
| Construction & Extraction | 866 (99.8%) | 2 (0.2%) |
| Installation, Maintenance & Repair | 655 (100.0%) | 0 (0.0%) |
| Total (Category) | 1,651 (99.9%) | 2 (0.1%) |
| Total (Overall) | 9,280 (52.7%) | 8,315 (47.3%) |
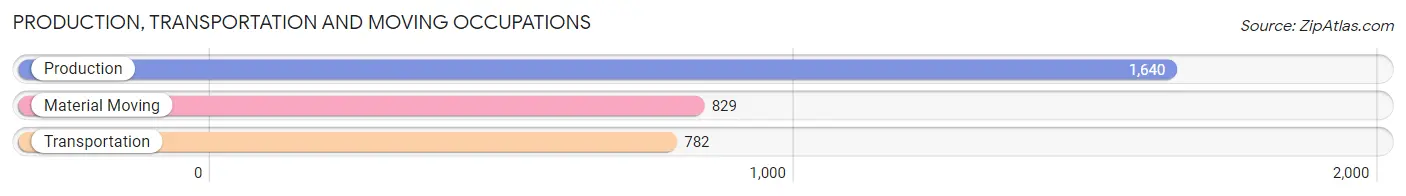
Production, Transportation and Moving Occupations
The most common Production, Transportation and Moving occupations in Effingham County are Production (1,640 | 9.3%), Material Moving (829 | 4.7%), and Transportation (782 | 4.4%).
Production, Transportation and Moving Occupations by Sex
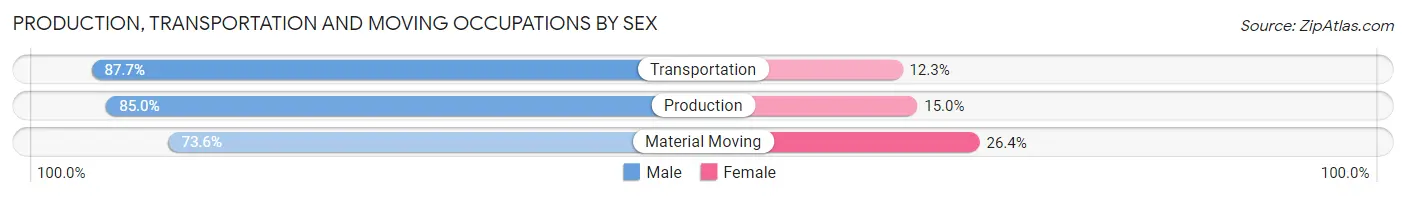
| Occupation | Male | Female |
| Production | 1,394 (85.0%) | 246 (15.0%) |
| Transportation | 686 (87.7%) | 96 (12.3%) |
| Material Moving | 610 (73.6%) | 219 (26.4%) |
| Total (Category) | 2,690 (82.7%) | 561 (17.3%) |
| Total (Overall) | 9,280 (52.7%) | 8,315 (47.3%) |
Employment Industries by Sex in Effingham County
Employment Industries in Effingham County
The major employment industries in Effingham County include Health Care & Social Assistance (2,742 | 15.6%), Manufacturing (2,670 | 15.2%), Retail Trade (2,377 | 13.5%), Accommodation & Food Services (1,439 | 8.2%), and Construction (1,176 | 6.7%).

Employment Industries by Sex in Effingham County
The Effingham County industries that see more men than women are Mining, Quarrying, & Extraction (100.0%), Construction (95.2%), and Enterprise Management (93.8%), whereas the industries that tend to have a higher number of women are Health Care & Social Assistance (84.7%), Real Estate, Rental & Leasing (82.7%), and Educational Services (77.4%).
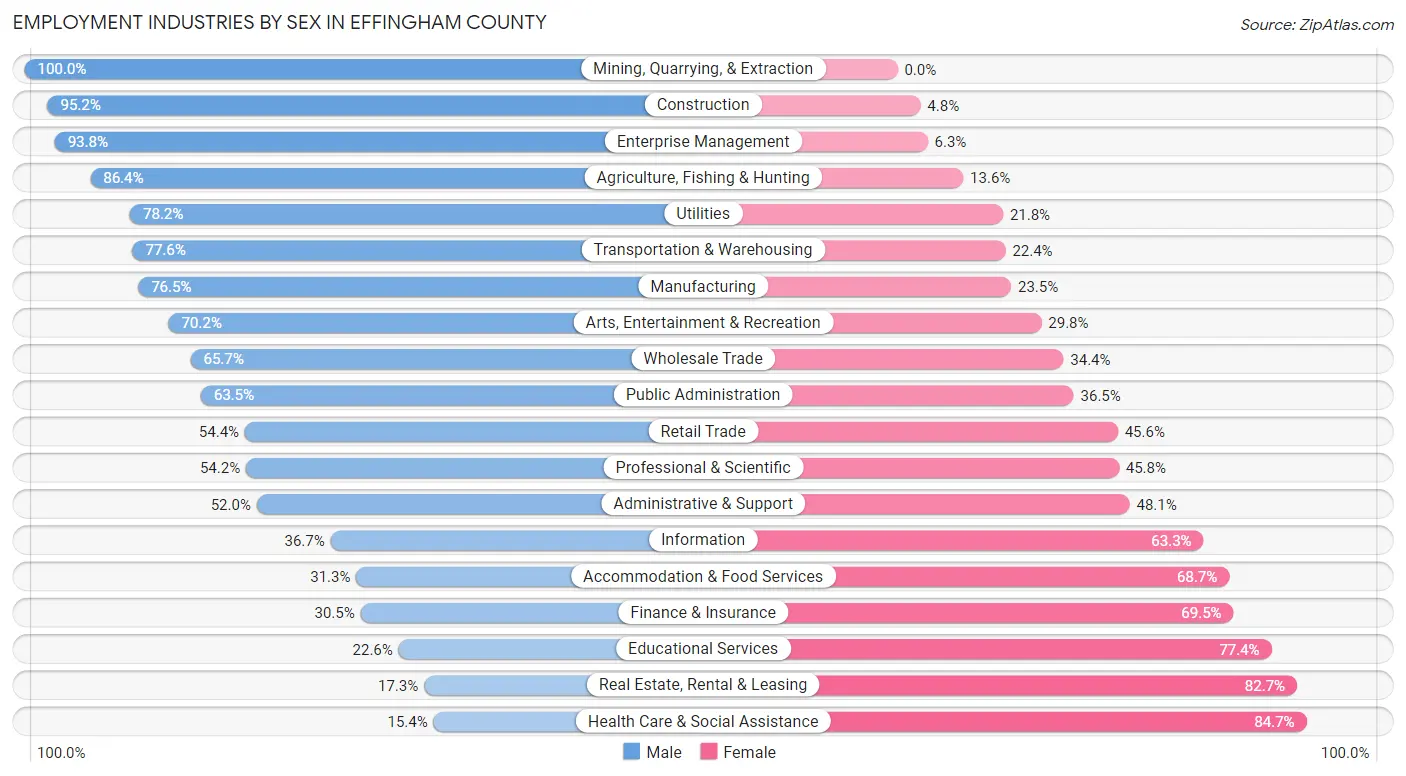
| Industry | Male | Female |
| Agriculture, Fishing & Hunting | 546 (86.4%) | 86 (13.6%) |
| Mining, Quarrying, & Extraction | 24 (100.0%) | 0 (0.0%) |
| Construction | 1,120 (95.2%) | 56 (4.8%) |
| Manufacturing | 2,042 (76.5%) | 628 (23.5%) |
| Wholesale Trade | 411 (65.6%) | 215 (34.4%) |
| Retail Trade | 1,293 (54.4%) | 1,084 (45.6%) |
| Transportation & Warehousing | 646 (77.6%) | 186 (22.4%) |
| Utilities | 161 (78.2%) | 45 (21.8%) |
| Information | 55 (36.7%) | 95 (63.3%) |
| Finance & Insurance | 166 (30.5%) | 379 (69.5%) |
| Real Estate, Rental & Leasing | 31 (17.3%) | 148 (82.7%) |
| Professional & Scientific | 337 (54.2%) | 285 (45.8%) |
| Enterprise Management | 60 (93.8%) | 4 (6.2%) |
| Administrative & Support | 200 (51.9%) | 185 (48.0%) |
| Educational Services | 263 (22.6%) | 901 (77.4%) |
| Health Care & Social Assistance | 421 (15.3%) | 2,321 (84.7%) |
| Arts, Entertainment & Recreation | 132 (70.2%) | 56 (29.8%) |
| Accommodation & Food Services | 451 (31.3%) | 988 (68.7%) |
| Public Administration | 364 (63.5%) | 209 (36.5%) |
| Total | 9,280 (52.7%) | 8,315 (47.3%) |
Education in Effingham County
School Enrollment in Effingham County
The most common levels of schooling among the 7,615 students in Effingham County are middle school (1,961 | 25.8%), elementary school (1,836 | 24.1%), and high school (1,662 | 21.8%).
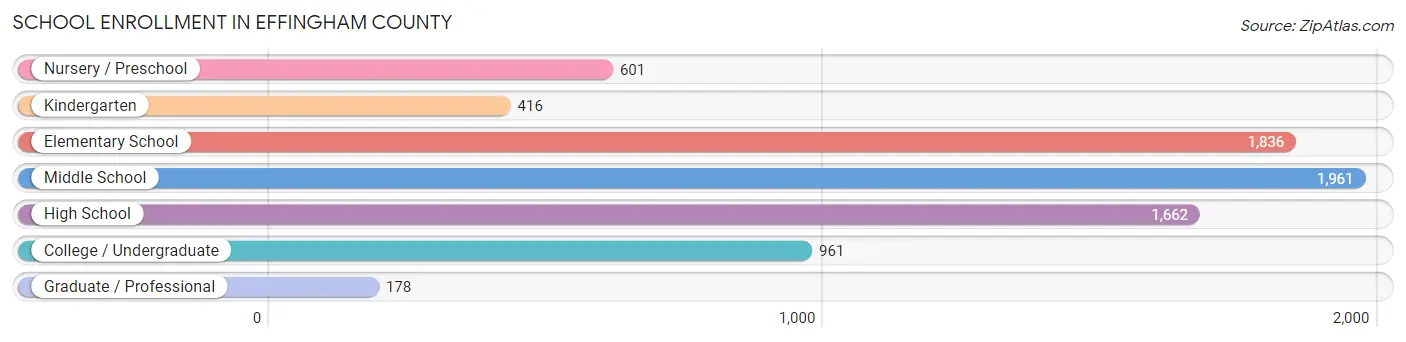
| School Level | # Students | % Students |
| Nursery / Preschool | 601 | 7.9% |
| Kindergarten | 416 | 5.5% |
| Elementary School | 1,836 | 24.1% |
| Middle School | 1,961 | 25.8% |
| High School | 1,662 | 21.8% |
| College / Undergraduate | 961 | 12.6% |
| Graduate / Professional | 178 | 2.3% |
| Total | 7,615 | 100.0% |
School Enrollment by Age by Funding Source in Effingham County
Out of a total of 7,615 students who are enrolled in schools in Effingham County, 1,218 (16.0%) attend a private institution, while the remaining 6,397 (84.0%) are enrolled in public schools. The age group of 3 to 4 year olds has the highest likelihood of being enrolled in private schools, with 130 (25.7% in the age bracket) enrolled. Conversely, the age group of 18 to 19 year olds has the lowest likelihood of being enrolled in a private school, with 357 (88.4% in the age bracket) attending a public institution.
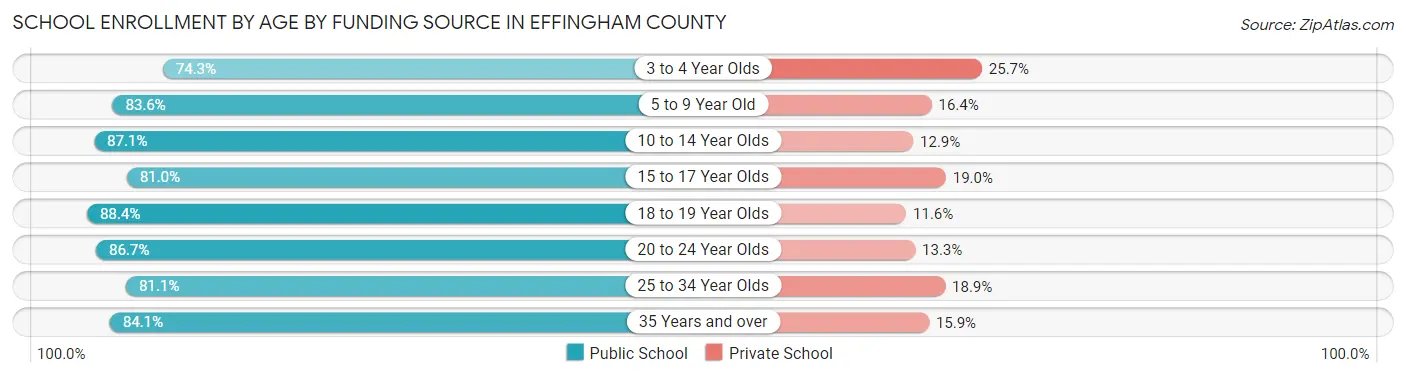
| Age Bracket | Public School | Private School |
| 3 to 4 Year Olds | 375 (74.3%) | 130 (25.7%) |
| 5 to 9 Year Old | 1,757 (83.6%) | 344 (16.4%) |
| 10 to 14 Year Olds | 2,059 (87.1%) | 306 (12.9%) |
| 15 to 17 Year Olds | 1,068 (81.0%) | 251 (19.0%) |
| 18 to 19 Year Olds | 357 (88.4%) | 47 (11.6%) |
| 20 to 24 Year Olds | 417 (86.7%) | 64 (13.3%) |
| 25 to 34 Year Olds | 219 (81.1%) | 51 (18.9%) |
| 35 Years and over | 143 (84.1%) | 27 (15.9%) |
| Total | 6,397 (84.0%) | 1,218 (16.0%) |
Educational Attainment by Field of Study in Effingham County
Business (1,329 | 20.5%), education (1,090 | 16.8%), science & technology (841 | 13.0%), bio, nature & agricultural (675 | 10.4%), and engineering (447 | 6.9%) are the most common fields of study among 6,486 individuals in Effingham County who have obtained a bachelor's degree or higher.
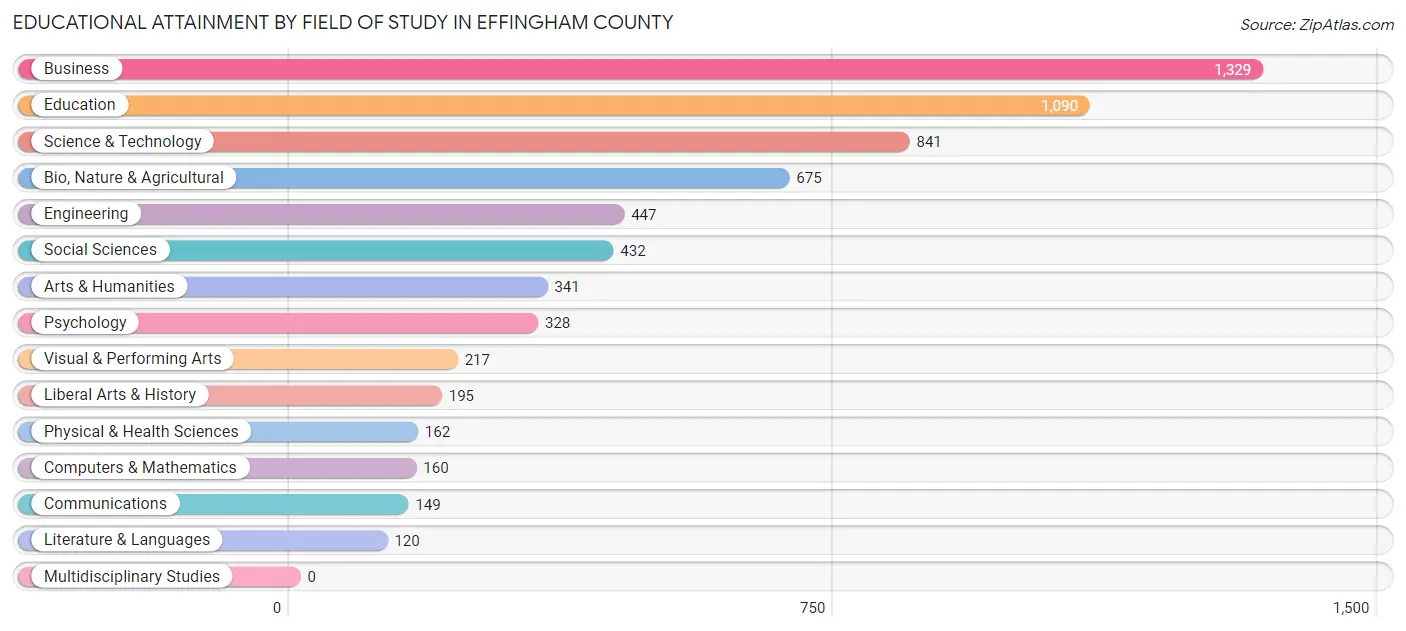
| Field of Study | # Graduates | % Graduates |
| Computers & Mathematics | 160 | 2.5% |
| Bio, Nature & Agricultural | 675 | 10.4% |
| Physical & Health Sciences | 162 | 2.5% |
| Psychology | 328 | 5.1% |
| Social Sciences | 432 | 6.7% |
| Engineering | 447 | 6.9% |
| Multidisciplinary Studies | 0 | 0.0% |
| Science & Technology | 841 | 13.0% |
| Business | 1,329 | 20.5% |
| Education | 1,090 | 16.8% |
| Literature & Languages | 120 | 1.8% |
| Liberal Arts & History | 195 | 3.0% |
| Visual & Performing Arts | 217 | 3.4% |
| Communications | 149 | 2.3% |
| Arts & Humanities | 341 | 5.3% |
| Total | 6,486 | 100.0% |
Transportation & Commute in Effingham County
Vehicle Availability by Sex in Effingham County
The most prevalent vehicle ownership categories in Effingham County are males with 2 vehicles (3,641, accounting for 39.7%) and females with 2 vehicles (3,266, making up 44.5%).
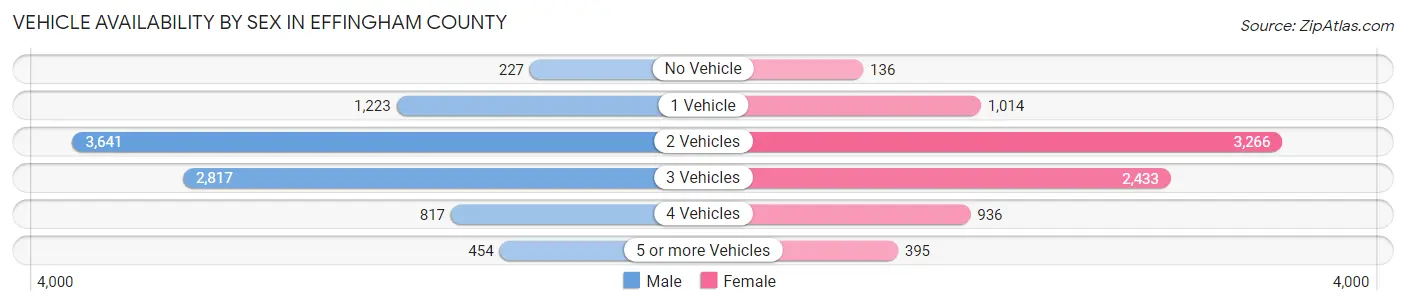
| Vehicles Available | Male | Female |
| No Vehicle | 227 (2.5%) | 136 (1.7%) |
| 1 Vehicle | 1,223 (13.3%) | 1,014 (12.4%) |
| 2 Vehicles | 3,641 (39.7%) | 3,266 (39.9%) |
| 3 Vehicles | 2,817 (30.7%) | 2,433 (29.7%) |
| 4 Vehicles | 817 (8.9%) | 936 (11.4%) |
| 5 or more Vehicles | 454 (5.0%) | 395 (4.8%) |
| Total | 9,179 (100.0%) | 8,180 (100.0%) |
Commute Time in Effingham County
The most frequently occuring commute durations in Effingham County are 10 to 14 minutes (3,572 commuters, 22.9%), 5 to 9 minutes (3,061 commuters, 19.7%), and 15 to 19 minutes (2,885 commuters, 18.5%).
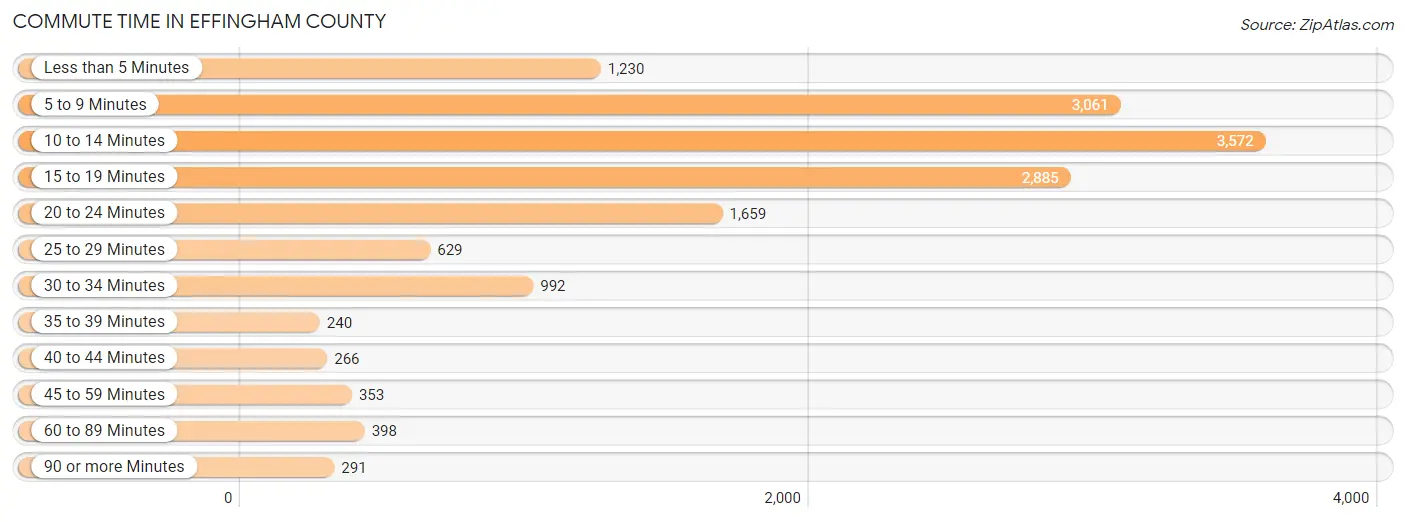
| Commute Time | # Commuters | % Commuters |
| Less than 5 Minutes | 1,230 | 7.9% |
| 5 to 9 Minutes | 3,061 | 19.7% |
| 10 to 14 Minutes | 3,572 | 22.9% |
| 15 to 19 Minutes | 2,885 | 18.5% |
| 20 to 24 Minutes | 1,659 | 10.6% |
| 25 to 29 Minutes | 629 | 4.0% |
| 30 to 34 Minutes | 992 | 6.4% |
| 35 to 39 Minutes | 240 | 1.5% |
| 40 to 44 Minutes | 266 | 1.7% |
| 45 to 59 Minutes | 353 | 2.3% |
| 60 to 89 Minutes | 398 | 2.6% |
| 90 or more Minutes | 291 | 1.9% |
Commute Time by Sex in Effingham County
The most common commute times in Effingham County are 10 to 14 minutes (1,905 commuters, 23.1%) for males and 10 to 14 minutes (1,667 commuters, 22.7%) for females.
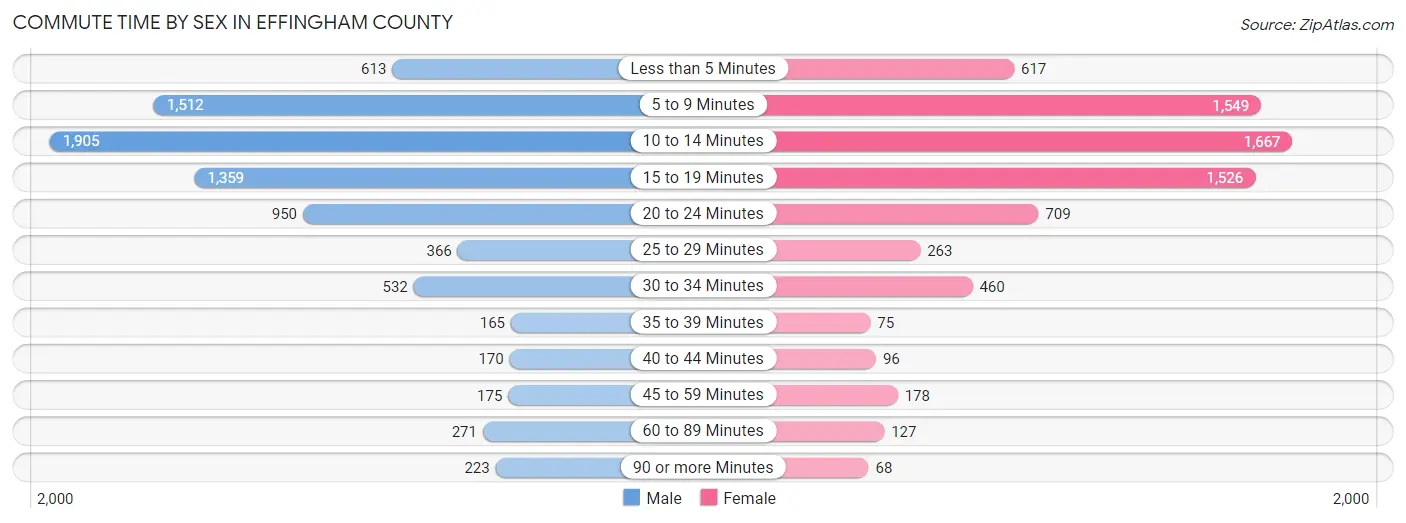
| Commute Time | Male | Female |
| Less than 5 Minutes | 613 (7.4%) | 617 (8.4%) |
| 5 to 9 Minutes | 1,512 (18.3%) | 1,549 (21.1%) |
| 10 to 14 Minutes | 1,905 (23.1%) | 1,667 (22.7%) |
| 15 to 19 Minutes | 1,359 (16.5%) | 1,526 (20.8%) |
| 20 to 24 Minutes | 950 (11.5%) | 709 (9.7%) |
| 25 to 29 Minutes | 366 (4.4%) | 263 (3.6%) |
| 30 to 34 Minutes | 532 (6.5%) | 460 (6.3%) |
| 35 to 39 Minutes | 165 (2.0%) | 75 (1.0%) |
| 40 to 44 Minutes | 170 (2.1%) | 96 (1.3%) |
| 45 to 59 Minutes | 175 (2.1%) | 178 (2.4%) |
| 60 to 89 Minutes | 271 (3.3%) | 127 (1.7%) |
| 90 or more Minutes | 223 (2.7%) | 68 (0.9%) |
Time of Departure to Work by Sex in Effingham County
The most frequent times of departure to work in Effingham County are 6:30 AM to 6:59 AM (1,651, 20.0%) for males and 7:00 AM to 7:29 AM (1,473, 20.1%) for females.

| Time of Departure | Male | Female |
| 12:00 AM to 4:59 AM | 382 (4.6%) | 361 (4.9%) |
| 5:00 AM to 5:29 AM | 225 (2.7%) | 135 (1.8%) |
| 5:30 AM to 5:59 AM | 514 (6.2%) | 280 (3.8%) |
| 6:00 AM to 6:29 AM | 968 (11.7%) | 610 (8.3%) |
| 6:30 AM to 6:59 AM | 1,651 (20.0%) | 752 (10.2%) |
| 7:00 AM to 7:29 AM | 1,438 (17.4%) | 1,473 (20.1%) |
| 7:30 AM to 7:59 AM | 953 (11.6%) | 1,375 (18.8%) |
| 8:00 AM to 8:29 AM | 400 (4.9%) | 568 (7.7%) |
| 8:30 AM to 8:59 AM | 110 (1.3%) | 211 (2.9%) |
| 9:00 AM to 9:59 AM | 172 (2.1%) | 219 (3.0%) |
| 10:00 AM to 10:59 AM | 165 (2.0%) | 131 (1.8%) |
| 11:00 AM to 11:59 AM | 52 (0.6%) | 219 (3.0%) |
| 12:00 PM to 3:59 PM | 569 (6.9%) | 565 (7.7%) |
| 4:00 PM to 11:59 PM | 642 (7.8%) | 436 (5.9%) |
| Total | 8,241 (100.0%) | 7,335 (100.0%) |
Housing Occupancy in Effingham County
Occupancy by Ownership in Effingham County
Of the total 14,098 dwellings in Effingham County, owner-occupied units account for 10,969 (77.8%), while renter-occupied units make up 3,129 (22.2%).
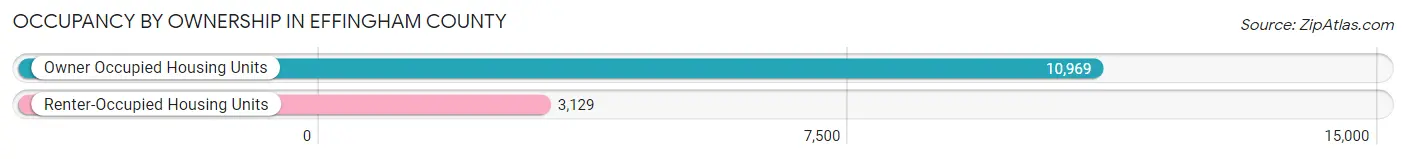
| Occupancy | # Housing Units | % Housing Units |
| Owner Occupied Housing Units | 10,969 | 77.8% |
| Renter-Occupied Housing Units | 3,129 | 22.2% |
| Total Occupied Housing Units | 14,098 | 100.0% |
Occupancy by Household Size in Effingham County
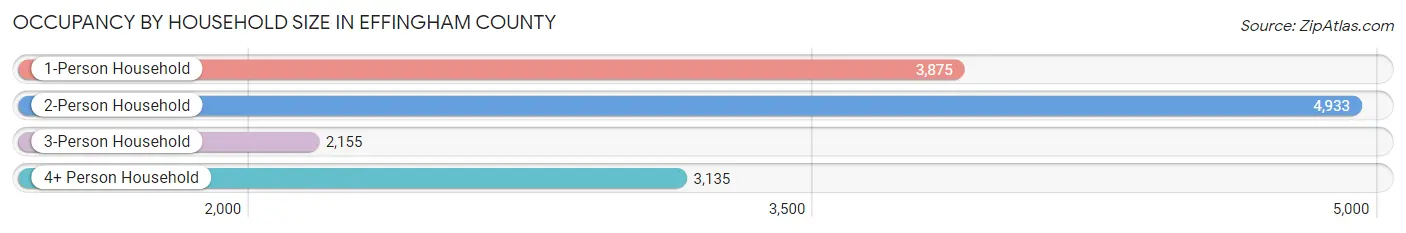
| Household Size | # Housing Units | % Housing Units |
| 1-Person Household | 3,875 | 27.5% |
| 2-Person Household | 4,933 | 35.0% |
| 3-Person Household | 2,155 | 15.3% |
| 4+ Person Household | 3,135 | 22.2% |
| Total Housing Units | 14,098 | 100.0% |
Occupancy by Ownership by Household Size in Effingham County
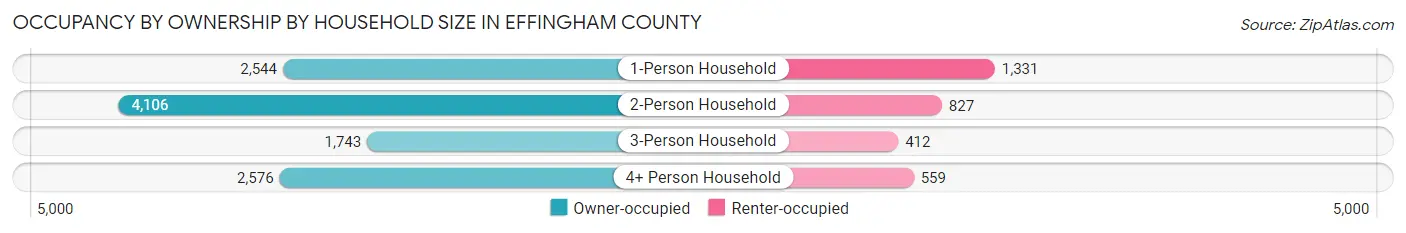
| Household Size | Owner-occupied | Renter-occupied |
| 1-Person Household | 2,544 (65.6%) | 1,331 (34.4%) |
| 2-Person Household | 4,106 (83.2%) | 827 (16.8%) |
| 3-Person Household | 1,743 (80.9%) | 412 (19.1%) |
| 4+ Person Household | 2,576 (82.2%) | 559 (17.8%) |
| Total Housing Units | 10,969 (77.8%) | 3,129 (22.2%) |
Occupancy by Educational Attainment in Effingham County
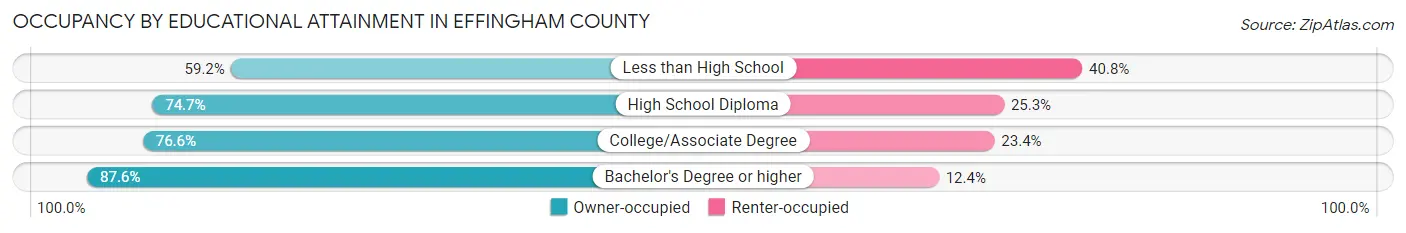
| Household Size | Owner-occupied | Renter-occupied |
| Less than High School | 478 (59.2%) | 330 (40.8%) |
| High School Diploma | 3,323 (74.7%) | 1,127 (25.3%) |
| College/Associate Degree | 3,995 (76.6%) | 1,223 (23.4%) |
| Bachelor's Degree or higher | 3,173 (87.6%) | 449 (12.4%) |
Occupancy by Age of Householder in Effingham County
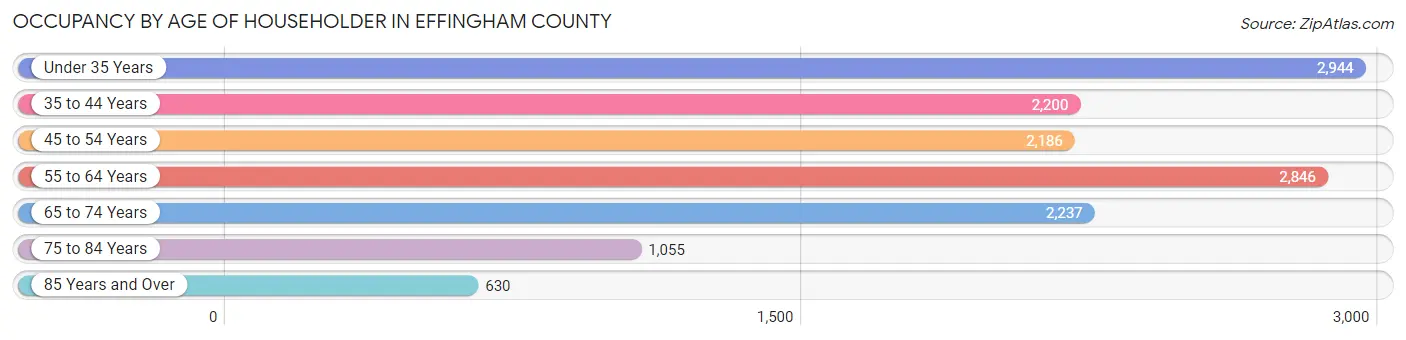
| Age Bracket | # Households | % Households |
| Under 35 Years | 2,944 | 20.9% |
| 35 to 44 Years | 2,200 | 15.6% |
| 45 to 54 Years | 2,186 | 15.5% |
| 55 to 64 Years | 2,846 | 20.2% |
| 65 to 74 Years | 2,237 | 15.9% |
| 75 to 84 Years | 1,055 | 7.5% |
| 85 Years and Over | 630 | 4.5% |
| Total | 14,098 | 100.0% |
Housing Finances in Effingham County
Median Income by Occupancy in Effingham County
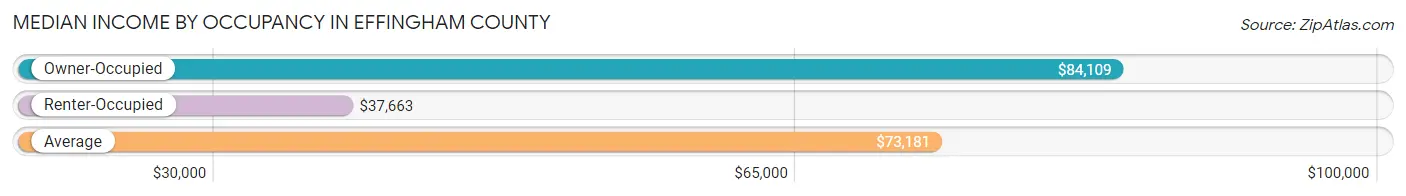
| Occupancy Type | # Households | Median Income |
| Owner-Occupied | 10,969 (77.8%) | $84,109 |
| Renter-Occupied | 3,129 (22.2%) | $37,663 |
| Average | 14,098 (100.0%) | $73,181 |
Occupancy by Householder Income Bracket in Effingham County
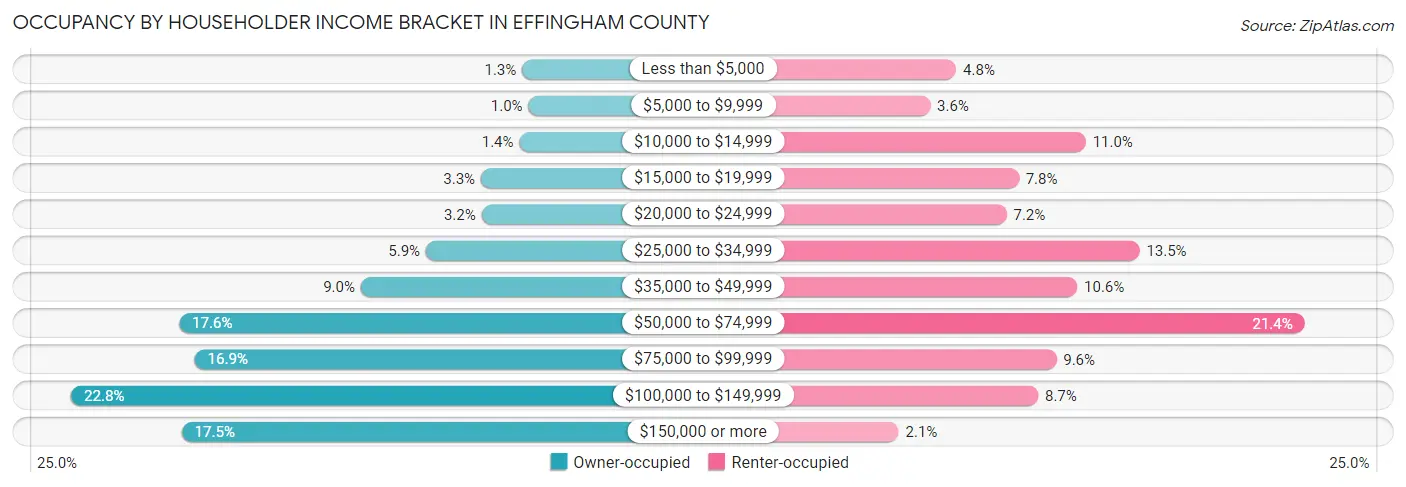
| Income Bracket | Owner-occupied | Renter-occupied |
| Less than $5,000 | 144 (1.3%) | 150 (4.8%) |
| $5,000 to $9,999 | 111 (1.0%) | 111 (3.5%) |
| $10,000 to $14,999 | 158 (1.4%) | 343 (11.0%) |
| $15,000 to $19,999 | 359 (3.3%) | 243 (7.8%) |
| $20,000 to $24,999 | 355 (3.2%) | 225 (7.2%) |
| $25,000 to $34,999 | 646 (5.9%) | 423 (13.5%) |
| $35,000 to $49,999 | 986 (9.0%) | 330 (10.5%) |
| $50,000 to $74,999 | 1,935 (17.6%) | 669 (21.4%) |
| $75,000 to $99,999 | 1,854 (16.9%) | 299 (9.6%) |
| $100,000 to $149,999 | 2,499 (22.8%) | 272 (8.7%) |
| $150,000 or more | 1,922 (17.5%) | 64 (2.1%) |
| Total | 10,969 (100.0%) | 3,129 (100.0%) |
Monthly Housing Cost Tiers in Effingham County

| Monthly Cost | Owner-occupied | Renter-occupied |
| Less than $300 | 511 (4.7%) | 169 (5.4%) |
| $300 to $499 | 1,657 (15.1%) | 339 (10.8%) |
| $500 to $799 | 2,544 (23.2%) | 1,129 (36.1%) |
| $800 to $999 | 1,569 (14.3%) | 686 (21.9%) |
| $1,000 to $1,499 | 2,251 (20.5%) | 349 (11.2%) |
| $1,500 to $1,999 | 1,257 (11.5%) | 146 (4.7%) |
| $2,000 to $2,499 | 600 (5.5%) | 0 (0.0%) |
| $2,500 to $2,999 | 254 (2.3%) | 0 (0.0%) |
| $3,000 or more | 326 (3.0%) | 12 (0.4%) |
| Total | 10,969 (100.0%) | 3,129 (100.0%) |
Physical Housing Characteristics in Effingham County
Housing Structures in Effingham County
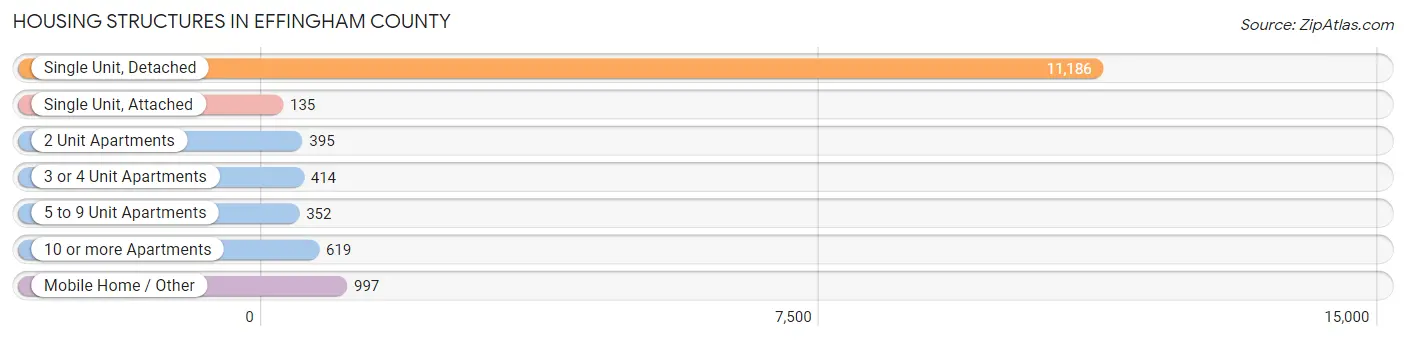
| Structure Type | # Housing Units | % Housing Units |
| Single Unit, Detached | 11,186 | 79.3% |
| Single Unit, Attached | 135 | 1.0% |
| 2 Unit Apartments | 395 | 2.8% |
| 3 or 4 Unit Apartments | 414 | 2.9% |
| 5 to 9 Unit Apartments | 352 | 2.5% |
| 10 or more Apartments | 619 | 4.4% |
| Mobile Home / Other | 997 | 7.1% |
| Total | 14,098 | 100.0% |
Housing Structures by Occupancy in Effingham County
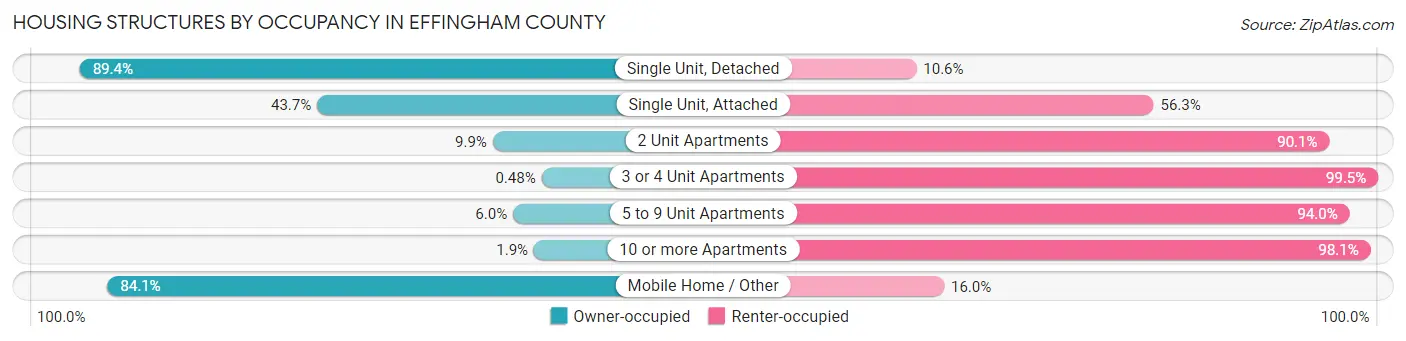
| Structure Type | Owner-occupied | Renter-occupied |
| Single Unit, Detached | 9,998 (89.4%) | 1,188 (10.6%) |
| Single Unit, Attached | 59 (43.7%) | 76 (56.3%) |
| 2 Unit Apartments | 39 (9.9%) | 356 (90.1%) |
| 3 or 4 Unit Apartments | 2 (0.5%) | 412 (99.5%) |
| 5 to 9 Unit Apartments | 21 (6.0%) | 331 (94.0%) |
| 10 or more Apartments | 12 (1.9%) | 607 (98.1%) |
| Mobile Home / Other | 838 (84.1%) | 159 (16.0%) |
| Total | 10,969 (77.8%) | 3,129 (22.2%) |
Housing Structures by Number of Rooms in Effingham County
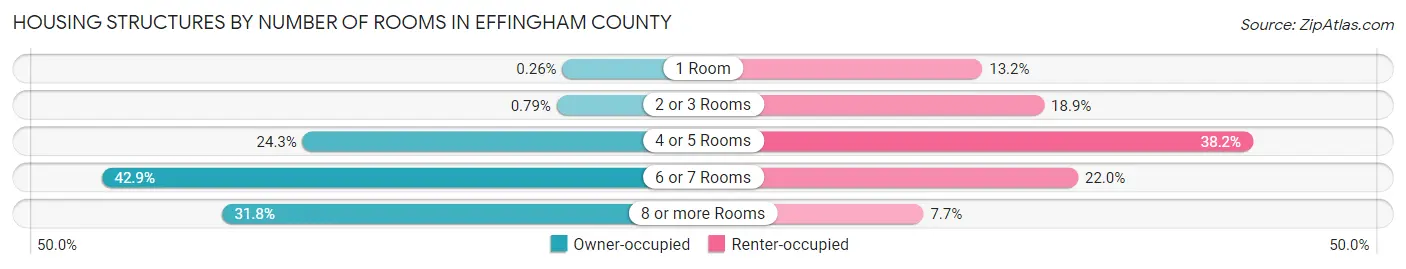
| Number of Rooms | Owner-occupied | Renter-occupied |
| 1 Room | 28 (0.3%) | 412 (13.2%) |
| 2 or 3 Rooms | 87 (0.8%) | 591 (18.9%) |
| 4 or 5 Rooms | 2,664 (24.3%) | 1,195 (38.2%) |
| 6 or 7 Rooms | 4,704 (42.9%) | 689 (22.0%) |
| 8 or more Rooms | 3,486 (31.8%) | 242 (7.7%) |
| Total | 10,969 (100.0%) | 3,129 (100.0%) |
Housing Structure by Heating Type in Effingham County
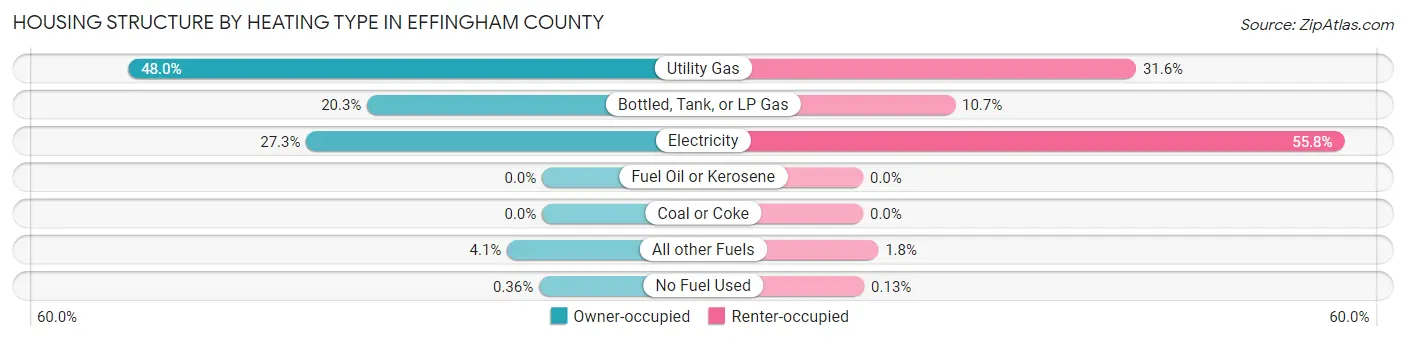
| Heating Type | Owner-occupied | Renter-occupied |
| Utility Gas | 5,263 (48.0%) | 990 (31.6%) |
| Bottled, Tank, or LP Gas | 2,224 (20.3%) | 334 (10.7%) |
| Electricity | 2,999 (27.3%) | 1,746 (55.8%) |
| Fuel Oil or Kerosene | 0 (0.0%) | 0 (0.0%) |
| Coal or Coke | 0 (0.0%) | 0 (0.0%) |
| All other Fuels | 444 (4.1%) | 55 (1.8%) |
| No Fuel Used | 39 (0.4%) | 4 (0.1%) |
| Total | 10,969 (100.0%) | 3,129 (100.0%) |
Household Vehicle Usage in Effingham County
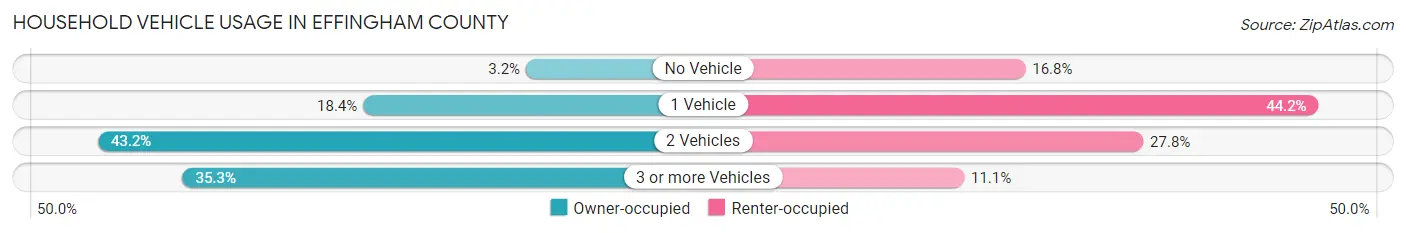
| Vehicles per Household | Owner-occupied | Renter-occupied |
| No Vehicle | 351 (3.2%) | 527 (16.8%) |
| 1 Vehicle | 2,018 (18.4%) | 1,383 (44.2%) |
| 2 Vehicles | 4,733 (43.1%) | 871 (27.8%) |
| 3 or more Vehicles | 3,867 (35.2%) | 348 (11.1%) |
| Total | 10,969 (100.0%) | 3,129 (100.0%) |
Real Estate & Mortgages in Effingham County
Real Estate and Mortgage Overview in Effingham County
| Characteristic | Without Mortgage | With Mortgage |
| Housing Units | 5,129 | 5,840 |
| Median Property Value | $159,200 | $173,700 |
| Median Household Income | $68,569 | $1,204 |
| Monthly Housing Costs | $560 | $289 |
| Real Estate Taxes | $2,459 | $133 |
Property Value by Mortgage Status in Effingham County
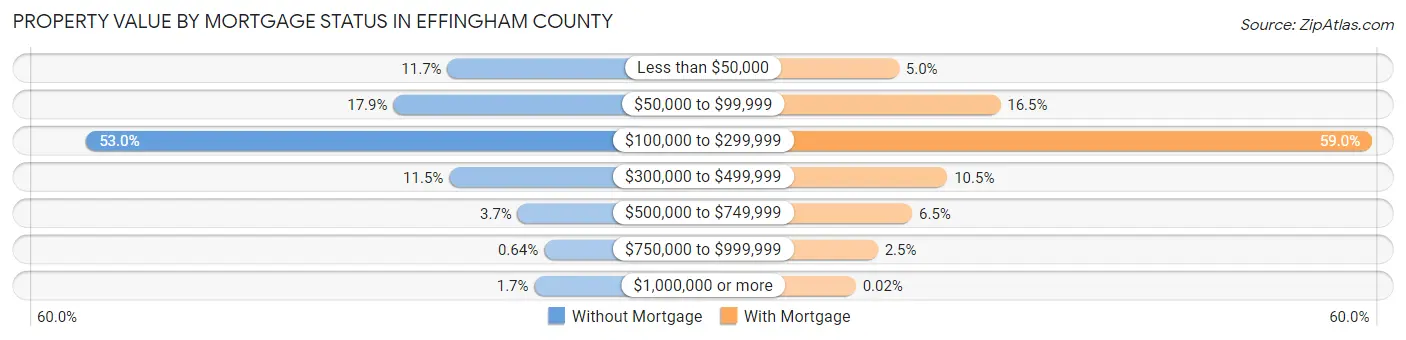
| Property Value | Without Mortgage | With Mortgage |
| Less than $50,000 | 599 (11.7%) | 289 (5.0%) |
| $50,000 to $99,999 | 916 (17.9%) | 966 (16.5%) |
| $100,000 to $299,999 | 2,716 (52.9%) | 3,447 (59.0%) |
| $300,000 to $499,999 | 589 (11.5%) | 612 (10.5%) |
| $500,000 to $749,999 | 187 (3.6%) | 377 (6.5%) |
| $750,000 to $999,999 | 33 (0.6%) | 148 (2.5%) |
| $1,000,000 or more | 89 (1.7%) | 1 (0.0%) |
| Total | 5,129 (100.0%) | 5,840 (100.0%) |
Household Income by Mortgage Status in Effingham County
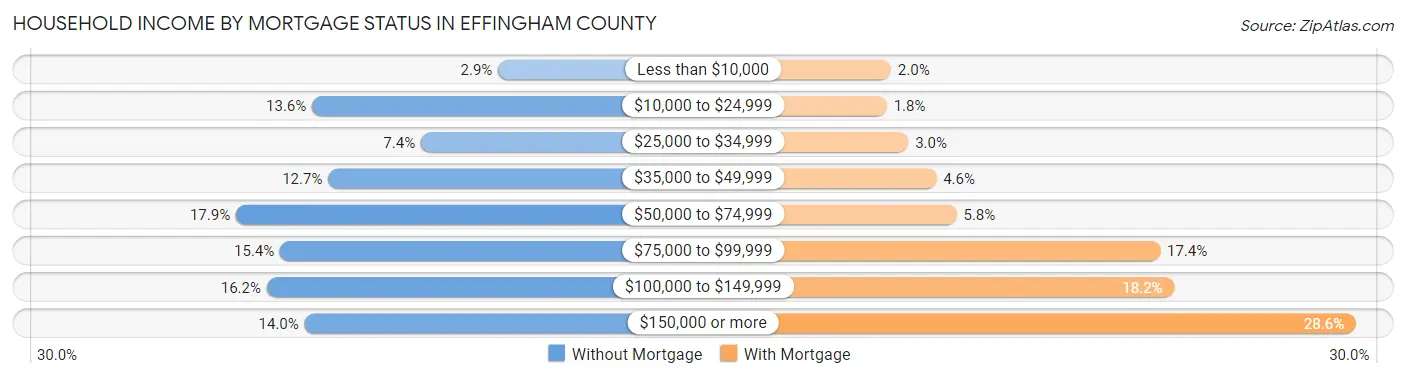
| Household Income | Without Mortgage | With Mortgage |
| Less than $10,000 | 151 (2.9%) | 118 (2.0%) |
| $10,000 to $24,999 | 696 (13.6%) | 104 (1.8%) |
| $25,000 to $34,999 | 377 (7.3%) | 176 (3.0%) |
| $35,000 to $49,999 | 649 (12.7%) | 269 (4.6%) |
| $50,000 to $74,999 | 919 (17.9%) | 337 (5.8%) |
| $75,000 to $99,999 | 790 (15.4%) | 1,016 (17.4%) |
| $100,000 to $149,999 | 829 (16.2%) | 1,064 (18.2%) |
| $150,000 or more | 718 (14.0%) | 1,670 (28.6%) |
| Total | 5,129 (100.0%) | 5,840 (100.0%) |
Property Value to Household Income Ratio in Effingham County
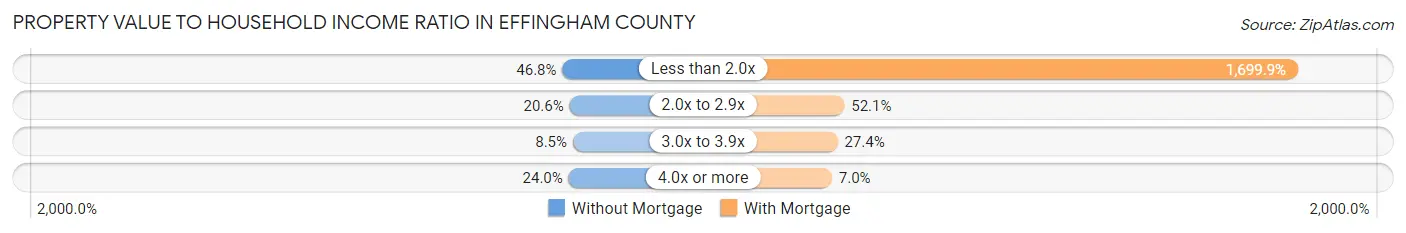
| Value-to-Income Ratio | Without Mortgage | With Mortgage |
| Less than 2.0x | 2,398 (46.8%) | 99,272 (1,699.9%) |
| 2.0x to 2.9x | 1,055 (20.6%) | 3,043 (52.1%) |
| 3.0x to 3.9x | 435 (8.5%) | 1,600 (27.4%) |
| 4.0x or more | 1,232 (24.0%) | 410 (7.0%) |
| Total | 5,129 (100.0%) | 5,840 (100.0%) |
Real Estate Taxes by Mortgage Status in Effingham County
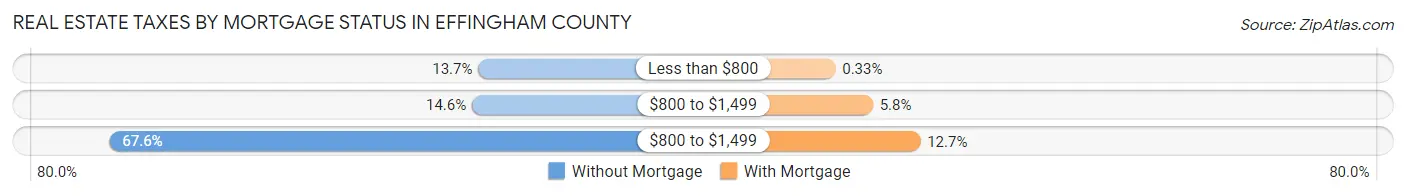
| Property Taxes | Without Mortgage | With Mortgage |
| Less than $800 | 703 (13.7%) | 19 (0.3%) |
| $800 to $1,499 | 750 (14.6%) | 339 (5.8%) |
| $800 to $1,499 | 3,467 (67.6%) | 744 (12.7%) |
| Total | 5,129 (100.0%) | 5,840 (100.0%) |
Health & Disability in Effingham County
Health Insurance Coverage by Age in Effingham County
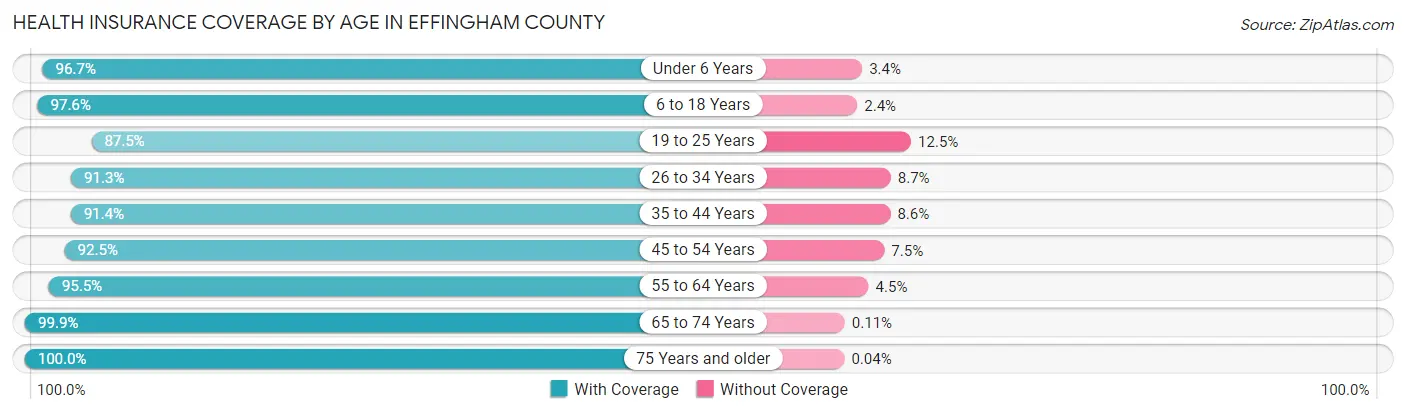
| Age Bracket | With Coverage | Without Coverage |
| Under 6 Years | 2,540 (96.7%) | 88 (3.4%) |
| 6 to 18 Years | 5,784 (97.6%) | 144 (2.4%) |
| 19 to 25 Years | 2,282 (87.5%) | 325 (12.5%) |
| 26 to 34 Years | 3,839 (91.3%) | 365 (8.7%) |
| 35 to 44 Years | 3,735 (91.4%) | 352 (8.6%) |
| 45 to 54 Years | 3,635 (92.5%) | 294 (7.5%) |
| 55 to 64 Years | 4,715 (95.5%) | 224 (4.5%) |
| 65 to 74 Years | 3,480 (99.9%) | 4 (0.1%) |
| 75 Years and older | 2,411 (100.0%) | 1 (0.0%) |
| Total | 32,421 (94.8%) | 1,797 (5.2%) |
Health Insurance Coverage by Citizenship Status in Effingham County
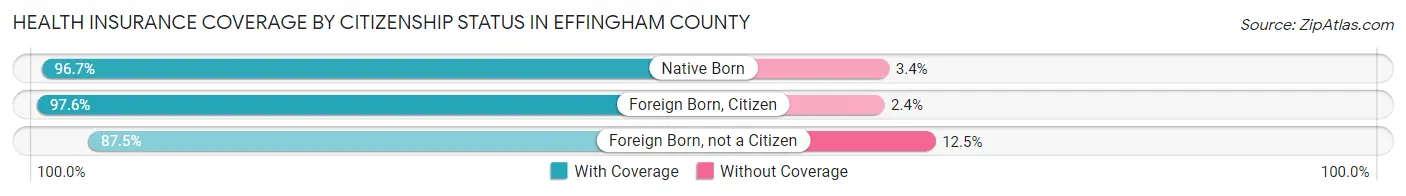
| Citizenship Status | With Coverage | Without Coverage |
| Native Born | 2,540 (96.7%) | 88 (3.4%) |
| Foreign Born, Citizen | 5,784 (97.6%) | 144 (2.4%) |
| Foreign Born, not a Citizen | 2,282 (87.5%) | 325 (12.5%) |
Health Insurance Coverage by Household Income in Effingham County
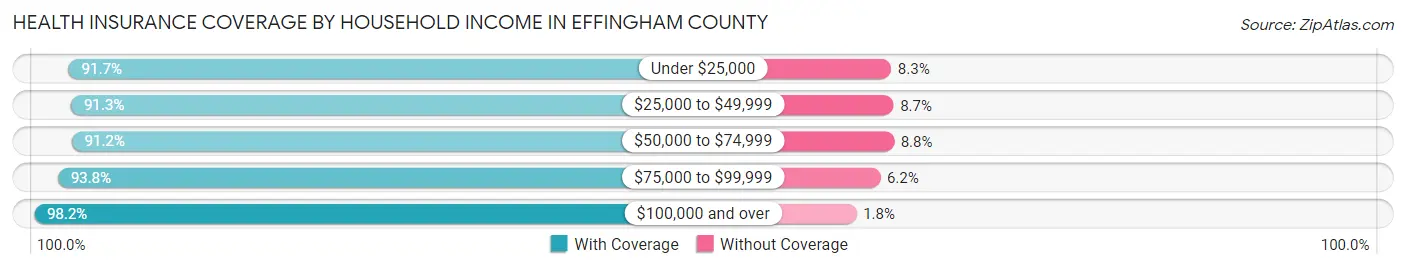
| Household Income | With Coverage | Without Coverage |
| Under $25,000 | 3,378 (91.7%) | 304 (8.3%) |
| $25,000 to $49,999 | 4,168 (91.3%) | 397 (8.7%) |
| $50,000 to $74,999 | 4,837 (91.2%) | 466 (8.8%) |
| $75,000 to $99,999 | 5,668 (93.8%) | 375 (6.2%) |
| $100,000 and over | 14,267 (98.2%) | 255 (1.8%) |
Public vs Private Health Insurance Coverage by Age in Effingham County
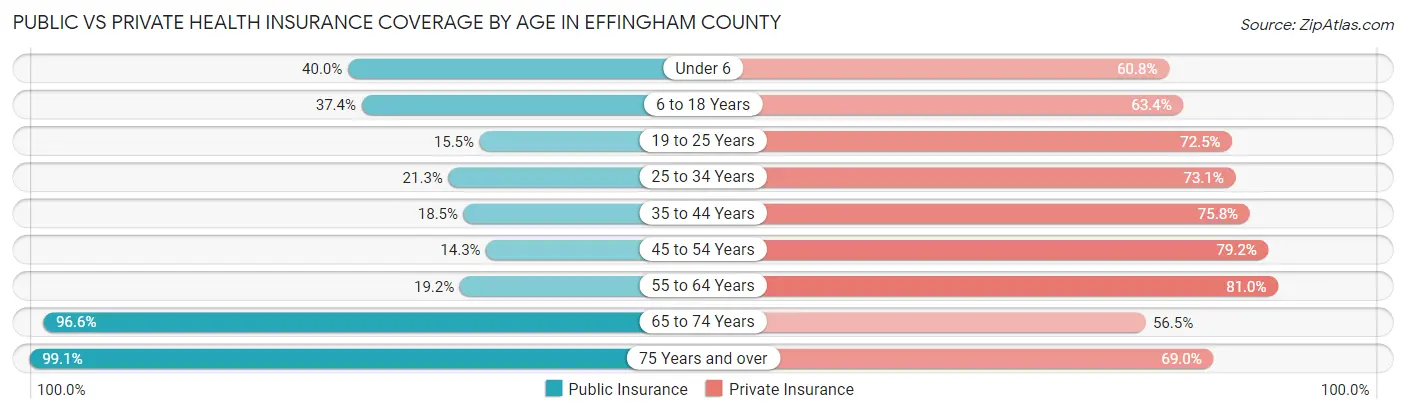
| Age Bracket | Public Insurance | Private Insurance |
| Under 6 | 1,050 (40.0%) | 1,597 (60.8%) |
| 6 to 18 Years | 2,218 (37.4%) | 3,760 (63.4%) |
| 19 to 25 Years | 404 (15.5%) | 1,890 (72.5%) |
| 25 to 34 Years | 895 (21.3%) | 3,073 (73.1%) |
| 35 to 44 Years | 755 (18.5%) | 3,096 (75.7%) |
| 45 to 54 Years | 561 (14.3%) | 3,113 (79.2%) |
| 55 to 64 Years | 947 (19.2%) | 4,001 (81.0%) |
| 65 to 74 Years | 3,365 (96.6%) | 1,967 (56.5%) |
| 75 Years and over | 2,391 (99.1%) | 1,664 (69.0%) |
| Total | 12,586 (36.8%) | 24,161 (70.6%) |
Disability Status by Sex by Age in Effingham County
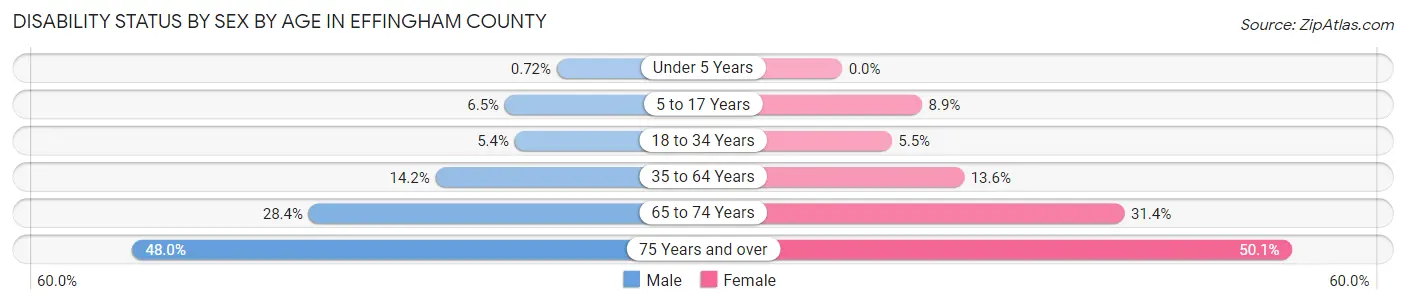
| Age Bracket | Male | Female |
| Under 5 Years | 8 (0.7%) | 0 (0.0%) |
| 5 to 17 Years | 205 (6.5%) | 254 (8.9%) |
| 18 to 34 Years | 199 (5.4%) | 189 (5.5%) |
| 35 to 64 Years | 939 (14.2%) | 863 (13.6%) |
| 65 to 74 Years | 480 (28.3%) | 563 (31.4%) |
| 75 Years and over | 495 (48.0%) | 691 (50.1%) |
Disability Class by Sex by Age in Effingham County
Disability Class: Hearing Difficulty
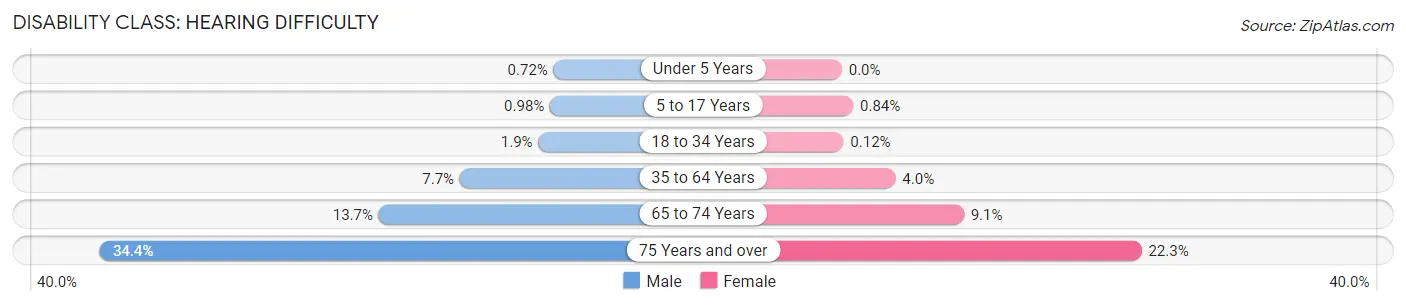
| Age Bracket | Male | Female |
| Under 5 Years | 8 (0.7%) | 0 (0.0%) |
| 5 to 17 Years | 31 (1.0%) | 24 (0.8%) |
| 18 to 34 Years | 68 (1.8%) | 4 (0.1%) |
| 35 to 64 Years | 507 (7.7%) | 253 (4.0%) |
| 65 to 74 Years | 232 (13.7%) | 162 (9.0%) |
| 75 Years and over | 355 (34.4%) | 307 (22.3%) |
Disability Class: Vision Difficulty
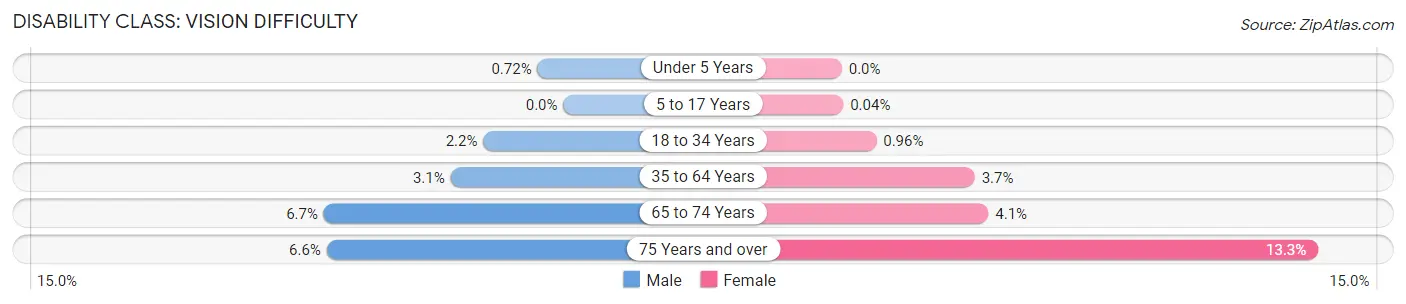
| Age Bracket | Male | Female |
| Under 5 Years | 8 (0.7%) | 0 (0.0%) |
| 5 to 17 Years | 0 (0.0%) | 1 (0.0%) |
| 18 to 34 Years | 82 (2.2%) | 33 (1.0%) |
| 35 to 64 Years | 207 (3.1%) | 235 (3.7%) |
| 65 to 74 Years | 113 (6.7%) | 73 (4.1%) |
| 75 Years and over | 68 (6.6%) | 183 (13.3%) |
Disability Class: Cognitive Difficulty
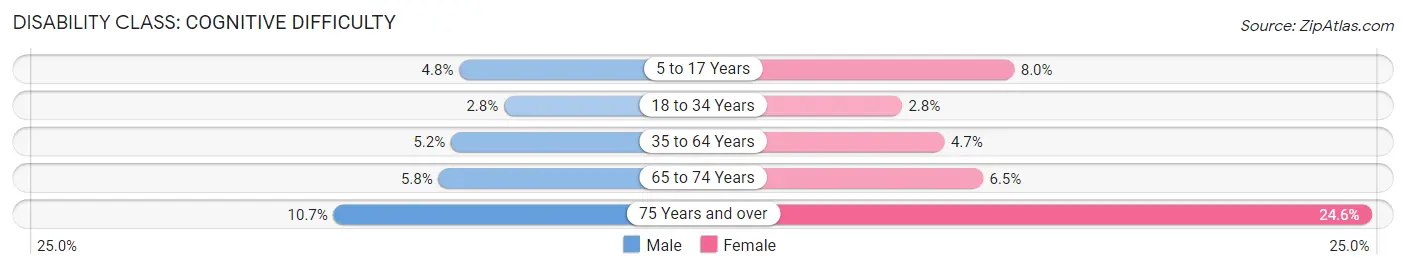
| Age Bracket | Male | Female |
| 5 to 17 Years | 152 (4.8%) | 228 (8.0%) |
| 18 to 34 Years | 101 (2.8%) | 95 (2.8%) |
| 35 to 64 Years | 344 (5.2%) | 301 (4.7%) |
| 65 to 74 Years | 98 (5.8%) | 117 (6.5%) |
| 75 Years and over | 110 (10.7%) | 339 (24.6%) |
Disability Class: Ambulatory Difficulty

| Age Bracket | Male | Female |
| 5 to 17 Years | 37 (1.2%) | 64 (2.2%) |
| 18 to 34 Years | 26 (0.7%) | 34 (1.0%) |
| 35 to 64 Years | 326 (4.9%) | 414 (6.5%) |
| 65 to 74 Years | 272 (16.1%) | 388 (21.7%) |
| 75 Years and over | 336 (32.6%) | 498 (36.1%) |
Disability Class: Self-Care Difficulty

| Age Bracket | Male | Female |
| 5 to 17 Years | 33 (1.1%) | 66 (2.3%) |
| 18 to 34 Years | 36 (1.0%) | 33 (1.0%) |
| 35 to 64 Years | 125 (1.9%) | 99 (1.6%) |
| 65 to 74 Years | 38 (2.2%) | 151 (8.4%) |
| 75 Years and over | 135 (13.1%) | 186 (13.5%) |
Technology Access in Effingham County
Computing Device Access in Effingham County
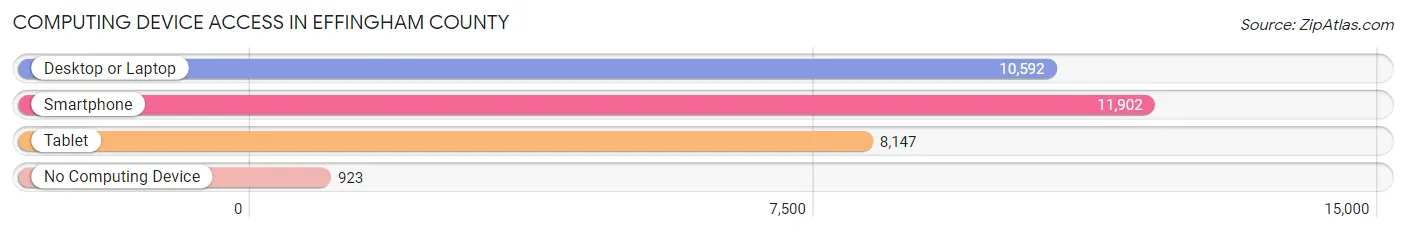
| Device Type | # Households | % Households |
| Desktop or Laptop | 10,592 | 75.1% |
| Smartphone | 11,902 | 84.4% |
| Tablet | 8,147 | 57.8% |
| No Computing Device | 923 | 6.6% |
| Total | 14,098 | 100.0% |
Internet Access in Effingham County
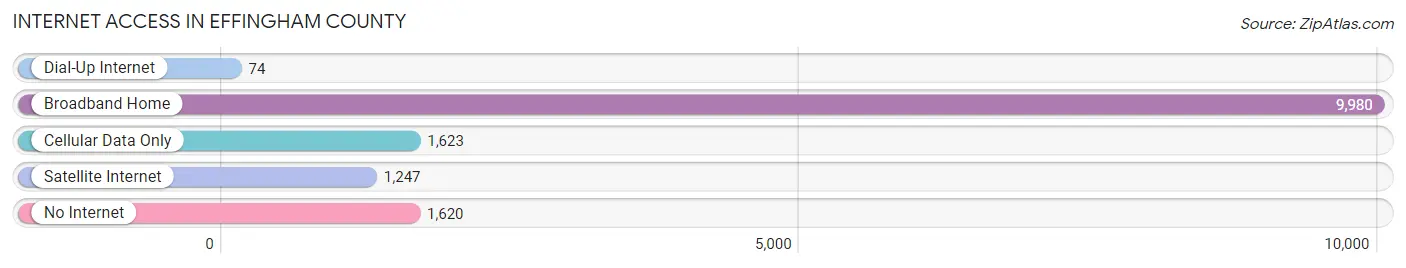
| Internet Type | # Households | % Households |
| Dial-Up Internet | 74 | 0.5% |
| Broadband Home | 9,980 | 70.8% |
| Cellular Data Only | 1,623 | 11.5% |
| Satellite Internet | 1,247 | 8.8% |
| No Internet | 1,620 | 11.5% |
| Total | 14,098 | 100.0% |
Effingham County Summary
Effingham County is located in the state of Illinois, in the United States of America. It is part of the Central Illinois region and is bordered by Fayette, Clay, Jasper, Cumberland, Shelby, and Marion counties. The county seat is Effingham, and the county has a total area of 576 square miles. As of the 2010 census, the population was 34,242.
History
Effingham County was formed in 1831 from parts of Fayette and Crawford counties. It was named after Lord Effingham, a British nobleman who opposed the Stamp Act of 1765. The county was originally settled by German immigrants, and the county seat was named after the German city of Effingham.
The county was an important center of the Underground Railroad, with many of the county's residents helping to hide and transport escaped slaves. During the Civil War, the county was divided between Union and Confederate sympathizers, and the county was the site of several skirmishes.
Geography
Effingham County is located in the Central Illinois region of the state. It is bordered by Fayette, Clay, Jasper, Cumberland, Shelby, and Marion counties. The county has a total area of 576 square miles, with the majority of the land being used for agricultural purposes. The terrain is mostly flat, with some rolling hills in the northern part of the county. The Kaskaskia River runs through the county, and there are several small lakes and ponds scattered throughout the area.
The climate of Effingham County is humid continental, with hot summers and cold winters. The average annual temperature is around 50°F, and the average annual precipitation is around 40 inches.
Economy
The economy of Effingham County is largely based on agriculture. The county is home to several large farms, and the main crops grown in the area are corn, soybeans, and wheat. The county is also home to several manufacturing companies, including a large automotive parts manufacturer.
The county is also home to several tourist attractions, including the Effingham County Fairgrounds, the Effingham County Museum, and the Effingham County Historical Society. The county is also home to several wineries and breweries, as well as several golf courses.
Demographics
As of the 2010 census, the population of Effingham County was 34,242. The racial makeup of the county was 95.3% White, 0.7% African American, 0.3% Native American, 0.7% Asian, 0.1% Pacific Islander, 1.7% from other races, and 1.1% from two or more races. Hispanic or Latino of any race were 3.3% of the population.
The median income for a household in the county was $45,945, and the median income for a family was $54,945. The per capita income for the county was $21,945. About 8.3% of families and 11.2% of the population were below the poverty line, including 15.2% of those under age 18 and 8.2% of those age 65 or over.
Common Questions
What is Per Capita Income in Effingham County?
Per Capita income in Effingham County is $37,844.
What is the Median Family Income in Effingham County?
Median Family Income in Effingham County is $89,840.
What is the Median Household income in Effingham County?
Median Household Income in Effingham County is $73,181.
What is Income or Wage Gap in Effingham County?
Income or Wage Gap in Effingham County is 32.6%.
Women in Effingham County earn 67.4 cents for every dollar earned by a man.
What is Family Income Deficit in Effingham County?
Family Income Deficit in Effingham County is $11,589.
Families that are below poverty line in Effingham County earn $11,589 less on average than the poverty threshold level.
What is Inequality or Gini Index in Effingham County?
Inequality or Gini Index in Effingham County is 0.44.
What is the Total Population of Effingham County?
Total Population of Effingham County is 34,594.
What is the Total Male Population of Effingham County?
Total Male Population of Effingham County is 17,394.
What is the Total Female Population of Effingham County?
Total Female Population of Effingham County is 17,200.
What is the Ratio of Males per 100 Females in Effingham County?
There are 101.13 Males per 100 Females in Effingham County.
What is the Ratio of Females per 100 Males in Effingham County?
There are 98.88 Females per 100 Males in Effingham County.
What is the Median Population Age in Effingham County?
Median Population Age in Effingham County is 39.3 Years.
What is the Average Family Size in Effingham County
Average Family Size in Effingham County is 3.0 People.
What is the Average Household Size in Effingham County
Average Household Size in Effingham County is 2.4 People.
How Large is the Labor Force in Effingham County?
There are 18,050 People in the Labor Forcein in Effingham County.
What is the Percentage of People in the Labor Force in Effingham County?
66.4% of People are in the Labor Force in Effingham County.
What is the Unemployment Rate in Effingham County?
Unemployment Rate in Effingham County is 2.5%.