De Witt County, IL Map & Demographics
De Witt County Map
De Witt County Overview
$35,630
PER CAPITA INCOME
$86,064
AVG FAMILY INCOME
$61,823
AVG HOUSEHOLD INCOME
30.9%
WAGE / INCOME GAP [ % ]
69.1¢/ $1
WAGE / INCOME GAP [ $ ]
$9,770
FAMILY INCOME DEFICIT
0.42
INEQUALITY / GINI INDEX
15,535
TOTAL POPULATION
7,822
MALE POPULATION
7,713
FEMALE POPULATION
101.41
MALES / 100 FEMALES
98.61
FEMALES / 100 MALES
44.0
MEDIAN AGE
3.0
AVG FAMILY SIZE
2.3
AVG HOUSEHOLD SIZE
8,061
LABOR FORCE [ PEOPLE ]
63.3%
PERCENT IN LABOR FORCE
5.4%
UNEMPLOYMENT RATE
Income in De Witt County
Income Overview in De Witt County
Per Capita Income in De Witt County is $35,630, while median incomes of families and households are $86,064 and $61,823 respectively.
| Characteristic | Number | Measure |
| Per Capita Income | 15,535 | $35,630 |
| Median Family Income | 4,042 | $86,064 |
| Mean Family Income | 4,042 | $97,958 |
| Median Household Income | 6,644 | $61,823 |
| Mean Household Income | 6,644 | $80,318 |
| Income Deficit | 4,042 | $9,770 |
| Wage / Income Gap (%) | 15,535 | 30.93% |
| Wage / Income Gap ($) | 15,535 | 69.07¢ per $1 |
| Gini / Inequality Index | 15,535 | 0.42 |
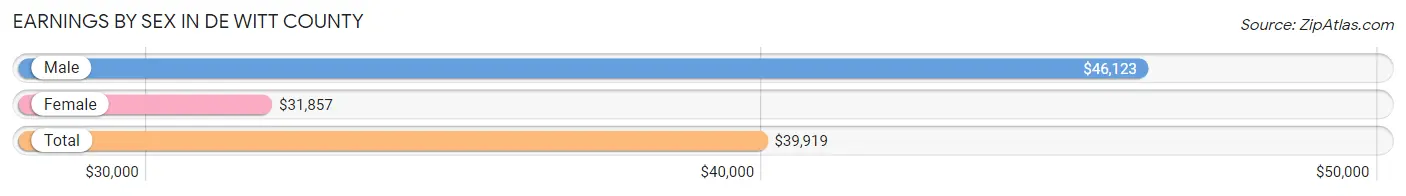
Earnings by Sex in De Witt County
Average Earnings in De Witt County are $39,919, $46,123 for men and $31,857 for women, a difference of 30.9%.
| Sex | Number | Average Earnings |
| Male | 4,423 (53.4%) | $46,123 |
| Female | 3,865 (46.6%) | $31,857 |
| Total | 8,288 (100.0%) | $39,919 |
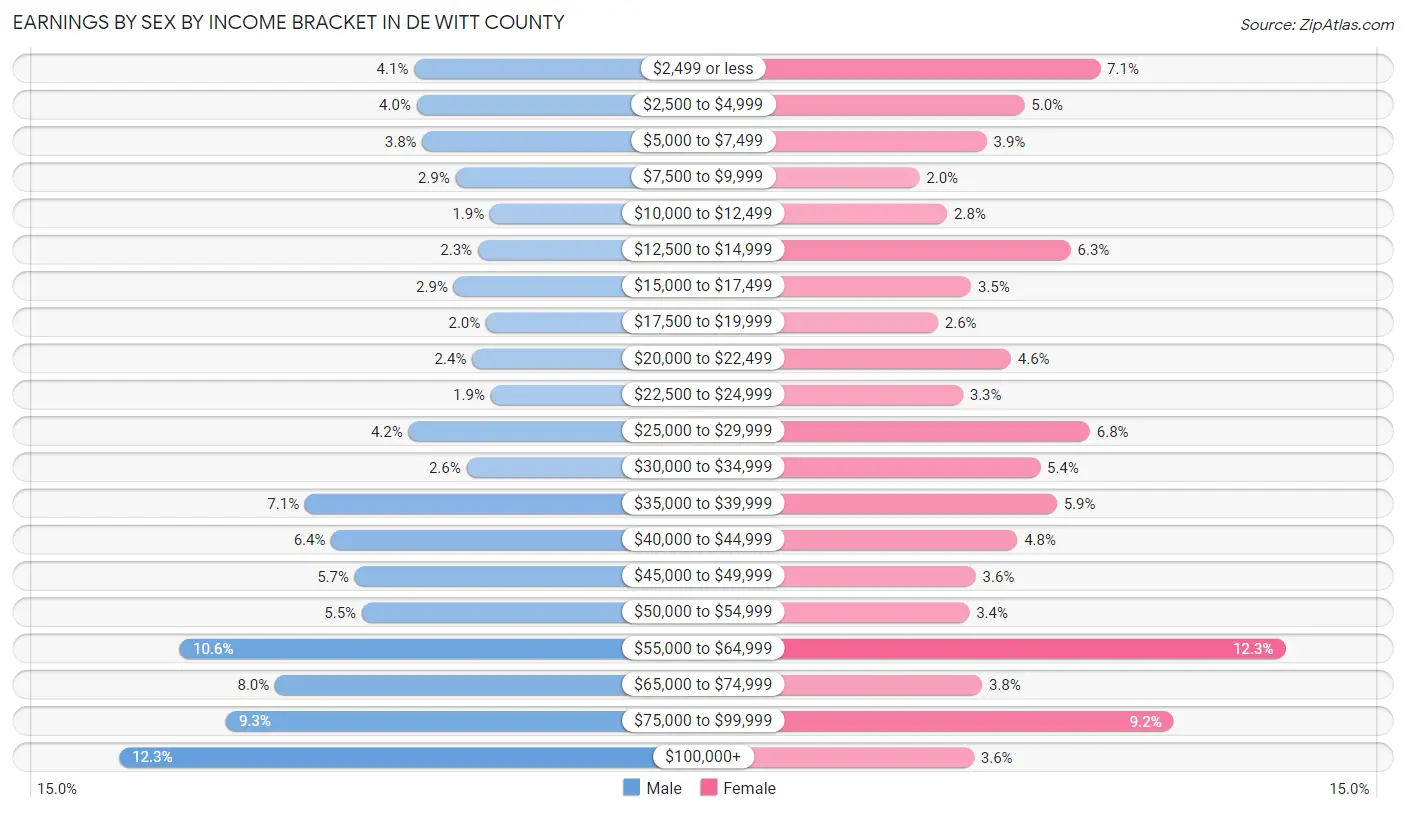
Earnings by Sex by Income Bracket in De Witt County
The most common earnings brackets in De Witt County are $100,000+ for men (546 | 12.3%) and $55,000 to $64,999 for women (476 | 12.3%).
| Income | Male | Female |
| $2,499 or less | 179 (4.1%) | 275 (7.1%) |
| $2,500 to $4,999 | 176 (4.0%) | 193 (5.0%) |
| $5,000 to $7,499 | 169 (3.8%) | 152 (3.9%) |
| $7,500 to $9,999 | 128 (2.9%) | 79 (2.0%) |
| $10,000 to $12,499 | 85 (1.9%) | 109 (2.8%) |
| $12,500 to $14,999 | 100 (2.3%) | 243 (6.3%) |
| $15,000 to $17,499 | 130 (2.9%) | 135 (3.5%) |
| $17,500 to $19,999 | 90 (2.0%) | 99 (2.6%) |
| $20,000 to $22,499 | 107 (2.4%) | 178 (4.6%) |
| $22,500 to $24,999 | 84 (1.9%) | 126 (3.3%) |
| $25,000 to $29,999 | 186 (4.2%) | 264 (6.8%) |
| $30,000 to $34,999 | 114 (2.6%) | 210 (5.4%) |
| $35,000 to $39,999 | 315 (7.1%) | 228 (5.9%) |
| $40,000 to $44,999 | 282 (6.4%) | 185 (4.8%) |
| $45,000 to $49,999 | 253 (5.7%) | 140 (3.6%) |
| $50,000 to $54,999 | 244 (5.5%) | 133 (3.4%) |
| $55,000 to $64,999 | 470 (10.6%) | 476 (12.3%) |
| $65,000 to $74,999 | 352 (8.0%) | 147 (3.8%) |
| $75,000 to $99,999 | 413 (9.3%) | 355 (9.2%) |
| $100,000+ | 546 (12.3%) | 138 (3.6%) |
| Total | 4,423 (100.0%) | 3,865 (100.0%) |
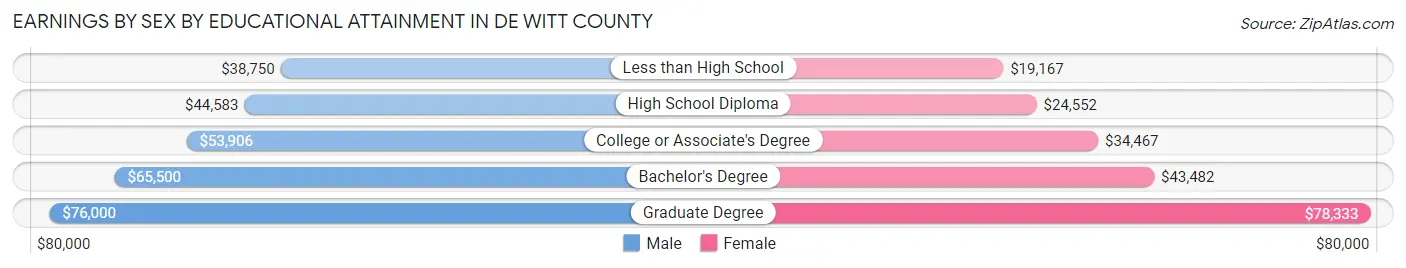
Earnings by Sex by Educational Attainment in De Witt County
Average earnings in De Witt County are $51,236 for men and $36,261 for women, a difference of 29.2%. Men with an educational attainment of graduate degree enjoy the highest average annual earnings of $76,000, while those with less than high school education earn the least with $38,750. Women with an educational attainment of graduate degree earn the most with the average annual earnings of $78,333, while those with less than high school education have the smallest earnings of $19,167.
| Educational Attainment | Male Income | Female Income |
| Less than High School | $38,750 | $19,167 |
| High School Diploma | $44,583 | $24,552 |
| College or Associate's Degree | $53,906 | $34,467 |
| Bachelor's Degree | $65,500 | $43,482 |
| Graduate Degree | $76,000 | $78,333 |
| Total | $51,236 | $36,261 |
Family Income in De Witt County
Family Income Brackets in De Witt County
According to the De Witt County family income data, there are 1,160 families falling into the $100,000 to $149,999 income range, which is the most common income bracket and makes up 28.7% of all families. Conversely, the $10,000 to $14,999 income bracket is the least frequent group with only 53 families (1.3%) belonging to this category.
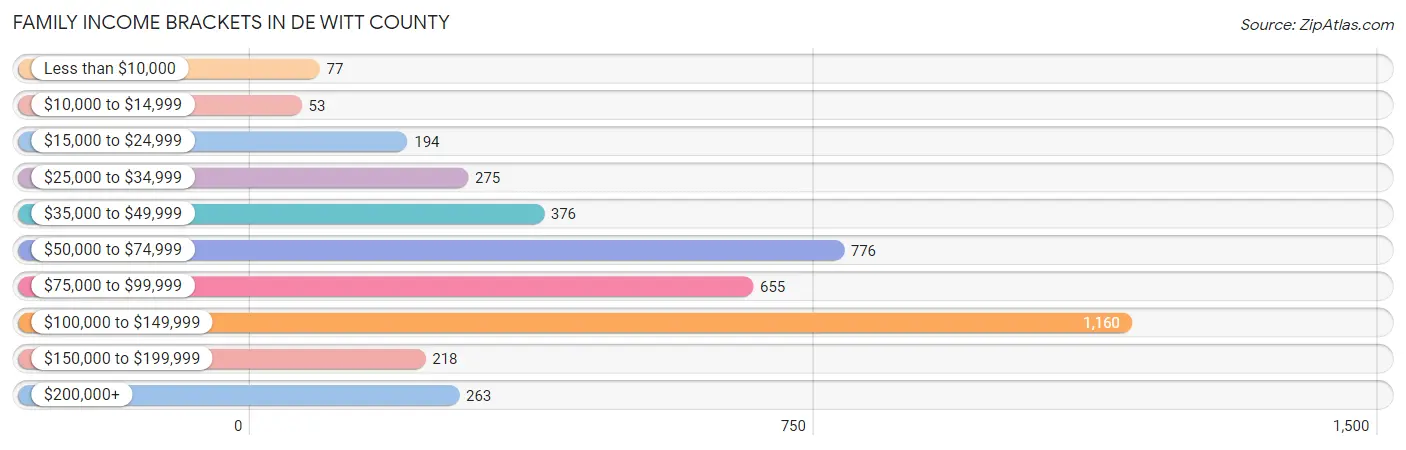
| Income Bracket | # Families | % Families |
| Less than $10,000 | 77 | 1.9% |
| $10,000 to $14,999 | 53 | 1.3% |
| $15,000 to $24,999 | 194 | 4.8% |
| $25,000 to $34,999 | 275 | 6.8% |
| $35,000 to $49,999 | 376 | 9.3% |
| $50,000 to $74,999 | 776 | 19.2% |
| $75,000 to $99,999 | 655 | 16.2% |
| $100,000 to $149,999 | 1,160 | 28.7% |
| $150,000 to $199,999 | 218 | 5.4% |
| $200,000+ | 263 | 6.5% |
Family Income by Famaliy Size in De Witt County
4-person families (658 | 16.3%) account for the highest median family income in De Witt County with $106,290 per family, while 2-person families (2,419 | 59.9%) have the highest median income of $39,024 per family member.
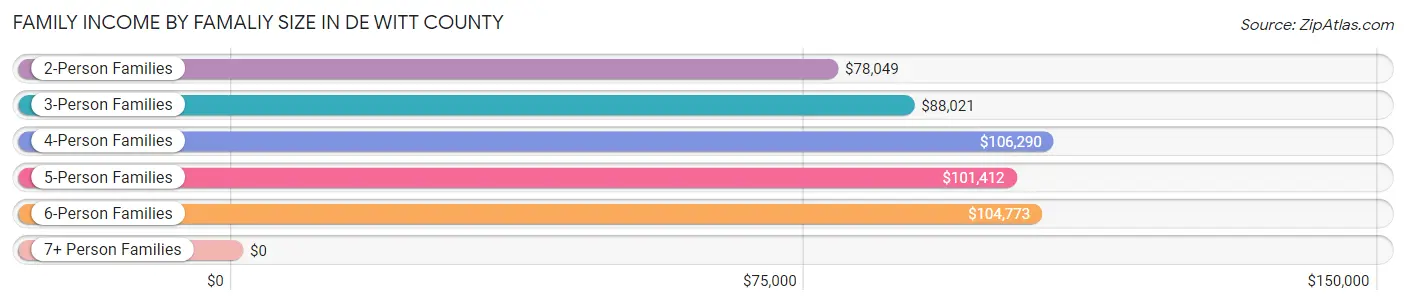
| Income Bracket | # Families | Median Income |
| 2-Person Families | 2,419 (59.9%) | $78,049 |
| 3-Person Families | 591 (14.6%) | $88,021 |
| 4-Person Families | 658 (16.3%) | $106,290 |
| 5-Person Families | 221 (5.5%) | $101,412 |
| 6-Person Families | 140 (3.5%) | $104,773 |
| 7+ Person Families | 13 (0.3%) | $0 |
| Total | 4,042 (100.0%) | $86,064 |
Family Income by Number of Earners in De Witt County
The median family income in De Witt County is $86,064, with families comprising 3+ earners (351) having the highest median family income of $120,481, while families with no earners (706) have the lowest median family income of $50,672, accounting for 8.7% and 17.5% of families, respectively.
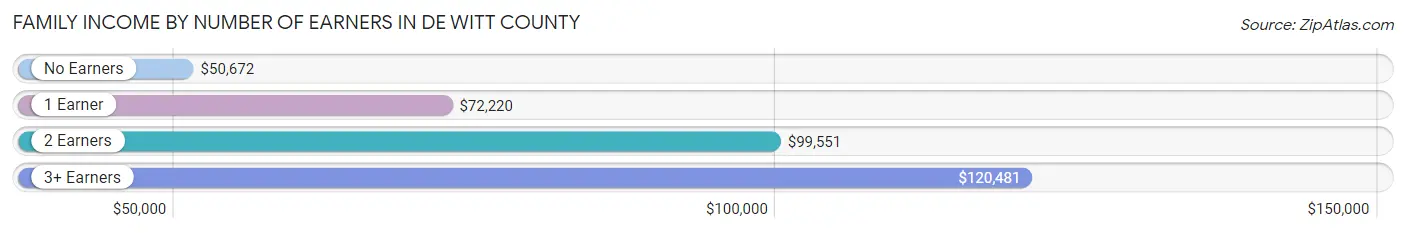
| Number of Earners | # Families | Median Income |
| No Earners | 706 (17.5%) | $50,672 |
| 1 Earner | 1,305 (32.3%) | $72,220 |
| 2 Earners | 1,680 (41.6%) | $99,551 |
| 3+ Earners | 351 (8.7%) | $120,481 |
| Total | 4,042 (100.0%) | $86,064 |
Household Income in De Witt County
Household Income Brackets in De Witt County
With 1,342 households falling in the category, the $100,000 to $149,999 income range is the most frequent in De Witt County, accounting for 20.2% of all households. In contrast, only 219 households (3.3%) fall into the $10,000 to $14,999 income bracket, making it the least populous group.
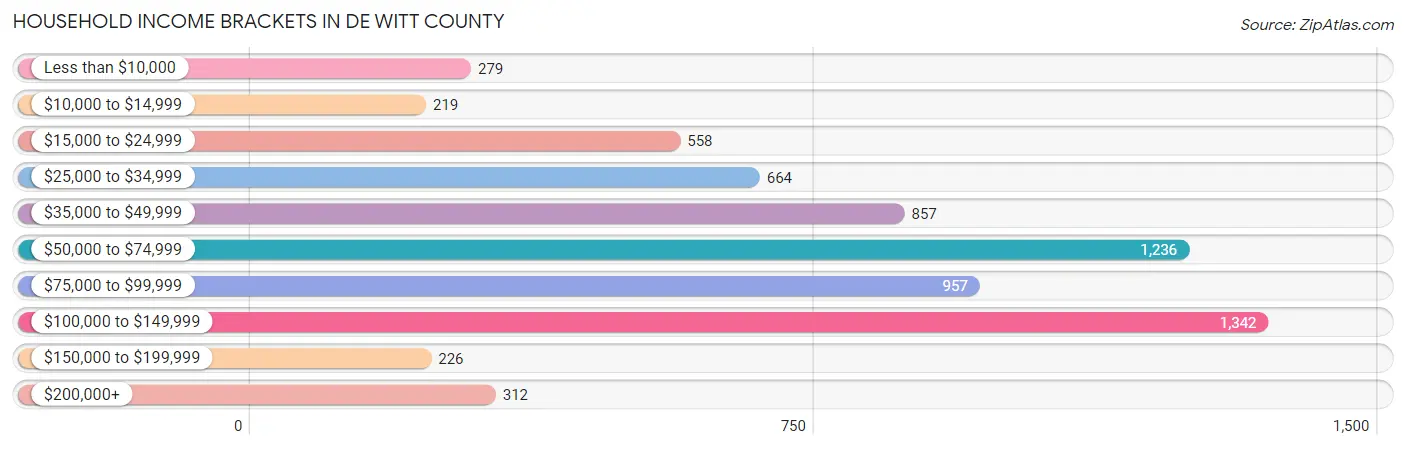
| Income Bracket | # Households | % Households |
| Less than $10,000 | 279 | 4.2% |
| $10,000 to $14,999 | 219 | 3.3% |
| $15,000 to $24,999 | 558 | 8.4% |
| $25,000 to $34,999 | 664 | 10.0% |
| $35,000 to $49,999 | 857 | 12.9% |
| $50,000 to $74,999 | 1,236 | 18.6% |
| $75,000 to $99,999 | 957 | 14.4% |
| $100,000 to $149,999 | 1,342 | 20.2% |
| $150,000 to $199,999 | 226 | 3.4% |
| $200,000+ | 312 | 4.7% |
Household Income by Householder Age in De Witt County
The median household income in De Witt County is $61,823, with the highest median household income of $83,731 found in the 45 to 64 years age bracket for the primary householder. A total of 2,395 households (36.0%) fall into this category. Meanwhile, the 15 to 24 years age bracket for the primary householder has the lowest median household income of $37,850, with 283 households (4.3%) in this group.
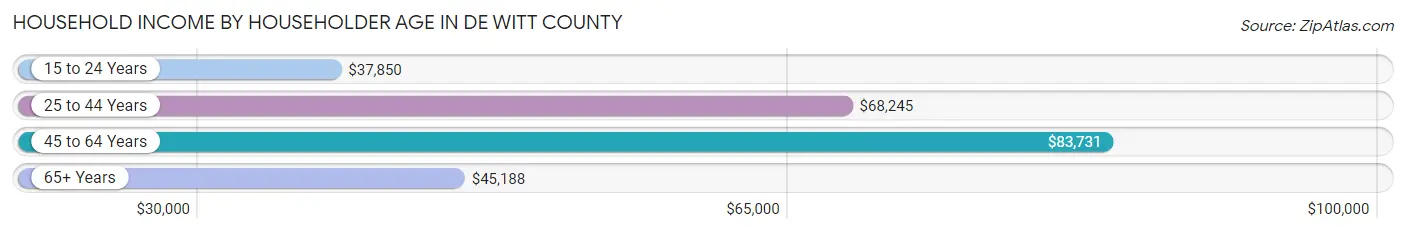
| Income Bracket | # Households | Median Income |
| 15 to 24 Years | 283 (4.3%) | $37,850 |
| 25 to 44 Years | 1,930 (29.0%) | $68,245 |
| 45 to 64 Years | 2,395 (36.0%) | $83,731 |
| 65+ Years | 2,036 (30.6%) | $45,188 |
| Total | 6,644 (100.0%) | $61,823 |
Poverty in De Witt County
Income Below Poverty by Sex and Age in De Witt County
With 9.1% poverty level for males and 11.3% for females among the residents of De Witt County, under 5 year old males and 15 year old females are the most vulnerable to poverty, with 161 males (37.3%) and 38 females (38.0%) in their respective age groups living below the poverty level.
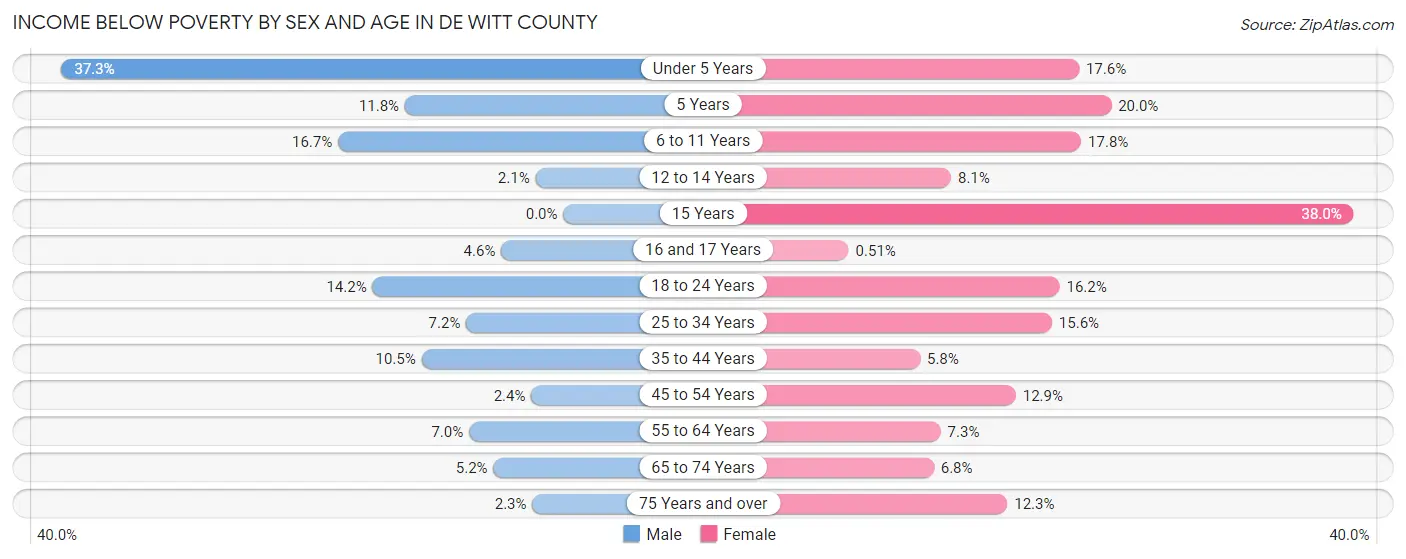
| Age Bracket | Male | Female |
| Under 5 Years | 161 (37.3%) | 75 (17.6%) |
| 5 Years | 14 (11.8%) | 16 (20.0%) |
| 6 to 11 Years | 94 (16.7%) | 75 (17.8%) |
| 12 to 14 Years | 5 (2.1%) | 30 (8.1%) |
| 15 Years | 0 (0.0%) | 38 (38.0%) |
| 16 and 17 Years | 13 (4.6%) | 1 (0.5%) |
| 18 to 24 Years | 88 (14.2%) | 87 (16.2%) |
| 25 to 34 Years | 60 (7.2%) | 127 (15.6%) |
| 35 to 44 Years | 99 (10.5%) | 54 (5.8%) |
| 45 to 54 Years | 26 (2.4%) | 123 (12.9%) |
| 55 to 64 Years | 86 (7.0%) | 87 (7.3%) |
| 65 to 74 Years | 44 (5.2%) | 61 (6.8%) |
| 75 Years and over | 11 (2.3%) | 82 (12.3%) |
| Total | 701 (9.1%) | 856 (11.3%) |
Income Above Poverty by Sex and Age in De Witt County
According to the poverty statistics in De Witt County, males aged 15 years and females aged 16 and 17 years are the age groups that are most secure financially, with 100.0% of males and 99.5% of females in these age groups living above the poverty line.
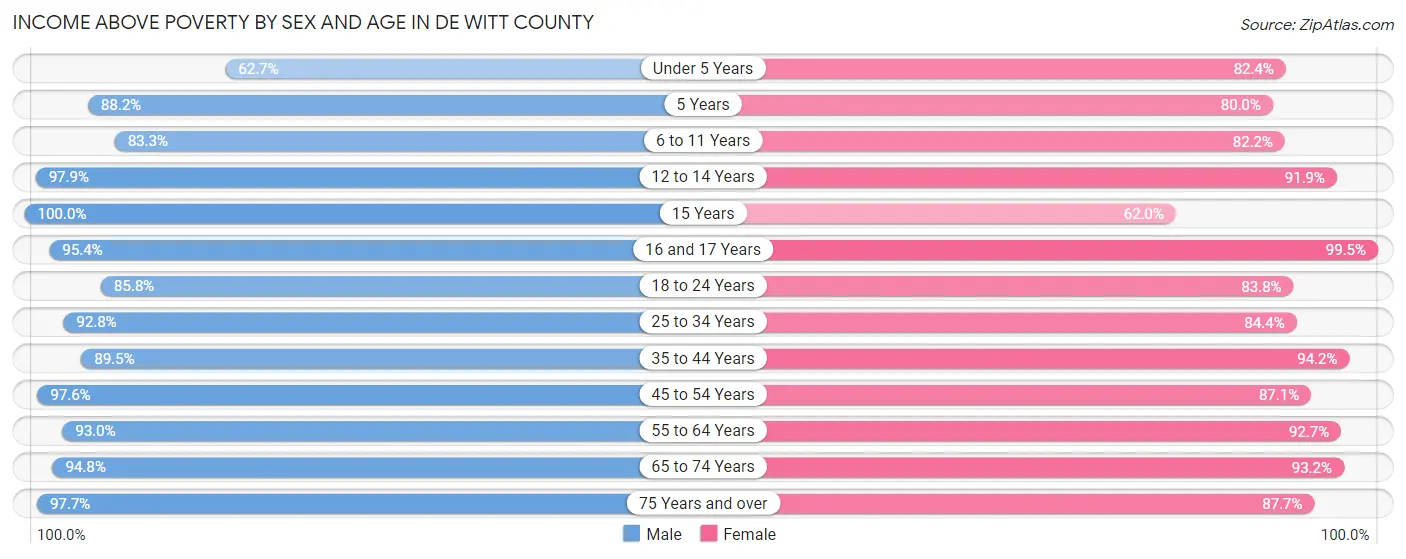
| Age Bracket | Male | Female |
| Under 5 Years | 271 (62.7%) | 351 (82.4%) |
| 5 Years | 105 (88.2%) | 64 (80.0%) |
| 6 to 11 Years | 468 (83.3%) | 347 (82.2%) |
| 12 to 14 Years | 236 (97.9%) | 340 (91.9%) |
| 15 Years | 28 (100.0%) | 62 (62.0%) |
| 16 and 17 Years | 269 (95.4%) | 195 (99.5%) |
| 18 to 24 Years | 533 (85.8%) | 451 (83.8%) |
| 25 to 34 Years | 772 (92.8%) | 687 (84.4%) |
| 35 to 44 Years | 841 (89.5%) | 876 (94.2%) |
| 45 to 54 Years | 1,067 (97.6%) | 829 (87.1%) |
| 55 to 64 Years | 1,143 (93.0%) | 1,099 (92.7%) |
| 65 to 74 Years | 803 (94.8%) | 832 (93.2%) |
| 75 Years and over | 468 (97.7%) | 585 (87.7%) |
| Total | 7,004 (90.9%) | 6,718 (88.7%) |
Income Below Poverty Among Married-Couple Families in De Witt County
The poverty statistics for married-couple families in De Witt County show that 2.8% or 90 of the total 3,233 families live below the poverty line. Families with 1 or 2 children have the highest poverty rate of 5.6%, comprising of 44 families. On the other hand, families with 5 or more children have the lowest poverty rate of 0.0%, which includes 0 families.
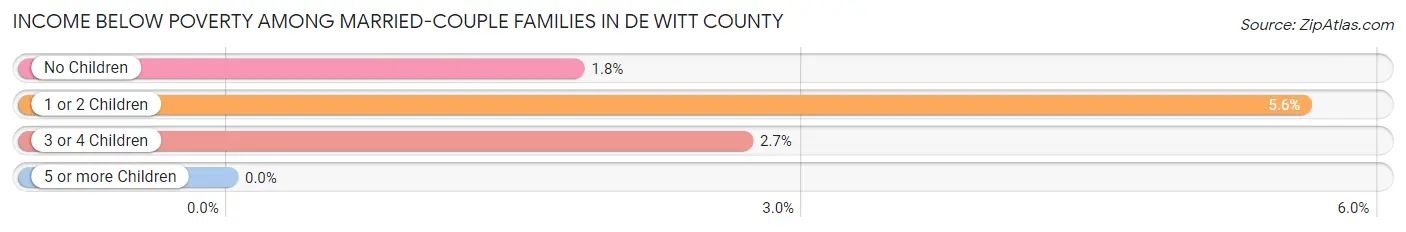
| Children | Above Poverty | Below Poverty |
| No Children | 2,172 (98.2%) | 40 (1.8%) |
| 1 or 2 Children | 741 (94.4%) | 44 (5.6%) |
| 3 or 4 Children | 217 (97.3%) | 6 (2.7%) |
| 5 or more Children | 13 (100.0%) | 0 (0.0%) |
| Total | 3,143 (97.2%) | 90 (2.8%) |
Income Below Poverty Among Single-Parent Households in De Witt County
According to the poverty data in De Witt County, 3.2% or 8 single-father households and 25.9% or 145 single-mother households are living below the poverty line. Among single-father households, those with 1 or 2 children have the highest poverty rate, with 5 households (5.9%) experiencing poverty. Likewise, among single-mother households, those with 3 or 4 children have the highest poverty rate, with 28 households (96.6%) falling below the poverty line.
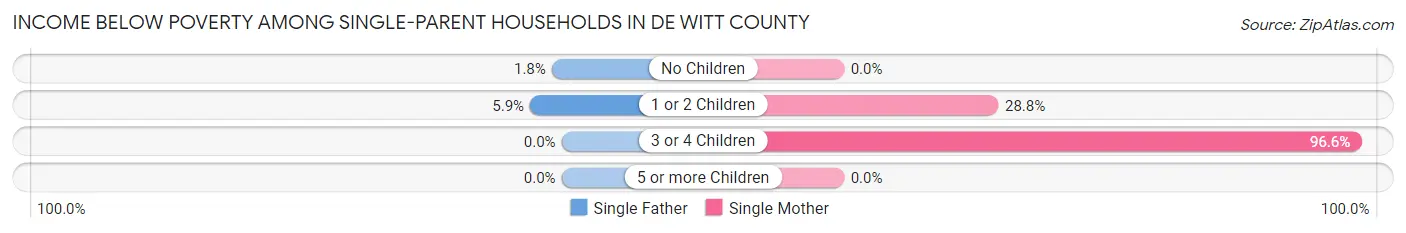
| Children | Single Father | Single Mother |
| No Children | 3 (1.8%) | 0 (0.0%) |
| 1 or 2 Children | 5 (5.9%) | 117 (28.7%) |
| 3 or 4 Children | 0 (0.0%) | 28 (96.6%) |
| 5 or more Children | 0 (0.0%) | 0 (0.0%) |
| Total | 8 (3.2%) | 145 (25.9%) |
Income Below Poverty Among Married-Couple vs Single-Parent Households in De Witt County
The poverty data for De Witt County shows that 90 of the married-couple family households (2.8%) and 153 of the single-parent households (18.9%) are living below the poverty level. Within the married-couple family households, those with 1 or 2 children have the highest poverty rate, with 44 households (5.6%) falling below the poverty line. Among the single-parent households, those with 3 or 4 children have the highest poverty rate, with 28 household (96.6%) living below poverty.
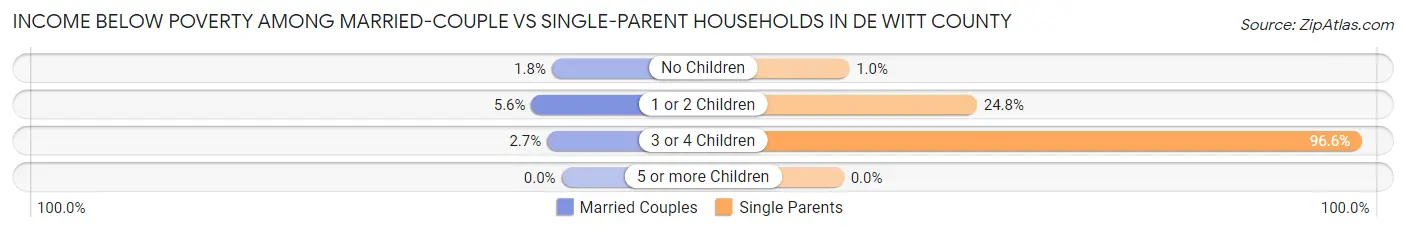
| Children | Married-Couple Families | Single-Parent Households |
| No Children | 40 (1.8%) | 3 (1.0%) |
| 1 or 2 Children | 44 (5.6%) | 122 (24.8%) |
| 3 or 4 Children | 6 (2.7%) | 28 (96.6%) |
| 5 or more Children | 0 (0.0%) | 0 (0.0%) |
| Total | 90 (2.8%) | 153 (18.9%) |
Race in De Witt County
The most populous races in De Witt County are White / Caucasian (14,790 | 95.2%), Hispanic or Latino (470 | 3.0%), and Two or more Races (432 | 2.8%).
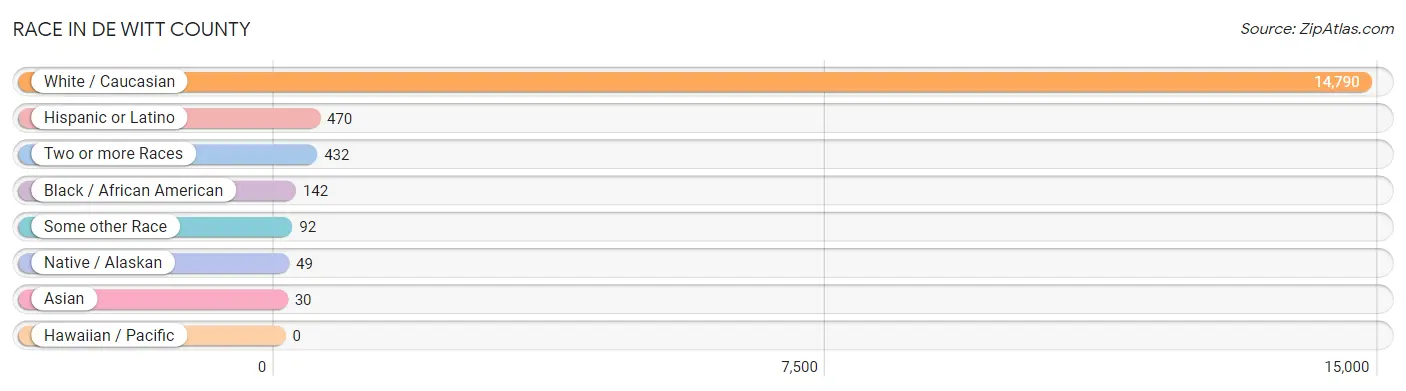
| Race | # Population | % Population |
| Asian | 30 | 0.2% |
| Black / African American | 142 | 0.9% |
| Hawaiian / Pacific | 0 | 0.0% |
| Hispanic or Latino | 470 | 3.0% |
| Native / Alaskan | 49 | 0.3% |
| White / Caucasian | 14,790 | 95.2% |
| Two or more Races | 432 | 2.8% |
| Some other Race | 92 | 0.6% |
| Total | 15,535 | 100.0% |
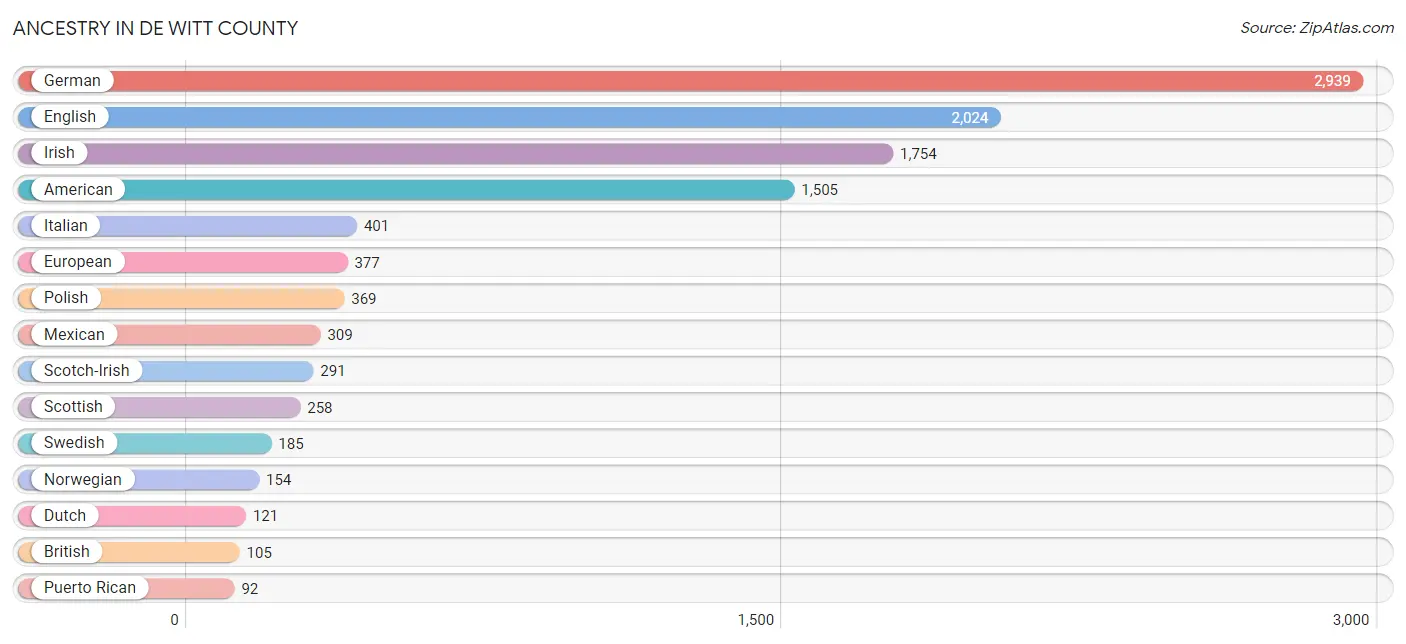
Ancestry in De Witt County
The most populous ancestries reported in De Witt County are German (2,939 | 18.9%), English (2,024 | 13.0%), Irish (1,754 | 11.3%), American (1,505 | 9.7%), and Italian (401 | 2.6%), together accounting for 55.5% of all De Witt County residents.
| Ancestry | # Population | % Population |
| African | 4 | 0.0% |
| Albanian | 19 | 0.1% |
| American | 1,505 | 9.7% |
| Arab | 24 | 0.2% |
| Austrian | 22 | 0.1% |
| Belgian | 7 | 0.1% |
| Bhutanese | 56 | 0.4% |
| British | 105 | 0.7% |
| Burmese | 24 | 0.2% |
| Canadian | 89 | 0.6% |
| Celtic | 3 | 0.0% |
| Cherokee | 91 | 0.6% |
| Czech | 9 | 0.1% |
| Danish | 12 | 0.1% |
| Dutch | 121 | 0.8% |
| Eastern European | 6 | 0.0% |
| Egyptian | 24 | 0.2% |
| English | 2,024 | 13.0% |
| European | 377 | 2.4% |
| Filipino | 9 | 0.1% |
| French | 76 | 0.5% |
| German | 2,939 | 18.9% |
| Greek | 19 | 0.1% |
| Hungarian | 43 | 0.3% |
| Irish | 1,754 | 11.3% |
| Iroquois | 4 | 0.0% |
| Italian | 401 | 2.6% |
| Jamaican | 4 | 0.0% |
| Lithuanian | 13 | 0.1% |
| Mexican | 309 | 2.0% |
| Northern European | 6 | 0.0% |
| Norwegian | 154 | 1.0% |
| Pennsylvania German | 17 | 0.1% |
| Polish | 369 | 2.4% |
| Portuguese | 19 | 0.1% |
| Puerto Rican | 92 | 0.6% |
| Romanian | 14 | 0.1% |
| Scandinavian | 29 | 0.2% |
| Scotch-Irish | 291 | 1.9% |
| Scottish | 258 | 1.7% |
| Slavic | 2 | 0.0% |
| Slovene | 10 | 0.1% |
| Spaniard | 16 | 0.1% |
| Spanish | 39 | 0.3% |
| Subsaharan African | 4 | 0.0% |
| Swedish | 185 | 1.2% |
| Swiss | 16 | 0.1% |
| Thai | 10 | 0.1% |
| Ukrainian | 22 | 0.1% |
| Welsh | 68 | 0.4% |
| West Indian | 1 | 0.0% | View All 51 Rows |
Immigrants in De Witt County
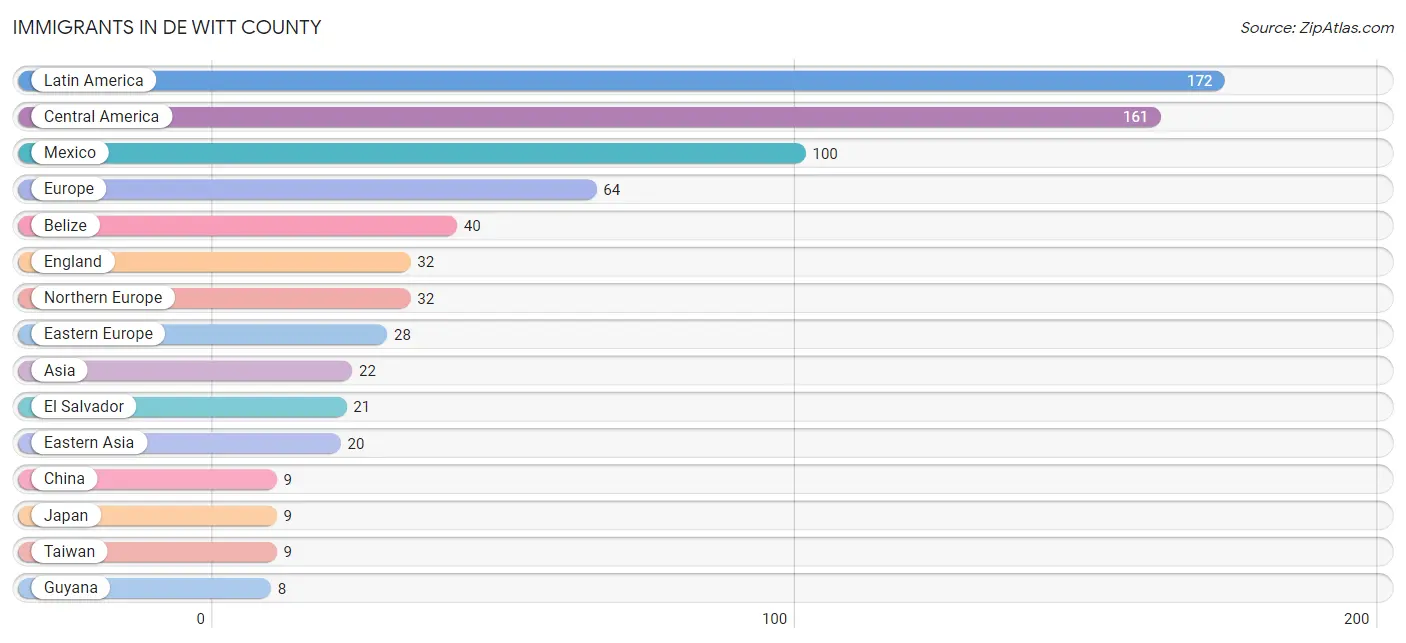
The most numerous immigrant groups reported in De Witt County came from Latin America (172 | 1.1%), Central America (161 | 1.0%), Mexico (100 | 0.6%), Europe (64 | 0.4%), and Belize (40 | 0.3%), together accounting for 3.5% of all De Witt County residents.
| Immigration Origin | # Population | % Population |
| Asia | 22 | 0.1% |
| Belize | 40 | 0.3% |
| Caribbean | 3 | 0.0% |
| Central America | 161 | 1.0% |
| China | 9 | 0.1% |
| Eastern Asia | 20 | 0.1% |
| Eastern Europe | 28 | 0.2% |
| El Salvador | 21 | 0.1% |
| England | 32 | 0.2% |
| Europe | 64 | 0.4% |
| Germany | 4 | 0.0% |
| Guyana | 8 | 0.1% |
| India | 2 | 0.0% |
| Jamaica | 3 | 0.0% |
| Japan | 9 | 0.1% |
| Korea | 2 | 0.0% |
| Latin America | 172 | 1.1% |
| Mexico | 100 | 0.6% |
| Northern Europe | 32 | 0.2% |
| South America | 8 | 0.1% |
| South Central Asia | 2 | 0.0% |
| Taiwan | 9 | 0.1% |
| Western Europe | 4 | 0.0% | View All 23 Rows |
Sex and Age in De Witt County
Sex and Age in De Witt County
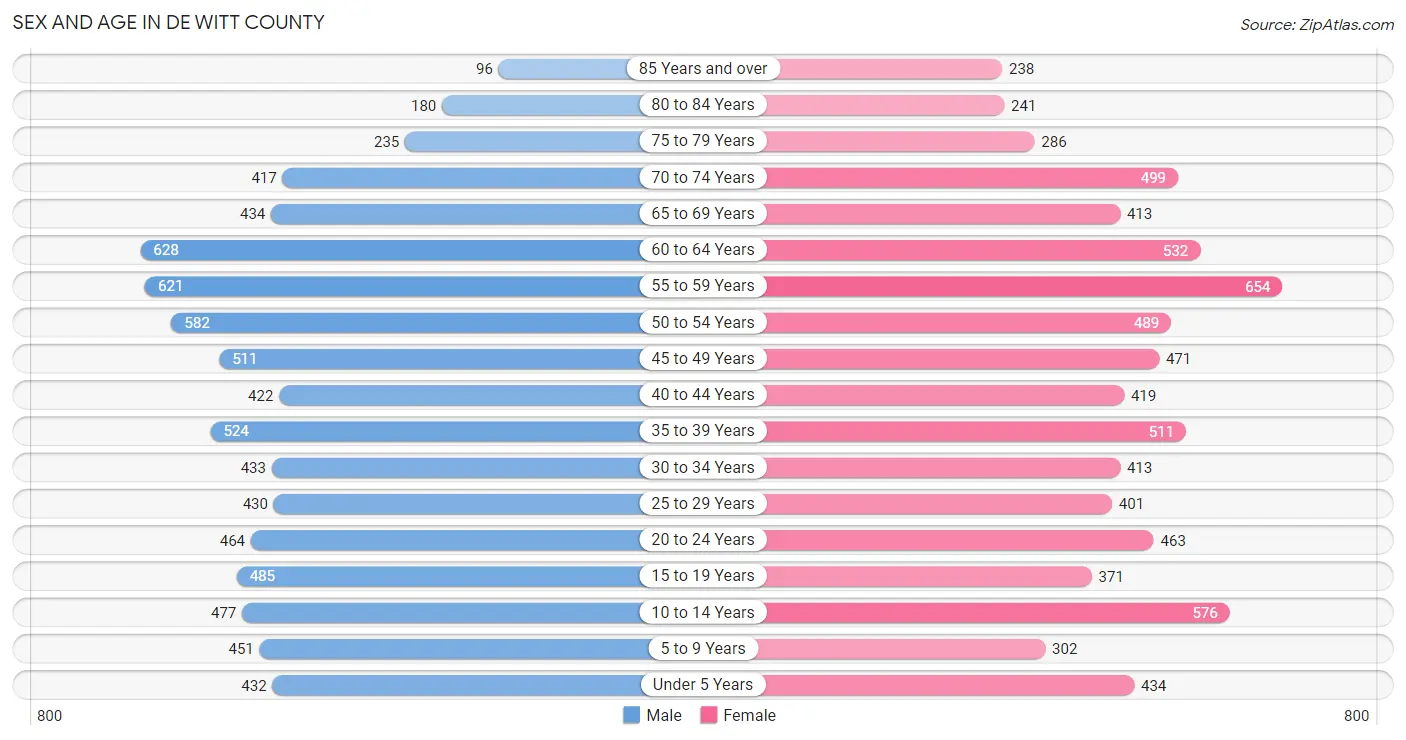
The most populous age groups in De Witt County are 60 to 64 Years (628 | 8.0%) for men and 55 to 59 Years (654 | 8.5%) for women.
| Age Bracket | Male | Female |
| Under 5 Years | 432 (5.5%) | 434 (5.6%) |
| 5 to 9 Years | 451 (5.8%) | 302 (3.9%) |
| 10 to 14 Years | 477 (6.1%) | 576 (7.5%) |
| 15 to 19 Years | 485 (6.2%) | 371 (4.8%) |
| 20 to 24 Years | 464 (5.9%) | 463 (6.0%) |
| 25 to 29 Years | 430 (5.5%) | 401 (5.2%) |
| 30 to 34 Years | 433 (5.5%) | 413 (5.3%) |
| 35 to 39 Years | 524 (6.7%) | 511 (6.6%) |
| 40 to 44 Years | 422 (5.4%) | 419 (5.4%) |
| 45 to 49 Years | 511 (6.5%) | 471 (6.1%) |
| 50 to 54 Years | 582 (7.4%) | 489 (6.3%) |
| 55 to 59 Years | 621 (7.9%) | 654 (8.5%) |
| 60 to 64 Years | 628 (8.0%) | 532 (6.9%) |
| 65 to 69 Years | 434 (5.6%) | 413 (5.3%) |
| 70 to 74 Years | 417 (5.3%) | 499 (6.5%) |
| 75 to 79 Years | 235 (3.0%) | 286 (3.7%) |
| 80 to 84 Years | 180 (2.3%) | 241 (3.1%) |
| 85 Years and over | 96 (1.2%) | 238 (3.1%) |
| Total | 7,822 (100.0%) | 7,713 (100.0%) |
Families and Households in De Witt County
Median Family Size in De Witt County
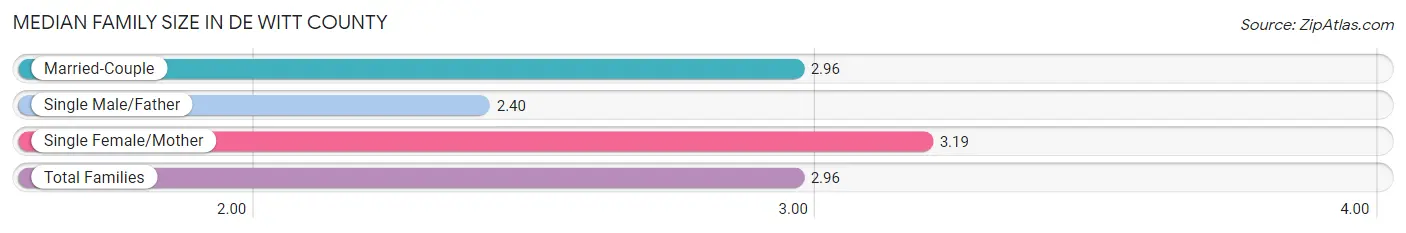
The median family size in De Witt County is 2.96 persons per family, with single female/mother families (561 | 13.9%) accounting for the largest median family size of 3.19 persons per family. On the other hand, single male/father families (248 | 6.1%) represent the smallest median family size with 2.40 persons per family.
| Family Type | # Families | Family Size |
| Married-Couple | 3,233 (80.0%) | 2.96 |
| Single Male/Father | 248 (6.1%) | 2.40 |
| Single Female/Mother | 561 (13.9%) | 3.19 |
| Total Families | 4,042 (100.0%) | 2.96 |
Median Household Size in De Witt County
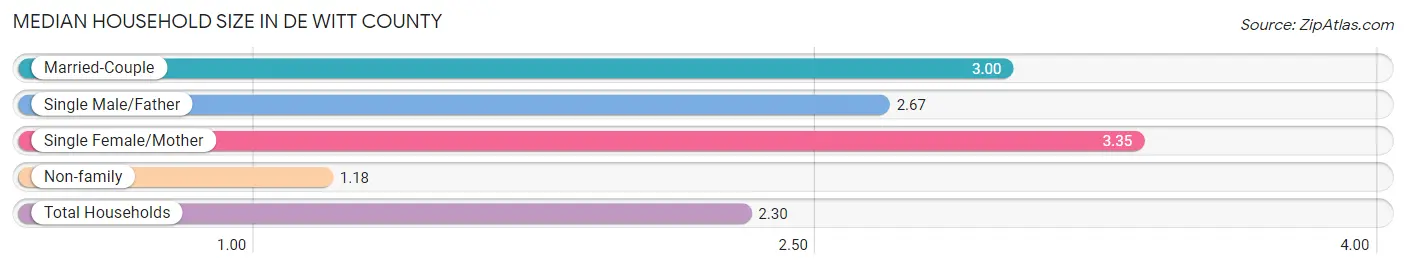
The median household size in De Witt County is 2.30 persons per household, with single female/mother households (561 | 8.4%) accounting for the largest median household size of 3.35 persons per household. non-family households (2,602 | 39.2%) represent the smallest median household size with 1.18 persons per household.
| Household Type | # Households | Household Size |
| Married-Couple | 3,233 (48.7%) | 3.00 |
| Single Male/Father | 248 (3.7%) | 2.67 |
| Single Female/Mother | 561 (8.4%) | 3.35 |
| Non-family | 2,602 (39.2%) | 1.18 |
| Total Households | 6,644 (100.0%) | 2.30 |
Household Size by Marriage Status in De Witt County
Out of a total of 6,644 households in De Witt County, 4,042 (60.8%) are family households, while 2,602 (39.2%) are nonfamily households. The most numerous type of family households are 2-person households, comprising 2,343, and the most common type of nonfamily households are 1-person households, comprising 2,329.
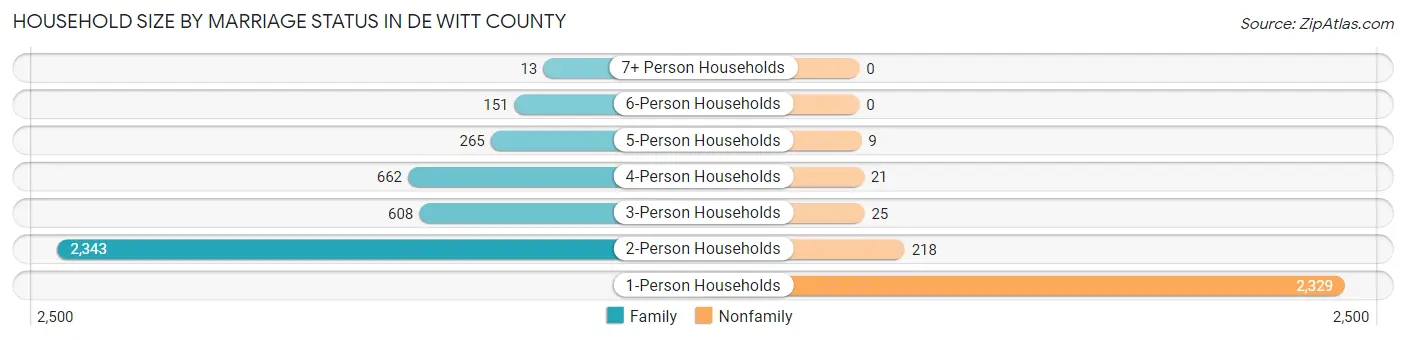
| Household Size | Family Households | Nonfamily Households |
| 1-Person Households | - | 2,329 (35.0%) |
| 2-Person Households | 2,343 (35.3%) | 218 (3.3%) |
| 3-Person Households | 608 (9.1%) | 25 (0.4%) |
| 4-Person Households | 662 (10.0%) | 21 (0.3%) |
| 5-Person Households | 265 (4.0%) | 9 (0.1%) |
| 6-Person Households | 151 (2.3%) | 0 (0.0%) |
| 7+ Person Households | 13 (0.2%) | 0 (0.0%) |
| Total | 4,042 (60.8%) | 2,602 (39.2%) |
Female Fertility in De Witt County
Fertility by Age in De Witt County
Average fertility rate in De Witt County is 49.0 births per 1,000 women. Women in the age bracket of 20 to 34 years have the highest fertility rate with 81.0 births per 1,000 women. Women in the age bracket of 20 to 34 years acount for 68.2% of all women with births.
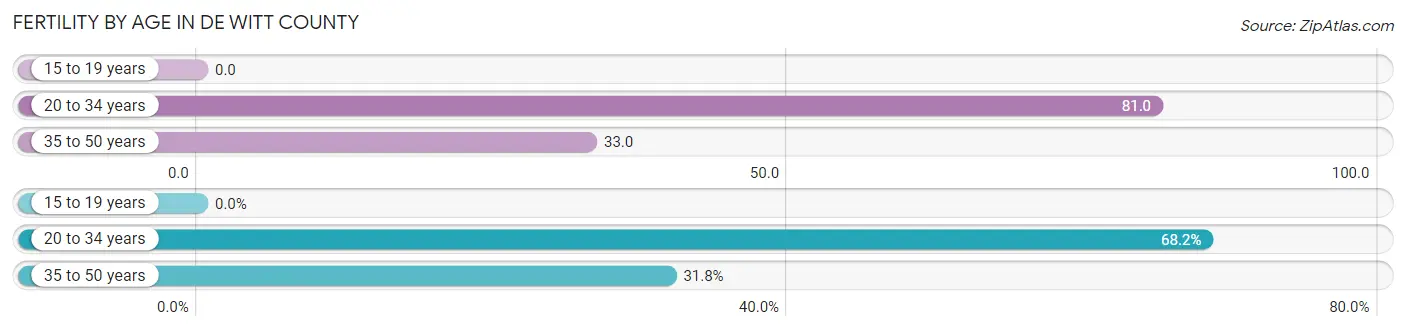
| Age Bracket | Women with Births | Births / 1,000 Women |
| 15 to 19 years | 0 (0.0%) | 0.0 |
| 20 to 34 years | 103 (68.2%) | 81.0 |
| 35 to 50 years | 48 (31.8%) | 33.0 |
| Total | 151 (100.0%) | 49.0 |
Fertility by Age by Marriage Status in De Witt County
69.5% of women with births (151) in De Witt County are married. The highest percentage of unmarried women with births falls into 20 to 34 years age bracket with 44.7% of them unmarried at the time of birth, while the lowest percentage of unmarried women with births belong to 35 to 50 years age bracket with 0.0% of them unmarried.
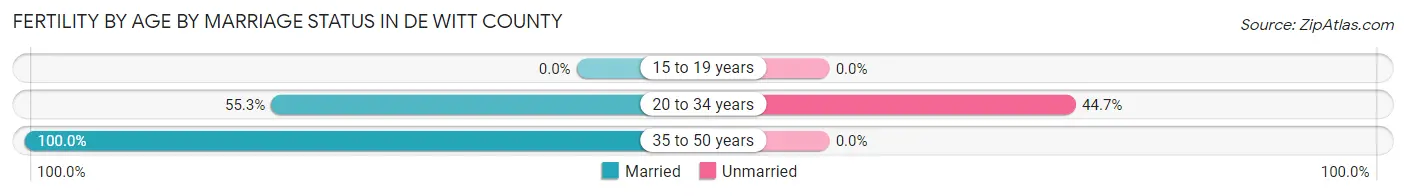
| Age Bracket | Married | Unmarried |
| 15 to 19 years | 0 (0.0%) | 0 (0.0%) |
| 20 to 34 years | 57 (55.3%) | 46 (44.7%) |
| 35 to 50 years | 48 (100.0%) | 0 (0.0%) |
| Total | 105 (69.5%) | 46 (30.5%) |
Fertility by Education in De Witt County
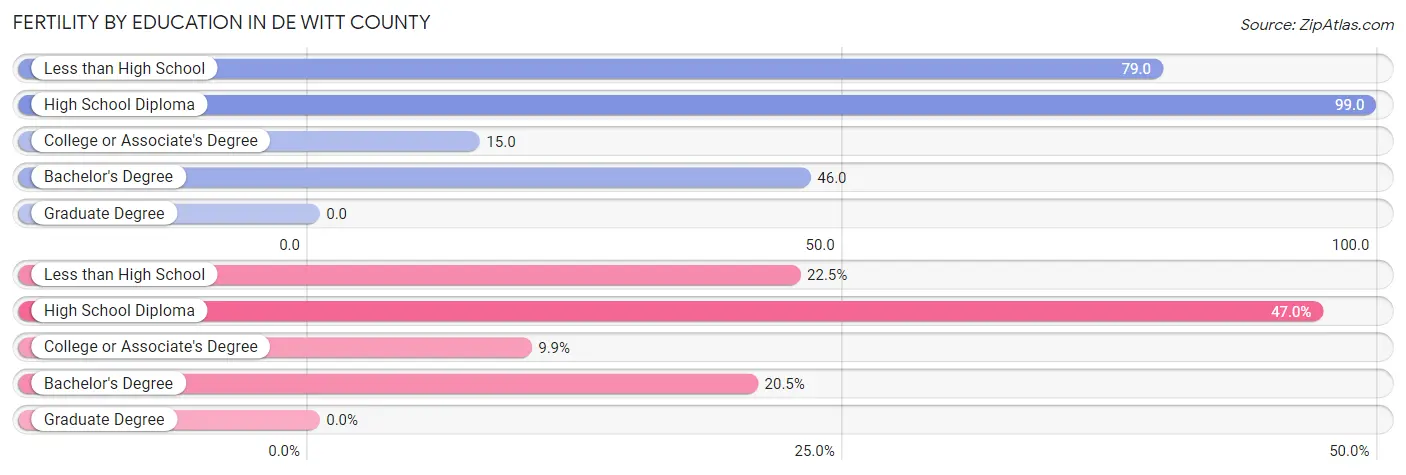
| Educational Attainment | Women with Births | Births / 1,000 Women |
| Less than High School | 34 (22.5%) | 79.0 |
| High School Diploma | 71 (47.0%) | 99.0 |
| College or Associate's Degree | 15 (9.9%) | 15.0 |
| Bachelor's Degree | 31 (20.5%) | 46.0 |
| Graduate Degree | 0 (0.0%) | 0.0 |
| Total | 151 (100.0%) | 49.0 |
Fertility by Education by Marriage Status in De Witt County
30.5% of women with births in De Witt County are unmarried. Women with the educational attainment of bachelor's degree are most likely to be married with 100.0% of them married at childbirth, while women with the educational attainment of less than high school are least likely to be married with 100.0% of them unmarried at childbirth.
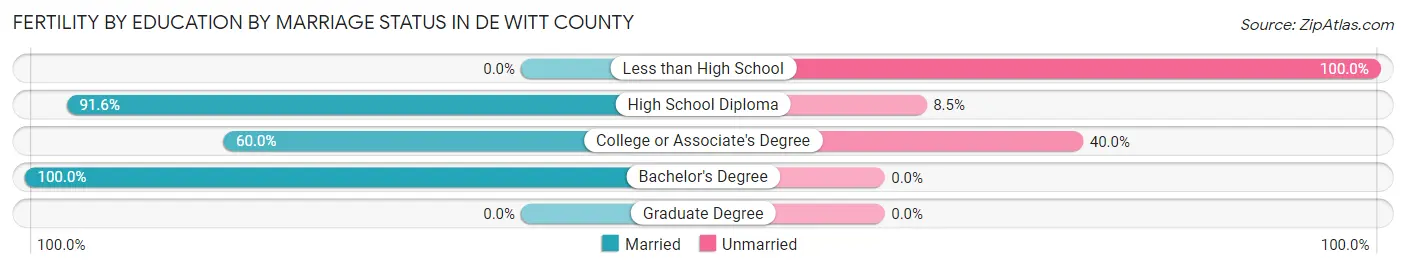
| Educational Attainment | Married | Unmarried |
| Less than High School | 0 (0.0%) | 34 (100.0%) |
| High School Diploma | 65 (91.5%) | 6 (8.5%) |
| College or Associate's Degree | 9 (60.0%) | 6 (40.0%) |
| Bachelor's Degree | 31 (100.0%) | 0 (0.0%) |
| Graduate Degree | 0 (0.0%) | 0 (0.0%) |
| Total | 105 (69.5%) | 46 (30.5%) |
Employment Characteristics in De Witt County
Employment by Class of Employer in De Witt County
Among the 7,552 employed individuals in De Witt County, private company employees (4,924 | 65.2%), local government employees (731 | 9.7%), and self-employed (not incorporated) (509 | 6.7%) make up the most common classes of employment.
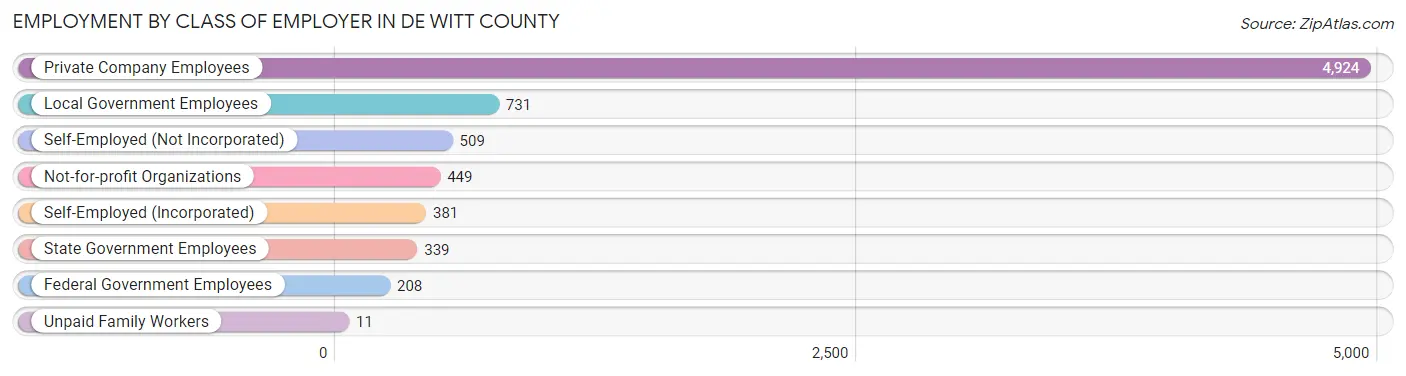
| Employer Class | # Employees | % Employees |
| Private Company Employees | 4,924 | 65.2% |
| Self-Employed (Incorporated) | 381 | 5.1% |
| Self-Employed (Not Incorporated) | 509 | 6.7% |
| Not-for-profit Organizations | 449 | 5.9% |
| Local Government Employees | 731 | 9.7% |
| State Government Employees | 339 | 4.5% |
| Federal Government Employees | 208 | 2.8% |
| Unpaid Family Workers | 11 | 0.2% |
| Total | 7,552 | 100.0% |
Employment Status by Age in De Witt County
According to the labor force statistics for De Witt County, out of the total population over 16 years of age (12,735), 63.3% or 8,061 individuals are in the labor force, with 5.4% or 435 of them unemployed. The age group with the highest labor force participation rate is 30 to 34 years, with 91.4% or 773 individuals in the labor force. Within the labor force, the 16 to 19 years age range has the highest percentage of unemployed individuals, with 30.2% or 123 of them being unemployed.
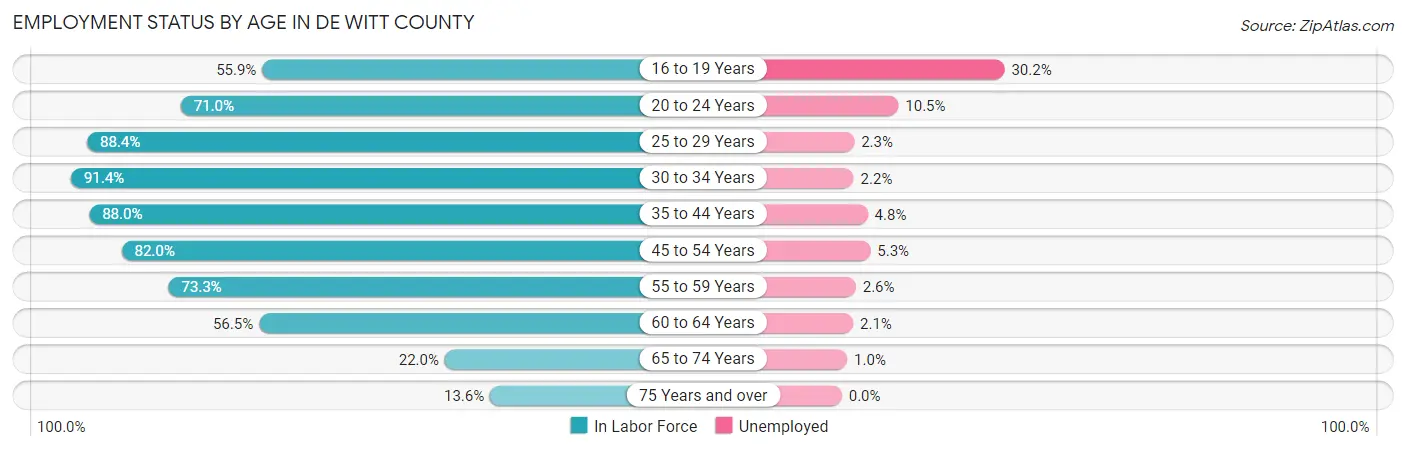
| Age Bracket | In Labor Force | Unemployed |
| 16 to 19 Years | 407 (55.9%) | 123 (30.2%) |
| 20 to 24 Years | 658 (71.0%) | 69 (10.5%) |
| 25 to 29 Years | 735 (88.4%) | 17 (2.3%) |
| 30 to 34 Years | 773 (91.4%) | 17 (2.2%) |
| 35 to 44 Years | 1,651 (88.0%) | 79 (4.8%) |
| 45 to 54 Years | 1,683 (82.0%) | 89 (5.3%) |
| 55 to 59 Years | 935 (73.3%) | 24 (2.6%) |
| 60 to 64 Years | 655 (56.5%) | 14 (2.1%) |
| 65 to 74 Years | 388 (22.0%) | 4 (1.0%) |
| 75 Years and over | 174 (13.6%) | 0 (0.0%) |
| Total | 8,061 (63.3%) | 435 (5.4%) |
Employment Status by Educational Attainment in De Witt County
According to labor force statistics for De Witt County, 80.0% of individuals (6,433) out of the total population between 25 and 64 years of age (8,041) are in the labor force, with 3.7% or 238 of them being unemployed. The group with the highest labor force participation rate are those with the educational attainment of college / associate degree, with 85.0% or 2,333 individuals in the labor force. Within the labor force, individuals with high school diploma education have the highest percentage of unemployment, with 5.4% or 127 of them being unemployed.
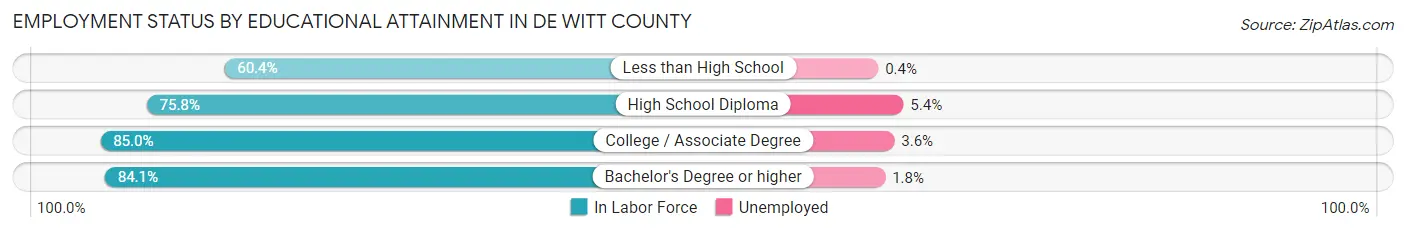
| Educational Attainment | In Labor Force | Unemployed |
| Less than High School | 255 (60.4%) | 2 (0.4%) |
| High School Diploma | 2,343 (75.8%) | 167 (5.4%) |
| College / Associate Degree | 2,333 (85.0%) | 99 (3.6%) |
| Bachelor's Degree or higher | 1,500 (84.1%) | 32 (1.8%) |
| Total | 6,433 (80.0%) | 298 (3.7%) |
Employment Occupations by Sex in De Witt County
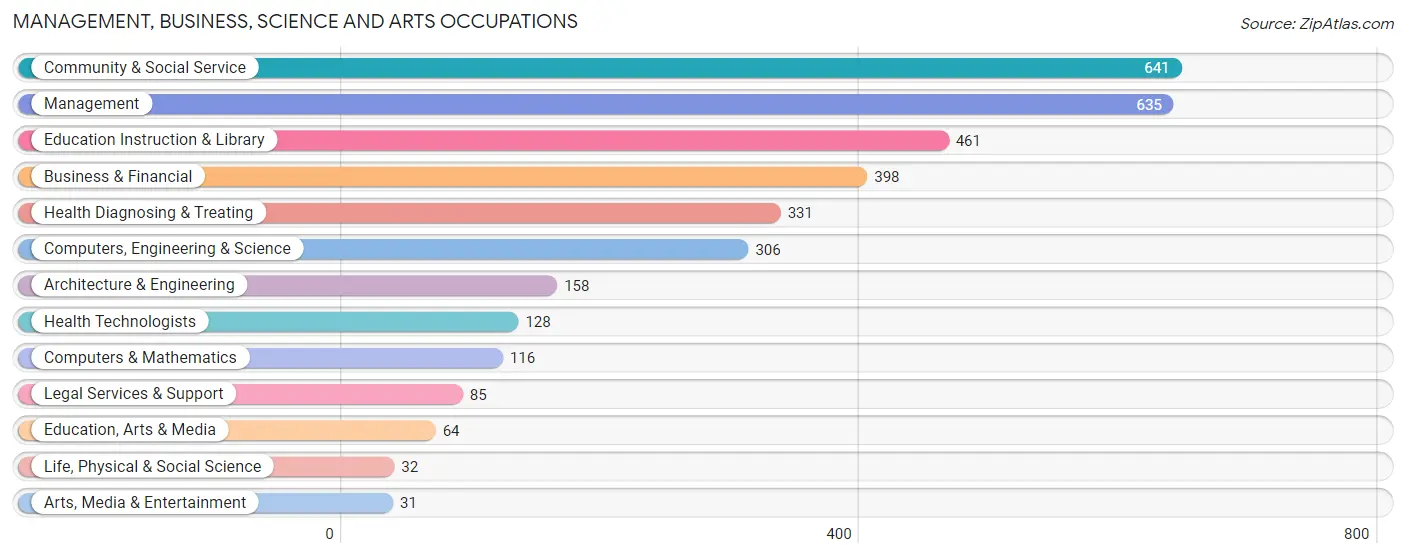
Management, Business, Science and Arts Occupations
The most common Management, Business, Science and Arts occupations in De Witt County are Community & Social Service (641 | 8.4%), Management (635 | 8.4%), Education Instruction & Library (461 | 6.1%), Business & Financial (398 | 5.2%), and Health Diagnosing & Treating (331 | 4.3%).
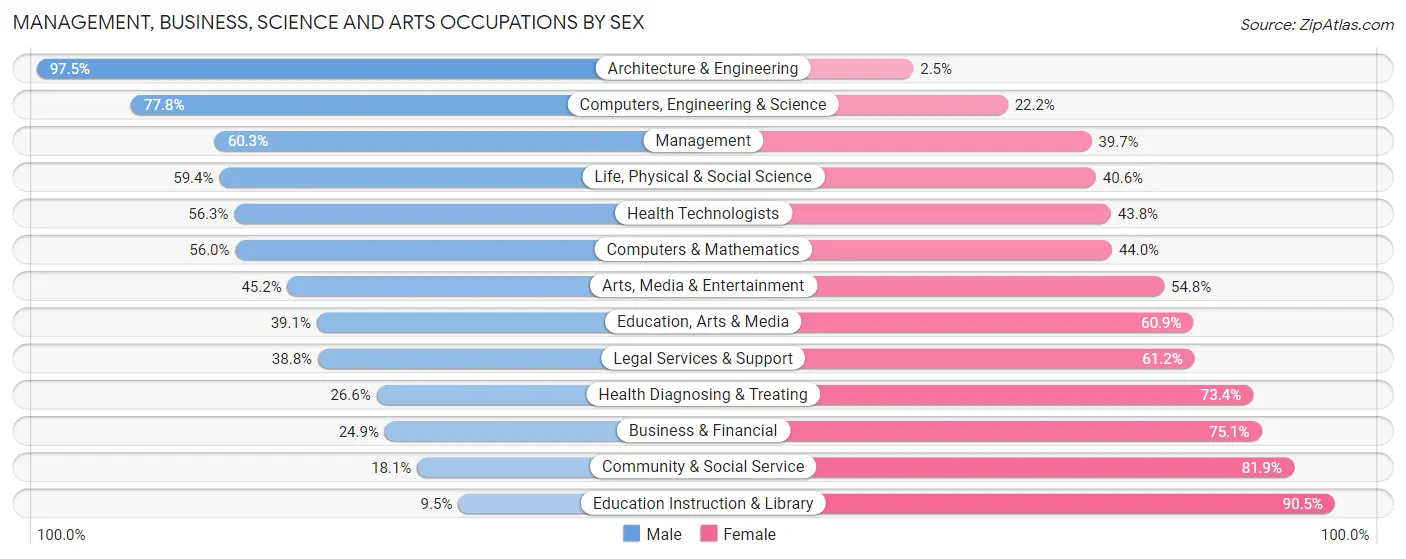
Management, Business, Science and Arts Occupations by Sex
Within the Management, Business, Science and Arts occupations in De Witt County, the most male-oriented occupations are Architecture & Engineering (97.5%), Computers, Engineering & Science (77.8%), and Management (60.3%), while the most female-oriented occupations are Education Instruction & Library (90.5%), Community & Social Service (81.9%), and Business & Financial (75.1%).
| Occupation | Male | Female |
| Management | 383 (60.3%) | 252 (39.7%) |
| Business & Financial | 99 (24.9%) | 299 (75.1%) |
| Computers, Engineering & Science | 238 (77.8%) | 68 (22.2%) |
| Computers & Mathematics | 65 (56.0%) | 51 (44.0%) |
| Architecture & Engineering | 154 (97.5%) | 4 (2.5%) |
| Life, Physical & Social Science | 19 (59.4%) | 13 (40.6%) |
| Community & Social Service | 116 (18.1%) | 525 (81.9%) |
| Education, Arts & Media | 25 (39.1%) | 39 (60.9%) |
| Legal Services & Support | 33 (38.8%) | 52 (61.2%) |
| Education Instruction & Library | 44 (9.5%) | 417 (90.5%) |
| Arts, Media & Entertainment | 14 (45.2%) | 17 (54.8%) |
| Health Diagnosing & Treating | 88 (26.6%) | 243 (73.4%) |
| Health Technologists | 72 (56.2%) | 56 (43.8%) |
| Total (Category) | 924 (40.0%) | 1,387 (60.0%) |
| Total (Overall) | 4,033 (53.0%) | 3,571 (47.0%) |
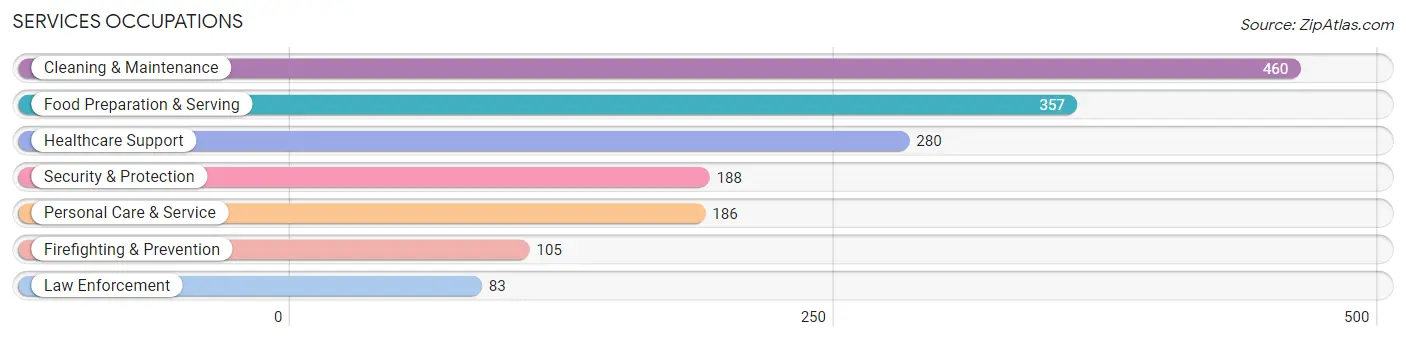
Services Occupations
The most common Services occupations in De Witt County are Cleaning & Maintenance (460 | 6.0%), Food Preparation & Serving (357 | 4.7%), Healthcare Support (280 | 3.7%), Security & Protection (188 | 2.5%), and Personal Care & Service (186 | 2.5%).
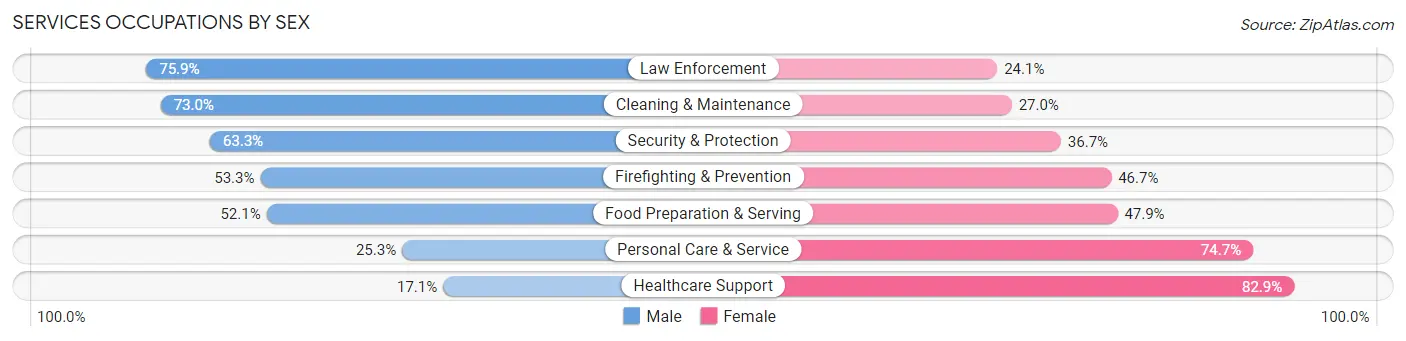
Services Occupations by Sex
Within the Services occupations in De Witt County, the most male-oriented occupations are Law Enforcement (75.9%), Cleaning & Maintenance (73.0%), and Security & Protection (63.3%), while the most female-oriented occupations are Healthcare Support (82.9%), Personal Care & Service (74.7%), and Food Preparation & Serving (47.9%).
| Occupation | Male | Female |
| Healthcare Support | 48 (17.1%) | 232 (82.9%) |
| Security & Protection | 119 (63.3%) | 69 (36.7%) |
| Firefighting & Prevention | 56 (53.3%) | 49 (46.7%) |
| Law Enforcement | 63 (75.9%) | 20 (24.1%) |
| Food Preparation & Serving | 186 (52.1%) | 171 (47.9%) |
| Cleaning & Maintenance | 336 (73.0%) | 124 (27.0%) |
| Personal Care & Service | 47 (25.3%) | 139 (74.7%) |
| Total (Category) | 736 (50.0%) | 735 (50.0%) |
| Total (Overall) | 4,033 (53.0%) | 3,571 (47.0%) |
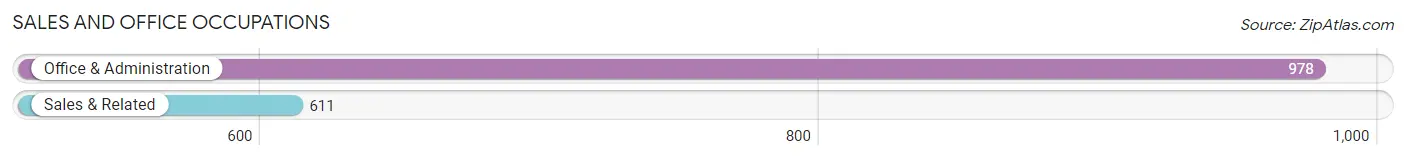
Sales and Office Occupations
The most common Sales and Office occupations in De Witt County are Office & Administration (978 | 12.9%), and Sales & Related (611 | 8.0%).
Sales and Office Occupations by Sex
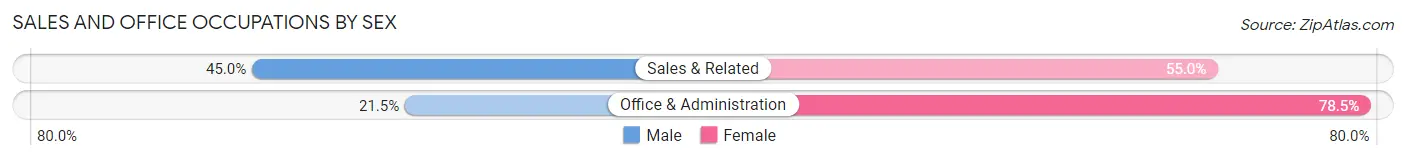
| Occupation | Male | Female |
| Sales & Related | 275 (45.0%) | 336 (55.0%) |
| Office & Administration | 210 (21.5%) | 768 (78.5%) |
| Total (Category) | 485 (30.5%) | 1,104 (69.5%) |
| Total (Overall) | 4,033 (53.0%) | 3,571 (47.0%) |
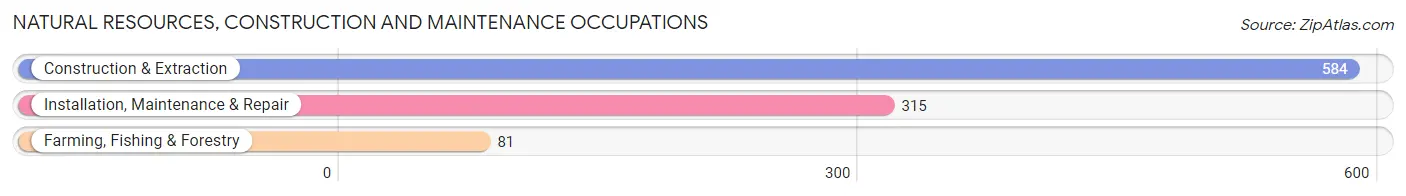
Natural Resources, Construction and Maintenance Occupations
The most common Natural Resources, Construction and Maintenance occupations in De Witt County are Construction & Extraction (584 | 7.7%), Installation, Maintenance & Repair (315 | 4.1%), and Farming, Fishing & Forestry (81 | 1.1%).
Natural Resources, Construction and Maintenance Occupations by Sex
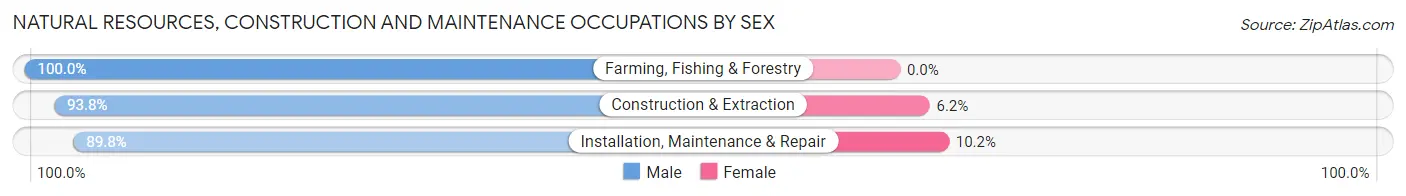
| Occupation | Male | Female |
| Farming, Fishing & Forestry | 81 (100.0%) | 0 (0.0%) |
| Construction & Extraction | 548 (93.8%) | 36 (6.2%) |
| Installation, Maintenance & Repair | 283 (89.8%) | 32 (10.2%) |
| Total (Category) | 912 (93.1%) | 68 (6.9%) |
| Total (Overall) | 4,033 (53.0%) | 3,571 (47.0%) |
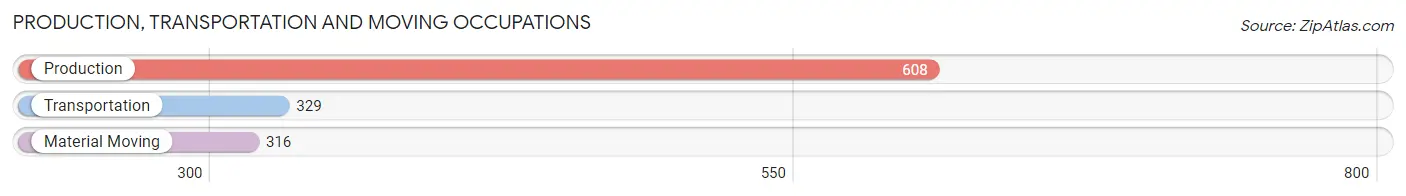
Production, Transportation and Moving Occupations
The most common Production, Transportation and Moving occupations in De Witt County are Production (608 | 8.0%), Transportation (329 | 4.3%), and Material Moving (316 | 4.2%).
Production, Transportation and Moving Occupations by Sex
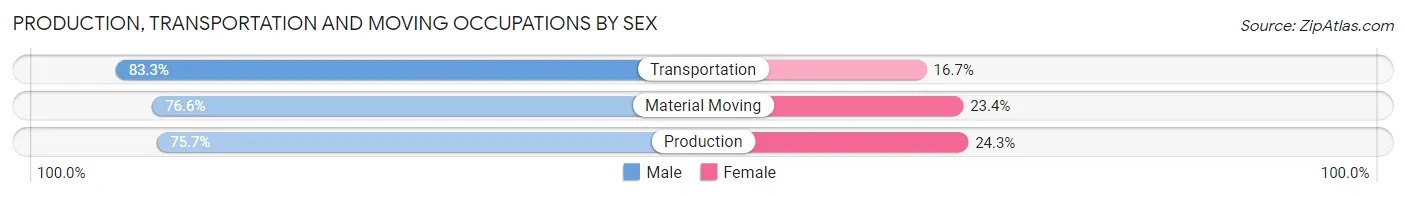
| Occupation | Male | Female |
| Production | 460 (75.7%) | 148 (24.3%) |
| Transportation | 274 (83.3%) | 55 (16.7%) |
| Material Moving | 242 (76.6%) | 74 (23.4%) |
| Total (Category) | 976 (77.9%) | 277 (22.1%) |
| Total (Overall) | 4,033 (53.0%) | 3,571 (47.0%) |
Employment Industries by Sex in De Witt County
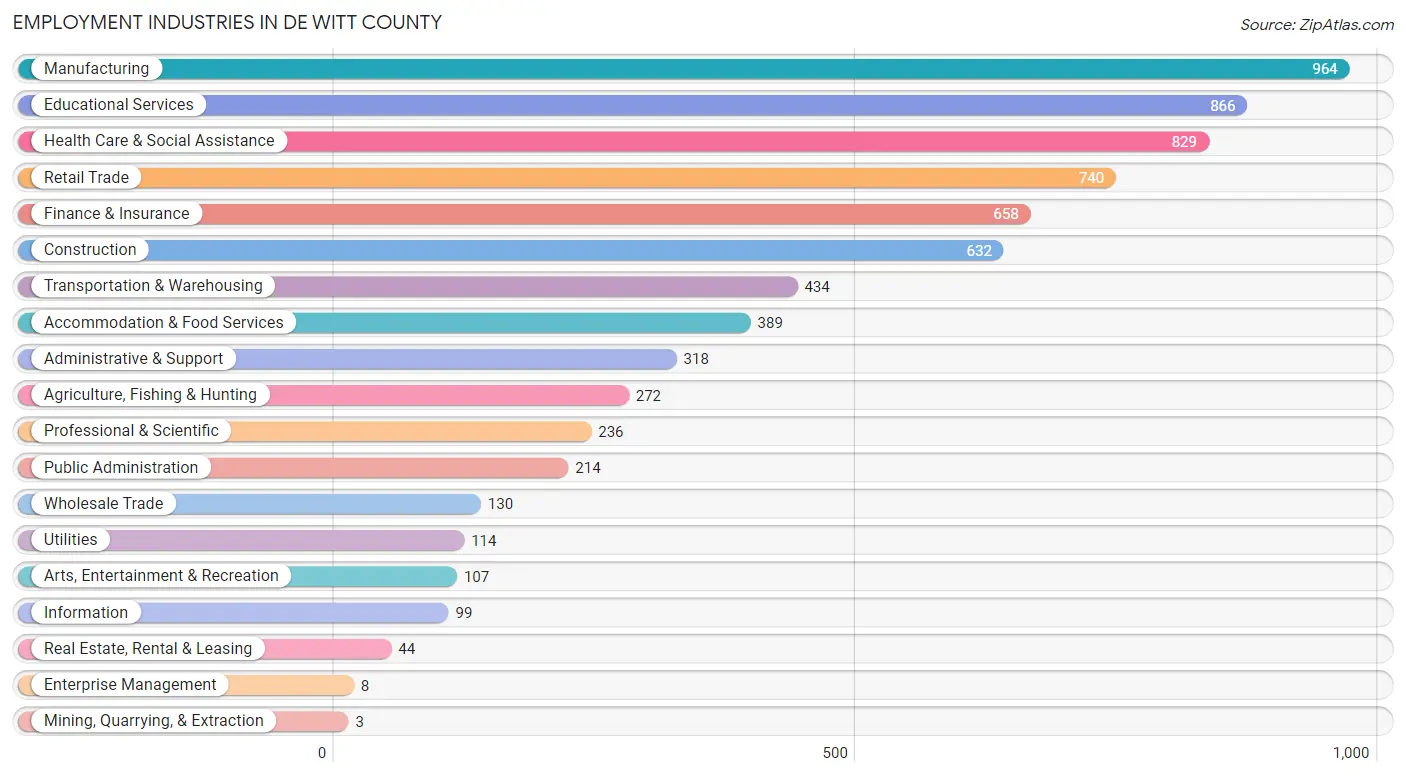
Employment Industries in De Witt County
The major employment industries in De Witt County include Manufacturing (964 | 12.7%), Educational Services (866 | 11.4%), Health Care & Social Assistance (829 | 10.9%), Retail Trade (740 | 9.7%), and Finance & Insurance (658 | 8.6%).
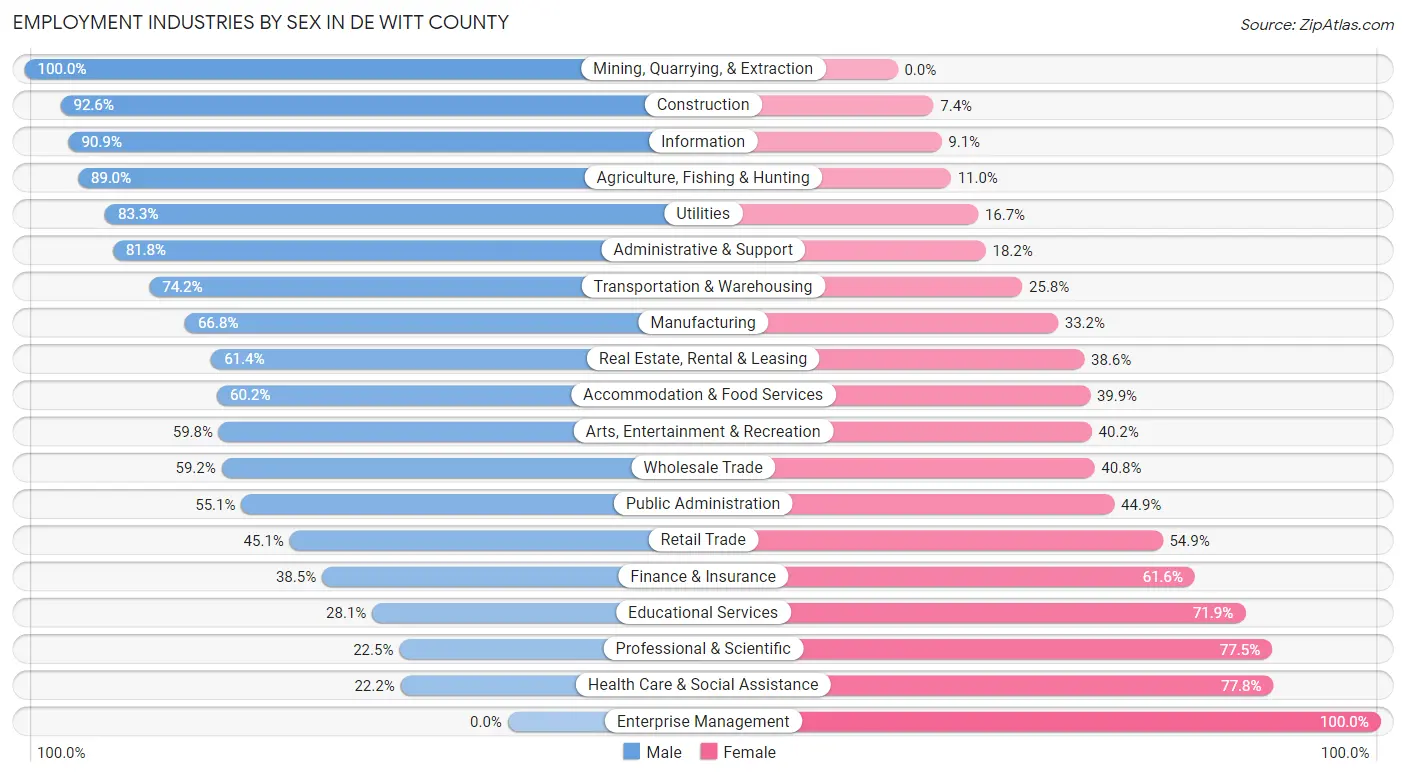
Employment Industries by Sex in De Witt County
The De Witt County industries that see more men than women are Mining, Quarrying, & Extraction (100.0%), Construction (92.6%), and Information (90.9%), whereas the industries that tend to have a higher number of women are Enterprise Management (100.0%), Health Care & Social Assistance (77.8%), and Professional & Scientific (77.5%).
| Industry | Male | Female |
| Agriculture, Fishing & Hunting | 242 (89.0%) | 30 (11.0%) |
| Mining, Quarrying, & Extraction | 3 (100.0%) | 0 (0.0%) |
| Construction | 585 (92.6%) | 47 (7.4%) |
| Manufacturing | 644 (66.8%) | 320 (33.2%) |
| Wholesale Trade | 77 (59.2%) | 53 (40.8%) |
| Retail Trade | 334 (45.1%) | 406 (54.9%) |
| Transportation & Warehousing | 322 (74.2%) | 112 (25.8%) |
| Utilities | 95 (83.3%) | 19 (16.7%) |
| Information | 90 (90.9%) | 9 (9.1%) |
| Finance & Insurance | 253 (38.5%) | 405 (61.6%) |
| Real Estate, Rental & Leasing | 27 (61.4%) | 17 (38.6%) |
| Professional & Scientific | 53 (22.5%) | 183 (77.5%) |
| Enterprise Management | 0 (0.0%) | 8 (100.0%) |
| Administrative & Support | 260 (81.8%) | 58 (18.2%) |
| Educational Services | 243 (28.1%) | 623 (71.9%) |
| Health Care & Social Assistance | 184 (22.2%) | 645 (77.8%) |
| Arts, Entertainment & Recreation | 64 (59.8%) | 43 (40.2%) |
| Accommodation & Food Services | 234 (60.2%) | 155 (39.9%) |
| Public Administration | 118 (55.1%) | 96 (44.9%) |
| Total | 4,033 (53.0%) | 3,571 (47.0%) |
Education in De Witt County
School Enrollment in De Witt County
The most common levels of schooling among the 3,113 students in De Witt County are middle school (798 | 25.6%), high school (767 | 24.6%), and elementary school (654 | 21.0%).
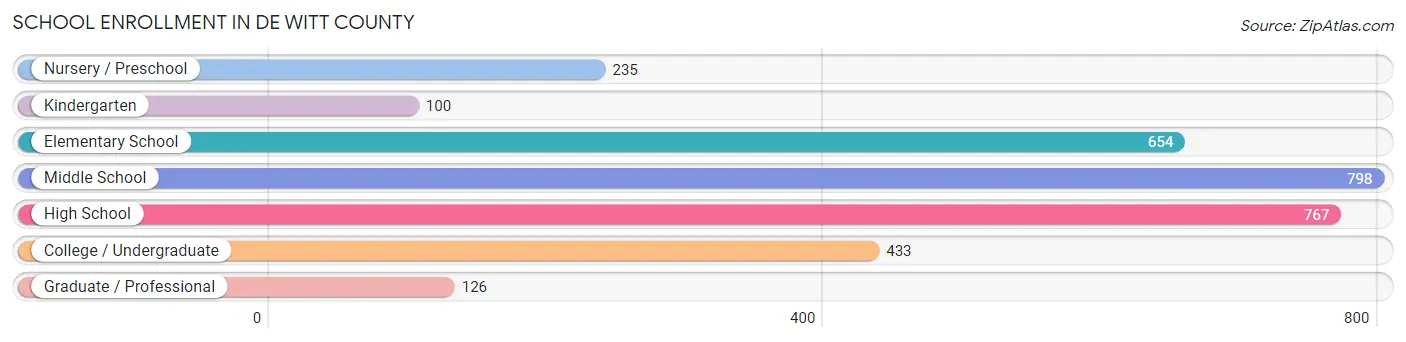
| School Level | # Students | % Students |
| Nursery / Preschool | 235 | 7.5% |
| Kindergarten | 100 | 3.2% |
| Elementary School | 654 | 21.0% |
| Middle School | 798 | 25.6% |
| High School | 767 | 24.6% |
| College / Undergraduate | 433 | 13.9% |
| Graduate / Professional | 126 | 4.1% |
| Total | 3,113 | 100.0% |
School Enrollment by Age by Funding Source in De Witt County
Out of a total of 3,113 students who are enrolled in schools in De Witt County, 641 (20.6%) attend a private institution, while the remaining 2,472 (79.4%) are enrolled in public schools. The age group of 3 to 4 year olds has the highest likelihood of being enrolled in private schools, with 73 (49.7% in the age bracket) enrolled. Conversely, the age group of 35 years and over has the lowest likelihood of being enrolled in a private school, with 96 (97.0% in the age bracket) attending a public institution.
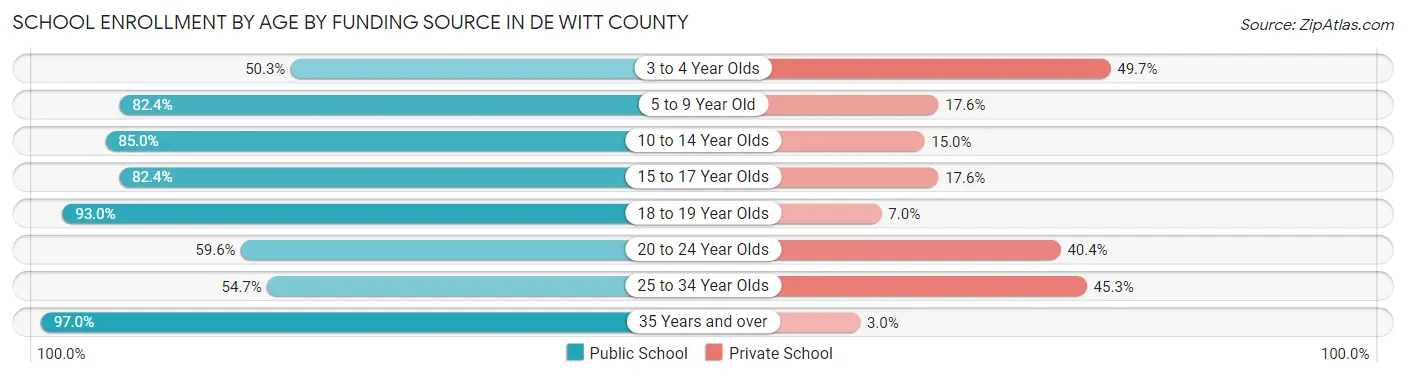
| Age Bracket | Public School | Private School |
| 3 to 4 Year Olds | 74 (50.3%) | 73 (49.7%) |
| 5 to 9 Year Old | 579 (82.4%) | 124 (17.6%) |
| 10 to 14 Year Olds | 876 (85.0%) | 155 (15.0%) |
| 15 to 17 Year Olds | 496 (82.4%) | 106 (17.6%) |
| 18 to 19 Year Olds | 119 (93.0%) | 9 (7.0%) |
| 20 to 24 Year Olds | 127 (59.6%) | 86 (40.4%) |
| 25 to 34 Year Olds | 104 (54.7%) | 86 (45.3%) |
| 35 Years and over | 96 (97.0%) | 3 (3.0%) |
| Total | 2,472 (79.4%) | 641 (20.6%) |
Educational Attainment by Field of Study in De Witt County
Education (629 | 24.7%), business (540 | 21.2%), bio, nature & agricultural (246 | 9.7%), science & technology (223 | 8.8%), and arts & humanities (182 | 7.1%) are the most common fields of study among 2,544 individuals in De Witt County who have obtained a bachelor's degree or higher.
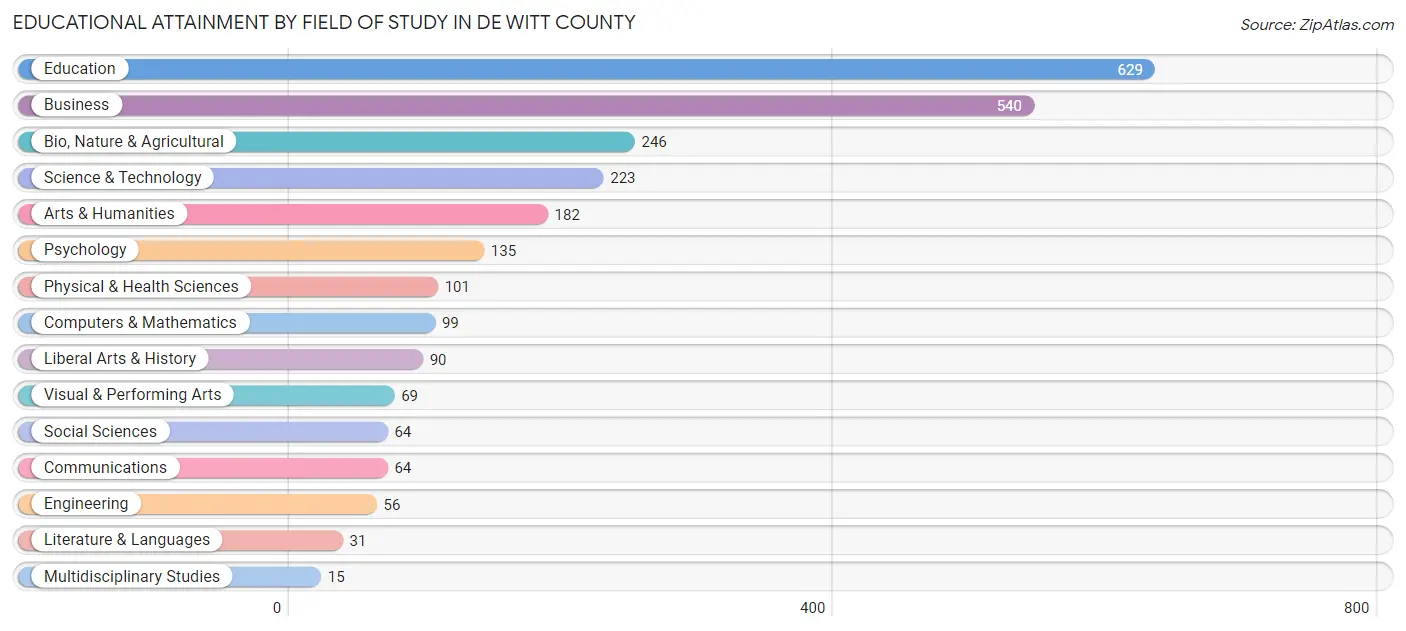
| Field of Study | # Graduates | % Graduates |
| Computers & Mathematics | 99 | 3.9% |
| Bio, Nature & Agricultural | 246 | 9.7% |
| Physical & Health Sciences | 101 | 4.0% |
| Psychology | 135 | 5.3% |
| Social Sciences | 64 | 2.5% |
| Engineering | 56 | 2.2% |
| Multidisciplinary Studies | 15 | 0.6% |
| Science & Technology | 223 | 8.8% |
| Business | 540 | 21.2% |
| Education | 629 | 24.7% |
| Literature & Languages | 31 | 1.2% |
| Liberal Arts & History | 90 | 3.5% |
| Visual & Performing Arts | 69 | 2.7% |
| Communications | 64 | 2.5% |
| Arts & Humanities | 182 | 7.1% |
| Total | 2,544 | 100.0% |
Transportation & Commute in De Witt County
Vehicle Availability by Sex in De Witt County
The most prevalent vehicle ownership categories in De Witt County are males with 2 vehicles (1,795, accounting for 44.8%) and females with 2 vehicles (1,380, making up 50.7%).
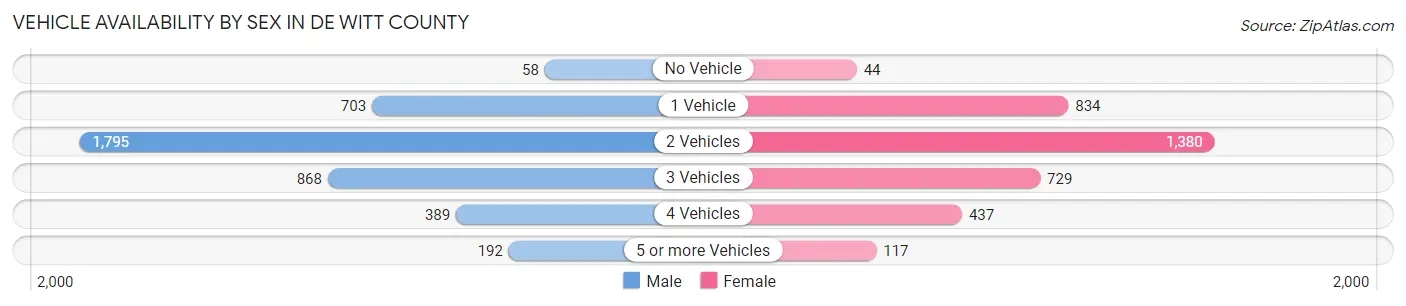
| Vehicles Available | Male | Female |
| No Vehicle | 58 (1.5%) | 44 (1.2%) |
| 1 Vehicle | 703 (17.5%) | 834 (23.5%) |
| 2 Vehicles | 1,795 (44.8%) | 1,380 (39.0%) |
| 3 Vehicles | 868 (21.7%) | 729 (20.6%) |
| 4 Vehicles | 389 (9.7%) | 437 (12.3%) |
| 5 or more Vehicles | 192 (4.8%) | 117 (3.3%) |
| Total | 4,005 (100.0%) | 3,541 (100.0%) |
Commute Time in De Witt County
The most frequently occuring commute durations in De Witt County are 30 to 34 minutes (1,366 commuters, 19.2%), 5 to 9 minutes (1,158 commuters, 16.2%), and 10 to 14 minutes (871 commuters, 12.2%).
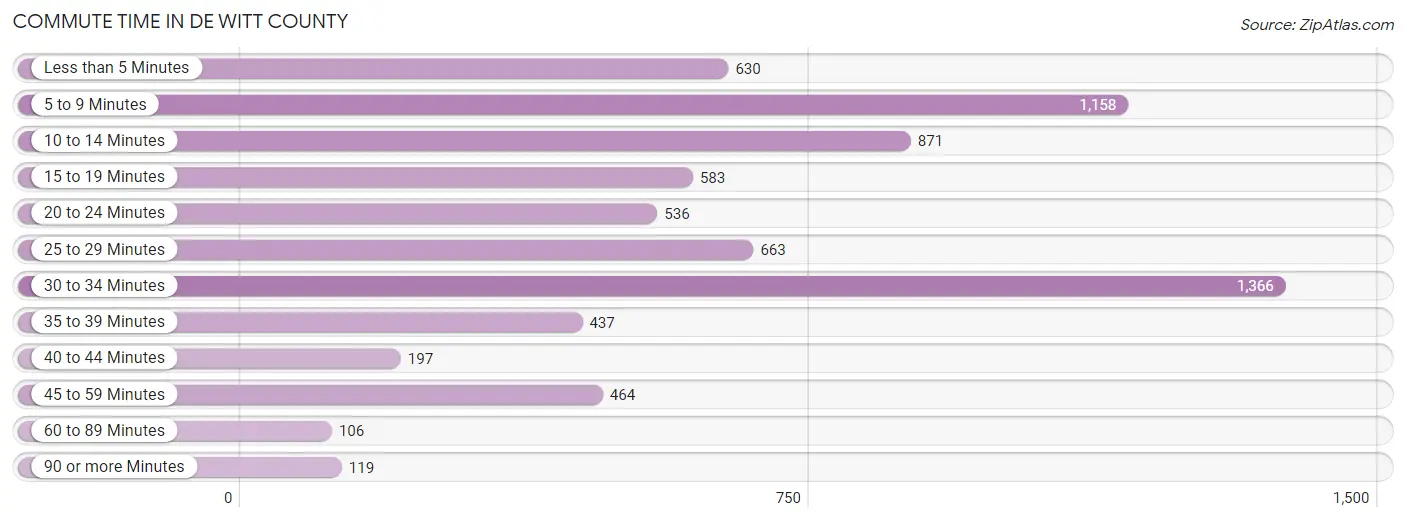
| Commute Time | # Commuters | % Commuters |
| Less than 5 Minutes | 630 | 8.8% |
| 5 to 9 Minutes | 1,158 | 16.2% |
| 10 to 14 Minutes | 871 | 12.2% |
| 15 to 19 Minutes | 583 | 8.2% |
| 20 to 24 Minutes | 536 | 7.5% |
| 25 to 29 Minutes | 663 | 9.3% |
| 30 to 34 Minutes | 1,366 | 19.2% |
| 35 to 39 Minutes | 437 | 6.1% |
| 40 to 44 Minutes | 197 | 2.8% |
| 45 to 59 Minutes | 464 | 6.5% |
| 60 to 89 Minutes | 106 | 1.5% |
| 90 or more Minutes | 119 | 1.7% |
Commute Time by Sex in De Witt County
The most common commute times in De Witt County are 30 to 34 minutes (724 commuters, 19.0%) for males and 30 to 34 minutes (642 commuters, 19.4%) for females.
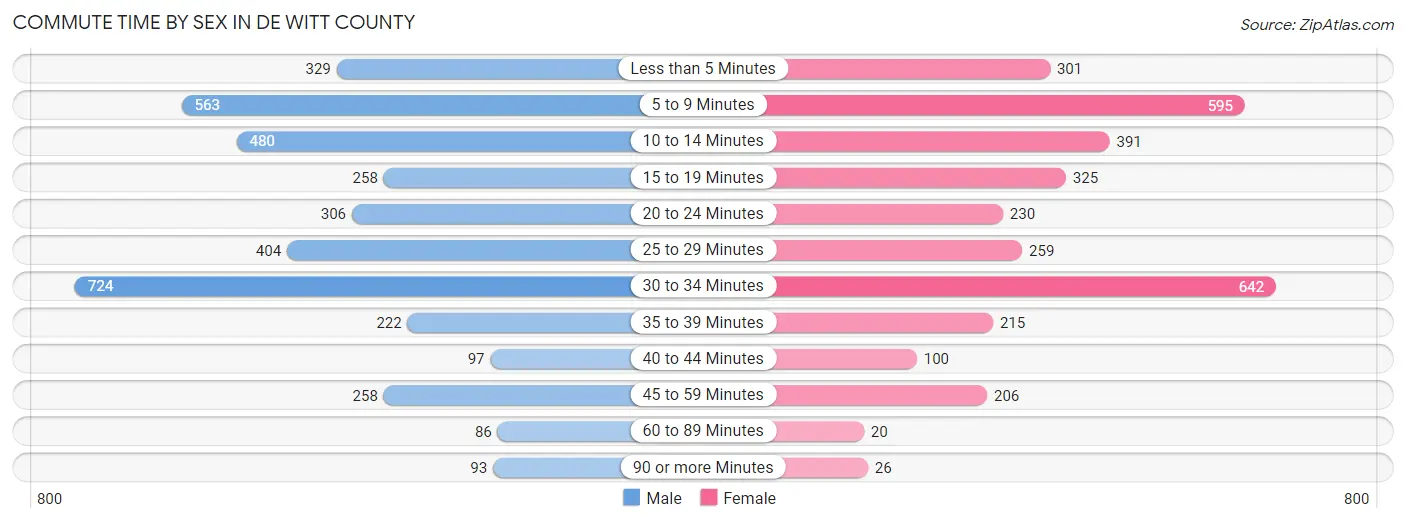
| Commute Time | Male | Female |
| Less than 5 Minutes | 329 (8.6%) | 301 (9.1%) |
| 5 to 9 Minutes | 563 (14.7%) | 595 (18.0%) |
| 10 to 14 Minutes | 480 (12.6%) | 391 (11.8%) |
| 15 to 19 Minutes | 258 (6.8%) | 325 (9.8%) |
| 20 to 24 Minutes | 306 (8.0%) | 230 (7.0%) |
| 25 to 29 Minutes | 404 (10.6%) | 259 (7.8%) |
| 30 to 34 Minutes | 724 (19.0%) | 642 (19.4%) |
| 35 to 39 Minutes | 222 (5.8%) | 215 (6.5%) |
| 40 to 44 Minutes | 97 (2.5%) | 100 (3.0%) |
| 45 to 59 Minutes | 258 (6.8%) | 206 (6.2%) |
| 60 to 89 Minutes | 86 (2.2%) | 20 (0.6%) |
| 90 or more Minutes | 93 (2.4%) | 26 (0.8%) |
Time of Departure to Work by Sex in De Witt County
The most frequent times of departure to work in De Witt County are 7:00 AM to 7:29 AM (554, 14.5%) for males and 7:00 AM to 7:29 AM (694, 21.0%) for females.
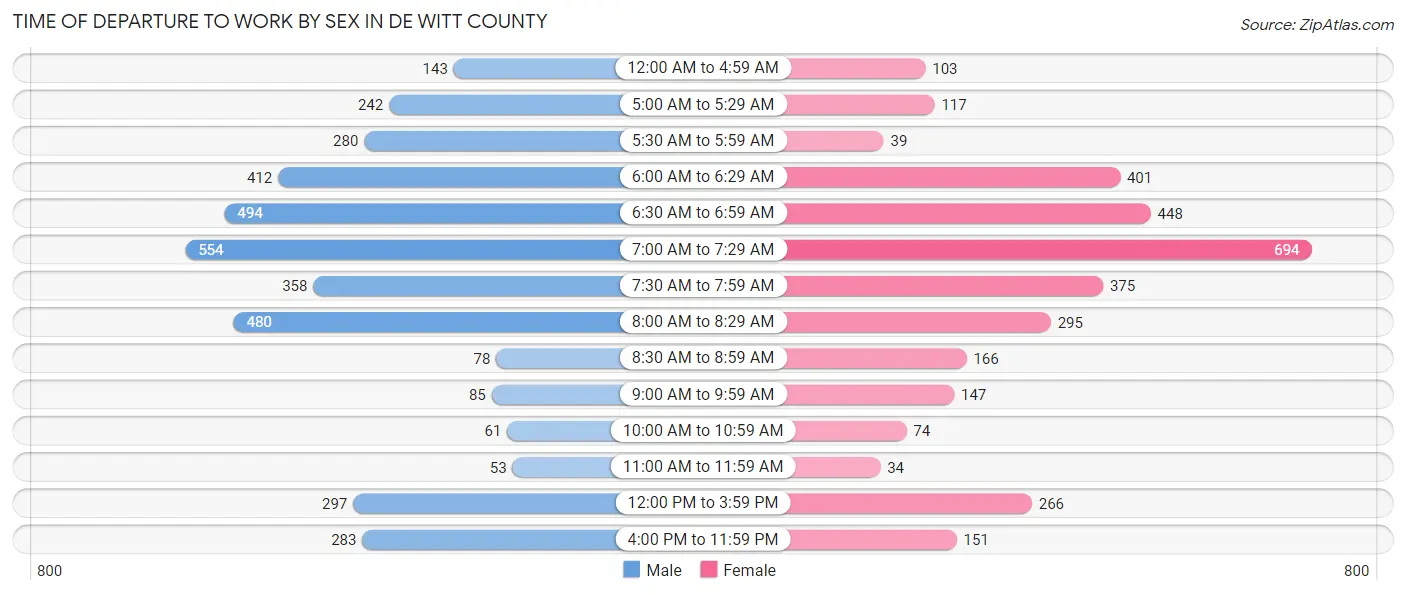
| Time of Departure | Male | Female |
| 12:00 AM to 4:59 AM | 143 (3.7%) | 103 (3.1%) |
| 5:00 AM to 5:29 AM | 242 (6.3%) | 117 (3.5%) |
| 5:30 AM to 5:59 AM | 280 (7.3%) | 39 (1.2%) |
| 6:00 AM to 6:29 AM | 412 (10.8%) | 401 (12.1%) |
| 6:30 AM to 6:59 AM | 494 (12.9%) | 448 (13.5%) |
| 7:00 AM to 7:29 AM | 554 (14.5%) | 694 (21.0%) |
| 7:30 AM to 7:59 AM | 358 (9.4%) | 375 (11.3%) |
| 8:00 AM to 8:29 AM | 480 (12.6%) | 295 (8.9%) |
| 8:30 AM to 8:59 AM | 78 (2.0%) | 166 (5.0%) |
| 9:00 AM to 9:59 AM | 85 (2.2%) | 147 (4.4%) |
| 10:00 AM to 10:59 AM | 61 (1.6%) | 74 (2.2%) |
| 11:00 AM to 11:59 AM | 53 (1.4%) | 34 (1.0%) |
| 12:00 PM to 3:59 PM | 297 (7.8%) | 266 (8.0%) |
| 4:00 PM to 11:59 PM | 283 (7.4%) | 151 (4.6%) |
| Total | 3,820 (100.0%) | 3,310 (100.0%) |
Housing Occupancy in De Witt County
Occupancy by Ownership in De Witt County
Of the total 6,644 dwellings in De Witt County, owner-occupied units account for 5,075 (76.4%), while renter-occupied units make up 1,569 (23.6%).
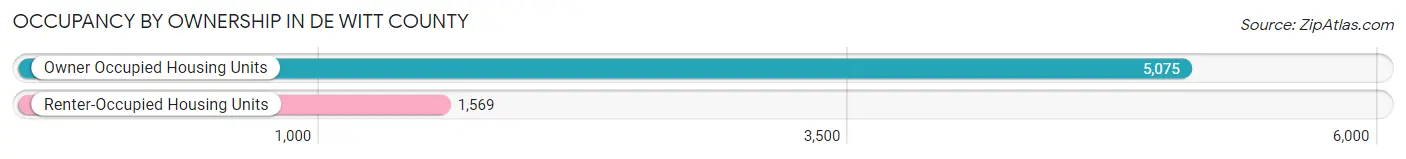
| Occupancy | # Housing Units | % Housing Units |
| Owner Occupied Housing Units | 5,075 | 76.4% |
| Renter-Occupied Housing Units | 1,569 | 23.6% |
| Total Occupied Housing Units | 6,644 | 100.0% |
Occupancy by Household Size in De Witt County
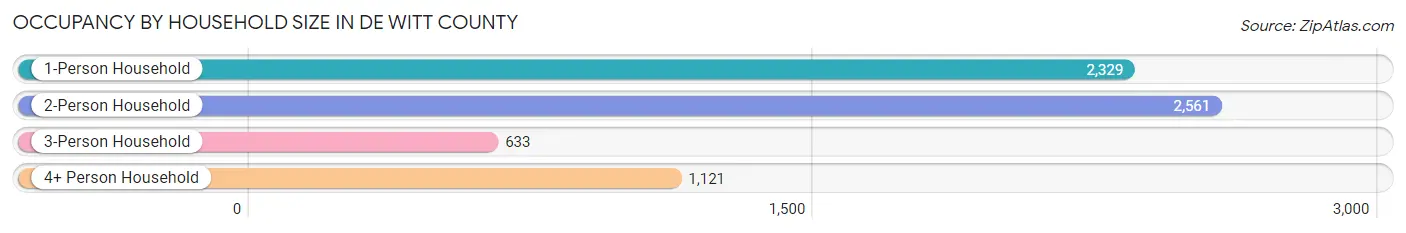
| Household Size | # Housing Units | % Housing Units |
| 1-Person Household | 2,329 | 35.0% |
| 2-Person Household | 2,561 | 38.6% |
| 3-Person Household | 633 | 9.5% |
| 4+ Person Household | 1,121 | 16.9% |
| Total Housing Units | 6,644 | 100.0% |
Occupancy by Ownership by Household Size in De Witt County
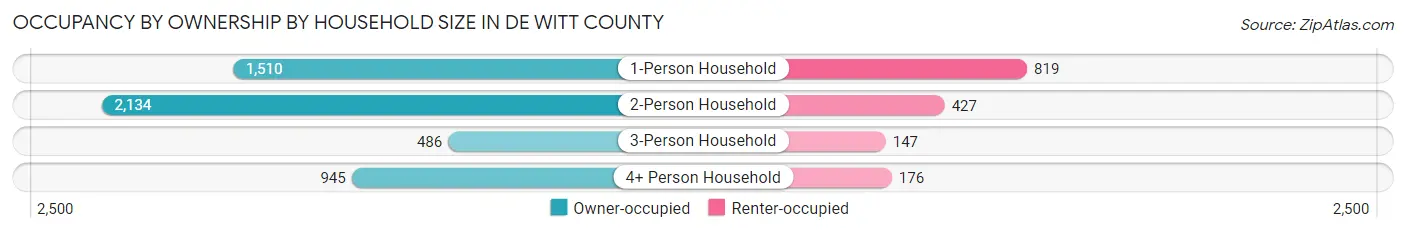
| Household Size | Owner-occupied | Renter-occupied |
| 1-Person Household | 1,510 (64.8%) | 819 (35.2%) |
| 2-Person Household | 2,134 (83.3%) | 427 (16.7%) |
| 3-Person Household | 486 (76.8%) | 147 (23.2%) |
| 4+ Person Household | 945 (84.3%) | 176 (15.7%) |
| Total Housing Units | 5,075 (76.4%) | 1,569 (23.6%) |
Occupancy by Educational Attainment in De Witt County
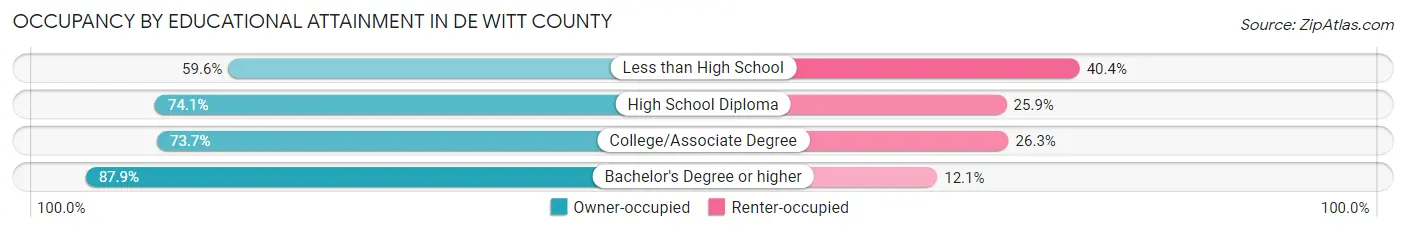
| Household Size | Owner-occupied | Renter-occupied |
| Less than High School | 232 (59.6%) | 157 (40.4%) |
| High School Diploma | 1,949 (74.1%) | 680 (25.9%) |
| College/Associate Degree | 1,524 (73.7%) | 543 (26.3%) |
| Bachelor's Degree or higher | 1,370 (87.9%) | 189 (12.1%) |
Occupancy by Age of Householder in De Witt County
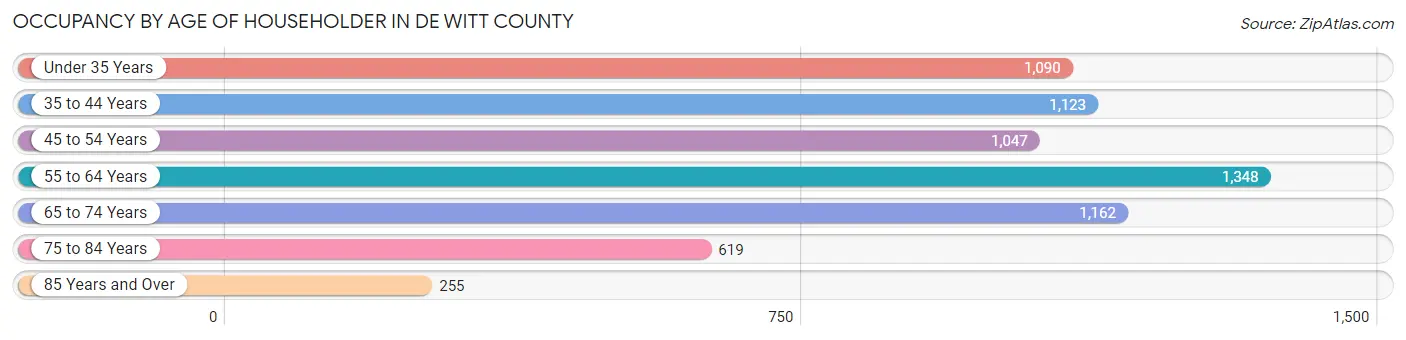
| Age Bracket | # Households | % Households |
| Under 35 Years | 1,090 | 16.4% |
| 35 to 44 Years | 1,123 | 16.9% |
| 45 to 54 Years | 1,047 | 15.8% |
| 55 to 64 Years | 1,348 | 20.3% |
| 65 to 74 Years | 1,162 | 17.5% |
| 75 to 84 Years | 619 | 9.3% |
| 85 Years and Over | 255 | 3.8% |
| Total | 6,644 | 100.0% |
Housing Finances in De Witt County
Median Income by Occupancy in De Witt County
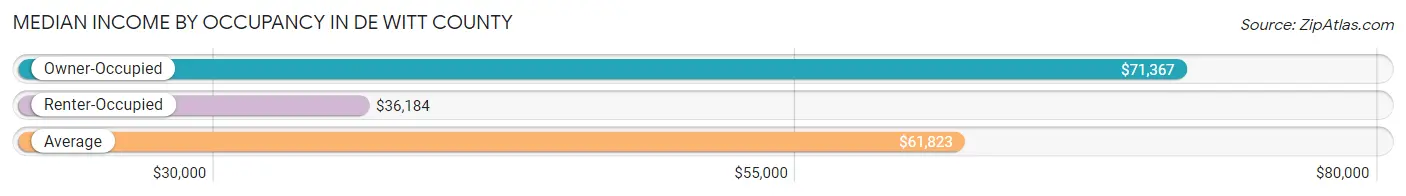
| Occupancy Type | # Households | Median Income |
| Owner-Occupied | 5,075 (76.4%) | $71,367 |
| Renter-Occupied | 1,569 (23.6%) | $36,184 |
| Average | 6,644 (100.0%) | $61,823 |
Occupancy by Householder Income Bracket in De Witt County
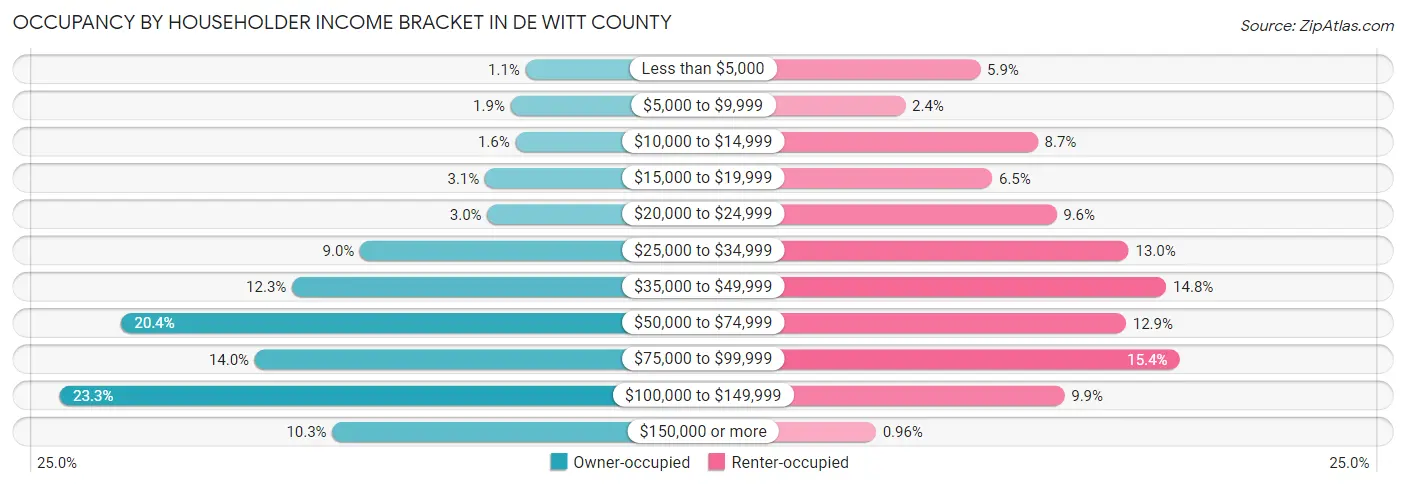
| Income Bracket | Owner-occupied | Renter-occupied |
| Less than $5,000 | 58 (1.1%) | 93 (5.9%) |
| $5,000 to $9,999 | 94 (1.8%) | 37 (2.4%) |
| $10,000 to $14,999 | 82 (1.6%) | 136 (8.7%) |
| $15,000 to $19,999 | 156 (3.1%) | 102 (6.5%) |
| $20,000 to $24,999 | 150 (3.0%) | 150 (9.6%) |
| $25,000 to $34,999 | 458 (9.0%) | 204 (13.0%) |
| $35,000 to $49,999 | 622 (12.3%) | 232 (14.8%) |
| $50,000 to $74,999 | 1,035 (20.4%) | 202 (12.9%) |
| $75,000 to $99,999 | 712 (14.0%) | 242 (15.4%) |
| $100,000 to $149,999 | 1,183 (23.3%) | 156 (9.9%) |
| $150,000 or more | 525 (10.3%) | 15 (1.0%) |
| Total | 5,075 (100.0%) | 1,569 (100.0%) |
Monthly Housing Cost Tiers in De Witt County
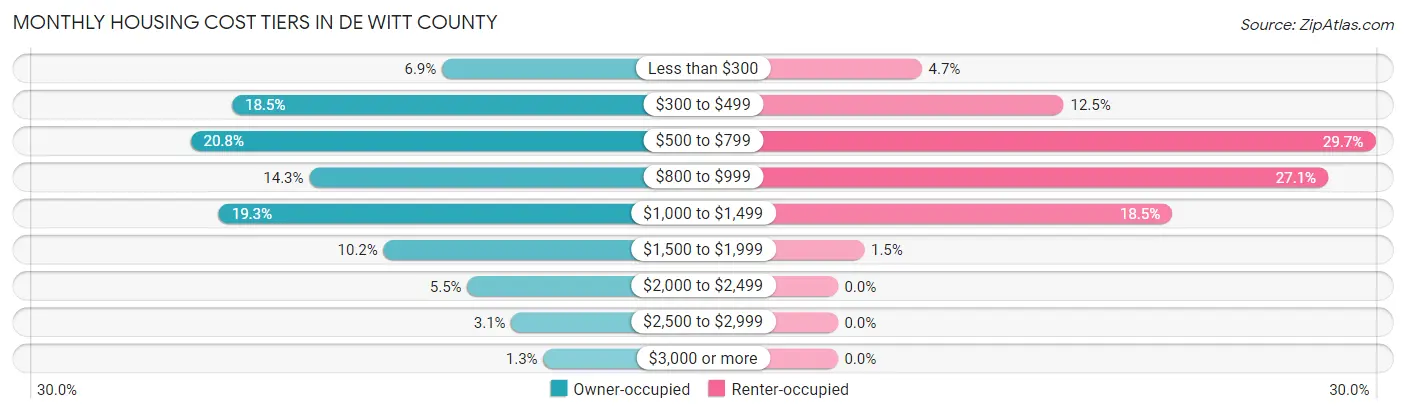
| Monthly Cost | Owner-occupied | Renter-occupied |
| Less than $300 | 352 (6.9%) | 73 (4.6%) |
| $300 to $499 | 941 (18.5%) | 196 (12.5%) |
| $500 to $799 | 1,057 (20.8%) | 466 (29.7%) |
| $800 to $999 | 724 (14.3%) | 425 (27.1%) |
| $1,000 to $1,499 | 978 (19.3%) | 290 (18.5%) |
| $1,500 to $1,999 | 516 (10.2%) | 23 (1.5%) |
| $2,000 to $2,499 | 281 (5.5%) | 0 (0.0%) |
| $2,500 to $2,999 | 158 (3.1%) | 0 (0.0%) |
| $3,000 or more | 68 (1.3%) | 0 (0.0%) |
| Total | 5,075 (100.0%) | 1,569 (100.0%) |
Physical Housing Characteristics in De Witt County
Housing Structures in De Witt County
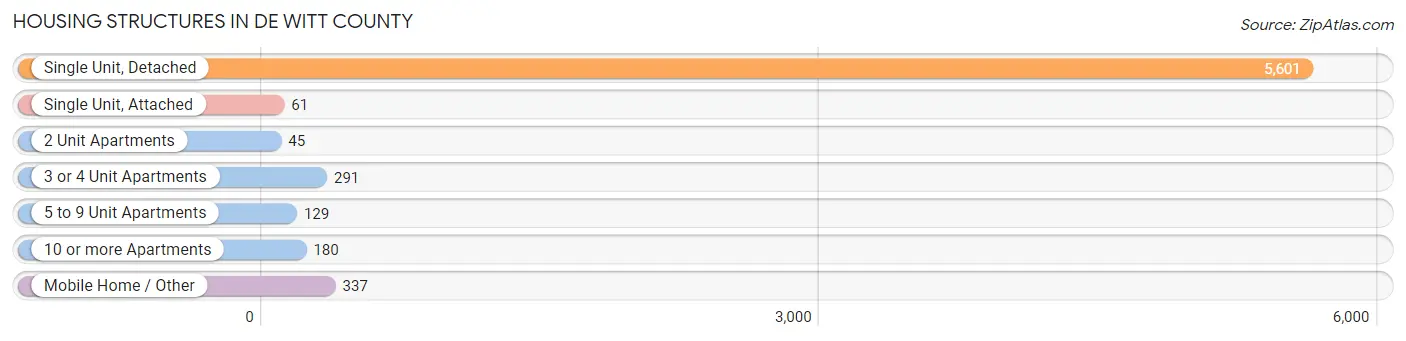
| Structure Type | # Housing Units | % Housing Units |
| Single Unit, Detached | 5,601 | 84.3% |
| Single Unit, Attached | 61 | 0.9% |
| 2 Unit Apartments | 45 | 0.7% |
| 3 or 4 Unit Apartments | 291 | 4.4% |
| 5 to 9 Unit Apartments | 129 | 1.9% |
| 10 or more Apartments | 180 | 2.7% |
| Mobile Home / Other | 337 | 5.1% |
| Total | 6,644 | 100.0% |
Housing Structures by Occupancy in De Witt County
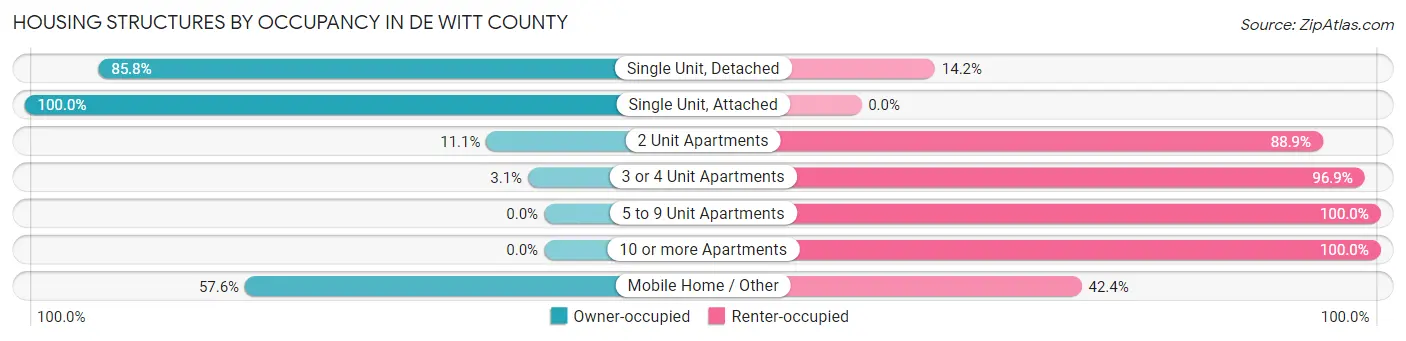
| Structure Type | Owner-occupied | Renter-occupied |
| Single Unit, Detached | 4,806 (85.8%) | 795 (14.2%) |
| Single Unit, Attached | 61 (100.0%) | 0 (0.0%) |
| 2 Unit Apartments | 5 (11.1%) | 40 (88.9%) |
| 3 or 4 Unit Apartments | 9 (3.1%) | 282 (96.9%) |
| 5 to 9 Unit Apartments | 0 (0.0%) | 129 (100.0%) |
| 10 or more Apartments | 0 (0.0%) | 180 (100.0%) |
| Mobile Home / Other | 194 (57.6%) | 143 (42.4%) |
| Total | 5,075 (76.4%) | 1,569 (23.6%) |
Housing Structures by Number of Rooms in De Witt County
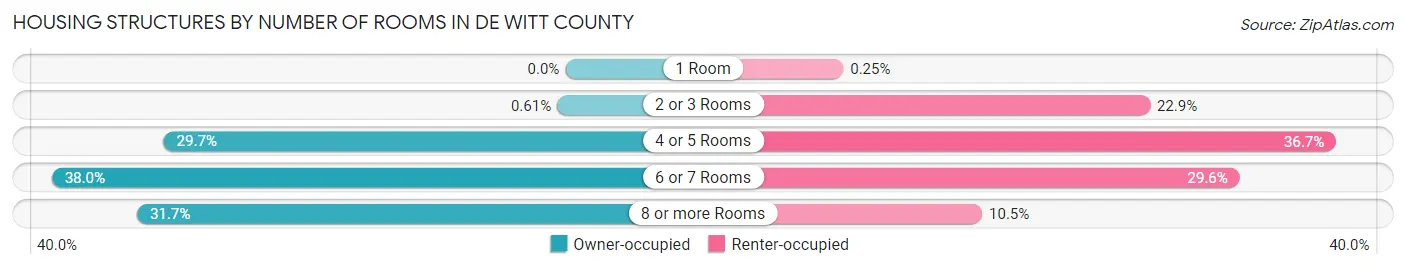
| Number of Rooms | Owner-occupied | Renter-occupied |
| 1 Room | 0 (0.0%) | 4 (0.3%) |
| 2 or 3 Rooms | 31 (0.6%) | 360 (22.9%) |
| 4 or 5 Rooms | 1,508 (29.7%) | 576 (36.7%) |
| 6 or 7 Rooms | 1,928 (38.0%) | 464 (29.6%) |
| 8 or more Rooms | 1,608 (31.7%) | 165 (10.5%) |
| Total | 5,075 (100.0%) | 1,569 (100.0%) |
Housing Structure by Heating Type in De Witt County
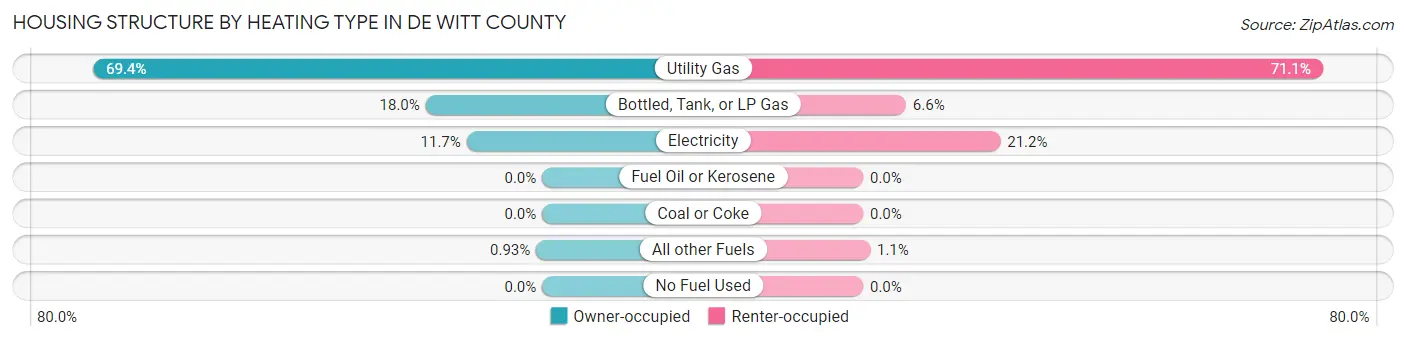
| Heating Type | Owner-occupied | Renter-occupied |
| Utility Gas | 3,522 (69.4%) | 1,115 (71.1%) |
| Bottled, Tank, or LP Gas | 914 (18.0%) | 104 (6.6%) |
| Electricity | 592 (11.7%) | 333 (21.2%) |
| Fuel Oil or Kerosene | 0 (0.0%) | 0 (0.0%) |
| Coal or Coke | 0 (0.0%) | 0 (0.0%) |
| All other Fuels | 47 (0.9%) | 17 (1.1%) |
| No Fuel Used | 0 (0.0%) | 0 (0.0%) |
| Total | 5,075 (100.0%) | 1,569 (100.0%) |
Household Vehicle Usage in De Witt County
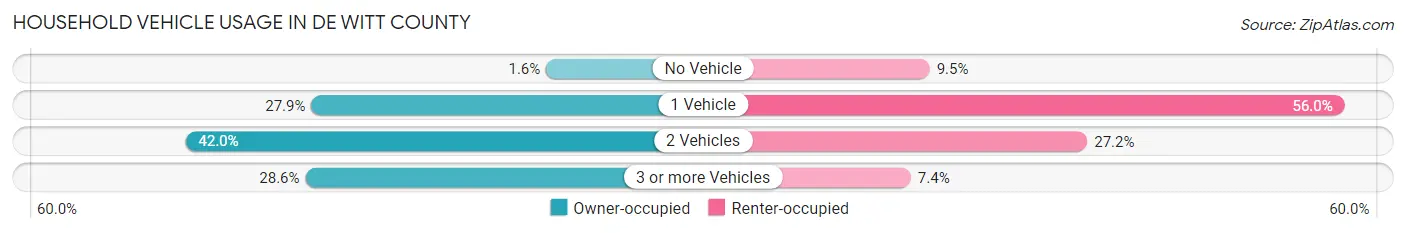
| Vehicles per Household | Owner-occupied | Renter-occupied |
| No Vehicle | 80 (1.6%) | 149 (9.5%) |
| 1 Vehicle | 1,415 (27.9%) | 878 (56.0%) |
| 2 Vehicles | 2,131 (42.0%) | 426 (27.2%) |
| 3 or more Vehicles | 1,449 (28.5%) | 116 (7.4%) |
| Total | 5,075 (100.0%) | 1,569 (100.0%) |
Real Estate & Mortgages in De Witt County
Real Estate and Mortgage Overview in De Witt County
| Characteristic | Without Mortgage | With Mortgage |
| Housing Units | 2,210 | 2,865 |
| Median Property Value | $104,800 | $133,700 |
| Median Household Income | $60,130 | $307 |
| Monthly Housing Costs | $462 | $58 |
| Real Estate Taxes | $1,772 | $34 |
Property Value by Mortgage Status in De Witt County
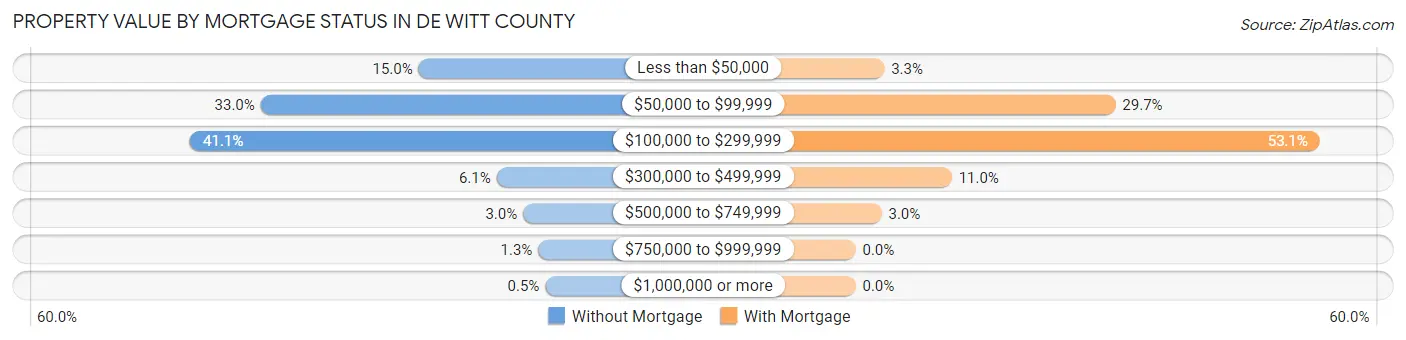
| Property Value | Without Mortgage | With Mortgage |
| Less than $50,000 | 331 (15.0%) | 94 (3.3%) |
| $50,000 to $99,999 | 730 (33.0%) | 851 (29.7%) |
| $100,000 to $299,999 | 908 (41.1%) | 1,520 (53.0%) |
| $300,000 to $499,999 | 134 (6.1%) | 315 (11.0%) |
| $500,000 to $749,999 | 67 (3.0%) | 85 (3.0%) |
| $750,000 to $999,999 | 29 (1.3%) | 0 (0.0%) |
| $1,000,000 or more | 11 (0.5%) | 0 (0.0%) |
| Total | 2,210 (100.0%) | 2,865 (100.0%) |
Household Income by Mortgage Status in De Witt County
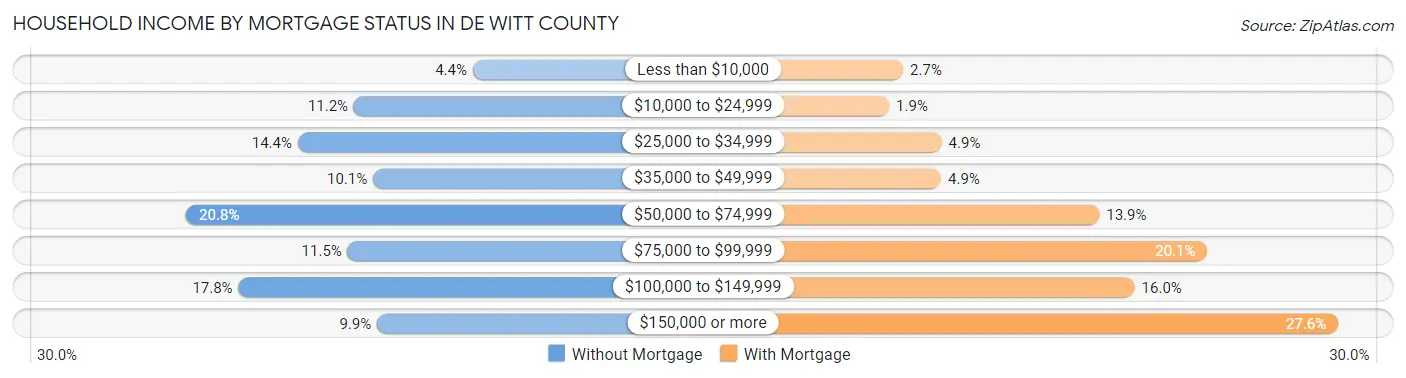
| Household Income | Without Mortgage | With Mortgage |
| Less than $10,000 | 97 (4.4%) | 78 (2.7%) |
| $10,000 to $24,999 | 247 (11.2%) | 55 (1.9%) |
| $25,000 to $34,999 | 318 (14.4%) | 141 (4.9%) |
| $35,000 to $49,999 | 223 (10.1%) | 140 (4.9%) |
| $50,000 to $74,999 | 459 (20.8%) | 399 (13.9%) |
| $75,000 to $99,999 | 255 (11.5%) | 576 (20.1%) |
| $100,000 to $149,999 | 393 (17.8%) | 457 (16.0%) |
| $150,000 or more | 218 (9.9%) | 790 (27.6%) |
| Total | 2,210 (100.0%) | 2,865 (100.0%) |
Property Value to Household Income Ratio in De Witt County
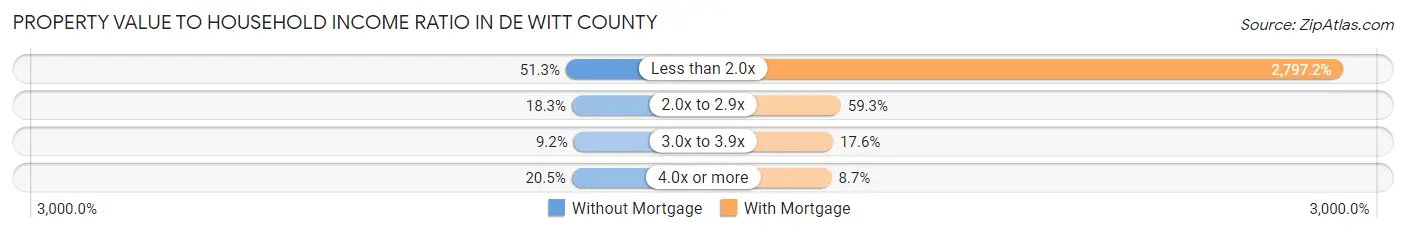
| Value-to-Income Ratio | Without Mortgage | With Mortgage |
| Less than 2.0x | 1,133 (51.3%) | 80,139 (2,797.2%) |
| 2.0x to 2.9x | 404 (18.3%) | 1,699 (59.3%) |
| 3.0x to 3.9x | 204 (9.2%) | 504 (17.6%) |
| 4.0x or more | 453 (20.5%) | 249 (8.7%) |
| Total | 2,210 (100.0%) | 2,865 (100.0%) |
Real Estate Taxes by Mortgage Status in De Witt County
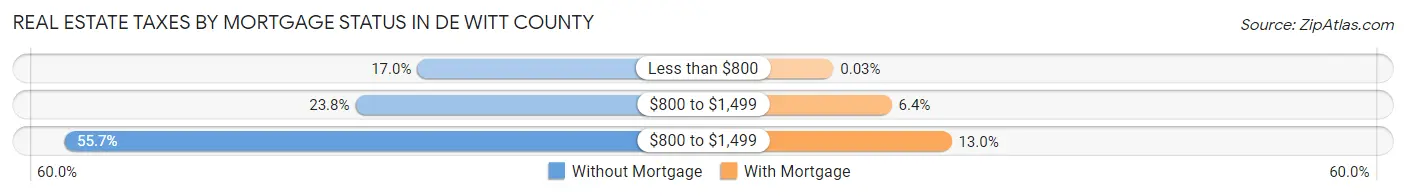
| Property Taxes | Without Mortgage | With Mortgage |
| Less than $800 | 375 (17.0%) | 1 (0.0%) |
| $800 to $1,499 | 525 (23.8%) | 184 (6.4%) |
| $800 to $1,499 | 1,230 (55.7%) | 372 (13.0%) |
| Total | 2,210 (100.0%) | 2,865 (100.0%) |
Health & Disability in De Witt County
Health Insurance Coverage by Age in De Witt County
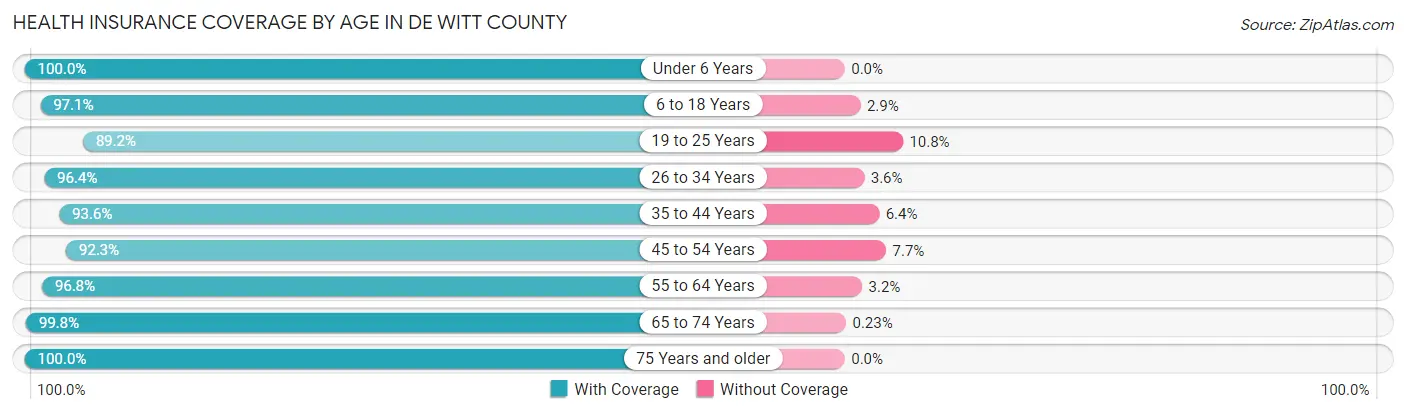
| Age Bracket | With Coverage | Without Coverage |
| Under 6 Years | 1,065 (100.0%) | 0 (0.0%) |
| 6 to 18 Years | 2,263 (97.1%) | 68 (2.9%) |
| 19 to 25 Years | 1,020 (89.2%) | 124 (10.8%) |
| 26 to 34 Years | 1,487 (96.4%) | 56 (3.6%) |
| 35 to 44 Years | 1,750 (93.6%) | 120 (6.4%) |
| 45 to 54 Years | 1,870 (92.3%) | 156 (7.7%) |
| 55 to 64 Years | 2,337 (96.8%) | 78 (3.2%) |
| 65 to 74 Years | 1,736 (99.8%) | 4 (0.2%) |
| 75 Years and older | 1,146 (100.0%) | 0 (0.0%) |
| Total | 14,674 (96.0%) | 606 (4.0%) |
Health Insurance Coverage by Citizenship Status in De Witt County
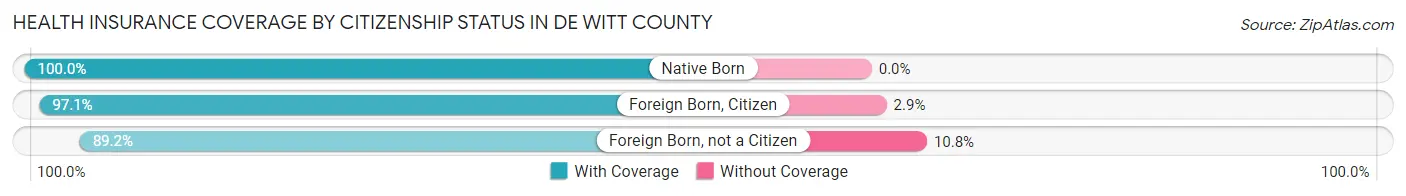
| Citizenship Status | With Coverage | Without Coverage |
| Native Born | 1,065 (100.0%) | 0 (0.0%) |
| Foreign Born, Citizen | 2,263 (97.1%) | 68 (2.9%) |
| Foreign Born, not a Citizen | 1,020 (89.2%) | 124 (10.8%) |
Health Insurance Coverage by Household Income in De Witt County
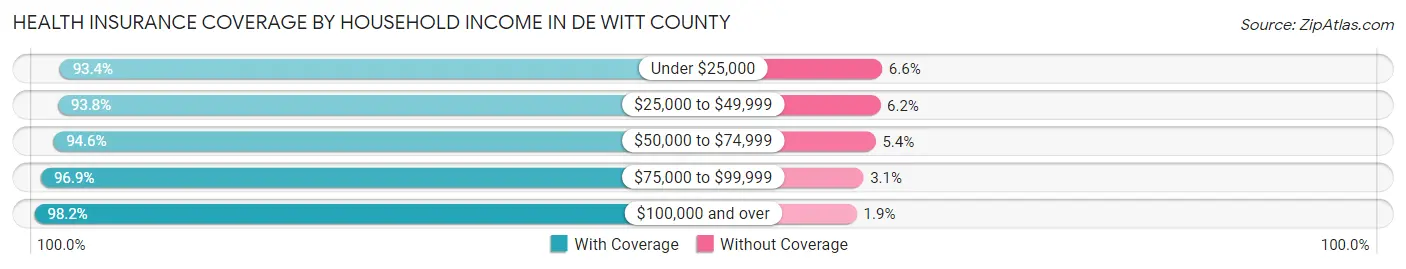
| Household Income | With Coverage | Without Coverage |
| Under $25,000 | 1,590 (93.4%) | 112 (6.6%) |
| $25,000 to $49,999 | 2,586 (93.8%) | 172 (6.2%) |
| $50,000 to $74,999 | 2,485 (94.6%) | 141 (5.4%) |
| $75,000 to $99,999 | 2,329 (96.9%) | 74 (3.1%) |
| $100,000 and over | 5,673 (98.2%) | 107 (1.8%) |
Public vs Private Health Insurance Coverage by Age in De Witt County
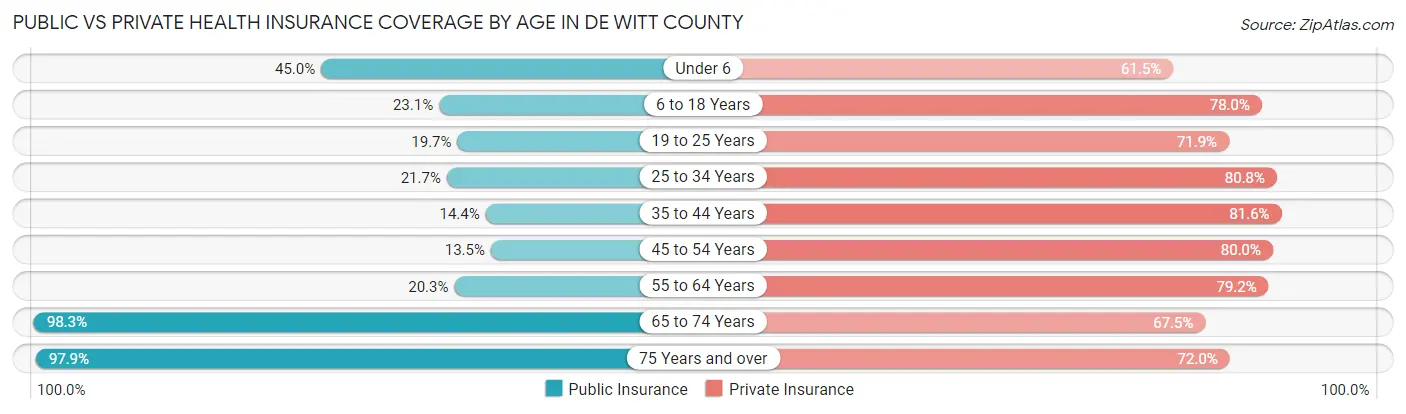
| Age Bracket | Public Insurance | Private Insurance |
| Under 6 | 479 (45.0%) | 655 (61.5%) |
| 6 to 18 Years | 538 (23.1%) | 1,817 (77.9%) |
| 19 to 25 Years | 225 (19.7%) | 822 (71.9%) |
| 25 to 34 Years | 334 (21.6%) | 1,246 (80.7%) |
| 35 to 44 Years | 270 (14.4%) | 1,526 (81.6%) |
| 45 to 54 Years | 273 (13.5%) | 1,621 (80.0%) |
| 55 to 64 Years | 489 (20.3%) | 1,913 (79.2%) |
| 65 to 74 Years | 1,710 (98.3%) | 1,174 (67.5%) |
| 75 Years and over | 1,122 (97.9%) | 825 (72.0%) |
| Total | 5,440 (35.6%) | 11,599 (75.9%) |
Disability Status by Sex by Age in De Witt County
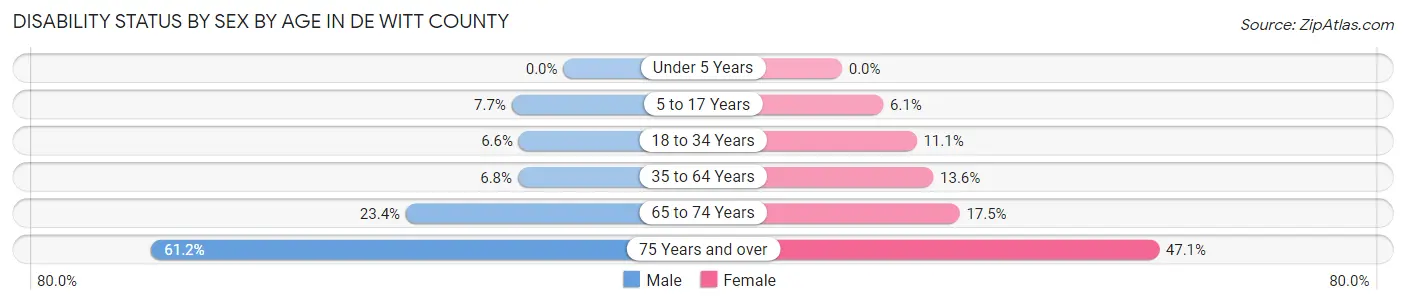
| Age Bracket | Male | Female |
| Under 5 Years | 0 (0.0%) | 0 (0.0%) |
| 5 to 17 Years | 95 (7.7%) | 72 (6.1%) |
| 18 to 34 Years | 96 (6.6%) | 150 (11.1%) |
| 35 to 64 Years | 219 (6.8%) | 416 (13.6%) |
| 65 to 74 Years | 198 (23.4%) | 156 (17.5%) |
| 75 Years and over | 293 (61.2%) | 314 (47.1%) |
Disability Class by Sex by Age in De Witt County
Disability Class: Hearing Difficulty
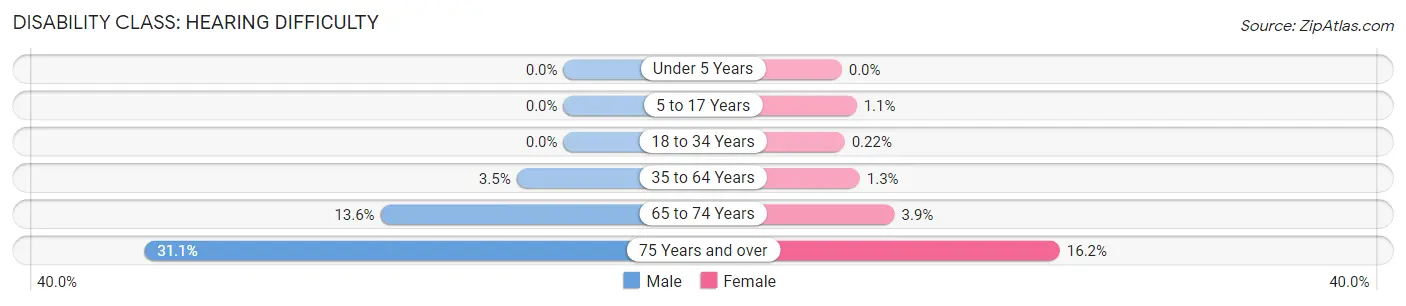
| Age Bracket | Male | Female |
| Under 5 Years | 0 (0.0%) | 0 (0.0%) |
| 5 to 17 Years | 0 (0.0%) | 13 (1.1%) |
| 18 to 34 Years | 0 (0.0%) | 3 (0.2%) |
| 35 to 64 Years | 113 (3.5%) | 41 (1.3%) |
| 65 to 74 Years | 115 (13.6%) | 35 (3.9%) |
| 75 Years and over | 149 (31.1%) | 108 (16.2%) |
Disability Class: Vision Difficulty
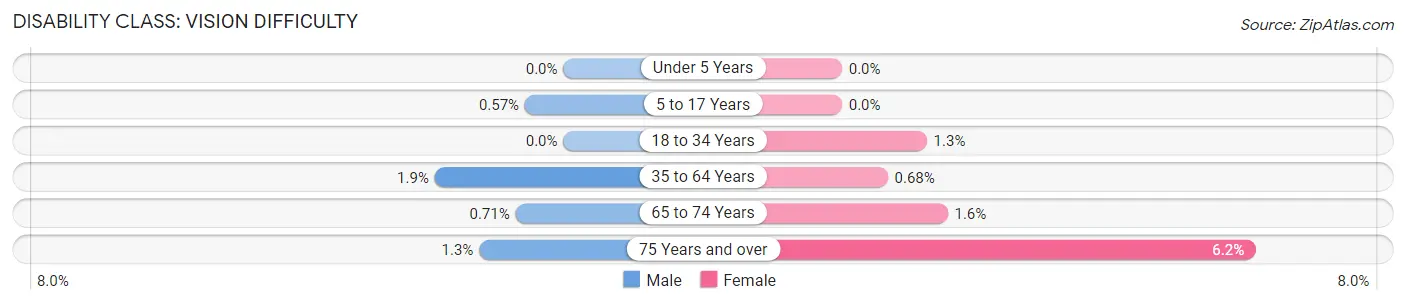
| Age Bracket | Male | Female |
| Under 5 Years | 0 (0.0%) | 0 (0.0%) |
| 5 to 17 Years | 7 (0.6%) | 0 (0.0%) |
| 18 to 34 Years | 0 (0.0%) | 17 (1.3%) |
| 35 to 64 Years | 62 (1.9%) | 21 (0.7%) |
| 65 to 74 Years | 6 (0.7%) | 14 (1.6%) |
| 75 Years and over | 6 (1.3%) | 41 (6.1%) |
Disability Class: Cognitive Difficulty
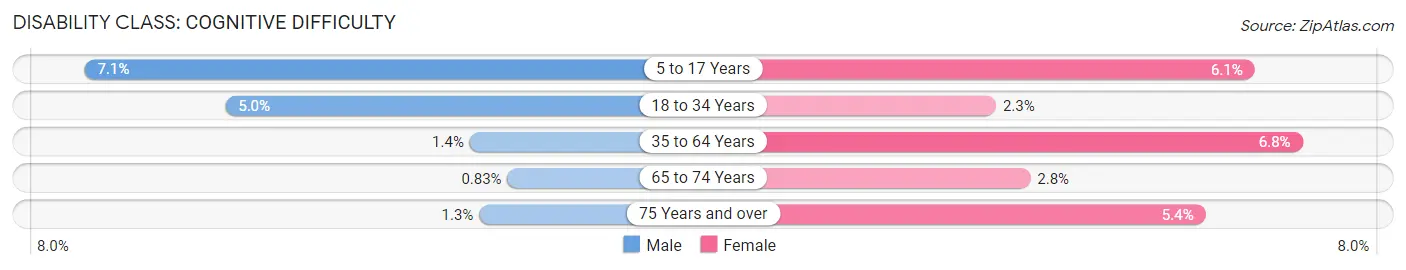
| Age Bracket | Male | Female |
| 5 to 17 Years | 88 (7.1%) | 72 (6.1%) |
| 18 to 34 Years | 73 (5.0%) | 31 (2.3%) |
| 35 to 64 Years | 45 (1.4%) | 210 (6.8%) |
| 65 to 74 Years | 7 (0.8%) | 25 (2.8%) |
| 75 Years and over | 6 (1.3%) | 36 (5.4%) |
Disability Class: Ambulatory Difficulty
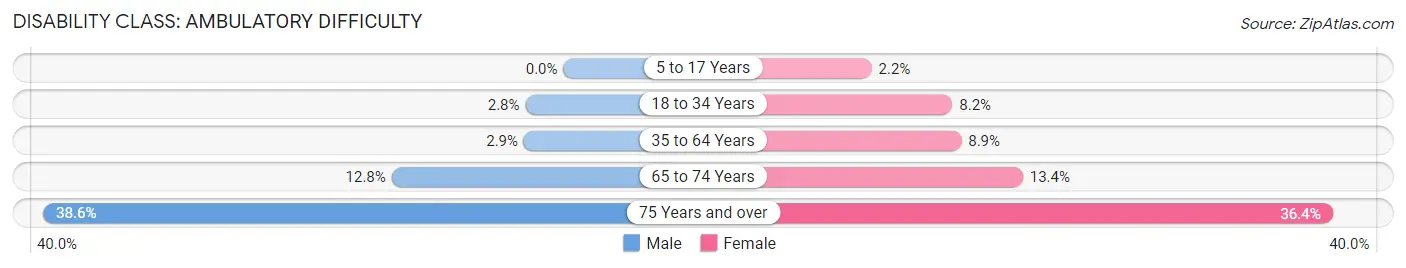
| Age Bracket | Male | Female |
| 5 to 17 Years | 0 (0.0%) | 26 (2.2%) |
| 18 to 34 Years | 41 (2.8%) | 111 (8.2%) |
| 35 to 64 Years | 95 (2.9%) | 272 (8.9%) |
| 65 to 74 Years | 108 (12.8%) | 120 (13.4%) |
| 75 Years and over | 185 (38.6%) | 243 (36.4%) |
Disability Class: Self-Care Difficulty
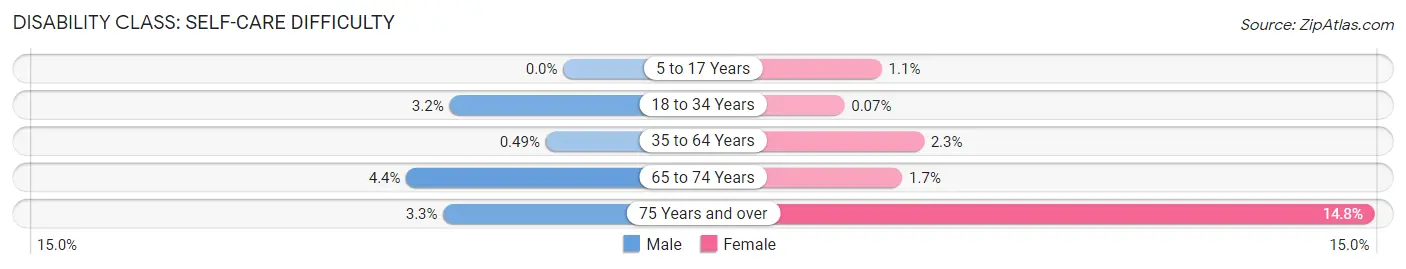
| Age Bracket | Male | Female |
| 5 to 17 Years | 0 (0.0%) | 13 (1.1%) |
| 18 to 34 Years | 46 (3.2%) | 1 (0.1%) |
| 35 to 64 Years | 16 (0.5%) | 70 (2.3%) |
| 65 to 74 Years | 37 (4.4%) | 15 (1.7%) |
| 75 Years and over | 16 (3.3%) | 99 (14.8%) |
Technology Access in De Witt County
Computing Device Access in De Witt County
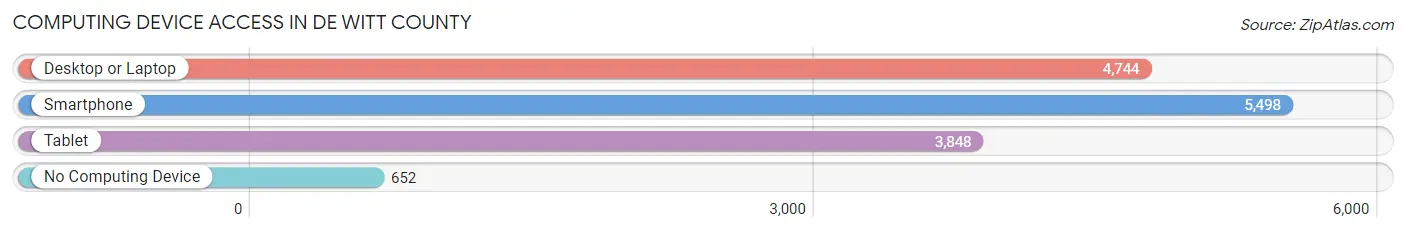
| Device Type | # Households | % Households |
| Desktop or Laptop | 4,744 | 71.4% |
| Smartphone | 5,498 | 82.8% |
| Tablet | 3,848 | 57.9% |
| No Computing Device | 652 | 9.8% |
| Total | 6,644 | 100.0% |
Internet Access in De Witt County
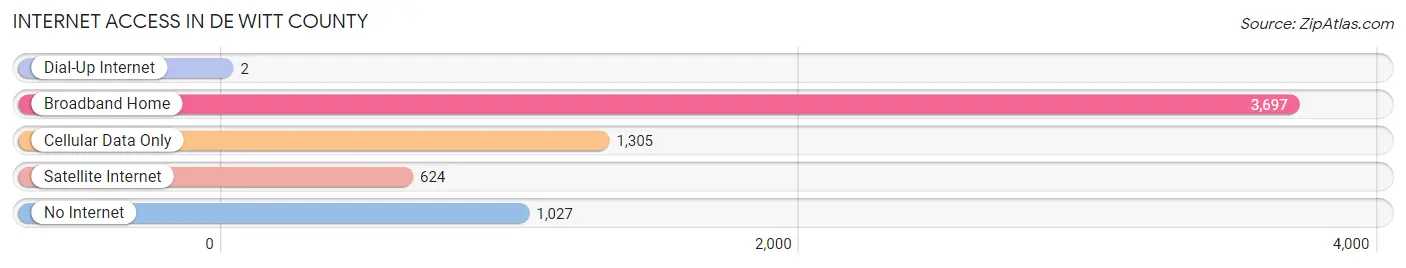
| Internet Type | # Households | % Households |
| Dial-Up Internet | 2 | 0.0% |
| Broadband Home | 3,697 | 55.6% |
| Cellular Data Only | 1,305 | 19.6% |
| Satellite Internet | 624 | 9.4% |
| No Internet | 1,027 | 15.5% |
| Total | 6,644 | 100.0% |
De Witt County Summary
De Witt County is located in the central part of Illinois, in the United States. It is bordered by McLean County to the north, Piatt County to the east, Champaign County to the south, and McDonough County to the west. The county seat is Clinton, and the largest city is Farmer City. The county was named after DeWitt Clinton, the seventh Governor of New York.
Geography
De Witt County covers an area of 576 square miles, of which 574 square miles is land and 2 square miles is water. The county is located in the central part of the state, and is part of the Central Illinois region. The terrain is mostly flat, with some rolling hills in the northern part of the county. The Sangamon River flows through the county, and there are several small lakes and ponds. The climate is humid continental, with hot summers and cold winters.
Demographics
As of the 2010 census, there were 16,561 people, 6,541 households, and 4,541 families living in the county. The population density was 28.9 people per square mile. The racial makeup of the county was 97.2% White, 0.7% African American, 0.3% Native American, 0.3% Asian, 0.2% from other races, and 1.3% from two or more races. Hispanic or Latino of any race were 1.3% of the population.
The median income for a household in the county was $48,945, and the median income for a family was $58,945. The per capita income for the county was $22,945. About 8.2% of families and 10.7% of the population were below the poverty line, including 14.2% of those under age 18 and 8.2% of those age 65 or over.
Economy
De Witt County has a diverse economy, with a mix of agriculture, manufacturing, and services. The county is home to several large agricultural operations, including grain and livestock farms. The county is also home to several manufacturing companies, including a large automotive parts plant. The service sector is also important to the county’s economy, with several healthcare and educational institutions located in the county.
De Witt County is also home to several tourist attractions, including the Clinton Lake State Recreation Area, the Clinton Lake Marina, and the Clinton Lake Museum. The county is also home to several wineries, and is a popular destination for outdoor recreation.
Conclusion
De Witt County is a rural county located in the central part of Illinois. It has a diverse economy, with a mix of agriculture, manufacturing, and services. The county is home to several tourist attractions, and is a popular destination for outdoor recreation. The population of the county is mostly white, with a small percentage of African Americans, Native Americans, and Asians. The median income for a household in the county is $48,945, and the per capita income is $22,945.
Common Questions
What is Per Capita Income in De Witt County?
Per Capita income in De Witt County is $35,630.
What is the Median Family Income in De Witt County?
Median Family Income in De Witt County is $86,064.
What is the Median Household income in De Witt County?
Median Household Income in De Witt County is $61,823.
What is Income or Wage Gap in De Witt County?
Income or Wage Gap in De Witt County is 30.9%.
Women in De Witt County earn 69.1 cents for every dollar earned by a man.
What is Family Income Deficit in De Witt County?
Family Income Deficit in De Witt County is $9,770.
Families that are below poverty line in De Witt County earn $9,770 less on average than the poverty threshold level.
What is Inequality or Gini Index in De Witt County?
Inequality or Gini Index in De Witt County is 0.42.
What is the Total Population of De Witt County?
Total Population of De Witt County is 15,535.
What is the Total Male Population of De Witt County?
Total Male Population of De Witt County is 7,822.
What is the Total Female Population of De Witt County?
Total Female Population of De Witt County is 7,713.
What is the Ratio of Males per 100 Females in De Witt County?
There are 101.41 Males per 100 Females in De Witt County.
What is the Ratio of Females per 100 Males in De Witt County?
There are 98.61 Females per 100 Males in De Witt County.
What is the Median Population Age in De Witt County?
Median Population Age in De Witt County is 44.0 Years.
What is the Average Family Size in De Witt County
Average Family Size in De Witt County is 3.0 People.
What is the Average Household Size in De Witt County
Average Household Size in De Witt County is 2.3 People.
How Large is the Labor Force in De Witt County?
There are 8,061 People in the Labor Forcein in De Witt County.
What is the Percentage of People in the Labor Force in De Witt County?
63.3% of People are in the Labor Force in De Witt County.
What is the Unemployment Rate in De Witt County?
Unemployment Rate in De Witt County is 5.4%.