Cumberland County, IL Map & Demographics
Cumberland County Map
Cumberland County Overview
$34,338
PER CAPITA INCOME
$88,494
AVG FAMILY INCOME
$71,274
AVG HOUSEHOLD INCOME
42.2%
WAGE / INCOME GAP [ % ]
57.8¢/ $1
WAGE / INCOME GAP [ $ ]
$9,801
FAMILY INCOME DEFICIT
0.40
INEQUALITY / GINI INDEX
10,447
TOTAL POPULATION
5,400
MALE POPULATION
5,047
FEMALE POPULATION
106.99
MALES / 100 FEMALES
93.46
FEMALES / 100 MALES
42.6
MEDIAN AGE
3.0
AVG FAMILY SIZE
2.5
AVG HOUSEHOLD SIZE
5,628
LABOR FORCE [ PEOPLE ]
66.9%
PERCENT IN LABOR FORCE
1.9%
UNEMPLOYMENT RATE
Cumberland County Area Codes
Income in Cumberland County
Income Overview in Cumberland County
Per Capita Income in Cumberland County is $34,338, while median incomes of families and households are $88,494 and $71,274 respectively.
| Characteristic | Number | Measure |
| Per Capita Income | 10,447 | $34,338 |
| Median Family Income | 2,763 | $88,494 |
| Mean Family Income | 2,763 | $97,378 |
| Median Household Income | 4,142 | $71,274 |
| Mean Household Income | 4,142 | $84,760 |
| Income Deficit | 2,763 | $9,801 |
| Wage / Income Gap (%) | 10,447 | 42.19% |
| Wage / Income Gap ($) | 10,447 | 57.81¢ per $1 |
| Gini / Inequality Index | 10,447 | 0.40 |
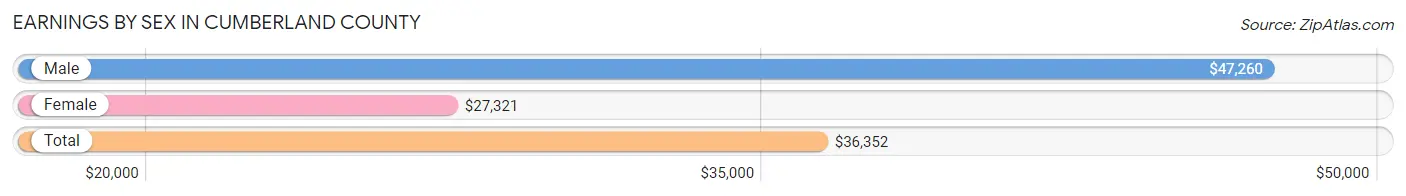
Earnings by Sex in Cumberland County
Average Earnings in Cumberland County are $36,352, $47,260 for men and $27,321 for women, a difference of 42.2%.
| Sex | Number | Average Earnings |
| Male | 3,155 (53.4%) | $47,260 |
| Female | 2,757 (46.6%) | $27,321 |
| Total | 5,912 (100.0%) | $36,352 |
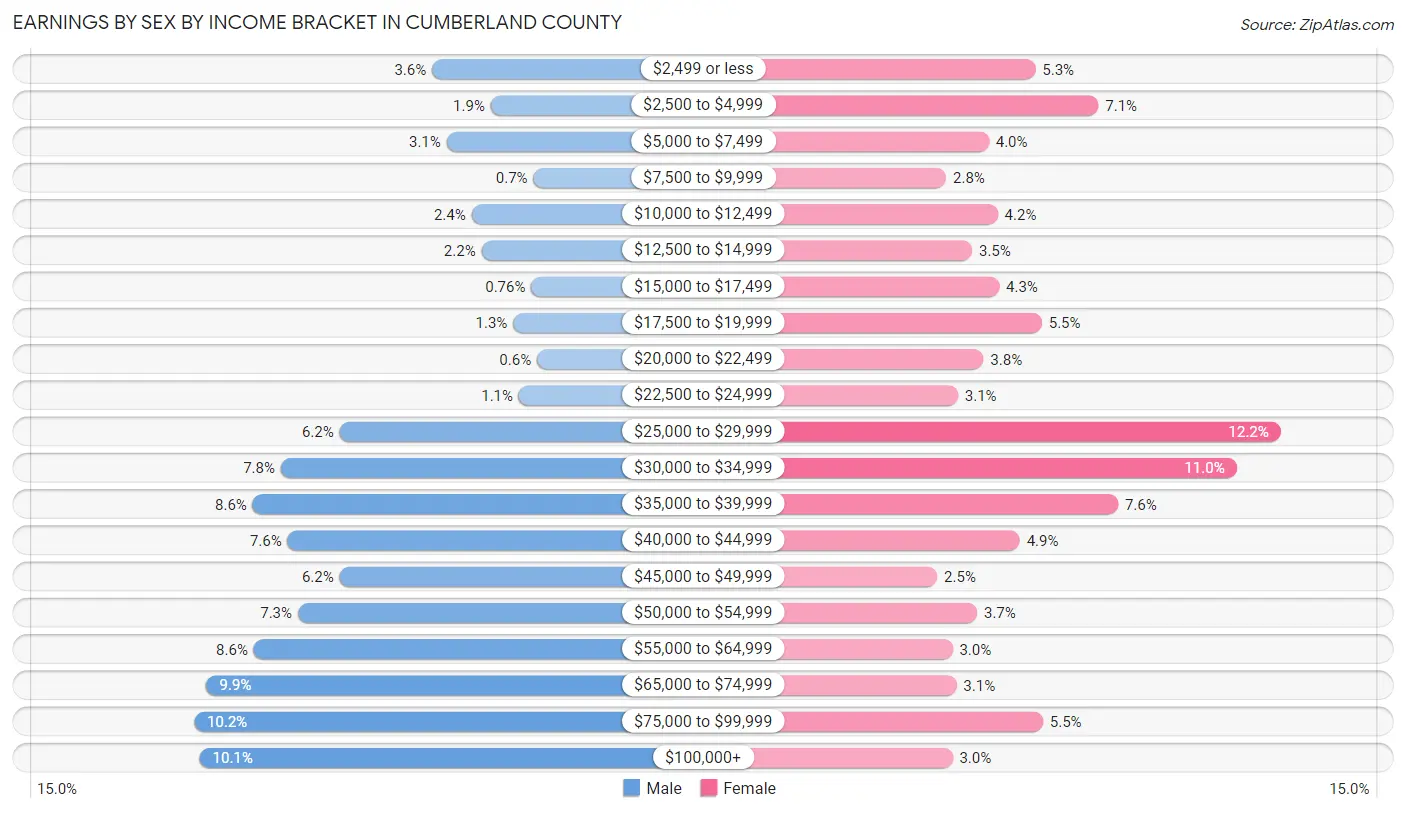
Earnings by Sex by Income Bracket in Cumberland County
The most common earnings brackets in Cumberland County are $75,000 to $99,999 for men (323 | 10.2%) and $25,000 to $29,999 for women (336 | 12.2%).
| Income | Male | Female |
| $2,499 or less | 112 (3.5%) | 146 (5.3%) |
| $2,500 to $4,999 | 60 (1.9%) | 195 (7.1%) |
| $5,000 to $7,499 | 99 (3.1%) | 110 (4.0%) |
| $7,500 to $9,999 | 22 (0.7%) | 77 (2.8%) |
| $10,000 to $12,499 | 77 (2.4%) | 117 (4.2%) |
| $12,500 to $14,999 | 68 (2.2%) | 97 (3.5%) |
| $15,000 to $17,499 | 24 (0.8%) | 118 (4.3%) |
| $17,500 to $19,999 | 40 (1.3%) | 151 (5.5%) |
| $20,000 to $22,499 | 19 (0.6%) | 106 (3.8%) |
| $22,500 to $24,999 | 35 (1.1%) | 86 (3.1%) |
| $25,000 to $29,999 | 194 (6.1%) | 336 (12.2%) |
| $30,000 to $34,999 | 246 (7.8%) | 302 (11.0%) |
| $35,000 to $39,999 | 271 (8.6%) | 210 (7.6%) |
| $40,000 to $44,999 | 240 (7.6%) | 134 (4.9%) |
| $45,000 to $49,999 | 194 (6.1%) | 70 (2.5%) |
| $50,000 to $54,999 | 231 (7.3%) | 101 (3.7%) |
| $55,000 to $64,999 | 270 (8.6%) | 82 (3.0%) |
| $65,000 to $74,999 | 312 (9.9%) | 85 (3.1%) |
| $75,000 to $99,999 | 323 (10.2%) | 152 (5.5%) |
| $100,000+ | 318 (10.1%) | 82 (3.0%) |
| Total | 3,155 (100.0%) | 2,757 (100.0%) |
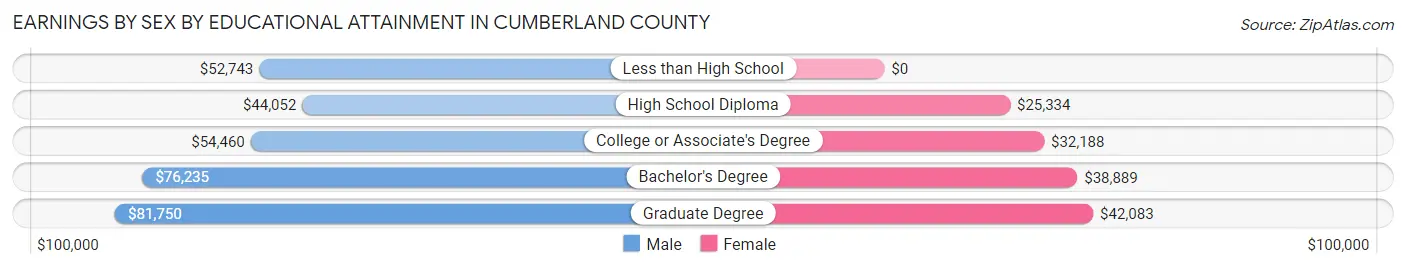
Earnings by Sex by Educational Attainment in Cumberland County
Average earnings in Cumberland County are $52,562 for men and $29,545 for women, a difference of 43.8%. Men with an educational attainment of graduate degree enjoy the highest average annual earnings of $81,750, while those with high school diploma education earn the least with $44,052. Women with an educational attainment of graduate degree earn the most with the average annual earnings of $42,083, while those with high school diploma education have the smallest earnings of $25,334.
| Educational Attainment | Male Income | Female Income |
| Less than High School | $52,743 | $0 |
| High School Diploma | $44,052 | $25,334 |
| College or Associate's Degree | $54,460 | $32,188 |
| Bachelor's Degree | $76,235 | $38,889 |
| Graduate Degree | $81,750 | $42,083 |
| Total | $52,562 | $29,545 |
Family Income in Cumberland County
Family Income Brackets in Cumberland County
According to the Cumberland County family income data, there are 710 families falling into the $100,000 to $149,999 income range, which is the most common income bracket and makes up 25.7% of all families. Conversely, the $10,000 to $14,999 income bracket is the least frequent group with only 28 families (1.0%) belonging to this category.
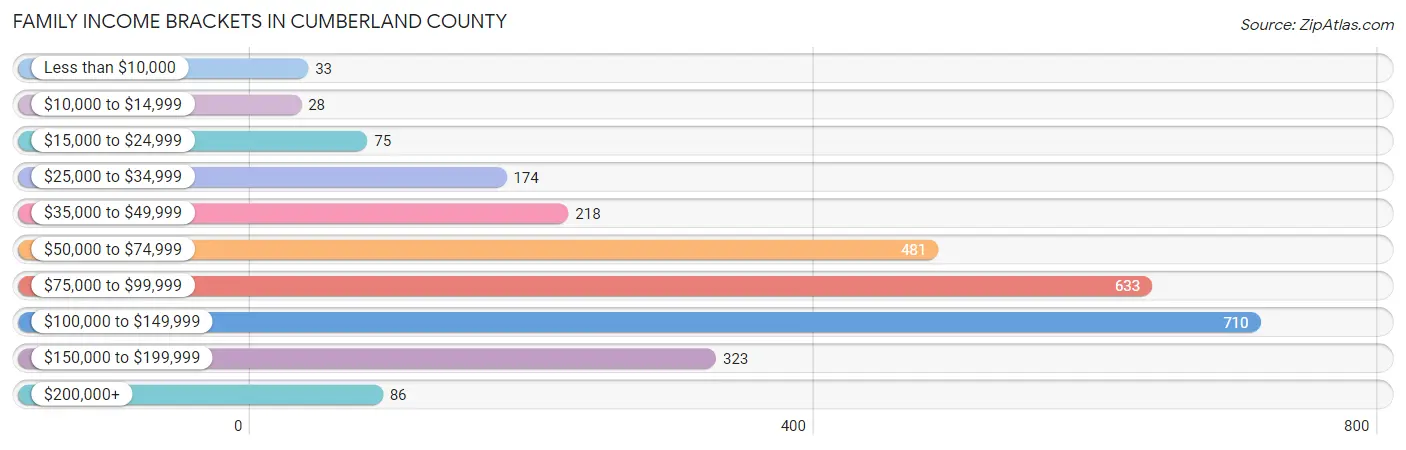
| Income Bracket | # Families | % Families |
| Less than $10,000 | 33 | 1.2% |
| $10,000 to $14,999 | 28 | 1.0% |
| $15,000 to $24,999 | 75 | 2.7% |
| $25,000 to $34,999 | 174 | 6.3% |
| $35,000 to $49,999 | 218 | 7.9% |
| $50,000 to $74,999 | 481 | 17.4% |
| $75,000 to $99,999 | 633 | 22.9% |
| $100,000 to $149,999 | 710 | 25.7% |
| $150,000 to $199,999 | 323 | 11.7% |
| $200,000+ | 86 | 3.1% |
Family Income by Famaliy Size in Cumberland County
5-person families (194 | 7.0%) account for the highest median family income in Cumberland County with $113,906 per family, while 2-person families (1,394 | 50.4%) have the highest median income of $39,250 per family member.
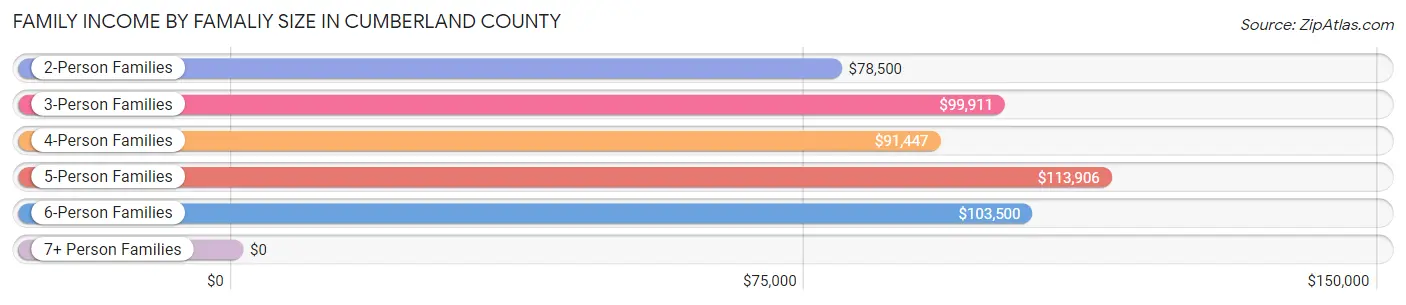
| Income Bracket | # Families | Median Income |
| 2-Person Families | 1,394 (50.4%) | $78,500 |
| 3-Person Families | 622 (22.5%) | $99,911 |
| 4-Person Families | 500 (18.1%) | $91,447 |
| 5-Person Families | 194 (7.0%) | $113,906 |
| 6-Person Families | 32 (1.2%) | $103,500 |
| 7+ Person Families | 21 (0.8%) | $0 |
| Total | 2,763 (100.0%) | $88,494 |
Family Income by Number of Earners in Cumberland County
The median family income in Cumberland County is $88,494, with families comprising 3+ earners (444) having the highest median family income of $137,708, while families with no earners (434) have the lowest median family income of $53,158, accounting for 16.1% and 15.7% of families, respectively.
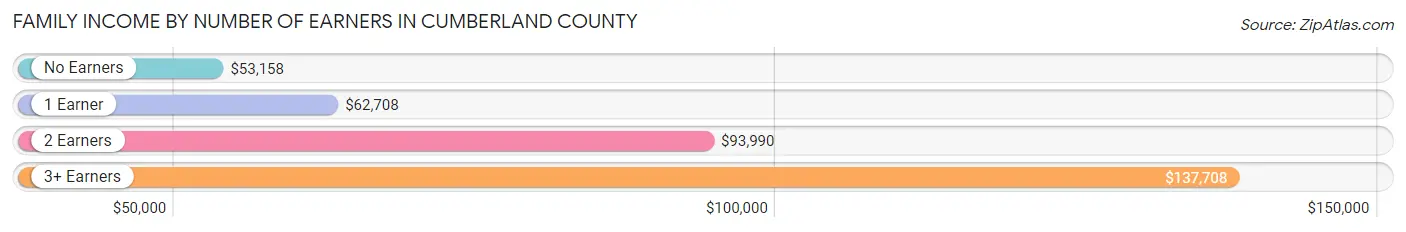
| Number of Earners | # Families | Median Income |
| No Earners | 434 (15.7%) | $53,158 |
| 1 Earner | 498 (18.0%) | $62,708 |
| 2 Earners | 1,387 (50.2%) | $93,990 |
| 3+ Earners | 444 (16.1%) | $137,708 |
| Total | 2,763 (100.0%) | $88,494 |
Household Income in Cumberland County
Household Income Brackets in Cumberland County
With 766 households falling in the category, the $75,000 to $99,999 income range is the most frequent in Cumberland County, accounting for 18.5% of all households. In contrast, only 112 households (2.7%) fall into the $10,000 to $14,999 income bracket, making it the least populous group.
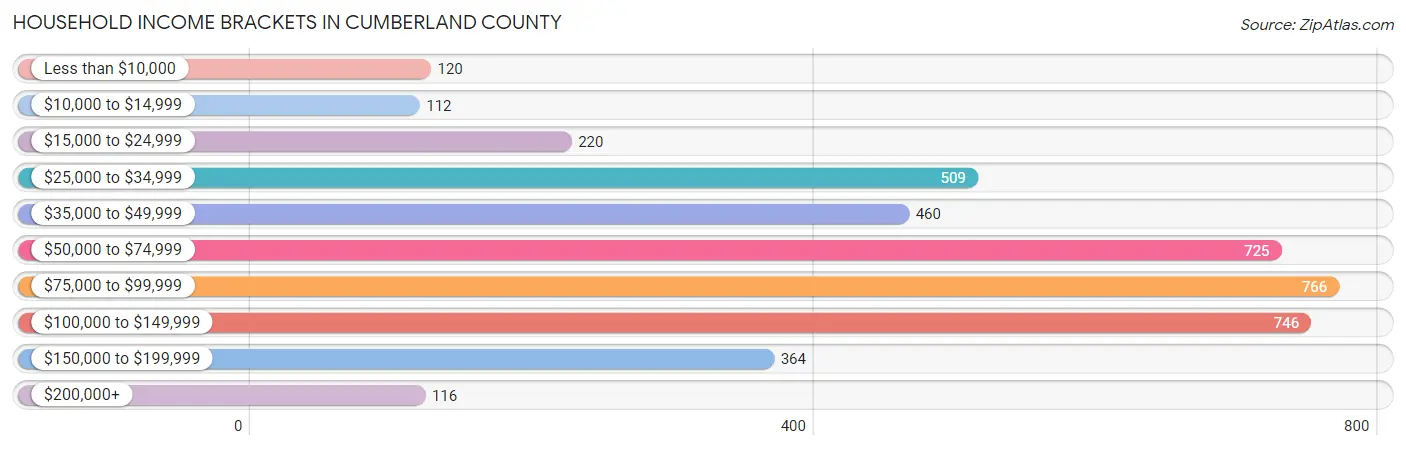
| Income Bracket | # Households | % Households |
| Less than $10,000 | 120 | 2.9% |
| $10,000 to $14,999 | 112 | 2.7% |
| $15,000 to $24,999 | 220 | 5.3% |
| $25,000 to $34,999 | 509 | 12.3% |
| $35,000 to $49,999 | 460 | 11.1% |
| $50,000 to $74,999 | 725 | 17.5% |
| $75,000 to $99,999 | 766 | 18.5% |
| $100,000 to $149,999 | 746 | 18.0% |
| $150,000 to $199,999 | 364 | 8.8% |
| $200,000+ | 116 | 2.8% |
Household Income by Householder Age in Cumberland County
The median household income in Cumberland County is $71,274, with the highest median household income of $87,426 found in the 45 to 64 years age bracket for the primary householder. A total of 1,633 households (39.4%) fall into this category. Meanwhile, the 65+ years age bracket for the primary householder has the lowest median household income of $42,404, with 1,319 households (31.8%) in this group.
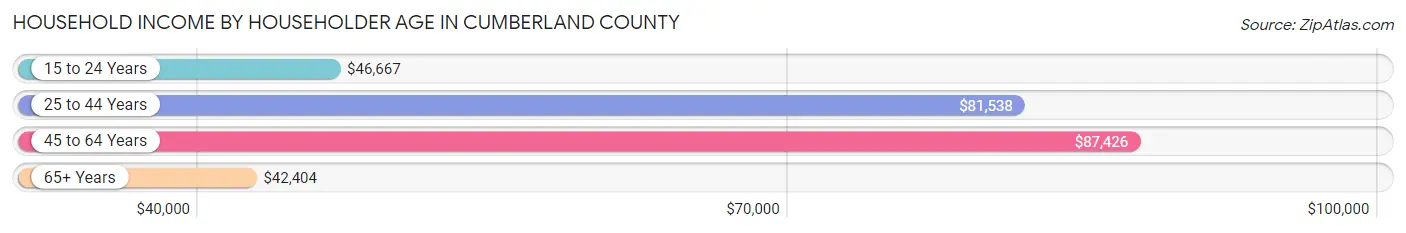
| Income Bracket | # Households | Median Income |
| 15 to 24 Years | 76 (1.8%) | $46,667 |
| 25 to 44 Years | 1,114 (26.9%) | $81,538 |
| 45 to 64 Years | 1,633 (39.4%) | $87,426 |
| 65+ Years | 1,319 (31.8%) | $42,404 |
| Total | 4,142 (100.0%) | $71,274 |
Poverty in Cumberland County
Income Below Poverty by Sex and Age in Cumberland County
With 9.5% poverty level for males and 10.0% for females among the residents of Cumberland County, 15 year old males and 16 and 17 year old females are the most vulnerable to poverty, with 15 males (39.5%) and 29 females (20.9%) in their respective age groups living below the poverty level.
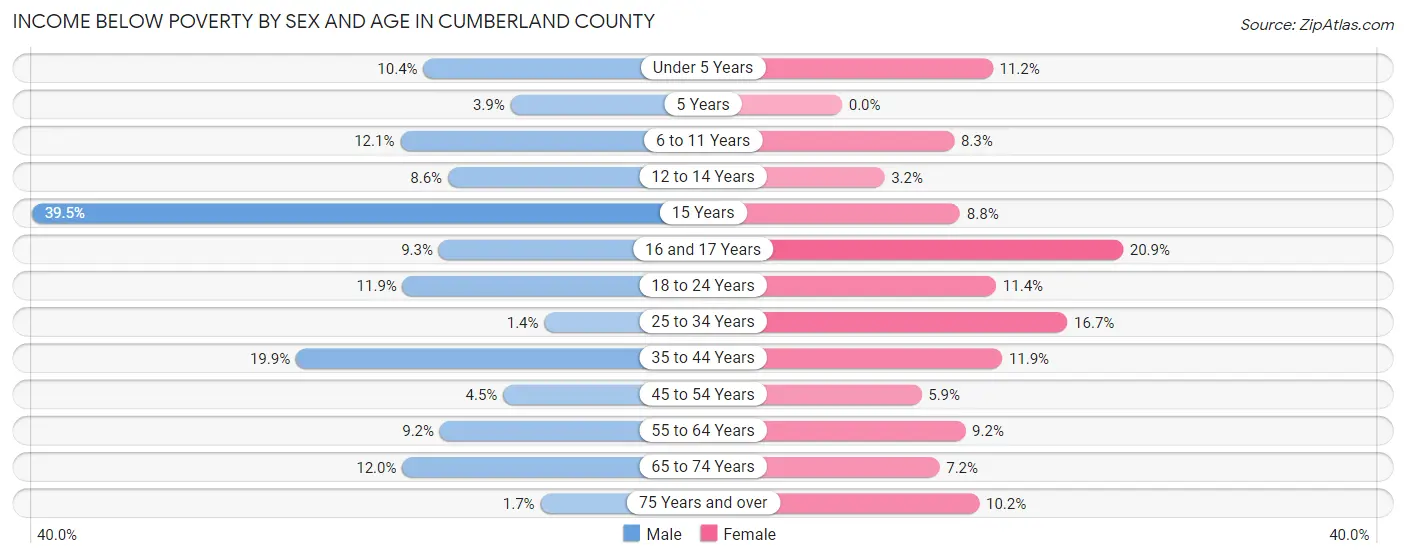
| Age Bracket | Male | Female |
| Under 5 Years | 35 (10.4%) | 31 (11.2%) |
| 5 Years | 2 (3.9%) | 0 (0.0%) |
| 6 to 11 Years | 55 (12.1%) | 30 (8.3%) |
| 12 to 14 Years | 15 (8.6%) | 4 (3.2%) |
| 15 Years | 15 (39.5%) | 5 (8.8%) |
| 16 and 17 Years | 16 (9.2%) | 29 (20.9%) |
| 18 to 24 Years | 42 (11.9%) | 39 (11.4%) |
| 25 to 34 Years | 9 (1.4%) | 91 (16.7%) |
| 35 to 44 Years | 134 (19.9%) | 73 (11.9%) |
| 45 to 54 Years | 29 (4.5%) | 36 (5.9%) |
| 55 to 64 Years | 72 (9.2%) | 68 (9.2%) |
| 65 to 74 Years | 77 (12.0%) | 43 (7.2%) |
| 75 Years and over | 6 (1.7%) | 44 (10.2%) |
| Total | 507 (9.5%) | 493 (10.0%) |
Income Above Poverty by Sex and Age in Cumberland County
According to the poverty statistics in Cumberland County, males aged 25 to 34 years and females aged 5 years are the age groups that are most secure financially, with 98.6% of males and 100.0% of females in these age groups living above the poverty line.
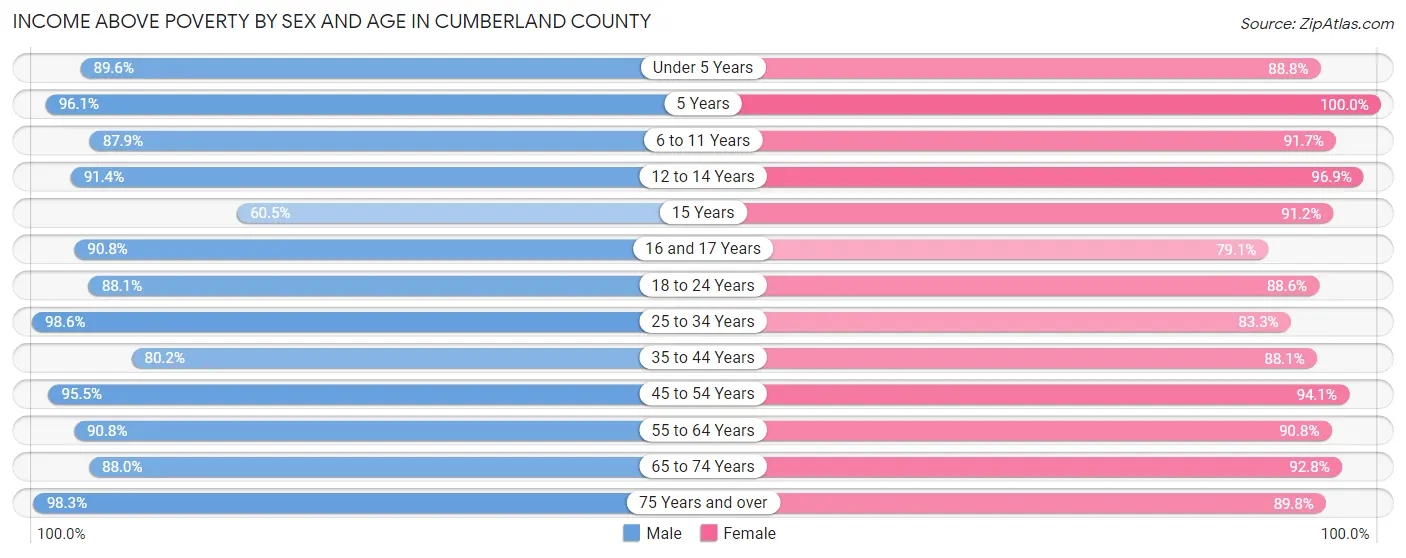
| Age Bracket | Male | Female |
| Under 5 Years | 302 (89.6%) | 246 (88.8%) |
| 5 Years | 49 (96.1%) | 99 (100.0%) |
| 6 to 11 Years | 399 (87.9%) | 330 (91.7%) |
| 12 to 14 Years | 160 (91.4%) | 123 (96.9%) |
| 15 Years | 23 (60.5%) | 52 (91.2%) |
| 16 and 17 Years | 157 (90.7%) | 110 (79.1%) |
| 18 to 24 Years | 310 (88.1%) | 302 (88.6%) |
| 25 to 34 Years | 628 (98.6%) | 453 (83.3%) |
| 35 to 44 Years | 541 (80.1%) | 541 (88.1%) |
| 45 to 54 Years | 620 (95.5%) | 574 (94.1%) |
| 55 to 64 Years | 713 (90.8%) | 674 (90.8%) |
| 65 to 74 Years | 567 (88.0%) | 551 (92.8%) |
| 75 Years and over | 347 (98.3%) | 388 (89.8%) |
| Total | 4,816 (90.5%) | 4,443 (90.0%) |
Income Below Poverty Among Married-Couple Families in Cumberland County
The poverty statistics for married-couple families in Cumberland County show that 3.0% or 72 of the total 2,375 families live below the poverty line. Families with 3 or 4 children have the highest poverty rate of 11.7%, comprising of 19 families. On the other hand, families with 5 or more children have the lowest poverty rate of 0.0%, which includes 0 families.
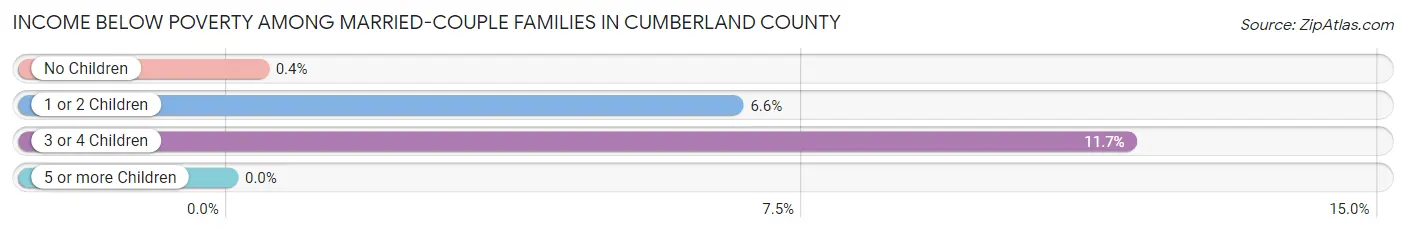
| Children | Above Poverty | Below Poverty |
| No Children | 1,482 (99.6%) | 6 (0.4%) |
| 1 or 2 Children | 665 (93.4%) | 47 (6.6%) |
| 3 or 4 Children | 143 (88.3%) | 19 (11.7%) |
| 5 or more Children | 13 (100.0%) | 0 (0.0%) |
| Total | 2,303 (97.0%) | 72 (3.0%) |
Income Below Poverty Among Single-Parent Households in Cumberland County
According to the poverty data in Cumberland County, 4.3% or 6 single-father households and 22.9% or 57 single-mother households are living below the poverty line. Among single-father households, those with 1 or 2 children have the highest poverty rate, with 4 households (6.7%) experiencing poverty. Likewise, among single-mother households, those with 3 or 4 children have the highest poverty rate, with 17 households (39.5%) falling below the poverty line.
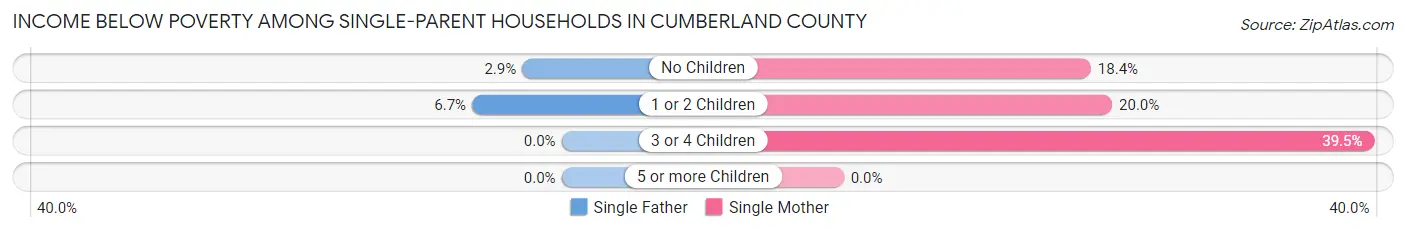
| Children | Single Father | Single Mother |
| No Children | 2 (2.9%) | 14 (18.4%) |
| 1 or 2 Children | 4 (6.7%) | 26 (20.0%) |
| 3 or 4 Children | 0 (0.0%) | 17 (39.5%) |
| 5 or more Children | 0 (0.0%) | 0 (0.0%) |
| Total | 6 (4.3%) | 57 (22.9%) |
Income Below Poverty Among Married-Couple vs Single-Parent Households in Cumberland County
The poverty data for Cumberland County shows that 72 of the married-couple family households (3.0%) and 63 of the single-parent households (16.2%) are living below the poverty level. Within the married-couple family households, those with 3 or 4 children have the highest poverty rate, with 19 households (11.7%) falling below the poverty line. Among the single-parent households, those with 3 or 4 children have the highest poverty rate, with 17 household (31.5%) living below poverty.
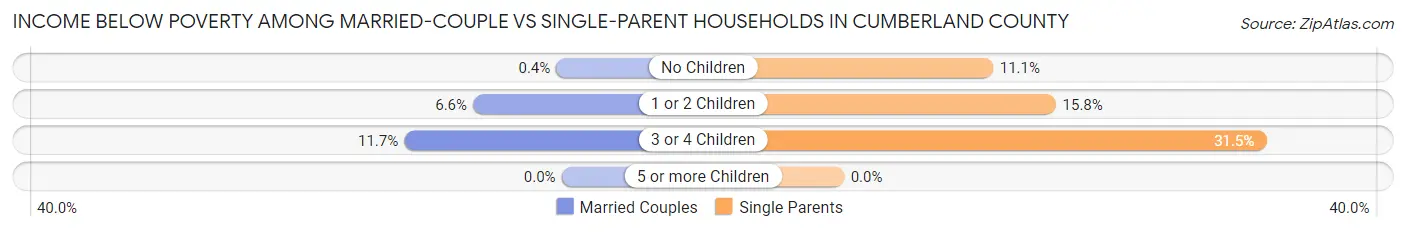
| Children | Married-Couple Families | Single-Parent Households |
| No Children | 6 (0.4%) | 16 (11.1%) |
| 1 or 2 Children | 47 (6.6%) | 30 (15.8%) |
| 3 or 4 Children | 19 (11.7%) | 17 (31.5%) |
| 5 or more Children | 0 (0.0%) | 0 (0.0%) |
| Total | 72 (3.0%) | 63 (16.2%) |
Race in Cumberland County
The most populous races in Cumberland County are White / Caucasian (10,053 | 96.2%), Two or more Races (225 | 2.1%), and Hispanic or Latino (175 | 1.7%).
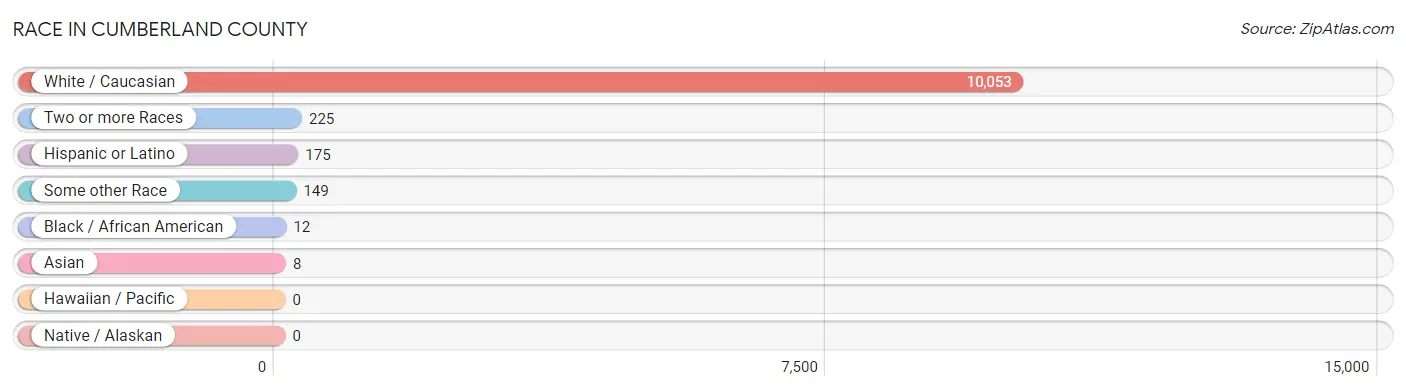
| Race | # Population | % Population |
| Asian | 8 | 0.1% |
| Black / African American | 12 | 0.1% |
| Hawaiian / Pacific | 0 | 0.0% |
| Hispanic or Latino | 175 | 1.7% |
| Native / Alaskan | 0 | 0.0% |
| White / Caucasian | 10,053 | 96.2% |
| Two or more Races | 225 | 2.1% |
| Some other Race | 149 | 1.4% |
| Total | 10,447 | 100.0% |
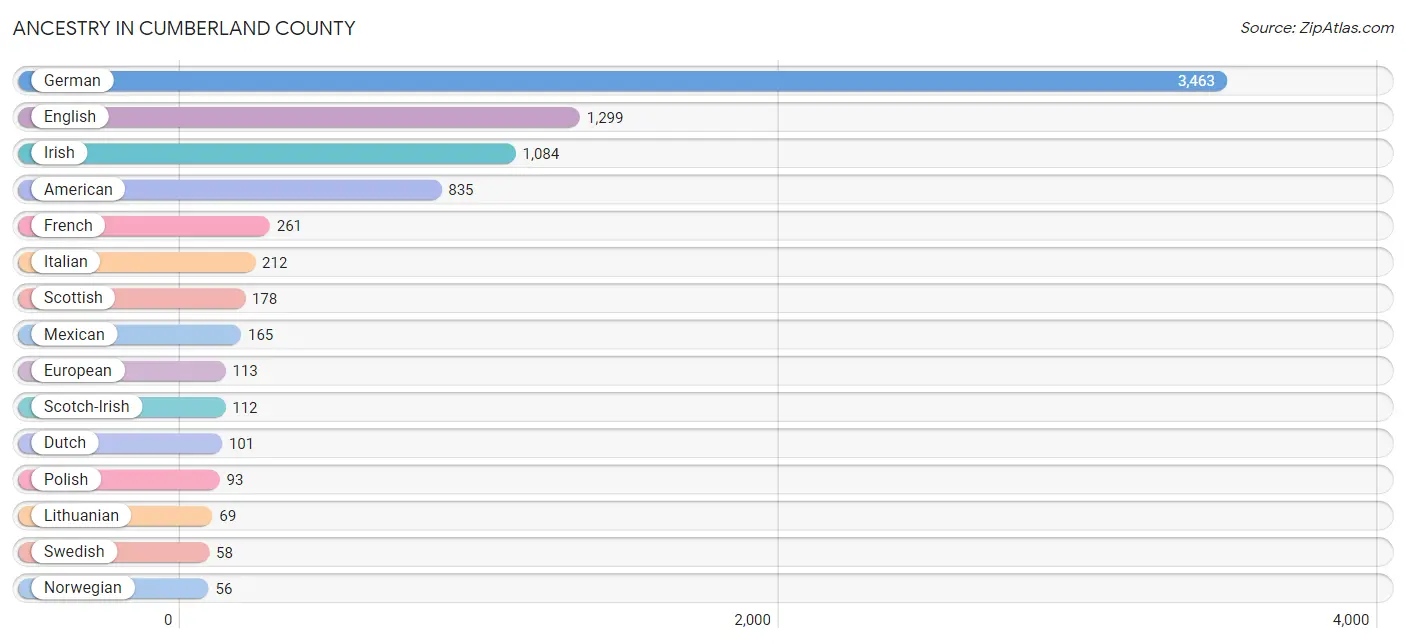
Ancestry in Cumberland County
The most populous ancestries reported in Cumberland County are German (3,463 | 33.2%), English (1,299 | 12.4%), Irish (1,084 | 10.4%), American (835 | 8.0%), and French (261 | 2.5%), together accounting for 66.4% of all Cumberland County residents.
| Ancestry | # Population | % Population |
| American | 835 | 8.0% |
| Austrian | 3 | 0.0% |
| British | 24 | 0.2% |
| Burmese | 4 | 0.0% |
| Central American | 8 | 0.1% |
| Cherokee | 42 | 0.4% |
| Croatian | 5 | 0.1% |
| Czech | 7 | 0.1% |
| Czechoslovakian | 3 | 0.0% |
| Danish | 8 | 0.1% |
| Dutch | 101 | 1.0% |
| Eastern European | 11 | 0.1% |
| English | 1,299 | 12.4% |
| European | 113 | 1.1% |
| French | 261 | 2.5% |
| French Canadian | 5 | 0.1% |
| German | 3,463 | 33.2% |
| Guamanian / Chamorro | 5 | 0.1% |
| Hungarian | 5 | 0.1% |
| Irish | 1,084 | 10.4% |
| Italian | 212 | 2.0% |
| Korean | 8 | 0.1% |
| Lithuanian | 69 | 0.7% |
| Mexican | 165 | 1.6% |
| Northern European | 4 | 0.0% |
| Norwegian | 56 | 0.5% |
| Panamanian | 8 | 0.1% |
| Pennsylvania German | 4 | 0.0% |
| Polish | 93 | 0.9% |
| Portuguese | 8 | 0.1% |
| Puerto Rican | 2 | 0.0% |
| Russian | 4 | 0.0% |
| Scandinavian | 13 | 0.1% |
| Scotch-Irish | 112 | 1.1% |
| Scottish | 178 | 1.7% |
| Swedish | 58 | 0.6% |
| Welsh | 22 | 0.2% | View All 37 Rows |
Immigrants in Cumberland County
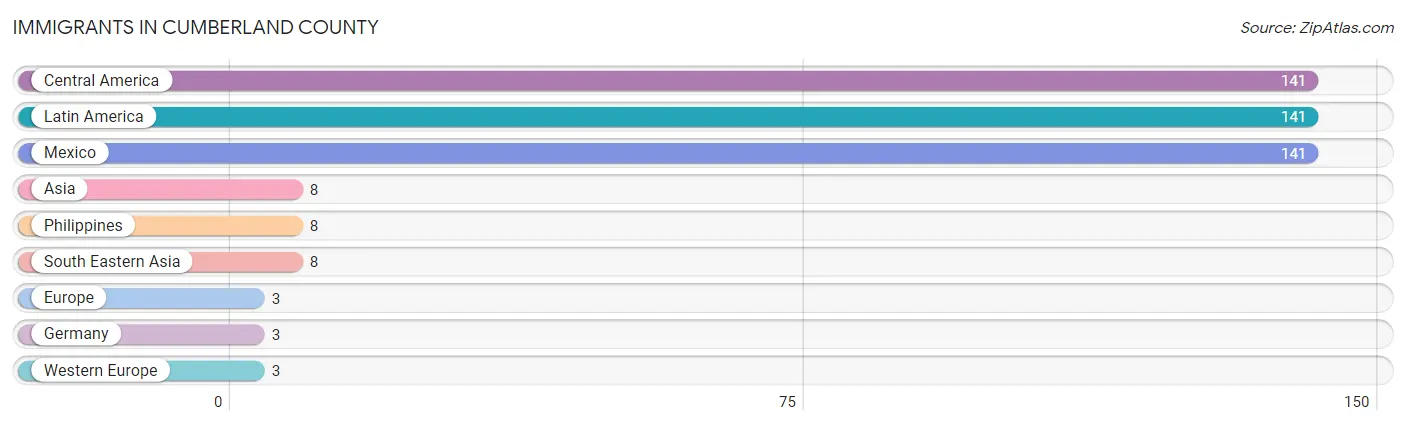
The most numerous immigrant groups reported in Cumberland County came from Central America (141 | 1.3%), Latin America (141 | 1.3%), Mexico (141 | 1.3%), Asia (8 | 0.1%), and Philippines (8 | 0.1%), together accounting for 4.2% of all Cumberland County residents.
| Immigration Origin | # Population | % Population |
| Asia | 8 | 0.1% |
| Central America | 141 | 1.3% |
| Europe | 3 | 0.0% |
| Germany | 3 | 0.0% |
| Latin America | 141 | 1.3% |
| Mexico | 141 | 1.3% |
| Philippines | 8 | 0.1% |
| South Eastern Asia | 8 | 0.1% |
| Western Europe | 3 | 0.0% | View All 9 Rows |
Sex and Age in Cumberland County
Sex and Age in Cumberland County
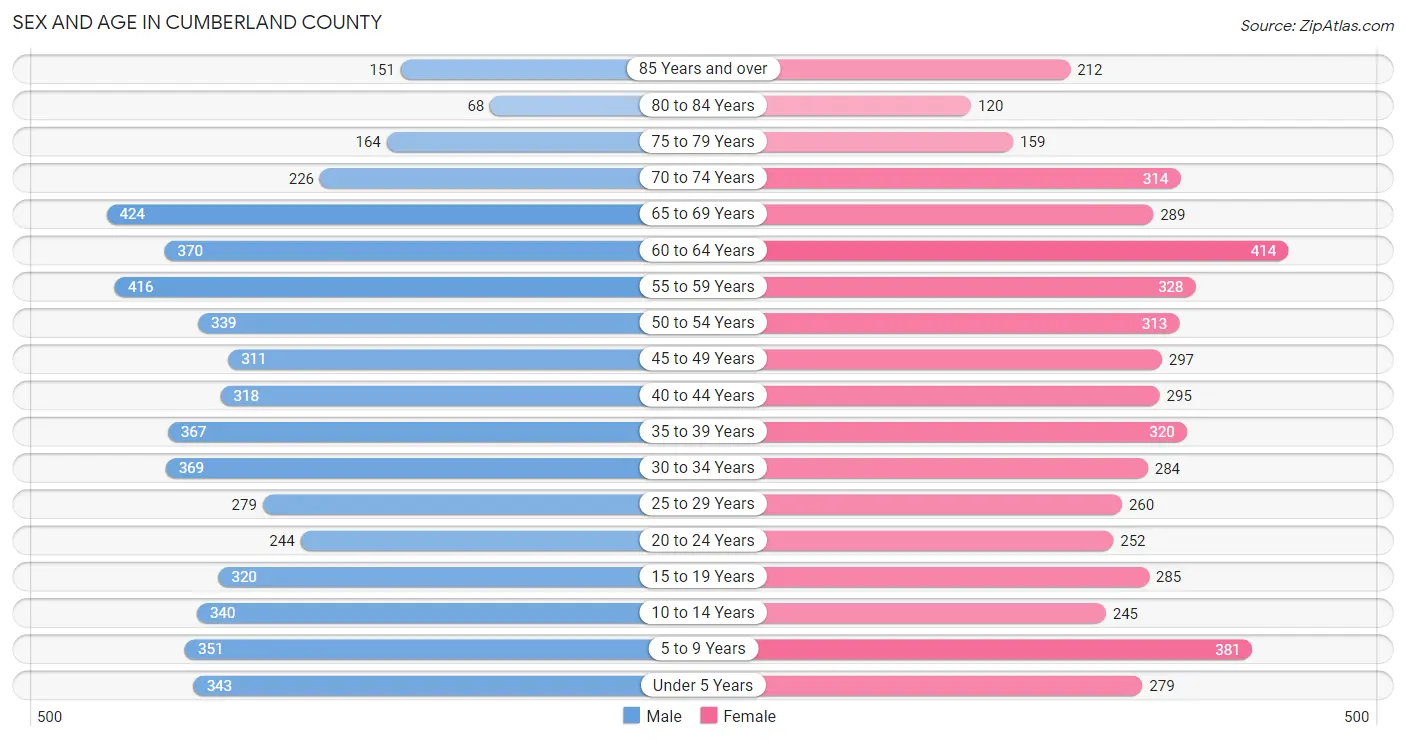
The most populous age groups in Cumberland County are 65 to 69 Years (424 | 7.9%) for men and 60 to 64 Years (414 | 8.2%) for women.
| Age Bracket | Male | Female |
| Under 5 Years | 343 (6.4%) | 279 (5.5%) |
| 5 to 9 Years | 351 (6.5%) | 381 (7.5%) |
| 10 to 14 Years | 340 (6.3%) | 245 (4.9%) |
| 15 to 19 Years | 320 (5.9%) | 285 (5.7%) |
| 20 to 24 Years | 244 (4.5%) | 252 (5.0%) |
| 25 to 29 Years | 279 (5.2%) | 260 (5.1%) |
| 30 to 34 Years | 369 (6.8%) | 284 (5.6%) |
| 35 to 39 Years | 367 (6.8%) | 320 (6.3%) |
| 40 to 44 Years | 318 (5.9%) | 295 (5.9%) |
| 45 to 49 Years | 311 (5.8%) | 297 (5.9%) |
| 50 to 54 Years | 339 (6.3%) | 313 (6.2%) |
| 55 to 59 Years | 416 (7.7%) | 328 (6.5%) |
| 60 to 64 Years | 370 (6.9%) | 414 (8.2%) |
| 65 to 69 Years | 424 (7.9%) | 289 (5.7%) |
| 70 to 74 Years | 226 (4.2%) | 314 (6.2%) |
| 75 to 79 Years | 164 (3.0%) | 159 (3.2%) |
| 80 to 84 Years | 68 (1.3%) | 120 (2.4%) |
| 85 Years and over | 151 (2.8%) | 212 (4.2%) |
| Total | 5,400 (100.0%) | 5,047 (100.0%) |
Families and Households in Cumberland County
Median Family Size in Cumberland County
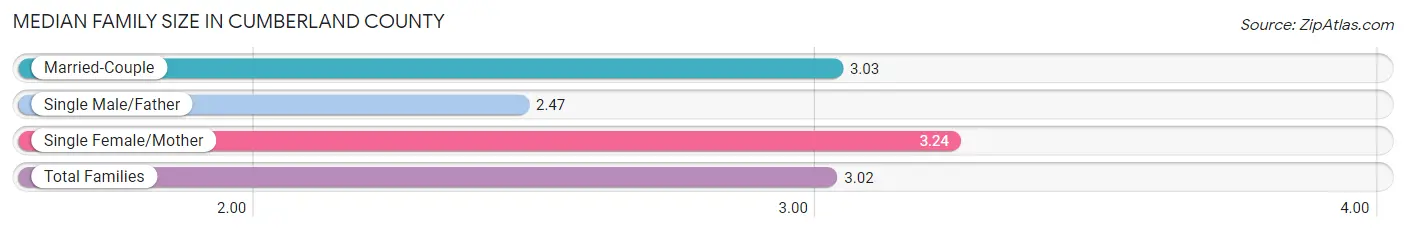
The median family size in Cumberland County is 3.02 persons per family, with single female/mother families (249 | 9.0%) accounting for the largest median family size of 3.24 persons per family. On the other hand, single male/father families (139 | 5.0%) represent the smallest median family size with 2.47 persons per family.
| Family Type | # Families | Family Size |
| Married-Couple | 2,375 (86.0%) | 3.03 |
| Single Male/Father | 139 (5.0%) | 2.47 |
| Single Female/Mother | 249 (9.0%) | 3.24 |
| Total Families | 2,763 (100.0%) | 3.02 |
Median Household Size in Cumberland County
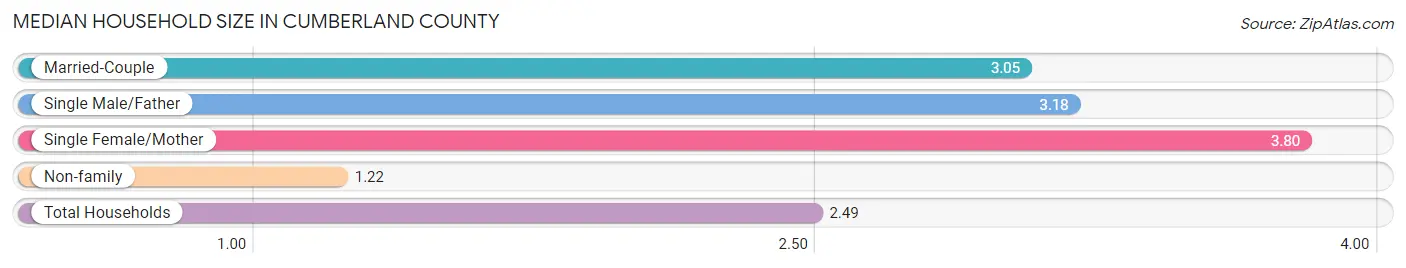
The median household size in Cumberland County is 2.49 persons per household, with single female/mother households (249 | 6.0%) accounting for the largest median household size of 3.8 persons per household. non-family households (1,379 | 33.3%) represent the smallest median household size with 1.22 persons per household.
| Household Type | # Households | Household Size |
| Married-Couple | 2,375 (57.3%) | 3.05 |
| Single Male/Father | 139 (3.4%) | 3.18 |
| Single Female/Mother | 249 (6.0%) | 3.80 |
| Non-family | 1,379 (33.3%) | 1.22 |
| Total Households | 4,142 (100.0%) | 2.49 |
Household Size by Marriage Status in Cumberland County
Out of a total of 4,142 households in Cumberland County, 2,763 (66.7%) are family households, while 1,379 (33.3%) are nonfamily households. The most numerous type of family households are 2-person households, comprising 1,319, and the most common type of nonfamily households are 1-person households, comprising 1,246.
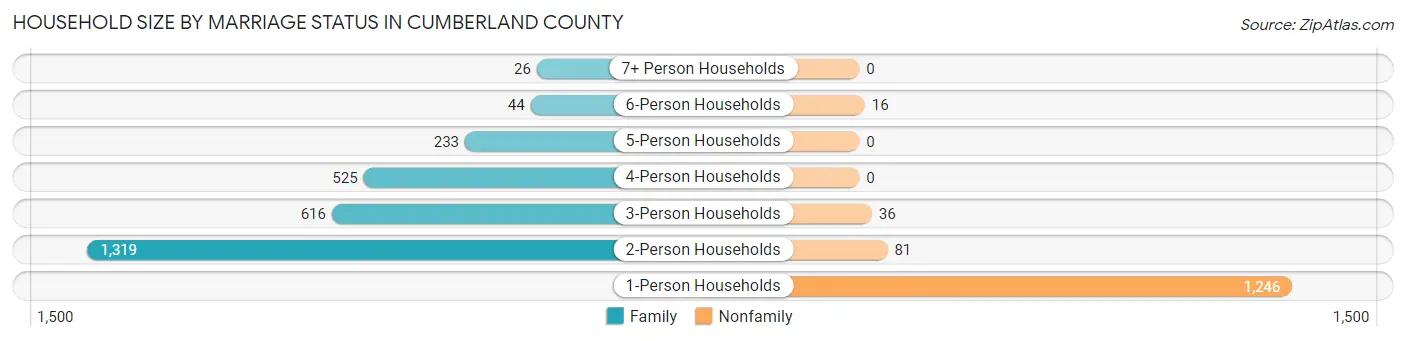
| Household Size | Family Households | Nonfamily Households |
| 1-Person Households | - | 1,246 (30.1%) |
| 2-Person Households | 1,319 (31.8%) | 81 (2.0%) |
| 3-Person Households | 616 (14.9%) | 36 (0.9%) |
| 4-Person Households | 525 (12.7%) | 0 (0.0%) |
| 5-Person Households | 233 (5.6%) | 0 (0.0%) |
| 6-Person Households | 44 (1.1%) | 16 (0.4%) |
| 7+ Person Households | 26 (0.6%) | 0 (0.0%) |
| Total | 2,763 (66.7%) | 1,379 (33.3%) |
Female Fertility in Cumberland County
Fertility by Age in Cumberland County
Average fertility rate in Cumberland County is 74.0 births per 1,000 women. Women in the age bracket of 20 to 34 years have the highest fertility rate with 166.0 births per 1,000 women. Women in the age bracket of 20 to 34 years acount for 85.7% of all women with births.
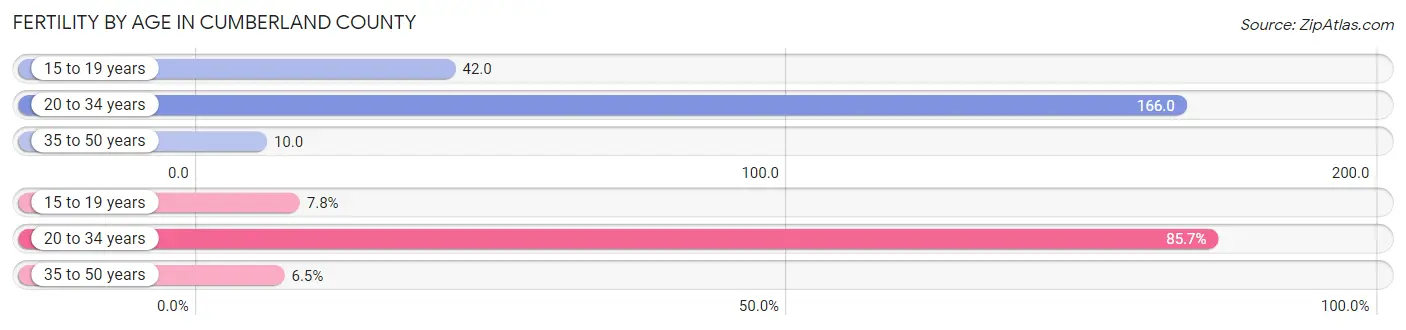
| Age Bracket | Women with Births | Births / 1,000 Women |
| 15 to 19 years | 12 (7.8%) | 42.0 |
| 20 to 34 years | 132 (85.7%) | 166.0 |
| 35 to 50 years | 10 (6.5%) | 10.0 |
| Total | 154 (100.0%) | 74.0 |
Fertility by Age by Marriage Status in Cumberland County
68.8% of women with births (154) in Cumberland County are married. The highest percentage of unmarried women with births falls into 15 to 19 years age bracket with 100.0% of them unmarried at the time of birth, while the lowest percentage of unmarried women with births belong to 35 to 50 years age bracket with 0.0% of them unmarried.
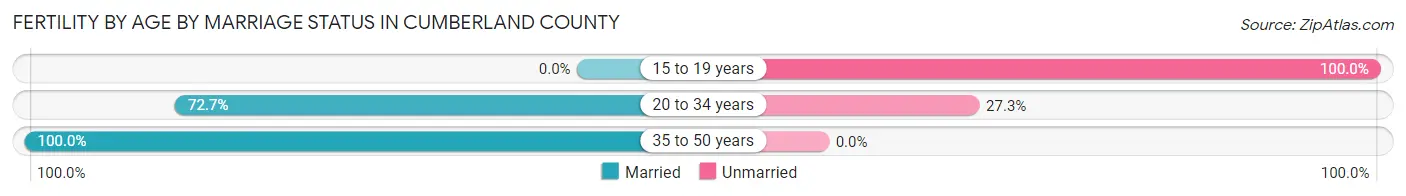
| Age Bracket | Married | Unmarried |
| 15 to 19 years | 0 (0.0%) | 12 (100.0%) |
| 20 to 34 years | 96 (72.7%) | 36 (27.3%) |
| 35 to 50 years | 10 (100.0%) | 0 (0.0%) |
| Total | 106 (68.8%) | 48 (31.2%) |
Fertility by Education in Cumberland County
Average fertility rate in Cumberland County is 74.0 births per 1,000 women. Women with the education attainment of bachelor's degree have the highest fertility rate of 174.0 births per 1,000 women, while women with the education attainment of less than high school have the lowest fertility at 17.0 births per 1,000 women. Women with the education attainment of bachelor's degree represent 37.0% of all women with births.

| Educational Attainment | Women with Births | Births / 1,000 Women |
| Less than High School | 5 (3.3%) | 17.0 |
| High School Diploma | 53 (34.4%) | 138.0 |
| College or Associate's Degree | 35 (22.7%) | 38.0 |
| Bachelor's Degree | 57 (37.0%) | 174.0 |
| Graduate Degree | 4 (2.6%) | 29.0 |
| Total | 154 (100.0%) | 74.0 |
Fertility by Education by Marriage Status in Cumberland County
31.2% of women with births in Cumberland County are unmarried. Women with the educational attainment of bachelor's degree are most likely to be married with 100.0% of them married at childbirth, while women with the educational attainment of less than high school are least likely to be married with 100.0% of them unmarried at childbirth.
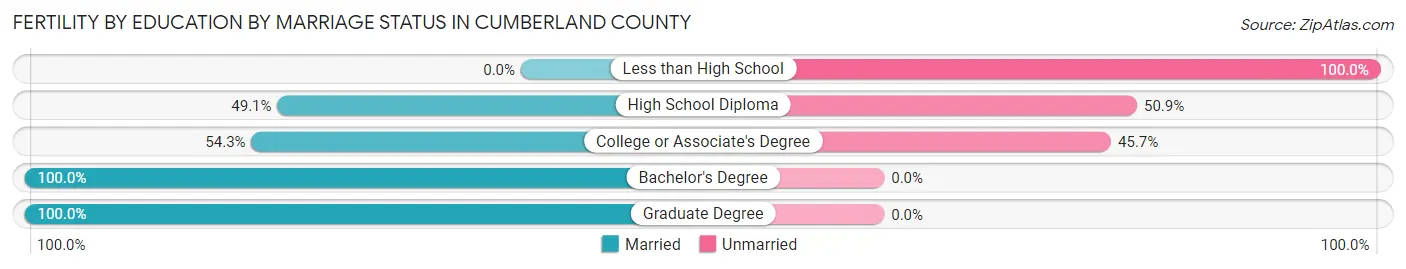
| Educational Attainment | Married | Unmarried |
| Less than High School | 0 (0.0%) | 5 (100.0%) |
| High School Diploma | 26 (49.1%) | 27 (50.9%) |
| College or Associate's Degree | 19 (54.3%) | 16 (45.7%) |
| Bachelor's Degree | 57 (100.0%) | 0 (0.0%) |
| Graduate Degree | 4 (100.0%) | 0 (0.0%) |
| Total | 106 (68.8%) | 48 (31.2%) |
Employment Characteristics in Cumberland County
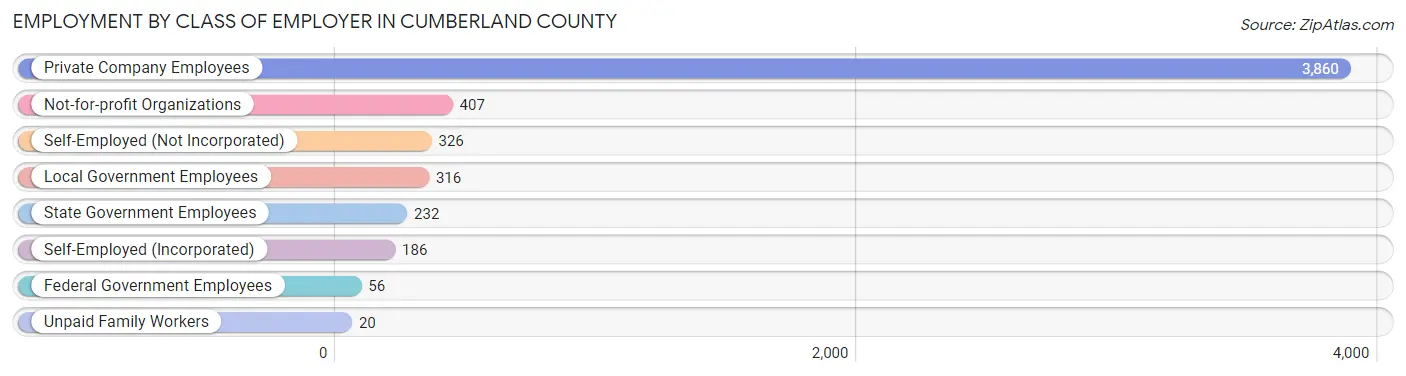
Employment by Class of Employer in Cumberland County
Among the 5,403 employed individuals in Cumberland County, private company employees (3,860 | 71.4%), not-for-profit organizations (407 | 7.5%), and self-employed (not incorporated) (326 | 6.0%) make up the most common classes of employment.
| Employer Class | # Employees | % Employees |
| Private Company Employees | 3,860 | 71.4% |
| Self-Employed (Incorporated) | 186 | 3.4% |
| Self-Employed (Not Incorporated) | 326 | 6.0% |
| Not-for-profit Organizations | 407 | 7.5% |
| Local Government Employees | 316 | 5.9% |
| State Government Employees | 232 | 4.3% |
| Federal Government Employees | 56 | 1.0% |
| Unpaid Family Workers | 20 | 0.4% |
| Total | 5,403 | 100.0% |
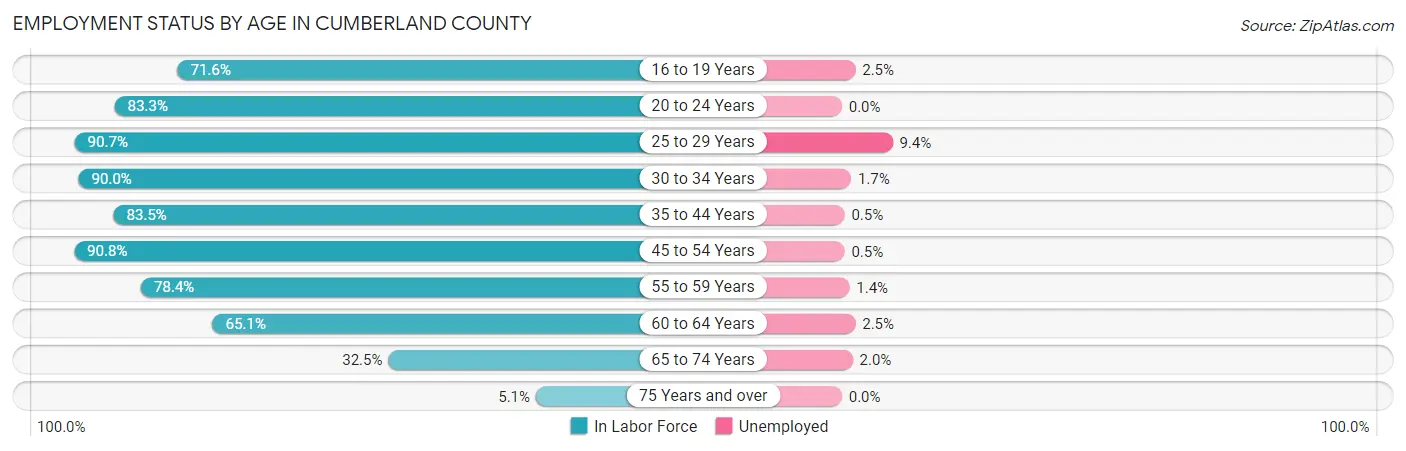
Employment Status by Age in Cumberland County
According to the labor force statistics for Cumberland County, out of the total population over 16 years of age (8,413), 66.9% or 5,628 individuals are in the labor force, with 1.9% or 107 of them unemployed. The age group with the highest labor force participation rate is 45 to 54 years, with 90.8% or 1,144 individuals in the labor force. Within the labor force, the 25 to 29 years age range has the highest percentage of unemployed individuals, with 9.4% or 46 of them being unemployed.
| Age Bracket | In Labor Force | Unemployed |
| 16 to 19 Years | 365 (71.6%) | 9 (2.5%) |
| 20 to 24 Years | 413 (83.3%) | 0 (0.0%) |
| 25 to 29 Years | 489 (90.7%) | 46 (9.4%) |
| 30 to 34 Years | 588 (90.0%) | 10 (1.7%) |
| 35 to 44 Years | 1,086 (83.5%) | 5 (0.5%) |
| 45 to 54 Years | 1,144 (90.8%) | 6 (0.5%) |
| 55 to 59 Years | 583 (78.4%) | 8 (1.4%) |
| 60 to 64 Years | 510 (65.1%) | 13 (2.5%) |
| 65 to 74 Years | 407 (32.5%) | 8 (2.0%) |
| 75 Years and over | 45 (5.1%) | 0 (0.0%) |
| Total | 5,628 (66.9%) | 107 (1.9%) |
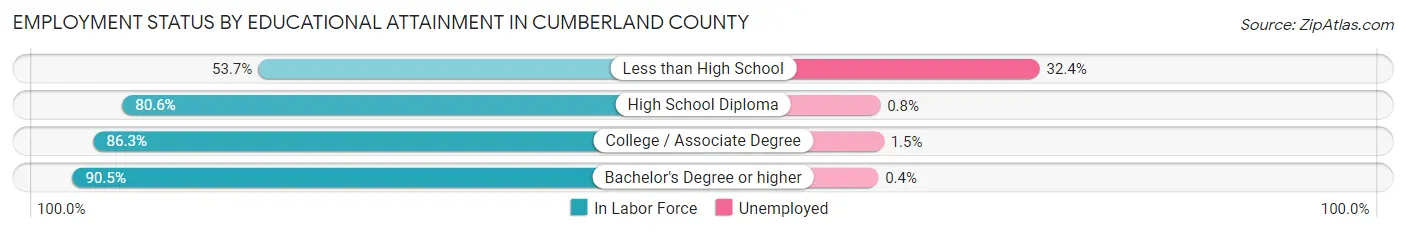
Employment Status by Educational Attainment in Cumberland County
According to labor force statistics for Cumberland County, 83.3% of individuals (4,398) out of the total population between 25 and 64 years of age (5,280) are in the labor force, with 2.0% or 88 of them being unemployed. The group with the highest labor force participation rate are those with the educational attainment of bachelor's degree or higher, with 90.5% or 849 individuals in the labor force. Within the labor force, individuals with less than high school education have the highest percentage of unemployment, with 32.4% or 45 of them being unemployed.
| Educational Attainment | In Labor Force | Unemployed |
| Less than High School | 139 (53.7%) | 84 (32.4%) |
| High School Diploma | 1,590 (80.6%) | 16 (0.8%) |
| College / Associate Degree | 1,821 (86.3%) | 32 (1.5%) |
| Bachelor's Degree or higher | 849 (90.5%) | 4 (0.4%) |
| Total | 4,398 (83.3%) | 106 (2.0%) |
Employment Occupations by Sex in Cumberland County
Management, Business, Science and Arts Occupations
The most common Management, Business, Science and Arts occupations in Cumberland County are Management (465 | 8.4%), Community & Social Service (372 | 6.7%), Health Diagnosing & Treating (333 | 6.0%), Computers, Engineering & Science (248 | 4.5%), and Health Technologists (242 | 4.4%).
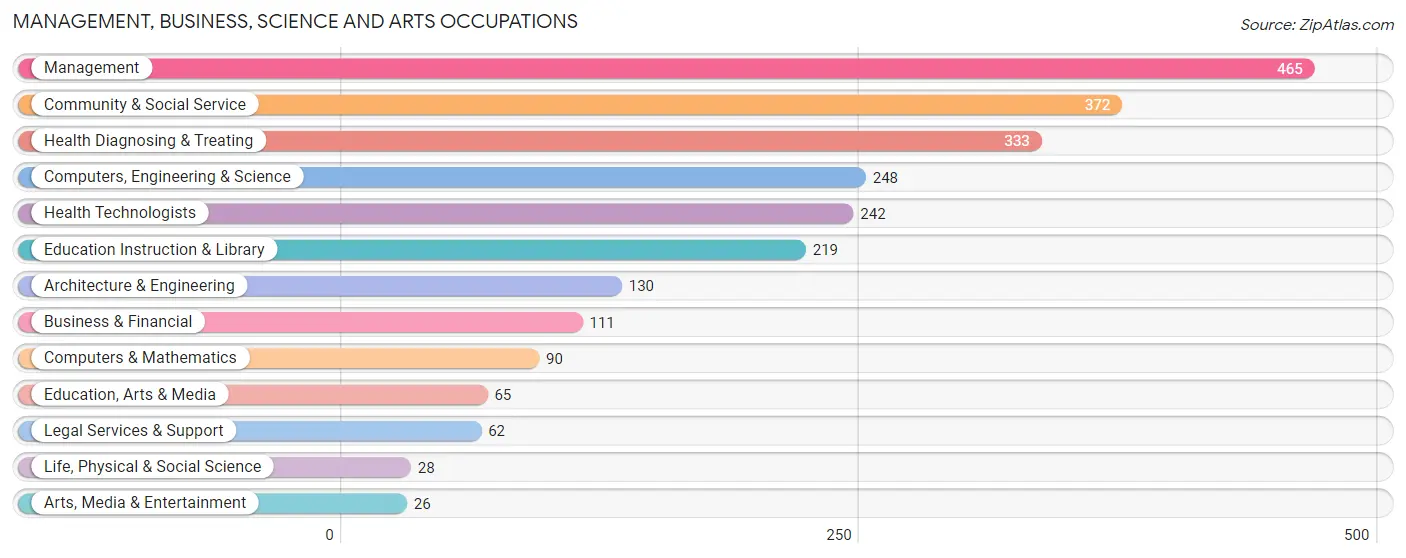
Management, Business, Science and Arts Occupations by Sex
Within the Management, Business, Science and Arts occupations in Cumberland County, the most male-oriented occupations are Architecture & Engineering (74.6%), Computers, Engineering & Science (73.0%), and Computers & Mathematics (72.2%), while the most female-oriented occupations are Education Instruction & Library (92.7%), Business & Financial (88.3%), and Health Technologists (88.0%).
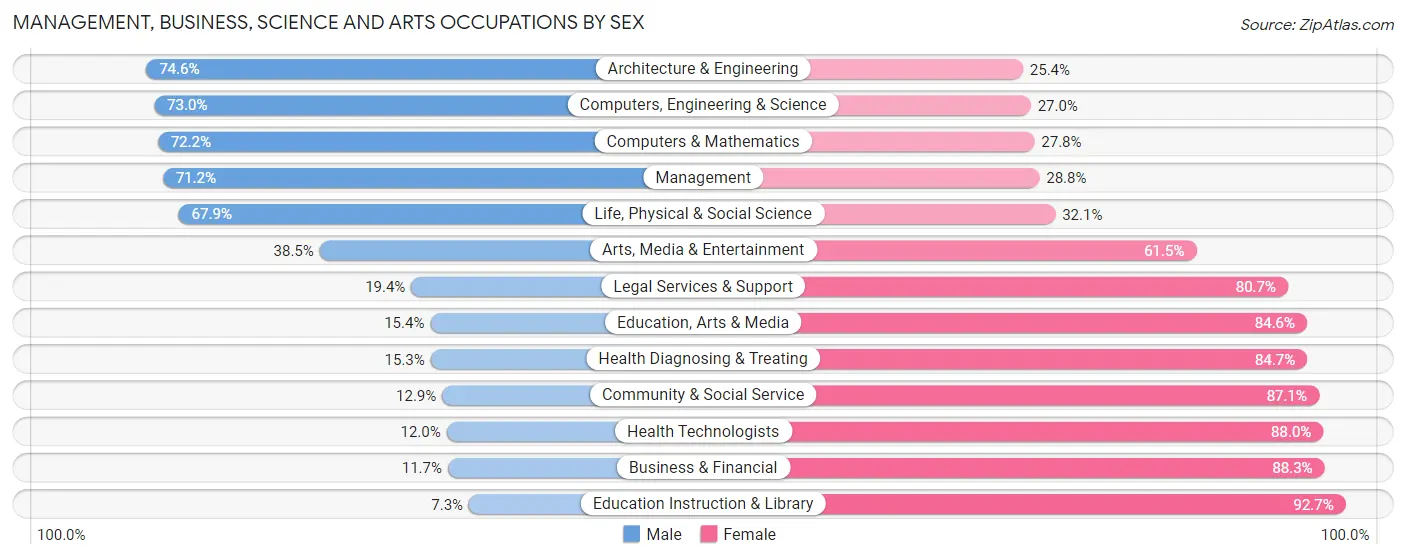
| Occupation | Male | Female |
| Management | 331 (71.2%) | 134 (28.8%) |
| Business & Financial | 13 (11.7%) | 98 (88.3%) |
| Computers, Engineering & Science | 181 (73.0%) | 67 (27.0%) |
| Computers & Mathematics | 65 (72.2%) | 25 (27.8%) |
| Architecture & Engineering | 97 (74.6%) | 33 (25.4%) |
| Life, Physical & Social Science | 19 (67.9%) | 9 (32.1%) |
| Community & Social Service | 48 (12.9%) | 324 (87.1%) |
| Education, Arts & Media | 10 (15.4%) | 55 (84.6%) |
| Legal Services & Support | 12 (19.4%) | 50 (80.6%) |
| Education Instruction & Library | 16 (7.3%) | 203 (92.7%) |
| Arts, Media & Entertainment | 10 (38.5%) | 16 (61.5%) |
| Health Diagnosing & Treating | 51 (15.3%) | 282 (84.7%) |
| Health Technologists | 29 (12.0%) | 213 (88.0%) |
| Total (Category) | 624 (40.8%) | 905 (59.2%) |
| Total (Overall) | 2,953 (53.5%) | 2,571 (46.5%) |
Services Occupations
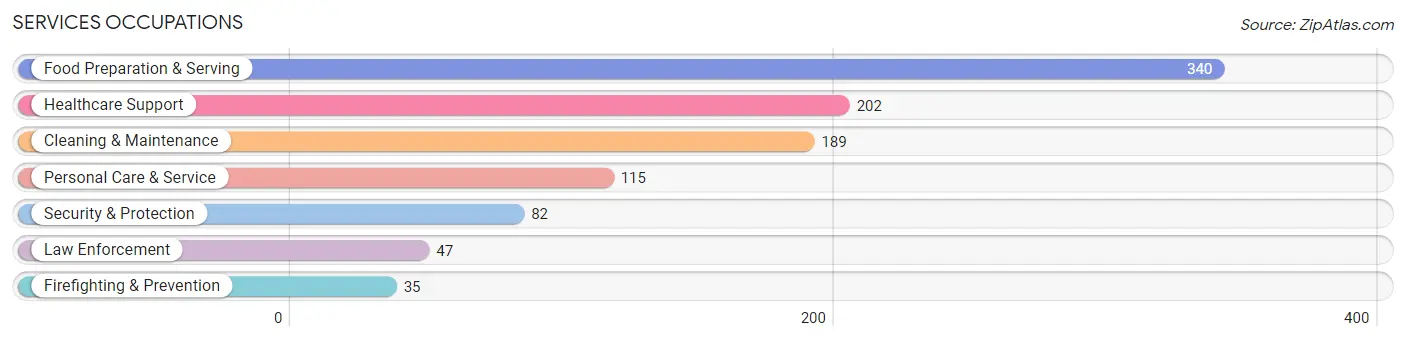
The most common Services occupations in Cumberland County are Food Preparation & Serving (340 | 6.1%), Healthcare Support (202 | 3.7%), Cleaning & Maintenance (189 | 3.4%), Personal Care & Service (115 | 2.1%), and Security & Protection (82 | 1.5%).
Services Occupations by Sex
Within the Services occupations in Cumberland County, the most male-oriented occupations are Law Enforcement (89.4%), Cleaning & Maintenance (68.2%), and Security & Protection (53.7%), while the most female-oriented occupations are Firefighting & Prevention (94.3%), Personal Care & Service (87.8%), and Healthcare Support (75.7%).
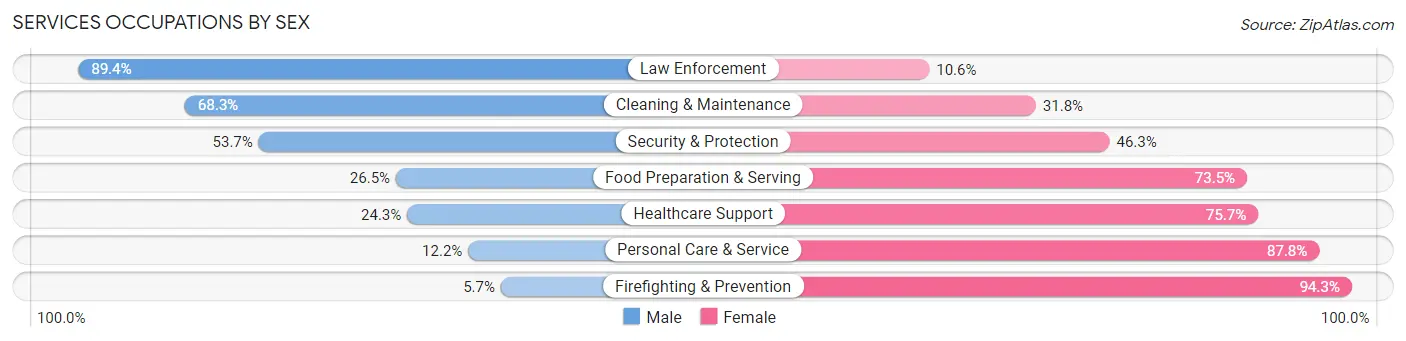
| Occupation | Male | Female |
| Healthcare Support | 49 (24.3%) | 153 (75.7%) |
| Security & Protection | 44 (53.7%) | 38 (46.3%) |
| Firefighting & Prevention | 2 (5.7%) | 33 (94.3%) |
| Law Enforcement | 42 (89.4%) | 5 (10.6%) |
| Food Preparation & Serving | 90 (26.5%) | 250 (73.5%) |
| Cleaning & Maintenance | 129 (68.2%) | 60 (31.8%) |
| Personal Care & Service | 14 (12.2%) | 101 (87.8%) |
| Total (Category) | 326 (35.1%) | 602 (64.9%) |
| Total (Overall) | 2,953 (53.5%) | 2,571 (46.5%) |
Sales and Office Occupations
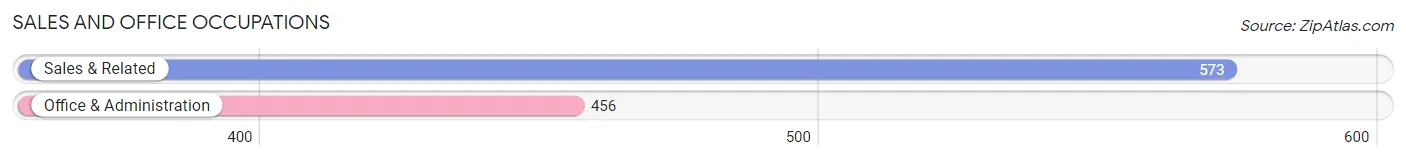
The most common Sales and Office occupations in Cumberland County are Sales & Related (573 | 10.4%), and Office & Administration (456 | 8.3%).
Sales and Office Occupations by Sex
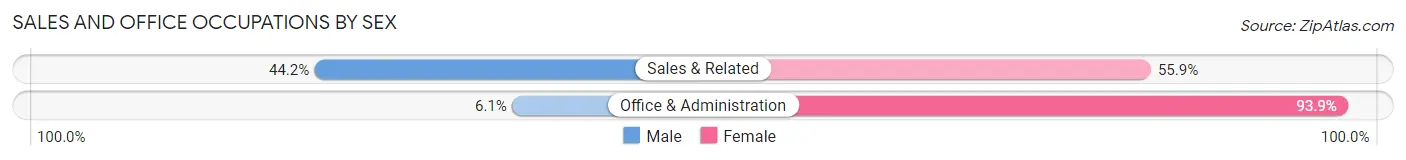
| Occupation | Male | Female |
| Sales & Related | 253 (44.2%) | 320 (55.8%) |
| Office & Administration | 28 (6.1%) | 428 (93.9%) |
| Total (Category) | 281 (27.3%) | 748 (72.7%) |
| Total (Overall) | 2,953 (53.5%) | 2,571 (46.5%) |
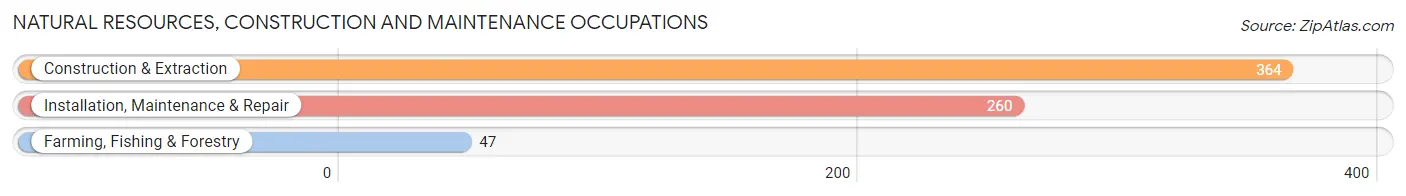
Natural Resources, Construction and Maintenance Occupations
The most common Natural Resources, Construction and Maintenance occupations in Cumberland County are Construction & Extraction (364 | 6.6%), Installation, Maintenance & Repair (260 | 4.7%), and Farming, Fishing & Forestry (47 | 0.9%).
Natural Resources, Construction and Maintenance Occupations by Sex
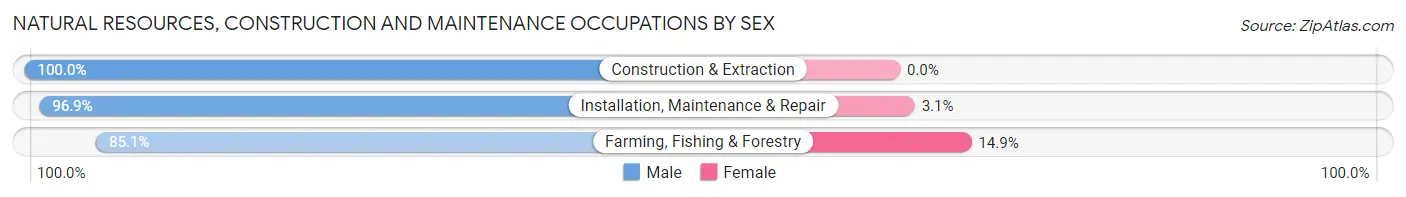
| Occupation | Male | Female |
| Farming, Fishing & Forestry | 40 (85.1%) | 7 (14.9%) |
| Construction & Extraction | 364 (100.0%) | 0 (0.0%) |
| Installation, Maintenance & Repair | 252 (96.9%) | 8 (3.1%) |
| Total (Category) | 656 (97.8%) | 15 (2.2%) |
| Total (Overall) | 2,953 (53.5%) | 2,571 (46.5%) |
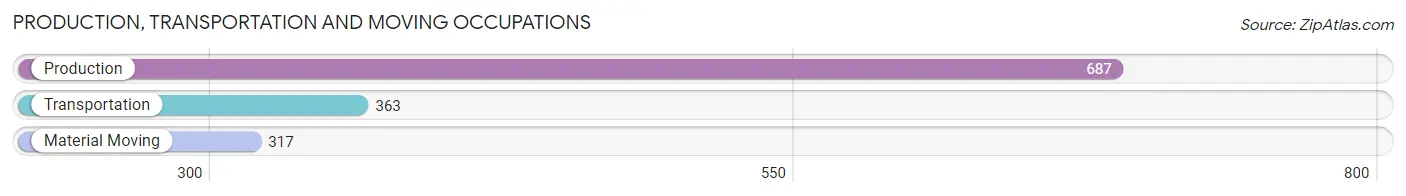
Production, Transportation and Moving Occupations
The most common Production, Transportation and Moving occupations in Cumberland County are Production (687 | 12.4%), Transportation (363 | 6.6%), and Material Moving (317 | 5.7%).
Production, Transportation and Moving Occupations by Sex
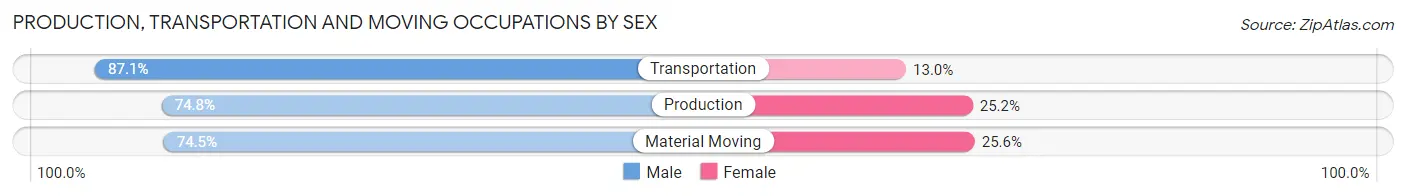
| Occupation | Male | Female |
| Production | 514 (74.8%) | 173 (25.2%) |
| Transportation | 316 (87.1%) | 47 (13.0%) |
| Material Moving | 236 (74.5%) | 81 (25.6%) |
| Total (Category) | 1,066 (78.0%) | 301 (22.0%) |
| Total (Overall) | 2,953 (53.5%) | 2,571 (46.5%) |
Employment Industries by Sex in Cumberland County
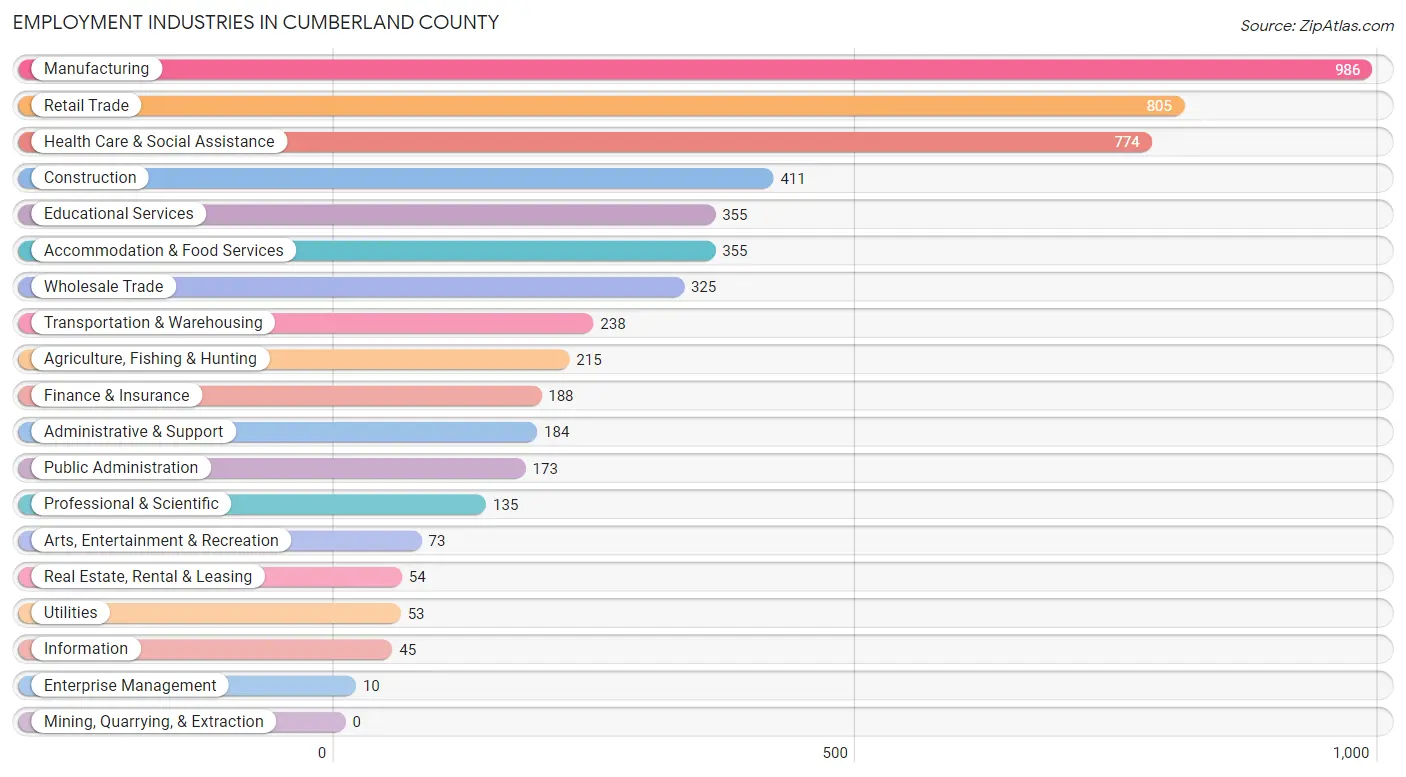
Employment Industries in Cumberland County
The major employment industries in Cumberland County include Manufacturing (986 | 17.8%), Retail Trade (805 | 14.6%), Health Care & Social Assistance (774 | 14.0%), Construction (411 | 7.4%), and Educational Services (355 | 6.4%).
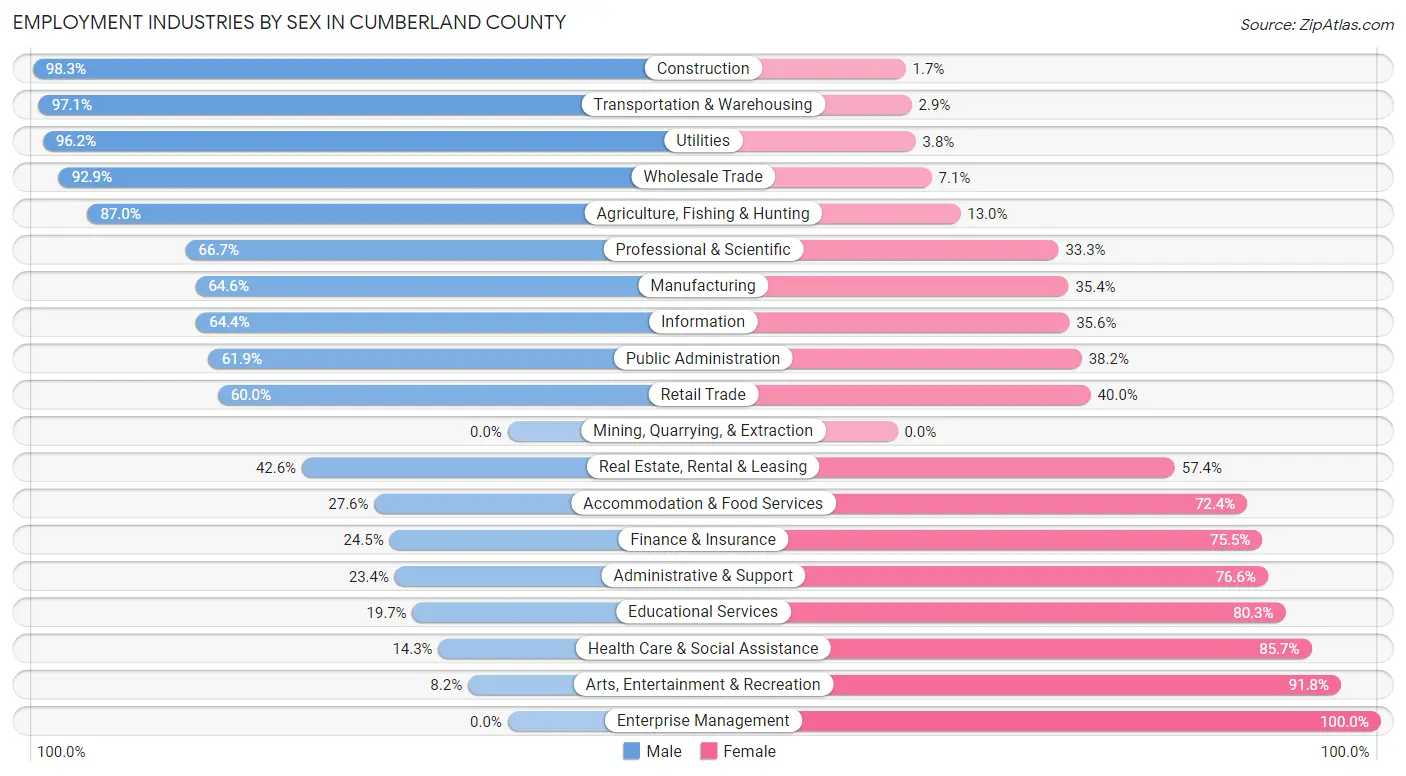
Employment Industries by Sex in Cumberland County
The Cumberland County industries that see more men than women are Construction (98.3%), Transportation & Warehousing (97.1%), and Utilities (96.2%), whereas the industries that tend to have a higher number of women are Enterprise Management (100.0%), Arts, Entertainment & Recreation (91.8%), and Health Care & Social Assistance (85.7%).
| Industry | Male | Female |
| Agriculture, Fishing & Hunting | 187 (87.0%) | 28 (13.0%) |
| Mining, Quarrying, & Extraction | 0 (0.0%) | 0 (0.0%) |
| Construction | 404 (98.3%) | 7 (1.7%) |
| Manufacturing | 637 (64.6%) | 349 (35.4%) |
| Wholesale Trade | 302 (92.9%) | 23 (7.1%) |
| Retail Trade | 483 (60.0%) | 322 (40.0%) |
| Transportation & Warehousing | 231 (97.1%) | 7 (2.9%) |
| Utilities | 51 (96.2%) | 2 (3.8%) |
| Information | 29 (64.4%) | 16 (35.6%) |
| Finance & Insurance | 46 (24.5%) | 142 (75.5%) |
| Real Estate, Rental & Leasing | 23 (42.6%) | 31 (57.4%) |
| Professional & Scientific | 90 (66.7%) | 45 (33.3%) |
| Enterprise Management | 0 (0.0%) | 10 (100.0%) |
| Administrative & Support | 43 (23.4%) | 141 (76.6%) |
| Educational Services | 70 (19.7%) | 285 (80.3%) |
| Health Care & Social Assistance | 111 (14.3%) | 663 (85.7%) |
| Arts, Entertainment & Recreation | 6 (8.2%) | 67 (91.8%) |
| Accommodation & Food Services | 98 (27.6%) | 257 (72.4%) |
| Public Administration | 107 (61.9%) | 66 (38.2%) |
| Total | 2,953 (53.5%) | 2,571 (46.5%) |
Education in Cumberland County
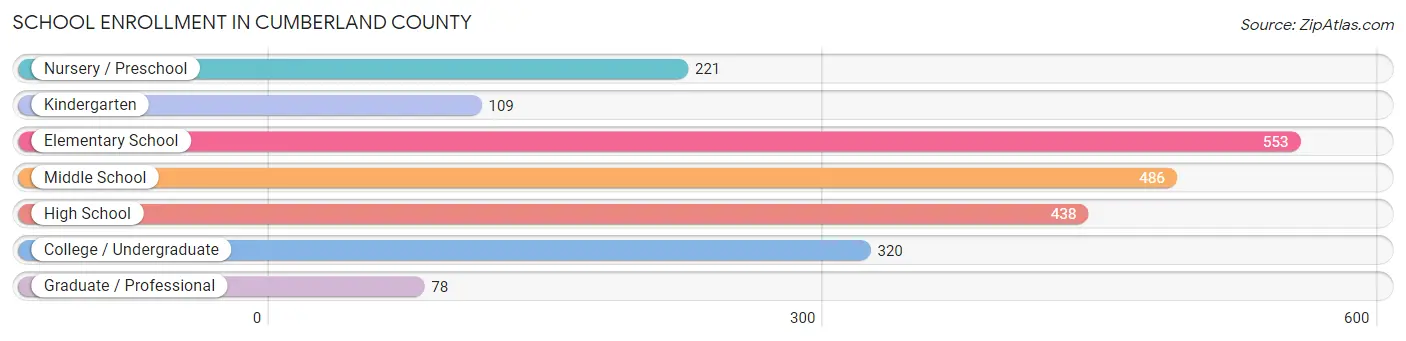
School Enrollment in Cumberland County
The most common levels of schooling among the 2,205 students in Cumberland County are elementary school (553 | 25.1%), middle school (486 | 22.0%), and high school (438 | 19.9%).
| School Level | # Students | % Students |
| Nursery / Preschool | 221 | 10.0% |
| Kindergarten | 109 | 4.9% |
| Elementary School | 553 | 25.1% |
| Middle School | 486 | 22.0% |
| High School | 438 | 19.9% |
| College / Undergraduate | 320 | 14.5% |
| Graduate / Professional | 78 | 3.5% |
| Total | 2,205 | 100.0% |
School Enrollment by Age by Funding Source in Cumberland County
Out of a total of 2,205 students who are enrolled in schools in Cumberland County, 251 (11.4%) attend a private institution, while the remaining 1,954 (88.6%) are enrolled in public schools. The age group of 5 to 9 year old has the highest likelihood of being enrolled in private schools, with 120 (16.8% in the age bracket) enrolled. Conversely, the age group of 15 to 17 year olds has the lowest likelihood of being enrolled in a private school, with 325 (100.0% in the age bracket) attending a public institution.
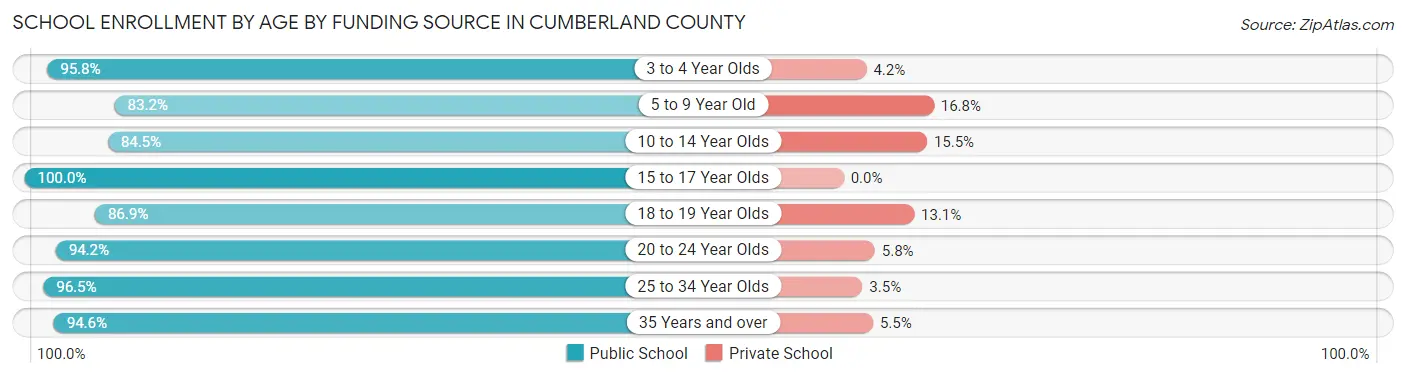
| Age Bracket | Public School | Private School |
| 3 to 4 Year Olds | 113 (95.8%) | 5 (4.2%) |
| 5 to 9 Year Old | 595 (83.2%) | 120 (16.8%) |
| 10 to 14 Year Olds | 485 (84.5%) | 89 (15.5%) |
| 15 to 17 Year Olds | 325 (100.0%) | 0 (0.0%) |
| 18 to 19 Year Olds | 139 (86.9%) | 21 (13.1%) |
| 20 to 24 Year Olds | 162 (94.2%) | 10 (5.8%) |
| 25 to 34 Year Olds | 83 (96.5%) | 3 (3.5%) |
| 35 Years and over | 52 (94.6%) | 3 (5.4%) |
| Total | 1,954 (88.6%) | 251 (11.4%) |
Educational Attainment by Field of Study in Cumberland County
Education (425 | 30.6%), science & technology (215 | 15.5%), business (197 | 14.2%), bio, nature & agricultural (152 | 11.0%), and physical & health sciences (89 | 6.4%) are the most common fields of study among 1,388 individuals in Cumberland County who have obtained a bachelor's degree or higher.
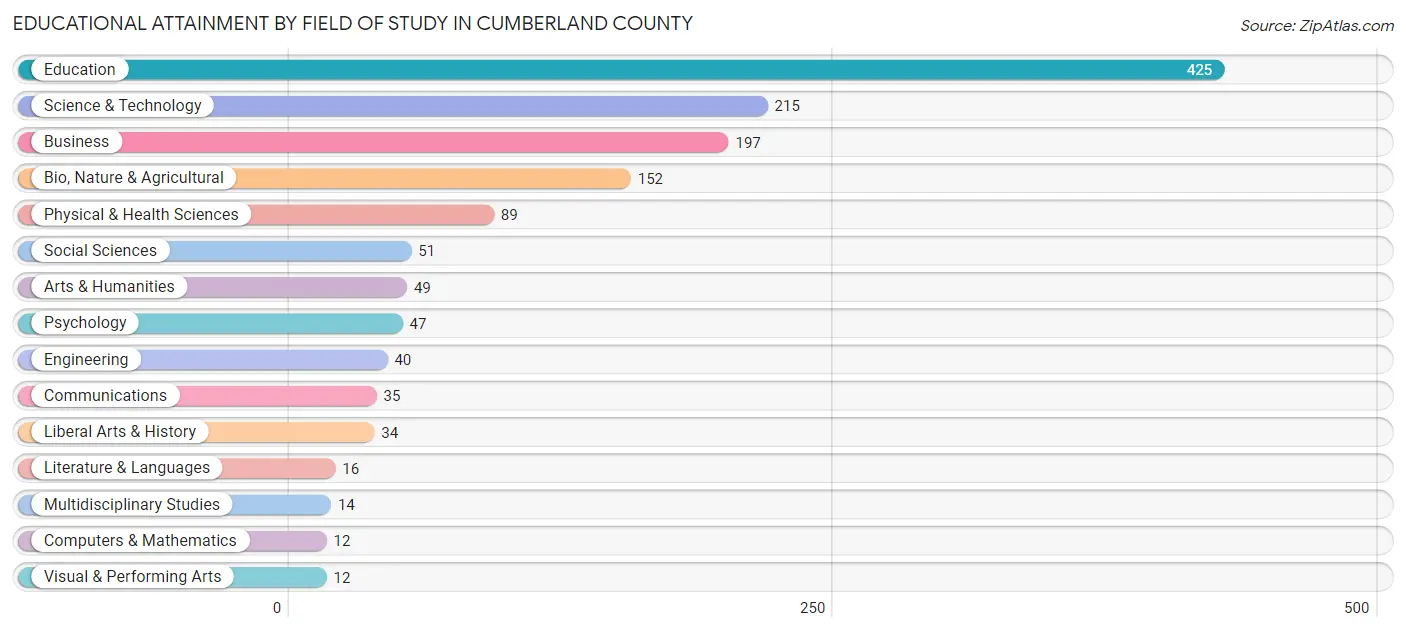
| Field of Study | # Graduates | % Graduates |
| Computers & Mathematics | 12 | 0.9% |
| Bio, Nature & Agricultural | 152 | 11.0% |
| Physical & Health Sciences | 89 | 6.4% |
| Psychology | 47 | 3.4% |
| Social Sciences | 51 | 3.7% |
| Engineering | 40 | 2.9% |
| Multidisciplinary Studies | 14 | 1.0% |
| Science & Technology | 215 | 15.5% |
| Business | 197 | 14.2% |
| Education | 425 | 30.6% |
| Literature & Languages | 16 | 1.1% |
| Liberal Arts & History | 34 | 2.5% |
| Visual & Performing Arts | 12 | 0.9% |
| Communications | 35 | 2.5% |
| Arts & Humanities | 49 | 3.5% |
| Total | 1,388 | 100.0% |
Transportation & Commute in Cumberland County
Vehicle Availability by Sex in Cumberland County
The most prevalent vehicle ownership categories in Cumberland County are males with 2 vehicles (1,129, accounting for 38.9%) and females with 2 vehicles (884, making up 45.1%).
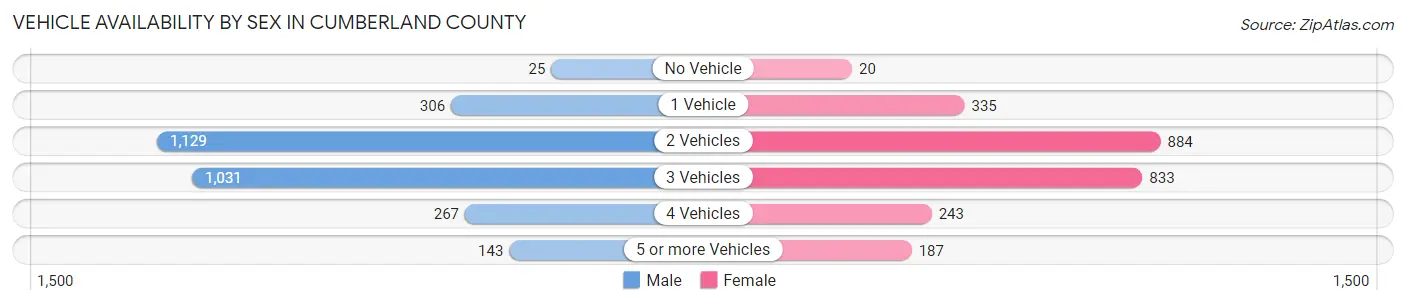
| Vehicles Available | Male | Female |
| No Vehicle | 25 (0.9%) | 20 (0.8%) |
| 1 Vehicle | 306 (10.5%) | 335 (13.4%) |
| 2 Vehicles | 1,129 (38.9%) | 884 (35.3%) |
| 3 Vehicles | 1,031 (35.5%) | 833 (33.3%) |
| 4 Vehicles | 267 (9.2%) | 243 (9.7%) |
| 5 or more Vehicles | 143 (4.9%) | 187 (7.5%) |
| Total | 2,901 (100.0%) | 2,502 (100.0%) |
Commute Time in Cumberland County
The most frequently occuring commute durations in Cumberland County are 5 to 9 minutes (781 commuters, 15.4%), 30 to 34 minutes (770 commuters, 15.2%), and 20 to 24 minutes (747 commuters, 14.8%).
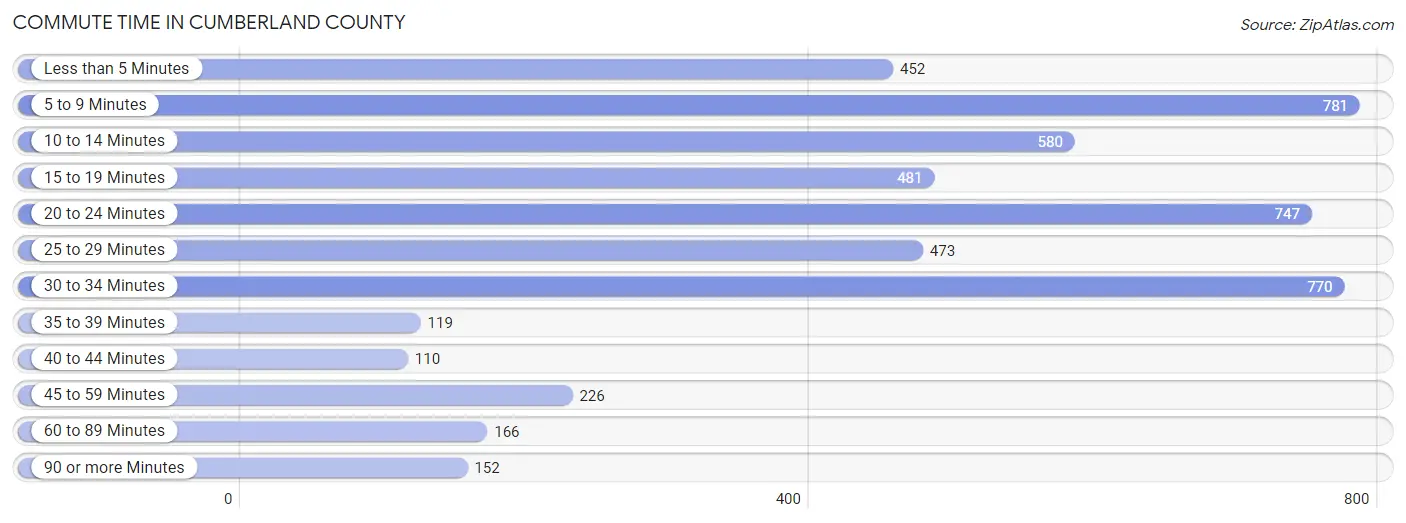
| Commute Time | # Commuters | % Commuters |
| Less than 5 Minutes | 452 | 8.9% |
| 5 to 9 Minutes | 781 | 15.4% |
| 10 to 14 Minutes | 580 | 11.5% |
| 15 to 19 Minutes | 481 | 9.5% |
| 20 to 24 Minutes | 747 | 14.8% |
| 25 to 29 Minutes | 473 | 9.3% |
| 30 to 34 Minutes | 770 | 15.2% |
| 35 to 39 Minutes | 119 | 2.4% |
| 40 to 44 Minutes | 110 | 2.2% |
| 45 to 59 Minutes | 226 | 4.5% |
| 60 to 89 Minutes | 166 | 3.3% |
| 90 or more Minutes | 152 | 3.0% |
Commute Time by Sex in Cumberland County
The most common commute times in Cumberland County are 5 to 9 minutes (458 commuters, 17.0%) for males and 30 to 34 minutes (459 commuters, 19.4%) for females.
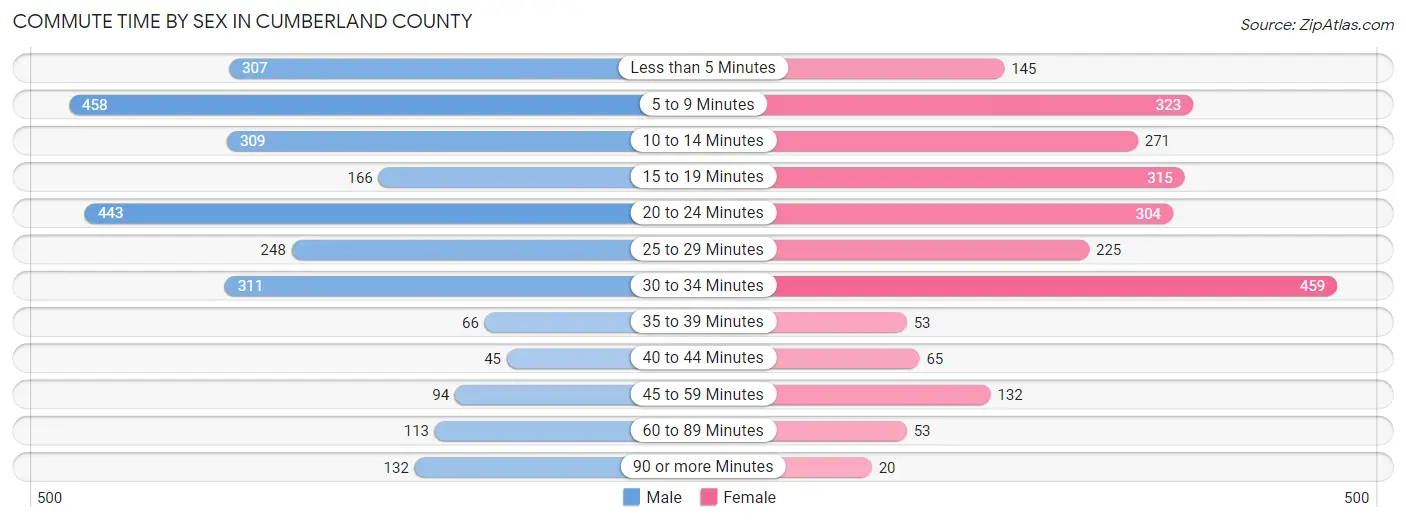
| Commute Time | Male | Female |
| Less than 5 Minutes | 307 (11.4%) | 145 (6.1%) |
| 5 to 9 Minutes | 458 (17.0%) | 323 (13.7%) |
| 10 to 14 Minutes | 309 (11.5%) | 271 (11.5%) |
| 15 to 19 Minutes | 166 (6.2%) | 315 (13.3%) |
| 20 to 24 Minutes | 443 (16.5%) | 304 (12.9%) |
| 25 to 29 Minutes | 248 (9.2%) | 225 (9.5%) |
| 30 to 34 Minutes | 311 (11.6%) | 459 (19.4%) |
| 35 to 39 Minutes | 66 (2.5%) | 53 (2.2%) |
| 40 to 44 Minutes | 45 (1.7%) | 65 (2.8%) |
| 45 to 59 Minutes | 94 (3.5%) | 132 (5.6%) |
| 60 to 89 Minutes | 113 (4.2%) | 53 (2.2%) |
| 90 or more Minutes | 132 (4.9%) | 20 (0.9%) |
Time of Departure to Work by Sex in Cumberland County
The most frequent times of departure to work in Cumberland County are 6:00 AM to 6:29 AM (447, 16.6%) for males and 7:30 AM to 7:59 AM (445, 18.8%) for females.
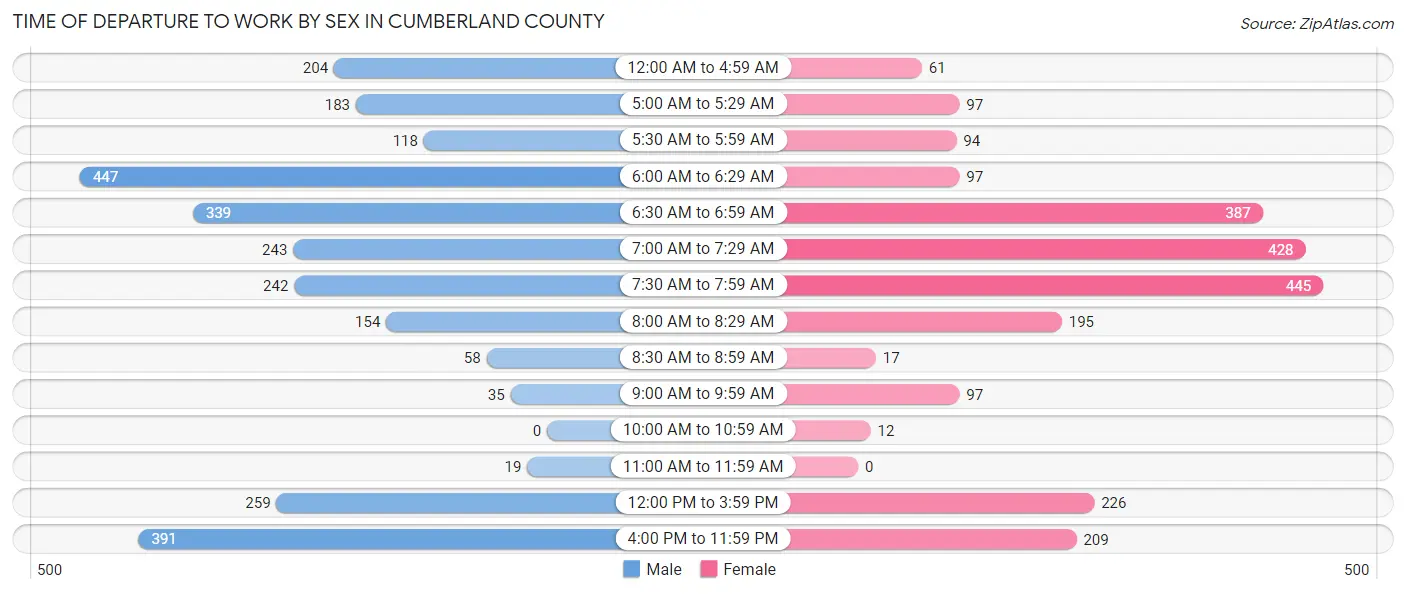
| Time of Departure | Male | Female |
| 12:00 AM to 4:59 AM | 204 (7.6%) | 61 (2.6%) |
| 5:00 AM to 5:29 AM | 183 (6.8%) | 97 (4.1%) |
| 5:30 AM to 5:59 AM | 118 (4.4%) | 94 (4.0%) |
| 6:00 AM to 6:29 AM | 447 (16.6%) | 97 (4.1%) |
| 6:30 AM to 6:59 AM | 339 (12.6%) | 387 (16.4%) |
| 7:00 AM to 7:29 AM | 243 (9.0%) | 428 (18.1%) |
| 7:30 AM to 7:59 AM | 242 (9.0%) | 445 (18.8%) |
| 8:00 AM to 8:29 AM | 154 (5.7%) | 195 (8.3%) |
| 8:30 AM to 8:59 AM | 58 (2.1%) | 17 (0.7%) |
| 9:00 AM to 9:59 AM | 35 (1.3%) | 97 (4.1%) |
| 10:00 AM to 10:59 AM | 0 (0.0%) | 12 (0.5%) |
| 11:00 AM to 11:59 AM | 19 (0.7%) | 0 (0.0%) |
| 12:00 PM to 3:59 PM | 259 (9.6%) | 226 (9.6%) |
| 4:00 PM to 11:59 PM | 391 (14.5%) | 209 (8.8%) |
| Total | 2,692 (100.0%) | 2,365 (100.0%) |
Housing Occupancy in Cumberland County
Occupancy by Ownership in Cumberland County
Of the total 4,142 dwellings in Cumberland County, owner-occupied units account for 3,360 (81.1%), while renter-occupied units make up 782 (18.9%).
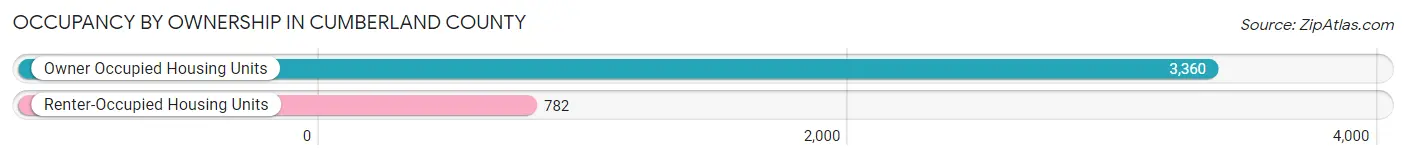
| Occupancy | # Housing Units | % Housing Units |
| Owner Occupied Housing Units | 3,360 | 81.1% |
| Renter-Occupied Housing Units | 782 | 18.9% |
| Total Occupied Housing Units | 4,142 | 100.0% |
Occupancy by Household Size in Cumberland County
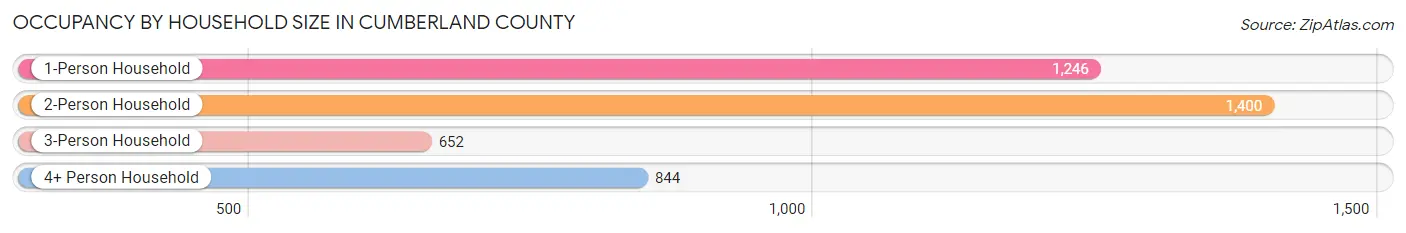
| Household Size | # Housing Units | % Housing Units |
| 1-Person Household | 1,246 | 30.1% |
| 2-Person Household | 1,400 | 33.8% |
| 3-Person Household | 652 | 15.7% |
| 4+ Person Household | 844 | 20.4% |
| Total Housing Units | 4,142 | 100.0% |
Occupancy by Ownership by Household Size in Cumberland County
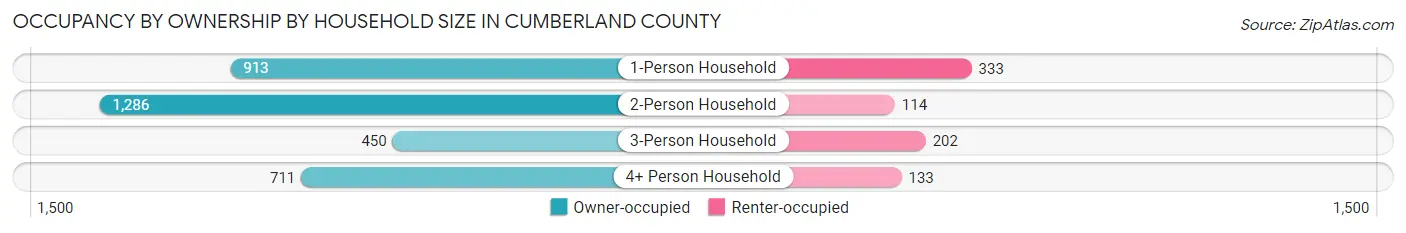
| Household Size | Owner-occupied | Renter-occupied |
| 1-Person Household | 913 (73.3%) | 333 (26.7%) |
| 2-Person Household | 1,286 (91.9%) | 114 (8.1%) |
| 3-Person Household | 450 (69.0%) | 202 (31.0%) |
| 4+ Person Household | 711 (84.2%) | 133 (15.8%) |
| Total Housing Units | 3,360 (81.1%) | 782 (18.9%) |
Occupancy by Educational Attainment in Cumberland County
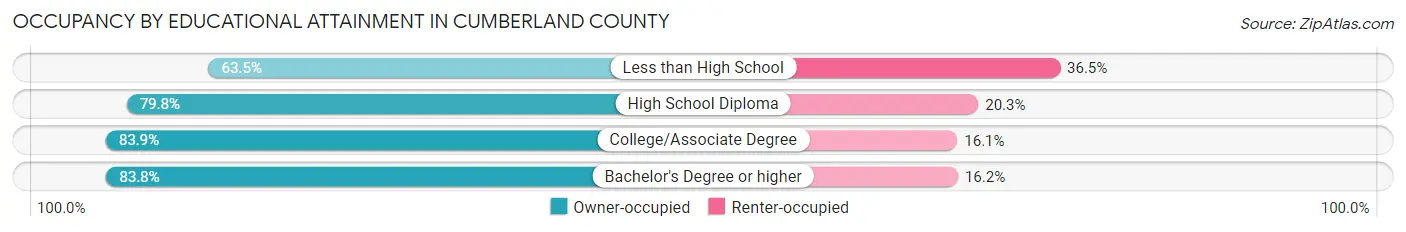
| Household Size | Owner-occupied | Renter-occupied |
| Less than High School | 162 (63.5%) | 93 (36.5%) |
| High School Diploma | 1,197 (79.7%) | 304 (20.3%) |
| College/Associate Degree | 1,381 (83.9%) | 265 (16.1%) |
| Bachelor's Degree or higher | 620 (83.8%) | 120 (16.2%) |
Occupancy by Age of Householder in Cumberland County
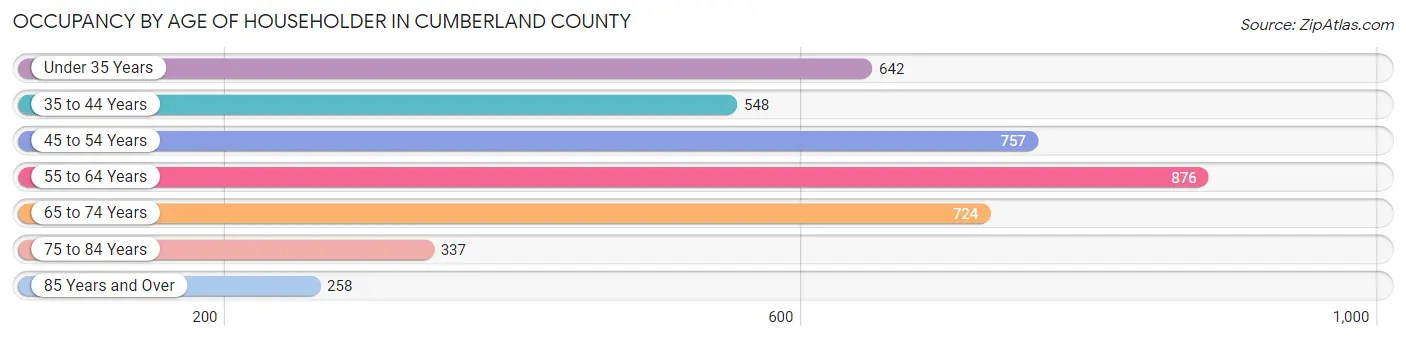
| Age Bracket | # Households | % Households |
| Under 35 Years | 642 | 15.5% |
| 35 to 44 Years | 548 | 13.2% |
| 45 to 54 Years | 757 | 18.3% |
| 55 to 64 Years | 876 | 21.1% |
| 65 to 74 Years | 724 | 17.5% |
| 75 to 84 Years | 337 | 8.1% |
| 85 Years and Over | 258 | 6.2% |
| Total | 4,142 | 100.0% |
Housing Finances in Cumberland County
Median Income by Occupancy in Cumberland County
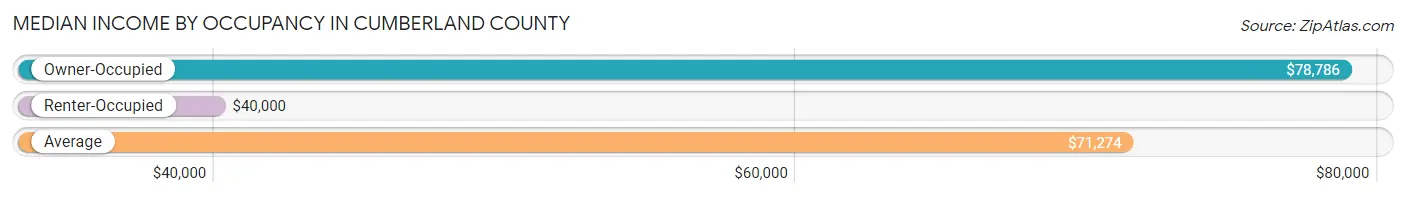
| Occupancy Type | # Households | Median Income |
| Owner-Occupied | 3,360 (81.1%) | $78,786 |
| Renter-Occupied | 782 (18.9%) | $40,000 |
| Average | 4,142 (100.0%) | $71,274 |
Occupancy by Householder Income Bracket in Cumberland County
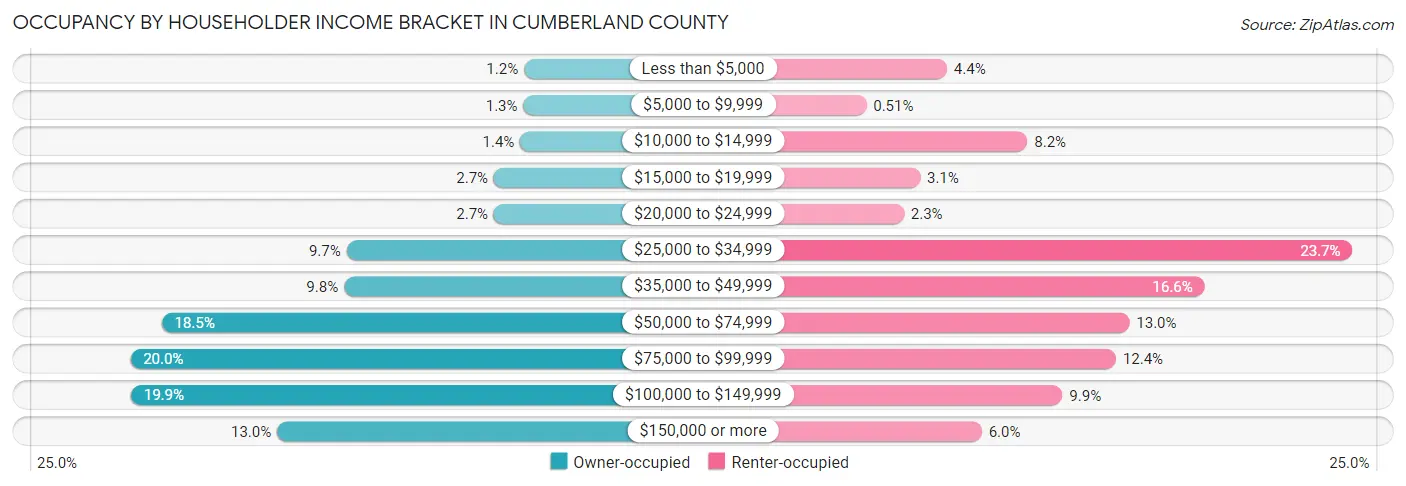
| Income Bracket | Owner-occupied | Renter-occupied |
| Less than $5,000 | 41 (1.2%) | 34 (4.3%) |
| $5,000 to $9,999 | 42 (1.3%) | 4 (0.5%) |
| $10,000 to $14,999 | 47 (1.4%) | 64 (8.2%) |
| $15,000 to $19,999 | 89 (2.6%) | 24 (3.1%) |
| $20,000 to $24,999 | 89 (2.6%) | 18 (2.3%) |
| $25,000 to $34,999 | 325 (9.7%) | 185 (23.7%) |
| $35,000 to $49,999 | 329 (9.8%) | 130 (16.6%) |
| $50,000 to $74,999 | 621 (18.5%) | 102 (13.0%) |
| $75,000 to $99,999 | 671 (20.0%) | 97 (12.4%) |
| $100,000 to $149,999 | 670 (19.9%) | 77 (9.9%) |
| $150,000 or more | 436 (13.0%) | 47 (6.0%) |
| Total | 3,360 (100.0%) | 782 (100.0%) |
Monthly Housing Cost Tiers in Cumberland County
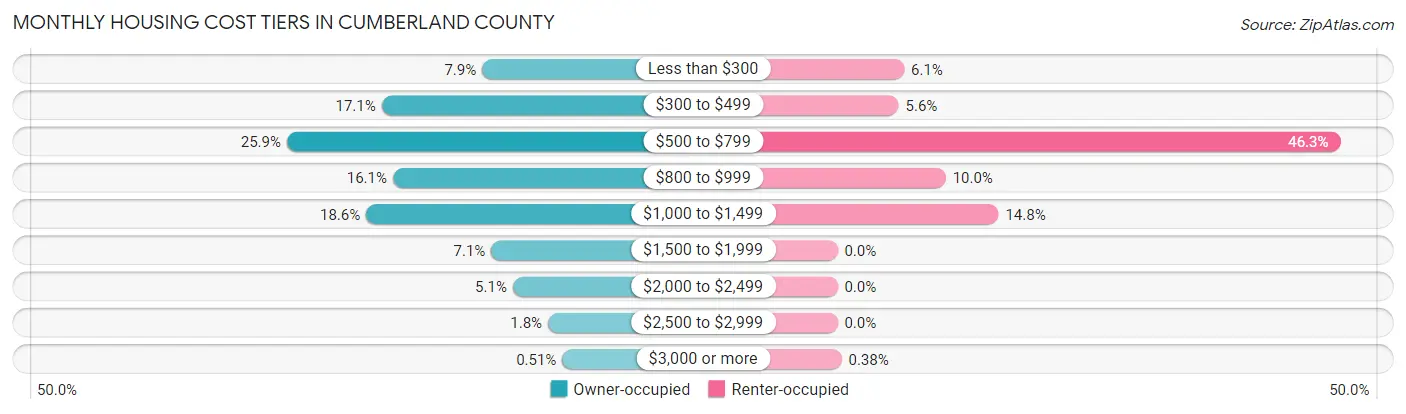
| Monthly Cost | Owner-occupied | Renter-occupied |
| Less than $300 | 265 (7.9%) | 48 (6.1%) |
| $300 to $499 | 576 (17.1%) | 44 (5.6%) |
| $500 to $799 | 869 (25.9%) | 362 (46.3%) |
| $800 to $999 | 541 (16.1%) | 78 (10.0%) |
| $1,000 to $1,499 | 624 (18.6%) | 116 (14.8%) |
| $1,500 to $1,999 | 237 (7.0%) | 0 (0.0%) |
| $2,000 to $2,499 | 170 (5.1%) | 0 (0.0%) |
| $2,500 to $2,999 | 61 (1.8%) | 0 (0.0%) |
| $3,000 or more | 17 (0.5%) | 3 (0.4%) |
| Total | 3,360 (100.0%) | 782 (100.0%) |
Physical Housing Characteristics in Cumberland County
Housing Structures in Cumberland County
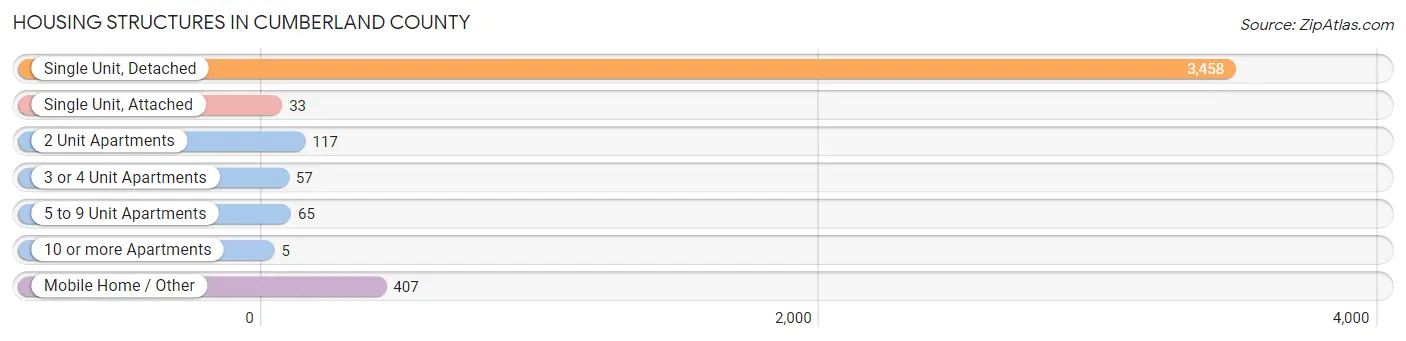
| Structure Type | # Housing Units | % Housing Units |
| Single Unit, Detached | 3,458 | 83.5% |
| Single Unit, Attached | 33 | 0.8% |
| 2 Unit Apartments | 117 | 2.8% |
| 3 or 4 Unit Apartments | 57 | 1.4% |
| 5 to 9 Unit Apartments | 65 | 1.6% |
| 10 or more Apartments | 5 | 0.1% |
| Mobile Home / Other | 407 | 9.8% |
| Total | 4,142 | 100.0% |
Housing Structures by Occupancy in Cumberland County
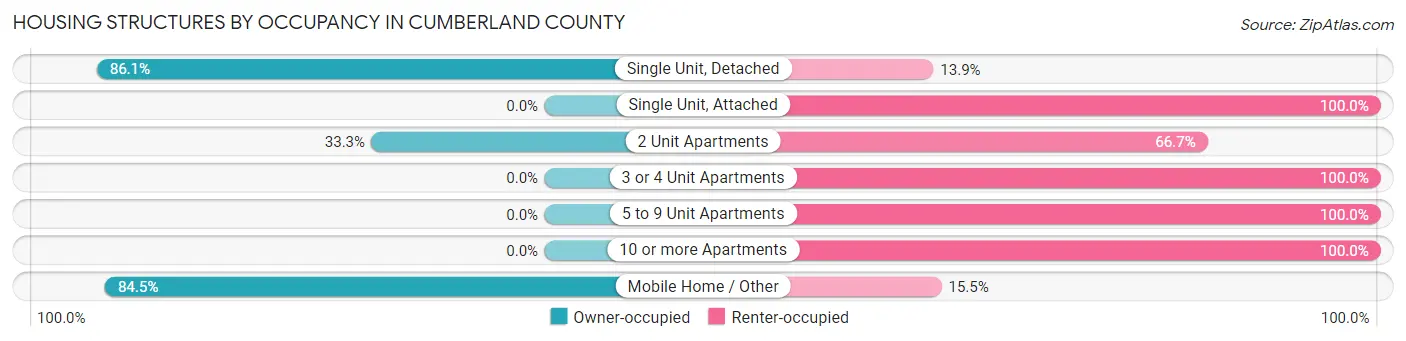
| Structure Type | Owner-occupied | Renter-occupied |
| Single Unit, Detached | 2,977 (86.1%) | 481 (13.9%) |
| Single Unit, Attached | 0 (0.0%) | 33 (100.0%) |
| 2 Unit Apartments | 39 (33.3%) | 78 (66.7%) |
| 3 or 4 Unit Apartments | 0 (0.0%) | 57 (100.0%) |
| 5 to 9 Unit Apartments | 0 (0.0%) | 65 (100.0%) |
| 10 or more Apartments | 0 (0.0%) | 5 (100.0%) |
| Mobile Home / Other | 344 (84.5%) | 63 (15.5%) |
| Total | 3,360 (81.1%) | 782 (18.9%) |
Housing Structures by Number of Rooms in Cumberland County
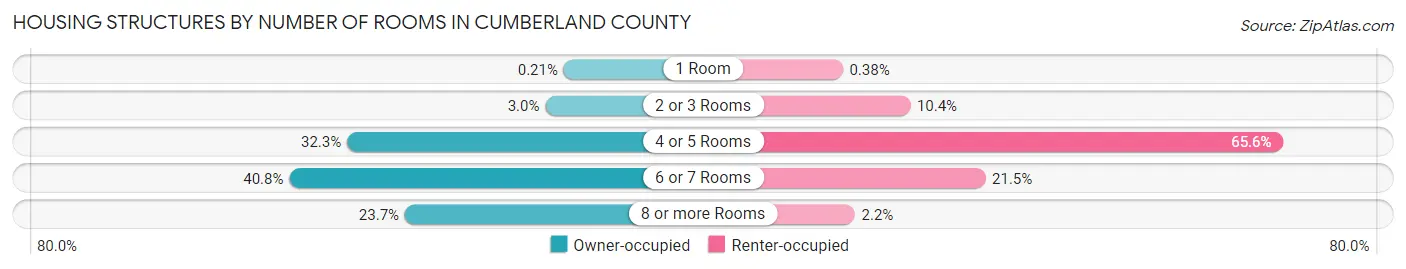
| Number of Rooms | Owner-occupied | Renter-occupied |
| 1 Room | 7 (0.2%) | 3 (0.4%) |
| 2 or 3 Rooms | 99 (2.9%) | 81 (10.4%) |
| 4 or 5 Rooms | 1,085 (32.3%) | 513 (65.6%) |
| 6 or 7 Rooms | 1,372 (40.8%) | 168 (21.5%) |
| 8 or more Rooms | 797 (23.7%) | 17 (2.2%) |
| Total | 3,360 (100.0%) | 782 (100.0%) |
Housing Structure by Heating Type in Cumberland County
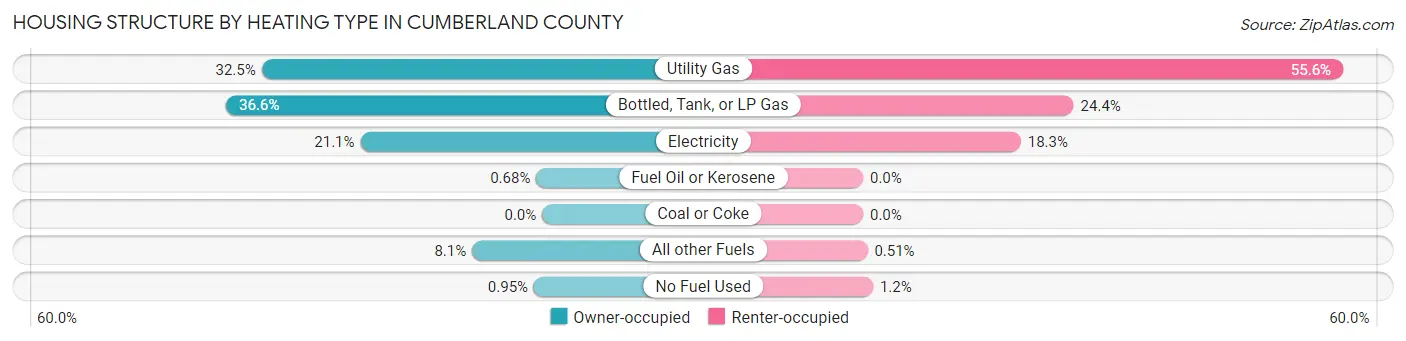
| Heating Type | Owner-occupied | Renter-occupied |
| Utility Gas | 1,093 (32.5%) | 435 (55.6%) |
| Bottled, Tank, or LP Gas | 1,231 (36.6%) | 191 (24.4%) |
| Electricity | 708 (21.1%) | 143 (18.3%) |
| Fuel Oil or Kerosene | 23 (0.7%) | 0 (0.0%) |
| Coal or Coke | 0 (0.0%) | 0 (0.0%) |
| All other Fuels | 273 (8.1%) | 4 (0.5%) |
| No Fuel Used | 32 (0.9%) | 9 (1.1%) |
| Total | 3,360 (100.0%) | 782 (100.0%) |
Household Vehicle Usage in Cumberland County
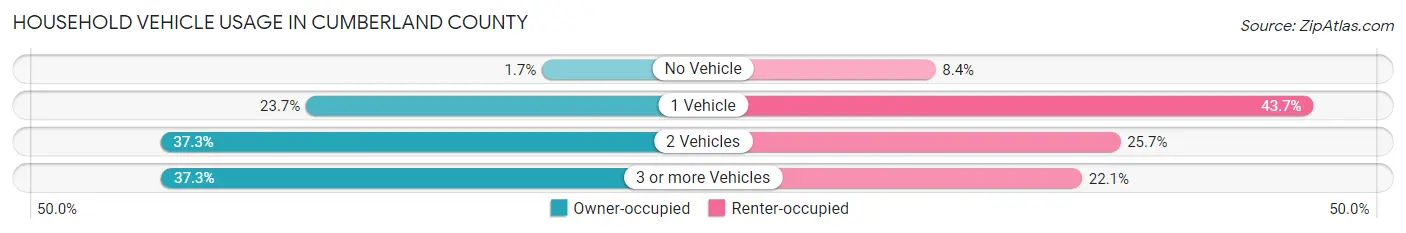
| Vehicles per Household | Owner-occupied | Renter-occupied |
| No Vehicle | 57 (1.7%) | 66 (8.4%) |
| 1 Vehicle | 797 (23.7%) | 342 (43.7%) |
| 2 Vehicles | 1,254 (37.3%) | 201 (25.7%) |
| 3 or more Vehicles | 1,252 (37.3%) | 173 (22.1%) |
| Total | 3,360 (100.0%) | 782 (100.0%) |
Real Estate & Mortgages in Cumberland County
Real Estate and Mortgage Overview in Cumberland County
| Characteristic | Without Mortgage | With Mortgage |
| Housing Units | 1,786 | 1,574 |
| Median Property Value | $112,600 | $119,300 |
| Median Household Income | $58,537 | $232 |
| Monthly Housing Costs | $528 | $17 |
| Real Estate Taxes | $2,192 | $30 |
Property Value by Mortgage Status in Cumberland County
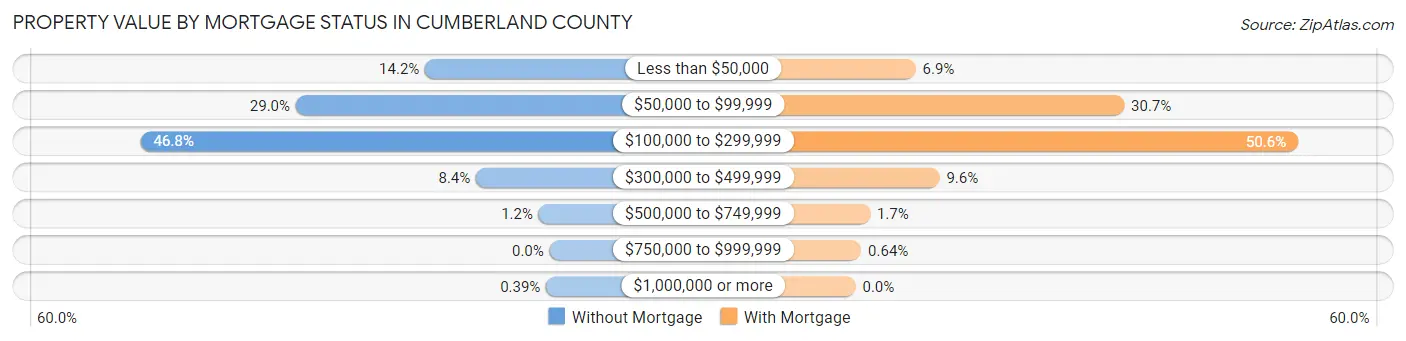
| Property Value | Without Mortgage | With Mortgage |
| Less than $50,000 | 254 (14.2%) | 108 (6.9%) |
| $50,000 to $99,999 | 518 (29.0%) | 483 (30.7%) |
| $100,000 to $299,999 | 835 (46.8%) | 796 (50.6%) |
| $300,000 to $499,999 | 150 (8.4%) | 151 (9.6%) |
| $500,000 to $749,999 | 22 (1.2%) | 26 (1.7%) |
| $750,000 to $999,999 | 0 (0.0%) | 10 (0.6%) |
| $1,000,000 or more | 7 (0.4%) | 0 (0.0%) |
| Total | 1,786 (100.0%) | 1,574 (100.0%) |
Household Income by Mortgage Status in Cumberland County
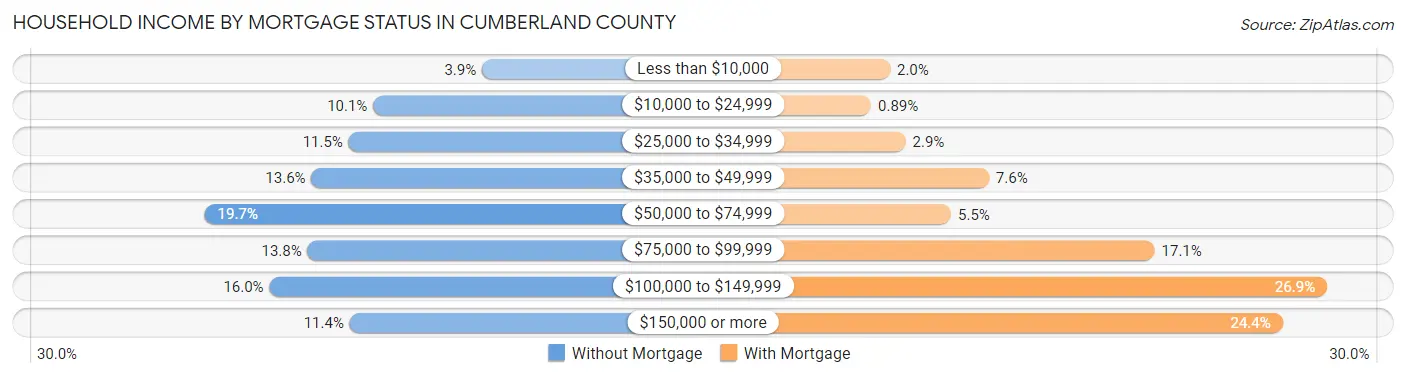
| Household Income | Without Mortgage | With Mortgage |
| Less than $10,000 | 69 (3.9%) | 31 (2.0%) |
| $10,000 to $24,999 | 180 (10.1%) | 14 (0.9%) |
| $25,000 to $34,999 | 205 (11.5%) | 45 (2.9%) |
| $35,000 to $49,999 | 243 (13.6%) | 120 (7.6%) |
| $50,000 to $74,999 | 352 (19.7%) | 86 (5.5%) |
| $75,000 to $99,999 | 247 (13.8%) | 269 (17.1%) |
| $100,000 to $149,999 | 286 (16.0%) | 424 (26.9%) |
| $150,000 or more | 204 (11.4%) | 384 (24.4%) |
| Total | 1,786 (100.0%) | 1,574 (100.0%) |
Property Value to Household Income Ratio in Cumberland County
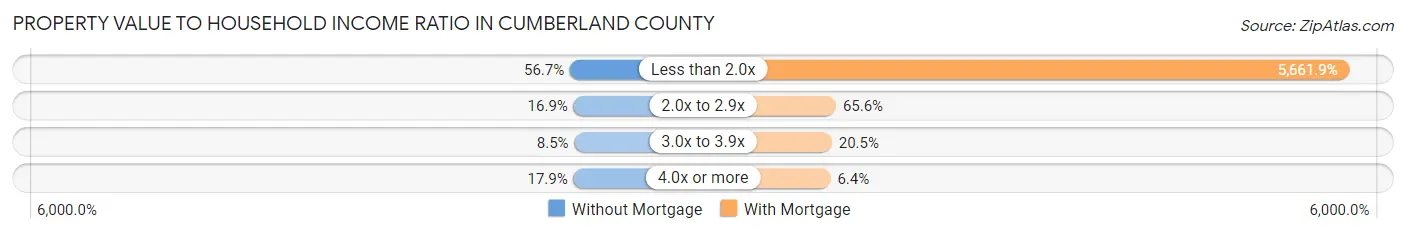
| Value-to-Income Ratio | Without Mortgage | With Mortgage |
| Less than 2.0x | 1,012 (56.7%) | 89,118 (5,661.9%) |
| 2.0x to 2.9x | 302 (16.9%) | 1,033 (65.6%) |
| 3.0x to 3.9x | 152 (8.5%) | 323 (20.5%) |
| 4.0x or more | 320 (17.9%) | 100 (6.4%) |
| Total | 1,786 (100.0%) | 1,574 (100.0%) |
Real Estate Taxes by Mortgage Status in Cumberland County
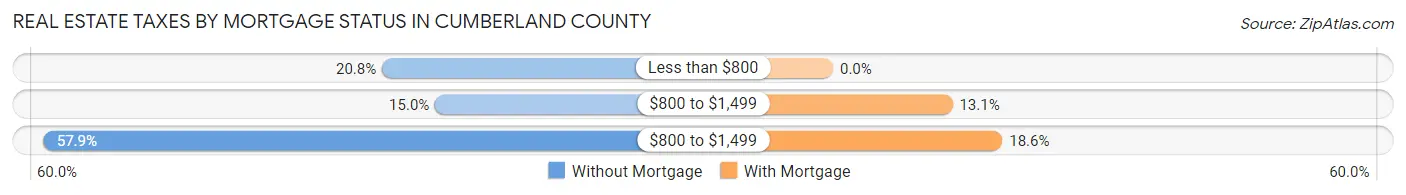
| Property Taxes | Without Mortgage | With Mortgage |
| Less than $800 | 372 (20.8%) | 0 (0.0%) |
| $800 to $1,499 | 268 (15.0%) | 206 (13.1%) |
| $800 to $1,499 | 1,034 (57.9%) | 292 (18.5%) |
| Total | 1,786 (100.0%) | 1,574 (100.0%) |
Health & Disability in Cumberland County
Health Insurance Coverage by Age in Cumberland County
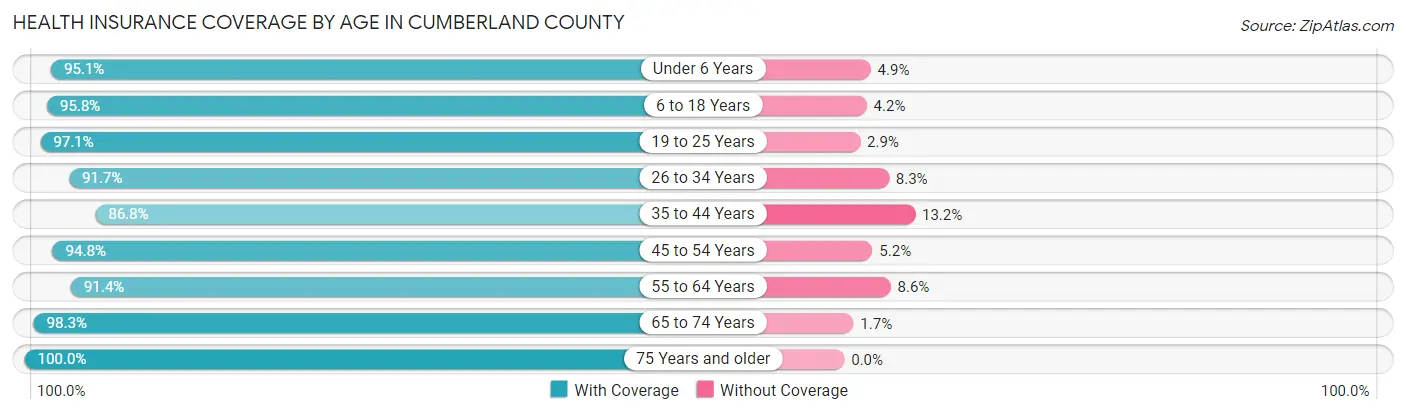
| Age Bracket | With Coverage | Without Coverage |
| Under 6 Years | 734 (95.1%) | 38 (4.9%) |
| 6 to 18 Years | 1,633 (95.8%) | 71 (4.2%) |
| 19 to 25 Years | 595 (97.1%) | 18 (2.9%) |
| 26 to 34 Years | 1,037 (91.7%) | 94 (8.3%) |
| 35 to 44 Years | 1,119 (86.8%) | 170 (13.2%) |
| 45 to 54 Years | 1,193 (94.8%) | 66 (5.2%) |
| 55 to 64 Years | 1,395 (91.4%) | 132 (8.6%) |
| 65 to 74 Years | 1,217 (98.3%) | 21 (1.7%) |
| 75 Years and older | 785 (100.0%) | 0 (0.0%) |
| Total | 9,708 (94.1%) | 610 (5.9%) |
Health Insurance Coverage by Citizenship Status in Cumberland County
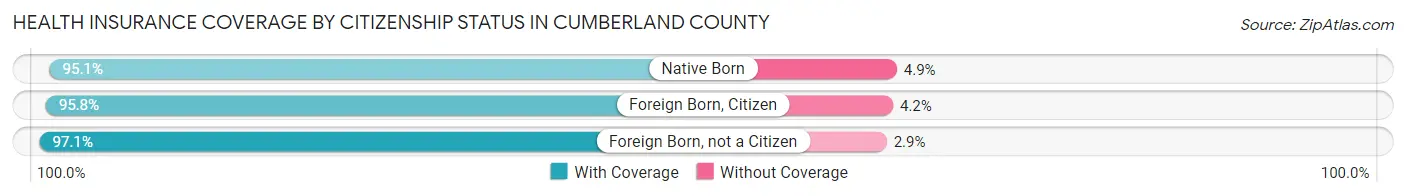
| Citizenship Status | With Coverage | Without Coverage |
| Native Born | 734 (95.1%) | 38 (4.9%) |
| Foreign Born, Citizen | 1,633 (95.8%) | 71 (4.2%) |
| Foreign Born, not a Citizen | 595 (97.1%) | 18 (2.9%) |
Health Insurance Coverage by Household Income in Cumberland County
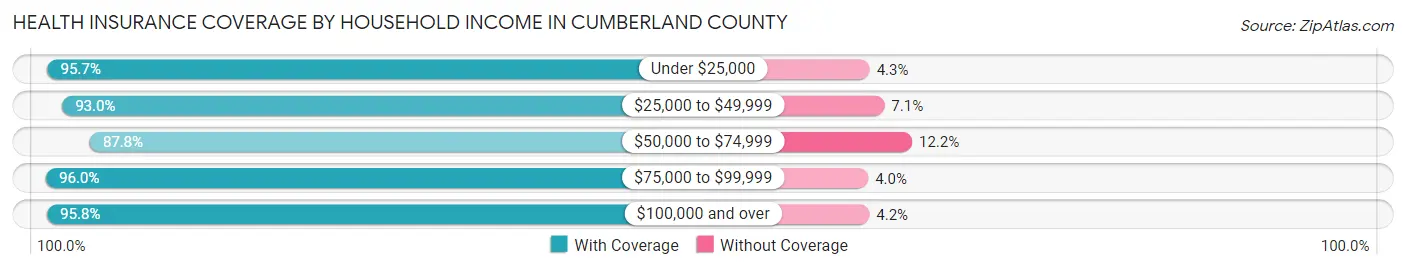
| Household Income | With Coverage | Without Coverage |
| Under $25,000 | 623 (95.7%) | 28 (4.3%) |
| $25,000 to $49,999 | 1,635 (92.9%) | 124 (7.0%) |
| $50,000 to $74,999 | 1,415 (87.8%) | 197 (12.2%) |
| $75,000 to $99,999 | 2,295 (96.0%) | 96 (4.0%) |
| $100,000 and over | 3,740 (95.8%) | 165 (4.2%) |
Public vs Private Health Insurance Coverage by Age in Cumberland County
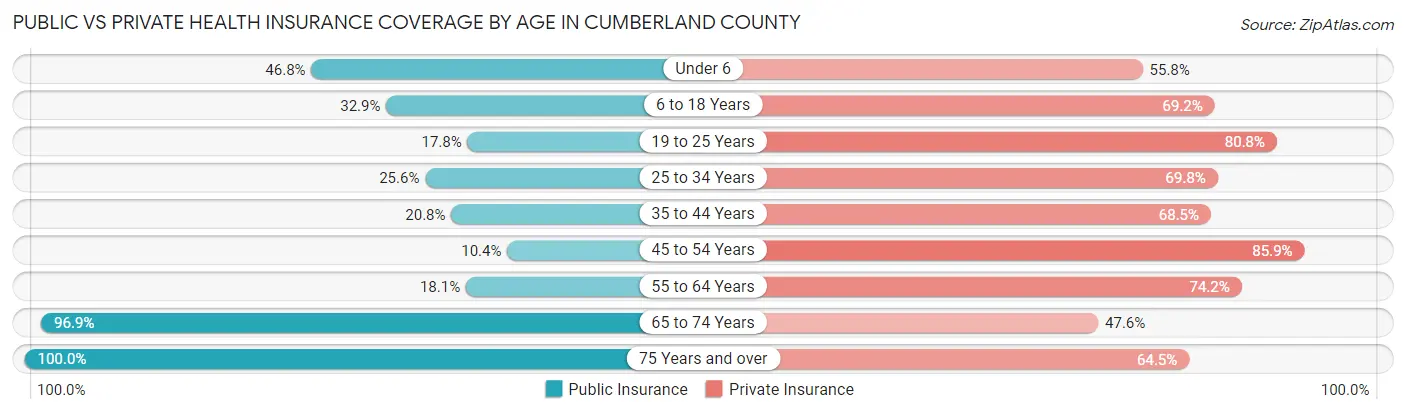
| Age Bracket | Public Insurance | Private Insurance |
| Under 6 | 361 (46.8%) | 431 (55.8%) |
| 6 to 18 Years | 560 (32.9%) | 1,179 (69.2%) |
| 19 to 25 Years | 109 (17.8%) | 495 (80.7%) |
| 25 to 34 Years | 290 (25.6%) | 789 (69.8%) |
| 35 to 44 Years | 268 (20.8%) | 883 (68.5%) |
| 45 to 54 Years | 131 (10.4%) | 1,081 (85.9%) |
| 55 to 64 Years | 276 (18.1%) | 1,133 (74.2%) |
| 65 to 74 Years | 1,200 (96.9%) | 589 (47.6%) |
| 75 Years and over | 785 (100.0%) | 506 (64.5%) |
| Total | 3,980 (38.6%) | 7,086 (68.7%) |
Disability Status by Sex by Age in Cumberland County
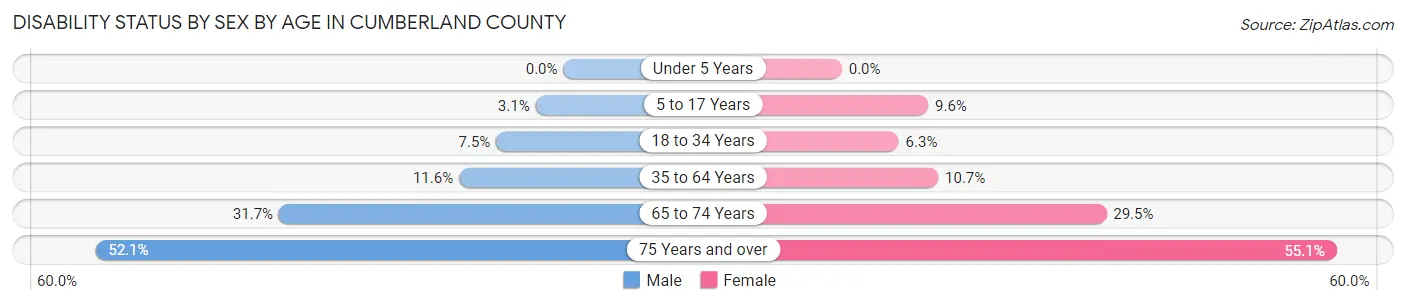
| Age Bracket | Male | Female |
| Under 5 Years | 0 (0.0%) | 0 (0.0%) |
| 5 to 17 Years | 28 (3.1%) | 79 (9.6%) |
| 18 to 34 Years | 74 (7.5%) | 56 (6.3%) |
| 35 to 64 Years | 245 (11.6%) | 211 (10.7%) |
| 65 to 74 Years | 204 (31.7%) | 175 (29.5%) |
| 75 Years and over | 184 (52.1%) | 238 (55.1%) |
Disability Class by Sex by Age in Cumberland County
Disability Class: Hearing Difficulty
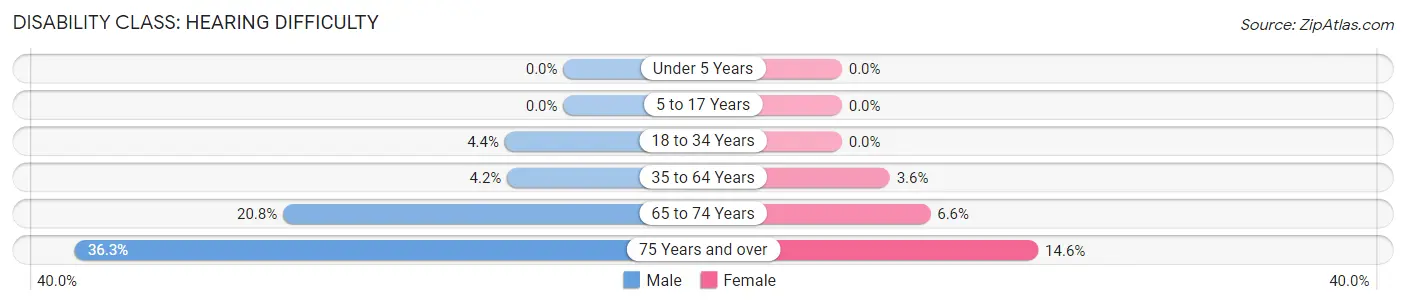
| Age Bracket | Male | Female |
| Under 5 Years | 0 (0.0%) | 0 (0.0%) |
| 5 to 17 Years | 0 (0.0%) | 0 (0.0%) |
| 18 to 34 Years | 43 (4.3%) | 0 (0.0%) |
| 35 to 64 Years | 88 (4.2%) | 70 (3.6%) |
| 65 to 74 Years | 134 (20.8%) | 39 (6.6%) |
| 75 Years and over | 128 (36.3%) | 63 (14.6%) |
Disability Class: Vision Difficulty
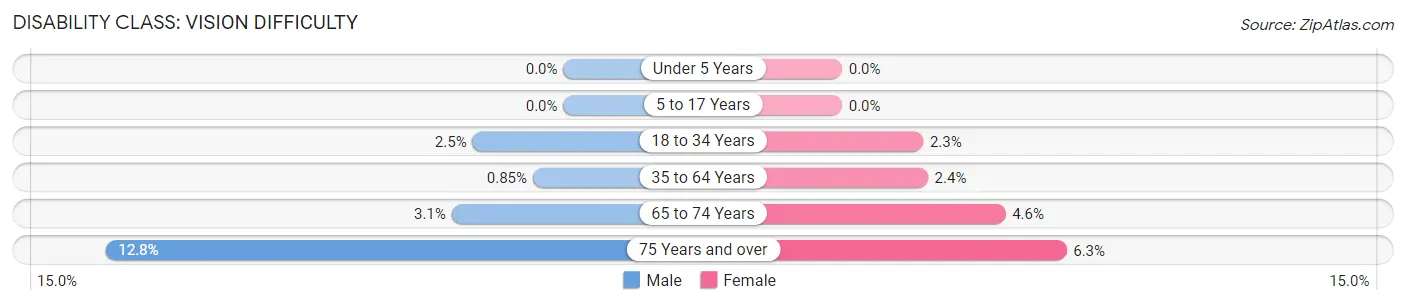
| Age Bracket | Male | Female |
| Under 5 Years | 0 (0.0%) | 0 (0.0%) |
| 5 to 17 Years | 0 (0.0%) | 0 (0.0%) |
| 18 to 34 Years | 25 (2.5%) | 20 (2.3%) |
| 35 to 64 Years | 18 (0.9%) | 47 (2.4%) |
| 65 to 74 Years | 20 (3.1%) | 27 (4.5%) |
| 75 Years and over | 45 (12.8%) | 27 (6.2%) |
Disability Class: Cognitive Difficulty
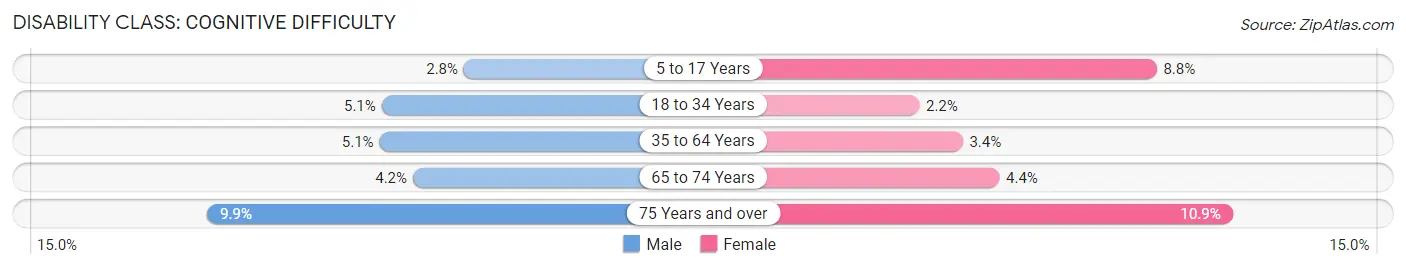
| Age Bracket | Male | Female |
| 5 to 17 Years | 25 (2.8%) | 72 (8.8%) |
| 18 to 34 Years | 50 (5.1%) | 19 (2.1%) |
| 35 to 64 Years | 108 (5.1%) | 66 (3.4%) |
| 65 to 74 Years | 27 (4.2%) | 26 (4.4%) |
| 75 Years and over | 35 (9.9%) | 47 (10.9%) |
Disability Class: Ambulatory Difficulty
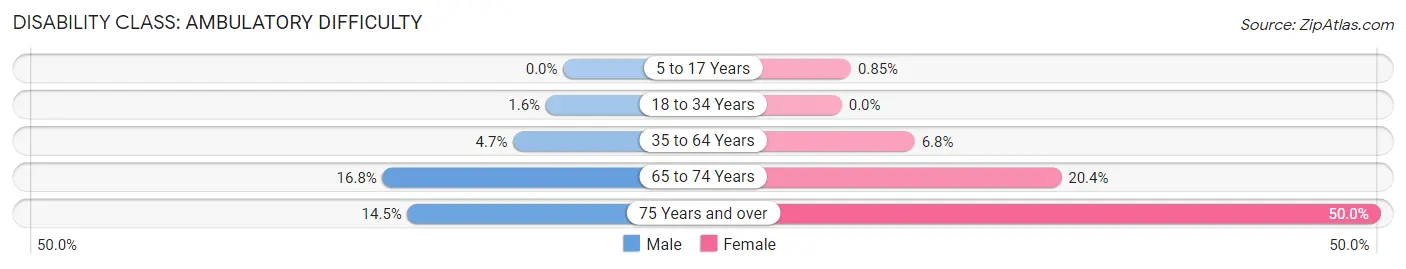
| Age Bracket | Male | Female |
| 5 to 17 Years | 0 (0.0%) | 7 (0.9%) |
| 18 to 34 Years | 16 (1.6%) | 0 (0.0%) |
| 35 to 64 Years | 98 (4.6%) | 133 (6.8%) |
| 65 to 74 Years | 108 (16.8%) | 121 (20.4%) |
| 75 Years and over | 51 (14.4%) | 216 (50.0%) |
Disability Class: Self-Care Difficulty
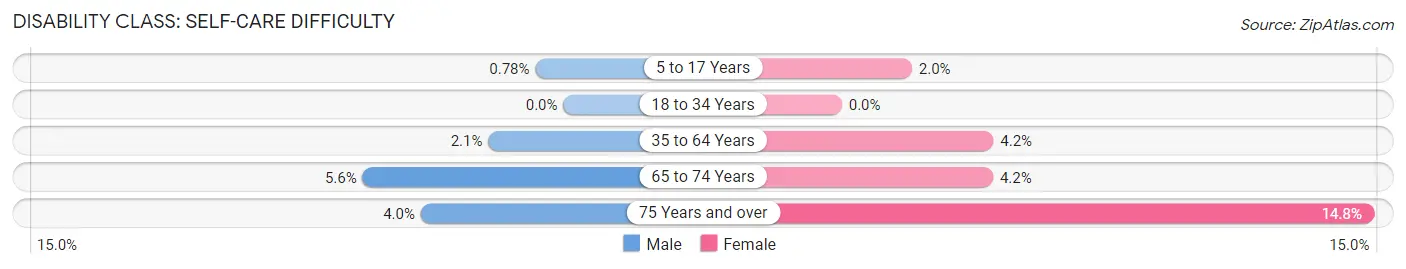
| Age Bracket | Male | Female |
| 5 to 17 Years | 7 (0.8%) | 16 (1.9%) |
| 18 to 34 Years | 0 (0.0%) | 0 (0.0%) |
| 35 to 64 Years | 44 (2.1%) | 83 (4.2%) |
| 65 to 74 Years | 36 (5.6%) | 25 (4.2%) |
| 75 Years and over | 14 (4.0%) | 64 (14.8%) |
Technology Access in Cumberland County
Computing Device Access in Cumberland County
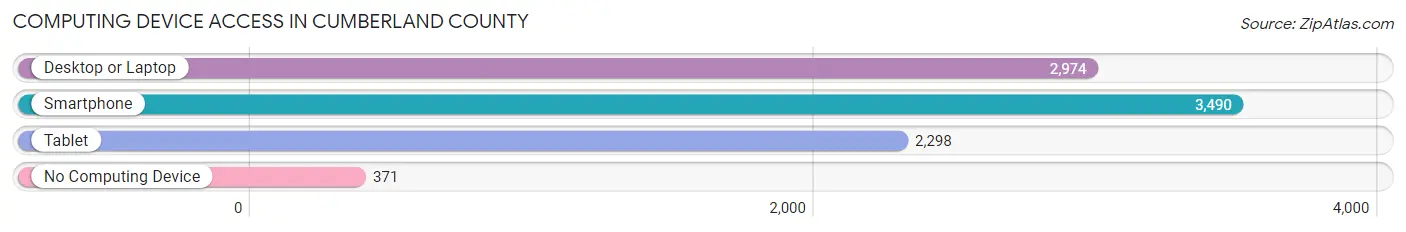
| Device Type | # Households | % Households |
| Desktop or Laptop | 2,974 | 71.8% |
| Smartphone | 3,490 | 84.3% |
| Tablet | 2,298 | 55.5% |
| No Computing Device | 371 | 9.0% |
| Total | 4,142 | 100.0% |
Internet Access in Cumberland County
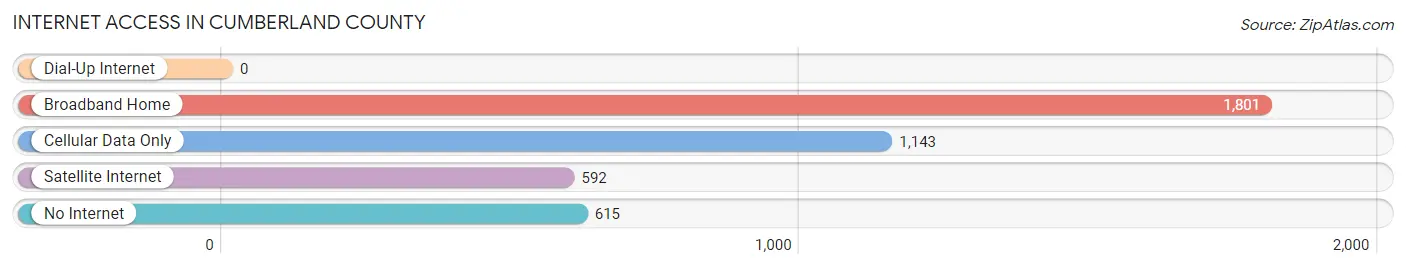
| Internet Type | # Households | % Households |
| Dial-Up Internet | 0 | 0.0% |
| Broadband Home | 1,801 | 43.5% |
| Cellular Data Only | 1,143 | 27.6% |
| Satellite Internet | 592 | 14.3% |
| No Internet | 615 | 14.8% |
| Total | 4,142 | 100.0% |
Cumberland County Summary
Cumberland County is located in the southeastern corner of Illinois, and is part of the Effingham-Mattoon-Charleston Metropolitan Statistical Area. The county was established in 1843 and is named after the Duke of Cumberland. The county seat is Toledo, and the population was 10,945 at the 2010 census.
Geography
Cumberland County is located in the southeastern corner of Illinois, and is bordered by Clark County to the north, Jasper County to the east, Clay County to the south, and Shelby County to the west. The county has a total area of 517 square miles, of which 515 square miles is land and 2.2 square miles is water. The county is mostly flat, with some rolling hills in the northern part. The highest point in the county is located in the northwest corner, at an elevation of 890 feet.
The county is drained by the Embarras River, which flows through the center of the county from north to south. The Embarras River is a tributary of the Wabash River, which flows into the Ohio River. Other major waterways in the county include the Little Wabash River, which flows through the eastern part of the county, and the Little Embarras River, which flows through the western part of the county.
Climate
Cumberland County has a humid continental climate, with hot, humid summers and cold, dry winters. The average annual temperature is 54°F, and the average annual precipitation is 40 inches.
Demographics
As of the 2010 census, there were 10,945 people, 4,521 households, and 3,092 families living in the county. The population density was 21.3 people per square mile. The racial makeup of the county was 97.7% White, 0.4% African American, 0.2% Native American, 0.2% Asian, 0.2% from other races, and 1.3% from two or more races. Hispanic or Latino of any race were 1.2% of the population.
The median income for a household in the county was $41,945, and the median income for a family was $50,945. The per capita income for the county was $20,945. About 11.2% of families and 14.2% of the population were below the poverty line, including 19.2% of those under age 18 and 8.2% of those age 65 or over.
Economy
Cumberland County is largely rural, and the economy is based on agriculture. The county is home to several large farms, and the main crops grown in the county are corn, soybeans, and wheat. The county is also home to several small businesses, including manufacturing, retail, and service industries.
The county is served by two major highways, Interstate 57 and U.S. Route 45. The nearest airport is the Effingham County Airport, located in Effingham, Illinois.
The county is home to several small towns, including Toledo, Greenup, Neoga, and Shiloh. The county seat is Toledo, which is home to the Cumberland County Courthouse and the Cumberland County Historical Museum.
Conclusion
Cumberland County is a rural county located in the southeastern corner of Illinois. The county is home to several small towns, and the economy is based on agriculture. The county is served by two major highways, and the nearest airport is the Effingham County Airport. The population of the county was 10,945 at the 2010 census, and the median income for a household was $41,945.
Common Questions
What is Per Capita Income in Cumberland County?
Per Capita income in Cumberland County is $34,338.
What is the Median Family Income in Cumberland County?
Median Family Income in Cumberland County is $88,494.
What is the Median Household income in Cumberland County?
Median Household Income in Cumberland County is $71,274.
What is Income or Wage Gap in Cumberland County?
Income or Wage Gap in Cumberland County is 42.2%.
Women in Cumberland County earn 57.8 cents for every dollar earned by a man.
What is Family Income Deficit in Cumberland County?
Family Income Deficit in Cumberland County is $9,801.
Families that are below poverty line in Cumberland County earn $9,801 less on average than the poverty threshold level.
What is Inequality or Gini Index in Cumberland County?
Inequality or Gini Index in Cumberland County is 0.40.
What is the Total Population of Cumberland County?
Total Population of Cumberland County is 10,447.
What is the Total Male Population of Cumberland County?
Total Male Population of Cumberland County is 5,400.
What is the Total Female Population of Cumberland County?
Total Female Population of Cumberland County is 5,047.
What is the Ratio of Males per 100 Females in Cumberland County?
There are 106.99 Males per 100 Females in Cumberland County.
What is the Ratio of Females per 100 Males in Cumberland County?
There are 93.46 Females per 100 Males in Cumberland County.
What is the Median Population Age in Cumberland County?
Median Population Age in Cumberland County is 42.6 Years.
What is the Average Family Size in Cumberland County
Average Family Size in Cumberland County is 3.0 People.
What is the Average Household Size in Cumberland County
Average Household Size in Cumberland County is 2.5 People.
How Large is the Labor Force in Cumberland County?
There are 5,628 People in the Labor Forcein in Cumberland County.
What is the Percentage of People in the Labor Force in Cumberland County?
66.9% of People are in the Labor Force in Cumberland County.
What is the Unemployment Rate in Cumberland County?
Unemployment Rate in Cumberland County is 1.9%.