Crawford County, IL Map & Demographics
Crawford County Map
Crawford County Overview
$32,786
PER CAPITA INCOME
$79,123
AVG FAMILY INCOME
$64,163
AVG HOUSEHOLD INCOME
27.8%
WAGE / INCOME GAP [ % ]
72.2¢/ $1
WAGE / INCOME GAP [ $ ]
$8,016
FAMILY INCOME DEFICIT
0.44
INEQUALITY / GINI INDEX
18,729
TOTAL POPULATION
9,989
MALE POPULATION
8,740
FEMALE POPULATION
114.29
MALES / 100 FEMALES
87.50
FEMALES / 100 MALES
42.2
MEDIAN AGE
2.8
AVG FAMILY SIZE
2.3
AVG HOUSEHOLD SIZE
8,572
LABOR FORCE [ PEOPLE ]
55.4%
PERCENT IN LABOR FORCE
3.3%
UNEMPLOYMENT RATE
Income in Crawford County
Income Overview in Crawford County
Per Capita Income in Crawford County is $32,786, while median incomes of families and households are $79,123 and $64,163 respectively.
| Characteristic | Number | Measure |
| Per Capita Income | 18,729 | $32,786 |
| Median Family Income | 4,902 | $79,123 |
| Mean Family Income | 4,902 | $101,243 |
| Median Household Income | 7,481 | $64,163 |
| Mean Household Income | 7,481 | $81,010 |
| Income Deficit | 4,902 | $8,016 |
| Wage / Income Gap (%) | 18,729 | 27.78% |
| Wage / Income Gap ($) | 18,729 | 72.22¢ per $1 |
| Gini / Inequality Index | 18,729 | 0.44 |
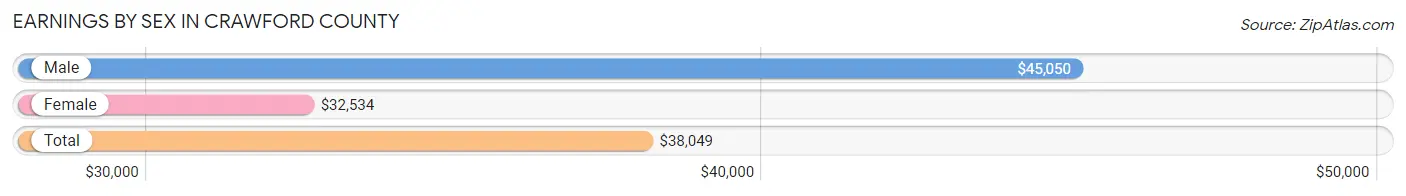
Earnings by Sex in Crawford County
Average Earnings in Crawford County are $38,049, $45,050 for men and $32,534 for women, a difference of 27.8%.
| Sex | Number | Average Earnings |
| Male | 4,845 (52.6%) | $45,050 |
| Female | 4,371 (47.4%) | $32,534 |
| Total | 9,216 (100.0%) | $38,049 |
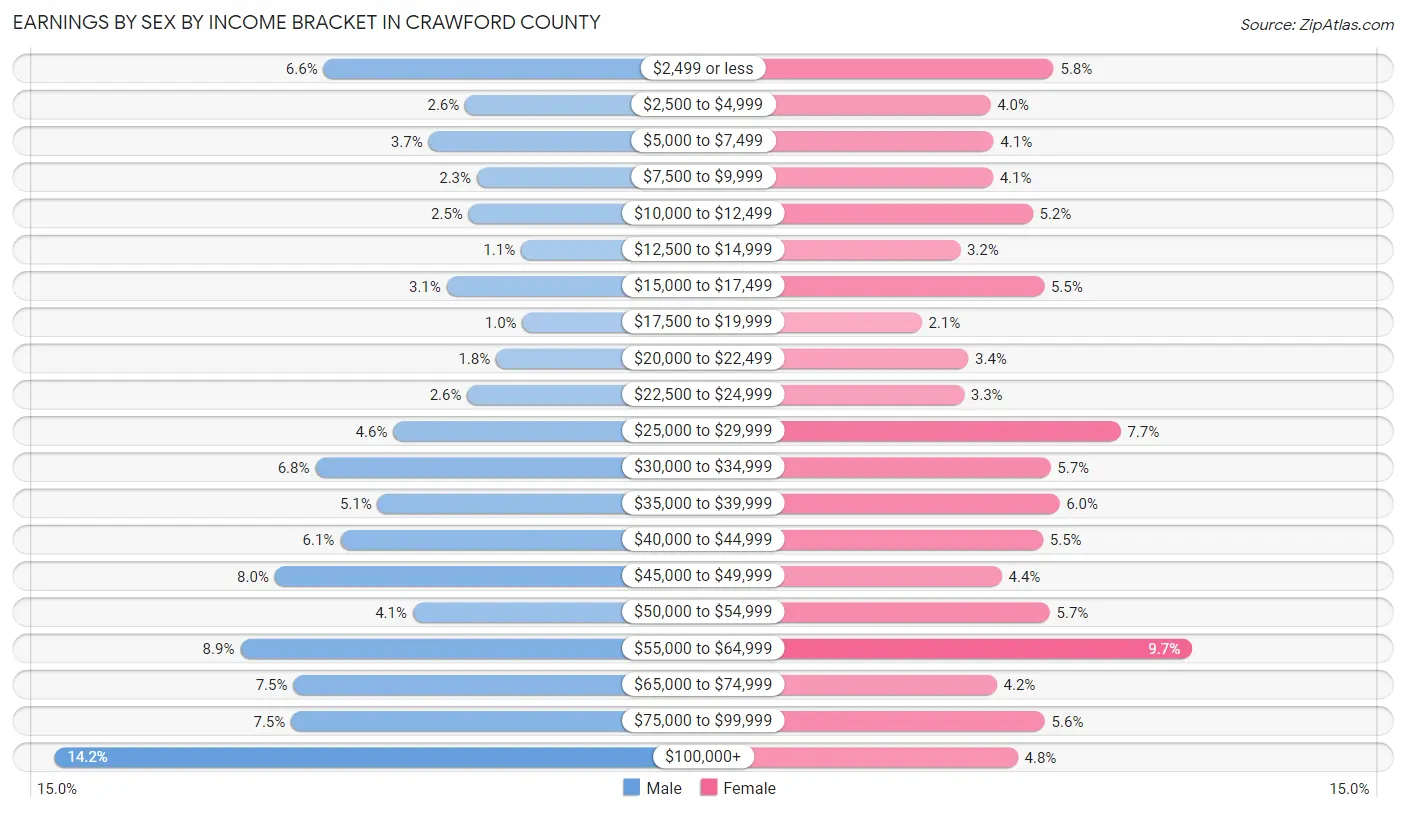
Earnings by Sex by Income Bracket in Crawford County
The most common earnings brackets in Crawford County are $100,000+ for men (686 | 14.2%) and $55,000 to $64,999 for women (424 | 9.7%).
| Income | Male | Female |
| $2,499 or less | 320 (6.6%) | 254 (5.8%) |
| $2,500 to $4,999 | 127 (2.6%) | 176 (4.0%) |
| $5,000 to $7,499 | 177 (3.6%) | 180 (4.1%) |
| $7,500 to $9,999 | 111 (2.3%) | 179 (4.1%) |
| $10,000 to $12,499 | 122 (2.5%) | 228 (5.2%) |
| $12,500 to $14,999 | 51 (1.1%) | 139 (3.2%) |
| $15,000 to $17,499 | 152 (3.1%) | 242 (5.5%) |
| $17,500 to $19,999 | 49 (1.0%) | 92 (2.1%) |
| $20,000 to $22,499 | 85 (1.8%) | 149 (3.4%) |
| $22,500 to $24,999 | 124 (2.6%) | 144 (3.3%) |
| $25,000 to $29,999 | 225 (4.6%) | 336 (7.7%) |
| $30,000 to $34,999 | 331 (6.8%) | 250 (5.7%) |
| $35,000 to $39,999 | 246 (5.1%) | 261 (6.0%) |
| $40,000 to $44,999 | 297 (6.1%) | 241 (5.5%) |
| $45,000 to $49,999 | 386 (8.0%) | 190 (4.3%) |
| $50,000 to $54,999 | 198 (4.1%) | 249 (5.7%) |
| $55,000 to $64,999 | 433 (8.9%) | 424 (9.7%) |
| $65,000 to $74,999 | 361 (7.4%) | 184 (4.2%) |
| $75,000 to $99,999 | 364 (7.5%) | 243 (5.6%) |
| $100,000+ | 686 (14.2%) | 210 (4.8%) |
| Total | 4,845 (100.0%) | 4,371 (100.0%) |
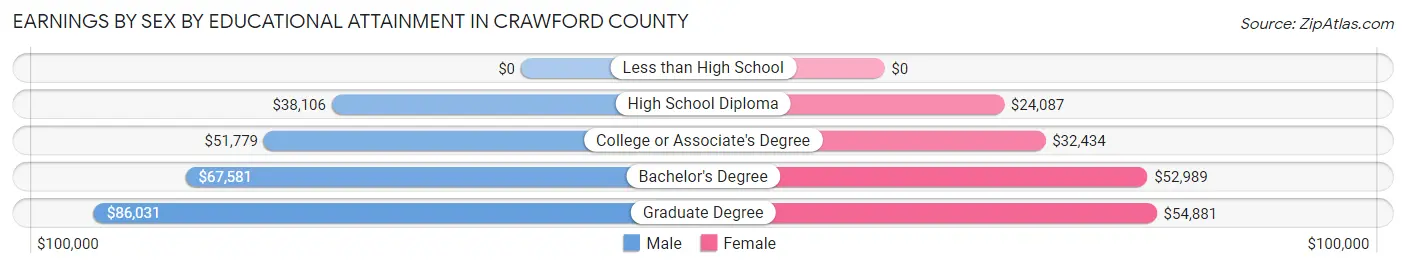
Earnings by Sex by Educational Attainment in Crawford County
Average earnings in Crawford County are $47,407 for men and $35,874 for women, a difference of 24.3%. Men with an educational attainment of graduate degree enjoy the highest average annual earnings of $86,031, while those with high school diploma education earn the least with $38,106. Women with an educational attainment of graduate degree earn the most with the average annual earnings of $54,881, while those with high school diploma education have the smallest earnings of $24,087.
| Educational Attainment | Male Income | Female Income |
| Less than High School | - | - |
| High School Diploma | $38,106 | $24,087 |
| College or Associate's Degree | $51,779 | $32,434 |
| Bachelor's Degree | $67,581 | $52,989 |
| Graduate Degree | $86,031 | $54,881 |
| Total | $47,407 | $35,874 |
Family Income in Crawford County
Family Income Brackets in Crawford County
According to the Crawford County family income data, there are 1,211 families falling into the $50,000 to $74,999 income range, which is the most common income bracket and makes up 24.7% of all families. Conversely, the $10,000 to $14,999 income bracket is the least frequent group with only 39 families (0.8%) belonging to this category.
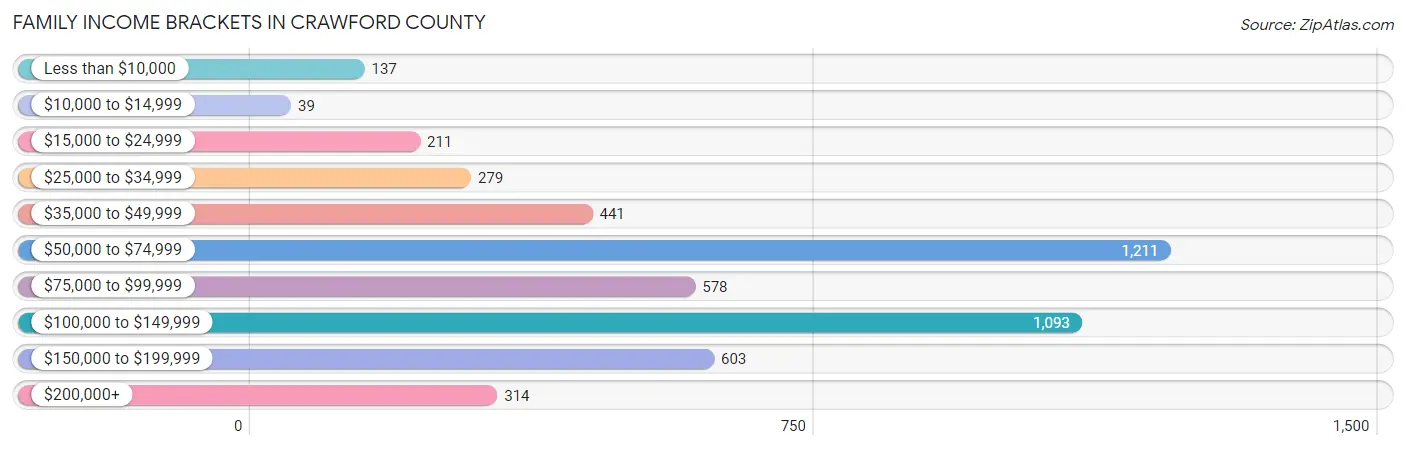
| Income Bracket | # Families | % Families |
| Less than $10,000 | 137 | 2.8% |
| $10,000 to $14,999 | 39 | 0.8% |
| $15,000 to $24,999 | 211 | 4.3% |
| $25,000 to $34,999 | 279 | 5.7% |
| $35,000 to $49,999 | 441 | 9.0% |
| $50,000 to $74,999 | 1,211 | 24.7% |
| $75,000 to $99,999 | 578 | 11.8% |
| $100,000 to $149,999 | 1,093 | 22.3% |
| $150,000 to $199,999 | 603 | 12.3% |
| $200,000+ | 314 | 6.4% |
Family Income by Famaliy Size in Crawford County
7+ person families (43 | 0.9%) account for the highest median family income in Crawford County with $122,880 per family, while 2-person families (2,575 | 52.5%) have the highest median income of $34,538 per family member.
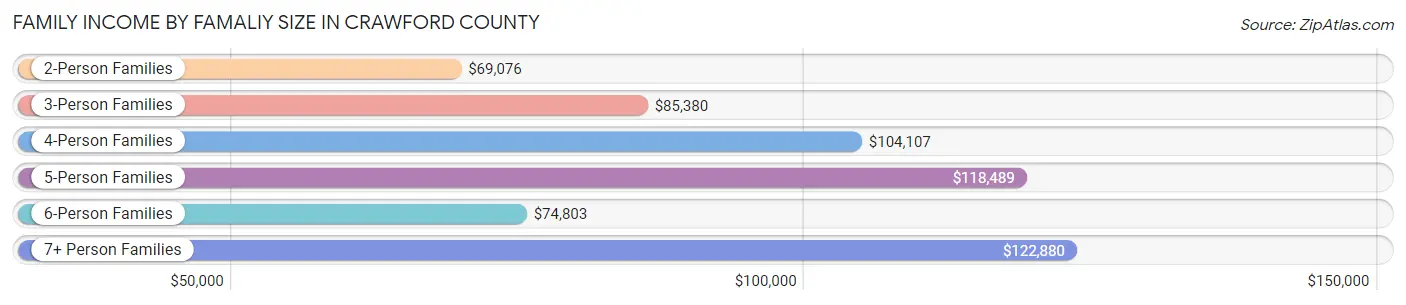
| Income Bracket | # Families | Median Income |
| 2-Person Families | 2,575 (52.5%) | $69,076 |
| 3-Person Families | 997 (20.3%) | $85,380 |
| 4-Person Families | 915 (18.7%) | $104,107 |
| 5-Person Families | 327 (6.7%) | $118,489 |
| 6-Person Families | 45 (0.9%) | $74,803 |
| 7+ Person Families | 43 (0.9%) | $122,880 |
| Total | 4,902 (100.0%) | $79,123 |
Family Income by Number of Earners in Crawford County
The median family income in Crawford County is $79,123, with families comprising 3+ earners (649) having the highest median family income of $148,594, while families with no earners (870) have the lowest median family income of $52,021, accounting for 13.2% and 17.7% of families, respectively.
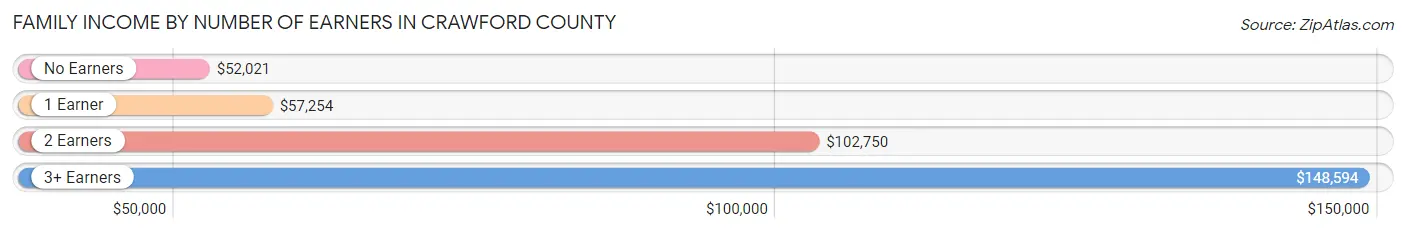
| Number of Earners | # Families | Median Income |
| No Earners | 870 (17.7%) | $52,021 |
| 1 Earner | 1,516 (30.9%) | $57,254 |
| 2 Earners | 1,867 (38.1%) | $102,750 |
| 3+ Earners | 649 (13.2%) | $148,594 |
| Total | 4,902 (100.0%) | $79,123 |
Household Income in Crawford County
Household Income Brackets in Crawford County
With 1,653 households falling in the category, the $50,000 to $74,999 income range is the most frequent in Crawford County, accounting for 22.1% of all households. In contrast, only 307 households (4.1%) fall into the $10,000 to $14,999 income bracket, making it the least populous group.
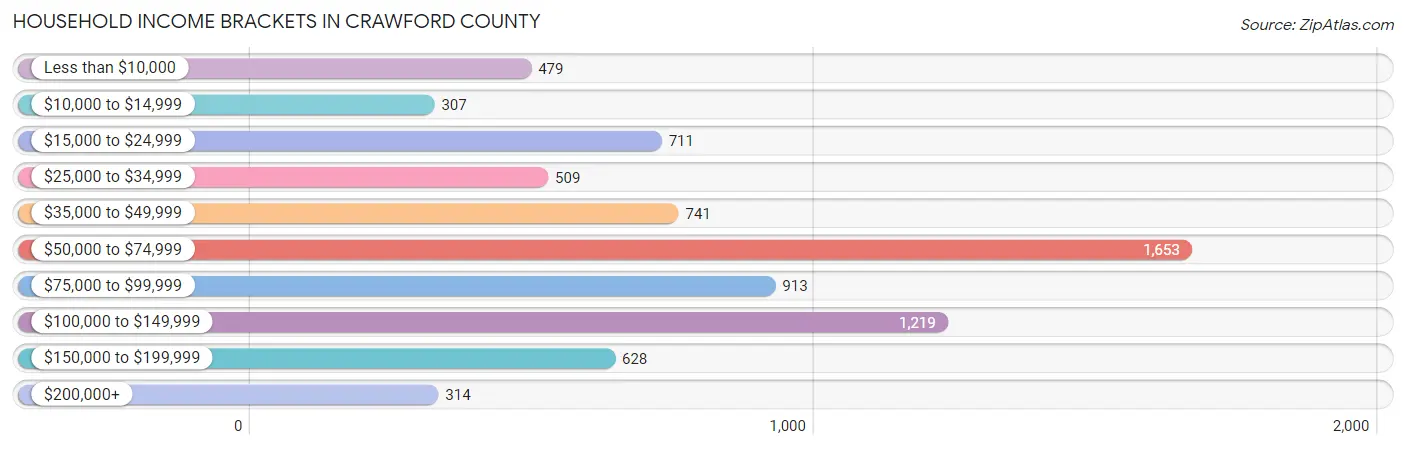
| Income Bracket | # Households | % Households |
| Less than $10,000 | 479 | 6.4% |
| $10,000 to $14,999 | 307 | 4.1% |
| $15,000 to $24,999 | 711 | 9.5% |
| $25,000 to $34,999 | 509 | 6.8% |
| $35,000 to $49,999 | 741 | 9.9% |
| $50,000 to $74,999 | 1,653 | 22.1% |
| $75,000 to $99,999 | 913 | 12.2% |
| $100,000 to $149,999 | 1,219 | 16.3% |
| $150,000 to $199,999 | 628 | 8.4% |
| $200,000+ | 314 | 4.2% |
Household Income by Householder Age in Crawford County
The median household income in Crawford County is $64,163, with the highest median household income of $75,842 found in the 25 to 44 years age bracket for the primary householder. A total of 2,158 households (28.8%) fall into this category. Meanwhile, the 15 to 24 years age bracket for the primary householder has the lowest median household income of $26,169, with 379 households (5.1%) in this group.
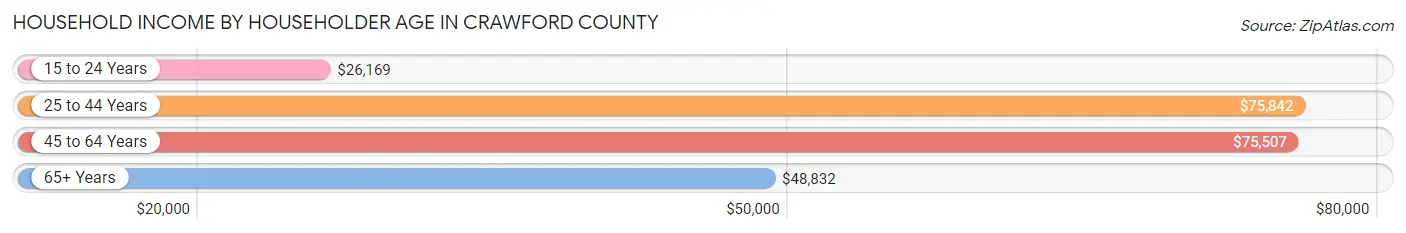
| Income Bracket | # Households | Median Income |
| 15 to 24 Years | 379 (5.1%) | $26,169 |
| 25 to 44 Years | 2,158 (28.8%) | $75,842 |
| 45 to 64 Years | 2,599 (34.7%) | $75,507 |
| 65+ Years | 2,345 (31.4%) | $48,832 |
| Total | 7,481 (100.0%) | $64,163 |
Poverty in Crawford County
Income Below Poverty by Sex and Age in Crawford County
With 9.3% poverty level for males and 9.9% for females among the residents of Crawford County, 18 to 24 year old males and 18 to 24 year old females are the most vulnerable to poverty, with 127 males (18.7%) and 151 females (26.0%) in their respective age groups living below the poverty level.
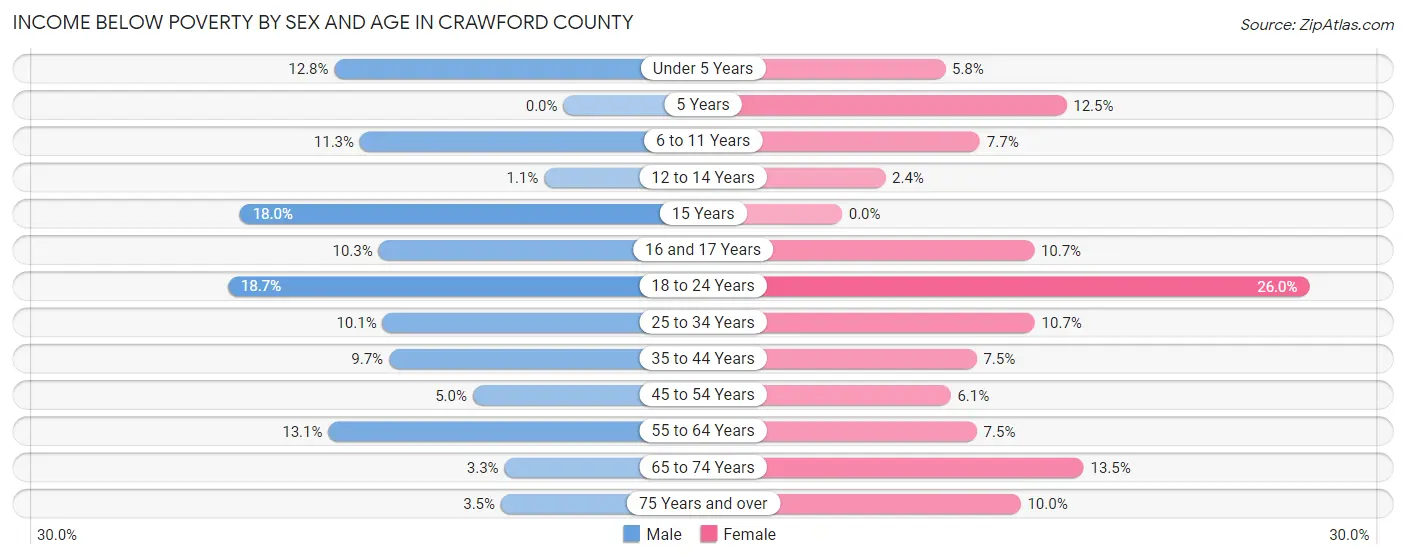
| Age Bracket | Male | Female |
| Under 5 Years | 63 (12.8%) | 26 (5.8%) |
| 5 Years | 0 (0.0%) | 15 (12.5%) |
| 6 to 11 Years | 80 (11.3%) | 52 (7.7%) |
| 12 to 14 Years | 3 (1.1%) | 4 (2.4%) |
| 15 Years | 20 (18.0%) | 0 (0.0%) |
| 16 and 17 Years | 21 (10.3%) | 29 (10.7%) |
| 18 to 24 Years | 127 (18.7%) | 151 (26.0%) |
| 25 to 34 Years | 109 (10.1%) | 108 (10.7%) |
| 35 to 44 Years | 97 (9.7%) | 74 (7.5%) |
| 45 to 54 Years | 54 (5.0%) | 63 (6.0%) |
| 55 to 64 Years | 163 (13.1%) | 97 (7.5%) |
| 65 to 74 Years | 32 (3.3%) | 145 (13.5%) |
| 75 Years and over | 20 (3.5%) | 79 (10.0%) |
| Total | 789 (9.3%) | 843 (9.9%) |
Income Above Poverty by Sex and Age in Crawford County
According to the poverty statistics in Crawford County, males aged 5 years and females aged 15 years are the age groups that are most secure financially, with 100.0% of males and 100.0% of females in these age groups living above the poverty line.
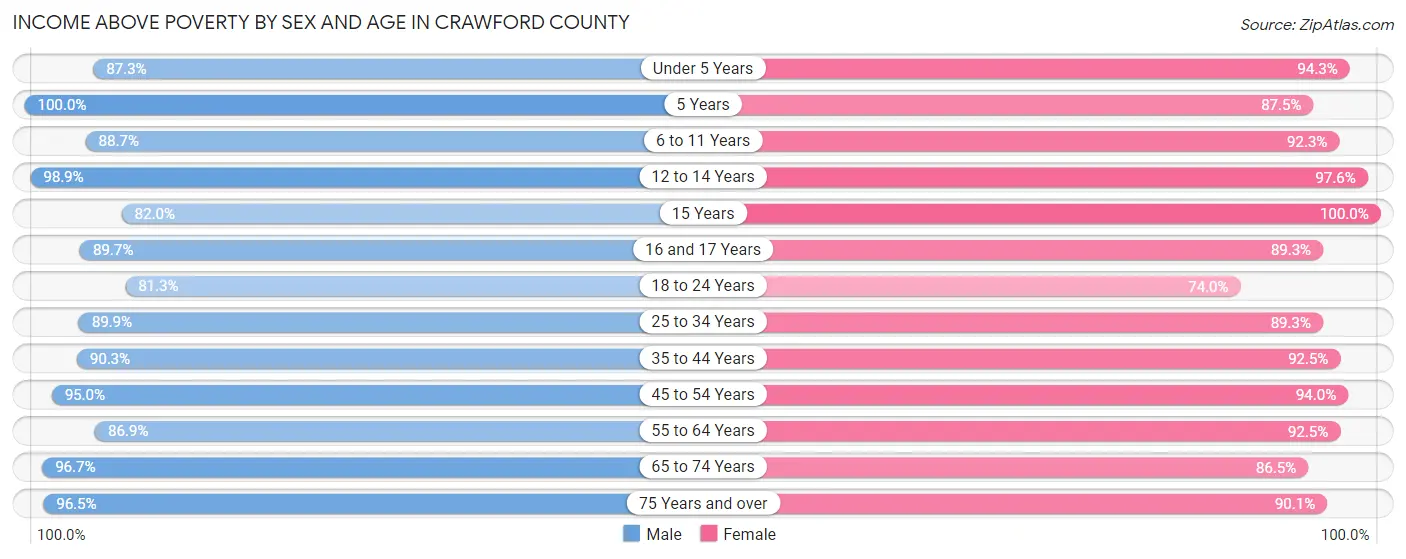
| Age Bracket | Male | Female |
| Under 5 Years | 431 (87.3%) | 426 (94.3%) |
| 5 Years | 65 (100.0%) | 105 (87.5%) |
| 6 to 11 Years | 626 (88.7%) | 624 (92.3%) |
| 12 to 14 Years | 278 (98.9%) | 162 (97.6%) |
| 15 Years | 91 (82.0%) | 54 (100.0%) |
| 16 and 17 Years | 183 (89.7%) | 242 (89.3%) |
| 18 to 24 Years | 553 (81.3%) | 429 (74.0%) |
| 25 to 34 Years | 973 (89.9%) | 898 (89.3%) |
| 35 to 44 Years | 902 (90.3%) | 913 (92.5%) |
| 45 to 54 Years | 1,018 (95.0%) | 979 (94.0%) |
| 55 to 64 Years | 1,082 (86.9%) | 1,194 (92.5%) |
| 65 to 74 Years | 943 (96.7%) | 932 (86.5%) |
| 75 Years and over | 555 (96.5%) | 715 (90.0%) |
| Total | 7,700 (90.7%) | 7,673 (90.1%) |
Income Below Poverty Among Married-Couple Families in Crawford County
The poverty statistics for married-couple families in Crawford County show that 3.2% or 125 of the total 3,974 families live below the poverty line. Families with 3 or 4 children have the highest poverty rate of 4.2%, comprising of 10 families. On the other hand, families with 5 or more children have the lowest poverty rate of 0.0%, which includes 0 families.
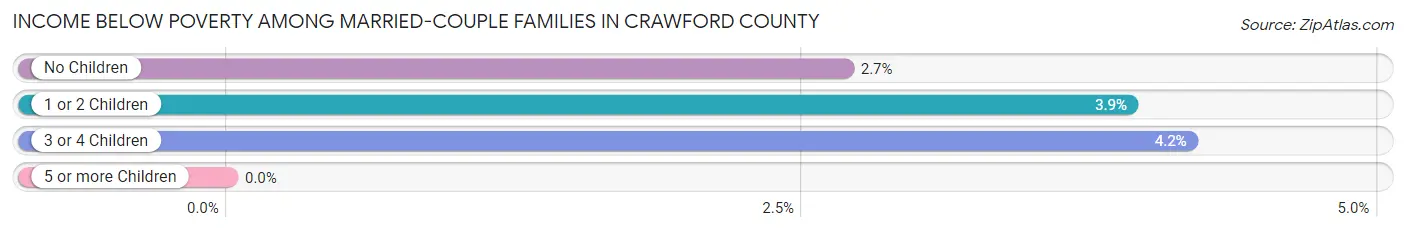
| Children | Above Poverty | Below Poverty |
| No Children | 2,360 (97.3%) | 65 (2.7%) |
| 1 or 2 Children | 1,225 (96.1%) | 50 (3.9%) |
| 3 or 4 Children | 229 (95.8%) | 10 (4.2%) |
| 5 or more Children | 35 (100.0%) | 0 (0.0%) |
| Total | 3,849 (96.9%) | 125 (3.2%) |
Income Below Poverty Among Single-Parent Households in Crawford County
According to the poverty data in Crawford County, 15.3% or 47 single-father households and 21.3% or 132 single-mother households are living below the poverty line. Among single-father households, those with 1 or 2 children have the highest poverty rate, with 45 households (18.3%) experiencing poverty. Likewise, among single-mother households, those with 3 or 4 children have the highest poverty rate, with 12 households (35.3%) falling below the poverty line.
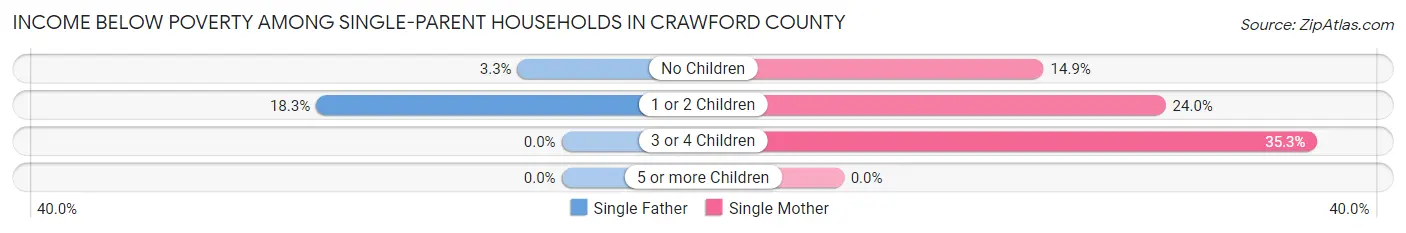
| Children | Single Father | Single Mother |
| No Children | 2 (3.3%) | 31 (14.9%) |
| 1 or 2 Children | 45 (18.3%) | 89 (24.0%) |
| 3 or 4 Children | 0 (0.0%) | 12 (35.3%) |
| 5 or more Children | 0 (0.0%) | 0 (0.0%) |
| Total | 47 (15.3%) | 132 (21.3%) |
Income Below Poverty Among Married-Couple vs Single-Parent Households in Crawford County
The poverty data for Crawford County shows that 125 of the married-couple family households (3.2%) and 179 of the single-parent households (19.3%) are living below the poverty level. Within the married-couple family households, those with 3 or 4 children have the highest poverty rate, with 10 households (4.2%) falling below the poverty line. Among the single-parent households, those with 3 or 4 children have the highest poverty rate, with 12 household (35.3%) living below poverty.
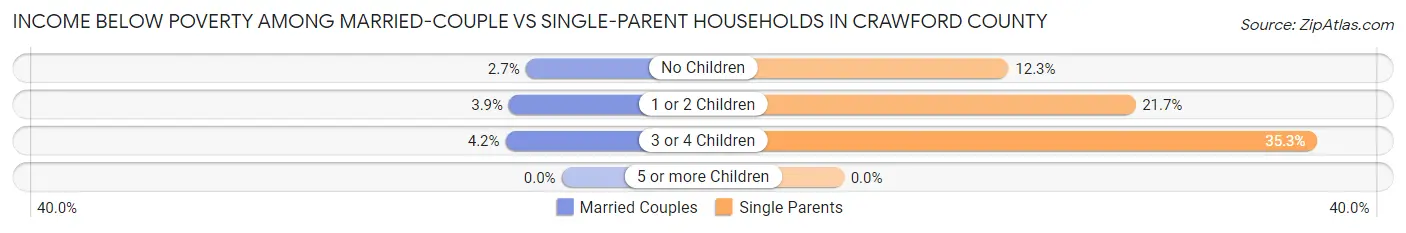
| Children | Married-Couple Families | Single-Parent Households |
| No Children | 65 (2.7%) | 33 (12.3%) |
| 1 or 2 Children | 50 (3.9%) | 134 (21.7%) |
| 3 or 4 Children | 10 (4.2%) | 12 (35.3%) |
| 5 or more Children | 0 (0.0%) | 0 (0.0%) |
| Total | 125 (3.2%) | 179 (19.3%) |
Race in Crawford County
The most populous races in Crawford County are White / Caucasian (17,245 | 92.1%), Black / African American (845 | 4.5%), and Hispanic or Latino (459 | 2.5%).
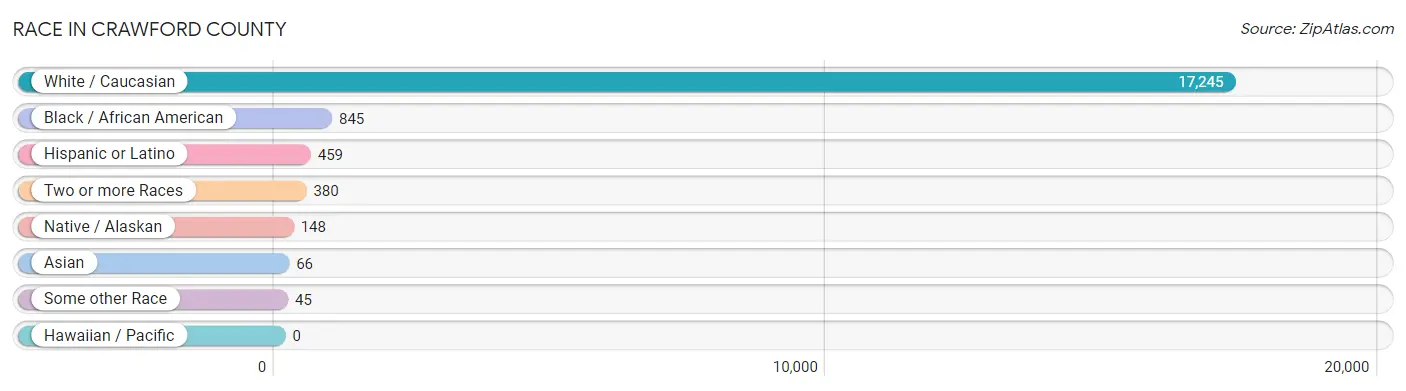
| Race | # Population | % Population |
| Asian | 66 | 0.4% |
| Black / African American | 845 | 4.5% |
| Hawaiian / Pacific | 0 | 0.0% |
| Hispanic or Latino | 459 | 2.5% |
| Native / Alaskan | 148 | 0.8% |
| White / Caucasian | 17,245 | 92.1% |
| Two or more Races | 380 | 2.0% |
| Some other Race | 45 | 0.2% |
| Total | 18,729 | 100.0% |
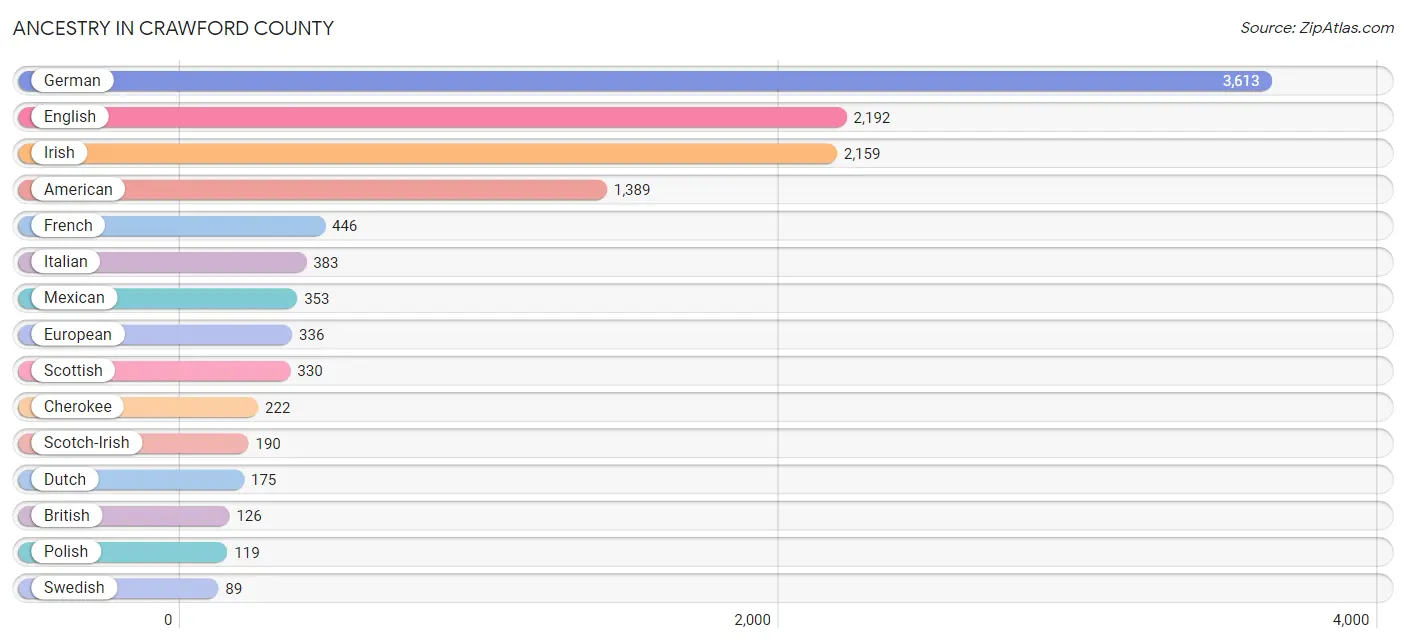
Ancestry in Crawford County
The most populous ancestries reported in Crawford County are German (3,613 | 19.3%), English (2,192 | 11.7%), Irish (2,159 | 11.5%), American (1,389 | 7.4%), and French (446 | 2.4%), together accounting for 52.3% of all Crawford County residents.
| Ancestry | # Population | % Population |
| African | 3 | 0.0% |
| American | 1,389 | 7.4% |
| Austrian | 16 | 0.1% |
| Belgian | 11 | 0.1% |
| Bhutanese | 2 | 0.0% |
| Blackfeet | 15 | 0.1% |
| Brazilian | 18 | 0.1% |
| British | 126 | 0.7% |
| Canadian | 15 | 0.1% |
| Central American | 7 | 0.0% |
| Cherokee | 222 | 1.2% |
| Chickasaw | 3 | 0.0% |
| Chilean | 1 | 0.0% |
| Chippewa | 1 | 0.0% |
| Colombian | 2 | 0.0% |
| Croatian | 30 | 0.2% |
| Czech | 87 | 0.5% |
| Czechoslovakian | 8 | 0.0% |
| Danish | 16 | 0.1% |
| Dutch | 175 | 0.9% |
| English | 2,192 | 11.7% |
| European | 336 | 1.8% |
| French | 446 | 2.4% |
| French Canadian | 17 | 0.1% |
| German | 3,613 | 19.3% |
| Greek | 14 | 0.1% |
| Guatemalan | 7 | 0.0% |
| Haitian | 1 | 0.0% |
| Hungarian | 18 | 0.1% |
| Indian (Asian) | 1 | 0.0% |
| Iranian | 4 | 0.0% |
| Irish | 2,159 | 11.5% |
| Italian | 383 | 2.0% |
| Korean | 73 | 0.4% |
| Lithuanian | 14 | 0.1% |
| Mexican | 353 | 1.9% |
| Nigerian | 3 | 0.0% |
| Northern European | 16 | 0.1% |
| Norwegian | 82 | 0.4% |
| Pennsylvania German | 53 | 0.3% |
| Polish | 119 | 0.6% |
| Puerto Rican | 57 | 0.3% |
| Romanian | 8 | 0.0% |
| Russian | 17 | 0.1% |
| Scandinavian | 58 | 0.3% |
| Scotch-Irish | 190 | 1.0% |
| Scottish | 330 | 1.8% |
| Slovak | 26 | 0.1% |
| South American | 3 | 0.0% |
| Spaniard | 8 | 0.0% |
| Spanish | 21 | 0.1% |
| Sri Lankan | 4 | 0.0% |
| Subsaharan African | 6 | 0.0% |
| Swedish | 89 | 0.5% |
| Swiss | 62 | 0.3% |
| Thai | 58 | 0.3% |
| Turkish | 5 | 0.0% |
| Ukrainian | 12 | 0.1% |
| Welsh | 85 | 0.4% | View All 59 Rows |
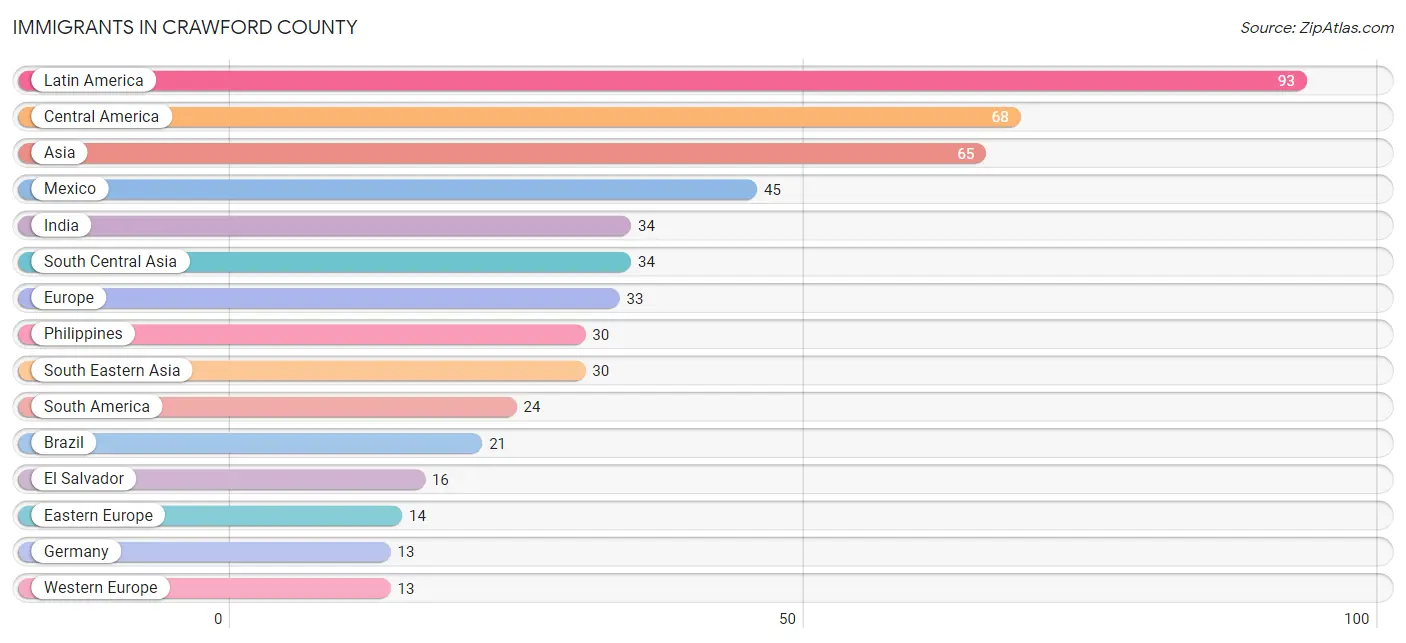
Immigrants in Crawford County
The most numerous immigrant groups reported in Crawford County came from Latin America (93 | 0.5%), Central America (68 | 0.4%), Asia (65 | 0.4%), Mexico (45 | 0.2%), and India (34 | 0.2%), together accounting for 1.6% of all Crawford County residents.
| Immigration Origin | # Population | % Population |
| Asia | 65 | 0.4% |
| Australia | 6 | 0.0% |
| Brazil | 21 | 0.1% |
| Caribbean | 1 | 0.0% |
| Central America | 68 | 0.4% |
| Chile | 1 | 0.0% |
| China | 1 | 0.0% |
| Colombia | 2 | 0.0% |
| Eastern Asia | 1 | 0.0% |
| Eastern Europe | 14 | 0.1% |
| El Salvador | 16 | 0.1% |
| Europe | 33 | 0.2% |
| Germany | 13 | 0.1% |
| Greece | 6 | 0.0% |
| Guatemala | 7 | 0.0% |
| Haiti | 1 | 0.0% |
| Hungary | 2 | 0.0% |
| India | 34 | 0.2% |
| Latin America | 93 | 0.5% |
| Mexico | 45 | 0.2% |
| Oceania | 6 | 0.0% |
| Philippines | 30 | 0.2% |
| Romania | 8 | 0.0% |
| Russia | 4 | 0.0% |
| South America | 24 | 0.1% |
| South Central Asia | 34 | 0.2% |
| South Eastern Asia | 30 | 0.2% |
| Southern Europe | 6 | 0.0% |
| Western Europe | 13 | 0.1% | View All 29 Rows |
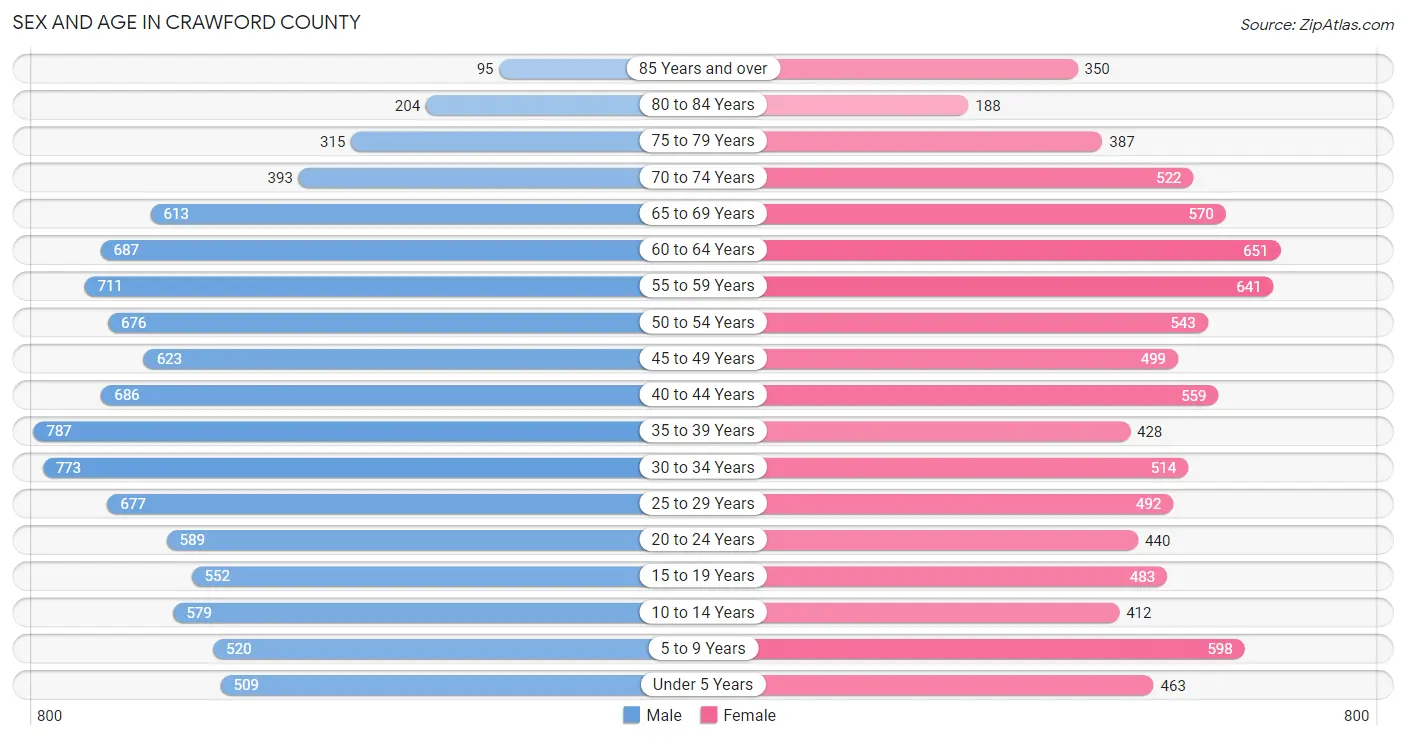
Sex and Age in Crawford County
Sex and Age in Crawford County
The most populous age groups in Crawford County are 35 to 39 Years (787 | 7.9%) for men and 60 to 64 Years (651 | 7.4%) for women.
| Age Bracket | Male | Female |
| Under 5 Years | 509 (5.1%) | 463 (5.3%) |
| 5 to 9 Years | 520 (5.2%) | 598 (6.8%) |
| 10 to 14 Years | 579 (5.8%) | 412 (4.7%) |
| 15 to 19 Years | 552 (5.5%) | 483 (5.5%) |
| 20 to 24 Years | 589 (5.9%) | 440 (5.0%) |
| 25 to 29 Years | 677 (6.8%) | 492 (5.6%) |
| 30 to 34 Years | 773 (7.7%) | 514 (5.9%) |
| 35 to 39 Years | 787 (7.9%) | 428 (4.9%) |
| 40 to 44 Years | 686 (6.9%) | 559 (6.4%) |
| 45 to 49 Years | 623 (6.2%) | 499 (5.7%) |
| 50 to 54 Years | 676 (6.8%) | 543 (6.2%) |
| 55 to 59 Years | 711 (7.1%) | 641 (7.3%) |
| 60 to 64 Years | 687 (6.9%) | 651 (7.4%) |
| 65 to 69 Years | 613 (6.1%) | 570 (6.5%) |
| 70 to 74 Years | 393 (3.9%) | 522 (6.0%) |
| 75 to 79 Years | 315 (3.2%) | 387 (4.4%) |
| 80 to 84 Years | 204 (2.0%) | 188 (2.1%) |
| 85 Years and over | 95 (0.9%) | 350 (4.0%) |
| Total | 9,989 (100.0%) | 8,740 (100.0%) |
Families and Households in Crawford County
Median Family Size in Crawford County
The median family size in Crawford County is 2.81 persons per family, with married-couple families (3,974 | 81.1%) accounting for the largest median family size of 2.92 persons per family. On the other hand, single male/father families (307 | 6.3%) represent the smallest median family size with 2.12 persons per family.

| Family Type | # Families | Family Size |
| Married-Couple | 3,974 (81.1%) | 2.92 |
| Single Male/Father | 307 (6.3%) | 2.12 |
| Single Female/Mother | 621 (12.7%) | 2.46 |
| Total Families | 4,902 (100.0%) | 2.81 |
Median Household Size in Crawford County
The median household size in Crawford County is 2.28 persons per household, with married-couple households (3,974 | 53.1%) accounting for the largest median household size of 2.94 persons per household. non-family households (2,579 | 34.5%) represent the smallest median household size with 1.14 persons per household.

| Household Type | # Households | Household Size |
| Married-Couple | 3,974 (53.1%) | 2.94 |
| Single Male/Father | 307 (4.1%) | 2.45 |
| Single Female/Mother | 621 (8.3%) | 2.73 |
| Non-family | 2,579 (34.5%) | 1.14 |
| Total Households | 7,481 (100.0%) | 2.28 |
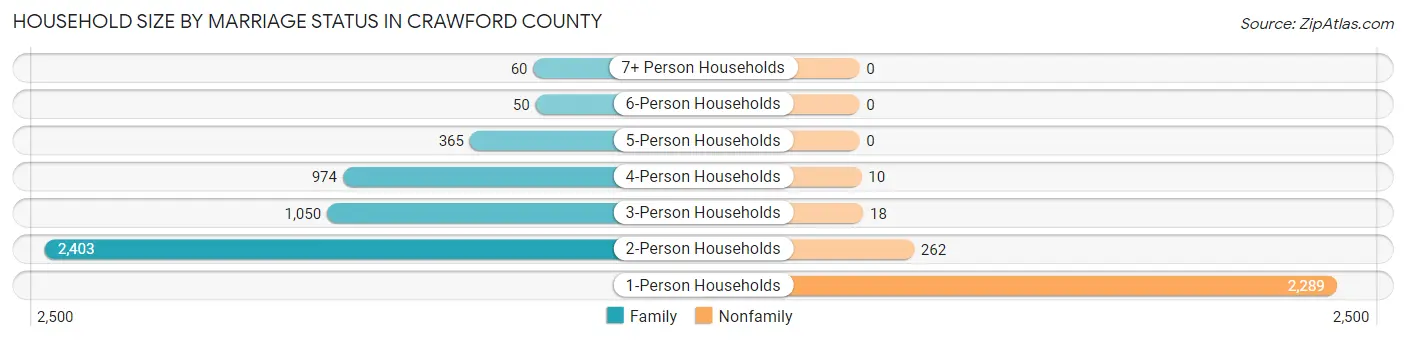
Household Size by Marriage Status in Crawford County
Out of a total of 7,481 households in Crawford County, 4,902 (65.5%) are family households, while 2,579 (34.5%) are nonfamily households. The most numerous type of family households are 2-person households, comprising 2,403, and the most common type of nonfamily households are 1-person households, comprising 2,289.
| Household Size | Family Households | Nonfamily Households |
| 1-Person Households | - | 2,289 (30.6%) |
| 2-Person Households | 2,403 (32.1%) | 262 (3.5%) |
| 3-Person Households | 1,050 (14.0%) | 18 (0.2%) |
| 4-Person Households | 974 (13.0%) | 10 (0.1%) |
| 5-Person Households | 365 (4.9%) | 0 (0.0%) |
| 6-Person Households | 50 (0.7%) | 0 (0.0%) |
| 7+ Person Households | 60 (0.8%) | 0 (0.0%) |
| Total | 4,902 (65.5%) | 2,579 (34.5%) |
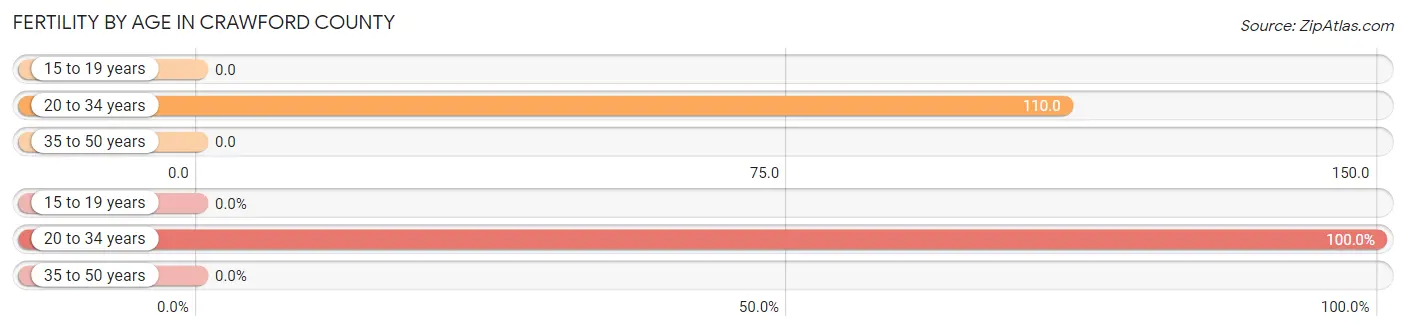
Female Fertility in Crawford County
Fertility by Age in Crawford County
Average fertility rate in Crawford County is 44.0 births per 1,000 women. Women in the age bracket of 20 to 34 years have the highest fertility rate with 110.0 births per 1,000 women. Women in the age bracket of 20 to 34 years acount for 100.0% of all women with births.
| Age Bracket | Women with Births | Births / 1,000 Women |
| 15 to 19 years | 0 (0.0%) | 0.0 |
| 20 to 34 years | 159 (100.0%) | 110.0 |
| 35 to 50 years | 0 (0.0%) | 0.0 |
| Total | 159 (100.0%) | 44.0 |
Fertility by Age by Marriage Status in Crawford County
76.7% of women with births (159) in Crawford County are married. The highest percentage of unmarried women with births falls into 20 to 34 years age bracket with 23.3% of them unmarried at the time of birth, while the lowest percentage of unmarried women with births belong to 20 to 34 years age bracket with 23.3% of them unmarried.
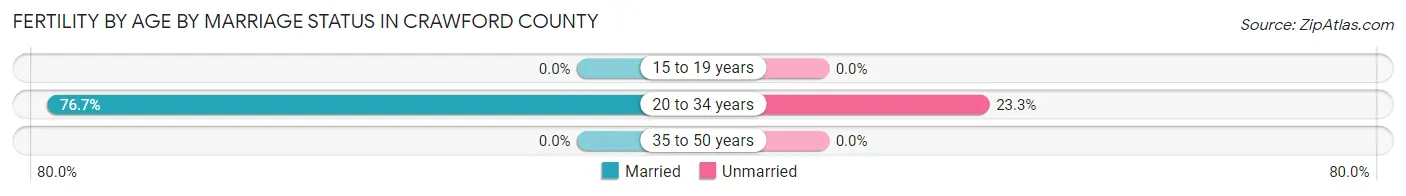
| Age Bracket | Married | Unmarried |
| 15 to 19 years | 0 (0.0%) | 0 (0.0%) |
| 20 to 34 years | 122 (76.7%) | 37 (23.3%) |
| 35 to 50 years | 0 (0.0%) | 0 (0.0%) |
| Total | 122 (76.7%) | 37 (23.3%) |
Fertility by Education in Crawford County
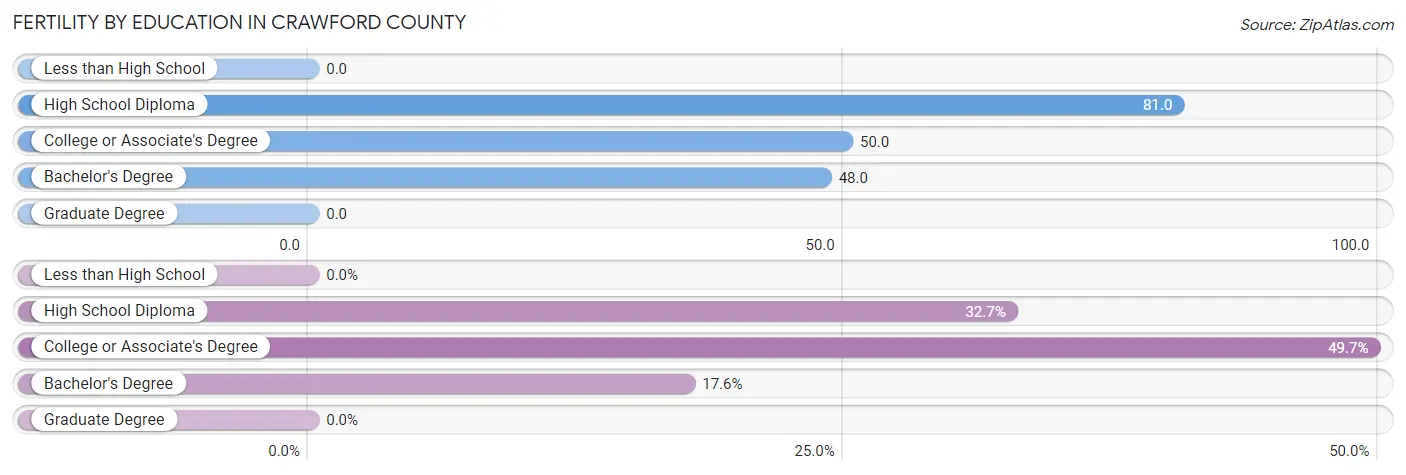
| Educational Attainment | Women with Births | Births / 1,000 Women |
| Less than High School | 0 (0.0%) | 0.0 |
| High School Diploma | 52 (32.7%) | 81.0 |
| College or Associate's Degree | 79 (49.7%) | 50.0 |
| Bachelor's Degree | 28 (17.6%) | 48.0 |
| Graduate Degree | 0 (0.0%) | 0.0 |
| Total | 159 (100.0%) | 44.0 |
Fertility by Education by Marriage Status in Crawford County
23.3% of women with births in Crawford County are unmarried. Women with the educational attainment of bachelor's degree are most likely to be married with 100.0% of them married at childbirth, while women with the educational attainment of high school diploma are least likely to be married with 44.2% of them unmarried at childbirth.
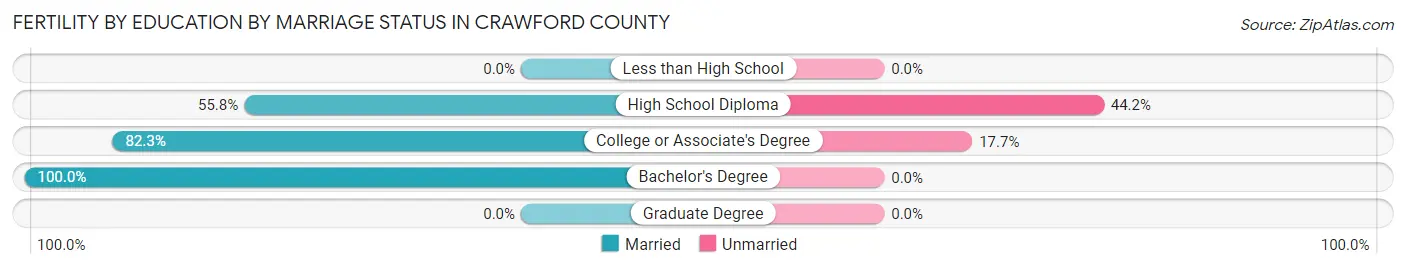
| Educational Attainment | Married | Unmarried |
| Less than High School | 0 (0.0%) | 0 (0.0%) |
| High School Diploma | 29 (55.8%) | 23 (44.2%) |
| College or Associate's Degree | 65 (82.3%) | 14 (17.7%) |
| Bachelor's Degree | 28 (100.0%) | 0 (0.0%) |
| Graduate Degree | 0 (0.0%) | 0 (0.0%) |
| Total | 122 (76.7%) | 37 (23.3%) |
Employment Characteristics in Crawford County
Employment by Class of Employer in Crawford County
Among the 8,191 employed individuals in Crawford County, private company employees (5,331 | 65.1%), not-for-profit organizations (805 | 9.8%), and local government employees (695 | 8.5%) make up the most common classes of employment.
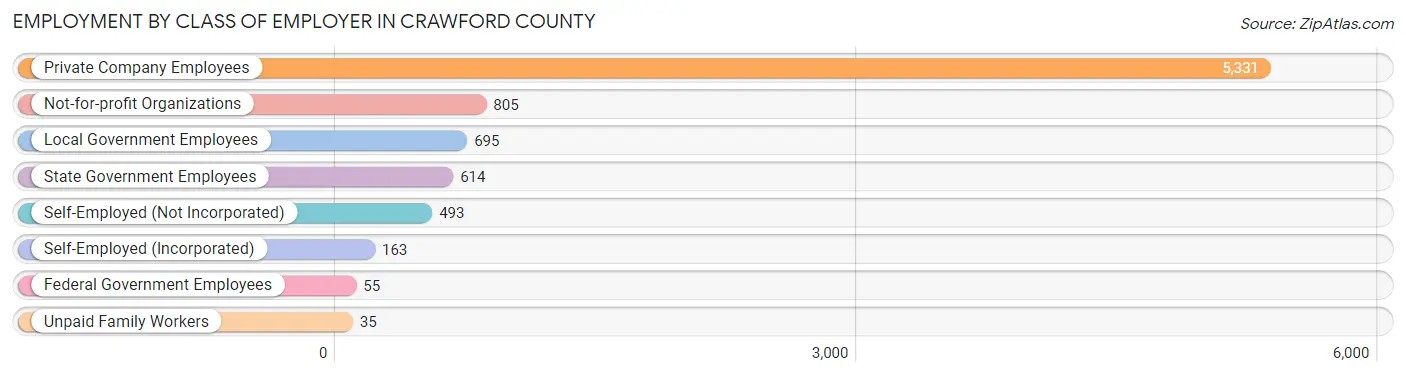
| Employer Class | # Employees | % Employees |
| Private Company Employees | 5,331 | 65.1% |
| Self-Employed (Incorporated) | 163 | 2.0% |
| Self-Employed (Not Incorporated) | 493 | 6.0% |
| Not-for-profit Organizations | 805 | 9.8% |
| Local Government Employees | 695 | 8.5% |
| State Government Employees | 614 | 7.5% |
| Federal Government Employees | 55 | 0.7% |
| Unpaid Family Workers | 35 | 0.4% |
| Total | 8,191 | 100.0% |
Employment Status by Age in Crawford County
According to the labor force statistics for Crawford County, out of the total population over 16 years of age (15,473), 55.4% or 8,572 individuals are in the labor force, with 3.3% or 283 of them unemployed. The age group with the highest labor force participation rate is 45 to 54 years, with 80.8% or 1,892 individuals in the labor force. Within the labor force, the 20 to 24 years age range has the highest percentage of unemployed individuals, with 9.7% or 68 of them being unemployed.
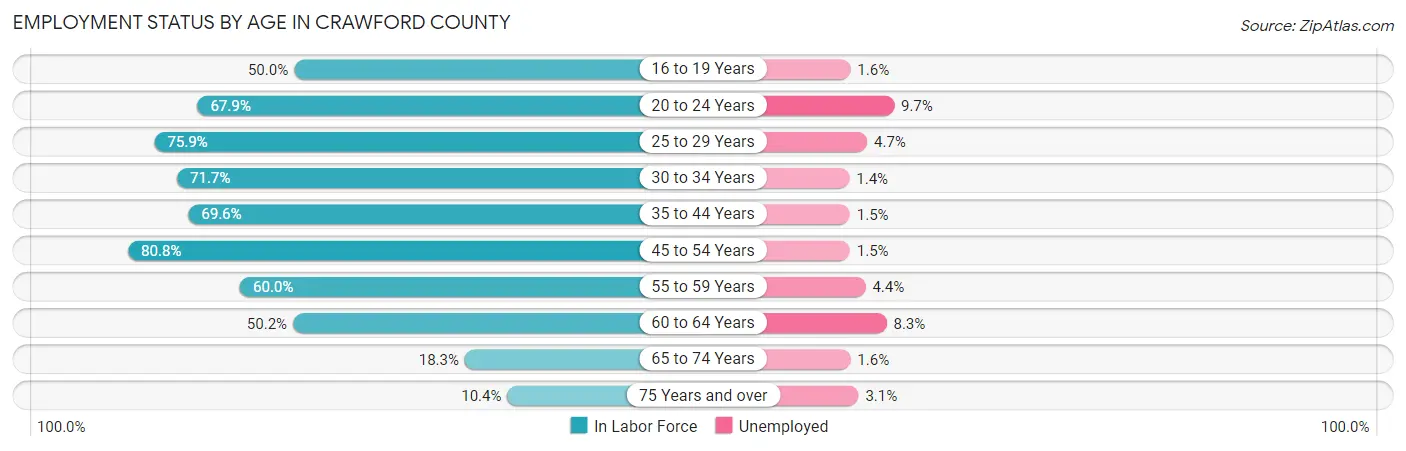
| Age Bracket | In Labor Force | Unemployed |
| 16 to 19 Years | 430 (50.0%) | 7 (1.6%) |
| 20 to 24 Years | 699 (67.9%) | 68 (9.7%) |
| 25 to 29 Years | 887 (75.9%) | 42 (4.7%) |
| 30 to 34 Years | 923 (71.7%) | 13 (1.4%) |
| 35 to 44 Years | 1,712 (69.6%) | 26 (1.5%) |
| 45 to 54 Years | 1,892 (80.8%) | 28 (1.5%) |
| 55 to 59 Years | 811 (60.0%) | 36 (4.4%) |
| 60 to 64 Years | 672 (50.2%) | 56 (8.3%) |
| 65 to 74 Years | 384 (18.3%) | 6 (1.6%) |
| 75 Years and over | 160 (10.4%) | 5 (3.1%) |
| Total | 8,572 (55.4%) | 283 (3.3%) |
Employment Status by Educational Attainment in Crawford County
According to labor force statistics for Crawford County, 69.3% of individuals (6,893) out of the total population between 25 and 64 years of age (9,947) are in the labor force, with 2.9% or 200 of them being unemployed. The group with the highest labor force participation rate are those with the educational attainment of bachelor's degree or higher, with 91.9% or 1,643 individuals in the labor force. Within the labor force, individuals with less than high school education have the highest percentage of unemployment, with 16.0% or 62 of them being unemployed.
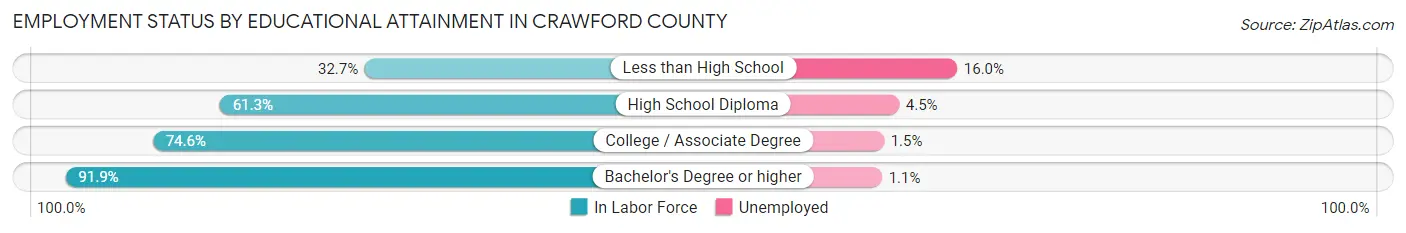
| Educational Attainment | In Labor Force | Unemployed |
| Less than High School | 387 (32.7%) | 189 (16.0%) |
| High School Diploma | 1,567 (61.3%) | 115 (4.5%) |
| College / Associate Degree | 3,298 (74.6%) | 66 (1.5%) |
| Bachelor's Degree or higher | 1,643 (91.9%) | 20 (1.1%) |
| Total | 6,893 (69.3%) | 288 (2.9%) |
Employment Occupations by Sex in Crawford County
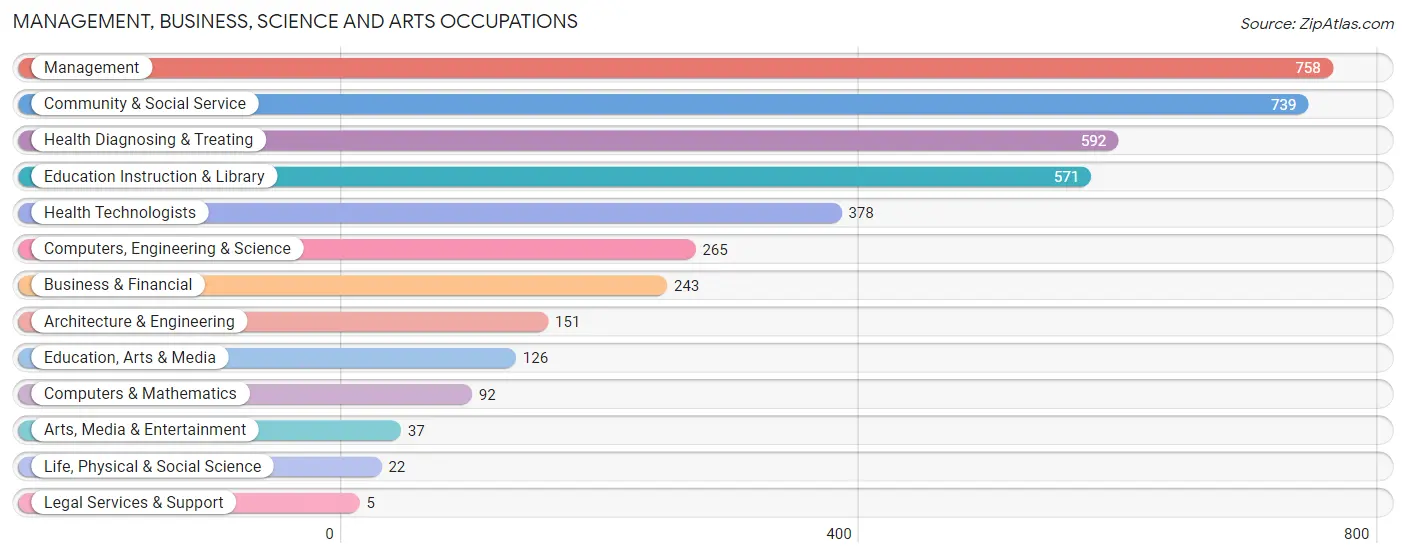
Management, Business, Science and Arts Occupations
The most common Management, Business, Science and Arts occupations in Crawford County are Management (758 | 9.1%), Community & Social Service (739 | 8.9%), Health Diagnosing & Treating (592 | 7.1%), Education Instruction & Library (571 | 6.9%), and Health Technologists (378 | 4.6%).
Management, Business, Science and Arts Occupations by Sex
Within the Management, Business, Science and Arts occupations in Crawford County, the most male-oriented occupations are Legal Services & Support (100.0%), Education, Arts & Media (63.5%), and Management (62.4%), while the most female-oriented occupations are Health Diagnosing & Treating (84.8%), Health Technologists (83.3%), and Business & Financial (70.4%).
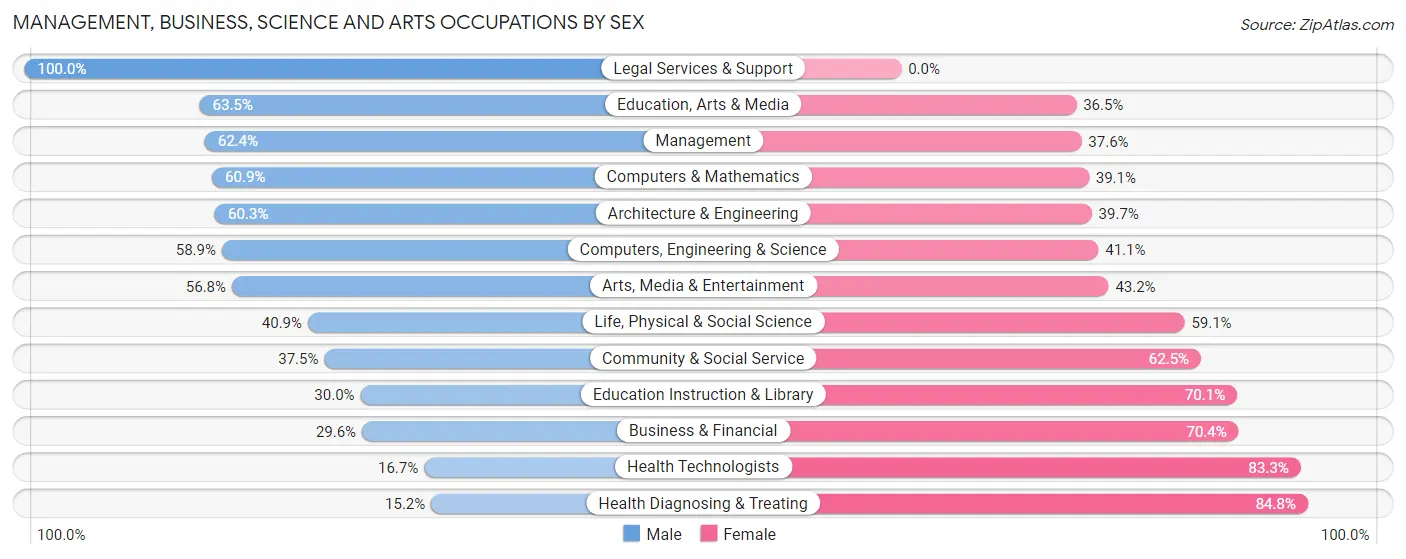
| Occupation | Male | Female |
| Management | 473 (62.4%) | 285 (37.6%) |
| Business & Financial | 72 (29.6%) | 171 (70.4%) |
| Computers, Engineering & Science | 156 (58.9%) | 109 (41.1%) |
| Computers & Mathematics | 56 (60.9%) | 36 (39.1%) |
| Architecture & Engineering | 91 (60.3%) | 60 (39.7%) |
| Life, Physical & Social Science | 9 (40.9%) | 13 (59.1%) |
| Community & Social Service | 277 (37.5%) | 462 (62.5%) |
| Education, Arts & Media | 80 (63.5%) | 46 (36.5%) |
| Legal Services & Support | 5 (100.0%) | 0 (0.0%) |
| Education Instruction & Library | 171 (29.9%) | 400 (70.1%) |
| Arts, Media & Entertainment | 21 (56.8%) | 16 (43.2%) |
| Health Diagnosing & Treating | 90 (15.2%) | 502 (84.8%) |
| Health Technologists | 63 (16.7%) | 315 (83.3%) |
| Total (Category) | 1,068 (41.1%) | 1,529 (58.9%) |
| Total (Overall) | 4,267 (51.5%) | 4,014 (48.5%) |
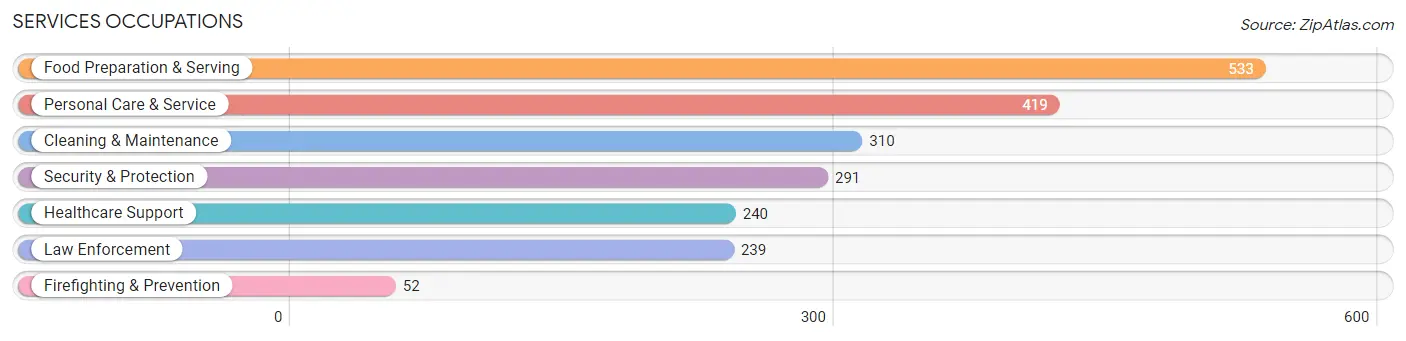
Services Occupations
The most common Services occupations in Crawford County are Food Preparation & Serving (533 | 6.4%), Personal Care & Service (419 | 5.1%), Cleaning & Maintenance (310 | 3.7%), Security & Protection (291 | 3.5%), and Healthcare Support (240 | 2.9%).
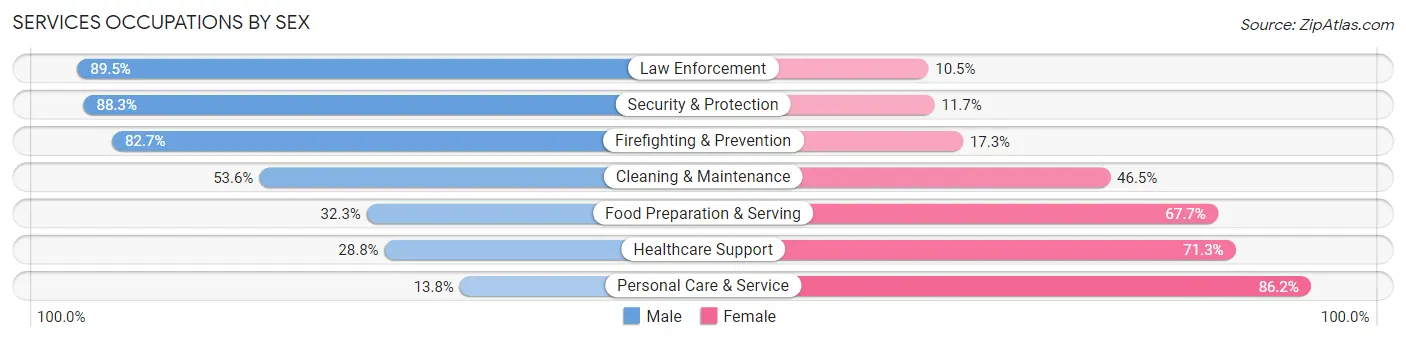
Services Occupations by Sex
Within the Services occupations in Crawford County, the most male-oriented occupations are Law Enforcement (89.5%), Security & Protection (88.3%), and Firefighting & Prevention (82.7%), while the most female-oriented occupations are Personal Care & Service (86.2%), Healthcare Support (71.3%), and Food Preparation & Serving (67.7%).
| Occupation | Male | Female |
| Healthcare Support | 69 (28.7%) | 171 (71.3%) |
| Security & Protection | 257 (88.3%) | 34 (11.7%) |
| Firefighting & Prevention | 43 (82.7%) | 9 (17.3%) |
| Law Enforcement | 214 (89.5%) | 25 (10.5%) |
| Food Preparation & Serving | 172 (32.3%) | 361 (67.7%) |
| Cleaning & Maintenance | 166 (53.5%) | 144 (46.5%) |
| Personal Care & Service | 58 (13.8%) | 361 (86.2%) |
| Total (Category) | 722 (40.3%) | 1,071 (59.7%) |
| Total (Overall) | 4,267 (51.5%) | 4,014 (48.5%) |
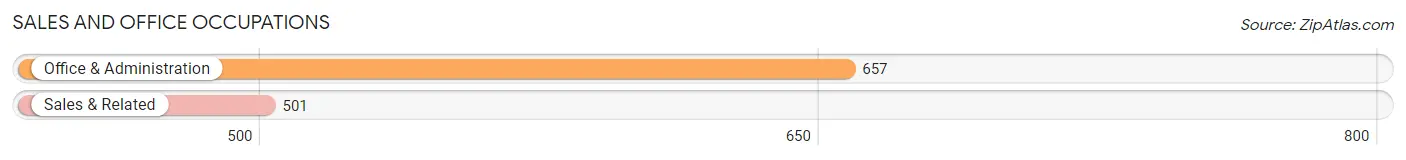
Sales and Office Occupations
The most common Sales and Office occupations in Crawford County are Office & Administration (657 | 7.9%), and Sales & Related (501 | 6.0%).
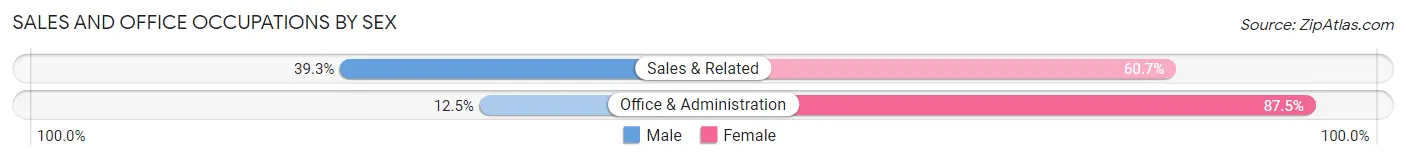
Sales and Office Occupations by Sex
| Occupation | Male | Female |
| Sales & Related | 197 (39.3%) | 304 (60.7%) |
| Office & Administration | 82 (12.5%) | 575 (87.5%) |
| Total (Category) | 279 (24.1%) | 879 (75.9%) |
| Total (Overall) | 4,267 (51.5%) | 4,014 (48.5%) |
Natural Resources, Construction and Maintenance Occupations
The most common Natural Resources, Construction and Maintenance occupations in Crawford County are Construction & Extraction (509 | 6.1%), Installation, Maintenance & Repair (270 | 3.3%), and Farming, Fishing & Forestry (75 | 0.9%).
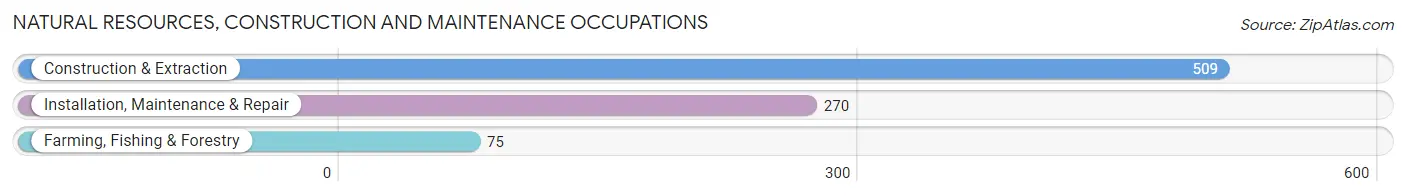
Natural Resources, Construction and Maintenance Occupations by Sex
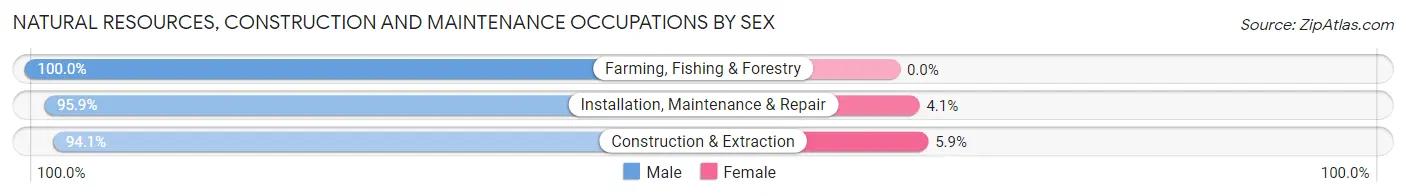
| Occupation | Male | Female |
| Farming, Fishing & Forestry | 75 (100.0%) | 0 (0.0%) |
| Construction & Extraction | 479 (94.1%) | 30 (5.9%) |
| Installation, Maintenance & Repair | 259 (95.9%) | 11 (4.1%) |
| Total (Category) | 813 (95.2%) | 41 (4.8%) |
| Total (Overall) | 4,267 (51.5%) | 4,014 (48.5%) |
Production, Transportation and Moving Occupations
The most common Production, Transportation and Moving occupations in Crawford County are Production (1,206 | 14.6%), Material Moving (457 | 5.5%), and Transportation (216 | 2.6%).
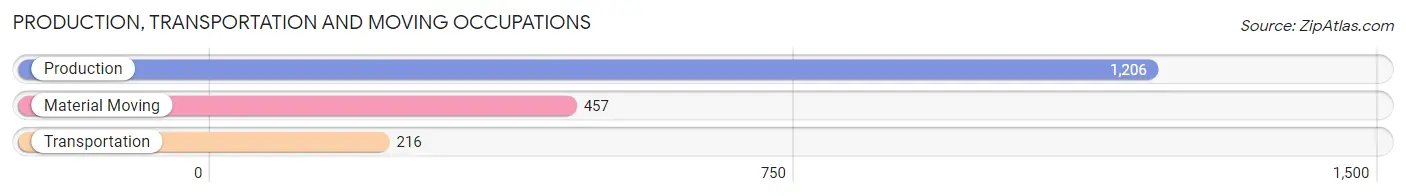
Production, Transportation and Moving Occupations by Sex
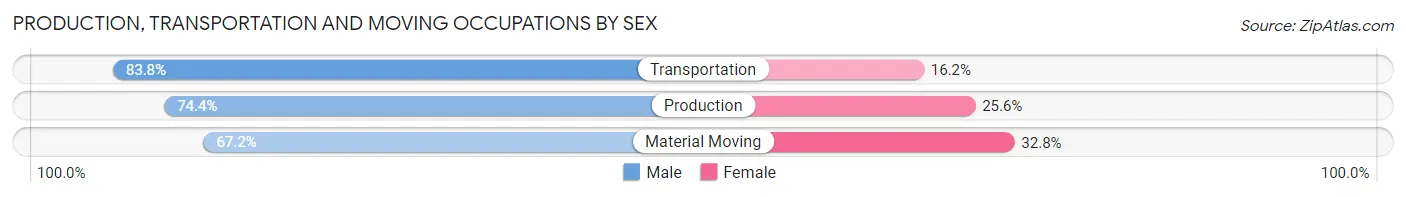
| Occupation | Male | Female |
| Production | 897 (74.4%) | 309 (25.6%) |
| Transportation | 181 (83.8%) | 35 (16.2%) |
| Material Moving | 307 (67.2%) | 150 (32.8%) |
| Total (Category) | 1,385 (73.7%) | 494 (26.3%) |
| Total (Overall) | 4,267 (51.5%) | 4,014 (48.5%) |
Employment Industries by Sex in Crawford County
Employment Industries in Crawford County
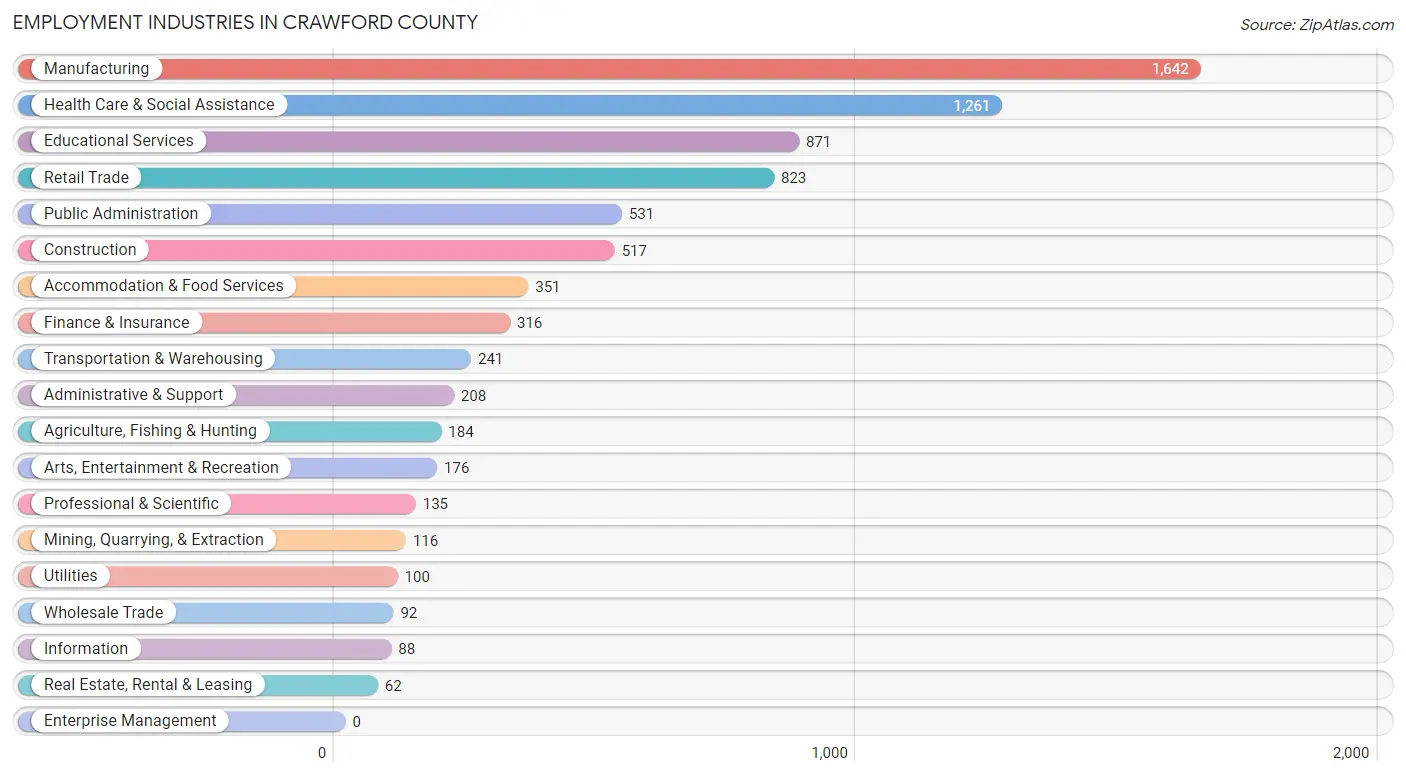
The major employment industries in Crawford County include Manufacturing (1,642 | 19.8%), Health Care & Social Assistance (1,261 | 15.2%), Educational Services (871 | 10.5%), Retail Trade (823 | 9.9%), and Public Administration (531 | 6.4%).
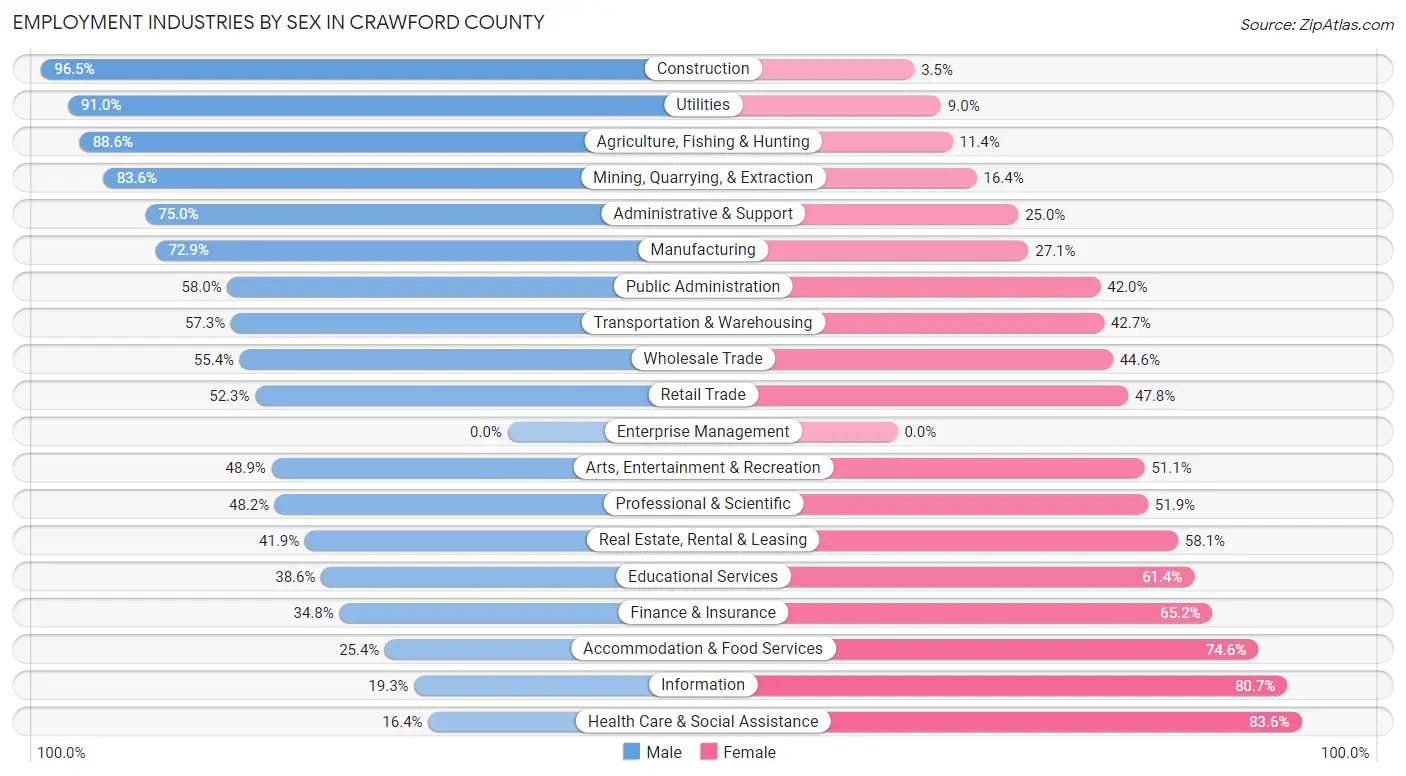
Employment Industries by Sex in Crawford County
The Crawford County industries that see more men than women are Construction (96.5%), Utilities (91.0%), and Agriculture, Fishing & Hunting (88.6%), whereas the industries that tend to have a higher number of women are Health Care & Social Assistance (83.6%), Information (80.7%), and Accommodation & Food Services (74.6%).
| Industry | Male | Female |
| Agriculture, Fishing & Hunting | 163 (88.6%) | 21 (11.4%) |
| Mining, Quarrying, & Extraction | 97 (83.6%) | 19 (16.4%) |
| Construction | 499 (96.5%) | 18 (3.5%) |
| Manufacturing | 1,197 (72.9%) | 445 (27.1%) |
| Wholesale Trade | 51 (55.4%) | 41 (44.6%) |
| Retail Trade | 430 (52.2%) | 393 (47.7%) |
| Transportation & Warehousing | 138 (57.3%) | 103 (42.7%) |
| Utilities | 91 (91.0%) | 9 (9.0%) |
| Information | 17 (19.3%) | 71 (80.7%) |
| Finance & Insurance | 110 (34.8%) | 206 (65.2%) |
| Real Estate, Rental & Leasing | 26 (41.9%) | 36 (58.1%) |
| Professional & Scientific | 65 (48.1%) | 70 (51.8%) |
| Enterprise Management | 0 (0.0%) | 0 (0.0%) |
| Administrative & Support | 156 (75.0%) | 52 (25.0%) |
| Educational Services | 336 (38.6%) | 535 (61.4%) |
| Health Care & Social Assistance | 207 (16.4%) | 1,054 (83.6%) |
| Arts, Entertainment & Recreation | 86 (48.9%) | 90 (51.1%) |
| Accommodation & Food Services | 89 (25.4%) | 262 (74.6%) |
| Public Administration | 308 (58.0%) | 223 (42.0%) |
| Total | 4,267 (51.5%) | 4,014 (48.5%) |
Education in Crawford County
School Enrollment in Crawford County
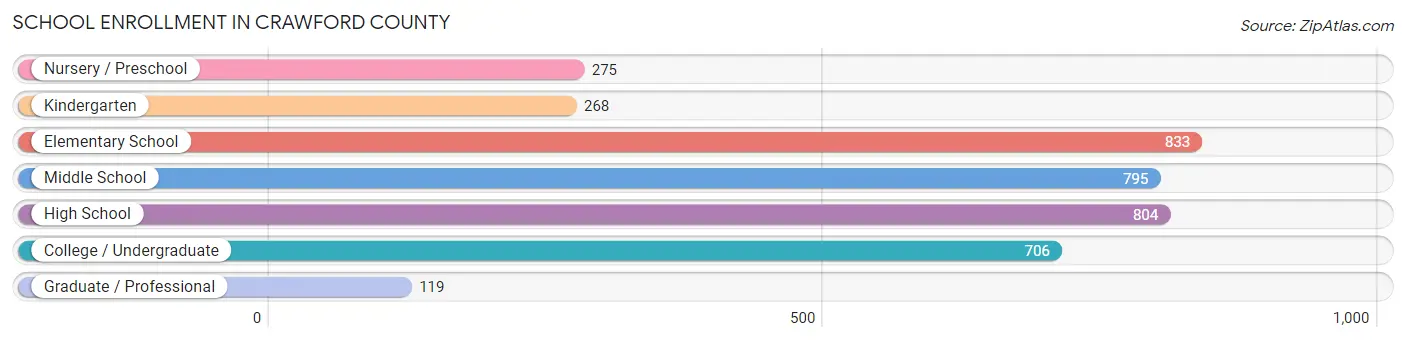
The most common levels of schooling among the 3,800 students in Crawford County are elementary school (833 | 21.9%), high school (804 | 21.2%), and middle school (795 | 20.9%).
| School Level | # Students | % Students |
| Nursery / Preschool | 275 | 7.2% |
| Kindergarten | 268 | 7.0% |
| Elementary School | 833 | 21.9% |
| Middle School | 795 | 20.9% |
| High School | 804 | 21.2% |
| College / Undergraduate | 706 | 18.6% |
| Graduate / Professional | 119 | 3.1% |
| Total | 3,800 | 100.0% |
School Enrollment by Age by Funding Source in Crawford County
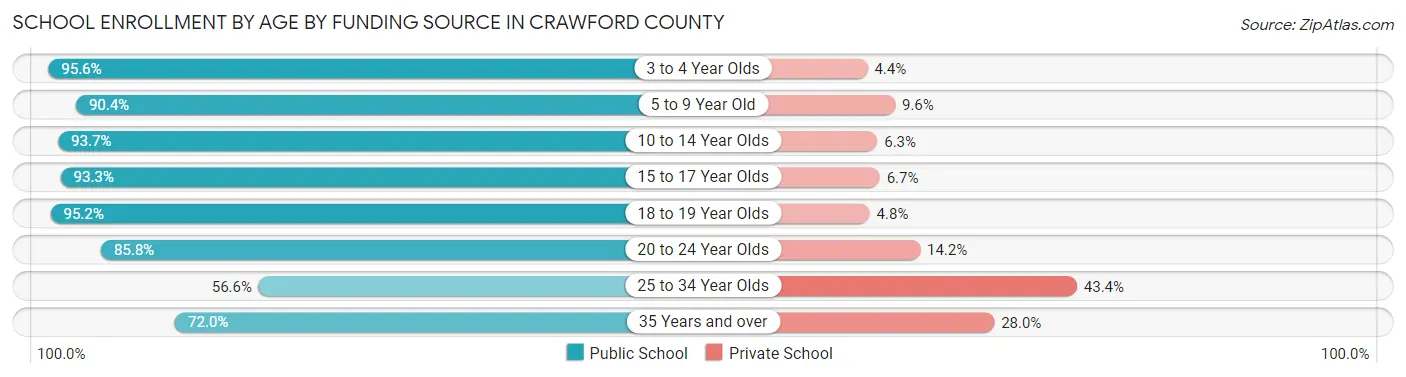
Out of a total of 3,800 students who are enrolled in schools in Crawford County, 399 (10.5%) attend a private institution, while the remaining 3,401 (89.5%) are enrolled in public schools. The age group of 25 to 34 year olds has the highest likelihood of being enrolled in private schools, with 53 (43.4% in the age bracket) enrolled. Conversely, the age group of 3 to 4 year olds has the lowest likelihood of being enrolled in a private school, with 194 (95.6% in the age bracket) attending a public institution.
| Age Bracket | Public School | Private School |
| 3 to 4 Year Olds | 194 (95.6%) | 9 (4.4%) |
| 5 to 9 Year Old | 973 (90.4%) | 103 (9.6%) |
| 10 to 14 Year Olds | 884 (93.7%) | 59 (6.3%) |
| 15 to 17 Year Olds | 570 (93.3%) | 41 (6.7%) |
| 18 to 19 Year Olds | 275 (95.2%) | 14 (4.8%) |
| 20 to 24 Year Olds | 223 (85.8%) | 37 (14.2%) |
| 25 to 34 Year Olds | 69 (56.6%) | 53 (43.4%) |
| 35 Years and over | 213 (72.0%) | 83 (28.0%) |
| Total | 3,401 (89.5%) | 399 (10.5%) |
Educational Attainment by Field of Study in Crawford County
Education (763 | 28.0%), science & technology (334 | 12.2%), business (251 | 9.2%), social sciences (227 | 8.3%), and arts & humanities (191 | 7.0%) are the most common fields of study among 2,729 individuals in Crawford County who have obtained a bachelor's degree or higher.
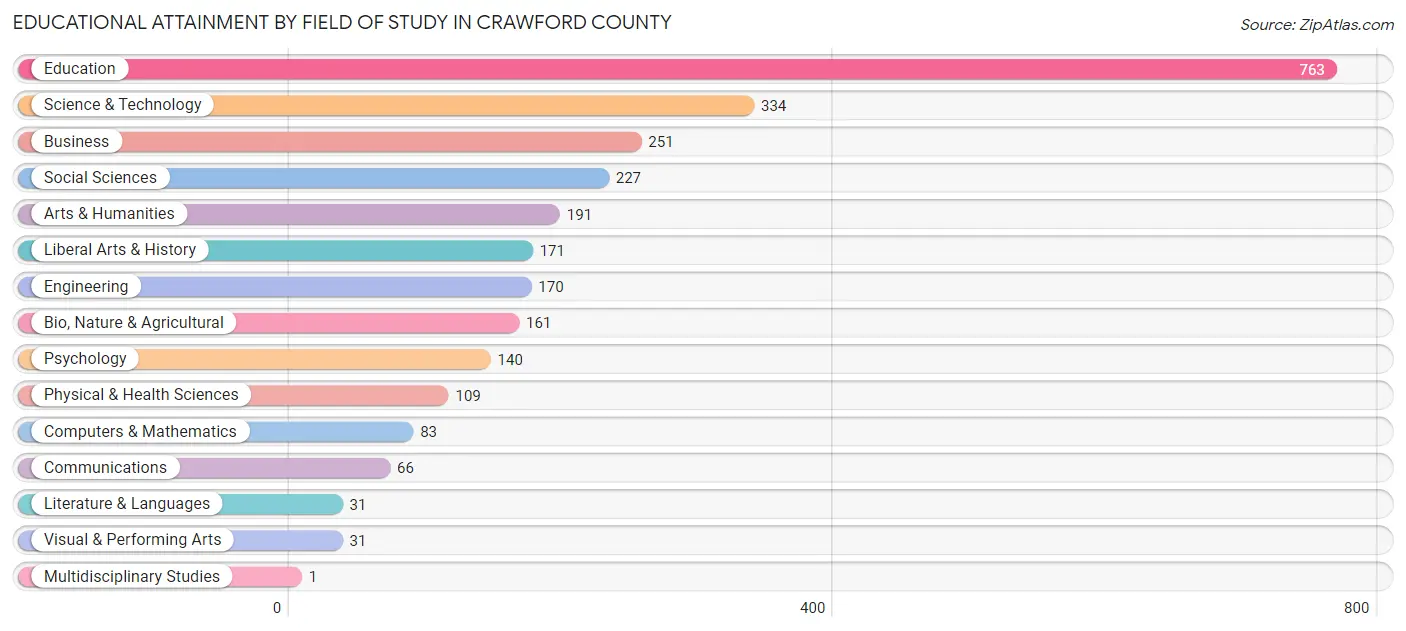
| Field of Study | # Graduates | % Graduates |
| Computers & Mathematics | 83 | 3.0% |
| Bio, Nature & Agricultural | 161 | 5.9% |
| Physical & Health Sciences | 109 | 4.0% |
| Psychology | 140 | 5.1% |
| Social Sciences | 227 | 8.3% |
| Engineering | 170 | 6.2% |
| Multidisciplinary Studies | 1 | 0.0% |
| Science & Technology | 334 | 12.2% |
| Business | 251 | 9.2% |
| Education | 763 | 28.0% |
| Literature & Languages | 31 | 1.1% |
| Liberal Arts & History | 171 | 6.3% |
| Visual & Performing Arts | 31 | 1.1% |
| Communications | 66 | 2.4% |
| Arts & Humanities | 191 | 7.0% |
| Total | 2,729 | 100.0% |
Transportation & Commute in Crawford County
Vehicle Availability by Sex in Crawford County
The most prevalent vehicle ownership categories in Crawford County are males with 2 vehicles (1,564, accounting for 37.0%) and females with 2 vehicles (1,282, making up 39.5%).
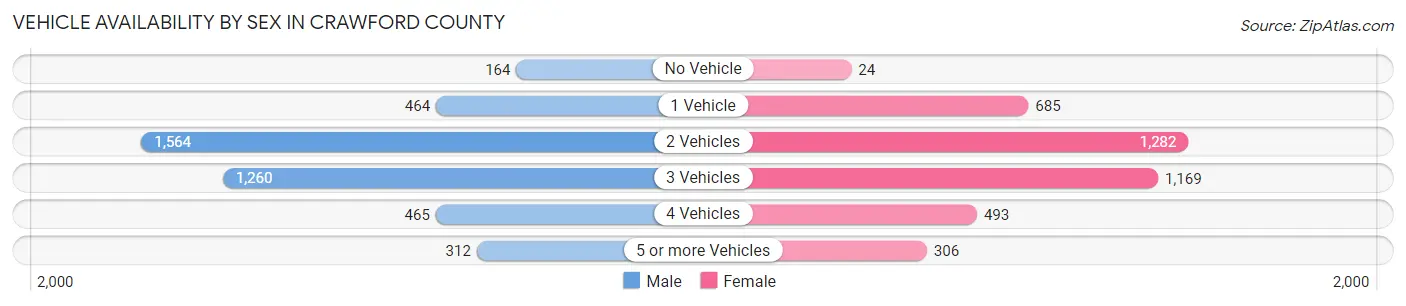
| Vehicles Available | Male | Female |
| No Vehicle | 164 (3.9%) | 24 (0.6%) |
| 1 Vehicle | 464 (11.0%) | 685 (17.3%) |
| 2 Vehicles | 1,564 (37.0%) | 1,282 (32.4%) |
| 3 Vehicles | 1,260 (29.8%) | 1,169 (29.5%) |
| 4 Vehicles | 465 (11.0%) | 493 (12.4%) |
| 5 or more Vehicles | 312 (7.4%) | 306 (7.7%) |
| Total | 4,229 (100.0%) | 3,959 (100.0%) |
Commute Time in Crawford County
The most frequently occuring commute durations in Crawford County are 5 to 9 minutes (1,736 commuters, 22.5%), 10 to 14 minutes (1,546 commuters, 20.0%), and 15 to 19 minutes (1,381 commuters, 17.9%).
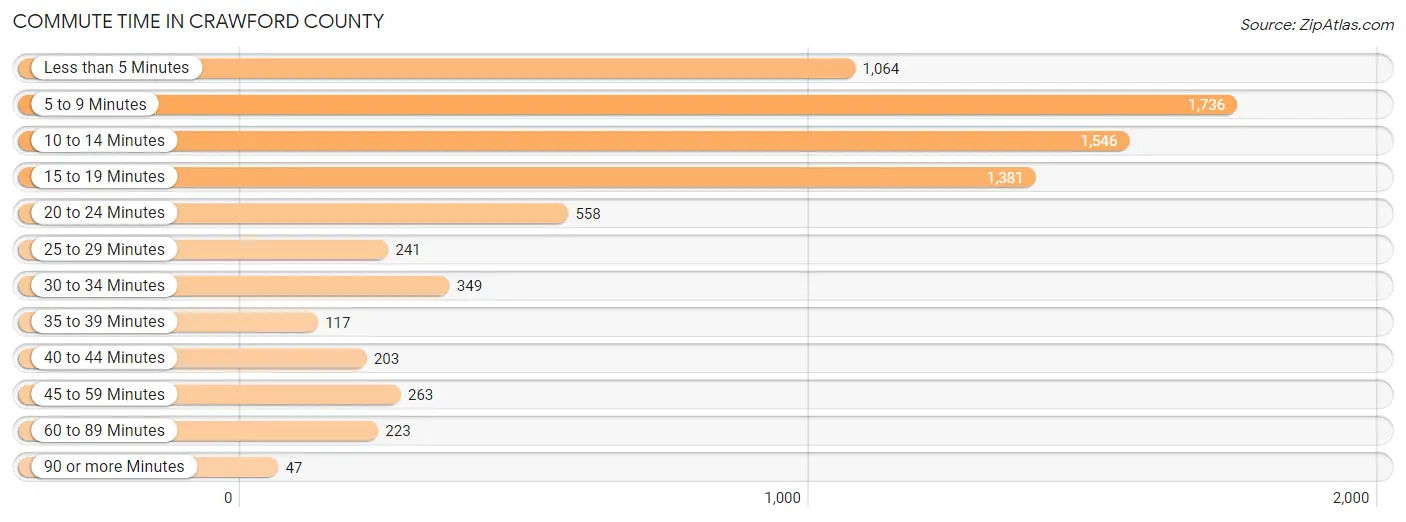
| Commute Time | # Commuters | % Commuters |
| Less than 5 Minutes | 1,064 | 13.8% |
| 5 to 9 Minutes | 1,736 | 22.5% |
| 10 to 14 Minutes | 1,546 | 20.0% |
| 15 to 19 Minutes | 1,381 | 17.9% |
| 20 to 24 Minutes | 558 | 7.2% |
| 25 to 29 Minutes | 241 | 3.1% |
| 30 to 34 Minutes | 349 | 4.5% |
| 35 to 39 Minutes | 117 | 1.5% |
| 40 to 44 Minutes | 203 | 2.6% |
| 45 to 59 Minutes | 263 | 3.4% |
| 60 to 89 Minutes | 223 | 2.9% |
| 90 or more Minutes | 47 | 0.6% |
Commute Time by Sex in Crawford County
The most common commute times in Crawford County are 5 to 9 minutes (966 commuters, 23.3%) for males and 10 to 14 minutes (787 commuters, 22.0%) for females.
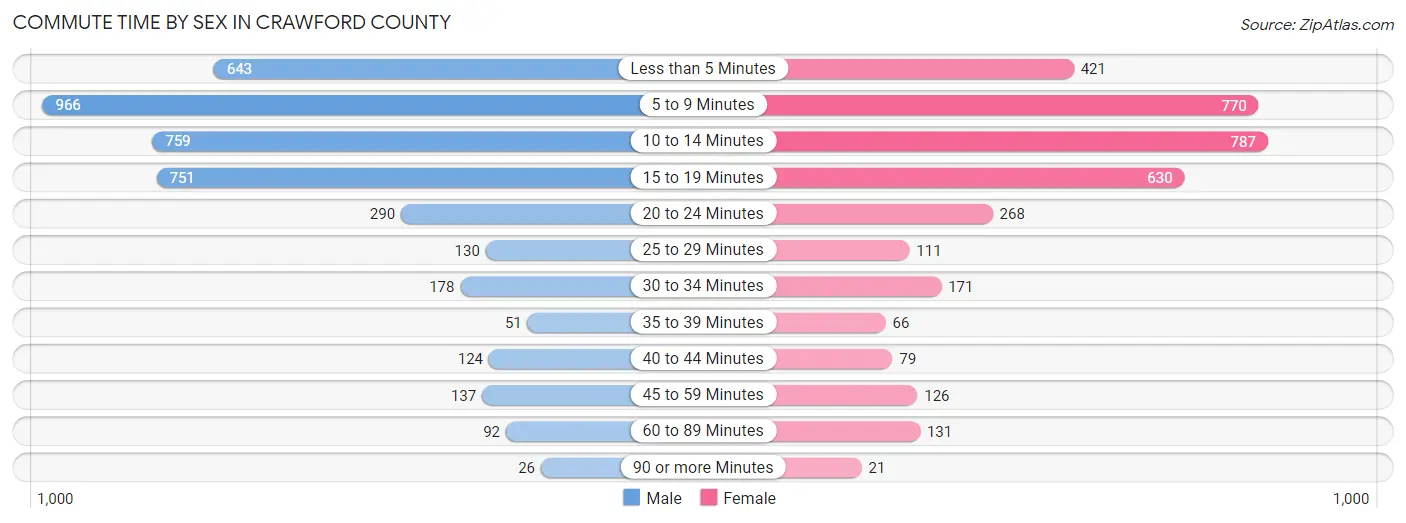
| Commute Time | Male | Female |
| Less than 5 Minutes | 643 (15.5%) | 421 (11.8%) |
| 5 to 9 Minutes | 966 (23.3%) | 770 (21.5%) |
| 10 to 14 Minutes | 759 (18.3%) | 787 (22.0%) |
| 15 to 19 Minutes | 751 (18.1%) | 630 (17.6%) |
| 20 to 24 Minutes | 290 (7.0%) | 268 (7.5%) |
| 25 to 29 Minutes | 130 (3.1%) | 111 (3.1%) |
| 30 to 34 Minutes | 178 (4.3%) | 171 (4.8%) |
| 35 to 39 Minutes | 51 (1.2%) | 66 (1.8%) |
| 40 to 44 Minutes | 124 (3.0%) | 79 (2.2%) |
| 45 to 59 Minutes | 137 (3.3%) | 126 (3.5%) |
| 60 to 89 Minutes | 92 (2.2%) | 131 (3.7%) |
| 90 or more Minutes | 26 (0.6%) | 21 (0.6%) |
Time of Departure to Work by Sex in Crawford County
The most frequent times of departure to work in Crawford County are 6:30 AM to 6:59 AM (857, 20.7%) for males and 7:30 AM to 7:59 AM (609, 17.0%) for females.
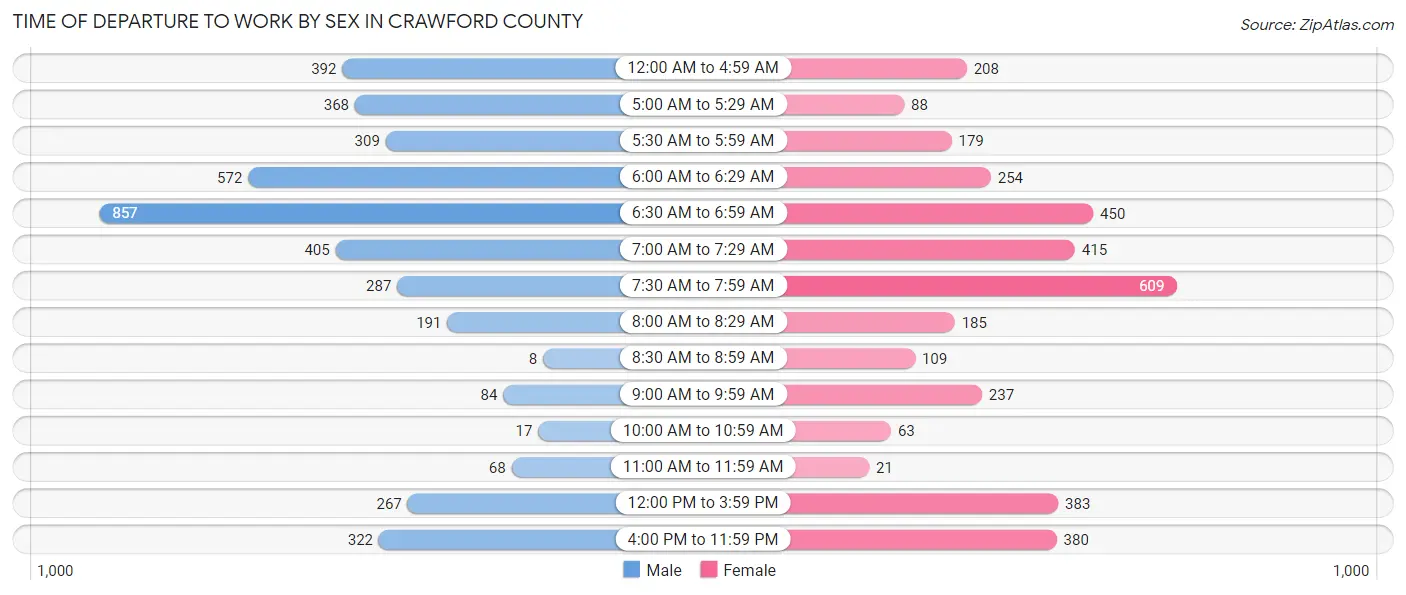
| Time of Departure | Male | Female |
| 12:00 AM to 4:59 AM | 392 (9.5%) | 208 (5.8%) |
| 5:00 AM to 5:29 AM | 368 (8.9%) | 88 (2.5%) |
| 5:30 AM to 5:59 AM | 309 (7.4%) | 179 (5.0%) |
| 6:00 AM to 6:29 AM | 572 (13.8%) | 254 (7.1%) |
| 6:30 AM to 6:59 AM | 857 (20.7%) | 450 (12.6%) |
| 7:00 AM to 7:29 AM | 405 (9.8%) | 415 (11.6%) |
| 7:30 AM to 7:59 AM | 287 (6.9%) | 609 (17.0%) |
| 8:00 AM to 8:29 AM | 191 (4.6%) | 185 (5.2%) |
| 8:30 AM to 8:59 AM | 8 (0.2%) | 109 (3.0%) |
| 9:00 AM to 9:59 AM | 84 (2.0%) | 237 (6.6%) |
| 10:00 AM to 10:59 AM | 17 (0.4%) | 63 (1.8%) |
| 11:00 AM to 11:59 AM | 68 (1.6%) | 21 (0.6%) |
| 12:00 PM to 3:59 PM | 267 (6.4%) | 383 (10.7%) |
| 4:00 PM to 11:59 PM | 322 (7.8%) | 380 (10.6%) |
| Total | 4,147 (100.0%) | 3,581 (100.0%) |
Housing Occupancy in Crawford County
Occupancy by Ownership in Crawford County
Of the total 7,481 dwellings in Crawford County, owner-occupied units account for 5,911 (79.0%), while renter-occupied units make up 1,570 (21.0%).
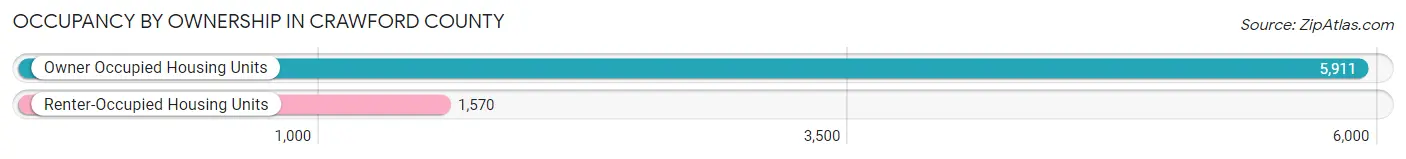
| Occupancy | # Housing Units | % Housing Units |
| Owner Occupied Housing Units | 5,911 | 79.0% |
| Renter-Occupied Housing Units | 1,570 | 21.0% |
| Total Occupied Housing Units | 7,481 | 100.0% |
Occupancy by Household Size in Crawford County
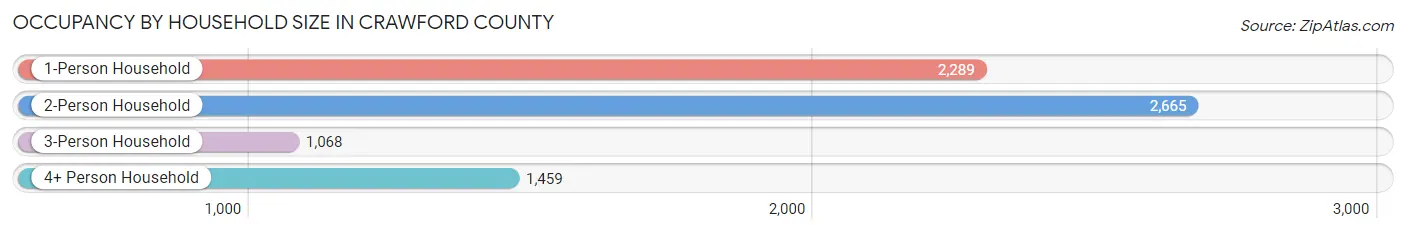
| Household Size | # Housing Units | % Housing Units |
| 1-Person Household | 2,289 | 30.6% |
| 2-Person Household | 2,665 | 35.6% |
| 3-Person Household | 1,068 | 14.3% |
| 4+ Person Household | 1,459 | 19.5% |
| Total Housing Units | 7,481 | 100.0% |
Occupancy by Ownership by Household Size in Crawford County
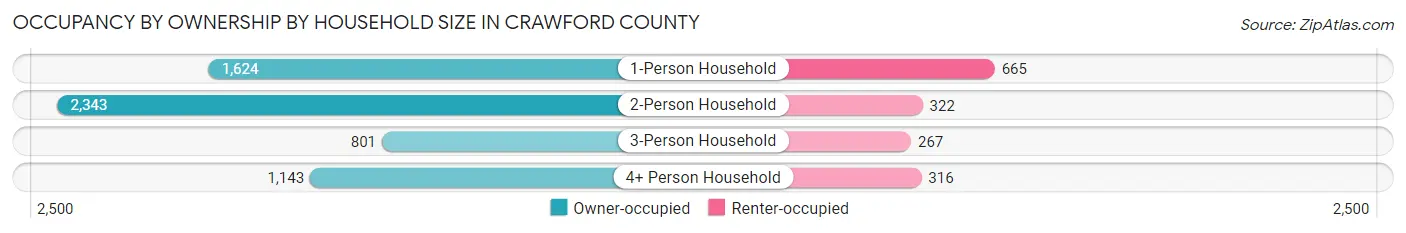
| Household Size | Owner-occupied | Renter-occupied |
| 1-Person Household | 1,624 (71.0%) | 665 (29.0%) |
| 2-Person Household | 2,343 (87.9%) | 322 (12.1%) |
| 3-Person Household | 801 (75.0%) | 267 (25.0%) |
| 4+ Person Household | 1,143 (78.3%) | 316 (21.7%) |
| Total Housing Units | 5,911 (79.0%) | 1,570 (21.0%) |
Occupancy by Educational Attainment in Crawford County
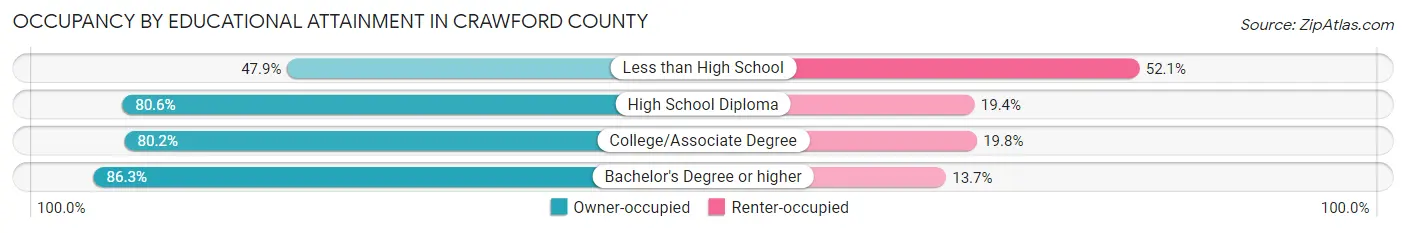
| Household Size | Owner-occupied | Renter-occupied |
| Less than High School | 289 (47.9%) | 314 (52.1%) |
| High School Diploma | 1,603 (80.6%) | 385 (19.4%) |
| College/Associate Degree | 2,627 (80.2%) | 650 (19.8%) |
| Bachelor's Degree or higher | 1,392 (86.3%) | 221 (13.7%) |
Occupancy by Age of Householder in Crawford County
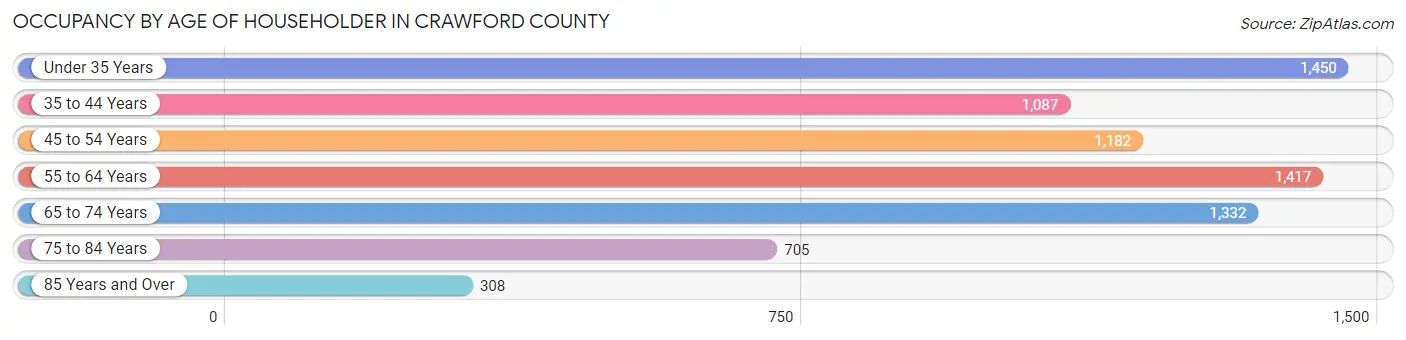
| Age Bracket | # Households | % Households |
| Under 35 Years | 1,450 | 19.4% |
| 35 to 44 Years | 1,087 | 14.5% |
| 45 to 54 Years | 1,182 | 15.8% |
| 55 to 64 Years | 1,417 | 18.9% |
| 65 to 74 Years | 1,332 | 17.8% |
| 75 to 84 Years | 705 | 9.4% |
| 85 Years and Over | 308 | 4.1% |
| Total | 7,481 | 100.0% |
Housing Finances in Crawford County
Median Income by Occupancy in Crawford County
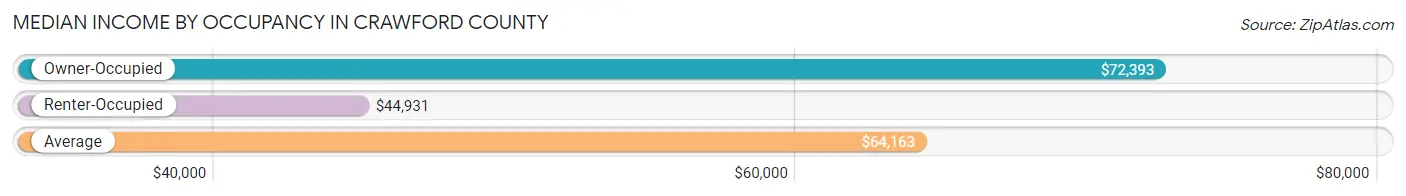
| Occupancy Type | # Households | Median Income |
| Owner-Occupied | 5,911 (79.0%) | $72,393 |
| Renter-Occupied | 1,570 (21.0%) | $44,931 |
| Average | 7,481 (100.0%) | $64,163 |
Occupancy by Householder Income Bracket in Crawford County
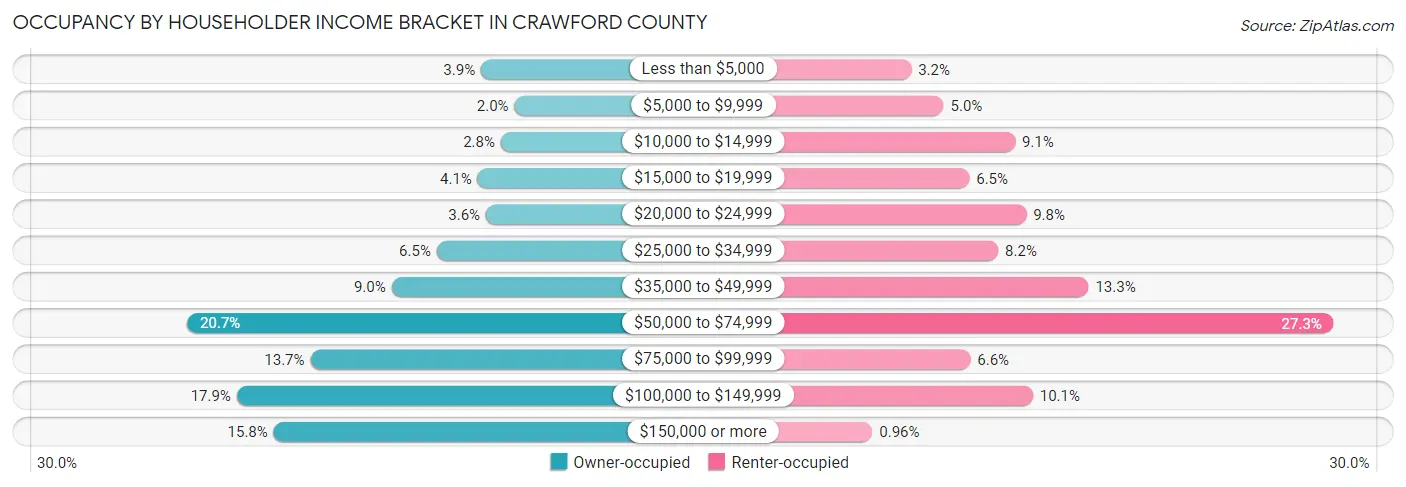
| Income Bracket | Owner-occupied | Renter-occupied |
| Less than $5,000 | 232 (3.9%) | 50 (3.2%) |
| $5,000 to $9,999 | 119 (2.0%) | 79 (5.0%) |
| $10,000 to $14,999 | 165 (2.8%) | 143 (9.1%) |
| $15,000 to $19,999 | 243 (4.1%) | 102 (6.5%) |
| $20,000 to $24,999 | 215 (3.6%) | 153 (9.8%) |
| $25,000 to $34,999 | 381 (6.5%) | 128 (8.2%) |
| $35,000 to $49,999 | 534 (9.0%) | 209 (13.3%) |
| $50,000 to $74,999 | 1,225 (20.7%) | 429 (27.3%) |
| $75,000 to $99,999 | 808 (13.7%) | 103 (6.6%) |
| $100,000 to $149,999 | 1,057 (17.9%) | 159 (10.1%) |
| $150,000 or more | 932 (15.8%) | 15 (1.0%) |
| Total | 5,911 (100.0%) | 1,570 (100.0%) |
Monthly Housing Cost Tiers in Crawford County
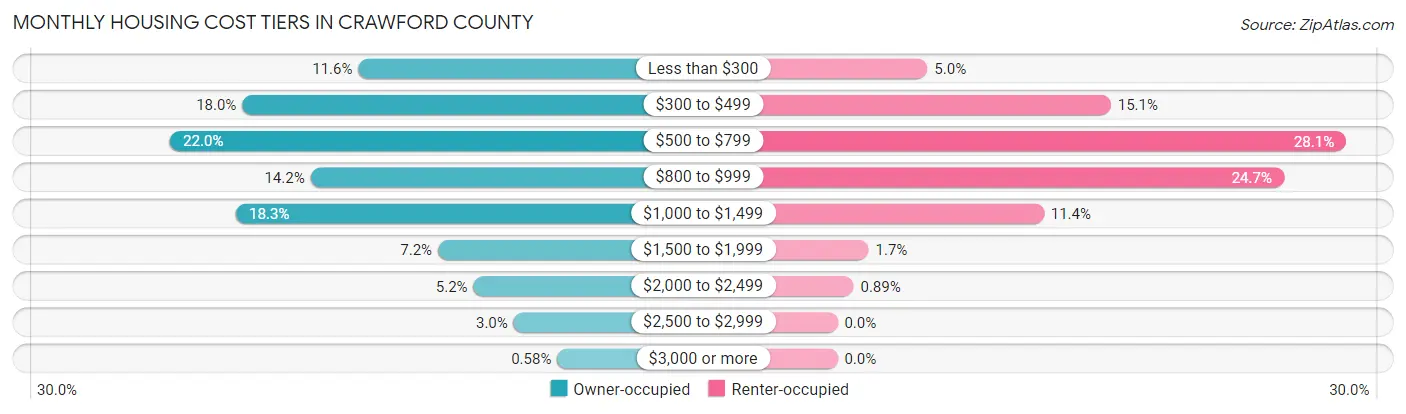
| Monthly Cost | Owner-occupied | Renter-occupied |
| Less than $300 | 684 (11.6%) | 78 (5.0%) |
| $300 to $499 | 1,063 (18.0%) | 237 (15.1%) |
| $500 to $799 | 1,298 (22.0%) | 441 (28.1%) |
| $800 to $999 | 840 (14.2%) | 387 (24.6%) |
| $1,000 to $1,499 | 1,083 (18.3%) | 179 (11.4%) |
| $1,500 to $1,999 | 424 (7.2%) | 27 (1.7%) |
| $2,000 to $2,499 | 308 (5.2%) | 14 (0.9%) |
| $2,500 to $2,999 | 177 (3.0%) | 0 (0.0%) |
| $3,000 or more | 34 (0.6%) | 0 (0.0%) |
| Total | 5,911 (100.0%) | 1,570 (100.0%) |
Physical Housing Characteristics in Crawford County
Housing Structures in Crawford County
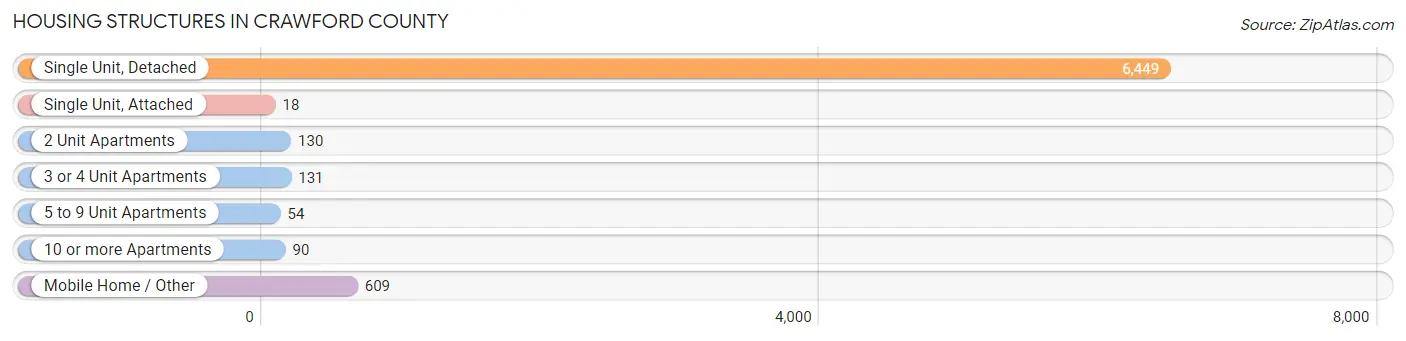
| Structure Type | # Housing Units | % Housing Units |
| Single Unit, Detached | 6,449 | 86.2% |
| Single Unit, Attached | 18 | 0.2% |
| 2 Unit Apartments | 130 | 1.7% |
| 3 or 4 Unit Apartments | 131 | 1.8% |
| 5 to 9 Unit Apartments | 54 | 0.7% |
| 10 or more Apartments | 90 | 1.2% |
| Mobile Home / Other | 609 | 8.1% |
| Total | 7,481 | 100.0% |
Housing Structures by Occupancy in Crawford County
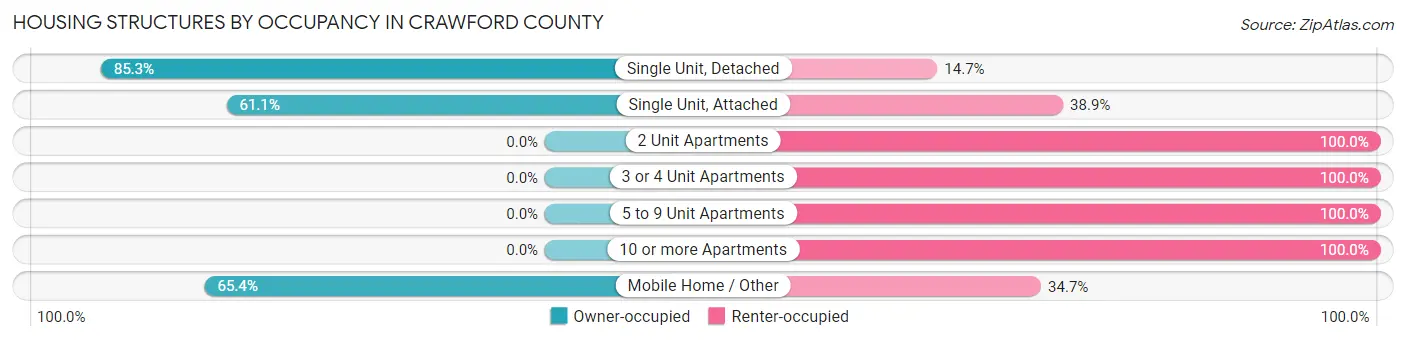
| Structure Type | Owner-occupied | Renter-occupied |
| Single Unit, Detached | 5,502 (85.3%) | 947 (14.7%) |
| Single Unit, Attached | 11 (61.1%) | 7 (38.9%) |
| 2 Unit Apartments | 0 (0.0%) | 130 (100.0%) |
| 3 or 4 Unit Apartments | 0 (0.0%) | 131 (100.0%) |
| 5 to 9 Unit Apartments | 0 (0.0%) | 54 (100.0%) |
| 10 or more Apartments | 0 (0.0%) | 90 (100.0%) |
| Mobile Home / Other | 398 (65.3%) | 211 (34.6%) |
| Total | 5,911 (79.0%) | 1,570 (21.0%) |
Housing Structures by Number of Rooms in Crawford County
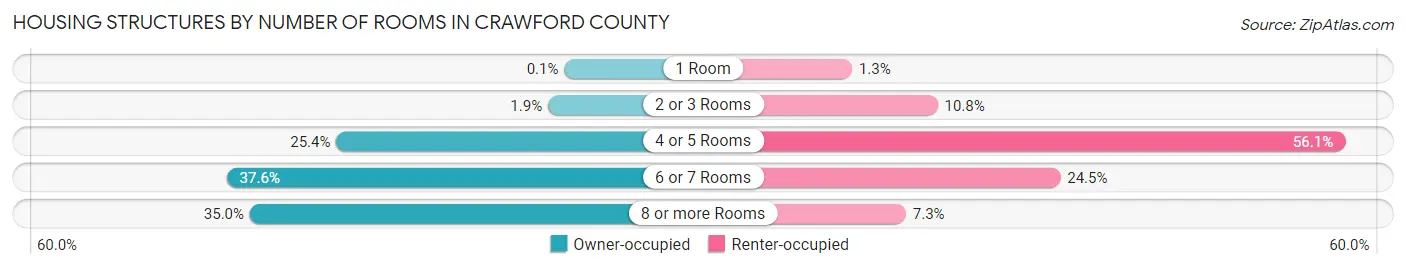
| Number of Rooms | Owner-occupied | Renter-occupied |
| 1 Room | 6 (0.1%) | 21 (1.3%) |
| 2 or 3 Rooms | 113 (1.9%) | 170 (10.8%) |
| 4 or 5 Rooms | 1,502 (25.4%) | 880 (56.0%) |
| 6 or 7 Rooms | 2,221 (37.6%) | 384 (24.5%) |
| 8 or more Rooms | 2,069 (35.0%) | 115 (7.3%) |
| Total | 5,911 (100.0%) | 1,570 (100.0%) |
Housing Structure by Heating Type in Crawford County
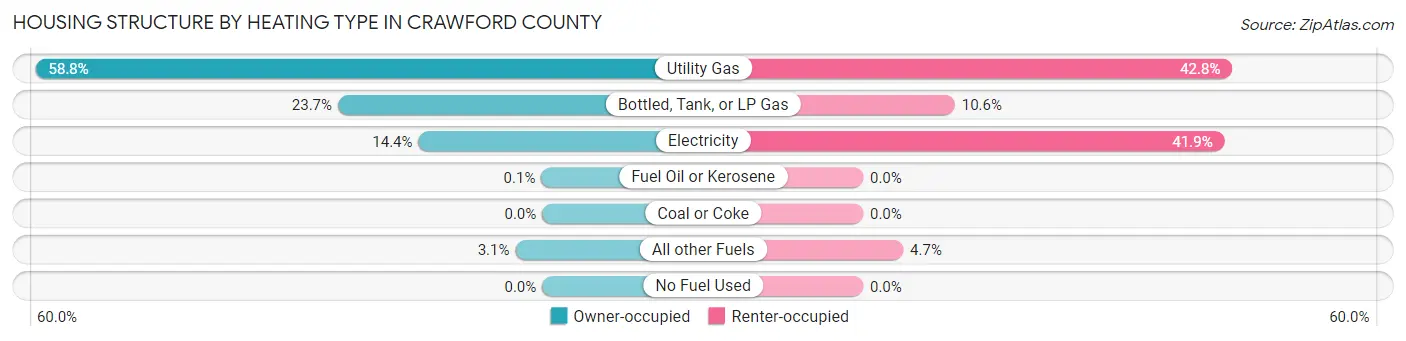
| Heating Type | Owner-occupied | Renter-occupied |
| Utility Gas | 3,473 (58.8%) | 672 (42.8%) |
| Bottled, Tank, or LP Gas | 1,400 (23.7%) | 167 (10.6%) |
| Electricity | 848 (14.3%) | 658 (41.9%) |
| Fuel Oil or Kerosene | 6 (0.1%) | 0 (0.0%) |
| Coal or Coke | 0 (0.0%) | 0 (0.0%) |
| All other Fuels | 184 (3.1%) | 73 (4.6%) |
| No Fuel Used | 0 (0.0%) | 0 (0.0%) |
| Total | 5,911 (100.0%) | 1,570 (100.0%) |
Household Vehicle Usage in Crawford County
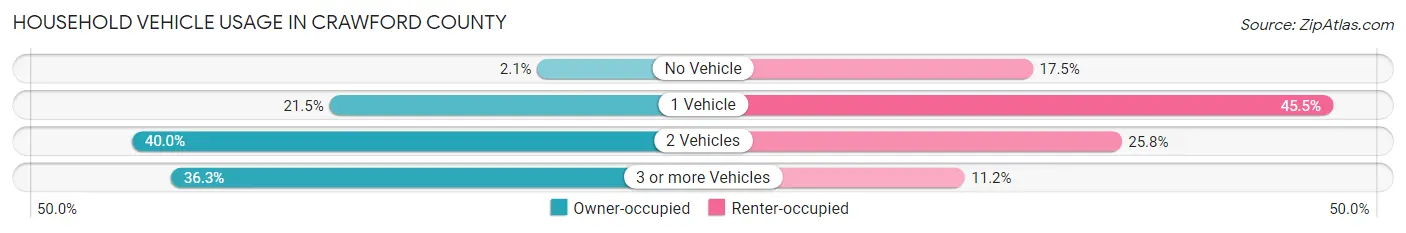
| Vehicles per Household | Owner-occupied | Renter-occupied |
| No Vehicle | 126 (2.1%) | 275 (17.5%) |
| 1 Vehicle | 1,273 (21.5%) | 715 (45.5%) |
| 2 Vehicles | 2,364 (40.0%) | 405 (25.8%) |
| 3 or more Vehicles | 2,148 (36.3%) | 175 (11.2%) |
| Total | 5,911 (100.0%) | 1,570 (100.0%) |
Real Estate & Mortgages in Crawford County
Real Estate and Mortgage Overview in Crawford County
| Characteristic | Without Mortgage | With Mortgage |
| Housing Units | 2,711 | 3,200 |
| Median Property Value | $94,900 | $121,000 |
| Median Household Income | $53,089 | $710 |
| Monthly Housing Costs | $449 | $34 |
| Real Estate Taxes | $1,439 | $117 |
Property Value by Mortgage Status in Crawford County
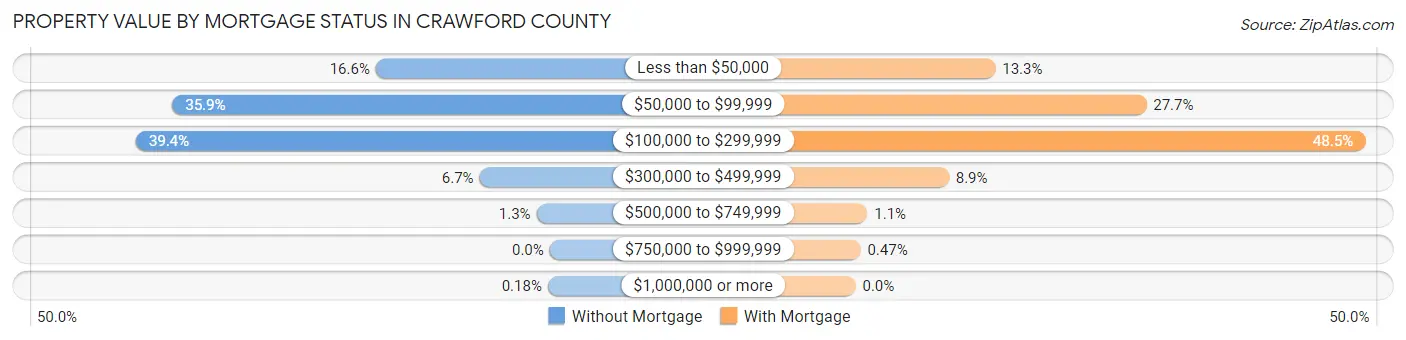
| Property Value | Without Mortgage | With Mortgage |
| Less than $50,000 | 449 (16.6%) | 426 (13.3%) |
| $50,000 to $99,999 | 974 (35.9%) | 886 (27.7%) |
| $100,000 to $299,999 | 1,068 (39.4%) | 1,553 (48.5%) |
| $300,000 to $499,999 | 181 (6.7%) | 284 (8.9%) |
| $500,000 to $749,999 | 34 (1.3%) | 36 (1.1%) |
| $750,000 to $999,999 | 0 (0.0%) | 15 (0.5%) |
| $1,000,000 or more | 5 (0.2%) | 0 (0.0%) |
| Total | 2,711 (100.0%) | 3,200 (100.0%) |
Household Income by Mortgage Status in Crawford County
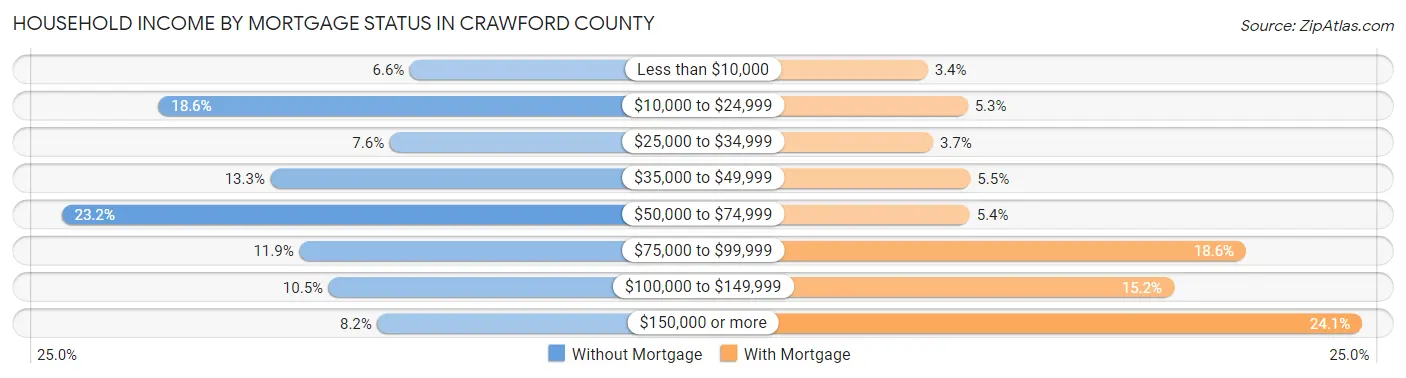
| Household Income | Without Mortgage | With Mortgage |
| Less than $10,000 | 180 (6.6%) | 110 (3.4%) |
| $10,000 to $24,999 | 505 (18.6%) | 171 (5.3%) |
| $25,000 to $34,999 | 206 (7.6%) | 118 (3.7%) |
| $35,000 to $49,999 | 360 (13.3%) | 175 (5.5%) |
| $50,000 to $74,999 | 630 (23.2%) | 174 (5.4%) |
| $75,000 to $99,999 | 323 (11.9%) | 595 (18.6%) |
| $100,000 to $149,999 | 285 (10.5%) | 485 (15.2%) |
| $150,000 or more | 222 (8.2%) | 772 (24.1%) |
| Total | 2,711 (100.0%) | 3,200 (100.0%) |
Property Value to Household Income Ratio in Crawford County
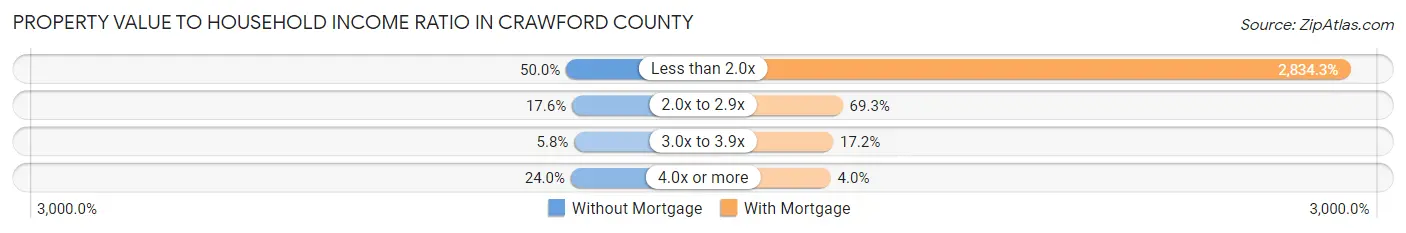
| Value-to-Income Ratio | Without Mortgage | With Mortgage |
| Less than 2.0x | 1,355 (50.0%) | 90,697 (2,834.3%) |
| 2.0x to 2.9x | 478 (17.6%) | 2,219 (69.3%) |
| 3.0x to 3.9x | 158 (5.8%) | 551 (17.2%) |
| 4.0x or more | 651 (24.0%) | 129 (4.0%) |
| Total | 2,711 (100.0%) | 3,200 (100.0%) |
Real Estate Taxes by Mortgage Status in Crawford County
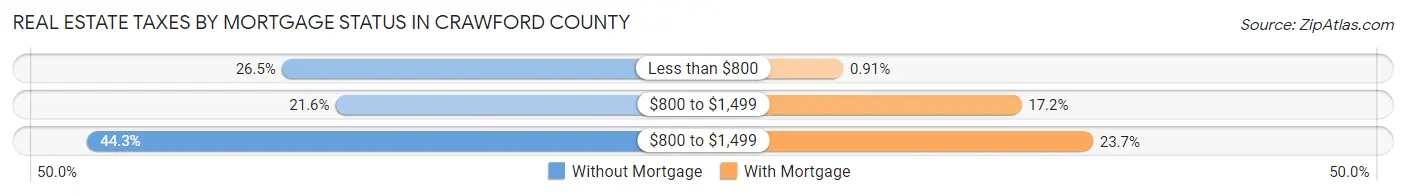
| Property Taxes | Without Mortgage | With Mortgage |
| Less than $800 | 719 (26.5%) | 29 (0.9%) |
| $800 to $1,499 | 586 (21.6%) | 550 (17.2%) |
| $800 to $1,499 | 1,200 (44.3%) | 759 (23.7%) |
| Total | 2,711 (100.0%) | 3,200 (100.0%) |
Health & Disability in Crawford County
Health Insurance Coverage by Age in Crawford County
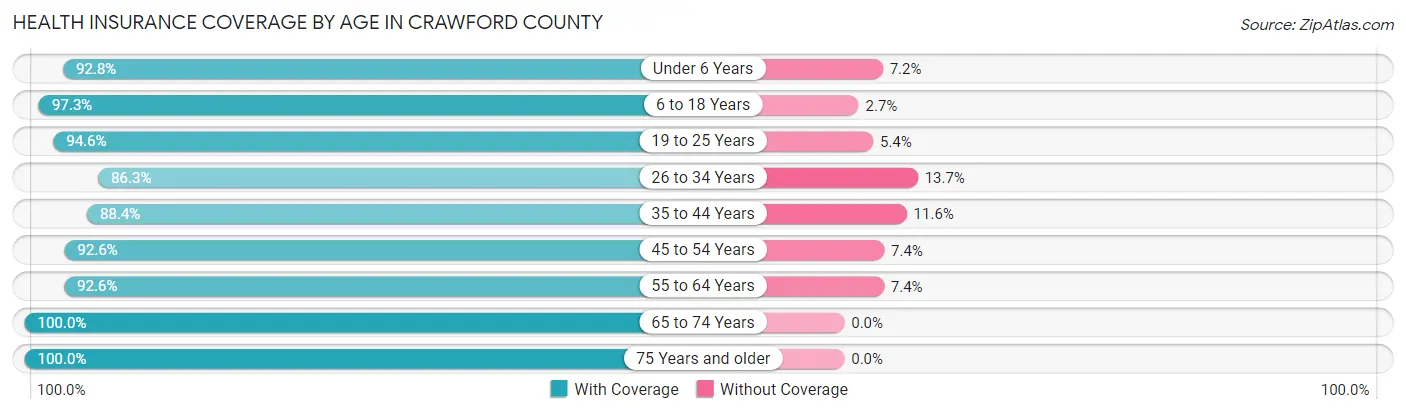
| Age Bracket | With Coverage | Without Coverage |
| Under 6 Years | 1,077 (92.8%) | 83 (7.2%) |
| 6 to 18 Years | 2,699 (97.3%) | 74 (2.7%) |
| 19 to 25 Years | 1,182 (94.6%) | 67 (5.4%) |
| 26 to 34 Years | 1,627 (86.3%) | 258 (13.7%) |
| 35 to 44 Years | 1,755 (88.4%) | 231 (11.6%) |
| 45 to 54 Years | 1,957 (92.6%) | 157 (7.4%) |
| 55 to 64 Years | 2,349 (92.6%) | 187 (7.4%) |
| 65 to 74 Years | 2,052 (100.0%) | 0 (0.0%) |
| 75 Years and older | 1,369 (100.0%) | 0 (0.0%) |
| Total | 16,067 (93.8%) | 1,057 (6.2%) |
Health Insurance Coverage by Citizenship Status in Crawford County
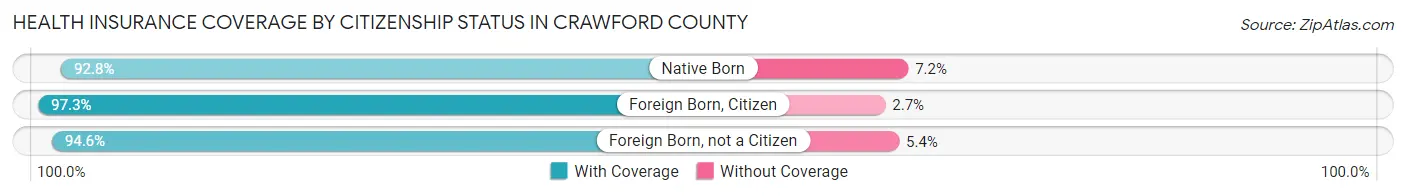
| Citizenship Status | With Coverage | Without Coverage |
| Native Born | 1,077 (92.8%) | 83 (7.2%) |
| Foreign Born, Citizen | 2,699 (97.3%) | 74 (2.7%) |
| Foreign Born, not a Citizen | 1,182 (94.6%) | 67 (5.4%) |
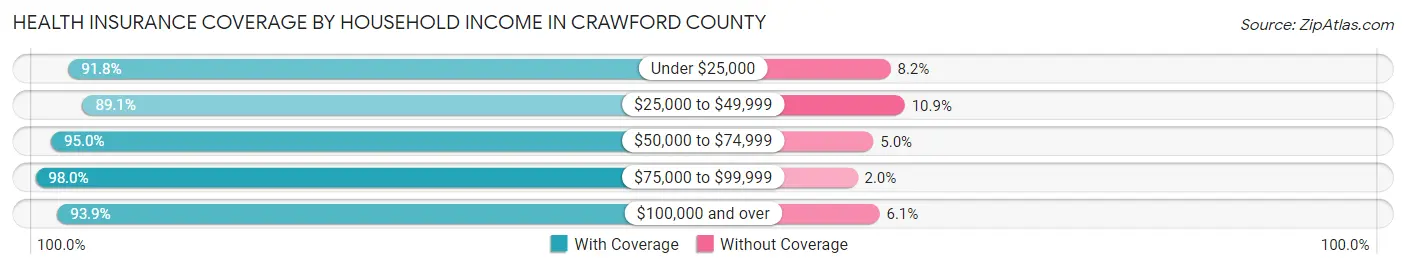
Health Insurance Coverage by Household Income in Crawford County
| Household Income | With Coverage | Without Coverage |
| Under $25,000 | 1,914 (91.8%) | 171 (8.2%) |
| $25,000 to $49,999 | 2,027 (89.1%) | 247 (10.9%) |
| $50,000 to $74,999 | 3,490 (95.0%) | 183 (5.0%) |
| $75,000 to $99,999 | 2,295 (98.0%) | 47 (2.0%) |
| $100,000 and over | 6,261 (93.9%) | 409 (6.1%) |
Public vs Private Health Insurance Coverage by Age in Crawford County
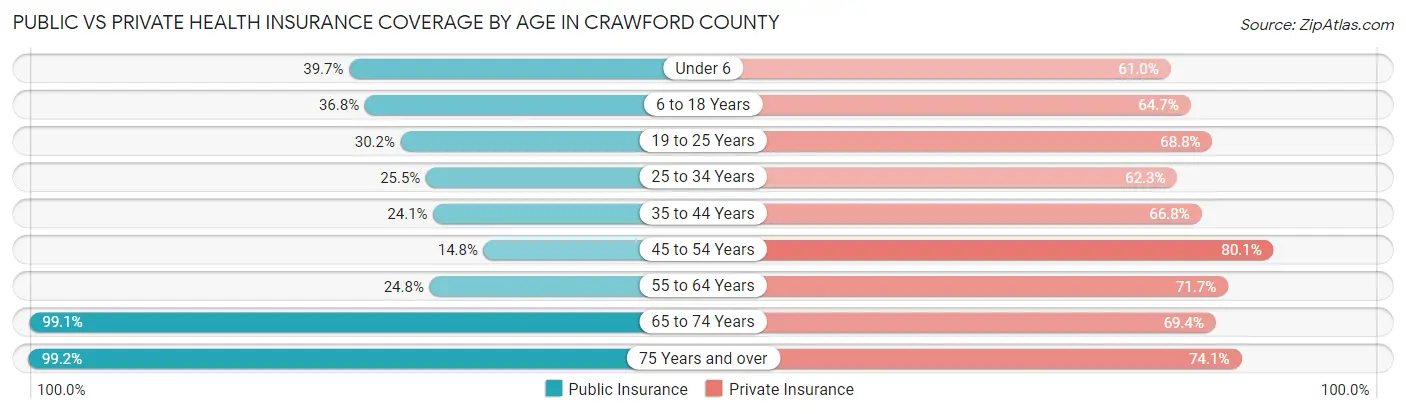
| Age Bracket | Public Insurance | Private Insurance |
| Under 6 | 461 (39.7%) | 708 (61.0%) |
| 6 to 18 Years | 1,021 (36.8%) | 1,795 (64.7%) |
| 19 to 25 Years | 377 (30.2%) | 859 (68.8%) |
| 25 to 34 Years | 480 (25.5%) | 1,174 (62.3%) |
| 35 to 44 Years | 479 (24.1%) | 1,326 (66.8%) |
| 45 to 54 Years | 312 (14.8%) | 1,694 (80.1%) |
| 55 to 64 Years | 629 (24.8%) | 1,818 (71.7%) |
| 65 to 74 Years | 2,034 (99.1%) | 1,424 (69.4%) |
| 75 Years and over | 1,358 (99.2%) | 1,015 (74.1%) |
| Total | 7,151 (41.8%) | 11,813 (69.0%) |
Disability Status by Sex by Age in Crawford County
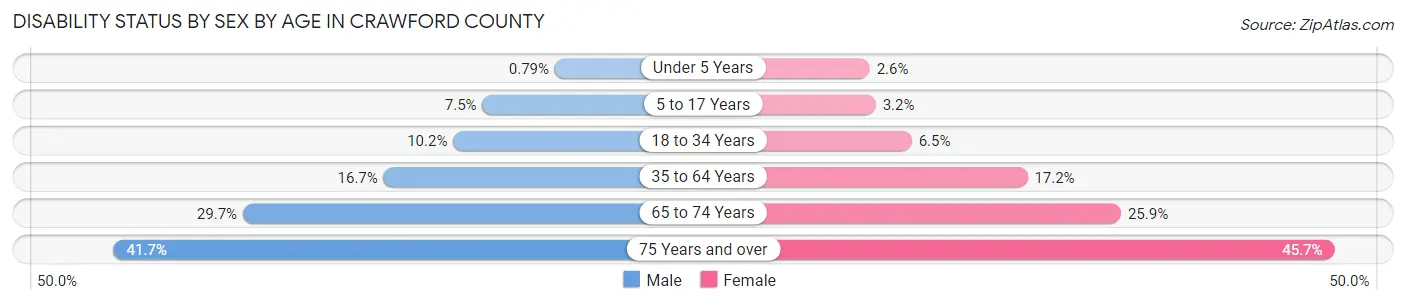
| Age Bracket | Male | Female |
| Under 5 Years | 4 (0.8%) | 12 (2.6%) |
| 5 to 17 Years | 106 (7.5%) | 42 (3.2%) |
| 18 to 34 Years | 180 (10.2%) | 103 (6.5%) |
| 35 to 64 Years | 553 (16.7%) | 572 (17.2%) |
| 65 to 74 Years | 290 (29.7%) | 279 (25.9%) |
| 75 Years and over | 240 (41.7%) | 363 (45.7%) |
Disability Class by Sex by Age in Crawford County
Disability Class: Hearing Difficulty
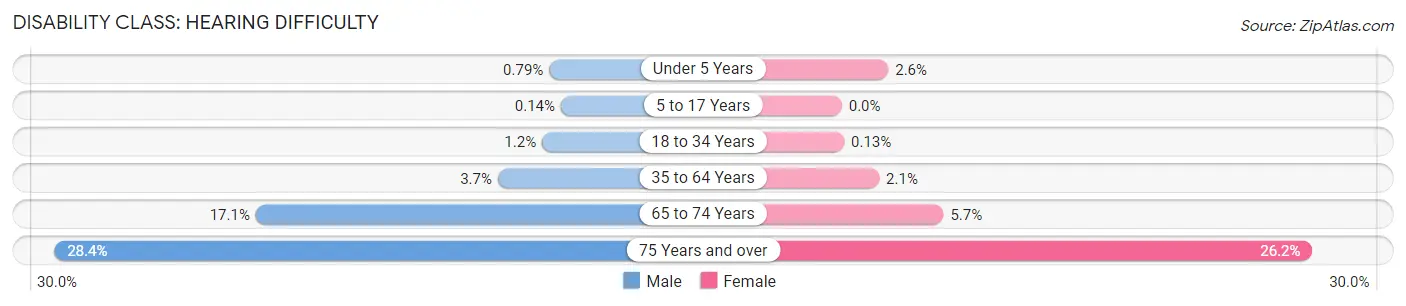
| Age Bracket | Male | Female |
| Under 5 Years | 4 (0.8%) | 12 (2.6%) |
| 5 to 17 Years | 2 (0.1%) | 0 (0.0%) |
| 18 to 34 Years | 21 (1.2%) | 2 (0.1%) |
| 35 to 64 Years | 121 (3.6%) | 69 (2.1%) |
| 65 to 74 Years | 167 (17.1%) | 61 (5.7%) |
| 75 Years and over | 163 (28.3%) | 208 (26.2%) |
Disability Class: Vision Difficulty
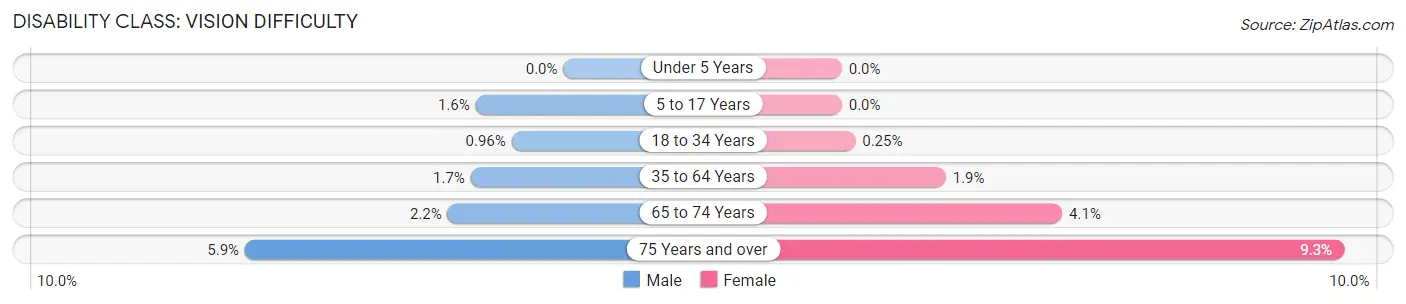
| Age Bracket | Male | Female |
| Under 5 Years | 0 (0.0%) | 0 (0.0%) |
| 5 to 17 Years | 23 (1.6%) | 0 (0.0%) |
| 18 to 34 Years | 17 (1.0%) | 4 (0.3%) |
| 35 to 64 Years | 57 (1.7%) | 64 (1.9%) |
| 65 to 74 Years | 21 (2.1%) | 44 (4.1%) |
| 75 Years and over | 34 (5.9%) | 74 (9.3%) |
Disability Class: Cognitive Difficulty
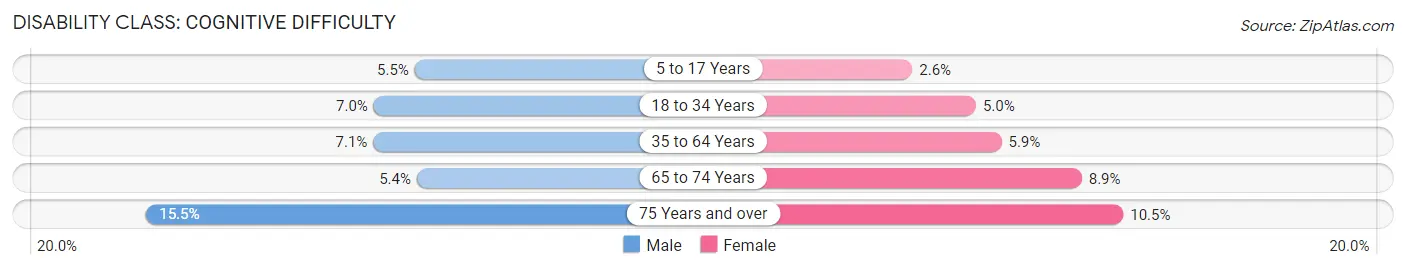
| Age Bracket | Male | Female |
| 5 to 17 Years | 78 (5.5%) | 35 (2.6%) |
| 18 to 34 Years | 124 (7.0%) | 79 (5.0%) |
| 35 to 64 Years | 234 (7.1%) | 197 (5.9%) |
| 65 to 74 Years | 53 (5.4%) | 96 (8.9%) |
| 75 Years and over | 89 (15.5%) | 83 (10.4%) |
Disability Class: Ambulatory Difficulty
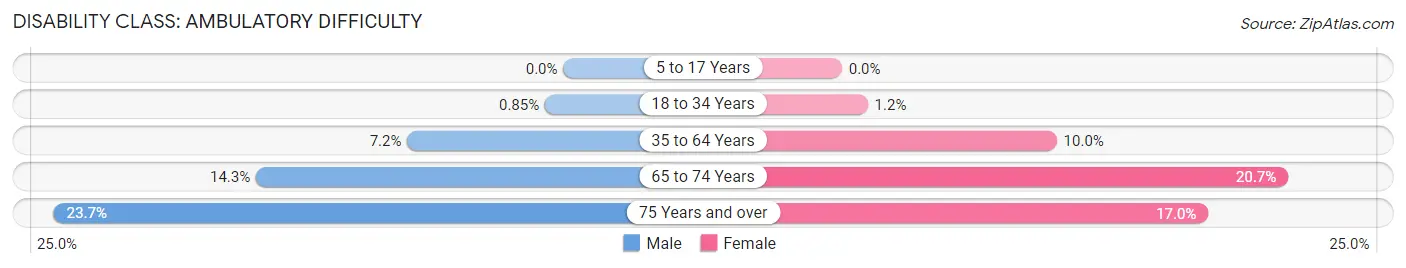
| Age Bracket | Male | Female |
| 5 to 17 Years | 0 (0.0%) | 0 (0.0%) |
| 18 to 34 Years | 15 (0.9%) | 19 (1.2%) |
| 35 to 64 Years | 240 (7.2%) | 331 (10.0%) |
| 65 to 74 Years | 139 (14.3%) | 223 (20.7%) |
| 75 Years and over | 136 (23.6%) | 135 (17.0%) |
Disability Class: Self-Care Difficulty
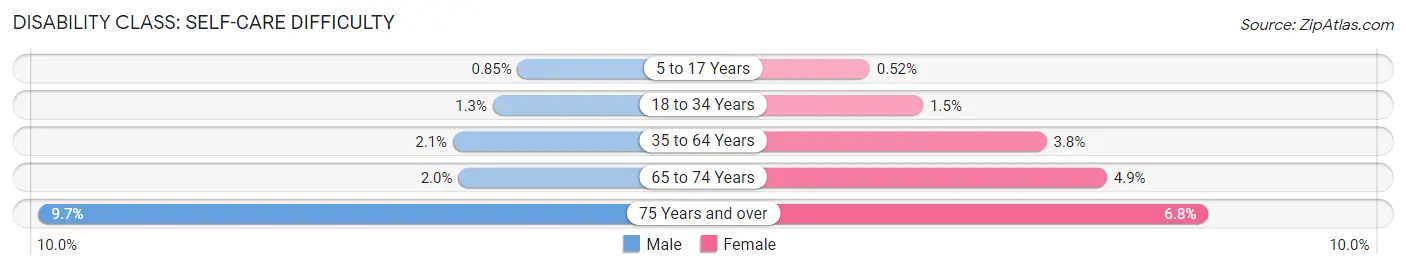
| Age Bracket | Male | Female |
| 5 to 17 Years | 12 (0.9%) | 7 (0.5%) |
| 18 to 34 Years | 23 (1.3%) | 24 (1.5%) |
| 35 to 64 Years | 68 (2.1%) | 126 (3.8%) |
| 65 to 74 Years | 19 (1.9%) | 53 (4.9%) |
| 75 Years and over | 56 (9.7%) | 54 (6.8%) |
Technology Access in Crawford County
Computing Device Access in Crawford County
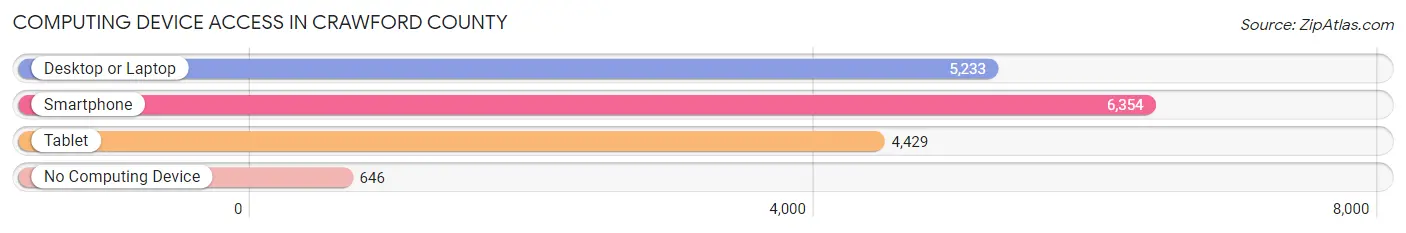
| Device Type | # Households | % Households |
| Desktop or Laptop | 5,233 | 70.0% |
| Smartphone | 6,354 | 84.9% |
| Tablet | 4,429 | 59.2% |
| No Computing Device | 646 | 8.6% |
| Total | 7,481 | 100.0% |
Internet Access in Crawford County
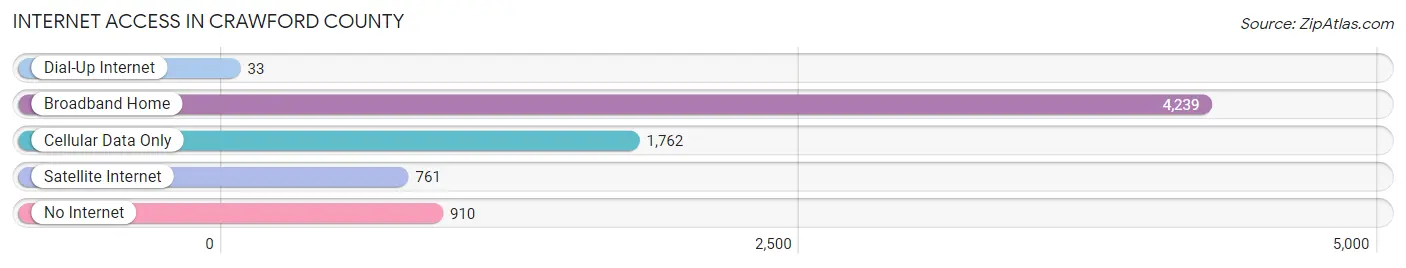
| Internet Type | # Households | % Households |
| Dial-Up Internet | 33 | 0.4% |
| Broadband Home | 4,239 | 56.7% |
| Cellular Data Only | 1,762 | 23.5% |
| Satellite Internet | 761 | 10.2% |
| No Internet | 910 | 12.2% |
| Total | 7,481 | 100.0% |
Crawford County Summary
Crawford County, Illinois is located in the southeastern corner of the state, bordered by the Wabash River to the east and the Ohio River to the south. The county seat is Robinson, and the county was named after William H. Crawford, the United States Secretary of War from 1815 to 1816. The county has a total area of 517 square miles, and a population of 19,817 as of the 2010 census.
History
Crawford County was formed in 1816 from parts of Clark, Edgar, and Lawrence counties. The county was named after William H. Crawford, the United States Secretary of War from 1815 to 1816. The first settlers arrived in the area in the early 1800s, and the county was officially organized in 1817.
The county was largely agricultural in its early years, with corn, wheat, and oats being the main crops. The county also had a thriving timber industry, with the Wabash River providing access to the lumber markets of the Midwest.
In the late 1800s, the county began to industrialize, with coal mining becoming a major industry. The coal industry was centered around the town of Oblong, which was the largest town in the county at the time. The coal industry declined in the early 1900s, and the county shifted back to an agricultural economy.
Geography
Crawford County is located in the southeastern corner of the state, bordered by the Wabash River to the east and the Ohio River to the south. The county has a total area of 517 square miles, and is mostly flat with some rolling hills. The highest point in the county is located in the northwest corner, at an elevation of 890 feet.
The county is home to several state parks and wildlife areas, including the Crawford County State Fish and Wildlife Area, the Oblong State Fish and Wildlife Area, and the Robinson State Fish and Wildlife Area.
Economy
Crawford County has a largely agricultural economy, with corn, soybeans, and wheat being the main crops. The county also has a thriving timber industry, with the Wabash River providing access to the lumber markets of the Midwest.
The county also has a growing manufacturing sector, with several companies located in the county. The largest employers in the county are the Robinson Community Unit School District, the Crawford County Health Department, and the Crawford County Sheriff's Office.
Demographics
As of the 2010 census, there were 19,817 people, 7,845 households, and 5,541 families living in the county. The population density was 39 people per square mile. The racial makeup of the county was 97.3% White, 0.7% African American, 0.2% Native American, 0.2% Asian, 0.1% Pacific Islander, 0.5% from other races, and 1.1% from two or more races. Hispanic or Latino of any race were 1.3% of the population.
The median income for a household in the county was $37,945, and the median income for a family was $45,945. The per capita income for the county was $18,845. About 11.3% of families and 14.2% of the population were below the poverty line, including 19.2% of those under age 18 and 8.7% of those age 65 or over.
Common Questions
What is Per Capita Income in Crawford County?
Per Capita income in Crawford County is $32,786.
What is the Median Family Income in Crawford County?
Median Family Income in Crawford County is $79,123.
What is the Median Household income in Crawford County?
Median Household Income in Crawford County is $64,163.
What is Income or Wage Gap in Crawford County?
Income or Wage Gap in Crawford County is 27.8%.
Women in Crawford County earn 72.2 cents for every dollar earned by a man.
What is Family Income Deficit in Crawford County?
Family Income Deficit in Crawford County is $8,016.
Families that are below poverty line in Crawford County earn $8,016 less on average than the poverty threshold level.
What is Inequality or Gini Index in Crawford County?
Inequality or Gini Index in Crawford County is 0.44.
What is the Total Population of Crawford County?
Total Population of Crawford County is 18,729.
What is the Total Male Population of Crawford County?
Total Male Population of Crawford County is 9,989.
What is the Total Female Population of Crawford County?
Total Female Population of Crawford County is 8,740.
What is the Ratio of Males per 100 Females in Crawford County?
There are 114.29 Males per 100 Females in Crawford County.
What is the Ratio of Females per 100 Males in Crawford County?
There are 87.50 Females per 100 Males in Crawford County.
What is the Median Population Age in Crawford County?
Median Population Age in Crawford County is 42.2 Years.
What is the Average Family Size in Crawford County
Average Family Size in Crawford County is 2.8 People.
What is the Average Household Size in Crawford County
Average Household Size in Crawford County is 2.3 People.
How Large is the Labor Force in Crawford County?
There are 8,572 People in the Labor Forcein in Crawford County.
What is the Percentage of People in the Labor Force in Crawford County?
55.4% of People are in the Labor Force in Crawford County.
What is the Unemployment Rate in Crawford County?
Unemployment Rate in Crawford County is 3.3%.