Christian County, IL Map & Demographics
Christian County Map
Christian County Overview
$29,960
PER CAPITA INCOME
$78,447
AVG FAMILY INCOME
$56,933
AVG HOUSEHOLD INCOME
34.0%
WAGE / INCOME GAP [ % ]
66.0¢/ $1
WAGE / INCOME GAP [ $ ]
$12,191
FAMILY INCOME DEFICIT
0.43
INEQUALITY / GINI INDEX
33,893
TOTAL POPULATION
17,737
MALE POPULATION
16,156
FEMALE POPULATION
109.79
MALES / 100 FEMALES
91.09
FEMALES / 100 MALES
42.2
MEDIAN AGE
3.3
AVG FAMILY SIZE
2.4
AVG HOUSEHOLD SIZE
15,419
LABOR FORCE [ PEOPLE ]
55.6%
PERCENT IN LABOR FORCE
4.4%
UNEMPLOYMENT RATE
Christian County Area Codes
Income in Christian County
Income Overview in Christian County
Per Capita Income in Christian County is $29,960, while median incomes of families and households are $78,447 and $56,933 respectively.
| Characteristic | Number | Measure |
| Per Capita Income | 33,893 | $29,960 |
| Median Family Income | 7,461 | $78,447 |
| Mean Family Income | 7,461 | $90,802 |
| Median Household Income | 13,473 | $56,933 |
| Mean Household Income | 13,473 | $70,766 |
| Income Deficit | 7,461 | $12,191 |
| Wage / Income Gap (%) | 33,893 | 34.04% |
| Wage / Income Gap ($) | 33,893 | 65.96¢ per $1 |
| Gini / Inequality Index | 33,893 | 0.43 |
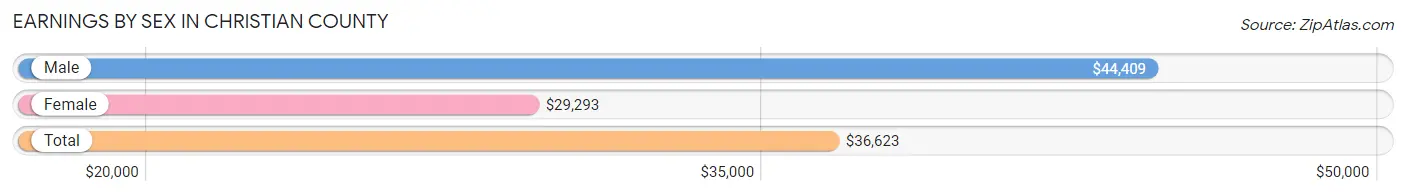
Earnings by Sex in Christian County
Average Earnings in Christian County are $36,623, $44,409 for men and $29,293 for women, a difference of 34.0%.
| Sex | Number | Average Earnings |
| Male | 8,754 (54.3%) | $44,409 |
| Female | 7,375 (45.7%) | $29,293 |
| Total | 16,129 (100.0%) | $36,623 |
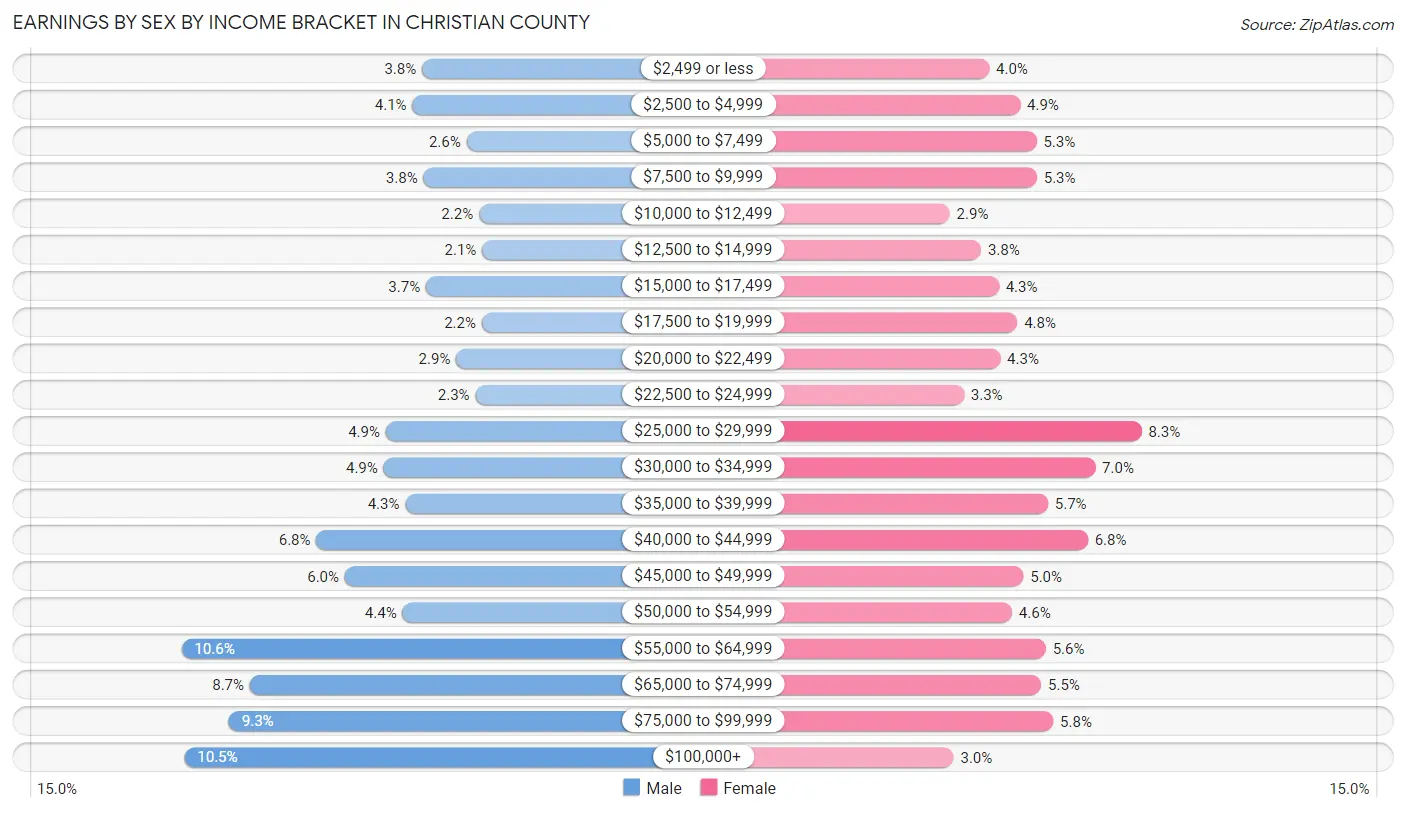
Earnings by Sex by Income Bracket in Christian County
The most common earnings brackets in Christian County are $55,000 to $64,999 for men (927 | 10.6%) and $25,000 to $29,999 for women (611 | 8.3%).
| Income | Male | Female |
| $2,499 or less | 335 (3.8%) | 295 (4.0%) |
| $2,500 to $4,999 | 359 (4.1%) | 359 (4.9%) |
| $5,000 to $7,499 | 226 (2.6%) | 393 (5.3%) |
| $7,500 to $9,999 | 332 (3.8%) | 394 (5.3%) |
| $10,000 to $12,499 | 195 (2.2%) | 213 (2.9%) |
| $12,500 to $14,999 | 187 (2.1%) | 278 (3.8%) |
| $15,000 to $17,499 | 326 (3.7%) | 315 (4.3%) |
| $17,500 to $19,999 | 188 (2.1%) | 353 (4.8%) |
| $20,000 to $22,499 | 251 (2.9%) | 318 (4.3%) |
| $22,500 to $24,999 | 204 (2.3%) | 243 (3.3%) |
| $25,000 to $29,999 | 425 (4.9%) | 611 (8.3%) |
| $30,000 to $34,999 | 430 (4.9%) | 515 (7.0%) |
| $35,000 to $39,999 | 376 (4.3%) | 417 (5.7%) |
| $40,000 to $44,999 | 595 (6.8%) | 499 (6.8%) |
| $45,000 to $49,999 | 525 (6.0%) | 366 (5.0%) |
| $50,000 to $54,999 | 383 (4.4%) | 342 (4.6%) |
| $55,000 to $64,999 | 927 (10.6%) | 412 (5.6%) |
| $65,000 to $74,999 | 759 (8.7%) | 403 (5.5%) |
| $75,000 to $99,999 | 811 (9.3%) | 428 (5.8%) |
| $100,000+ | 920 (10.5%) | 221 (3.0%) |
| Total | 8,754 (100.0%) | 7,375 (100.0%) |
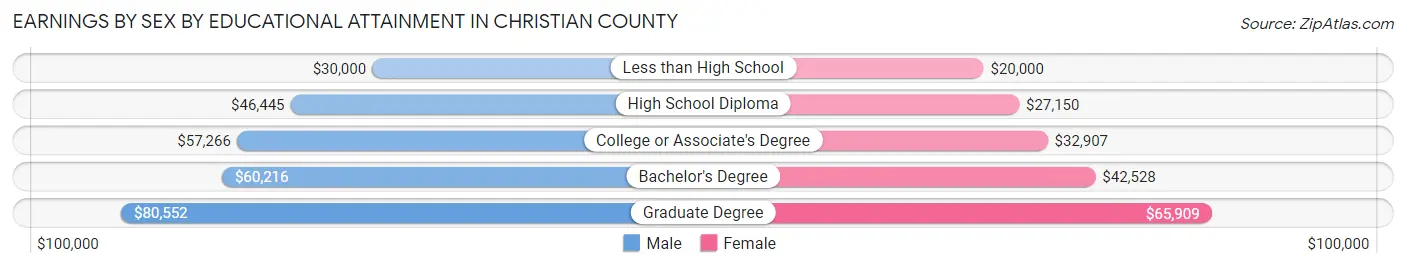
Earnings by Sex by Educational Attainment in Christian County
Average earnings in Christian County are $51,506 for men and $32,737 for women, a difference of 36.4%. Men with an educational attainment of graduate degree enjoy the highest average annual earnings of $80,552, while those with less than high school education earn the least with $30,000. Women with an educational attainment of graduate degree earn the most with the average annual earnings of $65,909, while those with less than high school education have the smallest earnings of $20,000.
| Educational Attainment | Male Income | Female Income |
| Less than High School | $30,000 | $20,000 |
| High School Diploma | $46,445 | $27,150 |
| College or Associate's Degree | $57,266 | $32,907 |
| Bachelor's Degree | $60,216 | $42,528 |
| Graduate Degree | $80,552 | $65,909 |
| Total | $51,506 | $32,737 |
Family Income in Christian County
Family Income Brackets in Christian County
According to the Christian County family income data, there are 1,619 families falling into the $50,000 to $74,999 income range, which is the most common income bracket and makes up 21.7% of all families. Conversely, the $10,000 to $14,999 income bracket is the least frequent group with only 52 families (0.7%) belonging to this category.
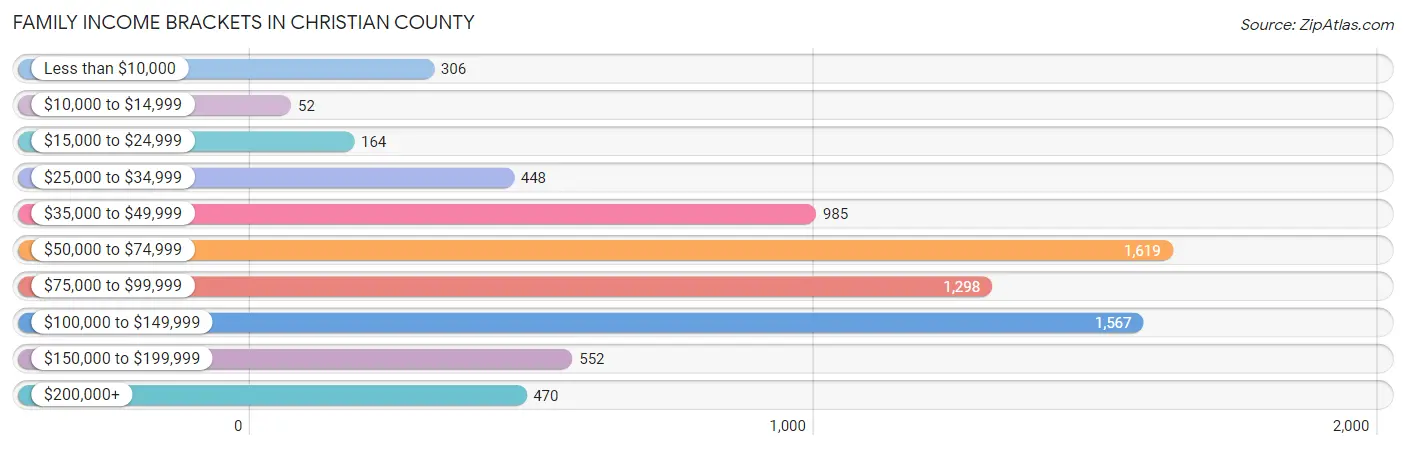
| Income Bracket | # Families | % Families |
| Less than $10,000 | 306 | 4.1% |
| $10,000 to $14,999 | 52 | 0.7% |
| $15,000 to $24,999 | 164 | 2.2% |
| $25,000 to $34,999 | 448 | 6.0% |
| $35,000 to $49,999 | 985 | 13.2% |
| $50,000 to $74,999 | 1,619 | 21.7% |
| $75,000 to $99,999 | 1,298 | 17.4% |
| $100,000 to $149,999 | 1,567 | 21.0% |
| $150,000 to $199,999 | 552 | 7.4% |
| $200,000+ | 470 | 6.3% |
Family Income by Famaliy Size in Christian County
5-person families (526 | 7.0%) account for the highest median family income in Christian County with $104,453 per family, while 2-person families (3,982 | 53.4%) have the highest median income of $36,196 per family member.
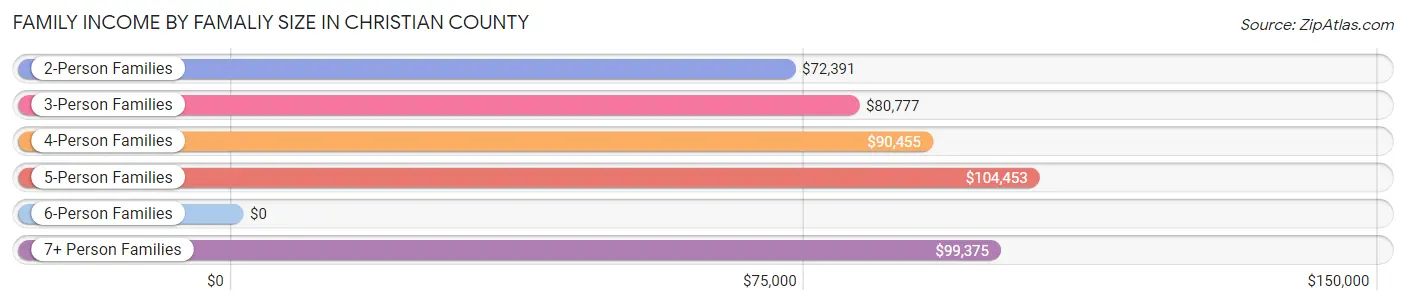
| Income Bracket | # Families | Median Income |
| 2-Person Families | 3,982 (53.4%) | $72,391 |
| 3-Person Families | 1,500 (20.1%) | $80,777 |
| 4-Person Families | 1,350 (18.1%) | $90,455 |
| 5-Person Families | 526 (7.0%) | $104,453 |
| 6-Person Families | 69 (0.9%) | $0 |
| 7+ Person Families | 34 (0.5%) | $99,375 |
| Total | 7,461 (100.0%) | $78,447 |
Family Income by Number of Earners in Christian County
The median family income in Christian County is $78,447, with families comprising 2 earners (2,869) having the highest median family income of $102,373, while families with no earners (1,440) have the lowest median family income of $53,258, accounting for 38.5% and 19.3% of families, respectively.
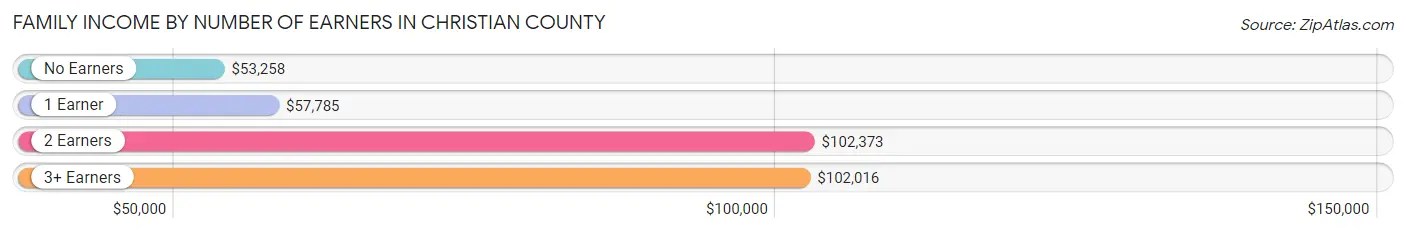
| Number of Earners | # Families | Median Income |
| No Earners | 1,440 (19.3%) | $53,258 |
| 1 Earner | 2,386 (32.0%) | $57,785 |
| 2 Earners | 2,869 (38.5%) | $102,373 |
| 3+ Earners | 766 (10.3%) | $102,016 |
| Total | 7,461 (100.0%) | $78,447 |
Household Income in Christian County
Household Income Brackets in Christian County
With 2,614 households falling in the category, the $50,000 to $74,999 income range is the most frequent in Christian County, accounting for 19.4% of all households. In contrast, only 539 households (4.0%) fall into the $200,000+ income bracket, making it the least populous group.
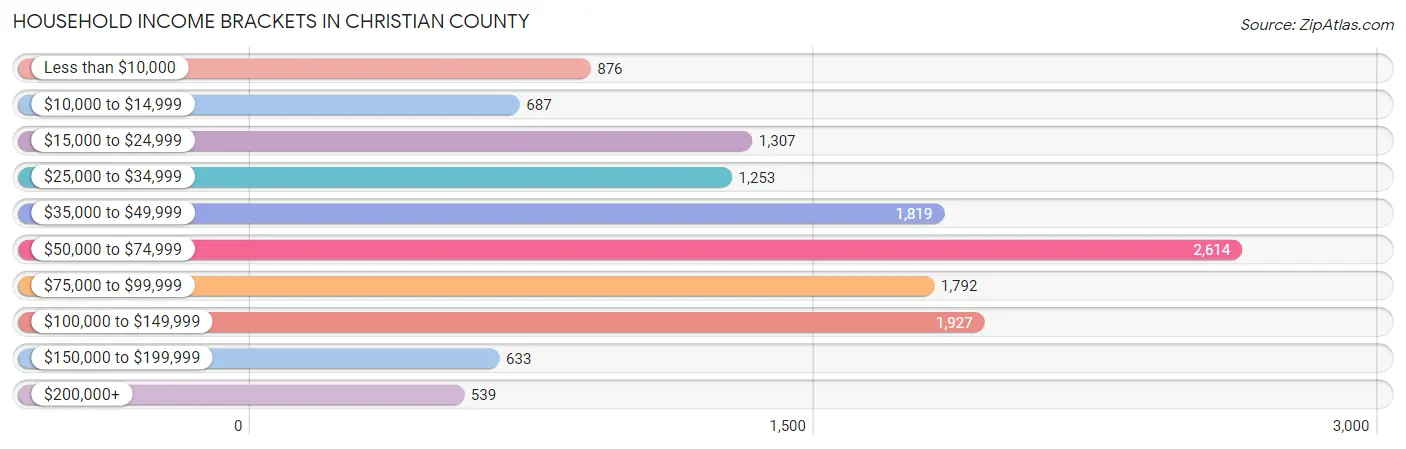
| Income Bracket | # Households | % Households |
| Less than $10,000 | 876 | 6.5% |
| $10,000 to $14,999 | 687 | 5.1% |
| $15,000 to $24,999 | 1,307 | 9.7% |
| $25,000 to $34,999 | 1,253 | 9.3% |
| $35,000 to $49,999 | 1,819 | 13.5% |
| $50,000 to $74,999 | 2,614 | 19.4% |
| $75,000 to $99,999 | 1,792 | 13.3% |
| $100,000 to $149,999 | 1,927 | 14.3% |
| $150,000 to $199,999 | 633 | 4.7% |
| $200,000+ | 539 | 4.0% |
Household Income by Householder Age in Christian County
The median household income in Christian County is $56,933, with the highest median household income of $68,197 found in the 25 to 44 years age bracket for the primary householder. A total of 3,740 households (27.8%) fall into this category. Meanwhile, the 15 to 24 years age bracket for the primary householder has the lowest median household income of $39,911, with 444 households (3.3%) in this group.
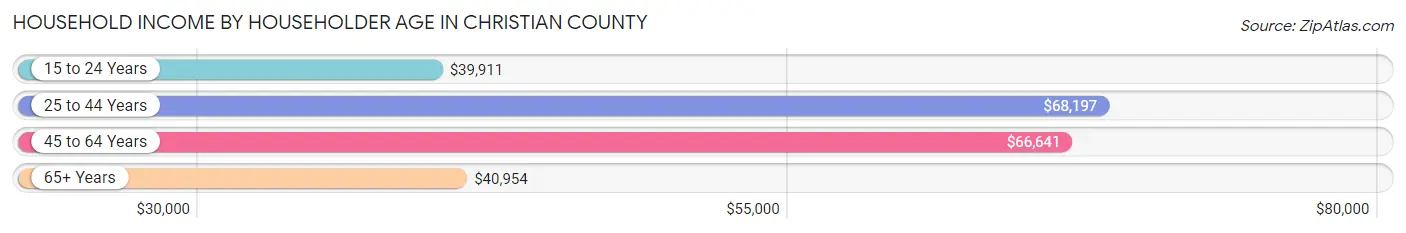
| Income Bracket | # Households | Median Income |
| 15 to 24 Years | 444 (3.3%) | $39,911 |
| 25 to 44 Years | 3,740 (27.8%) | $68,197 |
| 45 to 64 Years | 4,906 (36.4%) | $66,641 |
| 65+ Years | 4,383 (32.5%) | $40,954 |
| Total | 13,473 (100.0%) | $56,933 |
Poverty in Christian County
Income Below Poverty by Sex and Age in Christian County
With 9.9% poverty level for males and 13.9% for females among the residents of Christian County, 12 to 14 year old males and 16 and 17 year old females are the most vulnerable to poverty, with 124 males (18.8%) and 176 females (36.1%) in their respective age groups living below the poverty level.
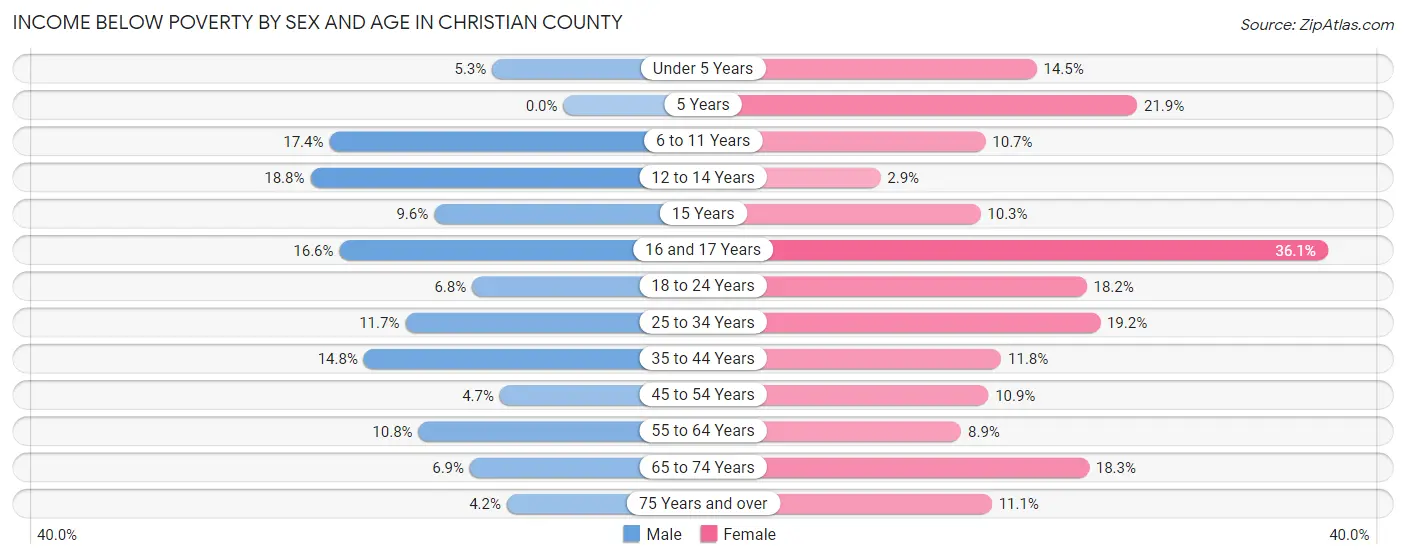
| Age Bracket | Male | Female |
| Under 5 Years | 56 (5.3%) | 118 (14.5%) |
| 5 Years | 0 (0.0%) | 48 (21.9%) |
| 6 to 11 Years | 202 (17.4%) | 120 (10.7%) |
| 12 to 14 Years | 124 (18.8%) | 13 (2.9%) |
| 15 Years | 17 (9.6%) | 25 (10.3%) |
| 16 and 17 Years | 75 (16.6%) | 176 (36.1%) |
| 18 to 24 Years | 100 (6.8%) | 212 (18.2%) |
| 25 to 34 Years | 236 (11.7%) | 328 (19.2%) |
| 35 to 44 Years | 292 (14.8%) | 215 (11.8%) |
| 45 to 54 Years | 100 (4.7%) | 216 (10.9%) |
| 55 to 64 Years | 247 (10.8%) | 206 (8.9%) |
| 65 to 74 Years | 119 (6.9%) | 340 (18.3%) |
| 75 Years and over | 48 (4.2%) | 183 (11.1%) |
| Total | 1,616 (9.9%) | 2,200 (13.9%) |
Income Above Poverty by Sex and Age in Christian County
According to the poverty statistics in Christian County, males aged 5 years and females aged 12 to 14 years are the age groups that are most secure financially, with 100.0% of males and 97.1% of females in these age groups living above the poverty line.
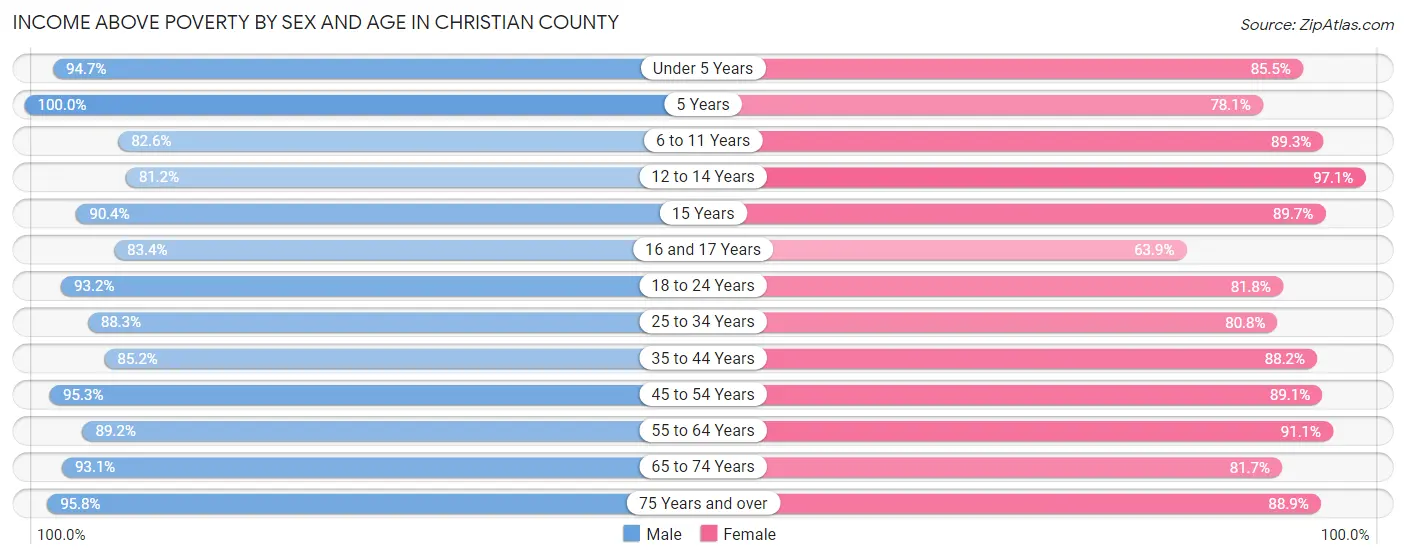
| Age Bracket | Male | Female |
| Under 5 Years | 1,003 (94.7%) | 698 (85.5%) |
| 5 Years | 103 (100.0%) | 171 (78.1%) |
| 6 to 11 Years | 960 (82.6%) | 1,006 (89.3%) |
| 12 to 14 Years | 536 (81.2%) | 442 (97.1%) |
| 15 Years | 160 (90.4%) | 218 (89.7%) |
| 16 and 17 Years | 376 (83.4%) | 312 (63.9%) |
| 18 to 24 Years | 1,376 (93.2%) | 955 (81.8%) |
| 25 to 34 Years | 1,775 (88.3%) | 1,383 (80.8%) |
| 35 to 44 Years | 1,678 (85.2%) | 1,602 (88.2%) |
| 45 to 54 Years | 2,020 (95.3%) | 1,772 (89.1%) |
| 55 to 64 Years | 2,048 (89.2%) | 2,120 (91.1%) |
| 65 to 74 Years | 1,595 (93.1%) | 1,514 (81.7%) |
| 75 Years and over | 1,095 (95.8%) | 1,461 (88.9%) |
| Total | 14,725 (90.1%) | 13,654 (86.1%) |
Income Below Poverty Among Married-Couple Families in Christian County
The poverty statistics for married-couple families in Christian County show that 3.7% or 215 of the total 5,847 families live below the poverty line. Families with 3 or 4 children have the highest poverty rate of 8.5%, comprising of 40 families. On the other hand, families with 5 or more children have the lowest poverty rate of 0.0%, which includes 0 families.
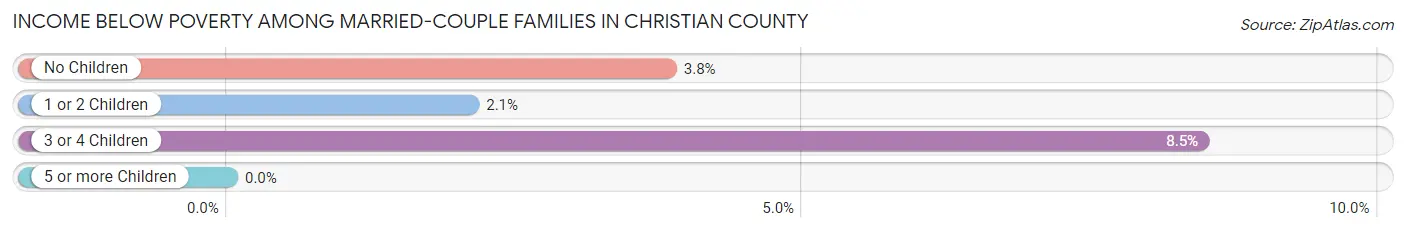
| Children | Above Poverty | Below Poverty |
| No Children | 3,501 (96.2%) | 139 (3.8%) |
| 1 or 2 Children | 1,675 (97.9%) | 36 (2.1%) |
| 3 or 4 Children | 433 (91.5%) | 40 (8.5%) |
| 5 or more Children | 23 (100.0%) | 0 (0.0%) |
| Total | 5,632 (96.3%) | 215 (3.7%) |
Income Below Poverty Among Single-Parent Households in Christian County
According to the poverty data in Christian County, 13.3% or 59 single-father households and 20.5% or 240 single-mother households are living below the poverty line. Among single-father households, those with 1 or 2 children have the highest poverty rate, with 45 households (17.3%) experiencing poverty. Likewise, among single-mother households, those with 1 or 2 children have the highest poverty rate, with 202 households (31.2%) falling below the poverty line.
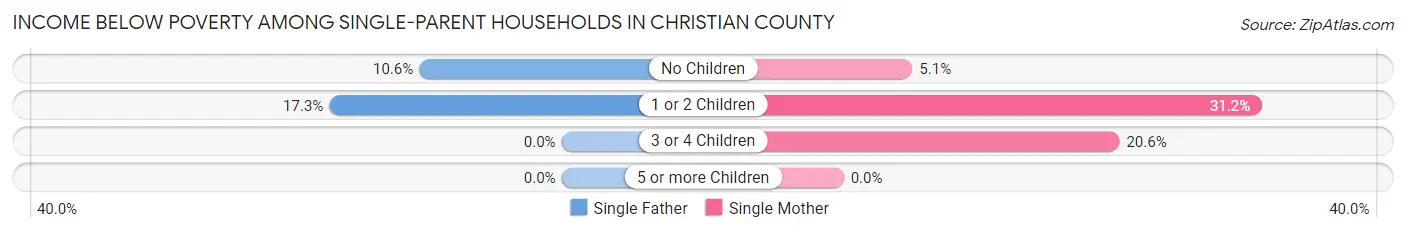
| Children | Single Father | Single Mother |
| No Children | 14 (10.6%) | 23 (5.1%) |
| 1 or 2 Children | 45 (17.3%) | 202 (31.2%) |
| 3 or 4 Children | 0 (0.0%) | 15 (20.5%) |
| 5 or more Children | 0 (0.0%) | 0 (0.0%) |
| Total | 59 (13.3%) | 240 (20.5%) |
Income Below Poverty Among Married-Couple vs Single-Parent Households in Christian County
The poverty data for Christian County shows that 215 of the married-couple family households (3.7%) and 299 of the single-parent households (18.5%) are living below the poverty level. Within the married-couple family households, those with 3 or 4 children have the highest poverty rate, with 40 households (8.5%) falling below the poverty line. Among the single-parent households, those with 1 or 2 children have the highest poverty rate, with 247 household (27.2%) living below poverty.
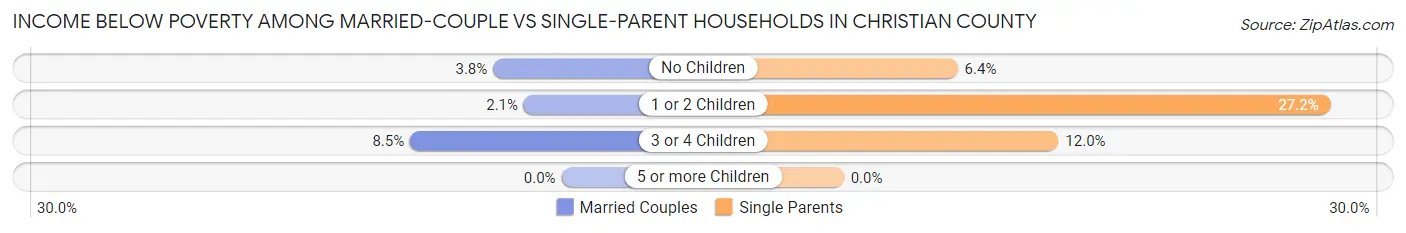
| Children | Married-Couple Families | Single-Parent Households |
| No Children | 139 (3.8%) | 37 (6.4%) |
| 1 or 2 Children | 36 (2.1%) | 247 (27.2%) |
| 3 or 4 Children | 40 (8.5%) | 15 (12.0%) |
| 5 or more Children | 0 (0.0%) | 0 (0.0%) |
| Total | 215 (3.7%) | 299 (18.5%) |
Race in Christian County
The most populous races in Christian County are White / Caucasian (31,947 | 94.3%), Black / African American (889 | 2.6%), and Hispanic or Latino (661 | 1.9%).
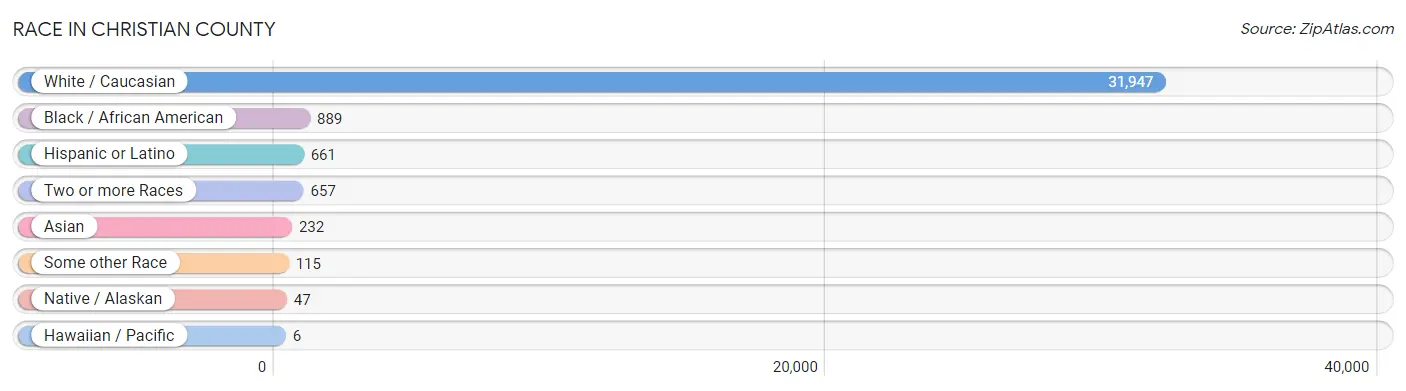
| Race | # Population | % Population |
| Asian | 232 | 0.7% |
| Black / African American | 889 | 2.6% |
| Hawaiian / Pacific | 6 | 0.0% |
| Hispanic or Latino | 661 | 1.9% |
| Native / Alaskan | 47 | 0.1% |
| White / Caucasian | 31,947 | 94.3% |
| Two or more Races | 657 | 1.9% |
| Some other Race | 115 | 0.3% |
| Total | 33,893 | 100.0% |
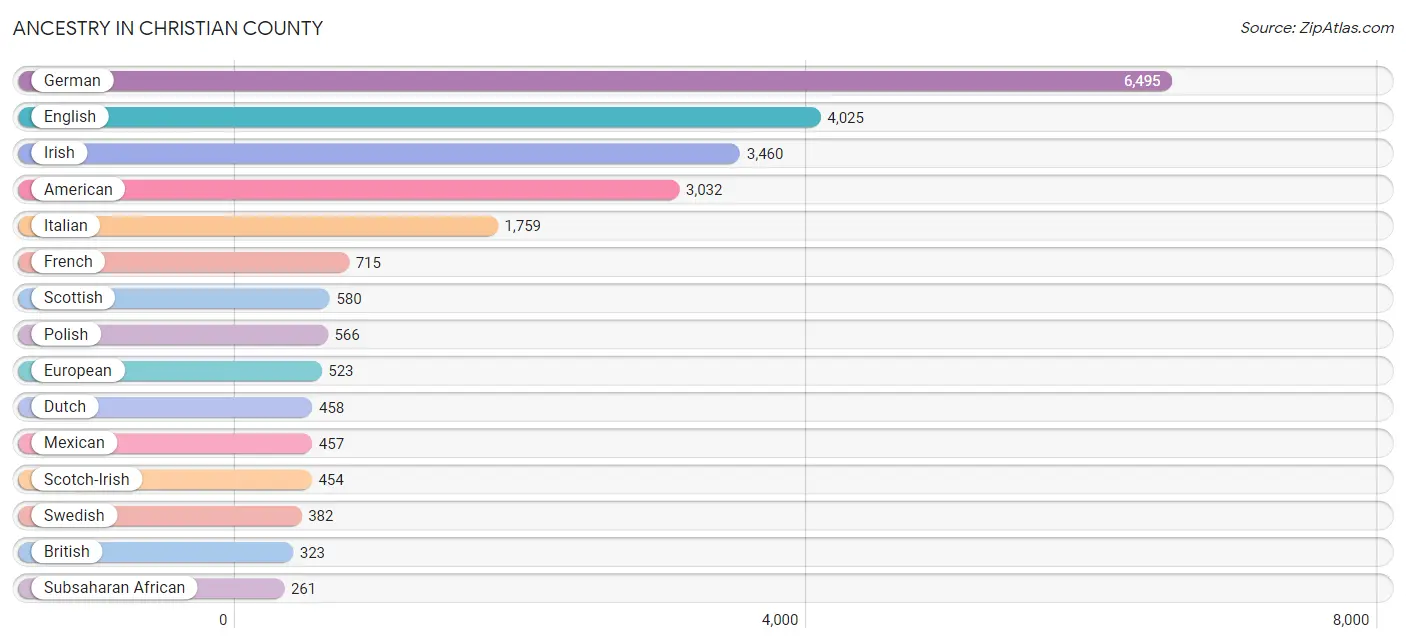
Ancestry in Christian County
The most populous ancestries reported in Christian County are German (6,495 | 19.2%), English (4,025 | 11.9%), Irish (3,460 | 10.2%), American (3,032 | 8.9%), and Italian (1,759 | 5.2%), together accounting for 55.4% of all Christian County residents.
| Ancestry | # Population | % Population |
| African | 219 | 0.6% |
| Alsatian | 9 | 0.0% |
| American | 3,032 | 8.9% |
| Arab | 3 | 0.0% |
| Argentinean | 16 | 0.1% |
| Australian | 31 | 0.1% |
| Austrian | 37 | 0.1% |
| Belgian | 44 | 0.1% |
| Bhutanese | 33 | 0.1% |
| Blackfeet | 18 | 0.1% |
| British | 323 | 0.9% |
| Bulgarian | 8 | 0.0% |
| Burmese | 20 | 0.1% |
| Canadian | 5 | 0.0% |
| Central American | 75 | 0.2% |
| Central American Indian | 4 | 0.0% |
| Cherokee | 54 | 0.2% |
| Chippewa | 5 | 0.0% |
| Choctaw | 5 | 0.0% |
| Colombian | 8 | 0.0% |
| Creek | 6 | 0.0% |
| Croatian | 24 | 0.1% |
| Cuban | 7 | 0.0% |
| Czech | 215 | 0.6% |
| Czechoslovakian | 14 | 0.0% |
| Danish | 55 | 0.2% |
| Dutch | 458 | 1.3% |
| Dutch West Indian | 7 | 0.0% |
| Eastern European | 72 | 0.2% |
| English | 4,025 | 11.9% |
| European | 523 | 1.5% |
| Filipino | 3 | 0.0% |
| French | 715 | 2.1% |
| French American Indian | 15 | 0.0% |
| French Canadian | 24 | 0.1% |
| German | 6,495 | 19.2% |
| Greek | 108 | 0.3% |
| Guamanian / Chamorro | 6 | 0.0% |
| Guatemalan | 50 | 0.2% |
| Hungarian | 61 | 0.2% |
| Indian (Asian) | 38 | 0.1% |
| Irish | 3,460 | 10.2% |
| Italian | 1,759 | 5.2% |
| Japanese | 17 | 0.1% |
| Korean | 1 | 0.0% |
| Lithuanian | 118 | 0.4% |
| Malaysian | 4 | 0.0% |
| Mexican | 457 | 1.3% |
| Mexican American Indian | 4 | 0.0% |
| New Zealander | 5 | 0.0% |
| Nigerian | 42 | 0.1% |
| Northern European | 35 | 0.1% |
| Norwegian | 135 | 0.4% |
| Palestinian | 3 | 0.0% |
| Pennsylvania German | 3 | 0.0% |
| Polish | 566 | 1.7% |
| Portuguese | 21 | 0.1% |
| Puerto Rican | 59 | 0.2% |
| Romanian | 7 | 0.0% |
| Russian | 21 | 0.1% |
| Salvadoran | 25 | 0.1% |
| Scandinavian | 13 | 0.0% |
| Scotch-Irish | 454 | 1.3% |
| Scottish | 580 | 1.7% |
| Serbian | 4 | 0.0% |
| Slavic | 1 | 0.0% |
| Slovak | 152 | 0.4% |
| Slovene | 22 | 0.1% |
| South American | 24 | 0.1% |
| Spanish | 21 | 0.1% |
| Sri Lankan | 51 | 0.2% |
| Subsaharan African | 261 | 0.8% |
| Swedish | 382 | 1.1% |
| Swiss | 36 | 0.1% |
| Thai | 124 | 0.4% |
| Welsh | 104 | 0.3% |
| Yugoslavian | 16 | 0.1% | View All 77 Rows |
Immigrants in Christian County
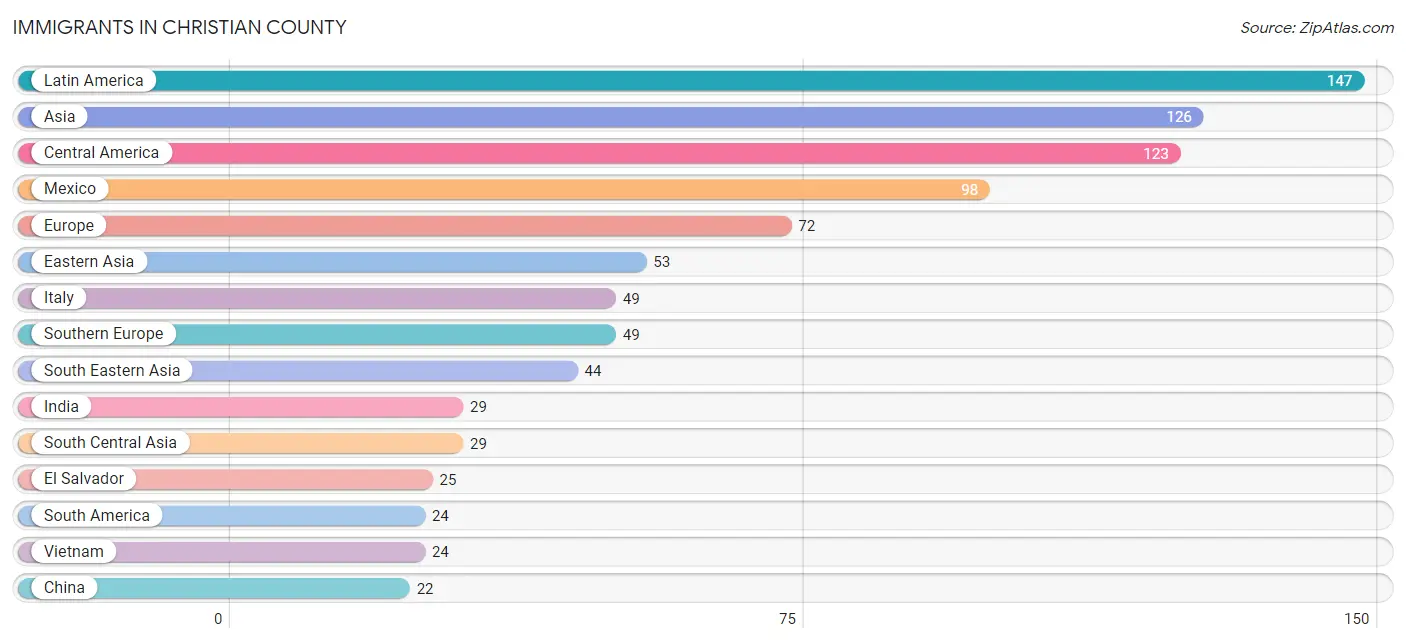
The most numerous immigrant groups reported in Christian County came from Latin America (147 | 0.4%), Asia (126 | 0.4%), Central America (123 | 0.4%), Mexico (98 | 0.3%), and Europe (72 | 0.2%), together accounting for 1.7% of all Christian County residents.
| Immigration Origin | # Population | % Population |
| Argentina | 16 | 0.1% |
| Asia | 126 | 0.4% |
| Cambodia | 8 | 0.0% |
| Central America | 123 | 0.4% |
| China | 22 | 0.1% |
| Colombia | 8 | 0.0% |
| Eastern Asia | 53 | 0.2% |
| El Salvador | 25 | 0.1% |
| England | 18 | 0.1% |
| Europe | 72 | 0.2% |
| Germany | 3 | 0.0% |
| India | 29 | 0.1% |
| Indonesia | 1 | 0.0% |
| Italy | 49 | 0.1% |
| Japan | 1 | 0.0% |
| Korea | 19 | 0.1% |
| Laos | 4 | 0.0% |
| Latin America | 147 | 0.4% |
| Mexico | 98 | 0.3% |
| Netherlands | 2 | 0.0% |
| Northern Europe | 18 | 0.1% |
| Philippines | 7 | 0.0% |
| South America | 24 | 0.1% |
| South Central Asia | 29 | 0.1% |
| South Eastern Asia | 44 | 0.1% |
| Southern Europe | 49 | 0.1% |
| Vietnam | 24 | 0.1% |
| Western Europe | 5 | 0.0% | View All 28 Rows |
Sex and Age in Christian County
Sex and Age in Christian County
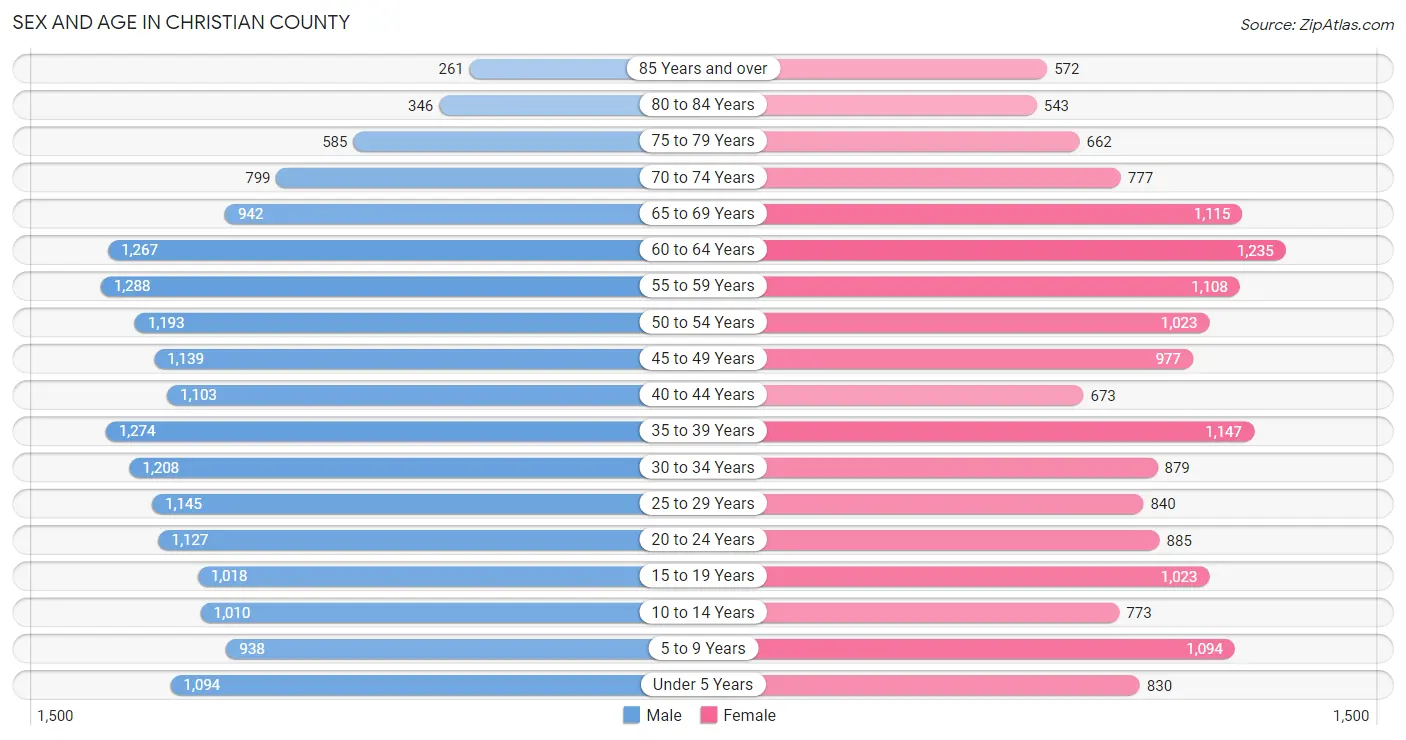
The most populous age groups in Christian County are 55 to 59 Years (1,288 | 7.3%) for men and 60 to 64 Years (1,235 | 7.6%) for women.
| Age Bracket | Male | Female |
| Under 5 Years | 1,094 (6.2%) | 830 (5.1%) |
| 5 to 9 Years | 938 (5.3%) | 1,094 (6.8%) |
| 10 to 14 Years | 1,010 (5.7%) | 773 (4.8%) |
| 15 to 19 Years | 1,018 (5.7%) | 1,023 (6.3%) |
| 20 to 24 Years | 1,127 (6.4%) | 885 (5.5%) |
| 25 to 29 Years | 1,145 (6.5%) | 840 (5.2%) |
| 30 to 34 Years | 1,208 (6.8%) | 879 (5.4%) |
| 35 to 39 Years | 1,274 (7.2%) | 1,147 (7.1%) |
| 40 to 44 Years | 1,103 (6.2%) | 673 (4.2%) |
| 45 to 49 Years | 1,139 (6.4%) | 977 (6.0%) |
| 50 to 54 Years | 1,193 (6.7%) | 1,023 (6.3%) |
| 55 to 59 Years | 1,288 (7.3%) | 1,108 (6.9%) |
| 60 to 64 Years | 1,267 (7.1%) | 1,235 (7.6%) |
| 65 to 69 Years | 942 (5.3%) | 1,115 (6.9%) |
| 70 to 74 Years | 799 (4.5%) | 777 (4.8%) |
| 75 to 79 Years | 585 (3.3%) | 662 (4.1%) |
| 80 to 84 Years | 346 (1.9%) | 543 (3.4%) |
| 85 Years and over | 261 (1.5%) | 572 (3.5%) |
| Total | 17,737 (100.0%) | 16,156 (100.0%) |
Families and Households in Christian County
Median Family Size in Christian County
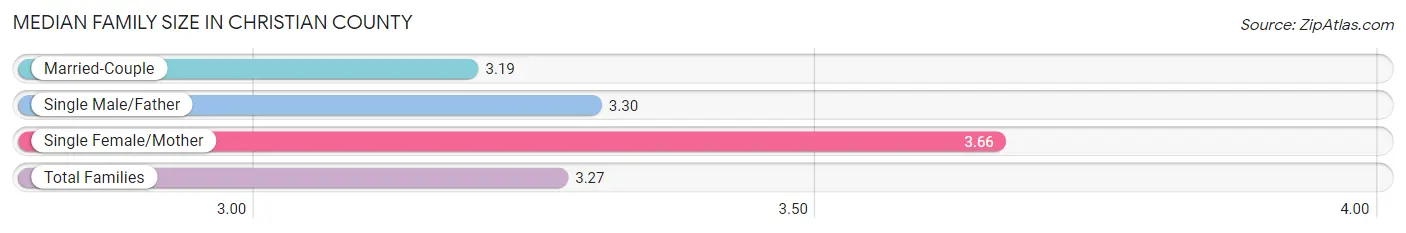
The median family size in Christian County is 3.27 persons per family, with single female/mother families (1,170 | 15.7%) accounting for the largest median family size of 3.66 persons per family. On the other hand, married-couple families (5,847 | 78.4%) represent the smallest median family size with 3.19 persons per family.
| Family Type | # Families | Family Size |
| Married-Couple | 5,847 (78.4%) | 3.19 |
| Single Male/Father | 444 (5.9%) | 3.30 |
| Single Female/Mother | 1,170 (15.7%) | 3.66 |
| Total Families | 7,461 (100.0%) | 3.27 |
Median Household Size in Christian County
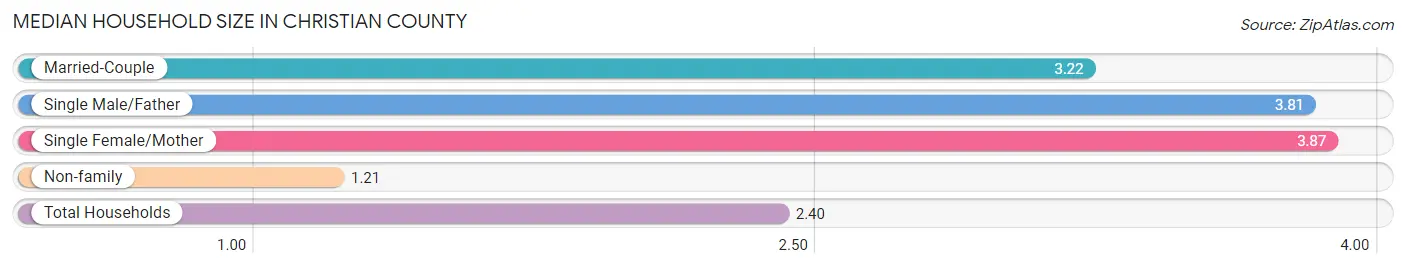
The median household size in Christian County is 2.40 persons per household, with single female/mother households (1,170 | 8.7%) accounting for the largest median household size of 3.87 persons per household. non-family households (6,012 | 44.6%) represent the smallest median household size with 1.21 persons per household.
| Household Type | # Households | Household Size |
| Married-Couple | 5,847 (43.4%) | 3.22 |
| Single Male/Father | 444 (3.3%) | 3.81 |
| Single Female/Mother | 1,170 (8.7%) | 3.87 |
| Non-family | 6,012 (44.6%) | 1.21 |
| Total Households | 13,473 (100.0%) | 2.40 |
Household Size by Marriage Status in Christian County
Out of a total of 13,473 households in Christian County, 7,461 (55.4%) are family households, while 6,012 (44.6%) are nonfamily households. The most numerous type of family households are 2-person households, comprising 3,767, and the most common type of nonfamily households are 1-person households, comprising 5,083.
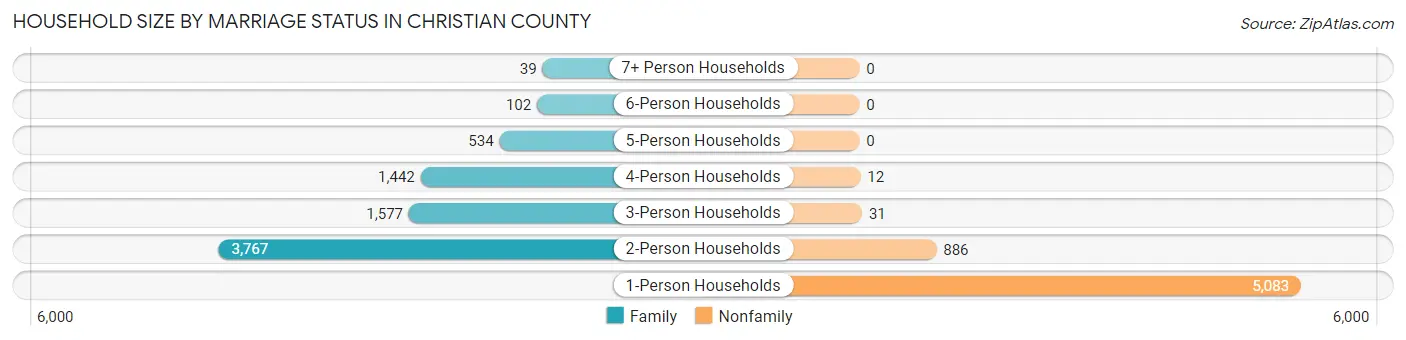
| Household Size | Family Households | Nonfamily Households |
| 1-Person Households | - | 5,083 (37.7%) |
| 2-Person Households | 3,767 (28.0%) | 886 (6.6%) |
| 3-Person Households | 1,577 (11.7%) | 31 (0.2%) |
| 4-Person Households | 1,442 (10.7%) | 12 (0.1%) |
| 5-Person Households | 534 (4.0%) | 0 (0.0%) |
| 6-Person Households | 102 (0.8%) | 0 (0.0%) |
| 7+ Person Households | 39 (0.3%) | 0 (0.0%) |
| Total | 7,461 (55.4%) | 6,012 (44.6%) |
Female Fertility in Christian County
Fertility by Age in Christian County
Average fertility rate in Christian County is 43.0 births per 1,000 women. Women in the age bracket of 20 to 34 years have the highest fertility rate with 74.0 births per 1,000 women. Women in the age bracket of 20 to 34 years acount for 68.7% of all women with births.
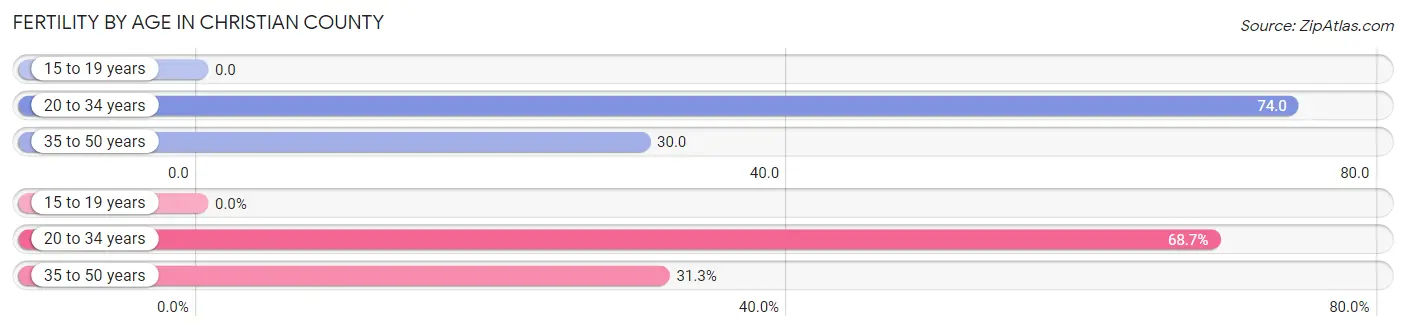
| Age Bracket | Women with Births | Births / 1,000 Women |
| 15 to 19 years | 0 (0.0%) | 0.0 |
| 20 to 34 years | 193 (68.7%) | 74.0 |
| 35 to 50 years | 88 (31.3%) | 30.0 |
| Total | 281 (100.0%) | 43.0 |
Fertility by Age by Marriage Status in Christian County
65.8% of women with births (281) in Christian County are married. The highest percentage of unmarried women with births falls into 35 to 50 years age bracket with 39.8% of them unmarried at the time of birth, while the lowest percentage of unmarried women with births belong to 20 to 34 years age bracket with 31.6% of them unmarried.
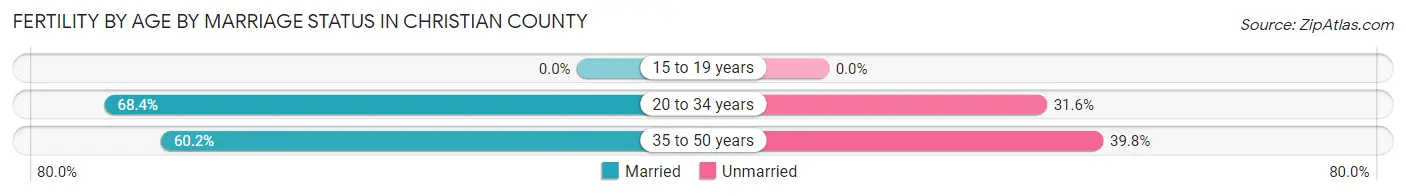
| Age Bracket | Married | Unmarried |
| 15 to 19 years | 0 (0.0%) | 0 (0.0%) |
| 20 to 34 years | 132 (68.4%) | 61 (31.6%) |
| 35 to 50 years | 53 (60.2%) | 35 (39.8%) |
| Total | 185 (65.8%) | 96 (34.2%) |
Fertility by Education in Christian County
Average fertility rate in Christian County is 43.0 births per 1,000 women. Women with the education attainment of graduate degree have the highest fertility rate of 66.0 births per 1,000 women, while women with the education attainment of bachelor's degree have the lowest fertility at 26.0 births per 1,000 women. Women with the education attainment of college or associate's degree represent 43.4% of all women with births.
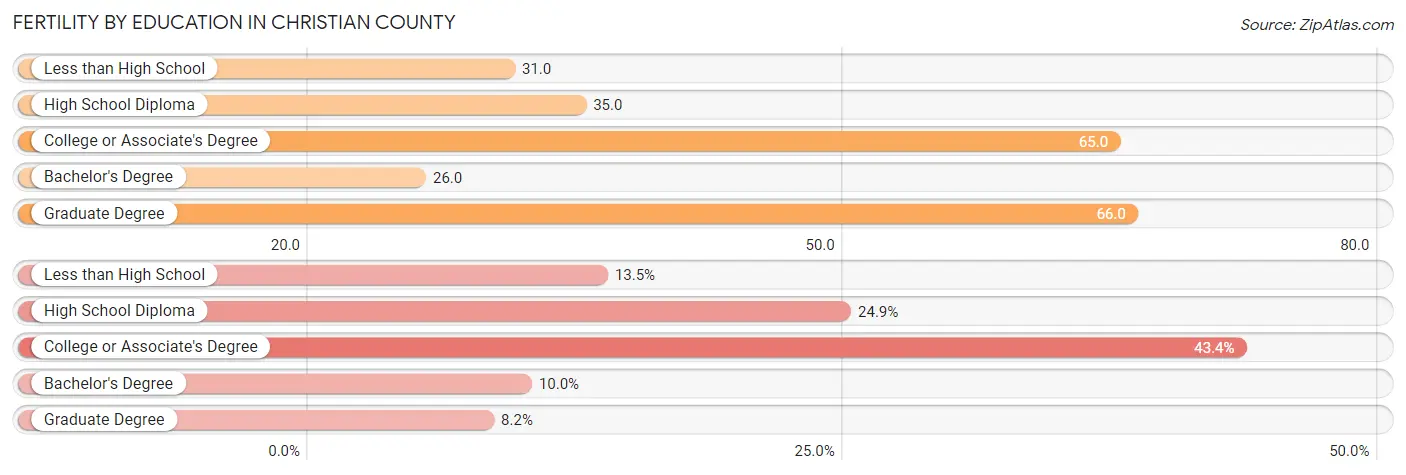
| Educational Attainment | Women with Births | Births / 1,000 Women |
| Less than High School | 38 (13.5%) | 31.0 |
| High School Diploma | 70 (24.9%) | 35.0 |
| College or Associate's Degree | 122 (43.4%) | 65.0 |
| Bachelor's Degree | 28 (10.0%) | 26.0 |
| Graduate Degree | 23 (8.2%) | 66.0 |
| Total | 281 (100.0%) | 43.0 |
Fertility by Education by Marriage Status in Christian County
34.2% of women with births in Christian County are unmarried. Women with the educational attainment of graduate degree are most likely to be married with 100.0% of them married at childbirth, while women with the educational attainment of college or associate's degree are least likely to be married with 48.4% of them unmarried at childbirth.
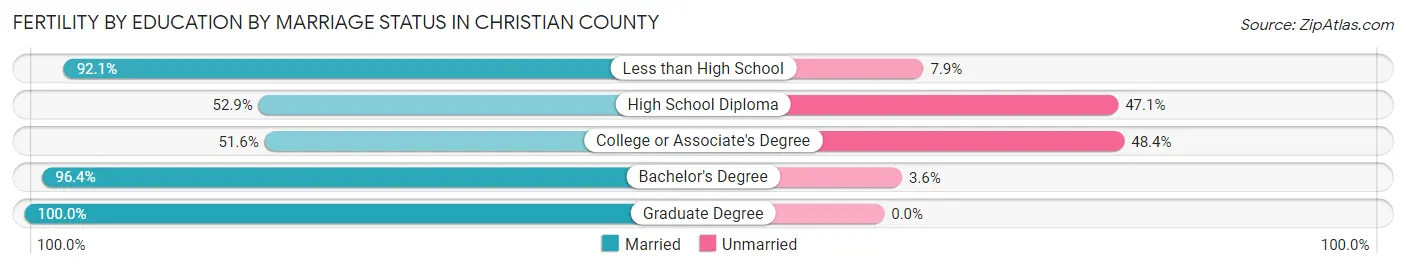
| Educational Attainment | Married | Unmarried |
| Less than High School | 35 (92.1%) | 3 (7.9%) |
| High School Diploma | 37 (52.9%) | 33 (47.1%) |
| College or Associate's Degree | 63 (51.6%) | 59 (48.4%) |
| Bachelor's Degree | 27 (96.4%) | 1 (3.6%) |
| Graduate Degree | 23 (100.0%) | 0 (0.0%) |
| Total | 185 (65.8%) | 96 (34.2%) |
Employment Characteristics in Christian County
Employment by Class of Employer in Christian County
Among the 14,557 employed individuals in Christian County, private company employees (9,733 | 66.9%), not-for-profit organizations (1,310 | 9.0%), and local government employees (1,089 | 7.5%) make up the most common classes of employment.
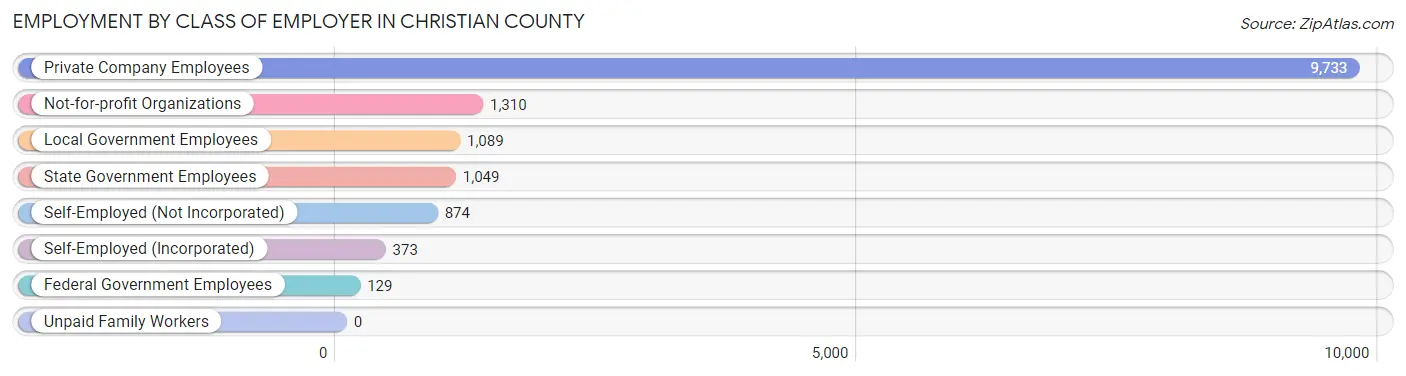
| Employer Class | # Employees | % Employees |
| Private Company Employees | 9,733 | 66.9% |
| Self-Employed (Incorporated) | 373 | 2.6% |
| Self-Employed (Not Incorporated) | 874 | 6.0% |
| Not-for-profit Organizations | 1,310 | 9.0% |
| Local Government Employees | 1,089 | 7.5% |
| State Government Employees | 1,049 | 7.2% |
| Federal Government Employees | 129 | 0.9% |
| Unpaid Family Workers | 0 | 0.0% |
| Total | 14,557 | 100.0% |
Employment Status by Age in Christian County
According to the labor force statistics for Christian County, out of the total population over 16 years of age (27,732), 55.6% or 15,419 individuals are in the labor force, with 4.4% or 678 of them unemployed. The age group with the highest labor force participation rate is 45 to 54 years, with 80.1% or 3,470 individuals in the labor force. Within the labor force, the 16 to 19 years age range has the highest percentage of unemployed individuals, with 14.9% or 104 of them being unemployed.
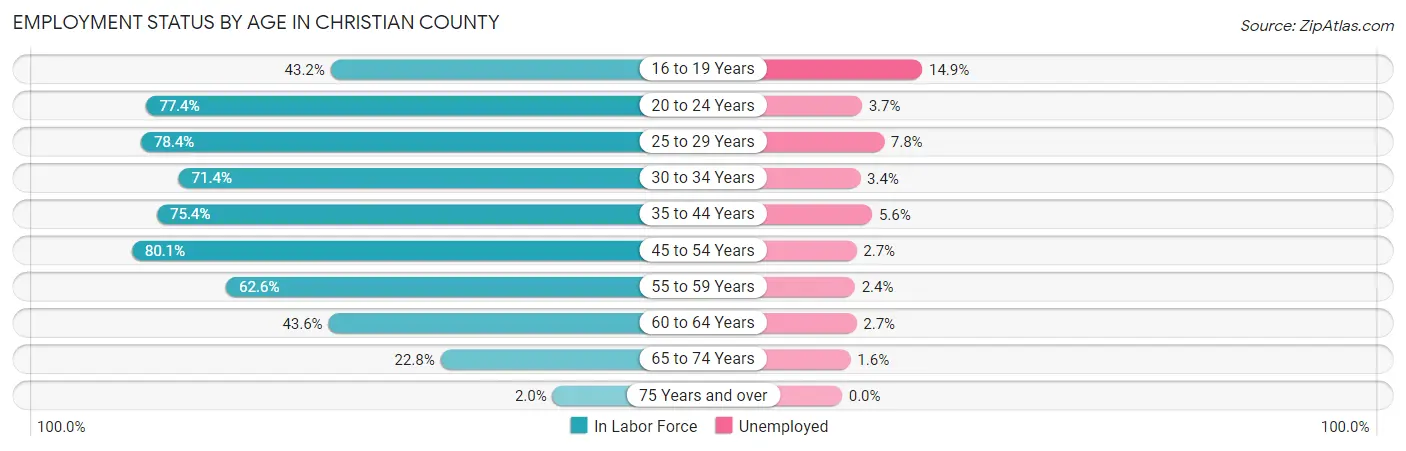
| Age Bracket | In Labor Force | Unemployed |
| 16 to 19 Years | 699 (43.2%) | 104 (14.9%) |
| 20 to 24 Years | 1,557 (77.4%) | 58 (3.7%) |
| 25 to 29 Years | 1,556 (78.4%) | 121 (7.8%) |
| 30 to 34 Years | 1,490 (71.4%) | 51 (3.4%) |
| 35 to 44 Years | 3,165 (75.4%) | 177 (5.6%) |
| 45 to 54 Years | 3,470 (80.1%) | 94 (2.7%) |
| 55 to 59 Years | 1,500 (62.6%) | 36 (2.4%) |
| 60 to 64 Years | 1,091 (43.6%) | 29 (2.7%) |
| 65 to 74 Years | 828 (22.8%) | 13 (1.6%) |
| 75 Years and over | 59 (2.0%) | 0 (0.0%) |
| Total | 15,419 (55.6%) | 678 (4.4%) |
Employment Status by Educational Attainment in Christian County
According to labor force statistics for Christian County, 70.1% of individuals (12,267) out of the total population between 25 and 64 years of age (17,499) are in the labor force, with 4.1% or 503 of them being unemployed. The group with the highest labor force participation rate are those with the educational attainment of bachelor's degree or higher, with 87.3% or 2,767 individuals in the labor force. Within the labor force, individuals with less than high school education have the highest percentage of unemployment, with 7.0% or 45 of them being unemployed.
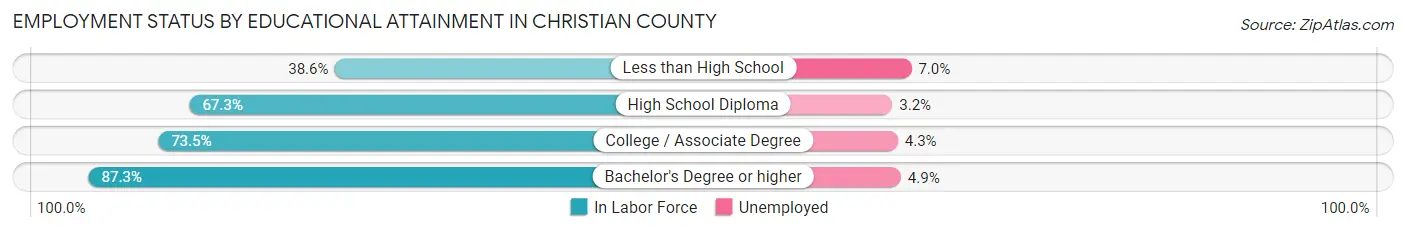
| Educational Attainment | In Labor Force | Unemployed |
| Less than High School | 638 (38.6%) | 116 (7.0%) |
| High School Diploma | 4,887 (67.3%) | 232 (3.2%) |
| College / Associate Degree | 3,979 (73.5%) | 233 (4.3%) |
| Bachelor's Degree or higher | 2,767 (87.3%) | 155 (4.9%) |
| Total | 12,267 (70.1%) | 717 (4.1%) |
Employment Occupations by Sex in Christian County
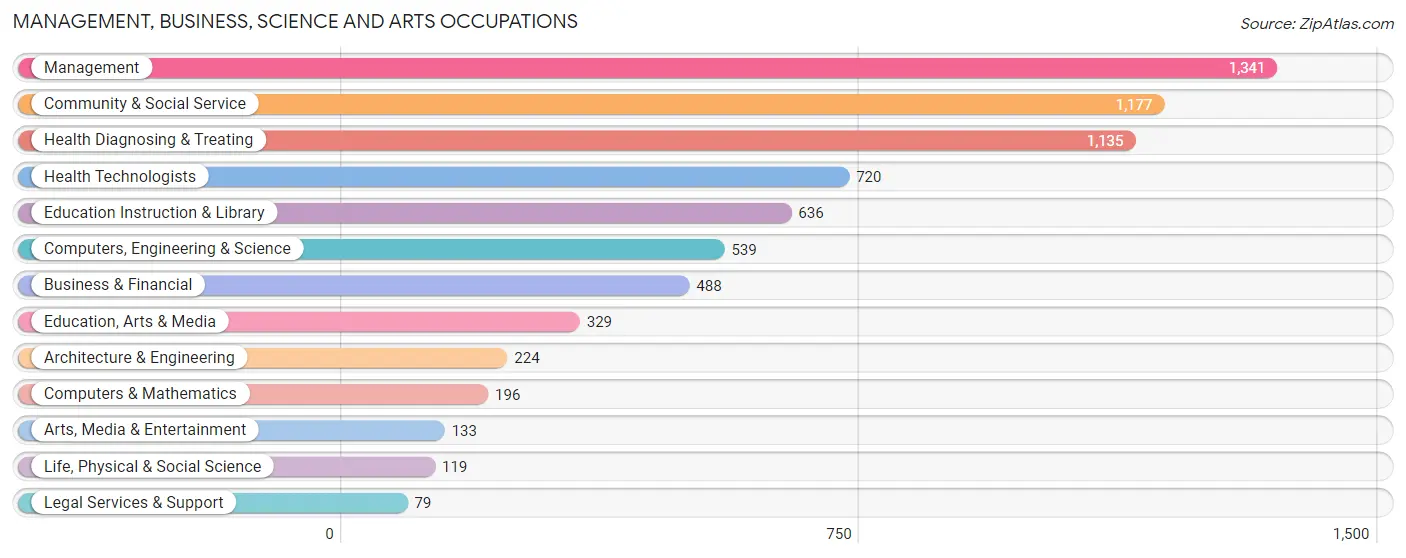
Management, Business, Science and Arts Occupations
The most common Management, Business, Science and Arts occupations in Christian County are Management (1,341 | 9.1%), Community & Social Service (1,177 | 8.0%), Health Diagnosing & Treating (1,135 | 7.7%), Health Technologists (720 | 4.9%), and Education Instruction & Library (636 | 4.3%).
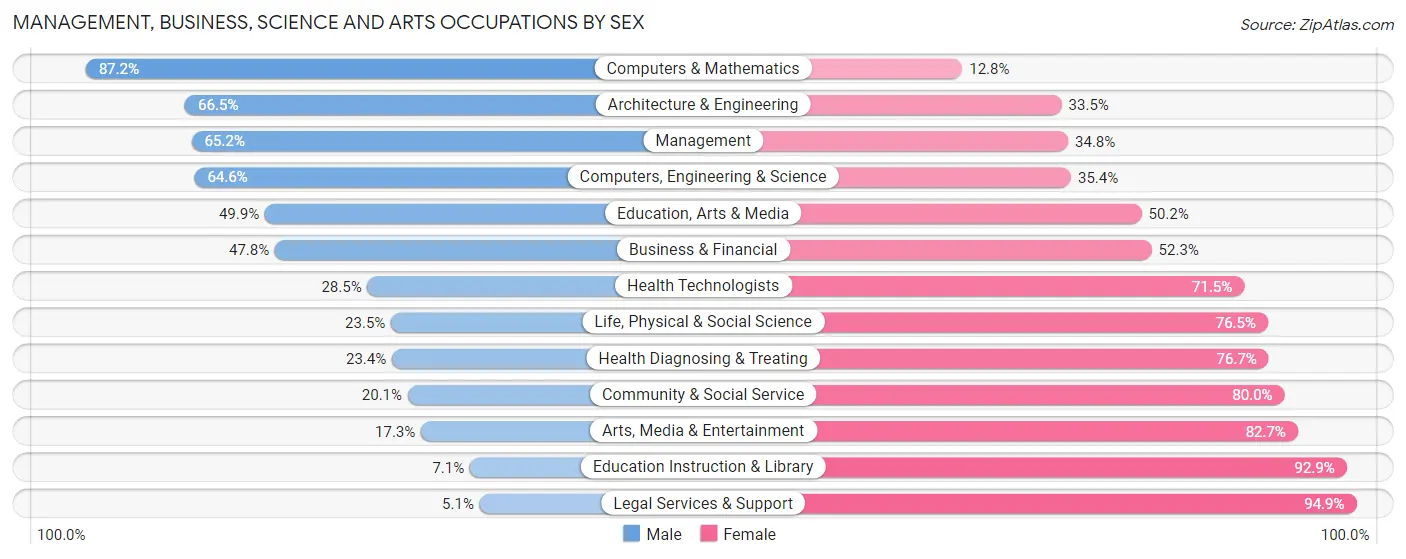
Management, Business, Science and Arts Occupations by Sex
Within the Management, Business, Science and Arts occupations in Christian County, the most male-oriented occupations are Computers & Mathematics (87.2%), Architecture & Engineering (66.5%), and Management (65.2%), while the most female-oriented occupations are Legal Services & Support (94.9%), Education Instruction & Library (92.9%), and Arts, Media & Entertainment (82.7%).
| Occupation | Male | Female |
| Management | 874 (65.2%) | 467 (34.8%) |
| Business & Financial | 233 (47.7%) | 255 (52.2%) |
| Computers, Engineering & Science | 348 (64.6%) | 191 (35.4%) |
| Computers & Mathematics | 171 (87.2%) | 25 (12.8%) |
| Architecture & Engineering | 149 (66.5%) | 75 (33.5%) |
| Life, Physical & Social Science | 28 (23.5%) | 91 (76.5%) |
| Community & Social Service | 236 (20.1%) | 941 (79.9%) |
| Education, Arts & Media | 164 (49.8%) | 165 (50.1%) |
| Legal Services & Support | 4 (5.1%) | 75 (94.9%) |
| Education Instruction & Library | 45 (7.1%) | 591 (92.9%) |
| Arts, Media & Entertainment | 23 (17.3%) | 110 (82.7%) |
| Health Diagnosing & Treating | 265 (23.4%) | 870 (76.6%) |
| Health Technologists | 205 (28.5%) | 515 (71.5%) |
| Total (Category) | 1,956 (41.8%) | 2,724 (58.2%) |
| Total (Overall) | 7,794 (52.9%) | 6,927 (47.1%) |
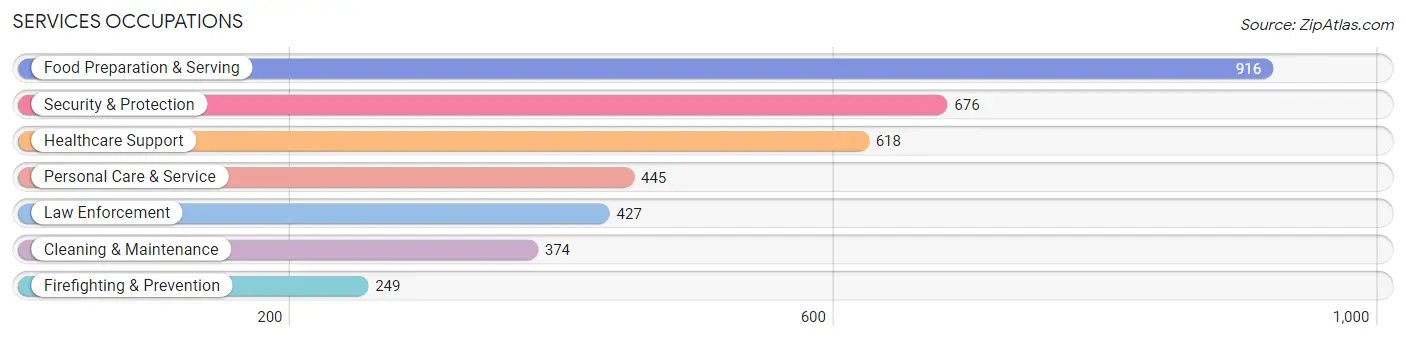
Services Occupations
The most common Services occupations in Christian County are Food Preparation & Serving (916 | 6.2%), Security & Protection (676 | 4.6%), Healthcare Support (618 | 4.2%), Personal Care & Service (445 | 3.0%), and Law Enforcement (427 | 2.9%).
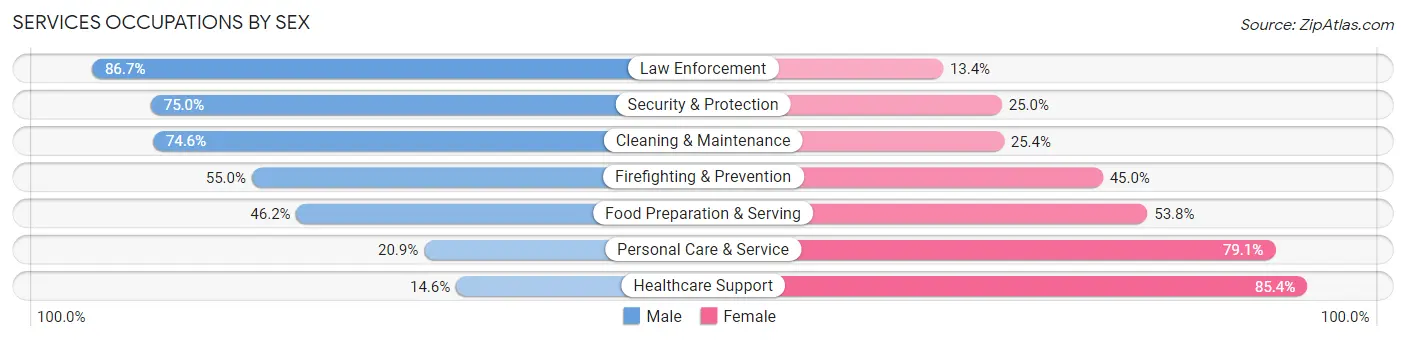
Services Occupations by Sex
Within the Services occupations in Christian County, the most male-oriented occupations are Law Enforcement (86.7%), Security & Protection (75.0%), and Cleaning & Maintenance (74.6%), while the most female-oriented occupations are Healthcare Support (85.4%), Personal Care & Service (79.1%), and Food Preparation & Serving (53.8%).
| Occupation | Male | Female |
| Healthcare Support | 90 (14.6%) | 528 (85.4%) |
| Security & Protection | 507 (75.0%) | 169 (25.0%) |
| Firefighting & Prevention | 137 (55.0%) | 112 (45.0%) |
| Law Enforcement | 370 (86.7%) | 57 (13.4%) |
| Food Preparation & Serving | 423 (46.2%) | 493 (53.8%) |
| Cleaning & Maintenance | 279 (74.6%) | 95 (25.4%) |
| Personal Care & Service | 93 (20.9%) | 352 (79.1%) |
| Total (Category) | 1,392 (46.0%) | 1,637 (54.0%) |
| Total (Overall) | 7,794 (52.9%) | 6,927 (47.1%) |
Sales and Office Occupations
The most common Sales and Office occupations in Christian County are Office & Administration (1,697 | 11.5%), and Sales & Related (1,365 | 9.3%).

Sales and Office Occupations by Sex

| Occupation | Male | Female |
| Sales & Related | 662 (48.5%) | 703 (51.5%) |
| Office & Administration | 249 (14.7%) | 1,448 (85.3%) |
| Total (Category) | 911 (29.7%) | 2,151 (70.3%) |
| Total (Overall) | 7,794 (52.9%) | 6,927 (47.1%) |
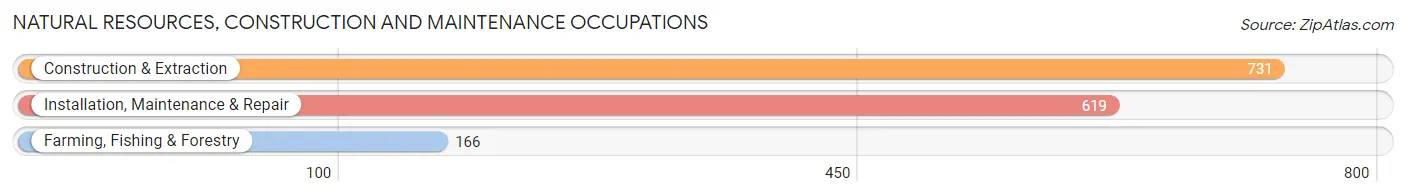
Natural Resources, Construction and Maintenance Occupations
The most common Natural Resources, Construction and Maintenance occupations in Christian County are Construction & Extraction (731 | 5.0%), Installation, Maintenance & Repair (619 | 4.2%), and Farming, Fishing & Forestry (166 | 1.1%).
Natural Resources, Construction and Maintenance Occupations by Sex
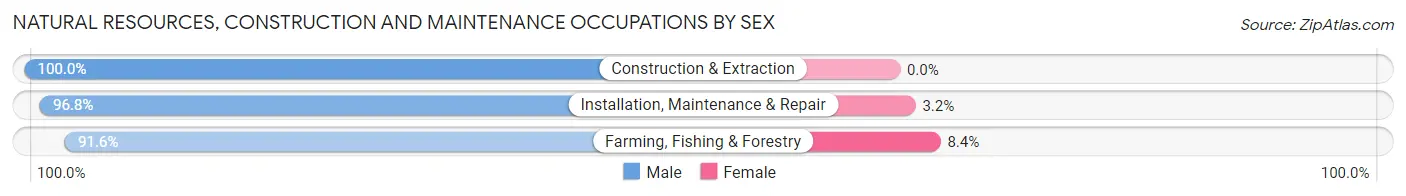
| Occupation | Male | Female |
| Farming, Fishing & Forestry | 152 (91.6%) | 14 (8.4%) |
| Construction & Extraction | 731 (100.0%) | 0 (0.0%) |
| Installation, Maintenance & Repair | 599 (96.8%) | 20 (3.2%) |
| Total (Category) | 1,482 (97.8%) | 34 (2.2%) |
| Total (Overall) | 7,794 (52.9%) | 6,927 (47.1%) |
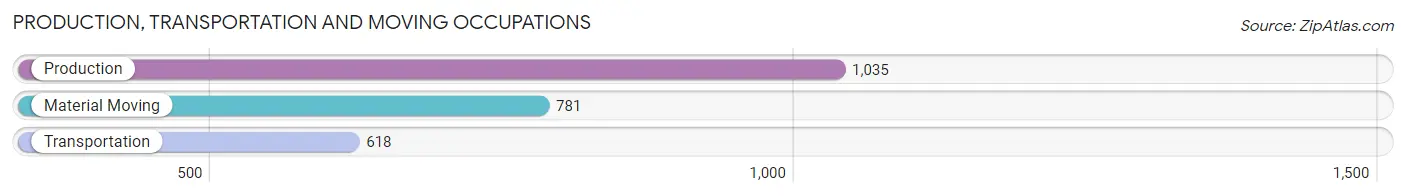
Production, Transportation and Moving Occupations
The most common Production, Transportation and Moving occupations in Christian County are Production (1,035 | 7.0%), Material Moving (781 | 5.3%), and Transportation (618 | 4.2%).
Production, Transportation and Moving Occupations by Sex
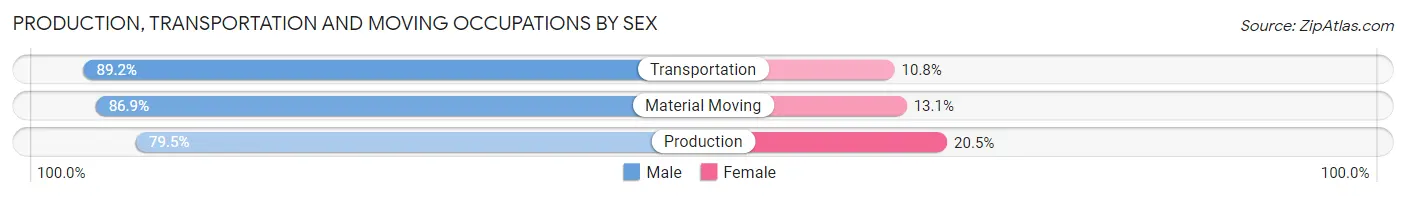
| Occupation | Male | Female |
| Production | 823 (79.5%) | 212 (20.5%) |
| Transportation | 551 (89.2%) | 67 (10.8%) |
| Material Moving | 679 (86.9%) | 102 (13.1%) |
| Total (Category) | 2,053 (84.4%) | 381 (15.7%) |
| Total (Overall) | 7,794 (52.9%) | 6,927 (47.1%) |
Employment Industries by Sex in Christian County
Employment Industries in Christian County
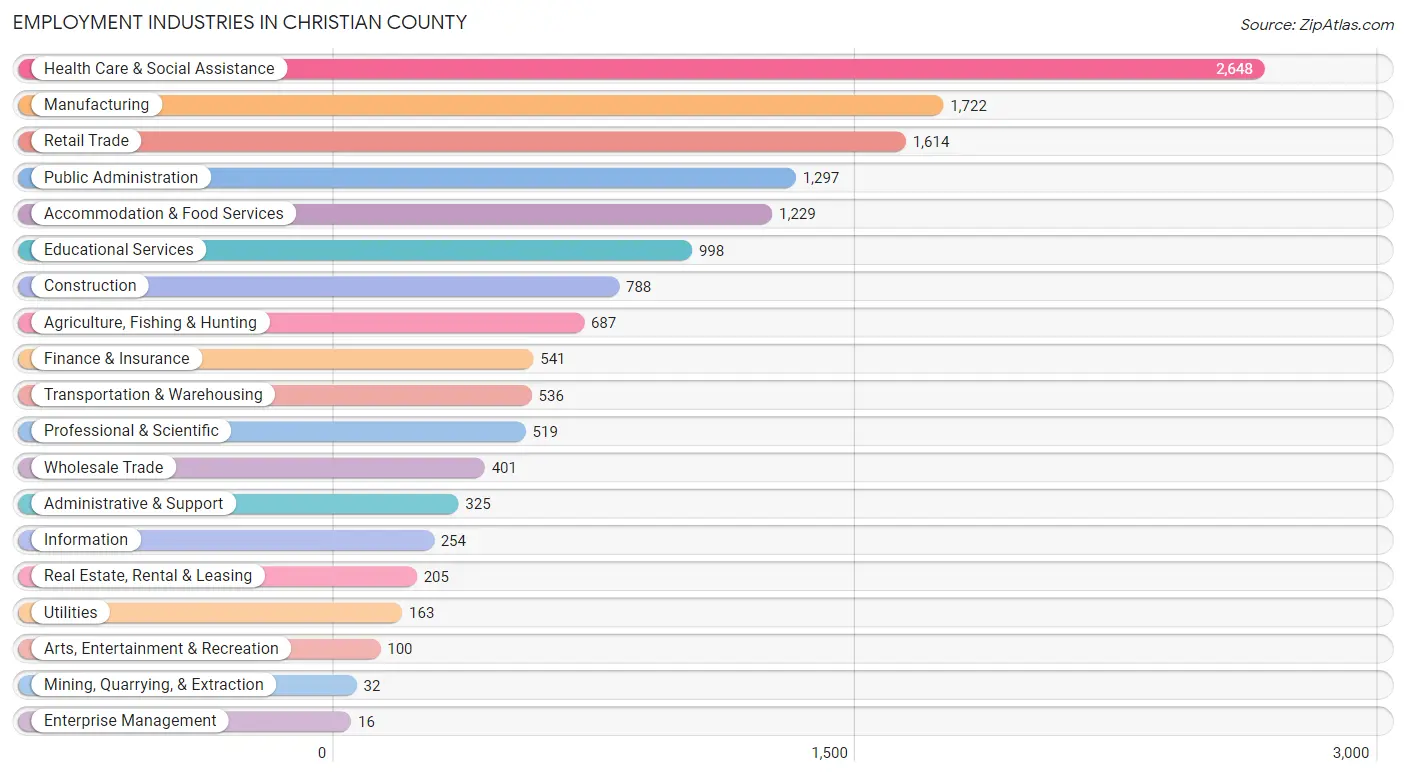
The major employment industries in Christian County include Health Care & Social Assistance (2,648 | 18.0%), Manufacturing (1,722 | 11.7%), Retail Trade (1,614 | 11.0%), Public Administration (1,297 | 8.8%), and Accommodation & Food Services (1,229 | 8.4%).
Employment Industries by Sex in Christian County
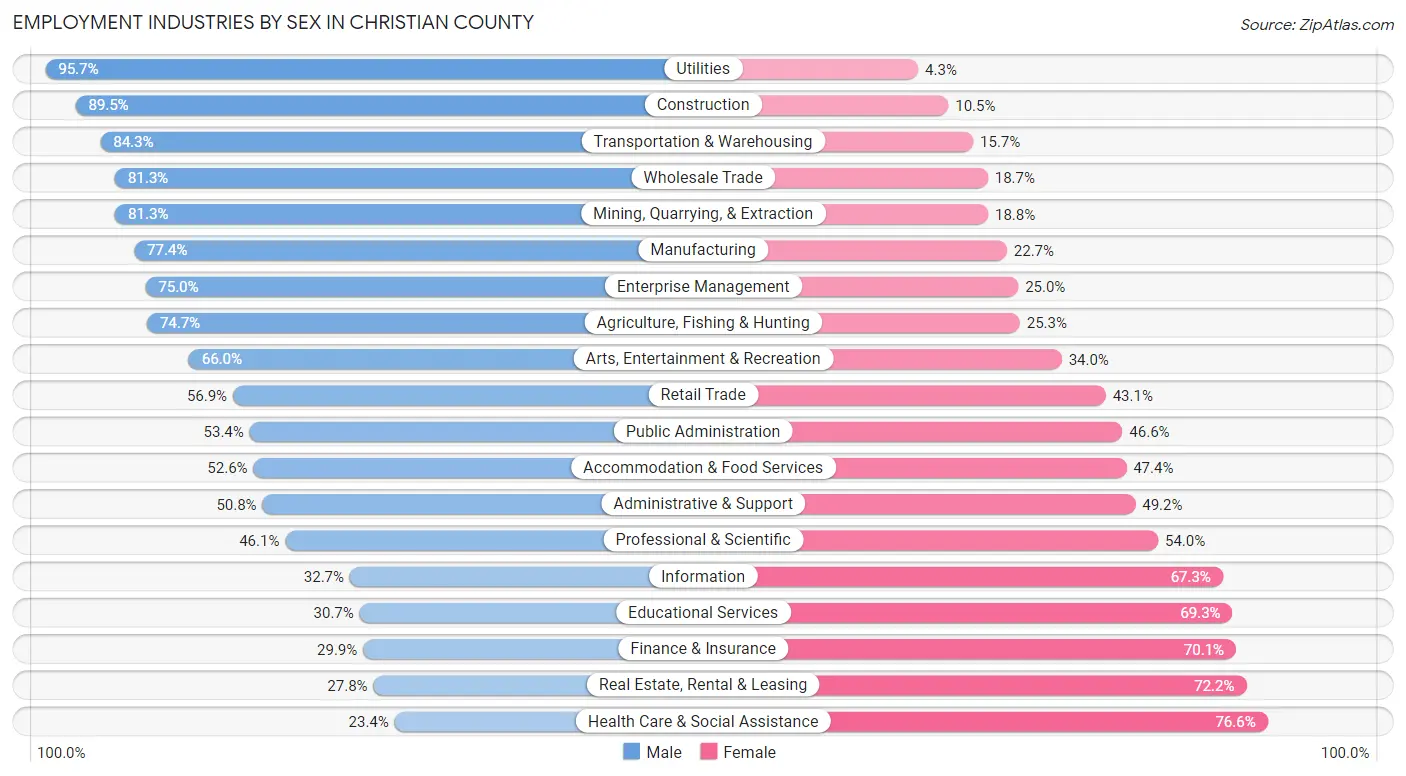
The Christian County industries that see more men than women are Utilities (95.7%), Construction (89.5%), and Transportation & Warehousing (84.3%), whereas the industries that tend to have a higher number of women are Health Care & Social Assistance (76.6%), Real Estate, Rental & Leasing (72.2%), and Finance & Insurance (70.1%).
| Industry | Male | Female |
| Agriculture, Fishing & Hunting | 513 (74.7%) | 174 (25.3%) |
| Mining, Quarrying, & Extraction | 26 (81.2%) | 6 (18.8%) |
| Construction | 705 (89.5%) | 83 (10.5%) |
| Manufacturing | 1,332 (77.3%) | 390 (22.7%) |
| Wholesale Trade | 326 (81.3%) | 75 (18.7%) |
| Retail Trade | 918 (56.9%) | 696 (43.1%) |
| Transportation & Warehousing | 452 (84.3%) | 84 (15.7%) |
| Utilities | 156 (95.7%) | 7 (4.3%) |
| Information | 83 (32.7%) | 171 (67.3%) |
| Finance & Insurance | 162 (29.9%) | 379 (70.1%) |
| Real Estate, Rental & Leasing | 57 (27.8%) | 148 (72.2%) |
| Professional & Scientific | 239 (46.1%) | 280 (53.9%) |
| Enterprise Management | 12 (75.0%) | 4 (25.0%) |
| Administrative & Support | 165 (50.8%) | 160 (49.2%) |
| Educational Services | 306 (30.7%) | 692 (69.3%) |
| Health Care & Social Assistance | 620 (23.4%) | 2,028 (76.6%) |
| Arts, Entertainment & Recreation | 66 (66.0%) | 34 (34.0%) |
| Accommodation & Food Services | 647 (52.6%) | 582 (47.4%) |
| Public Administration | 693 (53.4%) | 604 (46.6%) |
| Total | 7,794 (52.9%) | 6,927 (47.1%) |
Education in Christian County
School Enrollment in Christian County
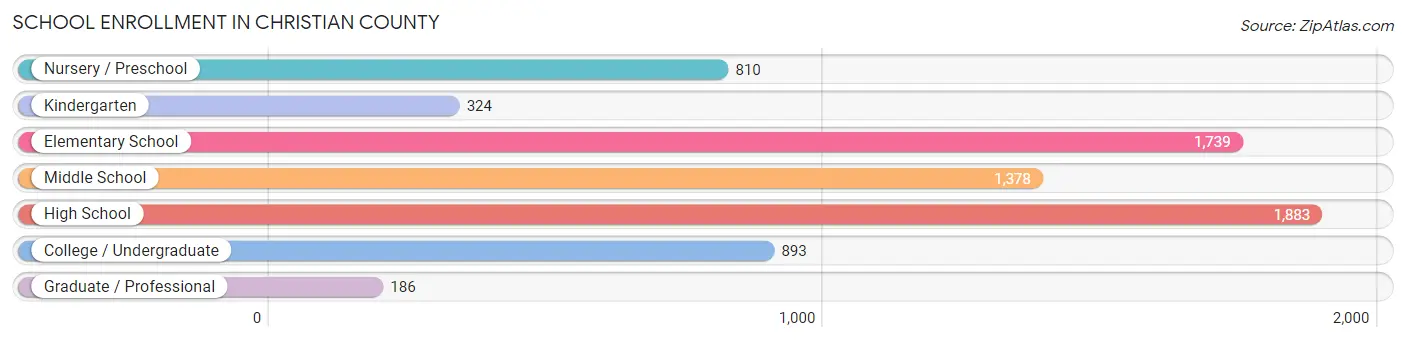
The most common levels of schooling among the 7,213 students in Christian County are high school (1,883 | 26.1%), elementary school (1,739 | 24.1%), and middle school (1,378 | 19.1%).
| School Level | # Students | % Students |
| Nursery / Preschool | 810 | 11.2% |
| Kindergarten | 324 | 4.5% |
| Elementary School | 1,739 | 24.1% |
| Middle School | 1,378 | 19.1% |
| High School | 1,883 | 26.1% |
| College / Undergraduate | 893 | 12.4% |
| Graduate / Professional | 186 | 2.6% |
| Total | 7,213 | 100.0% |
School Enrollment by Age by Funding Source in Christian County
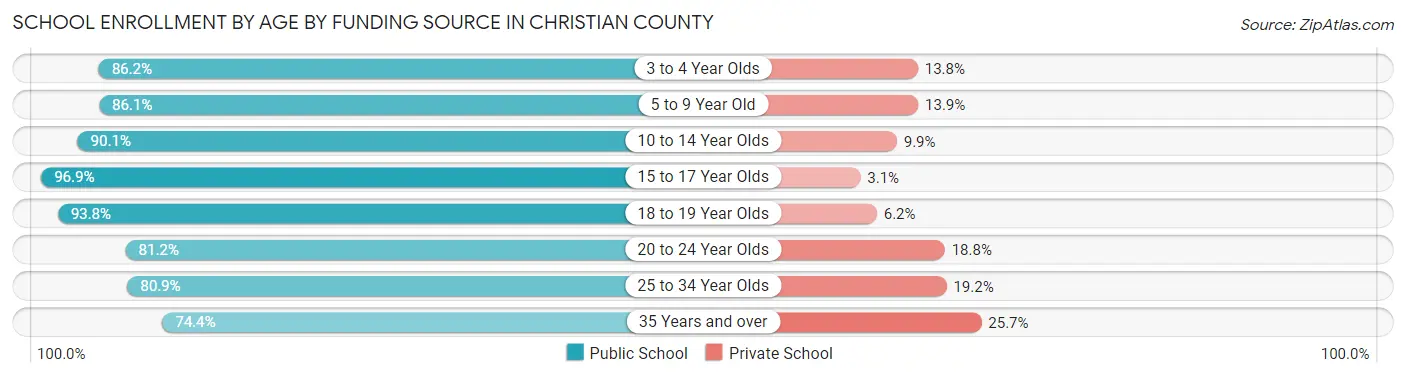
Out of a total of 7,213 students who are enrolled in schools in Christian County, 808 (11.2%) attend a private institution, while the remaining 6,405 (88.8%) are enrolled in public schools. The age group of 35 years and over has the highest likelihood of being enrolled in private schools, with 49 (25.7% in the age bracket) enrolled. Conversely, the age group of 15 to 17 year olds has the lowest likelihood of being enrolled in a private school, with 1,315 (96.9% in the age bracket) attending a public institution.
| Age Bracket | Public School | Private School |
| 3 to 4 Year Olds | 599 (86.2%) | 96 (13.8%) |
| 5 to 9 Year Old | 1,702 (86.1%) | 274 (13.9%) |
| 10 to 14 Year Olds | 1,603 (90.1%) | 176 (9.9%) |
| 15 to 17 Year Olds | 1,315 (96.9%) | 42 (3.1%) |
| 18 to 19 Year Olds | 426 (93.8%) | 28 (6.2%) |
| 20 to 24 Year Olds | 427 (81.2%) | 99 (18.8%) |
| 25 to 34 Year Olds | 190 (80.8%) | 45 (19.2%) |
| 35 Years and over | 142 (74.4%) | 49 (25.7%) |
| Total | 6,405 (88.8%) | 808 (11.2%) |
Educational Attainment by Field of Study in Christian County
Education (827 | 18.0%), business (638 | 13.9%), science & technology (531 | 11.6%), bio, nature & agricultural (445 | 9.7%), and arts & humanities (445 | 9.7%) are the most common fields of study among 4,588 individuals in Christian County who have obtained a bachelor's degree or higher.
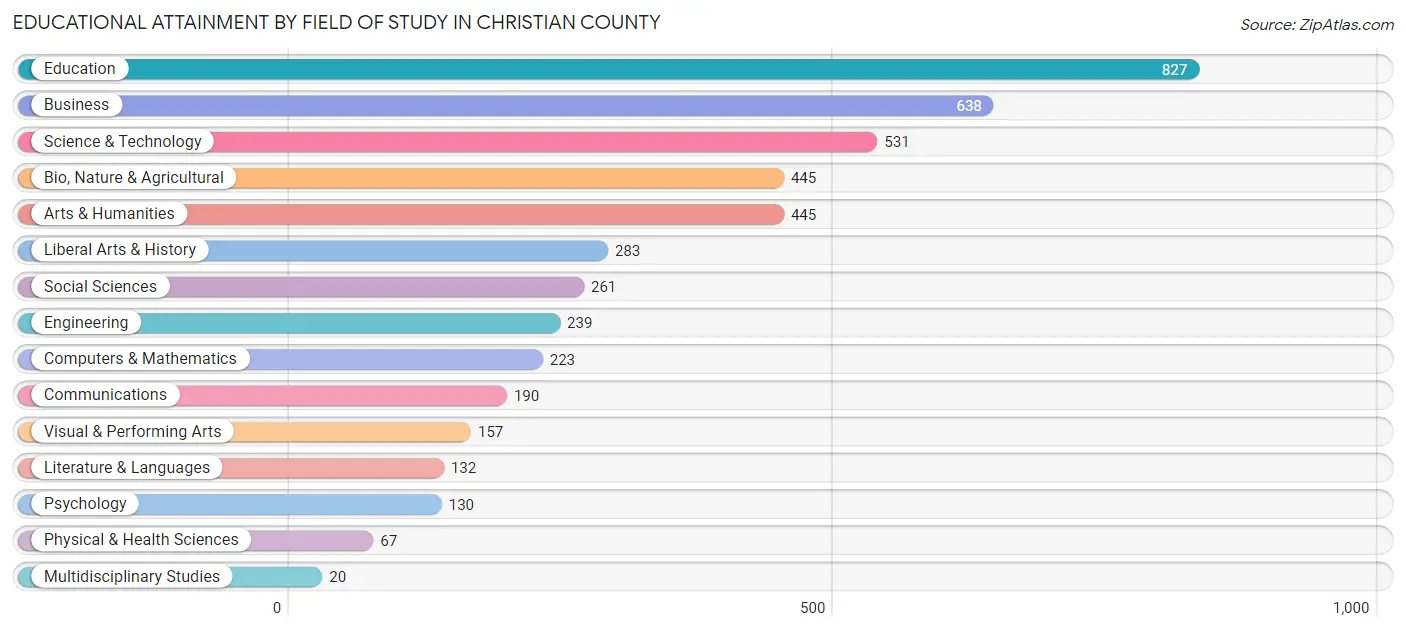
| Field of Study | # Graduates | % Graduates |
| Computers & Mathematics | 223 | 4.9% |
| Bio, Nature & Agricultural | 445 | 9.7% |
| Physical & Health Sciences | 67 | 1.5% |
| Psychology | 130 | 2.8% |
| Social Sciences | 261 | 5.7% |
| Engineering | 239 | 5.2% |
| Multidisciplinary Studies | 20 | 0.4% |
| Science & Technology | 531 | 11.6% |
| Business | 638 | 13.9% |
| Education | 827 | 18.0% |
| Literature & Languages | 132 | 2.9% |
| Liberal Arts & History | 283 | 6.2% |
| Visual & Performing Arts | 157 | 3.4% |
| Communications | 190 | 4.1% |
| Arts & Humanities | 445 | 9.7% |
| Total | 4,588 | 100.0% |
Transportation & Commute in Christian County
Vehicle Availability by Sex in Christian County
The most prevalent vehicle ownership categories in Christian County are males with 2 vehicles (3,427, accounting for 44.3%) and females with 2 vehicles (2,852, making up 50.2%).
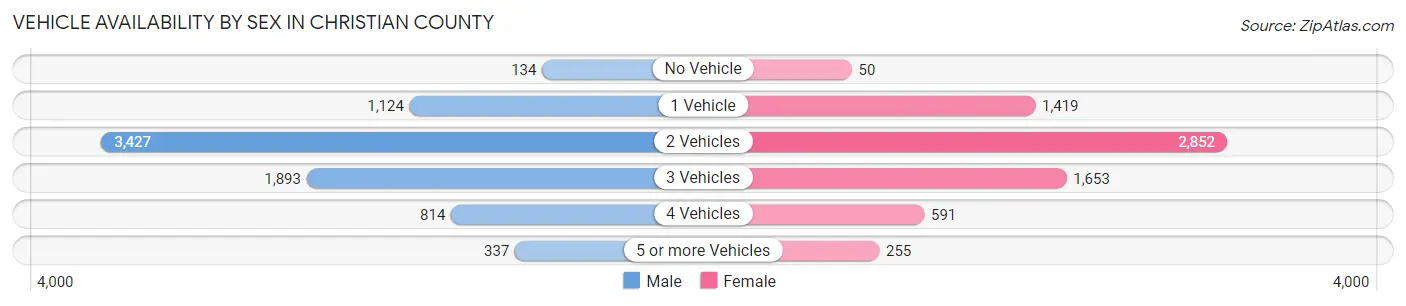
| Vehicles Available | Male | Female |
| No Vehicle | 134 (1.7%) | 50 (0.7%) |
| 1 Vehicle | 1,124 (14.5%) | 1,419 (20.8%) |
| 2 Vehicles | 3,427 (44.3%) | 2,852 (41.8%) |
| 3 Vehicles | 1,893 (24.5%) | 1,653 (24.2%) |
| 4 Vehicles | 814 (10.5%) | 591 (8.7%) |
| 5 or more Vehicles | 337 (4.4%) | 255 (3.7%) |
| Total | 7,729 (100.0%) | 6,820 (100.0%) |
Commute Time in Christian County
The most frequently occuring commute durations in Christian County are 5 to 9 minutes (2,670 commuters, 19.4%), 10 to 14 minutes (1,976 commuters, 14.4%), and 15 to 19 minutes (1,786 commuters, 13.0%).
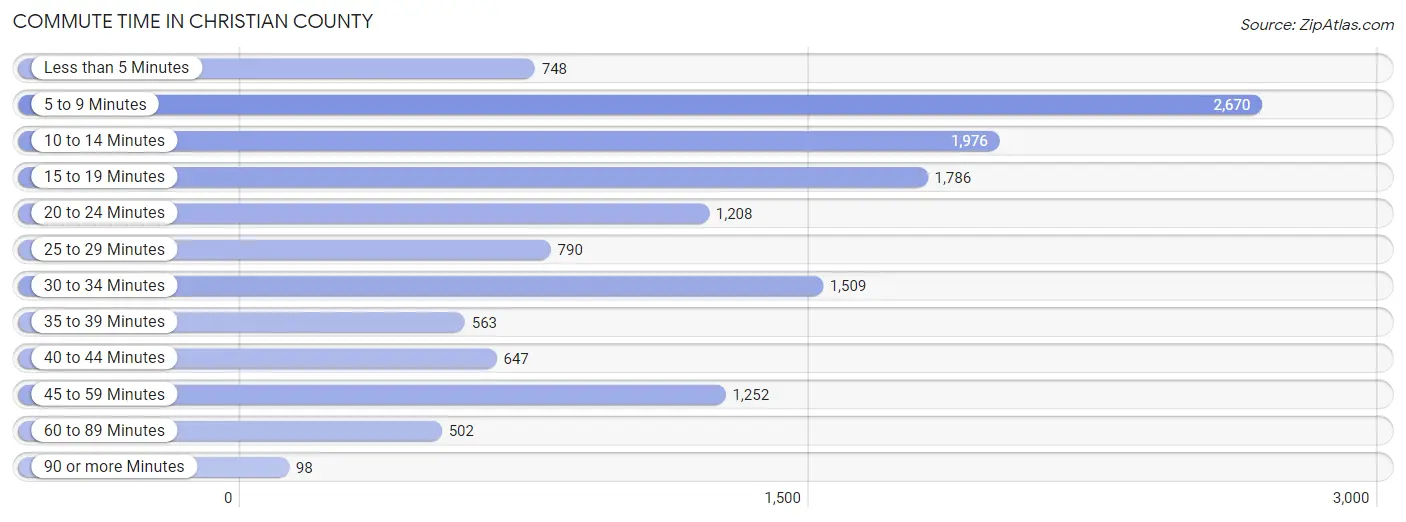
| Commute Time | # Commuters | % Commuters |
| Less than 5 Minutes | 748 | 5.4% |
| 5 to 9 Minutes | 2,670 | 19.4% |
| 10 to 14 Minutes | 1,976 | 14.4% |
| 15 to 19 Minutes | 1,786 | 13.0% |
| 20 to 24 Minutes | 1,208 | 8.8% |
| 25 to 29 Minutes | 790 | 5.8% |
| 30 to 34 Minutes | 1,509 | 11.0% |
| 35 to 39 Minutes | 563 | 4.1% |
| 40 to 44 Minutes | 647 | 4.7% |
| 45 to 59 Minutes | 1,252 | 9.1% |
| 60 to 89 Minutes | 502 | 3.6% |
| 90 or more Minutes | 98 | 0.7% |
Commute Time by Sex in Christian County
The most common commute times in Christian County are 5 to 9 minutes (1,235 commuters, 16.7%) for males and 5 to 9 minutes (1,435 commuters, 22.6%) for females.
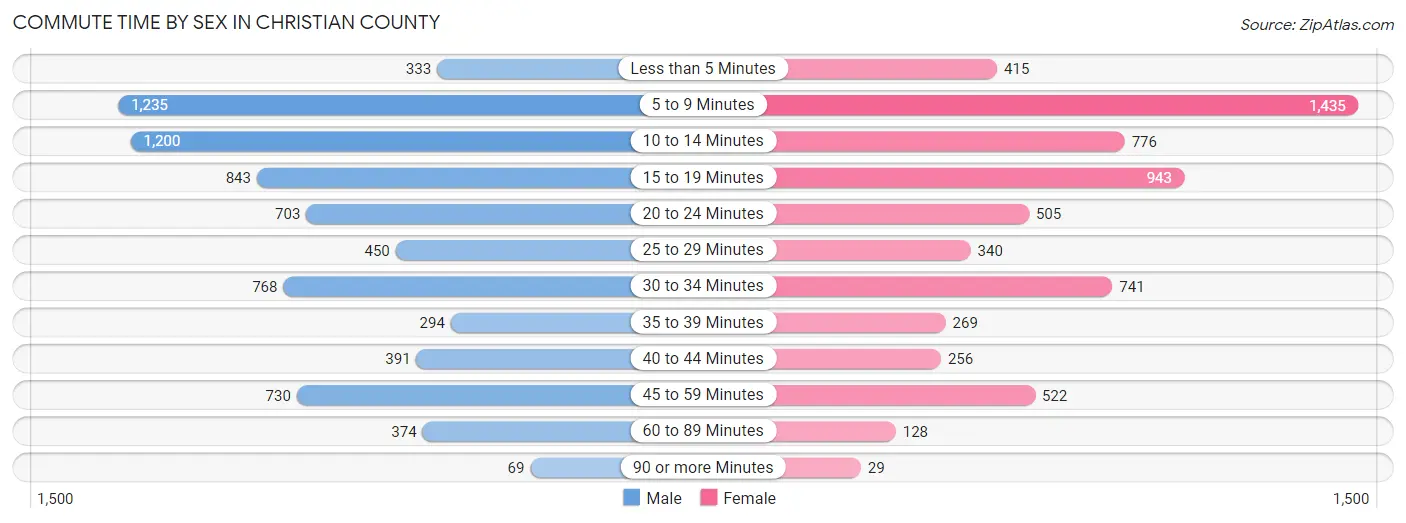
| Commute Time | Male | Female |
| Less than 5 Minutes | 333 (4.5%) | 415 (6.5%) |
| 5 to 9 Minutes | 1,235 (16.7%) | 1,435 (22.6%) |
| 10 to 14 Minutes | 1,200 (16.2%) | 776 (12.2%) |
| 15 to 19 Minutes | 843 (11.4%) | 943 (14.8%) |
| 20 to 24 Minutes | 703 (9.5%) | 505 (7.9%) |
| 25 to 29 Minutes | 450 (6.1%) | 340 (5.3%) |
| 30 to 34 Minutes | 768 (10.4%) | 741 (11.7%) |
| 35 to 39 Minutes | 294 (4.0%) | 269 (4.2%) |
| 40 to 44 Minutes | 391 (5.3%) | 256 (4.0%) |
| 45 to 59 Minutes | 730 (9.9%) | 522 (8.2%) |
| 60 to 89 Minutes | 374 (5.1%) | 128 (2.0%) |
| 90 or more Minutes | 69 (0.9%) | 29 (0.5%) |
Time of Departure to Work by Sex in Christian County
The most frequent times of departure to work in Christian County are 7:00 AM to 7:29 AM (1,254, 17.0%) for males and 7:00 AM to 7:29 AM (1,082, 17.0%) for females.
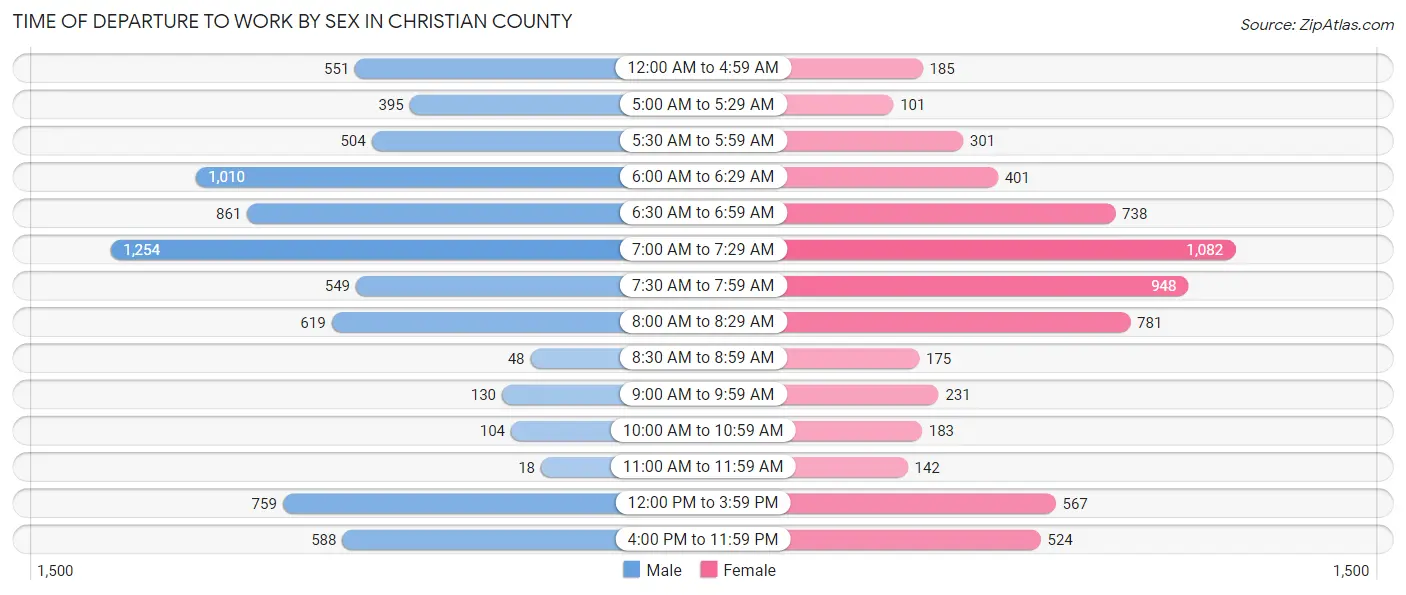
| Time of Departure | Male | Female |
| 12:00 AM to 4:59 AM | 551 (7.5%) | 185 (2.9%) |
| 5:00 AM to 5:29 AM | 395 (5.3%) | 101 (1.6%) |
| 5:30 AM to 5:59 AM | 504 (6.8%) | 301 (4.7%) |
| 6:00 AM to 6:29 AM | 1,010 (13.7%) | 401 (6.3%) |
| 6:30 AM to 6:59 AM | 861 (11.7%) | 738 (11.6%) |
| 7:00 AM to 7:29 AM | 1,254 (17.0%) | 1,082 (17.0%) |
| 7:30 AM to 7:59 AM | 549 (7.4%) | 948 (14.9%) |
| 8:00 AM to 8:29 AM | 619 (8.4%) | 781 (12.3%) |
| 8:30 AM to 8:59 AM | 48 (0.6%) | 175 (2.8%) |
| 9:00 AM to 9:59 AM | 130 (1.8%) | 231 (3.6%) |
| 10:00 AM to 10:59 AM | 104 (1.4%) | 183 (2.9%) |
| 11:00 AM to 11:59 AM | 18 (0.2%) | 142 (2.2%) |
| 12:00 PM to 3:59 PM | 759 (10.3%) | 567 (8.9%) |
| 4:00 PM to 11:59 PM | 588 (8.0%) | 524 (8.2%) |
| Total | 7,390 (100.0%) | 6,359 (100.0%) |
Housing Occupancy in Christian County
Occupancy by Ownership in Christian County
Of the total 13,473 dwellings in Christian County, owner-occupied units account for 10,351 (76.8%), while renter-occupied units make up 3,122 (23.2%).
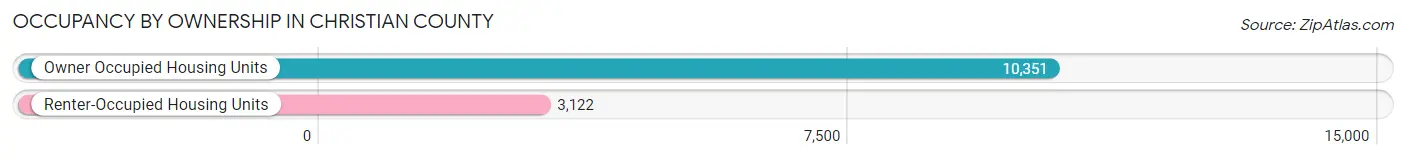
| Occupancy | # Housing Units | % Housing Units |
| Owner Occupied Housing Units | 10,351 | 76.8% |
| Renter-Occupied Housing Units | 3,122 | 23.2% |
| Total Occupied Housing Units | 13,473 | 100.0% |
Occupancy by Household Size in Christian County
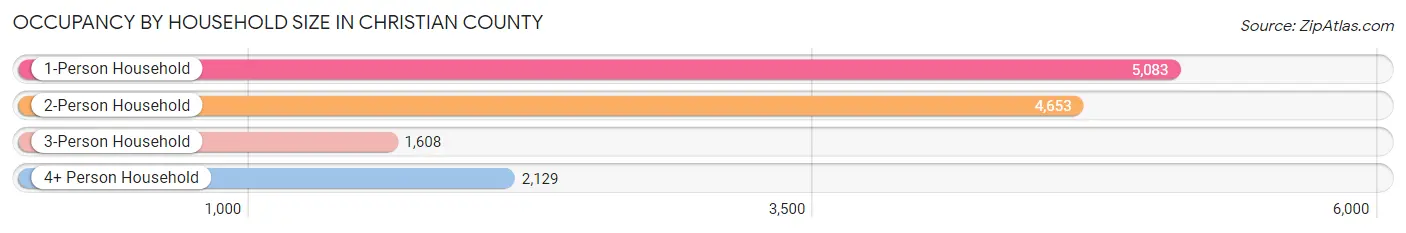
| Household Size | # Housing Units | % Housing Units |
| 1-Person Household | 5,083 | 37.7% |
| 2-Person Household | 4,653 | 34.5% |
| 3-Person Household | 1,608 | 11.9% |
| 4+ Person Household | 2,129 | 15.8% |
| Total Housing Units | 13,473 | 100.0% |
Occupancy by Ownership by Household Size in Christian County
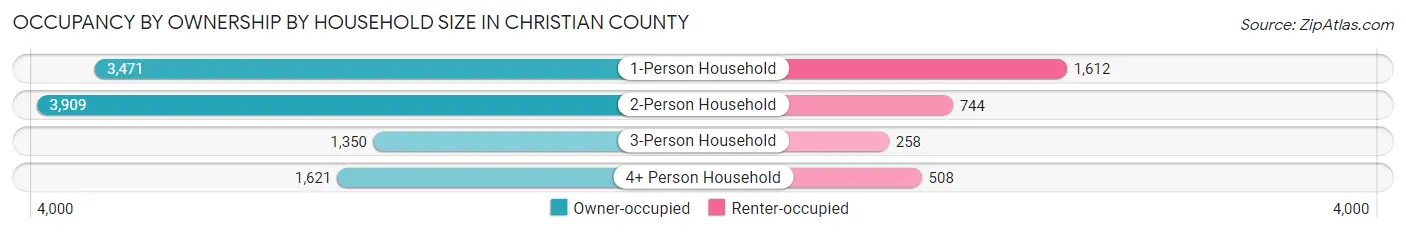
| Household Size | Owner-occupied | Renter-occupied |
| 1-Person Household | 3,471 (68.3%) | 1,612 (31.7%) |
| 2-Person Household | 3,909 (84.0%) | 744 (16.0%) |
| 3-Person Household | 1,350 (84.0%) | 258 (16.0%) |
| 4+ Person Household | 1,621 (76.1%) | 508 (23.9%) |
| Total Housing Units | 10,351 (76.8%) | 3,122 (23.2%) |
Occupancy by Educational Attainment in Christian County
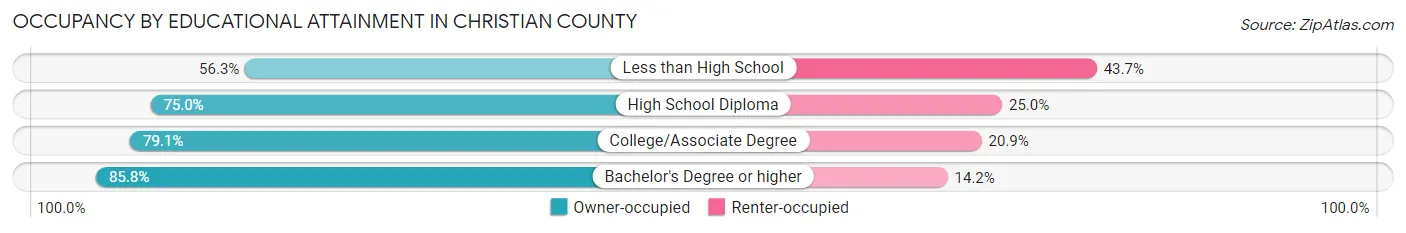
| Household Size | Owner-occupied | Renter-occupied |
| Less than High School | 583 (56.3%) | 453 (43.7%) |
| High School Diploma | 4,269 (75.0%) | 1,420 (25.0%) |
| College/Associate Degree | 3,438 (79.1%) | 909 (20.9%) |
| Bachelor's Degree or higher | 2,061 (85.8%) | 340 (14.2%) |
Occupancy by Age of Householder in Christian County
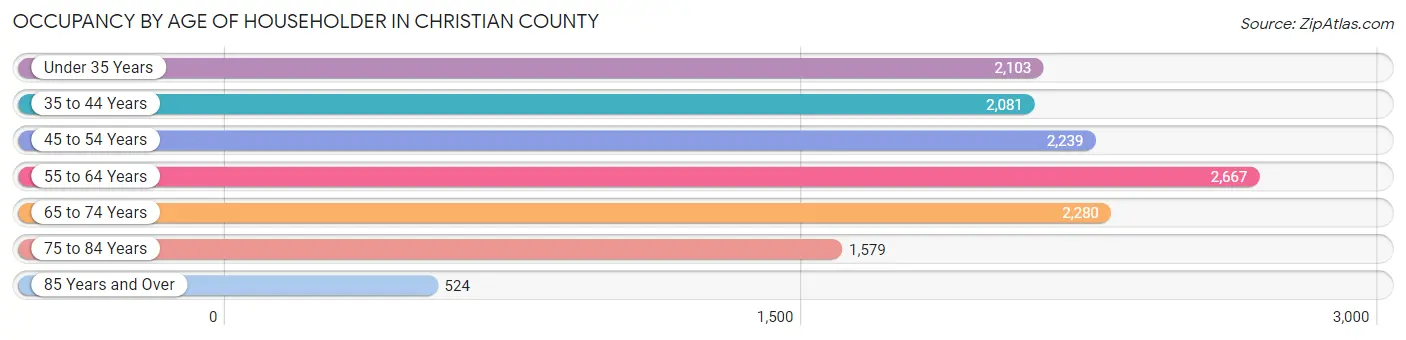
| Age Bracket | # Households | % Households |
| Under 35 Years | 2,103 | 15.6% |
| 35 to 44 Years | 2,081 | 15.4% |
| 45 to 54 Years | 2,239 | 16.6% |
| 55 to 64 Years | 2,667 | 19.8% |
| 65 to 74 Years | 2,280 | 16.9% |
| 75 to 84 Years | 1,579 | 11.7% |
| 85 Years and Over | 524 | 3.9% |
| Total | 13,473 | 100.0% |
Housing Finances in Christian County
Median Income by Occupancy in Christian County
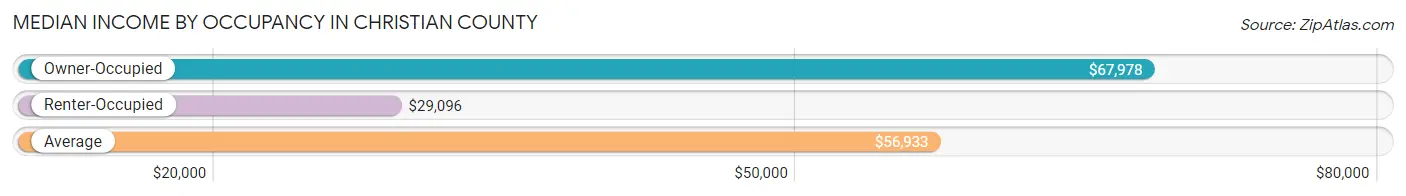
| Occupancy Type | # Households | Median Income |
| Owner-Occupied | 10,351 (76.8%) | $67,978 |
| Renter-Occupied | 3,122 (23.2%) | $29,096 |
| Average | 13,473 (100.0%) | $56,933 |
Occupancy by Householder Income Bracket in Christian County
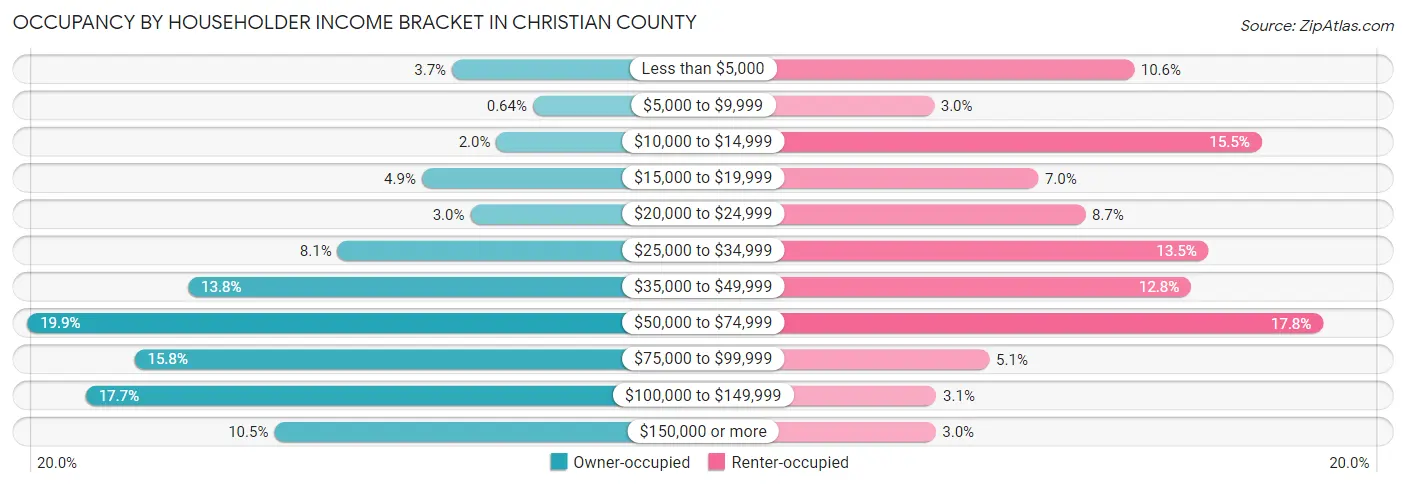
| Income Bracket | Owner-occupied | Renter-occupied |
| Less than $5,000 | 385 (3.7%) | 331 (10.6%) |
| $5,000 to $9,999 | 66 (0.6%) | 93 (3.0%) |
| $10,000 to $14,999 | 210 (2.0%) | 483 (15.5%) |
| $15,000 to $19,999 | 504 (4.9%) | 217 (7.0%) |
| $20,000 to $24,999 | 313 (3.0%) | 273 (8.7%) |
| $25,000 to $34,999 | 836 (8.1%) | 420 (13.5%) |
| $35,000 to $49,999 | 1,425 (13.8%) | 399 (12.8%) |
| $50,000 to $74,999 | 2,060 (19.9%) | 556 (17.8%) |
| $75,000 to $99,999 | 1,637 (15.8%) | 159 (5.1%) |
| $100,000 to $149,999 | 1,829 (17.7%) | 96 (3.1%) |
| $150,000 or more | 1,086 (10.5%) | 95 (3.0%) |
| Total | 10,351 (100.0%) | 3,122 (100.0%) |
Monthly Housing Cost Tiers in Christian County
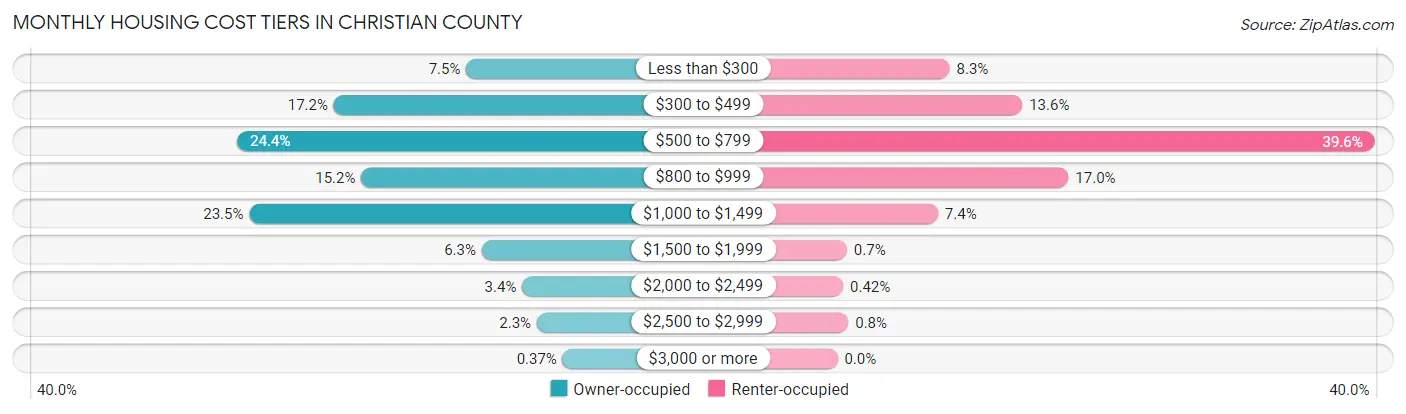
| Monthly Cost | Owner-occupied | Renter-occupied |
| Less than $300 | 773 (7.5%) | 258 (8.3%) |
| $300 to $499 | 1,783 (17.2%) | 425 (13.6%) |
| $500 to $799 | 2,520 (24.3%) | 1,235 (39.6%) |
| $800 to $999 | 1,573 (15.2%) | 531 (17.0%) |
| $1,000 to $1,499 | 2,427 (23.4%) | 231 (7.4%) |
| $1,500 to $1,999 | 655 (6.3%) | 22 (0.7%) |
| $2,000 to $2,499 | 347 (3.4%) | 13 (0.4%) |
| $2,500 to $2,999 | 235 (2.3%) | 25 (0.8%) |
| $3,000 or more | 38 (0.4%) | 0 (0.0%) |
| Total | 10,351 (100.0%) | 3,122 (100.0%) |
Physical Housing Characteristics in Christian County
Housing Structures in Christian County
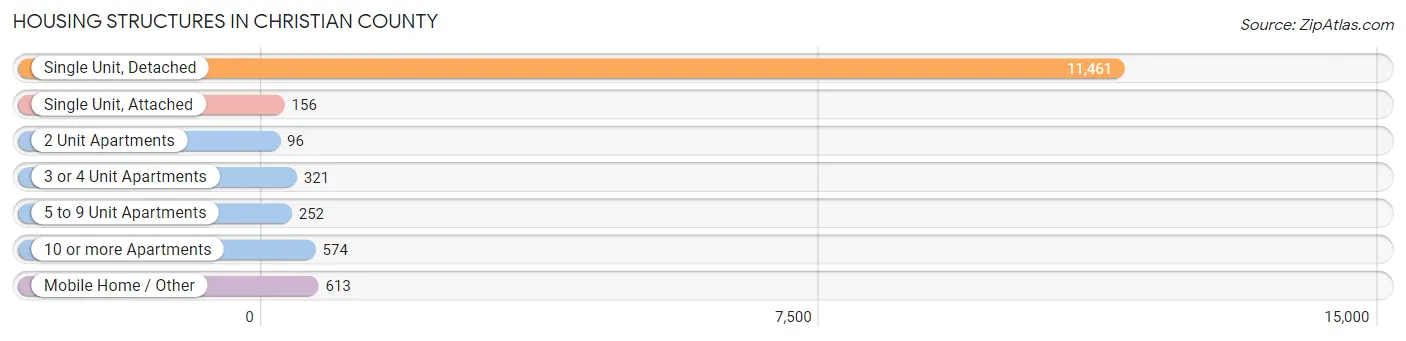
| Structure Type | # Housing Units | % Housing Units |
| Single Unit, Detached | 11,461 | 85.1% |
| Single Unit, Attached | 156 | 1.2% |
| 2 Unit Apartments | 96 | 0.7% |
| 3 or 4 Unit Apartments | 321 | 2.4% |
| 5 to 9 Unit Apartments | 252 | 1.9% |
| 10 or more Apartments | 574 | 4.3% |
| Mobile Home / Other | 613 | 4.5% |
| Total | 13,473 | 100.0% |
Housing Structures by Occupancy in Christian County
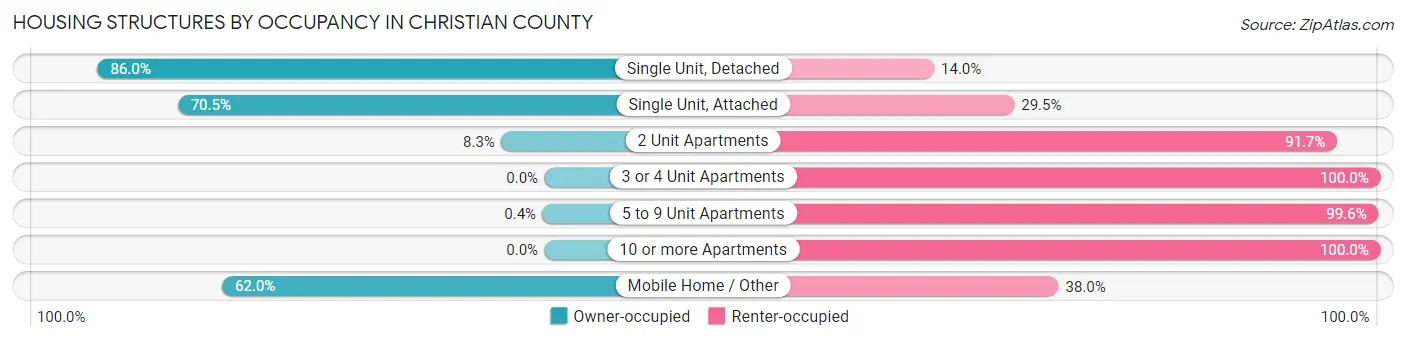
| Structure Type | Owner-occupied | Renter-occupied |
| Single Unit, Detached | 9,852 (86.0%) | 1,609 (14.0%) |
| Single Unit, Attached | 110 (70.5%) | 46 (29.5%) |
| 2 Unit Apartments | 8 (8.3%) | 88 (91.7%) |
| 3 or 4 Unit Apartments | 0 (0.0%) | 321 (100.0%) |
| 5 to 9 Unit Apartments | 1 (0.4%) | 251 (99.6%) |
| 10 or more Apartments | 0 (0.0%) | 574 (100.0%) |
| Mobile Home / Other | 380 (62.0%) | 233 (38.0%) |
| Total | 10,351 (76.8%) | 3,122 (23.2%) |
Housing Structures by Number of Rooms in Christian County
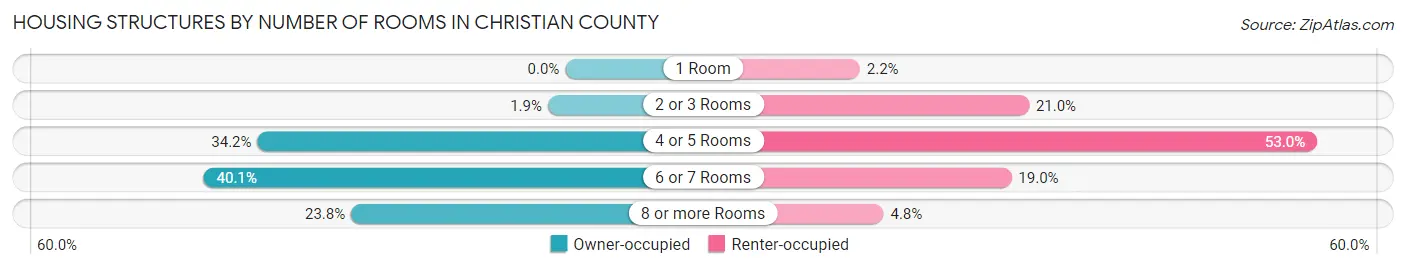
| Number of Rooms | Owner-occupied | Renter-occupied |
| 1 Room | 0 (0.0%) | 69 (2.2%) |
| 2 or 3 Rooms | 200 (1.9%) | 655 (21.0%) |
| 4 or 5 Rooms | 3,537 (34.2%) | 1,653 (52.9%) |
| 6 or 7 Rooms | 4,154 (40.1%) | 594 (19.0%) |
| 8 or more Rooms | 2,460 (23.8%) | 151 (4.8%) |
| Total | 10,351 (100.0%) | 3,122 (100.0%) |
Housing Structure by Heating Type in Christian County
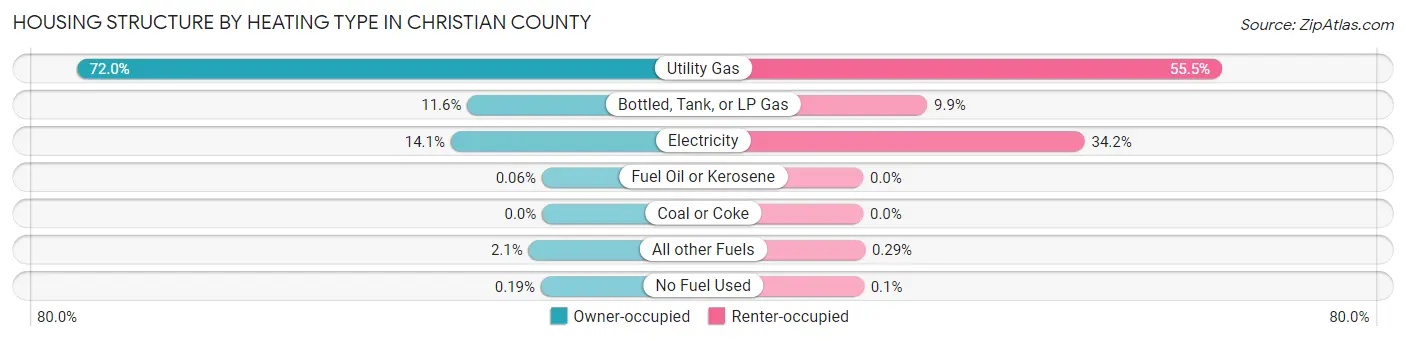
| Heating Type | Owner-occupied | Renter-occupied |
| Utility Gas | 7,451 (72.0%) | 1,732 (55.5%) |
| Bottled, Tank, or LP Gas | 1,197 (11.6%) | 309 (9.9%) |
| Electricity | 1,461 (14.1%) | 1,069 (34.2%) |
| Fuel Oil or Kerosene | 6 (0.1%) | 0 (0.0%) |
| Coal or Coke | 0 (0.0%) | 0 (0.0%) |
| All other Fuels | 216 (2.1%) | 9 (0.3%) |
| No Fuel Used | 20 (0.2%) | 3 (0.1%) |
| Total | 10,351 (100.0%) | 3,122 (100.0%) |
Household Vehicle Usage in Christian County
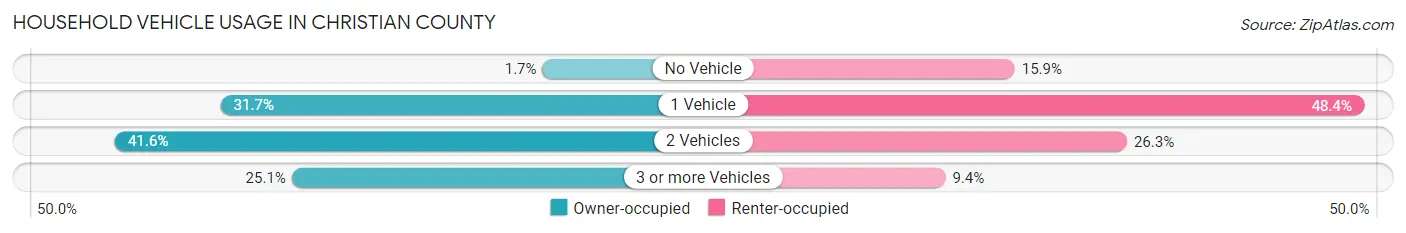
| Vehicles per Household | Owner-occupied | Renter-occupied |
| No Vehicle | 173 (1.7%) | 495 (15.9%) |
| 1 Vehicle | 3,281 (31.7%) | 1,512 (48.4%) |
| 2 Vehicles | 4,302 (41.6%) | 822 (26.3%) |
| 3 or more Vehicles | 2,595 (25.1%) | 293 (9.4%) |
| Total | 10,351 (100.0%) | 3,122 (100.0%) |
Real Estate & Mortgages in Christian County
Real Estate and Mortgage Overview in Christian County
| Characteristic | Without Mortgage | With Mortgage |
| Housing Units | 4,920 | 5,431 |
| Median Property Value | $102,700 | $113,500 |
| Median Household Income | $55,153 | $647 |
| Monthly Housing Costs | $505 | $35 |
| Real Estate Taxes | $1,634 | $57 |
Property Value by Mortgage Status in Christian County
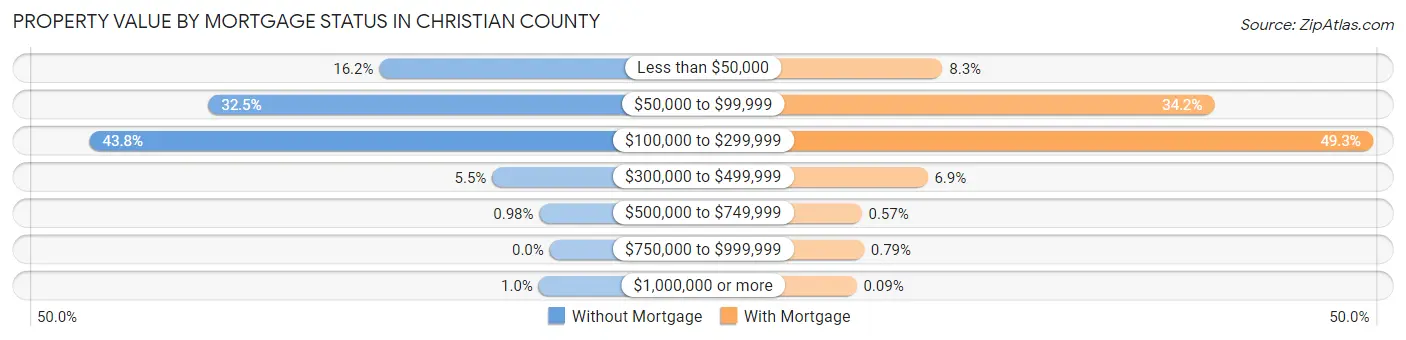
| Property Value | Without Mortgage | With Mortgage |
| Less than $50,000 | 798 (16.2%) | 449 (8.3%) |
| $50,000 to $99,999 | 1,599 (32.5%) | 1,856 (34.2%) |
| $100,000 to $299,999 | 2,155 (43.8%) | 2,675 (49.2%) |
| $300,000 to $499,999 | 269 (5.5%) | 372 (6.9%) |
| $500,000 to $749,999 | 48 (1.0%) | 31 (0.6%) |
| $750,000 to $999,999 | 0 (0.0%) | 43 (0.8%) |
| $1,000,000 or more | 51 (1.0%) | 5 (0.1%) |
| Total | 4,920 (100.0%) | 5,431 (100.0%) |
Household Income by Mortgage Status in Christian County
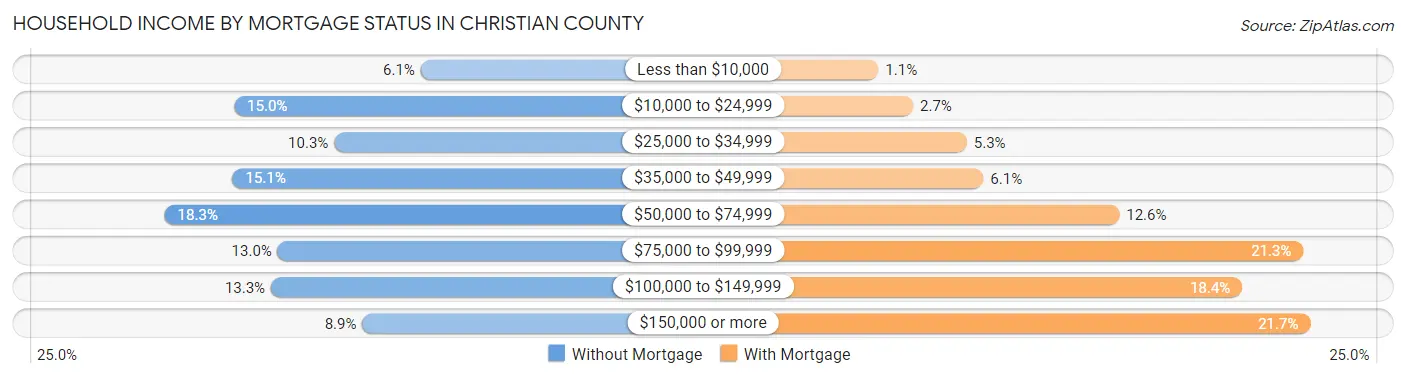
| Household Income | Without Mortgage | With Mortgage |
| Less than $10,000 | 302 (6.1%) | 59 (1.1%) |
| $10,000 to $24,999 | 739 (15.0%) | 149 (2.7%) |
| $25,000 to $34,999 | 505 (10.3%) | 288 (5.3%) |
| $35,000 to $49,999 | 743 (15.1%) | 331 (6.1%) |
| $50,000 to $74,999 | 902 (18.3%) | 682 (12.6%) |
| $75,000 to $99,999 | 637 (13.0%) | 1,158 (21.3%) |
| $100,000 to $149,999 | 653 (13.3%) | 1,000 (18.4%) |
| $150,000 or more | 439 (8.9%) | 1,176 (21.6%) |
| Total | 4,920 (100.0%) | 5,431 (100.0%) |
Property Value to Household Income Ratio in Christian County
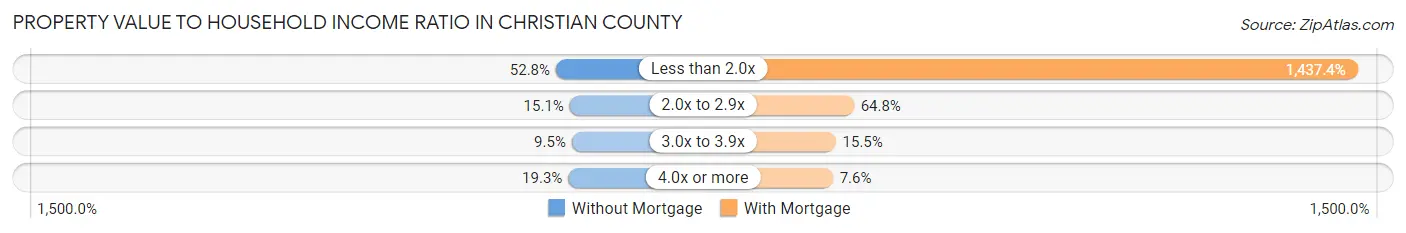
| Value-to-Income Ratio | Without Mortgage | With Mortgage |
| Less than 2.0x | 2,596 (52.8%) | 78,064 (1,437.4%) |
| 2.0x to 2.9x | 744 (15.1%) | 3,518 (64.8%) |
| 3.0x to 3.9x | 468 (9.5%) | 842 (15.5%) |
| 4.0x or more | 948 (19.3%) | 410 (7.5%) |
| Total | 4,920 (100.0%) | 5,431 (100.0%) |
Real Estate Taxes by Mortgage Status in Christian County
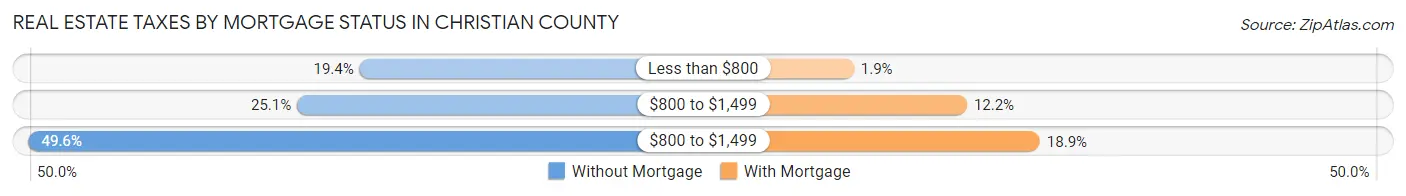
| Property Taxes | Without Mortgage | With Mortgage |
| Less than $800 | 955 (19.4%) | 103 (1.9%) |
| $800 to $1,499 | 1,236 (25.1%) | 664 (12.2%) |
| $800 to $1,499 | 2,442 (49.6%) | 1,026 (18.9%) |
| Total | 4,920 (100.0%) | 5,431 (100.0%) |
Health & Disability in Christian County
Health Insurance Coverage by Age in Christian County
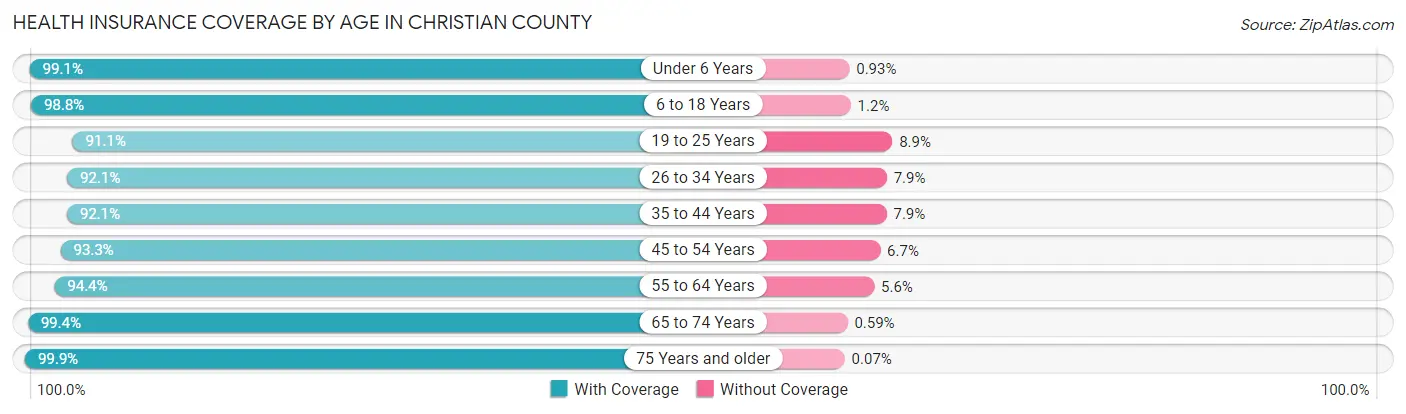
| Age Bracket | With Coverage | Without Coverage |
| Under 6 Years | 2,231 (99.1%) | 21 (0.9%) |
| 6 to 18 Years | 5,248 (98.8%) | 63 (1.2%) |
| 19 to 25 Years | 2,372 (91.1%) | 233 (8.9%) |
| 26 to 34 Years | 3,025 (92.1%) | 260 (7.9%) |
| 35 to 44 Years | 3,485 (92.1%) | 298 (7.9%) |
| 45 to 54 Years | 3,833 (93.3%) | 275 (6.7%) |
| 55 to 64 Years | 4,364 (94.4%) | 257 (5.6%) |
| 65 to 74 Years | 3,547 (99.4%) | 21 (0.6%) |
| 75 Years and older | 2,785 (99.9%) | 2 (0.1%) |
| Total | 30,890 (95.6%) | 1,430 (4.4%) |
Health Insurance Coverage by Citizenship Status in Christian County
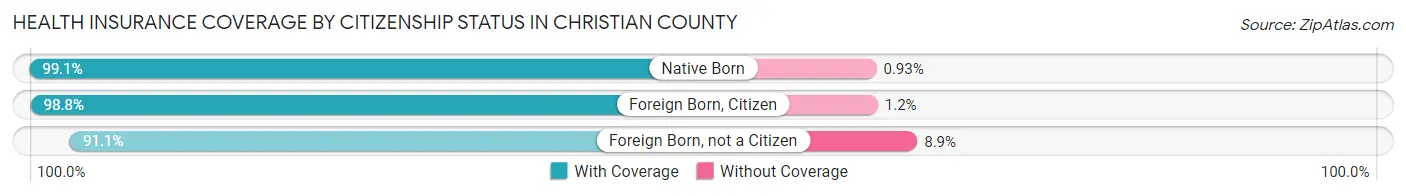
| Citizenship Status | With Coverage | Without Coverage |
| Native Born | 2,231 (99.1%) | 21 (0.9%) |
| Foreign Born, Citizen | 5,248 (98.8%) | 63 (1.2%) |
| Foreign Born, not a Citizen | 2,372 (91.1%) | 233 (8.9%) |
Health Insurance Coverage by Household Income in Christian County
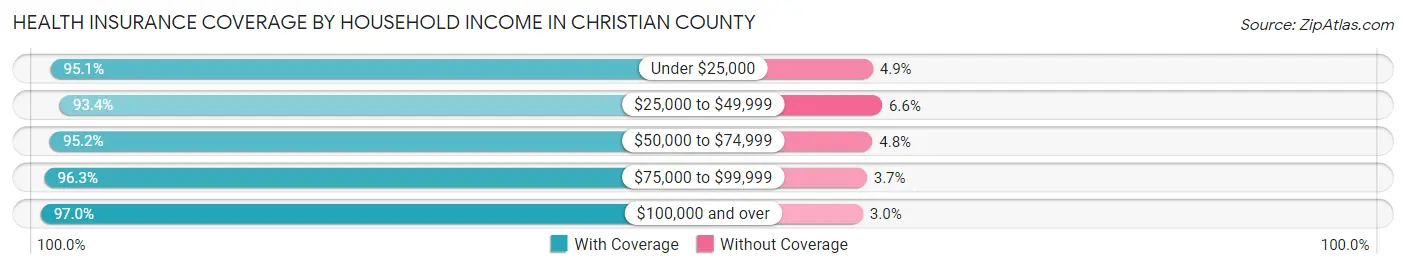
| Household Income | With Coverage | Without Coverage |
| Under $25,000 | 4,032 (95.1%) | 207 (4.9%) |
| $25,000 to $49,999 | 5,546 (93.4%) | 393 (6.6%) |
| $50,000 to $74,999 | 6,753 (95.2%) | 340 (4.8%) |
| $75,000 to $99,999 | 4,973 (96.3%) | 193 (3.7%) |
| $100,000 and over | 9,527 (97.0%) | 297 (3.0%) |
Public vs Private Health Insurance Coverage by Age in Christian County
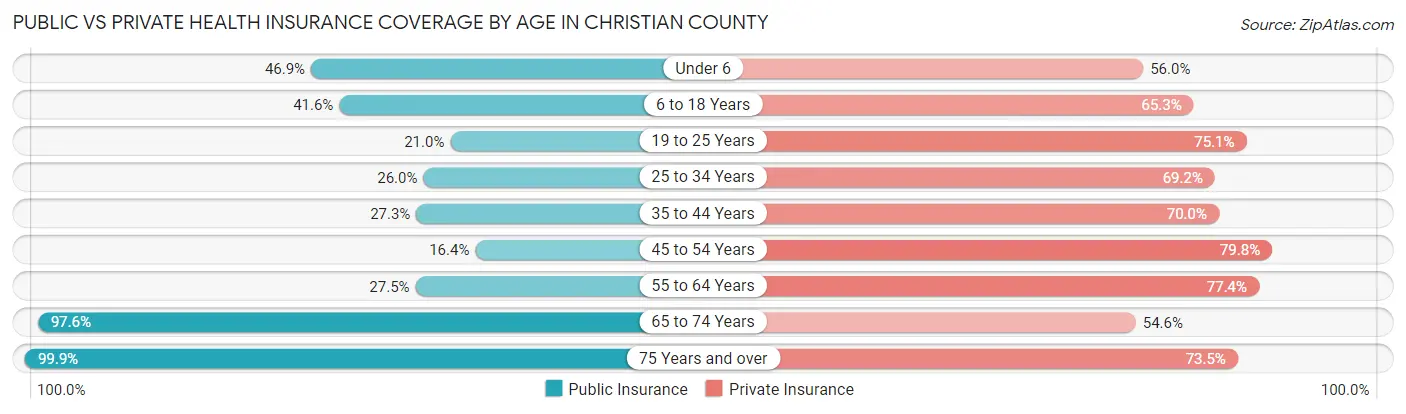
| Age Bracket | Public Insurance | Private Insurance |
| Under 6 | 1,055 (46.9%) | 1,260 (55.9%) |
| 6 to 18 Years | 2,210 (41.6%) | 3,467 (65.3%) |
| 19 to 25 Years | 547 (21.0%) | 1,956 (75.1%) |
| 25 to 34 Years | 854 (26.0%) | 2,274 (69.2%) |
| 35 to 44 Years | 1,033 (27.3%) | 2,647 (70.0%) |
| 45 to 54 Years | 672 (16.4%) | 3,280 (79.8%) |
| 55 to 64 Years | 1,269 (27.5%) | 3,577 (77.4%) |
| 65 to 74 Years | 3,481 (97.6%) | 1,947 (54.6%) |
| 75 Years and over | 2,785 (99.9%) | 2,048 (73.5%) |
| Total | 13,906 (43.0%) | 22,456 (69.5%) |
Disability Status by Sex by Age in Christian County
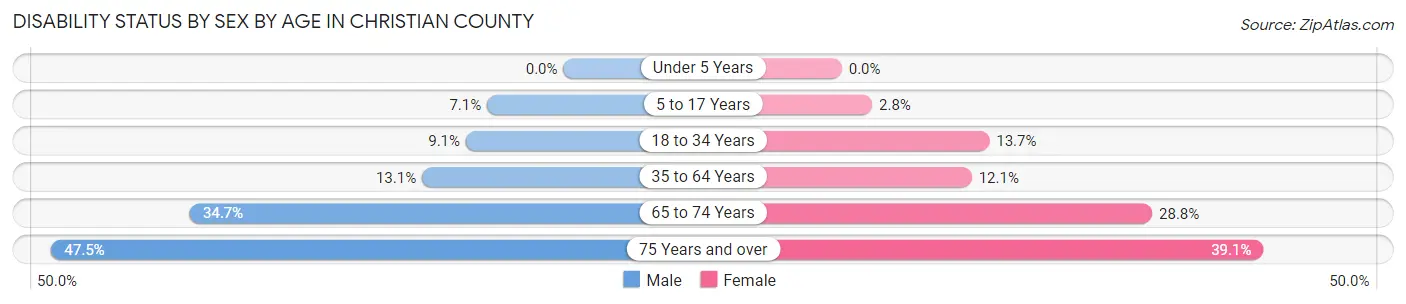
| Age Bracket | Male | Female |
| Under 5 Years | 0 (0.0%) | 0 (0.0%) |
| 5 to 17 Years | 182 (7.1%) | 73 (2.8%) |
| 18 to 34 Years | 315 (9.0%) | 394 (13.7%) |
| 35 to 64 Years | 838 (13.1%) | 739 (12.1%) |
| 65 to 74 Years | 594 (34.7%) | 534 (28.8%) |
| 75 Years and over | 543 (47.5%) | 643 (39.1%) |
Disability Class by Sex by Age in Christian County
Disability Class: Hearing Difficulty
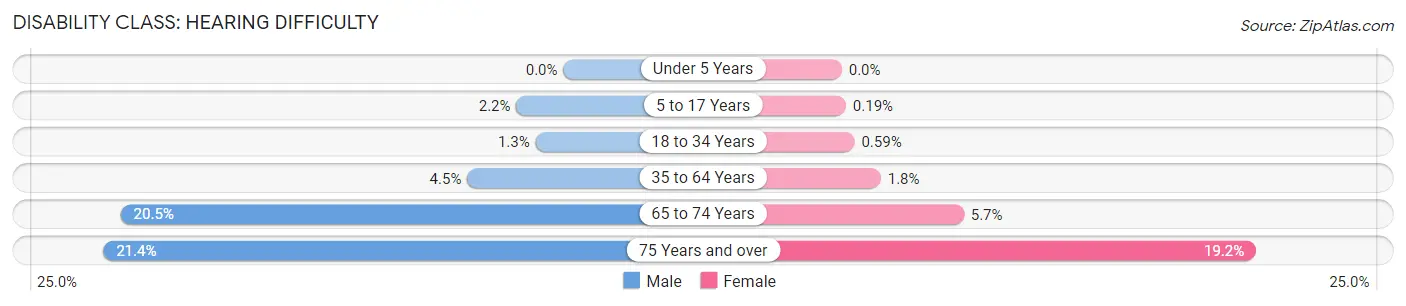
| Age Bracket | Male | Female |
| Under 5 Years | 0 (0.0%) | 0 (0.0%) |
| 5 to 17 Years | 56 (2.2%) | 5 (0.2%) |
| 18 to 34 Years | 45 (1.3%) | 17 (0.6%) |
| 35 to 64 Years | 285 (4.5%) | 111 (1.8%) |
| 65 to 74 Years | 352 (20.5%) | 105 (5.7%) |
| 75 Years and over | 244 (21.3%) | 316 (19.2%) |
Disability Class: Vision Difficulty
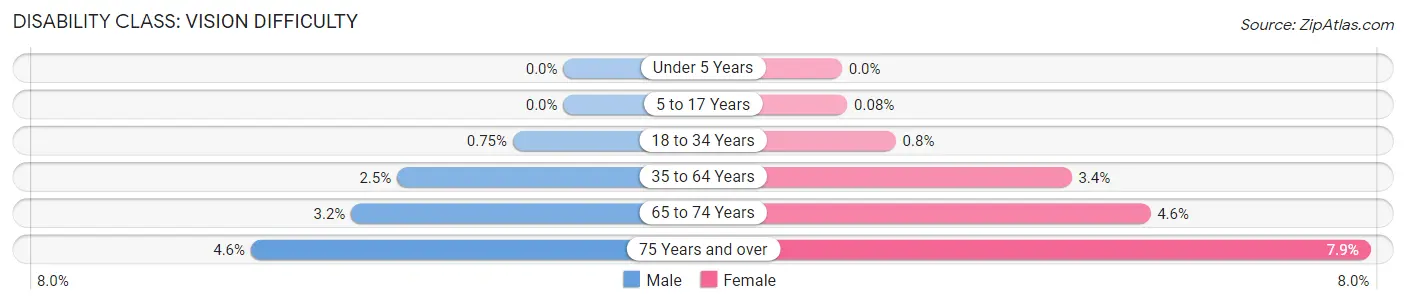
| Age Bracket | Male | Female |
| Under 5 Years | 0 (0.0%) | 0 (0.0%) |
| 5 to 17 Years | 0 (0.0%) | 2 (0.1%) |
| 18 to 34 Years | 26 (0.7%) | 23 (0.8%) |
| 35 to 64 Years | 158 (2.5%) | 209 (3.4%) |
| 65 to 74 Years | 54 (3.2%) | 85 (4.6%) |
| 75 Years and over | 53 (4.6%) | 129 (7.9%) |
Disability Class: Cognitive Difficulty
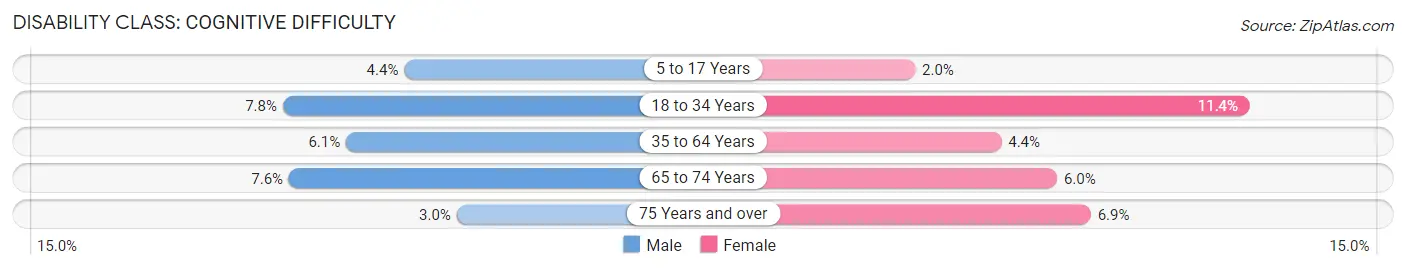
| Age Bracket | Male | Female |
| 5 to 17 Years | 114 (4.4%) | 53 (2.0%) |
| 18 to 34 Years | 272 (7.8%) | 327 (11.4%) |
| 35 to 64 Years | 386 (6.0%) | 272 (4.4%) |
| 65 to 74 Years | 131 (7.6%) | 111 (6.0%) |
| 75 Years and over | 34 (3.0%) | 114 (6.9%) |
Disability Class: Ambulatory Difficulty
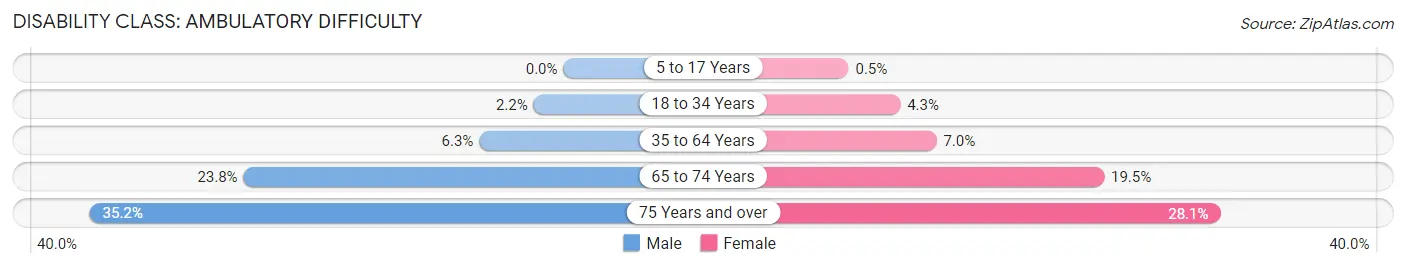
| Age Bracket | Male | Female |
| 5 to 17 Years | 0 (0.0%) | 13 (0.5%) |
| 18 to 34 Years | 77 (2.2%) | 125 (4.3%) |
| 35 to 64 Years | 399 (6.2%) | 431 (7.0%) |
| 65 to 74 Years | 407 (23.7%) | 361 (19.5%) |
| 75 Years and over | 402 (35.2%) | 462 (28.1%) |
Disability Class: Self-Care Difficulty
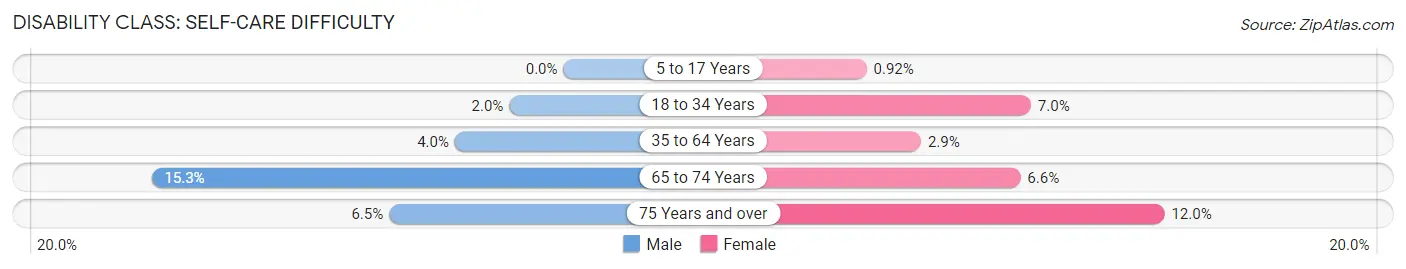
| Age Bracket | Male | Female |
| 5 to 17 Years | 0 (0.0%) | 24 (0.9%) |
| 18 to 34 Years | 70 (2.0%) | 202 (7.0%) |
| 35 to 64 Years | 257 (4.0%) | 180 (2.9%) |
| 65 to 74 Years | 262 (15.3%) | 123 (6.6%) |
| 75 Years and over | 74 (6.5%) | 197 (12.0%) |
Technology Access in Christian County
Computing Device Access in Christian County
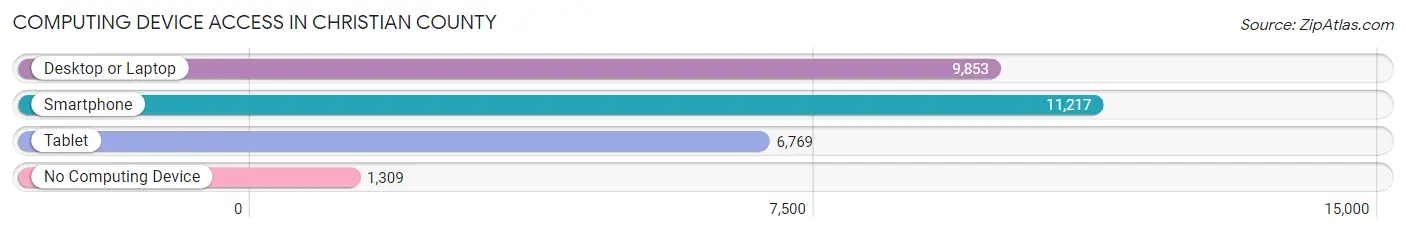
| Device Type | # Households | % Households |
| Desktop or Laptop | 9,853 | 73.1% |
| Smartphone | 11,217 | 83.3% |
| Tablet | 6,769 | 50.2% |
| No Computing Device | 1,309 | 9.7% |
| Total | 13,473 | 100.0% |
Internet Access in Christian County
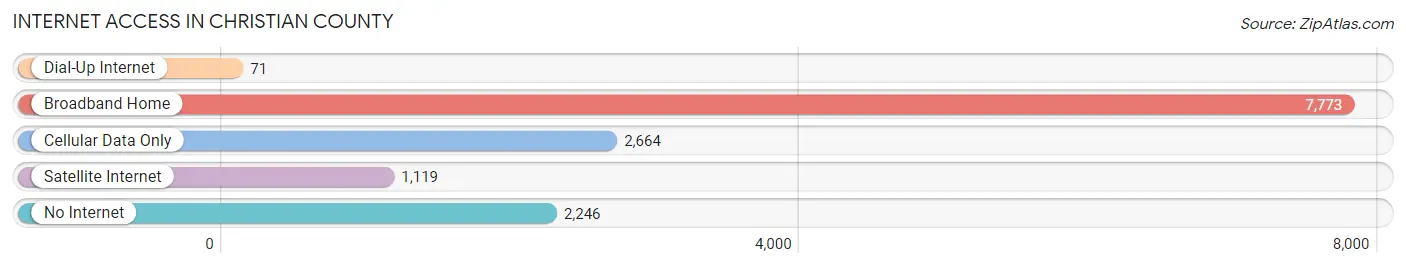
| Internet Type | # Households | % Households |
| Dial-Up Internet | 71 | 0.5% |
| Broadband Home | 7,773 | 57.7% |
| Cellular Data Only | 2,664 | 19.8% |
| Satellite Internet | 1,119 | 8.3% |
| No Internet | 2,246 | 16.7% |
| Total | 13,473 | 100.0% |
Christian County Summary
Christian County is located in the central part of the state of Illinois, and is part of the Springfield Metropolitan Statistical Area. The county was established in 1839 and is named after Christian County, Kentucky, which was named after Colonel William Christian, a Revolutionary War soldier. The county seat is Taylorville, and the population was 34,800 as of the 2010 census.
Geography
Christian County is located in the central part of the state of Illinois, and is bordered by Montgomery County to the north, Shelby County to the east, Fayette County to the south, and Sangamon County to the west. The county has a total area of 545 square miles, of which 544 square miles is land and 1 square mile is water. The terrain is mostly flat, with some rolling hills in the northern part of the county. The Kaskaskia River runs through the county, and there are several small lakes and ponds scattered throughout the area.
The climate of Christian County is typical of the Midwest, with hot, humid summers and cold, snowy winters. The average annual temperature is around 50 degrees Fahrenheit, and the average annual precipitation is around 40 inches.
Economy
Christian County has a diverse economy, with a mix of agriculture, manufacturing, and services. The county is home to several large employers, including Taylorville Memorial Hospital, Taylorville Community Unit School District #3, and the Christian County Sheriff's Office. Agriculture is a major part of the economy, with corn, soybeans, and wheat being the main crops. Manufacturing is also important, with several factories producing automotive parts, furniture, and other products.
The unemployment rate in Christian County was 4.2% in 2019, which is lower than the national average of 3.7%. The median household income in the county was $50,845 in 2019, which is slightly higher than the national median of $50,221.
Demographics
As of the 2010 census, there were 34,800 people, 13,845 households, and 9,845 families living in Christian County. The population density was 64 people per square mile. The racial makeup of the county was 97.2% White, 0.7% African American, 0.3% Native American, 0.4% Asian, 0.1% Pacific Islander, 0.4% from other races, and 0.9% from two or more races. Hispanic or Latino of any race were 1.7% of the population.
The median age in Christian County was 40.3 years, with 25.2% of the population under the age of 18 and 13.2% over the age of 65. The median household income was $50,845, and the median family income was $60,945. The per capita income was $24,845. About 8.7% of the population was below the poverty line.
Christian County is a rural county with a strong agricultural base. The county has a diverse economy and a population that is mostly white. The county has a low unemployment rate and a median household income that is slightly higher than the national average.
Common Questions
What is Per Capita Income in Christian County?
Per Capita income in Christian County is $29,960.
What is the Median Family Income in Christian County?
Median Family Income in Christian County is $78,447.
What is the Median Household income in Christian County?
Median Household Income in Christian County is $56,933.
What is Income or Wage Gap in Christian County?
Income or Wage Gap in Christian County is 34.0%.
Women in Christian County earn 66.0 cents for every dollar earned by a man.
What is Family Income Deficit in Christian County?
Family Income Deficit in Christian County is $12,191.
Families that are below poverty line in Christian County earn $12,191 less on average than the poverty threshold level.
What is Inequality or Gini Index in Christian County?
Inequality or Gini Index in Christian County is 0.43.
What is the Total Population of Christian County?
Total Population of Christian County is 33,893.
What is the Total Male Population of Christian County?
Total Male Population of Christian County is 17,737.
What is the Total Female Population of Christian County?
Total Female Population of Christian County is 16,156.
What is the Ratio of Males per 100 Females in Christian County?
There are 109.79 Males per 100 Females in Christian County.
What is the Ratio of Females per 100 Males in Christian County?
There are 91.09 Females per 100 Males in Christian County.
What is the Median Population Age in Christian County?
Median Population Age in Christian County is 42.2 Years.
What is the Average Family Size in Christian County
Average Family Size in Christian County is 3.3 People.
What is the Average Household Size in Christian County
Average Household Size in Christian County is 2.4 People.
How Large is the Labor Force in Christian County?
There are 15,419 People in the Labor Forcein in Christian County.
What is the Percentage of People in the Labor Force in Christian County?
55.6% of People are in the Labor Force in Christian County.
What is the Unemployment Rate in Christian County?
Unemployment Rate in Christian County is 4.4%.