Bureau County, IL Map & Demographics
Bureau County Map
Bureau County Overview
$34,873
PER CAPITA INCOME
$81,289
AVG FAMILY INCOME
$64,165
AVG HOUSEHOLD INCOME
43.5%
WAGE / INCOME GAP [ % ]
56.5¢/ $1
WAGE / INCOME GAP [ $ ]
$9,529
FAMILY INCOME DEFICIT
0.43
INEQUALITY / GINI INDEX
33,203
TOTAL POPULATION
16,455
MALE POPULATION
16,748
FEMALE POPULATION
98.25
MALES / 100 FEMALES
101.78
FEMALES / 100 MALES
44.0
MEDIAN AGE
2.9
AVG FAMILY SIZE
2.4
AVG HOUSEHOLD SIZE
16,888
LABOR FORCE [ PEOPLE ]
62.4%
PERCENT IN LABOR FORCE
5.7%
UNEMPLOYMENT RATE
Income in Bureau County
Income Overview in Bureau County
Per Capita Income in Bureau County is $34,873, while median incomes of families and households are $81,289 and $64,165 respectively.
| Characteristic | Number | Measure |
| Per Capita Income | 33,203 | $34,873 |
| Median Family Income | 8,881 | $81,289 |
| Mean Family Income | 8,881 | $95,329 |
| Median Household Income | 13,901 | $64,165 |
| Mean Household Income | 13,901 | $81,875 |
| Income Deficit | 8,881 | $9,529 |
| Wage / Income Gap (%) | 33,203 | 43.48% |
| Wage / Income Gap ($) | 33,203 | 56.52¢ per $1 |
| Gini / Inequality Index | 33,203 | 0.43 |
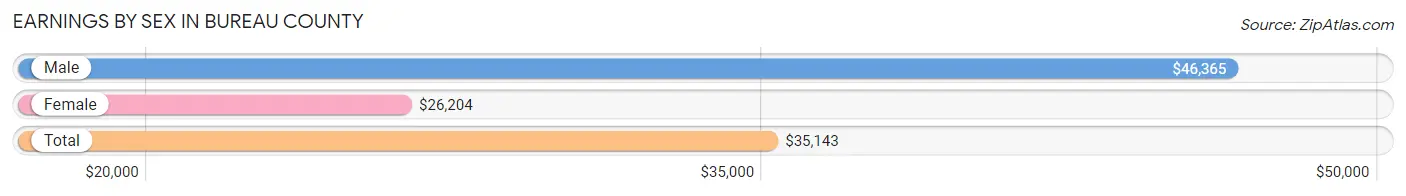
Earnings by Sex in Bureau County
Average Earnings in Bureau County are $35,143, $46,365 for men and $26,204 for women, a difference of 43.5%.
| Sex | Number | Average Earnings |
| Male | 9,274 (52.6%) | $46,365 |
| Female | 8,357 (47.4%) | $26,204 |
| Total | 17,631 (100.0%) | $35,143 |
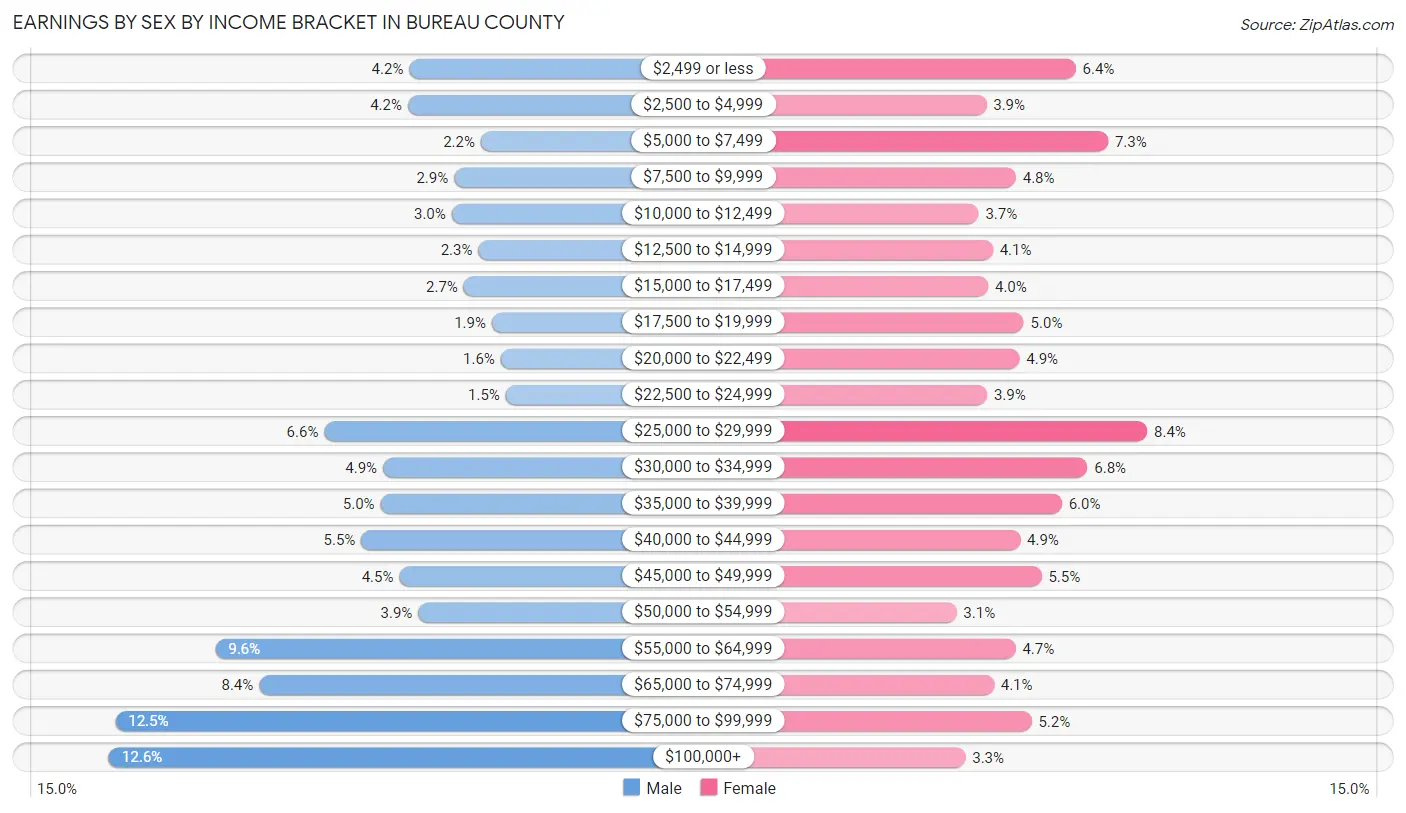
Earnings by Sex by Income Bracket in Bureau County
The most common earnings brackets in Bureau County are $100,000+ for men (1,171 | 12.6%) and $25,000 to $29,999 for women (705 | 8.4%).
| Income | Male | Female |
| $2,499 or less | 389 (4.2%) | 537 (6.4%) |
| $2,500 to $4,999 | 392 (4.2%) | 328 (3.9%) |
| $5,000 to $7,499 | 202 (2.2%) | 613 (7.3%) |
| $7,500 to $9,999 | 272 (2.9%) | 397 (4.8%) |
| $10,000 to $12,499 | 278 (3.0%) | 309 (3.7%) |
| $12,500 to $14,999 | 209 (2.2%) | 343 (4.1%) |
| $15,000 to $17,499 | 247 (2.7%) | 332 (4.0%) |
| $17,500 to $19,999 | 173 (1.9%) | 415 (5.0%) |
| $20,000 to $22,499 | 150 (1.6%) | 405 (4.9%) |
| $22,500 to $24,999 | 137 (1.5%) | 329 (3.9%) |
| $25,000 to $29,999 | 610 (6.6%) | 705 (8.4%) |
| $30,000 to $34,999 | 457 (4.9%) | 565 (6.8%) |
| $35,000 to $39,999 | 464 (5.0%) | 505 (6.0%) |
| $40,000 to $44,999 | 514 (5.5%) | 407 (4.9%) |
| $45,000 to $49,999 | 415 (4.5%) | 457 (5.5%) |
| $50,000 to $54,999 | 365 (3.9%) | 257 (3.1%) |
| $55,000 to $64,999 | 894 (9.6%) | 396 (4.7%) |
| $65,000 to $74,999 | 780 (8.4%) | 345 (4.1%) |
| $75,000 to $99,999 | 1,155 (12.4%) | 434 (5.2%) |
| $100,000+ | 1,171 (12.6%) | 278 (3.3%) |
| Total | 9,274 (100.0%) | 8,357 (100.0%) |
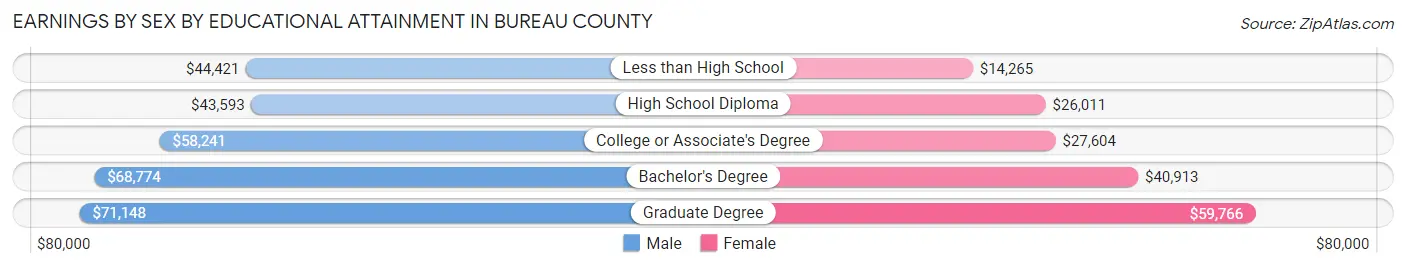
Earnings by Sex by Educational Attainment in Bureau County
Average earnings in Bureau County are $54,149 for men and $29,843 for women, a difference of 44.9%. Men with an educational attainment of graduate degree enjoy the highest average annual earnings of $71,148, while those with high school diploma education earn the least with $43,593. Women with an educational attainment of graduate degree earn the most with the average annual earnings of $59,766, while those with less than high school education have the smallest earnings of $14,265.
| Educational Attainment | Male Income | Female Income |
| Less than High School | $44,421 | $14,265 |
| High School Diploma | $43,593 | $26,011 |
| College or Associate's Degree | $58,241 | $27,604 |
| Bachelor's Degree | $68,774 | $40,913 |
| Graduate Degree | $71,148 | $59,766 |
| Total | $54,149 | $29,843 |
Family Income in Bureau County
Family Income Brackets in Bureau County
According to the Bureau County family income data, there are 2,149 families falling into the $100,000 to $149,999 income range, which is the most common income bracket and makes up 24.2% of all families. Conversely, the $10,000 to $14,999 income bracket is the least frequent group with only 151 families (1.7%) belonging to this category.
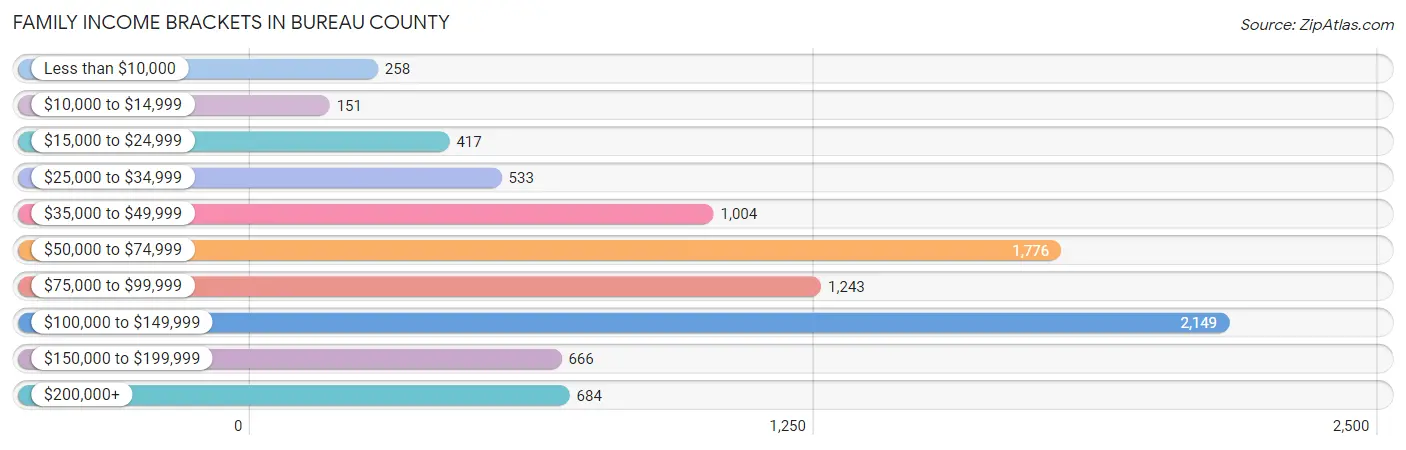
| Income Bracket | # Families | % Families |
| Less than $10,000 | 258 | 2.9% |
| $10,000 to $14,999 | 151 | 1.7% |
| $15,000 to $24,999 | 417 | 4.7% |
| $25,000 to $34,999 | 533 | 6.0% |
| $35,000 to $49,999 | 1,004 | 11.3% |
| $50,000 to $74,999 | 1,776 | 20.0% |
| $75,000 to $99,999 | 1,243 | 14.0% |
| $100,000 to $149,999 | 2,149 | 24.2% |
| $150,000 to $199,999 | 666 | 7.5% |
| $200,000+ | 684 | 7.7% |
Family Income by Famaliy Size in Bureau County
5-person families (782 | 8.8%) account for the highest median family income in Bureau County with $94,286 per family, while 2-person families (4,801 | 54.1%) have the highest median income of $36,788 per family member.
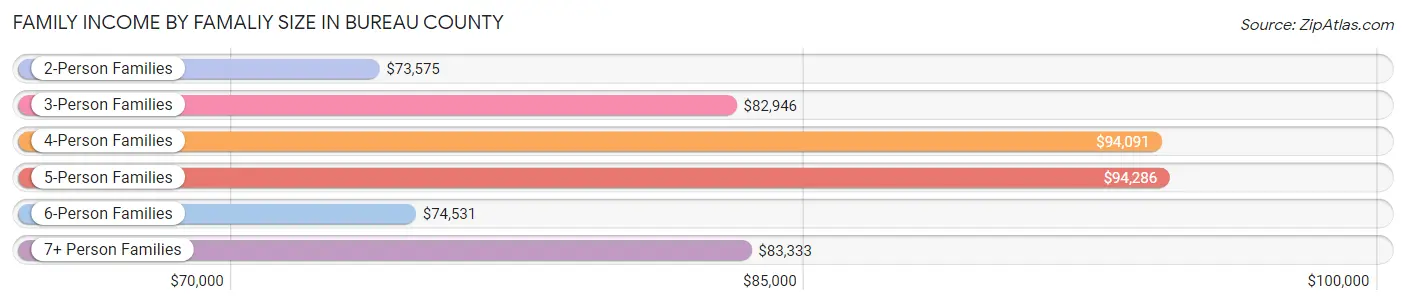
| Income Bracket | # Families | Median Income |
| 2-Person Families | 4,801 (54.1%) | $73,575 |
| 3-Person Families | 1,761 (19.8%) | $82,946 |
| 4-Person Families | 1,284 (14.5%) | $94,091 |
| 5-Person Families | 782 (8.8%) | $94,286 |
| 6-Person Families | 133 (1.5%) | $74,531 |
| 7+ Person Families | 120 (1.3%) | $83,333 |
| Total | 8,881 (100.0%) | $81,289 |
Family Income by Number of Earners in Bureau County
The median family income in Bureau County is $81,289, with families comprising 3+ earners (1,054) having the highest median family income of $116,962, while families with no earners (1,554) have the lowest median family income of $50,613, accounting for 11.9% and 17.5% of families, respectively.
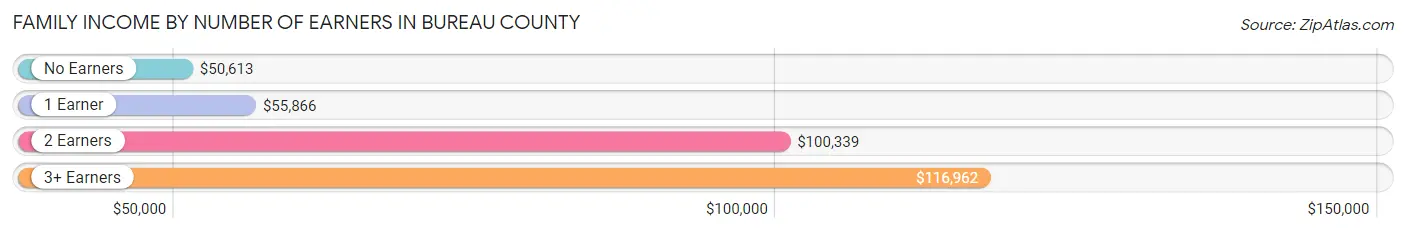
| Number of Earners | # Families | Median Income |
| No Earners | 1,554 (17.5%) | $50,613 |
| 1 Earner | 2,575 (29.0%) | $55,866 |
| 2 Earners | 3,698 (41.6%) | $100,339 |
| 3+ Earners | 1,054 (11.9%) | $116,962 |
| Total | 8,881 (100.0%) | $81,289 |
Household Income in Bureau County
Household Income Brackets in Bureau County
With 2,599 households falling in the category, the $50,000 to $74,999 income range is the most frequent in Bureau County, accounting for 18.7% of all households. In contrast, only 528 households (3.8%) fall into the less than $10,000 income bracket, making it the least populous group.
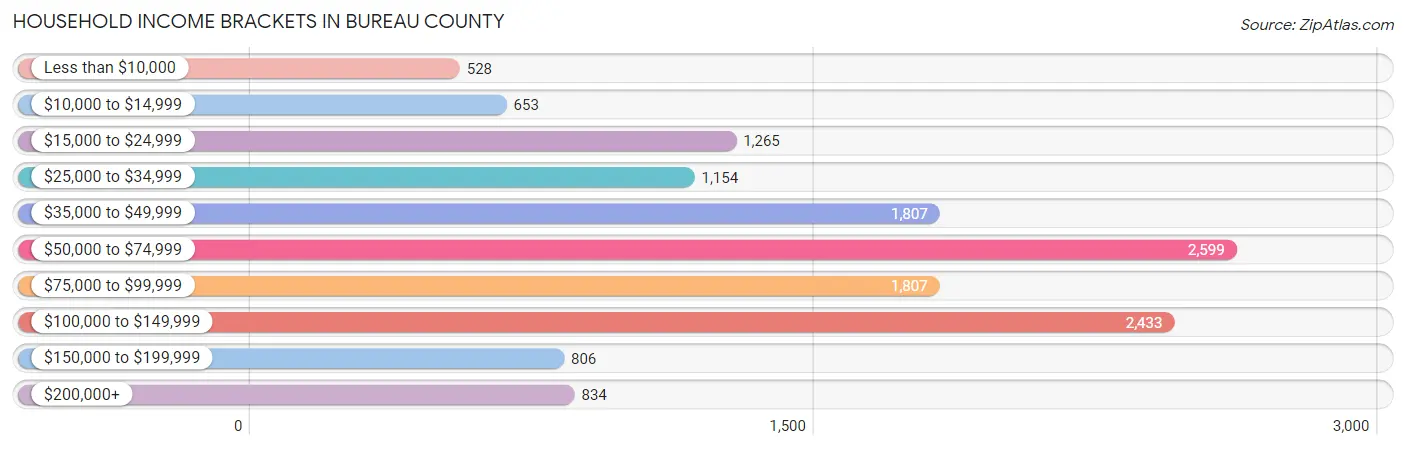
| Income Bracket | # Households | % Households |
| Less than $10,000 | 528 | 3.8% |
| $10,000 to $14,999 | 653 | 4.7% |
| $15,000 to $24,999 | 1,265 | 9.1% |
| $25,000 to $34,999 | 1,154 | 8.3% |
| $35,000 to $49,999 | 1,807 | 13.0% |
| $50,000 to $74,999 | 2,599 | 18.7% |
| $75,000 to $99,999 | 1,807 | 13.0% |
| $100,000 to $149,999 | 2,433 | 17.5% |
| $150,000 to $199,999 | 806 | 5.8% |
| $200,000+ | 834 | 6.0% |
Household Income by Householder Age in Bureau County
The median household income in Bureau County is $64,165, with the highest median household income of $74,909 found in the 45 to 64 years age bracket for the primary householder. A total of 4,980 households (35.8%) fall into this category. Meanwhile, the 15 to 24 years age bracket for the primary householder has the lowest median household income of $32,143, with 308 households (2.2%) in this group.
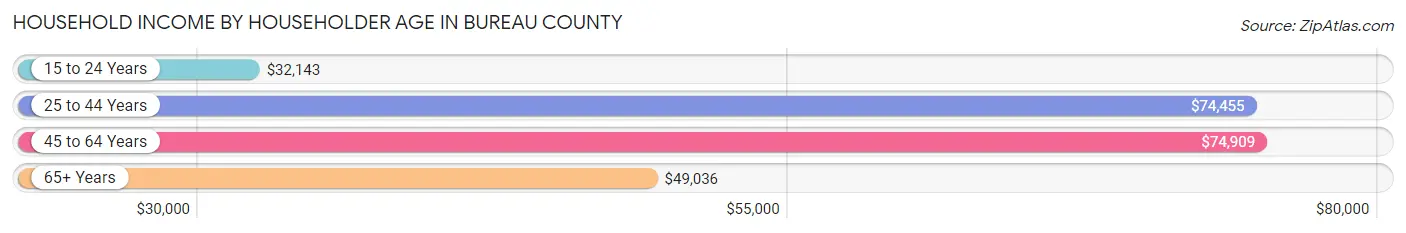
| Income Bracket | # Households | Median Income |
| 15 to 24 Years | 308 (2.2%) | $32,143 |
| 25 to 44 Years | 3,767 (27.1%) | $74,455 |
| 45 to 64 Years | 4,980 (35.8%) | $74,909 |
| 65+ Years | 4,846 (34.9%) | $49,036 |
| Total | 13,901 (100.0%) | $64,165 |
Poverty in Bureau County
Income Below Poverty by Sex and Age in Bureau County
With 11.7% poverty level for males and 13.6% for females among the residents of Bureau County, 5 year old males and 16 and 17 year old females are the most vulnerable to poverty, with 78 males (45.6%) and 104 females (24.5%) in their respective age groups living below the poverty level.
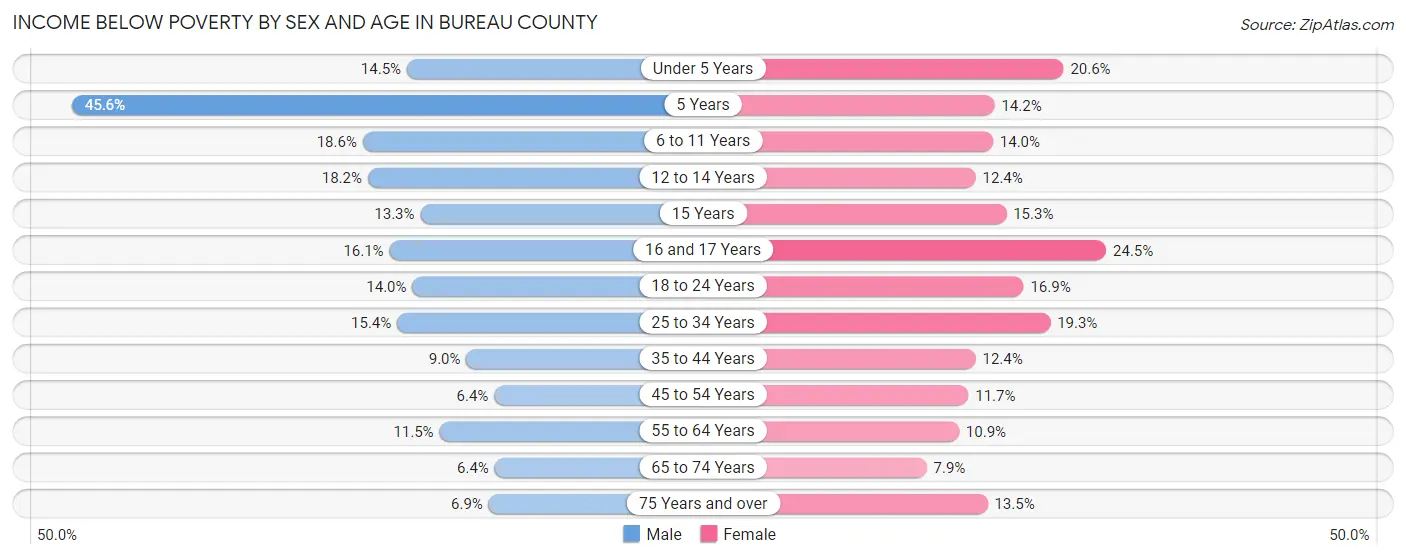
| Age Bracket | Male | Female |
| Under 5 Years | 124 (14.5%) | 152 (20.6%) |
| 5 Years | 78 (45.6%) | 36 (14.2%) |
| 6 to 11 Years | 229 (18.6%) | 159 (14.0%) |
| 12 to 14 Years | 114 (18.1%) | 59 (12.4%) |
| 15 Years | 28 (13.3%) | 47 (15.3%) |
| 16 and 17 Years | 66 (16.1%) | 104 (24.5%) |
| 18 to 24 Years | 179 (14.0%) | 214 (16.9%) |
| 25 to 34 Years | 280 (15.4%) | 334 (19.3%) |
| 35 to 44 Years | 177 (9.0%) | 227 (12.4%) |
| 45 to 54 Years | 132 (6.4%) | 234 (11.7%) |
| 55 to 64 Years | 271 (11.5%) | 264 (10.9%) |
| 65 to 74 Years | 124 (6.4%) | 165 (7.9%) |
| 75 Years and over | 89 (6.9%) | 242 (13.5%) |
| Total | 1,891 (11.7%) | 2,237 (13.6%) |
Income Above Poverty by Sex and Age in Bureau County
According to the poverty statistics in Bureau County, males aged 65 to 74 years and females aged 65 to 74 years are the age groups that are most secure financially, with 93.6% of males and 92.1% of females in these age groups living above the poverty line.
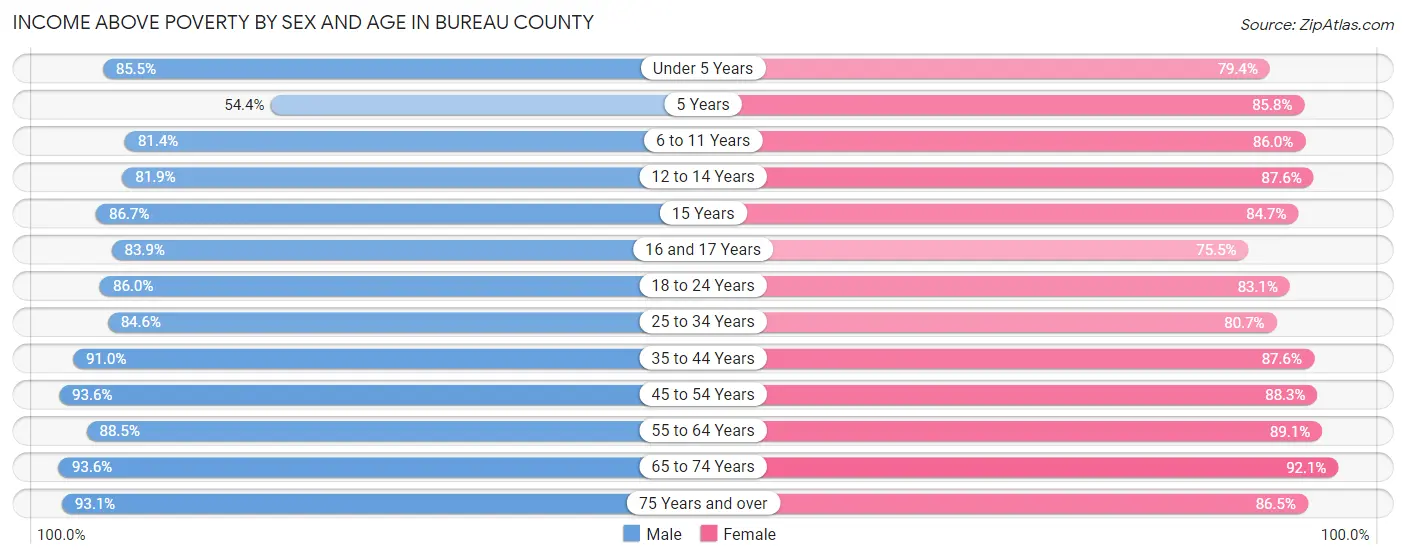
| Age Bracket | Male | Female |
| Under 5 Years | 730 (85.5%) | 587 (79.4%) |
| 5 Years | 93 (54.4%) | 218 (85.8%) |
| 6 to 11 Years | 1,001 (81.4%) | 975 (86.0%) |
| 12 to 14 Years | 514 (81.9%) | 416 (87.6%) |
| 15 Years | 183 (86.7%) | 261 (84.7%) |
| 16 and 17 Years | 343 (83.9%) | 320 (75.5%) |
| 18 to 24 Years | 1,099 (86.0%) | 1,055 (83.1%) |
| 25 to 34 Years | 1,535 (84.6%) | 1,393 (80.7%) |
| 35 to 44 Years | 1,789 (91.0%) | 1,602 (87.6%) |
| 45 to 54 Years | 1,925 (93.6%) | 1,760 (88.3%) |
| 55 to 64 Years | 2,085 (88.5%) | 2,165 (89.1%) |
| 65 to 74 Years | 1,822 (93.6%) | 1,931 (92.1%) |
| 75 Years and over | 1,196 (93.1%) | 1,548 (86.5%) |
| Total | 14,315 (88.3%) | 14,231 (86.4%) |
Income Below Poverty Among Married-Couple Families in Bureau County
The poverty statistics for married-couple families in Bureau County show that 3.9% or 267 of the total 6,916 families live below the poverty line. Families with 5 or more children have the highest poverty rate of 17.1%, comprising of 14 families. On the other hand, families with 3 or 4 children have the lowest poverty rate of 1.5%, which includes 7 families.
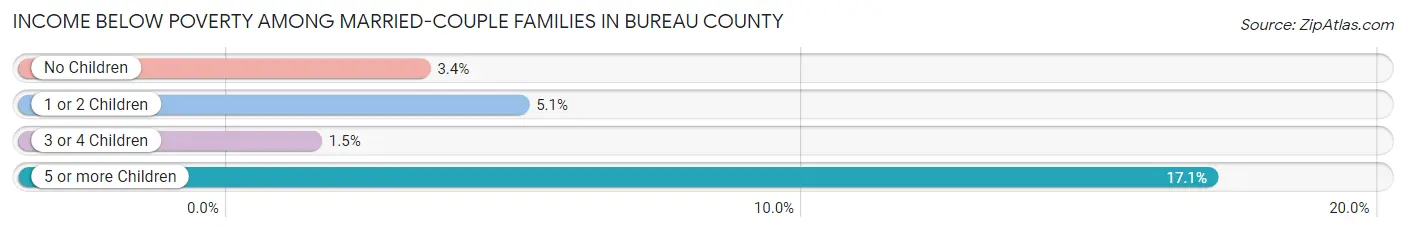
| Children | Above Poverty | Below Poverty |
| No Children | 4,295 (96.7%) | 149 (3.4%) |
| 1 or 2 Children | 1,815 (94.9%) | 97 (5.1%) |
| 3 or 4 Children | 471 (98.5%) | 7 (1.5%) |
| 5 or more Children | 68 (82.9%) | 14 (17.1%) |
| Total | 6,649 (96.1%) | 267 (3.9%) |
Income Below Poverty Among Single-Parent Households in Bureau County
According to the poverty data in Bureau County, 10.3% or 62 single-father households and 35.6% or 486 single-mother households are living below the poverty line. Among single-father households, those with 5 or more children have the highest poverty rate, with 10 households (100.0%) experiencing poverty. Likewise, among single-mother households, those with 3 or 4 children have the highest poverty rate, with 97 households (61.0%) falling below the poverty line.
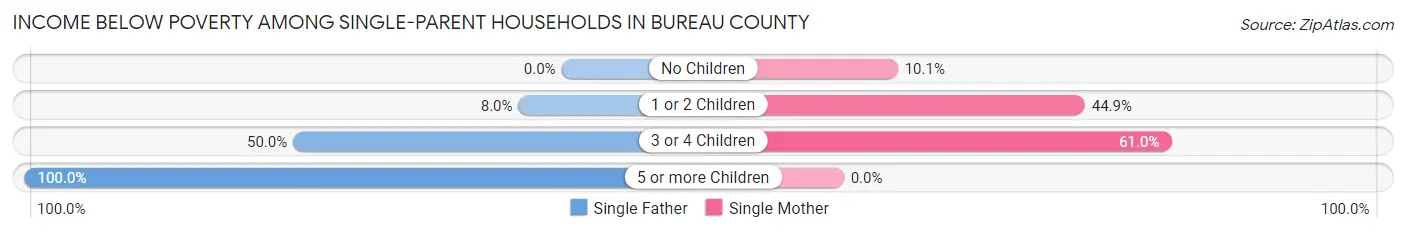
| Children | Single Father | Single Mother |
| No Children | 0 (0.0%) | 44 (10.1%) |
| 1 or 2 Children | 22 (8.0%) | 345 (44.9%) |
| 3 or 4 Children | 30 (50.0%) | 97 (61.0%) |
| 5 or more Children | 10 (100.0%) | 0 (0.0%) |
| Total | 62 (10.3%) | 486 (35.6%) |
Income Below Poverty Among Married-Couple vs Single-Parent Households in Bureau County
The poverty data for Bureau County shows that 267 of the married-couple family households (3.9%) and 548 of the single-parent households (27.9%) are living below the poverty level. Within the married-couple family households, those with 5 or more children have the highest poverty rate, with 14 households (17.1%) falling below the poverty line. Among the single-parent households, those with 5 or more children have the highest poverty rate, with 10 household (100.0%) living below poverty.
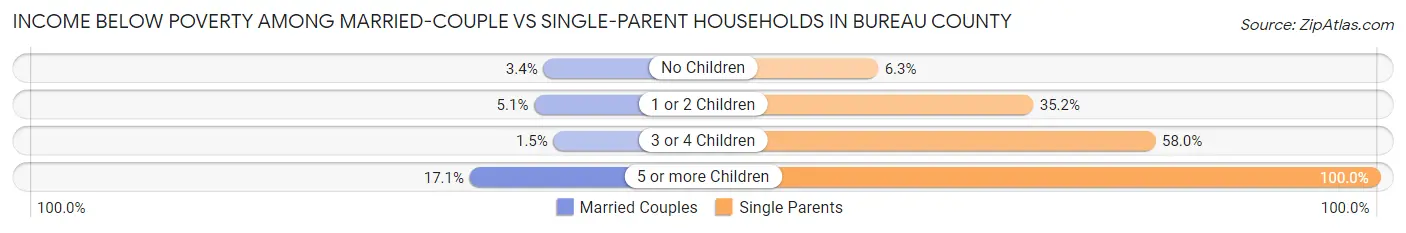
| Children | Married-Couple Families | Single-Parent Households |
| No Children | 149 (3.4%) | 44 (6.3%) |
| 1 or 2 Children | 97 (5.1%) | 367 (35.2%) |
| 3 or 4 Children | 7 (1.5%) | 127 (58.0%) |
| 5 or more Children | 14 (17.1%) | 10 (100.0%) |
| Total | 267 (3.9%) | 548 (27.9%) |
Race in Bureau County
The most populous races in Bureau County are White / Caucasian (30,017 | 90.4%), Hispanic or Latino (3,288 | 9.9%), and Two or more Races (1,361 | 4.1%).
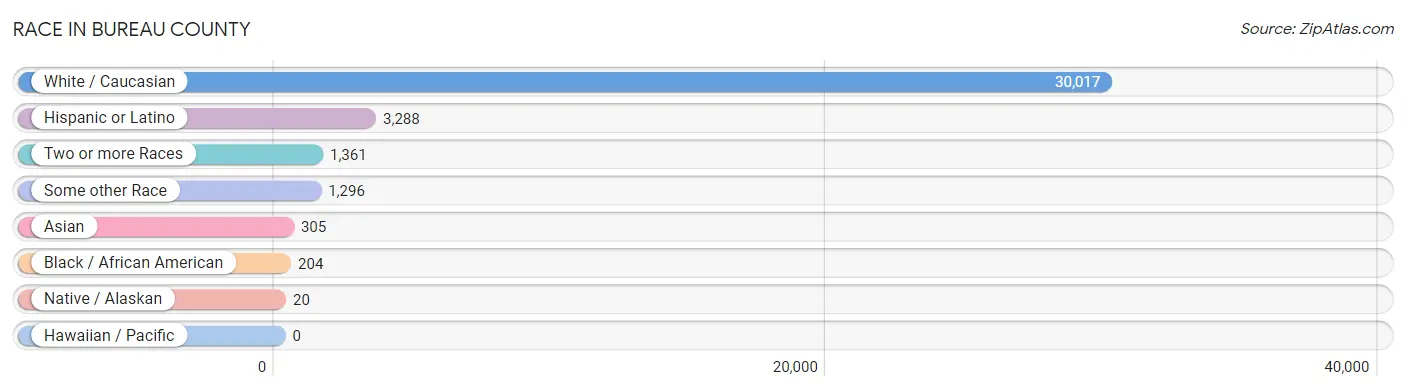
| Race | # Population | % Population |
| Asian | 305 | 0.9% |
| Black / African American | 204 | 0.6% |
| Hawaiian / Pacific | 0 | 0.0% |
| Hispanic or Latino | 3,288 | 9.9% |
| Native / Alaskan | 20 | 0.1% |
| White / Caucasian | 30,017 | 90.4% |
| Two or more Races | 1,361 | 4.1% |
| Some other Race | 1,296 | 3.9% |
| Total | 33,203 | 100.0% |
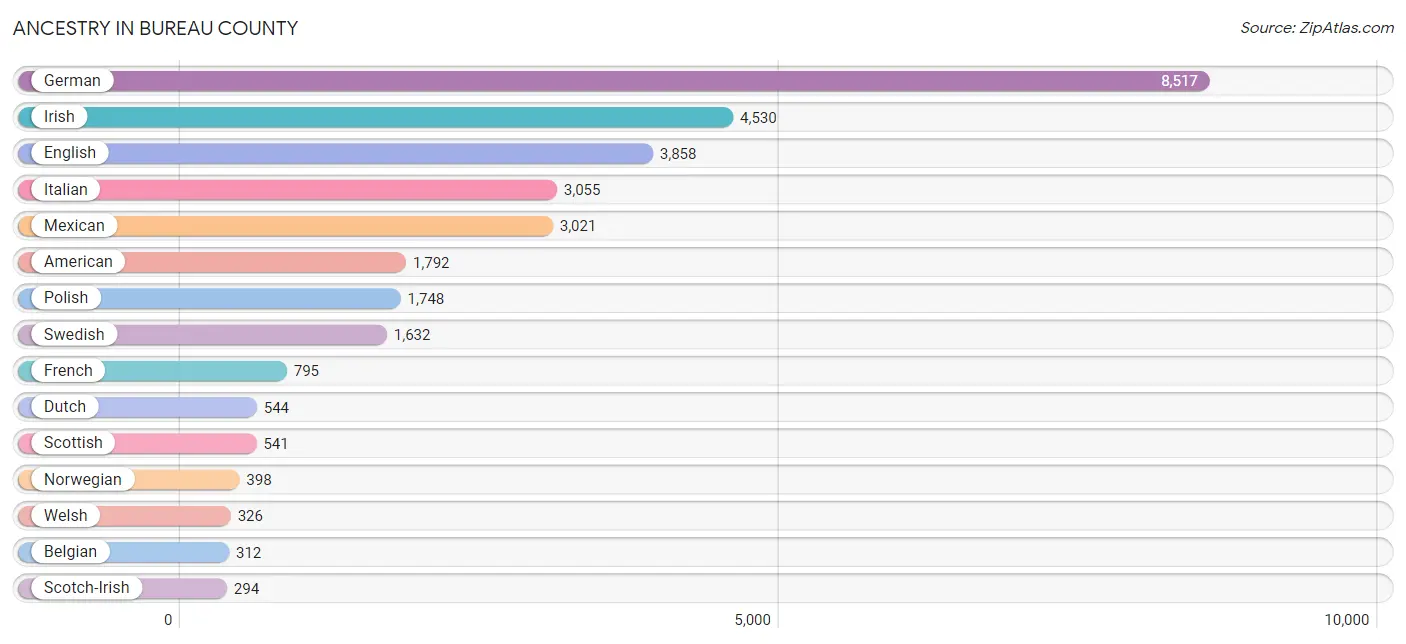
Ancestry in Bureau County
The most populous ancestries reported in Bureau County are German (8,517 | 25.7%), Irish (4,530 | 13.6%), English (3,858 | 11.6%), Italian (3,055 | 9.2%), and Mexican (3,021 | 9.1%), together accounting for 69.2% of all Bureau County residents.
| Ancestry | # Population | % Population |
| African | 14 | 0.0% |
| American | 1,792 | 5.4% |
| Apache | 13 | 0.0% |
| Arab | 46 | 0.1% |
| Armenian | 3 | 0.0% |
| Austrian | 57 | 0.2% |
| Bangladeshi | 44 | 0.1% |
| Basque | 1 | 0.0% |
| Belgian | 312 | 0.9% |
| Bhutanese | 21 | 0.1% |
| Blackfeet | 11 | 0.0% |
| Brazilian | 17 | 0.1% |
| British | 72 | 0.2% |
| Burmese | 24 | 0.1% |
| Canadian | 25 | 0.1% |
| Celtic | 2 | 0.0% |
| Central American Indian | 5 | 0.0% |
| Cherokee | 51 | 0.2% |
| Chippewa | 8 | 0.0% |
| Colombian | 23 | 0.1% |
| Comanche | 1 | 0.0% |
| Cree | 3 | 0.0% |
| Croatian | 32 | 0.1% |
| Czech | 140 | 0.4% |
| Czechoslovakian | 26 | 0.1% |
| Danish | 244 | 0.7% |
| Dutch | 544 | 1.6% |
| Eastern European | 18 | 0.1% |
| English | 3,858 | 11.6% |
| European | 277 | 0.8% |
| Finnish | 38 | 0.1% |
| French | 795 | 2.4% |
| French Canadian | 95 | 0.3% |
| German | 8,517 | 25.7% |
| Greek | 111 | 0.3% |
| Haitian | 11 | 0.0% |
| Hungarian | 25 | 0.1% |
| Indian (Asian) | 41 | 0.1% |
| Irish | 4,530 | 13.6% |
| Iroquois | 4 | 0.0% |
| Italian | 3,055 | 9.2% |
| Korean | 182 | 0.5% |
| Laotian | 3 | 0.0% |
| Latvian | 7 | 0.0% |
| Lithuanian | 264 | 0.8% |
| Luxembourger | 6 | 0.0% |
| Macedonian | 8 | 0.0% |
| Malaysian | 10 | 0.0% |
| Menominee | 12 | 0.0% |
| Mexican | 3,021 | 9.1% |
| Mexican American Indian | 8 | 0.0% |
| Native Hawaiian | 15 | 0.1% |
| Nepalese | 32 | 0.1% |
| Northern European | 8 | 0.0% |
| Norwegian | 398 | 1.2% |
| Pennsylvania German | 16 | 0.1% |
| Polish | 1,748 | 5.3% |
| Portuguese | 24 | 0.1% |
| Pueblo | 15 | 0.1% |
| Puerto Rican | 118 | 0.4% |
| Romanian | 7 | 0.0% |
| Russian | 121 | 0.4% |
| Scandinavian | 226 | 0.7% |
| Scotch-Irish | 294 | 0.9% |
| Scottish | 541 | 1.6% |
| Serbian | 6 | 0.0% |
| Sioux | 4 | 0.0% |
| Slavic | 18 | 0.1% |
| Slovak | 98 | 0.3% |
| Slovene | 150 | 0.4% |
| South American | 26 | 0.1% |
| Spaniard | 33 | 0.1% |
| Spanish | 33 | 0.1% |
| Spanish American | 4 | 0.0% |
| Sri Lankan | 9 | 0.0% |
| Subsaharan African | 14 | 0.0% |
| Swedish | 1,632 | 4.9% |
| Swiss | 87 | 0.3% |
| Syrian | 46 | 0.1% |
| Thai | 68 | 0.2% |
| Turkish | 6 | 0.0% |
| Ukrainian | 6 | 0.0% |
| Venezuelan | 3 | 0.0% |
| Welsh | 326 | 1.0% |
| Yugoslavian | 11 | 0.0% | View All 85 Rows |
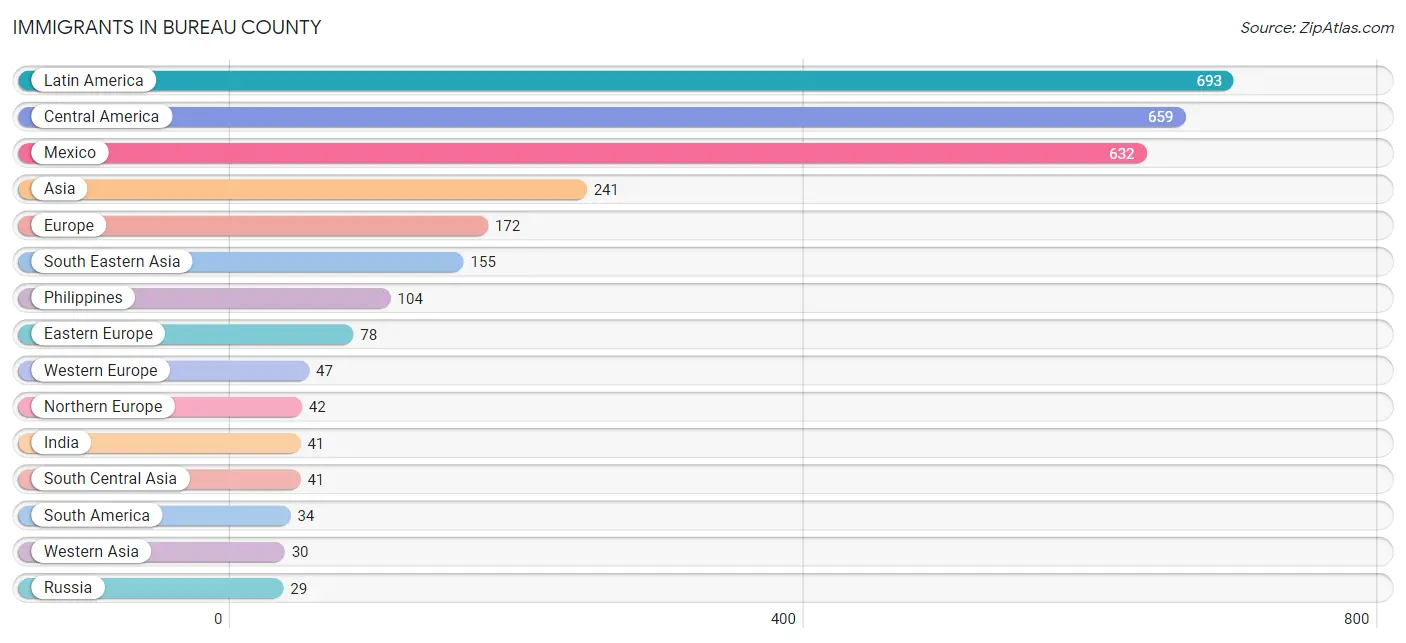
Immigrants in Bureau County
The most numerous immigrant groups reported in Bureau County came from Latin America (693 | 2.1%), Central America (659 | 2.0%), Mexico (632 | 1.9%), Asia (241 | 0.7%), and Europe (172 | 0.5%), together accounting for 7.2% of all Bureau County residents.
| Immigration Origin | # Population | % Population |
| Asia | 241 | 0.7% |
| Austria | 10 | 0.0% |
| Brazil | 15 | 0.1% |
| Canada | 6 | 0.0% |
| Central America | 659 | 2.0% |
| China | 8 | 0.0% |
| Colombia | 16 | 0.1% |
| Eastern Asia | 15 | 0.1% |
| Eastern Europe | 78 | 0.2% |
| England | 28 | 0.1% |
| Europe | 172 | 0.5% |
| Germany | 28 | 0.1% |
| Guatemala | 27 | 0.1% |
| India | 41 | 0.1% |
| Indonesia | 11 | 0.0% |
| Italy | 5 | 0.0% |
| Japan | 2 | 0.0% |
| Korea | 5 | 0.0% |
| Kuwait | 5 | 0.0% |
| Laos | 12 | 0.0% |
| Latin America | 693 | 2.1% |
| Latvia | 7 | 0.0% |
| Mexico | 632 | 1.9% |
| Netherlands | 7 | 0.0% |
| Northern Europe | 42 | 0.1% |
| Philippines | 104 | 0.3% |
| Poland | 19 | 0.1% |
| Romania | 7 | 0.0% |
| Russia | 29 | 0.1% |
| Scotland | 2 | 0.0% |
| South America | 34 | 0.1% |
| South Central Asia | 41 | 0.1% |
| South Eastern Asia | 155 | 0.5% |
| Southern Europe | 5 | 0.0% |
| Sweden | 2 | 0.0% |
| Switzerland | 2 | 0.0% |
| Syria | 25 | 0.1% |
| Thailand | 19 | 0.1% |
| Venezuela | 3 | 0.0% |
| Vietnam | 9 | 0.0% |
| Western Asia | 30 | 0.1% |
| Western Europe | 47 | 0.1% | View All 42 Rows |
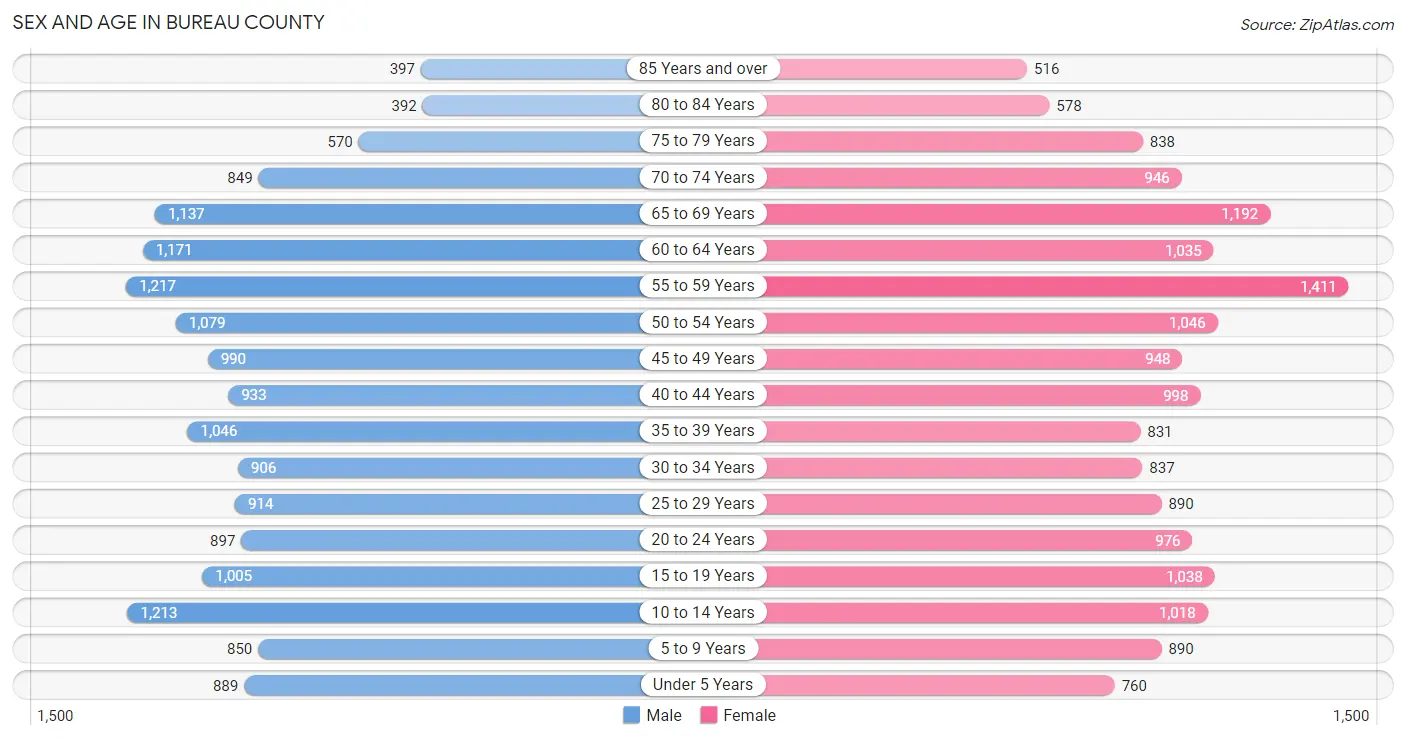
Sex and Age in Bureau County
Sex and Age in Bureau County
The most populous age groups in Bureau County are 55 to 59 Years (1,217 | 7.4%) for men and 55 to 59 Years (1,411 | 8.4%) for women.
| Age Bracket | Male | Female |
| Under 5 Years | 889 (5.4%) | 760 (4.5%) |
| 5 to 9 Years | 850 (5.2%) | 890 (5.3%) |
| 10 to 14 Years | 1,213 (7.4%) | 1,018 (6.1%) |
| 15 to 19 Years | 1,005 (6.1%) | 1,038 (6.2%) |
| 20 to 24 Years | 897 (5.4%) | 976 (5.8%) |
| 25 to 29 Years | 914 (5.6%) | 890 (5.3%) |
| 30 to 34 Years | 906 (5.5%) | 837 (5.0%) |
| 35 to 39 Years | 1,046 (6.4%) | 831 (5.0%) |
| 40 to 44 Years | 933 (5.7%) | 998 (6.0%) |
| 45 to 49 Years | 990 (6.0%) | 948 (5.7%) |
| 50 to 54 Years | 1,079 (6.6%) | 1,046 (6.2%) |
| 55 to 59 Years | 1,217 (7.4%) | 1,411 (8.4%) |
| 60 to 64 Years | 1,171 (7.1%) | 1,035 (6.2%) |
| 65 to 69 Years | 1,137 (6.9%) | 1,192 (7.1%) |
| 70 to 74 Years | 849 (5.2%) | 946 (5.7%) |
| 75 to 79 Years | 570 (3.5%) | 838 (5.0%) |
| 80 to 84 Years | 392 (2.4%) | 578 (3.5%) |
| 85 Years and over | 397 (2.4%) | 516 (3.1%) |
| Total | 16,455 (100.0%) | 16,748 (100.0%) |
Families and Households in Bureau County
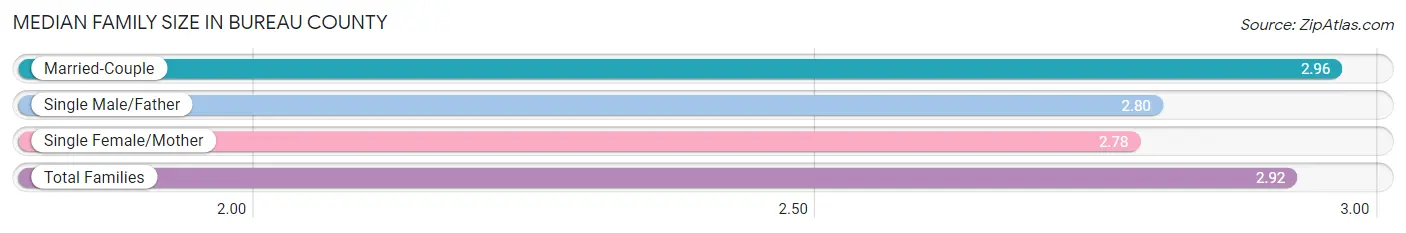
Median Family Size in Bureau County
The median family size in Bureau County is 2.92 persons per family, with married-couple families (6,916 | 77.9%) accounting for the largest median family size of 2.96 persons per family. On the other hand, single female/mother families (1,364 | 15.4%) represent the smallest median family size with 2.78 persons per family.
| Family Type | # Families | Family Size |
| Married-Couple | 6,916 (77.9%) | 2.96 |
| Single Male/Father | 601 (6.8%) | 2.80 |
| Single Female/Mother | 1,364 (15.4%) | 2.78 |
| Total Families | 8,881 (100.0%) | 2.92 |
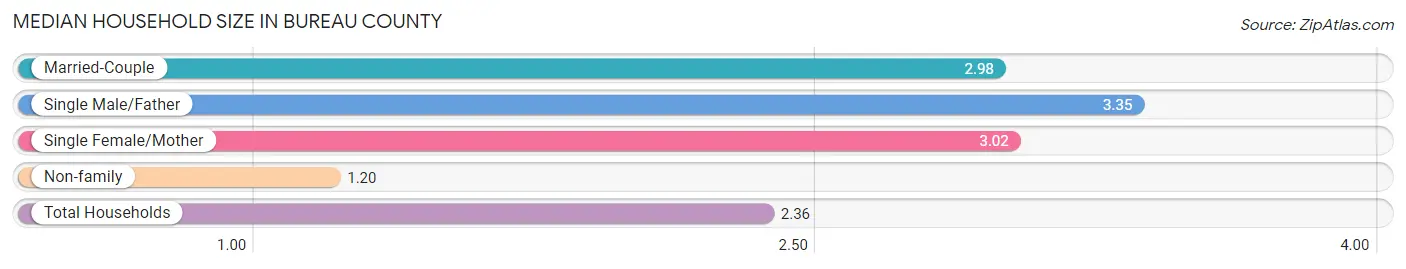
Median Household Size in Bureau County
The median household size in Bureau County is 2.36 persons per household, with single male/father households (601 | 4.3%) accounting for the largest median household size of 3.35 persons per household. non-family households (5,020 | 36.1%) represent the smallest median household size with 1.20 persons per household.
| Household Type | # Households | Household Size |
| Married-Couple | 6,916 (49.7%) | 2.98 |
| Single Male/Father | 601 (4.3%) | 3.35 |
| Single Female/Mother | 1,364 (9.8%) | 3.02 |
| Non-family | 5,020 (36.1%) | 1.20 |
| Total Households | 13,901 (100.0%) | 2.36 |
Household Size by Marriage Status in Bureau County
Out of a total of 13,901 households in Bureau County, 8,881 (63.9%) are family households, while 5,020 (36.1%) are nonfamily households. The most numerous type of family households are 2-person households, comprising 4,600, and the most common type of nonfamily households are 1-person households, comprising 4,156.
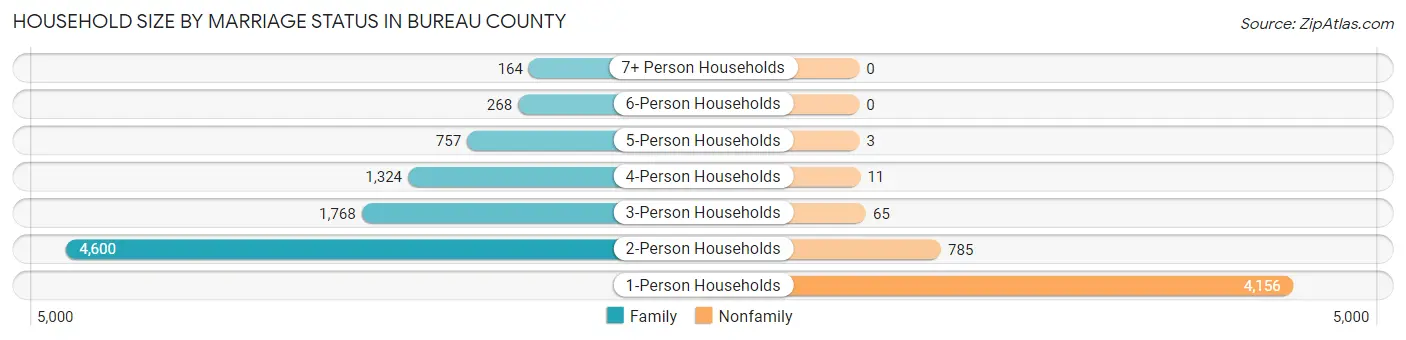
| Household Size | Family Households | Nonfamily Households |
| 1-Person Households | - | 4,156 (29.9%) |
| 2-Person Households | 4,600 (33.1%) | 785 (5.7%) |
| 3-Person Households | 1,768 (12.7%) | 65 (0.5%) |
| 4-Person Households | 1,324 (9.5%) | 11 (0.1%) |
| 5-Person Households | 757 (5.4%) | 3 (0.0%) |
| 6-Person Households | 268 (1.9%) | 0 (0.0%) |
| 7+ Person Households | 164 (1.2%) | 0 (0.0%) |
| Total | 8,881 (63.9%) | 5,020 (36.1%) |
Female Fertility in Bureau County
Fertility by Age in Bureau County
Average fertility rate in Bureau County is 52.0 births per 1,000 women. Women in the age bracket of 20 to 34 years have the highest fertility rate with 116.0 births per 1,000 women. Women in the age bracket of 20 to 34 years acount for 90.2% of all women with births.
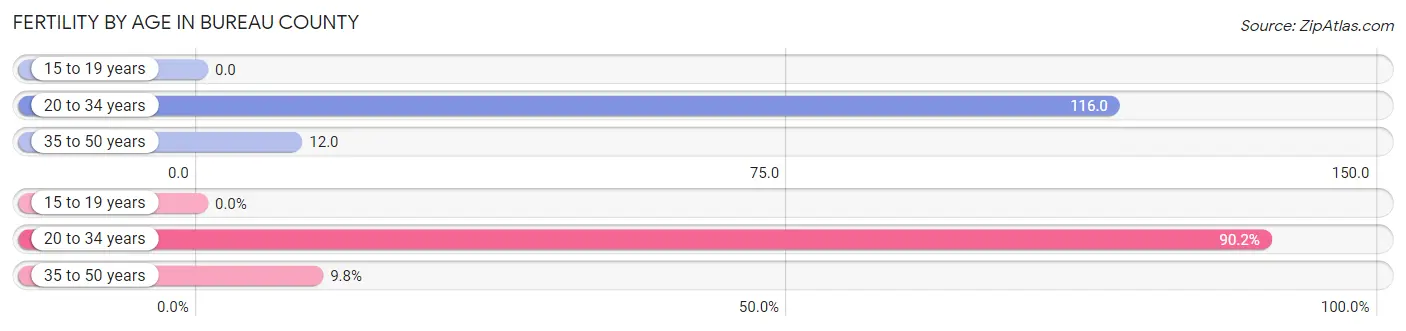
| Age Bracket | Women with Births | Births / 1,000 Women |
| 15 to 19 years | 0 (0.0%) | 0.0 |
| 20 to 34 years | 314 (90.2%) | 116.0 |
| 35 to 50 years | 34 (9.8%) | 12.0 |
| Total | 348 (100.0%) | 52.0 |
Fertility by Age by Marriage Status in Bureau County
81.0% of women with births (348) in Bureau County are married. The highest percentage of unmarried women with births falls into 20 to 34 years age bracket with 21.0% of them unmarried at the time of birth, while the lowest percentage of unmarried women with births belong to 35 to 50 years age bracket with 0.0% of them unmarried.
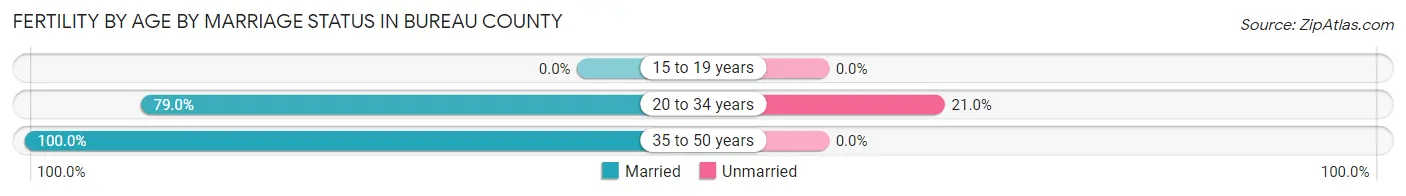
| Age Bracket | Married | Unmarried |
| 15 to 19 years | 0 (0.0%) | 0 (0.0%) |
| 20 to 34 years | 248 (79.0%) | 66 (21.0%) |
| 35 to 50 years | 34 (100.0%) | 0 (0.0%) |
| Total | 282 (81.0%) | 66 (19.0%) |
Fertility by Education in Bureau County
Average fertility rate in Bureau County is 52.0 births per 1,000 women. Women with the education attainment of graduate degree have the highest fertility rate of 87.0 births per 1,000 women, while women with the education attainment of bachelor's degree have the lowest fertility at 26.0 births per 1,000 women. Women with the education attainment of college or associate's degree represent 37.9% of all women with births.
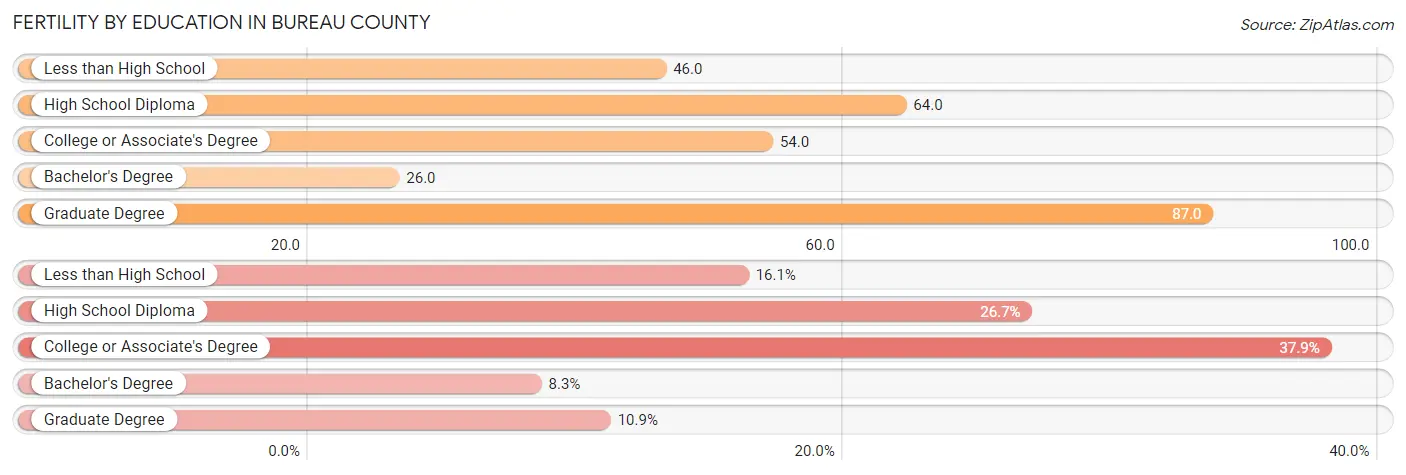
| Educational Attainment | Women with Births | Births / 1,000 Women |
| Less than High School | 56 (16.1%) | 46.0 |
| High School Diploma | 93 (26.7%) | 64.0 |
| College or Associate's Degree | 132 (37.9%) | 54.0 |
| Bachelor's Degree | 29 (8.3%) | 26.0 |
| Graduate Degree | 38 (10.9%) | 87.0 |
| Total | 348 (100.0%) | 52.0 |
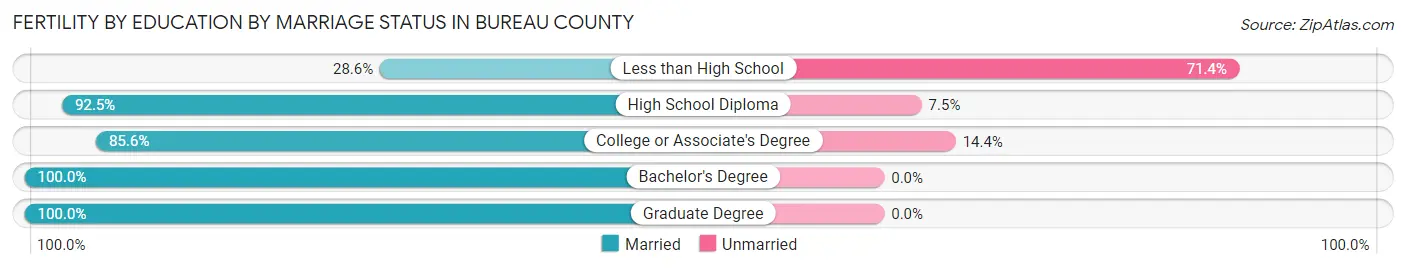
Fertility by Education by Marriage Status in Bureau County
19.0% of women with births in Bureau County are unmarried. Women with the educational attainment of bachelor's degree are most likely to be married with 100.0% of them married at childbirth, while women with the educational attainment of less than high school are least likely to be married with 71.4% of them unmarried at childbirth.
| Educational Attainment | Married | Unmarried |
| Less than High School | 16 (28.6%) | 40 (71.4%) |
| High School Diploma | 86 (92.5%) | 7 (7.5%) |
| College or Associate's Degree | 113 (85.6%) | 19 (14.4%) |
| Bachelor's Degree | 29 (100.0%) | 0 (0.0%) |
| Graduate Degree | 38 (100.0%) | 0 (0.0%) |
| Total | 282 (81.0%) | 66 (19.0%) |
Employment Characteristics in Bureau County
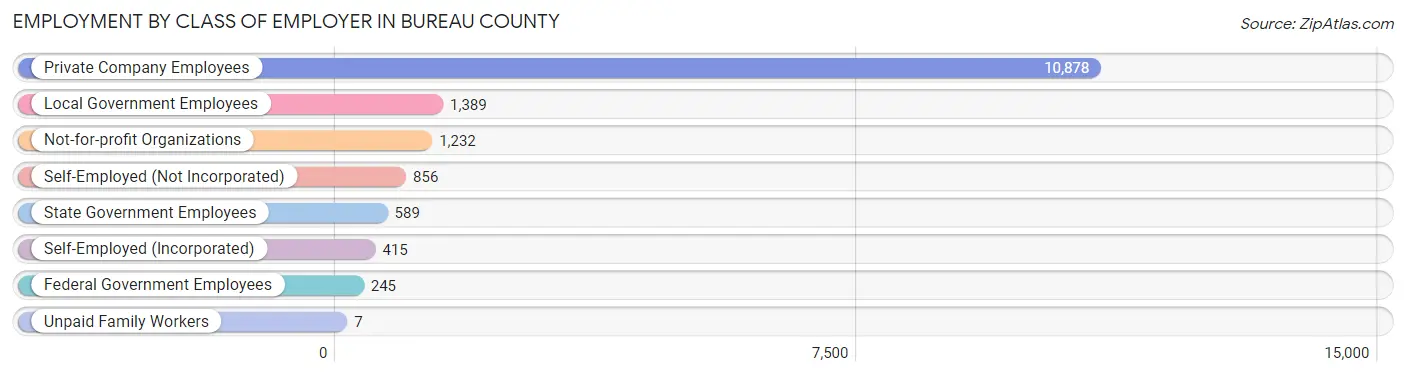
Employment by Class of Employer in Bureau County
Among the 15,611 employed individuals in Bureau County, private company employees (10,878 | 69.7%), local government employees (1,389 | 8.9%), and not-for-profit organizations (1,232 | 7.9%) make up the most common classes of employment.
| Employer Class | # Employees | % Employees |
| Private Company Employees | 10,878 | 69.7% |
| Self-Employed (Incorporated) | 415 | 2.7% |
| Self-Employed (Not Incorporated) | 856 | 5.5% |
| Not-for-profit Organizations | 1,232 | 7.9% |
| Local Government Employees | 1,389 | 8.9% |
| State Government Employees | 589 | 3.8% |
| Federal Government Employees | 245 | 1.6% |
| Unpaid Family Workers | 7 | 0.0% |
| Total | 15,611 | 100.0% |
Employment Status by Age in Bureau County
According to the labor force statistics for Bureau County, out of the total population over 16 years of age (27,064), 62.4% or 16,888 individuals are in the labor force, with 5.7% or 963 of them unemployed. The age group with the highest labor force participation rate is 25 to 29 years, with 89.6% or 1,616 individuals in the labor force. Within the labor force, the 16 to 19 years age range has the highest percentage of unemployed individuals, with 16.5% or 145 of them being unemployed.
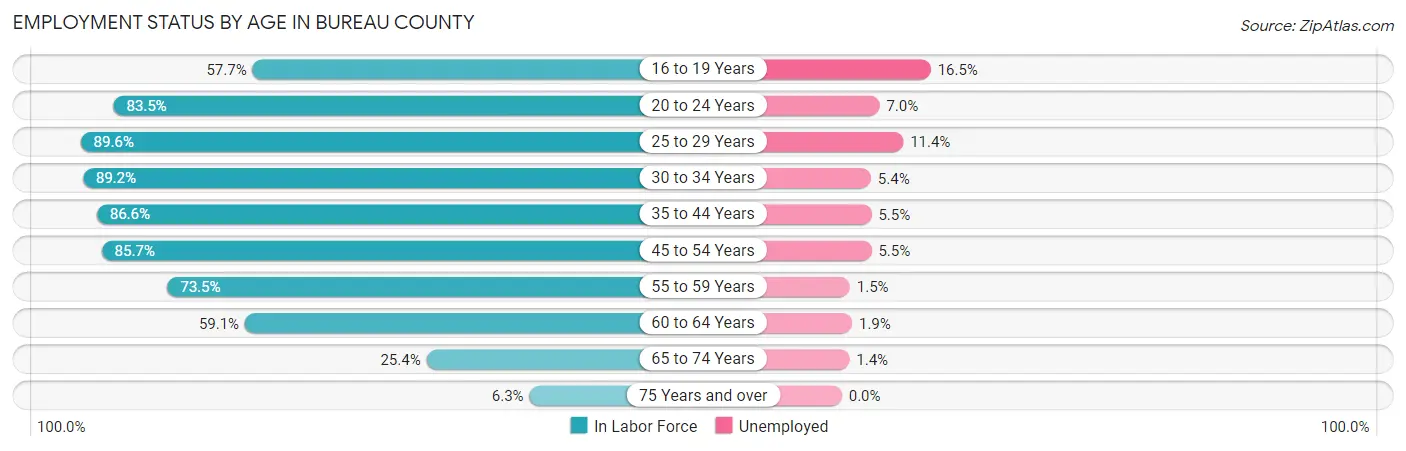
| Age Bracket | In Labor Force | Unemployed |
| 16 to 19 Years | 879 (57.7%) | 145 (16.5%) |
| 20 to 24 Years | 1,564 (83.5%) | 109 (7.0%) |
| 25 to 29 Years | 1,616 (89.6%) | 184 (11.4%) |
| 30 to 34 Years | 1,555 (89.2%) | 84 (5.4%) |
| 35 to 44 Years | 3,298 (86.6%) | 181 (5.5%) |
| 45 to 54 Years | 3,482 (85.7%) | 192 (5.5%) |
| 55 to 59 Years | 1,932 (73.5%) | 29 (1.5%) |
| 60 to 64 Years | 1,304 (59.1%) | 25 (1.9%) |
| 65 to 74 Years | 1,047 (25.4%) | 15 (1.4%) |
| 75 Years and over | 207 (6.3%) | 0 (0.0%) |
| Total | 16,888 (62.4%) | 963 (5.7%) |
Employment Status by Educational Attainment in Bureau County
According to labor force statistics for Bureau County, 81.1% of individuals (13,180) out of the total population between 25 and 64 years of age (16,252) are in the labor force, with 5.3% or 699 of them being unemployed. The group with the highest labor force participation rate are those with the educational attainment of bachelor's degree or higher, with 89.1% or 3,323 individuals in the labor force. Within the labor force, individuals with less than high school education have the highest percentage of unemployment, with 14.4% or 143 of them being unemployed.
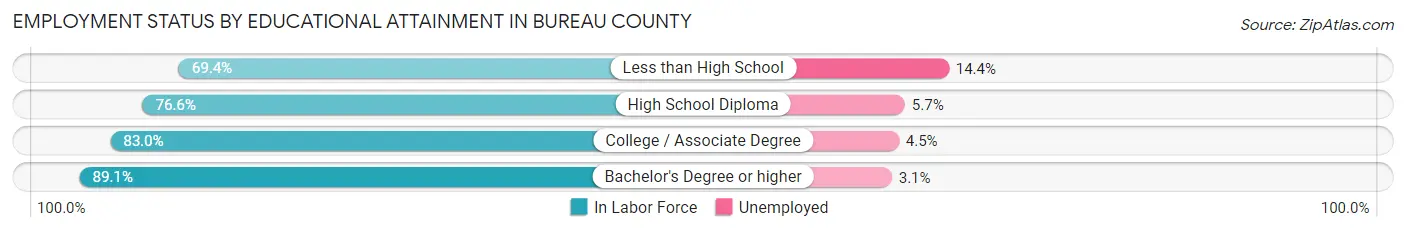
| Educational Attainment | In Labor Force | Unemployed |
| Less than High School | 996 (69.4%) | 207 (14.4%) |
| High School Diploma | 3,974 (76.6%) | 296 (5.7%) |
| College / Associate Degree | 4,896 (83.0%) | 265 (4.5%) |
| Bachelor's Degree or higher | 3,323 (89.1%) | 116 (3.1%) |
| Total | 13,180 (81.1%) | 861 (5.3%) |
Employment Occupations by Sex in Bureau County
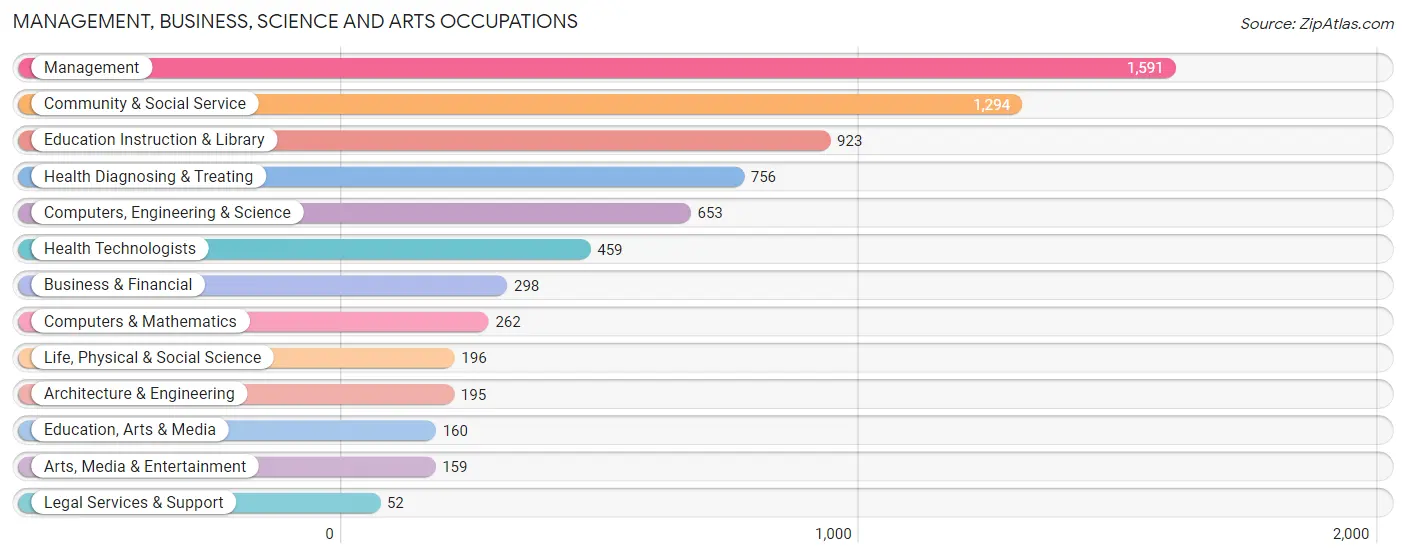
Management, Business, Science and Arts Occupations
The most common Management, Business, Science and Arts occupations in Bureau County are Management (1,591 | 10.0%), Community & Social Service (1,294 | 8.1%), Education Instruction & Library (923 | 5.8%), Health Diagnosing & Treating (756 | 4.8%), and Computers, Engineering & Science (653 | 4.1%).
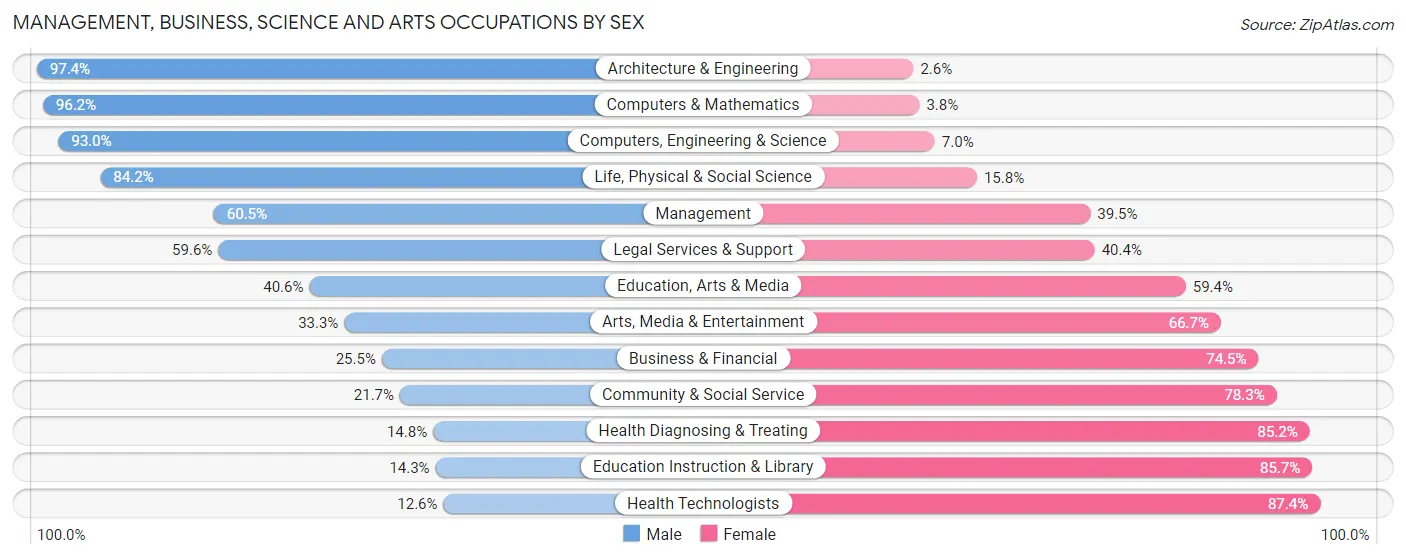
Management, Business, Science and Arts Occupations by Sex
Within the Management, Business, Science and Arts occupations in Bureau County, the most male-oriented occupations are Architecture & Engineering (97.4%), Computers & Mathematics (96.2%), and Computers, Engineering & Science (93.0%), while the most female-oriented occupations are Health Technologists (87.4%), Education Instruction & Library (85.7%), and Health Diagnosing & Treating (85.2%).
| Occupation | Male | Female |
| Management | 963 (60.5%) | 628 (39.5%) |
| Business & Financial | 76 (25.5%) | 222 (74.5%) |
| Computers, Engineering & Science | 607 (93.0%) | 46 (7.0%) |
| Computers & Mathematics | 252 (96.2%) | 10 (3.8%) |
| Architecture & Engineering | 190 (97.4%) | 5 (2.6%) |
| Life, Physical & Social Science | 165 (84.2%) | 31 (15.8%) |
| Community & Social Service | 281 (21.7%) | 1,013 (78.3%) |
| Education, Arts & Media | 65 (40.6%) | 95 (59.4%) |
| Legal Services & Support | 31 (59.6%) | 21 (40.4%) |
| Education Instruction & Library | 132 (14.3%) | 791 (85.7%) |
| Arts, Media & Entertainment | 53 (33.3%) | 106 (66.7%) |
| Health Diagnosing & Treating | 112 (14.8%) | 644 (85.2%) |
| Health Technologists | 58 (12.6%) | 401 (87.4%) |
| Total (Category) | 2,039 (44.4%) | 2,553 (55.6%) |
| Total (Overall) | 8,425 (53.0%) | 7,481 (47.0%) |
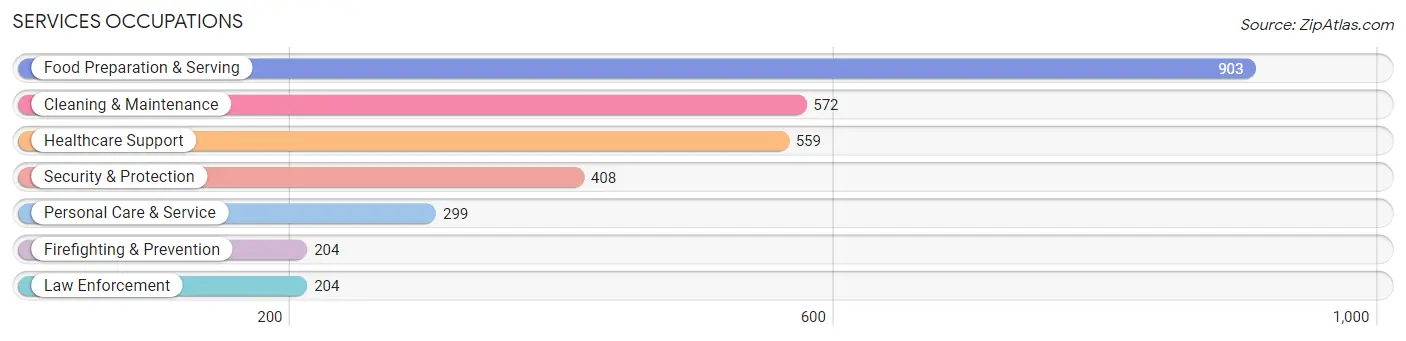
Services Occupations
The most common Services occupations in Bureau County are Food Preparation & Serving (903 | 5.7%), Cleaning & Maintenance (572 | 3.6%), Healthcare Support (559 | 3.5%), Security & Protection (408 | 2.6%), and Personal Care & Service (299 | 1.9%).
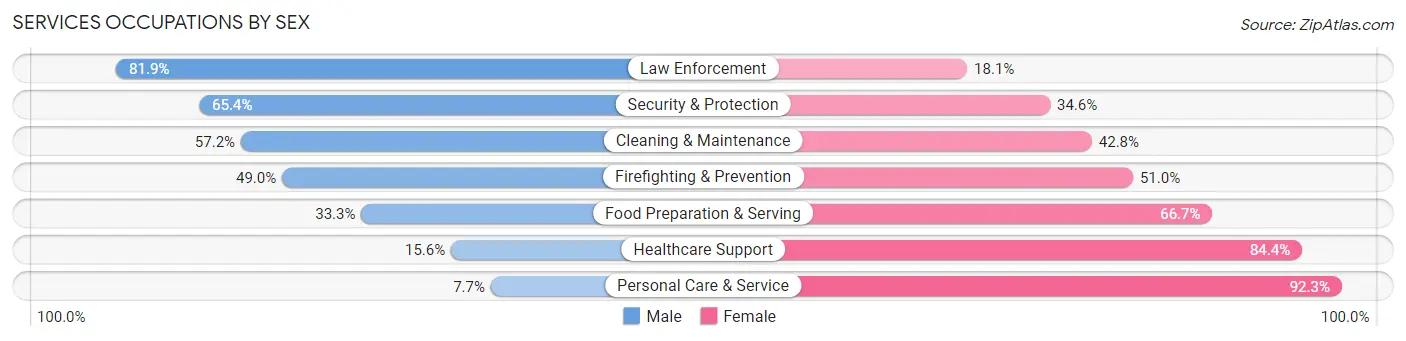
Services Occupations by Sex
Within the Services occupations in Bureau County, the most male-oriented occupations are Law Enforcement (81.9%), Security & Protection (65.4%), and Cleaning & Maintenance (57.2%), while the most female-oriented occupations are Personal Care & Service (92.3%), Healthcare Support (84.4%), and Food Preparation & Serving (66.7%).
| Occupation | Male | Female |
| Healthcare Support | 87 (15.6%) | 472 (84.4%) |
| Security & Protection | 267 (65.4%) | 141 (34.6%) |
| Firefighting & Prevention | 100 (49.0%) | 104 (51.0%) |
| Law Enforcement | 167 (81.9%) | 37 (18.1%) |
| Food Preparation & Serving | 301 (33.3%) | 602 (66.7%) |
| Cleaning & Maintenance | 327 (57.2%) | 245 (42.8%) |
| Personal Care & Service | 23 (7.7%) | 276 (92.3%) |
| Total (Category) | 1,005 (36.7%) | 1,736 (63.3%) |
| Total (Overall) | 8,425 (53.0%) | 7,481 (47.0%) |
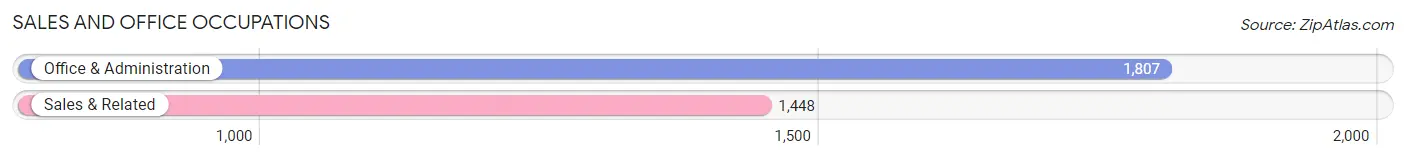
Sales and Office Occupations
The most common Sales and Office occupations in Bureau County are Office & Administration (1,807 | 11.4%), and Sales & Related (1,448 | 9.1%).
Sales and Office Occupations by Sex
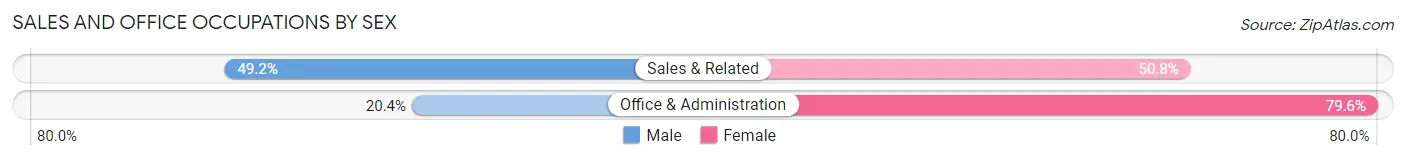
| Occupation | Male | Female |
| Sales & Related | 713 (49.2%) | 735 (50.8%) |
| Office & Administration | 369 (20.4%) | 1,438 (79.6%) |
| Total (Category) | 1,082 (33.2%) | 2,173 (66.8%) |
| Total (Overall) | 8,425 (53.0%) | 7,481 (47.0%) |
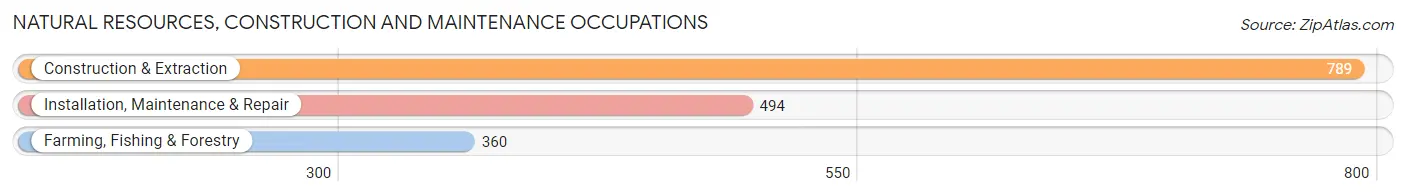
Natural Resources, Construction and Maintenance Occupations
The most common Natural Resources, Construction and Maintenance occupations in Bureau County are Construction & Extraction (789 | 5.0%), Installation, Maintenance & Repair (494 | 3.1%), and Farming, Fishing & Forestry (360 | 2.3%).
Natural Resources, Construction and Maintenance Occupations by Sex
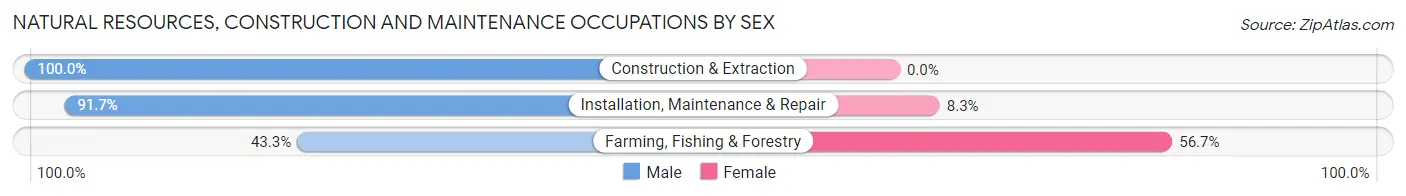
| Occupation | Male | Female |
| Farming, Fishing & Forestry | 156 (43.3%) | 204 (56.7%) |
| Construction & Extraction | 789 (100.0%) | 0 (0.0%) |
| Installation, Maintenance & Repair | 453 (91.7%) | 41 (8.3%) |
| Total (Category) | 1,398 (85.1%) | 245 (14.9%) |
| Total (Overall) | 8,425 (53.0%) | 7,481 (47.0%) |
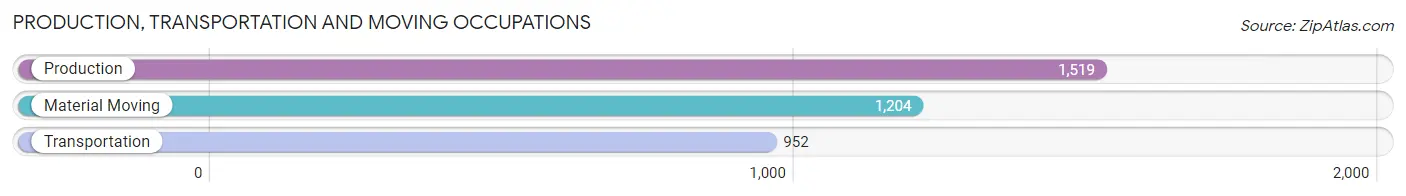
Production, Transportation and Moving Occupations
The most common Production, Transportation and Moving occupations in Bureau County are Production (1,519 | 9.6%), Material Moving (1,204 | 7.6%), and Transportation (952 | 6.0%).
Production, Transportation and Moving Occupations by Sex
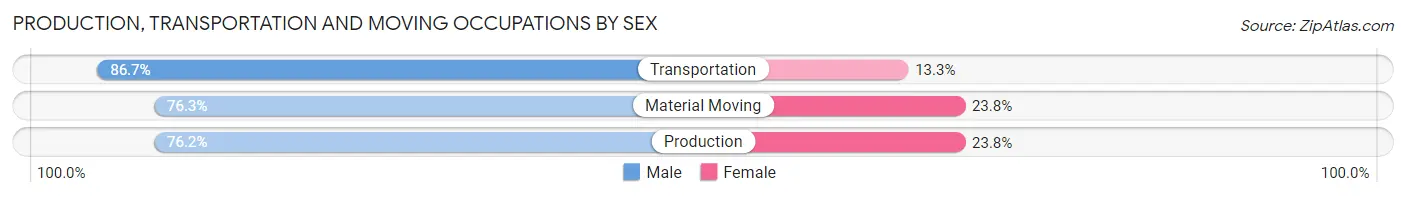
| Occupation | Male | Female |
| Production | 1,158 (76.2%) | 361 (23.8%) |
| Transportation | 825 (86.7%) | 127 (13.3%) |
| Material Moving | 918 (76.2%) | 286 (23.7%) |
| Total (Category) | 2,901 (78.9%) | 774 (21.1%) |
| Total (Overall) | 8,425 (53.0%) | 7,481 (47.0%) |
Employment Industries by Sex in Bureau County
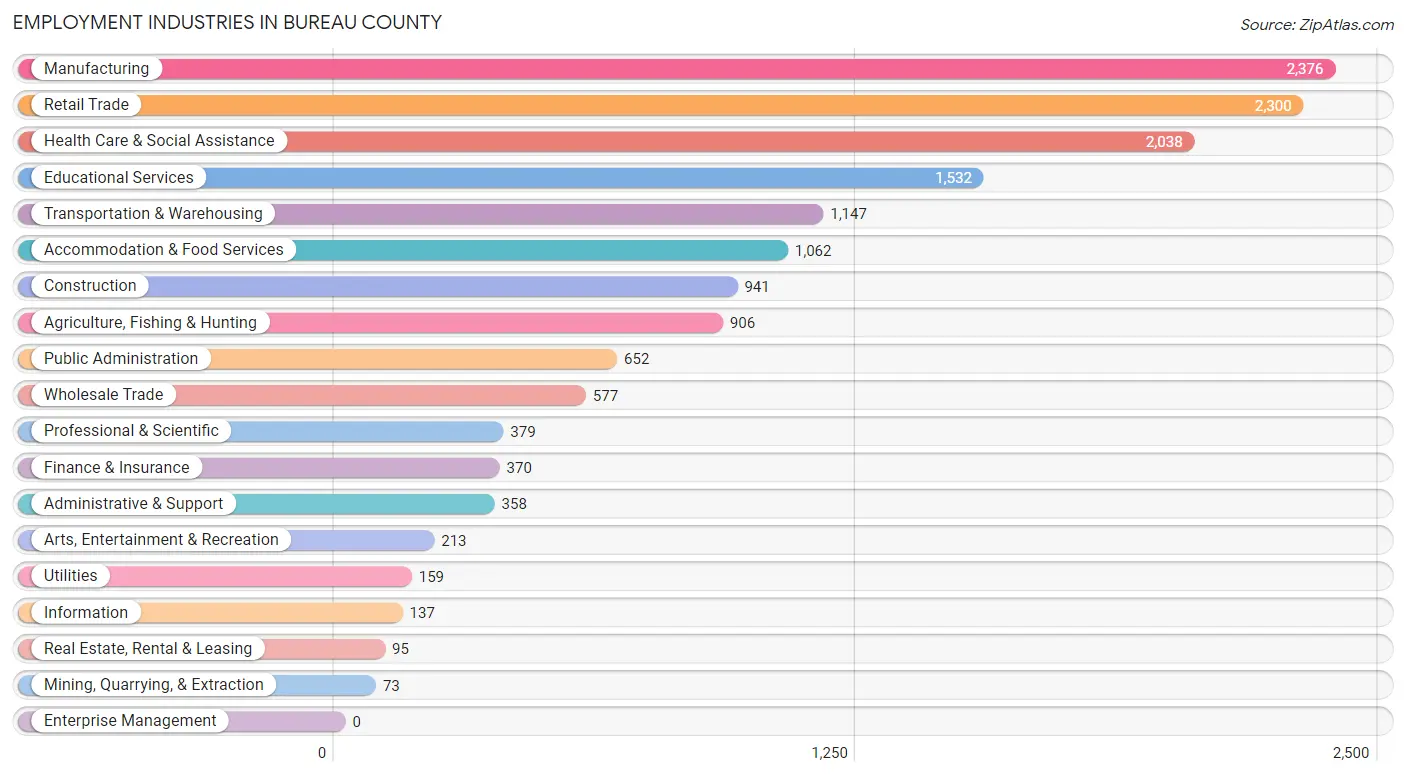
Employment Industries in Bureau County
The major employment industries in Bureau County include Manufacturing (2,376 | 14.9%), Retail Trade (2,300 | 14.5%), Health Care & Social Assistance (2,038 | 12.8%), Educational Services (1,532 | 9.6%), and Transportation & Warehousing (1,147 | 7.2%).
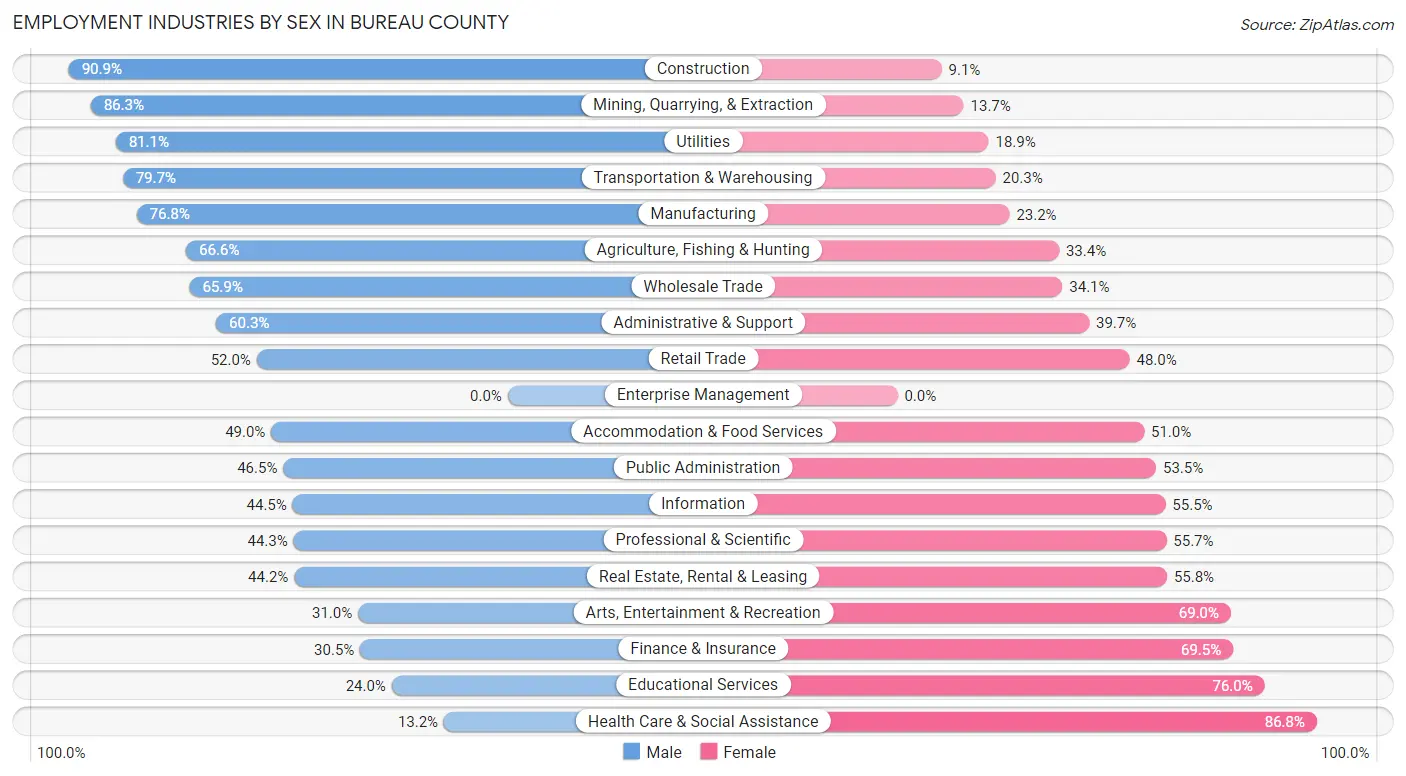
Employment Industries by Sex in Bureau County
The Bureau County industries that see more men than women are Construction (90.9%), Mining, Quarrying, & Extraction (86.3%), and Utilities (81.1%), whereas the industries that tend to have a higher number of women are Health Care & Social Assistance (86.8%), Educational Services (76.0%), and Finance & Insurance (69.5%).
| Industry | Male | Female |
| Agriculture, Fishing & Hunting | 603 (66.6%) | 303 (33.4%) |
| Mining, Quarrying, & Extraction | 63 (86.3%) | 10 (13.7%) |
| Construction | 855 (90.9%) | 86 (9.1%) |
| Manufacturing | 1,825 (76.8%) | 551 (23.2%) |
| Wholesale Trade | 380 (65.9%) | 197 (34.1%) |
| Retail Trade | 1,195 (52.0%) | 1,105 (48.0%) |
| Transportation & Warehousing | 914 (79.7%) | 233 (20.3%) |
| Utilities | 129 (81.1%) | 30 (18.9%) |
| Information | 61 (44.5%) | 76 (55.5%) |
| Finance & Insurance | 113 (30.5%) | 257 (69.5%) |
| Real Estate, Rental & Leasing | 42 (44.2%) | 53 (55.8%) |
| Professional & Scientific | 168 (44.3%) | 211 (55.7%) |
| Enterprise Management | 0 (0.0%) | 0 (0.0%) |
| Administrative & Support | 216 (60.3%) | 142 (39.7%) |
| Educational Services | 368 (24.0%) | 1,164 (76.0%) |
| Health Care & Social Assistance | 269 (13.2%) | 1,769 (86.8%) |
| Arts, Entertainment & Recreation | 66 (31.0%) | 147 (69.0%) |
| Accommodation & Food Services | 520 (49.0%) | 542 (51.0%) |
| Public Administration | 303 (46.5%) | 349 (53.5%) |
| Total | 8,425 (53.0%) | 7,481 (47.0%) |
Education in Bureau County
School Enrollment in Bureau County
The most common levels of schooling among the 6,764 students in Bureau County are middle school (1,761 | 26.0%), high school (1,562 | 23.1%), and elementary school (1,447 | 21.4%).
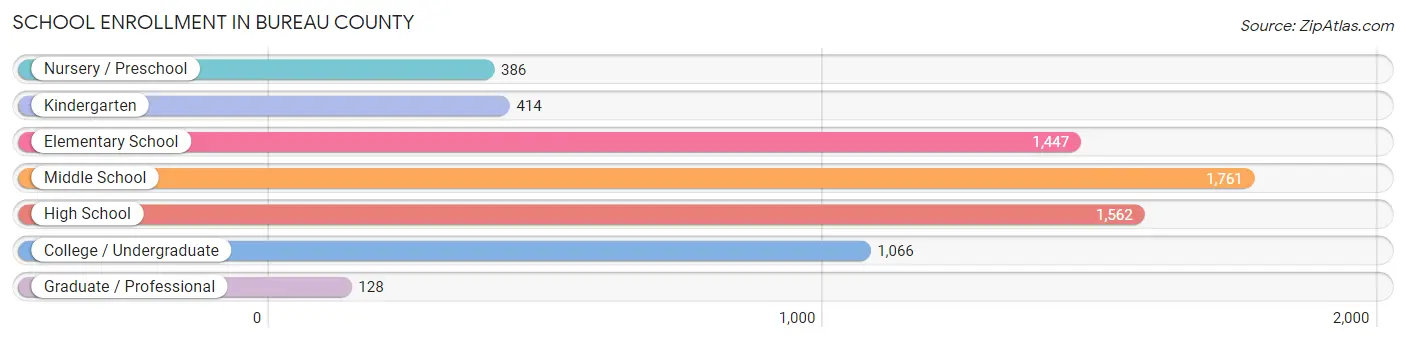
| School Level | # Students | % Students |
| Nursery / Preschool | 386 | 5.7% |
| Kindergarten | 414 | 6.1% |
| Elementary School | 1,447 | 21.4% |
| Middle School | 1,761 | 26.0% |
| High School | 1,562 | 23.1% |
| College / Undergraduate | 1,066 | 15.8% |
| Graduate / Professional | 128 | 1.9% |
| Total | 6,764 | 100.0% |
School Enrollment by Age by Funding Source in Bureau County
Out of a total of 6,764 students who are enrolled in schools in Bureau County, 1,150 (17.0%) attend a private institution, while the remaining 5,614 (83.0%) are enrolled in public schools. The age group of 20 to 24 year olds has the highest likelihood of being enrolled in private schools, with 110 (27.0% in the age bracket) enrolled. Conversely, the age group of 18 to 19 year olds has the lowest likelihood of being enrolled in a private school, with 431 (93.5% in the age bracket) attending a public institution.
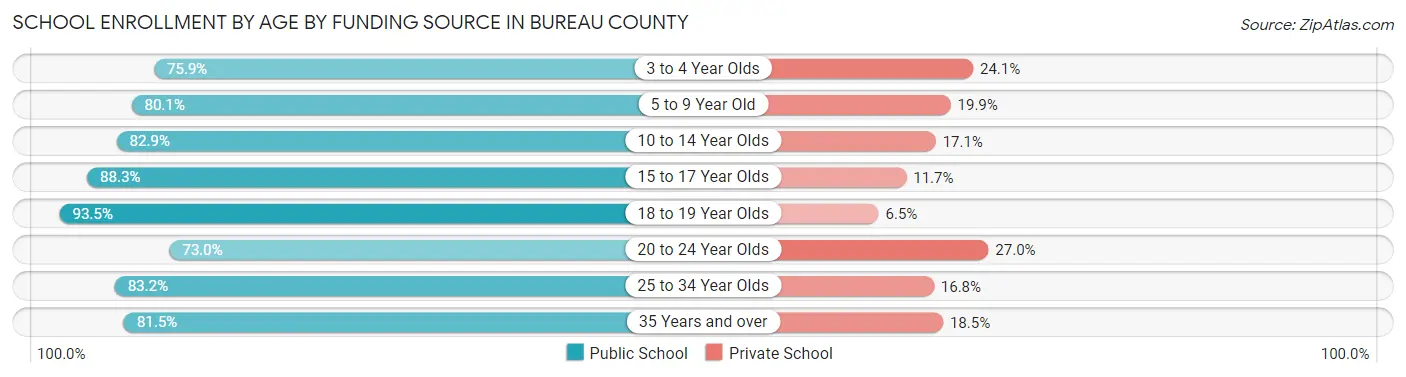
| Age Bracket | Public School | Private School |
| 3 to 4 Year Olds | 233 (75.9%) | 74 (24.1%) |
| 5 to 9 Year Old | 1,323 (80.1%) | 329 (19.9%) |
| 10 to 14 Year Olds | 1,813 (82.9%) | 375 (17.1%) |
| 15 to 17 Year Olds | 1,099 (88.3%) | 145 (11.7%) |
| 18 to 19 Year Olds | 431 (93.5%) | 30 (6.5%) |
| 20 to 24 Year Olds | 298 (73.0%) | 110 (27.0%) |
| 25 to 34 Year Olds | 208 (83.2%) | 42 (16.8%) |
| 35 Years and over | 207 (81.5%) | 47 (18.5%) |
| Total | 5,614 (83.0%) | 1,150 (17.0%) |
Educational Attainment by Field of Study in Bureau County
Education (1,365 | 25.0%), business (830 | 15.2%), bio, nature & agricultural (580 | 10.6%), science & technology (533 | 9.8%), and arts & humanities (406 | 7.4%) are the most common fields of study among 5,464 individuals in Bureau County who have obtained a bachelor's degree or higher.
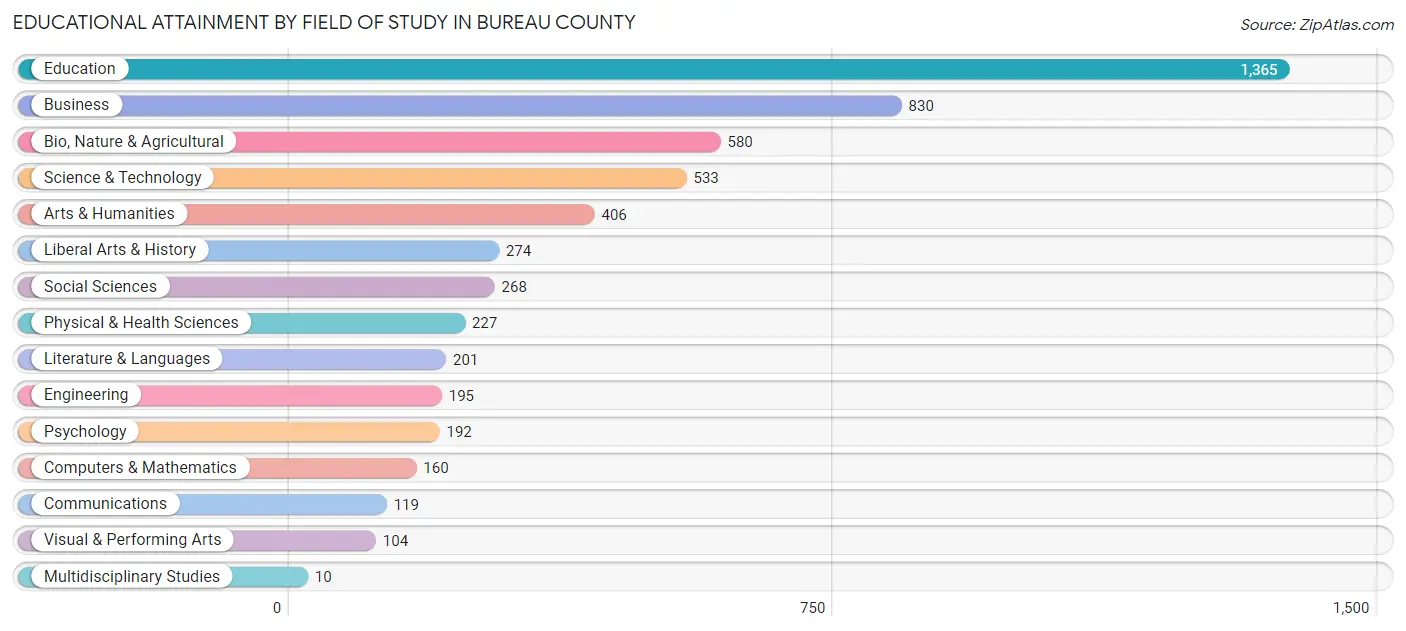
| Field of Study | # Graduates | % Graduates |
| Computers & Mathematics | 160 | 2.9% |
| Bio, Nature & Agricultural | 580 | 10.6% |
| Physical & Health Sciences | 227 | 4.2% |
| Psychology | 192 | 3.5% |
| Social Sciences | 268 | 4.9% |
| Engineering | 195 | 3.6% |
| Multidisciplinary Studies | 10 | 0.2% |
| Science & Technology | 533 | 9.8% |
| Business | 830 | 15.2% |
| Education | 1,365 | 25.0% |
| Literature & Languages | 201 | 3.7% |
| Liberal Arts & History | 274 | 5.0% |
| Visual & Performing Arts | 104 | 1.9% |
| Communications | 119 | 2.2% |
| Arts & Humanities | 406 | 7.4% |
| Total | 5,464 | 100.0% |
Transportation & Commute in Bureau County
Vehicle Availability by Sex in Bureau County
The most prevalent vehicle ownership categories in Bureau County are males with 2 vehicles (3,681, accounting for 44.5%) and females with 2 vehicles (3,139, making up 50.3%).
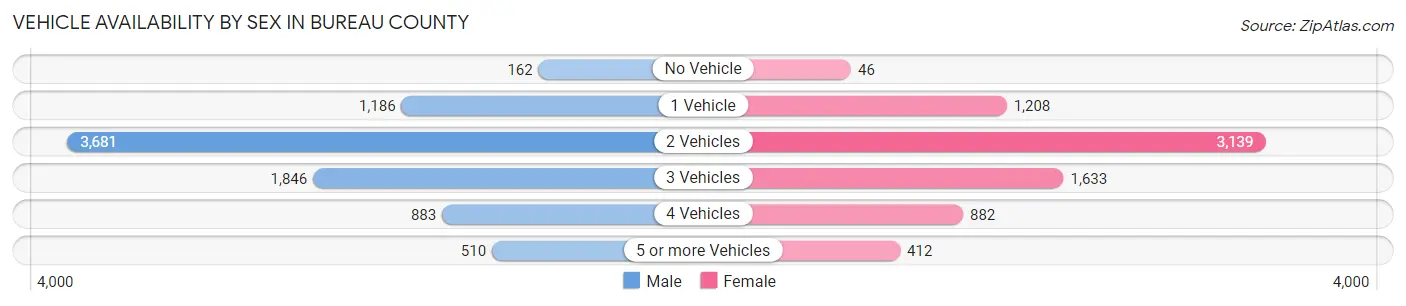
| Vehicles Available | Male | Female |
| No Vehicle | 162 (2.0%) | 46 (0.6%) |
| 1 Vehicle | 1,186 (14.3%) | 1,208 (16.5%) |
| 2 Vehicles | 3,681 (44.5%) | 3,139 (42.9%) |
| 3 Vehicles | 1,846 (22.3%) | 1,633 (22.3%) |
| 4 Vehicles | 883 (10.7%) | 882 (12.0%) |
| 5 or more Vehicles | 510 (6.2%) | 412 (5.6%) |
| Total | 8,268 (100.0%) | 7,320 (100.0%) |
Commute Time in Bureau County
The most frequently occuring commute durations in Bureau County are 5 to 9 minutes (2,485 commuters, 16.7%), 10 to 14 minutes (2,370 commuters, 15.9%), and 15 to 19 minutes (2,307 commuters, 15.5%).
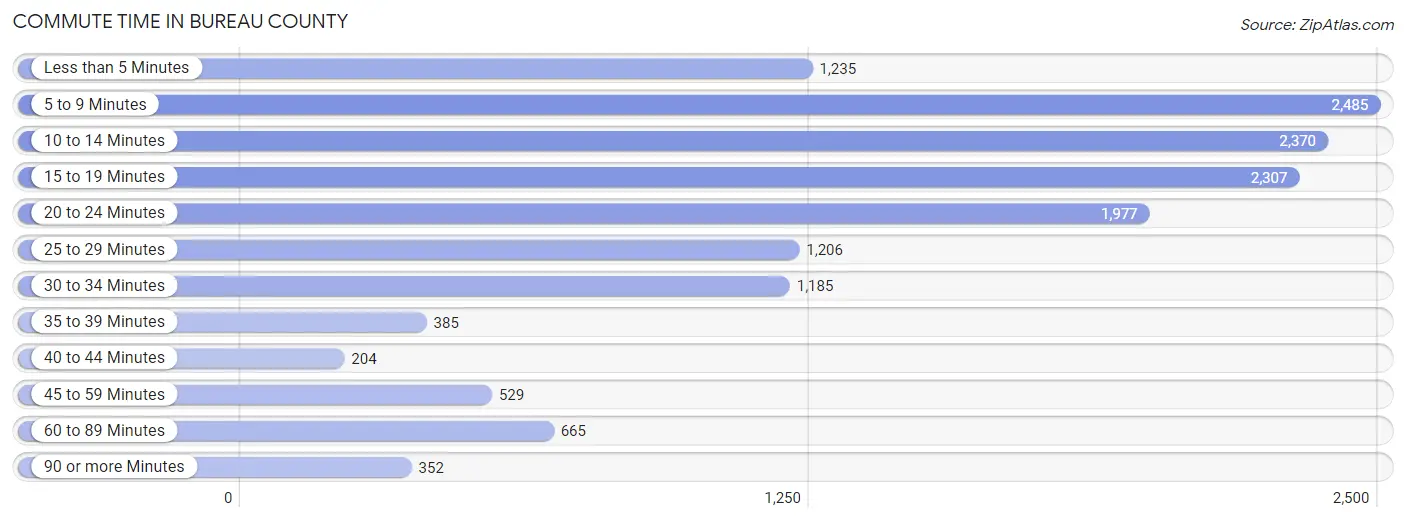
| Commute Time | # Commuters | % Commuters |
| Less than 5 Minutes | 1,235 | 8.3% |
| 5 to 9 Minutes | 2,485 | 16.7% |
| 10 to 14 Minutes | 2,370 | 15.9% |
| 15 to 19 Minutes | 2,307 | 15.5% |
| 20 to 24 Minutes | 1,977 | 13.3% |
| 25 to 29 Minutes | 1,206 | 8.1% |
| 30 to 34 Minutes | 1,185 | 8.0% |
| 35 to 39 Minutes | 385 | 2.6% |
| 40 to 44 Minutes | 204 | 1.4% |
| 45 to 59 Minutes | 529 | 3.5% |
| 60 to 89 Minutes | 665 | 4.5% |
| 90 or more Minutes | 352 | 2.4% |
Commute Time by Sex in Bureau County
The most common commute times in Bureau County are 10 to 14 minutes (1,315 commuters, 16.8%) for males and 5 to 9 minutes (1,258 commuters, 17.8%) for females.
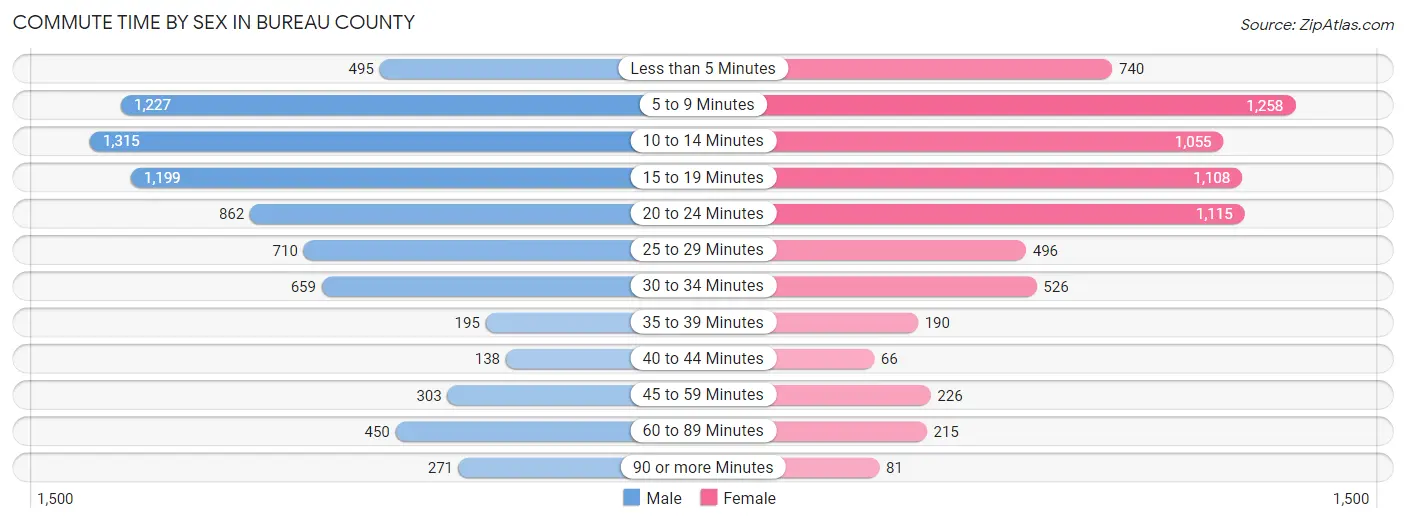
| Commute Time | Male | Female |
| Less than 5 Minutes | 495 (6.3%) | 740 (10.5%) |
| 5 to 9 Minutes | 1,227 (15.7%) | 1,258 (17.8%) |
| 10 to 14 Minutes | 1,315 (16.8%) | 1,055 (14.9%) |
| 15 to 19 Minutes | 1,199 (15.3%) | 1,108 (15.7%) |
| 20 to 24 Minutes | 862 (11.0%) | 1,115 (15.8%) |
| 25 to 29 Minutes | 710 (9.1%) | 496 (7.0%) |
| 30 to 34 Minutes | 659 (8.4%) | 526 (7.4%) |
| 35 to 39 Minutes | 195 (2.5%) | 190 (2.7%) |
| 40 to 44 Minutes | 138 (1.8%) | 66 (0.9%) |
| 45 to 59 Minutes | 303 (3.9%) | 226 (3.2%) |
| 60 to 89 Minutes | 450 (5.8%) | 215 (3.0%) |
| 90 or more Minutes | 271 (3.5%) | 81 (1.1%) |
Time of Departure to Work by Sex in Bureau County
The most frequent times of departure to work in Bureau County are 7:00 AM to 7:29 AM (1,093, 14.0%) for males and 7:30 AM to 7:59 AM (1,302, 18.4%) for females.
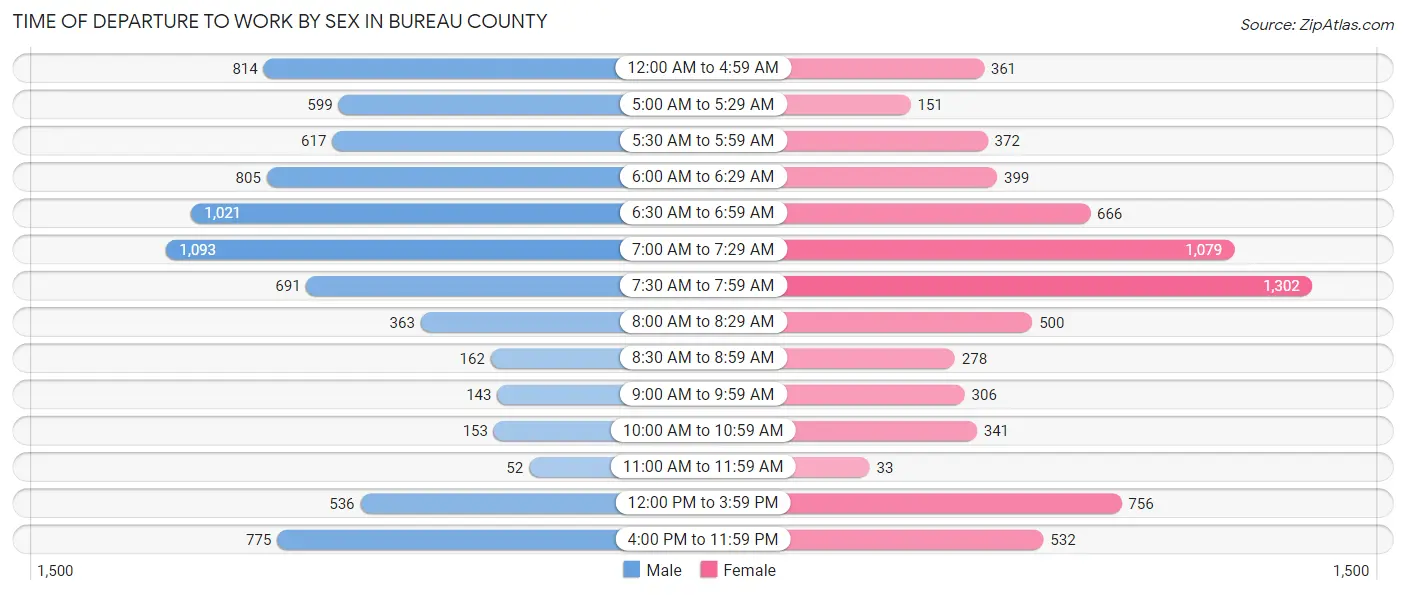
| Time of Departure | Male | Female |
| 12:00 AM to 4:59 AM | 814 (10.4%) | 361 (5.1%) |
| 5:00 AM to 5:29 AM | 599 (7.7%) | 151 (2.1%) |
| 5:30 AM to 5:59 AM | 617 (7.9%) | 372 (5.3%) |
| 6:00 AM to 6:29 AM | 805 (10.3%) | 399 (5.6%) |
| 6:30 AM to 6:59 AM | 1,021 (13.1%) | 666 (9.4%) |
| 7:00 AM to 7:29 AM | 1,093 (14.0%) | 1,079 (15.2%) |
| 7:30 AM to 7:59 AM | 691 (8.8%) | 1,302 (18.4%) |
| 8:00 AM to 8:29 AM | 363 (4.6%) | 500 (7.1%) |
| 8:30 AM to 8:59 AM | 162 (2.1%) | 278 (3.9%) |
| 9:00 AM to 9:59 AM | 143 (1.8%) | 306 (4.3%) |
| 10:00 AM to 10:59 AM | 153 (2.0%) | 341 (4.8%) |
| 11:00 AM to 11:59 AM | 52 (0.7%) | 33 (0.5%) |
| 12:00 PM to 3:59 PM | 536 (6.9%) | 756 (10.7%) |
| 4:00 PM to 11:59 PM | 775 (9.9%) | 532 (7.5%) |
| Total | 7,824 (100.0%) | 7,076 (100.0%) |
Housing Occupancy in Bureau County
Occupancy by Ownership in Bureau County
Of the total 13,901 dwellings in Bureau County, owner-occupied units account for 10,557 (75.9%), while renter-occupied units make up 3,344 (24.1%).
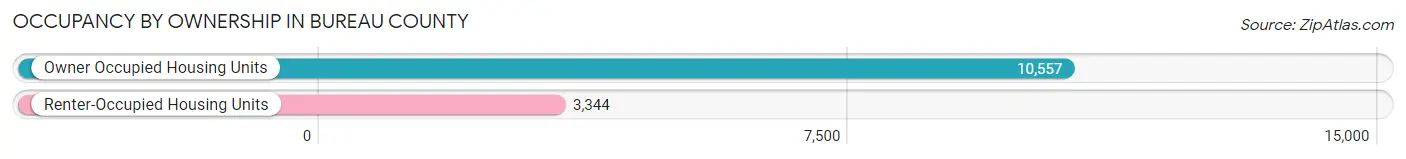
| Occupancy | # Housing Units | % Housing Units |
| Owner Occupied Housing Units | 10,557 | 75.9% |
| Renter-Occupied Housing Units | 3,344 | 24.1% |
| Total Occupied Housing Units | 13,901 | 100.0% |
Occupancy by Household Size in Bureau County
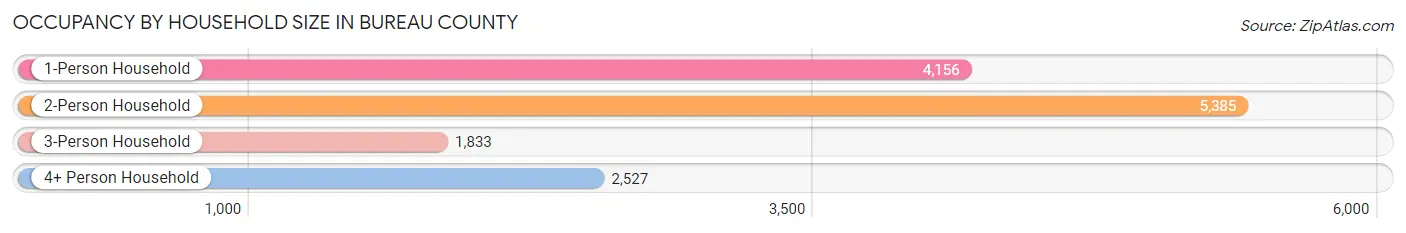
| Household Size | # Housing Units | % Housing Units |
| 1-Person Household | 4,156 | 29.9% |
| 2-Person Household | 5,385 | 38.7% |
| 3-Person Household | 1,833 | 13.2% |
| 4+ Person Household | 2,527 | 18.2% |
| Total Housing Units | 13,901 | 100.0% |
Occupancy by Ownership by Household Size in Bureau County
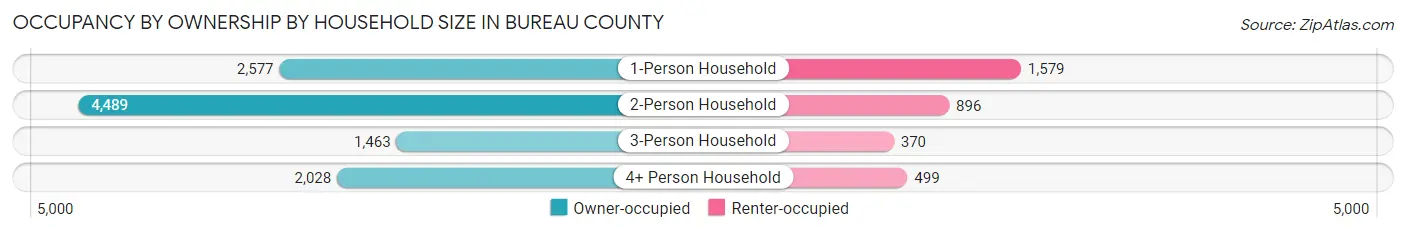
| Household Size | Owner-occupied | Renter-occupied |
| 1-Person Household | 2,577 (62.0%) | 1,579 (38.0%) |
| 2-Person Household | 4,489 (83.4%) | 896 (16.6%) |
| 3-Person Household | 1,463 (79.8%) | 370 (20.2%) |
| 4+ Person Household | 2,028 (80.2%) | 499 (19.8%) |
| Total Housing Units | 10,557 (75.9%) | 3,344 (24.1%) |
Occupancy by Educational Attainment in Bureau County
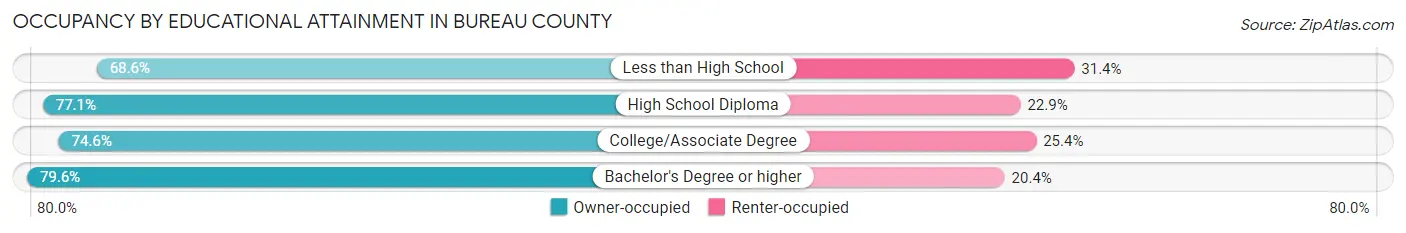
| Household Size | Owner-occupied | Renter-occupied |
| Less than High School | 883 (68.6%) | 405 (31.4%) |
| High School Diploma | 3,437 (77.1%) | 1,020 (22.9%) |
| College/Associate Degree | 3,827 (74.6%) | 1,302 (25.4%) |
| Bachelor's Degree or higher | 2,410 (79.6%) | 617 (20.4%) |
Occupancy by Age of Householder in Bureau County
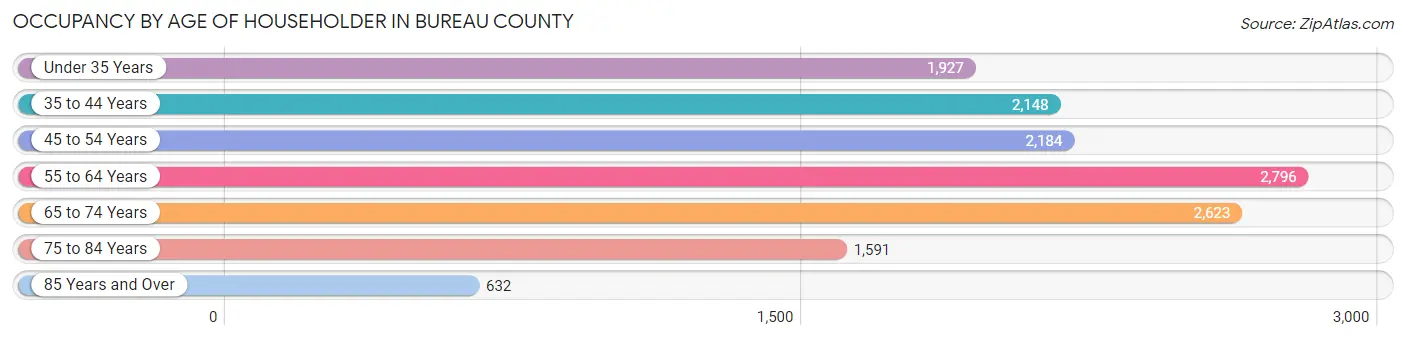
| Age Bracket | # Households | % Households |
| Under 35 Years | 1,927 | 13.9% |
| 35 to 44 Years | 2,148 | 15.4% |
| 45 to 54 Years | 2,184 | 15.7% |
| 55 to 64 Years | 2,796 | 20.1% |
| 65 to 74 Years | 2,623 | 18.9% |
| 75 to 84 Years | 1,591 | 11.5% |
| 85 Years and Over | 632 | 4.5% |
| Total | 13,901 | 100.0% |
Housing Finances in Bureau County
Median Income by Occupancy in Bureau County
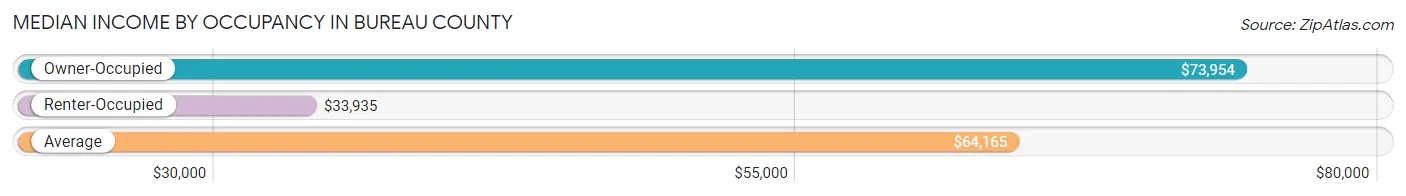
| Occupancy Type | # Households | Median Income |
| Owner-Occupied | 10,557 (75.9%) | $73,954 |
| Renter-Occupied | 3,344 (24.1%) | $33,935 |
| Average | 13,901 (100.0%) | $64,165 |
Occupancy by Householder Income Bracket in Bureau County
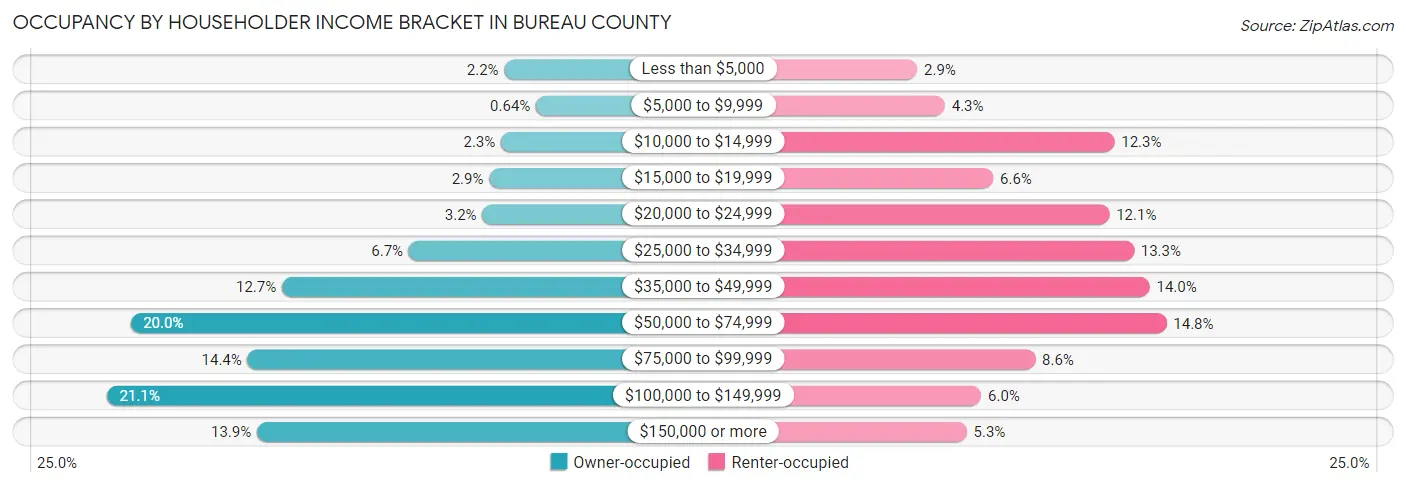
| Income Bracket | Owner-occupied | Renter-occupied |
| Less than $5,000 | 227 (2.1%) | 98 (2.9%) |
| $5,000 to $9,999 | 68 (0.6%) | 142 (4.3%) |
| $10,000 to $14,999 | 244 (2.3%) | 412 (12.3%) |
| $15,000 to $19,999 | 303 (2.9%) | 219 (6.6%) |
| $20,000 to $24,999 | 338 (3.2%) | 404 (12.1%) |
| $25,000 to $34,999 | 707 (6.7%) | 443 (13.3%) |
| $35,000 to $49,999 | 1,345 (12.7%) | 468 (14.0%) |
| $50,000 to $74,999 | 2,108 (20.0%) | 495 (14.8%) |
| $75,000 to $99,999 | 1,518 (14.4%) | 286 (8.6%) |
| $100,000 to $149,999 | 2,228 (21.1%) | 200 (6.0%) |
| $150,000 or more | 1,471 (13.9%) | 177 (5.3%) |
| Total | 10,557 (100.0%) | 3,344 (100.0%) |
Monthly Housing Cost Tiers in Bureau County
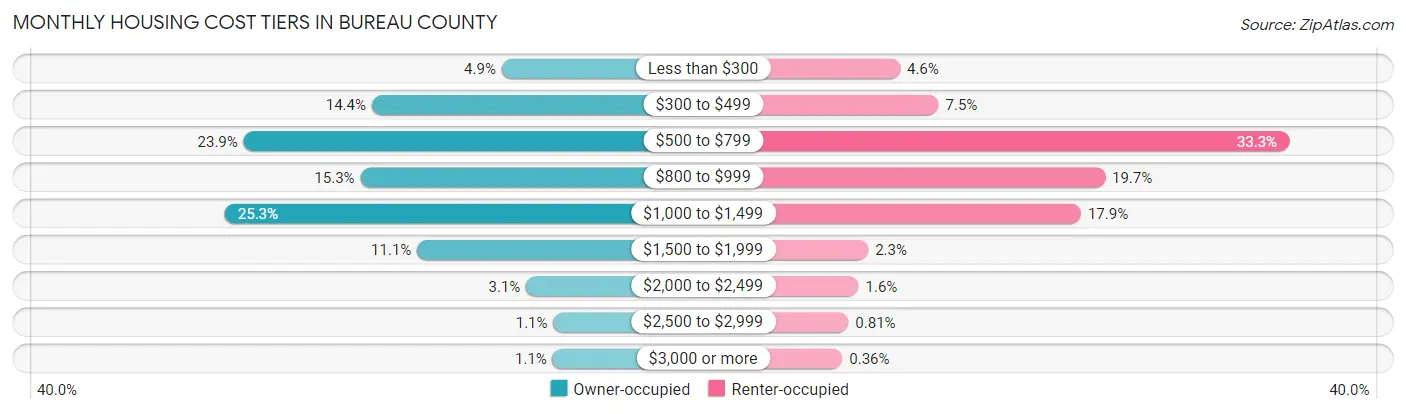
| Monthly Cost | Owner-occupied | Renter-occupied |
| Less than $300 | 513 (4.9%) | 154 (4.6%) |
| $300 to $499 | 1,523 (14.4%) | 249 (7.4%) |
| $500 to $799 | 2,520 (23.9%) | 1,112 (33.3%) |
| $800 to $999 | 1,612 (15.3%) | 659 (19.7%) |
| $1,000 to $1,499 | 2,666 (25.3%) | 600 (17.9%) |
| $1,500 to $1,999 | 1,171 (11.1%) | 76 (2.3%) |
| $2,000 to $2,499 | 323 (3.1%) | 52 (1.6%) |
| $2,500 to $2,999 | 112 (1.1%) | 27 (0.8%) |
| $3,000 or more | 117 (1.1%) | 12 (0.4%) |
| Total | 10,557 (100.0%) | 3,344 (100.0%) |
Physical Housing Characteristics in Bureau County
Housing Structures in Bureau County
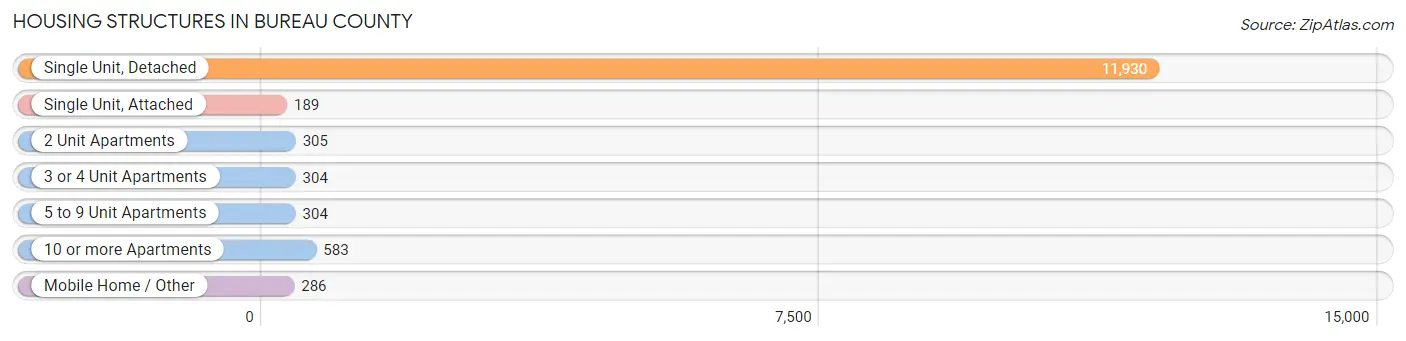
| Structure Type | # Housing Units | % Housing Units |
| Single Unit, Detached | 11,930 | 85.8% |
| Single Unit, Attached | 189 | 1.4% |
| 2 Unit Apartments | 305 | 2.2% |
| 3 or 4 Unit Apartments | 304 | 2.2% |
| 5 to 9 Unit Apartments | 304 | 2.2% |
| 10 or more Apartments | 583 | 4.2% |
| Mobile Home / Other | 286 | 2.1% |
| Total | 13,901 | 100.0% |
Housing Structures by Occupancy in Bureau County
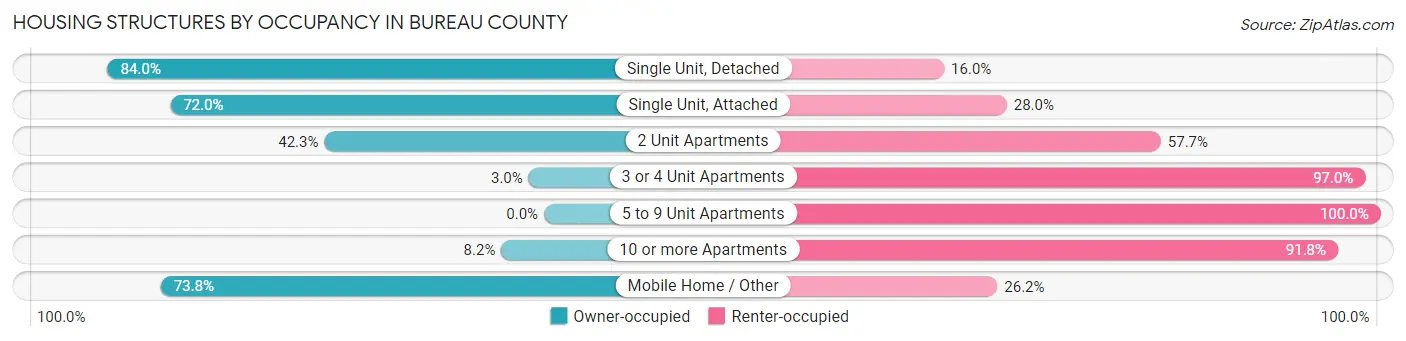
| Structure Type | Owner-occupied | Renter-occupied |
| Single Unit, Detached | 10,024 (84.0%) | 1,906 (16.0%) |
| Single Unit, Attached | 136 (72.0%) | 53 (28.0%) |
| 2 Unit Apartments | 129 (42.3%) | 176 (57.7%) |
| 3 or 4 Unit Apartments | 9 (3.0%) | 295 (97.0%) |
| 5 to 9 Unit Apartments | 0 (0.0%) | 304 (100.0%) |
| 10 or more Apartments | 48 (8.2%) | 535 (91.8%) |
| Mobile Home / Other | 211 (73.8%) | 75 (26.2%) |
| Total | 10,557 (75.9%) | 3,344 (24.1%) |
Housing Structures by Number of Rooms in Bureau County
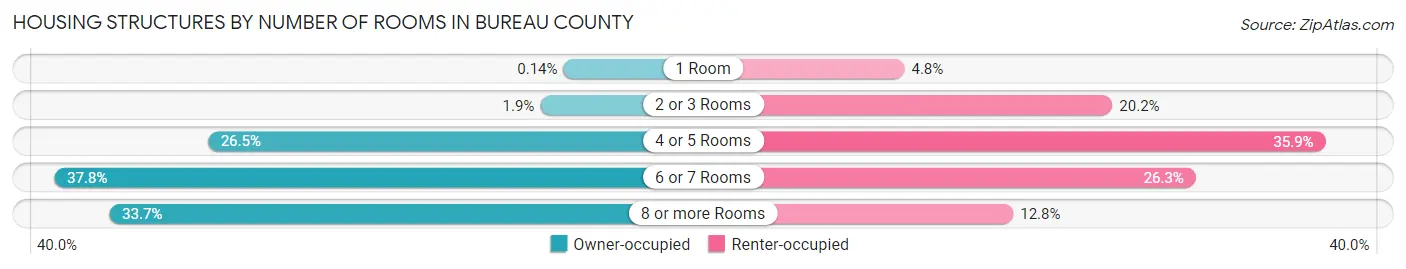
| Number of Rooms | Owner-occupied | Renter-occupied |
| 1 Room | 15 (0.1%) | 160 (4.8%) |
| 2 or 3 Rooms | 195 (1.8%) | 674 (20.2%) |
| 4 or 5 Rooms | 2,792 (26.5%) | 1,201 (35.9%) |
| 6 or 7 Rooms | 3,993 (37.8%) | 880 (26.3%) |
| 8 or more Rooms | 3,562 (33.7%) | 429 (12.8%) |
| Total | 10,557 (100.0%) | 3,344 (100.0%) |
Housing Structure by Heating Type in Bureau County
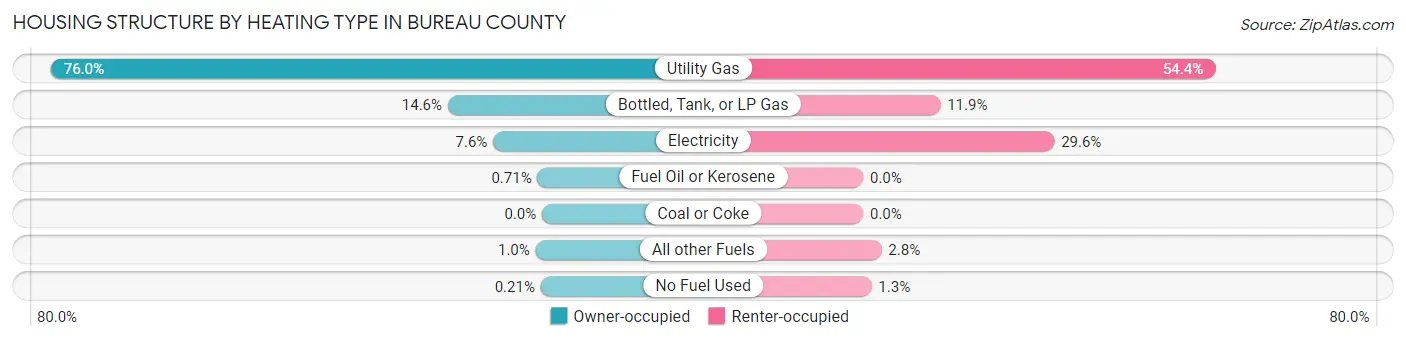
| Heating Type | Owner-occupied | Renter-occupied |
| Utility Gas | 8,018 (75.9%) | 1,819 (54.4%) |
| Bottled, Tank, or LP Gas | 1,538 (14.6%) | 399 (11.9%) |
| Electricity | 798 (7.6%) | 988 (29.5%) |
| Fuel Oil or Kerosene | 75 (0.7%) | 0 (0.0%) |
| Coal or Coke | 0 (0.0%) | 0 (0.0%) |
| All other Fuels | 106 (1.0%) | 95 (2.8%) |
| No Fuel Used | 22 (0.2%) | 43 (1.3%) |
| Total | 10,557 (100.0%) | 3,344 (100.0%) |
Household Vehicle Usage in Bureau County
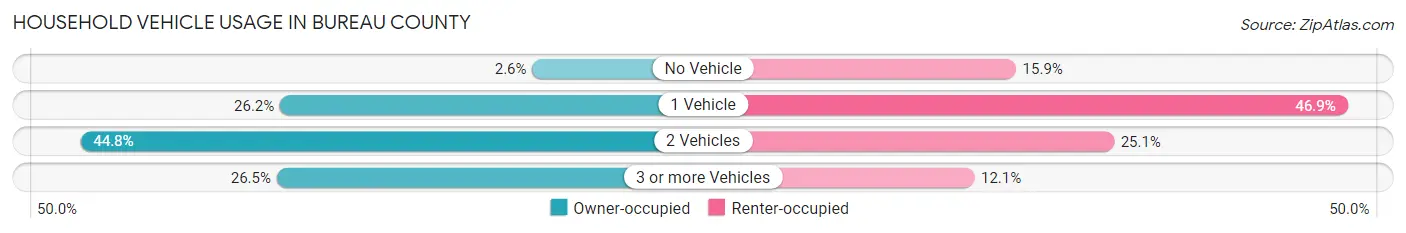
| Vehicles per Household | Owner-occupied | Renter-occupied |
| No Vehicle | 275 (2.6%) | 533 (15.9%) |
| 1 Vehicle | 2,761 (26.2%) | 1,569 (46.9%) |
| 2 Vehicles | 4,728 (44.8%) | 839 (25.1%) |
| 3 or more Vehicles | 2,793 (26.5%) | 403 (12.0%) |
| Total | 10,557 (100.0%) | 3,344 (100.0%) |
Real Estate & Mortgages in Bureau County
Real Estate and Mortgage Overview in Bureau County
| Characteristic | Without Mortgage | With Mortgage |
| Housing Units | 4,773 | 5,784 |
| Median Property Value | $115,900 | $123,200 |
| Median Household Income | $60,930 | $839 |
| Monthly Housing Costs | $553 | $102 |
| Real Estate Taxes | $2,396 | $57 |
Property Value by Mortgage Status in Bureau County
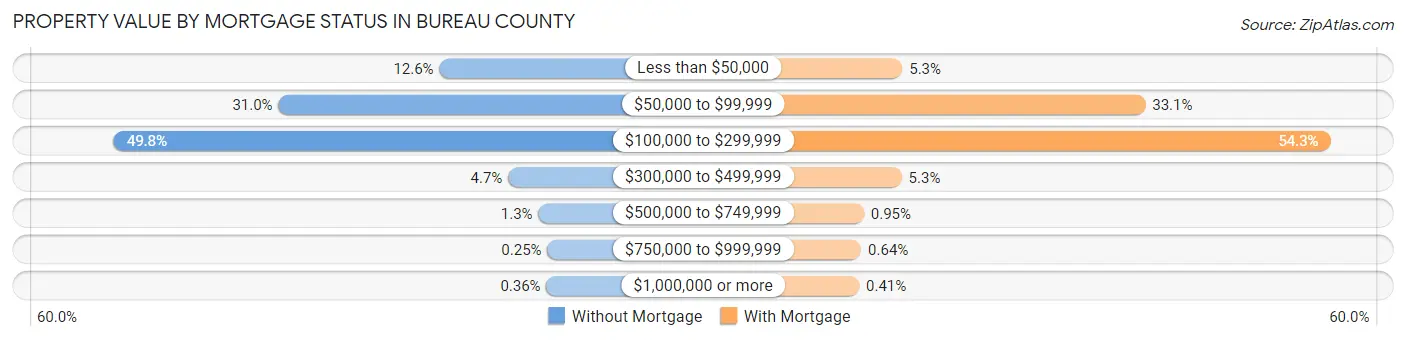
| Property Value | Without Mortgage | With Mortgage |
| Less than $50,000 | 601 (12.6%) | 309 (5.3%) |
| $50,000 to $99,999 | 1,479 (31.0%) | 1,915 (33.1%) |
| $100,000 to $299,999 | 2,377 (49.8%) | 3,139 (54.3%) |
| $300,000 to $499,999 | 226 (4.7%) | 305 (5.3%) |
| $500,000 to $749,999 | 61 (1.3%) | 55 (0.9%) |
| $750,000 to $999,999 | 12 (0.3%) | 37 (0.6%) |
| $1,000,000 or more | 17 (0.4%) | 24 (0.4%) |
| Total | 4,773 (100.0%) | 5,784 (100.0%) |
Household Income by Mortgage Status in Bureau County
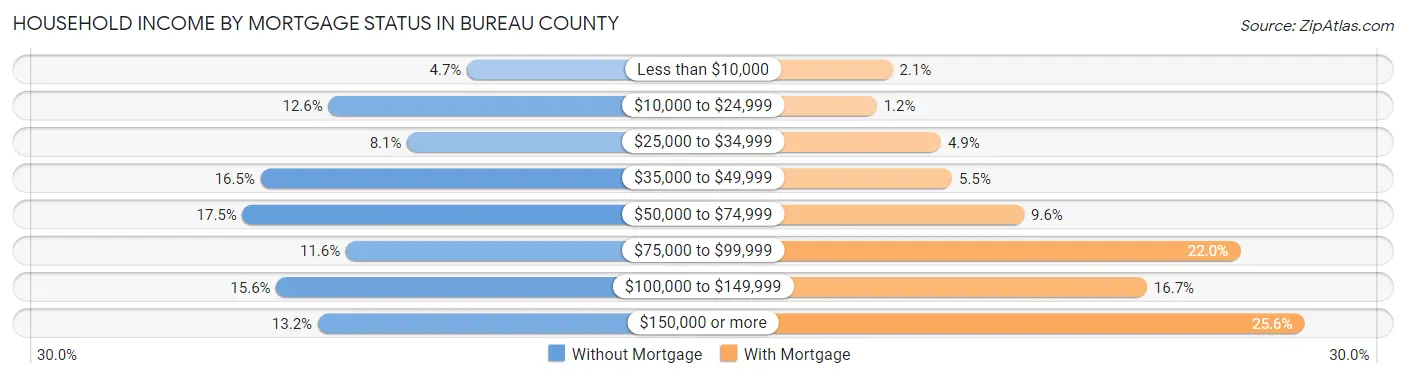
| Household Income | Without Mortgage | With Mortgage |
| Less than $10,000 | 225 (4.7%) | 122 (2.1%) |
| $10,000 to $24,999 | 603 (12.6%) | 70 (1.2%) |
| $25,000 to $34,999 | 388 (8.1%) | 282 (4.9%) |
| $35,000 to $49,999 | 788 (16.5%) | 319 (5.5%) |
| $50,000 to $74,999 | 837 (17.5%) | 557 (9.6%) |
| $75,000 to $99,999 | 555 (11.6%) | 1,271 (22.0%) |
| $100,000 to $149,999 | 745 (15.6%) | 963 (16.7%) |
| $150,000 or more | 632 (13.2%) | 1,483 (25.6%) |
| Total | 4,773 (100.0%) | 5,784 (100.0%) |
Property Value to Household Income Ratio in Bureau County
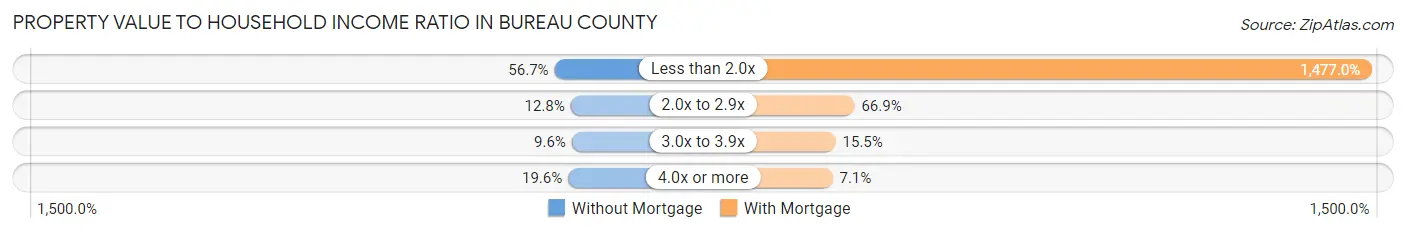
| Value-to-Income Ratio | Without Mortgage | With Mortgage |
| Less than 2.0x | 2,705 (56.7%) | 85,430 (1,477.0%) |
| 2.0x to 2.9x | 610 (12.8%) | 3,872 (66.9%) |
| 3.0x to 3.9x | 458 (9.6%) | 899 (15.5%) |
| 4.0x or more | 934 (19.6%) | 410 (7.1%) |
| Total | 4,773 (100.0%) | 5,784 (100.0%) |
Real Estate Taxes by Mortgage Status in Bureau County
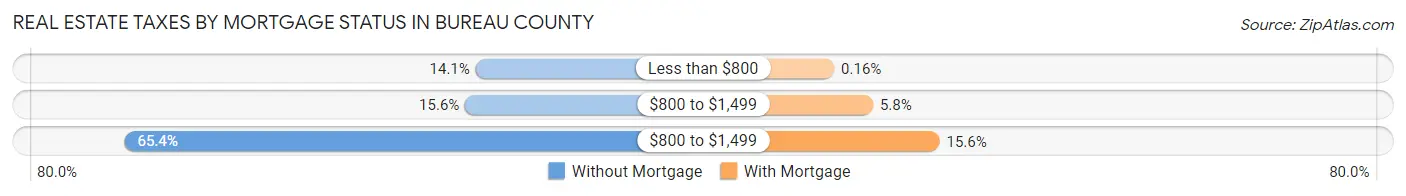
| Property Taxes | Without Mortgage | With Mortgage |
| Less than $800 | 673 (14.1%) | 9 (0.2%) |
| $800 to $1,499 | 746 (15.6%) | 337 (5.8%) |
| $800 to $1,499 | 3,121 (65.4%) | 900 (15.6%) |
| Total | 4,773 (100.0%) | 5,784 (100.0%) |
Health & Disability in Bureau County
Health Insurance Coverage by Age in Bureau County
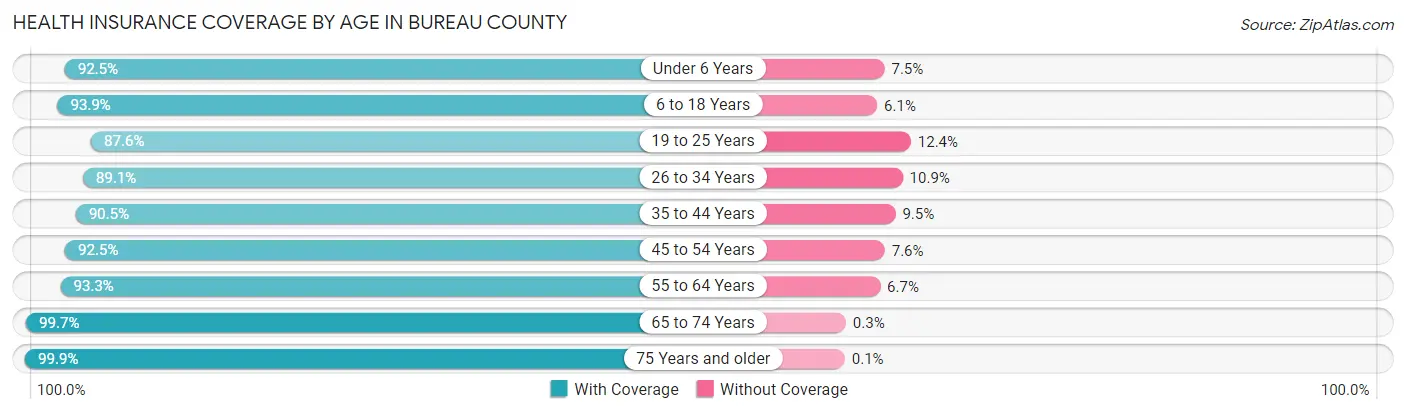
| Age Bracket | With Coverage | Without Coverage |
| Under 6 Years | 1,921 (92.5%) | 156 (7.5%) |
| 6 to 18 Years | 4,979 (93.9%) | 325 (6.1%) |
| 19 to 25 Years | 2,216 (87.6%) | 314 (12.4%) |
| 26 to 34 Years | 2,809 (89.1%) | 343 (10.9%) |
| 35 to 44 Years | 3,433 (90.5%) | 362 (9.5%) |
| 45 to 54 Years | 3,745 (92.4%) | 306 (7.5%) |
| 55 to 64 Years | 4,465 (93.3%) | 320 (6.7%) |
| 65 to 74 Years | 4,030 (99.7%) | 12 (0.3%) |
| 75 Years and older | 3,072 (99.9%) | 3 (0.1%) |
| Total | 30,670 (93.5%) | 2,141 (6.5%) |
Health Insurance Coverage by Citizenship Status in Bureau County
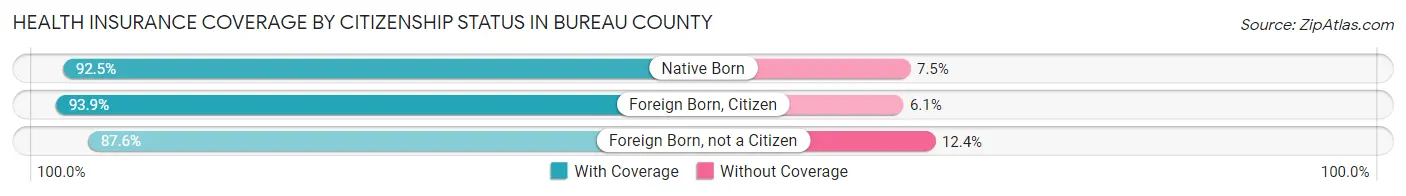
| Citizenship Status | With Coverage | Without Coverage |
| Native Born | 1,921 (92.5%) | 156 (7.5%) |
| Foreign Born, Citizen | 4,979 (93.9%) | 325 (6.1%) |
| Foreign Born, not a Citizen | 2,216 (87.6%) | 314 (12.4%) |
Health Insurance Coverage by Household Income in Bureau County
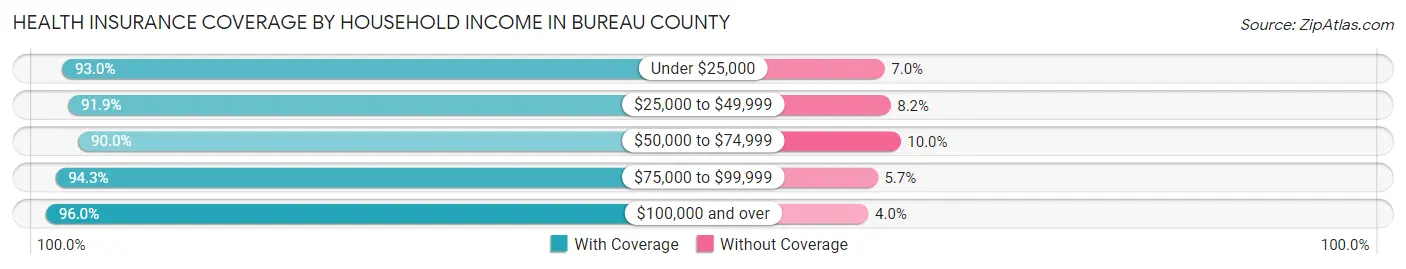
| Household Income | With Coverage | Without Coverage |
| Under $25,000 | 3,655 (93.0%) | 277 (7.0%) |
| $25,000 to $49,999 | 5,305 (91.8%) | 471 (8.2%) |
| $50,000 to $74,999 | 5,763 (90.0%) | 643 (10.0%) |
| $75,000 to $99,999 | 4,651 (94.3%) | 283 (5.7%) |
| $100,000 and over | 11,232 (96.0%) | 467 (4.0%) |
Public vs Private Health Insurance Coverage by Age in Bureau County
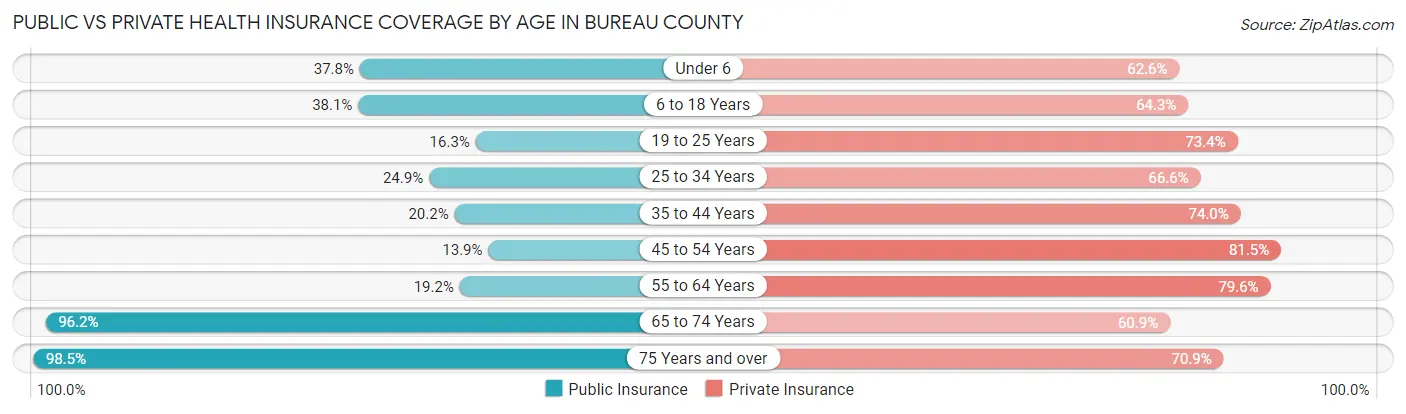
| Age Bracket | Public Insurance | Private Insurance |
| Under 6 | 785 (37.8%) | 1,301 (62.6%) |
| 6 to 18 Years | 2,020 (38.1%) | 3,410 (64.3%) |
| 19 to 25 Years | 412 (16.3%) | 1,858 (73.4%) |
| 25 to 34 Years | 786 (24.9%) | 2,099 (66.6%) |
| 35 to 44 Years | 767 (20.2%) | 2,809 (74.0%) |
| 45 to 54 Years | 564 (13.9%) | 3,303 (81.5%) |
| 55 to 64 Years | 920 (19.2%) | 3,807 (79.6%) |
| 65 to 74 Years | 3,887 (96.2%) | 2,462 (60.9%) |
| 75 Years and over | 3,028 (98.5%) | 2,179 (70.9%) |
| Total | 13,169 (40.1%) | 23,228 (70.8%) |
Disability Status by Sex by Age in Bureau County
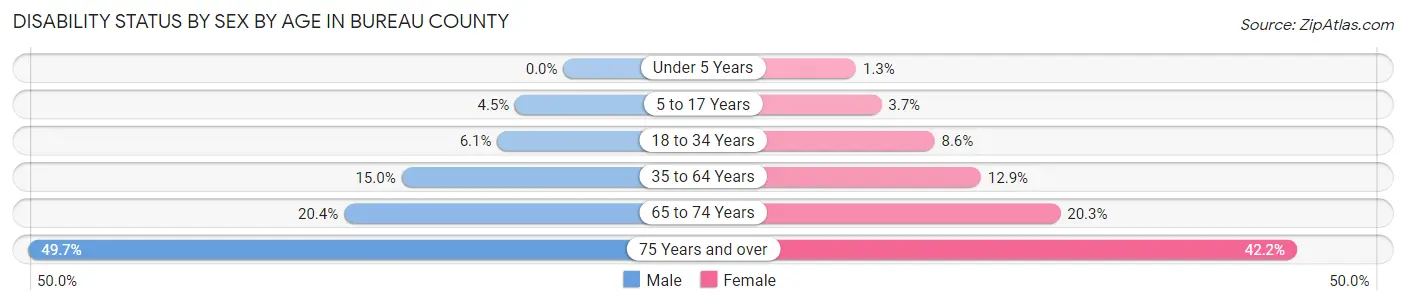
| Age Bracket | Male | Female |
| Under 5 Years | 0 (0.0%) | 10 (1.3%) |
| 5 to 17 Years | 120 (4.5%) | 97 (3.7%) |
| 18 to 34 Years | 189 (6.1%) | 259 (8.6%) |
| 35 to 64 Years | 958 (15.0%) | 807 (12.9%) |
| 65 to 74 Years | 396 (20.3%) | 425 (20.3%) |
| 75 Years and over | 638 (49.6%) | 756 (42.2%) |
Disability Class by Sex by Age in Bureau County
Disability Class: Hearing Difficulty
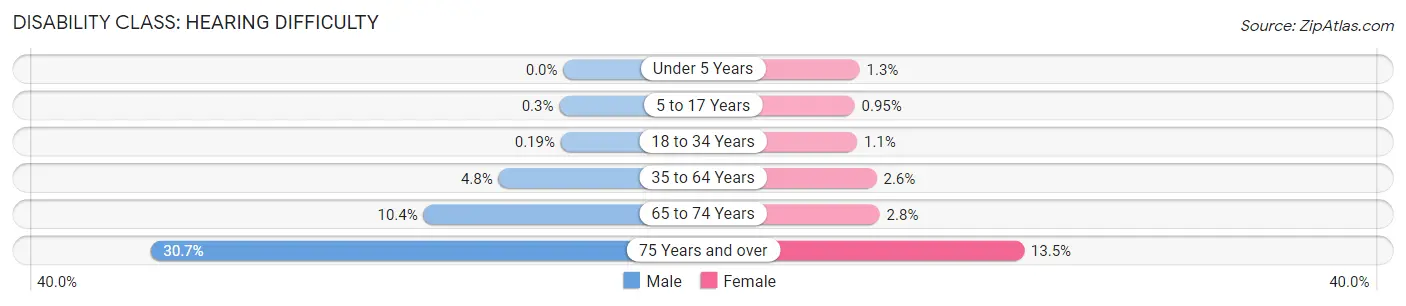
| Age Bracket | Male | Female |
| Under 5 Years | 0 (0.0%) | 10 (1.3%) |
| 5 to 17 Years | 8 (0.3%) | 25 (0.9%) |
| 18 to 34 Years | 6 (0.2%) | 34 (1.1%) |
| 35 to 64 Years | 307 (4.8%) | 161 (2.6%) |
| 65 to 74 Years | 202 (10.4%) | 59 (2.8%) |
| 75 Years and over | 394 (30.7%) | 242 (13.5%) |
Disability Class: Vision Difficulty
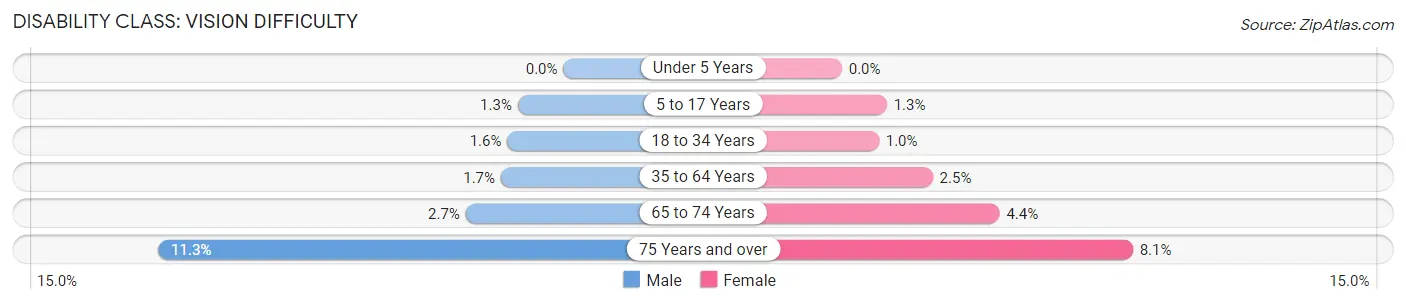
| Age Bracket | Male | Female |
| Under 5 Years | 0 (0.0%) | 0 (0.0%) |
| 5 to 17 Years | 34 (1.3%) | 33 (1.3%) |
| 18 to 34 Years | 48 (1.6%) | 31 (1.0%) |
| 35 to 64 Years | 111 (1.7%) | 158 (2.5%) |
| 65 to 74 Years | 53 (2.7%) | 92 (4.4%) |
| 75 Years and over | 145 (11.3%) | 145 (8.1%) |
Disability Class: Cognitive Difficulty
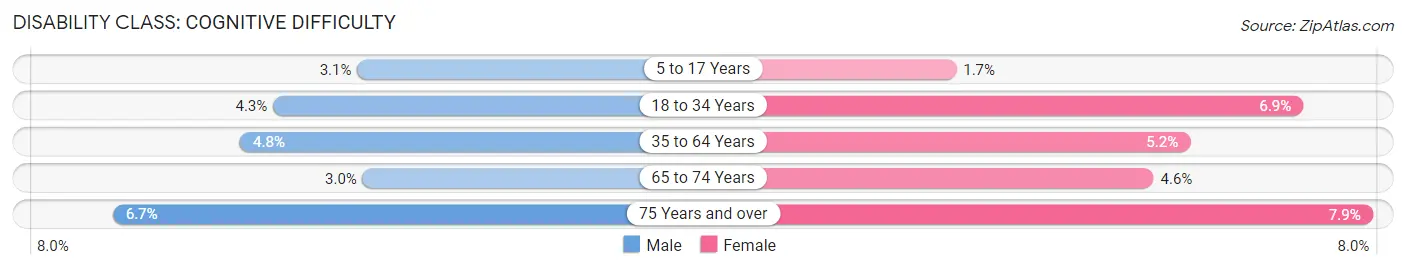
| Age Bracket | Male | Female |
| 5 to 17 Years | 82 (3.1%) | 45 (1.7%) |
| 18 to 34 Years | 133 (4.3%) | 206 (6.9%) |
| 35 to 64 Years | 306 (4.8%) | 323 (5.2%) |
| 65 to 74 Years | 58 (3.0%) | 97 (4.6%) |
| 75 Years and over | 86 (6.7%) | 141 (7.9%) |
Disability Class: Ambulatory Difficulty
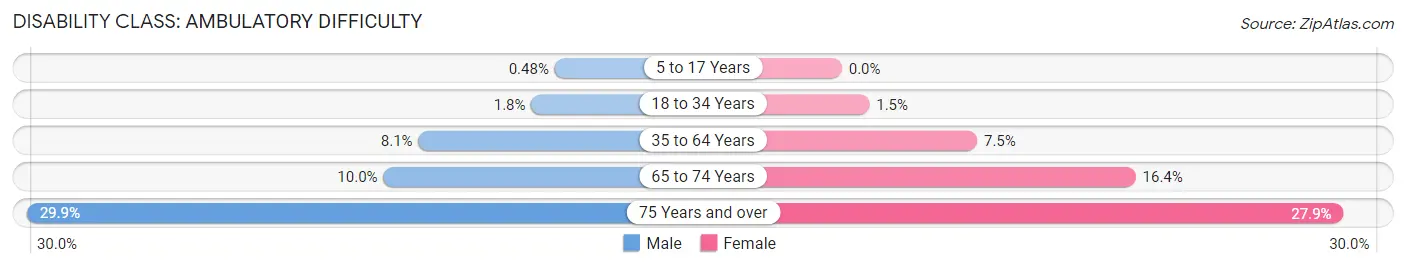
| Age Bracket | Male | Female |
| 5 to 17 Years | 13 (0.5%) | 0 (0.0%) |
| 18 to 34 Years | 55 (1.8%) | 46 (1.5%) |
| 35 to 64 Years | 515 (8.1%) | 471 (7.5%) |
| 65 to 74 Years | 195 (10.0%) | 343 (16.4%) |
| 75 Years and over | 384 (29.9%) | 500 (27.9%) |
Disability Class: Self-Care Difficulty
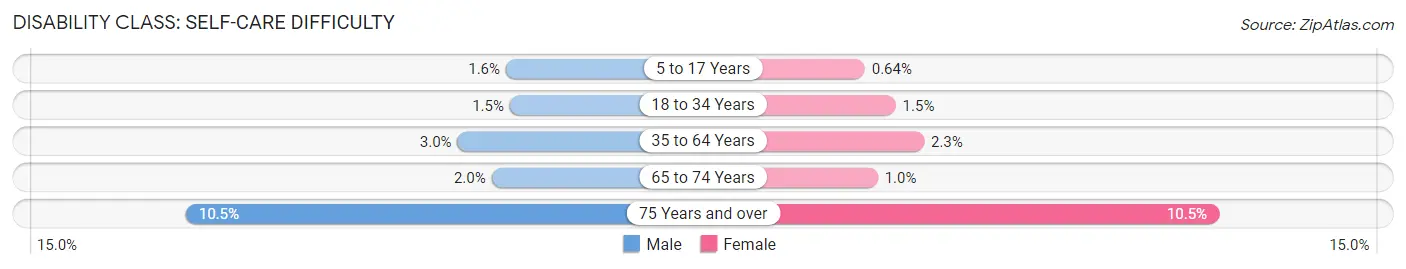
| Age Bracket | Male | Female |
| 5 to 17 Years | 43 (1.6%) | 17 (0.6%) |
| 18 to 34 Years | 46 (1.5%) | 45 (1.5%) |
| 35 to 64 Years | 188 (2.9%) | 143 (2.3%) |
| 65 to 74 Years | 39 (2.0%) | 21 (1.0%) |
| 75 Years and over | 135 (10.5%) | 188 (10.5%) |
Technology Access in Bureau County
Computing Device Access in Bureau County
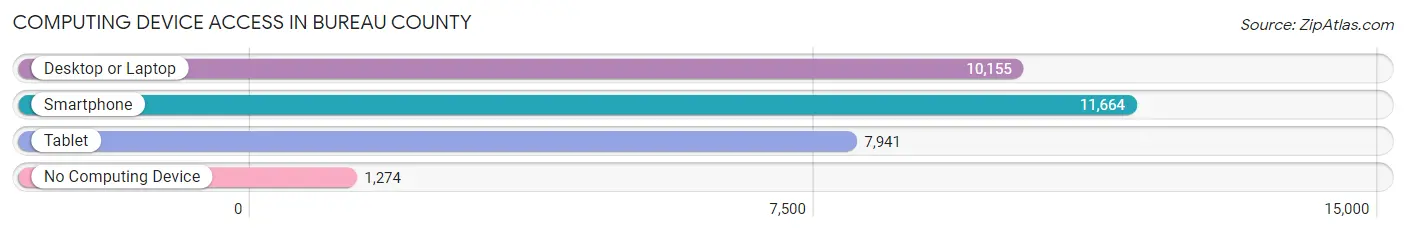
| Device Type | # Households | % Households |
| Desktop or Laptop | 10,155 | 73.1% |
| Smartphone | 11,664 | 83.9% |
| Tablet | 7,941 | 57.1% |
| No Computing Device | 1,274 | 9.2% |
| Total | 13,901 | 100.0% |
Internet Access in Bureau County
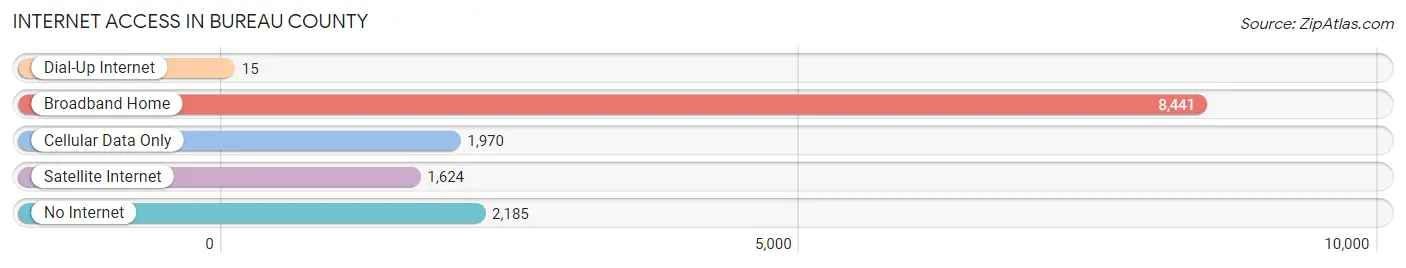
| Internet Type | # Households | % Households |
| Dial-Up Internet | 15 | 0.1% |
| Broadband Home | 8,441 | 60.7% |
| Cellular Data Only | 1,970 | 14.2% |
| Satellite Internet | 1,624 | 11.7% |
| No Internet | 2,185 | 15.7% |
| Total | 13,901 | 100.0% |
Bureau County Summary
Bureau County is located in the north-central region of Illinois, and is part of the Illinois-Indiana-Wisconsin tri-state area. It is bordered by LaSalle County to the north, Putnam County to the east, Marshall County to the south, and Henry and Stark Counties to the west. The county seat is Princeton, and the county is named after Michel Bureu, a French-Canadian fur trader who was active in the area in the early 19th century.
Geography
Bureau County covers an area of 845 square miles, making it the 25th largest county in Illinois. The terrain is mostly flat, with some rolling hills in the northern and western parts of the county. The highest point in the county is located in the northwest corner, at an elevation of 810 feet. The county is drained by the Illinois River, which forms its eastern border, and by the Bureau Creek, which flows through the center of the county.
The climate of Bureau County is humid continental, with hot, humid summers and cold, snowy winters. The average annual temperature is around 50°F, and the average annual precipitation is around 36 inches.
Demographics
As of the 2010 census, Bureau County had a population of 34,978. The racial makeup of the county was 94.2% White, 0.7% African American, 0.3% Native American, 0.5% Asian, 0.1% Pacific Islander, 2.7% from other races, and 1.5% from two or more races. Hispanic or Latino of any race were 5.3% of the population.
The median household income in Bureau County was $50,945, and the median family income was $60,945. The per capita income was $24,845. About 8.2% of families and 11.2% of the population were below the poverty line.
Economy
Agriculture is the main economic activity in Bureau County. The county is home to a large number of farms, and the main crops grown are corn, soybeans, and wheat. Livestock production is also important, with beef cattle, dairy cattle, and hogs being the main animals raised.
Manufacturing is also an important part of the economy. The county is home to a number of factories, including a Caterpillar plant in Princeton, a John Deere plant in Walnut, and a General Electric plant in Spring Valley.
The county also has a growing tourism industry, with a number of attractions, including the Bureau County Historical Museum, the Bureau County Fairgrounds, and the Illinois River.
History
Bureau County was first settled in the early 19th century by French-Canadian fur traders, including Michel Bureu, for whom the county is named. The first permanent settlers arrived in the 1830s, and the county was officially organized in 1837.
The county grew rapidly in the late 19th and early 20th centuries, as the railroads opened up the area to settlement and industry. The population peaked in 1920, at over 50,000, and has been declining ever since.
Today, Bureau County is a largely rural county, with a population of just over 35,000. Agriculture is still the main economic activity, but the county is also home to a number of factories and a growing tourism industry.
Common Questions
What is Per Capita Income in Bureau County?
Per Capita income in Bureau County is $34,873.
What is the Median Family Income in Bureau County?
Median Family Income in Bureau County is $81,289.
What is the Median Household income in Bureau County?
Median Household Income in Bureau County is $64,165.
What is Income or Wage Gap in Bureau County?
Income or Wage Gap in Bureau County is 43.5%.
Women in Bureau County earn 56.5 cents for every dollar earned by a man.
What is Family Income Deficit in Bureau County?
Family Income Deficit in Bureau County is $9,529.
Families that are below poverty line in Bureau County earn $9,529 less on average than the poverty threshold level.
What is Inequality or Gini Index in Bureau County?
Inequality or Gini Index in Bureau County is 0.43.
What is the Total Population of Bureau County?
Total Population of Bureau County is 33,203.
What is the Total Male Population of Bureau County?
Total Male Population of Bureau County is 16,455.
What is the Total Female Population of Bureau County?
Total Female Population of Bureau County is 16,748.
What is the Ratio of Males per 100 Females in Bureau County?
There are 98.25 Males per 100 Females in Bureau County.
What is the Ratio of Females per 100 Males in Bureau County?
There are 101.78 Females per 100 Males in Bureau County.
What is the Median Population Age in Bureau County?
Median Population Age in Bureau County is 44.0 Years.
What is the Average Family Size in Bureau County
Average Family Size in Bureau County is 2.9 People.
What is the Average Household Size in Bureau County
Average Household Size in Bureau County is 2.4 People.
How Large is the Labor Force in Bureau County?
There are 16,888 People in the Labor Forcein in Bureau County.
What is the Percentage of People in the Labor Force in Bureau County?
62.4% of People are in the Labor Force in Bureau County.
What is the Unemployment Rate in Bureau County?
Unemployment Rate in Bureau County is 5.7%.