Brown County, IL Map & Demographics
Brown County Map
Brown County Overview
$25,951
PER CAPITA INCOME
$82,813
AVG FAMILY INCOME
$64,760
AVG HOUSEHOLD INCOME
16.4%
WAGE / INCOME GAP [ % ]
83.6¢/ $1
WAGE / INCOME GAP [ $ ]
$8,563
FAMILY INCOME DEFICIT
0.41
INEQUALITY / GINI INDEX
6,334
TOTAL POPULATION
3,992
MALE POPULATION
2,342
FEMALE POPULATION
170.45
MALES / 100 FEMALES
58.67
FEMALES / 100 MALES
38.5
MEDIAN AGE
3.0
AVG FAMILY SIZE
2.2
AVG HOUSEHOLD SIZE
2,468
LABOR FORCE [ PEOPLE ]
45.8%
PERCENT IN LABOR FORCE
2.1%
UNEMPLOYMENT RATE
Brown County Area Codes
Income in Brown County
Income Overview in Brown County
Per Capita Income in Brown County is $25,951, while median incomes of families and households are $82,813 and $64,760 respectively.
| Characteristic | Number | Measure |
| Per Capita Income | 6,334 | $25,951 |
| Median Family Income | 1,168 | $82,813 |
| Mean Family Income | 1,168 | $89,688 |
| Median Household Income | 2,066 | $64,760 |
| Mean Household Income | 2,066 | $75,886 |
| Income Deficit | 1,168 | $8,563 |
| Wage / Income Gap (%) | 6,334 | 16.45% |
| Wage / Income Gap ($) | 6,334 | 83.55¢ per $1 |
| Gini / Inequality Index | 6,334 | 0.41 |
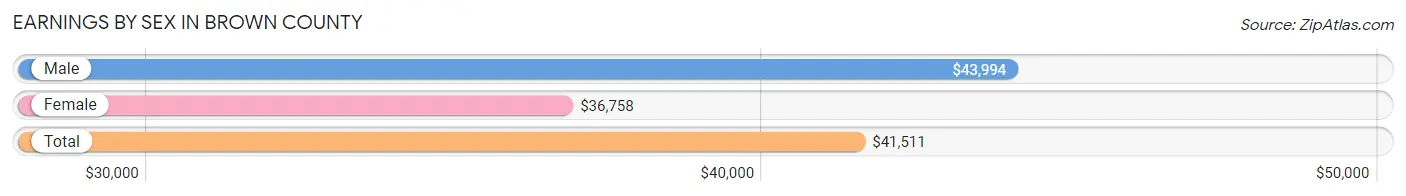
Earnings by Sex in Brown County
Average Earnings in Brown County are $41,511, $43,994 for men and $36,758 for women, a difference of 16.5%.
| Sex | Number | Average Earnings |
| Male | 1,583 (56.6%) | $43,994 |
| Female | 1,213 (43.4%) | $36,758 |
| Total | 2,796 (100.0%) | $41,511 |
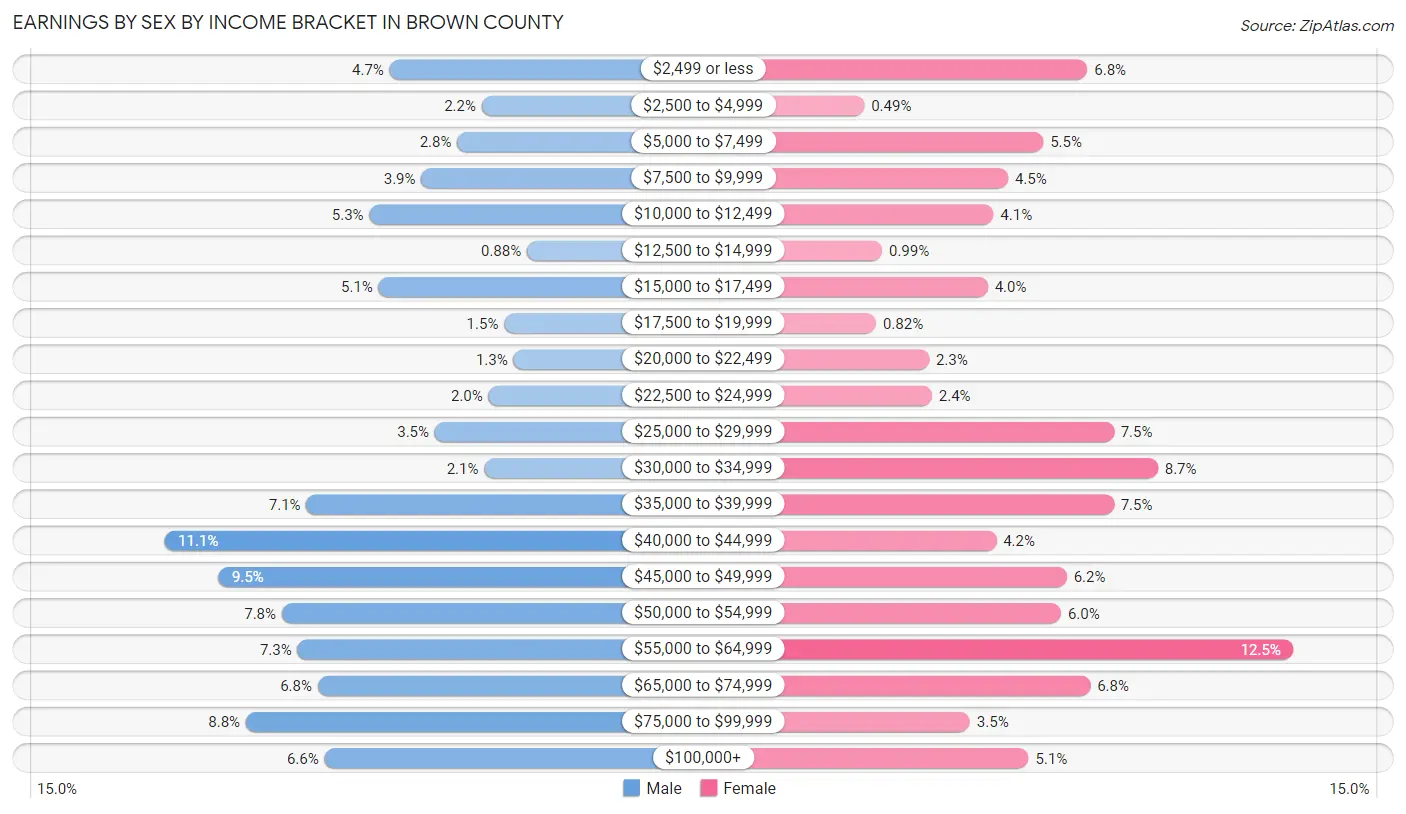
Earnings by Sex by Income Bracket in Brown County
The most common earnings brackets in Brown County are $40,000 to $44,999 for men (175 | 11.1%) and $55,000 to $64,999 for women (152 | 12.5%).
| Income | Male | Female |
| $2,499 or less | 75 (4.7%) | 82 (6.8%) |
| $2,500 to $4,999 | 34 (2.1%) | 6 (0.5%) |
| $5,000 to $7,499 | 45 (2.8%) | 67 (5.5%) |
| $7,500 to $9,999 | 61 (3.8%) | 55 (4.5%) |
| $10,000 to $12,499 | 84 (5.3%) | 50 (4.1%) |
| $12,500 to $14,999 | 14 (0.9%) | 12 (1.0%) |
| $15,000 to $17,499 | 80 (5.1%) | 48 (4.0%) |
| $17,500 to $19,999 | 24 (1.5%) | 10 (0.8%) |
| $20,000 to $22,499 | 20 (1.3%) | 28 (2.3%) |
| $22,500 to $24,999 | 31 (2.0%) | 29 (2.4%) |
| $25,000 to $29,999 | 55 (3.5%) | 91 (7.5%) |
| $30,000 to $34,999 | 33 (2.1%) | 106 (8.7%) |
| $35,000 to $39,999 | 112 (7.1%) | 91 (7.5%) |
| $40,000 to $44,999 | 175 (11.1%) | 51 (4.2%) |
| $45,000 to $49,999 | 151 (9.5%) | 75 (6.2%) |
| $50,000 to $54,999 | 123 (7.8%) | 73 (6.0%) |
| $55,000 to $64,999 | 116 (7.3%) | 152 (12.5%) |
| $65,000 to $74,999 | 107 (6.8%) | 83 (6.8%) |
| $75,000 to $99,999 | 139 (8.8%) | 42 (3.5%) |
| $100,000+ | 104 (6.6%) | 62 (5.1%) |
| Total | 1,583 (100.0%) | 1,213 (100.0%) |
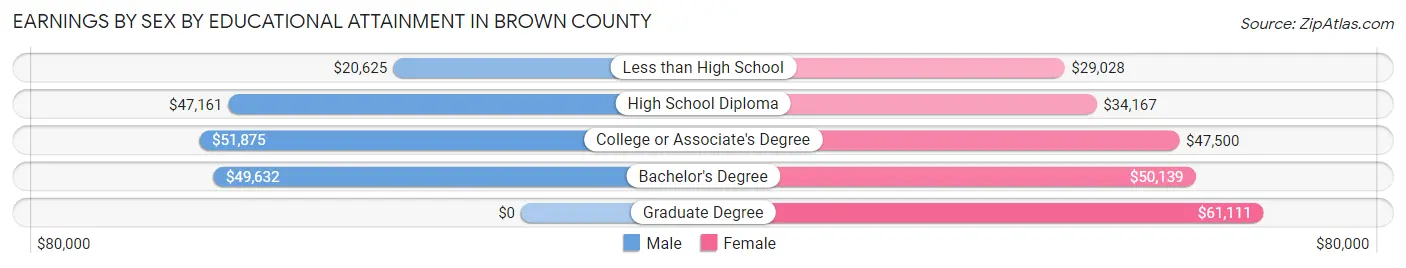
Earnings by Sex by Educational Attainment in Brown County
Average earnings in Brown County are $46,138 for men and $42,131 for women, a difference of 8.7%. Men with an educational attainment of college or associate's degree enjoy the highest average annual earnings of $51,875, while those with less than high school education earn the least with $20,625. Women with an educational attainment of graduate degree earn the most with the average annual earnings of $61,111, while those with less than high school education have the smallest earnings of $29,028.
| Educational Attainment | Male Income | Female Income |
| Less than High School | $20,625 | $29,028 |
| High School Diploma | $47,161 | $34,167 |
| College or Associate's Degree | $51,875 | $47,500 |
| Bachelor's Degree | $49,632 | $50,139 |
| Graduate Degree | - | - |
| Total | $46,138 | $42,131 |
Family Income in Brown County
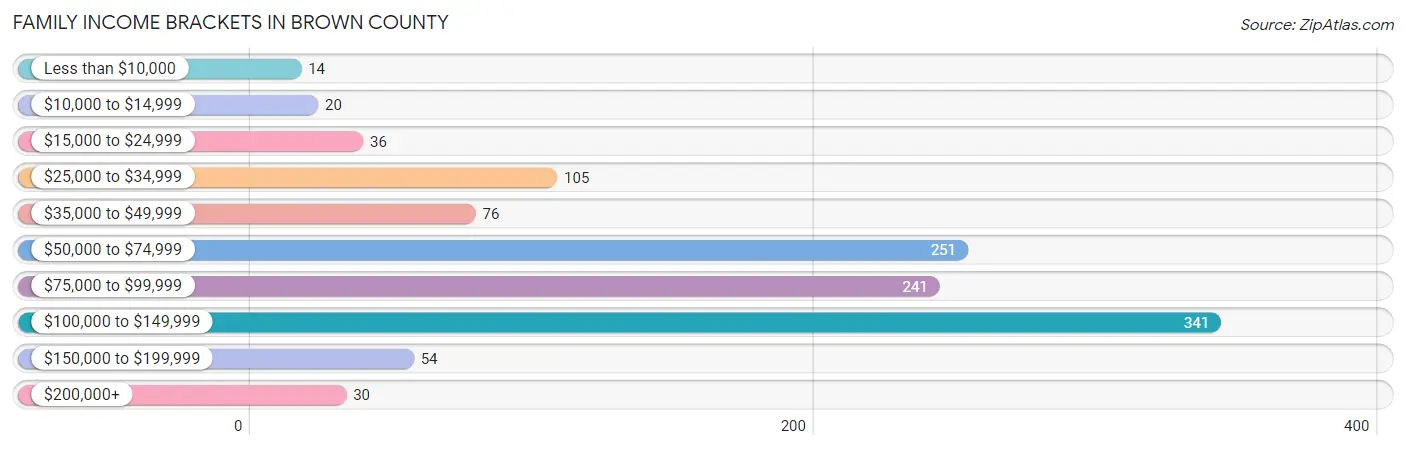
Family Income Brackets in Brown County
According to the Brown County family income data, there are 341 families falling into the $100,000 to $149,999 income range, which is the most common income bracket and makes up 29.2% of all families. Conversely, the less than $10,000 income bracket is the least frequent group with only 14 families (1.2%) belonging to this category.
| Income Bracket | # Families | % Families |
| Less than $10,000 | 14 | 1.2% |
| $10,000 to $14,999 | 20 | 1.7% |
| $15,000 to $24,999 | 36 | 3.1% |
| $25,000 to $34,999 | 105 | 9.0% |
| $35,000 to $49,999 | 76 | 6.5% |
| $50,000 to $74,999 | 251 | 21.5% |
| $75,000 to $99,999 | 241 | 20.6% |
| $100,000 to $149,999 | 341 | 29.2% |
| $150,000 to $199,999 | 54 | 4.6% |
| $200,000+ | 30 | 2.6% |
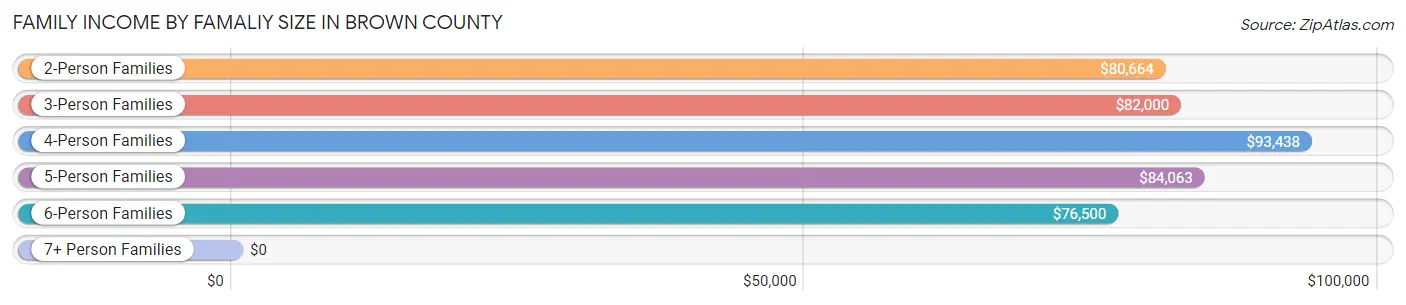
Family Income by Famaliy Size in Brown County
4-person families (123 | 10.5%) account for the highest median family income in Brown County with $93,438 per family, while 2-person families (665 | 56.9%) have the highest median income of $40,332 per family member.
| Income Bracket | # Families | Median Income |
| 2-Person Families | 665 (56.9%) | $80,664 |
| 3-Person Families | 256 (21.9%) | $82,000 |
| 4-Person Families | 123 (10.5%) | $93,438 |
| 5-Person Families | 63 (5.4%) | $84,063 |
| 6-Person Families | 48 (4.1%) | $76,500 |
| 7+ Person Families | 13 (1.1%) | $0 |
| Total | 1,168 (100.0%) | $82,813 |
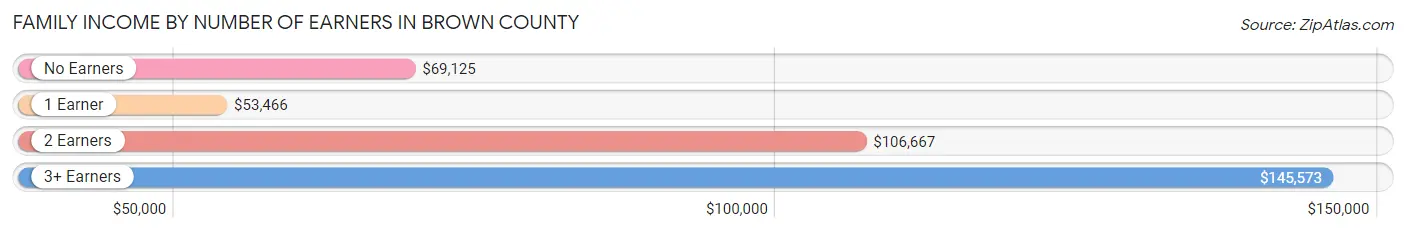
Family Income by Number of Earners in Brown County
The median family income in Brown County is $82,813, with families comprising 3+ earners (95) having the highest median family income of $145,573, while families with 1 earner (410) have the lowest median family income of $53,466, accounting for 8.1% and 35.1% of families, respectively.
| Number of Earners | # Families | Median Income |
| No Earners | 135 (11.6%) | $69,125 |
| 1 Earner | 410 (35.1%) | $53,466 |
| 2 Earners | 528 (45.2%) | $106,667 |
| 3+ Earners | 95 (8.1%) | $145,573 |
| Total | 1,168 (100.0%) | $82,813 |
Household Income in Brown County
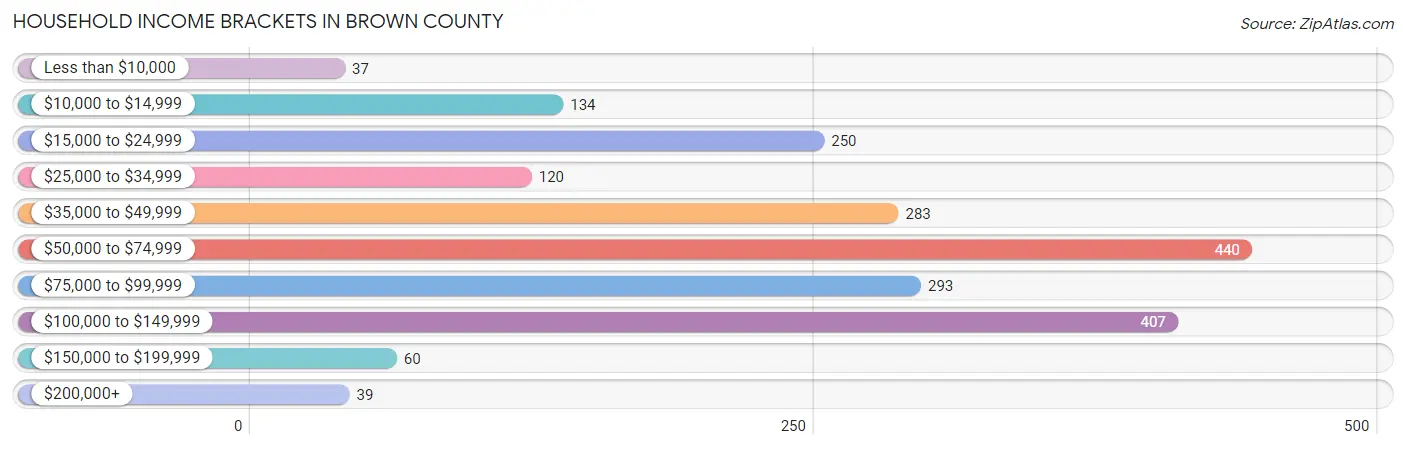
Household Income Brackets in Brown County
With 440 households falling in the category, the $50,000 to $74,999 income range is the most frequent in Brown County, accounting for 21.3% of all households. In contrast, only 37 households (1.8%) fall into the less than $10,000 income bracket, making it the least populous group.
| Income Bracket | # Households | % Households |
| Less than $10,000 | 37 | 1.8% |
| $10,000 to $14,999 | 134 | 6.5% |
| $15,000 to $24,999 | 250 | 12.1% |
| $25,000 to $34,999 | 120 | 5.8% |
| $35,000 to $49,999 | 283 | 13.7% |
| $50,000 to $74,999 | 440 | 21.3% |
| $75,000 to $99,999 | 293 | 14.2% |
| $100,000 to $149,999 | 407 | 19.7% |
| $150,000 to $199,999 | 60 | 2.9% |
| $200,000+ | 39 | 1.9% |
Household Income by Householder Age in Brown County
The median household income in Brown County is $64,760, with the highest median household income of $73,542 found in the 45 to 64 years age bracket for the primary householder. A total of 646 households (31.3%) fall into this category. Meanwhile, the 15 to 24 years age bracket for the primary householder has the lowest median household income of $44,250, with 124 households (6.0%) in this group.
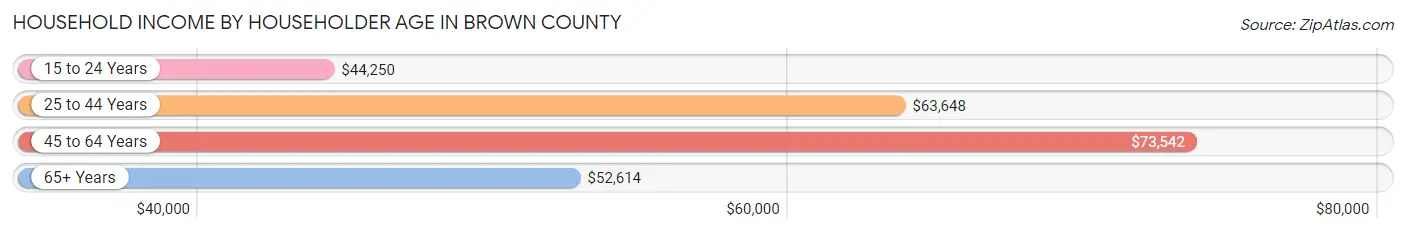
| Income Bracket | # Households | Median Income |
| 15 to 24 Years | 124 (6.0%) | $44,250 |
| 25 to 44 Years | 777 (37.6%) | $63,648 |
| 45 to 64 Years | 646 (31.3%) | $73,542 |
| 65+ Years | 519 (25.1%) | $52,614 |
| Total | 2,066 (100.0%) | $64,760 |
Poverty in Brown County
Income Below Poverty by Sex and Age in Brown County
With 8.0% poverty level for males and 12.1% for females among the residents of Brown County, 16 and 17 year old males and 15 year old females are the most vulnerable to poverty, with 18 males (28.6%) and 5 females (45.5%) in their respective age groups living below the poverty level.
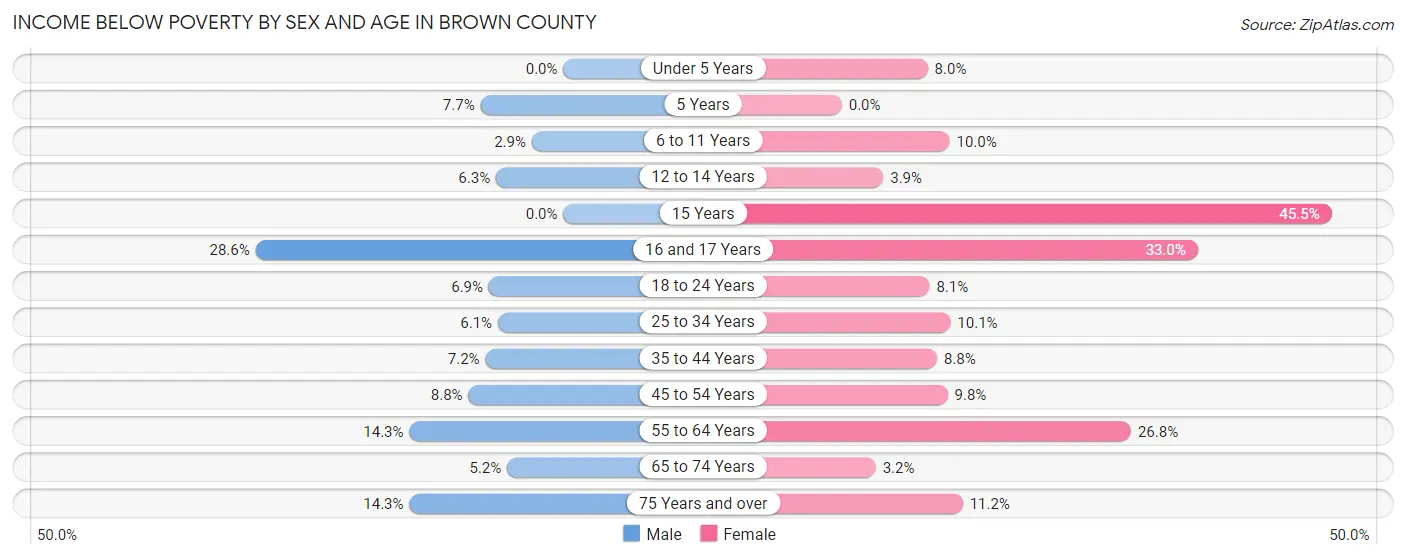
| Age Bracket | Male | Female |
| Under 5 Years | 0 (0.0%) | 11 (8.0%) |
| 5 Years | 3 (7.7%) | 0 (0.0%) |
| 6 to 11 Years | 7 (2.9%) | 15 (10.0%) |
| 12 to 14 Years | 5 (6.2%) | 4 (3.8%) |
| 15 Years | 0 (0.0%) | 5 (45.5%) |
| 16 and 17 Years | 18 (28.6%) | 36 (33.0%) |
| 18 to 24 Years | 17 (6.9%) | 14 (8.1%) |
| 25 to 34 Years | 25 (6.1%) | 24 (10.1%) |
| 35 to 44 Years | 25 (7.2%) | 28 (8.8%) |
| 45 to 54 Years | 14 (8.8%) | 27 (9.8%) |
| 55 to 64 Years | 43 (14.3%) | 84 (26.8%) |
| 65 to 74 Years | 7 (5.2%) | 8 (3.2%) |
| 75 Years and over | 22 (14.3%) | 23 (11.2%) |
| Total | 186 (8.0%) | 279 (12.1%) |
Income Above Poverty by Sex and Age in Brown County
According to the poverty statistics in Brown County, males aged under 5 years and females aged 5 years are the age groups that are most secure financially, with 100.0% of males and 100.0% of females in these age groups living above the poverty line.
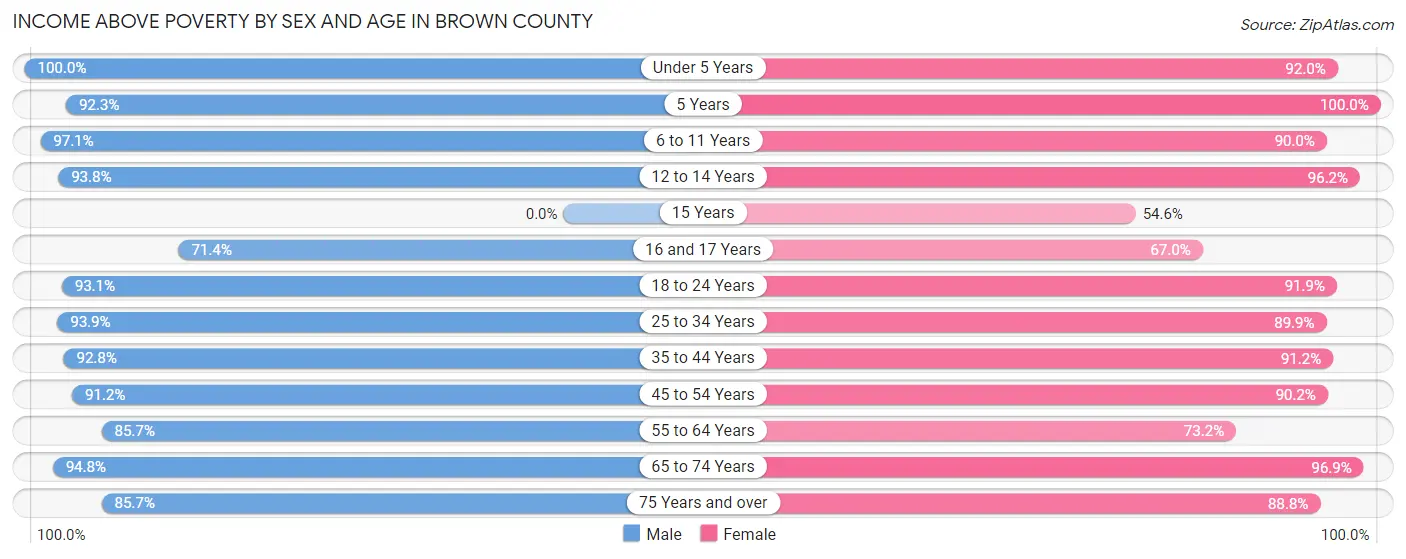
| Age Bracket | Male | Female |
| Under 5 Years | 153 (100.0%) | 127 (92.0%) |
| 5 Years | 36 (92.3%) | 19 (100.0%) |
| 6 to 11 Years | 232 (97.1%) | 135 (90.0%) |
| 12 to 14 Years | 75 (93.8%) | 100 (96.2%) |
| 15 Years | 0 (0.0%) | 6 (54.5%) |
| 16 and 17 Years | 45 (71.4%) | 73 (67.0%) |
| 18 to 24 Years | 229 (93.1%) | 158 (91.9%) |
| 25 to 34 Years | 387 (93.9%) | 214 (89.9%) |
| 35 to 44 Years | 321 (92.8%) | 289 (91.2%) |
| 45 to 54 Years | 145 (91.2%) | 248 (90.2%) |
| 55 to 64 Years | 258 (85.7%) | 229 (73.2%) |
| 65 to 74 Years | 127 (94.8%) | 246 (96.9%) |
| 75 Years and over | 132 (85.7%) | 182 (88.8%) |
| Total | 2,140 (92.0%) | 2,026 (87.9%) |
Income Below Poverty Among Married-Couple Families in Brown County
The poverty statistics for married-couple families in Brown County show that 0.9% or 8 of the total 886 families live below the poverty line. Families with 3 or 4 children have the highest poverty rate of 3.7%, comprising of 3 families. On the other hand, families with 1 or 2 children have the lowest poverty rate of 0.0%, which includes 0 families.
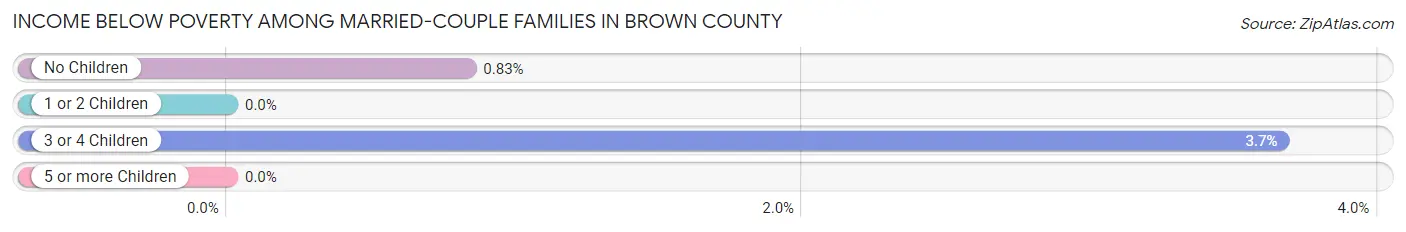
| Children | Above Poverty | Below Poverty |
| No Children | 597 (99.2%) | 5 (0.8%) |
| 1 or 2 Children | 189 (100.0%) | 0 (0.0%) |
| 3 or 4 Children | 79 (96.3%) | 3 (3.7%) |
| 5 or more Children | 13 (100.0%) | 0 (0.0%) |
| Total | 878 (99.1%) | 8 (0.9%) |
Income Below Poverty Among Single-Parent Households in Brown County
According to the poverty data in Brown County, 18.1% or 21 single-father households and 20.5% or 34 single-mother households are living below the poverty line. Among single-father households, those with 1 or 2 children have the highest poverty rate, with 21 households (24.4%) experiencing poverty. Likewise, among single-mother households, those with 5 or more children have the highest poverty rate, with 7 households (100.0%) falling below the poverty line.
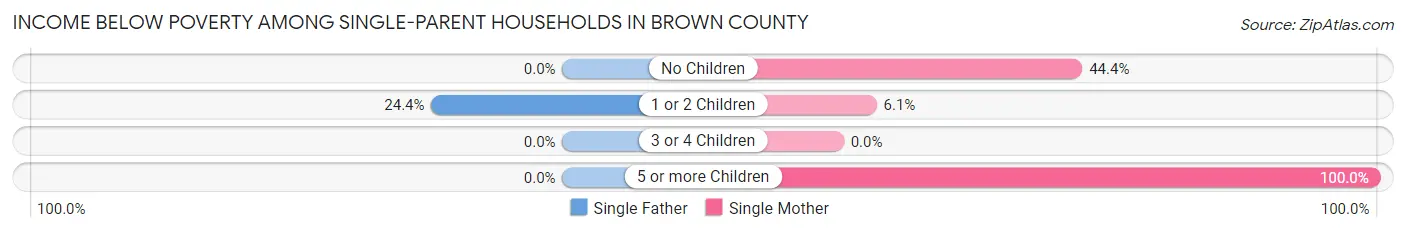
| Children | Single Father | Single Mother |
| No Children | 0 (0.0%) | 20 (44.4%) |
| 1 or 2 Children | 21 (24.4%) | 7 (6.1%) |
| 3 or 4 Children | 0 (0.0%) | 0 (0.0%) |
| 5 or more Children | 0 (0.0%) | 7 (100.0%) |
| Total | 21 (18.1%) | 34 (20.5%) |
Income Below Poverty Among Married-Couple vs Single-Parent Households in Brown County
The poverty data for Brown County shows that 8 of the married-couple family households (0.9%) and 55 of the single-parent households (19.5%) are living below the poverty level. Within the married-couple family households, those with 3 or 4 children have the highest poverty rate, with 3 households (3.7%) falling below the poverty line. Among the single-parent households, those with 5 or more children have the highest poverty rate, with 7 household (100.0%) living below poverty.
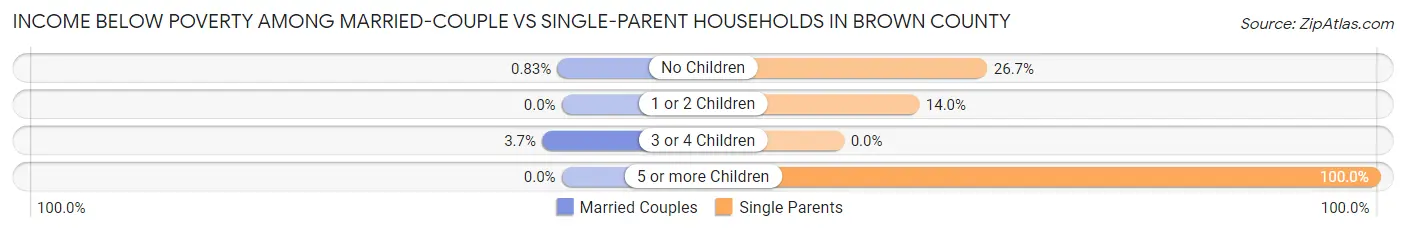
| Children | Married-Couple Families | Single-Parent Households |
| No Children | 5 (0.8%) | 20 (26.7%) |
| 1 or 2 Children | 0 (0.0%) | 28 (14.0%) |
| 3 or 4 Children | 3 (3.7%) | 0 (0.0%) |
| 5 or more Children | 0 (0.0%) | 7 (100.0%) |
| Total | 8 (0.9%) | 55 (19.5%) |
Race in Brown County
The most populous races in Brown County are White / Caucasian (4,956 | 78.2%), Black / African American (1,053 | 16.6%), and Hispanic or Latino (439 | 6.9%).
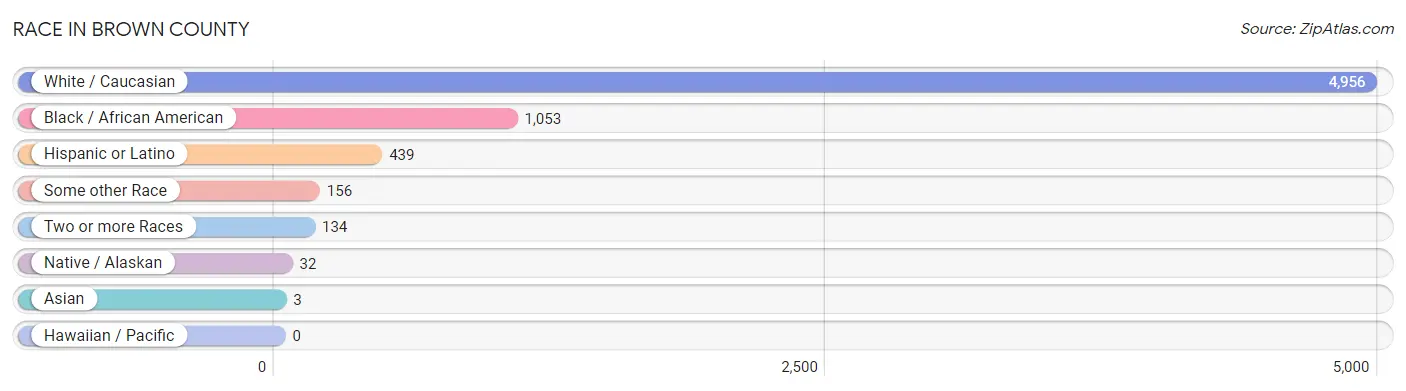
| Race | # Population | % Population |
| Asian | 3 | 0.1% |
| Black / African American | 1,053 | 16.6% |
| Hawaiian / Pacific | 0 | 0.0% |
| Hispanic or Latino | 439 | 6.9% |
| Native / Alaskan | 32 | 0.5% |
| White / Caucasian | 4,956 | 78.2% |
| Two or more Races | 134 | 2.1% |
| Some other Race | 156 | 2.5% |
| Total | 6,334 | 100.0% |
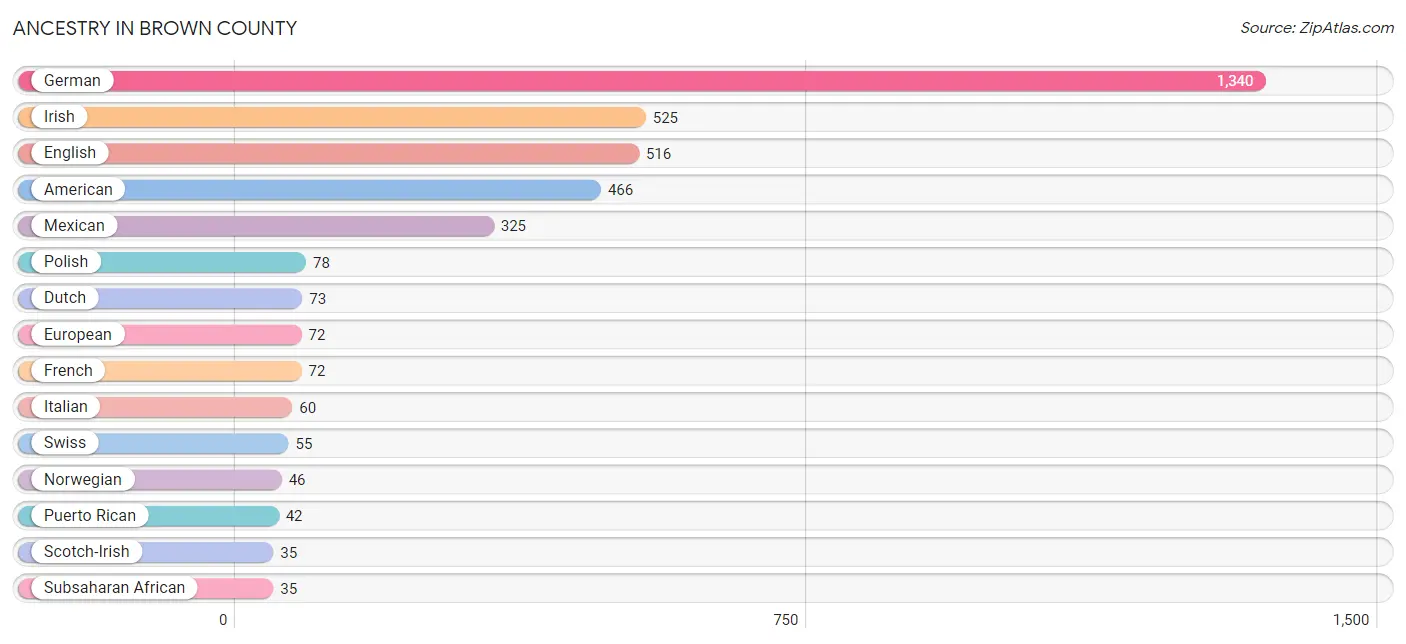
Ancestry in Brown County
The most populous ancestries reported in Brown County are German (1,340 | 21.2%), Irish (525 | 8.3%), English (516 | 8.2%), American (466 | 7.4%), and Mexican (325 | 5.1%), together accounting for 50.1% of all Brown County residents.
| Ancestry | # Population | % Population |
| African | 28 | 0.4% |
| Albanian | 28 | 0.4% |
| American | 466 | 7.4% |
| Apache | 7 | 0.1% |
| Arab | 10 | 0.2% |
| Argentinean | 9 | 0.1% |
| Blackfeet | 7 | 0.1% |
| British | 21 | 0.3% |
| Canadian | 4 | 0.1% |
| Central American | 30 | 0.5% |
| Cherokee | 1 | 0.0% |
| Chickasaw | 3 | 0.1% |
| Cuban | 8 | 0.1% |
| Danish | 14 | 0.2% |
| Dominican | 7 | 0.1% |
| Dutch | 73 | 1.1% |
| English | 516 | 8.2% |
| European | 72 | 1.1% |
| Finnish | 8 | 0.1% |
| French | 72 | 1.1% |
| French Canadian | 24 | 0.4% |
| German | 1,340 | 21.2% |
| Ghanaian | 7 | 0.1% |
| Greek | 9 | 0.1% |
| Irish | 525 | 8.3% |
| Italian | 60 | 0.9% |
| Jamaican | 9 | 0.1% |
| Japanese | 3 | 0.1% |
| Lebanese | 1 | 0.0% |
| Mexican | 325 | 5.1% |
| Moroccan | 9 | 0.1% |
| Navajo | 14 | 0.2% |
| Nicaraguan | 29 | 0.5% |
| Norwegian | 46 | 0.7% |
| Polish | 78 | 1.2% |
| Puerto Rican | 42 | 0.7% |
| Russian | 7 | 0.1% |
| Salvadoran | 1 | 0.0% |
| Scandinavian | 8 | 0.1% |
| Scotch-Irish | 35 | 0.5% |
| Scottish | 19 | 0.3% |
| Serbian | 11 | 0.2% |
| South American | 9 | 0.1% |
| Subsaharan African | 35 | 0.5% |
| Swedish | 17 | 0.3% |
| Swiss | 55 | 0.9% |
| Welsh | 20 | 0.3% |
| Yup'ik | 14 | 0.2% | View All 48 Rows |
Immigrants in Brown County
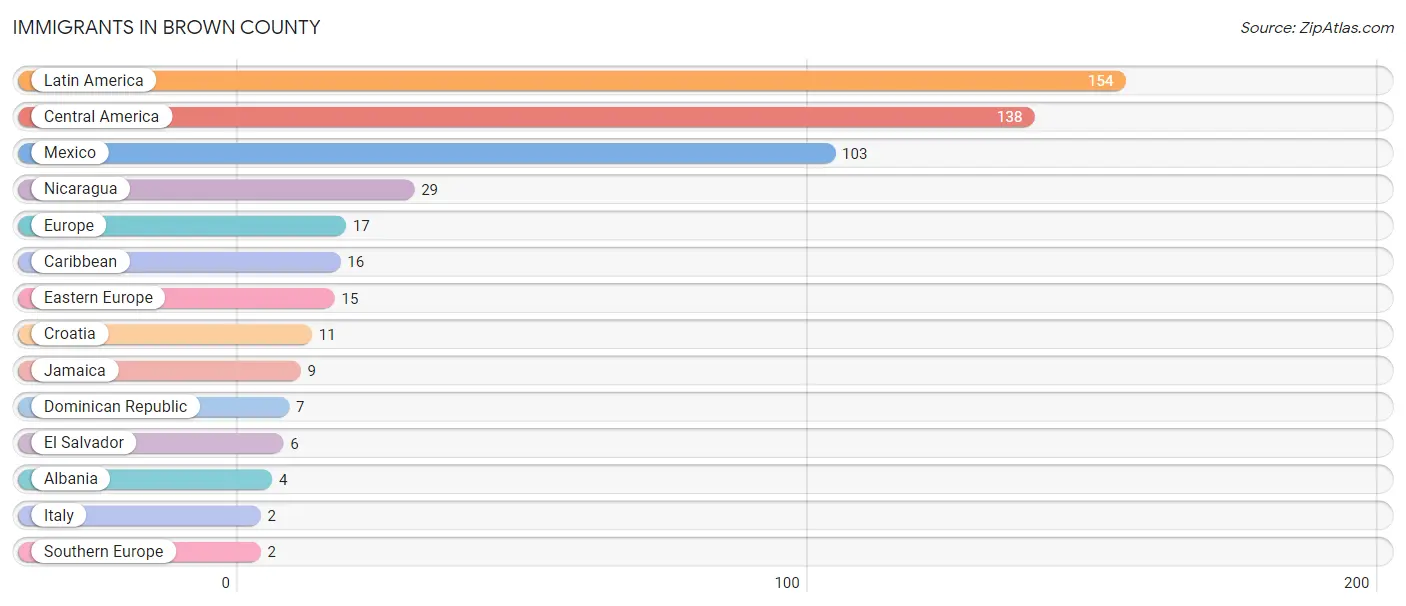
The most numerous immigrant groups reported in Brown County came from Latin America (154 | 2.4%), Central America (138 | 2.2%), Mexico (103 | 1.6%), Nicaragua (29 | 0.5%), and Europe (17 | 0.3%), together accounting for 7.0% of all Brown County residents.
| Immigration Origin | # Population | % Population |
| Albania | 4 | 0.1% |
| Caribbean | 16 | 0.3% |
| Central America | 138 | 2.2% |
| Croatia | 11 | 0.2% |
| Dominican Republic | 7 | 0.1% |
| Eastern Europe | 15 | 0.2% |
| El Salvador | 6 | 0.1% |
| Europe | 17 | 0.3% |
| Italy | 2 | 0.0% |
| Jamaica | 9 | 0.1% |
| Latin America | 154 | 2.4% |
| Mexico | 103 | 1.6% |
| Nicaragua | 29 | 0.5% |
| Southern Europe | 2 | 0.0% | View All 14 Rows |
Sex and Age in Brown County
Sex and Age in Brown County
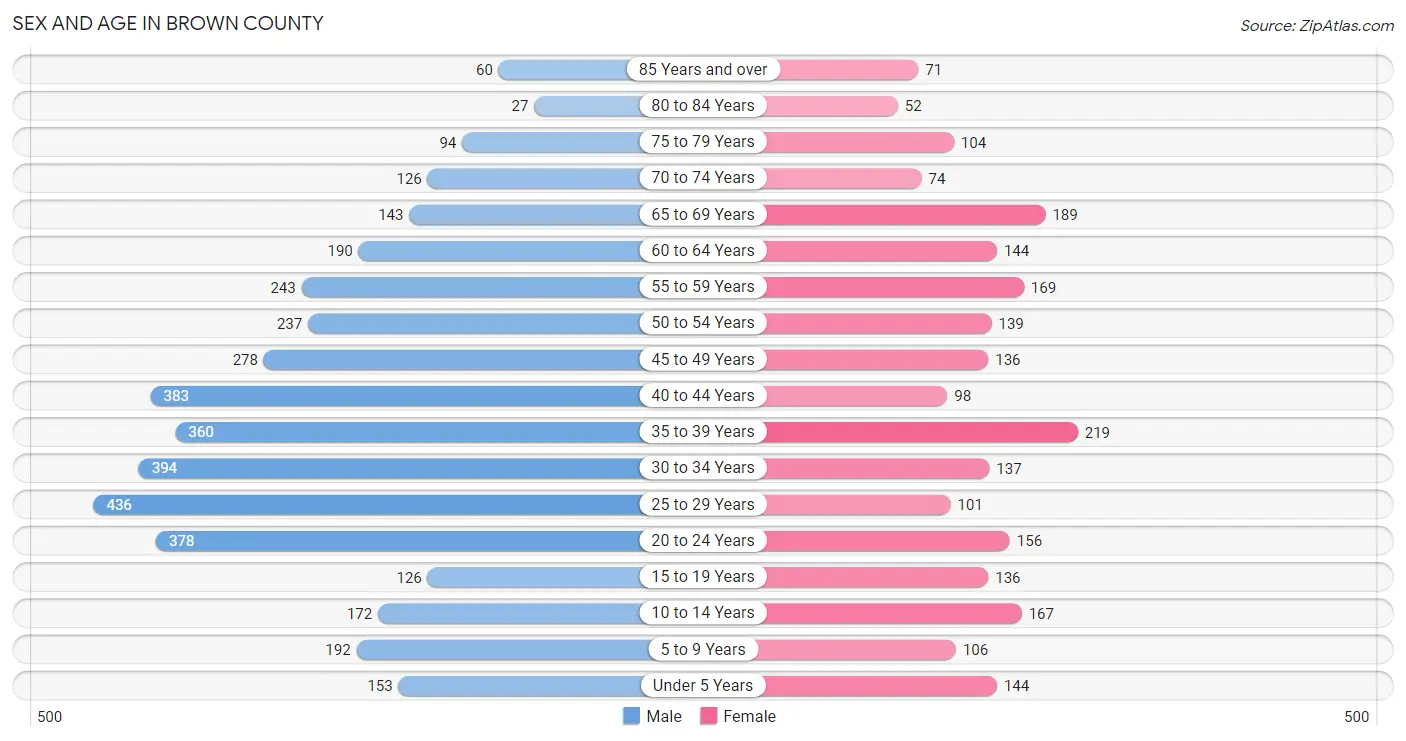
The most populous age groups in Brown County are 25 to 29 Years (436 | 10.9%) for men and 35 to 39 Years (219 | 9.3%) for women.
| Age Bracket | Male | Female |
| Under 5 Years | 153 (3.8%) | 144 (6.1%) |
| 5 to 9 Years | 192 (4.8%) | 106 (4.5%) |
| 10 to 14 Years | 172 (4.3%) | 167 (7.1%) |
| 15 to 19 Years | 126 (3.2%) | 136 (5.8%) |
| 20 to 24 Years | 378 (9.5%) | 156 (6.7%) |
| 25 to 29 Years | 436 (10.9%) | 101 (4.3%) |
| 30 to 34 Years | 394 (9.9%) | 137 (5.9%) |
| 35 to 39 Years | 360 (9.0%) | 219 (9.3%) |
| 40 to 44 Years | 383 (9.6%) | 98 (4.2%) |
| 45 to 49 Years | 278 (7.0%) | 136 (5.8%) |
| 50 to 54 Years | 237 (5.9%) | 139 (5.9%) |
| 55 to 59 Years | 243 (6.1%) | 169 (7.2%) |
| 60 to 64 Years | 190 (4.8%) | 144 (6.1%) |
| 65 to 69 Years | 143 (3.6%) | 189 (8.1%) |
| 70 to 74 Years | 126 (3.2%) | 74 (3.2%) |
| 75 to 79 Years | 94 (2.4%) | 104 (4.4%) |
| 80 to 84 Years | 27 (0.7%) | 52 (2.2%) |
| 85 Years and over | 60 (1.5%) | 71 (3.0%) |
| Total | 3,992 (100.0%) | 2,342 (100.0%) |
Families and Households in Brown County
Median Family Size in Brown County
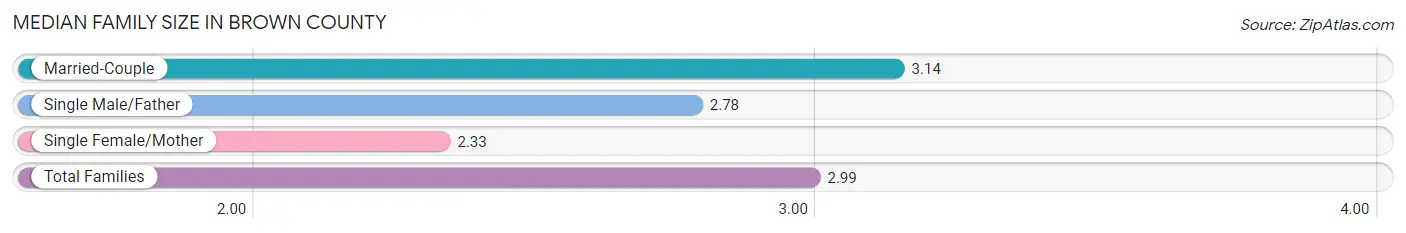
The median family size in Brown County is 2.99 persons per family, with married-couple families (886 | 75.9%) accounting for the largest median family size of 3.14 persons per family. On the other hand, single female/mother families (166 | 14.2%) represent the smallest median family size with 2.33 persons per family.
| Family Type | # Families | Family Size |
| Married-Couple | 886 (75.9%) | 3.14 |
| Single Male/Father | 116 (9.9%) | 2.78 |
| Single Female/Mother | 166 (14.2%) | 2.33 |
| Total Families | 1,168 (100.0%) | 2.99 |
Median Household Size in Brown County
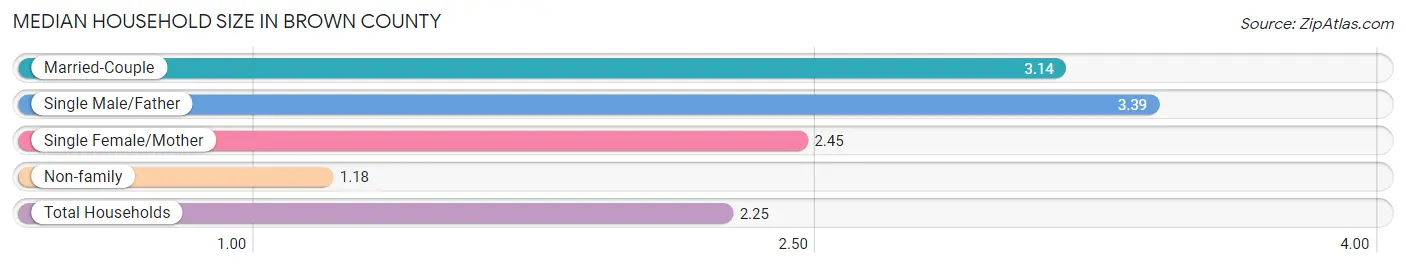
The median household size in Brown County is 2.25 persons per household, with single male/father households (116 | 5.6%) accounting for the largest median household size of 3.39 persons per household. non-family households (898 | 43.5%) represent the smallest median household size with 1.18 persons per household.
| Household Type | # Households | Household Size |
| Married-Couple | 886 (42.9%) | 3.14 |
| Single Male/Father | 116 (5.6%) | 3.39 |
| Single Female/Mother | 166 (8.0%) | 2.45 |
| Non-family | 898 (43.5%) | 1.18 |
| Total Households | 2,066 (100.0%) | 2.25 |
Household Size by Marriage Status in Brown County
Out of a total of 2,066 households in Brown County, 1,168 (56.5%) are family households, while 898 (43.5%) are nonfamily households. The most numerous type of family households are 2-person households, comprising 633, and the most common type of nonfamily households are 1-person households, comprising 765.
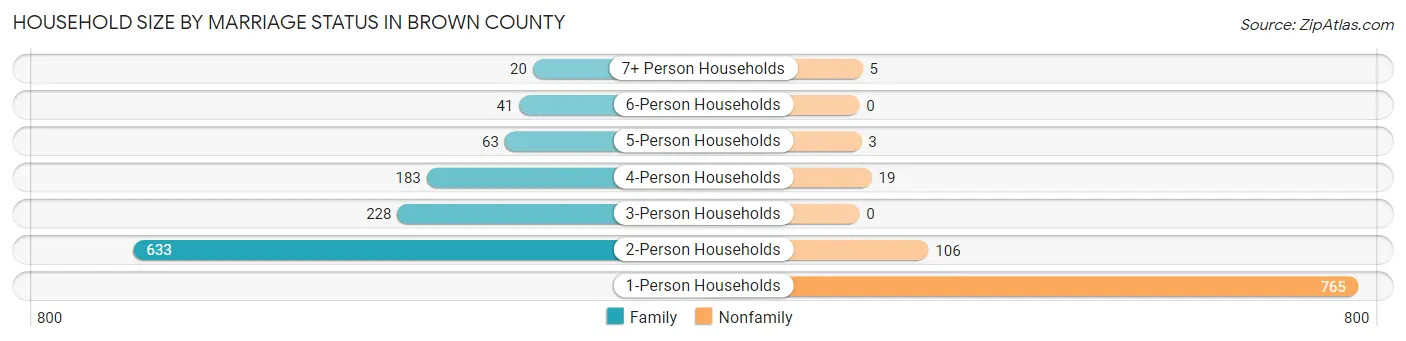
| Household Size | Family Households | Nonfamily Households |
| 1-Person Households | - | 765 (37.0%) |
| 2-Person Households | 633 (30.6%) | 106 (5.1%) |
| 3-Person Households | 228 (11.0%) | 0 (0.0%) |
| 4-Person Households | 183 (8.9%) | 19 (0.9%) |
| 5-Person Households | 63 (3.0%) | 3 (0.2%) |
| 6-Person Households | 41 (2.0%) | 0 (0.0%) |
| 7+ Person Households | 20 (1.0%) | 5 (0.2%) |
| Total | 1,168 (56.5%) | 898 (43.5%) |
Female Fertility in Brown County
Fertility by Age in Brown County
Average fertility rate in Brown County is 117.0 births per 1,000 women. Women in the age bracket of 20 to 34 years have the highest fertility rate with 282.0 births per 1,000 women. Women in the age bracket of 20 to 34 years acount for 94.9% of all women with births.
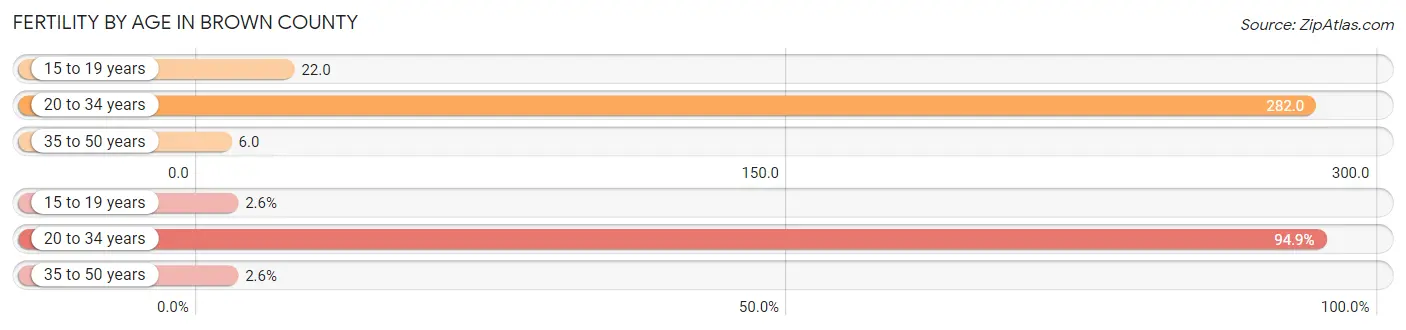
| Age Bracket | Women with Births | Births / 1,000 Women |
| 15 to 19 years | 3 (2.6%) | 22.0 |
| 20 to 34 years | 111 (94.9%) | 282.0 |
| 35 to 50 years | 3 (2.6%) | 6.0 |
| Total | 117 (100.0%) | 117.0 |
Fertility by Age by Marriage Status in Brown County
28.2% of women with births (117) in Brown County are married. The highest percentage of unmarried women with births falls into 15 to 19 years age bracket with 100.0% of them unmarried at the time of birth, while the lowest percentage of unmarried women with births belong to 35 to 50 years age bracket with 0.0% of them unmarried.
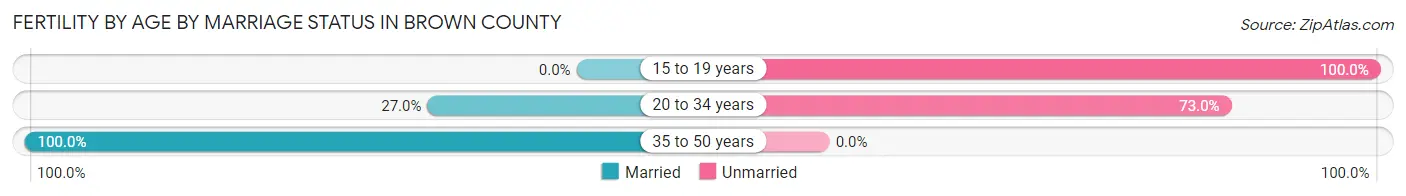
| Age Bracket | Married | Unmarried |
| 15 to 19 years | 0 (0.0%) | 3 (100.0%) |
| 20 to 34 years | 30 (27.0%) | 81 (73.0%) |
| 35 to 50 years | 3 (100.0%) | 0 (0.0%) |
| Total | 33 (28.2%) | 84 (71.8%) |
Fertility by Education in Brown County
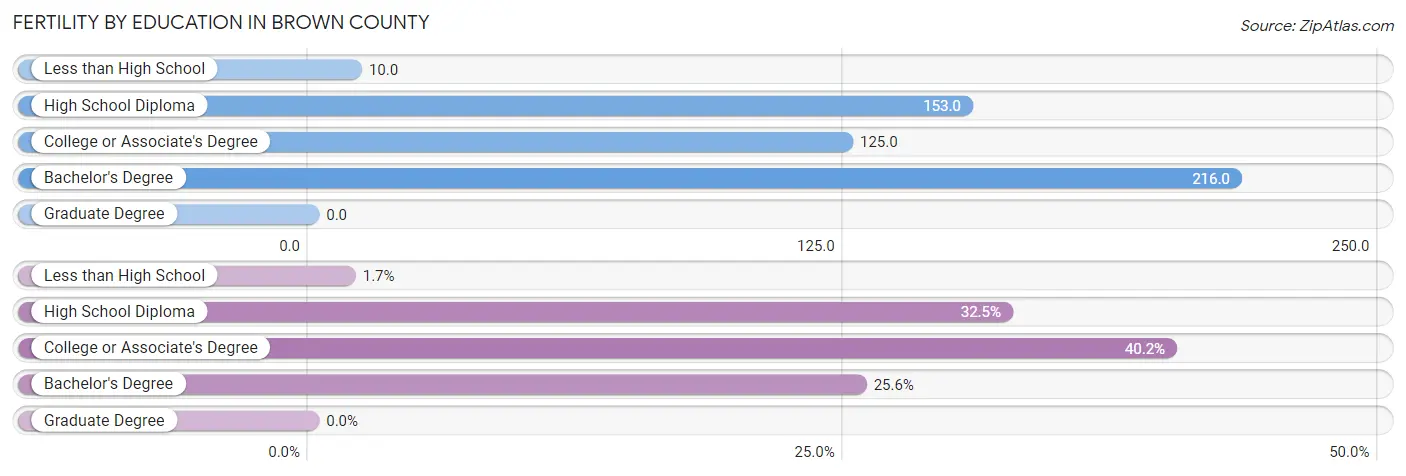
| Educational Attainment | Women with Births | Births / 1,000 Women |
| Less than High School | 2 (1.7%) | 10.0 |
| High School Diploma | 38 (32.5%) | 153.0 |
| College or Associate's Degree | 47 (40.2%) | 125.0 |
| Bachelor's Degree | 30 (25.6%) | 216.0 |
| Graduate Degree | 0 (0.0%) | 0.0 |
| Total | 117 (100.0%) | 117.0 |
Fertility by Education by Marriage Status in Brown County
71.8% of women with births in Brown County are unmarried. Women with the educational attainment of bachelor's degree are most likely to be married with 66.7% of them married at childbirth, while women with the educational attainment of less than high school are least likely to be married with 100.0% of them unmarried at childbirth.
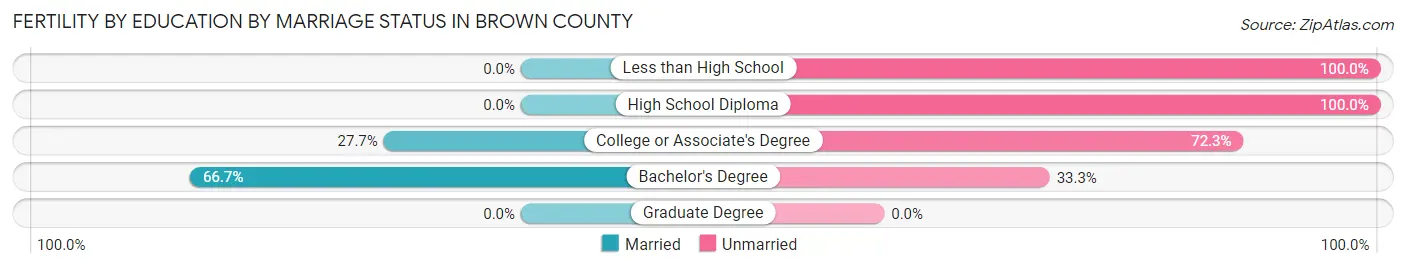
| Educational Attainment | Married | Unmarried |
| Less than High School | 0 (0.0%) | 2 (100.0%) |
| High School Diploma | 0 (0.0%) | 38 (100.0%) |
| College or Associate's Degree | 13 (27.7%) | 34 (72.3%) |
| Bachelor's Degree | 20 (66.7%) | 10 (33.3%) |
| Graduate Degree | 0 (0.0%) | 0 (0.0%) |
| Total | 33 (28.2%) | 84 (71.8%) |
Employment Characteristics in Brown County
Employment by Class of Employer in Brown County
Among the 2,368 employed individuals in Brown County, private company employees (1,537 | 64.9%), not-for-profit organizations (296 | 12.5%), and self-employed (not incorporated) (195 | 8.2%) make up the most common classes of employment.
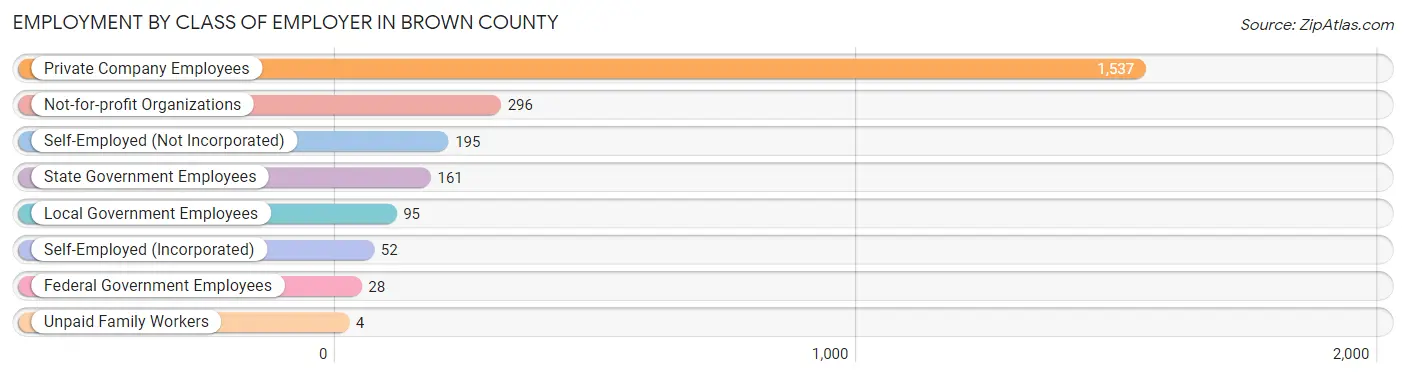
| Employer Class | # Employees | % Employees |
| Private Company Employees | 1,537 | 64.9% |
| Self-Employed (Incorporated) | 52 | 2.2% |
| Self-Employed (Not Incorporated) | 195 | 8.2% |
| Not-for-profit Organizations | 296 | 12.5% |
| Local Government Employees | 95 | 4.0% |
| State Government Employees | 161 | 6.8% |
| Federal Government Employees | 28 | 1.2% |
| Unpaid Family Workers | 4 | 0.2% |
| Total | 2,368 | 100.0% |
Employment Status by Age in Brown County
According to the labor force statistics for Brown County, out of the total population over 16 years of age (5,389), 45.8% or 2,468 individuals are in the labor force, with 2.1% or 52 of them unemployed. The age group with the highest labor force participation rate is 55 to 59 years, with 61.7% or 254 individuals in the labor force. Within the labor force, the 20 to 24 years age range has the highest percentage of unemployed individuals, with 8.2% or 25 of them being unemployed.
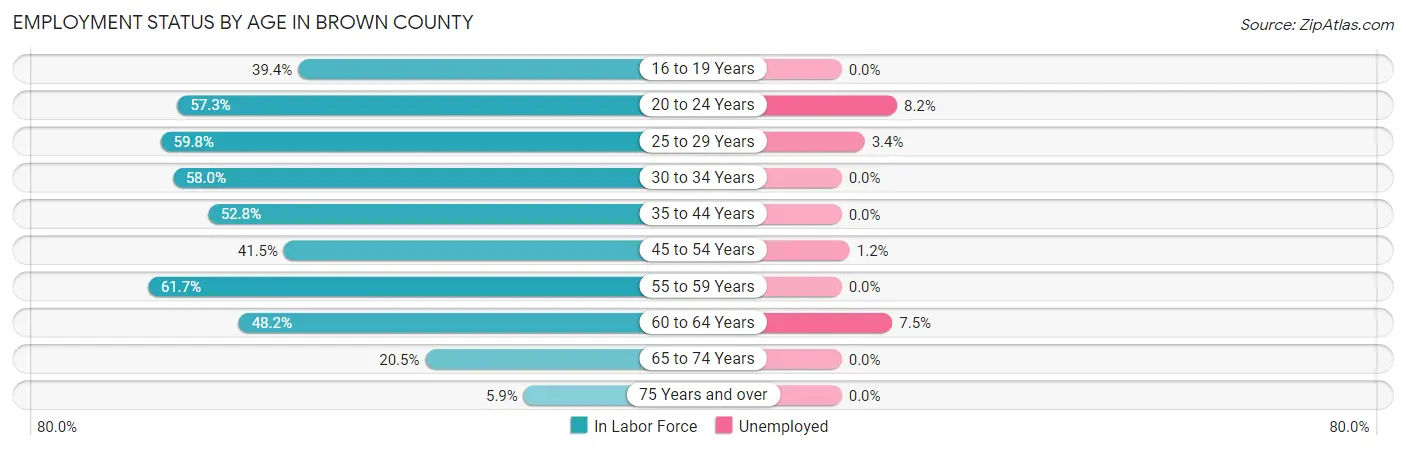
| Age Bracket | In Labor Force | Unemployed |
| 16 to 19 Years | 99 (39.4%) | 0 (0.0%) |
| 20 to 24 Years | 306 (57.3%) | 25 (8.2%) |
| 25 to 29 Years | 321 (59.8%) | 11 (3.4%) |
| 30 to 34 Years | 308 (58.0%) | 0 (0.0%) |
| 35 to 44 Years | 560 (52.8%) | 0 (0.0%) |
| 45 to 54 Years | 328 (41.5%) | 4 (1.2%) |
| 55 to 59 Years | 254 (61.7%) | 0 (0.0%) |
| 60 to 64 Years | 161 (48.2%) | 12 (7.5%) |
| 65 to 74 Years | 109 (20.5%) | 0 (0.0%) |
| 75 Years and over | 24 (5.9%) | 0 (0.0%) |
| Total | 2,468 (45.8%) | 52 (2.1%) |
Employment Status by Educational Attainment in Brown County
According to labor force statistics for Brown County, 52.7% of individuals (1,931) out of the total population between 25 and 64 years of age (3,664) are in the labor force, with 1.4% or 27 of them being unemployed. The group with the highest labor force participation rate are those with the educational attainment of bachelor's degree or higher, with 86.9% or 438 individuals in the labor force. Within the labor force, individuals with high school diploma education have the highest percentage of unemployment, with 3.2% or 25 of them being unemployed.
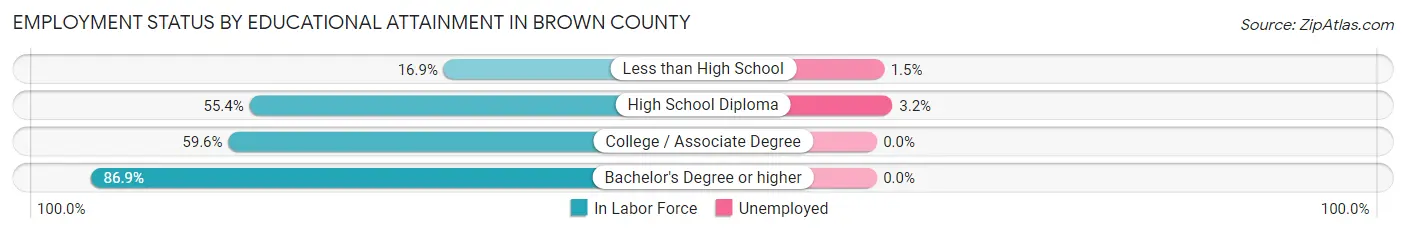
| Educational Attainment | In Labor Force | Unemployed |
| Less than High School | 130 (16.9%) | 12 (1.5%) |
| High School Diploma | 792 (55.4%) | 46 (3.2%) |
| College / Associate Degree | 572 (59.6%) | 0 (0.0%) |
| Bachelor's Degree or higher | 438 (86.9%) | 0 (0.0%) |
| Total | 1,931 (52.7%) | 51 (1.4%) |
Employment Occupations by Sex in Brown County
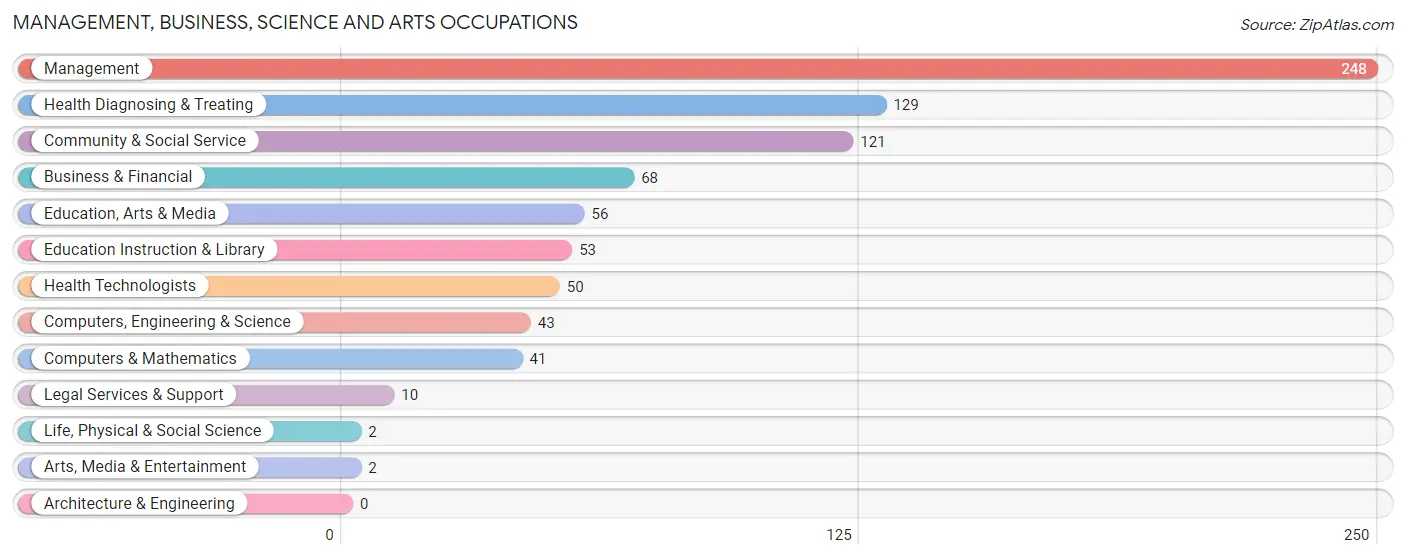
Management, Business, Science and Arts Occupations
The most common Management, Business, Science and Arts occupations in Brown County are Management (248 | 10.3%), Health Diagnosing & Treating (129 | 5.3%), Community & Social Service (121 | 5.0%), Business & Financial (68 | 2.8%), and Education, Arts & Media (56 | 2.3%).
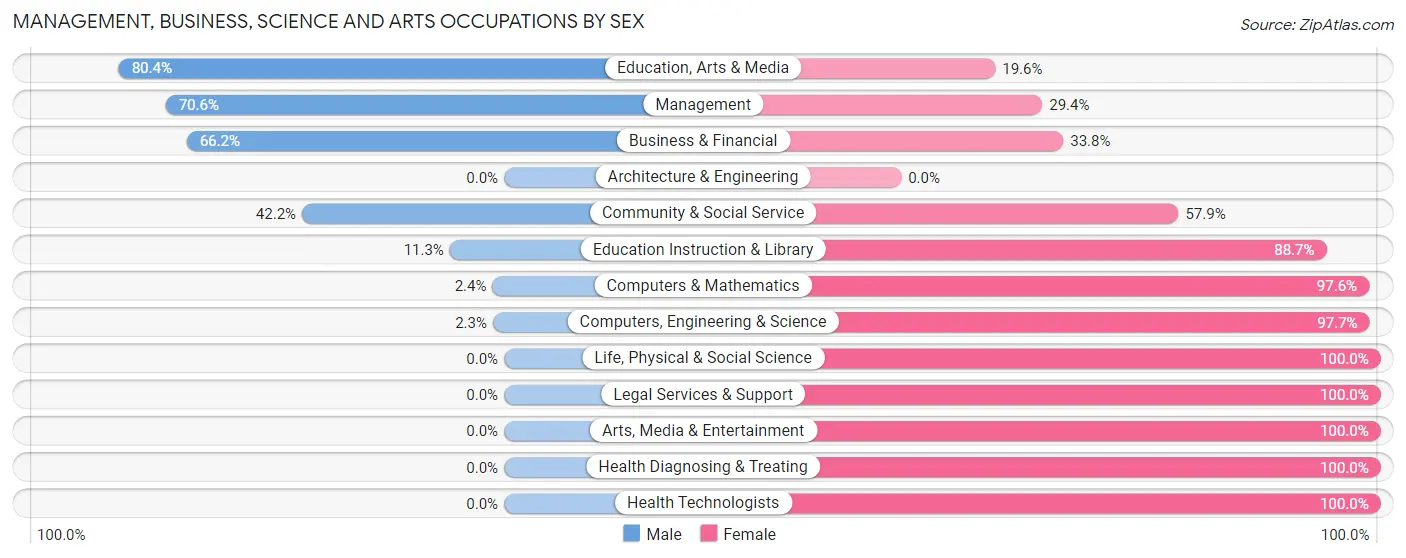
Management, Business, Science and Arts Occupations by Sex
Within the Management, Business, Science and Arts occupations in Brown County, the most male-oriented occupations are Education, Arts & Media (80.4%), Management (70.6%), and Business & Financial (66.2%), while the most female-oriented occupations are Life, Physical & Social Science (100.0%), Legal Services & Support (100.0%), and Arts, Media & Entertainment (100.0%).
| Occupation | Male | Female |
| Management | 175 (70.6%) | 73 (29.4%) |
| Business & Financial | 45 (66.2%) | 23 (33.8%) |
| Computers, Engineering & Science | 1 (2.3%) | 42 (97.7%) |
| Computers & Mathematics | 1 (2.4%) | 40 (97.6%) |
| Architecture & Engineering | 0 (0.0%) | 0 (0.0%) |
| Life, Physical & Social Science | 0 (0.0%) | 2 (100.0%) |
| Community & Social Service | 51 (42.1%) | 70 (57.9%) |
| Education, Arts & Media | 45 (80.4%) | 11 (19.6%) |
| Legal Services & Support | 0 (0.0%) | 10 (100.0%) |
| Education Instruction & Library | 6 (11.3%) | 47 (88.7%) |
| Arts, Media & Entertainment | 0 (0.0%) | 2 (100.0%) |
| Health Diagnosing & Treating | 0 (0.0%) | 129 (100.0%) |
| Health Technologists | 0 (0.0%) | 50 (100.0%) |
| Total (Category) | 272 (44.7%) | 337 (55.3%) |
| Total (Overall) | 1,267 (52.4%) | 1,151 (47.6%) |
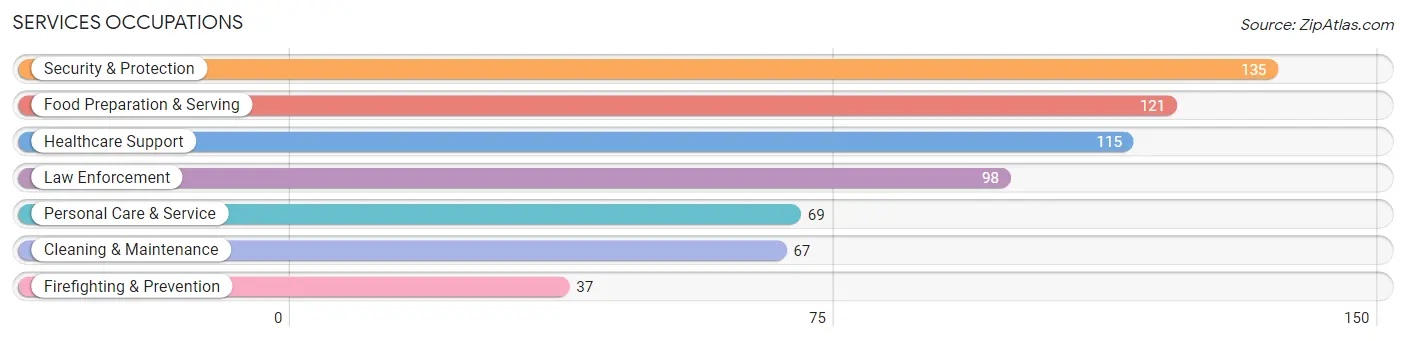
Services Occupations
The most common Services occupations in Brown County are Security & Protection (135 | 5.6%), Food Preparation & Serving (121 | 5.0%), Healthcare Support (115 | 4.8%), Law Enforcement (98 | 4.1%), and Personal Care & Service (69 | 2.9%).
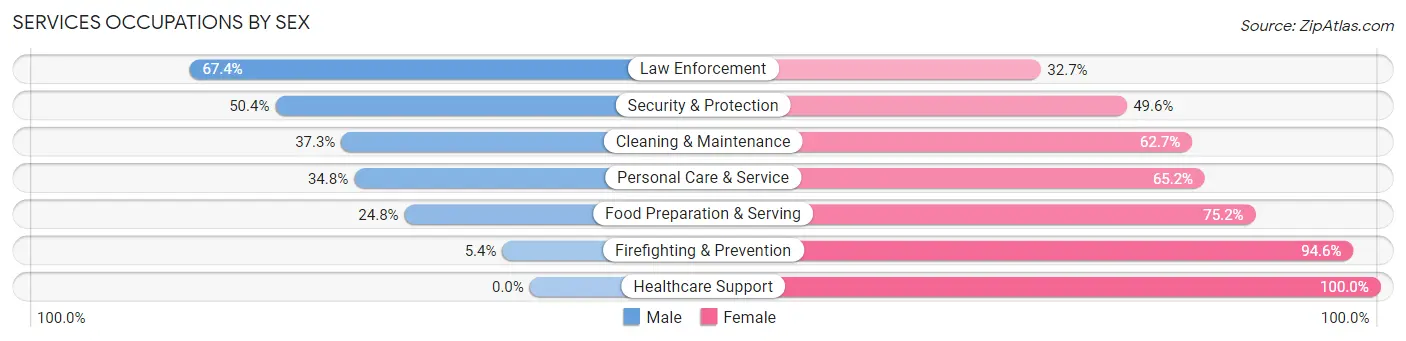
Services Occupations by Sex
Within the Services occupations in Brown County, the most male-oriented occupations are Law Enforcement (67.3%), Security & Protection (50.4%), and Cleaning & Maintenance (37.3%), while the most female-oriented occupations are Healthcare Support (100.0%), Firefighting & Prevention (94.6%), and Food Preparation & Serving (75.2%).
| Occupation | Male | Female |
| Healthcare Support | 0 (0.0%) | 115 (100.0%) |
| Security & Protection | 68 (50.4%) | 67 (49.6%) |
| Firefighting & Prevention | 2 (5.4%) | 35 (94.6%) |
| Law Enforcement | 66 (67.3%) | 32 (32.7%) |
| Food Preparation & Serving | 30 (24.8%) | 91 (75.2%) |
| Cleaning & Maintenance | 25 (37.3%) | 42 (62.7%) |
| Personal Care & Service | 24 (34.8%) | 45 (65.2%) |
| Total (Category) | 147 (29.0%) | 360 (71.0%) |
| Total (Overall) | 1,267 (52.4%) | 1,151 (47.6%) |
Sales and Office Occupations
The most common Sales and Office occupations in Brown County are Office & Administration (328 | 13.6%), and Sales & Related (197 | 8.2%).
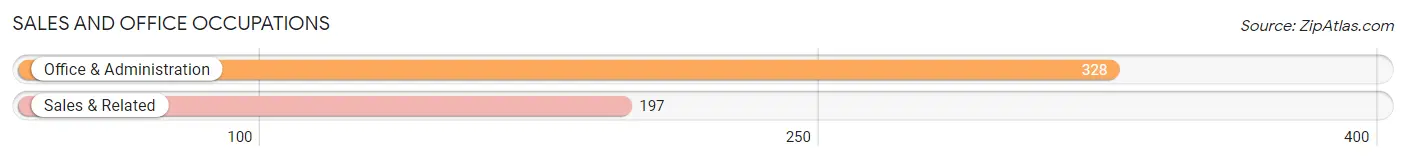
Sales and Office Occupations by Sex
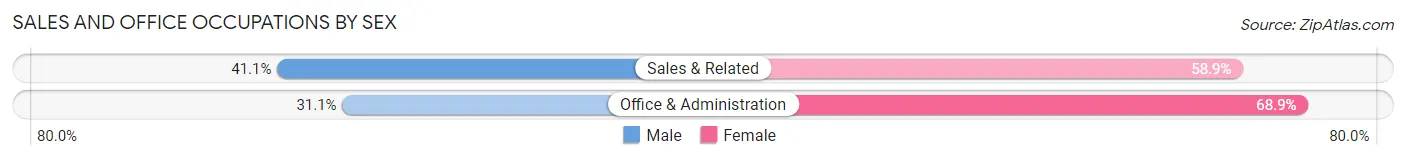
| Occupation | Male | Female |
| Sales & Related | 81 (41.1%) | 116 (58.9%) |
| Office & Administration | 102 (31.1%) | 226 (68.9%) |
| Total (Category) | 183 (34.9%) | 342 (65.1%) |
| Total (Overall) | 1,267 (52.4%) | 1,151 (47.6%) |
Natural Resources, Construction and Maintenance Occupations
The most common Natural Resources, Construction and Maintenance occupations in Brown County are Construction & Extraction (136 | 5.6%), Installation, Maintenance & Repair (107 | 4.4%), and Farming, Fishing & Forestry (83 | 3.4%).
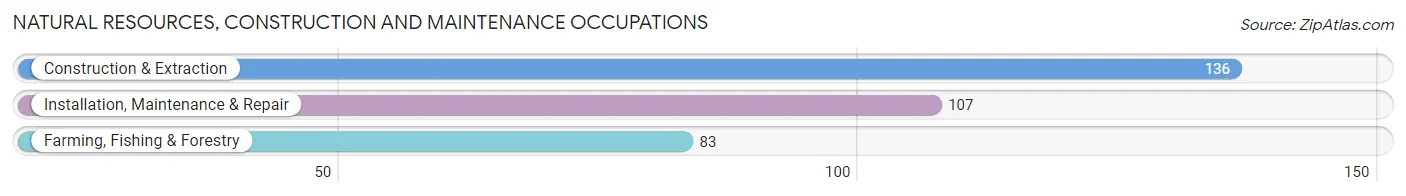
Natural Resources, Construction and Maintenance Occupations by Sex
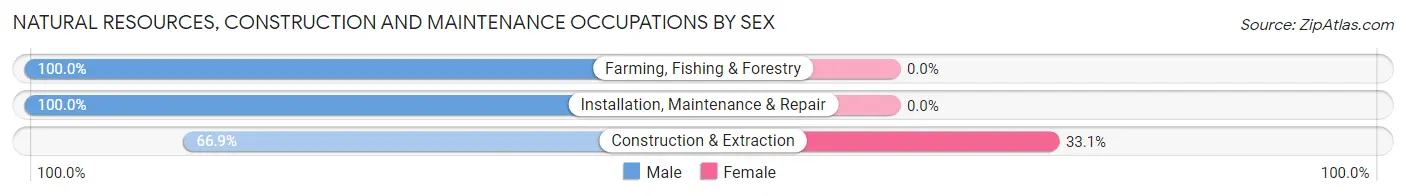
| Occupation | Male | Female |
| Farming, Fishing & Forestry | 83 (100.0%) | 0 (0.0%) |
| Construction & Extraction | 91 (66.9%) | 45 (33.1%) |
| Installation, Maintenance & Repair | 107 (100.0%) | 0 (0.0%) |
| Total (Category) | 281 (86.2%) | 45 (13.8%) |
| Total (Overall) | 1,267 (52.4%) | 1,151 (47.6%) |
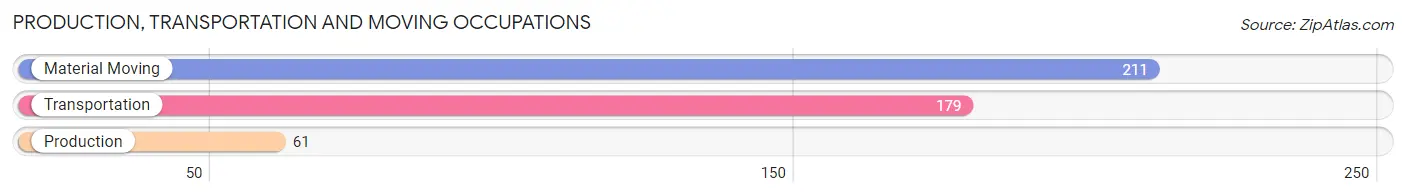
Production, Transportation and Moving Occupations
The most common Production, Transportation and Moving occupations in Brown County are Material Moving (211 | 8.7%), Transportation (179 | 7.4%), and Production (61 | 2.5%).
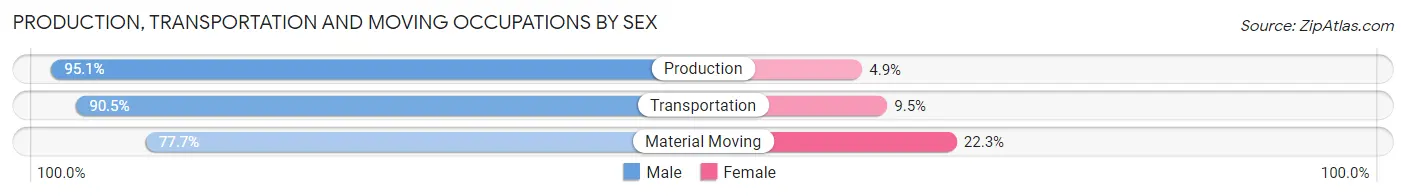
Production, Transportation and Moving Occupations by Sex
| Occupation | Male | Female |
| Production | 58 (95.1%) | 3 (4.9%) |
| Transportation | 162 (90.5%) | 17 (9.5%) |
| Material Moving | 164 (77.7%) | 47 (22.3%) |
| Total (Category) | 384 (85.1%) | 67 (14.9%) |
| Total (Overall) | 1,267 (52.4%) | 1,151 (47.6%) |
Employment Industries by Sex in Brown County
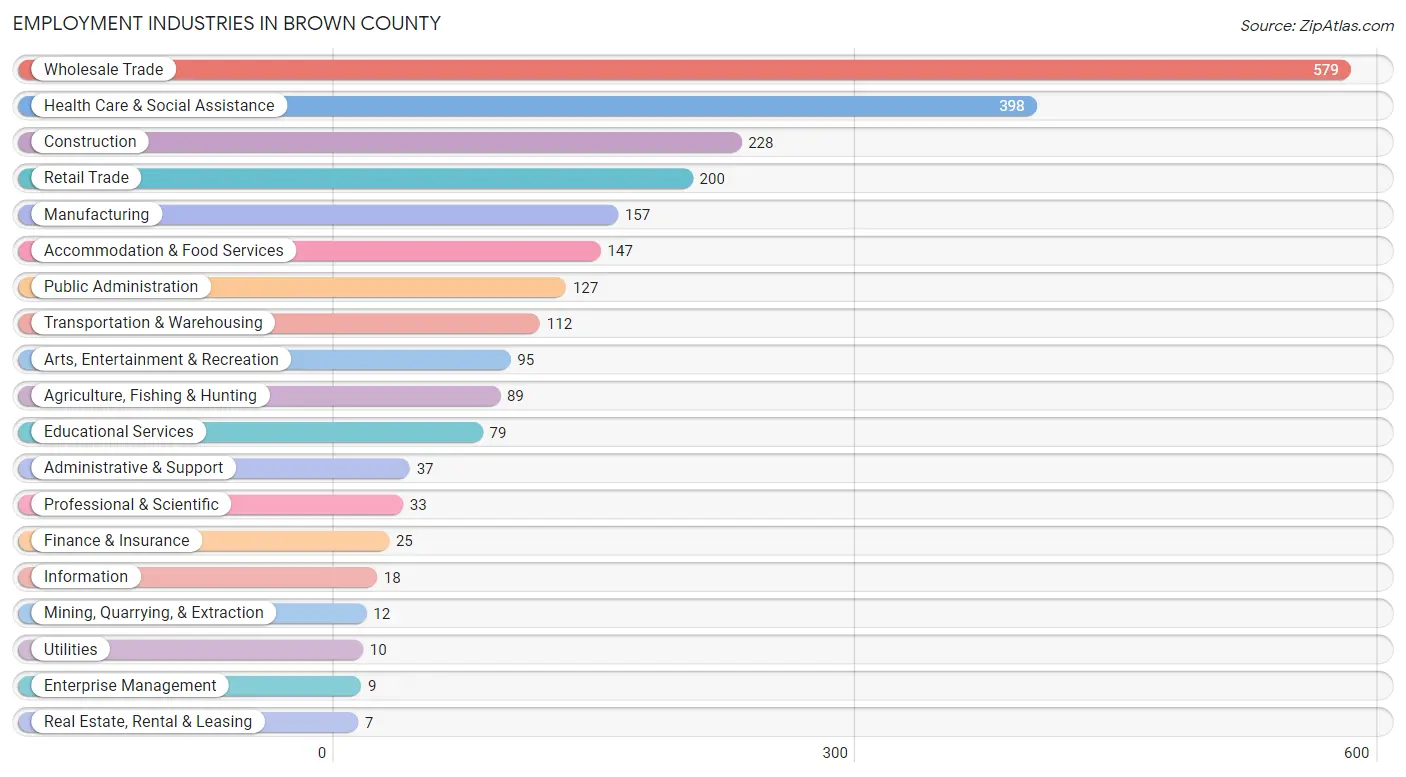
Employment Industries in Brown County
The major employment industries in Brown County include Wholesale Trade (579 | 23.9%), Health Care & Social Assistance (398 | 16.5%), Construction (228 | 9.4%), Retail Trade (200 | 8.3%), and Manufacturing (157 | 6.5%).
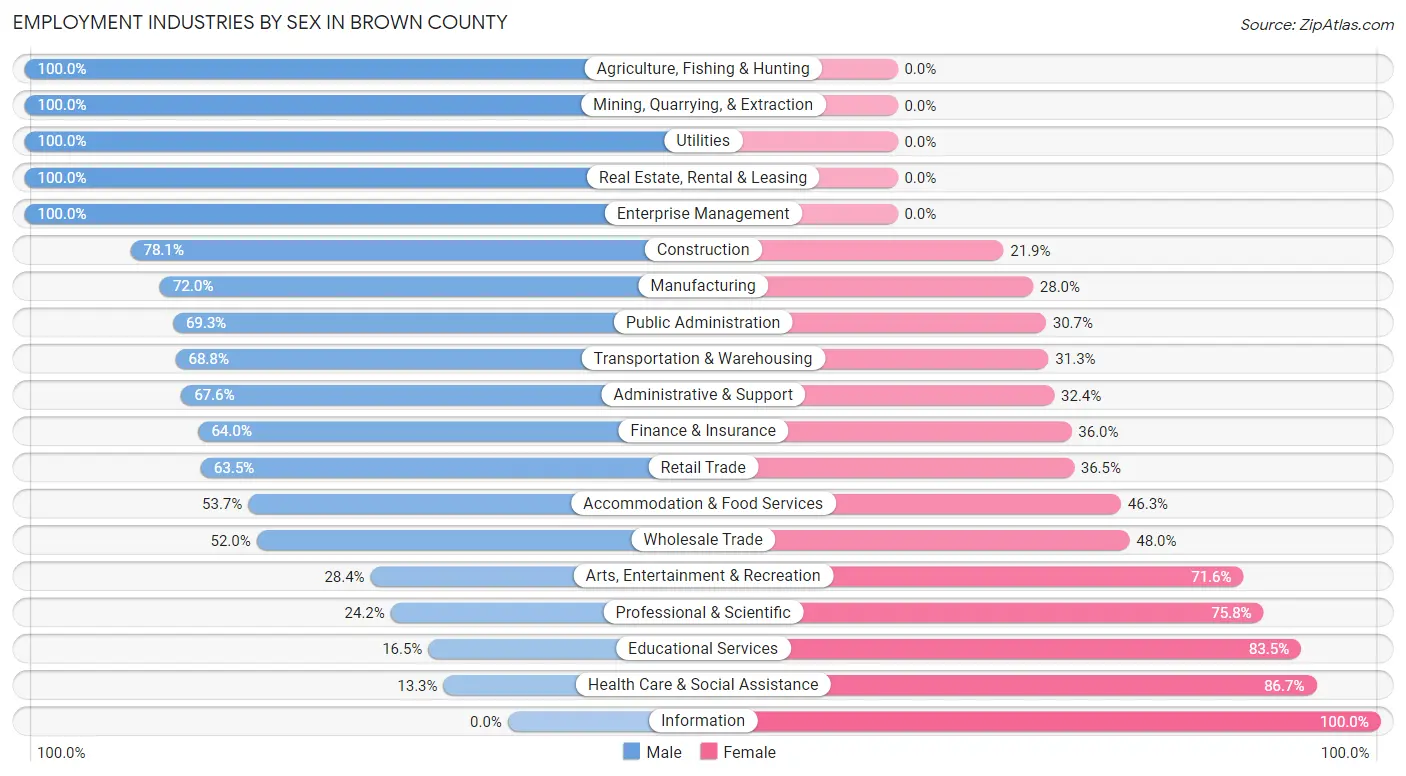
Employment Industries by Sex in Brown County
The Brown County industries that see more men than women are Agriculture, Fishing & Hunting (100.0%), Mining, Quarrying, & Extraction (100.0%), and Utilities (100.0%), whereas the industries that tend to have a higher number of women are Information (100.0%), Health Care & Social Assistance (86.7%), and Educational Services (83.5%).
| Industry | Male | Female |
| Agriculture, Fishing & Hunting | 89 (100.0%) | 0 (0.0%) |
| Mining, Quarrying, & Extraction | 12 (100.0%) | 0 (0.0%) |
| Construction | 178 (78.1%) | 50 (21.9%) |
| Manufacturing | 113 (72.0%) | 44 (28.0%) |
| Wholesale Trade | 301 (52.0%) | 278 (48.0%) |
| Retail Trade | 127 (63.5%) | 73 (36.5%) |
| Transportation & Warehousing | 77 (68.8%) | 35 (31.2%) |
| Utilities | 10 (100.0%) | 0 (0.0%) |
| Information | 0 (0.0%) | 18 (100.0%) |
| Finance & Insurance | 16 (64.0%) | 9 (36.0%) |
| Real Estate, Rental & Leasing | 7 (100.0%) | 0 (0.0%) |
| Professional & Scientific | 8 (24.2%) | 25 (75.8%) |
| Enterprise Management | 9 (100.0%) | 0 (0.0%) |
| Administrative & Support | 25 (67.6%) | 12 (32.4%) |
| Educational Services | 13 (16.5%) | 66 (83.5%) |
| Health Care & Social Assistance | 53 (13.3%) | 345 (86.7%) |
| Arts, Entertainment & Recreation | 27 (28.4%) | 68 (71.6%) |
| Accommodation & Food Services | 79 (53.7%) | 68 (46.3%) |
| Public Administration | 88 (69.3%) | 39 (30.7%) |
| Total | 1,267 (52.4%) | 1,151 (47.6%) |
Education in Brown County
School Enrollment in Brown County
The most common levels of schooling among the 1,095 students in Brown County are high school (286 | 26.1%), elementary school (269 | 24.6%), and middle school (242 | 22.1%).
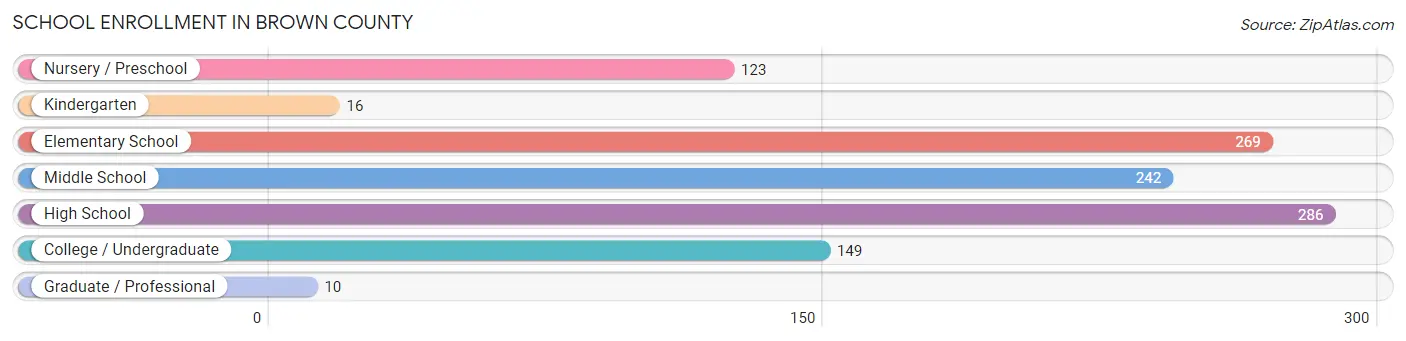
| School Level | # Students | % Students |
| Nursery / Preschool | 123 | 11.2% |
| Kindergarten | 16 | 1.5% |
| Elementary School | 269 | 24.6% |
| Middle School | 242 | 22.1% |
| High School | 286 | 26.1% |
| College / Undergraduate | 149 | 13.6% |
| Graduate / Professional | 10 | 0.9% |
| Total | 1,095 | 100.0% |
School Enrollment by Age by Funding Source in Brown County
Out of a total of 1,095 students who are enrolled in schools in Brown County, 185 (16.9%) attend a private institution, while the remaining 910 (83.1%) are enrolled in public schools. The age group of 20 to 24 year olds has the highest likelihood of being enrolled in private schools, with 32 (42.7% in the age bracket) enrolled. Conversely, the age group of 15 to 17 year olds has the lowest likelihood of being enrolled in a private school, with 177 (100.0% in the age bracket) attending a public institution.
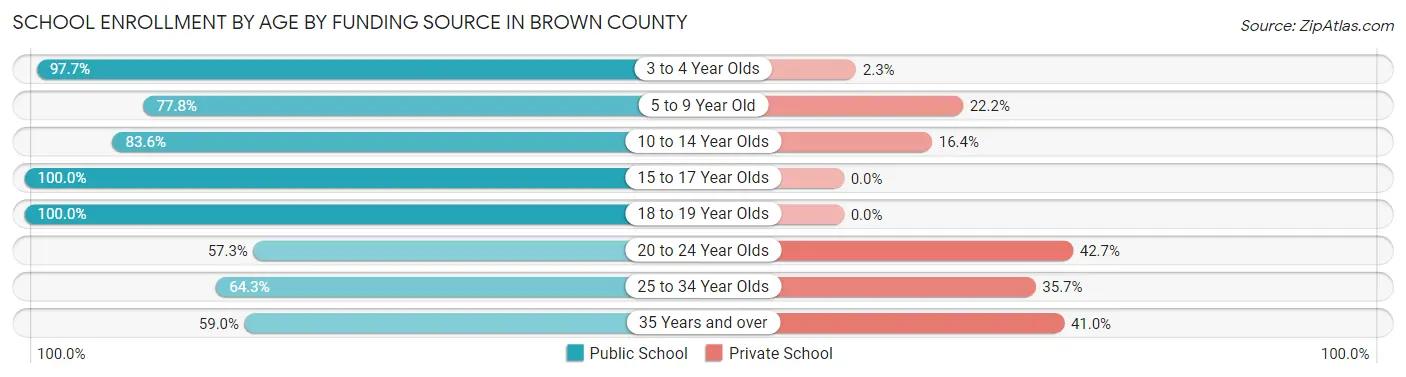
| Age Bracket | Public School | Private School |
| 3 to 4 Year Olds | 86 (97.7%) | 2 (2.3%) |
| 5 to 9 Year Old | 214 (77.8%) | 61 (22.2%) |
| 10 to 14 Year Olds | 275 (83.6%) | 54 (16.4%) |
| 15 to 17 Year Olds | 177 (100.0%) | 0 (0.0%) |
| 18 to 19 Year Olds | 56 (100.0%) | 0 (0.0%) |
| 20 to 24 Year Olds | 43 (57.3%) | 32 (42.7%) |
| 25 to 34 Year Olds | 36 (64.3%) | 20 (35.7%) |
| 35 Years and over | 23 (59.0%) | 16 (41.0%) |
| Total | 910 (83.1%) | 185 (16.9%) |
Educational Attainment by Field of Study in Brown County
Business (162 | 23.3%), education (98 | 14.1%), bio, nature & agricultural (94 | 13.5%), social sciences (90 | 13.0%), and arts & humanities (77 | 11.1%) are the most common fields of study among 694 individuals in Brown County who have obtained a bachelor's degree or higher.
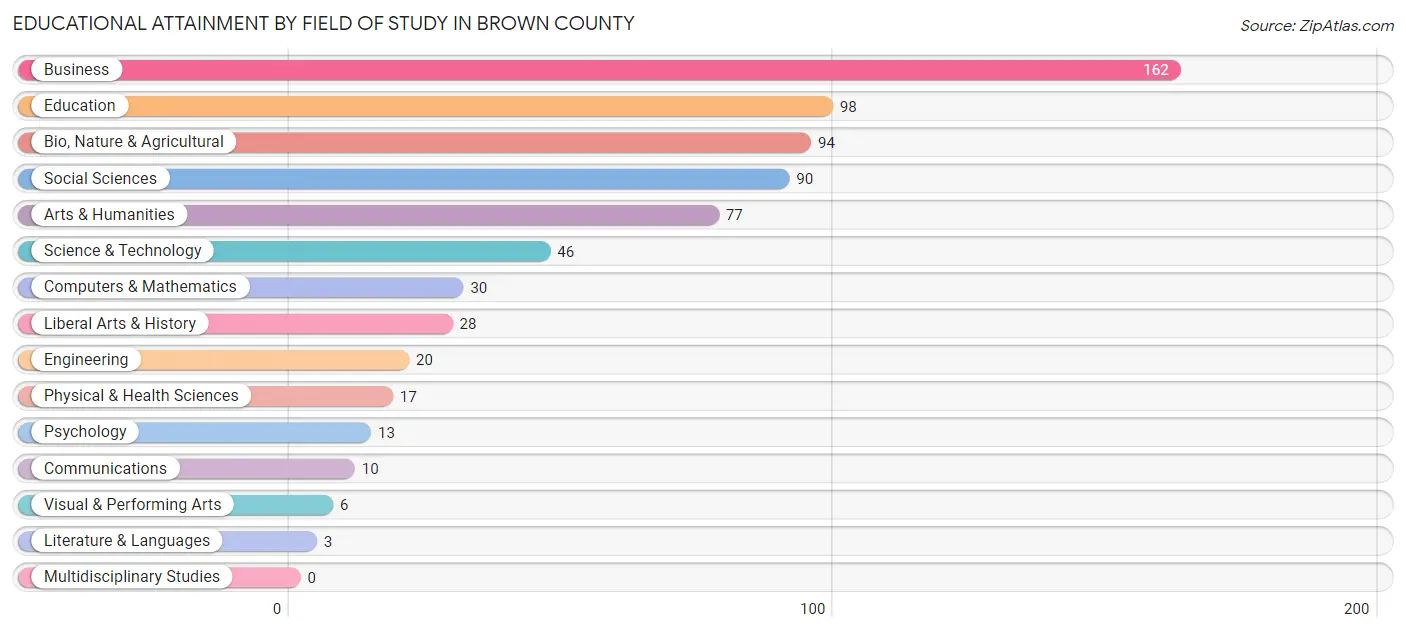
| Field of Study | # Graduates | % Graduates |
| Computers & Mathematics | 30 | 4.3% |
| Bio, Nature & Agricultural | 94 | 13.5% |
| Physical & Health Sciences | 17 | 2.5% |
| Psychology | 13 | 1.9% |
| Social Sciences | 90 | 13.0% |
| Engineering | 20 | 2.9% |
| Multidisciplinary Studies | 0 | 0.0% |
| Science & Technology | 46 | 6.6% |
| Business | 162 | 23.3% |
| Education | 98 | 14.1% |
| Literature & Languages | 3 | 0.4% |
| Liberal Arts & History | 28 | 4.0% |
| Visual & Performing Arts | 6 | 0.9% |
| Communications | 10 | 1.4% |
| Arts & Humanities | 77 | 11.1% |
| Total | 694 | 100.0% |
Transportation & Commute in Brown County
Vehicle Availability by Sex in Brown County
The most prevalent vehicle ownership categories in Brown County are males with 2 vehicles (478, accounting for 38.4%) and females with 2 vehicles (363, making up 42.6%).
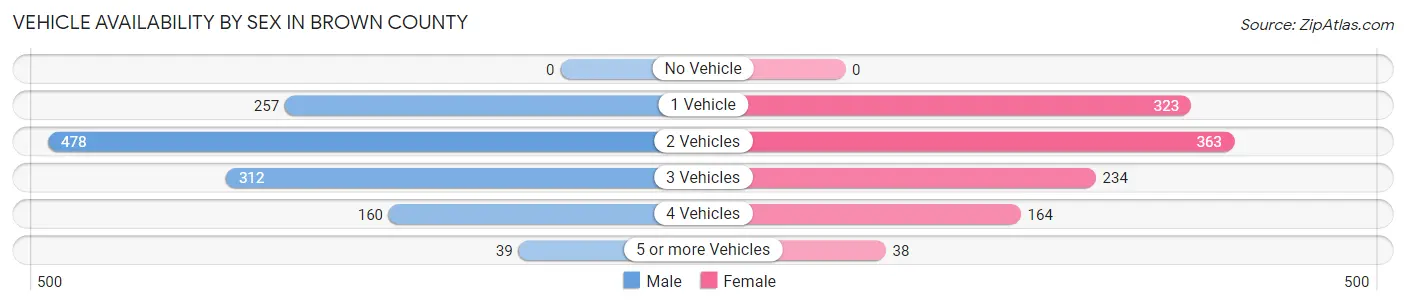
| Vehicles Available | Male | Female |
| No Vehicle | 0 (0.0%) | 0 (0.0%) |
| 1 Vehicle | 257 (20.6%) | 323 (28.8%) |
| 2 Vehicles | 478 (38.4%) | 363 (32.4%) |
| 3 Vehicles | 312 (25.0%) | 234 (20.9%) |
| 4 Vehicles | 160 (12.8%) | 164 (14.6%) |
| 5 or more Vehicles | 39 (3.1%) | 38 (3.4%) |
| Total | 1,246 (100.0%) | 1,122 (100.0%) |
Commute Time in Brown County
The most frequently occuring commute durations in Brown County are 5 to 9 minutes (579 commuters, 25.9%), 10 to 14 minutes (355 commuters, 15.9%), and less than 5 minutes (297 commuters, 13.3%).
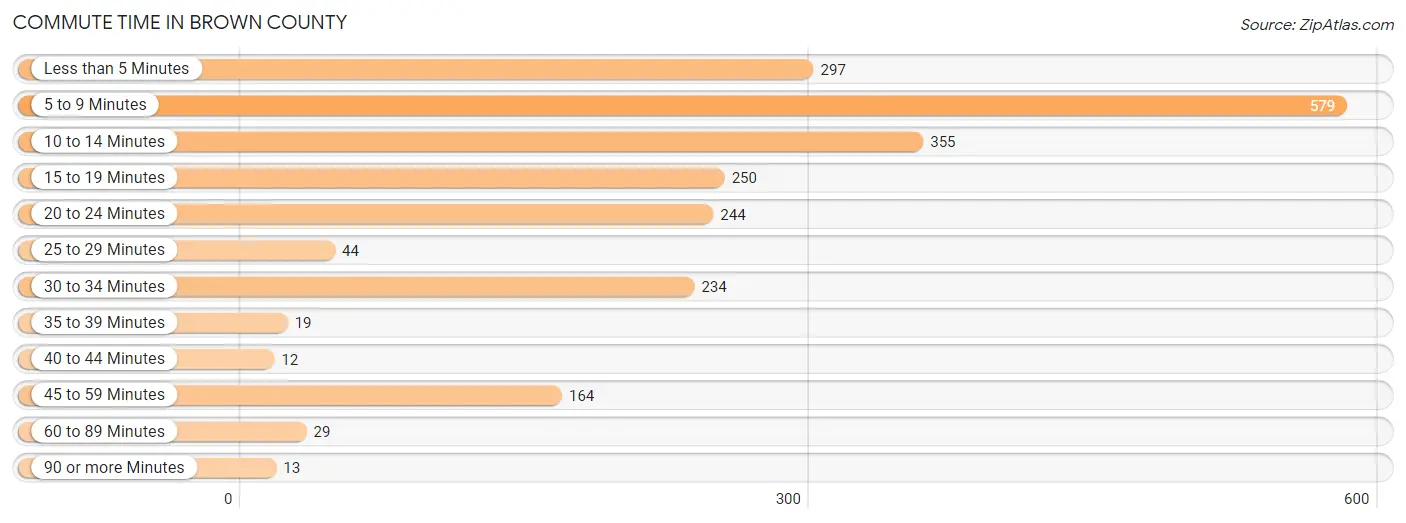
| Commute Time | # Commuters | % Commuters |
| Less than 5 Minutes | 297 | 13.3% |
| 5 to 9 Minutes | 579 | 25.9% |
| 10 to 14 Minutes | 355 | 15.9% |
| 15 to 19 Minutes | 250 | 11.2% |
| 20 to 24 Minutes | 244 | 10.9% |
| 25 to 29 Minutes | 44 | 2.0% |
| 30 to 34 Minutes | 234 | 10.4% |
| 35 to 39 Minutes | 19 | 0.9% |
| 40 to 44 Minutes | 12 | 0.5% |
| 45 to 59 Minutes | 164 | 7.3% |
| 60 to 89 Minutes | 29 | 1.3% |
| 90 or more Minutes | 13 | 0.6% |
Commute Time by Sex in Brown County
The most common commute times in Brown County are 5 to 9 minutes (350 commuters, 30.8%) for males and 5 to 9 minutes (229 commuters, 20.7%) for females.
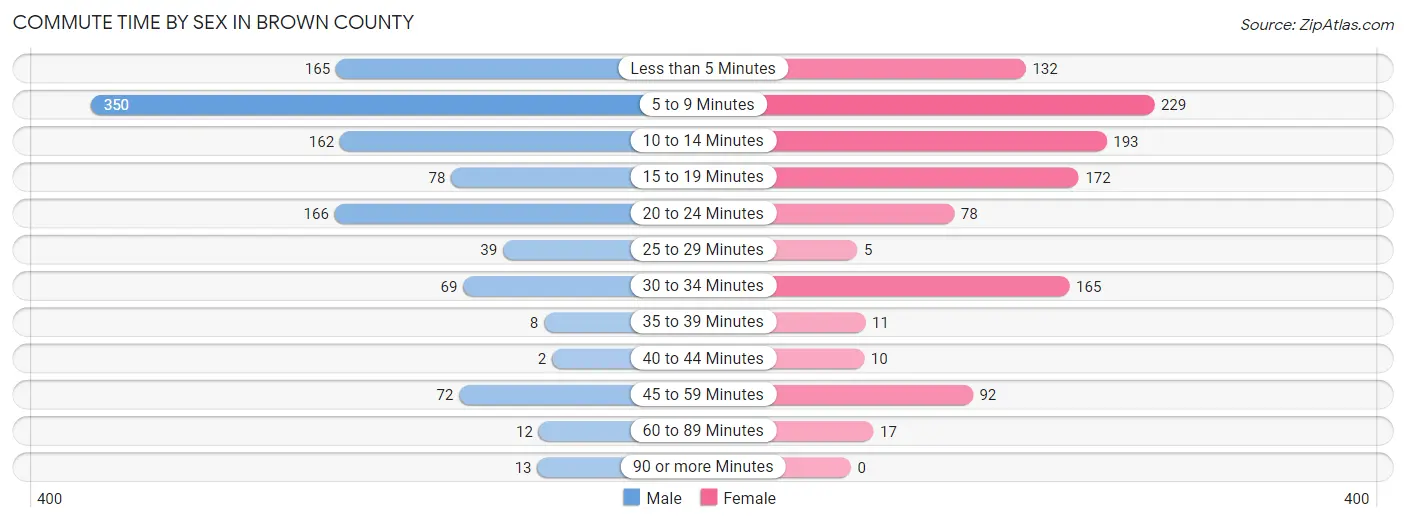
| Commute Time | Male | Female |
| Less than 5 Minutes | 165 (14.5%) | 132 (12.0%) |
| 5 to 9 Minutes | 350 (30.8%) | 229 (20.7%) |
| 10 to 14 Minutes | 162 (14.3%) | 193 (17.5%) |
| 15 to 19 Minutes | 78 (6.9%) | 172 (15.6%) |
| 20 to 24 Minutes | 166 (14.6%) | 78 (7.1%) |
| 25 to 29 Minutes | 39 (3.4%) | 5 (0.4%) |
| 30 to 34 Minutes | 69 (6.1%) | 165 (14.9%) |
| 35 to 39 Minutes | 8 (0.7%) | 11 (1.0%) |
| 40 to 44 Minutes | 2 (0.2%) | 10 (0.9%) |
| 45 to 59 Minutes | 72 (6.3%) | 92 (8.3%) |
| 60 to 89 Minutes | 12 (1.1%) | 17 (1.5%) |
| 90 or more Minutes | 13 (1.1%) | 0 (0.0%) |
Time of Departure to Work by Sex in Brown County
The most frequent times of departure to work in Brown County are 4:00 PM to 11:59 PM (292, 25.7%) for males and 7:00 AM to 7:29 AM (213, 19.3%) for females.
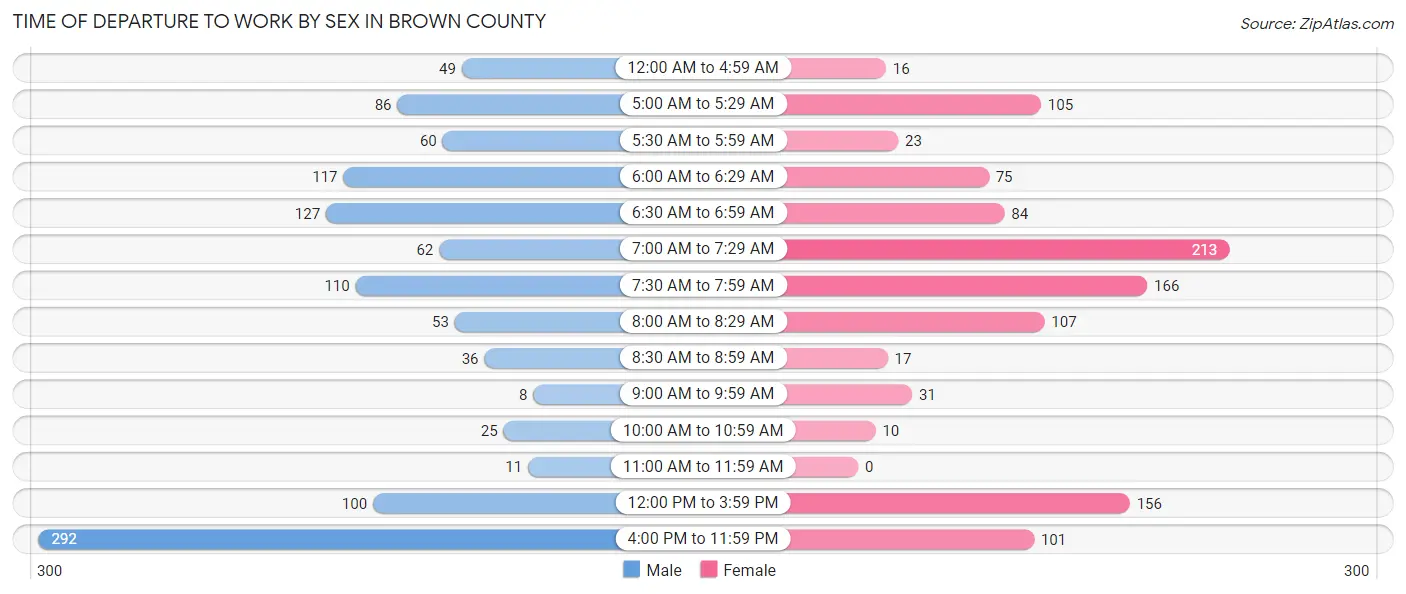
| Time of Departure | Male | Female |
| 12:00 AM to 4:59 AM | 49 (4.3%) | 16 (1.5%) |
| 5:00 AM to 5:29 AM | 86 (7.6%) | 105 (9.5%) |
| 5:30 AM to 5:59 AM | 60 (5.3%) | 23 (2.1%) |
| 6:00 AM to 6:29 AM | 117 (10.3%) | 75 (6.8%) |
| 6:30 AM to 6:59 AM | 127 (11.2%) | 84 (7.6%) |
| 7:00 AM to 7:29 AM | 62 (5.5%) | 213 (19.3%) |
| 7:30 AM to 7:59 AM | 110 (9.7%) | 166 (15.0%) |
| 8:00 AM to 8:29 AM | 53 (4.7%) | 107 (9.7%) |
| 8:30 AM to 8:59 AM | 36 (3.2%) | 17 (1.5%) |
| 9:00 AM to 9:59 AM | 8 (0.7%) | 31 (2.8%) |
| 10:00 AM to 10:59 AM | 25 (2.2%) | 10 (0.9%) |
| 11:00 AM to 11:59 AM | 11 (1.0%) | 0 (0.0%) |
| 12:00 PM to 3:59 PM | 100 (8.8%) | 156 (14.1%) |
| 4:00 PM to 11:59 PM | 292 (25.7%) | 101 (9.1%) |
| Total | 1,136 (100.0%) | 1,104 (100.0%) |
Housing Occupancy in Brown County
Occupancy by Ownership in Brown County
Of the total 2,066 dwellings in Brown County, owner-occupied units account for 1,463 (70.8%), while renter-occupied units make up 603 (29.2%).
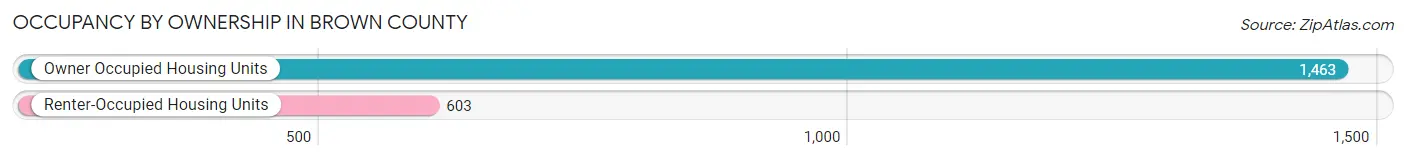
| Occupancy | # Housing Units | % Housing Units |
| Owner Occupied Housing Units | 1,463 | 70.8% |
| Renter-Occupied Housing Units | 603 | 29.2% |
| Total Occupied Housing Units | 2,066 | 100.0% |
Occupancy by Household Size in Brown County
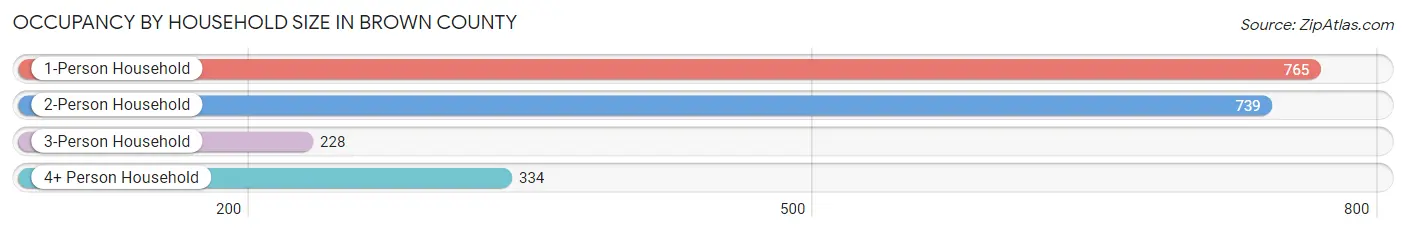
| Household Size | # Housing Units | % Housing Units |
| 1-Person Household | 765 | 37.0% |
| 2-Person Household | 739 | 35.8% |
| 3-Person Household | 228 | 11.0% |
| 4+ Person Household | 334 | 16.2% |
| Total Housing Units | 2,066 | 100.0% |
Occupancy by Ownership by Household Size in Brown County
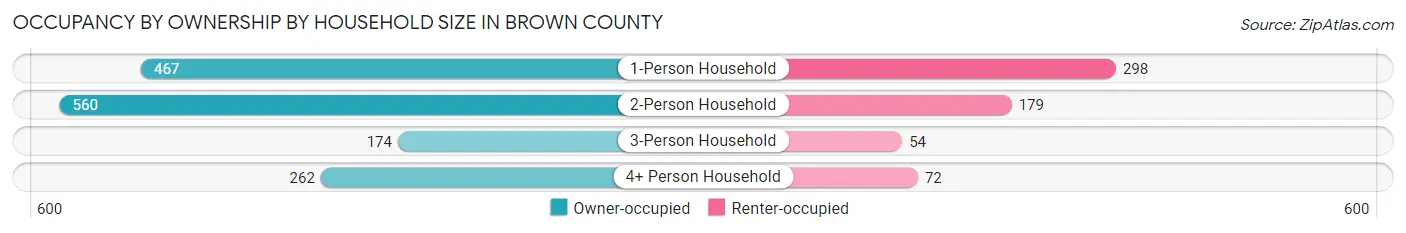
| Household Size | Owner-occupied | Renter-occupied |
| 1-Person Household | 467 (61.1%) | 298 (39.0%) |
| 2-Person Household | 560 (75.8%) | 179 (24.2%) |
| 3-Person Household | 174 (76.3%) | 54 (23.7%) |
| 4+ Person Household | 262 (78.4%) | 72 (21.6%) |
| Total Housing Units | 1,463 (70.8%) | 603 (29.2%) |
Occupancy by Educational Attainment in Brown County
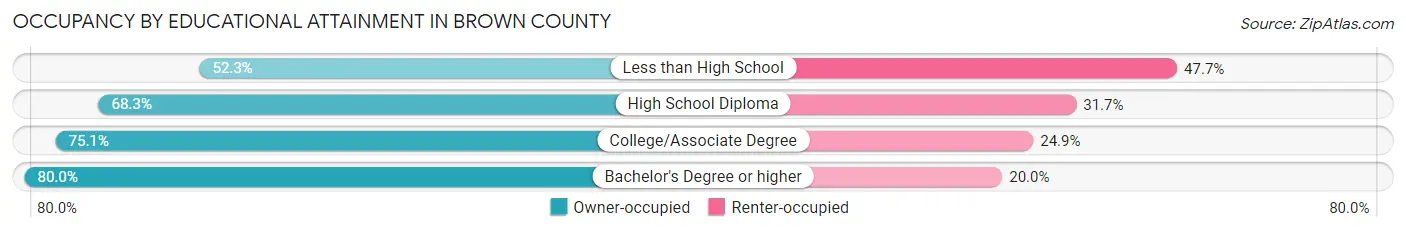
| Household Size | Owner-occupied | Renter-occupied |
| Less than High School | 127 (52.3%) | 116 (47.7%) |
| High School Diploma | 542 (68.3%) | 252 (31.7%) |
| College/Associate Degree | 446 (75.1%) | 148 (24.9%) |
| Bachelor's Degree or higher | 348 (80.0%) | 87 (20.0%) |
Occupancy by Age of Householder in Brown County
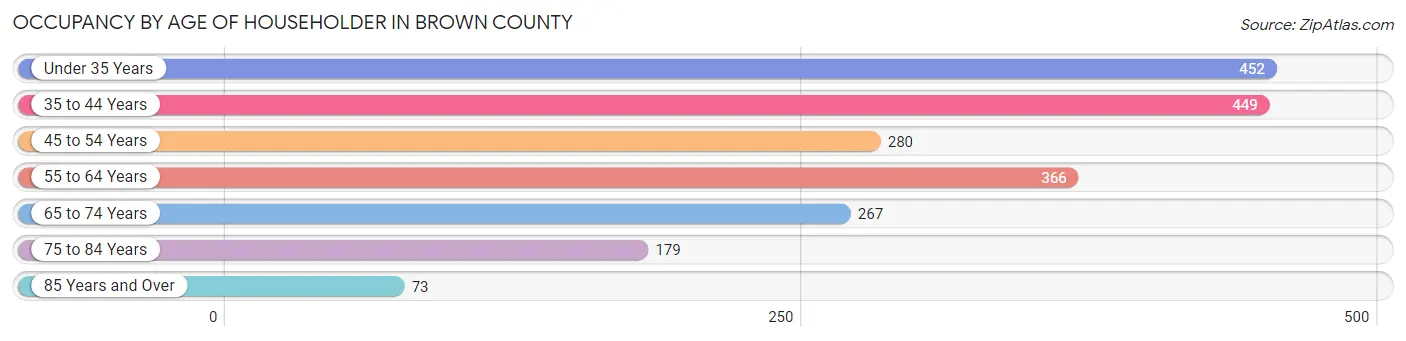
| Age Bracket | # Households | % Households |
| Under 35 Years | 452 | 21.9% |
| 35 to 44 Years | 449 | 21.7% |
| 45 to 54 Years | 280 | 13.6% |
| 55 to 64 Years | 366 | 17.7% |
| 65 to 74 Years | 267 | 12.9% |
| 75 to 84 Years | 179 | 8.7% |
| 85 Years and Over | 73 | 3.5% |
| Total | 2,066 | 100.0% |
Housing Finances in Brown County
Median Income by Occupancy in Brown County
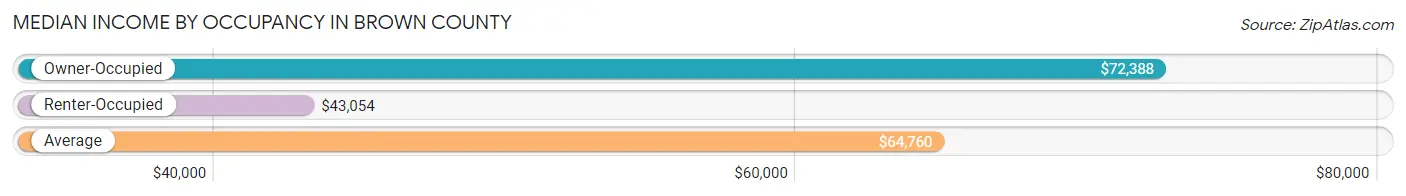
| Occupancy Type | # Households | Median Income |
| Owner-Occupied | 1,463 (70.8%) | $72,388 |
| Renter-Occupied | 603 (29.2%) | $43,054 |
| Average | 2,066 (100.0%) | $64,760 |
Occupancy by Householder Income Bracket in Brown County
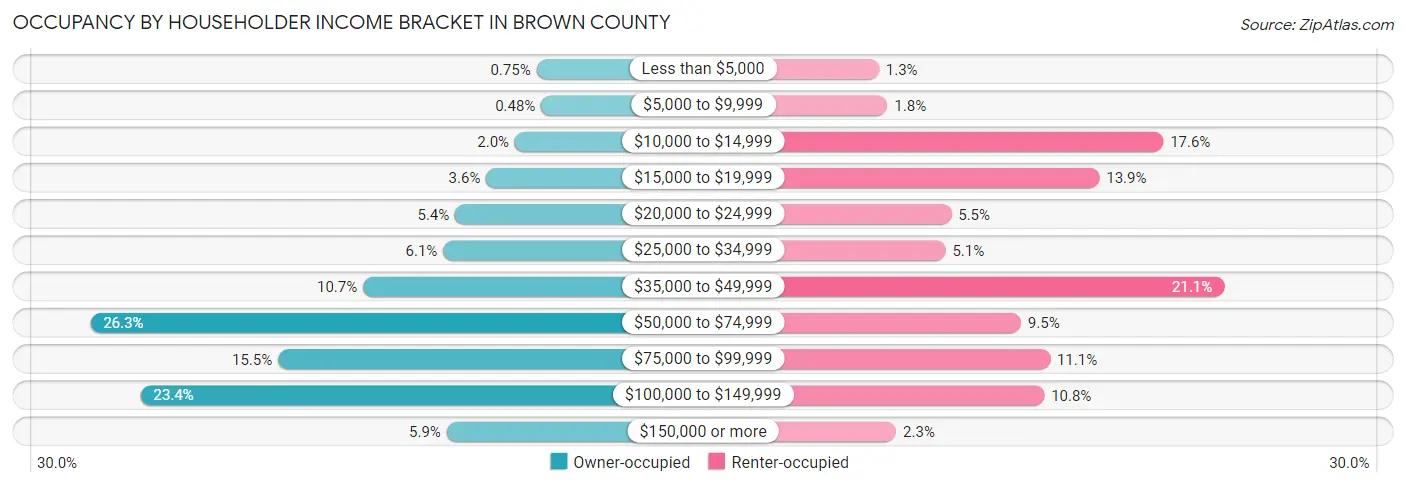
| Income Bracket | Owner-occupied | Renter-occupied |
| Less than $5,000 | 11 (0.7%) | 8 (1.3%) |
| $5,000 to $9,999 | 7 (0.5%) | 11 (1.8%) |
| $10,000 to $14,999 | 29 (2.0%) | 106 (17.6%) |
| $15,000 to $19,999 | 53 (3.6%) | 84 (13.9%) |
| $20,000 to $24,999 | 79 (5.4%) | 33 (5.5%) |
| $25,000 to $34,999 | 89 (6.1%) | 31 (5.1%) |
| $35,000 to $49,999 | 156 (10.7%) | 127 (21.1%) |
| $50,000 to $74,999 | 384 (26.3%) | 57 (9.5%) |
| $75,000 to $99,999 | 227 (15.5%) | 67 (11.1%) |
| $100,000 to $149,999 | 342 (23.4%) | 65 (10.8%) |
| $150,000 or more | 86 (5.9%) | 14 (2.3%) |
| Total | 1,463 (100.0%) | 603 (100.0%) |
Monthly Housing Cost Tiers in Brown County
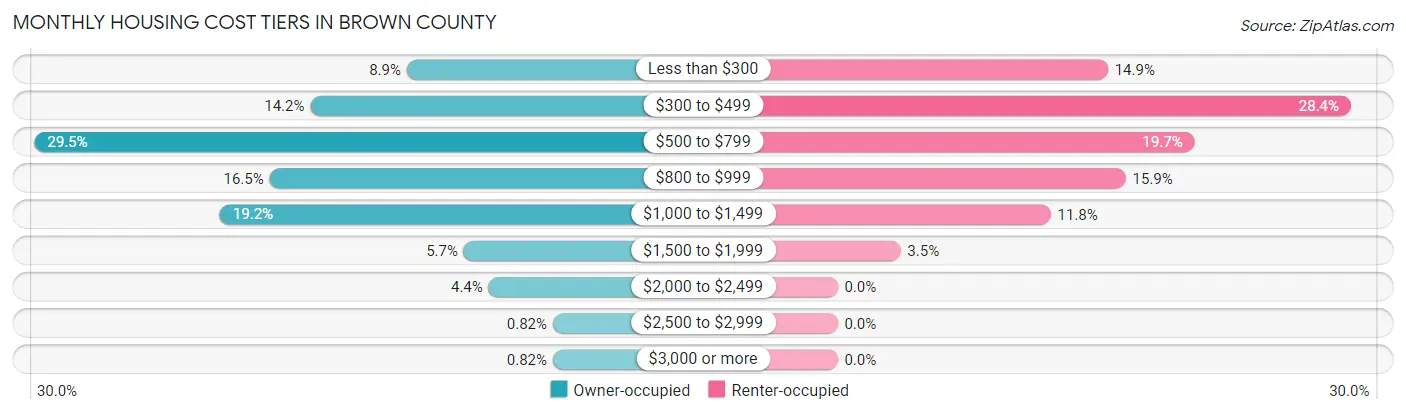
| Monthly Cost | Owner-occupied | Renter-occupied |
| Less than $300 | 130 (8.9%) | 90 (14.9%) |
| $300 to $499 | 208 (14.2%) | 171 (28.4%) |
| $500 to $799 | 431 (29.5%) | 119 (19.7%) |
| $800 to $999 | 241 (16.5%) | 96 (15.9%) |
| $1,000 to $1,499 | 281 (19.2%) | 71 (11.8%) |
| $1,500 to $1,999 | 84 (5.7%) | 21 (3.5%) |
| $2,000 to $2,499 | 64 (4.4%) | 0 (0.0%) |
| $2,500 to $2,999 | 12 (0.8%) | 0 (0.0%) |
| $3,000 or more | 12 (0.8%) | 0 (0.0%) |
| Total | 1,463 (100.0%) | 603 (100.0%) |
Physical Housing Characteristics in Brown County
Housing Structures in Brown County
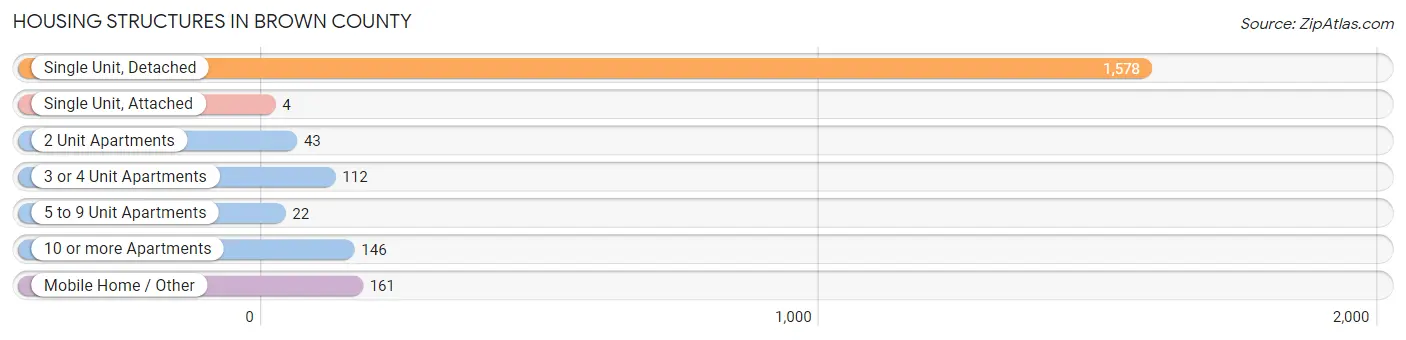
| Structure Type | # Housing Units | % Housing Units |
| Single Unit, Detached | 1,578 | 76.4% |
| Single Unit, Attached | 4 | 0.2% |
| 2 Unit Apartments | 43 | 2.1% |
| 3 or 4 Unit Apartments | 112 | 5.4% |
| 5 to 9 Unit Apartments | 22 | 1.1% |
| 10 or more Apartments | 146 | 7.1% |
| Mobile Home / Other | 161 | 7.8% |
| Total | 2,066 | 100.0% |
Housing Structures by Occupancy in Brown County
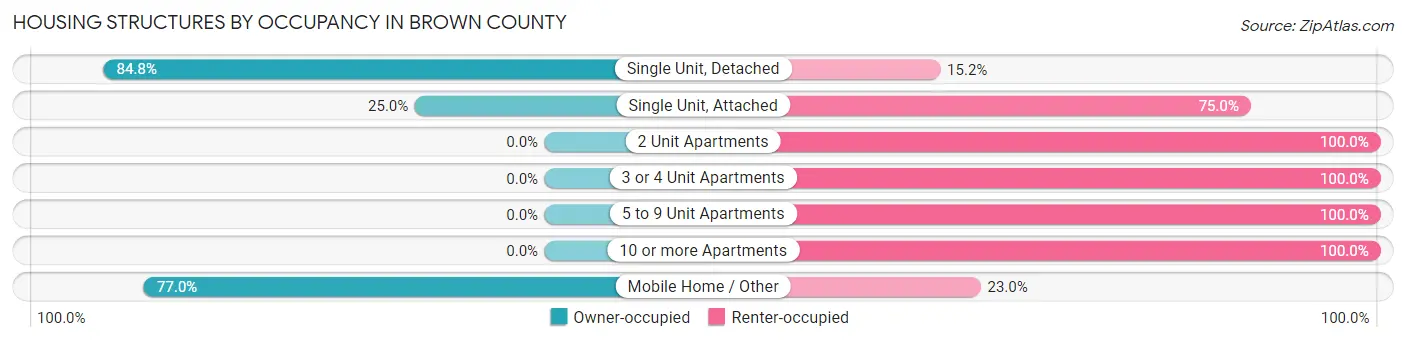
| Structure Type | Owner-occupied | Renter-occupied |
| Single Unit, Detached | 1,338 (84.8%) | 240 (15.2%) |
| Single Unit, Attached | 1 (25.0%) | 3 (75.0%) |
| 2 Unit Apartments | 0 (0.0%) | 43 (100.0%) |
| 3 or 4 Unit Apartments | 0 (0.0%) | 112 (100.0%) |
| 5 to 9 Unit Apartments | 0 (0.0%) | 22 (100.0%) |
| 10 or more Apartments | 0 (0.0%) | 146 (100.0%) |
| Mobile Home / Other | 124 (77.0%) | 37 (23.0%) |
| Total | 1,463 (70.8%) | 603 (29.2%) |
Housing Structures by Number of Rooms in Brown County
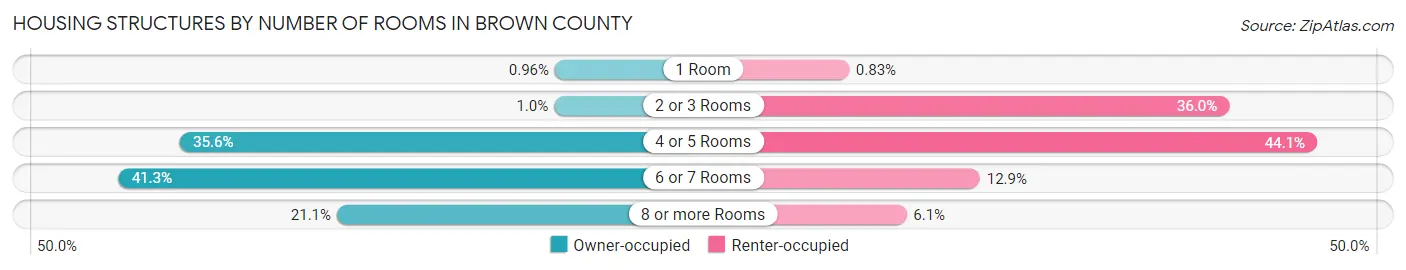
| Number of Rooms | Owner-occupied | Renter-occupied |
| 1 Room | 14 (1.0%) | 5 (0.8%) |
| 2 or 3 Rooms | 15 (1.0%) | 217 (36.0%) |
| 4 or 5 Rooms | 521 (35.6%) | 266 (44.1%) |
| 6 or 7 Rooms | 604 (41.3%) | 78 (12.9%) |
| 8 or more Rooms | 309 (21.1%) | 37 (6.1%) |
| Total | 1,463 (100.0%) | 603 (100.0%) |
Housing Structure by Heating Type in Brown County
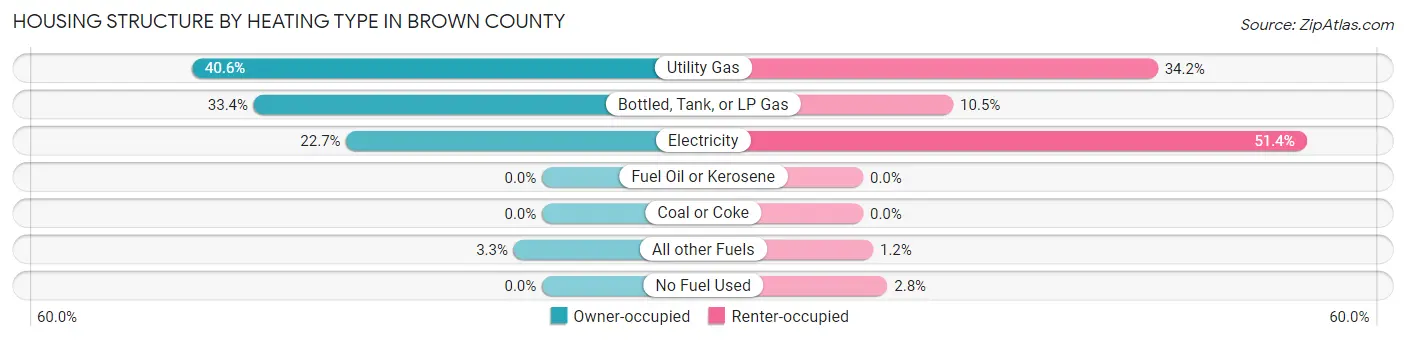
| Heating Type | Owner-occupied | Renter-occupied |
| Utility Gas | 594 (40.6%) | 206 (34.2%) |
| Bottled, Tank, or LP Gas | 489 (33.4%) | 63 (10.4%) |
| Electricity | 332 (22.7%) | 310 (51.4%) |
| Fuel Oil or Kerosene | 0 (0.0%) | 0 (0.0%) |
| Coal or Coke | 0 (0.0%) | 0 (0.0%) |
| All other Fuels | 48 (3.3%) | 7 (1.2%) |
| No Fuel Used | 0 (0.0%) | 17 (2.8%) |
| Total | 1,463 (100.0%) | 603 (100.0%) |
Household Vehicle Usage in Brown County
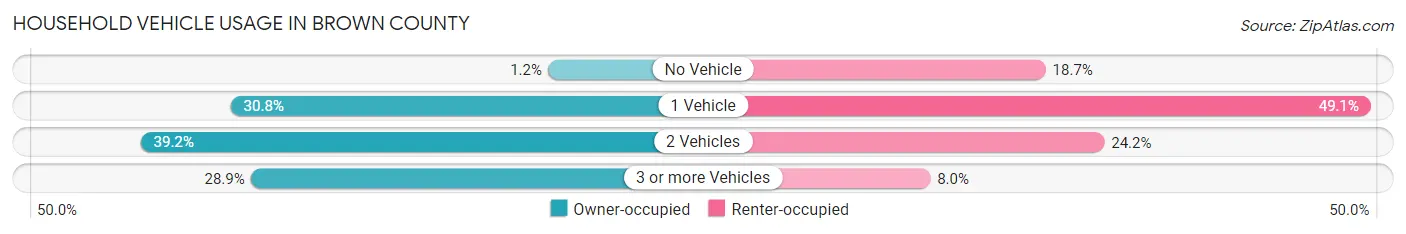
| Vehicles per Household | Owner-occupied | Renter-occupied |
| No Vehicle | 17 (1.2%) | 113 (18.7%) |
| 1 Vehicle | 450 (30.8%) | 296 (49.1%) |
| 2 Vehicles | 573 (39.2%) | 146 (24.2%) |
| 3 or more Vehicles | 423 (28.9%) | 48 (8.0%) |
| Total | 1,463 (100.0%) | 603 (100.0%) |
Real Estate & Mortgages in Brown County
Real Estate and Mortgage Overview in Brown County
| Characteristic | Without Mortgage | With Mortgage |
| Housing Units | 652 | 811 |
| Median Property Value | $117,700 | $124,900 |
| Median Household Income | $65,156 | $64 |
| Monthly Housing Costs | $497 | $12 |
| Real Estate Taxes | $1,733 | $10 |
Property Value by Mortgage Status in Brown County
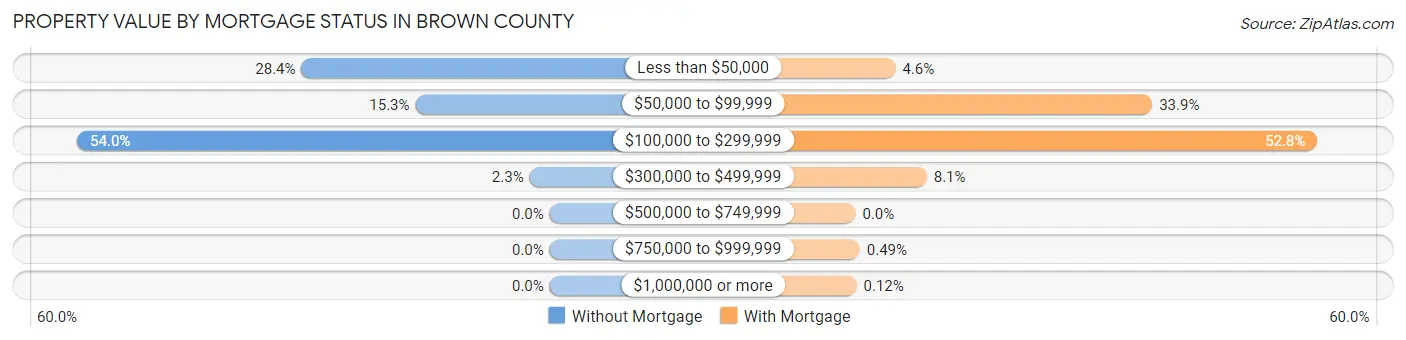
| Property Value | Without Mortgage | With Mortgage |
| Less than $50,000 | 185 (28.4%) | 37 (4.6%) |
| $50,000 to $99,999 | 100 (15.3%) | 275 (33.9%) |
| $100,000 to $299,999 | 352 (54.0%) | 428 (52.8%) |
| $300,000 to $499,999 | 15 (2.3%) | 66 (8.1%) |
| $500,000 to $749,999 | 0 (0.0%) | 0 (0.0%) |
| $750,000 to $999,999 | 0 (0.0%) | 4 (0.5%) |
| $1,000,000 or more | 0 (0.0%) | 1 (0.1%) |
| Total | 652 (100.0%) | 811 (100.0%) |
Household Income by Mortgage Status in Brown County
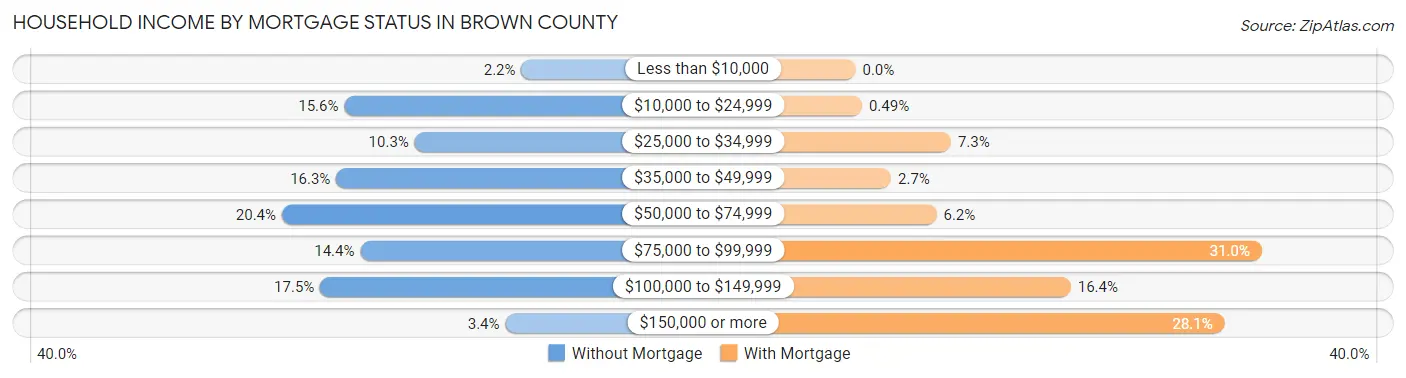
| Household Income | Without Mortgage | With Mortgage |
| Less than $10,000 | 14 (2.1%) | 0 (0.0%) |
| $10,000 to $24,999 | 102 (15.6%) | 4 (0.5%) |
| $25,000 to $34,999 | 67 (10.3%) | 59 (7.3%) |
| $35,000 to $49,999 | 106 (16.3%) | 22 (2.7%) |
| $50,000 to $74,999 | 133 (20.4%) | 50 (6.2%) |
| $75,000 to $99,999 | 94 (14.4%) | 251 (30.9%) |
| $100,000 to $149,999 | 114 (17.5%) | 133 (16.4%) |
| $150,000 or more | 22 (3.4%) | 228 (28.1%) |
| Total | 652 (100.0%) | 811 (100.0%) |
Property Value to Household Income Ratio in Brown County
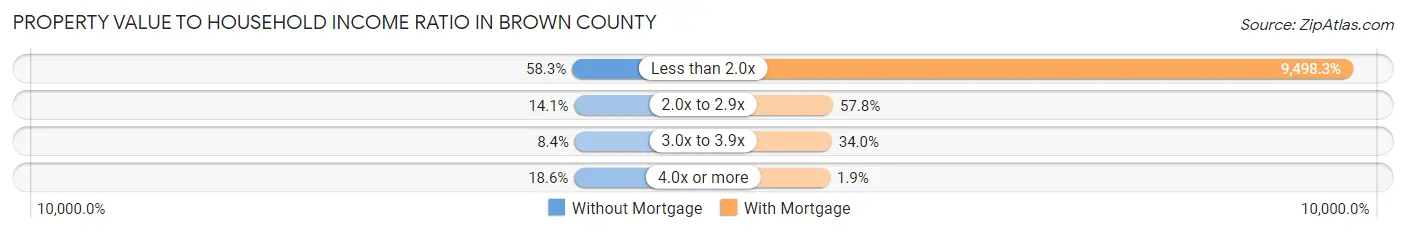
| Value-to-Income Ratio | Without Mortgage | With Mortgage |
| Less than 2.0x | 380 (58.3%) | 77,031 (9,498.3%) |
| 2.0x to 2.9x | 92 (14.1%) | 469 (57.8%) |
| 3.0x to 3.9x | 55 (8.4%) | 276 (34.0%) |
| 4.0x or more | 121 (18.6%) | 15 (1.8%) |
| Total | 652 (100.0%) | 811 (100.0%) |
Real Estate Taxes by Mortgage Status in Brown County
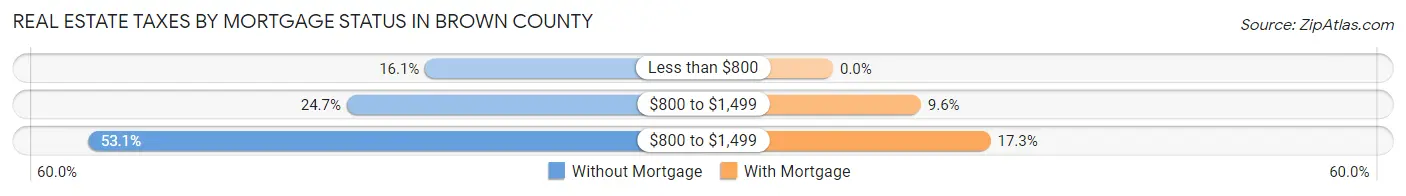
| Property Taxes | Without Mortgage | With Mortgage |
| Less than $800 | 105 (16.1%) | 0 (0.0%) |
| $800 to $1,499 | 161 (24.7%) | 78 (9.6%) |
| $800 to $1,499 | 346 (53.1%) | 140 (17.3%) |
| Total | 652 (100.0%) | 811 (100.0%) |
Health & Disability in Brown County
Health Insurance Coverage by Age in Brown County
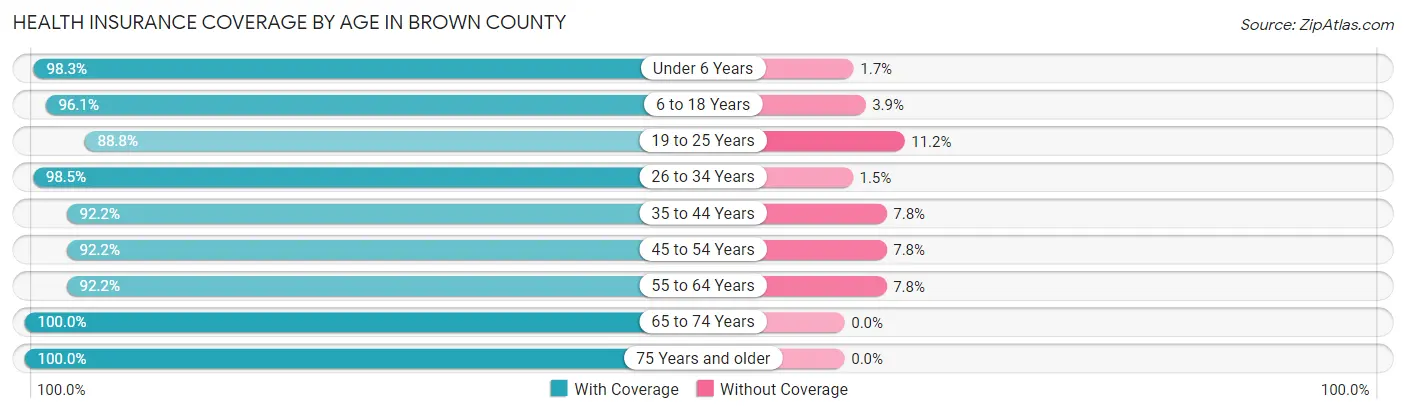
| Age Bracket | With Coverage | Without Coverage |
| Under 6 Years | 349 (98.3%) | 6 (1.7%) |
| 6 to 18 Years | 764 (96.1%) | 31 (3.9%) |
| 19 to 25 Years | 397 (88.8%) | 50 (11.2%) |
| 26 to 34 Years | 579 (98.5%) | 9 (1.5%) |
| 35 to 44 Years | 611 (92.2%) | 52 (7.8%) |
| 45 to 54 Years | 400 (92.2%) | 34 (7.8%) |
| 55 to 64 Years | 566 (92.2%) | 48 (7.8%) |
| 65 to 74 Years | 388 (100.0%) | 0 (0.0%) |
| 75 Years and older | 359 (100.0%) | 0 (0.0%) |
| Total | 4,413 (95.1%) | 230 (5.0%) |
Health Insurance Coverage by Citizenship Status in Brown County
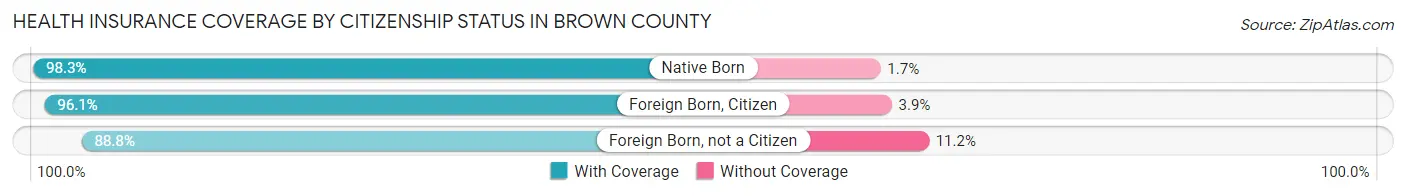
| Citizenship Status | With Coverage | Without Coverage |
| Native Born | 349 (98.3%) | 6 (1.7%) |
| Foreign Born, Citizen | 764 (96.1%) | 31 (3.9%) |
| Foreign Born, not a Citizen | 397 (88.8%) | 50 (11.2%) |
Health Insurance Coverage by Household Income in Brown County
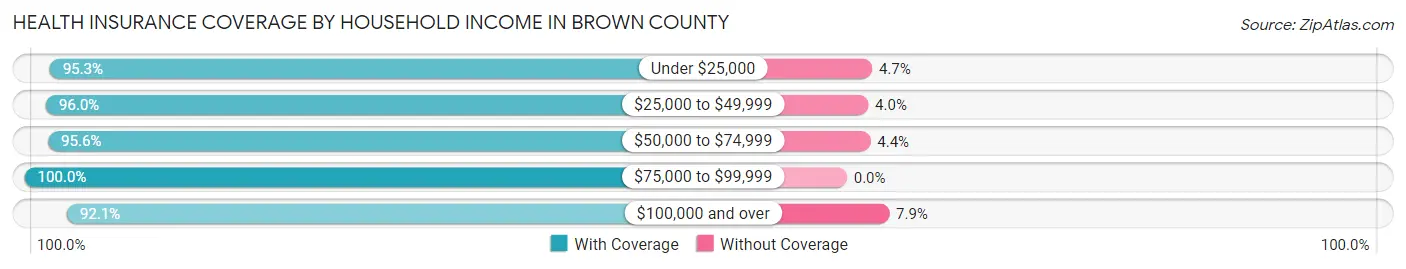
| Household Income | With Coverage | Without Coverage |
| Under $25,000 | 546 (95.3%) | 27 (4.7%) |
| $25,000 to $49,999 | 744 (96.0%) | 31 (4.0%) |
| $50,000 to $74,999 | 886 (95.6%) | 41 (4.4%) |
| $75,000 to $99,999 | 715 (100.0%) | 0 (0.0%) |
| $100,000 and over | 1,520 (92.1%) | 131 (7.9%) |
Public vs Private Health Insurance Coverage by Age in Brown County
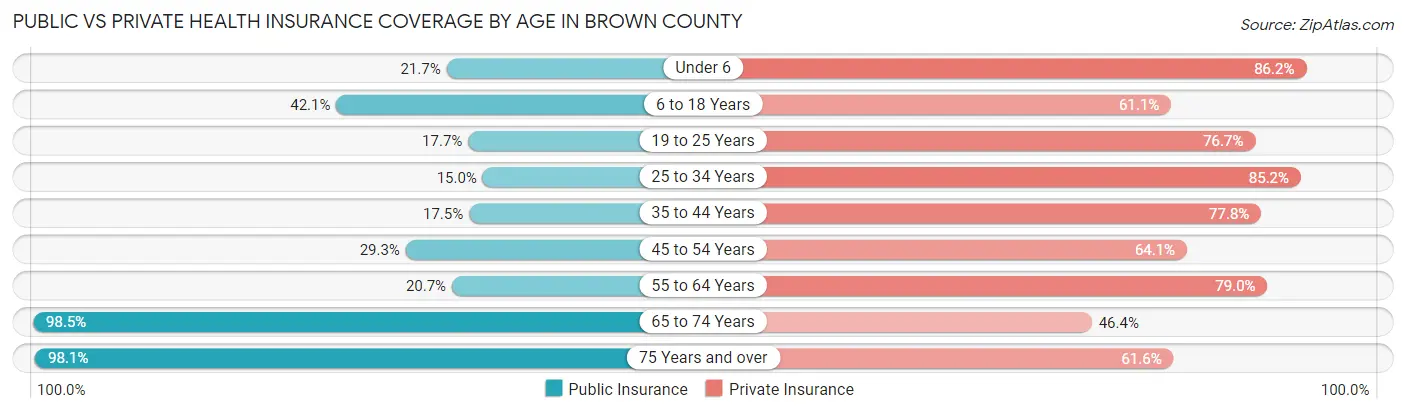
| Age Bracket | Public Insurance | Private Insurance |
| Under 6 | 77 (21.7%) | 306 (86.2%) |
| 6 to 18 Years | 335 (42.1%) | 486 (61.1%) |
| 19 to 25 Years | 79 (17.7%) | 343 (76.7%) |
| 25 to 34 Years | 88 (15.0%) | 501 (85.2%) |
| 35 to 44 Years | 116 (17.5%) | 516 (77.8%) |
| 45 to 54 Years | 127 (29.3%) | 278 (64.1%) |
| 55 to 64 Years | 127 (20.7%) | 485 (79.0%) |
| 65 to 74 Years | 382 (98.5%) | 180 (46.4%) |
| 75 Years and over | 352 (98.1%) | 221 (61.6%) |
| Total | 1,683 (36.2%) | 3,316 (71.4%) |
Disability Status by Sex by Age in Brown County
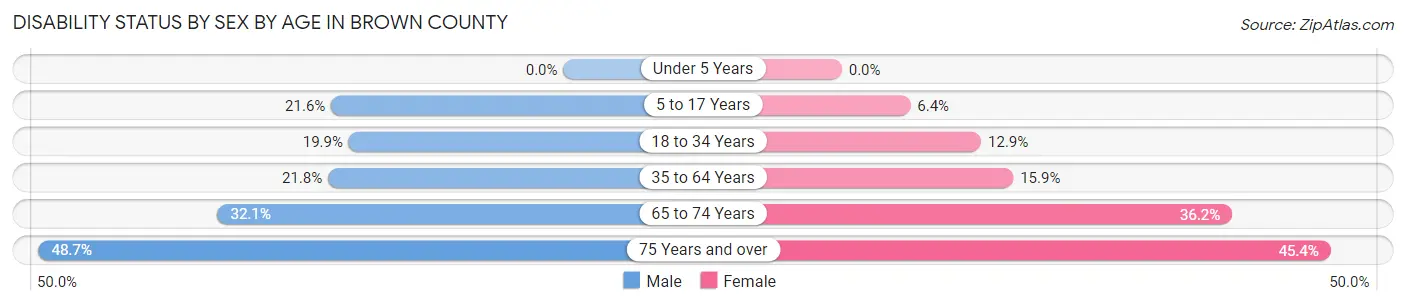
| Age Bracket | Male | Female |
| Under 5 Years | 0 (0.0%) | 0 (0.0%) |
| 5 to 17 Years | 92 (21.5%) | 25 (6.4%) |
| 18 to 34 Years | 131 (19.9%) | 53 (12.9%) |
| 35 to 64 Years | 176 (21.8%) | 144 (15.9%) |
| 65 to 74 Years | 43 (32.1%) | 92 (36.2%) |
| 75 Years and over | 75 (48.7%) | 93 (45.4%) |
Disability Class by Sex by Age in Brown County
Disability Class: Hearing Difficulty
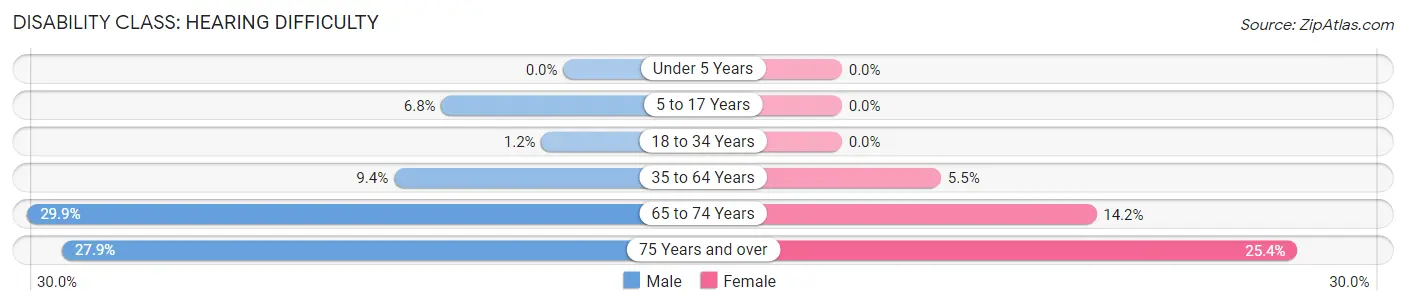
| Age Bracket | Male | Female |
| Under 5 Years | 0 (0.0%) | 0 (0.0%) |
| 5 to 17 Years | 29 (6.8%) | 0 (0.0%) |
| 18 to 34 Years | 8 (1.2%) | 0 (0.0%) |
| 35 to 64 Years | 76 (9.4%) | 50 (5.5%) |
| 65 to 74 Years | 40 (29.8%) | 36 (14.2%) |
| 75 Years and over | 43 (27.9%) | 52 (25.4%) |
Disability Class: Vision Difficulty
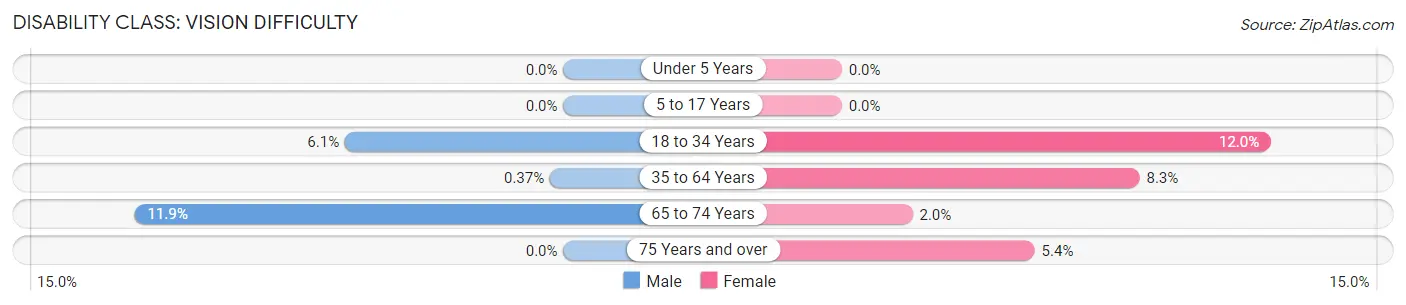
| Age Bracket | Male | Female |
| Under 5 Years | 0 (0.0%) | 0 (0.0%) |
| 5 to 17 Years | 0 (0.0%) | 0 (0.0%) |
| 18 to 34 Years | 40 (6.1%) | 49 (11.9%) |
| 35 to 64 Years | 3 (0.4%) | 75 (8.3%) |
| 65 to 74 Years | 16 (11.9%) | 5 (2.0%) |
| 75 Years and over | 0 (0.0%) | 11 (5.4%) |
Disability Class: Cognitive Difficulty
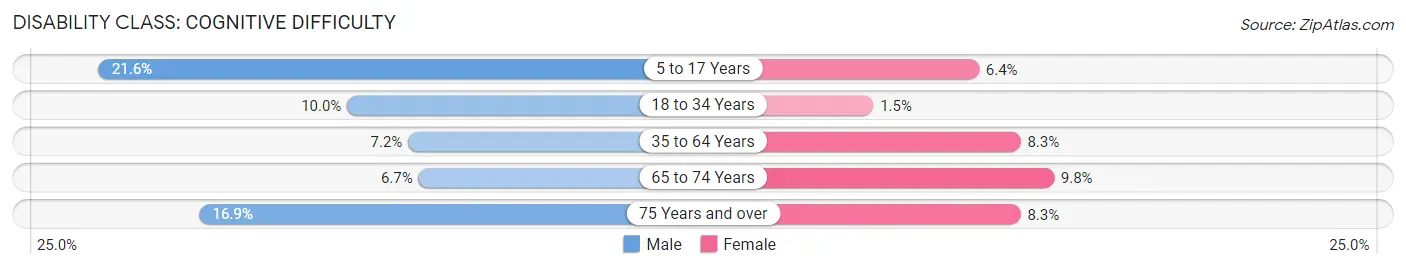
| Age Bracket | Male | Female |
| 5 to 17 Years | 92 (21.5%) | 25 (6.4%) |
| 18 to 34 Years | 66 (10.0%) | 6 (1.5%) |
| 35 to 64 Years | 58 (7.2%) | 75 (8.3%) |
| 65 to 74 Years | 9 (6.7%) | 25 (9.8%) |
| 75 Years and over | 26 (16.9%) | 17 (8.3%) |
Disability Class: Ambulatory Difficulty
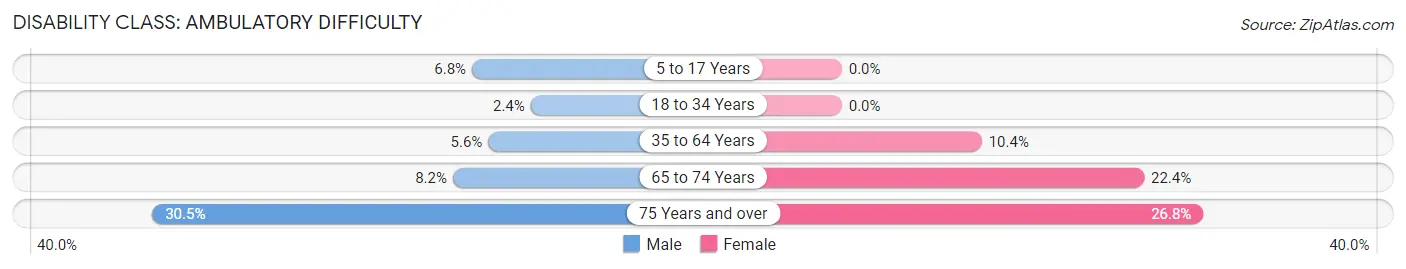
| Age Bracket | Male | Female |
| 5 to 17 Years | 29 (6.8%) | 0 (0.0%) |
| 18 to 34 Years | 16 (2.4%) | 0 (0.0%) |
| 35 to 64 Years | 45 (5.6%) | 94 (10.4%) |
| 65 to 74 Years | 11 (8.2%) | 57 (22.4%) |
| 75 Years and over | 47 (30.5%) | 55 (26.8%) |
Disability Class: Self-Care Difficulty
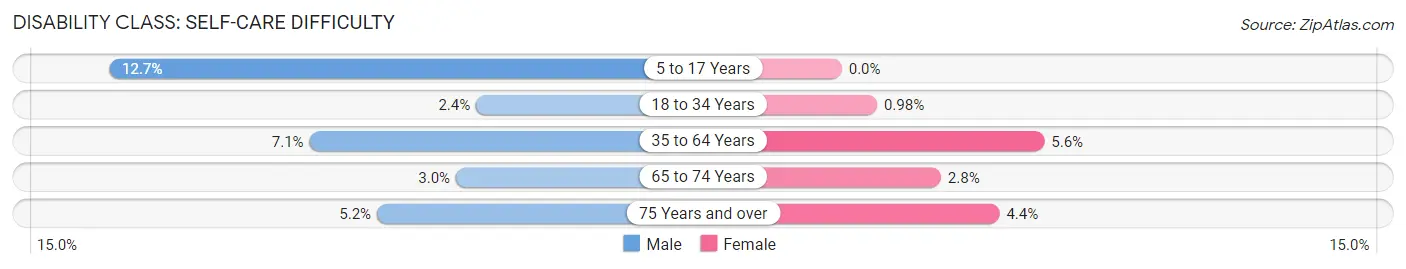
| Age Bracket | Male | Female |
| 5 to 17 Years | 54 (12.7%) | 0 (0.0%) |
| 18 to 34 Years | 16 (2.4%) | 4 (1.0%) |
| 35 to 64 Years | 57 (7.1%) | 51 (5.6%) |
| 65 to 74 Years | 4 (3.0%) | 7 (2.8%) |
| 75 Years and over | 8 (5.2%) | 9 (4.4%) |
Technology Access in Brown County
Computing Device Access in Brown County
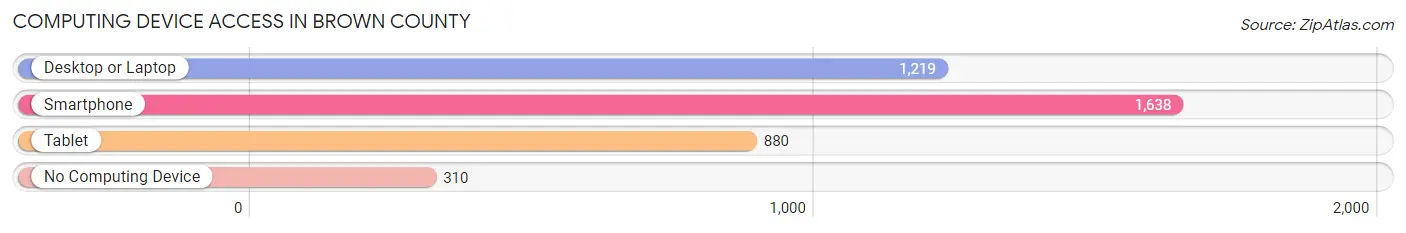
| Device Type | # Households | % Households |
| Desktop or Laptop | 1,219 | 59.0% |
| Smartphone | 1,638 | 79.3% |
| Tablet | 880 | 42.6% |
| No Computing Device | 310 | 15.0% |
| Total | 2,066 | 100.0% |
Internet Access in Brown County
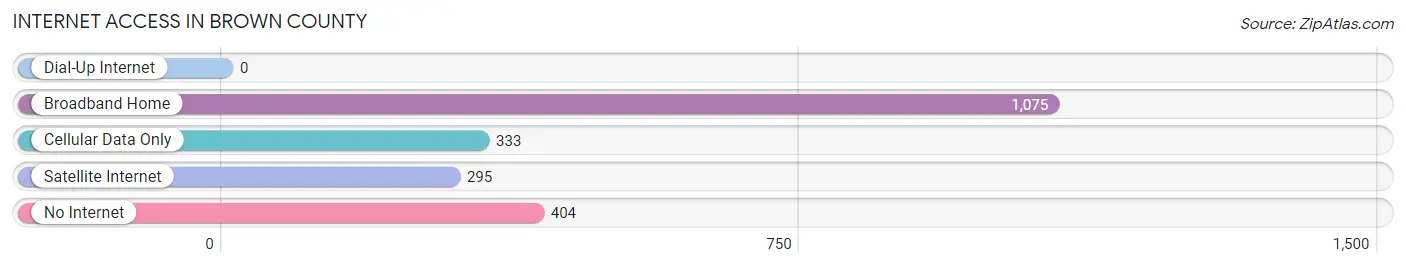
| Internet Type | # Households | % Households |
| Dial-Up Internet | 0 | 0.0% |
| Broadband Home | 1,075 | 52.0% |
| Cellular Data Only | 333 | 16.1% |
| Satellite Internet | 295 | 14.3% |
| No Internet | 404 | 19.6% |
| Total | 2,066 | 100.0% |
Brown County Summary
Brown County is located in the western part of the state of Illinois, in the United States. It is bordered by Schuyler County to the north, Adams County to the east, Pike County to the south, and Hancock County to the west. The county seat is Mount Sterling, and the largest city is Mount Sterling. The county was established in 1825 and named for Jacob Brown, a Revolutionary War hero.
Geography
Brown County is located in the western part of the state of Illinois, in the United States. It is bordered by Schuyler County to the north, Adams County to the east, Pike County to the south, and Hancock County to the west. The county has a total area of 576 square miles, of which 574 square miles is land and 2 square miles (0.3%) is water. The terrain is mostly flat, with some rolling hills in the northern part of the county. The highest point in the county is located in the northwest corner, at an elevation of 890 feet above sea level.
The county is drained by the La Moine River, which flows through the center of the county from north to south. Other major waterways include the Little La Moine River, the Coon Creek, and the Bear Creek. The county is also home to several small lakes, including Lake Brown, Lake Schuyler, and Lake Hancock.
Climate
Brown County has a humid continental climate, with cold, snowy winters and hot, humid summers. The average annual temperature is 52°F, and the average annual precipitation is 37 inches.
Demographics
As of the 2010 United States Census, there were 6,937 people, 2,817 households, and 1,919 families residing in the county. The population density was 12.1 people per square mile. There were 3,093 housing units at an average density of 5.3 per square mile. The racial makeup of the county was 97.7% White, 0.3% Black or African American, 0.2% Native American, 0.2% Asian, 0.2% from other races, and 1.4% from two or more races. 1.3% of the population were Hispanic or Latino of any race.
There were 2,817 households, out of which 28.2% had children under the age of 18 living with them, 54.2% were married couples living together, 9.2% had a female householder with no husband present, and 32.2% were non-families. 28.2% of all households were made up of individuals, and 14.2% had someone living alone who was 65 years of age or older. The average household size was 2.41 and the average family size was 2.93.
The median age in the county was 43.3 years. 22.7% of residents were under the age of 18; 7.2% were between the ages of 18 and 24; 23.2% were from 25 to 44; 28.2% were from 45 to 64; and 18.7% were 65 years of age or older. The gender makeup of the county was 48.7% male and 51.3% female.
Economy
The economy of Brown County is largely based on agriculture. The county is home to several large farms, and the main crops grown in the area are corn, soybeans, and wheat. Livestock production is also important, with cattle, hogs, and sheep being the main animals raised.
The county is also home to several small businesses, including manufacturing, retail, and service industries. The largest employers in the county are the Brown County Hospital, the Brown County School District, and the Brown County Sheriff's Office.
The median household income in the county was $41,945 in 2018, and the median family income was $50,945. The per capita income was $21,945. About 11.2% of families and 14.2% of the population were below the poverty line, including 19.2% of those under age 18 and 8.2% of those age 65 or over.
Conclusion
Brown County is a rural county located in the western part of the state of Illinois. It is bordered by Schuyler County to the north, Adams County to the east, Pike County to the south, and Hancock County to the west. The county has a total area of 576 square miles, and the terrain is mostly flat, with some rolling hills in the northern part of the county. The county has a humid continental climate, with cold, snowy winters and hot, humid summers. The population of the county was 6,937 as of the 2010 United States Census. The economy of the county is largely based on agriculture, with corn, soybeans, and wheat being the main crops grown in the area. Livestock production is also important, with cattle, hogs, and sheep being the main animals raised. The county is also home to several small businesses, including manufacturing, retail, and service industries. The median household income in the county was $41,945 in 2018, and the median family income was $50,945.
Common Questions
What is Per Capita Income in Brown County?
Per Capita income in Brown County is $25,951.
What is the Median Family Income in Brown County?
Median Family Income in Brown County is $82,813.
What is the Median Household income in Brown County?
Median Household Income in Brown County is $64,760.
What is Income or Wage Gap in Brown County?
Income or Wage Gap in Brown County is 16.4%.
Women in Brown County earn 83.6 cents for every dollar earned by a man.
What is Family Income Deficit in Brown County?
Family Income Deficit in Brown County is $8,563.
Families that are below poverty line in Brown County earn $8,563 less on average than the poverty threshold level.
What is Inequality or Gini Index in Brown County?
Inequality or Gini Index in Brown County is 0.41.
What is the Total Population of Brown County?
Total Population of Brown County is 6,334.
What is the Total Male Population of Brown County?
Total Male Population of Brown County is 3,992.
What is the Total Female Population of Brown County?
Total Female Population of Brown County is 2,342.
What is the Ratio of Males per 100 Females in Brown County?
There are 170.45 Males per 100 Females in Brown County.
What is the Ratio of Females per 100 Males in Brown County?
There are 58.67 Females per 100 Males in Brown County.
What is the Median Population Age in Brown County?
Median Population Age in Brown County is 38.5 Years.
What is the Average Family Size in Brown County
Average Family Size in Brown County is 3.0 People.
What is the Average Household Size in Brown County
Average Household Size in Brown County is 2.2 People.
How Large is the Labor Force in Brown County?
There are 2,468 People in the Labor Forcein in Brown County.
What is the Percentage of People in the Labor Force in Brown County?
45.8% of People are in the Labor Force in Brown County.
What is the Unemployment Rate in Brown County?
Unemployment Rate in Brown County is 2.1%.