Zip Codes with the Highest Percentage of Households Without a Vehicle in Roanoke, VA
RELATED REPORTS & OPTIONS
Households without a Cars
Roanoke
Compare Zip Codes
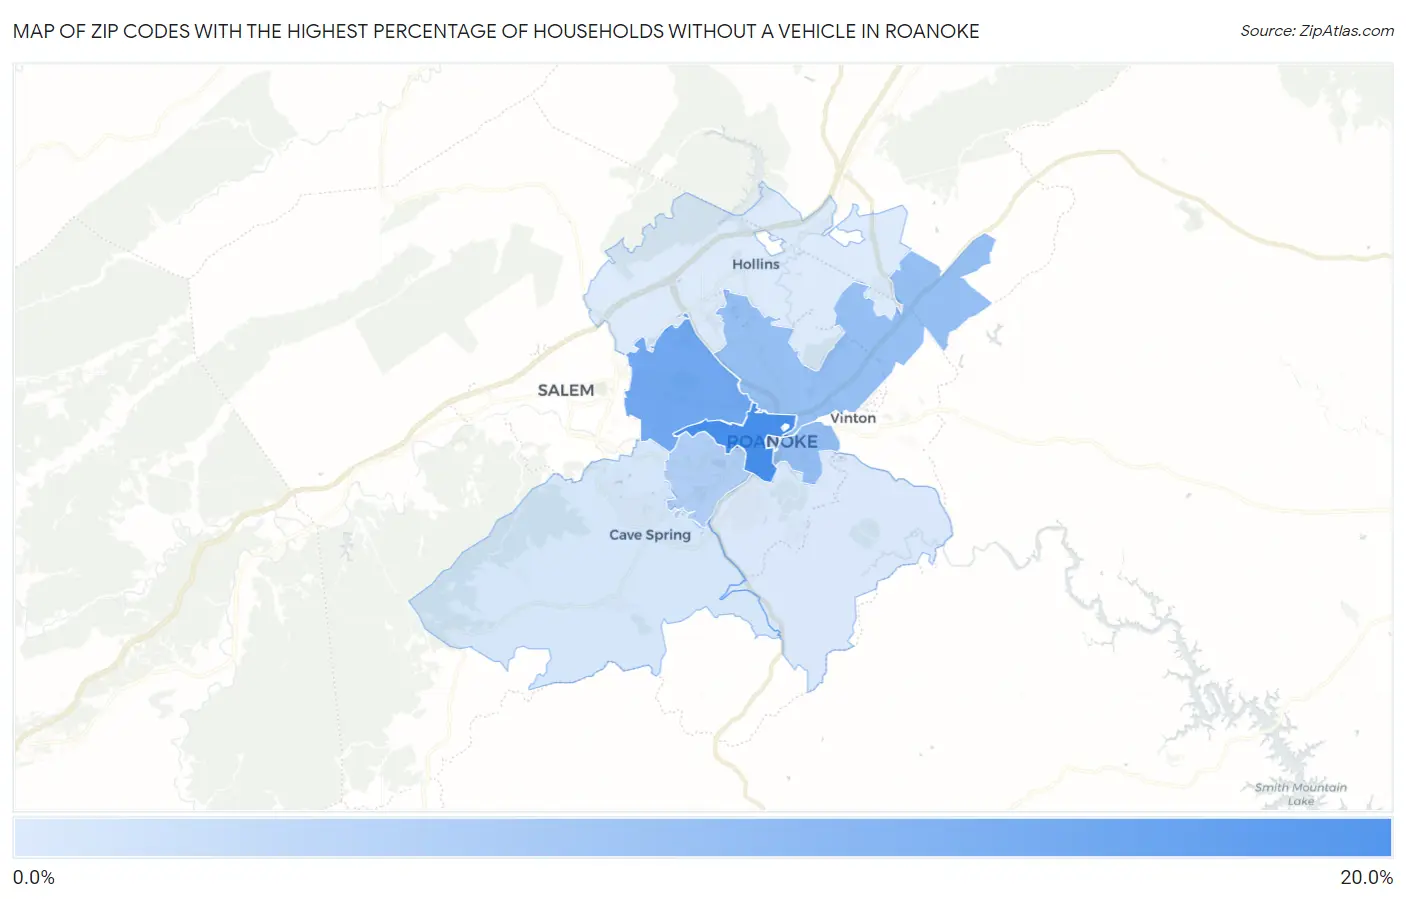
Map of Zip Codes with the Highest Percentage of Households Without a Vehicle in Roanoke
3.7%
18.9%
Zip Codes with the Highest Percentage of Households Without a Vehicle in Roanoke, VA
| Zip Code | Housholds Without a Car | vs State | vs National | |
| 1. | 24016 | 18.9% | 6.1%(+12.8)#28 | 8.3%(+10.6)#1,650 |
| 2. | 24017 | 14.4% | 6.1%(+8.30)#60 | 8.3%(+6.10)#2,546 |
| 3. | 24013 | 10.9% | 6.1%(+4.80)#103 | 8.3%(+2.60)#4,206 |
| 4. | 24012 | 10.8% | 6.1%(+4.70)#105 | 8.3%(+2.50)#4,244 |
| 5. | 24015 | 8.1% | 6.1%(+2.00)#171 | 8.3%(-0.200)#6,813 |
| 6. | 24011 | 6.2% | 6.1%(+0.100)#263 | 8.3%(-2.10)#10,149 |
| 7. | 24018 | 4.4% | 6.1%(-1.70)#356 | 8.3%(-3.90)#14,475 |
| 8. | 24014 | 3.9% | 6.1%(-2.20)#403 | 8.3%(-4.40)#16,057 |
| 9. | 24019 | 3.7% | 6.1%(-2.40)#423 | 8.3%(-4.60)#16,672 |
1
Common Questions
What are the Top 5 Zip Codes with the Highest Percentage of Households Without a Vehicle in Roanoke, VA?
Top 5 Zip Codes with the Highest Percentage of Households Without a Vehicle in Roanoke, VA are:
What zip code has the Highest Percentage of Households Without a Vehicle in Roanoke, VA?
24016 has the Highest Percentage of Households Without a Vehicle in Roanoke, VA with 18.9%.
What is the Percentage of Households Without a Vehicle in Roanoke, VA?
Percentage of Households Without a Vehicle in Roanoke is 11.2%.
What is the Percentage of Households Without a Vehicle in Virginia?
Percentage of Households Without a Vehicle in Virginia is 6.1%.
What is the Percentage of Households Without a Vehicle in the United States?
Percentage of Households Without a Vehicle in the United States is 8.3%.