Zip Codes with the Highest Percentage of Population Employed in Cleaning & Maintenance in Michigan
RELATED REPORTS & OPTIONS
Cleaning & Maintenance
Michigan
Compare Zip Codes
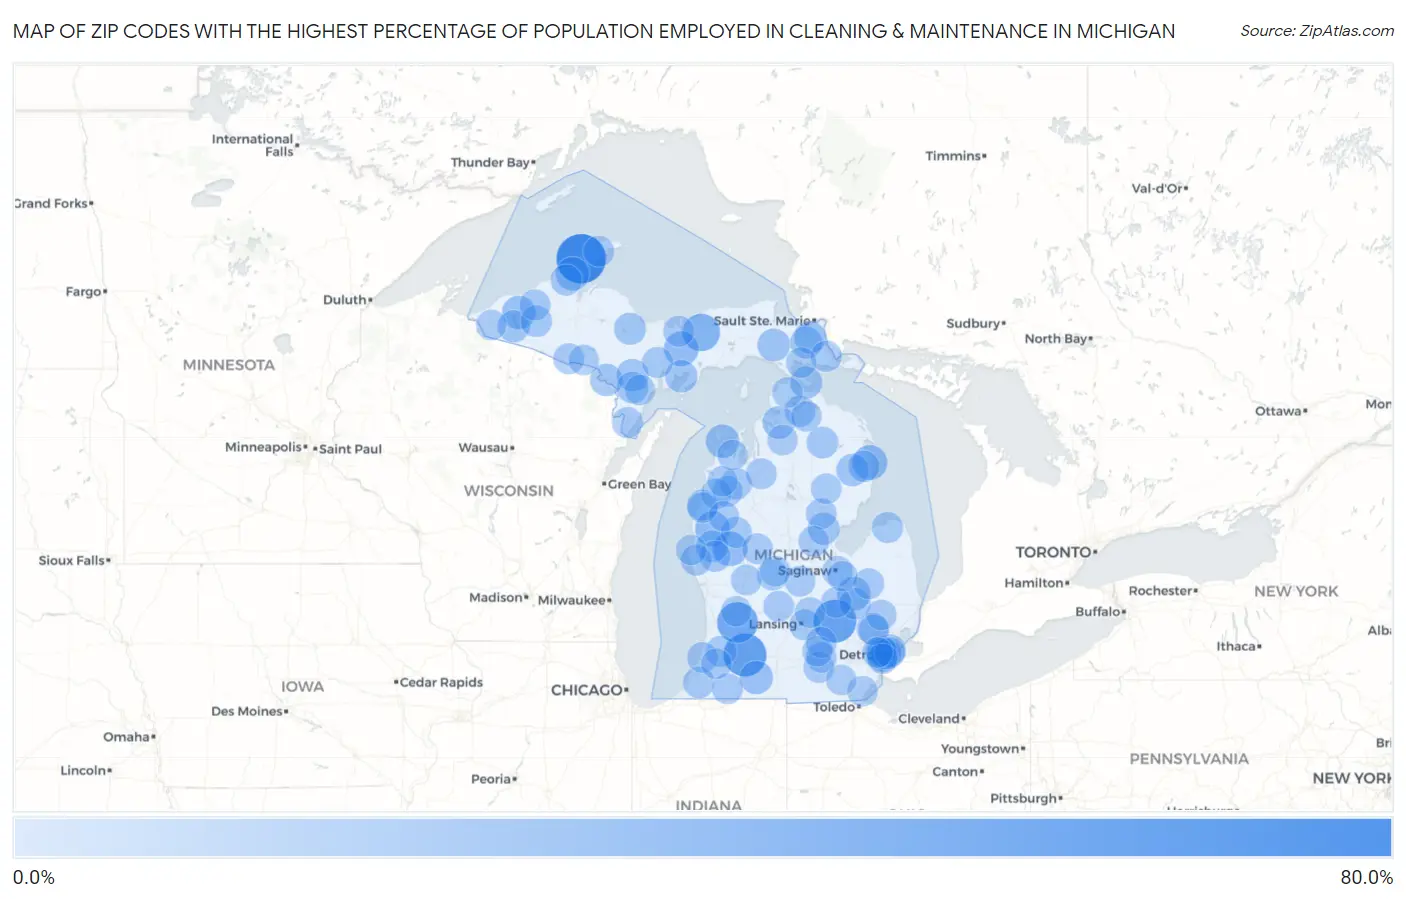
Map of Zip Codes with the Highest Percentage of Population Employed in Cleaning & Maintenance in Michigan
0.0%
80.0%
Zip Codes with the Highest Percentage of Population Employed in Cleaning & Maintenance in Michigan
| Zip Code | % Employed | vs State | vs National | |
| 1. | 49942 | 71.4% | 3.4%(+68.0)#1 | 3.5%(+67.9)#23 |
| 2. | 49074 | 49.1% | 3.4%(+45.7)#2 | 3.5%(+45.6)#52 |
| 3. | 48816 | 48.4% | 3.4%(+45.0)#3 | 3.5%(+44.9)#55 |
| 4. | 49335 | 41.3% | 3.4%(+37.9)#4 | 3.5%(+37.8)#80 |
| 5. | 49884 | 30.4% | 3.4%(+27.0)#5 | 3.5%(+26.9)#168 |
| 6. | 49458 | 21.7% | 3.4%(+18.3)#6 | 3.5%(+18.2)#340 |
| 7. | 49895 | 21.5% | 3.4%(+18.1)#7 | 3.5%(+18.0)#348 |
| 8. | 48721 | 21.3% | 3.4%(+17.9)#8 | 3.5%(+17.8)#356 |
| 9. | 49312 | 21.2% | 3.4%(+17.8)#9 | 3.5%(+17.7)#362 |
| 10. | 49921 | 17.3% | 3.4%(+14.0)#10 | 3.5%(+13.9)#539 |
| 11. | 49654 | 17.1% | 3.4%(+13.7)#11 | 3.5%(+13.6)#567 |
| 12. | 48437 | 17.0% | 3.4%(+13.6)#12 | 3.5%(+13.5)#570 |
| 13. | 49066 | 16.7% | 3.4%(+13.3)#13 | 3.5%(+13.2)#597 |
| 14. | 49910 | 16.7% | 3.4%(+13.3)#14 | 3.5%(+13.2)#602 |
| 15. | 49793 | 14.6% | 3.4%(+11.3)#15 | 3.5%(+11.2)#790 |
| 16. | 49796 | 13.8% | 3.4%(+10.4)#16 | 3.5%(+10.3)#902 |
| 17. | 48705 | 13.5% | 3.4%(+10.2)#17 | 3.5%(+10.1)#933 |
| 18. | 49864 | 13.3% | 3.4%(+9.95)#18 | 3.5%(+9.85)#968 |
| 19. | 49876 | 13.3% | 3.4%(+9.94)#19 | 3.5%(+9.84)#970 |
| 20. | 49873 | 12.8% | 3.4%(+9.39)#20 | 3.5%(+9.28)#1,054 |
| 21. | 49947 | 12.7% | 3.4%(+9.28)#21 | 3.5%(+9.18)#1,071 |
| 22. | 49788 | 12.5% | 3.4%(+9.12)#22 | 3.5%(+9.02)#1,087 |
| 23. | 49775 | 12.5% | 3.4%(+9.12)#23 | 3.5%(+9.02)#1,096 |
| 24. | 49724 | 12.4% | 3.4%(+8.98)#24 | 3.5%(+8.87)#1,131 |
| 25. | 49871 | 12.2% | 3.4%(+8.86)#25 | 3.5%(+8.75)#1,155 |
| 26. | 49874 | 11.9% | 3.4%(+8.48)#26 | 3.5%(+8.38)#1,239 |
| 27. | 48613 | 11.8% | 3.4%(+8.45)#27 | 3.5%(+8.35)#1,243 |
| 28. | 49459 | 11.5% | 3.4%(+8.08)#28 | 3.5%(+7.98)#1,345 |
| 29. | 49709 | 11.2% | 3.4%(+7.87)#29 | 3.5%(+7.76)#1,418 |
| 30. | 48340 | 10.8% | 3.4%(+7.41)#30 | 3.5%(+7.30)#1,546 |
| 31. | 49912 | 10.5% | 3.4%(+7.16)#31 | 3.5%(+7.06)#1,606 |
| 32. | 48213 | 10.5% | 3.4%(+7.15)#32 | 3.5%(+7.04)#1,619 |
| 33. | 48742 | 10.1% | 3.4%(+6.76)#33 | 3.5%(+6.65)#1,747 |
| 34. | 48519 | 10.1% | 3.4%(+6.73)#34 | 3.5%(+6.63)#1,762 |
| 35. | 49620 | 10.0% | 3.4%(+6.58)#35 | 3.5%(+6.48)#1,828 |
| 36. | 49104 | 9.9% | 3.4%(+6.54)#36 | 3.5%(+6.44)#1,839 |
| 37. | 49749 | 9.6% | 3.4%(+6.25)#37 | 3.5%(+6.15)#1,978 |
| 38. | 49955 | 9.6% | 3.4%(+6.22)#38 | 3.5%(+6.12)#1,997 |
| 39. | 49026 | 9.5% | 3.4%(+6.16)#39 | 3.5%(+6.06)#2,020 |
| 40. | 48445 | 9.4% | 3.4%(+6.01)#40 | 3.5%(+5.90)#2,096 |
| 41. | 48209 | 9.4% | 3.4%(+5.98)#41 | 3.5%(+5.88)#2,116 |
| 42. | 49421 | 9.4% | 3.4%(+5.98)#42 | 3.5%(+5.87)#2,118 |
| 43. | 48210 | 9.3% | 3.4%(+5.97)#43 | 3.5%(+5.87)#2,121 |
| 44. | 49626 | 9.2% | 3.4%(+5.82)#44 | 3.5%(+5.71)#2,191 |
| 45. | 49736 | 9.2% | 3.4%(+5.78)#45 | 3.5%(+5.68)#2,208 |
| 46. | 49960 | 9.1% | 3.4%(+5.71)#47 | 3.5%(+5.61)#2,246 |
| 47. | 49872 | 9.1% | 3.4%(+5.71)#48 | 3.5%(+5.61)#2,247 |
| 48. | 49446 | 9.0% | 3.4%(+5.62)#49 | 3.5%(+5.52)#2,297 |
| 49. | 49623 | 8.9% | 3.4%(+5.55)#50 | 3.5%(+5.45)#2,343 |
| 50. | 48824 | 8.9% | 3.4%(+5.54)#51 | 3.5%(+5.44)#2,352 |
| 51. | 49893 | 8.6% | 3.4%(+5.21)#52 | 3.5%(+5.11)#2,543 |
| 52. | 49915 | 8.5% | 3.4%(+5.17)#53 | 3.5%(+5.06)#2,579 |
| 53. | 49680 | 8.5% | 3.4%(+5.13)#54 | 3.5%(+5.03)#2,603 |
| 54. | 48852 | 8.5% | 3.4%(+5.09)#55 | 3.5%(+4.99)#2,630 |
| 55. | 48435 | 8.4% | 3.4%(+5.01)#56 | 3.5%(+4.90)#2,703 |
| 56. | 49043 | 8.4% | 3.4%(+5.00)#57 | 3.5%(+4.90)#2,708 |
| 57. | 49950 | 8.4% | 3.4%(+4.98)#58 | 3.5%(+4.88)#2,723 |
| 58. | 49061 | 8.3% | 3.4%(+4.96)#59 | 3.5%(+4.86)#2,734 |
| 59. | 48201 | 8.3% | 3.4%(+4.96)#60 | 3.5%(+4.86)#2,738 |
| 60. | 48610 | 8.2% | 3.4%(+4.86)#61 | 3.5%(+4.75)#2,836 |
| 61. | 49862 | 8.2% | 3.4%(+4.82)#62 | 3.5%(+4.72)#2,866 |
| 62. | 49342 | 8.2% | 3.4%(+4.80)#63 | 3.5%(+4.69)#2,886 |
| 63. | 49261 | 8.1% | 3.4%(+4.73)#64 | 3.5%(+4.63)#2,942 |
| 64. | 49240 | 8.1% | 3.4%(+4.71)#65 | 3.5%(+4.61)#2,965 |
| 65. | 49285 | 8.1% | 3.4%(+4.68)#66 | 3.5%(+4.58)#2,988 |
| 66. | 49625 | 8.0% | 3.4%(+4.63)#67 | 3.5%(+4.53)#3,033 |
| 67. | 49064 | 7.9% | 3.4%(+4.55)#68 | 3.5%(+4.45)#3,097 |
| 68. | 48628 | 7.8% | 3.4%(+4.46)#69 | 3.5%(+4.36)#3,186 |
| 69. | 48851 | 7.8% | 3.4%(+4.39)#70 | 3.5%(+4.29)#3,256 |
| 70. | 49343 | 7.7% | 3.4%(+4.36)#71 | 3.5%(+4.26)#3,283 |
| 71. | 48847 | 7.7% | 3.4%(+4.35)#72 | 3.5%(+4.25)#3,290 |
| 72. | 48449 | 7.7% | 3.4%(+4.35)#73 | 3.5%(+4.24)#3,296 |
| 73. | 48204 | 7.7% | 3.4%(+4.34)#74 | 3.5%(+4.24)#3,304 |
| 74. | 48342 | 7.6% | 3.4%(+4.27)#75 | 3.5%(+4.17)#3,375 |
| 75. | 48214 | 7.6% | 3.4%(+4.21)#76 | 3.5%(+4.11)#3,445 |
| 76. | 48654 | 7.6% | 3.4%(+4.17)#77 | 3.5%(+4.07)#3,484 |
| 77. | 49896 | 7.5% | 3.4%(+4.10)#78 | 3.5%(+4.00)#3,563 |
| 78. | 49902 | 7.4% | 3.4%(+4.07)#79 | 3.5%(+3.96)#3,607 |
| 79. | 49645 | 7.4% | 3.4%(+4.06)#80 | 3.5%(+3.96)#3,614 |
| 80. | 48601 | 7.4% | 3.4%(+4.01)#81 | 3.5%(+3.91)#3,653 |
| 81. | 49745 | 7.4% | 3.4%(+3.98)#82 | 3.5%(+3.88)#3,682 |
| 82. | 49634 | 7.3% | 3.4%(+3.96)#83 | 3.5%(+3.86)#3,701 |
| 83. | 48829 | 7.3% | 3.4%(+3.93)#84 | 3.5%(+3.83)#3,722 |
| 84. | 48848 | 7.3% | 3.4%(+3.90)#85 | 3.5%(+3.80)#3,769 |
| 85. | 48145 | 7.3% | 3.4%(+3.88)#86 | 3.5%(+3.77)#3,792 |
| 86. | 49730 | 7.3% | 3.4%(+3.87)#87 | 3.5%(+3.77)#3,799 |
| 87. | 49259 | 7.2% | 3.4%(+3.85)#88 | 3.5%(+3.75)#3,814 |
| 88. | 49509 | 7.2% | 3.4%(+3.84)#89 | 3.5%(+3.74)#3,831 |
| 89. | 48367 | 7.2% | 3.4%(+3.83)#90 | 3.5%(+3.73)#3,843 |
| 90. | 49959 | 7.2% | 3.4%(+3.81)#91 | 3.5%(+3.71)#3,870 |
| 91. | 49644 | 7.1% | 3.4%(+3.73)#92 | 3.5%(+3.63)#3,947 |
| 92. | 49229 | 7.1% | 3.4%(+3.72)#93 | 3.5%(+3.62)#3,956 |
| 93. | 49621 | 7.0% | 3.4%(+3.66)#94 | 3.5%(+3.55)#4,032 |
| 94. | 49436 | 7.0% | 3.4%(+3.65)#95 | 3.5%(+3.55)#4,038 |
| 95. | 48218 | 7.0% | 3.4%(+3.60)#96 | 3.5%(+3.50)#4,094 |
| 96. | 49705 | 6.9% | 3.4%(+3.56)#97 | 3.5%(+3.46)#4,131 |
| 97. | 48228 | 6.9% | 3.4%(+3.54)#98 | 3.5%(+3.44)#4,165 |
| 98. | 49755 | 6.9% | 3.4%(+3.54)#99 | 3.5%(+3.43)#4,175 |
| 99. | 49683 | 6.9% | 3.4%(+3.53)#100 | 3.5%(+3.43)#4,187 |
| 100. | 48722 | 6.9% | 3.4%(+3.52)#101 | 3.5%(+3.42)#4,194 |
Common Questions
What are the Top 10 Zip Codes with the Highest Percentage of Population Employed in Cleaning & Maintenance in Michigan?
Top 10 Zip Codes with the Highest Percentage of Population Employed in Cleaning & Maintenance in Michigan are:
What zip code has the Highest Percentage of Population Employed in Cleaning & Maintenance in Michigan?
49942 has the Highest Percentage of Population Employed in Cleaning & Maintenance in Michigan with 71.4%.
What is the Percentage of Population Employed in Cleaning & Maintenance in the State of Michigan?
Percentage of Population Employed in Cleaning & Maintenance in Michigan is 3.4%.
What is the Percentage of Population Employed in Cleaning & Maintenance in the United States?
Percentage of Population Employed in Cleaning & Maintenance in the United States is 3.5%.