Woodford County, IL Map & Demographics
Woodford County Map
Woodford County Overview
$41,400
PER CAPITA INCOME
$99,662
AVG FAMILY INCOME
$80,093
AVG HOUSEHOLD INCOME
40.1%
WAGE / INCOME GAP [ % ]
59.9¢/ $1
WAGE / INCOME GAP [ $ ]
$11,290
FAMILY INCOME DEFICIT
0.43
INEQUALITY / GINI INDEX
38,414
TOTAL POPULATION
19,241
MALE POPULATION
19,173
FEMALE POPULATION
100.35
MALES / 100 FEMALES
99.65
FEMALES / 100 MALES
40.1
MEDIAN AGE
3.0
AVG FAMILY SIZE
2.5
AVG HOUSEHOLD SIZE
19,333
LABOR FORCE [ PEOPLE ]
63.8%
PERCENT IN LABOR FORCE
3.3%
UNEMPLOYMENT RATE
Woodford County Area Codes
Income in Woodford County
Income Overview in Woodford County
Per Capita Income in Woodford County is $41,400, while median incomes of families and households are $99,662 and $80,093 respectively.
| Characteristic | Number | Measure |
| Per Capita Income | 38,414 | $41,400 |
| Median Family Income | 10,379 | $99,662 |
| Mean Family Income | 10,379 | $122,623 |
| Median Household Income | 14,725 | $80,093 |
| Mean Household Income | 14,725 | $103,919 |
| Income Deficit | 10,379 | $11,290 |
| Wage / Income Gap (%) | 38,414 | 40.09% |
| Wage / Income Gap ($) | 38,414 | 59.91¢ per $1 |
| Gini / Inequality Index | 38,414 | 0.43 |
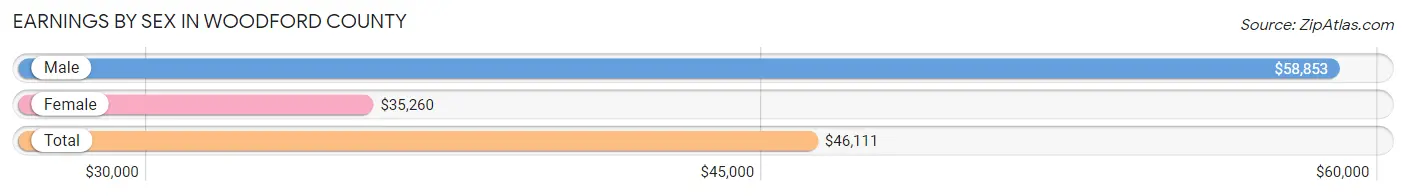
Earnings by Sex in Woodford County
Average Earnings in Woodford County are $46,111, $58,853 for men and $35,260 for women, a difference of 40.1%.
| Sex | Number | Average Earnings |
| Male | 10,967 (54.4%) | $58,853 |
| Female | 9,203 (45.6%) | $35,260 |
| Total | 20,170 (100.0%) | $46,111 |
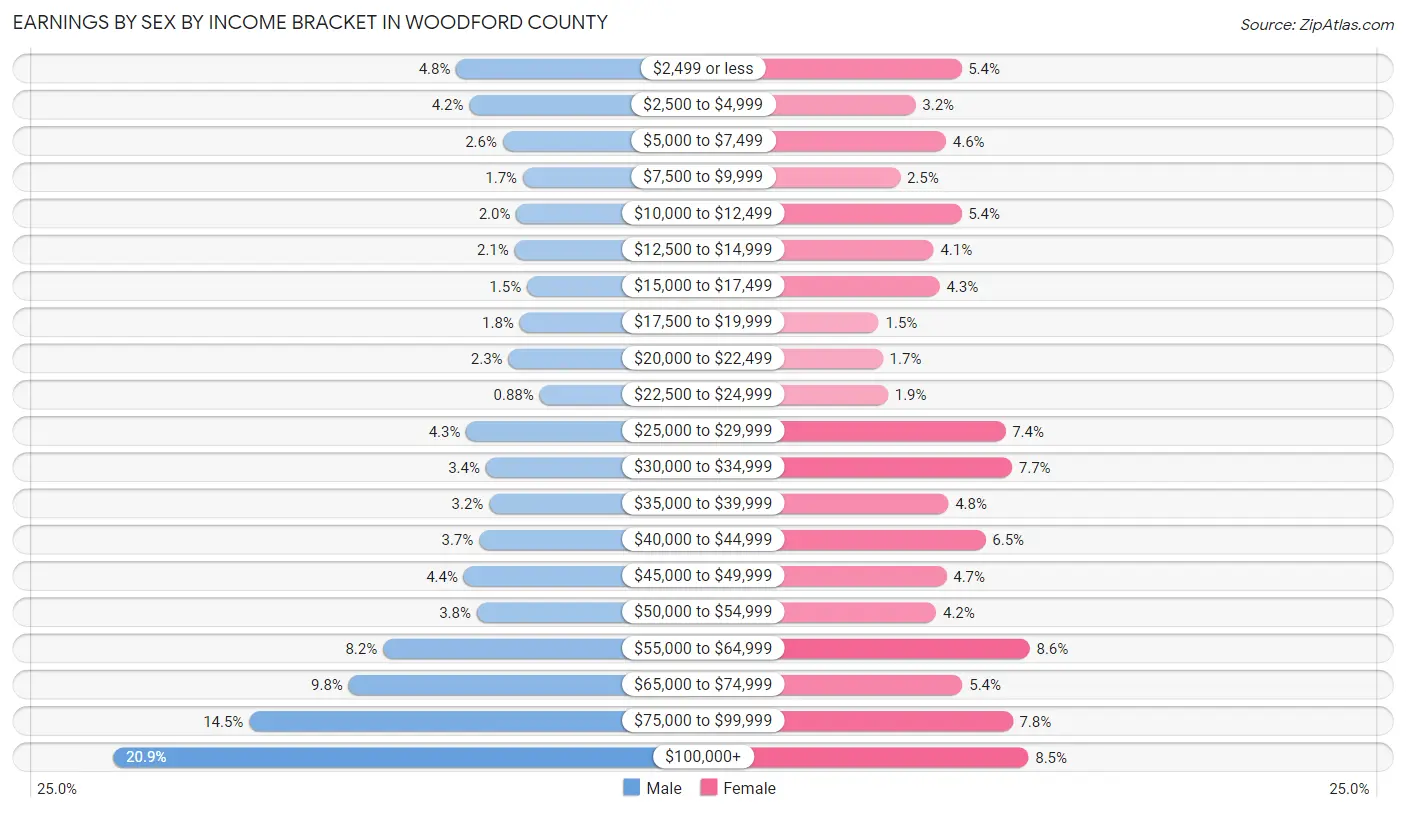
Earnings by Sex by Income Bracket in Woodford County
The most common earnings brackets in Woodford County are $100,000+ for men (2,287 | 20.8%) and $55,000 to $64,999 for women (788 | 8.6%).
| Income | Male | Female |
| $2,499 or less | 524 (4.8%) | 493 (5.4%) |
| $2,500 to $4,999 | 457 (4.2%) | 295 (3.2%) |
| $5,000 to $7,499 | 285 (2.6%) | 427 (4.6%) |
| $7,500 to $9,999 | 182 (1.7%) | 229 (2.5%) |
| $10,000 to $12,499 | 216 (2.0%) | 493 (5.4%) |
| $12,500 to $14,999 | 225 (2.1%) | 374 (4.1%) |
| $15,000 to $17,499 | 161 (1.5%) | 399 (4.3%) |
| $17,500 to $19,999 | 199 (1.8%) | 137 (1.5%) |
| $20,000 to $22,499 | 257 (2.3%) | 155 (1.7%) |
| $22,500 to $24,999 | 96 (0.9%) | 177 (1.9%) |
| $25,000 to $29,999 | 473 (4.3%) | 683 (7.4%) |
| $30,000 to $34,999 | 373 (3.4%) | 711 (7.7%) |
| $35,000 to $39,999 | 355 (3.2%) | 437 (4.8%) |
| $40,000 to $44,999 | 407 (3.7%) | 597 (6.5%) |
| $45,000 to $49,999 | 486 (4.4%) | 429 (4.7%) |
| $50,000 to $54,999 | 419 (3.8%) | 385 (4.2%) |
| $55,000 to $64,999 | 900 (8.2%) | 788 (8.6%) |
| $65,000 to $74,999 | 1,077 (9.8%) | 498 (5.4%) |
| $75,000 to $99,999 | 1,588 (14.5%) | 714 (7.8%) |
| $100,000+ | 2,287 (20.8%) | 782 (8.5%) |
| Total | 10,967 (100.0%) | 9,203 (100.0%) |
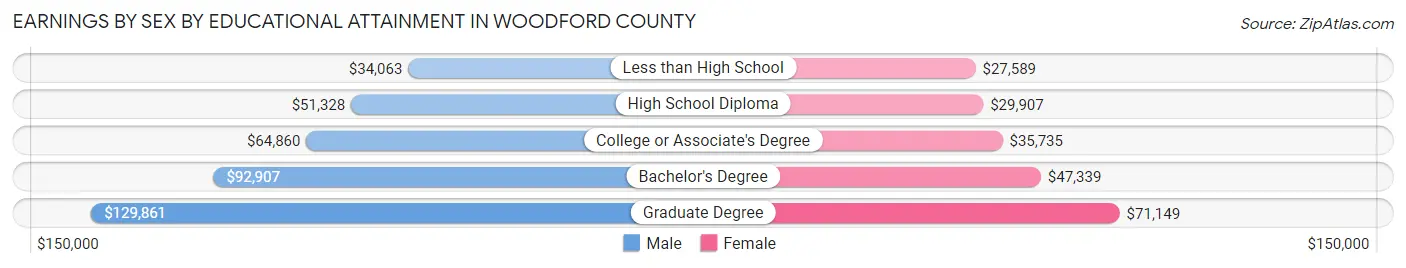
Earnings by Sex by Educational Attainment in Woodford County
Average earnings in Woodford County are $68,438 for men and $41,284 for women, a difference of 39.7%. Men with an educational attainment of graduate degree enjoy the highest average annual earnings of $129,861, while those with less than high school education earn the least with $34,063. Women with an educational attainment of graduate degree earn the most with the average annual earnings of $71,149, while those with less than high school education have the smallest earnings of $27,589.
| Educational Attainment | Male Income | Female Income |
| Less than High School | $34,063 | $27,589 |
| High School Diploma | $51,328 | $29,907 |
| College or Associate's Degree | $64,860 | $35,735 |
| Bachelor's Degree | $92,907 | $47,339 |
| Graduate Degree | $129,861 | $71,149 |
| Total | $68,438 | $41,284 |
Family Income in Woodford County
Family Income Brackets in Woodford County
According to the Woodford County family income data, there are 2,231 families falling into the $100,000 to $149,999 income range, which is the most common income bracket and makes up 21.5% of all families. Conversely, the $10,000 to $14,999 income bracket is the least frequent group with only 62 families (0.6%) belonging to this category.
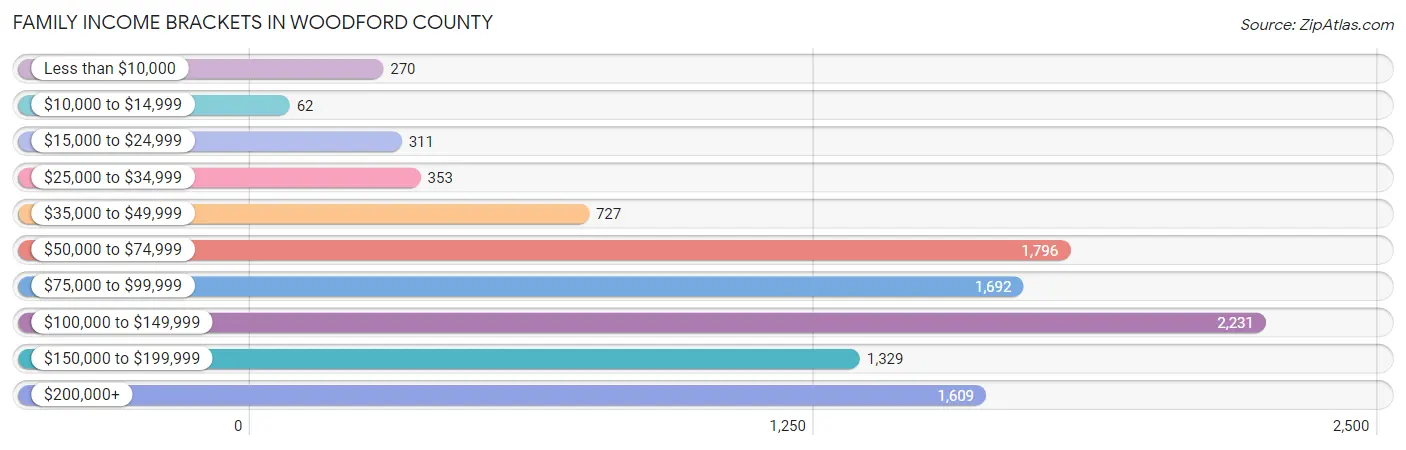
| Income Bracket | # Families | % Families |
| Less than $10,000 | 270 | 2.6% |
| $10,000 to $14,999 | 62 | 0.6% |
| $15,000 to $24,999 | 311 | 3.0% |
| $25,000 to $34,999 | 353 | 3.4% |
| $35,000 to $49,999 | 727 | 7.0% |
| $50,000 to $74,999 | 1,796 | 17.3% |
| $75,000 to $99,999 | 1,692 | 16.3% |
| $100,000 to $149,999 | 2,231 | 21.5% |
| $150,000 to $199,999 | 1,329 | 12.8% |
| $200,000+ | 1,609 | 15.5% |
Family Income by Famaliy Size in Woodford County
4-person families (1,870 | 18.0%) account for the highest median family income in Woodford County with $142,670 per family, while 2-person families (5,430 | 52.3%) have the highest median income of $42,522 per family member.
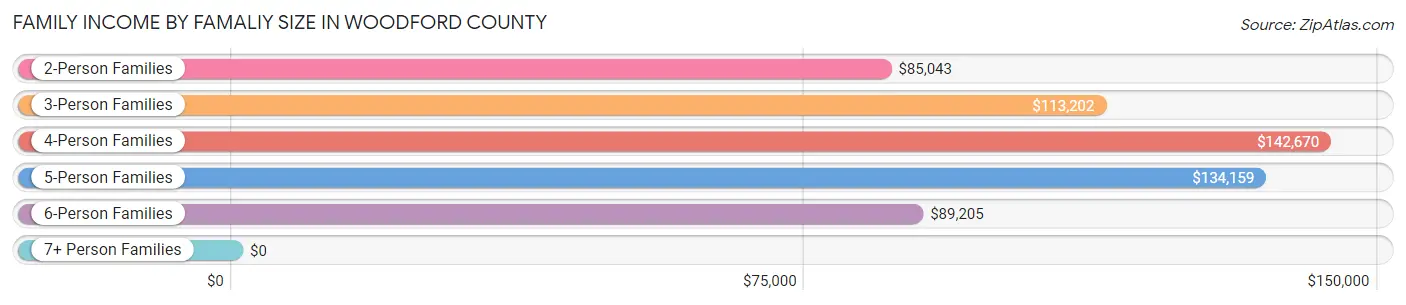
| Income Bracket | # Families | Median Income |
| 2-Person Families | 5,430 (52.3%) | $85,043 |
| 3-Person Families | 1,852 (17.8%) | $113,202 |
| 4-Person Families | 1,870 (18.0%) | $142,670 |
| 5-Person Families | 931 (9.0%) | $134,159 |
| 6-Person Families | 209 (2.0%) | $89,205 |
| 7+ Person Families | 87 (0.8%) | $0 |
| Total | 10,379 (100.0%) | $99,662 |
Family Income by Number of Earners in Woodford County
The median family income in Woodford County is $99,662, with families comprising 3+ earners (1,148) having the highest median family income of $177,069, while families with no earners (1,779) have the lowest median family income of $64,940, accounting for 11.1% and 17.1% of families, respectively.
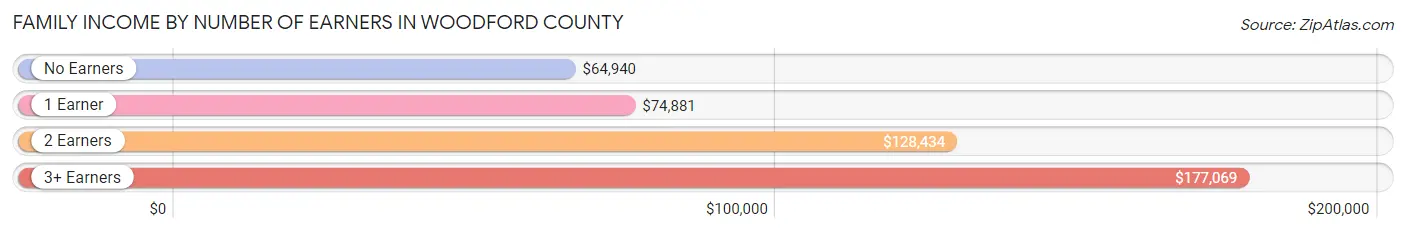
| Number of Earners | # Families | Median Income |
| No Earners | 1,779 (17.1%) | $64,940 |
| 1 Earner | 2,783 (26.8%) | $74,881 |
| 2 Earners | 4,669 (45.0%) | $128,434 |
| 3+ Earners | 1,148 (11.1%) | $177,069 |
| Total | 10,379 (100.0%) | $99,662 |
Household Income in Woodford County
Household Income Brackets in Woodford County
With 2,592 households falling in the category, the $50,000 to $74,999 income range is the most frequent in Woodford County, accounting for 17.6% of all households. In contrast, only 265 households (1.8%) fall into the $10,000 to $14,999 income bracket, making it the least populous group.
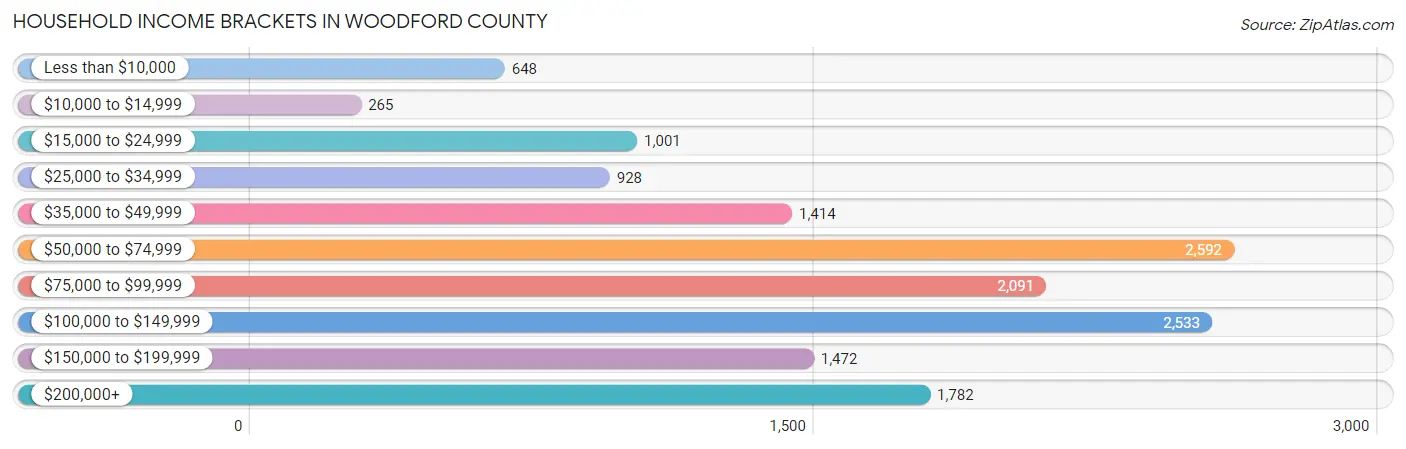
| Income Bracket | # Households | % Households |
| Less than $10,000 | 648 | 4.4% |
| $10,000 to $14,999 | 265 | 1.8% |
| $15,000 to $24,999 | 1,001 | 6.8% |
| $25,000 to $34,999 | 928 | 6.3% |
| $35,000 to $49,999 | 1,414 | 9.6% |
| $50,000 to $74,999 | 2,592 | 17.6% |
| $75,000 to $99,999 | 2,091 | 14.2% |
| $100,000 to $149,999 | 2,533 | 17.2% |
| $150,000 to $199,999 | 1,472 | 10.0% |
| $200,000+ | 1,782 | 12.1% |
Household Income by Householder Age in Woodford County
The median household income in Woodford County is $80,093, with the highest median household income of $97,731 found in the 45 to 64 years age bracket for the primary householder. A total of 5,430 households (36.9%) fall into this category. Meanwhile, the 15 to 24 years age bracket for the primary householder has the lowest median household income of $39,459, with 655 households (4.4%) in this group.
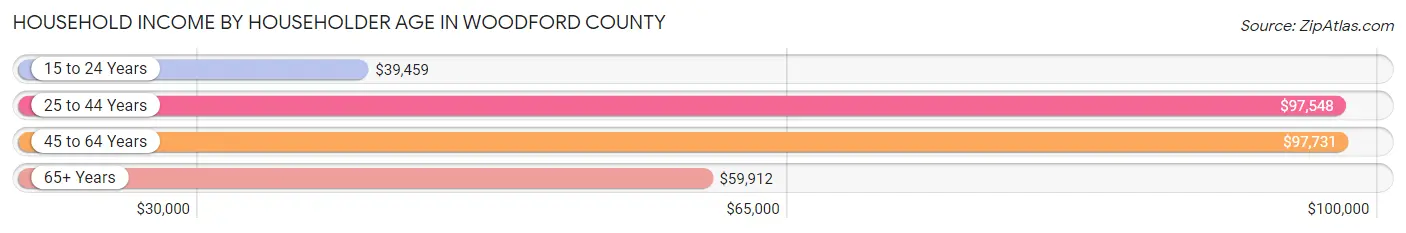
| Income Bracket | # Households | Median Income |
| 15 to 24 Years | 655 (4.4%) | $39,459 |
| 25 to 44 Years | 4,326 (29.4%) | $97,548 |
| 45 to 64 Years | 5,430 (36.9%) | $97,731 |
| 65+ Years | 4,314 (29.3%) | $59,912 |
| Total | 14,725 (100.0%) | $80,093 |
Poverty in Woodford County
Income Below Poverty by Sex and Age in Woodford County
With 7.1% poverty level for males and 7.8% for females among the residents of Woodford County, 16 and 17 year old males and 18 to 24 year old females are the most vulnerable to poverty, with 91 males (14.6%) and 267 females (18.3%) in their respective age groups living below the poverty level.
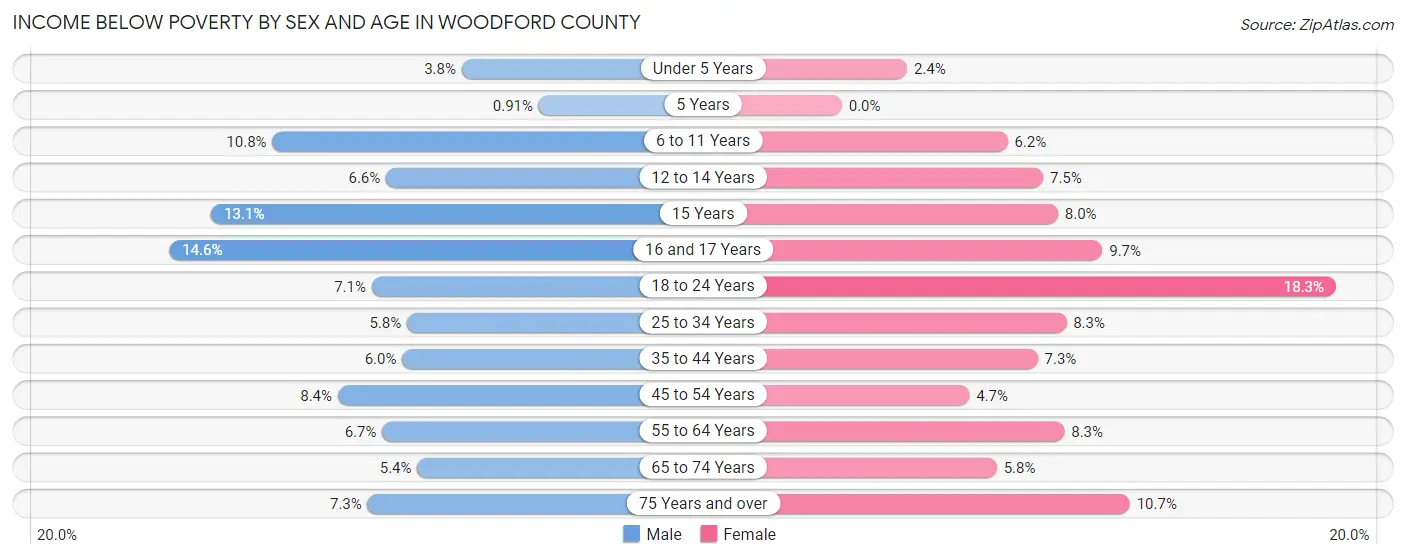
| Age Bracket | Male | Female |
| Under 5 Years | 43 (3.8%) | 24 (2.4%) |
| 5 Years | 2 (0.9%) | 0 (0.0%) |
| 6 to 11 Years | 175 (10.8%) | 96 (6.1%) |
| 12 to 14 Years | 53 (6.6%) | 48 (7.5%) |
| 15 Years | 34 (13.1%) | 28 (8.0%) |
| 16 and 17 Years | 91 (14.6%) | 44 (9.7%) |
| 18 to 24 Years | 112 (7.1%) | 267 (18.3%) |
| 25 to 34 Years | 116 (5.8%) | 158 (8.3%) |
| 35 to 44 Years | 144 (6.0%) | 179 (7.3%) |
| 45 to 54 Years | 196 (8.4%) | 104 (4.7%) |
| 55 to 64 Years | 177 (6.7%) | 220 (8.3%) |
| 65 to 74 Years | 109 (5.4%) | 114 (5.8%) |
| 75 Years and over | 78 (7.3%) | 176 (10.7%) |
| Total | 1,330 (7.1%) | 1,458 (7.8%) |
Income Above Poverty by Sex and Age in Woodford County
According to the poverty statistics in Woodford County, males aged 5 years and females aged 5 years are the age groups that are most secure financially, with 99.1% of males and 100.0% of females in these age groups living above the poverty line.
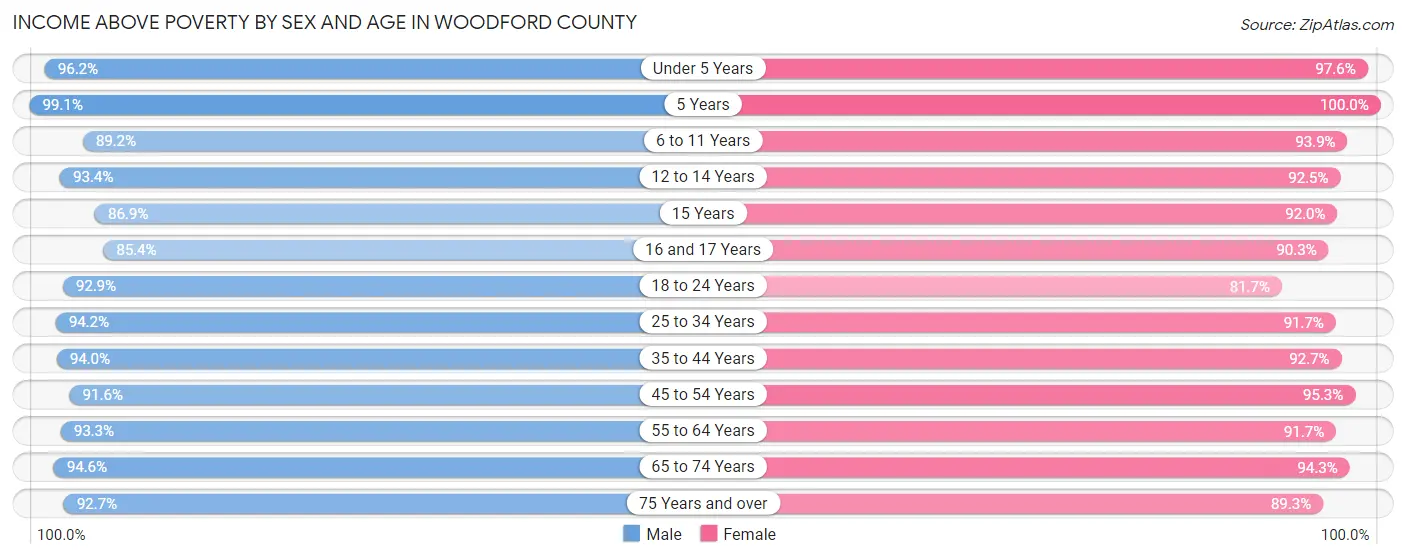
| Age Bracket | Male | Female |
| Under 5 Years | 1,098 (96.2%) | 969 (97.6%) |
| 5 Years | 217 (99.1%) | 334 (100.0%) |
| 6 to 11 Years | 1,445 (89.2%) | 1,465 (93.9%) |
| 12 to 14 Years | 753 (93.4%) | 595 (92.5%) |
| 15 Years | 226 (86.9%) | 321 (92.0%) |
| 16 and 17 Years | 531 (85.4%) | 411 (90.3%) |
| 18 to 24 Years | 1,463 (92.9%) | 1,189 (81.7%) |
| 25 to 34 Years | 1,885 (94.2%) | 1,739 (91.7%) |
| 35 to 44 Years | 2,263 (94.0%) | 2,284 (92.7%) |
| 45 to 54 Years | 2,146 (91.6%) | 2,095 (95.3%) |
| 55 to 64 Years | 2,457 (93.3%) | 2,442 (91.7%) |
| 65 to 74 Years | 1,903 (94.6%) | 1,868 (94.3%) |
| 75 Years and over | 995 (92.7%) | 1,470 (89.3%) |
| Total | 17,382 (92.9%) | 17,182 (92.2%) |
Income Below Poverty Among Married-Couple Families in Woodford County
The poverty statistics for married-couple families in Woodford County show that 3.2% or 280 of the total 8,844 families live below the poverty line. Families with 3 or 4 children have the highest poverty rate of 4.3%, comprising of 37 families. On the other hand, families with 5 or more children have the lowest poverty rate of 0.0%, which includes 0 families.
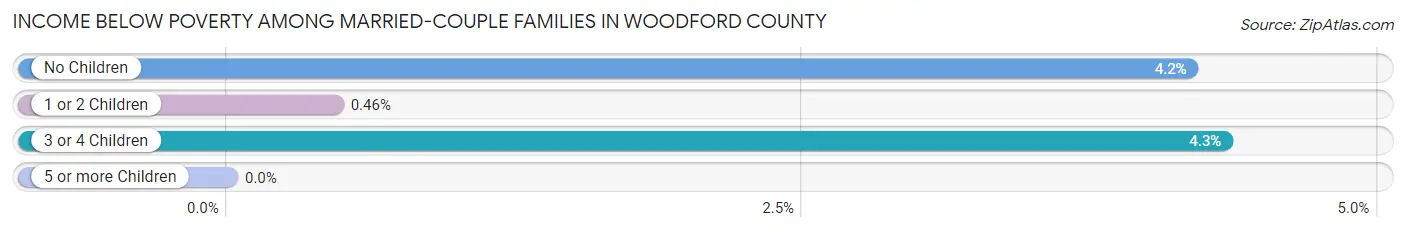
| Children | Above Poverty | Below Poverty |
| No Children | 5,319 (95.8%) | 232 (4.2%) |
| 1 or 2 Children | 2,364 (99.5%) | 11 (0.5%) |
| 3 or 4 Children | 818 (95.7%) | 37 (4.3%) |
| 5 or more Children | 63 (100.0%) | 0 (0.0%) |
| Total | 8,564 (96.8%) | 280 (3.2%) |
Income Below Poverty Among Single-Parent Households in Woodford County
According to the poverty data in Woodford County, 17.0% or 78 single-father households and 18.9% or 203 single-mother households are living below the poverty line. Among single-father households, those with 3 or 4 children have the highest poverty rate, with 19 households (44.2%) experiencing poverty. Likewise, among single-mother households, those with 3 or 4 children have the highest poverty rate, with 43 households (25.8%) falling below the poverty line.
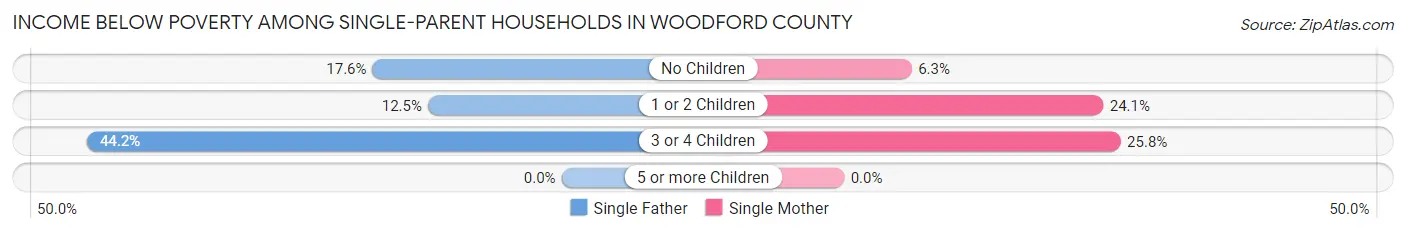
| Children | Single Father | Single Mother |
| No Children | 25 (17.6%) | 21 (6.3%) |
| 1 or 2 Children | 34 (12.4%) | 139 (24.1%) |
| 3 or 4 Children | 19 (44.2%) | 43 (25.8%) |
| 5 or more Children | 0 (0.0%) | 0 (0.0%) |
| Total | 78 (17.0%) | 203 (18.9%) |
Income Below Poverty Among Married-Couple vs Single-Parent Households in Woodford County
The poverty data for Woodford County shows that 280 of the married-couple family households (3.2%) and 281 of the single-parent households (18.3%) are living below the poverty level. Within the married-couple family households, those with 3 or 4 children have the highest poverty rate, with 37 households (4.3%) falling below the poverty line. Among the single-parent households, those with 3 or 4 children have the highest poverty rate, with 62 household (29.5%) living below poverty.
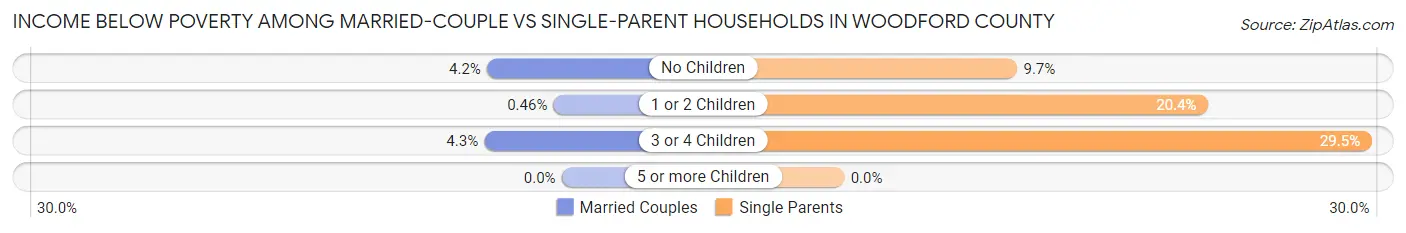
| Children | Married-Couple Families | Single-Parent Households |
| No Children | 232 (4.2%) | 46 (9.7%) |
| 1 or 2 Children | 11 (0.5%) | 173 (20.4%) |
| 3 or 4 Children | 37 (4.3%) | 62 (29.5%) |
| 5 or more Children | 0 (0.0%) | 0 (0.0%) |
| Total | 280 (3.2%) | 281 (18.3%) |
Race in Woodford County
The most populous races in Woodford County are White / Caucasian (36,710 | 95.6%), Two or more Races (959 | 2.5%), and Hispanic or Latino (740 | 1.9%).
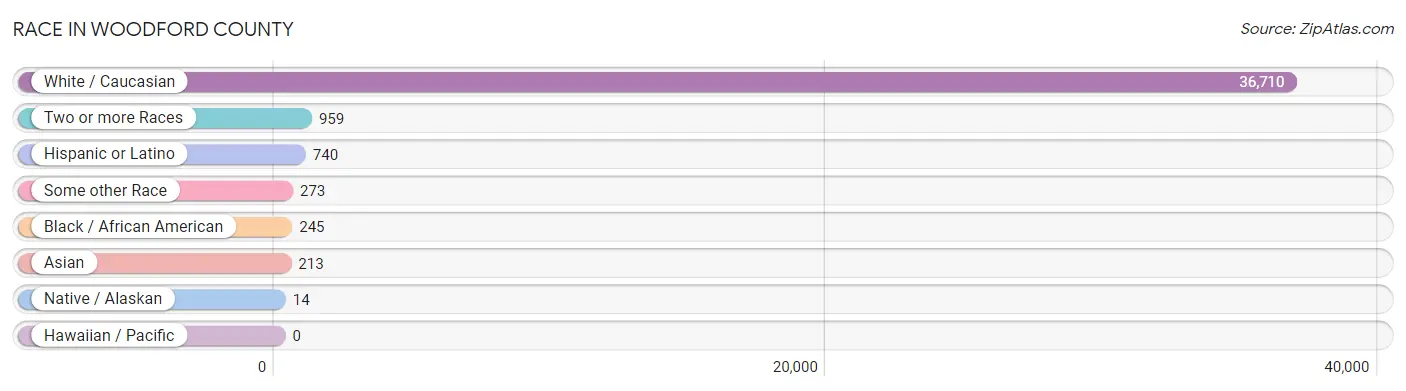
| Race | # Population | % Population |
| Asian | 213 | 0.5% |
| Black / African American | 245 | 0.6% |
| Hawaiian / Pacific | 0 | 0.0% |
| Hispanic or Latino | 740 | 1.9% |
| Native / Alaskan | 14 | 0.0% |
| White / Caucasian | 36,710 | 95.6% |
| Two or more Races | 959 | 2.5% |
| Some other Race | 273 | 0.7% |
| Total | 38,414 | 100.0% |
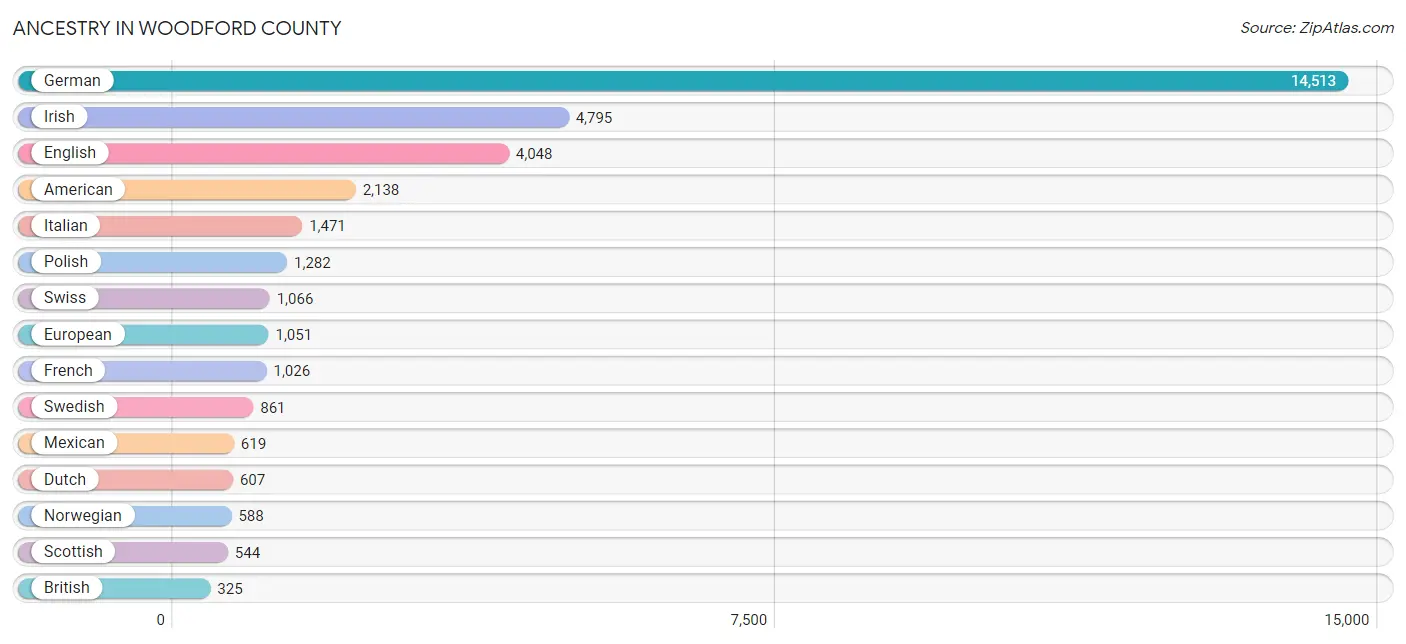
Ancestry in Woodford County
The most populous ancestries reported in Woodford County are German (14,513 | 37.8%), Irish (4,795 | 12.5%), English (4,048 | 10.5%), American (2,138 | 5.6%), and Italian (1,471 | 3.8%), together accounting for 70.2% of all Woodford County residents.
| Ancestry | # Population | % Population |
| African | 52 | 0.1% |
| American | 2,138 | 5.6% |
| Arab | 150 | 0.4% |
| Austrian | 157 | 0.4% |
| Belgian | 70 | 0.2% |
| Bhutanese | 7 | 0.0% |
| Blackfeet | 9 | 0.0% |
| British | 325 | 0.9% |
| Burmese | 66 | 0.2% |
| Canadian | 130 | 0.3% |
| Celtic | 9 | 0.0% |
| Central American | 7 | 0.0% |
| Cherokee | 36 | 0.1% |
| Choctaw | 1 | 0.0% |
| Croatian | 49 | 0.1% |
| Cuban | 8 | 0.0% |
| Czech | 159 | 0.4% |
| Czechoslovakian | 6 | 0.0% |
| Danish | 225 | 0.6% |
| Dutch | 607 | 1.6% |
| Eastern European | 59 | 0.2% |
| Egyptian | 14 | 0.0% |
| English | 4,048 | 10.5% |
| European | 1,051 | 2.7% |
| Finnish | 39 | 0.1% |
| French | 1,026 | 2.7% |
| French Canadian | 24 | 0.1% |
| German | 14,513 | 37.8% |
| Greek | 40 | 0.1% |
| Guyanese | 14 | 0.0% |
| Honduran | 7 | 0.0% |
| Hungarian | 112 | 0.3% |
| Indian (Asian) | 81 | 0.2% |
| Irish | 4,795 | 12.5% |
| Italian | 1,471 | 3.8% |
| Jamaican | 2 | 0.0% |
| Japanese | 57 | 0.2% |
| Korean | 127 | 0.3% |
| Lebanese | 136 | 0.4% |
| Lithuanian | 18 | 0.1% |
| Mexican | 619 | 1.6% |
| New Zealander | 18 | 0.1% |
| Northern European | 35 | 0.1% |
| Norwegian | 588 | 1.5% |
| Pakistani | 10 | 0.0% |
| Peruvian | 3 | 0.0% |
| Polish | 1,282 | 3.3% |
| Portuguese | 5 | 0.0% |
| Puerto Rican | 45 | 0.1% |
| Russian | 120 | 0.3% |
| Scandinavian | 131 | 0.3% |
| Scotch-Irish | 218 | 0.6% |
| Scottish | 544 | 1.4% |
| Slovak | 46 | 0.1% |
| Slovene | 19 | 0.1% |
| South American | 3 | 0.0% |
| Spanish | 29 | 0.1% |
| Subsaharan African | 52 | 0.1% |
| Swedish | 861 | 2.2% |
| Swiss | 1,066 | 2.8% |
| Thai | 66 | 0.2% |
| Turkish | 43 | 0.1% |
| Welsh | 161 | 0.4% |
| West Indian | 1 | 0.0% |
| Yugoslavian | 8 | 0.0% | View All 65 Rows |
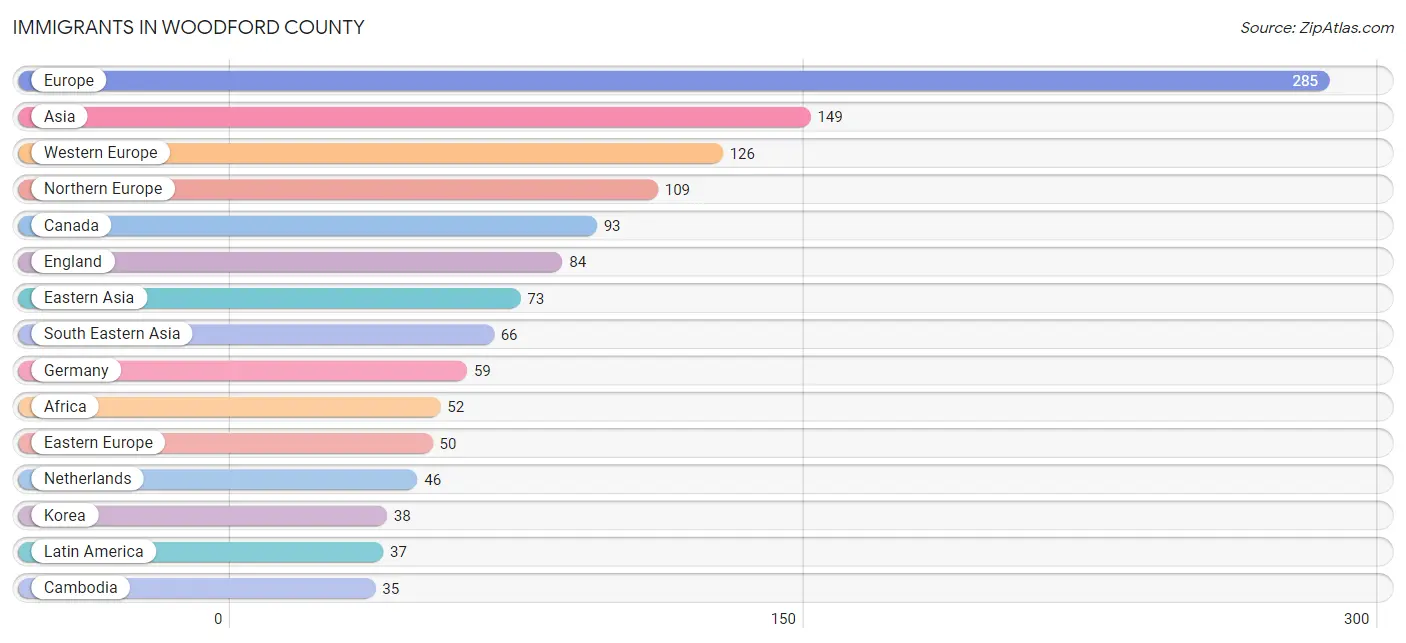
Immigrants in Woodford County
The most numerous immigrant groups reported in Woodford County came from Europe (285 | 0.7%), Asia (149 | 0.4%), Western Europe (126 | 0.3%), Northern Europe (109 | 0.3%), and Canada (93 | 0.2%), together accounting for 2.0% of all Woodford County residents.
| Immigration Origin | # Population | % Population |
| Africa | 52 | 0.1% |
| Asia | 149 | 0.4% |
| Cambodia | 35 | 0.1% |
| Canada | 93 | 0.2% |
| Caribbean | 1 | 0.0% |
| Central America | 22 | 0.1% |
| China | 35 | 0.1% |
| Eastern Africa | 35 | 0.1% |
| Eastern Asia | 73 | 0.2% |
| Eastern Europe | 50 | 0.1% |
| Egypt | 17 | 0.0% |
| England | 84 | 0.2% |
| Ethiopia | 28 | 0.1% |
| Europe | 285 | 0.7% |
| France | 21 | 0.1% |
| Germany | 59 | 0.2% |
| Guyana | 14 | 0.0% |
| Haiti | 1 | 0.0% |
| India | 6 | 0.0% |
| Ireland | 8 | 0.0% |
| Korea | 38 | 0.1% |
| Latin America | 37 | 0.1% |
| Latvia | 3 | 0.0% |
| Mexico | 22 | 0.1% |
| Moldova | 6 | 0.0% |
| Netherlands | 46 | 0.1% |
| Northern Africa | 17 | 0.0% |
| Northern Europe | 109 | 0.3% |
| Norway | 8 | 0.0% |
| Pakistan | 4 | 0.0% |
| Philippines | 30 | 0.1% |
| Poland | 25 | 0.1% |
| Russia | 16 | 0.0% |
| South America | 14 | 0.0% |
| South Central Asia | 10 | 0.0% |
| South Eastern Asia | 66 | 0.2% |
| Thailand | 1 | 0.0% |
| Western Europe | 126 | 0.3% | View All 38 Rows |
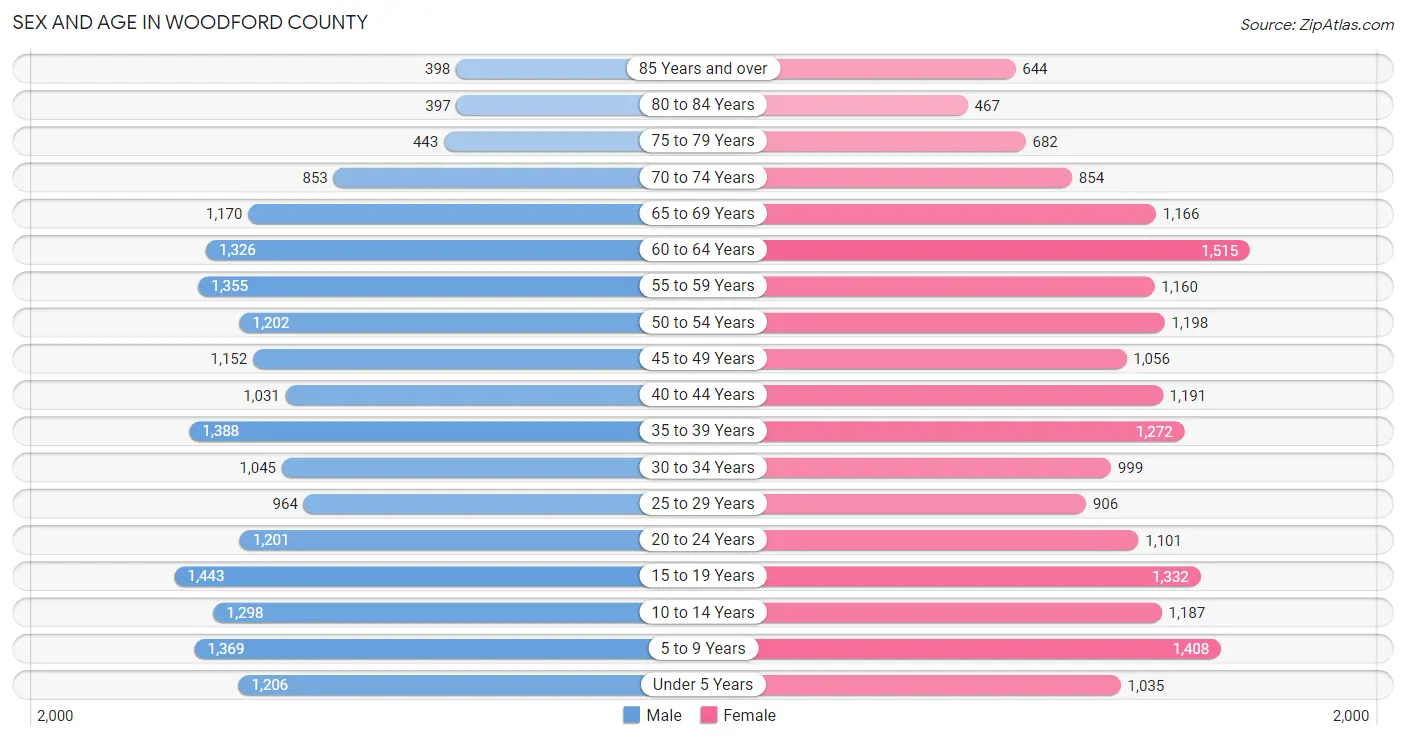
Sex and Age in Woodford County
Sex and Age in Woodford County
The most populous age groups in Woodford County are 15 to 19 Years (1,443 | 7.5%) for men and 60 to 64 Years (1,515 | 7.9%) for women.
| Age Bracket | Male | Female |
| Under 5 Years | 1,206 (6.3%) | 1,035 (5.4%) |
| 5 to 9 Years | 1,369 (7.1%) | 1,408 (7.3%) |
| 10 to 14 Years | 1,298 (6.8%) | 1,187 (6.2%) |
| 15 to 19 Years | 1,443 (7.5%) | 1,332 (7.0%) |
| 20 to 24 Years | 1,201 (6.2%) | 1,101 (5.7%) |
| 25 to 29 Years | 964 (5.0%) | 906 (4.7%) |
| 30 to 34 Years | 1,045 (5.4%) | 999 (5.2%) |
| 35 to 39 Years | 1,388 (7.2%) | 1,272 (6.6%) |
| 40 to 44 Years | 1,031 (5.4%) | 1,191 (6.2%) |
| 45 to 49 Years | 1,152 (6.0%) | 1,056 (5.5%) |
| 50 to 54 Years | 1,202 (6.2%) | 1,198 (6.2%) |
| 55 to 59 Years | 1,355 (7.0%) | 1,160 (6.0%) |
| 60 to 64 Years | 1,326 (6.9%) | 1,515 (7.9%) |
| 65 to 69 Years | 1,170 (6.1%) | 1,166 (6.1%) |
| 70 to 74 Years | 853 (4.4%) | 854 (4.4%) |
| 75 to 79 Years | 443 (2.3%) | 682 (3.6%) |
| 80 to 84 Years | 397 (2.1%) | 467 (2.4%) |
| 85 Years and over | 398 (2.1%) | 644 (3.4%) |
| Total | 19,241 (100.0%) | 19,173 (100.0%) |
Families and Households in Woodford County
Median Family Size in Woodford County
The median family size in Woodford County is 3.04 persons per family, with married-couple families (8,844 | 85.2%) accounting for the largest median family size of 3.08 persons per family. On the other hand, single male/father families (458 | 4.4%) represent the smallest median family size with 2.62 persons per family.

| Family Type | # Families | Family Size |
| Married-Couple | 8,844 (85.2%) | 3.08 |
| Single Male/Father | 458 (4.4%) | 2.62 |
| Single Female/Mother | 1,077 (10.4%) | 2.92 |
| Total Families | 10,379 (100.0%) | 3.04 |
Median Household Size in Woodford County
The median household size in Woodford County is 2.54 persons per household, with single male/father households (458 | 3.1%) accounting for the largest median household size of 3.28 persons per household. non-family households (4,346 | 29.5%) represent the smallest median household size with 1.16 persons per household.

| Household Type | # Households | Household Size |
| Married-Couple | 8,844 (60.1%) | 3.11 |
| Single Male/Father | 458 (3.1%) | 3.28 |
| Single Female/Mother | 1,077 (7.3%) | 3.17 |
| Non-family | 4,346 (29.5%) | 1.16 |
| Total Households | 14,725 (100.0%) | 2.54 |
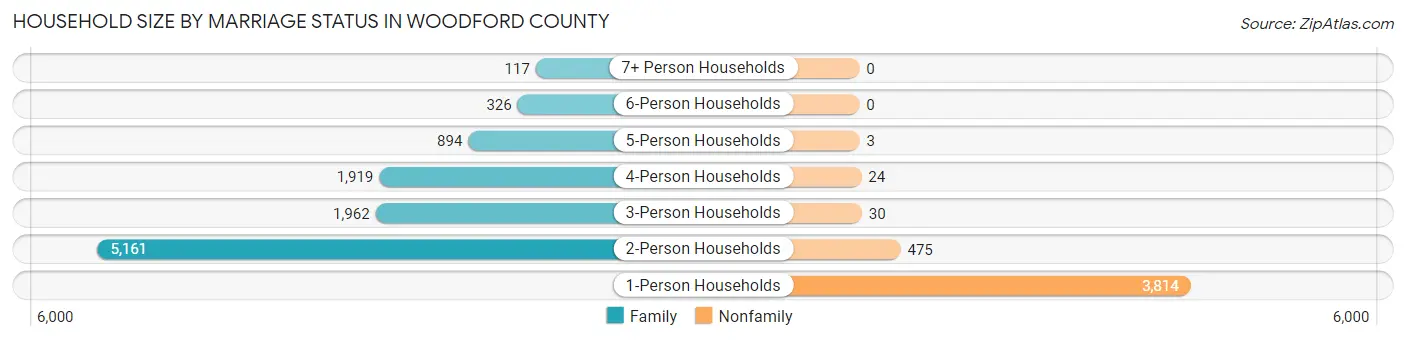
Household Size by Marriage Status in Woodford County
Out of a total of 14,725 households in Woodford County, 10,379 (70.5%) are family households, while 4,346 (29.5%) are nonfamily households. The most numerous type of family households are 2-person households, comprising 5,161, and the most common type of nonfamily households are 1-person households, comprising 3,814.
| Household Size | Family Households | Nonfamily Households |
| 1-Person Households | - | 3,814 (25.9%) |
| 2-Person Households | 5,161 (35.0%) | 475 (3.2%) |
| 3-Person Households | 1,962 (13.3%) | 30 (0.2%) |
| 4-Person Households | 1,919 (13.0%) | 24 (0.2%) |
| 5-Person Households | 894 (6.1%) | 3 (0.0%) |
| 6-Person Households | 326 (2.2%) | 0 (0.0%) |
| 7+ Person Households | 117 (0.8%) | 0 (0.0%) |
| Total | 10,379 (70.5%) | 4,346 (29.5%) |
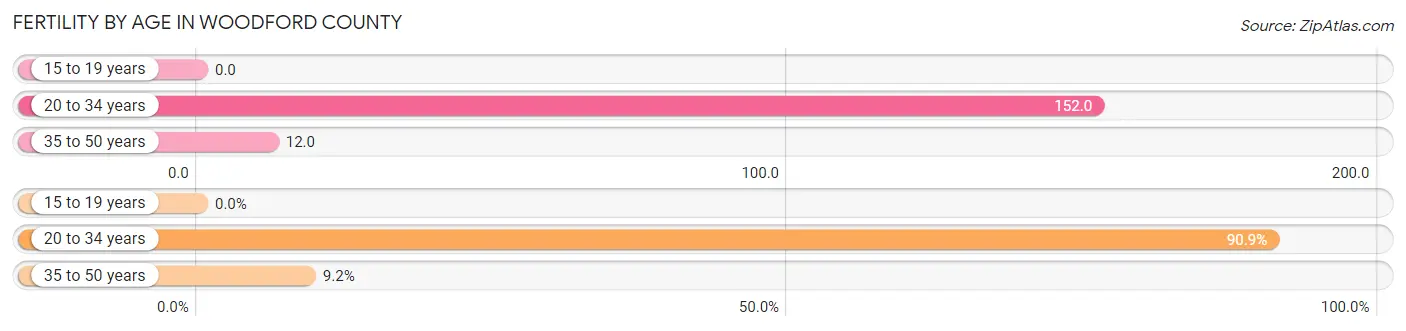
Female Fertility in Woodford County
Fertility by Age in Woodford County
Average fertility rate in Woodford County is 62.0 births per 1,000 women. Women in the age bracket of 20 to 34 years have the highest fertility rate with 152.0 births per 1,000 women. Women in the age bracket of 20 to 34 years acount for 90.8% of all women with births.
| Age Bracket | Women with Births | Births / 1,000 Women |
| 15 to 19 years | 0 (0.0%) | 0.0 |
| 20 to 34 years | 457 (90.8%) | 152.0 |
| 35 to 50 years | 46 (9.1%) | 12.0 |
| Total | 503 (100.0%) | 62.0 |
Fertility by Age by Marriage Status in Woodford County
92.0% of women with births (503) in Woodford County are married. The highest percentage of unmarried women with births falls into 20 to 34 years age bracket with 8.7% of them unmarried at the time of birth, while the lowest percentage of unmarried women with births belong to 35 to 50 years age bracket with 0.0% of them unmarried.
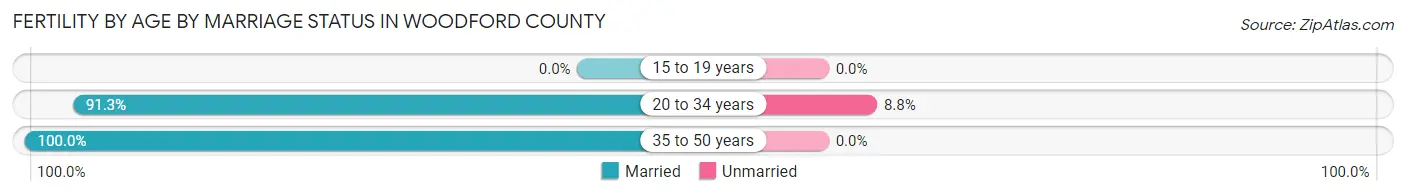
| Age Bracket | Married | Unmarried |
| 15 to 19 years | 0 (0.0%) | 0 (0.0%) |
| 20 to 34 years | 417 (91.2%) | 40 (8.7%) |
| 35 to 50 years | 46 (100.0%) | 0 (0.0%) |
| Total | 463 (92.0%) | 40 (8.0%) |
Fertility by Education in Woodford County
Average fertility rate in Woodford County is 62.0 births per 1,000 women. Women with the education attainment of graduate degree have the highest fertility rate of 124.0 births per 1,000 women, while women with the education attainment of less than high school have the lowest fertility at 4.0 births per 1,000 women. Women with the education attainment of graduate degree represent 31.2% of all women with births.
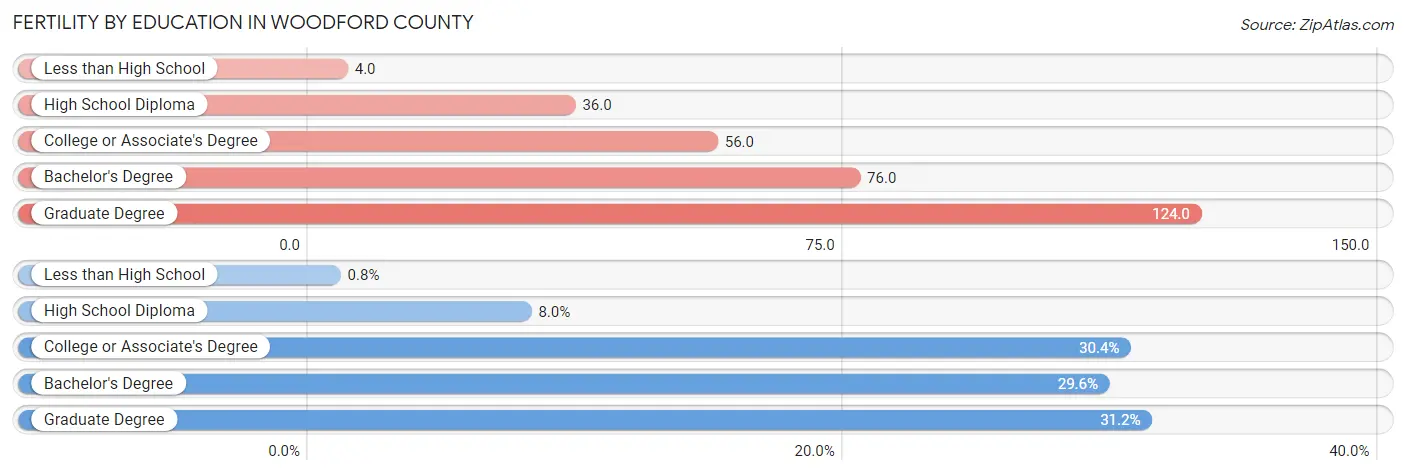
| Educational Attainment | Women with Births | Births / 1,000 Women |
| Less than High School | 4 (0.8%) | 4.0 |
| High School Diploma | 40 (8.0%) | 36.0 |
| College or Associate's Degree | 153 (30.4%) | 56.0 |
| Bachelor's Degree | 149 (29.6%) | 76.0 |
| Graduate Degree | 157 (31.2%) | 124.0 |
| Total | 503 (100.0%) | 62.0 |
Fertility by Education by Marriage Status in Woodford County
8.0% of women with births in Woodford County are unmarried. Women with the educational attainment of less than high school are most likely to be married with 100.0% of them married at childbirth, while women with the educational attainment of high school diploma are least likely to be married with 47.5% of them unmarried at childbirth.
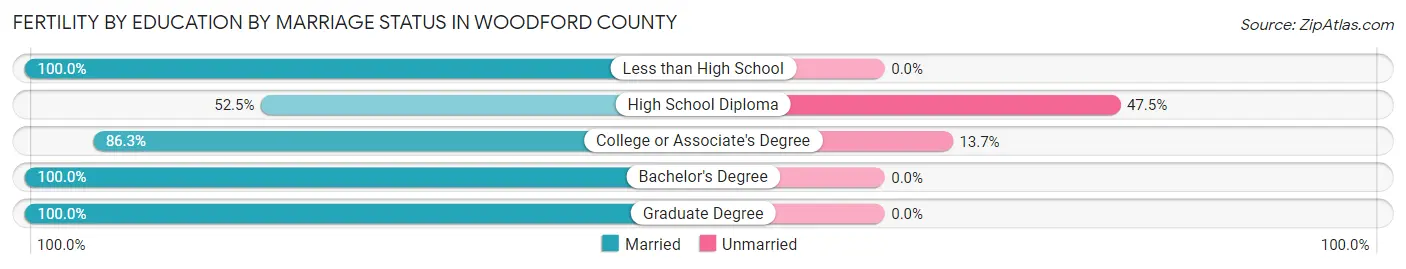
| Educational Attainment | Married | Unmarried |
| Less than High School | 4 (100.0%) | 0 (0.0%) |
| High School Diploma | 21 (52.5%) | 19 (47.5%) |
| College or Associate's Degree | 132 (86.3%) | 21 (13.7%) |
| Bachelor's Degree | 149 (100.0%) | 0 (0.0%) |
| Graduate Degree | 157 (100.0%) | 0 (0.0%) |
| Total | 463 (92.0%) | 40 (8.0%) |
Employment Characteristics in Woodford County
Employment by Class of Employer in Woodford County
Among the 18,421 employed individuals in Woodford County, private company employees (12,673 | 68.8%), not-for-profit organizations (2,193 | 11.9%), and local government employees (1,340 | 7.3%) make up the most common classes of employment.
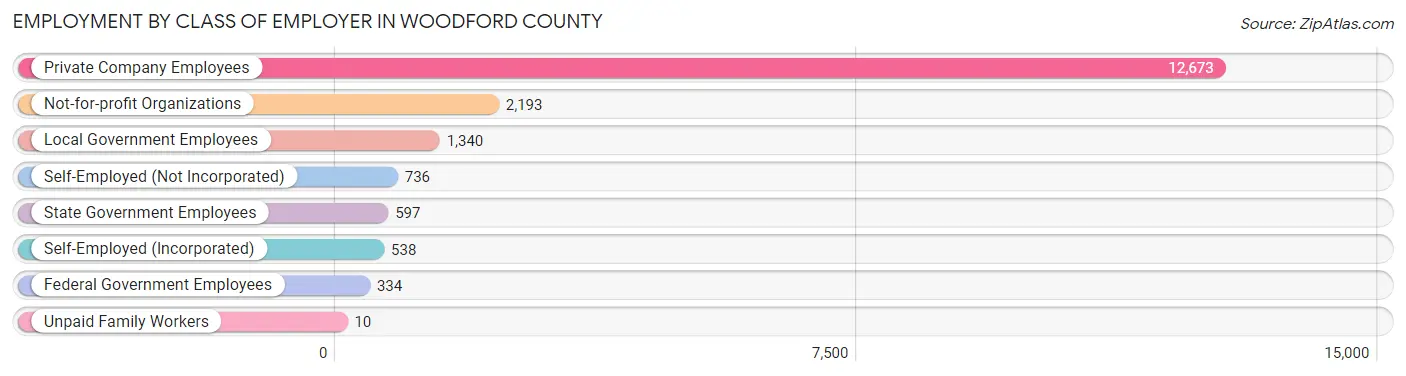
| Employer Class | # Employees | % Employees |
| Private Company Employees | 12,673 | 68.8% |
| Self-Employed (Incorporated) | 538 | 2.9% |
| Self-Employed (Not Incorporated) | 736 | 4.0% |
| Not-for-profit Organizations | 2,193 | 11.9% |
| Local Government Employees | 1,340 | 7.3% |
| State Government Employees | 597 | 3.2% |
| Federal Government Employees | 334 | 1.8% |
| Unpaid Family Workers | 10 | 0.1% |
| Total | 18,421 | 100.0% |
Employment Status by Age in Woodford County
According to the labor force statistics for Woodford County, out of the total population over 16 years of age (30,302), 63.8% or 19,333 individuals are in the labor force, with 3.3% or 638 of them unemployed. The age group with the highest labor force participation rate is 25 to 29 years, with 94.9% or 1,775 individuals in the labor force. Within the labor force, the 25 to 29 years age range has the highest percentage of unemployed individuals, with 6.7% or 119 of them being unemployed.
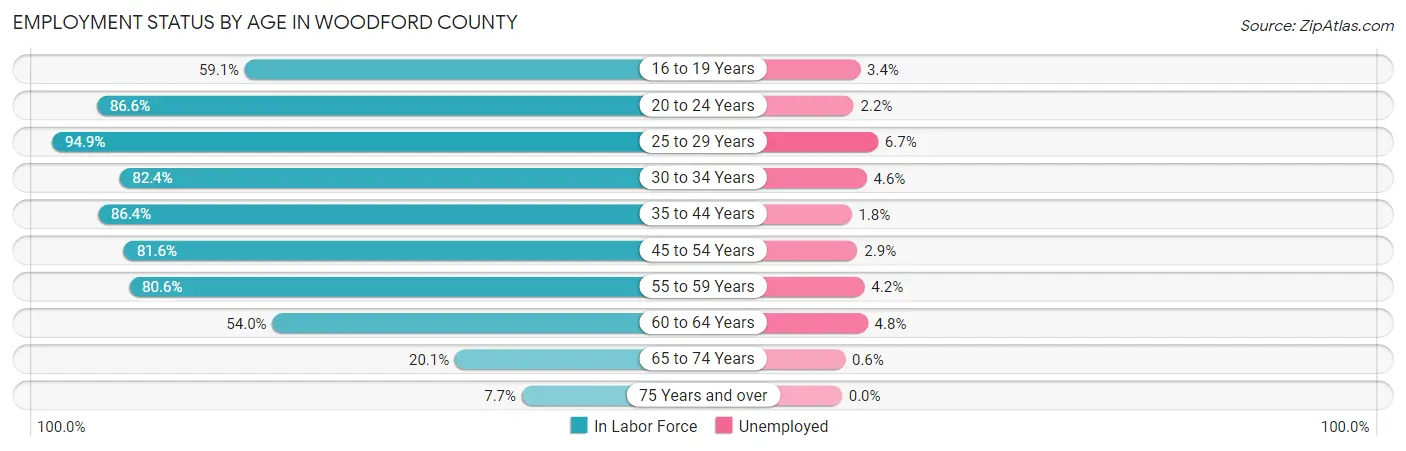
| Age Bracket | In Labor Force | Unemployed |
| 16 to 19 Years | 1,280 (59.1%) | 44 (3.4%) |
| 20 to 24 Years | 1,994 (86.6%) | 44 (2.2%) |
| 25 to 29 Years | 1,775 (94.9%) | 119 (6.7%) |
| 30 to 34 Years | 1,684 (82.4%) | 77 (4.6%) |
| 35 to 44 Years | 4,218 (86.4%) | 76 (1.8%) |
| 45 to 54 Years | 3,760 (81.6%) | 109 (2.9%) |
| 55 to 59 Years | 2,027 (80.6%) | 85 (4.2%) |
| 60 to 64 Years | 1,534 (54.0%) | 74 (4.8%) |
| 65 to 74 Years | 813 (20.1%) | 5 (0.6%) |
| 75 Years and over | 233 (7.7%) | 0 (0.0%) |
| Total | 19,333 (63.8%) | 638 (3.3%) |
Employment Status by Educational Attainment in Woodford County
According to labor force statistics for Woodford County, 80.0% of individuals (15,008) out of the total population between 25 and 64 years of age (18,760) are in the labor force, with 3.6% or 540 of them being unemployed. The group with the highest labor force participation rate are those with the educational attainment of bachelor's degree or higher, with 86.6% or 6,595 individuals in the labor force. Within the labor force, individuals with high school diploma education have the highest percentage of unemployment, with 6.9% or 210 of them being unemployed.
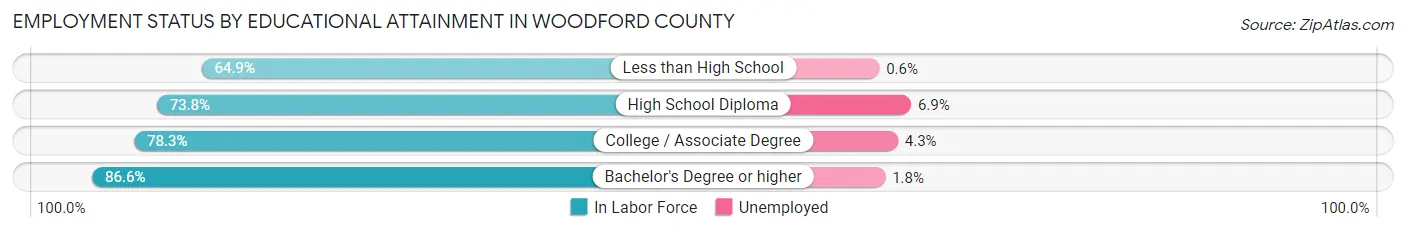
| Educational Attainment | In Labor Force | Unemployed |
| Less than High School | 650 (64.9%) | 6 (0.6%) |
| High School Diploma | 3,046 (73.8%) | 285 (6.9%) |
| College / Associate Degree | 4,709 (78.3%) | 259 (4.3%) |
| Bachelor's Degree or higher | 6,595 (86.6%) | 137 (1.8%) |
| Total | 15,008 (80.0%) | 675 (3.6%) |
Employment Occupations by Sex in Woodford County
Management, Business, Science and Arts Occupations
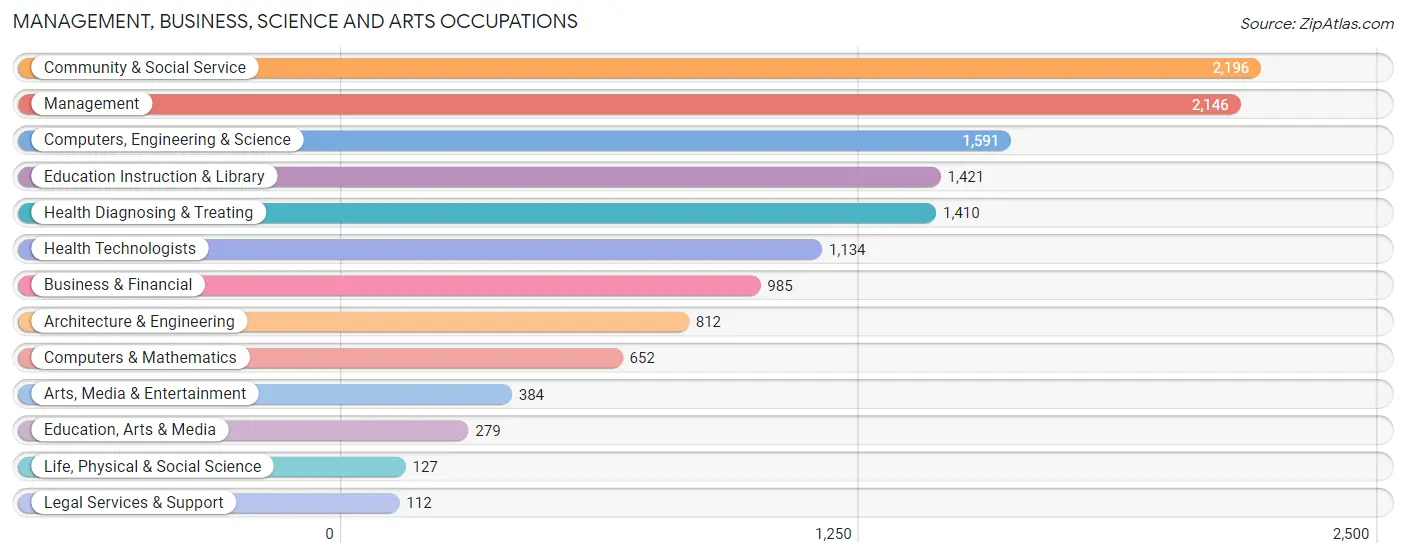
The most common Management, Business, Science and Arts occupations in Woodford County are Community & Social Service (2,196 | 11.8%), Management (2,146 | 11.5%), Computers, Engineering & Science (1,591 | 8.6%), Education Instruction & Library (1,421 | 7.6%), and Health Diagnosing & Treating (1,410 | 7.6%).
Management, Business, Science and Arts Occupations by Sex
Within the Management, Business, Science and Arts occupations in Woodford County, the most male-oriented occupations are Architecture & Engineering (92.7%), Computers, Engineering & Science (83.9%), and Computers & Mathematics (80.1%), while the most female-oriented occupations are Health Technologists (82.1%), Health Diagnosing & Treating (79.6%), and Education Instruction & Library (72.2%).
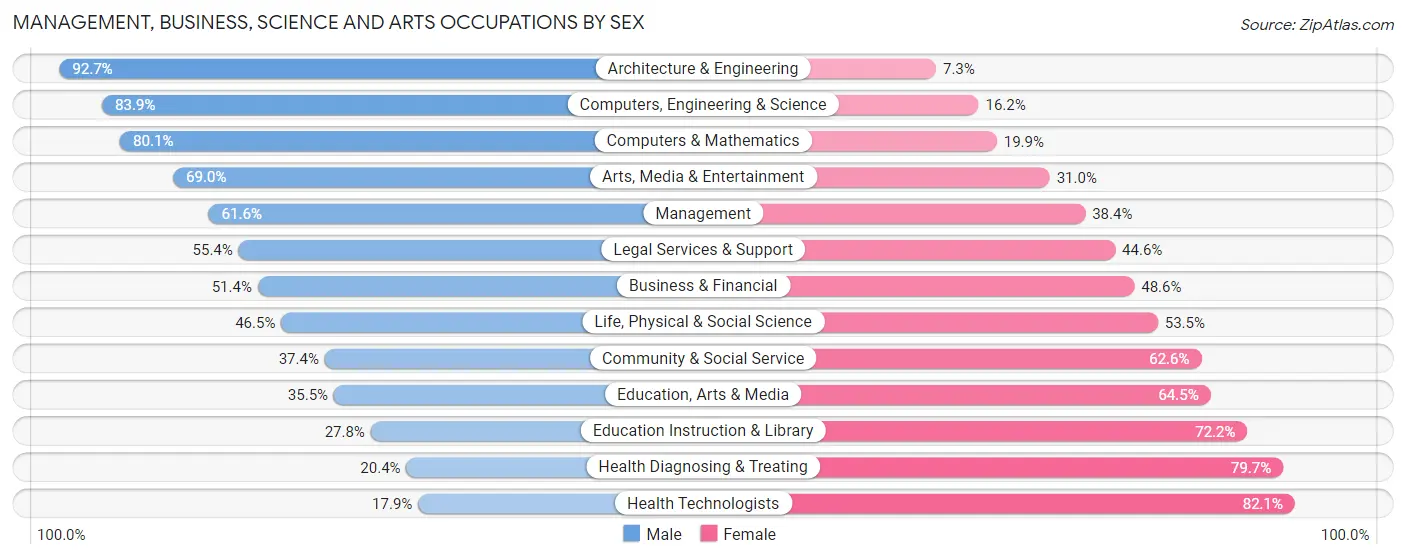
| Occupation | Male | Female |
| Management | 1,322 (61.6%) | 824 (38.4%) |
| Business & Financial | 506 (51.4%) | 479 (48.6%) |
| Computers, Engineering & Science | 1,334 (83.9%) | 257 (16.2%) |
| Computers & Mathematics | 522 (80.1%) | 130 (19.9%) |
| Architecture & Engineering | 753 (92.7%) | 59 (7.3%) |
| Life, Physical & Social Science | 59 (46.5%) | 68 (53.5%) |
| Community & Social Service | 821 (37.4%) | 1,375 (62.6%) |
| Education, Arts & Media | 99 (35.5%) | 180 (64.5%) |
| Legal Services & Support | 62 (55.4%) | 50 (44.6%) |
| Education Instruction & Library | 395 (27.8%) | 1,026 (72.2%) |
| Arts, Media & Entertainment | 265 (69.0%) | 119 (31.0%) |
| Health Diagnosing & Treating | 287 (20.3%) | 1,123 (79.6%) |
| Health Technologists | 203 (17.9%) | 931 (82.1%) |
| Total (Category) | 4,270 (51.3%) | 4,058 (48.7%) |
| Total (Overall) | 9,950 (53.5%) | 8,649 (46.5%) |
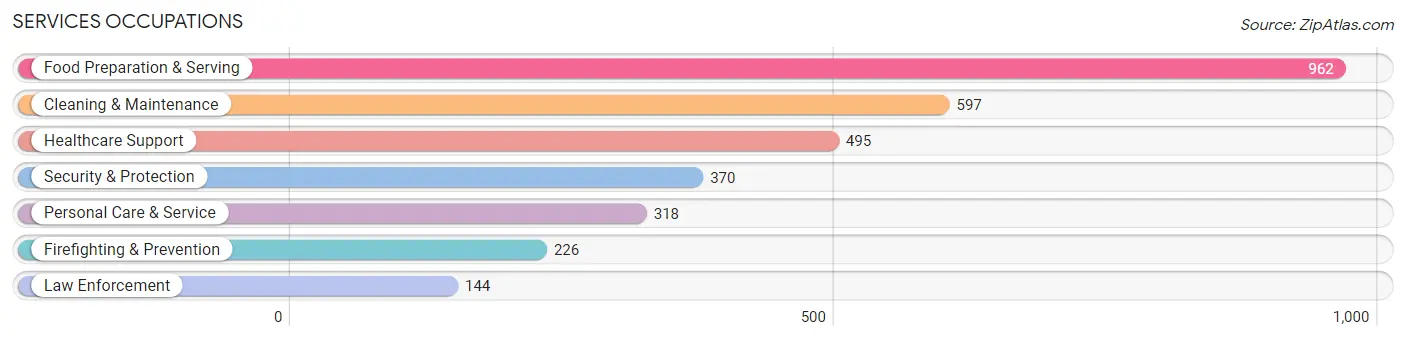
Services Occupations
The most common Services occupations in Woodford County are Food Preparation & Serving (962 | 5.2%), Cleaning & Maintenance (597 | 3.2%), Healthcare Support (495 | 2.7%), Security & Protection (370 | 2.0%), and Personal Care & Service (318 | 1.7%).
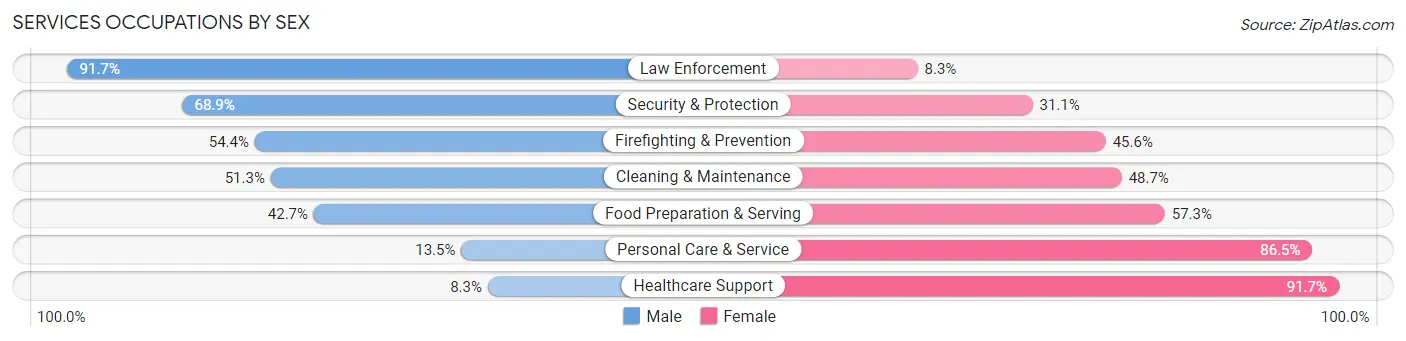
Services Occupations by Sex
Within the Services occupations in Woodford County, the most male-oriented occupations are Law Enforcement (91.7%), Security & Protection (68.9%), and Firefighting & Prevention (54.4%), while the most female-oriented occupations are Healthcare Support (91.7%), Personal Care & Service (86.5%), and Food Preparation & Serving (57.3%).
| Occupation | Male | Female |
| Healthcare Support | 41 (8.3%) | 454 (91.7%) |
| Security & Protection | 255 (68.9%) | 115 (31.1%) |
| Firefighting & Prevention | 123 (54.4%) | 103 (45.6%) |
| Law Enforcement | 132 (91.7%) | 12 (8.3%) |
| Food Preparation & Serving | 411 (42.7%) | 551 (57.3%) |
| Cleaning & Maintenance | 306 (51.3%) | 291 (48.7%) |
| Personal Care & Service | 43 (13.5%) | 275 (86.5%) |
| Total (Category) | 1,056 (38.5%) | 1,686 (61.5%) |
| Total (Overall) | 9,950 (53.5%) | 8,649 (46.5%) |
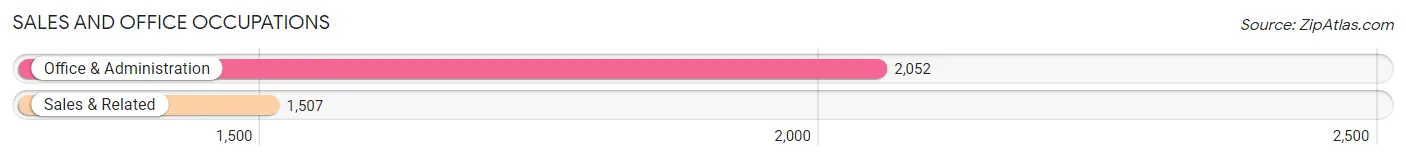
Sales and Office Occupations
The most common Sales and Office occupations in Woodford County are Office & Administration (2,052 | 11.0%), and Sales & Related (1,507 | 8.1%).
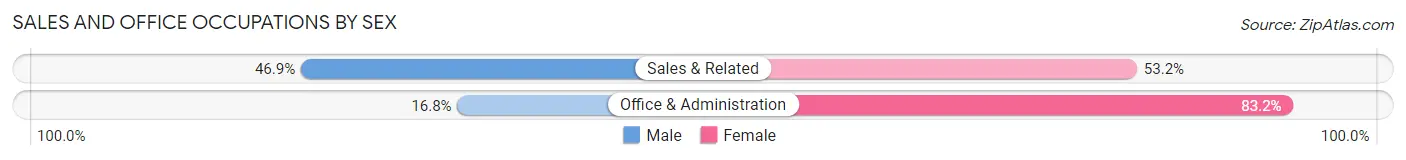
Sales and Office Occupations by Sex
| Occupation | Male | Female |
| Sales & Related | 706 (46.9%) | 801 (53.1%) |
| Office & Administration | 344 (16.8%) | 1,708 (83.2%) |
| Total (Category) | 1,050 (29.5%) | 2,509 (70.5%) |
| Total (Overall) | 9,950 (53.5%) | 8,649 (46.5%) |
Natural Resources, Construction and Maintenance Occupations
The most common Natural Resources, Construction and Maintenance occupations in Woodford County are Construction & Extraction (772 | 4.2%), Installation, Maintenance & Repair (720 | 3.9%), and Farming, Fishing & Forestry (132 | 0.7%).
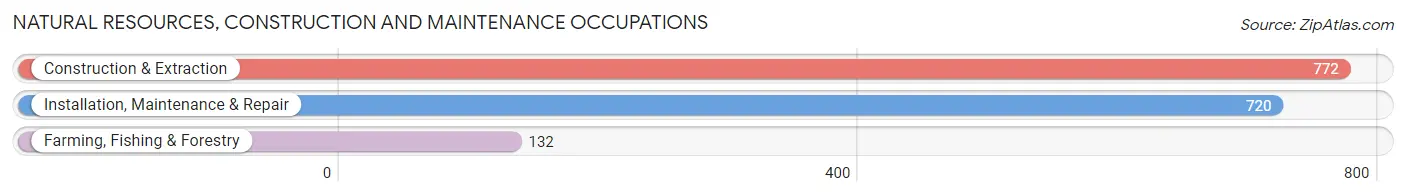
Natural Resources, Construction and Maintenance Occupations by Sex
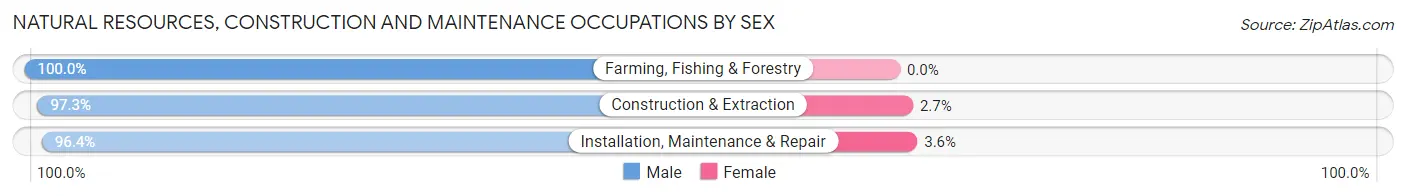
| Occupation | Male | Female |
| Farming, Fishing & Forestry | 132 (100.0%) | 0 (0.0%) |
| Construction & Extraction | 751 (97.3%) | 21 (2.7%) |
| Installation, Maintenance & Repair | 694 (96.4%) | 26 (3.6%) |
| Total (Category) | 1,577 (97.1%) | 47 (2.9%) |
| Total (Overall) | 9,950 (53.5%) | 8,649 (46.5%) |
Production, Transportation and Moving Occupations
The most common Production, Transportation and Moving occupations in Woodford County are Production (952 | 5.1%), Material Moving (762 | 4.1%), and Transportation (632 | 3.4%).
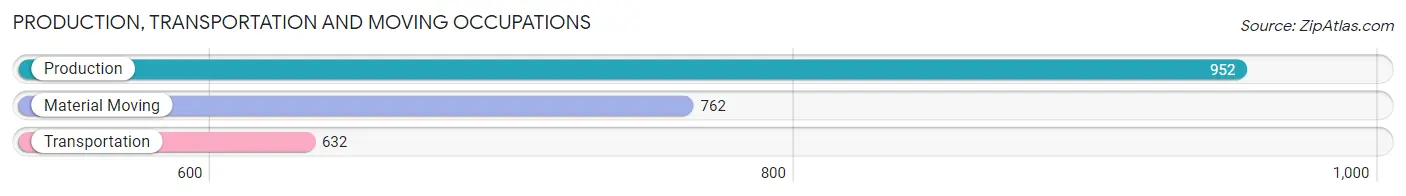
Production, Transportation and Moving Occupations by Sex
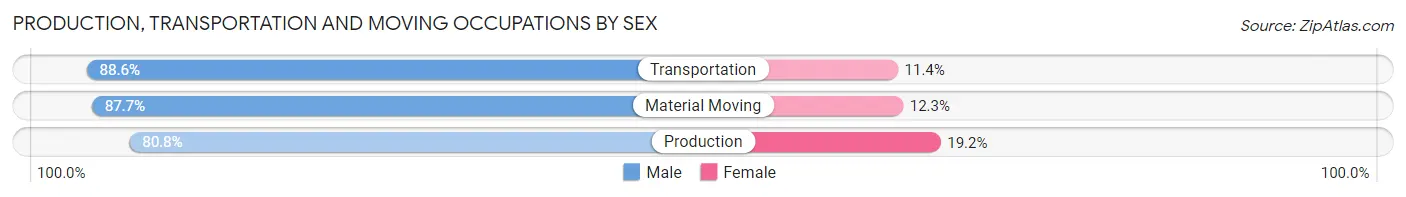
| Occupation | Male | Female |
| Production | 769 (80.8%) | 183 (19.2%) |
| Transportation | 560 (88.6%) | 72 (11.4%) |
| Material Moving | 668 (87.7%) | 94 (12.3%) |
| Total (Category) | 1,997 (85.1%) | 349 (14.9%) |
| Total (Overall) | 9,950 (53.5%) | 8,649 (46.5%) |
Employment Industries by Sex in Woodford County
Employment Industries in Woodford County
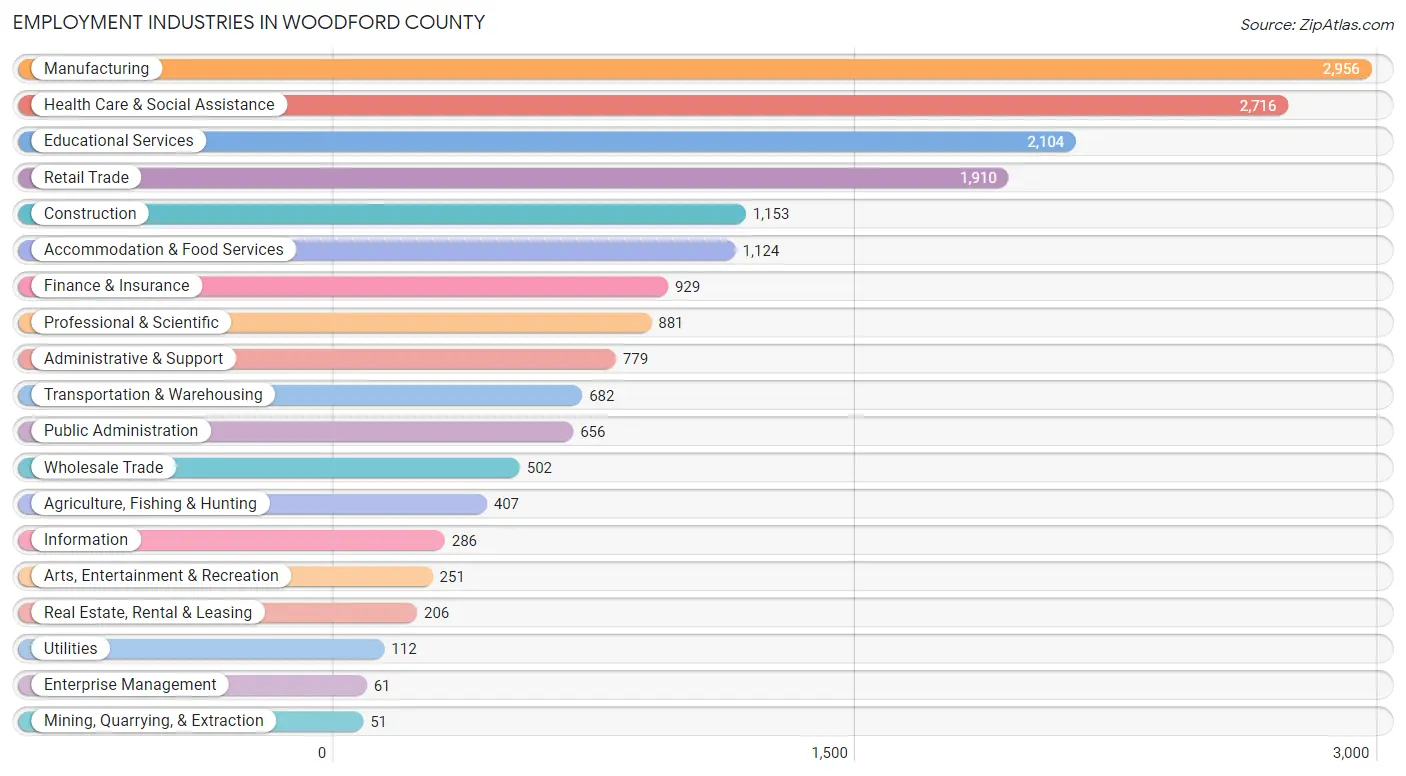
The major employment industries in Woodford County include Manufacturing (2,956 | 15.9%), Health Care & Social Assistance (2,716 | 14.6%), Educational Services (2,104 | 11.3%), Retail Trade (1,910 | 10.3%), and Construction (1,153 | 6.2%).
Employment Industries by Sex in Woodford County
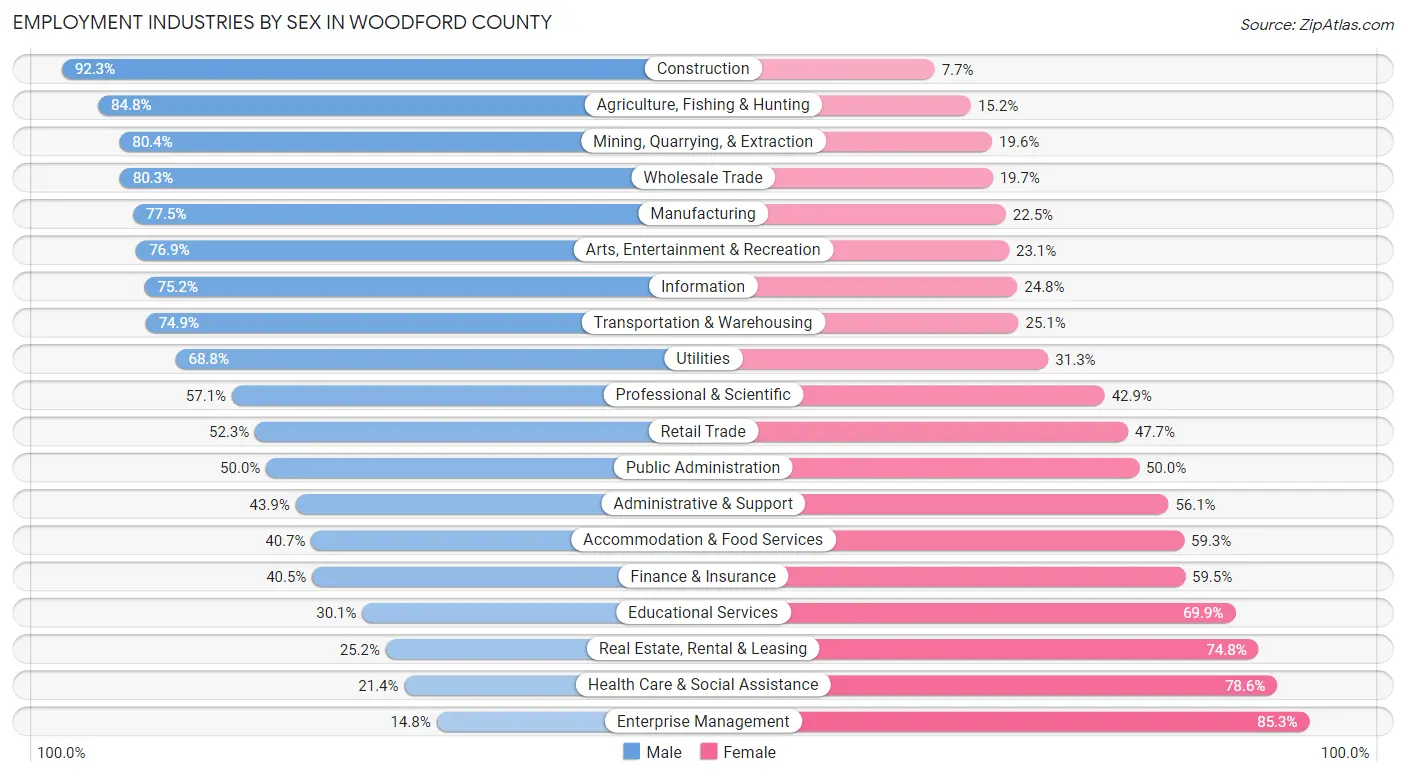
The Woodford County industries that see more men than women are Construction (92.3%), Agriculture, Fishing & Hunting (84.8%), and Mining, Quarrying, & Extraction (80.4%), whereas the industries that tend to have a higher number of women are Enterprise Management (85.3%), Health Care & Social Assistance (78.6%), and Real Estate, Rental & Leasing (74.8%).
| Industry | Male | Female |
| Agriculture, Fishing & Hunting | 345 (84.8%) | 62 (15.2%) |
| Mining, Quarrying, & Extraction | 41 (80.4%) | 10 (19.6%) |
| Construction | 1,064 (92.3%) | 89 (7.7%) |
| Manufacturing | 2,292 (77.5%) | 664 (22.5%) |
| Wholesale Trade | 403 (80.3%) | 99 (19.7%) |
| Retail Trade | 999 (52.3%) | 911 (47.7%) |
| Transportation & Warehousing | 511 (74.9%) | 171 (25.1%) |
| Utilities | 77 (68.8%) | 35 (31.2%) |
| Information | 215 (75.2%) | 71 (24.8%) |
| Finance & Insurance | 376 (40.5%) | 553 (59.5%) |
| Real Estate, Rental & Leasing | 52 (25.2%) | 154 (74.8%) |
| Professional & Scientific | 503 (57.1%) | 378 (42.9%) |
| Enterprise Management | 9 (14.7%) | 52 (85.3%) |
| Administrative & Support | 342 (43.9%) | 437 (56.1%) |
| Educational Services | 633 (30.1%) | 1,471 (69.9%) |
| Health Care & Social Assistance | 581 (21.4%) | 2,135 (78.6%) |
| Arts, Entertainment & Recreation | 193 (76.9%) | 58 (23.1%) |
| Accommodation & Food Services | 457 (40.7%) | 667 (59.3%) |
| Public Administration | 328 (50.0%) | 328 (50.0%) |
| Total | 9,950 (53.5%) | 8,649 (46.5%) |
Education in Woodford County
School Enrollment in Woodford County
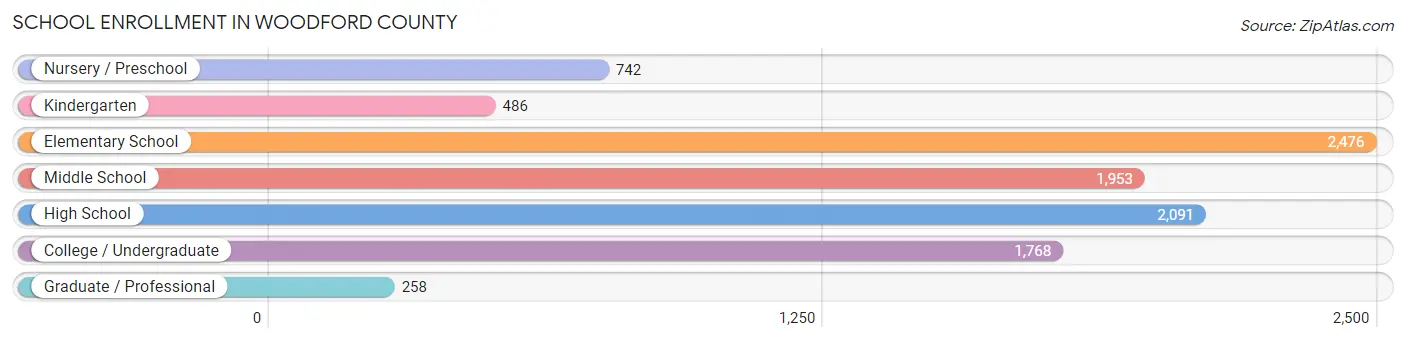
The most common levels of schooling among the 9,774 students in Woodford County are elementary school (2,476 | 25.3%), high school (2,091 | 21.4%), and middle school (1,953 | 20.0%).
| School Level | # Students | % Students |
| Nursery / Preschool | 742 | 7.6% |
| Kindergarten | 486 | 5.0% |
| Elementary School | 2,476 | 25.3% |
| Middle School | 1,953 | 20.0% |
| High School | 2,091 | 21.4% |
| College / Undergraduate | 1,768 | 18.1% |
| Graduate / Professional | 258 | 2.6% |
| Total | 9,774 | 100.0% |
School Enrollment by Age by Funding Source in Woodford County
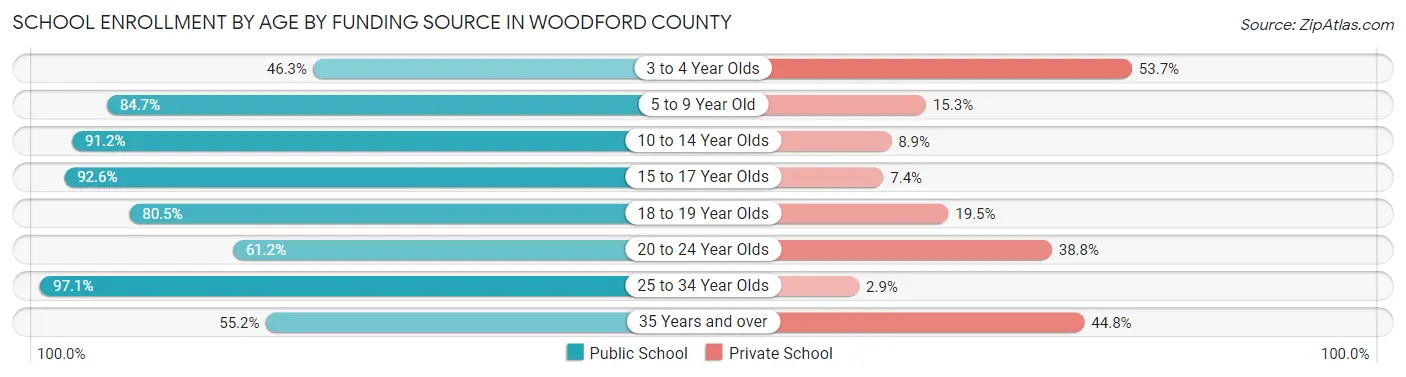
Out of a total of 9,774 students who are enrolled in schools in Woodford County, 1,681 (17.2%) attend a private institution, while the remaining 8,093 (82.8%) are enrolled in public schools. The age group of 3 to 4 year olds has the highest likelihood of being enrolled in private schools, with 298 (53.7% in the age bracket) enrolled. Conversely, the age group of 25 to 34 year olds has the lowest likelihood of being enrolled in a private school, with 303 (97.1% in the age bracket) attending a public institution.
| Age Bracket | Public School | Private School |
| 3 to 4 Year Olds | 257 (46.3%) | 298 (53.7%) |
| 5 to 9 Year Old | 2,325 (84.7%) | 421 (15.3%) |
| 10 to 14 Year Olds | 2,265 (91.1%) | 220 (8.8%) |
| 15 to 17 Year Olds | 1,555 (92.6%) | 124 (7.4%) |
| 18 to 19 Year Olds | 772 (80.5%) | 187 (19.5%) |
| 20 to 24 Year Olds | 428 (61.2%) | 271 (38.8%) |
| 25 to 34 Year Olds | 303 (97.1%) | 9 (2.9%) |
| 35 Years and over | 187 (55.2%) | 152 (44.8%) |
| Total | 8,093 (82.8%) | 1,681 (17.2%) |
Educational Attainment by Field of Study in Woodford County
Business (2,049 | 21.1%), education (1,570 | 16.2%), science & technology (1,209 | 12.4%), engineering (942 | 9.7%), and bio, nature & agricultural (870 | 9.0%) are the most common fields of study among 9,715 individuals in Woodford County who have obtained a bachelor's degree or higher.

| Field of Study | # Graduates | % Graduates |
| Computers & Mathematics | 330 | 3.4% |
| Bio, Nature & Agricultural | 870 | 9.0% |
| Physical & Health Sciences | 194 | 2.0% |
| Psychology | 245 | 2.5% |
| Social Sciences | 318 | 3.3% |
| Engineering | 942 | 9.7% |
| Multidisciplinary Studies | 76 | 0.8% |
| Science & Technology | 1,209 | 12.4% |
| Business | 2,049 | 21.1% |
| Education | 1,570 | 16.2% |
| Literature & Languages | 112 | 1.1% |
| Liberal Arts & History | 341 | 3.5% |
| Visual & Performing Arts | 355 | 3.6% |
| Communications | 474 | 4.9% |
| Arts & Humanities | 630 | 6.5% |
| Total | 9,715 | 100.0% |
Transportation & Commute in Woodford County
Vehicle Availability by Sex in Woodford County
The most prevalent vehicle ownership categories in Woodford County are males with 2 vehicles (4,175, accounting for 42.7%) and females with 2 vehicles (3,431, making up 49.3%).
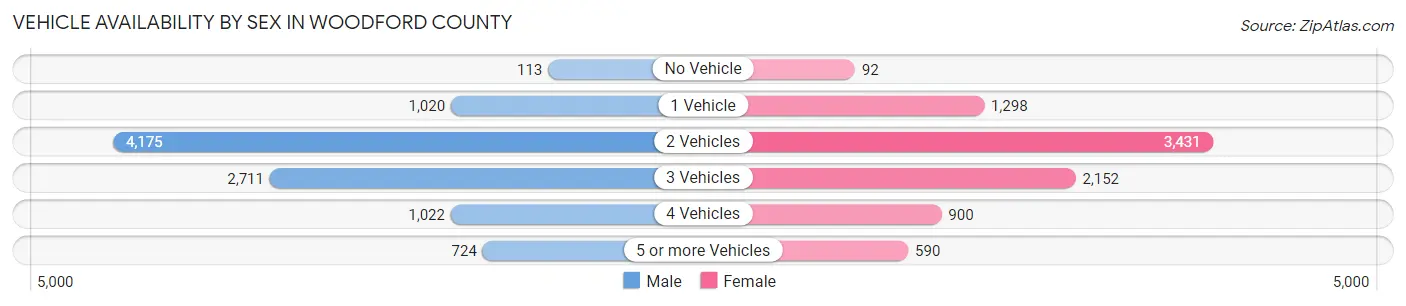
| Vehicles Available | Male | Female |
| No Vehicle | 113 (1.2%) | 92 (1.1%) |
| 1 Vehicle | 1,020 (10.4%) | 1,298 (15.3%) |
| 2 Vehicles | 4,175 (42.7%) | 3,431 (40.5%) |
| 3 Vehicles | 2,711 (27.8%) | 2,152 (25.4%) |
| 4 Vehicles | 1,022 (10.5%) | 900 (10.6%) |
| 5 or more Vehicles | 724 (7.4%) | 590 (7.0%) |
| Total | 9,765 (100.0%) | 8,463 (100.0%) |
Commute Time in Woodford County
The most frequently occuring commute durations in Woodford County are 20 to 24 minutes (2,444 commuters, 14.7%), 30 to 34 minutes (2,404 commuters, 14.5%), and 5 to 9 minutes (1,975 commuters, 11.9%).
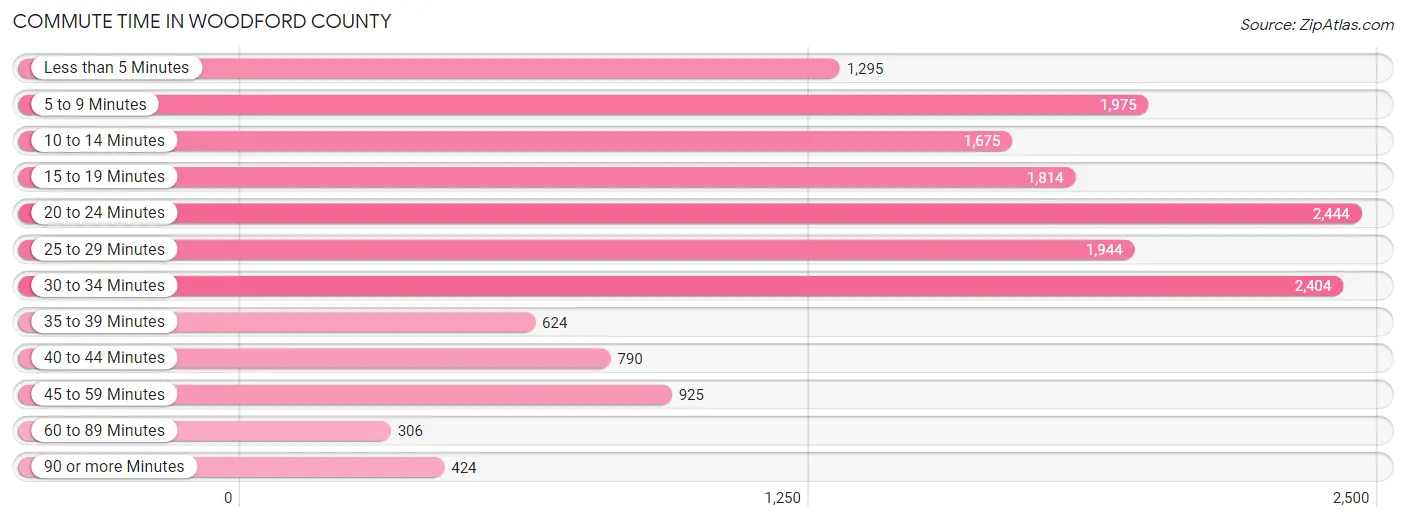
| Commute Time | # Commuters | % Commuters |
| Less than 5 Minutes | 1,295 | 7.8% |
| 5 to 9 Minutes | 1,975 | 11.9% |
| 10 to 14 Minutes | 1,675 | 10.1% |
| 15 to 19 Minutes | 1,814 | 10.9% |
| 20 to 24 Minutes | 2,444 | 14.7% |
| 25 to 29 Minutes | 1,944 | 11.7% |
| 30 to 34 Minutes | 2,404 | 14.5% |
| 35 to 39 Minutes | 624 | 3.7% |
| 40 to 44 Minutes | 790 | 4.8% |
| 45 to 59 Minutes | 925 | 5.6% |
| 60 to 89 Minutes | 306 | 1.8% |
| 90 or more Minutes | 424 | 2.5% |
Commute Time by Sex in Woodford County
The most common commute times in Woodford County are 20 to 24 minutes (1,302 commuters, 14.7%) for males and 30 to 34 minutes (1,220 commuters, 15.7%) for females.
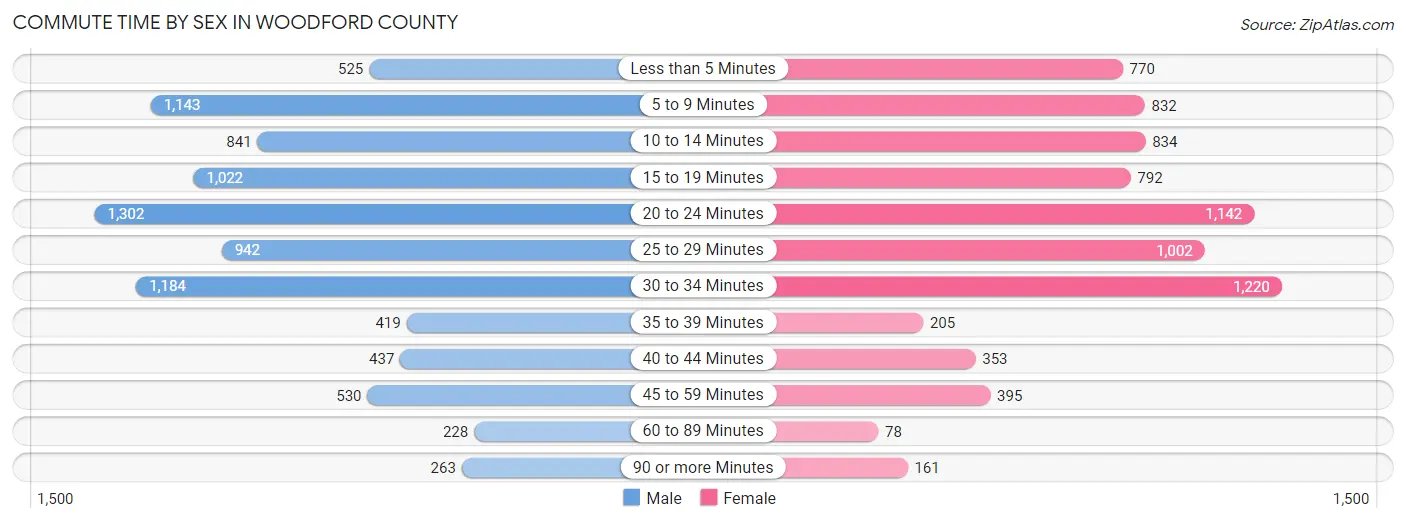
| Commute Time | Male | Female |
| Less than 5 Minutes | 525 (5.9%) | 770 (9.9%) |
| 5 to 9 Minutes | 1,143 (12.9%) | 832 (10.7%) |
| 10 to 14 Minutes | 841 (9.5%) | 834 (10.7%) |
| 15 to 19 Minutes | 1,022 (11.6%) | 792 (10.2%) |
| 20 to 24 Minutes | 1,302 (14.7%) | 1,142 (14.7%) |
| 25 to 29 Minutes | 942 (10.7%) | 1,002 (12.9%) |
| 30 to 34 Minutes | 1,184 (13.4%) | 1,220 (15.7%) |
| 35 to 39 Minutes | 419 (4.7%) | 205 (2.6%) |
| 40 to 44 Minutes | 437 (5.0%) | 353 (4.5%) |
| 45 to 59 Minutes | 530 (6.0%) | 395 (5.1%) |
| 60 to 89 Minutes | 228 (2.6%) | 78 (1.0%) |
| 90 or more Minutes | 263 (3.0%) | 161 (2.1%) |
Time of Departure to Work by Sex in Woodford County
The most frequent times of departure to work in Woodford County are 7:00 AM to 7:29 AM (1,413, 16.0%) for males and 7:00 AM to 7:29 AM (1,425, 18.3%) for females.
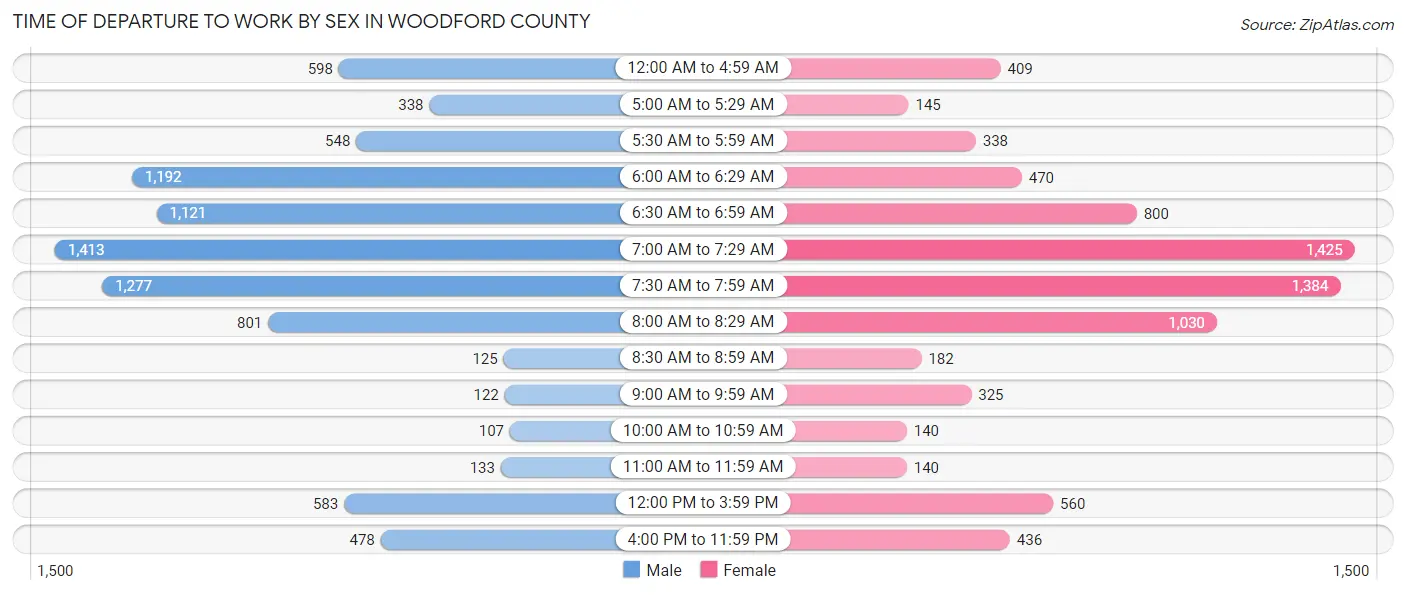
| Time of Departure | Male | Female |
| 12:00 AM to 4:59 AM | 598 (6.8%) | 409 (5.2%) |
| 5:00 AM to 5:29 AM | 338 (3.8%) | 145 (1.9%) |
| 5:30 AM to 5:59 AM | 548 (6.2%) | 338 (4.3%) |
| 6:00 AM to 6:29 AM | 1,192 (13.5%) | 470 (6.0%) |
| 6:30 AM to 6:59 AM | 1,121 (12.7%) | 800 (10.3%) |
| 7:00 AM to 7:29 AM | 1,413 (16.0%) | 1,425 (18.3%) |
| 7:30 AM to 7:59 AM | 1,277 (14.4%) | 1,384 (17.8%) |
| 8:00 AM to 8:29 AM | 801 (9.1%) | 1,030 (13.2%) |
| 8:30 AM to 8:59 AM | 125 (1.4%) | 182 (2.3%) |
| 9:00 AM to 9:59 AM | 122 (1.4%) | 325 (4.2%) |
| 10:00 AM to 10:59 AM | 107 (1.2%) | 140 (1.8%) |
| 11:00 AM to 11:59 AM | 133 (1.5%) | 140 (1.8%) |
| 12:00 PM to 3:59 PM | 583 (6.6%) | 560 (7.2%) |
| 4:00 PM to 11:59 PM | 478 (5.4%) | 436 (5.6%) |
| Total | 8,836 (100.0%) | 7,784 (100.0%) |
Housing Occupancy in Woodford County
Occupancy by Ownership in Woodford County
Of the total 14,725 dwellings in Woodford County, owner-occupied units account for 12,118 (82.3%), while renter-occupied units make up 2,607 (17.7%).
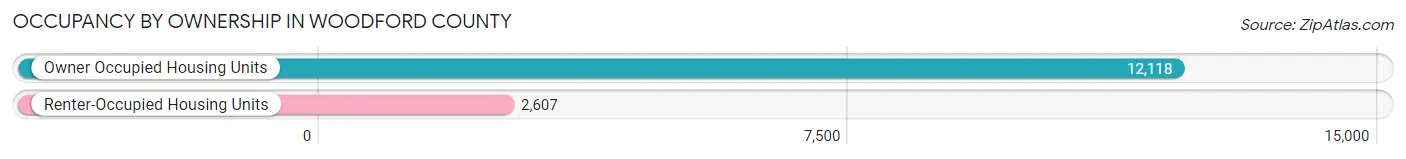
| Occupancy | # Housing Units | % Housing Units |
| Owner Occupied Housing Units | 12,118 | 82.3% |
| Renter-Occupied Housing Units | 2,607 | 17.7% |
| Total Occupied Housing Units | 14,725 | 100.0% |
Occupancy by Household Size in Woodford County
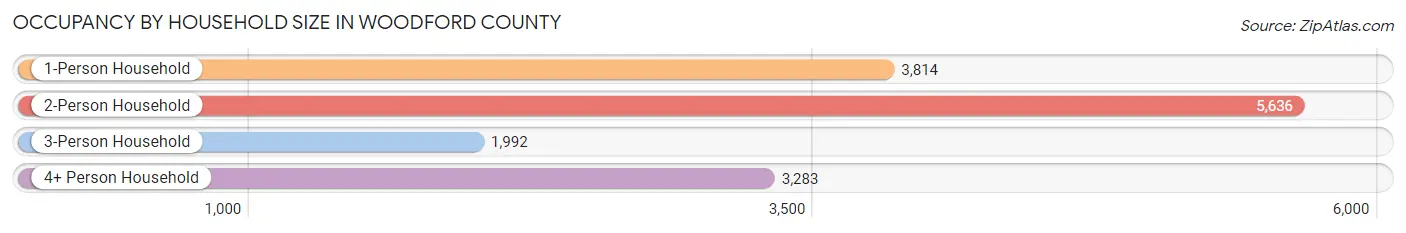
| Household Size | # Housing Units | % Housing Units |
| 1-Person Household | 3,814 | 25.9% |
| 2-Person Household | 5,636 | 38.3% |
| 3-Person Household | 1,992 | 13.5% |
| 4+ Person Household | 3,283 | 22.3% |
| Total Housing Units | 14,725 | 100.0% |
Occupancy by Ownership by Household Size in Woodford County
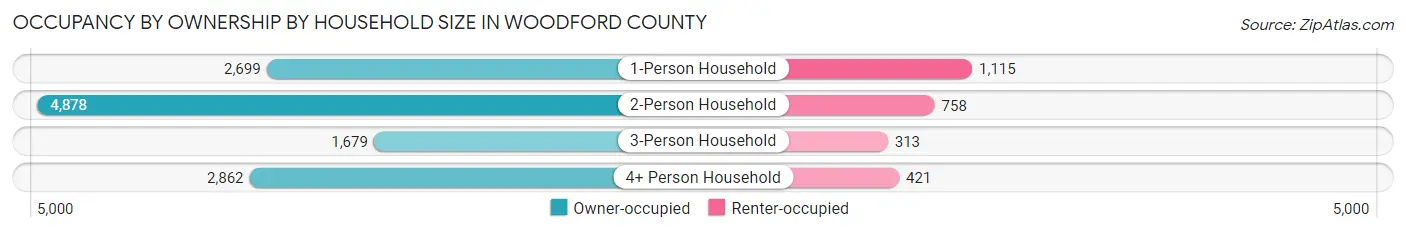
| Household Size | Owner-occupied | Renter-occupied |
| 1-Person Household | 2,699 (70.8%) | 1,115 (29.2%) |
| 2-Person Household | 4,878 (86.6%) | 758 (13.5%) |
| 3-Person Household | 1,679 (84.3%) | 313 (15.7%) |
| 4+ Person Household | 2,862 (87.2%) | 421 (12.8%) |
| Total Housing Units | 12,118 (82.3%) | 2,607 (17.7%) |
Occupancy by Educational Attainment in Woodford County
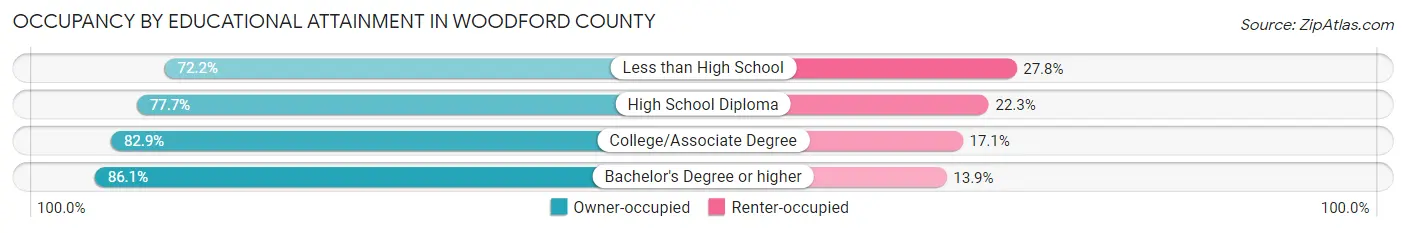
| Household Size | Owner-occupied | Renter-occupied |
| Less than High School | 481 (72.2%) | 185 (27.8%) |
| High School Diploma | 2,868 (77.7%) | 822 (22.3%) |
| College/Associate Degree | 4,044 (82.9%) | 836 (17.1%) |
| Bachelor's Degree or higher | 4,725 (86.1%) | 764 (13.9%) |
Occupancy by Age of Householder in Woodford County
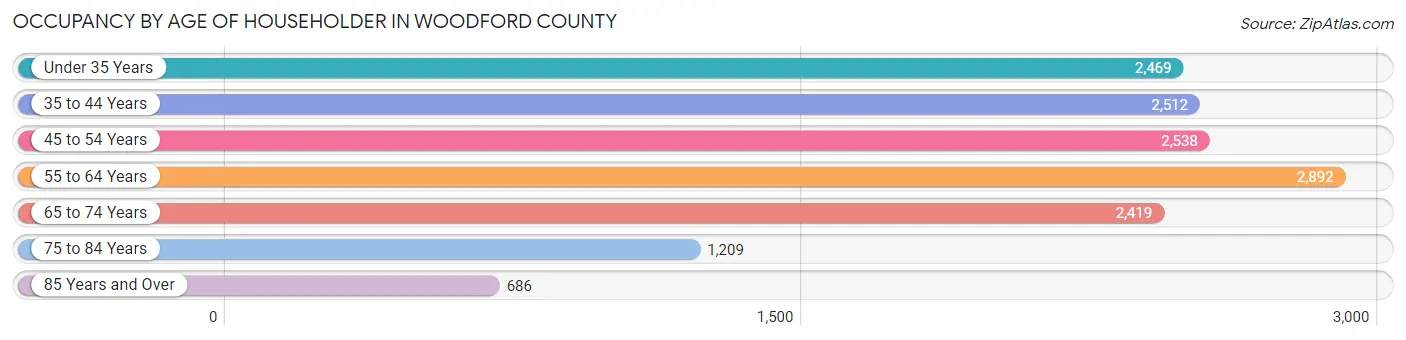
| Age Bracket | # Households | % Households |
| Under 35 Years | 2,469 | 16.8% |
| 35 to 44 Years | 2,512 | 17.1% |
| 45 to 54 Years | 2,538 | 17.2% |
| 55 to 64 Years | 2,892 | 19.6% |
| 65 to 74 Years | 2,419 | 16.4% |
| 75 to 84 Years | 1,209 | 8.2% |
| 85 Years and Over | 686 | 4.7% |
| Total | 14,725 | 100.0% |
Housing Finances in Woodford County
Median Income by Occupancy in Woodford County
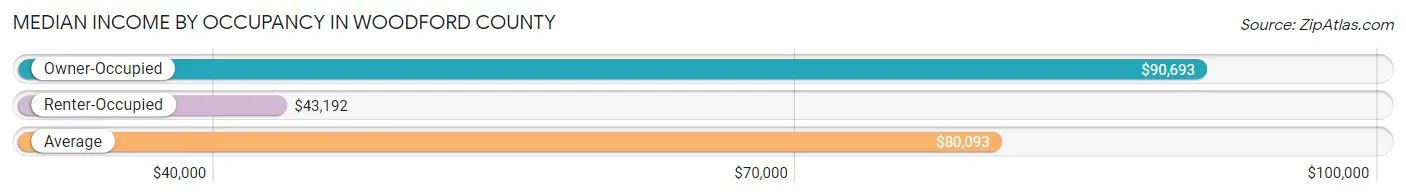
| Occupancy Type | # Households | Median Income |
| Owner-Occupied | 12,118 (82.3%) | $90,693 |
| Renter-Occupied | 2,607 (17.7%) | $43,192 |
| Average | 14,725 (100.0%) | $80,093 |
Occupancy by Householder Income Bracket in Woodford County
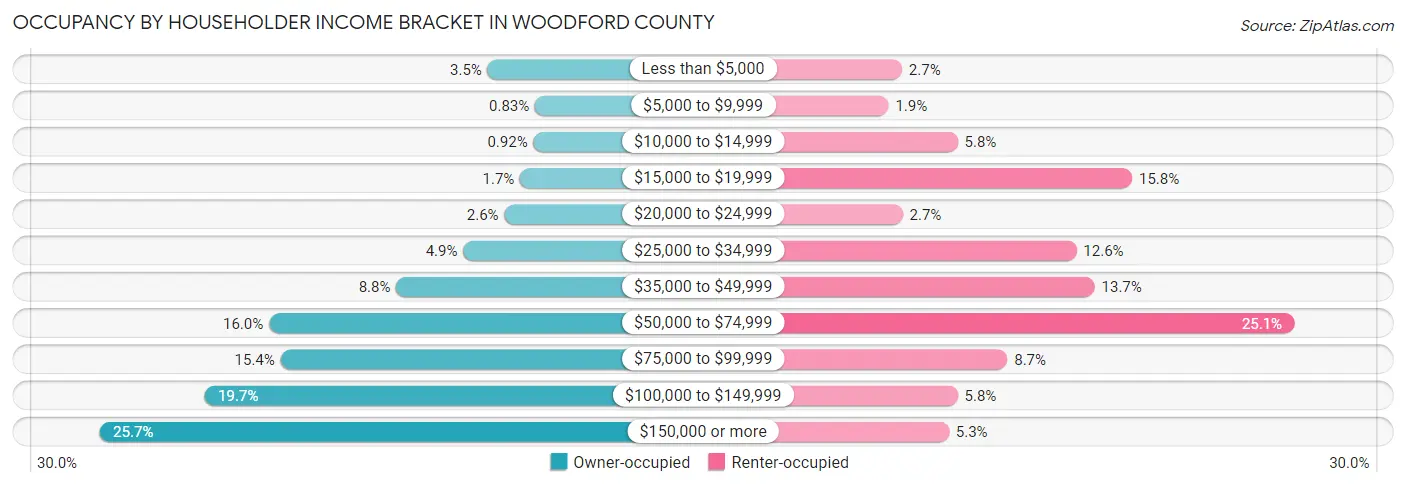
| Income Bracket | Owner-occupied | Renter-occupied |
| Less than $5,000 | 429 (3.5%) | 69 (2.6%) |
| $5,000 to $9,999 | 100 (0.8%) | 49 (1.9%) |
| $10,000 to $14,999 | 111 (0.9%) | 152 (5.8%) |
| $15,000 to $19,999 | 204 (1.7%) | 412 (15.8%) |
| $20,000 to $24,999 | 313 (2.6%) | 70 (2.7%) |
| $25,000 to $34,999 | 597 (4.9%) | 329 (12.6%) |
| $35,000 to $49,999 | 1,061 (8.8%) | 356 (13.7%) |
| $50,000 to $74,999 | 1,942 (16.0%) | 653 (25.1%) |
| $75,000 to $99,999 | 1,863 (15.4%) | 226 (8.7%) |
| $100,000 to $149,999 | 2,386 (19.7%) | 152 (5.8%) |
| $150,000 or more | 3,112 (25.7%) | 139 (5.3%) |
| Total | 12,118 (100.0%) | 2,607 (100.0%) |
Monthly Housing Cost Tiers in Woodford County
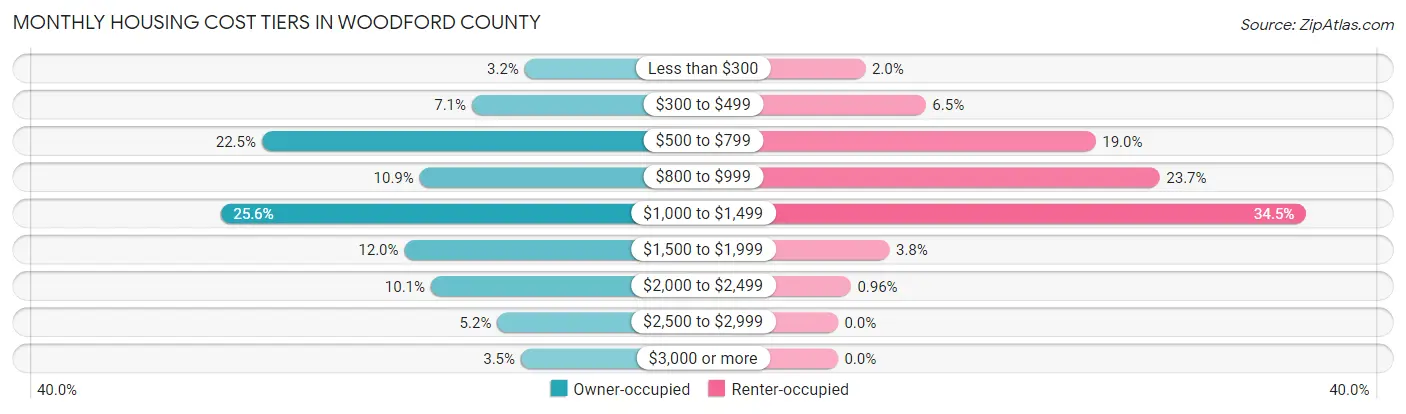
| Monthly Cost | Owner-occupied | Renter-occupied |
| Less than $300 | 384 (3.2%) | 53 (2.0%) |
| $300 to $499 | 855 (7.1%) | 169 (6.5%) |
| $500 to $799 | 2,730 (22.5%) | 495 (19.0%) |
| $800 to $999 | 1,322 (10.9%) | 618 (23.7%) |
| $1,000 to $1,499 | 3,100 (25.6%) | 900 (34.5%) |
| $1,500 to $1,999 | 1,458 (12.0%) | 99 (3.8%) |
| $2,000 to $2,499 | 1,222 (10.1%) | 25 (1.0%) |
| $2,500 to $2,999 | 629 (5.2%) | 0 (0.0%) |
| $3,000 or more | 418 (3.5%) | 0 (0.0%) |
| Total | 12,118 (100.0%) | 2,607 (100.0%) |
Physical Housing Characteristics in Woodford County
Housing Structures in Woodford County
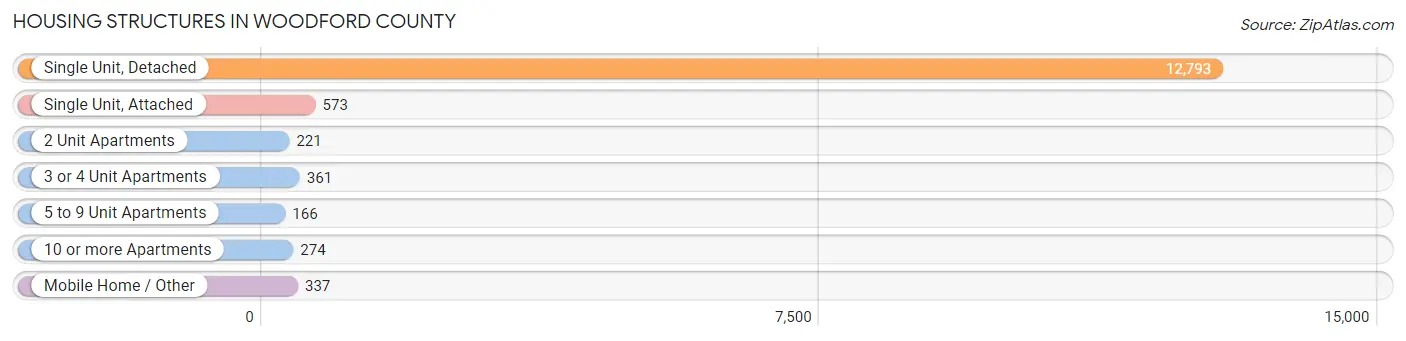
| Structure Type | # Housing Units | % Housing Units |
| Single Unit, Detached | 12,793 | 86.9% |
| Single Unit, Attached | 573 | 3.9% |
| 2 Unit Apartments | 221 | 1.5% |
| 3 or 4 Unit Apartments | 361 | 2.5% |
| 5 to 9 Unit Apartments | 166 | 1.1% |
| 10 or more Apartments | 274 | 1.9% |
| Mobile Home / Other | 337 | 2.3% |
| Total | 14,725 | 100.0% |
Housing Structures by Occupancy in Woodford County
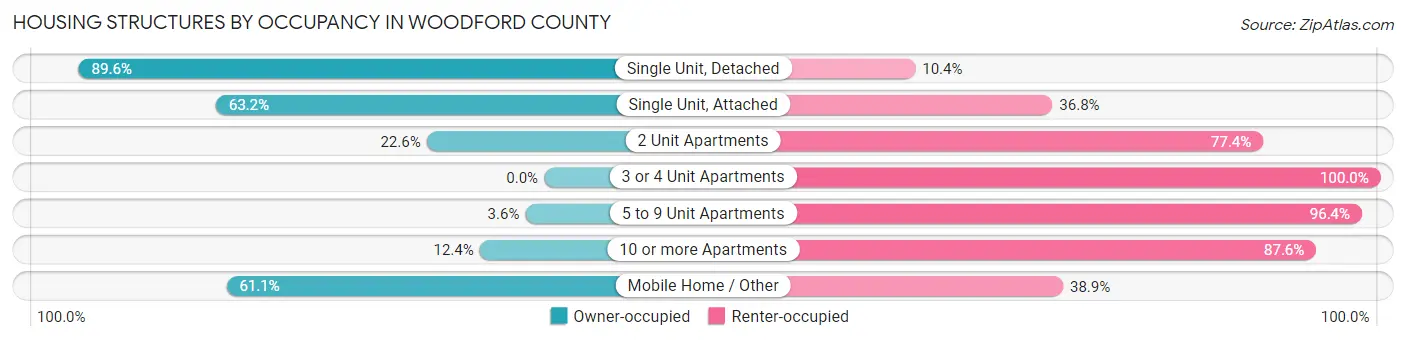
| Structure Type | Owner-occupied | Renter-occupied |
| Single Unit, Detached | 11,460 (89.6%) | 1,333 (10.4%) |
| Single Unit, Attached | 362 (63.2%) | 211 (36.8%) |
| 2 Unit Apartments | 50 (22.6%) | 171 (77.4%) |
| 3 or 4 Unit Apartments | 0 (0.0%) | 361 (100.0%) |
| 5 to 9 Unit Apartments | 6 (3.6%) | 160 (96.4%) |
| 10 or more Apartments | 34 (12.4%) | 240 (87.6%) |
| Mobile Home / Other | 206 (61.1%) | 131 (38.9%) |
| Total | 12,118 (82.3%) | 2,607 (17.7%) |
Housing Structures by Number of Rooms in Woodford County
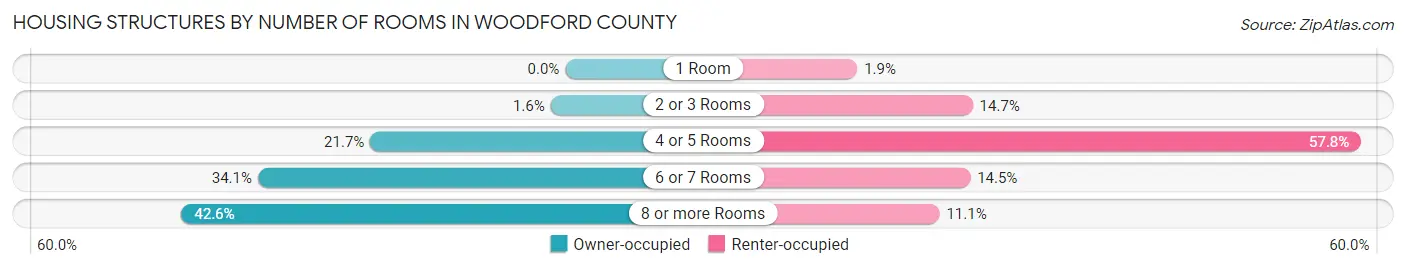
| Number of Rooms | Owner-occupied | Renter-occupied |
| 1 Room | 0 (0.0%) | 50 (1.9%) |
| 2 or 3 Rooms | 198 (1.6%) | 384 (14.7%) |
| 4 or 5 Rooms | 2,623 (21.6%) | 1,508 (57.8%) |
| 6 or 7 Rooms | 4,135 (34.1%) | 377 (14.5%) |
| 8 or more Rooms | 5,162 (42.6%) | 288 (11.1%) |
| Total | 12,118 (100.0%) | 2,607 (100.0%) |
Housing Structure by Heating Type in Woodford County

| Heating Type | Owner-occupied | Renter-occupied |
| Utility Gas | 8,266 (68.2%) | 1,600 (61.4%) |
| Bottled, Tank, or LP Gas | 1,828 (15.1%) | 207 (7.9%) |
| Electricity | 1,828 (15.1%) | 671 (25.7%) |
| Fuel Oil or Kerosene | 3 (0.0%) | 0 (0.0%) |
| Coal or Coke | 0 (0.0%) | 14 (0.5%) |
| All other Fuels | 145 (1.2%) | 9 (0.4%) |
| No Fuel Used | 48 (0.4%) | 106 (4.1%) |
| Total | 12,118 (100.0%) | 2,607 (100.0%) |
Household Vehicle Usage in Woodford County
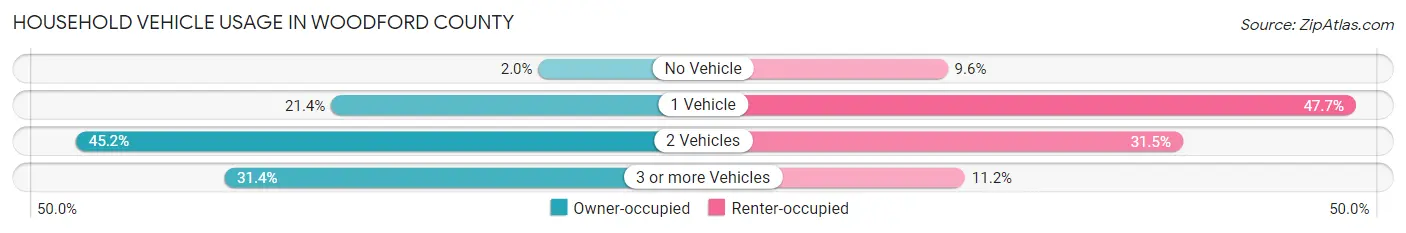
| Vehicles per Household | Owner-occupied | Renter-occupied |
| No Vehicle | 247 (2.0%) | 250 (9.6%) |
| 1 Vehicle | 2,592 (21.4%) | 1,243 (47.7%) |
| 2 Vehicles | 5,478 (45.2%) | 822 (31.5%) |
| 3 or more Vehicles | 3,801 (31.4%) | 292 (11.2%) |
| Total | 12,118 (100.0%) | 2,607 (100.0%) |
Real Estate & Mortgages in Woodford County
Real Estate and Mortgage Overview in Woodford County
| Characteristic | Without Mortgage | With Mortgage |
| Housing Units | 5,222 | 6,896 |
| Median Property Value | $168,700 | $209,200 |
| Median Household Income | $73,272 | $2,300 |
| Monthly Housing Costs | $658 | $418 |
| Real Estate Taxes | $3,747 | $145 |
Property Value by Mortgage Status in Woodford County
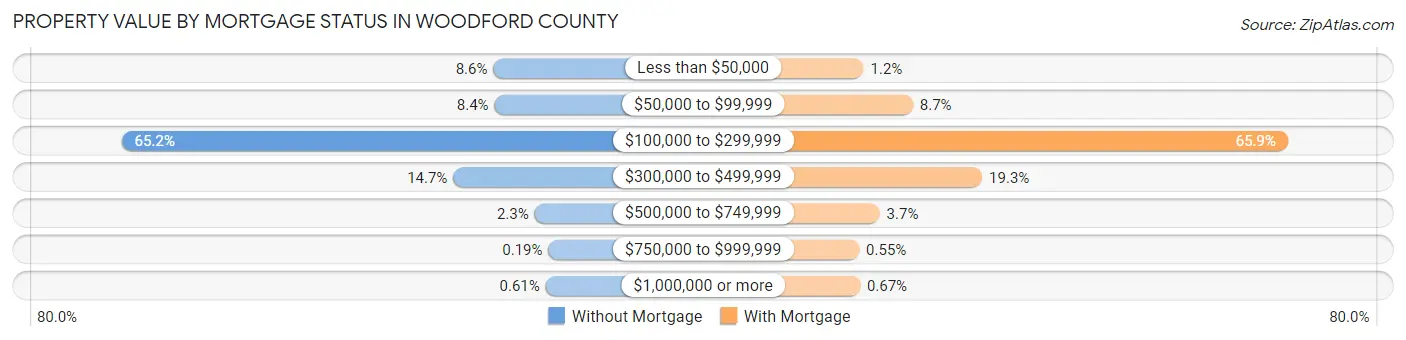
| Property Value | Without Mortgage | With Mortgage |
| Less than $50,000 | 448 (8.6%) | 85 (1.2%) |
| $50,000 to $99,999 | 439 (8.4%) | 602 (8.7%) |
| $100,000 to $299,999 | 3,406 (65.2%) | 4,542 (65.9%) |
| $300,000 to $499,999 | 767 (14.7%) | 1,330 (19.3%) |
| $500,000 to $749,999 | 120 (2.3%) | 253 (3.7%) |
| $750,000 to $999,999 | 10 (0.2%) | 38 (0.5%) |
| $1,000,000 or more | 32 (0.6%) | 46 (0.7%) |
| Total | 5,222 (100.0%) | 6,896 (100.0%) |
Household Income by Mortgage Status in Woodford County
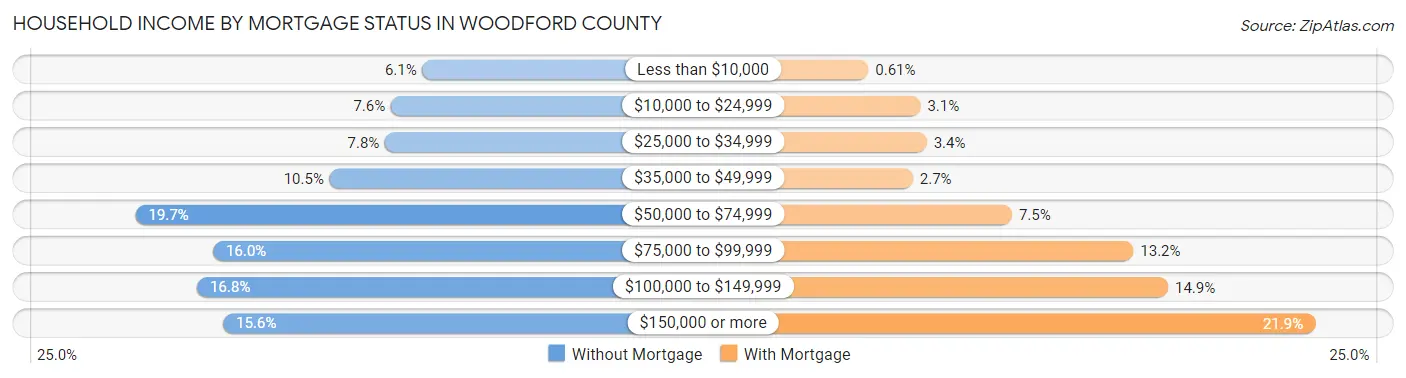
| Household Income | Without Mortgage | With Mortgage |
| Less than $10,000 | 316 (6.0%) | 42 (0.6%) |
| $10,000 to $24,999 | 394 (7.5%) | 213 (3.1%) |
| $25,000 to $34,999 | 409 (7.8%) | 234 (3.4%) |
| $35,000 to $49,999 | 547 (10.5%) | 188 (2.7%) |
| $50,000 to $74,999 | 1,030 (19.7%) | 514 (7.4%) |
| $75,000 to $99,999 | 837 (16.0%) | 912 (13.2%) |
| $100,000 to $149,999 | 877 (16.8%) | 1,026 (14.9%) |
| $150,000 or more | 812 (15.5%) | 1,509 (21.9%) |
| Total | 5,222 (100.0%) | 6,896 (100.0%) |
Property Value to Household Income Ratio in Woodford County
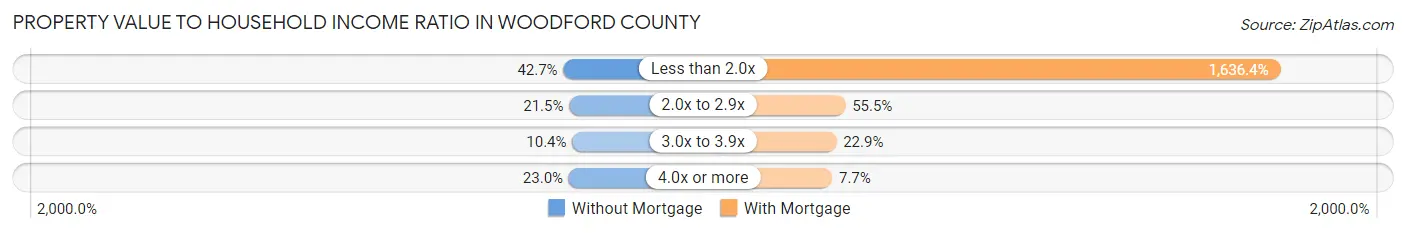
| Value-to-Income Ratio | Without Mortgage | With Mortgage |
| Less than 2.0x | 2,231 (42.7%) | 112,849 (1,636.4%) |
| 2.0x to 2.9x | 1,122 (21.5%) | 3,827 (55.5%) |
| 3.0x to 3.9x | 541 (10.4%) | 1,577 (22.9%) |
| 4.0x or more | 1,199 (23.0%) | 528 (7.7%) |
| Total | 5,222 (100.0%) | 6,896 (100.0%) |
Real Estate Taxes by Mortgage Status in Woodford County
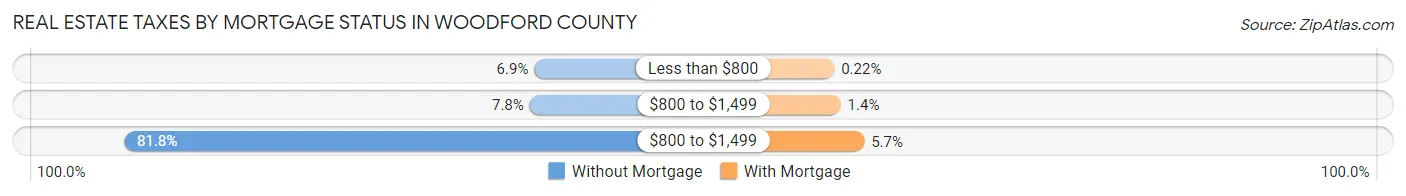
| Property Taxes | Without Mortgage | With Mortgage |
| Less than $800 | 361 (6.9%) | 15 (0.2%) |
| $800 to $1,499 | 405 (7.8%) | 96 (1.4%) |
| $800 to $1,499 | 4,273 (81.8%) | 393 (5.7%) |
| Total | 5,222 (100.0%) | 6,896 (100.0%) |
Health & Disability in Woodford County
Health Insurance Coverage by Age in Woodford County

| Age Bracket | With Coverage | Without Coverage |
| Under 6 Years | 2,647 (94.0%) | 169 (6.0%) |
| 6 to 18 Years | 6,732 (96.0%) | 282 (4.0%) |
| 19 to 25 Years | 2,958 (93.9%) | 191 (6.1%) |
| 26 to 34 Years | 3,050 (88.3%) | 405 (11.7%) |
| 35 to 44 Years | 4,493 (93.2%) | 330 (6.8%) |
| 45 to 54 Years | 4,337 (95.5%) | 204 (4.5%) |
| 55 to 64 Years | 5,150 (97.2%) | 146 (2.8%) |
| 65 to 74 Years | 3,976 (99.6%) | 18 (0.4%) |
| 75 Years and older | 2,719 (100.0%) | 0 (0.0%) |
| Total | 36,062 (95.4%) | 1,745 (4.6%) |
Health Insurance Coverage by Citizenship Status in Woodford County

| Citizenship Status | With Coverage | Without Coverage |
| Native Born | 2,647 (94.0%) | 169 (6.0%) |
| Foreign Born, Citizen | 6,732 (96.0%) | 282 (4.0%) |
| Foreign Born, not a Citizen | 2,958 (93.9%) | 191 (6.1%) |
Health Insurance Coverage by Household Income in Woodford County
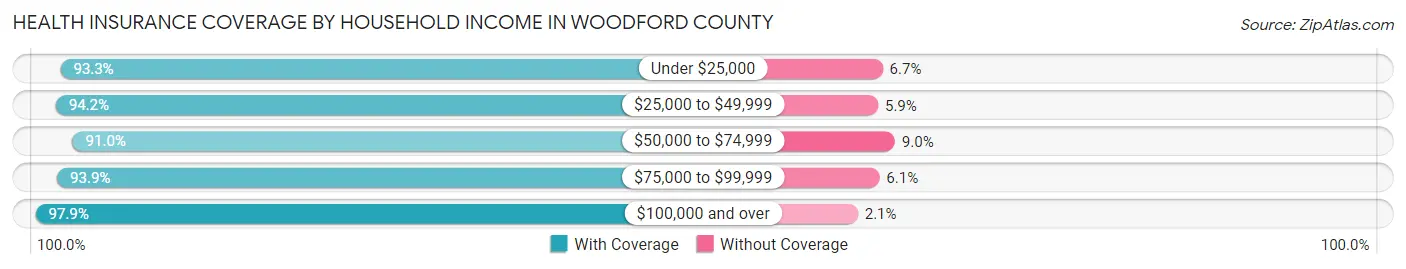
| Household Income | With Coverage | Without Coverage |
| Under $25,000 | 2,761 (93.3%) | 199 (6.7%) |
| $25,000 to $49,999 | 3,656 (94.2%) | 227 (5.9%) |
| $50,000 to $74,999 | 5,775 (91.0%) | 572 (9.0%) |
| $75,000 to $99,999 | 5,306 (93.9%) | 345 (6.1%) |
| $100,000 and over | 18,105 (97.9%) | 380 (2.1%) |
Public vs Private Health Insurance Coverage by Age in Woodford County
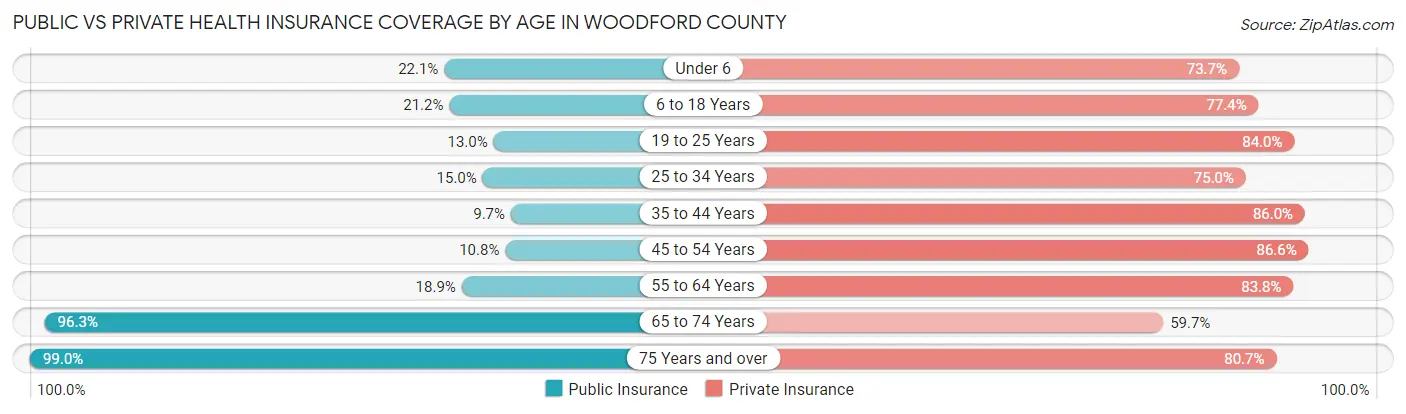
| Age Bracket | Public Insurance | Private Insurance |
| Under 6 | 623 (22.1%) | 2,075 (73.7%) |
| 6 to 18 Years | 1,485 (21.2%) | 5,426 (77.4%) |
| 19 to 25 Years | 408 (13.0%) | 2,645 (84.0%) |
| 25 to 34 Years | 518 (15.0%) | 2,591 (75.0%) |
| 35 to 44 Years | 470 (9.7%) | 4,146 (86.0%) |
| 45 to 54 Years | 490 (10.8%) | 3,934 (86.6%) |
| 55 to 64 Years | 1,000 (18.9%) | 4,438 (83.8%) |
| 65 to 74 Years | 3,845 (96.3%) | 2,383 (59.7%) |
| 75 Years and over | 2,692 (99.0%) | 2,193 (80.6%) |
| Total | 11,531 (30.5%) | 29,831 (78.9%) |
Disability Status by Sex by Age in Woodford County
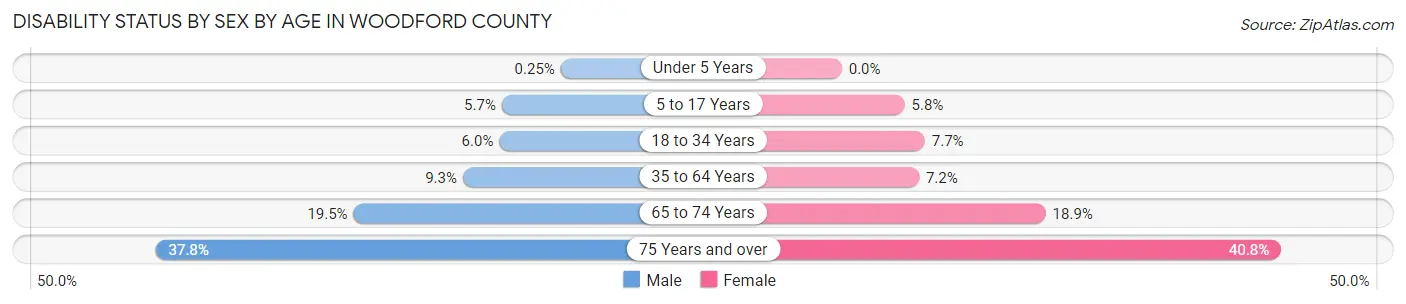
| Age Bracket | Male | Female |
| Under 5 Years | 3 (0.3%) | 0 (0.0%) |
| 5 to 17 Years | 203 (5.7%) | 198 (5.8%) |
| 18 to 34 Years | 221 (5.9%) | 272 (7.7%) |
| 35 to 64 Years | 686 (9.3%) | 523 (7.2%) |
| 65 to 74 Years | 392 (19.5%) | 375 (18.9%) |
| 75 Years and over | 406 (37.8%) | 671 (40.8%) |
Disability Class by Sex by Age in Woodford County
Disability Class: Hearing Difficulty
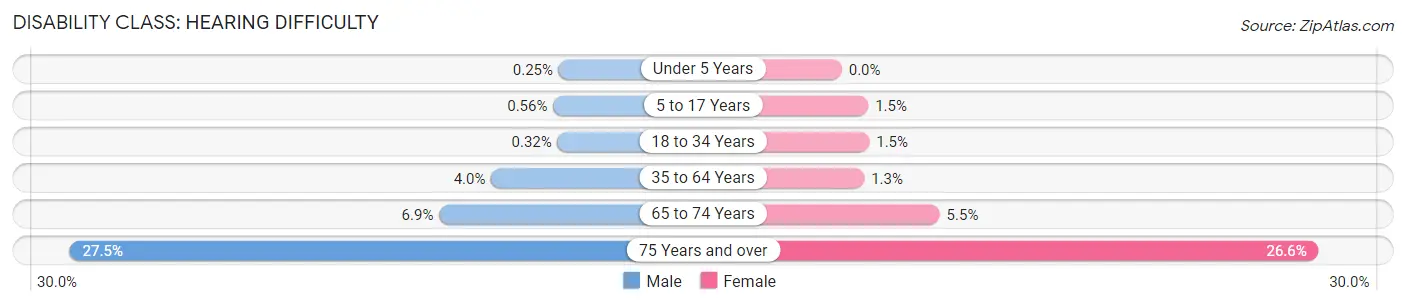
| Age Bracket | Male | Female |
| Under 5 Years | 3 (0.3%) | 0 (0.0%) |
| 5 to 17 Years | 20 (0.6%) | 50 (1.5%) |
| 18 to 34 Years | 12 (0.3%) | 54 (1.5%) |
| 35 to 64 Years | 295 (4.0%) | 91 (1.3%) |
| 65 to 74 Years | 139 (6.9%) | 108 (5.4%) |
| 75 Years and over | 295 (27.5%) | 437 (26.6%) |
Disability Class: Vision Difficulty
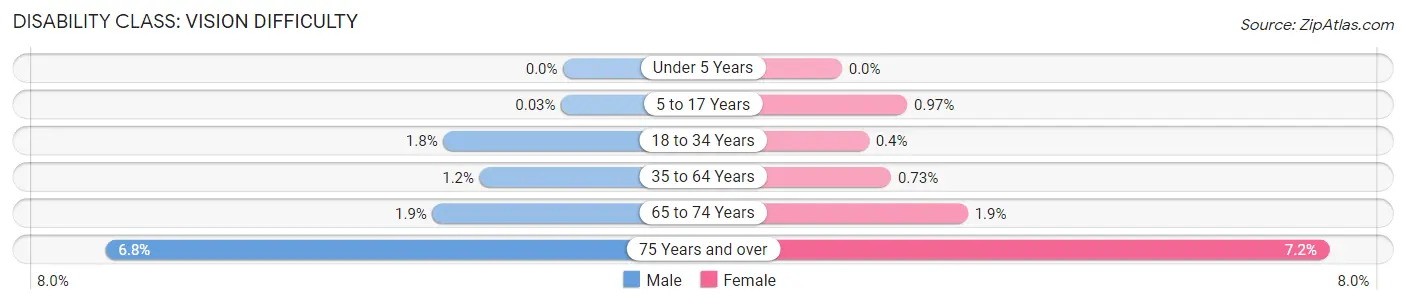
| Age Bracket | Male | Female |
| Under 5 Years | 0 (0.0%) | 0 (0.0%) |
| 5 to 17 Years | 1 (0.0%) | 33 (1.0%) |
| 18 to 34 Years | 66 (1.8%) | 14 (0.4%) |
| 35 to 64 Years | 91 (1.2%) | 53 (0.7%) |
| 65 to 74 Years | 39 (1.9%) | 37 (1.9%) |
| 75 Years and over | 73 (6.8%) | 119 (7.2%) |
Disability Class: Cognitive Difficulty
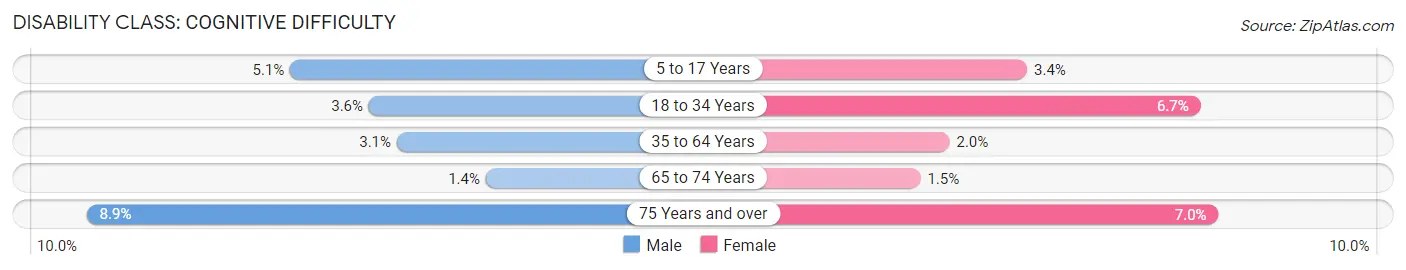
| Age Bracket | Male | Female |
| 5 to 17 Years | 180 (5.1%) | 117 (3.4%) |
| 18 to 34 Years | 134 (3.6%) | 235 (6.7%) |
| 35 to 64 Years | 227 (3.1%) | 146 (2.0%) |
| 65 to 74 Years | 29 (1.4%) | 29 (1.5%) |
| 75 Years and over | 95 (8.8%) | 115 (7.0%) |
Disability Class: Ambulatory Difficulty
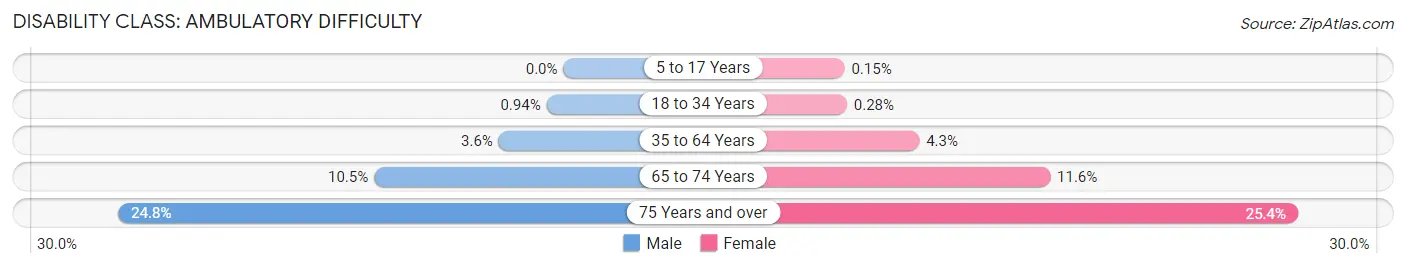
| Age Bracket | Male | Female |
| 5 to 17 Years | 0 (0.0%) | 5 (0.2%) |
| 18 to 34 Years | 35 (0.9%) | 10 (0.3%) |
| 35 to 64 Years | 265 (3.6%) | 315 (4.3%) |
| 65 to 74 Years | 212 (10.5%) | 230 (11.6%) |
| 75 Years and over | 266 (24.8%) | 418 (25.4%) |
Disability Class: Self-Care Difficulty
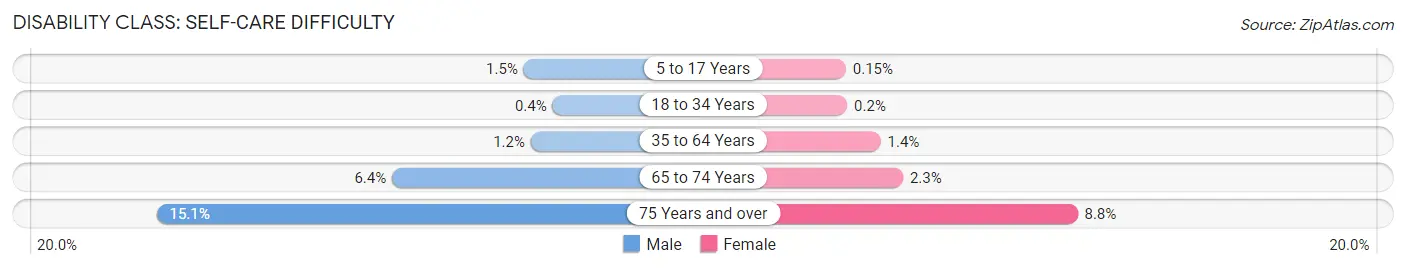
| Age Bracket | Male | Female |
| 5 to 17 Years | 52 (1.5%) | 5 (0.2%) |
| 18 to 34 Years | 15 (0.4%) | 7 (0.2%) |
| 35 to 64 Years | 89 (1.2%) | 105 (1.4%) |
| 65 to 74 Years | 128 (6.4%) | 45 (2.3%) |
| 75 Years and over | 162 (15.1%) | 144 (8.7%) |
Technology Access in Woodford County
Computing Device Access in Woodford County
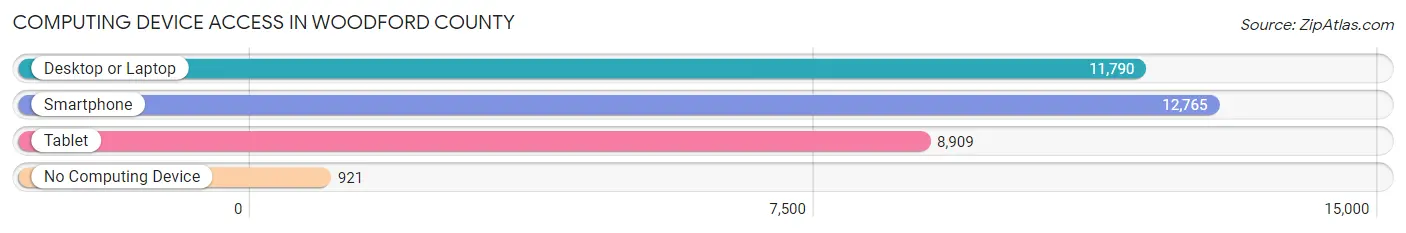
| Device Type | # Households | % Households |
| Desktop or Laptop | 11,790 | 80.1% |
| Smartphone | 12,765 | 86.7% |
| Tablet | 8,909 | 60.5% |
| No Computing Device | 921 | 6.2% |
| Total | 14,725 | 100.0% |
Internet Access in Woodford County
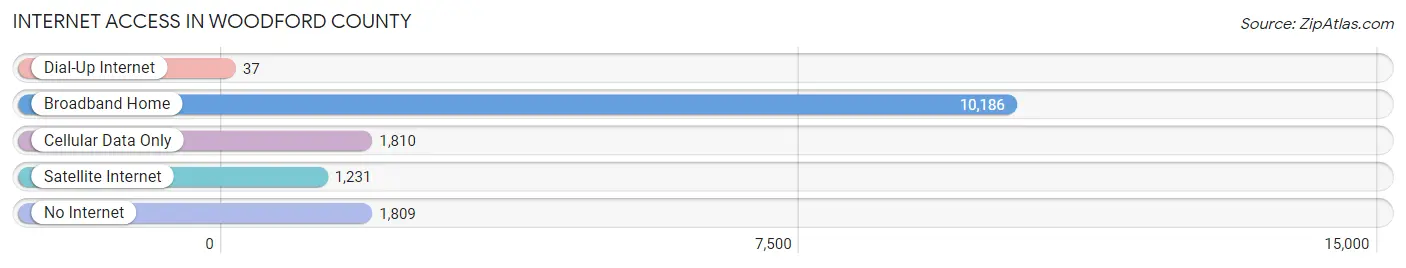
| Internet Type | # Households | % Households |
| Dial-Up Internet | 37 | 0.3% |
| Broadband Home | 10,186 | 69.2% |
| Cellular Data Only | 1,810 | 12.3% |
| Satellite Internet | 1,231 | 8.4% |
| No Internet | 1,809 | 12.3% |
| Total | 14,725 | 100.0% |
Woodford County Summary
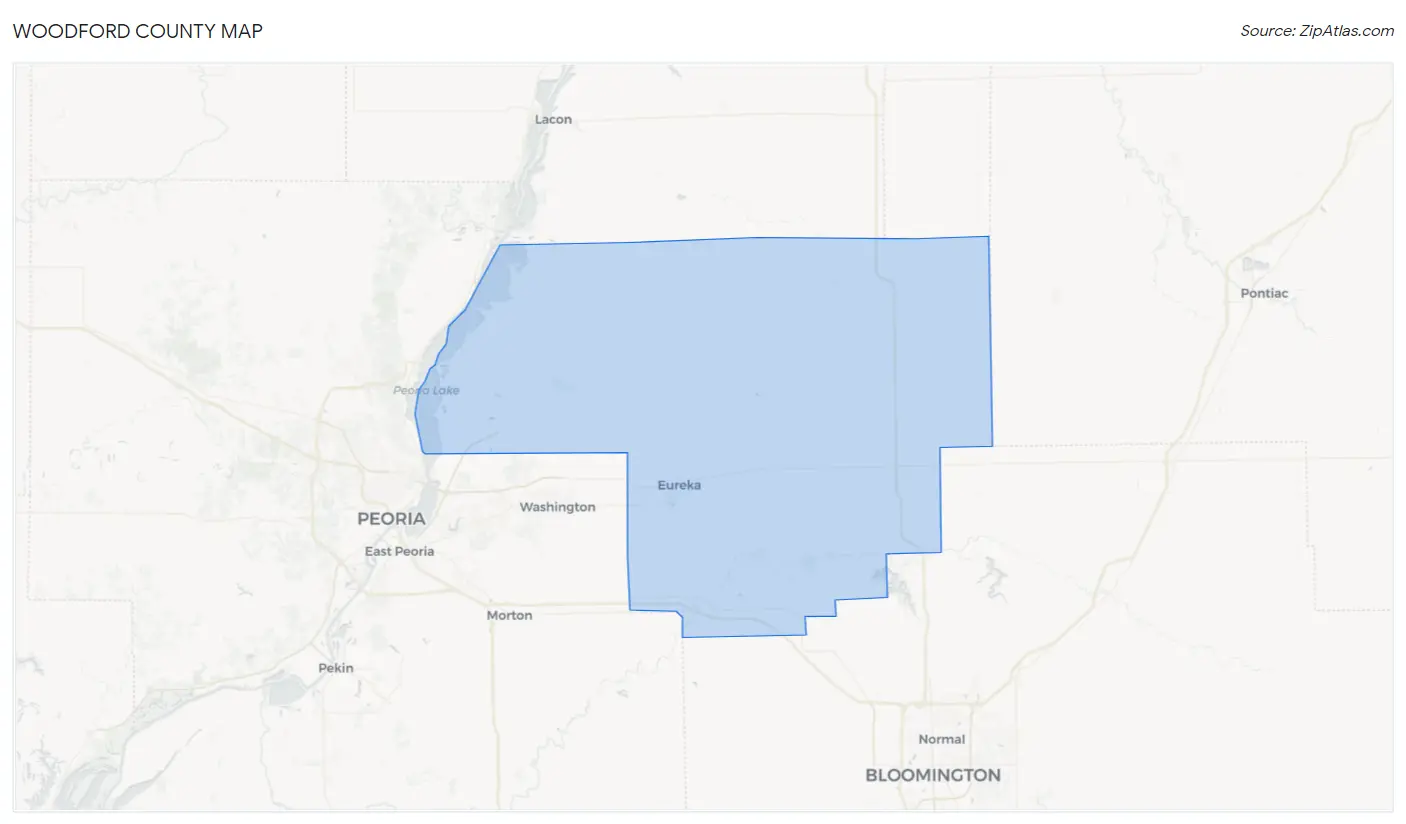
Woodford County is located in the central part of the state of Illinois, in the United States. It is part of the Peoria, IL Metropolitan Statistical Area. The county was established in 1841 and named after General William Woodford, a Revolutionary War hero. As of the 2010 census, the population was 38,664.
Geography
Woodford County is located in the central part of Illinois, and is bordered by Marshall County to the north, Tazewell County to the east, McLean County to the south, and Peoria County to the west. The county has a total area of 576 square miles, of which 574 square miles is land and 2 square miles (0.3%) is water. The county is mostly flat, with some rolling hills in the northern and western parts. The highest point in the county is located in the northwest corner, at an elevation of 890 feet.
The county is drained by the Mackinaw River, which flows through the center of the county from north to south. Other major waterways include the Vermilion River, which forms the western border of the county, and the Sangamon River, which forms the eastern border.
Climate
Woodford County has a humid continental climate, with cold, snowy winters and hot, humid summers. The average annual temperature is 51°F, and the average annual precipitation is 37.5 inches.
Demographics
As of the 2010 census, there were 38,664 people, 14,945 households, and 10,717 families residing in the county. The population density was 67 people per square mile. The racial makeup of the county was 95.2% White, 1.2% African American, 0.3% Native American, 0.5% Asian, 0.1% Pacific Islander, 1.7% from other races, and 1.1% from two or more races. Hispanic or Latino of any race were 3.7% of the population.
The median income for a household in the county was $54,945, and the median income for a family was $64,945. The per capita income for the county was $25,945. About 6.2% of families and 8.3% of the population were below the poverty line, including 10.2% of those under age 18 and 6.7% of those age 65 or over.
Economy
Woodford County is largely rural, with a strong agricultural base. The county is home to several large farms, as well as numerous smaller family farms. The county is also home to several manufacturing companies, including Caterpillar, Inc., which has a large plant in the county.
The county also has a strong tourism industry, with several popular attractions, including the Midewin National Tallgrass Prairie, the Woodford County Historical Society Museum, and the Woodford County Fair.
Conclusion
Woodford County is a rural county located in the central part of Illinois. It is home to a strong agricultural base, as well as several manufacturing companies and popular tourist attractions. The county has a population of 38,664, and a median household income of $54,945. The county is largely rural, with a humid continental climate and cold, snowy winters and hot, humid summers.
Common Questions
What is Per Capita Income in Woodford County?
Per Capita income in Woodford County is $41,400.
What is the Median Family Income in Woodford County?
Median Family Income in Woodford County is $99,662.
What is the Median Household income in Woodford County?
Median Household Income in Woodford County is $80,093.
What is Income or Wage Gap in Woodford County?
Income or Wage Gap in Woodford County is 40.1%.
Women in Woodford County earn 59.9 cents for every dollar earned by a man.
What is Family Income Deficit in Woodford County?
Family Income Deficit in Woodford County is $11,290.
Families that are below poverty line in Woodford County earn $11,290 less on average than the poverty threshold level.
What is Inequality or Gini Index in Woodford County?
Inequality or Gini Index in Woodford County is 0.43.
What is the Total Population of Woodford County?
Total Population of Woodford County is 38,414.
What is the Total Male Population of Woodford County?
Total Male Population of Woodford County is 19,241.
What is the Total Female Population of Woodford County?
Total Female Population of Woodford County is 19,173.
What is the Ratio of Males per 100 Females in Woodford County?
There are 100.35 Males per 100 Females in Woodford County.
What is the Ratio of Females per 100 Males in Woodford County?
There are 99.65 Females per 100 Males in Woodford County.
What is the Median Population Age in Woodford County?
Median Population Age in Woodford County is 40.1 Years.
What is the Average Family Size in Woodford County
Average Family Size in Woodford County is 3.0 People.
What is the Average Household Size in Woodford County
Average Household Size in Woodford County is 2.5 People.
How Large is the Labor Force in Woodford County?
There are 19,333 People in the Labor Forcein in Woodford County.
What is the Percentage of People in the Labor Force in Woodford County?
63.8% of People are in the Labor Force in Woodford County.
What is the Unemployment Rate in Woodford County?
Unemployment Rate in Woodford County is 3.3%.