White County, IL Map & Demographics
White County Map
White County Overview
$29,977
PER CAPITA INCOME
$72,500
AVG FAMILY INCOME
$54,605
AVG HOUSEHOLD INCOME
37.1%
WAGE / INCOME GAP [ % ]
62.9¢/ $1
WAGE / INCOME GAP [ $ ]
$8,350
FAMILY INCOME DEFICIT
0.44
INEQUALITY / GINI INDEX
13,834
TOTAL POPULATION
6,758
MALE POPULATION
7,076
FEMALE POPULATION
95.51
MALES / 100 FEMALES
104.71
FEMALES / 100 MALES
44.7
MEDIAN AGE
3.0
AVG FAMILY SIZE
2.4
AVG HOUSEHOLD SIZE
6,178
LABOR FORCE [ PEOPLE ]
55.1%
PERCENT IN LABOR FORCE
3.5%
UNEMPLOYMENT RATE
White County Area Codes
Income in White County
Income Overview in White County
Per Capita Income in White County is $29,977, while median incomes of families and households are $72,500 and $54,605 respectively.
| Characteristic | Number | Measure |
| Per Capita Income | 13,834 | $29,977 |
| Median Family Income | 3,574 | $72,500 |
| Mean Family Income | 3,574 | $84,197 |
| Median Household Income | 5,676 | $54,605 |
| Mean Household Income | 5,676 | $70,303 |
| Income Deficit | 3,574 | $8,350 |
| Wage / Income Gap (%) | 13,834 | 37.10% |
| Wage / Income Gap ($) | 13,834 | 62.90¢ per $1 |
| Gini / Inequality Index | 13,834 | 0.44 |
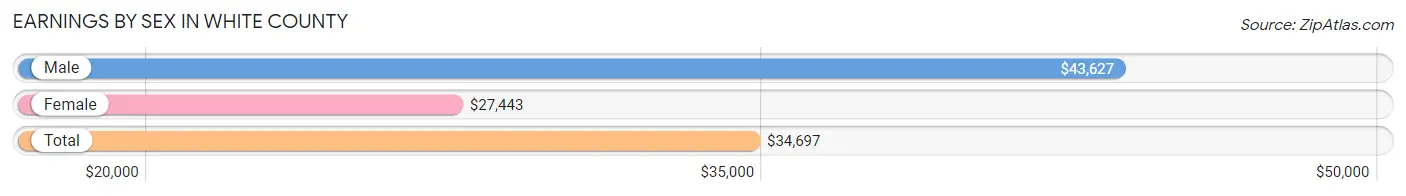
Earnings by Sex in White County
Average Earnings in White County are $34,697, $43,627 for men and $27,443 for women, a difference of 37.1%.
| Sex | Number | Average Earnings |
| Male | 3,414 (52.7%) | $43,627 |
| Female | 3,066 (47.3%) | $27,443 |
| Total | 6,480 (100.0%) | $34,697 |
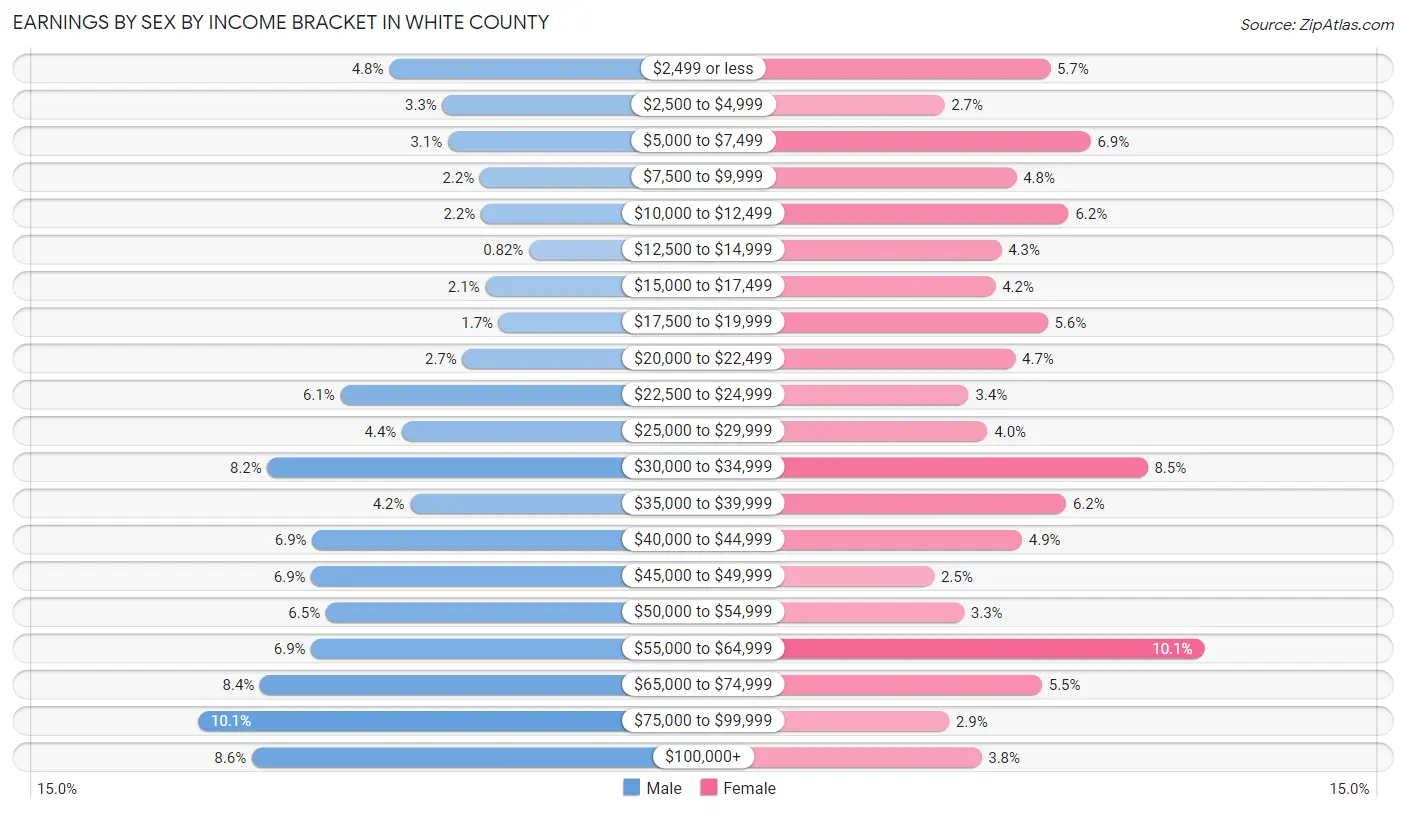
Earnings by Sex by Income Bracket in White County
The most common earnings brackets in White County are $75,000 to $99,999 for men (346 | 10.1%) and $55,000 to $64,999 for women (308 | 10.1%).
| Income | Male | Female |
| $2,499 or less | 162 (4.8%) | 175 (5.7%) |
| $2,500 to $4,999 | 111 (3.3%) | 84 (2.7%) |
| $5,000 to $7,499 | 106 (3.1%) | 210 (6.9%) |
| $7,500 to $9,999 | 75 (2.2%) | 146 (4.8%) |
| $10,000 to $12,499 | 74 (2.2%) | 191 (6.2%) |
| $12,500 to $14,999 | 28 (0.8%) | 133 (4.3%) |
| $15,000 to $17,499 | 70 (2.1%) | 128 (4.2%) |
| $17,500 to $19,999 | 57 (1.7%) | 173 (5.6%) |
| $20,000 to $22,499 | 92 (2.7%) | 145 (4.7%) |
| $22,500 to $24,999 | 209 (6.1%) | 105 (3.4%) |
| $25,000 to $29,999 | 150 (4.4%) | 121 (4.0%) |
| $30,000 to $34,999 | 279 (8.2%) | 259 (8.5%) |
| $35,000 to $39,999 | 142 (4.2%) | 189 (6.2%) |
| $40,000 to $44,999 | 236 (6.9%) | 151 (4.9%) |
| $45,000 to $49,999 | 237 (6.9%) | 75 (2.5%) |
| $50,000 to $54,999 | 223 (6.5%) | 101 (3.3%) |
| $55,000 to $64,999 | 237 (6.9%) | 308 (10.1%) |
| $65,000 to $74,999 | 286 (8.4%) | 168 (5.5%) |
| $75,000 to $99,999 | 346 (10.1%) | 88 (2.9%) |
| $100,000+ | 294 (8.6%) | 116 (3.8%) |
| Total | 3,414 (100.0%) | 3,066 (100.0%) |
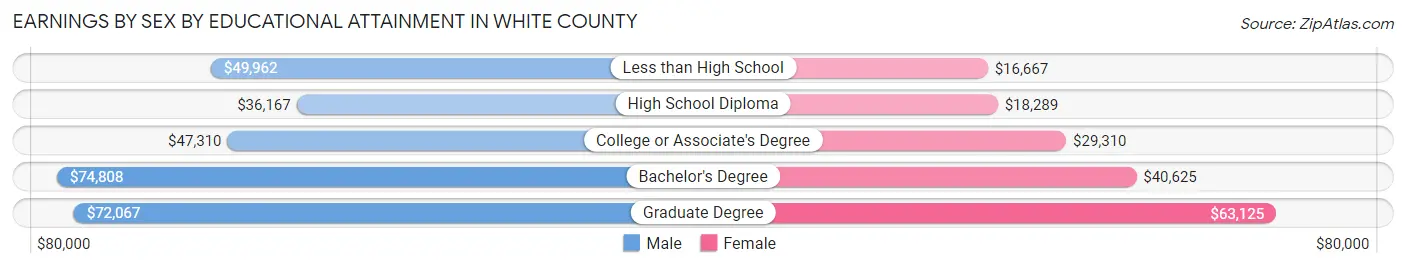
Earnings by Sex by Educational Attainment in White County
Average earnings in White County are $46,935 for men and $32,813 for women, a difference of 30.1%. Men with an educational attainment of bachelor's degree enjoy the highest average annual earnings of $74,808, while those with high school diploma education earn the least with $36,167. Women with an educational attainment of graduate degree earn the most with the average annual earnings of $63,125, while those with less than high school education have the smallest earnings of $16,667.
| Educational Attainment | Male Income | Female Income |
| Less than High School | $49,962 | $16,667 |
| High School Diploma | $36,167 | $18,289 |
| College or Associate's Degree | $47,310 | $29,310 |
| Bachelor's Degree | $74,808 | $40,625 |
| Graduate Degree | $72,067 | $63,125 |
| Total | $46,935 | $32,813 |
Family Income in White County
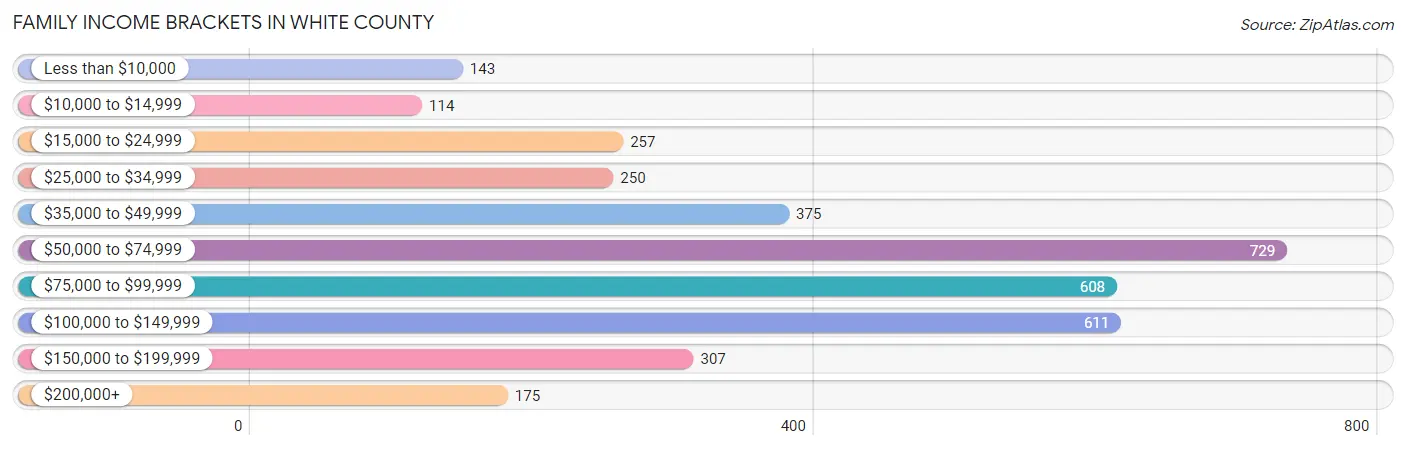
Family Income Brackets in White County
According to the White County family income data, there are 729 families falling into the $50,000 to $74,999 income range, which is the most common income bracket and makes up 20.4% of all families. Conversely, the $10,000 to $14,999 income bracket is the least frequent group with only 114 families (3.2%) belonging to this category.
| Income Bracket | # Families | % Families |
| Less than $10,000 | 143 | 4.0% |
| $10,000 to $14,999 | 114 | 3.2% |
| $15,000 to $24,999 | 257 | 7.2% |
| $25,000 to $34,999 | 250 | 7.0% |
| $35,000 to $49,999 | 375 | 10.5% |
| $50,000 to $74,999 | 729 | 20.4% |
| $75,000 to $99,999 | 608 | 17.0% |
| $100,000 to $149,999 | 611 | 17.1% |
| $150,000 to $199,999 | 307 | 8.6% |
| $200,000+ | 175 | 4.9% |
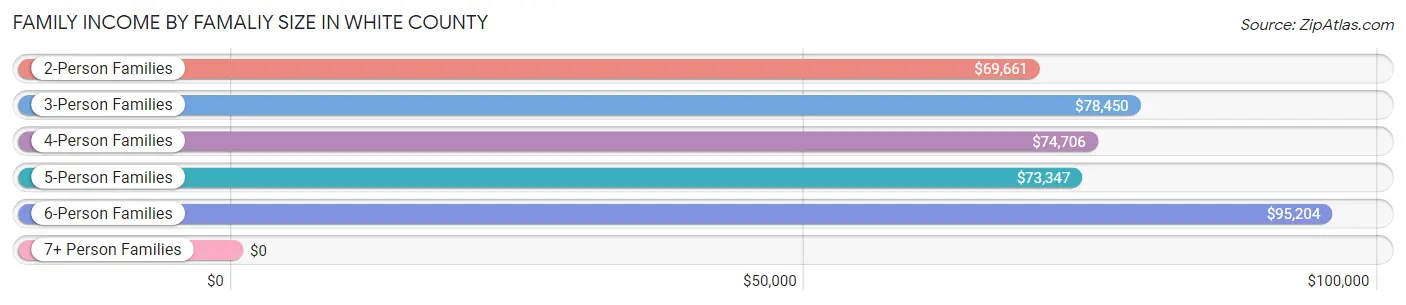
Family Income by Famaliy Size in White County
6-person families (136 | 3.8%) account for the highest median family income in White County with $95,204 per family, while 2-person families (2,046 | 57.3%) have the highest median income of $34,830 per family member.
| Income Bracket | # Families | Median Income |
| 2-Person Families | 2,046 (57.3%) | $69,661 |
| 3-Person Families | 673 (18.8%) | $78,450 |
| 4-Person Families | 394 (11.0%) | $74,706 |
| 5-Person Families | 317 (8.9%) | $73,347 |
| 6-Person Families | 136 (3.8%) | $95,204 |
| 7+ Person Families | 8 (0.2%) | $0 |
| Total | 3,574 (100.0%) | $72,500 |
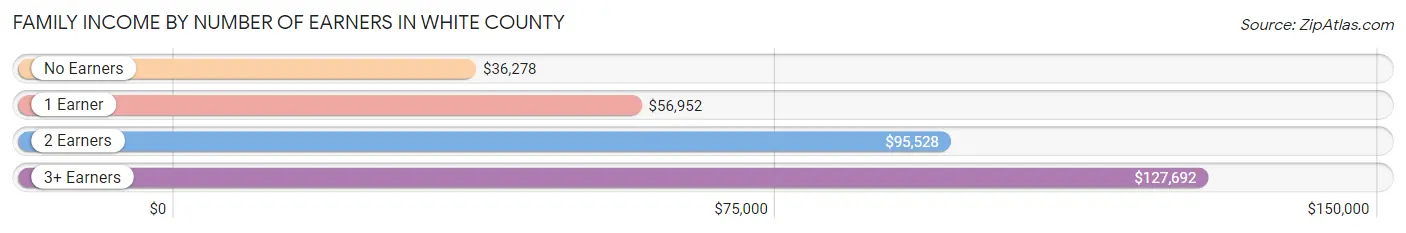
Family Income by Number of Earners in White County
The median family income in White County is $72,500, with families comprising 3+ earners (342) having the highest median family income of $127,692, while families with no earners (857) have the lowest median family income of $36,278, accounting for 9.6% and 24.0% of families, respectively.
| Number of Earners | # Families | Median Income |
| No Earners | 857 (24.0%) | $36,278 |
| 1 Earner | 1,040 (29.1%) | $56,952 |
| 2 Earners | 1,335 (37.3%) | $95,528 |
| 3+ Earners | 342 (9.6%) | $127,692 |
| Total | 3,574 (100.0%) | $72,500 |
Household Income in White County
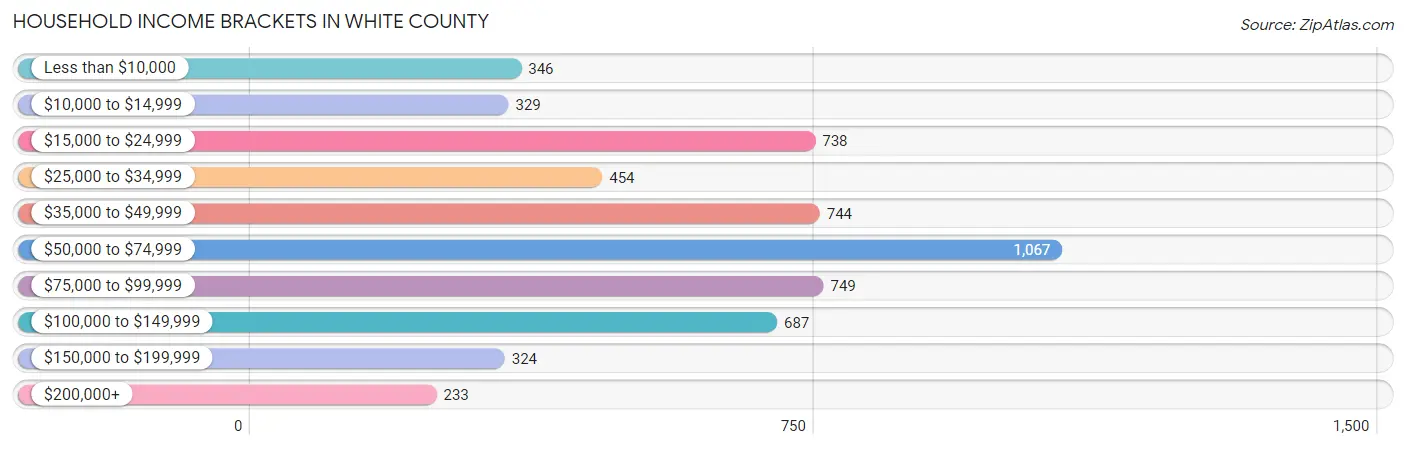
Household Income Brackets in White County
With 1,067 households falling in the category, the $50,000 to $74,999 income range is the most frequent in White County, accounting for 18.8% of all households. In contrast, only 233 households (4.1%) fall into the $200,000+ income bracket, making it the least populous group.
| Income Bracket | # Households | % Households |
| Less than $10,000 | 346 | 6.1% |
| $10,000 to $14,999 | 329 | 5.8% |
| $15,000 to $24,999 | 738 | 13.0% |
| $25,000 to $34,999 | 454 | 8.0% |
| $35,000 to $49,999 | 744 | 13.1% |
| $50,000 to $74,999 | 1,067 | 18.8% |
| $75,000 to $99,999 | 749 | 13.2% |
| $100,000 to $149,999 | 687 | 12.1% |
| $150,000 to $199,999 | 324 | 5.7% |
| $200,000+ | 233 | 4.1% |
Household Income by Householder Age in White County
The median household income in White County is $54,605, with the highest median household income of $63,772 found in the 25 to 44 years age bracket for the primary householder. A total of 1,643 households (28.9%) fall into this category. Meanwhile, the 15 to 24 years age bracket for the primary householder has the lowest median household income of $32,969, with 117 households (2.1%) in this group.
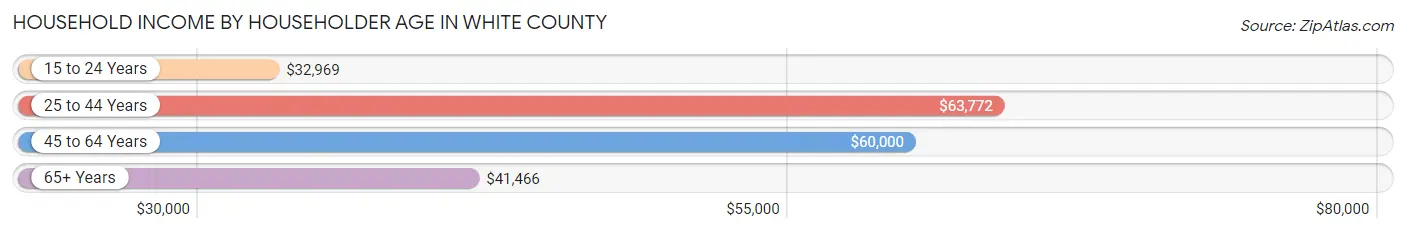
| Income Bracket | # Households | Median Income |
| 15 to 24 Years | 117 (2.1%) | $32,969 |
| 25 to 44 Years | 1,643 (28.9%) | $63,772 |
| 45 to 64 Years | 1,884 (33.2%) | $60,000 |
| 65+ Years | 2,032 (35.8%) | $41,466 |
| Total | 5,676 (100.0%) | $54,605 |
Poverty in White County
Income Below Poverty by Sex and Age in White County
With 14.2% poverty level for males and 16.4% for females among the residents of White County, 15 year old males and 15 year old females are the most vulnerable to poverty, with 19 males (33.9%) and 43 females (32.3%) in their respective age groups living below the poverty level.
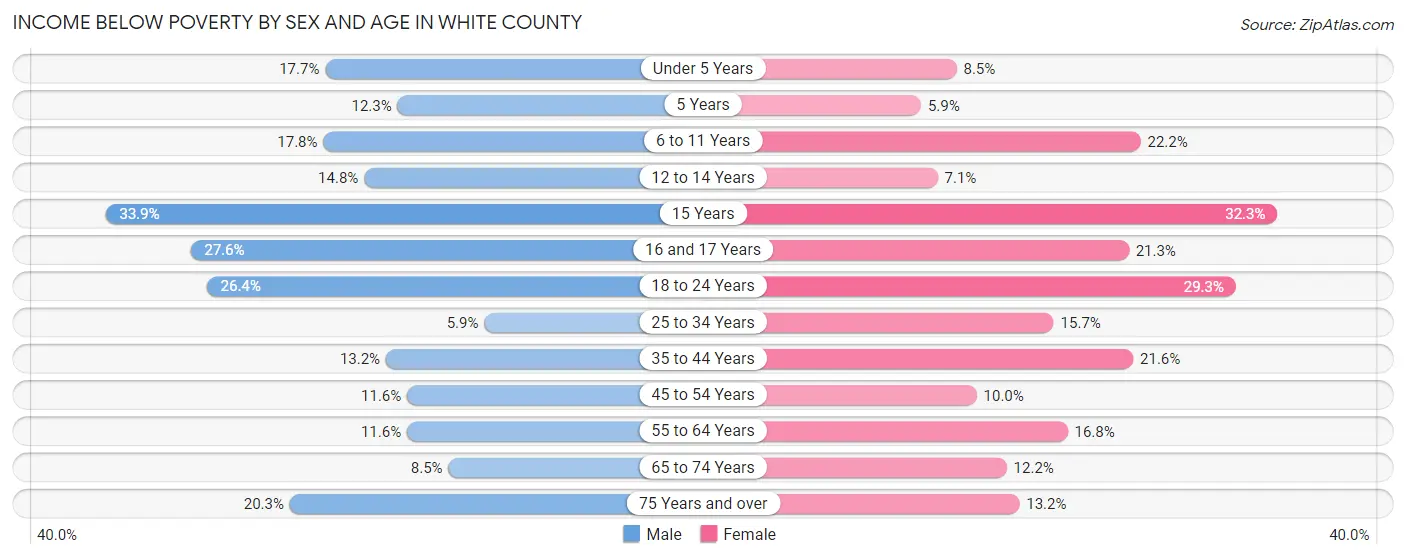
| Age Bracket | Male | Female |
| Under 5 Years | 67 (17.7%) | 26 (8.5%) |
| 5 Years | 8 (12.3%) | 2 (5.9%) |
| 6 to 11 Years | 85 (17.8%) | 122 (22.2%) |
| 12 to 14 Years | 42 (14.8%) | 14 (7.1%) |
| 15 Years | 19 (33.9%) | 43 (32.3%) |
| 16 and 17 Years | 50 (27.6%) | 36 (21.3%) |
| 18 to 24 Years | 117 (26.4%) | 124 (29.2%) |
| 25 to 34 Years | 43 (5.9%) | 115 (15.7%) |
| 35 to 44 Years | 105 (13.2%) | 180 (21.6%) |
| 45 to 54 Years | 92 (11.6%) | 76 (10.0%) |
| 55 to 64 Years | 118 (11.6%) | 172 (16.8%) |
| 65 to 74 Years | 64 (8.5%) | 105 (12.2%) |
| 75 Years and over | 118 (20.3%) | 106 (13.2%) |
| Total | 928 (14.2%) | 1,121 (16.4%) |
Income Above Poverty by Sex and Age in White County
According to the poverty statistics in White County, males aged 25 to 34 years and females aged 5 years are the age groups that are most secure financially, with 94.1% of males and 94.1% of females in these age groups living above the poverty line.
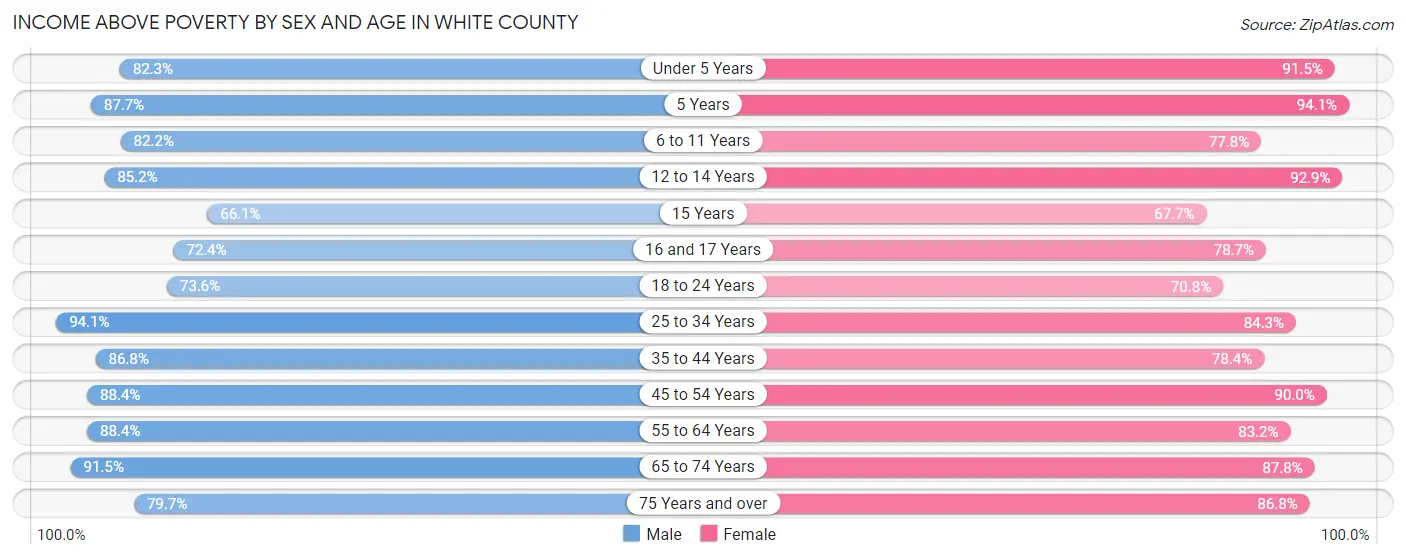
| Age Bracket | Male | Female |
| Under 5 Years | 312 (82.3%) | 279 (91.5%) |
| 5 Years | 57 (87.7%) | 32 (94.1%) |
| 6 to 11 Years | 392 (82.2%) | 428 (77.8%) |
| 12 to 14 Years | 242 (85.2%) | 183 (92.9%) |
| 15 Years | 37 (66.1%) | 90 (67.7%) |
| 16 and 17 Years | 131 (72.4%) | 133 (78.7%) |
| 18 to 24 Years | 326 (73.6%) | 300 (70.8%) |
| 25 to 34 Years | 690 (94.1%) | 616 (84.3%) |
| 35 to 44 Years | 692 (86.8%) | 652 (78.4%) |
| 45 to 54 Years | 701 (88.4%) | 683 (90.0%) |
| 55 to 64 Years | 898 (88.4%) | 854 (83.2%) |
| 65 to 74 Years | 686 (91.5%) | 753 (87.8%) |
| 75 Years and over | 463 (79.7%) | 698 (86.8%) |
| Total | 5,627 (85.8%) | 5,701 (83.6%) |
Income Below Poverty Among Married-Couple Families in White County
The poverty statistics for married-couple families in White County show that 5.3% or 145 of the total 2,709 families live below the poverty line. Families with 3 or 4 children have the highest poverty rate of 8.2%, comprising of 25 families. On the other hand, families with 1 or 2 children have the lowest poverty rate of 3.5%, which includes 20 families.
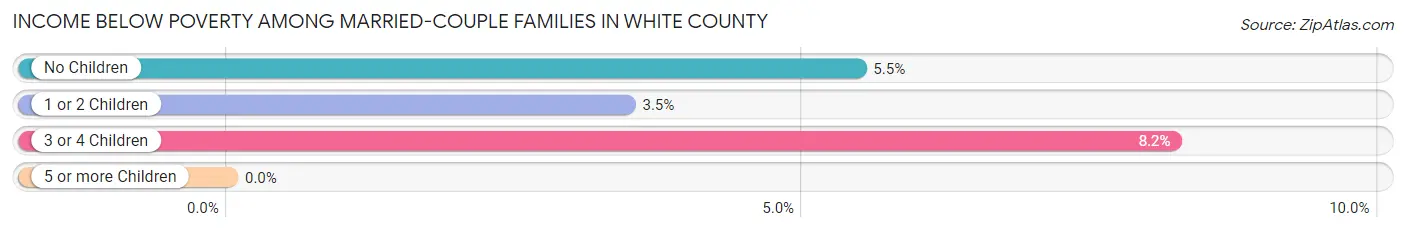
| Children | Above Poverty | Below Poverty |
| No Children | 1,727 (94.5%) | 100 (5.5%) |
| 1 or 2 Children | 558 (96.5%) | 20 (3.5%) |
| 3 or 4 Children | 279 (91.8%) | 25 (8.2%) |
| 5 or more Children | 0 (0.0%) | 0 (0.0%) |
| Total | 2,564 (94.7%) | 145 (5.3%) |
Income Below Poverty Among Single-Parent Households in White County
According to the poverty data in White County, 17.7% or 31 single-father households and 39.7% or 274 single-mother households are living below the poverty line. Among single-father households, those with 3 or 4 children have the highest poverty rate, with 8 households (61.5%) experiencing poverty. Likewise, among single-mother households, those with 1 or 2 children have the highest poverty rate, with 169 households (53.1%) falling below the poverty line.
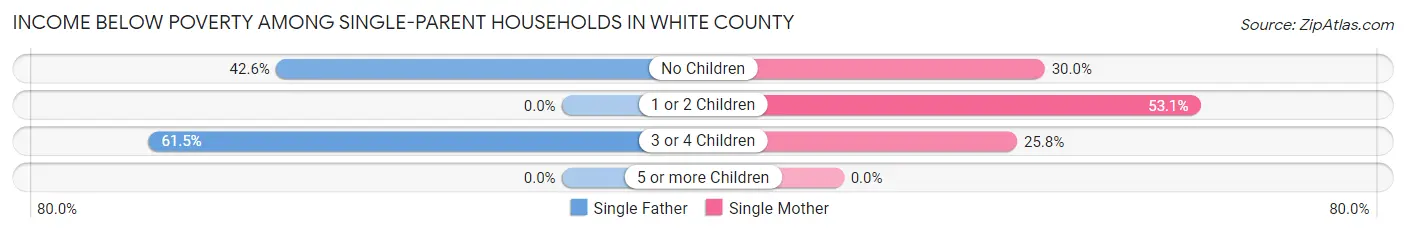
| Children | Single Father | Single Mother |
| No Children | 23 (42.6%) | 74 (30.0%) |
| 1 or 2 Children | 0 (0.0%) | 169 (53.1%) |
| 3 or 4 Children | 8 (61.5%) | 31 (25.8%) |
| 5 or more Children | 0 (0.0%) | 0 (0.0%) |
| Total | 31 (17.7%) | 274 (39.7%) |
Income Below Poverty Among Married-Couple vs Single-Parent Households in White County
The poverty data for White County shows that 145 of the married-couple family households (5.3%) and 305 of the single-parent households (35.3%) are living below the poverty level. Within the married-couple family households, those with 3 or 4 children have the highest poverty rate, with 25 households (8.2%) falling below the poverty line. Among the single-parent households, those with 1 or 2 children have the highest poverty rate, with 169 household (39.7%) living below poverty.
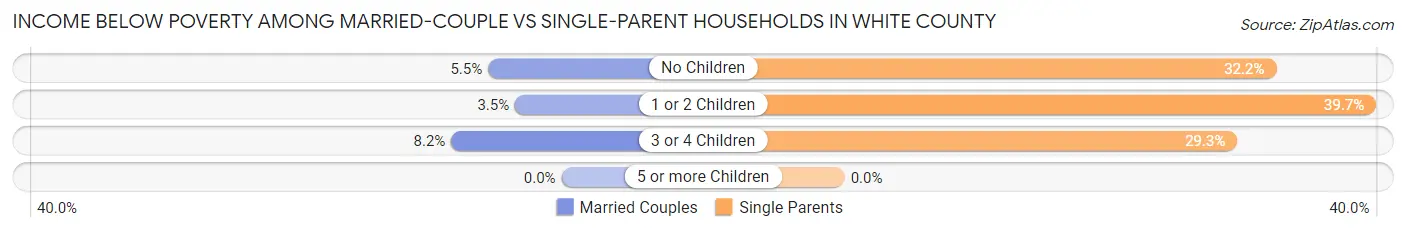
| Children | Married-Couple Families | Single-Parent Households |
| No Children | 100 (5.5%) | 97 (32.2%) |
| 1 or 2 Children | 20 (3.5%) | 169 (39.7%) |
| 3 or 4 Children | 25 (8.2%) | 39 (29.3%) |
| 5 or more Children | 0 (0.0%) | 0 (0.0%) |
| Total | 145 (5.3%) | 305 (35.3%) |
Race in White County
The most populous races in White County are White / Caucasian (13,379 | 96.7%), Two or more Races (207 | 1.5%), and Hispanic or Latino (205 | 1.5%).
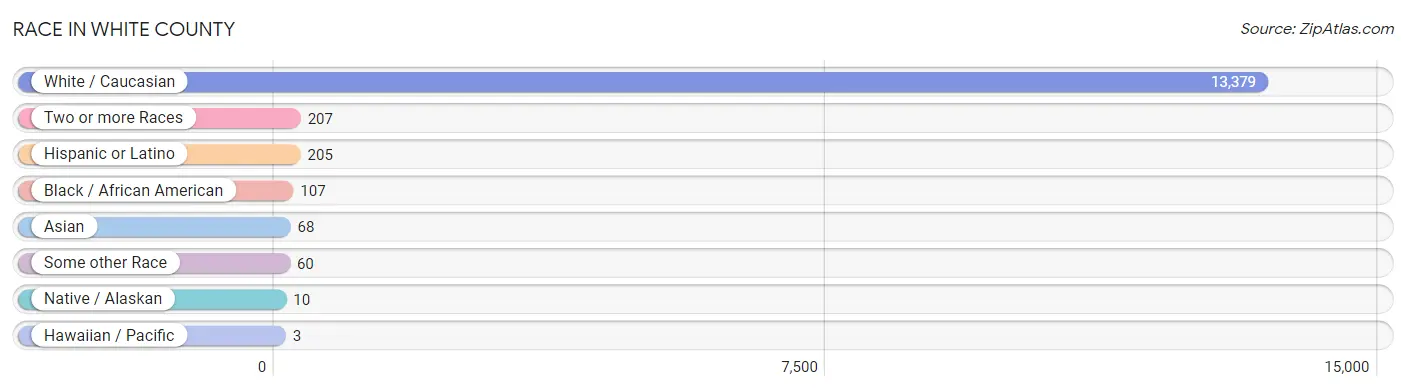
| Race | # Population | % Population |
| Asian | 68 | 0.5% |
| Black / African American | 107 | 0.8% |
| Hawaiian / Pacific | 3 | 0.0% |
| Hispanic or Latino | 205 | 1.5% |
| Native / Alaskan | 10 | 0.1% |
| White / Caucasian | 13,379 | 96.7% |
| Two or more Races | 207 | 1.5% |
| Some other Race | 60 | 0.4% |
| Total | 13,834 | 100.0% |
Ancestry in White County
The most populous ancestries reported in White County are German (2,785 | 20.1%), English (1,756 | 12.7%), Irish (1,674 | 12.1%), American (1,265 | 9.1%), and Polish (277 | 2.0%), together accounting for 56.1% of all White County residents.
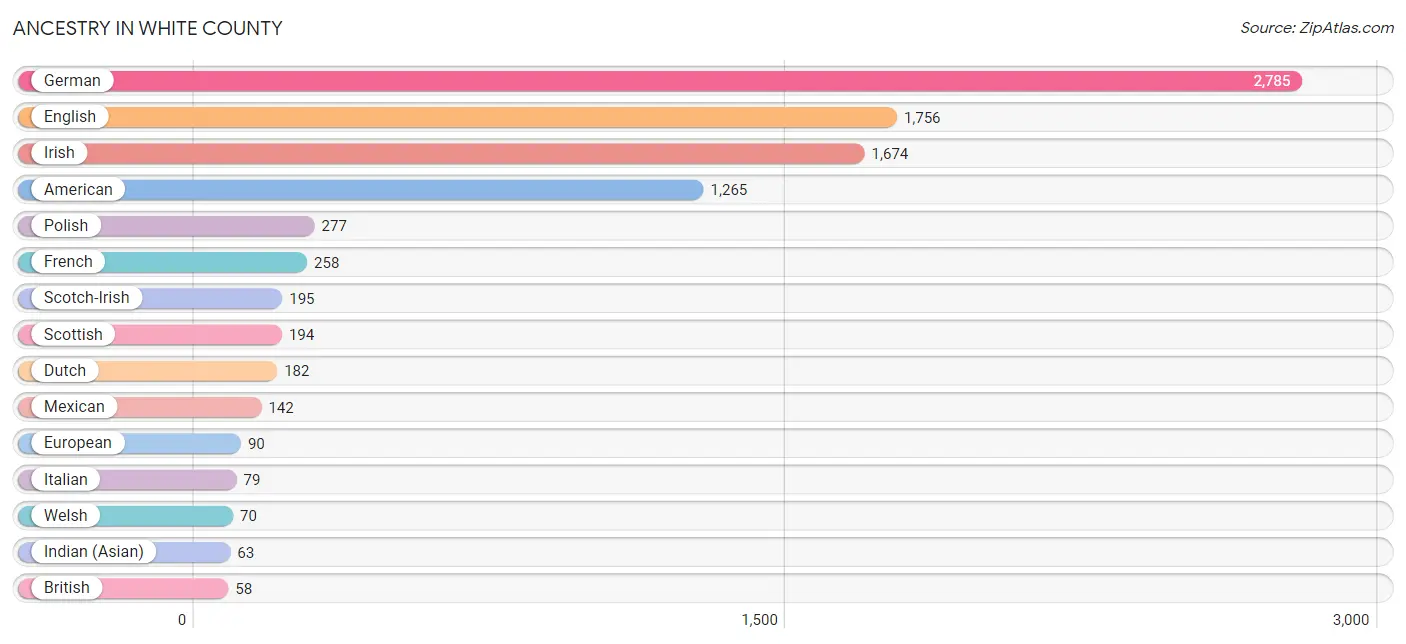
| Ancestry | # Population | % Population |
| African | 23 | 0.2% |
| American | 1,265 | 9.1% |
| Austrian | 8 | 0.1% |
| Bhutanese | 2 | 0.0% |
| Blackfeet | 2 | 0.0% |
| Brazilian | 1 | 0.0% |
| British | 58 | 0.4% |
| Bulgarian | 17 | 0.1% |
| Burmese | 14 | 0.1% |
| Central American | 4 | 0.0% |
| Central American Indian | 9 | 0.1% |
| Cherokee | 44 | 0.3% |
| Chickasaw | 1 | 0.0% |
| Colombian | 11 | 0.1% |
| Creek | 3 | 0.0% |
| Croatian | 27 | 0.2% |
| Cuban | 12 | 0.1% |
| Czech | 11 | 0.1% |
| Czechoslovakian | 48 | 0.4% |
| Danish | 12 | 0.1% |
| Dutch | 182 | 1.3% |
| Eastern European | 21 | 0.2% |
| English | 1,756 | 12.7% |
| European | 90 | 0.6% |
| French | 258 | 1.9% |
| French Canadian | 10 | 0.1% |
| German | 2,785 | 20.1% |
| Greek | 12 | 0.1% |
| Guamanian / Chamorro | 6 | 0.0% |
| Guatemalan | 2 | 0.0% |
| Hungarian | 1 | 0.0% |
| Indian (Asian) | 63 | 0.5% |
| Irish | 1,674 | 12.1% |
| Iroquois | 5 | 0.0% |
| Italian | 79 | 0.6% |
| Korean | 2 | 0.0% |
| Mexican | 142 | 1.0% |
| Native Hawaiian | 1 | 0.0% |
| Nigerian | 5 | 0.0% |
| Norwegian | 38 | 0.3% |
| Panamanian | 2 | 0.0% |
| Polish | 277 | 2.0% |
| Puerto Rican | 11 | 0.1% |
| Romanian | 10 | 0.1% |
| Russian | 16 | 0.1% |
| Samoan | 14 | 0.1% |
| Scandinavian | 38 | 0.3% |
| Scotch-Irish | 195 | 1.4% |
| Scottish | 194 | 1.4% |
| Slovak | 8 | 0.1% |
| South American | 11 | 0.1% |
| Spaniard | 2 | 0.0% |
| Spanish | 10 | 0.1% |
| Subsaharan African | 28 | 0.2% |
| Swedish | 54 | 0.4% |
| Swiss | 57 | 0.4% |
| Thai | 1 | 0.0% |
| Ukrainian | 12 | 0.1% |
| Welsh | 70 | 0.5% | View All 59 Rows |
Immigrants in White County
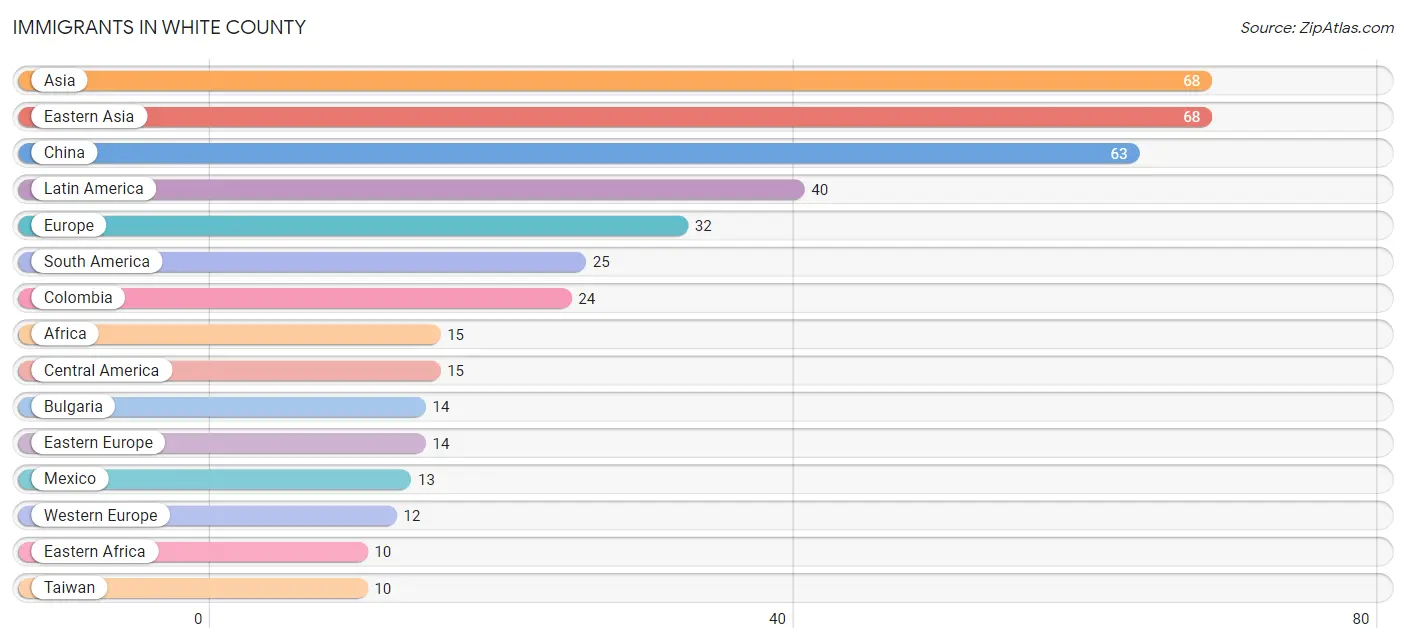
The most numerous immigrant groups reported in White County came from Asia (68 | 0.5%), Eastern Asia (68 | 0.5%), China (63 | 0.5%), Latin America (40 | 0.3%), and Europe (32 | 0.2%), together accounting for 2.0% of all White County residents.
| Immigration Origin | # Population | % Population |
| Africa | 15 | 0.1% |
| Asia | 68 | 0.5% |
| Brazil | 1 | 0.0% |
| Bulgaria | 14 | 0.1% |
| Canada | 9 | 0.1% |
| Central America | 15 | 0.1% |
| China | 63 | 0.5% |
| Colombia | 24 | 0.2% |
| Eastern Africa | 10 | 0.1% |
| Eastern Asia | 68 | 0.5% |
| Eastern Europe | 14 | 0.1% |
| Europe | 32 | 0.2% |
| Germany | 3 | 0.0% |
| Greece | 6 | 0.0% |
| Guatemala | 2 | 0.0% |
| Korea | 5 | 0.0% |
| Latin America | 40 | 0.3% |
| Mexico | 13 | 0.1% |
| Netherlands | 9 | 0.1% |
| Nigeria | 5 | 0.0% |
| South America | 25 | 0.2% |
| Southern Europe | 6 | 0.0% |
| Taiwan | 10 | 0.1% |
| Western Africa | 5 | 0.0% |
| Western Europe | 12 | 0.1% |
| Zimbabwe | 10 | 0.1% | View All 26 Rows |
Sex and Age in White County
Sex and Age in White County
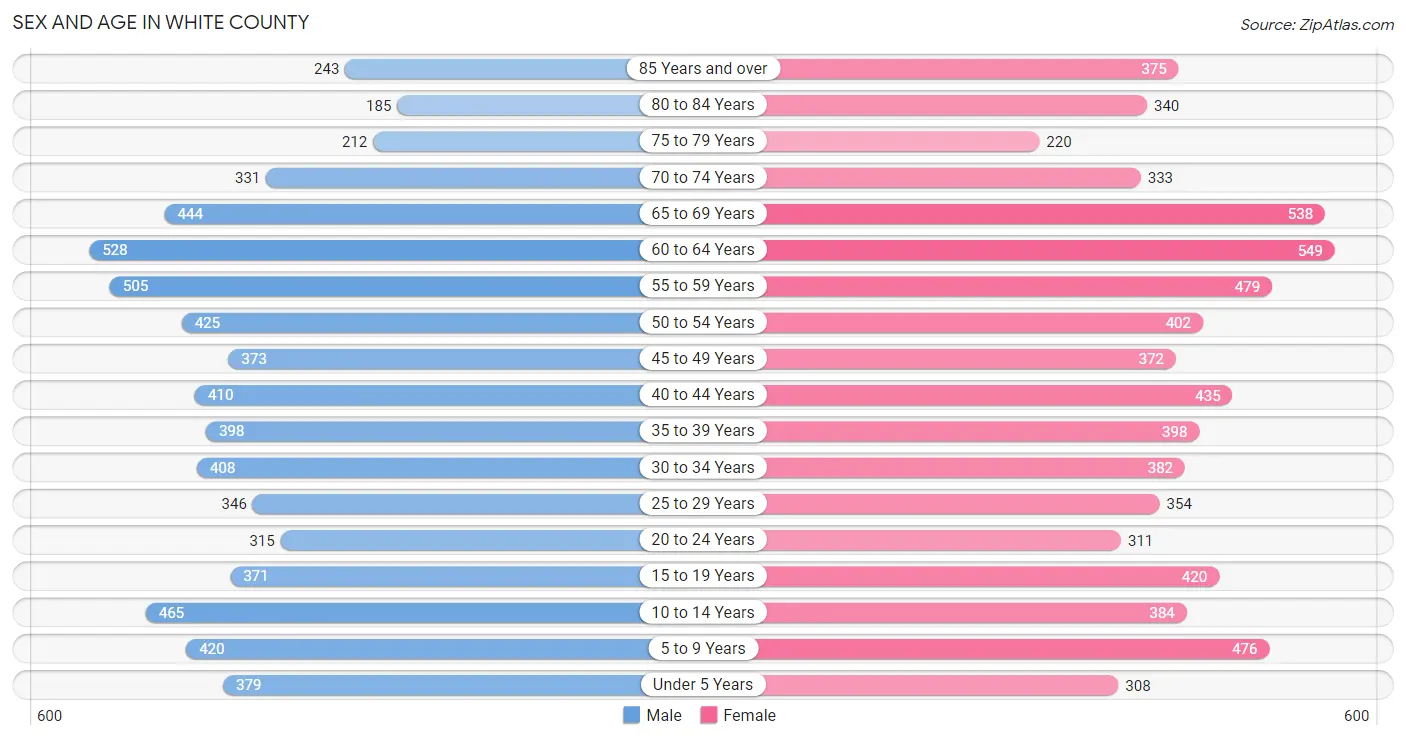
The most populous age groups in White County are 60 to 64 Years (528 | 7.8%) for men and 60 to 64 Years (549 | 7.8%) for women.
| Age Bracket | Male | Female |
| Under 5 Years | 379 (5.6%) | 308 (4.3%) |
| 5 to 9 Years | 420 (6.2%) | 476 (6.7%) |
| 10 to 14 Years | 465 (6.9%) | 384 (5.4%) |
| 15 to 19 Years | 371 (5.5%) | 420 (5.9%) |
| 20 to 24 Years | 315 (4.7%) | 311 (4.4%) |
| 25 to 29 Years | 346 (5.1%) | 354 (5.0%) |
| 30 to 34 Years | 408 (6.0%) | 382 (5.4%) |
| 35 to 39 Years | 398 (5.9%) | 398 (5.6%) |
| 40 to 44 Years | 410 (6.1%) | 435 (6.1%) |
| 45 to 49 Years | 373 (5.5%) | 372 (5.3%) |
| 50 to 54 Years | 425 (6.3%) | 402 (5.7%) |
| 55 to 59 Years | 505 (7.5%) | 479 (6.8%) |
| 60 to 64 Years | 528 (7.8%) | 549 (7.8%) |
| 65 to 69 Years | 444 (6.6%) | 538 (7.6%) |
| 70 to 74 Years | 331 (4.9%) | 333 (4.7%) |
| 75 to 79 Years | 212 (3.1%) | 220 (3.1%) |
| 80 to 84 Years | 185 (2.7%) | 340 (4.8%) |
| 85 Years and over | 243 (3.6%) | 375 (5.3%) |
| Total | 6,758 (100.0%) | 7,076 (100.0%) |
Families and Households in White County
Median Family Size in White County
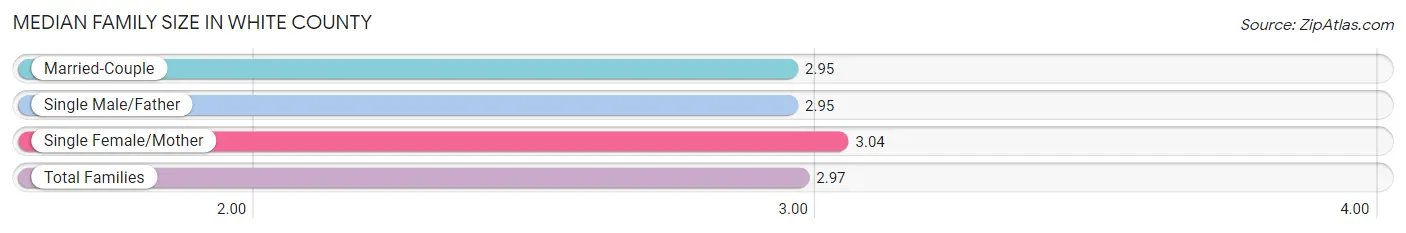
The median family size in White County is 2.97 persons per family, with single female/mother families (690 | 19.3%) accounting for the largest median family size of 3.04 persons per family. On the other hand, married-couple families (2,709 | 75.8%) represent the smallest median family size with 2.95 persons per family.
| Family Type | # Families | Family Size |
| Married-Couple | 2,709 (75.8%) | 2.95 |
| Single Male/Father | 175 (4.9%) | 2.95 |
| Single Female/Mother | 690 (19.3%) | 3.04 |
| Total Families | 3,574 (100.0%) | 2.97 |
Median Household Size in White County
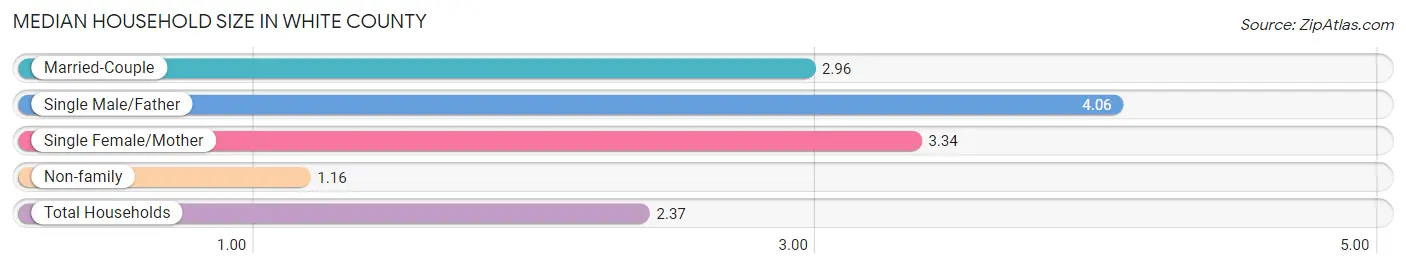
The median household size in White County is 2.37 persons per household, with single male/father households (175 | 3.1%) accounting for the largest median household size of 4.06 persons per household. non-family households (2,102 | 37.0%) represent the smallest median household size with 1.16 persons per household.
| Household Type | # Households | Household Size |
| Married-Couple | 2,709 (47.7%) | 2.96 |
| Single Male/Father | 175 (3.1%) | 4.06 |
| Single Female/Mother | 690 (12.2%) | 3.34 |
| Non-family | 2,102 (37.0%) | 1.16 |
| Total Households | 5,676 (100.0%) | 2.37 |
Household Size by Marriage Status in White County
Out of a total of 5,676 households in White County, 3,574 (63.0%) are family households, while 2,102 (37.0%) are nonfamily households. The most numerous type of family households are 2-person households, comprising 1,901, and the most common type of nonfamily households are 1-person households, comprising 1,906.
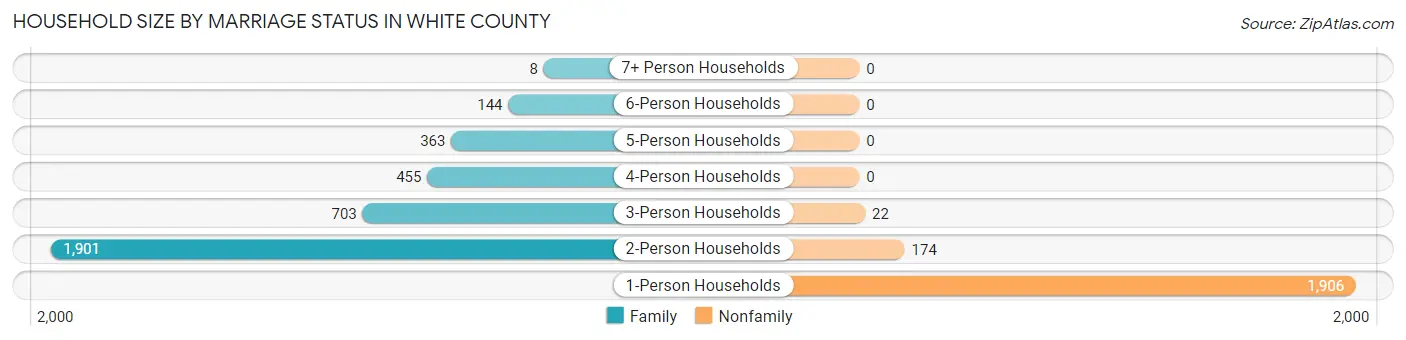
| Household Size | Family Households | Nonfamily Households |
| 1-Person Households | - | 1,906 (33.6%) |
| 2-Person Households | 1,901 (33.5%) | 174 (3.1%) |
| 3-Person Households | 703 (12.4%) | 22 (0.4%) |
| 4-Person Households | 455 (8.0%) | 0 (0.0%) |
| 5-Person Households | 363 (6.4%) | 0 (0.0%) |
| 6-Person Households | 144 (2.5%) | 0 (0.0%) |
| 7+ Person Households | 8 (0.1%) | 0 (0.0%) |
| Total | 3,574 (63.0%) | 2,102 (37.0%) |
Female Fertility in White County
Fertility by Age in White County
Average fertility rate in White County is 49.0 births per 1,000 women. Women in the age bracket of 20 to 34 years have the highest fertility rate with 119.0 births per 1,000 women. Women in the age bracket of 20 to 34 years acount for 93.3% of all women with births.
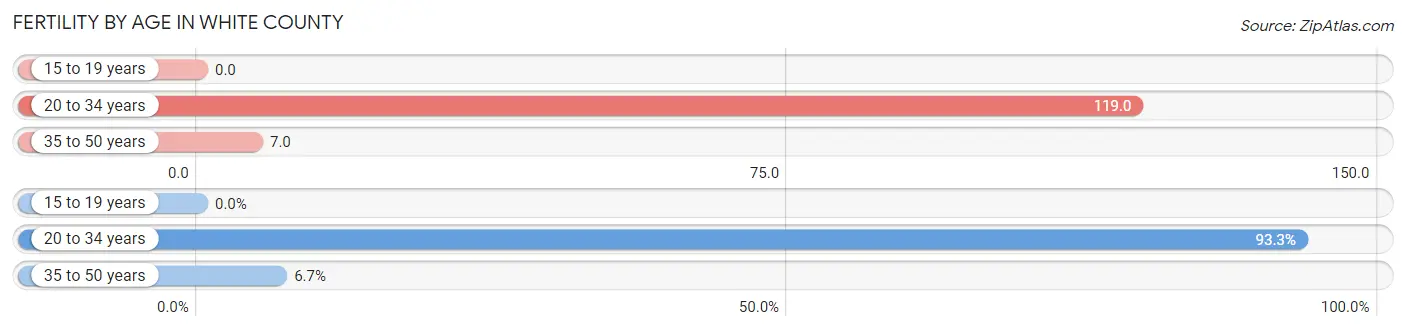
| Age Bracket | Women with Births | Births / 1,000 Women |
| 15 to 19 years | 0 (0.0%) | 0.0 |
| 20 to 34 years | 125 (93.3%) | 119.0 |
| 35 to 50 years | 9 (6.7%) | 7.0 |
| Total | 134 (100.0%) | 49.0 |
Fertility by Age by Marriage Status in White County
23.9% of women with births (134) in White County are married. The highest percentage of unmarried women with births falls into 20 to 34 years age bracket with 76.8% of them unmarried at the time of birth, while the lowest percentage of unmarried women with births belong to 35 to 50 years age bracket with 66.7% of them unmarried.
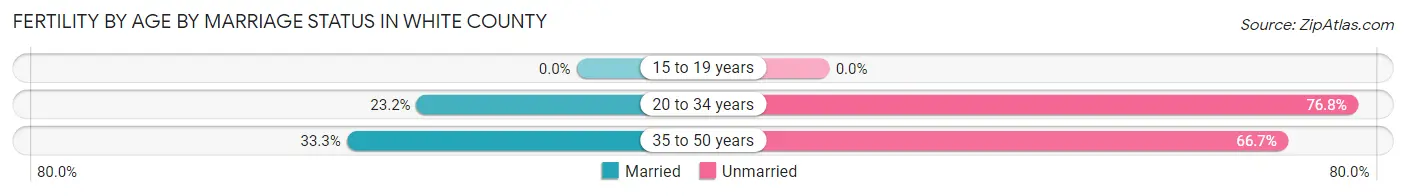
| Age Bracket | Married | Unmarried |
| 15 to 19 years | 0 (0.0%) | 0 (0.0%) |
| 20 to 34 years | 29 (23.2%) | 96 (76.8%) |
| 35 to 50 years | 3 (33.3%) | 6 (66.7%) |
| Total | 32 (23.9%) | 102 (76.1%) |
Fertility by Education in White County
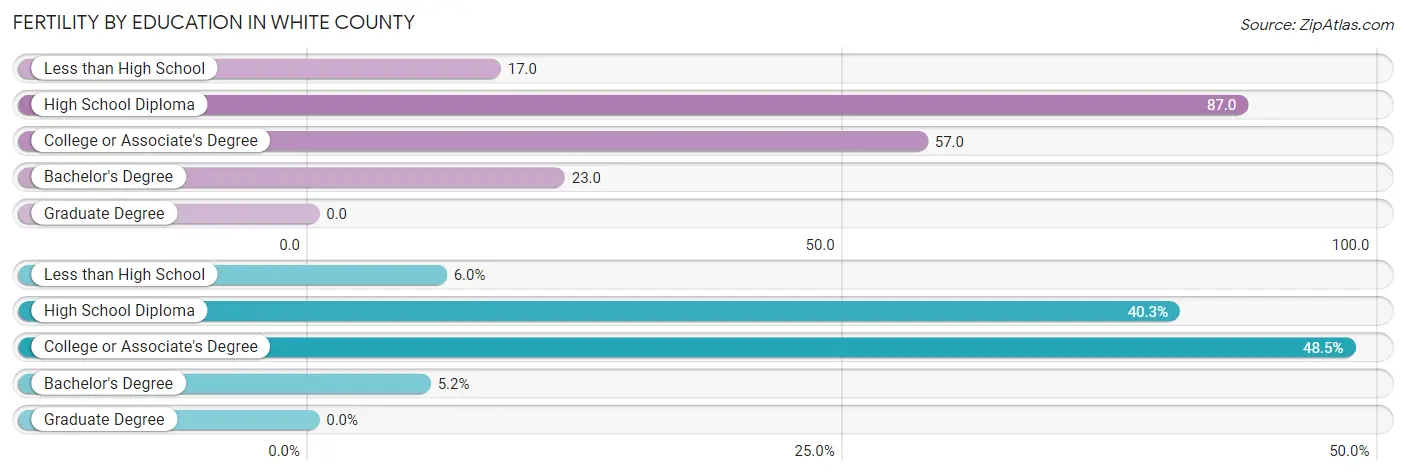
| Educational Attainment | Women with Births | Births / 1,000 Women |
| Less than High School | 8 (6.0%) | 17.0 |
| High School Diploma | 54 (40.3%) | 87.0 |
| College or Associate's Degree | 65 (48.5%) | 57.0 |
| Bachelor's Degree | 7 (5.2%) | 23.0 |
| Graduate Degree | 0 (0.0%) | 0.0 |
| Total | 134 (100.0%) | 49.0 |
Fertility by Education by Marriage Status in White County
76.1% of women with births in White County are unmarried. Women with the educational attainment of bachelor's degree are most likely to be married with 100.0% of them married at childbirth, while women with the educational attainment of college or associate's degree are least likely to be married with 86.2% of them unmarried at childbirth.
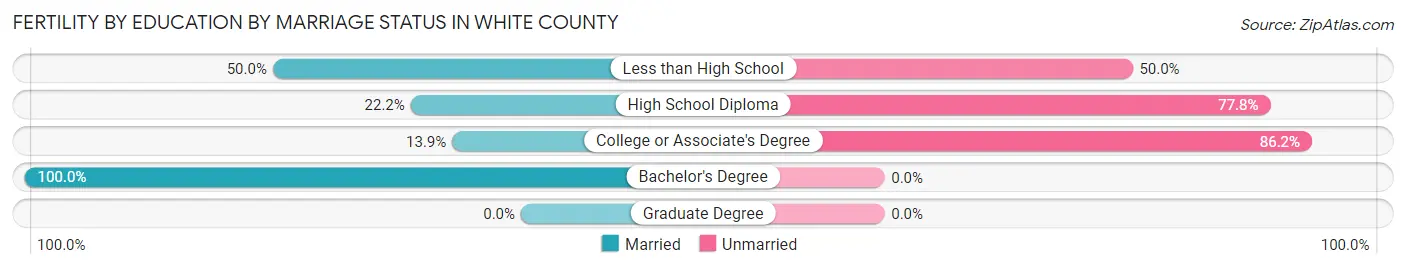
| Educational Attainment | Married | Unmarried |
| Less than High School | 4 (50.0%) | 4 (50.0%) |
| High School Diploma | 12 (22.2%) | 42 (77.8%) |
| College or Associate's Degree | 9 (13.9%) | 56 (86.2%) |
| Bachelor's Degree | 7 (100.0%) | 0 (0.0%) |
| Graduate Degree | 0 (0.0%) | 0 (0.0%) |
| Total | 32 (23.9%) | 102 (76.1%) |
Employment Characteristics in White County
Employment by Class of Employer in White County
Among the 5,884 employed individuals in White County, private company employees (4,074 | 69.2%), local government employees (487 | 8.3%), and self-employed (not incorporated) (475 | 8.1%) make up the most common classes of employment.
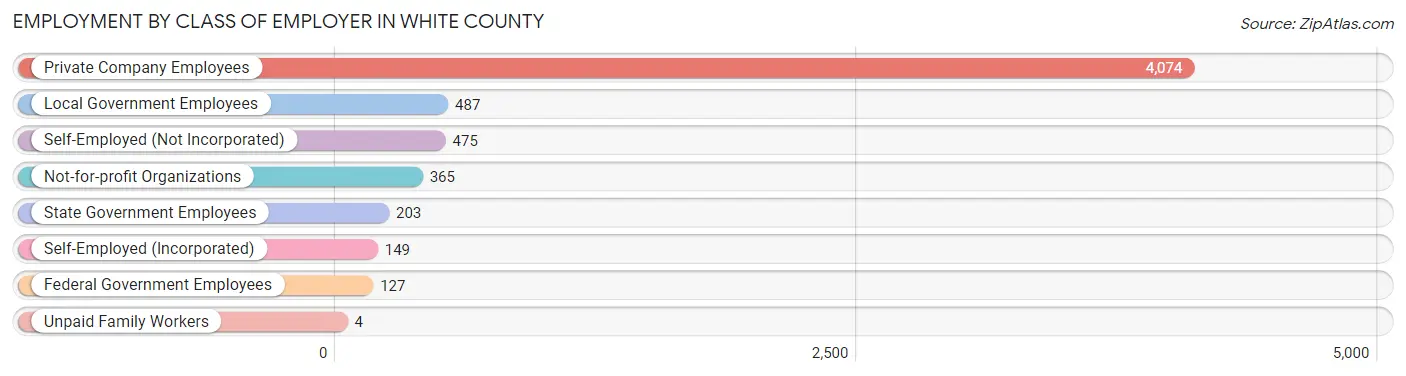
| Employer Class | # Employees | % Employees |
| Private Company Employees | 4,074 | 69.2% |
| Self-Employed (Incorporated) | 149 | 2.5% |
| Self-Employed (Not Incorporated) | 475 | 8.1% |
| Not-for-profit Organizations | 365 | 6.2% |
| Local Government Employees | 487 | 8.3% |
| State Government Employees | 203 | 3.5% |
| Federal Government Employees | 127 | 2.2% |
| Unpaid Family Workers | 4 | 0.1% |
| Total | 5,884 | 100.0% |
Employment Status by Age in White County
According to the labor force statistics for White County, out of the total population over 16 years of age (11,212), 55.1% or 6,178 individuals are in the labor force, with 3.5% or 216 of them unemployed. The age group with the highest labor force participation rate is 30 to 34 years, with 89.7% or 709 individuals in the labor force. Within the labor force, the 75 years and over age range has the highest percentage of unemployed individuals, with 11.2% or 11 of them being unemployed.
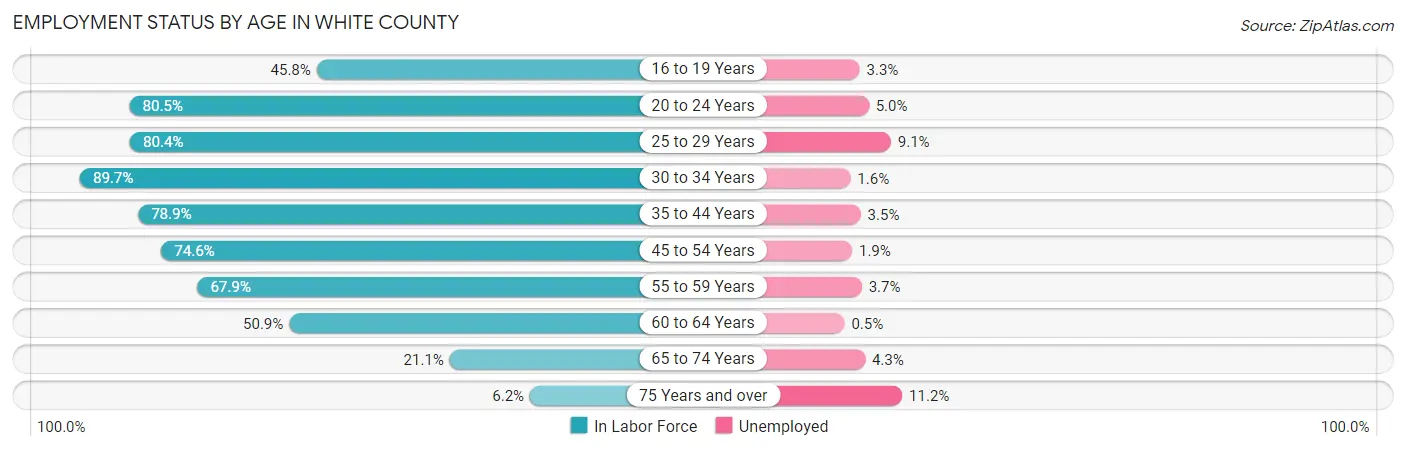
| Age Bracket | In Labor Force | Unemployed |
| 16 to 19 Years | 275 (45.8%) | 9 (3.3%) |
| 20 to 24 Years | 504 (80.5%) | 25 (5.0%) |
| 25 to 29 Years | 563 (80.4%) | 51 (9.1%) |
| 30 to 34 Years | 709 (89.7%) | 11 (1.6%) |
| 35 to 44 Years | 1,295 (78.9%) | 45 (3.5%) |
| 45 to 54 Years | 1,173 (74.6%) | 22 (1.9%) |
| 55 to 59 Years | 668 (67.9%) | 25 (3.7%) |
| 60 to 64 Years | 548 (50.9%) | 3 (0.5%) |
| 65 to 74 Years | 347 (21.1%) | 15 (4.3%) |
| 75 Years and over | 98 (6.2%) | 11 (11.2%) |
| Total | 6,178 (55.1%) | 216 (3.5%) |
Employment Status by Educational Attainment in White County
According to labor force statistics for White County, 73.2% of individuals (4,951) out of the total population between 25 and 64 years of age (6,764) are in the labor force, with 3.2% or 158 of them being unemployed. The group with the highest labor force participation rate are those with the educational attainment of bachelor's degree or higher, with 82.1% or 933 individuals in the labor force. Within the labor force, individuals with high school diploma education have the highest percentage of unemployment, with 7.4% or 104 of them being unemployed.
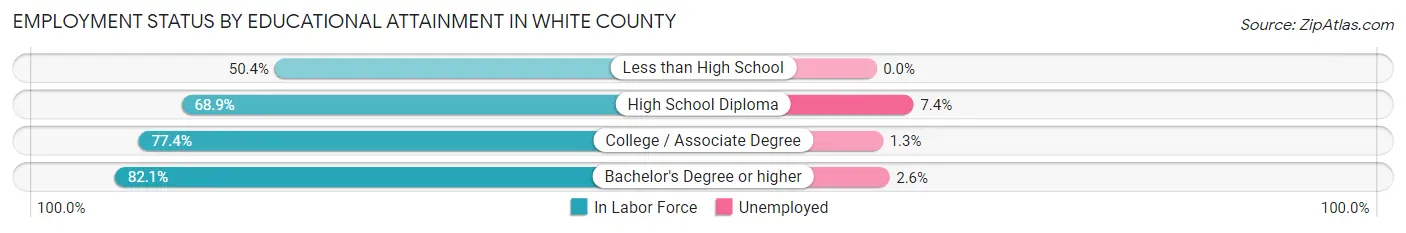
| Educational Attainment | In Labor Force | Unemployed |
| Less than High School | 305 (50.4%) | 0 (0.0%) |
| High School Diploma | 1,401 (68.9%) | 151 (7.4%) |
| College / Associate Degree | 2,313 (77.4%) | 39 (1.3%) |
| Bachelor's Degree or higher | 933 (82.1%) | 30 (2.6%) |
| Total | 4,951 (73.2%) | 216 (3.2%) |
Employment Occupations by Sex in White County
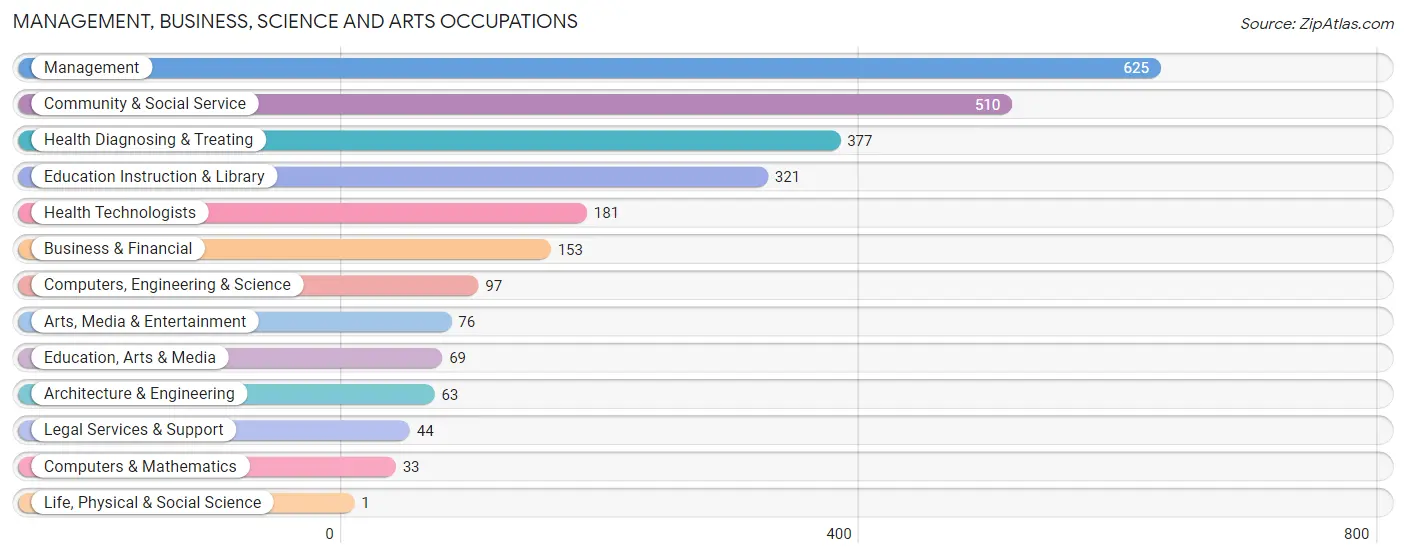
Management, Business, Science and Arts Occupations
The most common Management, Business, Science and Arts occupations in White County are Management (625 | 10.5%), Community & Social Service (510 | 8.6%), Health Diagnosing & Treating (377 | 6.3%), Education Instruction & Library (321 | 5.4%), and Health Technologists (181 | 3.0%).
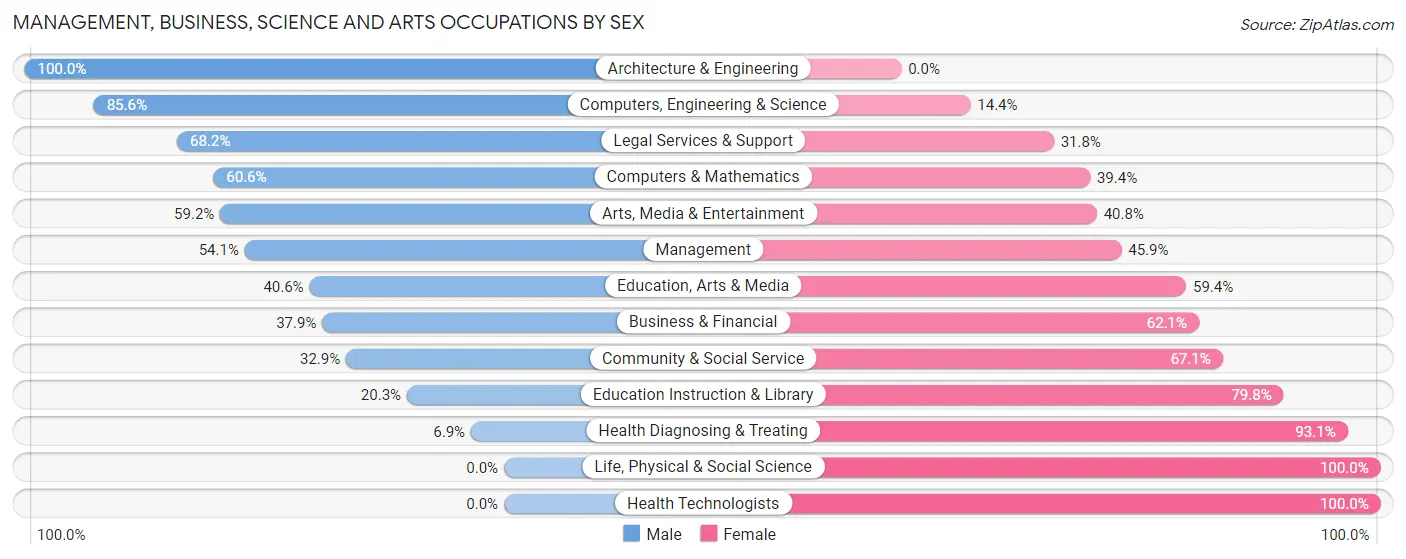
Management, Business, Science and Arts Occupations by Sex
Within the Management, Business, Science and Arts occupations in White County, the most male-oriented occupations are Architecture & Engineering (100.0%), Computers, Engineering & Science (85.6%), and Legal Services & Support (68.2%), while the most female-oriented occupations are Life, Physical & Social Science (100.0%), Health Technologists (100.0%), and Health Diagnosing & Treating (93.1%).
| Occupation | Male | Female |
| Management | 338 (54.1%) | 287 (45.9%) |
| Business & Financial | 58 (37.9%) | 95 (62.1%) |
| Computers, Engineering & Science | 83 (85.6%) | 14 (14.4%) |
| Computers & Mathematics | 20 (60.6%) | 13 (39.4%) |
| Architecture & Engineering | 63 (100.0%) | 0 (0.0%) |
| Life, Physical & Social Science | 0 (0.0%) | 1 (100.0%) |
| Community & Social Service | 168 (32.9%) | 342 (67.1%) |
| Education, Arts & Media | 28 (40.6%) | 41 (59.4%) |
| Legal Services & Support | 30 (68.2%) | 14 (31.8%) |
| Education Instruction & Library | 65 (20.3%) | 256 (79.7%) |
| Arts, Media & Entertainment | 45 (59.2%) | 31 (40.8%) |
| Health Diagnosing & Treating | 26 (6.9%) | 351 (93.1%) |
| Health Technologists | 0 (0.0%) | 181 (100.0%) |
| Total (Category) | 673 (38.2%) | 1,089 (61.8%) |
| Total (Overall) | 3,129 (52.5%) | 2,833 (47.5%) |
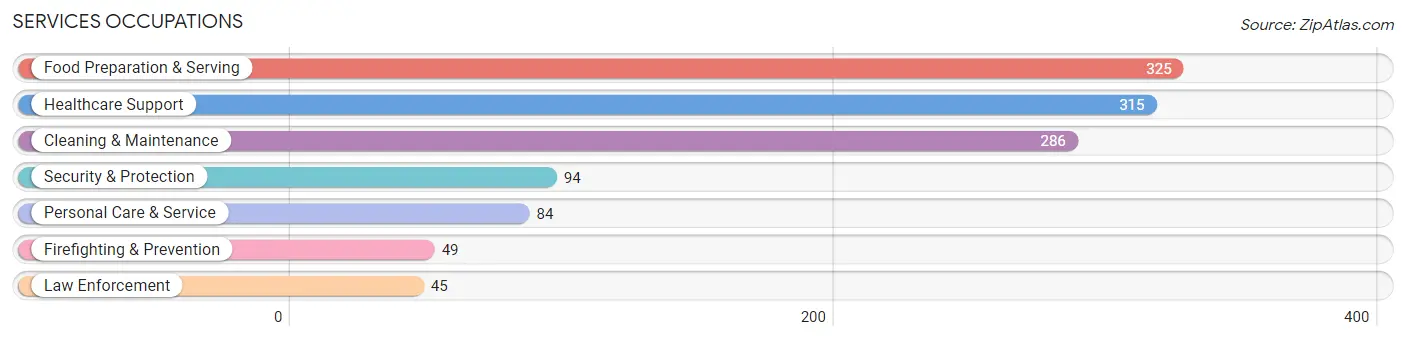
Services Occupations
The most common Services occupations in White County are Food Preparation & Serving (325 | 5.4%), Healthcare Support (315 | 5.3%), Cleaning & Maintenance (286 | 4.8%), Security & Protection (94 | 1.6%), and Personal Care & Service (84 | 1.4%).
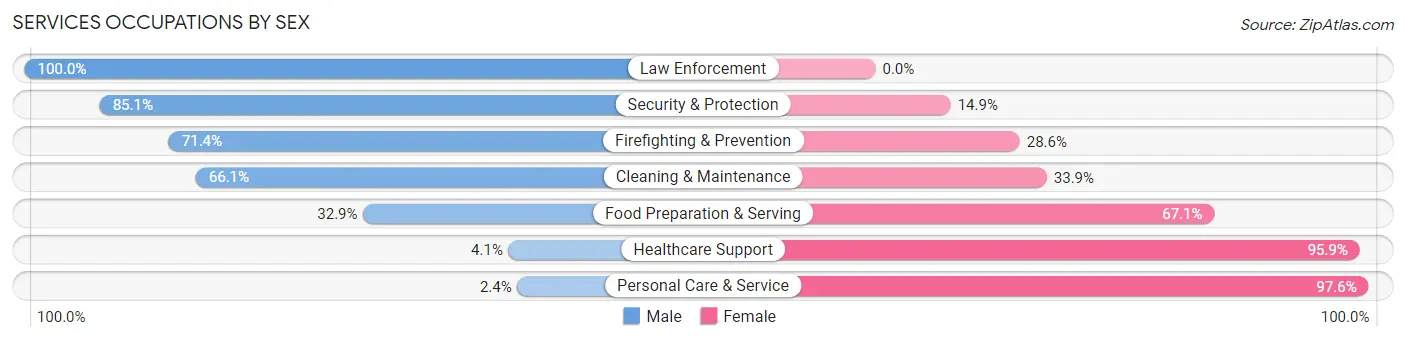
Services Occupations by Sex
Within the Services occupations in White County, the most male-oriented occupations are Law Enforcement (100.0%), Security & Protection (85.1%), and Firefighting & Prevention (71.4%), while the most female-oriented occupations are Personal Care & Service (97.6%), Healthcare Support (95.9%), and Food Preparation & Serving (67.1%).
| Occupation | Male | Female |
| Healthcare Support | 13 (4.1%) | 302 (95.9%) |
| Security & Protection | 80 (85.1%) | 14 (14.9%) |
| Firefighting & Prevention | 35 (71.4%) | 14 (28.6%) |
| Law Enforcement | 45 (100.0%) | 0 (0.0%) |
| Food Preparation & Serving | 107 (32.9%) | 218 (67.1%) |
| Cleaning & Maintenance | 189 (66.1%) | 97 (33.9%) |
| Personal Care & Service | 2 (2.4%) | 82 (97.6%) |
| Total (Category) | 391 (35.4%) | 713 (64.6%) |
| Total (Overall) | 3,129 (52.5%) | 2,833 (47.5%) |
Sales and Office Occupations
The most common Sales and Office occupations in White County are Office & Administration (529 | 8.9%), and Sales & Related (518 | 8.7%).
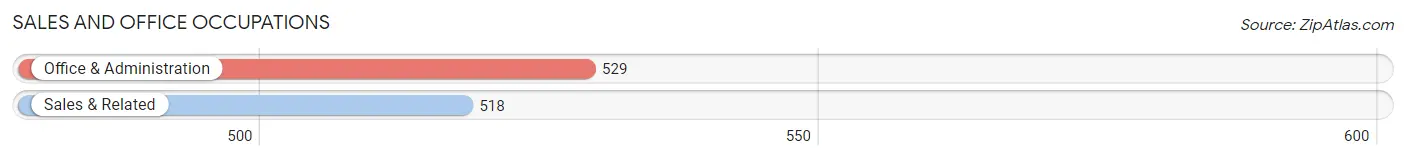
Sales and Office Occupations by Sex
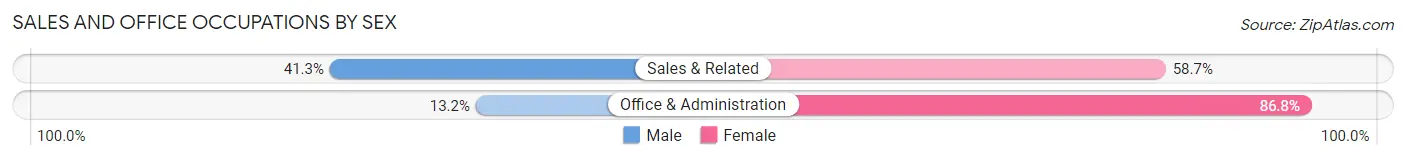
| Occupation | Male | Female |
| Sales & Related | 214 (41.3%) | 304 (58.7%) |
| Office & Administration | 70 (13.2%) | 459 (86.8%) |
| Total (Category) | 284 (27.1%) | 763 (72.9%) |
| Total (Overall) | 3,129 (52.5%) | 2,833 (47.5%) |
Natural Resources, Construction and Maintenance Occupations
The most common Natural Resources, Construction and Maintenance occupations in White County are Construction & Extraction (487 | 8.2%), Installation, Maintenance & Repair (209 | 3.5%), and Farming, Fishing & Forestry (127 | 2.1%).
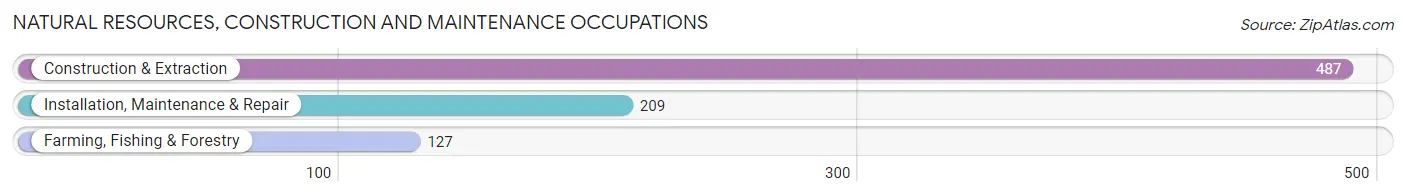
Natural Resources, Construction and Maintenance Occupations by Sex
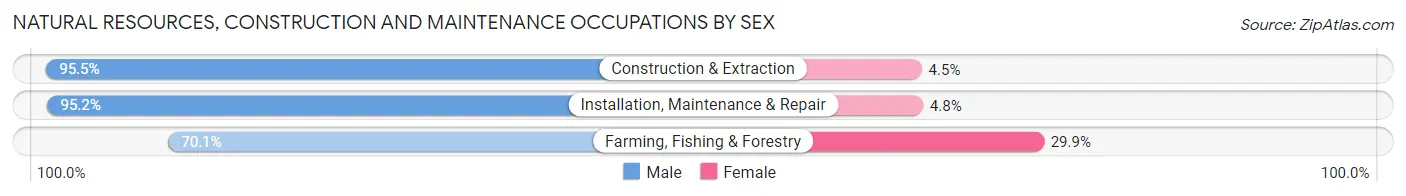
| Occupation | Male | Female |
| Farming, Fishing & Forestry | 89 (70.1%) | 38 (29.9%) |
| Construction & Extraction | 465 (95.5%) | 22 (4.5%) |
| Installation, Maintenance & Repair | 199 (95.2%) | 10 (4.8%) |
| Total (Category) | 753 (91.5%) | 70 (8.5%) |
| Total (Overall) | 3,129 (52.5%) | 2,833 (47.5%) |
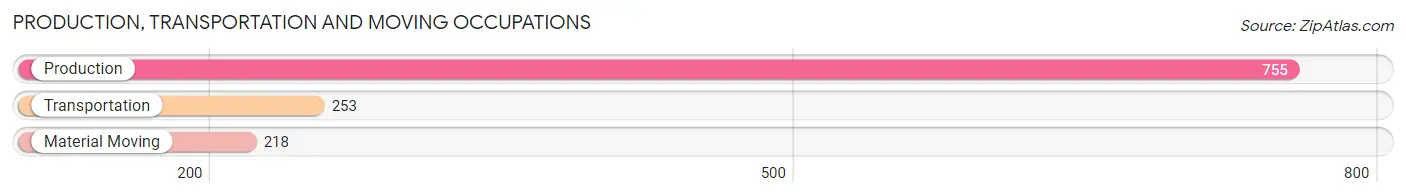
Production, Transportation and Moving Occupations
The most common Production, Transportation and Moving occupations in White County are Production (755 | 12.7%), Transportation (253 | 4.2%), and Material Moving (218 | 3.7%).
Production, Transportation and Moving Occupations by Sex
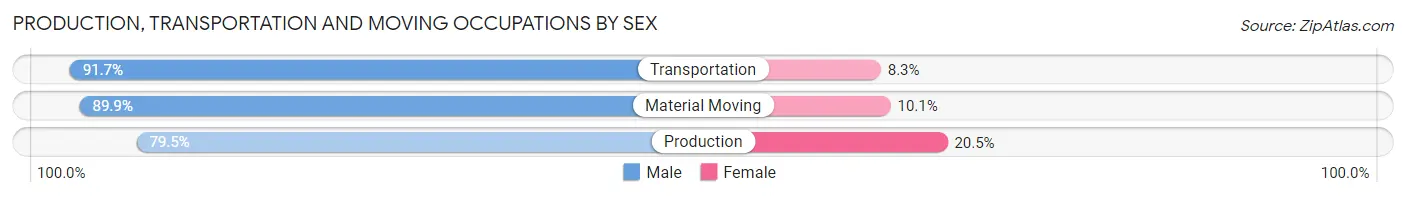
| Occupation | Male | Female |
| Production | 600 (79.5%) | 155 (20.5%) |
| Transportation | 232 (91.7%) | 21 (8.3%) |
| Material Moving | 196 (89.9%) | 22 (10.1%) |
| Total (Category) | 1,028 (83.9%) | 198 (16.2%) |
| Total (Overall) | 3,129 (52.5%) | 2,833 (47.5%) |
Employment Industries by Sex in White County
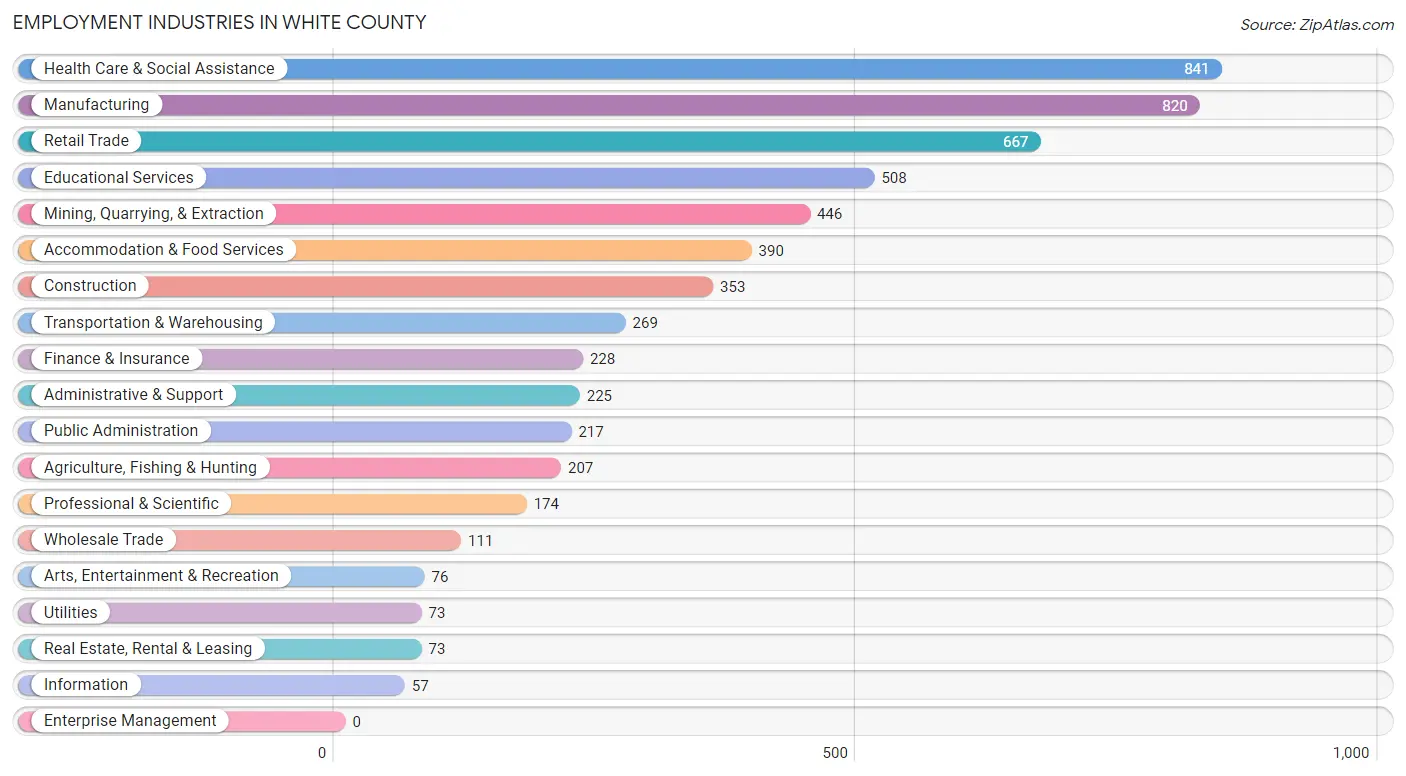
Employment Industries in White County
The major employment industries in White County include Health Care & Social Assistance (841 | 14.1%), Manufacturing (820 | 13.8%), Retail Trade (667 | 11.2%), Educational Services (508 | 8.5%), and Mining, Quarrying, & Extraction (446 | 7.5%).
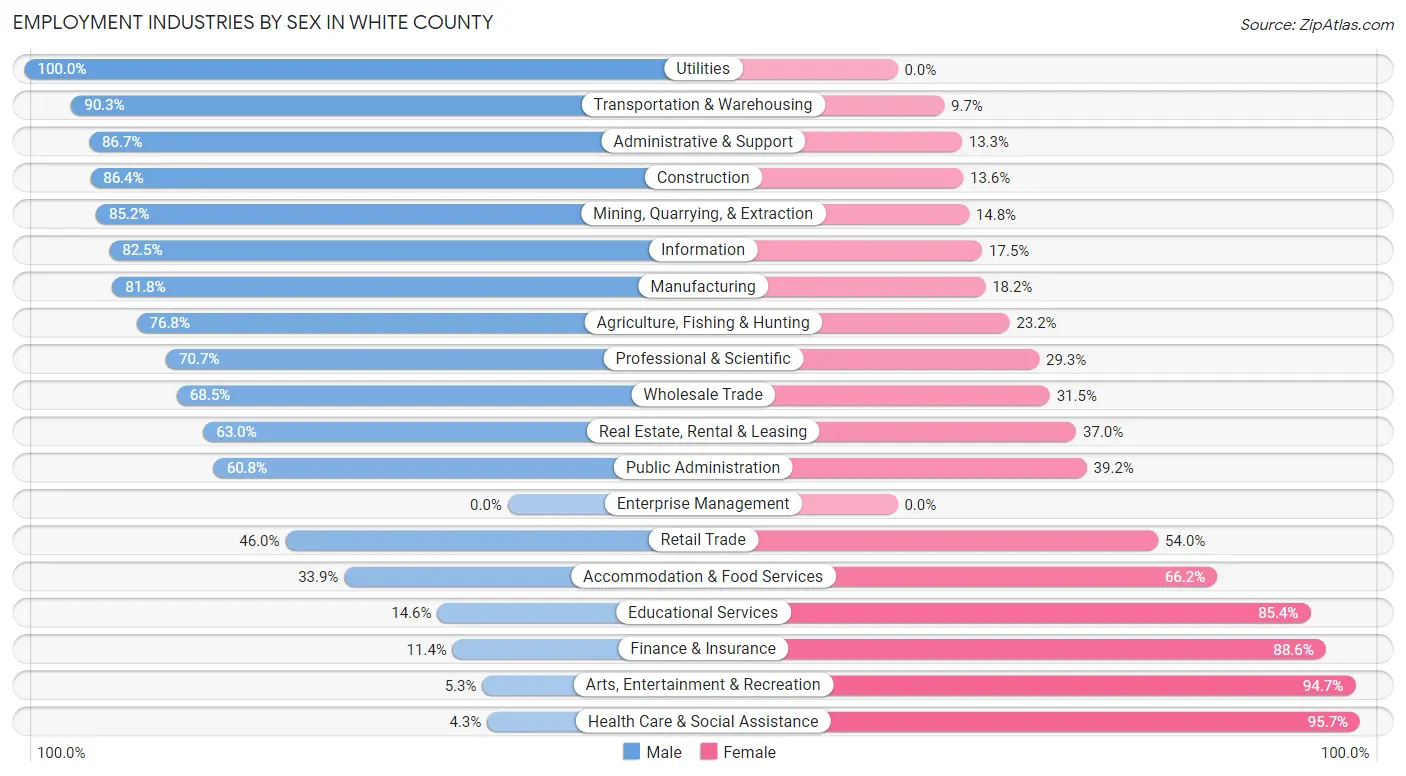
Employment Industries by Sex in White County
The White County industries that see more men than women are Utilities (100.0%), Transportation & Warehousing (90.3%), and Administrative & Support (86.7%), whereas the industries that tend to have a higher number of women are Health Care & Social Assistance (95.7%), Arts, Entertainment & Recreation (94.7%), and Finance & Insurance (88.6%).
| Industry | Male | Female |
| Agriculture, Fishing & Hunting | 159 (76.8%) | 48 (23.2%) |
| Mining, Quarrying, & Extraction | 380 (85.2%) | 66 (14.8%) |
| Construction | 305 (86.4%) | 48 (13.6%) |
| Manufacturing | 671 (81.8%) | 149 (18.2%) |
| Wholesale Trade | 76 (68.5%) | 35 (31.5%) |
| Retail Trade | 307 (46.0%) | 360 (54.0%) |
| Transportation & Warehousing | 243 (90.3%) | 26 (9.7%) |
| Utilities | 73 (100.0%) | 0 (0.0%) |
| Information | 47 (82.5%) | 10 (17.5%) |
| Finance & Insurance | 26 (11.4%) | 202 (88.6%) |
| Real Estate, Rental & Leasing | 46 (63.0%) | 27 (37.0%) |
| Professional & Scientific | 123 (70.7%) | 51 (29.3%) |
| Enterprise Management | 0 (0.0%) | 0 (0.0%) |
| Administrative & Support | 195 (86.7%) | 30 (13.3%) |
| Educational Services | 74 (14.6%) | 434 (85.4%) |
| Health Care & Social Assistance | 36 (4.3%) | 805 (95.7%) |
| Arts, Entertainment & Recreation | 4 (5.3%) | 72 (94.7%) |
| Accommodation & Food Services | 132 (33.9%) | 258 (66.1%) |
| Public Administration | 132 (60.8%) | 85 (39.2%) |
| Total | 3,129 (52.5%) | 2,833 (47.5%) |
Education in White County
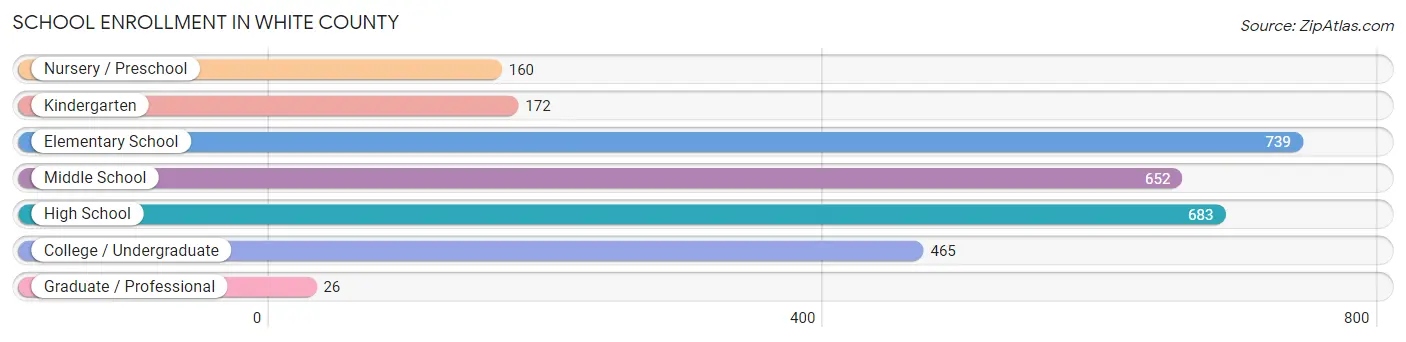
School Enrollment in White County
The most common levels of schooling among the 2,897 students in White County are elementary school (739 | 25.5%), high school (683 | 23.6%), and middle school (652 | 22.5%).
| School Level | # Students | % Students |
| Nursery / Preschool | 160 | 5.5% |
| Kindergarten | 172 | 5.9% |
| Elementary School | 739 | 25.5% |
| Middle School | 652 | 22.5% |
| High School | 683 | 23.6% |
| College / Undergraduate | 465 | 16.1% |
| Graduate / Professional | 26 | 0.9% |
| Total | 2,897 | 100.0% |
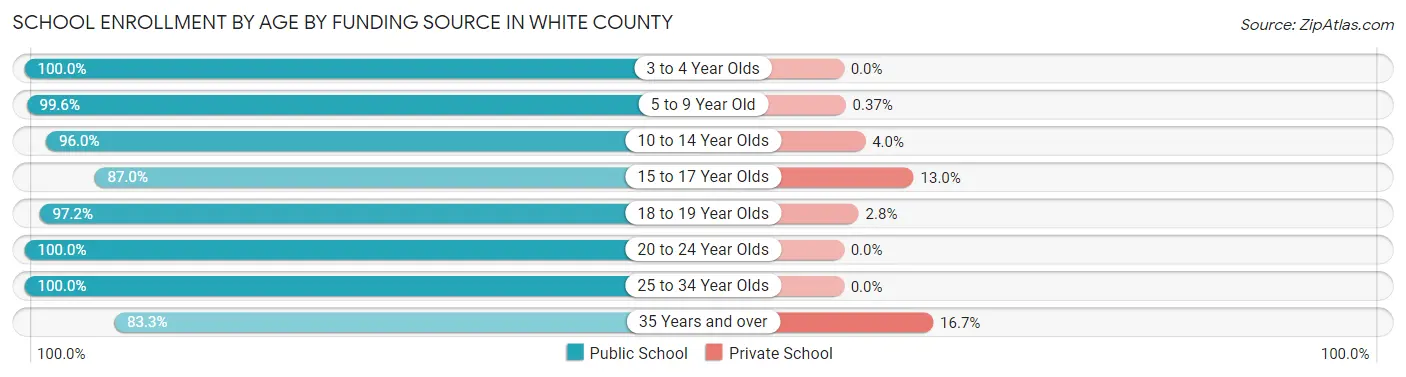
School Enrollment by Age by Funding Source in White County
Out of a total of 2,897 students who are enrolled in schools in White County, 130 (4.5%) attend a private institution, while the remaining 2,767 (95.5%) are enrolled in public schools. The age group of 35 years and over has the highest likelihood of being enrolled in private schools, with 19 (16.7% in the age bracket) enrolled. Conversely, the age group of 3 to 4 year olds has the lowest likelihood of being enrolled in a private school, with 110 (100.0% in the age bracket) attending a public institution.
| Age Bracket | Public School | Private School |
| 3 to 4 Year Olds | 110 (100.0%) | 0 (0.0%) |
| 5 to 9 Year Old | 815 (99.6%) | 3 (0.4%) |
| 10 to 14 Year Olds | 766 (96.0%) | 32 (4.0%) |
| 15 to 17 Year Olds | 474 (87.0%) | 71 (13.0%) |
| 18 to 19 Year Olds | 209 (97.2%) | 6 (2.8%) |
| 20 to 24 Year Olds | 212 (100.0%) | 0 (0.0%) |
| 25 to 34 Year Olds | 85 (100.0%) | 0 (0.0%) |
| 35 Years and over | 95 (83.3%) | 19 (16.7%) |
| Total | 2,767 (95.5%) | 130 (4.5%) |
Educational Attainment by Field of Study in White County
Education (421 | 24.5%), science & technology (254 | 14.8%), business (234 | 13.6%), bio, nature & agricultural (157 | 9.1%), and arts & humanities (105 | 6.1%) are the most common fields of study among 1,717 individuals in White County who have obtained a bachelor's degree or higher.
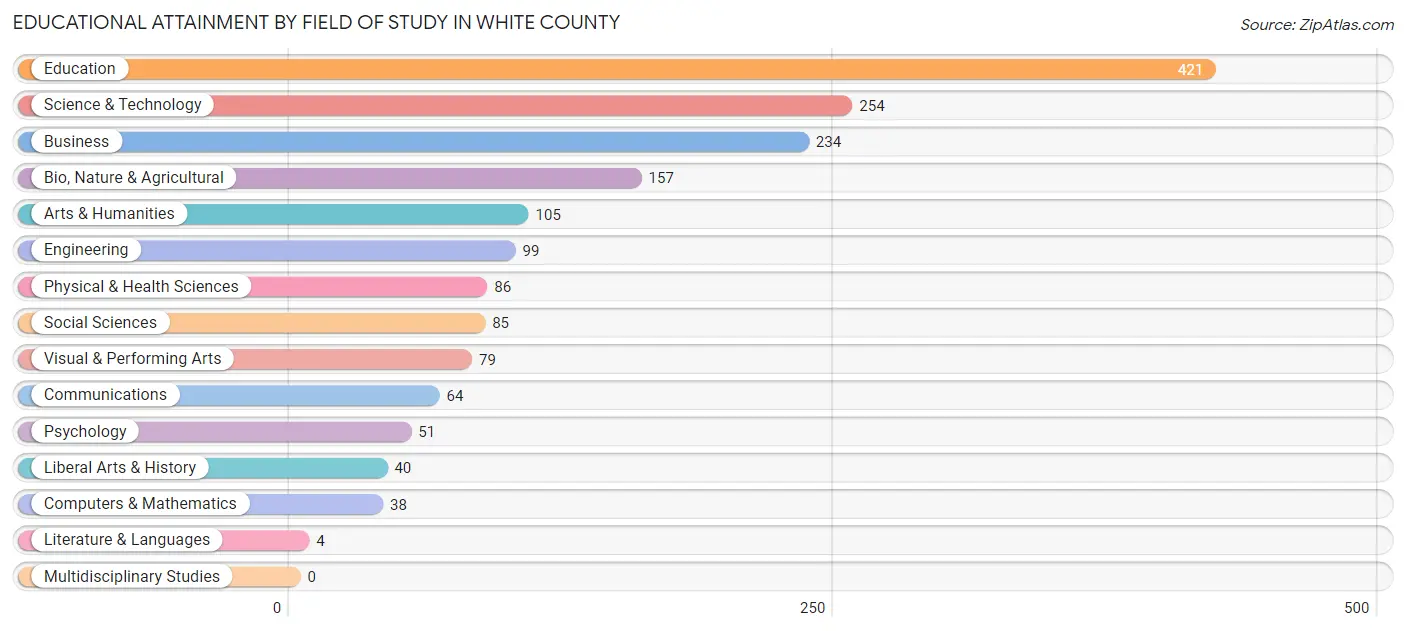
| Field of Study | # Graduates | % Graduates |
| Computers & Mathematics | 38 | 2.2% |
| Bio, Nature & Agricultural | 157 | 9.1% |
| Physical & Health Sciences | 86 | 5.0% |
| Psychology | 51 | 3.0% |
| Social Sciences | 85 | 5.0% |
| Engineering | 99 | 5.8% |
| Multidisciplinary Studies | 0 | 0.0% |
| Science & Technology | 254 | 14.8% |
| Business | 234 | 13.6% |
| Education | 421 | 24.5% |
| Literature & Languages | 4 | 0.2% |
| Liberal Arts & History | 40 | 2.3% |
| Visual & Performing Arts | 79 | 4.6% |
| Communications | 64 | 3.7% |
| Arts & Humanities | 105 | 6.1% |
| Total | 1,717 | 100.0% |
Transportation & Commute in White County
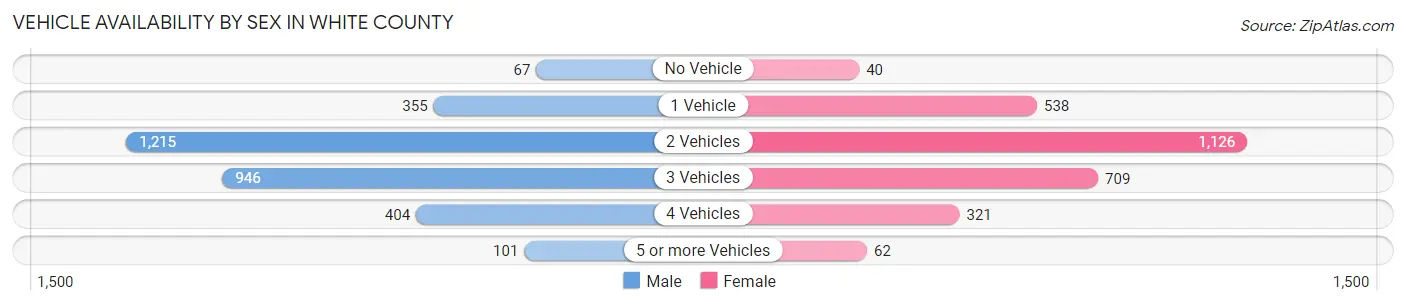
Vehicle Availability by Sex in White County
The most prevalent vehicle ownership categories in White County are males with 2 vehicles (1,215, accounting for 39.4%) and females with 2 vehicles (1,126, making up 43.4%).
| Vehicles Available | Male | Female |
| No Vehicle | 67 (2.2%) | 40 (1.4%) |
| 1 Vehicle | 355 (11.5%) | 538 (19.2%) |
| 2 Vehicles | 1,215 (39.4%) | 1,126 (40.3%) |
| 3 Vehicles | 946 (30.6%) | 709 (25.4%) |
| 4 Vehicles | 404 (13.1%) | 321 (11.5%) |
| 5 or more Vehicles | 101 (3.3%) | 62 (2.2%) |
| Total | 3,088 (100.0%) | 2,796 (100.0%) |
Commute Time in White County
The most frequently occuring commute durations in White County are 10 to 14 minutes (927 commuters, 16.6%), 5 to 9 minutes (848 commuters, 15.2%), and 15 to 19 minutes (672 commuters, 12.0%).
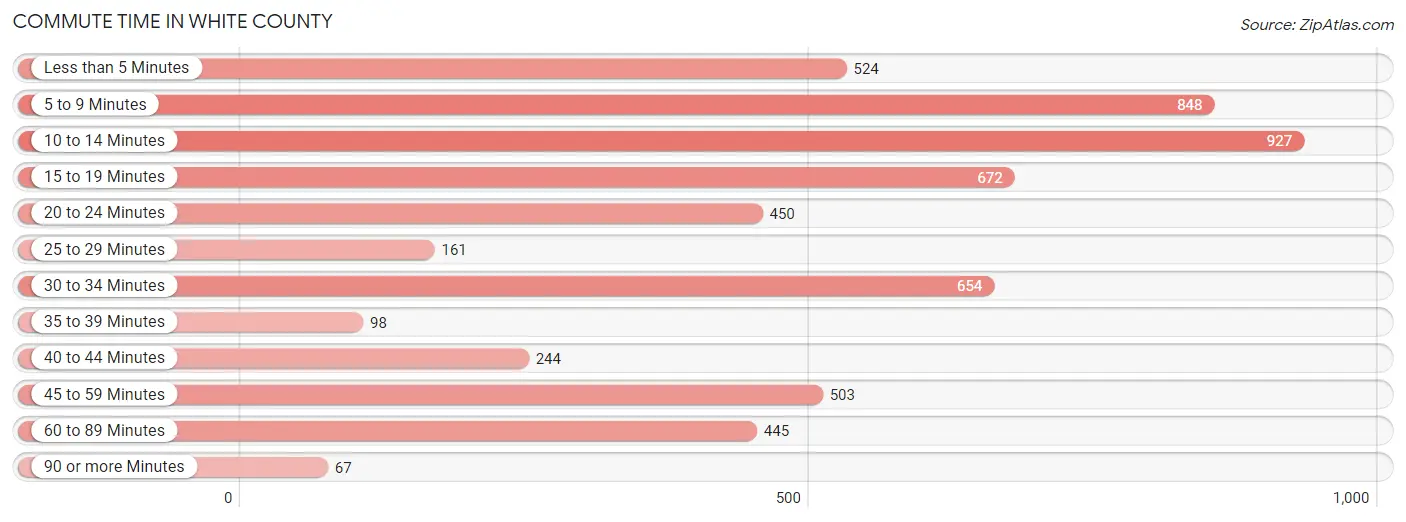
| Commute Time | # Commuters | % Commuters |
| Less than 5 Minutes | 524 | 9.4% |
| 5 to 9 Minutes | 848 | 15.2% |
| 10 to 14 Minutes | 927 | 16.6% |
| 15 to 19 Minutes | 672 | 12.0% |
| 20 to 24 Minutes | 450 | 8.1% |
| 25 to 29 Minutes | 161 | 2.9% |
| 30 to 34 Minutes | 654 | 11.7% |
| 35 to 39 Minutes | 98 | 1.8% |
| 40 to 44 Minutes | 244 | 4.4% |
| 45 to 59 Minutes | 503 | 9.0% |
| 60 to 89 Minutes | 445 | 8.0% |
| 90 or more Minutes | 67 | 1.2% |
Commute Time by Sex in White County
The most common commute times in White County are 30 to 34 minutes (416 commuters, 14.0%) for males and 10 to 14 minutes (578 commuters, 22.1%) for females.
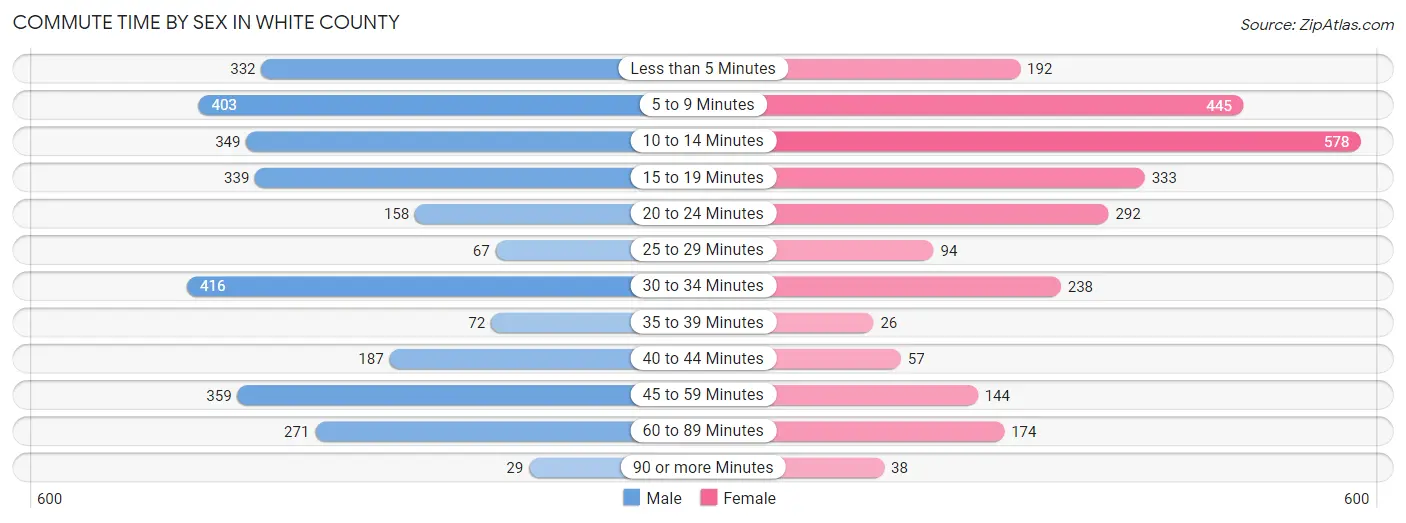
| Commute Time | Male | Female |
| Less than 5 Minutes | 332 (11.1%) | 192 (7.3%) |
| 5 to 9 Minutes | 403 (13.5%) | 445 (17.0%) |
| 10 to 14 Minutes | 349 (11.7%) | 578 (22.1%) |
| 15 to 19 Minutes | 339 (11.4%) | 333 (12.8%) |
| 20 to 24 Minutes | 158 (5.3%) | 292 (11.2%) |
| 25 to 29 Minutes | 67 (2.2%) | 94 (3.6%) |
| 30 to 34 Minutes | 416 (14.0%) | 238 (9.1%) |
| 35 to 39 Minutes | 72 (2.4%) | 26 (1.0%) |
| 40 to 44 Minutes | 187 (6.3%) | 57 (2.2%) |
| 45 to 59 Minutes | 359 (12.0%) | 144 (5.5%) |
| 60 to 89 Minutes | 271 (9.1%) | 174 (6.7%) |
| 90 or more Minutes | 29 (1.0%) | 38 (1.5%) |
Time of Departure to Work by Sex in White County
The most frequent times of departure to work in White County are 6:30 AM to 6:59 AM (422, 14.1%) for males and 7:30 AM to 7:59 AM (693, 26.5%) for females.
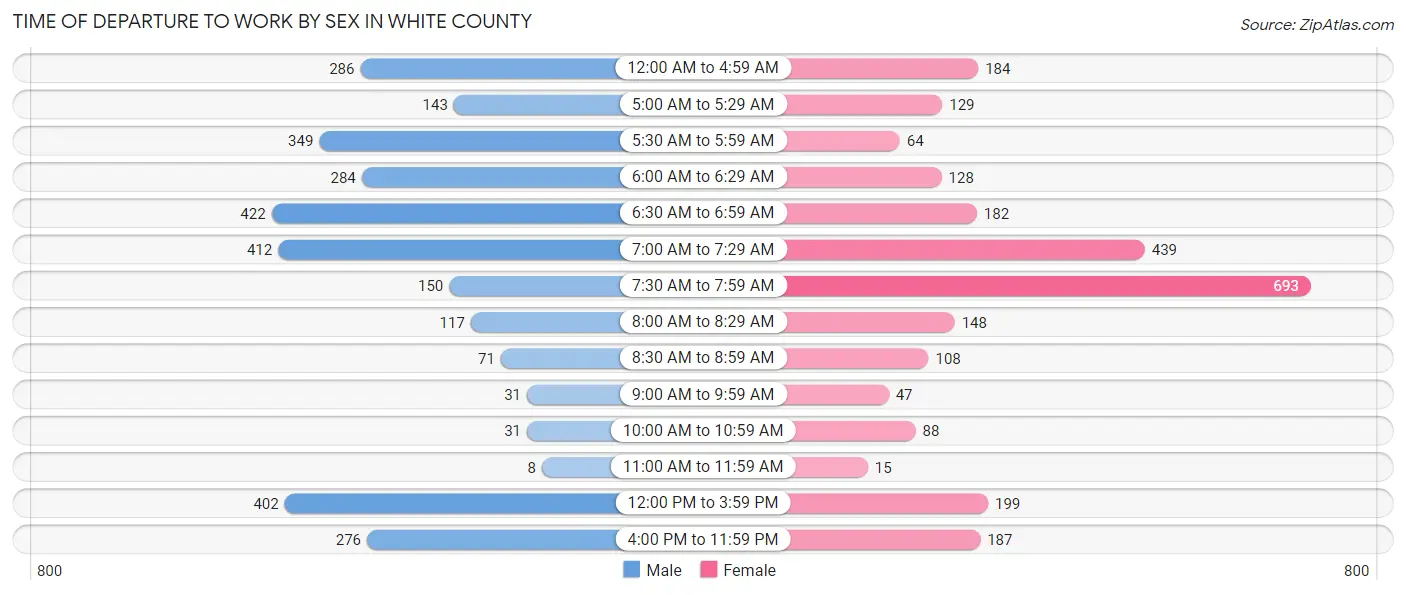
| Time of Departure | Male | Female |
| 12:00 AM to 4:59 AM | 286 (9.6%) | 184 (7.0%) |
| 5:00 AM to 5:29 AM | 143 (4.8%) | 129 (4.9%) |
| 5:30 AM to 5:59 AM | 349 (11.7%) | 64 (2.5%) |
| 6:00 AM to 6:29 AM | 284 (9.5%) | 128 (4.9%) |
| 6:30 AM to 6:59 AM | 422 (14.1%) | 182 (7.0%) |
| 7:00 AM to 7:29 AM | 412 (13.8%) | 439 (16.8%) |
| 7:30 AM to 7:59 AM | 150 (5.0%) | 693 (26.5%) |
| 8:00 AM to 8:29 AM | 117 (3.9%) | 148 (5.7%) |
| 8:30 AM to 8:59 AM | 71 (2.4%) | 108 (4.1%) |
| 9:00 AM to 9:59 AM | 31 (1.0%) | 47 (1.8%) |
| 10:00 AM to 10:59 AM | 31 (1.0%) | 88 (3.4%) |
| 11:00 AM to 11:59 AM | 8 (0.3%) | 15 (0.6%) |
| 12:00 PM to 3:59 PM | 402 (13.5%) | 199 (7.6%) |
| 4:00 PM to 11:59 PM | 276 (9.3%) | 187 (7.2%) |
| Total | 2,982 (100.0%) | 2,611 (100.0%) |
Housing Occupancy in White County
Occupancy by Ownership in White County
Of the total 5,676 dwellings in White County, owner-occupied units account for 4,338 (76.4%), while renter-occupied units make up 1,338 (23.6%).
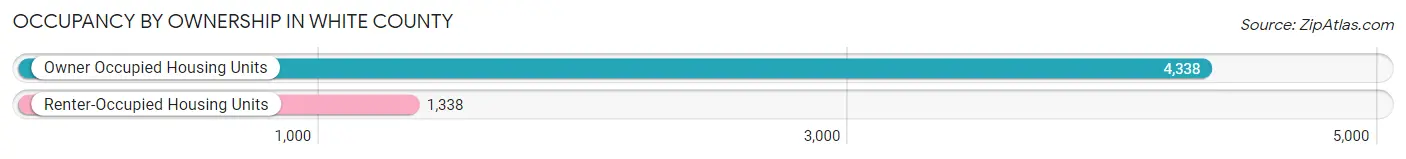
| Occupancy | # Housing Units | % Housing Units |
| Owner Occupied Housing Units | 4,338 | 76.4% |
| Renter-Occupied Housing Units | 1,338 | 23.6% |
| Total Occupied Housing Units | 5,676 | 100.0% |
Occupancy by Household Size in White County
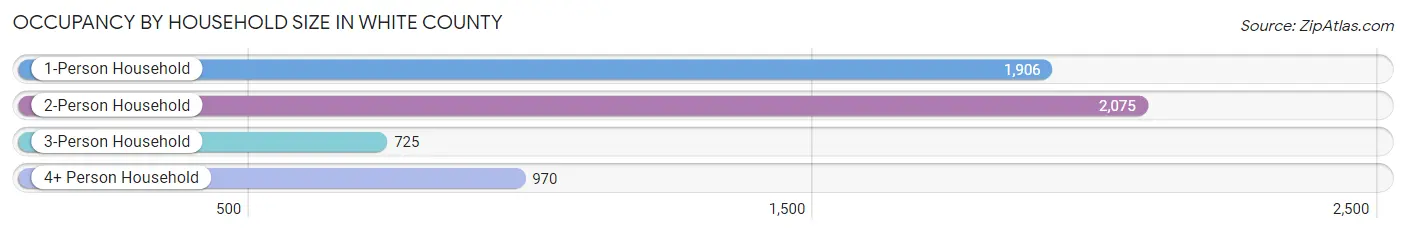
| Household Size | # Housing Units | % Housing Units |
| 1-Person Household | 1,906 | 33.6% |
| 2-Person Household | 2,075 | 36.6% |
| 3-Person Household | 725 | 12.8% |
| 4+ Person Household | 970 | 17.1% |
| Total Housing Units | 5,676 | 100.0% |
Occupancy by Ownership by Household Size in White County
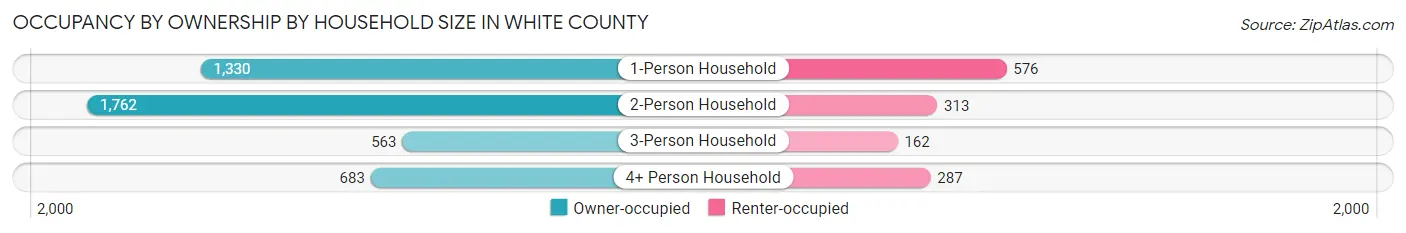
| Household Size | Owner-occupied | Renter-occupied |
| 1-Person Household | 1,330 (69.8%) | 576 (30.2%) |
| 2-Person Household | 1,762 (84.9%) | 313 (15.1%) |
| 3-Person Household | 563 (77.7%) | 162 (22.3%) |
| 4+ Person Household | 683 (70.4%) | 287 (29.6%) |
| Total Housing Units | 4,338 (76.4%) | 1,338 (23.6%) |
Occupancy by Educational Attainment in White County
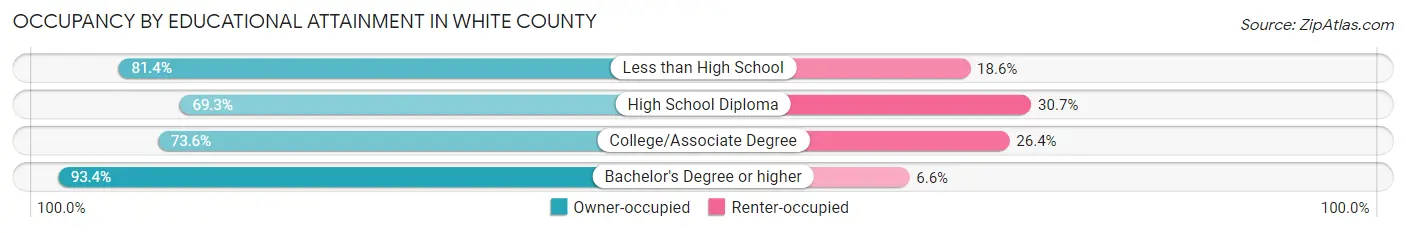
| Household Size | Owner-occupied | Renter-occupied |
| Less than High School | 332 (81.4%) | 76 (18.6%) |
| High School Diploma | 1,213 (69.3%) | 538 (30.7%) |
| College/Associate Degree | 1,827 (73.6%) | 656 (26.4%) |
| Bachelor's Degree or higher | 966 (93.4%) | 68 (6.6%) |
Occupancy by Age of Householder in White County
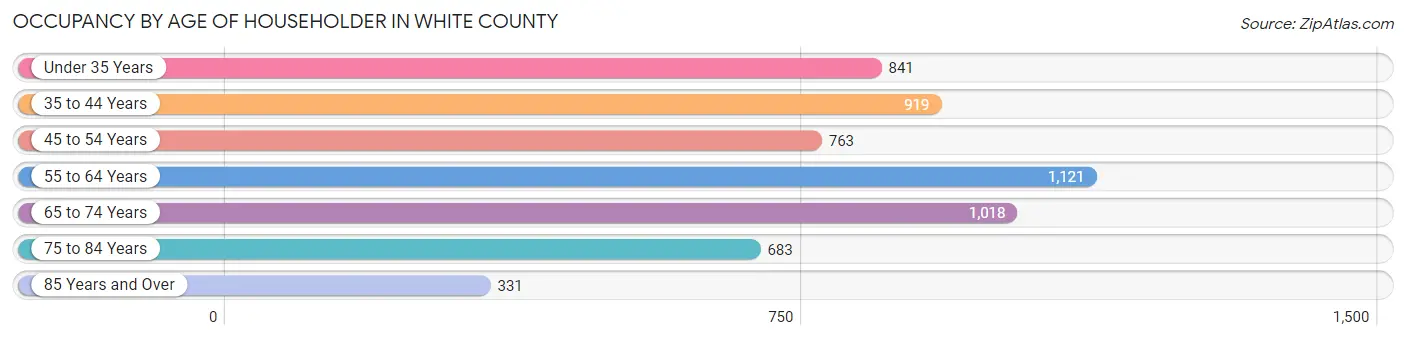
| Age Bracket | # Households | % Households |
| Under 35 Years | 841 | 14.8% |
| 35 to 44 Years | 919 | 16.2% |
| 45 to 54 Years | 763 | 13.4% |
| 55 to 64 Years | 1,121 | 19.8% |
| 65 to 74 Years | 1,018 | 17.9% |
| 75 to 84 Years | 683 | 12.0% |
| 85 Years and Over | 331 | 5.8% |
| Total | 5,676 | 100.0% |
Housing Finances in White County
Median Income by Occupancy in White County
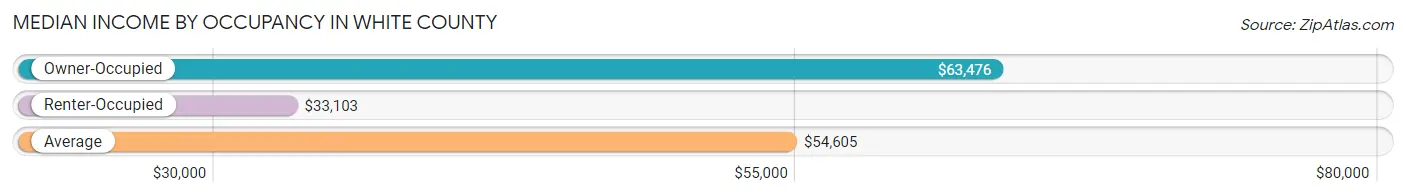
| Occupancy Type | # Households | Median Income |
| Owner-Occupied | 4,338 (76.4%) | $63,476 |
| Renter-Occupied | 1,338 (23.6%) | $33,103 |
| Average | 5,676 (100.0%) | $54,605 |
Occupancy by Householder Income Bracket in White County
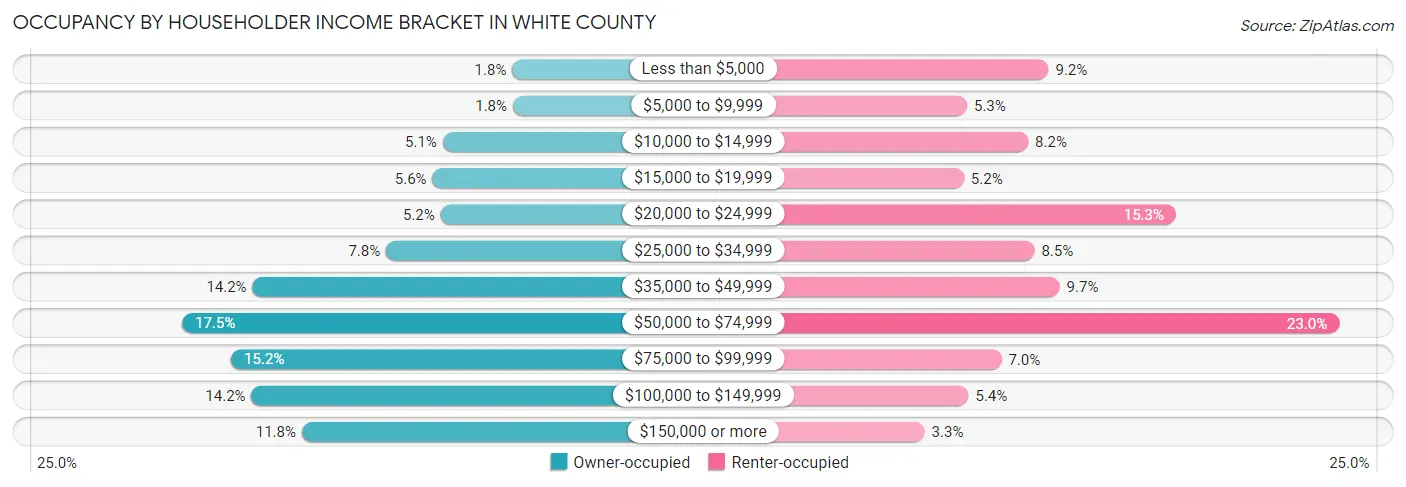
| Income Bracket | Owner-occupied | Renter-occupied |
| Less than $5,000 | 77 (1.8%) | 123 (9.2%) |
| $5,000 to $9,999 | 76 (1.8%) | 71 (5.3%) |
| $10,000 to $14,999 | 221 (5.1%) | 110 (8.2%) |
| $15,000 to $19,999 | 242 (5.6%) | 69 (5.2%) |
| $20,000 to $24,999 | 225 (5.2%) | 204 (15.2%) |
| $25,000 to $34,999 | 338 (7.8%) | 114 (8.5%) |
| $35,000 to $49,999 | 614 (14.1%) | 130 (9.7%) |
| $50,000 to $74,999 | 759 (17.5%) | 308 (23.0%) |
| $75,000 to $99,999 | 658 (15.2%) | 93 (7.0%) |
| $100,000 to $149,999 | 616 (14.2%) | 72 (5.4%) |
| $150,000 or more | 512 (11.8%) | 44 (3.3%) |
| Total | 4,338 (100.0%) | 1,338 (100.0%) |
Monthly Housing Cost Tiers in White County
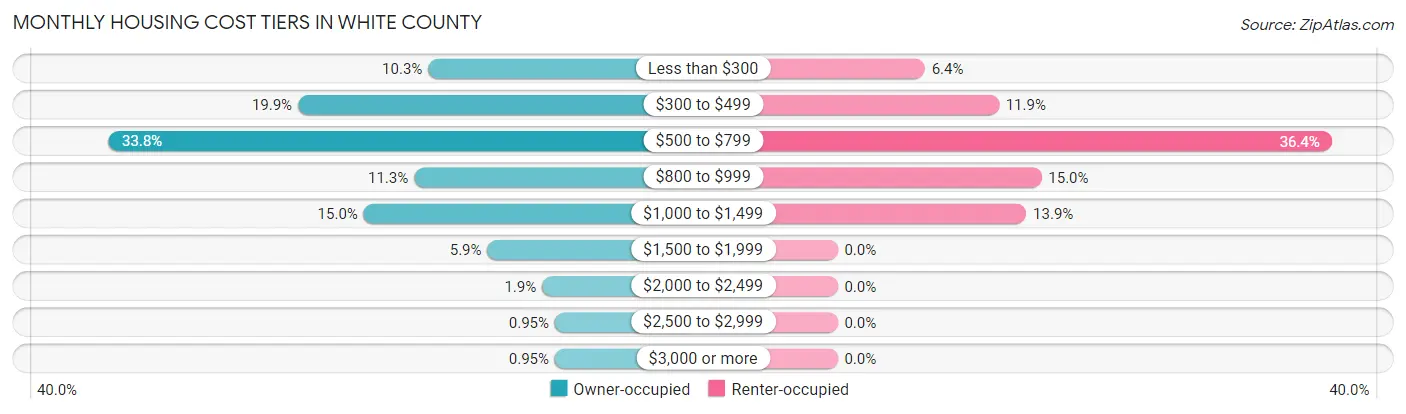
| Monthly Cost | Owner-occupied | Renter-occupied |
| Less than $300 | 446 (10.3%) | 86 (6.4%) |
| $300 to $499 | 862 (19.9%) | 159 (11.9%) |
| $500 to $799 | 1,466 (33.8%) | 487 (36.4%) |
| $800 to $999 | 491 (11.3%) | 201 (15.0%) |
| $1,000 to $1,499 | 652 (15.0%) | 186 (13.9%) |
| $1,500 to $1,999 | 257 (5.9%) | 0 (0.0%) |
| $2,000 to $2,499 | 82 (1.9%) | 0 (0.0%) |
| $2,500 to $2,999 | 41 (0.9%) | 0 (0.0%) |
| $3,000 or more | 41 (0.9%) | 0 (0.0%) |
| Total | 4,338 (100.0%) | 1,338 (100.0%) |
Physical Housing Characteristics in White County
Housing Structures in White County
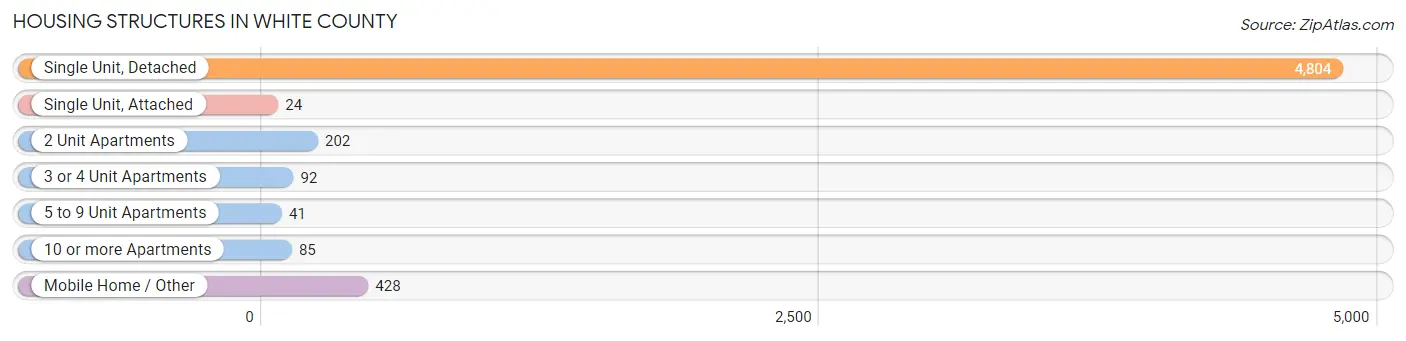
| Structure Type | # Housing Units | % Housing Units |
| Single Unit, Detached | 4,804 | 84.6% |
| Single Unit, Attached | 24 | 0.4% |
| 2 Unit Apartments | 202 | 3.6% |
| 3 or 4 Unit Apartments | 92 | 1.6% |
| 5 to 9 Unit Apartments | 41 | 0.7% |
| 10 or more Apartments | 85 | 1.5% |
| Mobile Home / Other | 428 | 7.5% |
| Total | 5,676 | 100.0% |
Housing Structures by Occupancy in White County
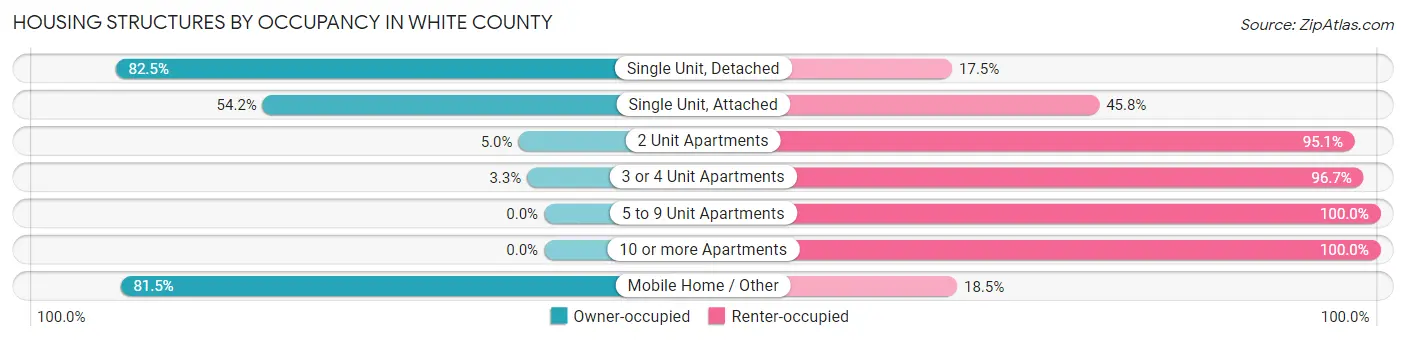
| Structure Type | Owner-occupied | Renter-occupied |
| Single Unit, Detached | 3,963 (82.5%) | 841 (17.5%) |
| Single Unit, Attached | 13 (54.2%) | 11 (45.8%) |
| 2 Unit Apartments | 10 (5.0%) | 192 (95.1%) |
| 3 or 4 Unit Apartments | 3 (3.3%) | 89 (96.7%) |
| 5 to 9 Unit Apartments | 0 (0.0%) | 41 (100.0%) |
| 10 or more Apartments | 0 (0.0%) | 85 (100.0%) |
| Mobile Home / Other | 349 (81.5%) | 79 (18.5%) |
| Total | 4,338 (76.4%) | 1,338 (23.6%) |
Housing Structures by Number of Rooms in White County
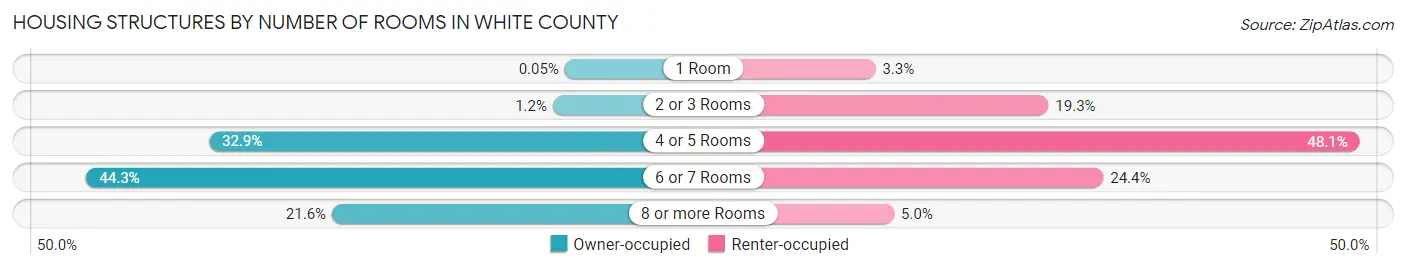
| Number of Rooms | Owner-occupied | Renter-occupied |
| 1 Room | 2 (0.1%) | 44 (3.3%) |
| 2 or 3 Rooms | 50 (1.1%) | 258 (19.3%) |
| 4 or 5 Rooms | 1,429 (32.9%) | 643 (48.1%) |
| 6 or 7 Rooms | 1,921 (44.3%) | 326 (24.4%) |
| 8 or more Rooms | 936 (21.6%) | 67 (5.0%) |
| Total | 4,338 (100.0%) | 1,338 (100.0%) |
Housing Structure by Heating Type in White County
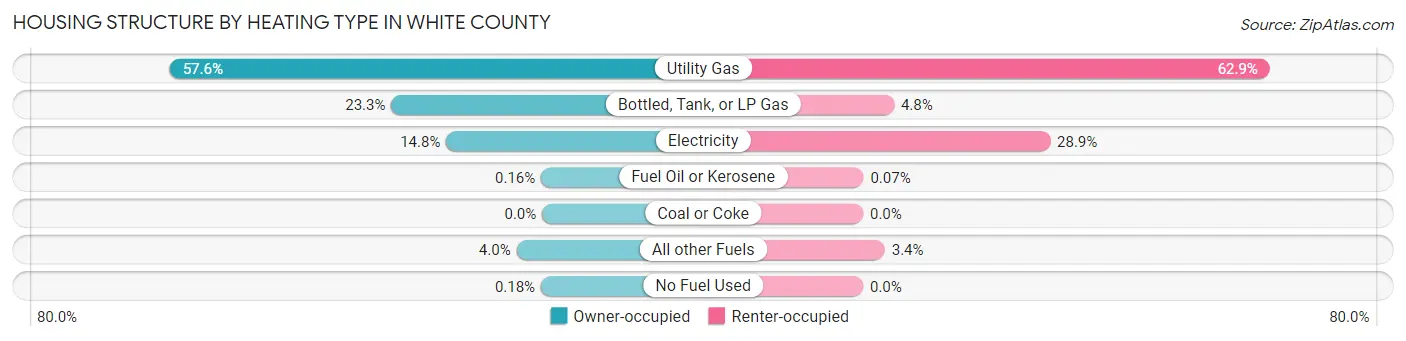
| Heating Type | Owner-occupied | Renter-occupied |
| Utility Gas | 2,497 (57.6%) | 841 (62.9%) |
| Bottled, Tank, or LP Gas | 1,011 (23.3%) | 64 (4.8%) |
| Electricity | 643 (14.8%) | 387 (28.9%) |
| Fuel Oil or Kerosene | 7 (0.2%) | 1 (0.1%) |
| Coal or Coke | 0 (0.0%) | 0 (0.0%) |
| All other Fuels | 172 (4.0%) | 45 (3.4%) |
| No Fuel Used | 8 (0.2%) | 0 (0.0%) |
| Total | 4,338 (100.0%) | 1,338 (100.0%) |
Household Vehicle Usage in White County
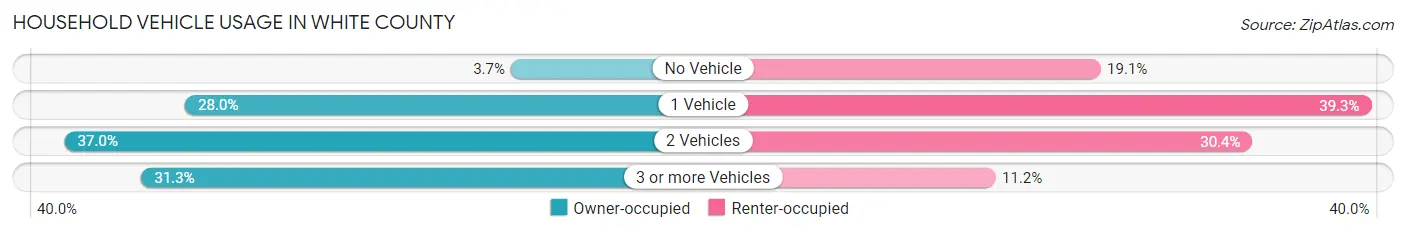
| Vehicles per Household | Owner-occupied | Renter-occupied |
| No Vehicle | 160 (3.7%) | 255 (19.1%) |
| 1 Vehicle | 1,215 (28.0%) | 526 (39.3%) |
| 2 Vehicles | 1,606 (37.0%) | 407 (30.4%) |
| 3 or more Vehicles | 1,357 (31.3%) | 150 (11.2%) |
| Total | 4,338 (100.0%) | 1,338 (100.0%) |
Real Estate & Mortgages in White County
Real Estate and Mortgage Overview in White County
| Characteristic | Without Mortgage | With Mortgage |
| Housing Units | 2,518 | 1,820 |
| Median Property Value | $96,300 | $108,400 |
| Median Household Income | $51,574 | $257 |
| Monthly Housing Costs | $505 | $41 |
| Real Estate Taxes | $1,299 | $125 |
Property Value by Mortgage Status in White County
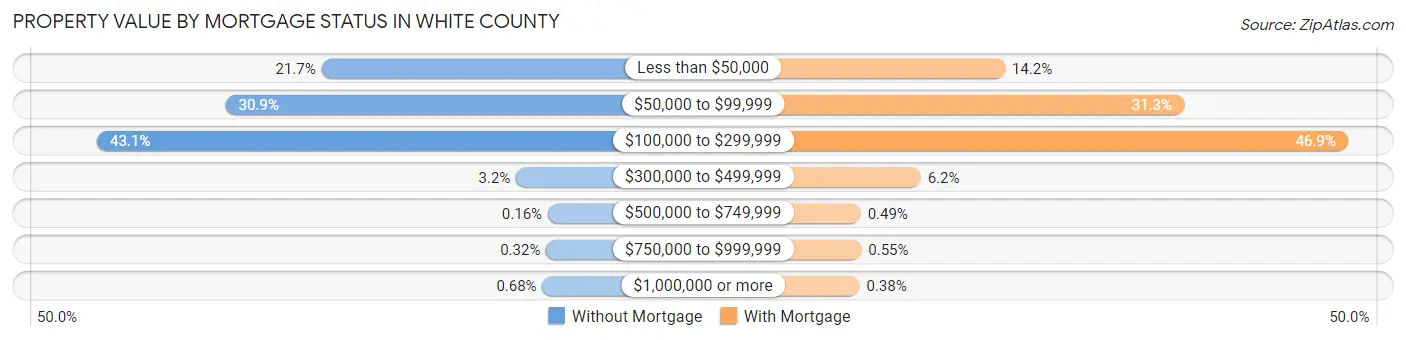
| Property Value | Without Mortgage | With Mortgage |
| Less than $50,000 | 547 (21.7%) | 259 (14.2%) |
| $50,000 to $99,999 | 777 (30.9%) | 569 (31.3%) |
| $100,000 to $299,999 | 1,085 (43.1%) | 853 (46.9%) |
| $300,000 to $499,999 | 80 (3.2%) | 113 (6.2%) |
| $500,000 to $749,999 | 4 (0.2%) | 9 (0.5%) |
| $750,000 to $999,999 | 8 (0.3%) | 10 (0.5%) |
| $1,000,000 or more | 17 (0.7%) | 7 (0.4%) |
| Total | 2,518 (100.0%) | 1,820 (100.0%) |
Household Income by Mortgage Status in White County
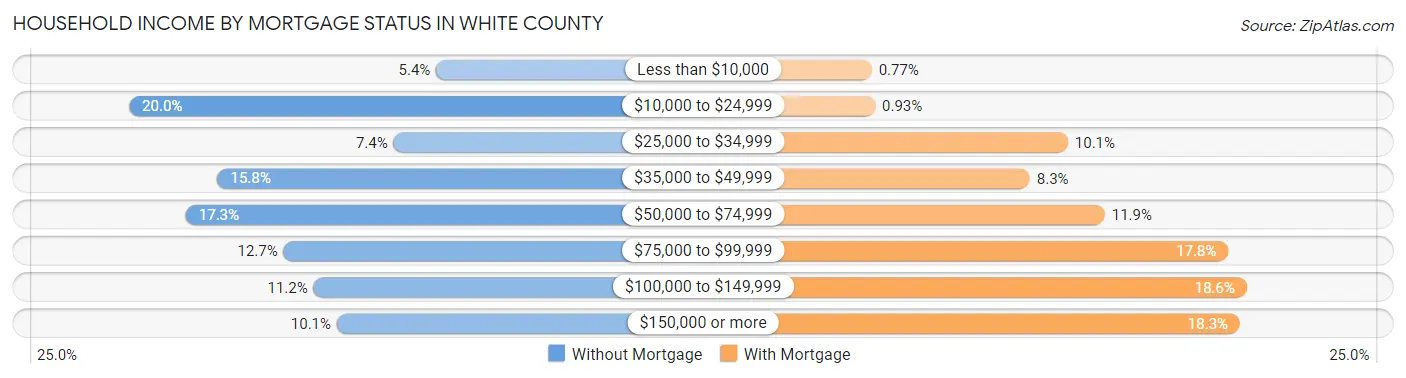
| Household Income | Without Mortgage | With Mortgage |
| Less than $10,000 | 136 (5.4%) | 14 (0.8%) |
| $10,000 to $24,999 | 504 (20.0%) | 17 (0.9%) |
| $25,000 to $34,999 | 187 (7.4%) | 184 (10.1%) |
| $35,000 to $49,999 | 398 (15.8%) | 151 (8.3%) |
| $50,000 to $74,999 | 436 (17.3%) | 216 (11.9%) |
| $75,000 to $99,999 | 319 (12.7%) | 323 (17.7%) |
| $100,000 to $149,999 | 283 (11.2%) | 339 (18.6%) |
| $150,000 or more | 255 (10.1%) | 333 (18.3%) |
| Total | 2,518 (100.0%) | 1,820 (100.0%) |
Property Value to Household Income Ratio in White County
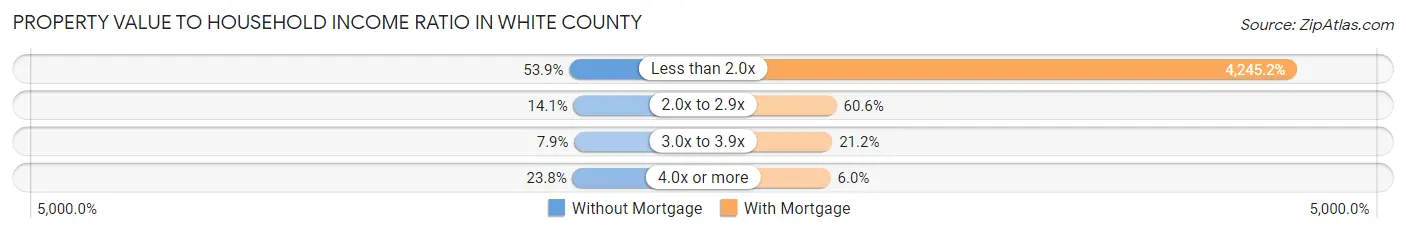
| Value-to-Income Ratio | Without Mortgage | With Mortgage |
| Less than 2.0x | 1,358 (53.9%) | 77,262 (4,245.2%) |
| 2.0x to 2.9x | 354 (14.1%) | 1,102 (60.6%) |
| 3.0x to 3.9x | 200 (7.9%) | 385 (21.1%) |
| 4.0x or more | 598 (23.7%) | 109 (6.0%) |
| Total | 2,518 (100.0%) | 1,820 (100.0%) |
Real Estate Taxes by Mortgage Status in White County
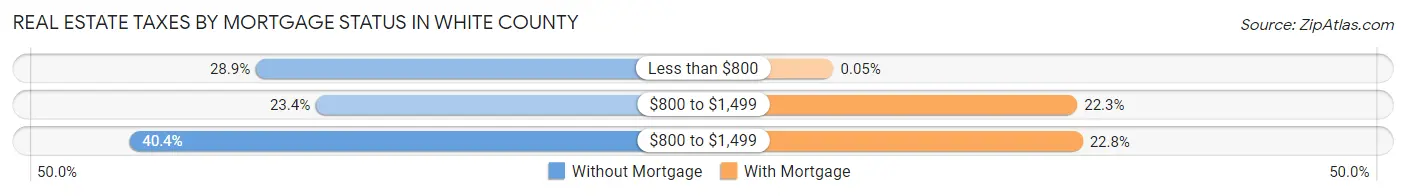
| Property Taxes | Without Mortgage | With Mortgage |
| Less than $800 | 727 (28.9%) | 1 (0.1%) |
| $800 to $1,499 | 589 (23.4%) | 406 (22.3%) |
| $800 to $1,499 | 1,018 (40.4%) | 415 (22.8%) |
| Total | 2,518 (100.0%) | 1,820 (100.0%) |
Health & Disability in White County
Health Insurance Coverage by Age in White County
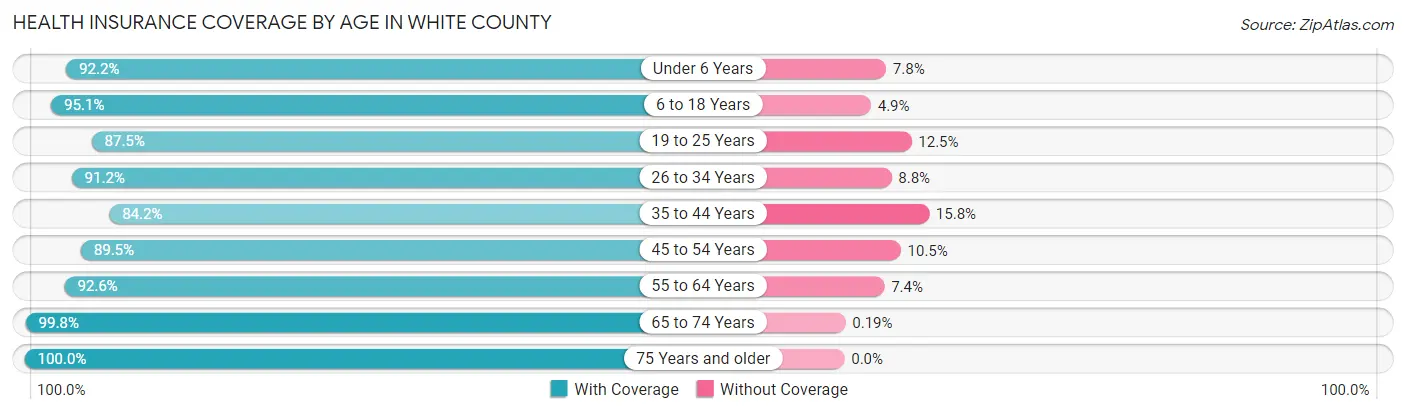
| Age Bracket | With Coverage | Without Coverage |
| Under 6 Years | 725 (92.2%) | 61 (7.8%) |
| 6 to 18 Years | 2,231 (95.1%) | 116 (4.9%) |
| 19 to 25 Years | 728 (87.5%) | 104 (12.5%) |
| 26 to 34 Years | 1,215 (91.2%) | 117 (8.8%) |
| 35 to 44 Years | 1,372 (84.2%) | 257 (15.8%) |
| 45 to 54 Years | 1,389 (89.5%) | 163 (10.5%) |
| 55 to 64 Years | 1,890 (92.6%) | 152 (7.4%) |
| 65 to 74 Years | 1,605 (99.8%) | 3 (0.2%) |
| 75 Years and older | 1,385 (100.0%) | 0 (0.0%) |
| Total | 12,540 (92.8%) | 973 (7.2%) |
Health Insurance Coverage by Citizenship Status in White County
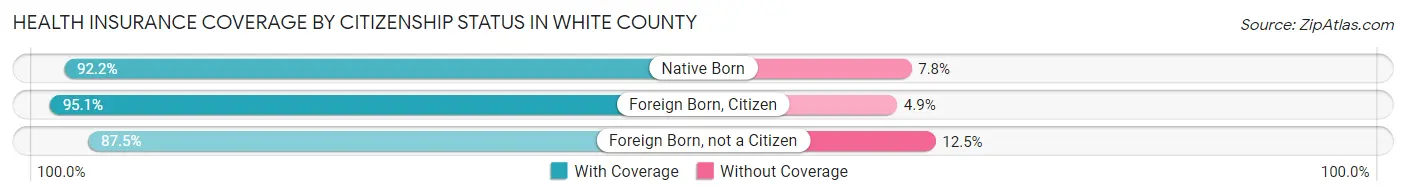
| Citizenship Status | With Coverage | Without Coverage |
| Native Born | 725 (92.2%) | 61 (7.8%) |
| Foreign Born, Citizen | 2,231 (95.1%) | 116 (4.9%) |
| Foreign Born, not a Citizen | 728 (87.5%) | 104 (12.5%) |
Health Insurance Coverage by Household Income in White County
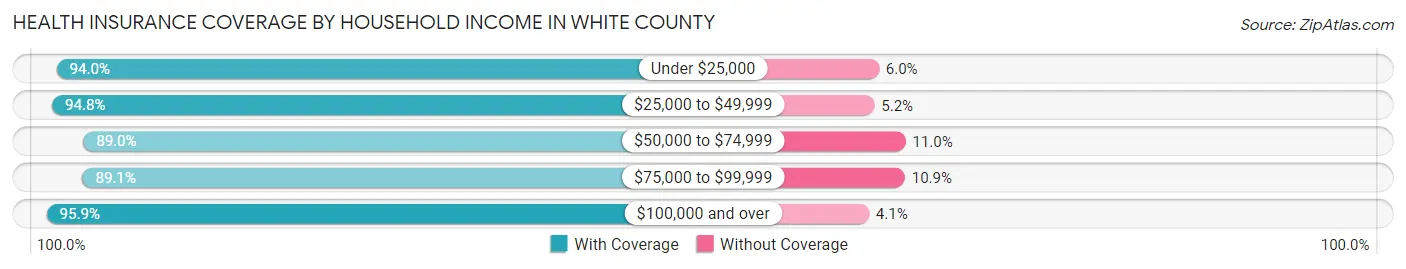
| Household Income | With Coverage | Without Coverage |
| Under $25,000 | 2,003 (94.0%) | 128 (6.0%) |
| $25,000 to $49,999 | 2,276 (94.8%) | 124 (5.2%) |
| $50,000 to $74,999 | 2,800 (89.0%) | 346 (11.0%) |
| $75,000 to $99,999 | 1,796 (89.1%) | 219 (10.9%) |
| $100,000 and over | 3,614 (95.9%) | 156 (4.1%) |
Public vs Private Health Insurance Coverage by Age in White County
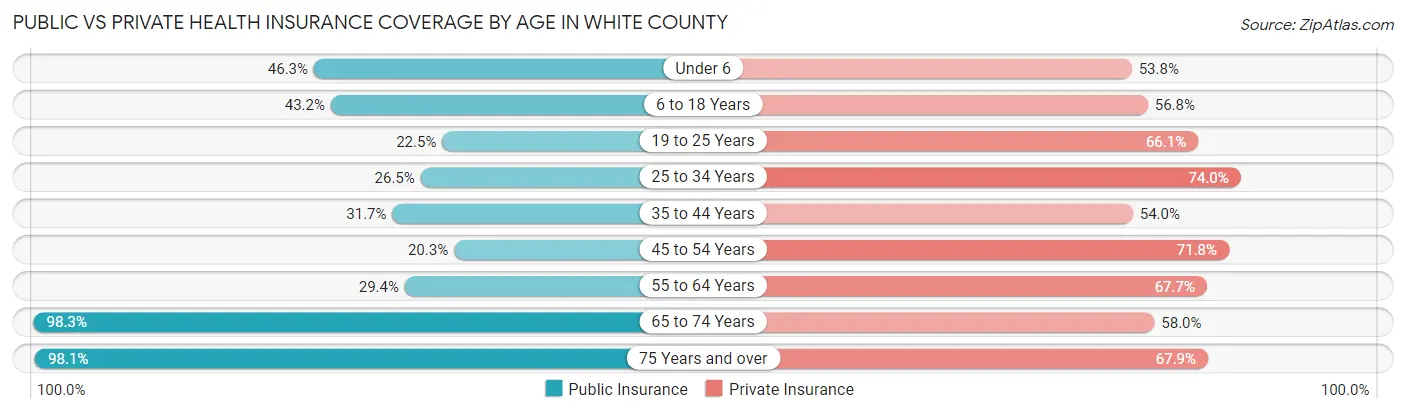
| Age Bracket | Public Insurance | Private Insurance |
| Under 6 | 364 (46.3%) | 423 (53.8%) |
| 6 to 18 Years | 1,013 (43.2%) | 1,333 (56.8%) |
| 19 to 25 Years | 187 (22.5%) | 550 (66.1%) |
| 25 to 34 Years | 353 (26.5%) | 986 (74.0%) |
| 35 to 44 Years | 517 (31.7%) | 880 (54.0%) |
| 45 to 54 Years | 315 (20.3%) | 1,115 (71.8%) |
| 55 to 64 Years | 601 (29.4%) | 1,383 (67.7%) |
| 65 to 74 Years | 1,581 (98.3%) | 933 (58.0%) |
| 75 Years and over | 1,358 (98.1%) | 941 (67.9%) |
| Total | 6,289 (46.5%) | 8,544 (63.2%) |
Disability Status by Sex by Age in White County
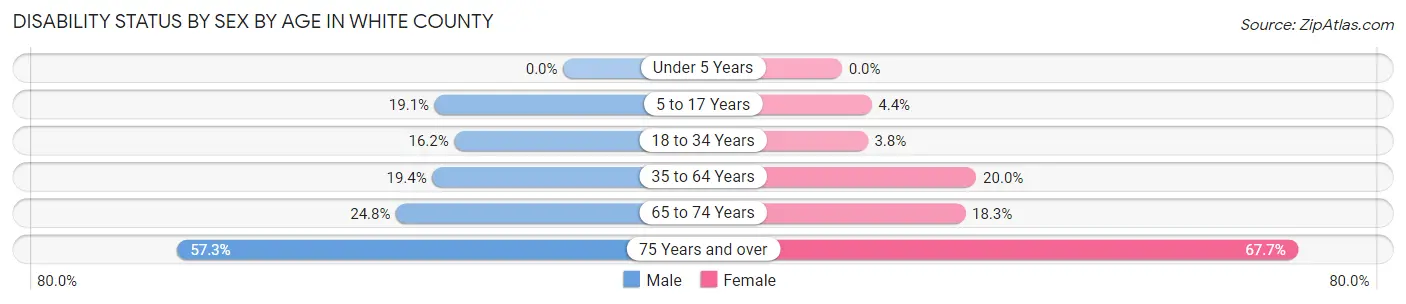
| Age Bracket | Male | Female |
| Under 5 Years | 0 (0.0%) | 0 (0.0%) |
| 5 to 17 Years | 213 (19.1%) | 51 (4.4%) |
| 18 to 34 Years | 190 (16.2%) | 44 (3.8%) |
| 35 to 64 Years | 506 (19.4%) | 522 (20.0%) |
| 65 to 74 Years | 186 (24.8%) | 157 (18.3%) |
| 75 Years and over | 333 (57.3%) | 544 (67.7%) |
Disability Class by Sex by Age in White County
Disability Class: Hearing Difficulty
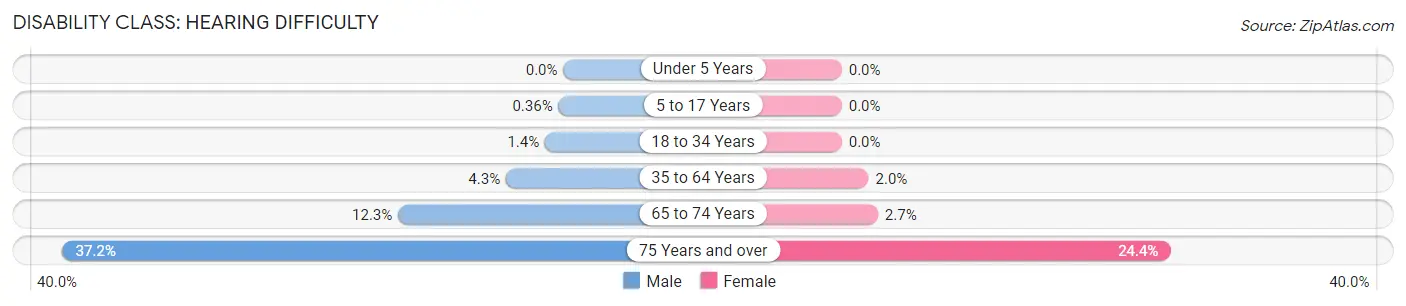
| Age Bracket | Male | Female |
| Under 5 Years | 0 (0.0%) | 0 (0.0%) |
| 5 to 17 Years | 4 (0.4%) | 0 (0.0%) |
| 18 to 34 Years | 16 (1.4%) | 0 (0.0%) |
| 35 to 64 Years | 111 (4.3%) | 52 (2.0%) |
| 65 to 74 Years | 92 (12.3%) | 23 (2.7%) |
| 75 Years and over | 216 (37.2%) | 196 (24.4%) |
Disability Class: Vision Difficulty
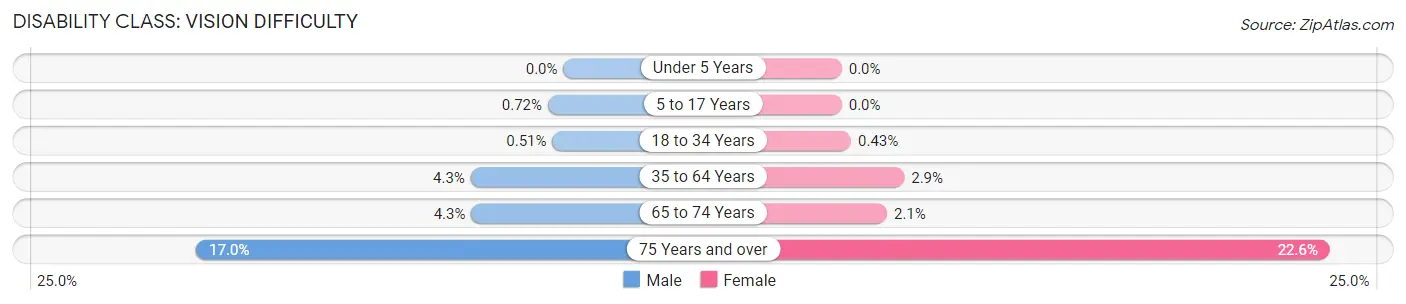
| Age Bracket | Male | Female |
| Under 5 Years | 0 (0.0%) | 0 (0.0%) |
| 5 to 17 Years | 8 (0.7%) | 0 (0.0%) |
| 18 to 34 Years | 6 (0.5%) | 5 (0.4%) |
| 35 to 64 Years | 112 (4.3%) | 76 (2.9%) |
| 65 to 74 Years | 32 (4.3%) | 18 (2.1%) |
| 75 Years and over | 99 (17.0%) | 182 (22.6%) |
Disability Class: Cognitive Difficulty
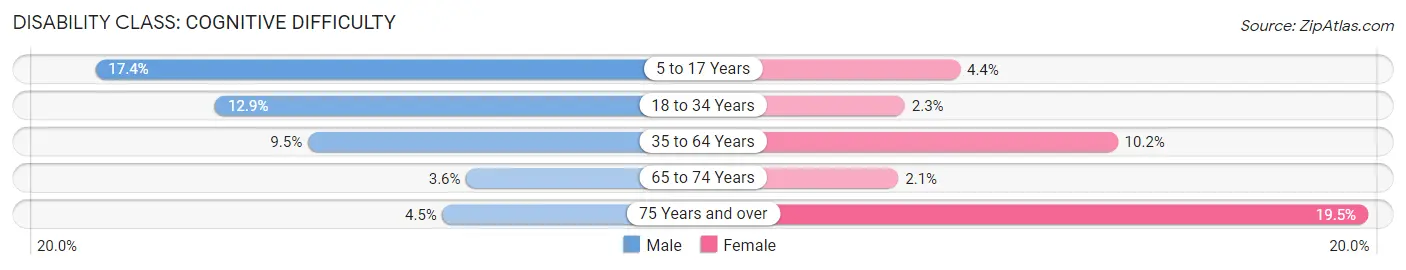
| Age Bracket | Male | Female |
| 5 to 17 Years | 194 (17.4%) | 51 (4.4%) |
| 18 to 34 Years | 152 (12.9%) | 27 (2.3%) |
| 35 to 64 Years | 247 (9.5%) | 268 (10.2%) |
| 65 to 74 Years | 27 (3.6%) | 18 (2.1%) |
| 75 Years and over | 26 (4.5%) | 157 (19.5%) |
Disability Class: Ambulatory Difficulty
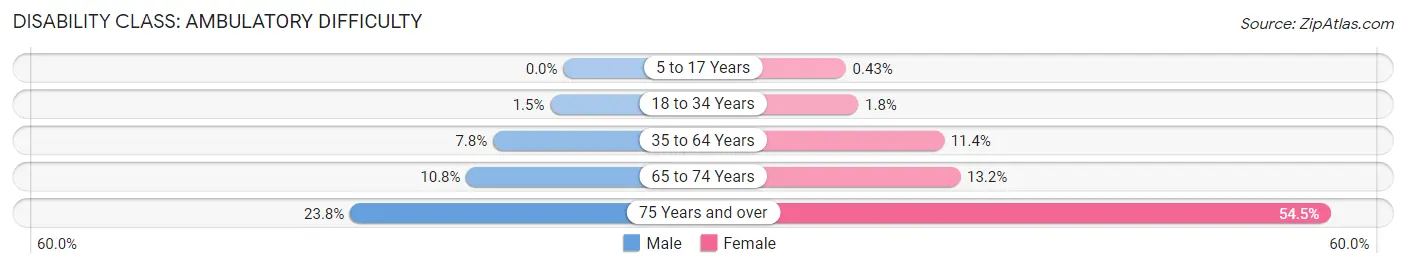
| Age Bracket | Male | Female |
| 5 to 17 Years | 0 (0.0%) | 5 (0.4%) |
| 18 to 34 Years | 17 (1.5%) | 21 (1.8%) |
| 35 to 64 Years | 204 (7.8%) | 297 (11.4%) |
| 65 to 74 Years | 81 (10.8%) | 113 (13.2%) |
| 75 Years and over | 138 (23.7%) | 438 (54.5%) |
Disability Class: Self-Care Difficulty
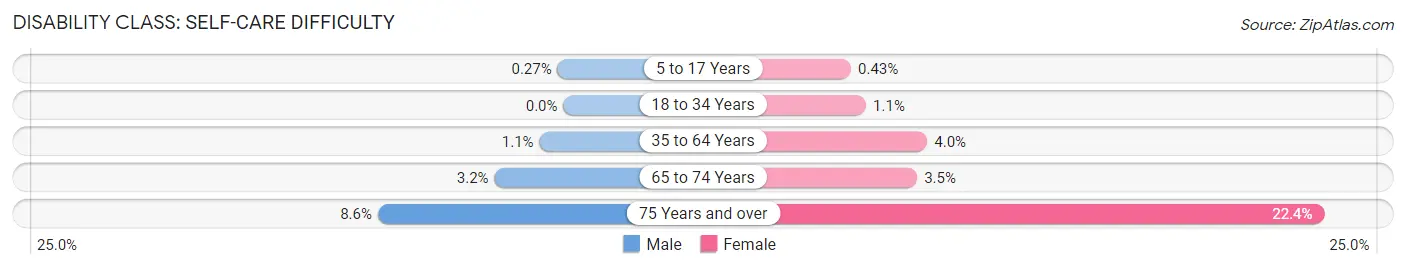
| Age Bracket | Male | Female |
| 5 to 17 Years | 3 (0.3%) | 5 (0.4%) |
| 18 to 34 Years | 0 (0.0%) | 13 (1.1%) |
| 35 to 64 Years | 29 (1.1%) | 104 (4.0%) |
| 65 to 74 Years | 24 (3.2%) | 30 (3.5%) |
| 75 Years and over | 50 (8.6%) | 180 (22.4%) |
Technology Access in White County
Computing Device Access in White County
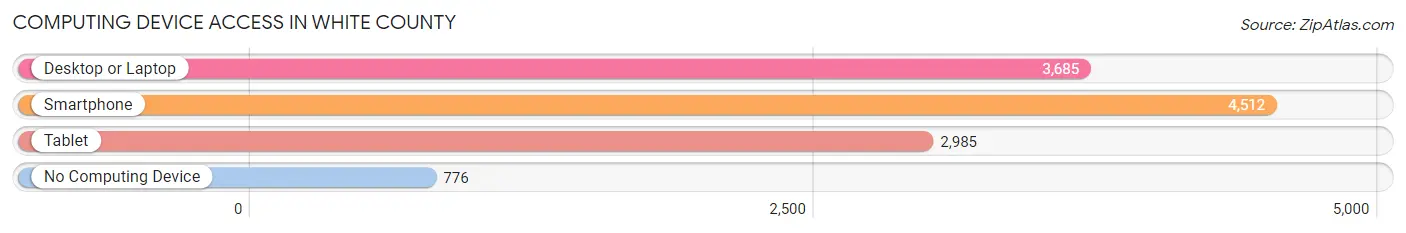
| Device Type | # Households | % Households |
| Desktop or Laptop | 3,685 | 64.9% |
| Smartphone | 4,512 | 79.5% |
| Tablet | 2,985 | 52.6% |
| No Computing Device | 776 | 13.7% |
| Total | 5,676 | 100.0% |
Internet Access in White County
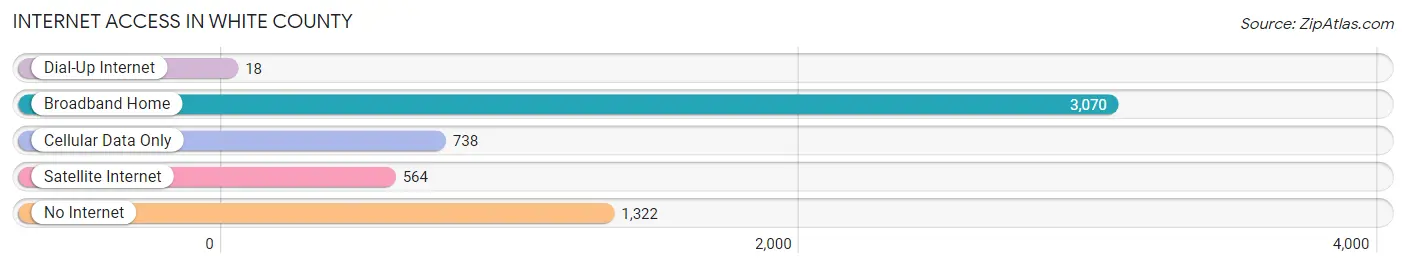
| Internet Type | # Households | % Households |
| Dial-Up Internet | 18 | 0.3% |
| Broadband Home | 3,070 | 54.1% |
| Cellular Data Only | 738 | 13.0% |
| Satellite Internet | 564 | 9.9% |
| No Internet | 1,322 | 23.3% |
| Total | 5,676 | 100.0% |
White County Summary
White County is a county located in the state of Illinois. It is part of the Centralia-Mount Vernon-Salem, IL Metropolitan Statistical Area. As of the 2010 census, the population was 14,665. The county seat is Carmi. The county was formed in 1815 from Gallatin and Edwards counties. It was named for General Edmund P. White, who was killed in the War of 1812.
Geography
White County is located in the southeastern part of Illinois. It is bordered by Wabash County to the north, Edwards County to the east, Hamilton County to the south, and Gallatin County to the west. The county has a total area of 517 square miles, of which 514 square miles is land and 3 square miles (0.6%) is water.
The county is mostly flat, with some rolling hills in the northern part. The highest point in the county is located in the northwest corner, at an elevation of 830 feet. The county is drained by the Little Wabash River, which flows through the center of the county from north to south.
Demographics
As of the 2010 census, there were 14,665 people, 5,945 households, and 4,093 families residing in the county. The population density was 28.6 people per square mile. There were 6,541 housing units at an average density of 12.7 per square mile. The racial makeup of the county was 97.3% White, 0.5% African American, 0.2% Native American, 0.3% Asian, 0.2% from other races, and 1.5% from two or more races. Hispanic or Latino of any race were 1.2% of the population.
There were 5,945 households, out of which 30.2% had children under the age of 18 living with them, 56.2% were married couples living together, 9.7% had a female householder with no husband present, and 30.2% were non-families. 26.2% of all households were made up of individuals, and 12.3% had someone living alone who was 65 years of age or older. The average household size was 2.45 and the average family size was 2.94.
The median age in the county was 41.3 years. 24.2% of residents were under the age of 18; 7.7% were between the ages of 18 and 24; 23.2% were from 25 to 44; 27.2% were from 45 to 64; and 17.7% were 65 years of age or older. The gender makeup of the county was 48.3% male and 51.7% female.
Economy
White County is largely rural and agricultural. The county is home to several large farms, as well as several small family farms. The county is also home to several small businesses, including a few manufacturing companies.
The county's largest employer is the White County Medical Center, which employs over 1,000 people. Other major employers include the White County School District, the White County Sheriff's Office, and the White County Courthouse.
The county's unemployment rate was 5.2% in 2019, slightly lower than the state average of 5.4%. The median household income was $45,845 in 2019, slightly lower than the state average of $50,902.
Conclusion
White County is a rural county located in the southeastern part of Illinois. It is home to several large farms, as well as several small family farms. The county is also home to several small businesses, including a few manufacturing companies. The county's largest employer is the White County Medical Center, which employs over 1,000 people. The county's unemployment rate was 5.2% in 2019, slightly lower than the state average of 5.4%. The median household income was $45,845 in 2019, slightly lower than the state average of $50,902.
Common Questions
What is Per Capita Income in White County?
Per Capita income in White County is $29,977.
What is the Median Family Income in White County?
Median Family Income in White County is $72,500.
What is the Median Household income in White County?
Median Household Income in White County is $54,605.
What is Income or Wage Gap in White County?
Income or Wage Gap in White County is 37.1%.
Women in White County earn 62.9 cents for every dollar earned by a man.
What is Family Income Deficit in White County?
Family Income Deficit in White County is $8,350.
Families that are below poverty line in White County earn $8,350 less on average than the poverty threshold level.
What is Inequality or Gini Index in White County?
Inequality or Gini Index in White County is 0.44.
What is the Total Population of White County?
Total Population of White County is 13,834.
What is the Total Male Population of White County?
Total Male Population of White County is 6,758.
What is the Total Female Population of White County?
Total Female Population of White County is 7,076.
What is the Ratio of Males per 100 Females in White County?
There are 95.51 Males per 100 Females in White County.
What is the Ratio of Females per 100 Males in White County?
There are 104.71 Females per 100 Males in White County.
What is the Median Population Age in White County?
Median Population Age in White County is 44.7 Years.
What is the Average Family Size in White County
Average Family Size in White County is 3.0 People.
What is the Average Household Size in White County
Average Household Size in White County is 2.4 People.
How Large is the Labor Force in White County?
There are 6,178 People in the Labor Forcein in White County.
What is the Percentage of People in the Labor Force in White County?
55.1% of People are in the Labor Force in White County.
What is the Unemployment Rate in White County?
Unemployment Rate in White County is 3.5%.