Wabash County, IL Map & Demographics
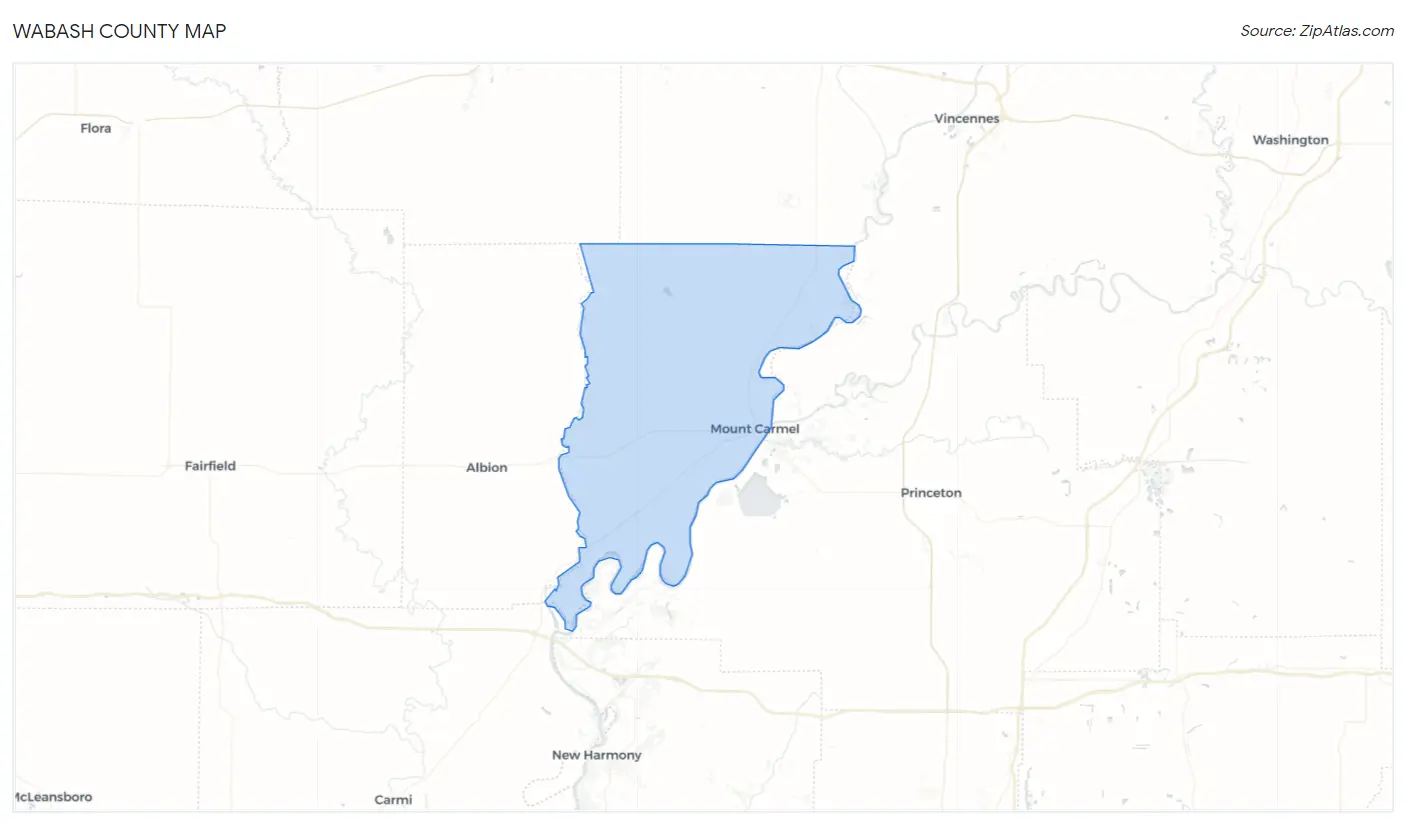
Wabash County Map
Wabash County Overview
$33,137
PER CAPITA INCOME
$80,377
AVG FAMILY INCOME
$54,074
AVG HOUSEHOLD INCOME
44.8%
WAGE / INCOME GAP [ % ]
55.2¢/ $1
WAGE / INCOME GAP [ $ ]
$8,931
FAMILY INCOME DEFICIT
0.46
INEQUALITY / GINI INDEX
11,321
TOTAL POPULATION
5,516
MALE POPULATION
5,805
FEMALE POPULATION
95.02
MALES / 100 FEMALES
105.24
FEMALES / 100 MALES
43.8
MEDIAN AGE
2.9
AVG FAMILY SIZE
2.3
AVG HOUSEHOLD SIZE
5,313
LABOR FORCE [ PEOPLE ]
58.4%
PERCENT IN LABOR FORCE
4.4%
UNEMPLOYMENT RATE
Wabash County Area Codes
Income in Wabash County
Income Overview in Wabash County
Per Capita Income in Wabash County is $33,137, while median incomes of families and households are $80,377 and $54,074 respectively.
| Characteristic | Number | Measure |
| Per Capita Income | 11,321 | $33,137 |
| Median Family Income | 3,099 | $80,377 |
| Mean Family Income | 3,099 | $92,181 |
| Median Household Income | 4,778 | $54,074 |
| Mean Household Income | 4,778 | $75,432 |
| Income Deficit | 3,099 | $8,931 |
| Wage / Income Gap (%) | 11,321 | 44.76% |
| Wage / Income Gap ($) | 11,321 | 55.24¢ per $1 |
| Gini / Inequality Index | 11,321 | 0.46 |
Earnings by Sex in Wabash County
Average Earnings in Wabash County are $35,546, $47,063 for men and $25,996 for women, a difference of 44.8%.
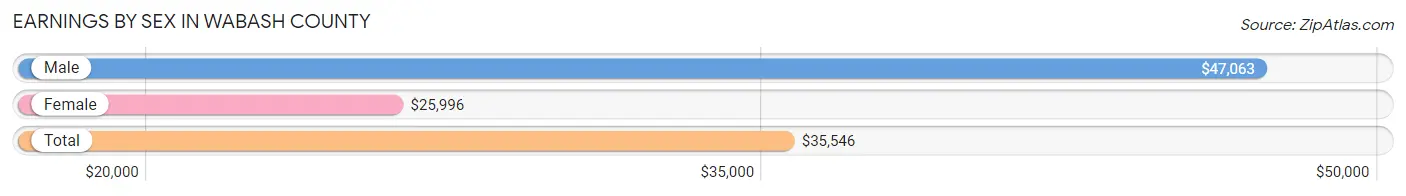
| Sex | Number | Average Earnings |
| Male | 2,929 (51.3%) | $47,063 |
| Female | 2,780 (48.7%) | $25,996 |
| Total | 5,709 (100.0%) | $35,546 |
Earnings by Sex by Income Bracket in Wabash County
The most common earnings brackets in Wabash County are $75,000 to $99,999 for men (491 | 16.8%) and $40,000 to $44,999 for women (253 | 9.1%).
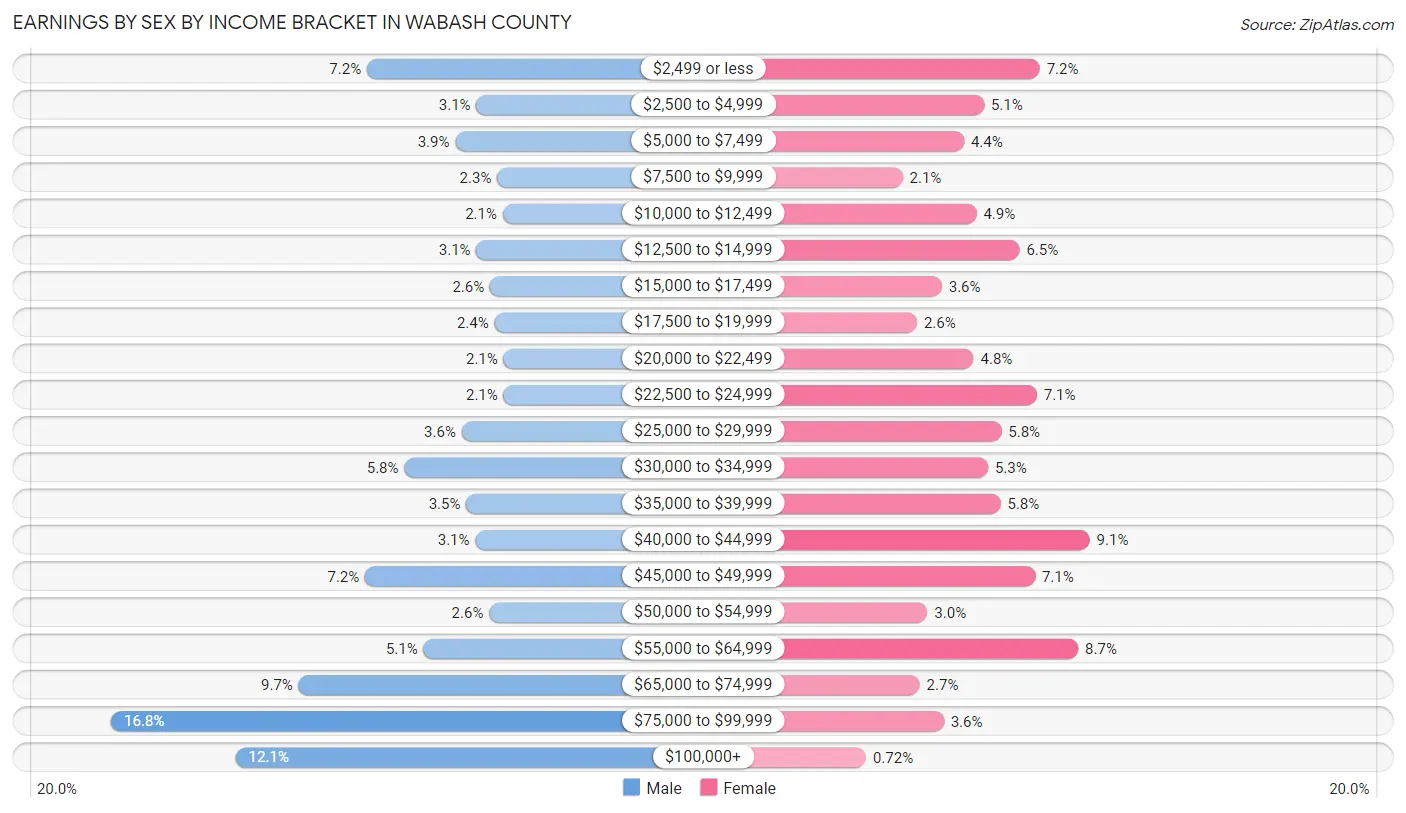
| Income | Male | Female |
| $2,499 or less | 210 (7.2%) | 201 (7.2%) |
| $2,500 to $4,999 | 90 (3.1%) | 143 (5.1%) |
| $5,000 to $7,499 | 113 (3.9%) | 122 (4.4%) |
| $7,500 to $9,999 | 67 (2.3%) | 58 (2.1%) |
| $10,000 to $12,499 | 61 (2.1%) | 135 (4.9%) |
| $12,500 to $14,999 | 90 (3.1%) | 180 (6.5%) |
| $15,000 to $17,499 | 75 (2.6%) | 99 (3.6%) |
| $17,500 to $19,999 | 70 (2.4%) | 73 (2.6%) |
| $20,000 to $22,499 | 60 (2.1%) | 132 (4.8%) |
| $22,500 to $24,999 | 60 (2.1%) | 198 (7.1%) |
| $25,000 to $29,999 | 106 (3.6%) | 161 (5.8%) |
| $30,000 to $34,999 | 169 (5.8%) | 147 (5.3%) |
| $35,000 to $39,999 | 101 (3.5%) | 160 (5.8%) |
| $40,000 to $44,999 | 91 (3.1%) | 253 (9.1%) |
| $45,000 to $49,999 | 212 (7.2%) | 196 (7.0%) |
| $50,000 to $54,999 | 76 (2.6%) | 84 (3.0%) |
| $55,000 to $64,999 | 148 (5.1%) | 241 (8.7%) |
| $65,000 to $74,999 | 285 (9.7%) | 76 (2.7%) |
| $75,000 to $99,999 | 491 (16.8%) | 101 (3.6%) |
| $100,000+ | 354 (12.1%) | 20 (0.7%) |
| Total | 2,929 (100.0%) | 2,780 (100.0%) |
Earnings by Sex by Educational Attainment in Wabash County
Average earnings in Wabash County are $56,194 for men and $32,440 for women, a difference of 42.3%. Men with an educational attainment of graduate degree enjoy the highest average annual earnings of $95,585, while those with less than high school education earn the least with $35,208. Women with an educational attainment of graduate degree earn the most with the average annual earnings of $60,625, while those with college or associate's degree education have the smallest earnings of $26,774.
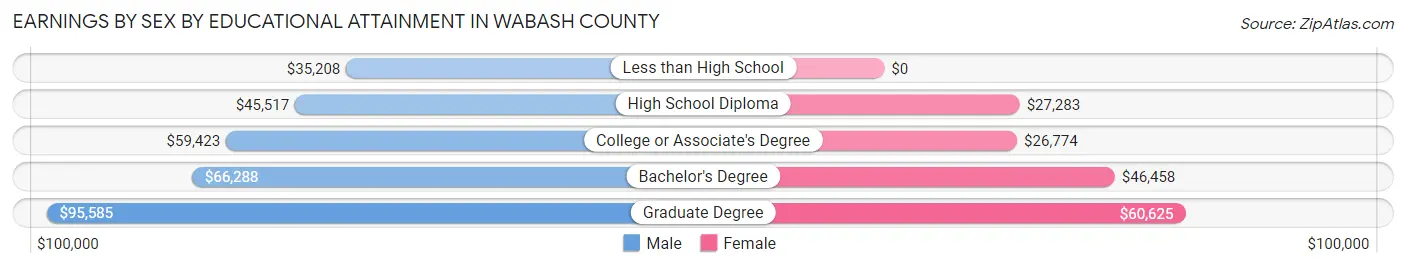
| Educational Attainment | Male Income | Female Income |
| Less than High School | $35,208 | $0 |
| High School Diploma | $45,517 | $27,283 |
| College or Associate's Degree | $59,423 | $26,774 |
| Bachelor's Degree | $66,288 | $46,458 |
| Graduate Degree | $95,585 | $60,625 |
| Total | $56,194 | $32,440 |
Family Income in Wabash County
Family Income Brackets in Wabash County
According to the Wabash County family income data, there are 682 families falling into the $100,000 to $149,999 income range, which is the most common income bracket and makes up 22.0% of all families. Conversely, the $10,000 to $14,999 income bracket is the least frequent group with only 59 families (1.9%) belonging to this category.
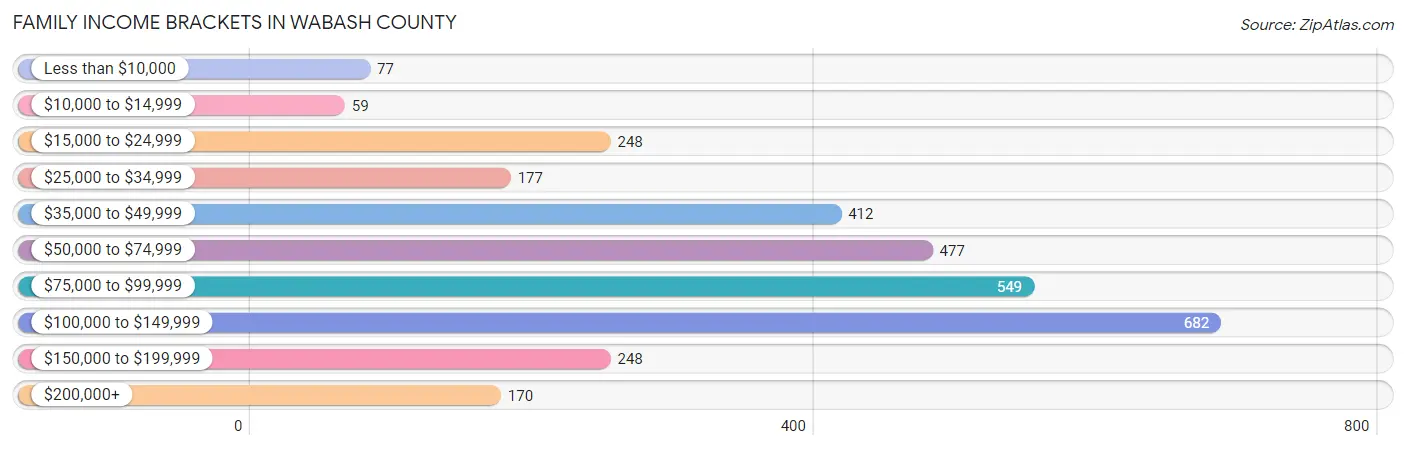
| Income Bracket | # Families | % Families |
| Less than $10,000 | 77 | 2.5% |
| $10,000 to $14,999 | 59 | 1.9% |
| $15,000 to $24,999 | 248 | 8.0% |
| $25,000 to $34,999 | 177 | 5.7% |
| $35,000 to $49,999 | 412 | 13.3% |
| $50,000 to $74,999 | 477 | 15.4% |
| $75,000 to $99,999 | 549 | 17.7% |
| $100,000 to $149,999 | 682 | 22.0% |
| $150,000 to $199,999 | 248 | 8.0% |
| $200,000+ | 170 | 5.5% |
Family Income by Famaliy Size in Wabash County
4-person families (485 | 15.7%) account for the highest median family income in Wabash County with $113,839 per family, while 3-person families (669 | 21.6%) have the highest median income of $30,440 per family member.
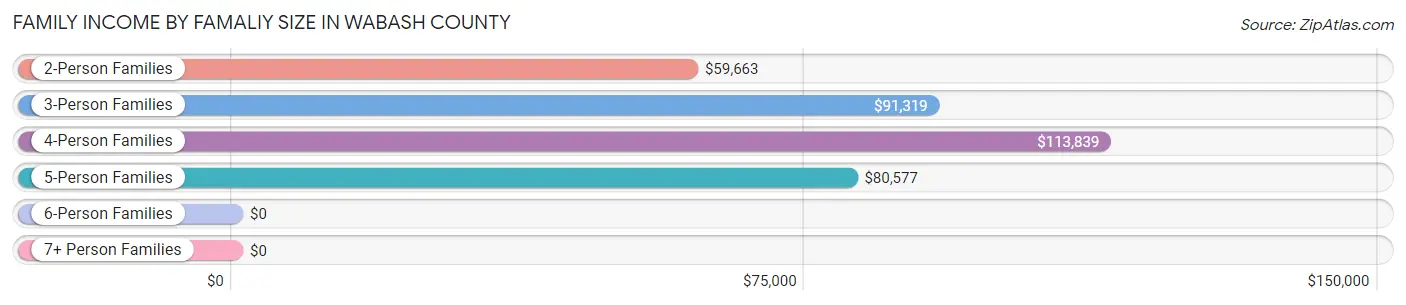
| Income Bracket | # Families | Median Income |
| 2-Person Families | 1,675 (54.0%) | $59,663 |
| 3-Person Families | 669 (21.6%) | $91,319 |
| 4-Person Families | 485 (15.7%) | $113,839 |
| 5-Person Families | 170 (5.5%) | $80,577 |
| 6-Person Families | 66 (2.1%) | $0 |
| 7+ Person Families | 34 (1.1%) | $0 |
| Total | 3,099 (100.0%) | $80,377 |
Family Income by Number of Earners in Wabash County
The median family income in Wabash County is $80,377, with families comprising 3+ earners (299) having the highest median family income of $156,250, while families with no earners (548) have the lowest median family income of $47,963, accounting for 9.7% and 17.7% of families, respectively.
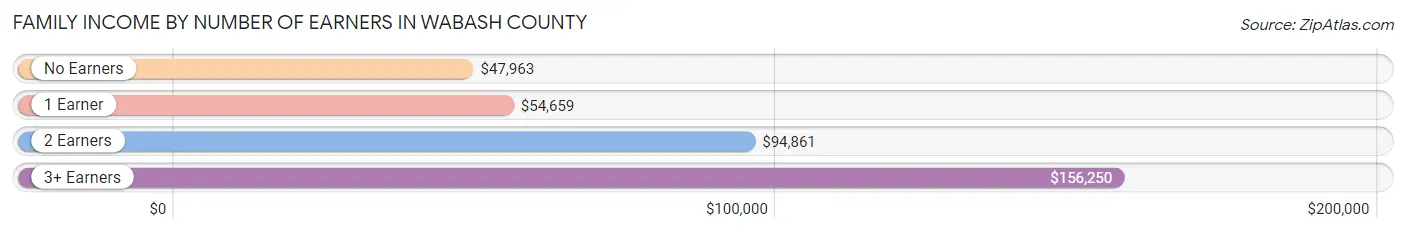
| Number of Earners | # Families | Median Income |
| No Earners | 548 (17.7%) | $47,963 |
| 1 Earner | 879 (28.4%) | $54,659 |
| 2 Earners | 1,373 (44.3%) | $94,861 |
| 3+ Earners | 299 (9.7%) | $156,250 |
| Total | 3,099 (100.0%) | $80,377 |
Household Income in Wabash County
Household Income Brackets in Wabash County
With 712 households falling in the category, the $15,000 to $24,999 income range is the most frequent in Wabash County, accounting for 14.9% of all households. In contrast, only 186 households (3.9%) fall into the $10,000 to $14,999 income bracket, making it the least populous group.
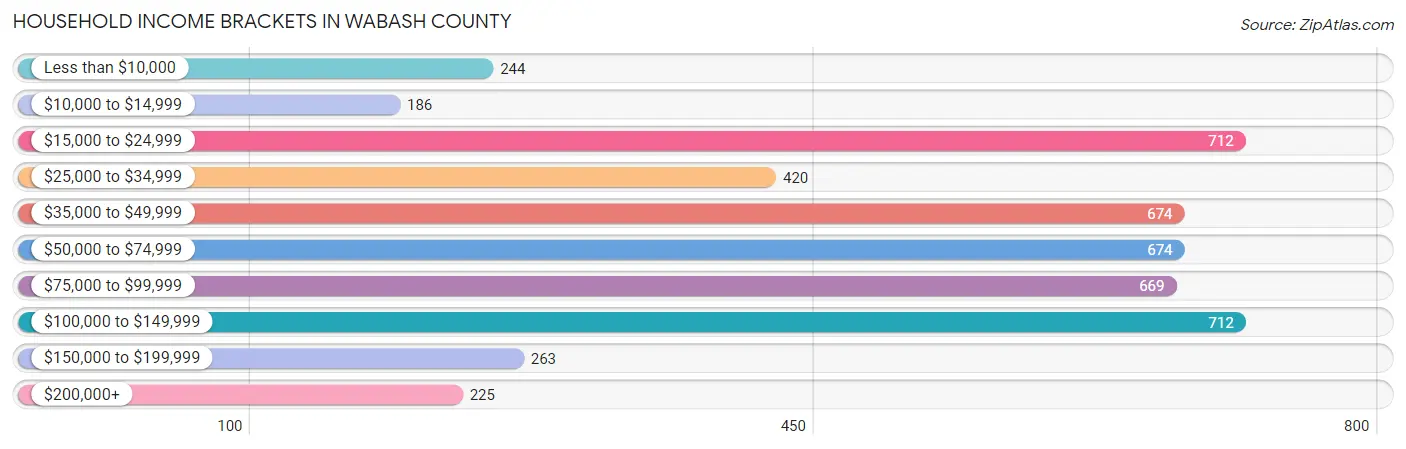
| Income Bracket | # Households | % Households |
| Less than $10,000 | 244 | 5.1% |
| $10,000 to $14,999 | 186 | 3.9% |
| $15,000 to $24,999 | 712 | 14.9% |
| $25,000 to $34,999 | 420 | 8.8% |
| $35,000 to $49,999 | 674 | 14.1% |
| $50,000 to $74,999 | 674 | 14.1% |
| $75,000 to $99,999 | 669 | 14.0% |
| $100,000 to $149,999 | 712 | 14.9% |
| $150,000 to $199,999 | 263 | 5.5% |
| $200,000+ | 225 | 4.7% |
Household Income by Householder Age in Wabash County
The median household income in Wabash County is $54,074, with the highest median household income of $81,852 found in the 25 to 44 years age bracket for the primary householder. A total of 1,266 households (26.5%) fall into this category. Meanwhile, the 15 to 24 years age bracket for the primary householder has the lowest median household income of $36,920, with 113 households (2.4%) in this group.
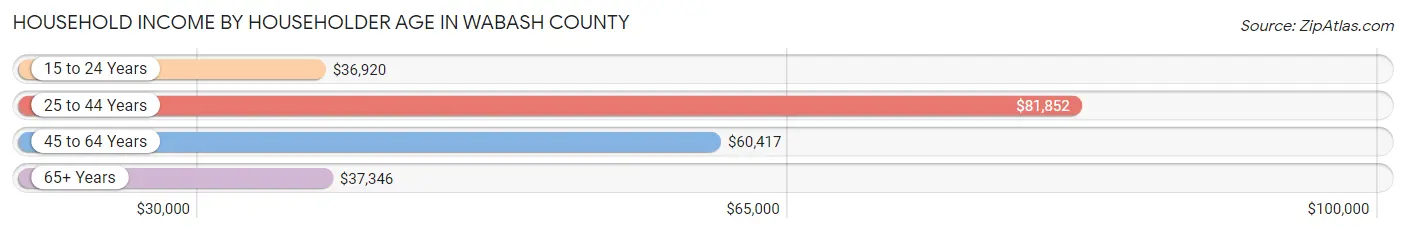
| Income Bracket | # Households | Median Income |
| 15 to 24 Years | 113 (2.4%) | $36,920 |
| 25 to 44 Years | 1,266 (26.5%) | $81,852 |
| 45 to 64 Years | 1,759 (36.8%) | $60,417 |
| 65+ Years | 1,640 (34.3%) | $37,346 |
| Total | 4,778 (100.0%) | $54,074 |
Poverty in Wabash County
Income Below Poverty by Sex and Age in Wabash County
With 10.3% poverty level for males and 16.2% for females among the residents of Wabash County, 18 to 24 year old males and 12 to 14 year old females are the most vulnerable to poverty, with 88 males (23.7%) and 75 females (38.3%) in their respective age groups living below the poverty level.

| Age Bracket | Male | Female |
| Under 5 Years | 42 (13.9%) | 74 (25.1%) |
| 5 Years | 20 (20.8%) | 2 (3.5%) |
| 6 to 11 Years | 14 (4.3%) | 117 (27.3%) |
| 12 to 14 Years | 11 (4.0%) | 75 (38.3%) |
| 15 Years | 12 (13.2%) | 5 (8.1%) |
| 16 and 17 Years | 27 (21.8%) | 12 (9.6%) |
| 18 to 24 Years | 88 (23.7%) | 95 (23.7%) |
| 25 to 34 Years | 57 (8.6%) | 106 (17.6%) |
| 35 to 44 Years | 63 (9.9%) | 99 (15.2%) |
| 45 to 54 Years | 76 (11.9%) | 96 (13.4%) |
| 55 to 64 Years | 63 (7.8%) | 114 (13.7%) |
| 65 to 74 Years | 79 (11.7%) | 77 (11.4%) |
| 75 Years and over | 8 (2.0%) | 51 (7.8%) |
| Total | 560 (10.3%) | 923 (16.2%) |
Income Above Poverty by Sex and Age in Wabash County
According to the poverty statistics in Wabash County, males aged 75 years and over and females aged 5 years are the age groups that are most secure financially, with 98.0% of males and 96.6% of females in these age groups living above the poverty line.
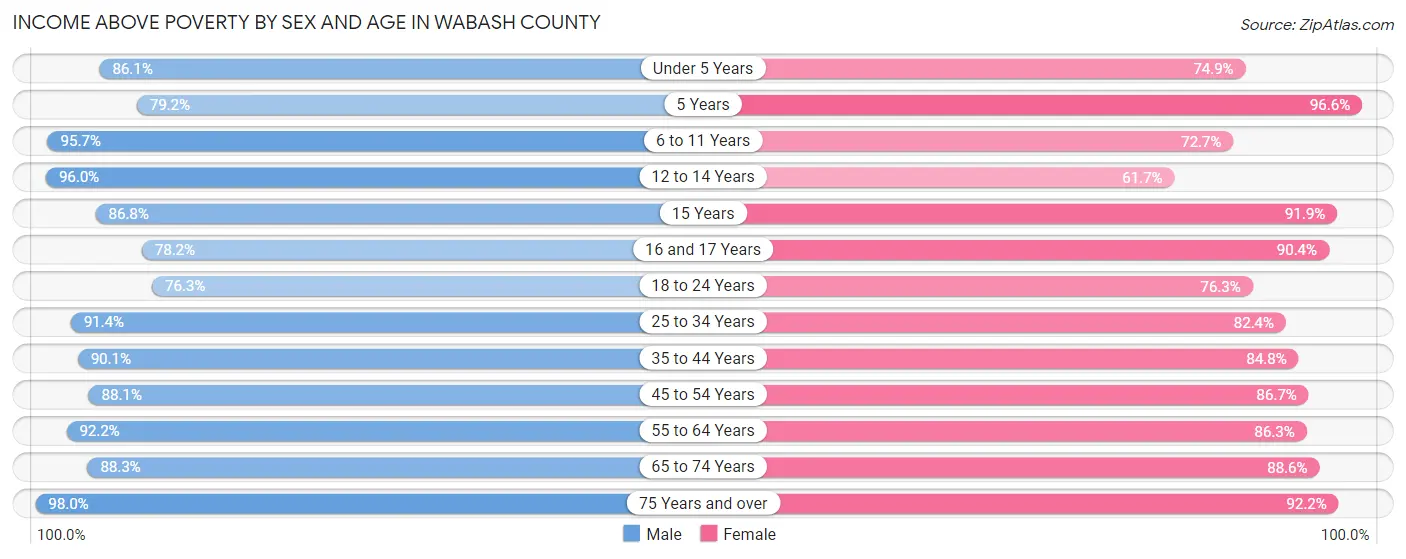
| Age Bracket | Male | Female |
| Under 5 Years | 260 (86.1%) | 221 (74.9%) |
| 5 Years | 76 (79.2%) | 56 (96.6%) |
| 6 to 11 Years | 313 (95.7%) | 311 (72.7%) |
| 12 to 14 Years | 266 (96.0%) | 121 (61.7%) |
| 15 Years | 79 (86.8%) | 57 (91.9%) |
| 16 and 17 Years | 97 (78.2%) | 113 (90.4%) |
| 18 to 24 Years | 284 (76.3%) | 305 (76.2%) |
| 25 to 34 Years | 609 (91.4%) | 497 (82.4%) |
| 35 to 44 Years | 575 (90.1%) | 551 (84.8%) |
| 45 to 54 Years | 563 (88.1%) | 623 (86.7%) |
| 55 to 64 Years | 748 (92.2%) | 716 (86.3%) |
| 65 to 74 Years | 598 (88.3%) | 601 (88.6%) |
| 75 Years and over | 391 (98.0%) | 604 (92.2%) |
| Total | 4,859 (89.7%) | 4,776 (83.8%) |
Income Below Poverty Among Married-Couple Families in Wabash County
The poverty statistics for married-couple families in Wabash County show that 3.7% or 85 of the total 2,301 families live below the poverty line. Families with 5 or more children have the highest poverty rate of 56.0%, comprising of 14 families. On the other hand, families with 1 or 2 children have the lowest poverty rate of 2.8%, which includes 19 families.
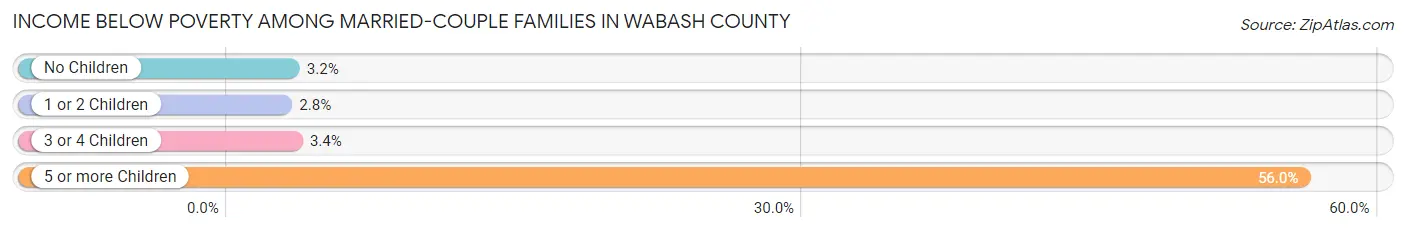
| Children | Above Poverty | Below Poverty |
| No Children | 1,440 (96.8%) | 48 (3.2%) |
| 1 or 2 Children | 651 (97.2%) | 19 (2.8%) |
| 3 or 4 Children | 114 (96.6%) | 4 (3.4%) |
| 5 or more Children | 11 (44.0%) | 14 (56.0%) |
| Total | 2,216 (96.3%) | 85 (3.7%) |
Income Below Poverty Among Single-Parent Households in Wabash County
According to the poverty data in Wabash County, 21.8% or 41 single-father households and 29.2% or 178 single-mother households are living below the poverty line. Among single-father households, those with 1 or 2 children have the highest poverty rate, with 30 households (31.6%) experiencing poverty. Likewise, among single-mother households, those with 1 or 2 children have the highest poverty rate, with 98 households (42.6%) falling below the poverty line.
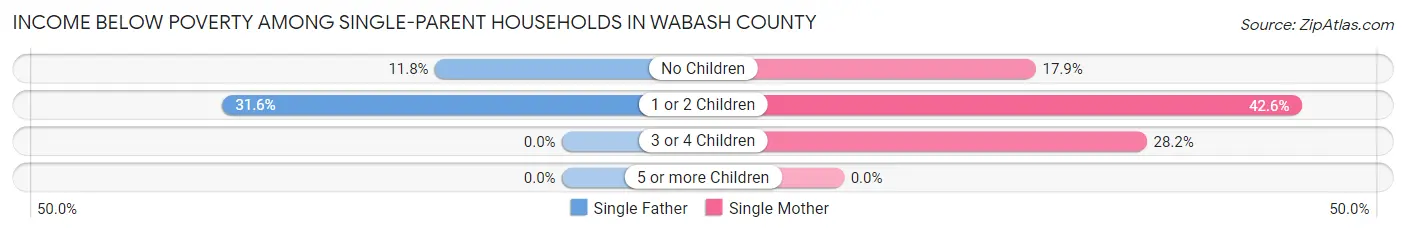
| Children | Single Father | Single Mother |
| No Children | 11 (11.8%) | 47 (17.9%) |
| 1 or 2 Children | 30 (31.6%) | 98 (42.6%) |
| 3 or 4 Children | 0 (0.0%) | 33 (28.2%) |
| 5 or more Children | 0 (0.0%) | 0 (0.0%) |
| Total | 41 (21.8%) | 178 (29.2%) |
Income Below Poverty Among Married-Couple vs Single-Parent Households in Wabash County
The poverty data for Wabash County shows that 85 of the married-couple family households (3.7%) and 219 of the single-parent households (27.4%) are living below the poverty level. Within the married-couple family households, those with 5 or more children have the highest poverty rate, with 14 households (56.0%) falling below the poverty line. Among the single-parent households, those with 1 or 2 children have the highest poverty rate, with 128 household (39.4%) living below poverty.
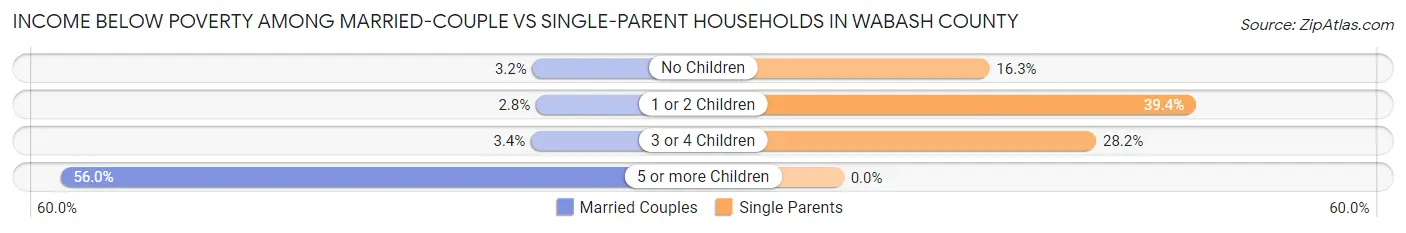
| Children | Married-Couple Families | Single-Parent Households |
| No Children | 48 (3.2%) | 58 (16.3%) |
| 1 or 2 Children | 19 (2.8%) | 128 (39.4%) |
| 3 or 4 Children | 4 (3.4%) | 33 (28.2%) |
| 5 or more Children | 14 (56.0%) | 0 (0.0%) |
| Total | 85 (3.7%) | 219 (27.4%) |
Race in Wabash County
The most populous races in Wabash County are White / Caucasian (10,585 | 93.5%), Two or more Races (395 | 3.5%), and Hispanic or Latino (345 | 3.0%).
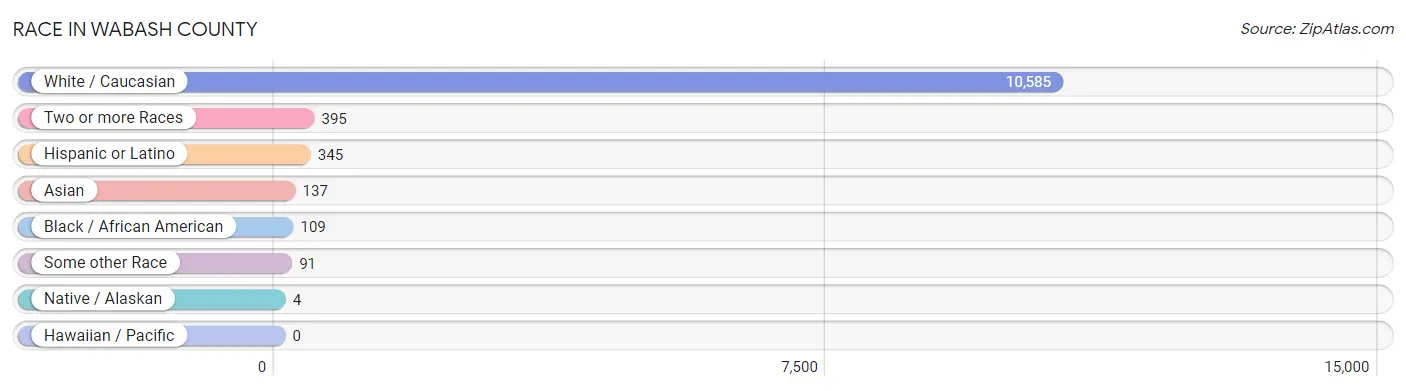
| Race | # Population | % Population |
| Asian | 137 | 1.2% |
| Black / African American | 109 | 1.0% |
| Hawaiian / Pacific | 0 | 0.0% |
| Hispanic or Latino | 345 | 3.0% |
| Native / Alaskan | 4 | 0.0% |
| White / Caucasian | 10,585 | 93.5% |
| Two or more Races | 395 | 3.5% |
| Some other Race | 91 | 0.8% |
| Total | 11,321 | 100.0% |
Ancestry in Wabash County
The most populous ancestries reported in Wabash County are German (3,105 | 27.4%), English (1,700 | 15.0%), American (1,195 | 10.6%), Irish (1,171 | 10.3%), and French (220 | 1.9%), together accounting for 65.3% of all Wabash County residents.
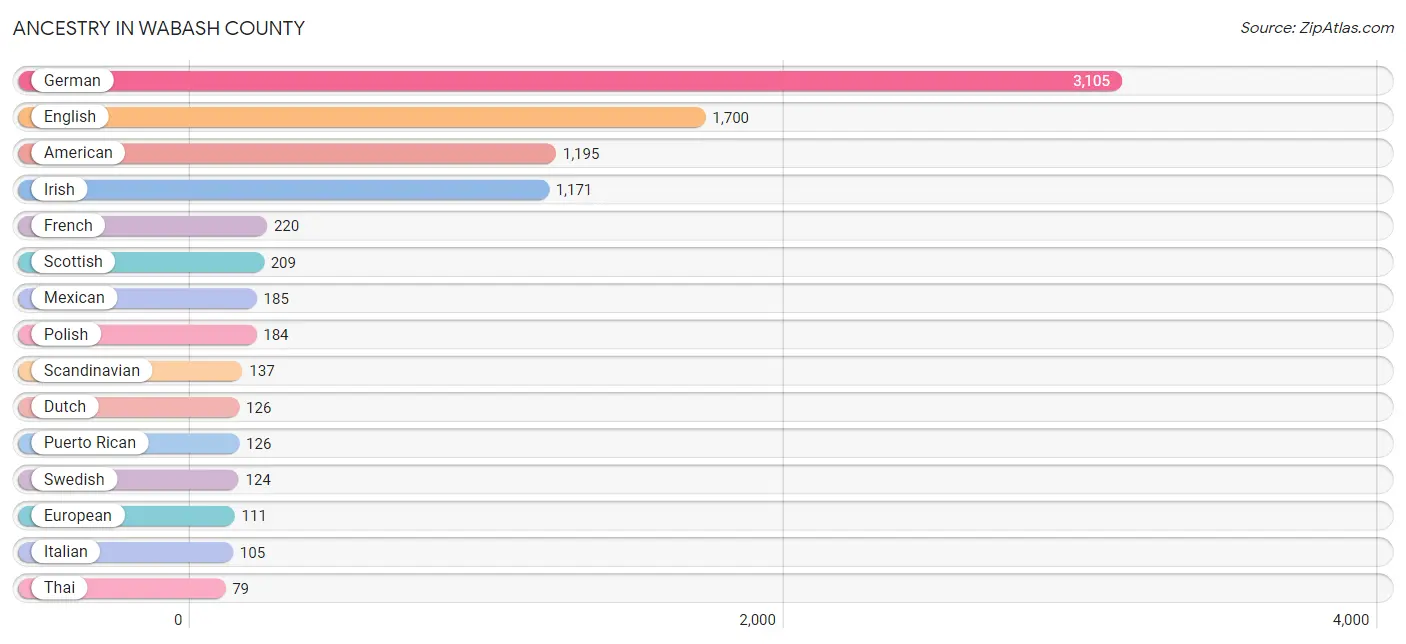
| Ancestry | # Population | % Population |
| American | 1,195 | 10.6% |
| Australian | 1 | 0.0% |
| Blackfeet | 5 | 0.0% |
| British | 59 | 0.5% |
| Burmese | 69 | 0.6% |
| Canadian | 7 | 0.1% |
| Central American | 26 | 0.2% |
| Cherokee | 30 | 0.3% |
| Danish | 30 | 0.3% |
| Dutch | 126 | 1.1% |
| Eastern European | 17 | 0.2% |
| English | 1,700 | 15.0% |
| European | 111 | 1.0% |
| French | 220 | 1.9% |
| French Canadian | 1 | 0.0% |
| German | 3,105 | 27.4% |
| Guatemalan | 25 | 0.2% |
| Honduran | 1 | 0.0% |
| Hungarian | 5 | 0.0% |
| Indian (Asian) | 8 | 0.1% |
| Irish | 1,171 | 10.3% |
| Iroquois | 6 | 0.1% |
| Italian | 105 | 0.9% |
| Korean | 60 | 0.5% |
| Mexican | 185 | 1.6% |
| Navajo | 1 | 0.0% |
| Northern European | 3 | 0.0% |
| Norwegian | 69 | 0.6% |
| Polish | 184 | 1.6% |
| Puerto Rican | 126 | 1.1% |
| Scandinavian | 137 | 1.2% |
| Scotch-Irish | 54 | 0.5% |
| Scottish | 209 | 1.8% |
| Slovene | 6 | 0.1% |
| Sri Lankan | 4 | 0.0% |
| Swedish | 124 | 1.1% |
| Swiss | 2 | 0.0% |
| Thai | 79 | 0.7% |
| Ukrainian | 9 | 0.1% |
| Welsh | 38 | 0.3% | View All 40 Rows |
Immigrants in Wabash County
The most numerous immigrant groups reported in Wabash County came from Asia (152 | 1.3%), Eastern Asia (77 | 0.7%), India (75 | 0.7%), South Central Asia (75 | 0.7%), and Korea (69 | 0.6%), together accounting for 4.0% of all Wabash County residents.
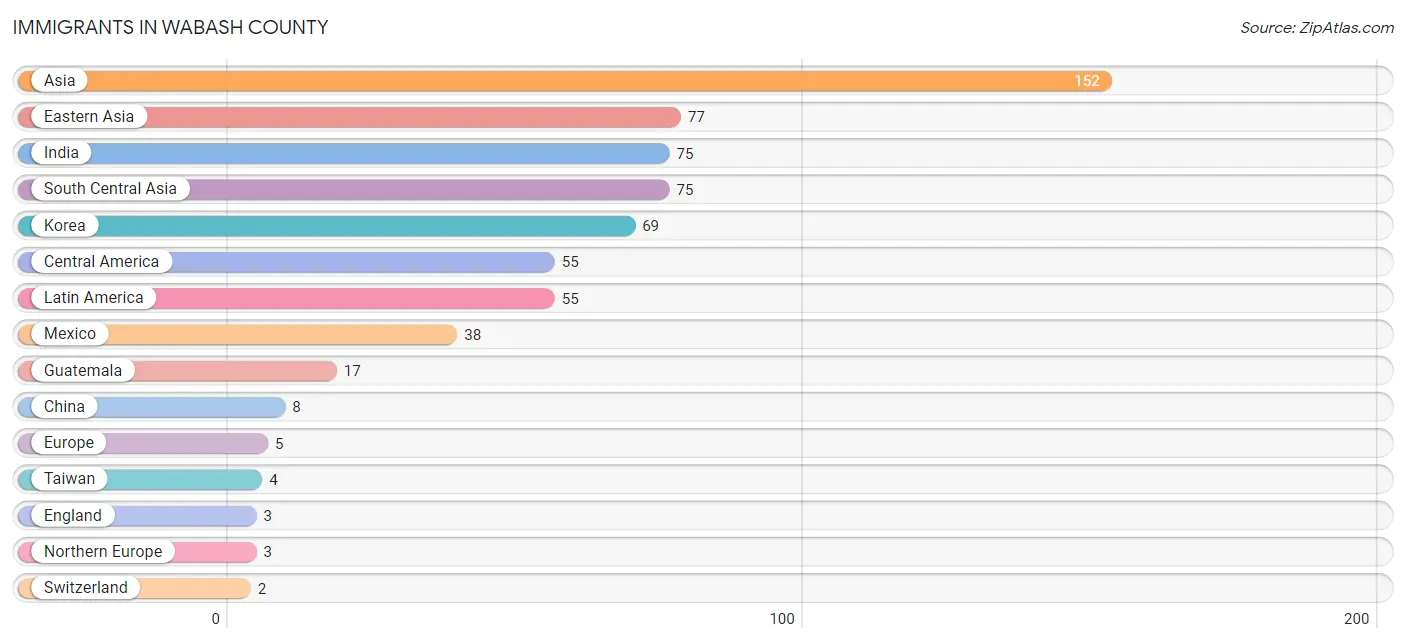
| Immigration Origin | # Population | % Population |
| Asia | 152 | 1.3% |
| Central America | 55 | 0.5% |
| China | 8 | 0.1% |
| Eastern Asia | 77 | 0.7% |
| England | 3 | 0.0% |
| Europe | 5 | 0.0% |
| Guatemala | 17 | 0.2% |
| India | 75 | 0.7% |
| Korea | 69 | 0.6% |
| Latin America | 55 | 0.5% |
| Mexico | 38 | 0.3% |
| Northern Europe | 3 | 0.0% |
| South Central Asia | 75 | 0.7% |
| Switzerland | 2 | 0.0% |
| Taiwan | 4 | 0.0% |
| Western Europe | 2 | 0.0% | View All 16 Rows |
Sex and Age in Wabash County
Sex and Age in Wabash County
The most populous age groups in Wabash County are 55 to 59 Years (418 | 7.6%) for men and 55 to 59 Years (426 | 7.3%) for women.
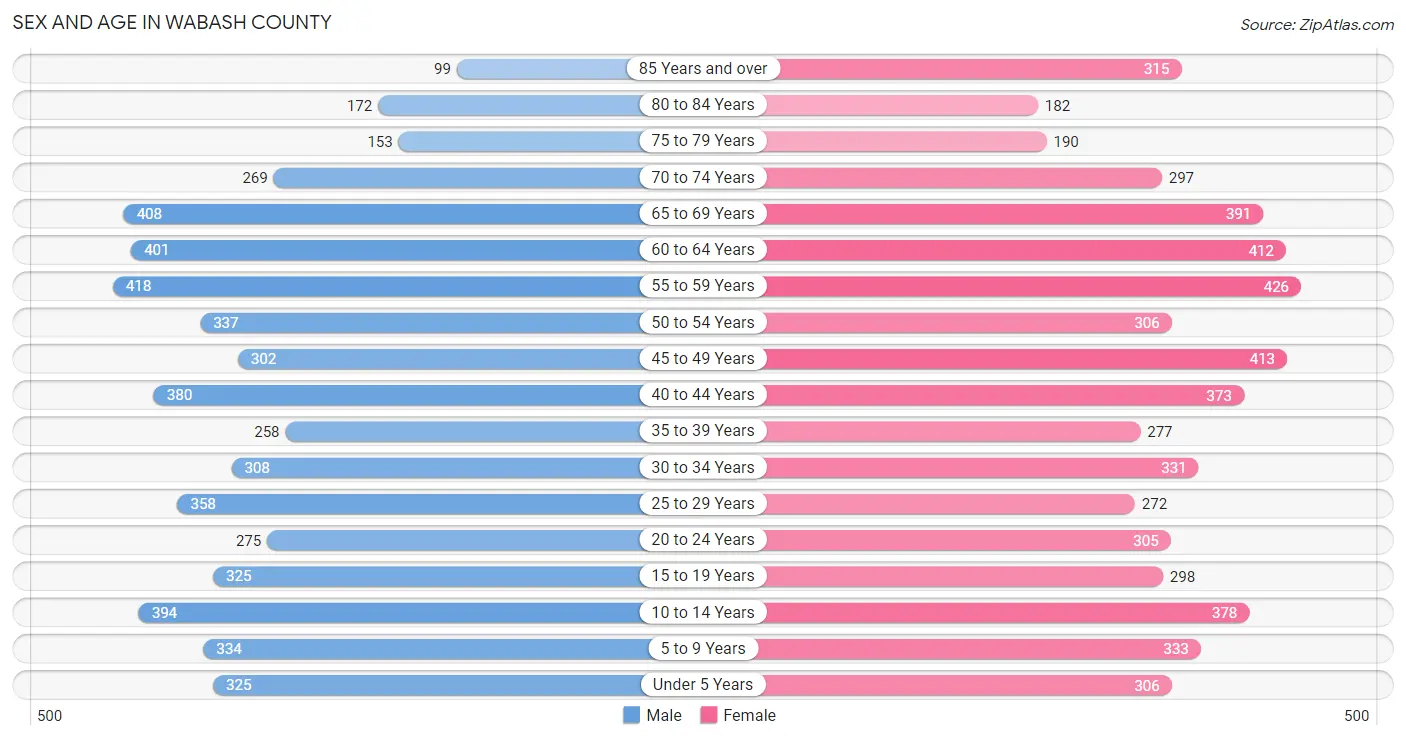
| Age Bracket | Male | Female |
| Under 5 Years | 325 (5.9%) | 306 (5.3%) |
| 5 to 9 Years | 334 (6.1%) | 333 (5.7%) |
| 10 to 14 Years | 394 (7.1%) | 378 (6.5%) |
| 15 to 19 Years | 325 (5.9%) | 298 (5.1%) |
| 20 to 24 Years | 275 (5.0%) | 305 (5.2%) |
| 25 to 29 Years | 358 (6.5%) | 272 (4.7%) |
| 30 to 34 Years | 308 (5.6%) | 331 (5.7%) |
| 35 to 39 Years | 258 (4.7%) | 277 (4.8%) |
| 40 to 44 Years | 380 (6.9%) | 373 (6.4%) |
| 45 to 49 Years | 302 (5.5%) | 413 (7.1%) |
| 50 to 54 Years | 337 (6.1%) | 306 (5.3%) |
| 55 to 59 Years | 418 (7.6%) | 426 (7.3%) |
| 60 to 64 Years | 401 (7.3%) | 412 (7.1%) |
| 65 to 69 Years | 408 (7.4%) | 391 (6.7%) |
| 70 to 74 Years | 269 (4.9%) | 297 (5.1%) |
| 75 to 79 Years | 153 (2.8%) | 190 (3.3%) |
| 80 to 84 Years | 172 (3.1%) | 182 (3.1%) |
| 85 Years and over | 99 (1.8%) | 315 (5.4%) |
| Total | 5,516 (100.0%) | 5,805 (100.0%) |
Families and Households in Wabash County
Median Family Size in Wabash County
The median family size in Wabash County is 2.88 persons per family, with married-couple families (2,301 | 74.3%) accounting for the largest median family size of 2.96 persons per family. On the other hand, single male/father families (188 | 6.1%) represent the smallest median family size with 2.48 persons per family.
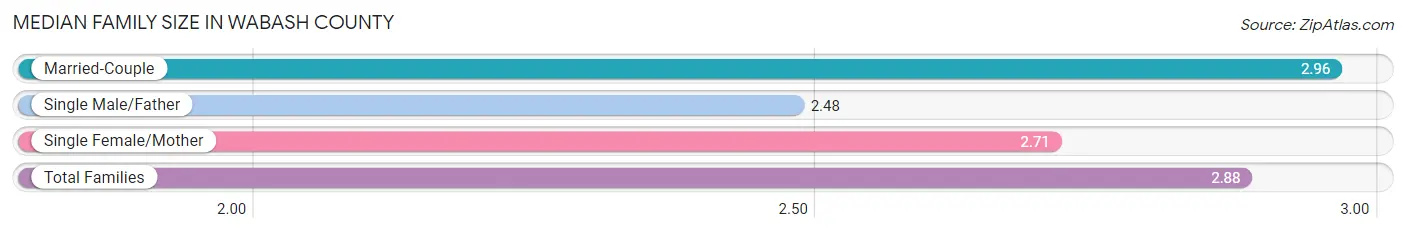
| Family Type | # Families | Family Size |
| Married-Couple | 2,301 (74.3%) | 2.96 |
| Single Male/Father | 188 (6.1%) | 2.48 |
| Single Female/Mother | 610 (19.7%) | 2.71 |
| Total Families | 3,099 (100.0%) | 2.88 |
Median Household Size in Wabash County
The median household size in Wabash County is 2.34 persons per household, with single male/father households (188 | 3.9%) accounting for the largest median household size of 3.23 persons per household. non-family households (1,679 | 35.1%) represent the smallest median household size with 1.15 persons per household.
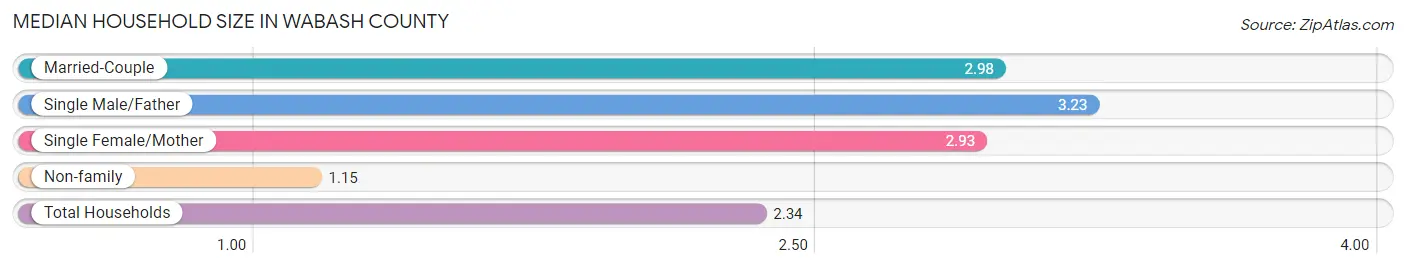
| Household Type | # Households | Household Size |
| Married-Couple | 2,301 (48.2%) | 2.98 |
| Single Male/Father | 188 (3.9%) | 3.23 |
| Single Female/Mother | 610 (12.8%) | 2.93 |
| Non-family | 1,679 (35.1%) | 1.15 |
| Total Households | 4,778 (100.0%) | 2.34 |
Household Size by Marriage Status in Wabash County
Out of a total of 4,778 households in Wabash County, 3,099 (64.9%) are family households, while 1,679 (35.1%) are nonfamily households. The most numerous type of family households are 2-person households, comprising 1,562, and the most common type of nonfamily households are 1-person households, comprising 1,486.
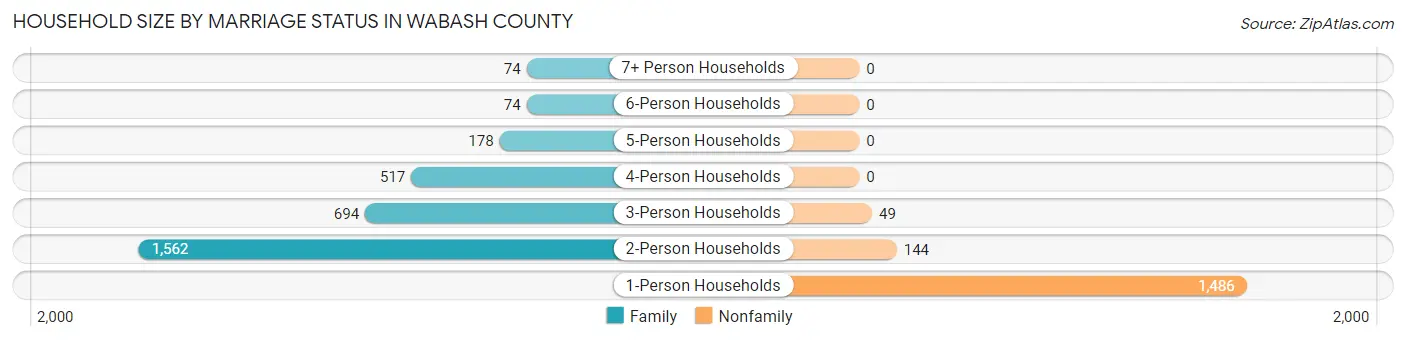
| Household Size | Family Households | Nonfamily Households |
| 1-Person Households | - | 1,486 (31.1%) |
| 2-Person Households | 1,562 (32.7%) | 144 (3.0%) |
| 3-Person Households | 694 (14.5%) | 49 (1.0%) |
| 4-Person Households | 517 (10.8%) | 0 (0.0%) |
| 5-Person Households | 178 (3.7%) | 0 (0.0%) |
| 6-Person Households | 74 (1.5%) | 0 (0.0%) |
| 7+ Person Households | 74 (1.5%) | 0 (0.0%) |
| Total | 3,099 (64.9%) | 1,679 (35.1%) |
Female Fertility in Wabash County
Fertility by Age in Wabash County
Average fertility rate in Wabash County is 95.0 births per 1,000 women. Women in the age bracket of 20 to 34 years have the highest fertility rate with 174.0 births per 1,000 women. Women in the age bracket of 20 to 34 years acount for 71.8% of all women with births.
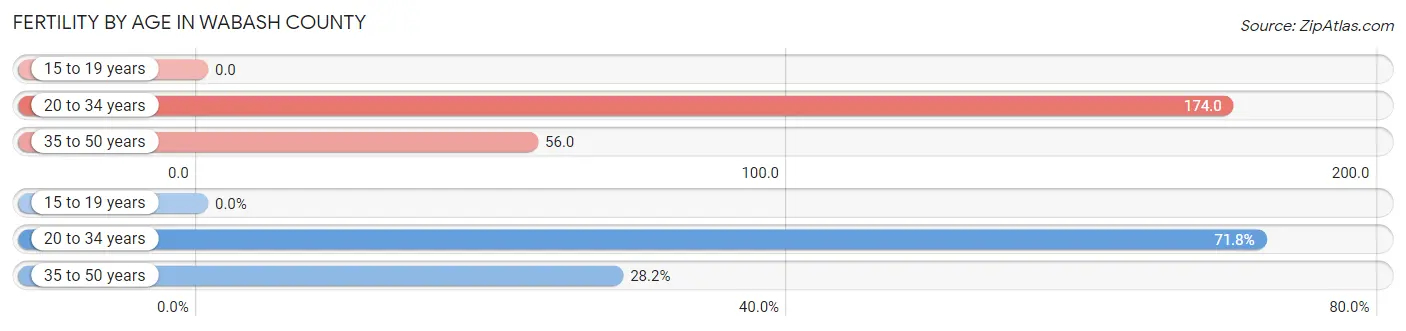
| Age Bracket | Women with Births | Births / 1,000 Women |
| 15 to 19 years | 0 (0.0%) | 0.0 |
| 20 to 34 years | 158 (71.8%) | 174.0 |
| 35 to 50 years | 62 (28.2%) | 56.0 |
| Total | 220 (100.0%) | 95.0 |
Fertility by Age by Marriage Status in Wabash County
62.3% of women with births (220) in Wabash County are married. The highest percentage of unmarried women with births falls into 35 to 50 years age bracket with 48.4% of them unmarried at the time of birth, while the lowest percentage of unmarried women with births belong to 20 to 34 years age bracket with 33.5% of them unmarried.
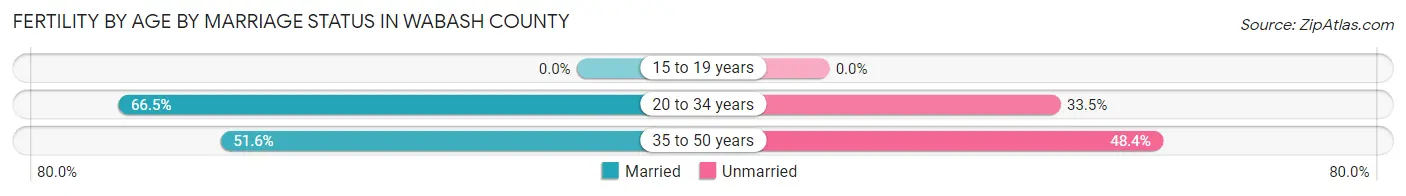
| Age Bracket | Married | Unmarried |
| 15 to 19 years | 0 (0.0%) | 0 (0.0%) |
| 20 to 34 years | 105 (66.5%) | 53 (33.5%) |
| 35 to 50 years | 32 (51.6%) | 30 (48.4%) |
| Total | 137 (62.3%) | 83 (37.7%) |
Fertility by Education in Wabash County
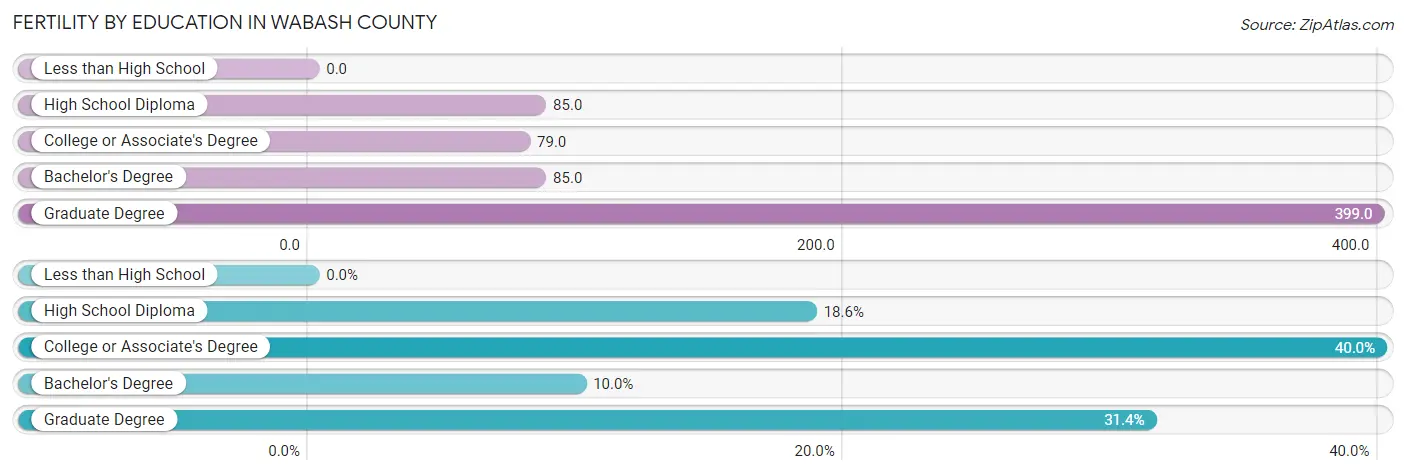
| Educational Attainment | Women with Births | Births / 1,000 Women |
| Less than High School | 0 (0.0%) | 0.0 |
| High School Diploma | 41 (18.6%) | 85.0 |
| College or Associate's Degree | 88 (40.0%) | 79.0 |
| Bachelor's Degree | 22 (10.0%) | 85.0 |
| Graduate Degree | 69 (31.4%) | 399.0 |
| Total | 220 (100.0%) | 95.0 |
Fertility by Education by Marriage Status in Wabash County
37.7% of women with births in Wabash County are unmarried. Women with the educational attainment of bachelor's degree are most likely to be married with 100.0% of them married at childbirth, while women with the educational attainment of high school diploma are least likely to be married with 100.0% of them unmarried at childbirth.
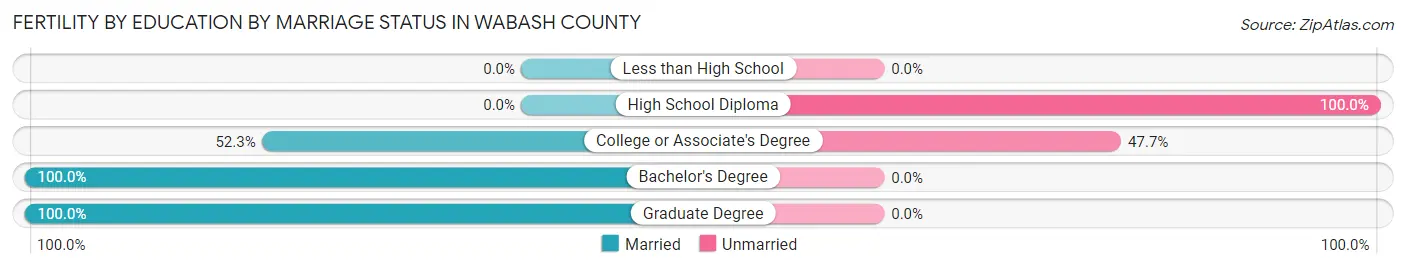
| Educational Attainment | Married | Unmarried |
| Less than High School | 0 (0.0%) | 0 (0.0%) |
| High School Diploma | 0 (0.0%) | 41 (100.0%) |
| College or Associate's Degree | 46 (52.3%) | 42 (47.7%) |
| Bachelor's Degree | 22 (100.0%) | 0 (0.0%) |
| Graduate Degree | 69 (100.0%) | 0 (0.0%) |
| Total | 137 (62.3%) | 83 (37.7%) |
Employment Characteristics in Wabash County
Employment by Class of Employer in Wabash County
Among the 4,981 employed individuals in Wabash County, private company employees (3,595 | 72.2%), local government employees (359 | 7.2%), and not-for-profit organizations (325 | 6.5%) make up the most common classes of employment.
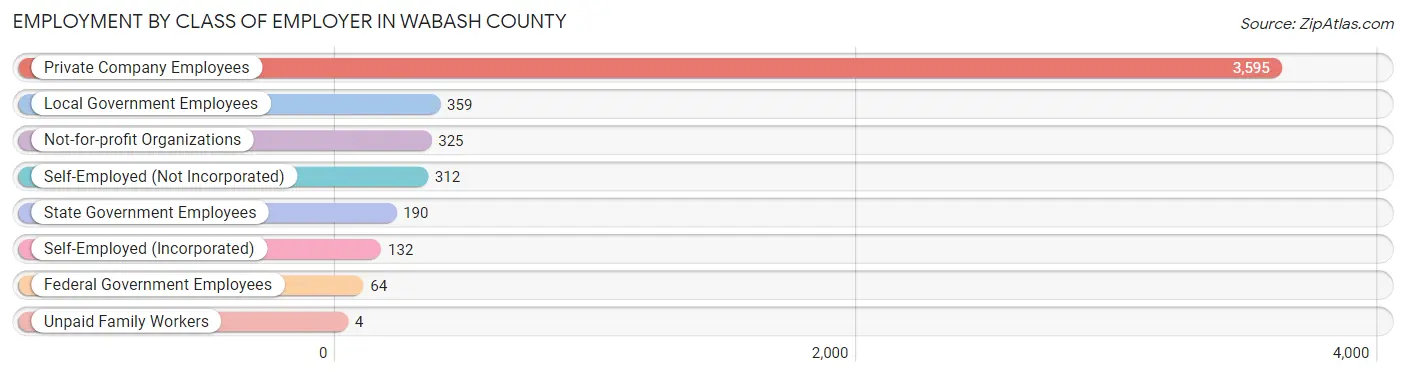
| Employer Class | # Employees | % Employees |
| Private Company Employees | 3,595 | 72.2% |
| Self-Employed (Incorporated) | 132 | 2.6% |
| Self-Employed (Not Incorporated) | 312 | 6.3% |
| Not-for-profit Organizations | 325 | 6.5% |
| Local Government Employees | 359 | 7.2% |
| State Government Employees | 190 | 3.8% |
| Federal Government Employees | 64 | 1.3% |
| Unpaid Family Workers | 4 | 0.1% |
| Total | 4,981 | 100.0% |
Employment Status by Age in Wabash County
According to the labor force statistics for Wabash County, out of the total population over 16 years of age (9,098), 58.4% or 5,313 individuals are in the labor force, with 4.4% or 234 of them unemployed. The age group with the highest labor force participation rate is 25 to 29 years, with 86.7% or 546 individuals in the labor force. Within the labor force, the 20 to 24 years age range has the highest percentage of unemployed individuals, with 13.7% or 68 of them being unemployed.
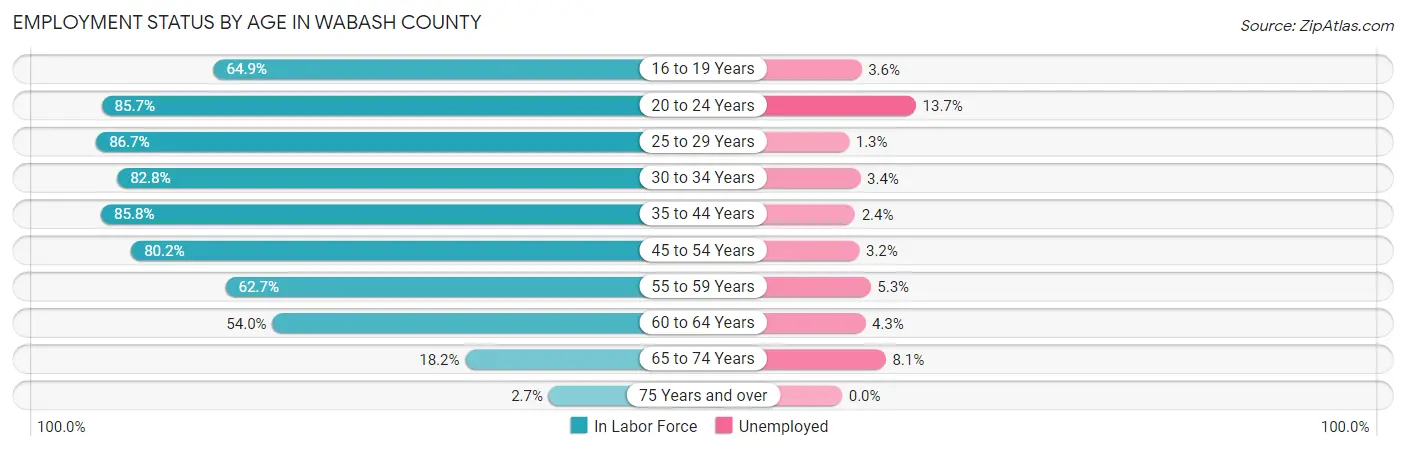
| Age Bracket | In Labor Force | Unemployed |
| 16 to 19 Years | 305 (64.9%) | 11 (3.6%) |
| 20 to 24 Years | 497 (85.7%) | 68 (13.7%) |
| 25 to 29 Years | 546 (86.7%) | 7 (1.3%) |
| 30 to 34 Years | 529 (82.8%) | 18 (3.4%) |
| 35 to 44 Years | 1,105 (85.8%) | 27 (2.4%) |
| 45 to 54 Years | 1,089 (80.2%) | 35 (3.2%) |
| 55 to 59 Years | 529 (62.7%) | 28 (5.3%) |
| 60 to 64 Years | 439 (54.0%) | 19 (4.3%) |
| 65 to 74 Years | 248 (18.2%) | 20 (8.1%) |
| 75 Years and over | 30 (2.7%) | 0 (0.0%) |
| Total | 5,313 (58.4%) | 234 (4.4%) |
Employment Status by Educational Attainment in Wabash County
According to labor force statistics for Wabash County, 76.0% of individuals (4,235) out of the total population between 25 and 64 years of age (5,572) are in the labor force, with 3.2% or 136 of them being unemployed. The group with the highest labor force participation rate are those with the educational attainment of bachelor's degree or higher, with 82.0% or 932 individuals in the labor force. Within the labor force, individuals with less than high school education have the highest percentage of unemployment, with 7.7% or 14 of them being unemployed.
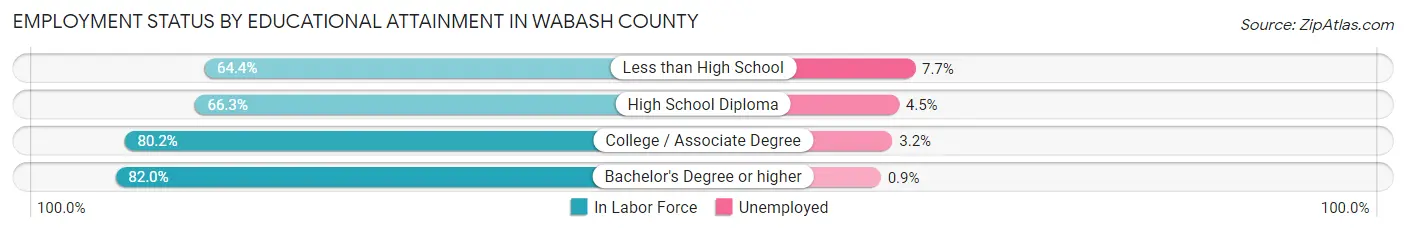
| Educational Attainment | In Labor Force | Unemployed |
| Less than High School | 183 (64.4%) | 22 (7.7%) |
| High School Diploma | 998 (66.3%) | 68 (4.5%) |
| College / Associate Degree | 2,123 (80.2%) | 85 (3.2%) |
| Bachelor's Degree or higher | 932 (82.0%) | 10 (0.9%) |
| Total | 4,235 (76.0%) | 178 (3.2%) |
Employment Occupations by Sex in Wabash County
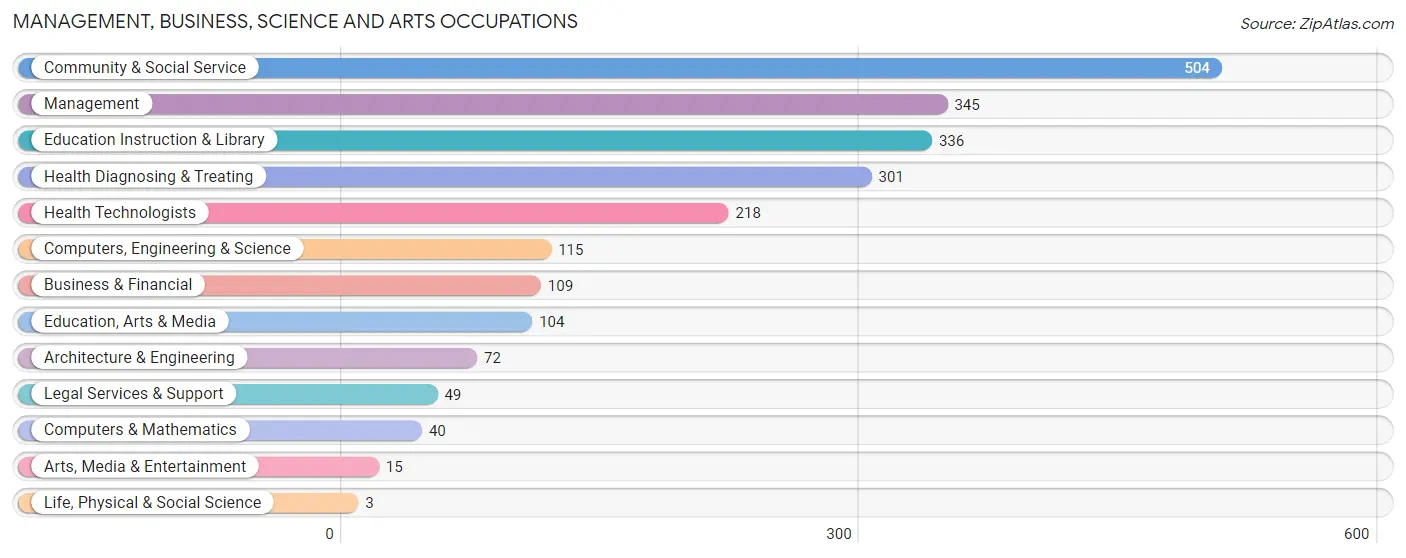
Management, Business, Science and Arts Occupations
The most common Management, Business, Science and Arts occupations in Wabash County are Community & Social Service (504 | 9.9%), Management (345 | 6.8%), Education Instruction & Library (336 | 6.6%), Health Diagnosing & Treating (301 | 5.9%), and Health Technologists (218 | 4.3%).
Management, Business, Science and Arts Occupations by Sex
Within the Management, Business, Science and Arts occupations in Wabash County, the most male-oriented occupations are Arts, Media & Entertainment (100.0%), Architecture & Engineering (79.2%), and Education, Arts & Media (72.1%), while the most female-oriented occupations are Life, Physical & Social Science (100.0%), Education Instruction & Library (85.7%), and Health Diagnosing & Treating (77.7%).
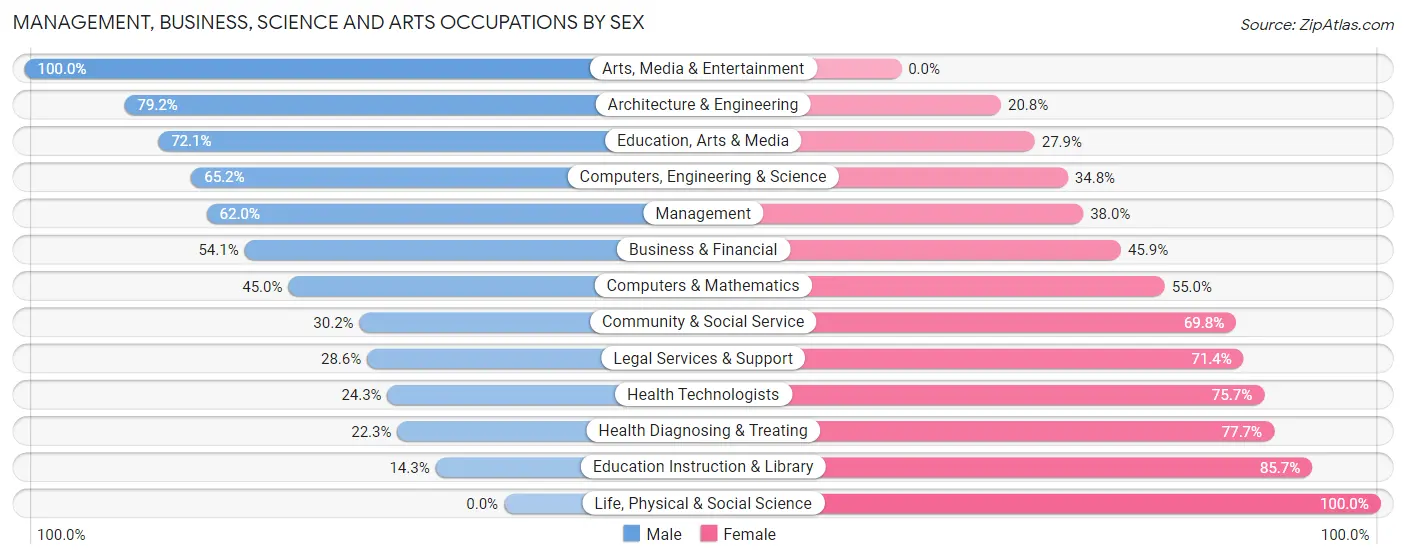
| Occupation | Male | Female |
| Management | 214 (62.0%) | 131 (38.0%) |
| Business & Financial | 59 (54.1%) | 50 (45.9%) |
| Computers, Engineering & Science | 75 (65.2%) | 40 (34.8%) |
| Computers & Mathematics | 18 (45.0%) | 22 (55.0%) |
| Architecture & Engineering | 57 (79.2%) | 15 (20.8%) |
| Life, Physical & Social Science | 0 (0.0%) | 3 (100.0%) |
| Community & Social Service | 152 (30.2%) | 352 (69.8%) |
| Education, Arts & Media | 75 (72.1%) | 29 (27.9%) |
| Legal Services & Support | 14 (28.6%) | 35 (71.4%) |
| Education Instruction & Library | 48 (14.3%) | 288 (85.7%) |
| Arts, Media & Entertainment | 15 (100.0%) | 0 (0.0%) |
| Health Diagnosing & Treating | 67 (22.3%) | 234 (77.7%) |
| Health Technologists | 53 (24.3%) | 165 (75.7%) |
| Total (Category) | 567 (41.3%) | 807 (58.7%) |
| Total (Overall) | 2,597 (51.1%) | 2,487 (48.9%) |
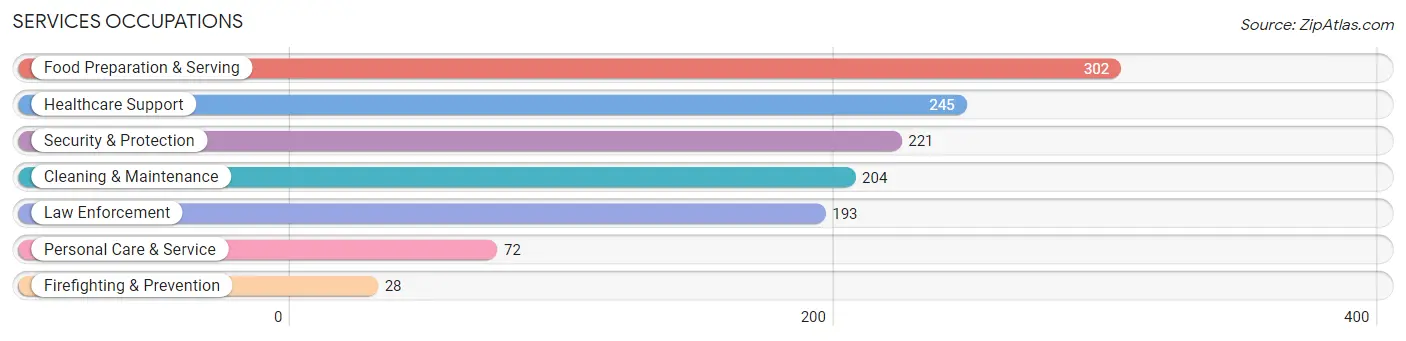
Services Occupations
The most common Services occupations in Wabash County are Food Preparation & Serving (302 | 5.9%), Healthcare Support (245 | 4.8%), Security & Protection (221 | 4.3%), Cleaning & Maintenance (204 | 4.0%), and Law Enforcement (193 | 3.8%).
Services Occupations by Sex
Within the Services occupations in Wabash County, the most male-oriented occupations are Cleaning & Maintenance (74.5%), Law Enforcement (52.8%), and Security & Protection (51.1%), while the most female-oriented occupations are Personal Care & Service (93.1%), Healthcare Support (75.5%), and Firefighting & Prevention (60.7%).
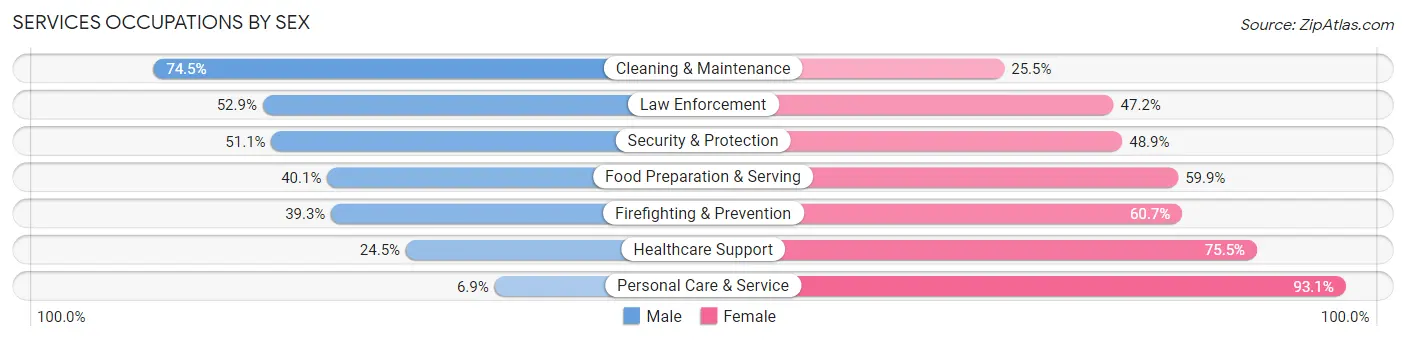
| Occupation | Male | Female |
| Healthcare Support | 60 (24.5%) | 185 (75.5%) |
| Security & Protection | 113 (51.1%) | 108 (48.9%) |
| Firefighting & Prevention | 11 (39.3%) | 17 (60.7%) |
| Law Enforcement | 102 (52.8%) | 91 (47.1%) |
| Food Preparation & Serving | 121 (40.1%) | 181 (59.9%) |
| Cleaning & Maintenance | 152 (74.5%) | 52 (25.5%) |
| Personal Care & Service | 5 (6.9%) | 67 (93.1%) |
| Total (Category) | 451 (43.2%) | 593 (56.8%) |
| Total (Overall) | 2,597 (51.1%) | 2,487 (48.9%) |
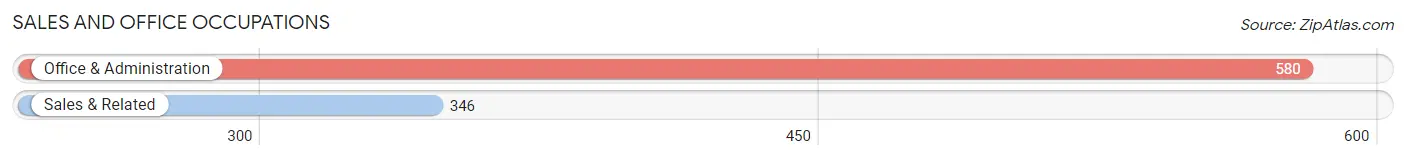
Sales and Office Occupations
The most common Sales and Office occupations in Wabash County are Office & Administration (580 | 11.4%), and Sales & Related (346 | 6.8%).
Sales and Office Occupations by Sex
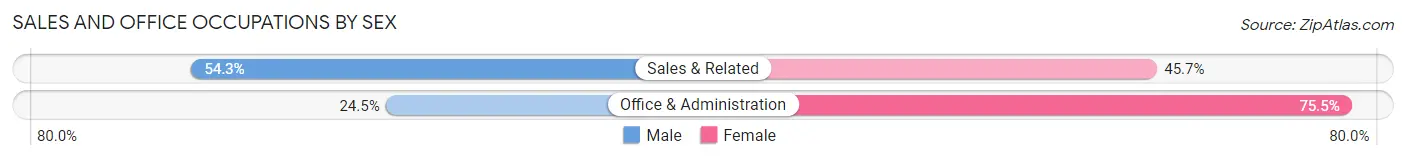
| Occupation | Male | Female |
| Sales & Related | 188 (54.3%) | 158 (45.7%) |
| Office & Administration | 142 (24.5%) | 438 (75.5%) |
| Total (Category) | 330 (35.6%) | 596 (64.4%) |
| Total (Overall) | 2,597 (51.1%) | 2,487 (48.9%) |
Natural Resources, Construction and Maintenance Occupations
The most common Natural Resources, Construction and Maintenance occupations in Wabash County are Construction & Extraction (339 | 6.7%), Installation, Maintenance & Repair (188 | 3.7%), and Farming, Fishing & Forestry (73 | 1.4%).
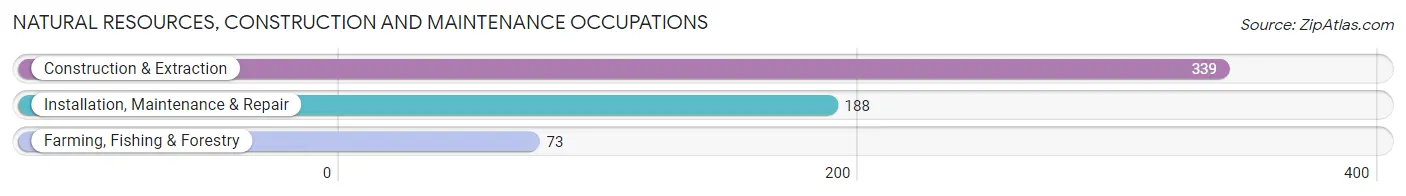
Natural Resources, Construction and Maintenance Occupations by Sex
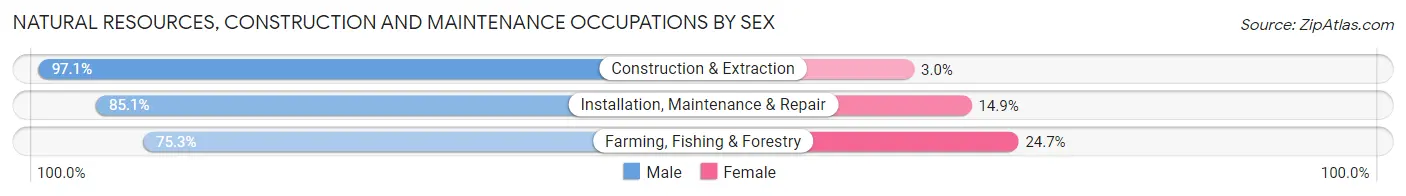
| Occupation | Male | Female |
| Farming, Fishing & Forestry | 55 (75.3%) | 18 (24.7%) |
| Construction & Extraction | 329 (97.1%) | 10 (2.9%) |
| Installation, Maintenance & Repair | 160 (85.1%) | 28 (14.9%) |
| Total (Category) | 544 (90.7%) | 56 (9.3%) |
| Total (Overall) | 2,597 (51.1%) | 2,487 (48.9%) |
Production, Transportation and Moving Occupations
The most common Production, Transportation and Moving occupations in Wabash County are Production (515 | 10.1%), Material Moving (384 | 7.5%), and Transportation (241 | 4.7%).
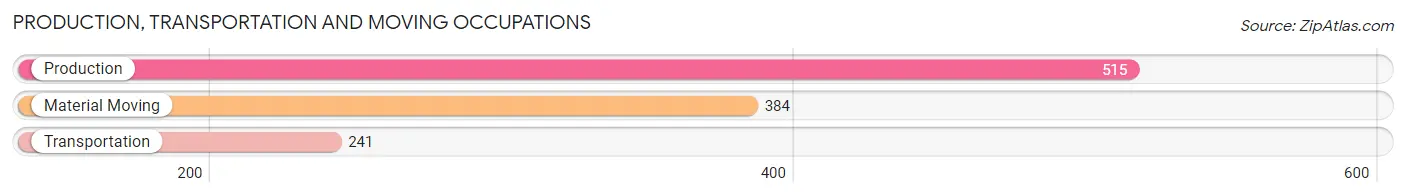
Production, Transportation and Moving Occupations by Sex
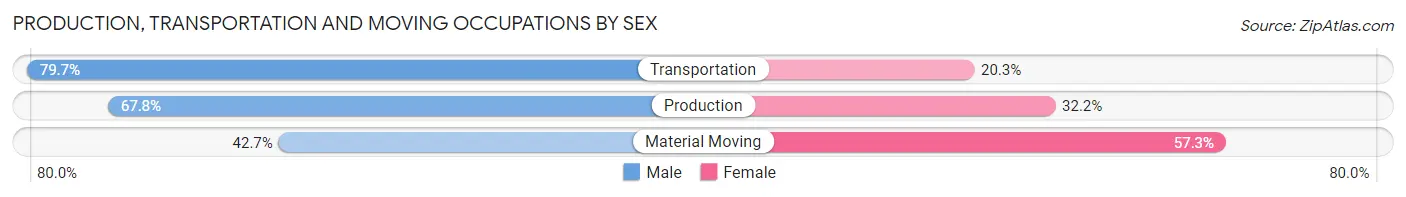
| Occupation | Male | Female |
| Production | 349 (67.8%) | 166 (32.2%) |
| Transportation | 192 (79.7%) | 49 (20.3%) |
| Material Moving | 164 (42.7%) | 220 (57.3%) |
| Total (Category) | 705 (61.8%) | 435 (38.2%) |
| Total (Overall) | 2,597 (51.1%) | 2,487 (48.9%) |
Employment Industries by Sex in Wabash County
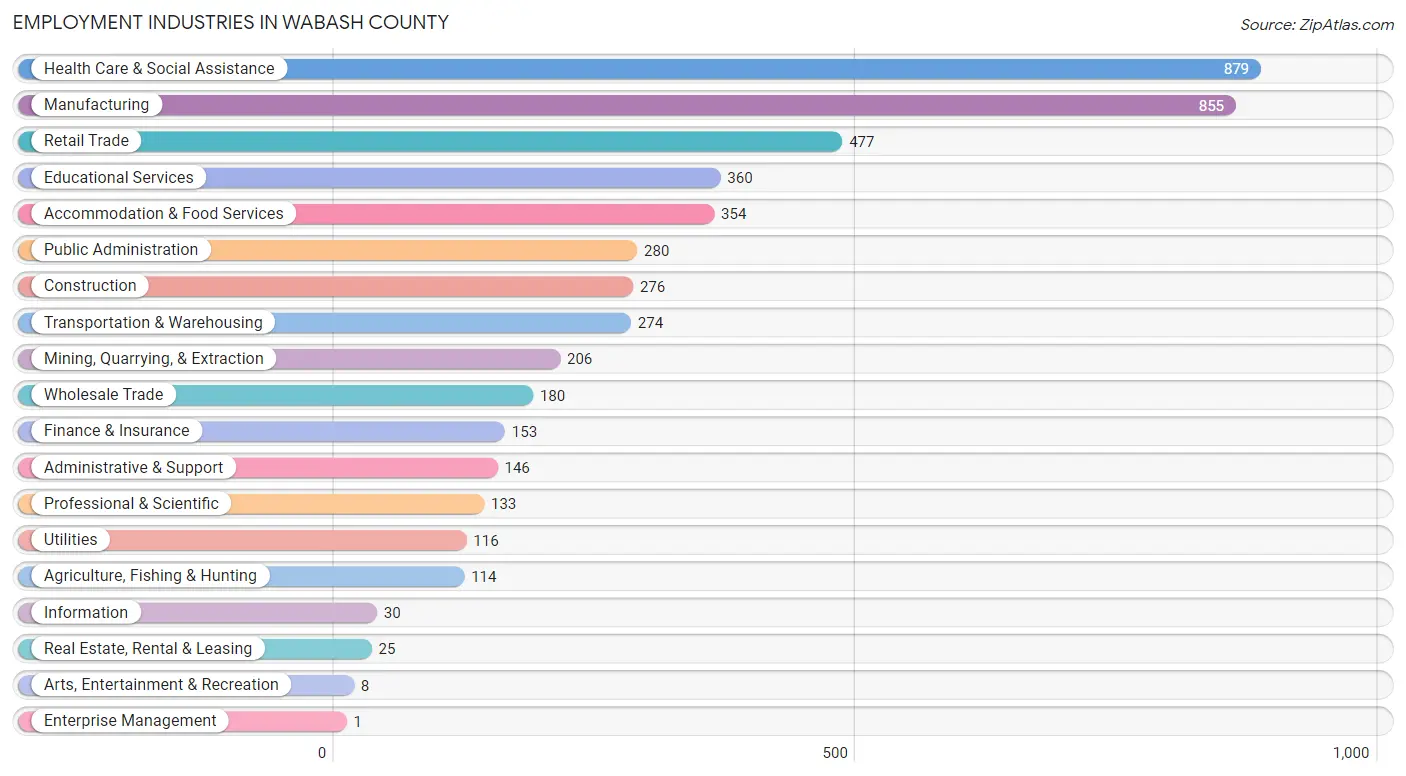
Employment Industries in Wabash County
The major employment industries in Wabash County include Health Care & Social Assistance (879 | 17.3%), Manufacturing (855 | 16.8%), Retail Trade (477 | 9.4%), Educational Services (360 | 7.1%), and Accommodation & Food Services (354 | 7.0%).
Employment Industries by Sex in Wabash County
The Wabash County industries that see more men than women are Real Estate, Rental & Leasing (100.0%), Enterprise Management (100.0%), and Arts, Entertainment & Recreation (100.0%), whereas the industries that tend to have a higher number of women are Information (96.7%), Finance & Insurance (88.2%), and Educational Services (80.0%).
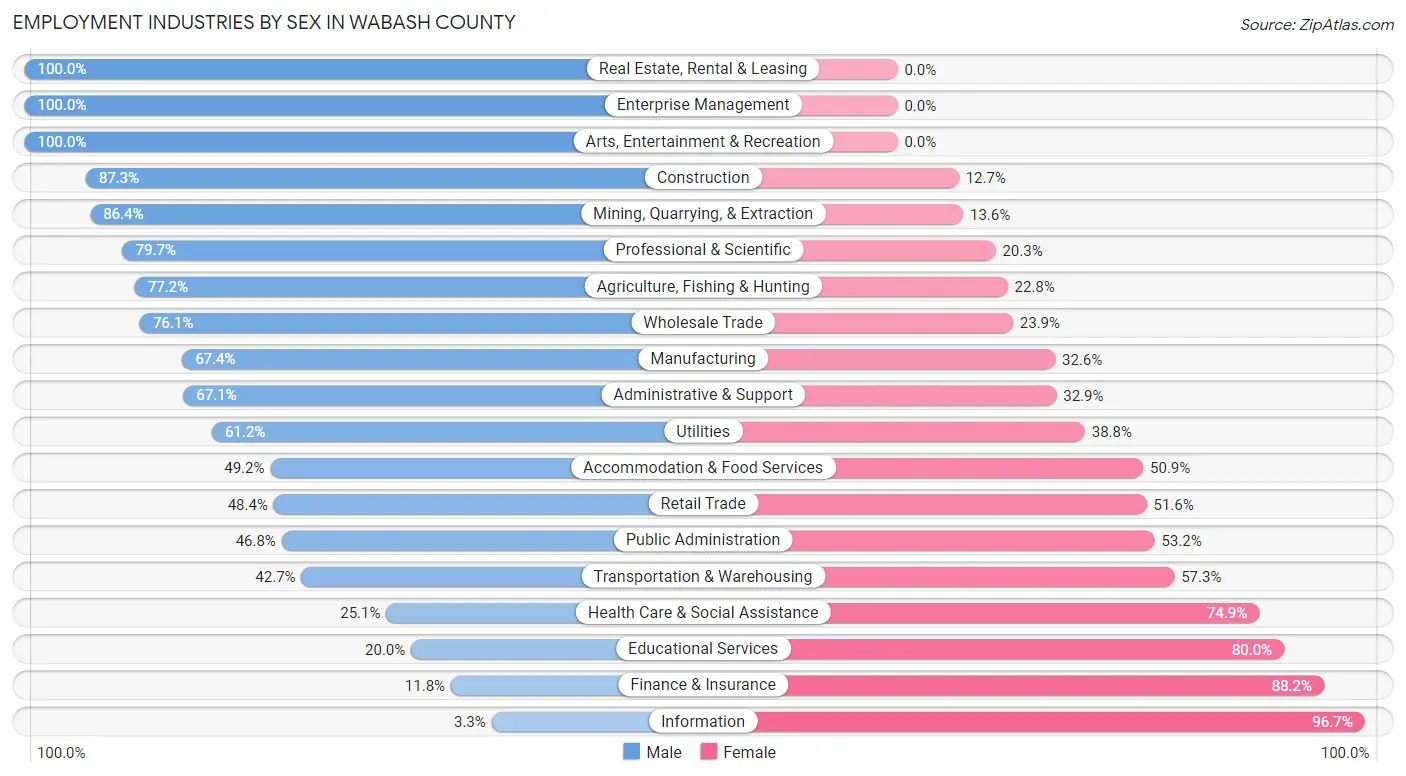
| Industry | Male | Female |
| Agriculture, Fishing & Hunting | 88 (77.2%) | 26 (22.8%) |
| Mining, Quarrying, & Extraction | 178 (86.4%) | 28 (13.6%) |
| Construction | 241 (87.3%) | 35 (12.7%) |
| Manufacturing | 576 (67.4%) | 279 (32.6%) |
| Wholesale Trade | 137 (76.1%) | 43 (23.9%) |
| Retail Trade | 231 (48.4%) | 246 (51.6%) |
| Transportation & Warehousing | 117 (42.7%) | 157 (57.3%) |
| Utilities | 71 (61.2%) | 45 (38.8%) |
| Information | 1 (3.3%) | 29 (96.7%) |
| Finance & Insurance | 18 (11.8%) | 135 (88.2%) |
| Real Estate, Rental & Leasing | 25 (100.0%) | 0 (0.0%) |
| Professional & Scientific | 106 (79.7%) | 27 (20.3%) |
| Enterprise Management | 1 (100.0%) | 0 (0.0%) |
| Administrative & Support | 98 (67.1%) | 48 (32.9%) |
| Educational Services | 72 (20.0%) | 288 (80.0%) |
| Health Care & Social Assistance | 221 (25.1%) | 658 (74.9%) |
| Arts, Entertainment & Recreation | 8 (100.0%) | 0 (0.0%) |
| Accommodation & Food Services | 174 (49.1%) | 180 (50.8%) |
| Public Administration | 131 (46.8%) | 149 (53.2%) |
| Total | 2,597 (51.1%) | 2,487 (48.9%) |
Education in Wabash County
School Enrollment in Wabash County
The most common levels of schooling among the 2,531 students in Wabash County are middle school (635 | 25.1%), high school (528 | 20.9%), and college / undergraduate (508 | 20.1%).
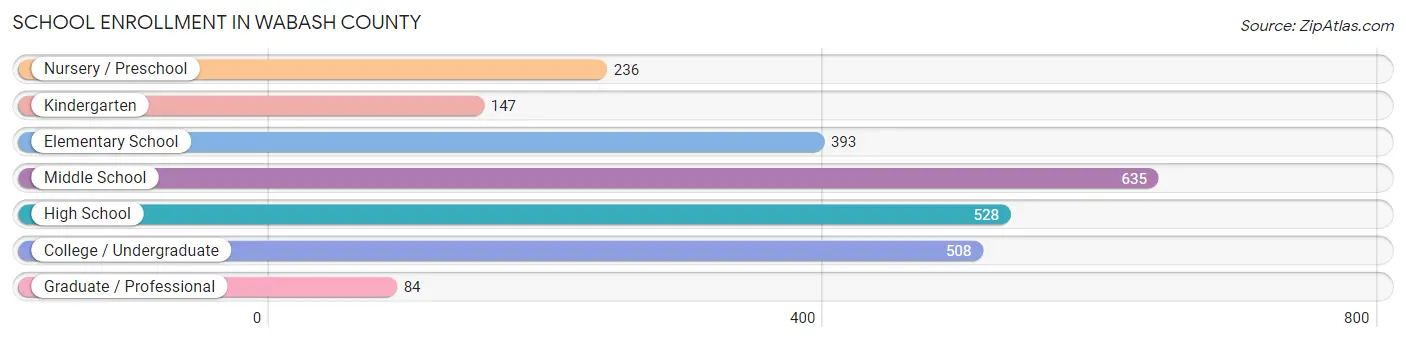
| School Level | # Students | % Students |
| Nursery / Preschool | 236 | 9.3% |
| Kindergarten | 147 | 5.8% |
| Elementary School | 393 | 15.5% |
| Middle School | 635 | 25.1% |
| High School | 528 | 20.9% |
| College / Undergraduate | 508 | 20.1% |
| Graduate / Professional | 84 | 3.3% |
| Total | 2,531 | 100.0% |
School Enrollment by Age by Funding Source in Wabash County
Out of a total of 2,531 students who are enrolled in schools in Wabash County, 362 (14.3%) attend a private institution, while the remaining 2,169 (85.7%) are enrolled in public schools. The age group of 20 to 24 year olds has the highest likelihood of being enrolled in private schools, with 113 (55.9% in the age bracket) enrolled. Conversely, the age group of 35 years and over has the lowest likelihood of being enrolled in a private school, with 181 (97.8% in the age bracket) attending a public institution.
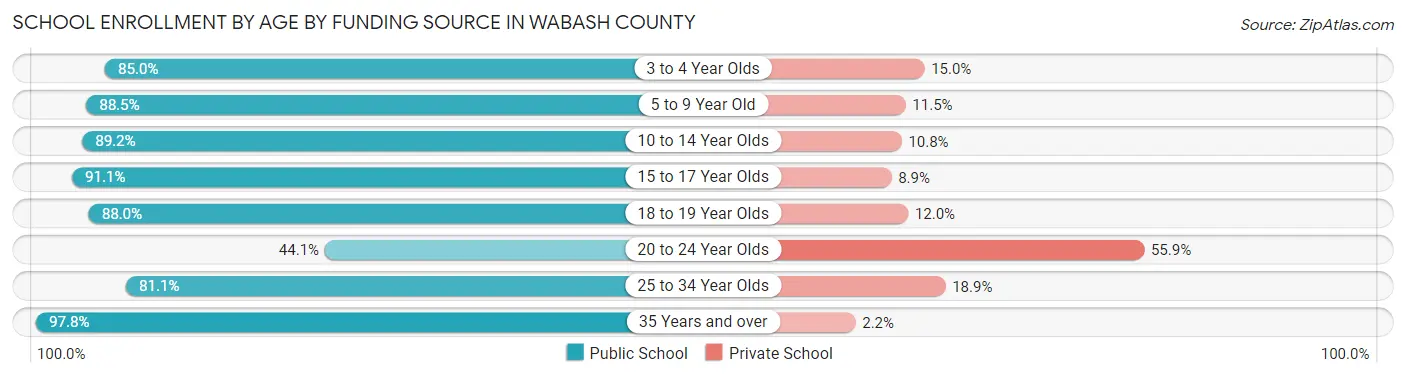
| Age Bracket | Public School | Private School |
| 3 to 4 Year Olds | 136 (85.0%) | 24 (15.0%) |
| 5 to 9 Year Old | 508 (88.5%) | 66 (11.5%) |
| 10 to 14 Year Olds | 680 (89.2%) | 82 (10.8%) |
| 15 to 17 Year Olds | 360 (91.1%) | 35 (8.9%) |
| 18 to 19 Year Olds | 125 (88.0%) | 17 (12.0%) |
| 20 to 24 Year Olds | 89 (44.1%) | 113 (55.9%) |
| 25 to 34 Year Olds | 90 (81.1%) | 21 (18.9%) |
| 35 Years and over | 181 (97.8%) | 4 (2.2%) |
| Total | 2,169 (85.7%) | 362 (14.3%) |
Educational Attainment by Field of Study in Wabash County
Education (374 | 22.7%), science & technology (295 | 17.9%), business (245 | 14.8%), bio, nature & agricultural (113 | 6.9%), and arts & humanities (110 | 6.7%) are the most common fields of study among 1,650 individuals in Wabash County who have obtained a bachelor's degree or higher.
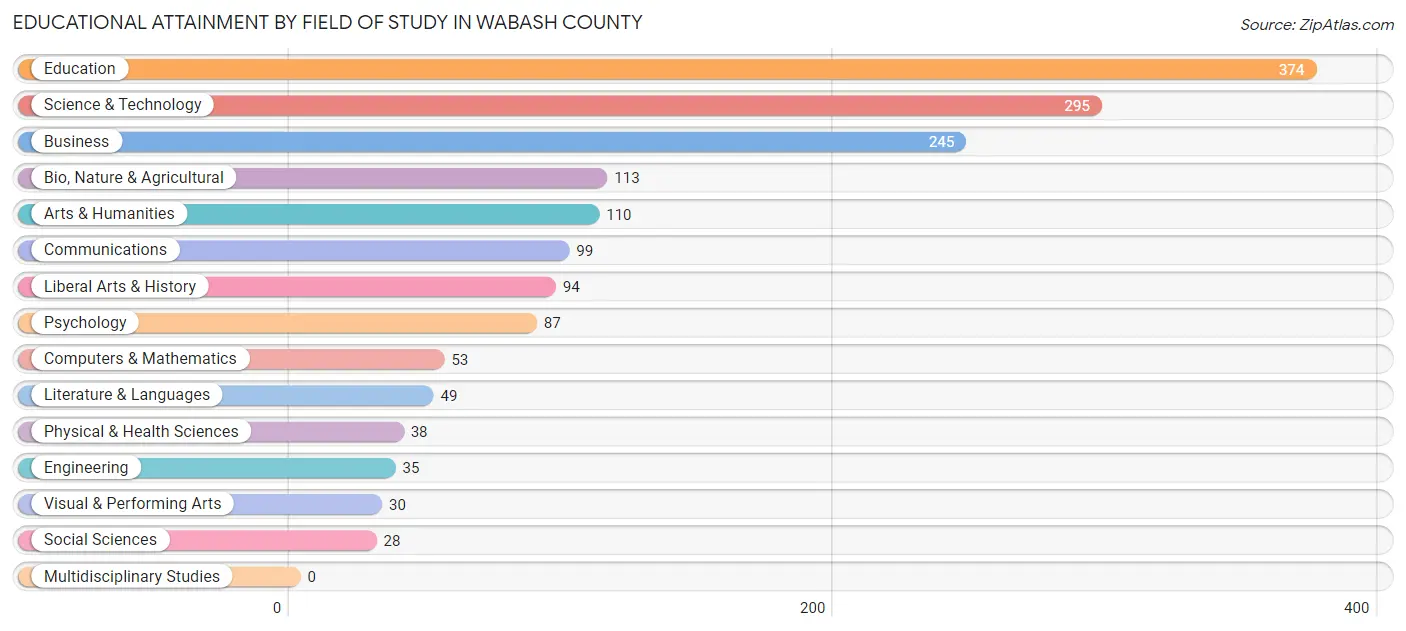
| Field of Study | # Graduates | % Graduates |
| Computers & Mathematics | 53 | 3.2% |
| Bio, Nature & Agricultural | 113 | 6.9% |
| Physical & Health Sciences | 38 | 2.3% |
| Psychology | 87 | 5.3% |
| Social Sciences | 28 | 1.7% |
| Engineering | 35 | 2.1% |
| Multidisciplinary Studies | 0 | 0.0% |
| Science & Technology | 295 | 17.9% |
| Business | 245 | 14.8% |
| Education | 374 | 22.7% |
| Literature & Languages | 49 | 3.0% |
| Liberal Arts & History | 94 | 5.7% |
| Visual & Performing Arts | 30 | 1.8% |
| Communications | 99 | 6.0% |
| Arts & Humanities | 110 | 6.7% |
| Total | 1,650 | 100.0% |
Transportation & Commute in Wabash County
Vehicle Availability by Sex in Wabash County
The most prevalent vehicle ownership categories in Wabash County are males with 2 vehicles (1,067, accounting for 41.7%) and females with 2 vehicles (1,024, making up 44.2%).
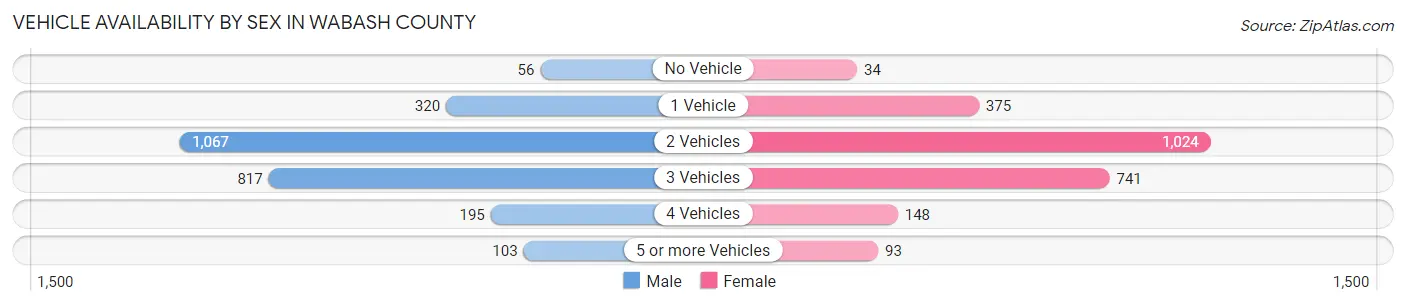
| Vehicles Available | Male | Female |
| No Vehicle | 56 (2.2%) | 34 (1.4%) |
| 1 Vehicle | 320 (12.5%) | 375 (15.5%) |
| 2 Vehicles | 1,067 (41.7%) | 1,024 (42.4%) |
| 3 Vehicles | 817 (31.9%) | 741 (30.7%) |
| 4 Vehicles | 195 (7.6%) | 148 (6.1%) |
| 5 or more Vehicles | 103 (4.0%) | 93 (3.8%) |
| Total | 2,558 (100.0%) | 2,415 (100.0%) |
Commute Time in Wabash County
The most frequently occuring commute durations in Wabash County are 5 to 9 minutes (955 commuters, 19.9%), 10 to 14 minutes (576 commuters, 12.0%), and 15 to 19 minutes (532 commuters, 11.1%).
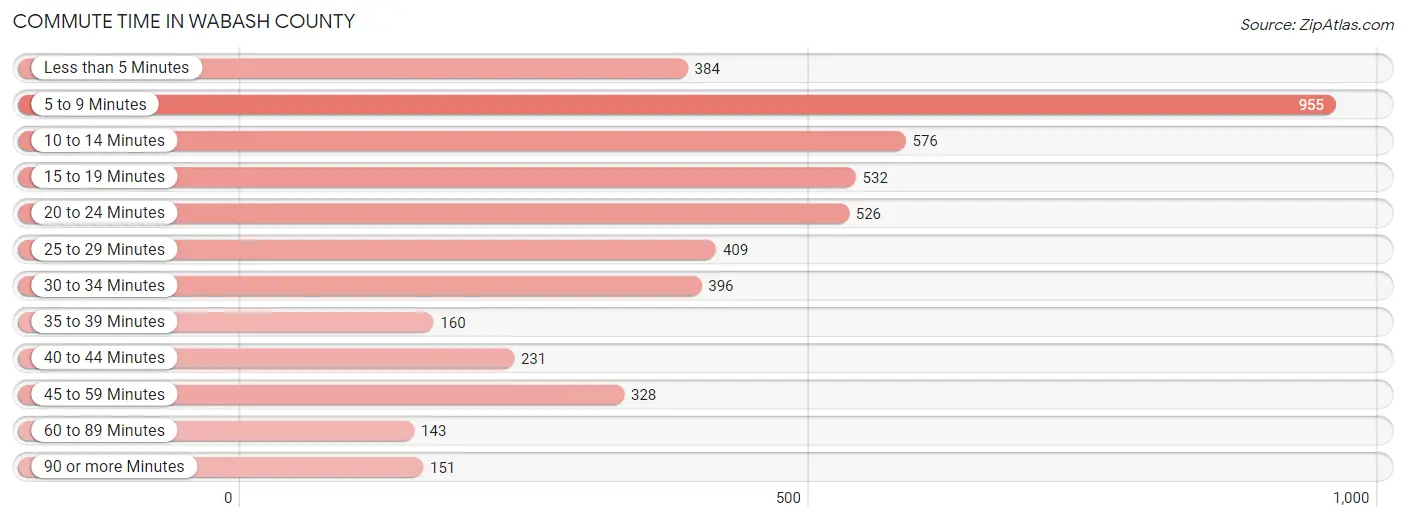
| Commute Time | # Commuters | % Commuters |
| Less than 5 Minutes | 384 | 8.0% |
| 5 to 9 Minutes | 955 | 19.9% |
| 10 to 14 Minutes | 576 | 12.0% |
| 15 to 19 Minutes | 532 | 11.1% |
| 20 to 24 Minutes | 526 | 11.0% |
| 25 to 29 Minutes | 409 | 8.5% |
| 30 to 34 Minutes | 396 | 8.3% |
| 35 to 39 Minutes | 160 | 3.3% |
| 40 to 44 Minutes | 231 | 4.8% |
| 45 to 59 Minutes | 328 | 6.9% |
| 60 to 89 Minutes | 143 | 3.0% |
| 90 or more Minutes | 151 | 3.2% |
Commute Time by Sex in Wabash County
The most common commute times in Wabash County are 5 to 9 minutes (377 commuters, 15.5%) for males and 5 to 9 minutes (578 commuters, 24.5%) for females.
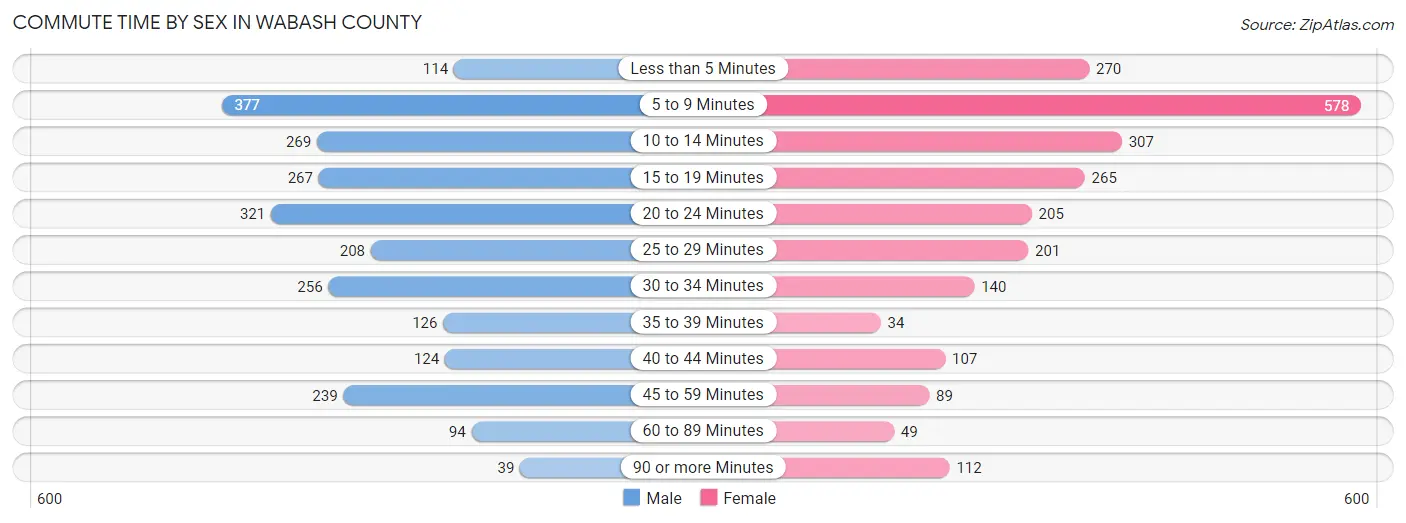
| Commute Time | Male | Female |
| Less than 5 Minutes | 114 (4.7%) | 270 (11.5%) |
| 5 to 9 Minutes | 377 (15.5%) | 578 (24.5%) |
| 10 to 14 Minutes | 269 (11.1%) | 307 (13.0%) |
| 15 to 19 Minutes | 267 (11.0%) | 265 (11.2%) |
| 20 to 24 Minutes | 321 (13.2%) | 205 (8.7%) |
| 25 to 29 Minutes | 208 (8.6%) | 201 (8.5%) |
| 30 to 34 Minutes | 256 (10.5%) | 140 (5.9%) |
| 35 to 39 Minutes | 126 (5.2%) | 34 (1.4%) |
| 40 to 44 Minutes | 124 (5.1%) | 107 (4.5%) |
| 45 to 59 Minutes | 239 (9.8%) | 89 (3.8%) |
| 60 to 89 Minutes | 94 (3.9%) | 49 (2.1%) |
| 90 or more Minutes | 39 (1.6%) | 112 (4.8%) |
Time of Departure to Work by Sex in Wabash County
The most frequent times of departure to work in Wabash County are 12:00 AM to 4:59 AM (319, 13.1%) for males and 7:00 AM to 7:29 AM (408, 17.3%) for females.
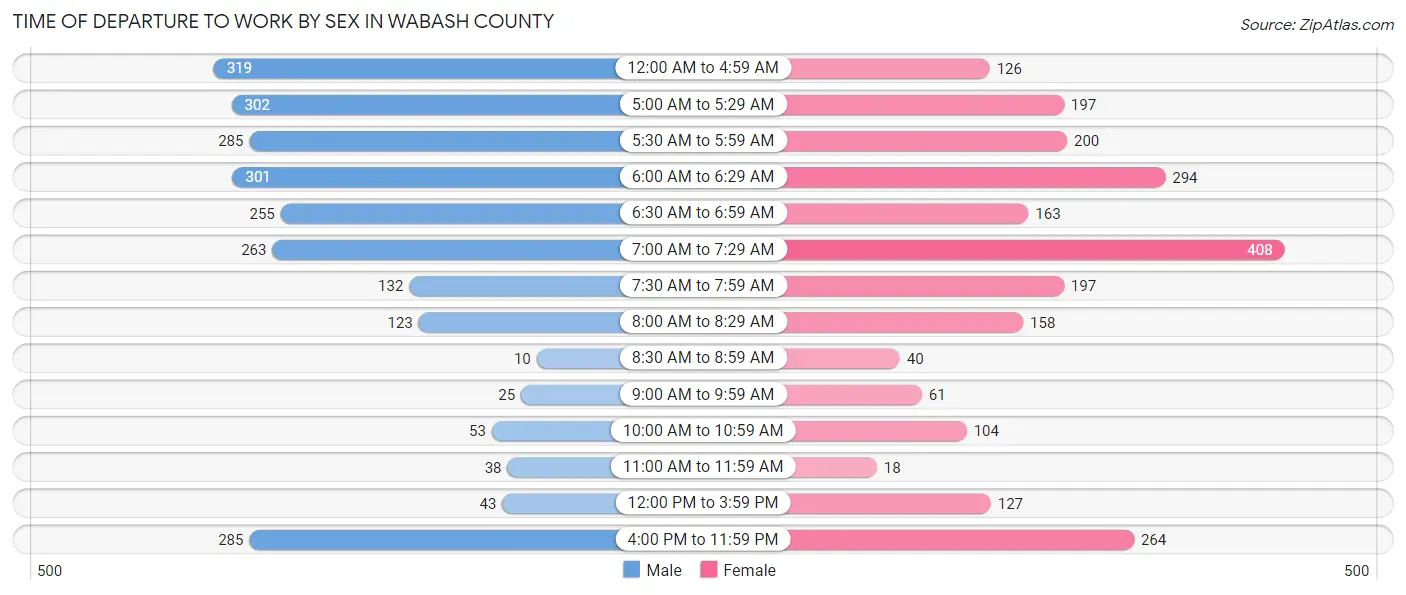
| Time of Departure | Male | Female |
| 12:00 AM to 4:59 AM | 319 (13.1%) | 126 (5.3%) |
| 5:00 AM to 5:29 AM | 302 (12.4%) | 197 (8.4%) |
| 5:30 AM to 5:59 AM | 285 (11.7%) | 200 (8.5%) |
| 6:00 AM to 6:29 AM | 301 (12.4%) | 294 (12.5%) |
| 6:30 AM to 6:59 AM | 255 (10.5%) | 163 (6.9%) |
| 7:00 AM to 7:29 AM | 263 (10.8%) | 408 (17.3%) |
| 7:30 AM to 7:59 AM | 132 (5.4%) | 197 (8.4%) |
| 8:00 AM to 8:29 AM | 123 (5.1%) | 158 (6.7%) |
| 8:30 AM to 8:59 AM | 10 (0.4%) | 40 (1.7%) |
| 9:00 AM to 9:59 AM | 25 (1.0%) | 61 (2.6%) |
| 10:00 AM to 10:59 AM | 53 (2.2%) | 104 (4.4%) |
| 11:00 AM to 11:59 AM | 38 (1.6%) | 18 (0.8%) |
| 12:00 PM to 3:59 PM | 43 (1.8%) | 127 (5.4%) |
| 4:00 PM to 11:59 PM | 285 (11.7%) | 264 (11.2%) |
| Total | 2,434 (100.0%) | 2,357 (100.0%) |
Housing Occupancy in Wabash County
Occupancy by Ownership in Wabash County
Of the total 4,778 dwellings in Wabash County, owner-occupied units account for 3,668 (76.8%), while renter-occupied units make up 1,110 (23.2%).
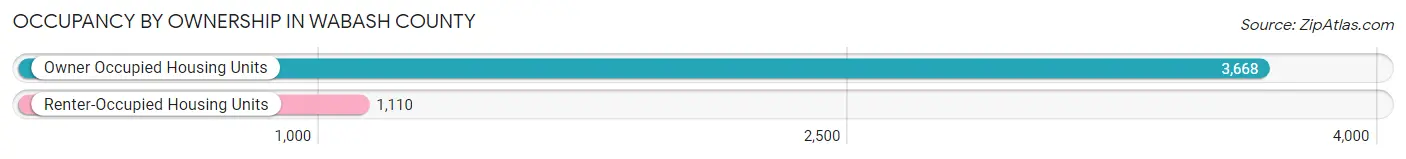
| Occupancy | # Housing Units | % Housing Units |
| Owner Occupied Housing Units | 3,668 | 76.8% |
| Renter-Occupied Housing Units | 1,110 | 23.2% |
| Total Occupied Housing Units | 4,778 | 100.0% |
Occupancy by Household Size in Wabash County
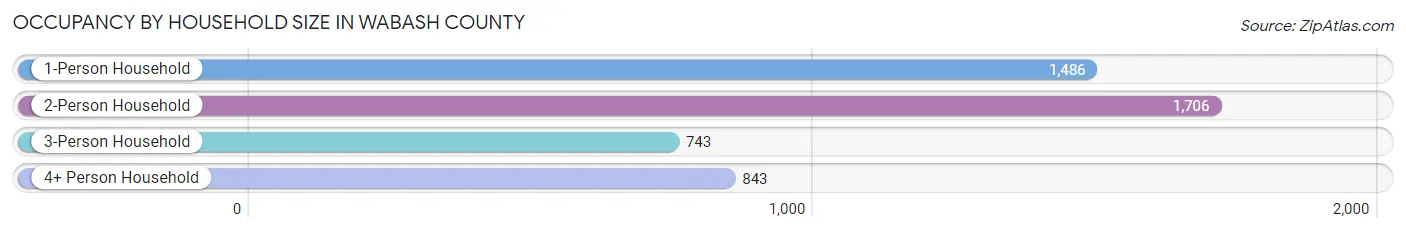
| Household Size | # Housing Units | % Housing Units |
| 1-Person Household | 1,486 | 31.1% |
| 2-Person Household | 1,706 | 35.7% |
| 3-Person Household | 743 | 15.5% |
| 4+ Person Household | 843 | 17.6% |
| Total Housing Units | 4,778 | 100.0% |
Occupancy by Ownership by Household Size in Wabash County
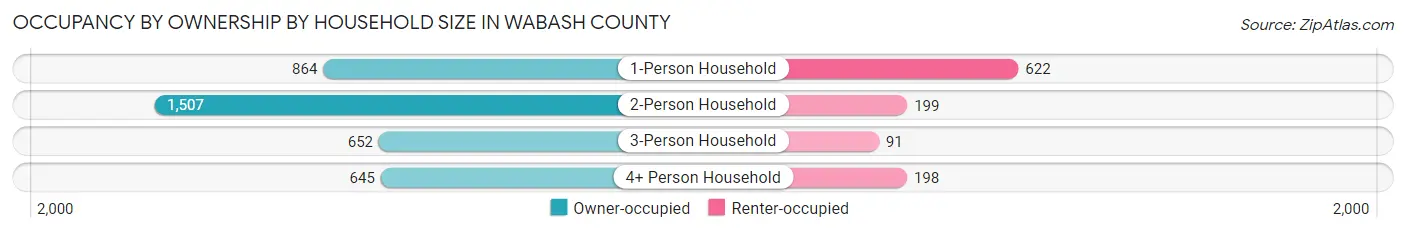
| Household Size | Owner-occupied | Renter-occupied |
| 1-Person Household | 864 (58.1%) | 622 (41.9%) |
| 2-Person Household | 1,507 (88.3%) | 199 (11.7%) |
| 3-Person Household | 652 (87.7%) | 91 (12.2%) |
| 4+ Person Household | 645 (76.5%) | 198 (23.5%) |
| Total Housing Units | 3,668 (76.8%) | 1,110 (23.2%) |
Occupancy by Educational Attainment in Wabash County
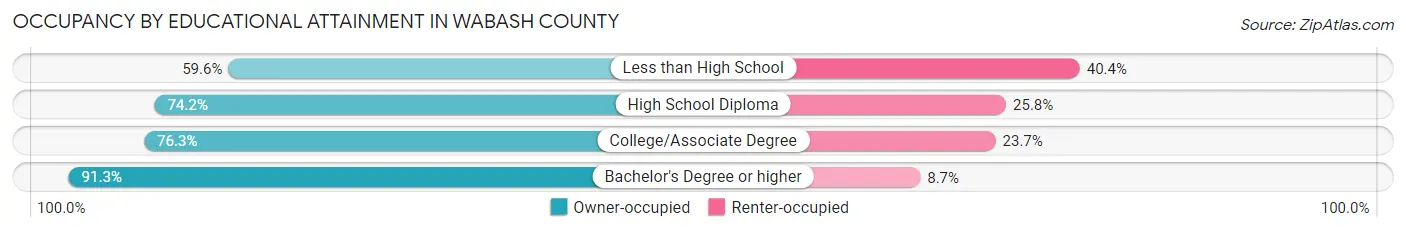
| Household Size | Owner-occupied | Renter-occupied |
| Less than High School | 226 (59.6%) | 153 (40.4%) |
| High School Diploma | 1,003 (74.2%) | 348 (25.8%) |
| College/Associate Degree | 1,750 (76.3%) | 543 (23.7%) |
| Bachelor's Degree or higher | 689 (91.3%) | 66 (8.7%) |
Occupancy by Age of Householder in Wabash County
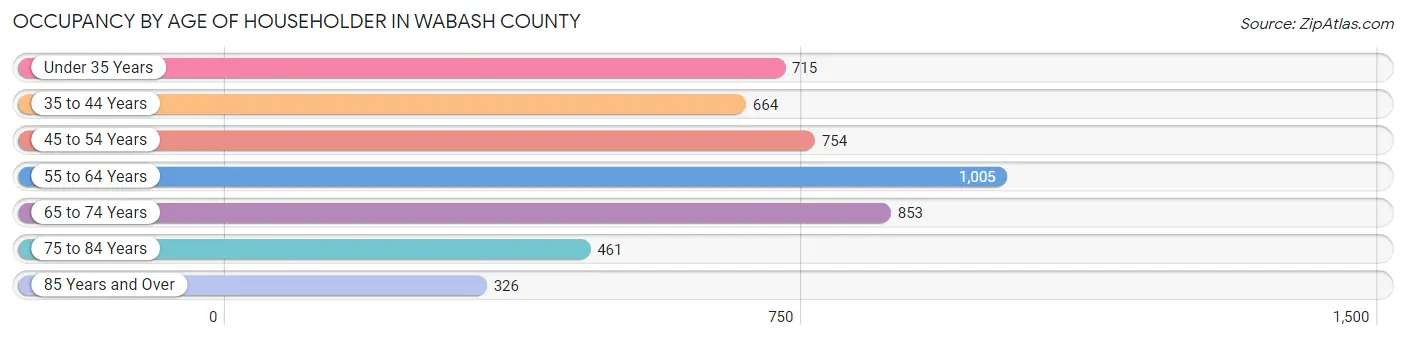
| Age Bracket | # Households | % Households |
| Under 35 Years | 715 | 15.0% |
| 35 to 44 Years | 664 | 13.9% |
| 45 to 54 Years | 754 | 15.8% |
| 55 to 64 Years | 1,005 | 21.0% |
| 65 to 74 Years | 853 | 17.8% |
| 75 to 84 Years | 461 | 9.7% |
| 85 Years and Over | 326 | 6.8% |
| Total | 4,778 | 100.0% |
Housing Finances in Wabash County
Median Income by Occupancy in Wabash County
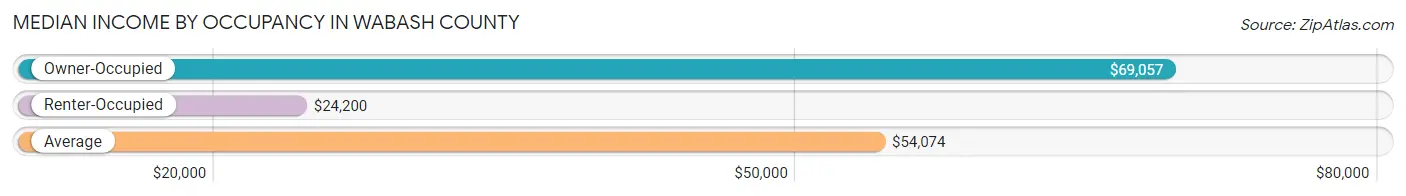
| Occupancy Type | # Households | Median Income |
| Owner-Occupied | 3,668 (76.8%) | $69,057 |
| Renter-Occupied | 1,110 (23.2%) | $24,200 |
| Average | 4,778 (100.0%) | $54,074 |
Occupancy by Householder Income Bracket in Wabash County
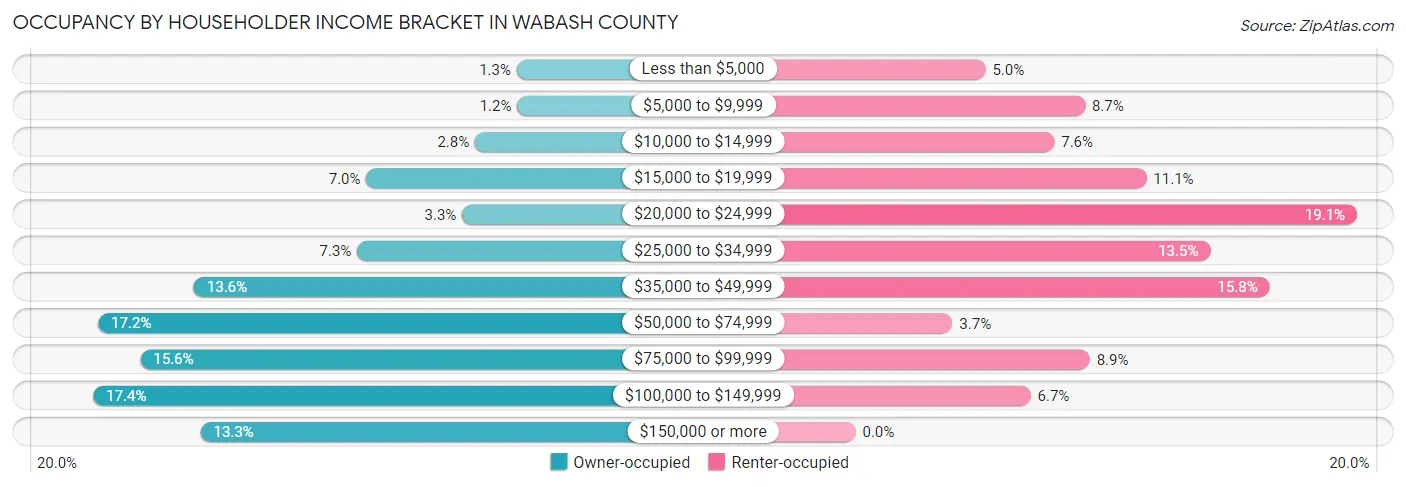
| Income Bracket | Owner-occupied | Renter-occupied |
| Less than $5,000 | 46 (1.3%) | 55 (5.0%) |
| $5,000 to $9,999 | 45 (1.2%) | 97 (8.7%) |
| $10,000 to $14,999 | 104 (2.8%) | 84 (7.6%) |
| $15,000 to $19,999 | 256 (7.0%) | 123 (11.1%) |
| $20,000 to $24,999 | 122 (3.3%) | 212 (19.1%) |
| $25,000 to $34,999 | 269 (7.3%) | 150 (13.5%) |
| $35,000 to $49,999 | 497 (13.6%) | 175 (15.8%) |
| $50,000 to $74,999 | 631 (17.2%) | 41 (3.7%) |
| $75,000 to $99,999 | 572 (15.6%) | 99 (8.9%) |
| $100,000 to $149,999 | 638 (17.4%) | 74 (6.7%) |
| $150,000 or more | 488 (13.3%) | 0 (0.0%) |
| Total | 3,668 (100.0%) | 1,110 (100.0%) |
Monthly Housing Cost Tiers in Wabash County
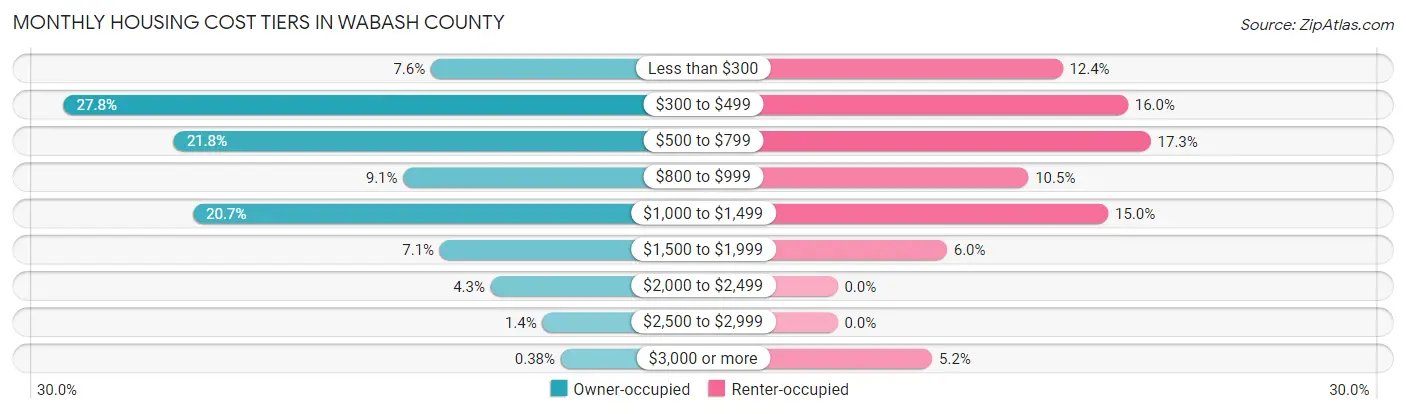
| Monthly Cost | Owner-occupied | Renter-occupied |
| Less than $300 | 277 (7.5%) | 138 (12.4%) |
| $300 to $499 | 1,021 (27.8%) | 178 (16.0%) |
| $500 to $799 | 798 (21.8%) | 192 (17.3%) |
| $800 to $999 | 333 (9.1%) | 117 (10.5%) |
| $1,000 to $1,499 | 759 (20.7%) | 166 (14.9%) |
| $1,500 to $1,999 | 259 (7.1%) | 67 (6.0%) |
| $2,000 to $2,499 | 156 (4.3%) | 0 (0.0%) |
| $2,500 to $2,999 | 51 (1.4%) | 0 (0.0%) |
| $3,000 or more | 14 (0.4%) | 58 (5.2%) |
| Total | 3,668 (100.0%) | 1,110 (100.0%) |
Physical Housing Characteristics in Wabash County
Housing Structures in Wabash County
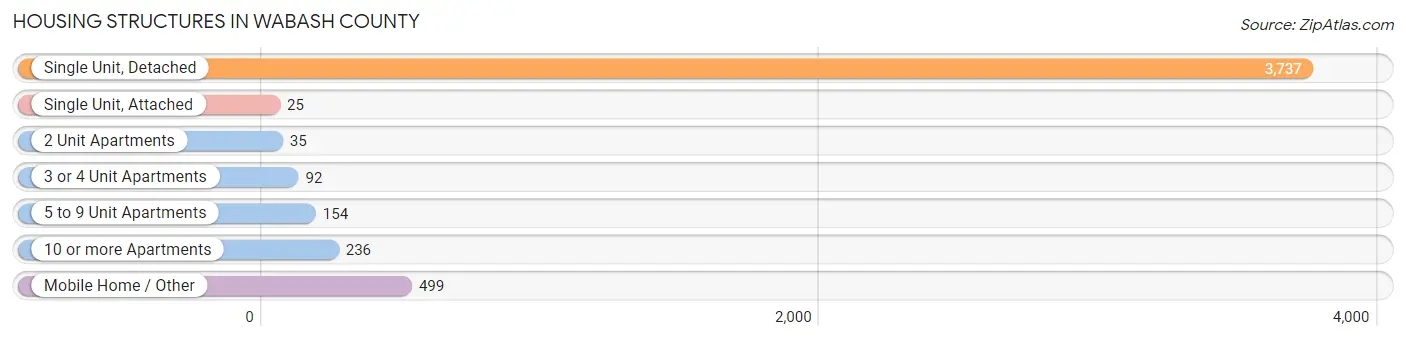
| Structure Type | # Housing Units | % Housing Units |
| Single Unit, Detached | 3,737 | 78.2% |
| Single Unit, Attached | 25 | 0.5% |
| 2 Unit Apartments | 35 | 0.7% |
| 3 or 4 Unit Apartments | 92 | 1.9% |
| 5 to 9 Unit Apartments | 154 | 3.2% |
| 10 or more Apartments | 236 | 4.9% |
| Mobile Home / Other | 499 | 10.4% |
| Total | 4,778 | 100.0% |
Housing Structures by Occupancy in Wabash County
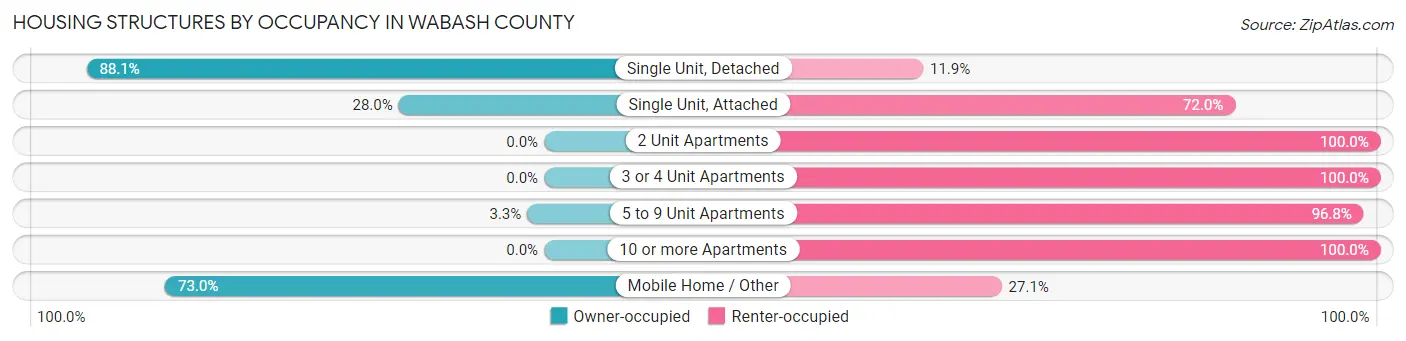
| Structure Type | Owner-occupied | Renter-occupied |
| Single Unit, Detached | 3,292 (88.1%) | 445 (11.9%) |
| Single Unit, Attached | 7 (28.0%) | 18 (72.0%) |
| 2 Unit Apartments | 0 (0.0%) | 35 (100.0%) |
| 3 or 4 Unit Apartments | 0 (0.0%) | 92 (100.0%) |
| 5 to 9 Unit Apartments | 5 (3.3%) | 149 (96.8%) |
| 10 or more Apartments | 0 (0.0%) | 236 (100.0%) |
| Mobile Home / Other | 364 (73.0%) | 135 (27.1%) |
| Total | 3,668 (76.8%) | 1,110 (23.2%) |
Housing Structures by Number of Rooms in Wabash County

| Number of Rooms | Owner-occupied | Renter-occupied |
| 1 Room | 1 (0.0%) | 36 (3.2%) |
| 2 or 3 Rooms | 61 (1.7%) | 306 (27.6%) |
| 4 or 5 Rooms | 1,049 (28.6%) | 474 (42.7%) |
| 6 or 7 Rooms | 1,453 (39.6%) | 148 (13.3%) |
| 8 or more Rooms | 1,104 (30.1%) | 146 (13.2%) |
| Total | 3,668 (100.0%) | 1,110 (100.0%) |
Housing Structure by Heating Type in Wabash County

| Heating Type | Owner-occupied | Renter-occupied |
| Utility Gas | 2,045 (55.7%) | 556 (50.1%) |
| Bottled, Tank, or LP Gas | 870 (23.7%) | 31 (2.8%) |
| Electricity | 608 (16.6%) | 392 (35.3%) |
| Fuel Oil or Kerosene | 28 (0.8%) | 0 (0.0%) |
| Coal or Coke | 0 (0.0%) | 0 (0.0%) |
| All other Fuels | 114 (3.1%) | 118 (10.6%) |
| No Fuel Used | 3 (0.1%) | 13 (1.2%) |
| Total | 3,668 (100.0%) | 1,110 (100.0%) |
Household Vehicle Usage in Wabash County
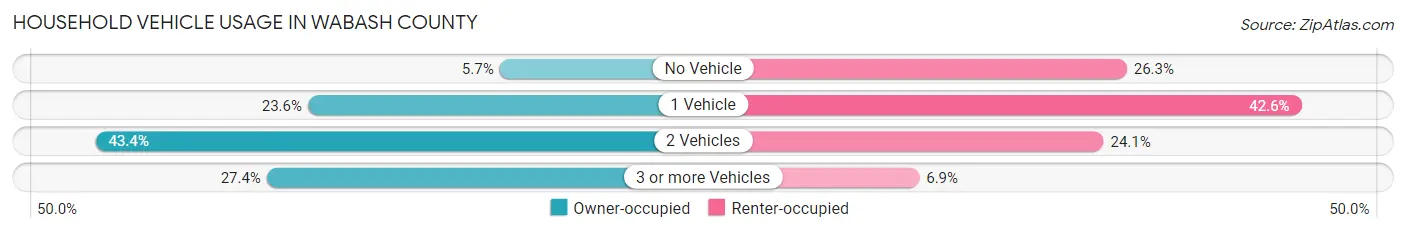
| Vehicles per Household | Owner-occupied | Renter-occupied |
| No Vehicle | 208 (5.7%) | 292 (26.3%) |
| 1 Vehicle | 864 (23.6%) | 473 (42.6%) |
| 2 Vehicles | 1,591 (43.4%) | 268 (24.1%) |
| 3 or more Vehicles | 1,005 (27.4%) | 77 (6.9%) |
| Total | 3,668 (100.0%) | 1,110 (100.0%) |
Real Estate & Mortgages in Wabash County
Real Estate and Mortgage Overview in Wabash County
| Characteristic | Without Mortgage | With Mortgage |
| Housing Units | 2,052 | 1,616 |
| Median Property Value | $82,800 | $109,400 |
| Median Household Income | $54,409 | $266 |
| Monthly Housing Costs | $438 | $14 |
| Real Estate Taxes | $1,186 | $40 |
Property Value by Mortgage Status in Wabash County
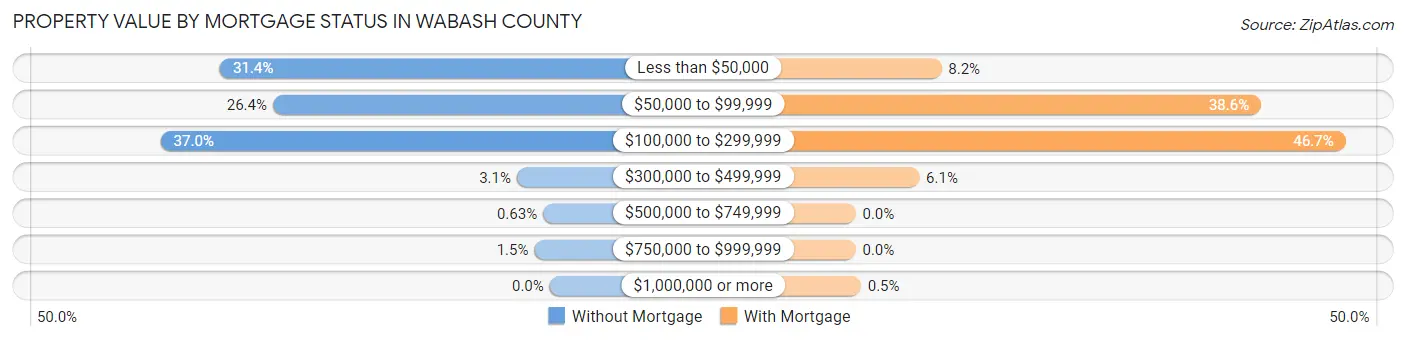
| Property Value | Without Mortgage | With Mortgage |
| Less than $50,000 | 644 (31.4%) | 132 (8.2%) |
| $50,000 to $99,999 | 541 (26.4%) | 624 (38.6%) |
| $100,000 to $299,999 | 760 (37.0%) | 754 (46.7%) |
| $300,000 to $499,999 | 64 (3.1%) | 98 (6.1%) |
| $500,000 to $749,999 | 13 (0.6%) | 0 (0.0%) |
| $750,000 to $999,999 | 30 (1.5%) | 0 (0.0%) |
| $1,000,000 or more | 0 (0.0%) | 8 (0.5%) |
| Total | 2,052 (100.0%) | 1,616 (100.0%) |
Household Income by Mortgage Status in Wabash County
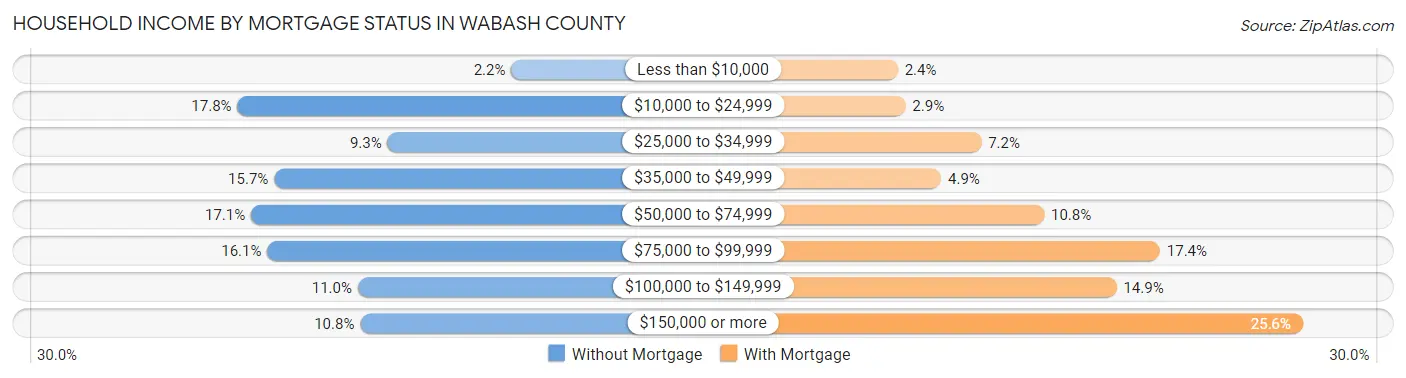
| Household Income | Without Mortgage | With Mortgage |
| Less than $10,000 | 45 (2.2%) | 39 (2.4%) |
| $10,000 to $24,999 | 366 (17.8%) | 46 (2.9%) |
| $25,000 to $34,999 | 190 (9.3%) | 116 (7.2%) |
| $35,000 to $49,999 | 323 (15.7%) | 79 (4.9%) |
| $50,000 to $74,999 | 350 (17.1%) | 174 (10.8%) |
| $75,000 to $99,999 | 331 (16.1%) | 281 (17.4%) |
| $100,000 to $149,999 | 225 (11.0%) | 241 (14.9%) |
| $150,000 or more | 222 (10.8%) | 413 (25.6%) |
| Total | 2,052 (100.0%) | 1,616 (100.0%) |
Property Value to Household Income Ratio in Wabash County
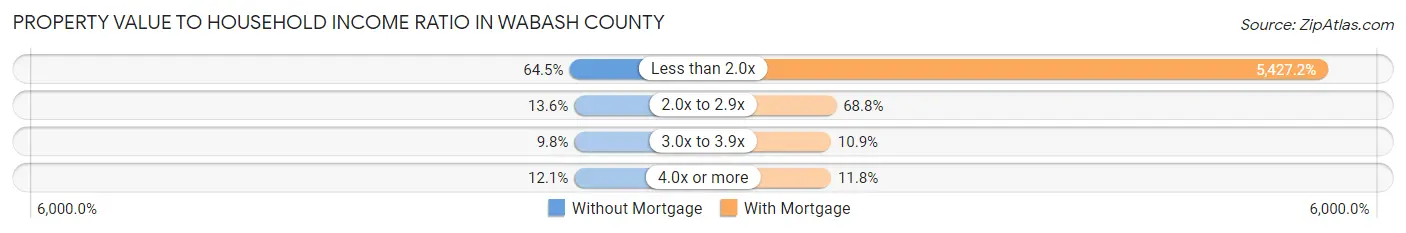
| Value-to-Income Ratio | Without Mortgage | With Mortgage |
| Less than 2.0x | 1,324 (64.5%) | 87,703 (5,427.2%) |
| 2.0x to 2.9x | 278 (13.6%) | 1,112 (68.8%) |
| 3.0x to 3.9x | 201 (9.8%) | 176 (10.9%) |
| 4.0x or more | 249 (12.1%) | 191 (11.8%) |
| Total | 2,052 (100.0%) | 1,616 (100.0%) |
Real Estate Taxes by Mortgage Status in Wabash County
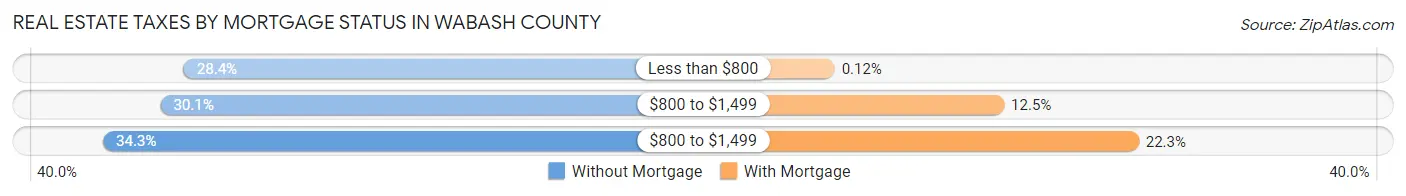
| Property Taxes | Without Mortgage | With Mortgage |
| Less than $800 | 582 (28.4%) | 2 (0.1%) |
| $800 to $1,499 | 617 (30.1%) | 202 (12.5%) |
| $800 to $1,499 | 703 (34.3%) | 361 (22.3%) |
| Total | 2,052 (100.0%) | 1,616 (100.0%) |
Health & Disability in Wabash County
Health Insurance Coverage by Age in Wabash County
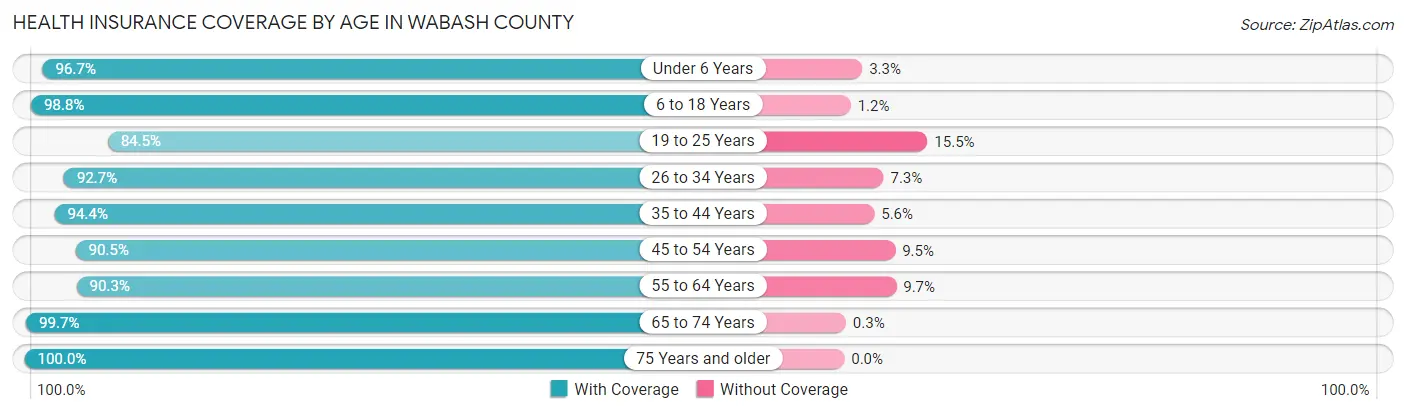
| Age Bracket | With Coverage | Without Coverage |
| Under 6 Years | 782 (96.7%) | 27 (3.3%) |
| 6 to 18 Years | 1,724 (98.8%) | 21 (1.2%) |
| 19 to 25 Years | 687 (84.5%) | 126 (15.5%) |
| 26 to 34 Years | 1,089 (92.7%) | 86 (7.3%) |
| 35 to 44 Years | 1,216 (94.4%) | 72 (5.6%) |
| 45 to 54 Years | 1,229 (90.5%) | 129 (9.5%) |
| 55 to 64 Years | 1,482 (90.3%) | 159 (9.7%) |
| 65 to 74 Years | 1,351 (99.7%) | 4 (0.3%) |
| 75 Years and older | 1,054 (100.0%) | 0 (0.0%) |
| Total | 10,614 (94.5%) | 624 (5.6%) |
Health Insurance Coverage by Citizenship Status in Wabash County
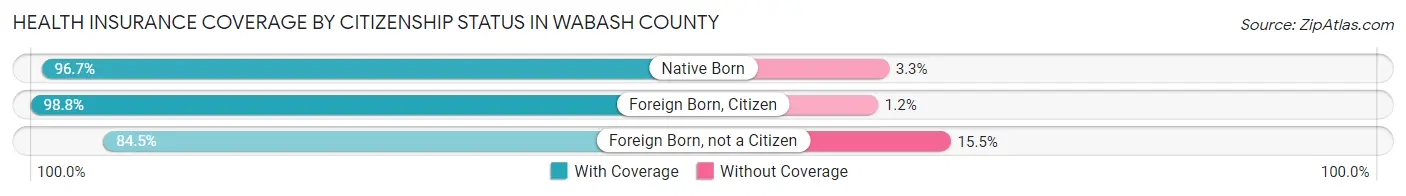
| Citizenship Status | With Coverage | Without Coverage |
| Native Born | 782 (96.7%) | 27 (3.3%) |
| Foreign Born, Citizen | 1,724 (98.8%) | 21 (1.2%) |
| Foreign Born, not a Citizen | 687 (84.5%) | 126 (15.5%) |
Health Insurance Coverage by Household Income in Wabash County
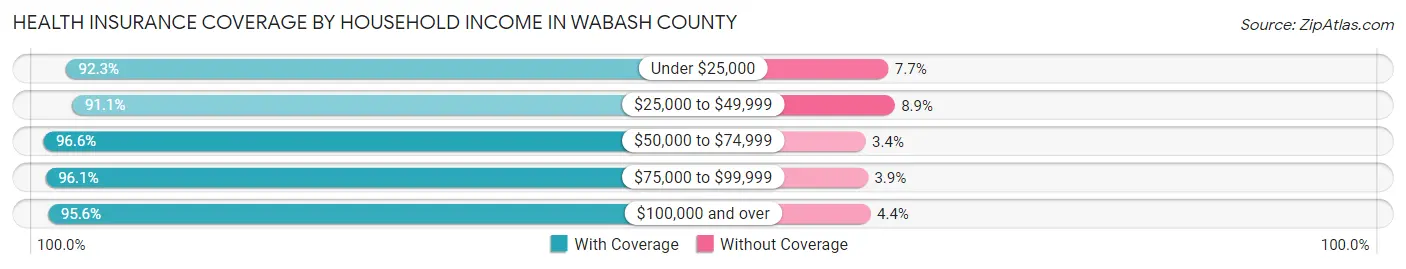
| Household Income | With Coverage | Without Coverage |
| Under $25,000 | 1,643 (92.3%) | 137 (7.7%) |
| $25,000 to $49,999 | 2,008 (91.1%) | 196 (8.9%) |
| $50,000 to $74,999 | 1,486 (96.6%) | 53 (3.4%) |
| $75,000 to $99,999 | 1,715 (96.1%) | 69 (3.9%) |
| $100,000 and over | 3,711 (95.6%) | 169 (4.4%) |
Public vs Private Health Insurance Coverage by Age in Wabash County
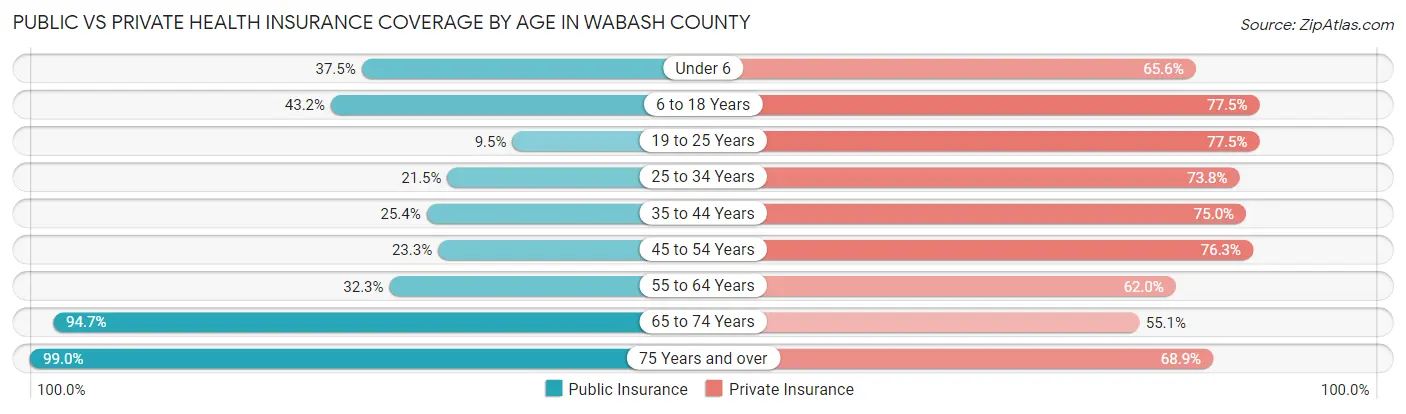
| Age Bracket | Public Insurance | Private Insurance |
| Under 6 | 303 (37.4%) | 531 (65.6%) |
| 6 to 18 Years | 753 (43.1%) | 1,352 (77.5%) |
| 19 to 25 Years | 77 (9.5%) | 630 (77.5%) |
| 25 to 34 Years | 253 (21.5%) | 867 (73.8%) |
| 35 to 44 Years | 327 (25.4%) | 966 (75.0%) |
| 45 to 54 Years | 316 (23.3%) | 1,036 (76.3%) |
| 55 to 64 Years | 530 (32.3%) | 1,017 (62.0%) |
| 65 to 74 Years | 1,283 (94.7%) | 747 (55.1%) |
| 75 Years and over | 1,043 (99.0%) | 726 (68.9%) |
| Total | 4,885 (43.5%) | 7,872 (70.1%) |
Disability Status by Sex by Age in Wabash County
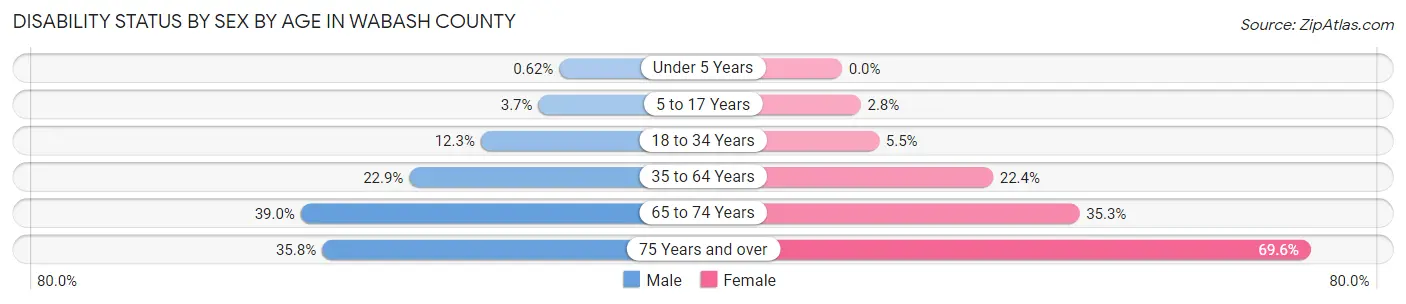
| Age Bracket | Male | Female |
| Under 5 Years | 2 (0.6%) | 0 (0.0%) |
| 5 to 17 Years | 35 (3.7%) | 25 (2.8%) |
| 18 to 34 Years | 129 (12.3%) | 56 (5.5%) |
| 35 to 64 Years | 478 (22.9%) | 493 (22.4%) |
| 65 to 74 Years | 264 (39.0%) | 239 (35.2%) |
| 75 Years and over | 143 (35.8%) | 456 (69.6%) |
Disability Class by Sex by Age in Wabash County
Disability Class: Hearing Difficulty
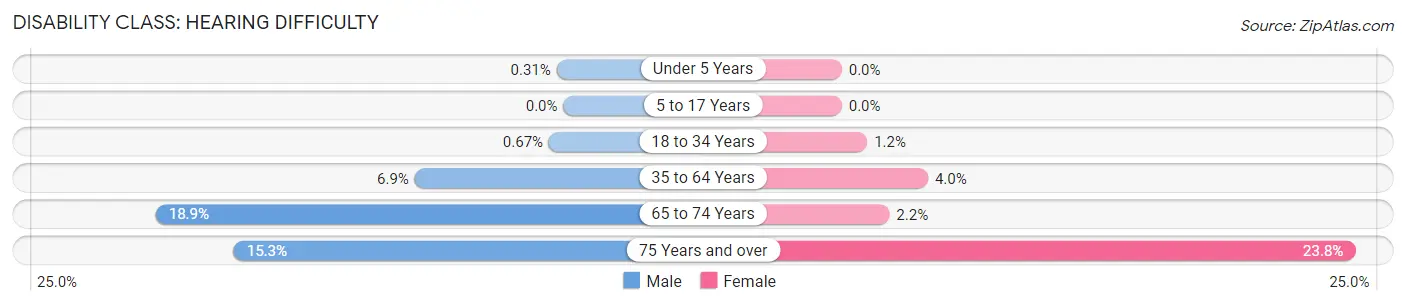
| Age Bracket | Male | Female |
| Under 5 Years | 1 (0.3%) | 0 (0.0%) |
| 5 to 17 Years | 0 (0.0%) | 0 (0.0%) |
| 18 to 34 Years | 7 (0.7%) | 12 (1.2%) |
| 35 to 64 Years | 144 (6.9%) | 88 (4.0%) |
| 65 to 74 Years | 128 (18.9%) | 15 (2.2%) |
| 75 Years and over | 61 (15.3%) | 156 (23.8%) |
Disability Class: Vision Difficulty
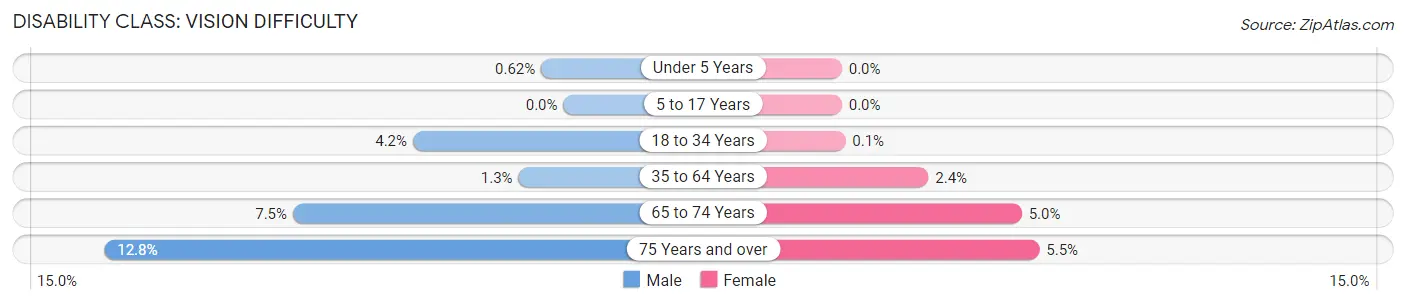
| Age Bracket | Male | Female |
| Under 5 Years | 2 (0.6%) | 0 (0.0%) |
| 5 to 17 Years | 0 (0.0%) | 0 (0.0%) |
| 18 to 34 Years | 44 (4.2%) | 1 (0.1%) |
| 35 to 64 Years | 26 (1.3%) | 53 (2.4%) |
| 65 to 74 Years | 51 (7.5%) | 34 (5.0%) |
| 75 Years and over | 51 (12.8%) | 36 (5.5%) |
Disability Class: Cognitive Difficulty
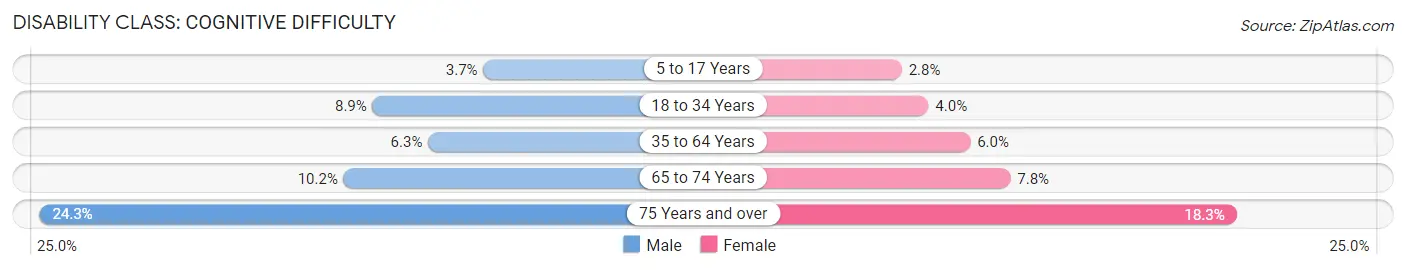
| Age Bracket | Male | Female |
| 5 to 17 Years | 35 (3.7%) | 25 (2.8%) |
| 18 to 34 Years | 93 (8.8%) | 41 (4.0%) |
| 35 to 64 Years | 131 (6.3%) | 131 (6.0%) |
| 65 to 74 Years | 69 (10.2%) | 53 (7.8%) |
| 75 Years and over | 97 (24.3%) | 120 (18.3%) |
Disability Class: Ambulatory Difficulty
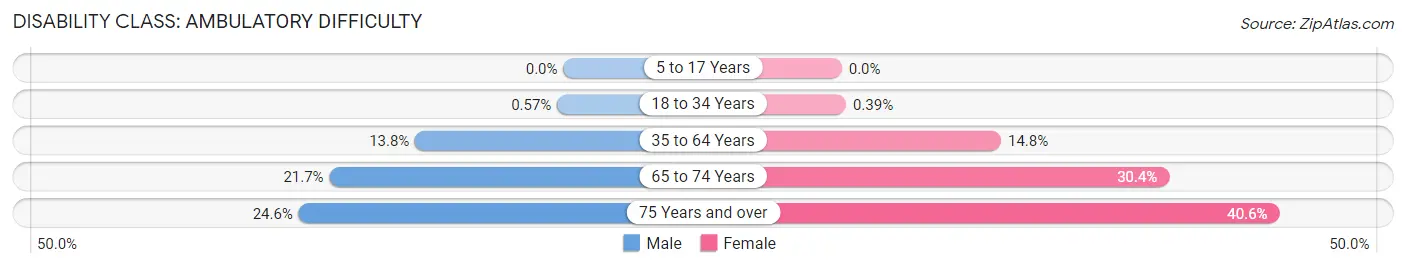
| Age Bracket | Male | Female |
| 5 to 17 Years | 0 (0.0%) | 0 (0.0%) |
| 18 to 34 Years | 6 (0.6%) | 4 (0.4%) |
| 35 to 64 Years | 287 (13.8%) | 325 (14.8%) |
| 65 to 74 Years | 147 (21.7%) | 206 (30.4%) |
| 75 Years and over | 98 (24.6%) | 266 (40.6%) |
Disability Class: Self-Care Difficulty
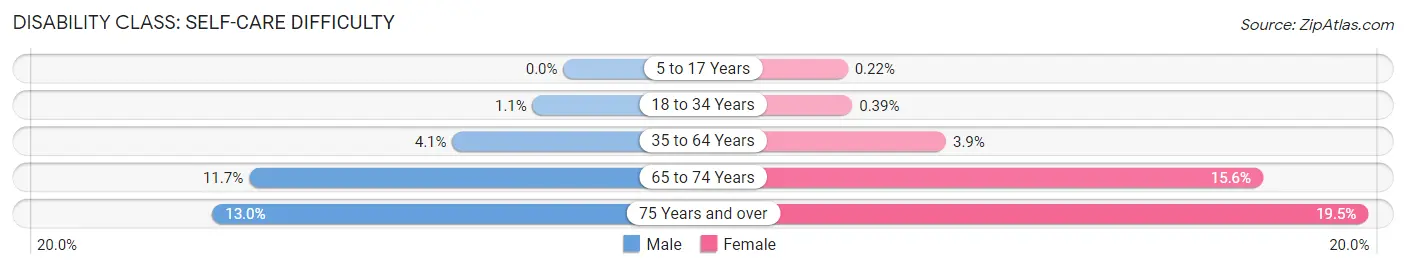
| Age Bracket | Male | Female |
| 5 to 17 Years | 0 (0.0%) | 2 (0.2%) |
| 18 to 34 Years | 12 (1.1%) | 4 (0.4%) |
| 35 to 64 Years | 86 (4.1%) | 85 (3.9%) |
| 65 to 74 Years | 79 (11.7%) | 106 (15.6%) |
| 75 Years and over | 52 (13.0%) | 128 (19.5%) |
Technology Access in Wabash County
Computing Device Access in Wabash County

| Device Type | # Households | % Households |
| Desktop or Laptop | 3,094 | 64.8% |
| Smartphone | 4,009 | 83.9% |
| Tablet | 2,654 | 55.5% |
| No Computing Device | 474 | 9.9% |
| Total | 4,778 | 100.0% |
Internet Access in Wabash County
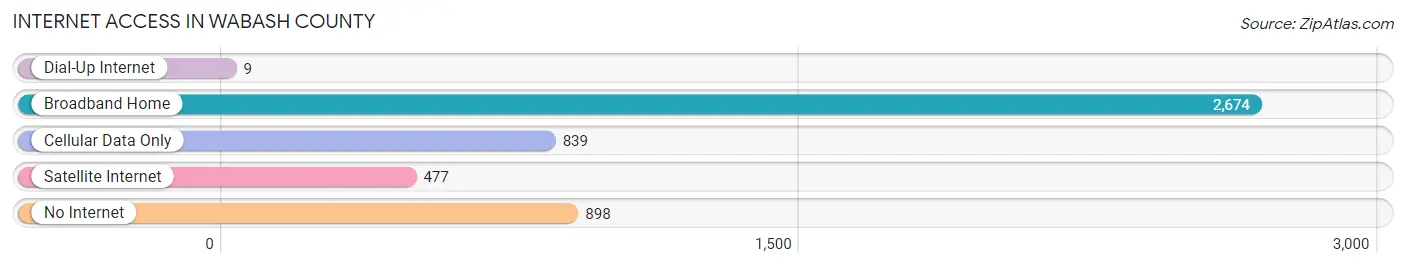
| Internet Type | # Households | % Households |
| Dial-Up Internet | 9 | 0.2% |
| Broadband Home | 2,674 | 56.0% |
| Cellular Data Only | 839 | 17.6% |
| Satellite Internet | 477 | 10.0% |
| No Internet | 898 | 18.8% |
| Total | 4,778 | 100.0% |
Wabash County Summary
Wabash County is located in the southeastern corner of Illinois, and is part of the Centralia-Mount Vernon-Salem Metropolitan Statistical Area. The county was established in 1824 and named after the Wabash River, which forms its eastern border. As of the 2010 census, the population was 11,947, making it the second least populous county in Illinois.
Geography
Wabash County is located in the southeastern corner of Illinois, and is bordered by Edwards County to the north, Wayne County to the east, White County to the south, and Hamilton and Marion Counties to the west. The county has a total area of 441 square miles, of which 437 square miles is land and 4.2 square miles is water. The Wabash River forms the eastern border of the county. The highest point in the county is located in the northwest corner, at an elevation of 830 feet.
The county is mostly rural, with small towns and villages scattered throughout. The largest town is Mount Carmel, with a population of 7,284 as of the 2010 census. Other towns include Allendale, Bellmont, Browns, Keensburg, Lancaster, and Mount Erie.
Economy
Wabash County has a largely agricultural economy, with corn, soybeans, and wheat being the main crops. The county also has a strong manufacturing sector, with companies such as Wabash National Corporation, a truck trailer manufacturer, and Wabash Valley Power, a power generation company.
Demographics
As of the 2010 census, there were 11,947 people, 4,717 households, and 3,269 families residing in the county. The population density was 27.3 people per square mile. The racial makeup of the county was 97.7% White, 0.5% African American, 0.2% Native American, 0.2% Asian, 0.2% from other races, and 1.2% from two or more races. Hispanic or Latino of any race were 1.2% of the population.
The median income for a household in the county was $37,945, and the median income for a family was $45,945. The per capita income for the county was $18,845. About 11.2% of families and 14.2% of the population were below the poverty line, including 19.2% of those under age 18 and 8.7% of those age 65 or over.
Conclusion
Wabash County is a rural county located in the southeastern corner of Illinois. It has a largely agricultural economy, with corn, soybeans, and wheat being the main crops. The county also has a strong manufacturing sector. As of the 2010 census, the population was 11,947, with a median household income of $37,945. The county is mostly rural, with small towns and villages scattered throughout.
Common Questions
What is Per Capita Income in Wabash County?
Per Capita income in Wabash County is $33,137.
What is the Median Family Income in Wabash County?
Median Family Income in Wabash County is $80,377.
What is the Median Household income in Wabash County?
Median Household Income in Wabash County is $54,074.
What is Income or Wage Gap in Wabash County?
Income or Wage Gap in Wabash County is 44.8%.
Women in Wabash County earn 55.2 cents for every dollar earned by a man.
What is Family Income Deficit in Wabash County?
Family Income Deficit in Wabash County is $8,931.
Families that are below poverty line in Wabash County earn $8,931 less on average than the poverty threshold level.
What is Inequality or Gini Index in Wabash County?
Inequality or Gini Index in Wabash County is 0.46.
What is the Total Population of Wabash County?
Total Population of Wabash County is 11,321.
What is the Total Male Population of Wabash County?
Total Male Population of Wabash County is 5,516.
What is the Total Female Population of Wabash County?
Total Female Population of Wabash County is 5,805.
What is the Ratio of Males per 100 Females in Wabash County?
There are 95.02 Males per 100 Females in Wabash County.
What is the Ratio of Females per 100 Males in Wabash County?
There are 105.24 Females per 100 Males in Wabash County.
What is the Median Population Age in Wabash County?
Median Population Age in Wabash County is 43.8 Years.
What is the Average Family Size in Wabash County
Average Family Size in Wabash County is 2.9 People.
What is the Average Household Size in Wabash County
Average Household Size in Wabash County is 2.3 People.
How Large is the Labor Force in Wabash County?
There are 5,313 People in the Labor Forcein in Wabash County.
What is the Percentage of People in the Labor Force in Wabash County?
58.4% of People are in the Labor Force in Wabash County.
What is the Unemployment Rate in Wabash County?
Unemployment Rate in Wabash County is 4.4%.