Stephenson County, IL Map & Demographics
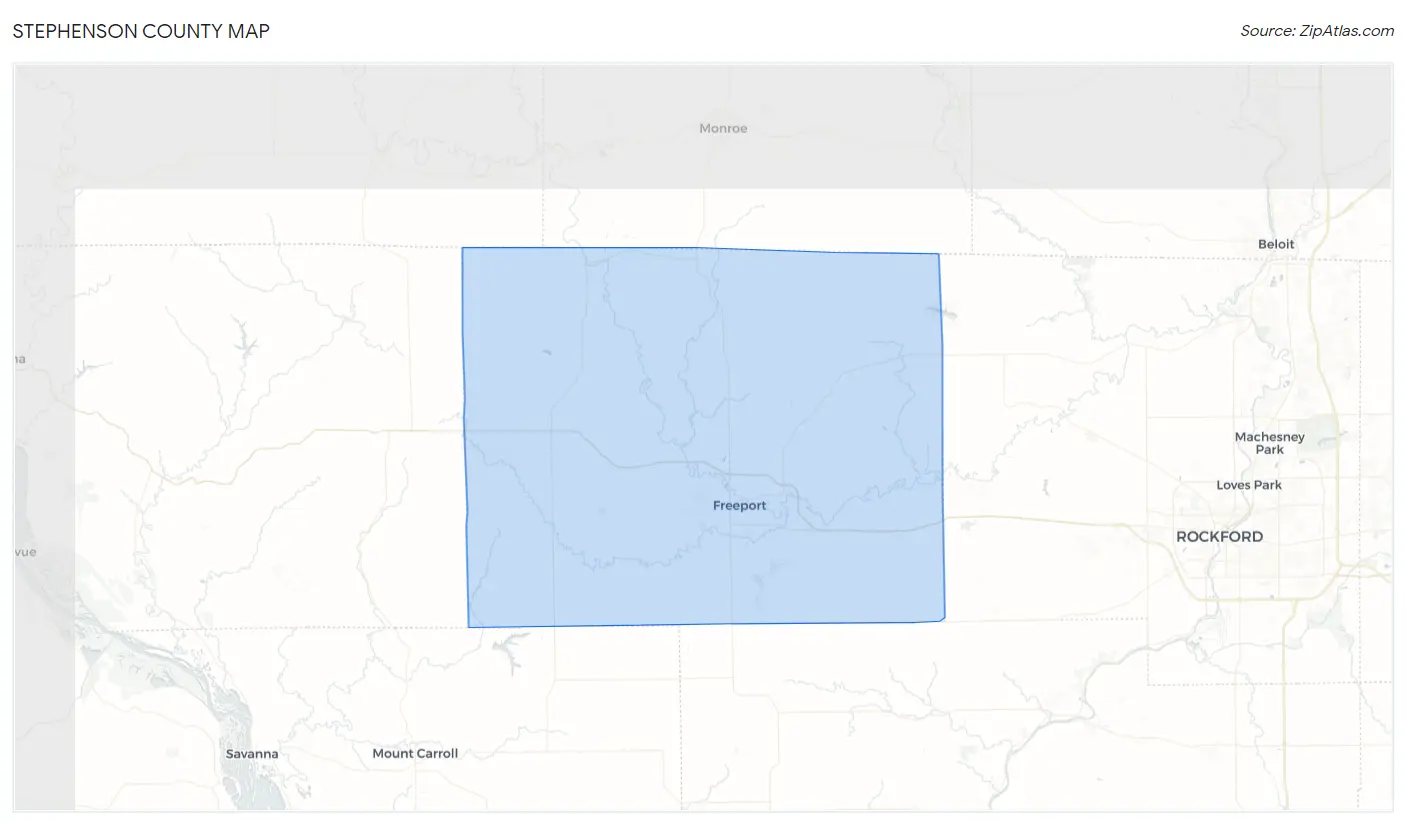
Stephenson County Map
Stephenson County Overview
$32,900
PER CAPITA INCOME
$73,244
AVG FAMILY INCOME
$57,527
AVG HOUSEHOLD INCOME
30.8%
WAGE / INCOME GAP [ % ]
69.2¢/ $1
WAGE / INCOME GAP [ $ ]
$7,641
FAMILY INCOME DEFICIT
0.44
INEQUALITY / GINI INDEX
44,482
TOTAL POPULATION
21,763
MALE POPULATION
22,719
FEMALE POPULATION
95.79
MALES / 100 FEMALES
104.39
FEMALES / 100 MALES
45.6
MEDIAN AGE
2.8
AVG FAMILY SIZE
2.3
AVG HOUSEHOLD SIZE
21,506
LABOR FORCE [ PEOPLE ]
59.3%
PERCENT IN LABOR FORCE
5.3%
UNEMPLOYMENT RATE
Stephenson County Area Codes
Income in Stephenson County
Income Overview in Stephenson County
Per Capita Income in Stephenson County is $32,900, while median incomes of families and households are $73,244 and $57,527 respectively.
| Characteristic | Number | Measure |
| Per Capita Income | 44,482 | $32,900 |
| Median Family Income | 12,016 | $73,244 |
| Mean Family Income | 12,016 | $88,319 |
| Median Household Income | 19,337 | $57,527 |
| Mean Household Income | 19,337 | $74,090 |
| Income Deficit | 12,016 | $7,641 |
| Wage / Income Gap (%) | 44,482 | 30.82% |
| Wage / Income Gap ($) | 44,482 | 69.18¢ per $1 |
| Gini / Inequality Index | 44,482 | 0.44 |
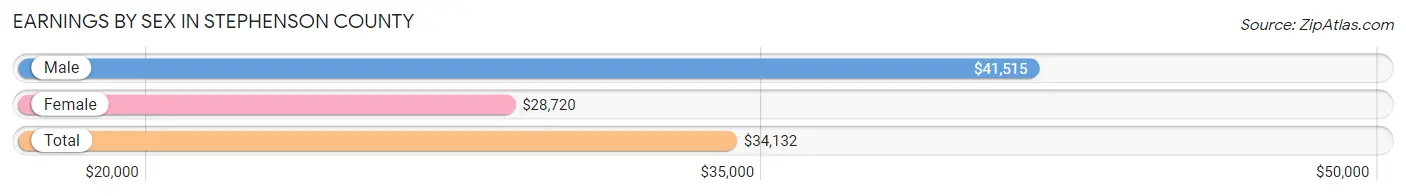
Earnings by Sex in Stephenson County
Average Earnings in Stephenson County are $34,132, $41,515 for men and $28,720 for women, a difference of 30.8%.
| Sex | Number | Average Earnings |
| Male | 11,528 (50.1%) | $41,515 |
| Female | 11,476 (49.9%) | $28,720 |
| Total | 23,004 (100.0%) | $34,132 |
Earnings by Sex by Income Bracket in Stephenson County
The most common earnings brackets in Stephenson County are $75,000 to $99,999 for men (1,489 | 12.9%) and $25,000 to $29,999 for women (1,250 | 10.9%).
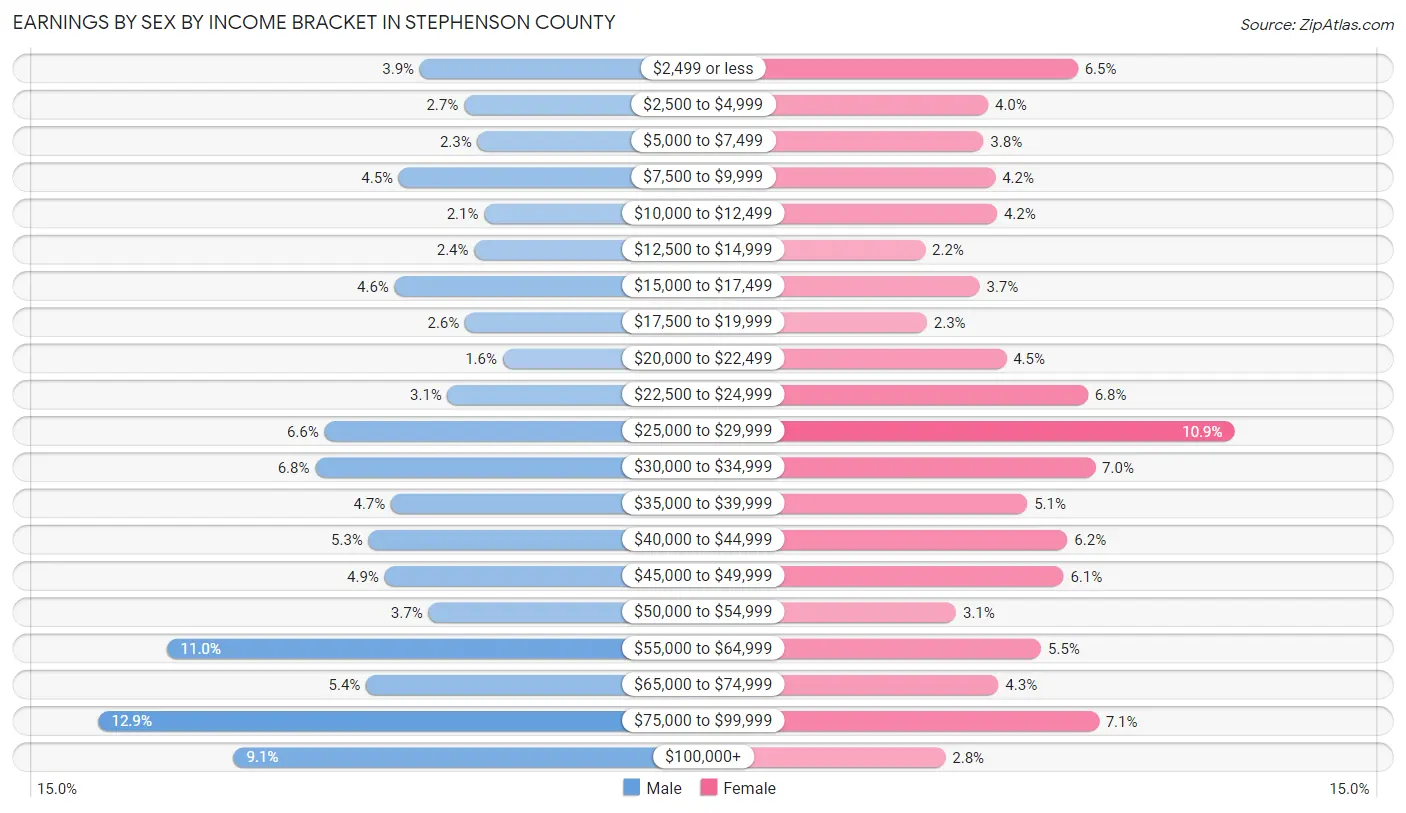
| Income | Male | Female |
| $2,499 or less | 448 (3.9%) | 745 (6.5%) |
| $2,500 to $4,999 | 305 (2.6%) | 456 (4.0%) |
| $5,000 to $7,499 | 262 (2.3%) | 441 (3.8%) |
| $7,500 to $9,999 | 517 (4.5%) | 479 (4.2%) |
| $10,000 to $12,499 | 240 (2.1%) | 484 (4.2%) |
| $12,500 to $14,999 | 272 (2.4%) | 252 (2.2%) |
| $15,000 to $17,499 | 530 (4.6%) | 428 (3.7%) |
| $17,500 to $19,999 | 302 (2.6%) | 258 (2.2%) |
| $20,000 to $22,499 | 180 (1.6%) | 514 (4.5%) |
| $22,500 to $24,999 | 359 (3.1%) | 777 (6.8%) |
| $25,000 to $29,999 | 757 (6.6%) | 1,250 (10.9%) |
| $30,000 to $34,999 | 787 (6.8%) | 801 (7.0%) |
| $35,000 to $39,999 | 542 (4.7%) | 582 (5.1%) |
| $40,000 to $44,999 | 614 (5.3%) | 711 (6.2%) |
| $45,000 to $49,999 | 562 (4.9%) | 699 (6.1%) |
| $50,000 to $54,999 | 421 (3.6%) | 352 (3.1%) |
| $55,000 to $64,999 | 1,266 (11.0%) | 627 (5.5%) |
| $65,000 to $74,999 | 623 (5.4%) | 489 (4.3%) |
| $75,000 to $99,999 | 1,489 (12.9%) | 813 (7.1%) |
| $100,000+ | 1,052 (9.1%) | 318 (2.8%) |
| Total | 11,528 (100.0%) | 11,476 (100.0%) |
Earnings by Sex by Educational Attainment in Stephenson County
Average earnings in Stephenson County are $48,426 for men and $32,195 for women, a difference of 33.5%. Men with an educational attainment of graduate degree enjoy the highest average annual earnings of $78,140, while those with less than high school education earn the least with $40,521. Women with an educational attainment of graduate degree earn the most with the average annual earnings of $69,955, while those with less than high school education have the smallest earnings of $21,851.
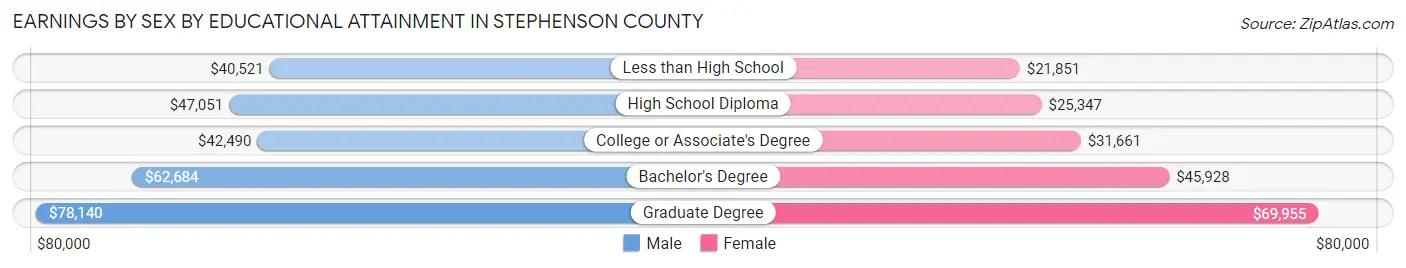
| Educational Attainment | Male Income | Female Income |
| Less than High School | $40,521 | $21,851 |
| High School Diploma | $47,051 | $25,347 |
| College or Associate's Degree | $42,490 | $31,661 |
| Bachelor's Degree | $62,684 | $45,928 |
| Graduate Degree | $78,140 | $69,955 |
| Total | $48,426 | $32,195 |
Family Income in Stephenson County
Family Income Brackets in Stephenson County
According to the Stephenson County family income data, there are 2,656 families falling into the $100,000 to $149,999 income range, which is the most common income bracket and makes up 22.1% of all families. Conversely, the $10,000 to $14,999 income bracket is the least frequent group with only 276 families (2.3%) belonging to this category.
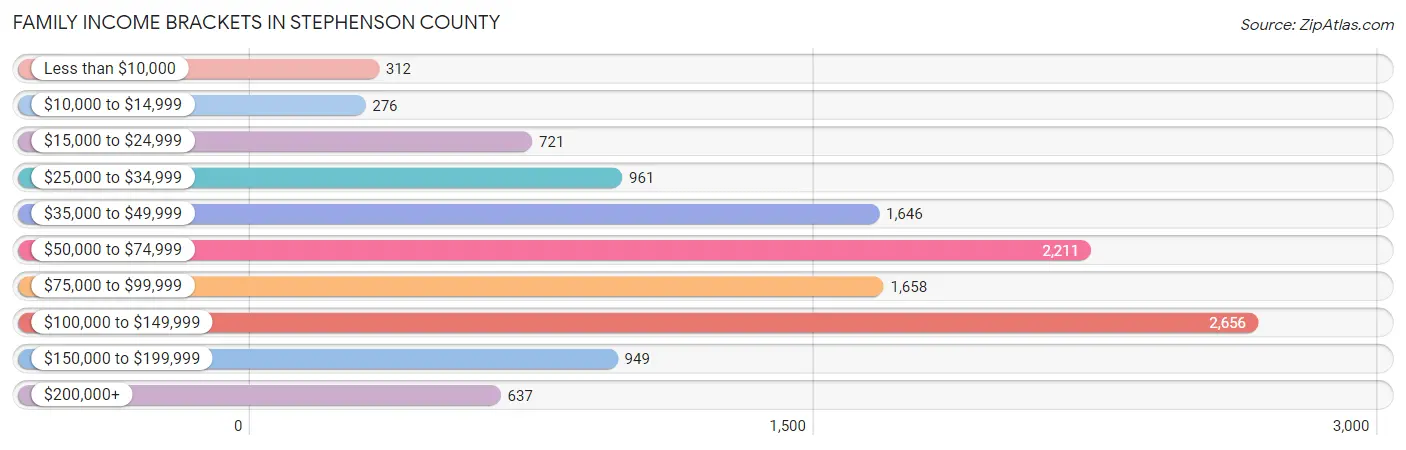
| Income Bracket | # Families | % Families |
| Less than $10,000 | 312 | 2.6% |
| $10,000 to $14,999 | 276 | 2.3% |
| $15,000 to $24,999 | 721 | 6.0% |
| $25,000 to $34,999 | 961 | 8.0% |
| $35,000 to $49,999 | 1,646 | 13.7% |
| $50,000 to $74,999 | 2,211 | 18.4% |
| $75,000 to $99,999 | 1,658 | 13.8% |
| $100,000 to $149,999 | 2,656 | 22.1% |
| $150,000 to $199,999 | 949 | 7.9% |
| $200,000+ | 637 | 5.3% |
Family Income by Famaliy Size in Stephenson County
5-person families (746 | 6.2%) account for the highest median family income in Stephenson County with $98,802 per family, while 2-person families (7,022 | 58.4%) have the highest median income of $34,150 per family member.
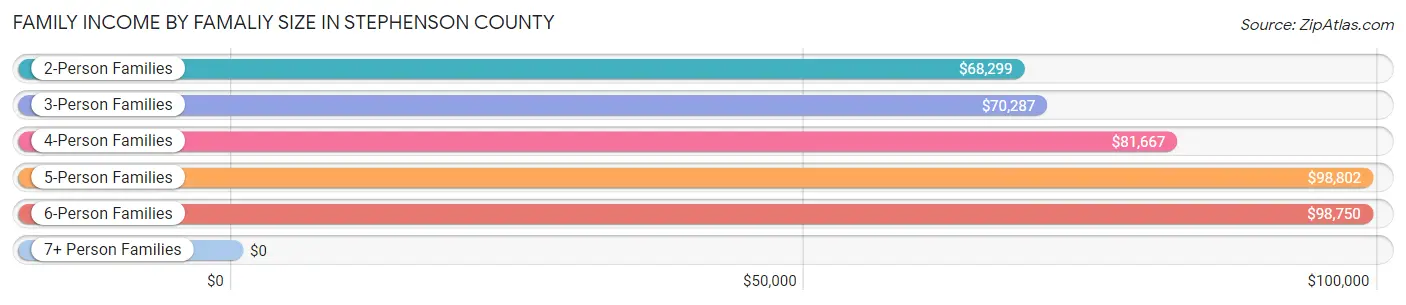
| Income Bracket | # Families | Median Income |
| 2-Person Families | 7,022 (58.4%) | $68,299 |
| 3-Person Families | 2,127 (17.7%) | $70,287 |
| 4-Person Families | 1,746 (14.5%) | $81,667 |
| 5-Person Families | 746 (6.2%) | $98,802 |
| 6-Person Families | 304 (2.5%) | $98,750 |
| 7+ Person Families | 71 (0.6%) | $0 |
| Total | 12,016 (100.0%) | $73,244 |
Family Income by Number of Earners in Stephenson County
The median family income in Stephenson County is $73,244, with families comprising 3+ earners (1,106) having the highest median family income of $126,875, while families with 1 earner (3,714) have the lowest median family income of $48,391, accounting for 9.2% and 30.9% of families, respectively.
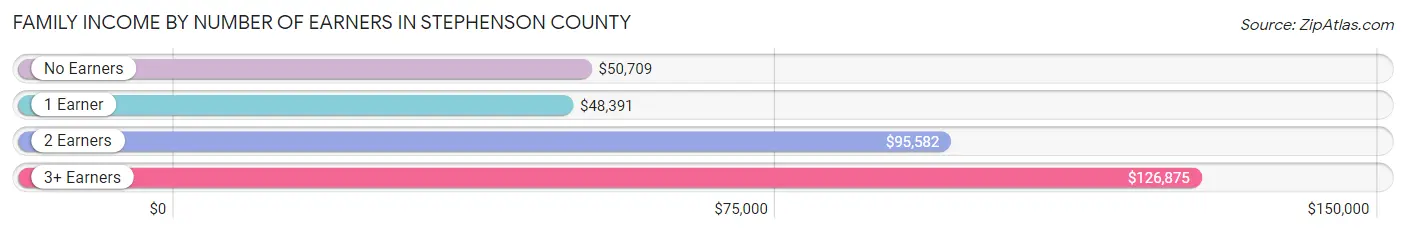
| Number of Earners | # Families | Median Income |
| No Earners | 2,356 (19.6%) | $50,709 |
| 1 Earner | 3,714 (30.9%) | $48,391 |
| 2 Earners | 4,840 (40.3%) | $95,582 |
| 3+ Earners | 1,106 (9.2%) | $126,875 |
| Total | 12,016 (100.0%) | $73,244 |
Household Income in Stephenson County
Household Income Brackets in Stephenson County
With 3,519 households falling in the category, the $50,000 to $74,999 income range is the most frequent in Stephenson County, accounting for 18.2% of all households. In contrast, only 793 households (4.1%) fall into the $200,000+ income bracket, making it the least populous group.
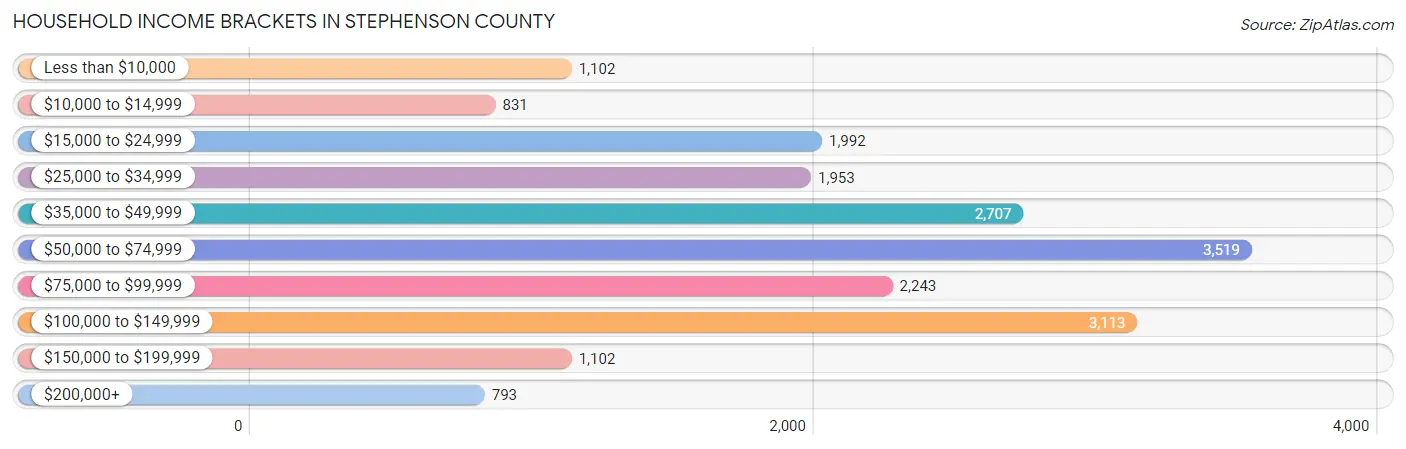
| Income Bracket | # Households | % Households |
| Less than $10,000 | 1,102 | 5.7% |
| $10,000 to $14,999 | 831 | 4.3% |
| $15,000 to $24,999 | 1,992 | 10.3% |
| $25,000 to $34,999 | 1,953 | 10.1% |
| $35,000 to $49,999 | 2,707 | 14.0% |
| $50,000 to $74,999 | 3,519 | 18.2% |
| $75,000 to $99,999 | 2,243 | 11.6% |
| $100,000 to $149,999 | 3,113 | 16.1% |
| $150,000 to $199,999 | 1,102 | 5.7% |
| $200,000+ | 793 | 4.1% |
Household Income by Householder Age in Stephenson County
The median household income in Stephenson County is $57,527, with the highest median household income of $65,259 found in the 45 to 64 years age bracket for the primary householder. A total of 6,826 households (35.3%) fall into this category. Meanwhile, the 15 to 24 years age bracket for the primary householder has the lowest median household income of $31,113, with 1,123 households (5.8%) in this group.
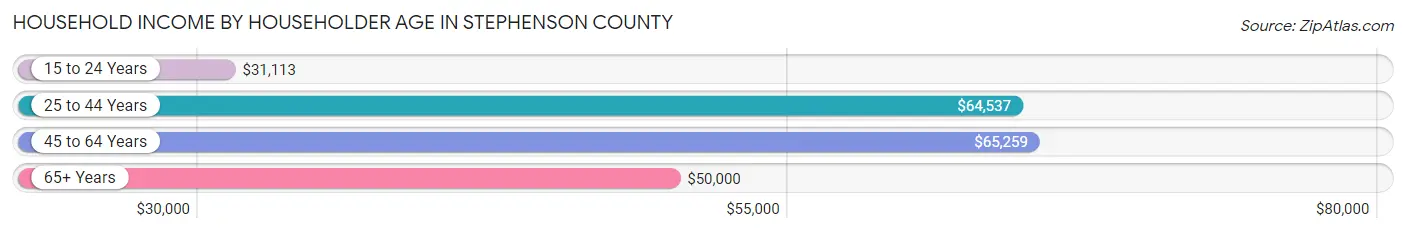
| Income Bracket | # Households | Median Income |
| 15 to 24 Years | 1,123 (5.8%) | $31,113 |
| 25 to 44 Years | 4,704 (24.3%) | $64,537 |
| 45 to 64 Years | 6,826 (35.3%) | $65,259 |
| 65+ Years | 6,684 (34.6%) | $50,000 |
| Total | 19,337 (100.0%) | $57,527 |
Poverty in Stephenson County
Income Below Poverty by Sex and Age in Stephenson County
With 13.0% poverty level for males and 13.7% for females among the residents of Stephenson County, under 5 year old males and 18 to 24 year old females are the most vulnerable to poverty, with 459 males (38.7%) and 467 females (28.6%) in their respective age groups living below the poverty level.
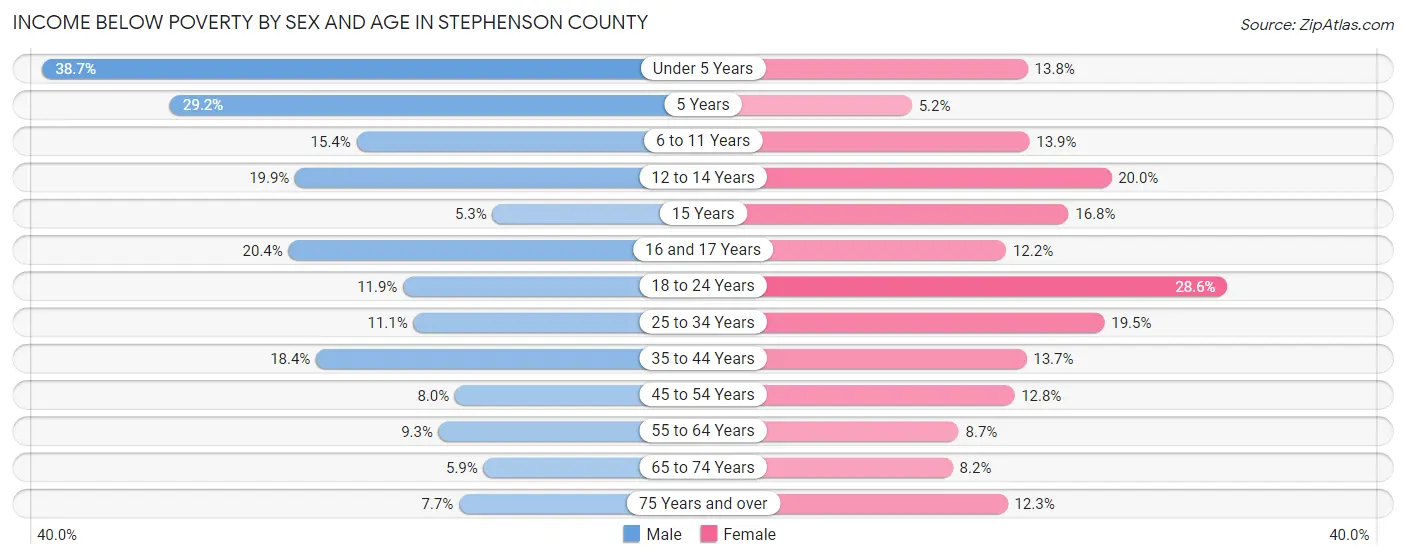
| Age Bracket | Male | Female |
| Under 5 Years | 459 (38.7%) | 164 (13.8%) |
| 5 Years | 92 (29.2%) | 16 (5.2%) |
| 6 to 11 Years | 243 (15.3%) | 205 (13.9%) |
| 12 to 14 Years | 140 (19.9%) | 139 (20.0%) |
| 15 Years | 20 (5.2%) | 37 (16.8%) |
| 16 and 17 Years | 133 (20.4%) | 73 (12.2%) |
| 18 to 24 Years | 206 (11.9%) | 467 (28.6%) |
| 25 to 34 Years | 241 (11.1%) | 436 (19.5%) |
| 35 to 44 Years | 437 (18.3%) | 310 (13.7%) |
| 45 to 54 Years | 205 (8.0%) | 357 (12.8%) |
| 55 to 64 Years | 303 (9.2%) | 284 (8.7%) |
| 65 to 74 Years | 161 (5.9%) | 252 (8.2%) |
| 75 Years and over | 136 (7.7%) | 313 (12.3%) |
| Total | 2,776 (13.0%) | 3,053 (13.7%) |
Income Above Poverty by Sex and Age in Stephenson County
According to the poverty statistics in Stephenson County, males aged 15 years and females aged 5 years are the age groups that are most secure financially, with 94.8% of males and 94.8% of females in these age groups living above the poverty line.
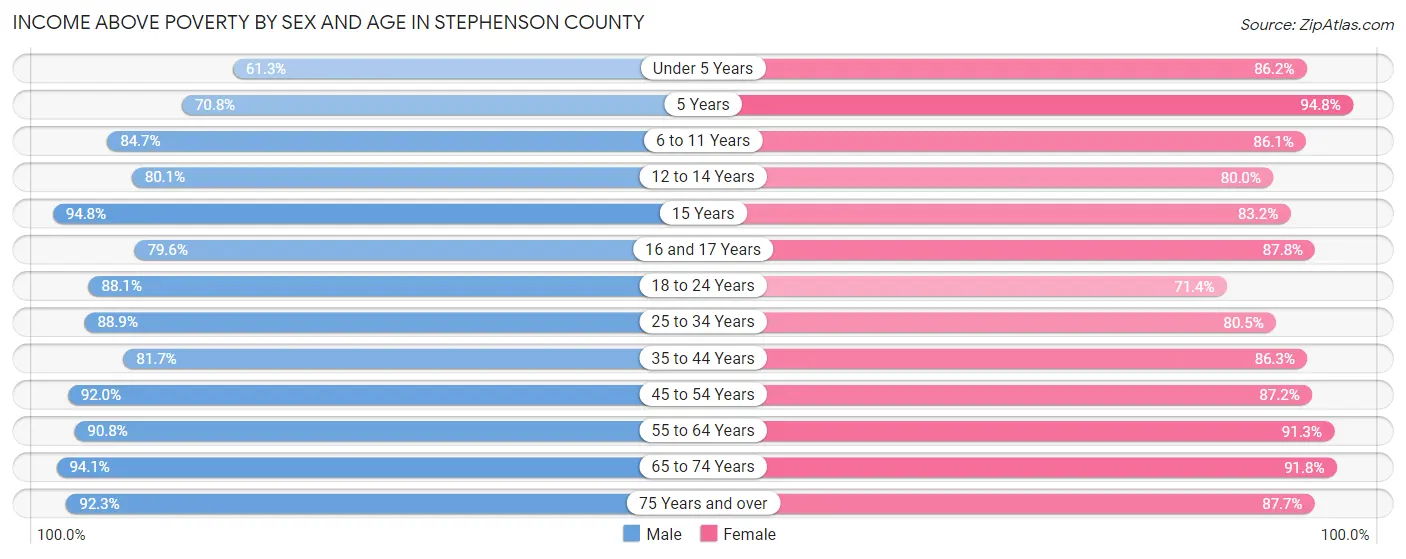
| Age Bracket | Male | Female |
| Under 5 Years | 728 (61.3%) | 1,024 (86.2%) |
| 5 Years | 223 (70.8%) | 292 (94.8%) |
| 6 to 11 Years | 1,340 (84.7%) | 1,268 (86.1%) |
| 12 to 14 Years | 563 (80.1%) | 556 (80.0%) |
| 15 Years | 361 (94.8%) | 183 (83.2%) |
| 16 and 17 Years | 519 (79.6%) | 526 (87.8%) |
| 18 to 24 Years | 1,527 (88.1%) | 1,164 (71.4%) |
| 25 to 34 Years | 1,927 (88.9%) | 1,801 (80.5%) |
| 35 to 44 Years | 1,944 (81.7%) | 1,953 (86.3%) |
| 45 to 54 Years | 2,346 (92.0%) | 2,433 (87.2%) |
| 55 to 64 Years | 2,974 (90.7%) | 2,993 (91.3%) |
| 65 to 74 Years | 2,559 (94.1%) | 2,811 (91.8%) |
| 75 Years and over | 1,622 (92.3%) | 2,231 (87.7%) |
| Total | 18,633 (87.0%) | 19,235 (86.3%) |
Income Below Poverty Among Married-Couple Families in Stephenson County
The poverty statistics for married-couple families in Stephenson County show that 4.8% or 438 of the total 9,110 families live below the poverty line. Families with 5 or more children have the highest poverty rate of 14.3%, comprising of 4 families. On the other hand, families with no children have the lowest poverty rate of 2.7%, which includes 165 families.
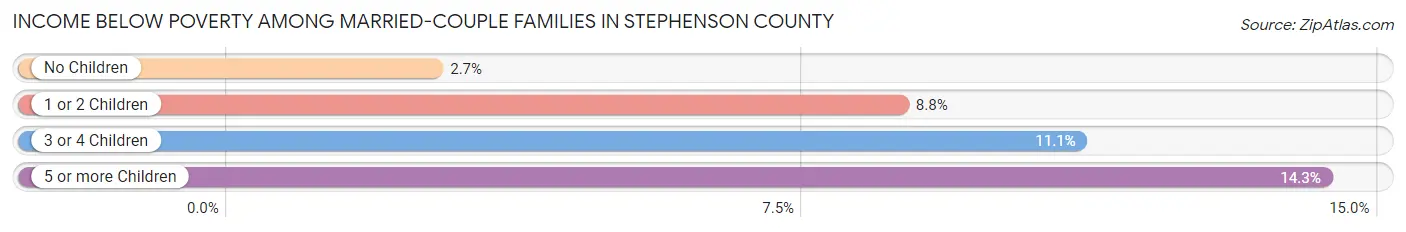
| Children | Above Poverty | Below Poverty |
| No Children | 5,996 (97.3%) | 165 (2.7%) |
| 1 or 2 Children | 2,155 (91.2%) | 207 (8.8%) |
| 3 or 4 Children | 497 (88.9%) | 62 (11.1%) |
| 5 or more Children | 24 (85.7%) | 4 (14.3%) |
| Total | 8,672 (95.2%) | 438 (4.8%) |
Income Below Poverty Among Single-Parent Households in Stephenson County
According to the poverty data in Stephenson County, 16.6% or 136 single-father households and 29.9% or 623 single-mother households are living below the poverty line. Among single-father households, those with 3 or 4 children have the highest poverty rate, with 12 households (80.0%) experiencing poverty. Likewise, among single-mother households, those with 3 or 4 children have the highest poverty rate, with 109 households (53.4%) falling below the poverty line.
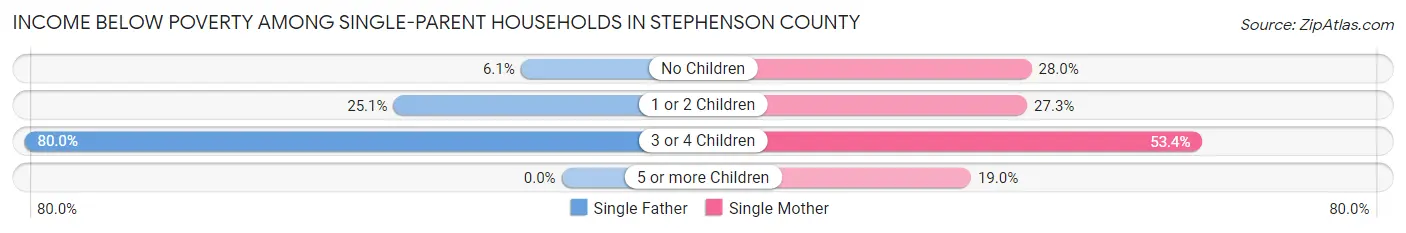
| Children | Single Father | Single Mother |
| No Children | 25 (6.1%) | 182 (28.0%) |
| 1 or 2 Children | 99 (25.1%) | 321 (27.3%) |
| 3 or 4 Children | 12 (80.0%) | 109 (53.4%) |
| 5 or more Children | 0 (0.0%) | 11 (19.0%) |
| Total | 136 (16.6%) | 623 (29.9%) |
Income Below Poverty Among Married-Couple vs Single-Parent Households in Stephenson County
The poverty data for Stephenson County shows that 438 of the married-couple family households (4.8%) and 759 of the single-parent households (26.1%) are living below the poverty level. Within the married-couple family households, those with 5 or more children have the highest poverty rate, with 4 households (14.3%) falling below the poverty line. Among the single-parent households, those with 3 or 4 children have the highest poverty rate, with 121 household (55.2%) living below poverty.
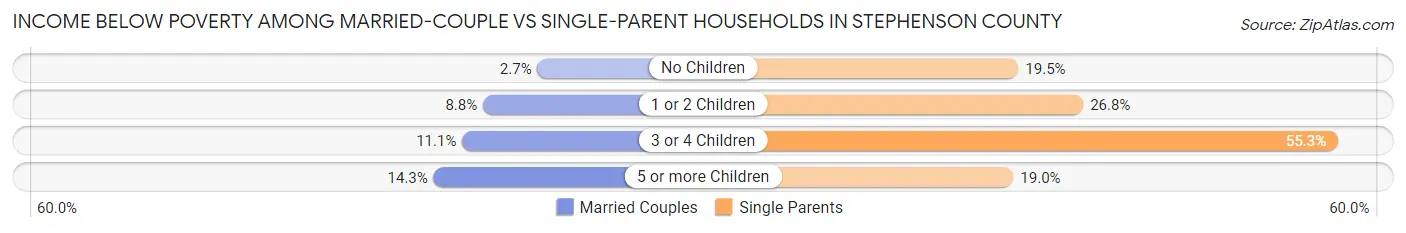
| Children | Married-Couple Families | Single-Parent Households |
| No Children | 165 (2.7%) | 207 (19.5%) |
| 1 or 2 Children | 207 (8.8%) | 420 (26.8%) |
| 3 or 4 Children | 62 (11.1%) | 121 (55.2%) |
| 5 or more Children | 4 (14.3%) | 11 (19.0%) |
| Total | 438 (4.8%) | 759 (26.1%) |
Race in Stephenson County
The most populous races in Stephenson County are White / Caucasian (37,047 | 83.3%), Black / African American (3,861 | 8.7%), and Two or more Races (2,625 | 5.9%).
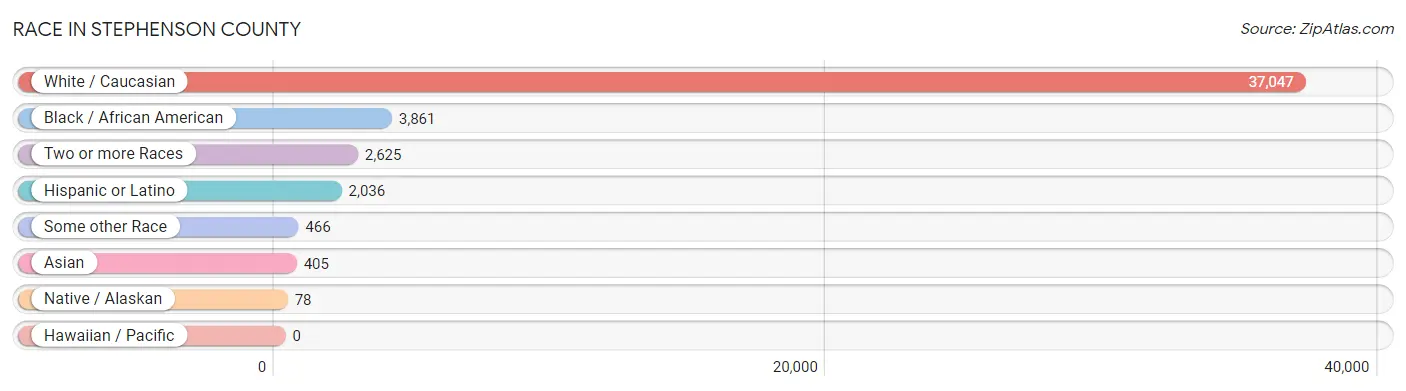
| Race | # Population | % Population |
| Asian | 405 | 0.9% |
| Black / African American | 3,861 | 8.7% |
| Hawaiian / Pacific | 0 | 0.0% |
| Hispanic or Latino | 2,036 | 4.6% |
| Native / Alaskan | 78 | 0.2% |
| White / Caucasian | 37,047 | 83.3% |
| Two or more Races | 2,625 | 5.9% |
| Some other Race | 466 | 1.1% |
| Total | 44,482 | 100.0% |
Ancestry in Stephenson County
The most populous ancestries reported in Stephenson County are German (16,822 | 37.8%), Irish (5,064 | 11.4%), English (3,779 | 8.5%), American (3,216 | 7.2%), and Mexican (1,509 | 3.4%), together accounting for 68.3% of all Stephenson County residents.
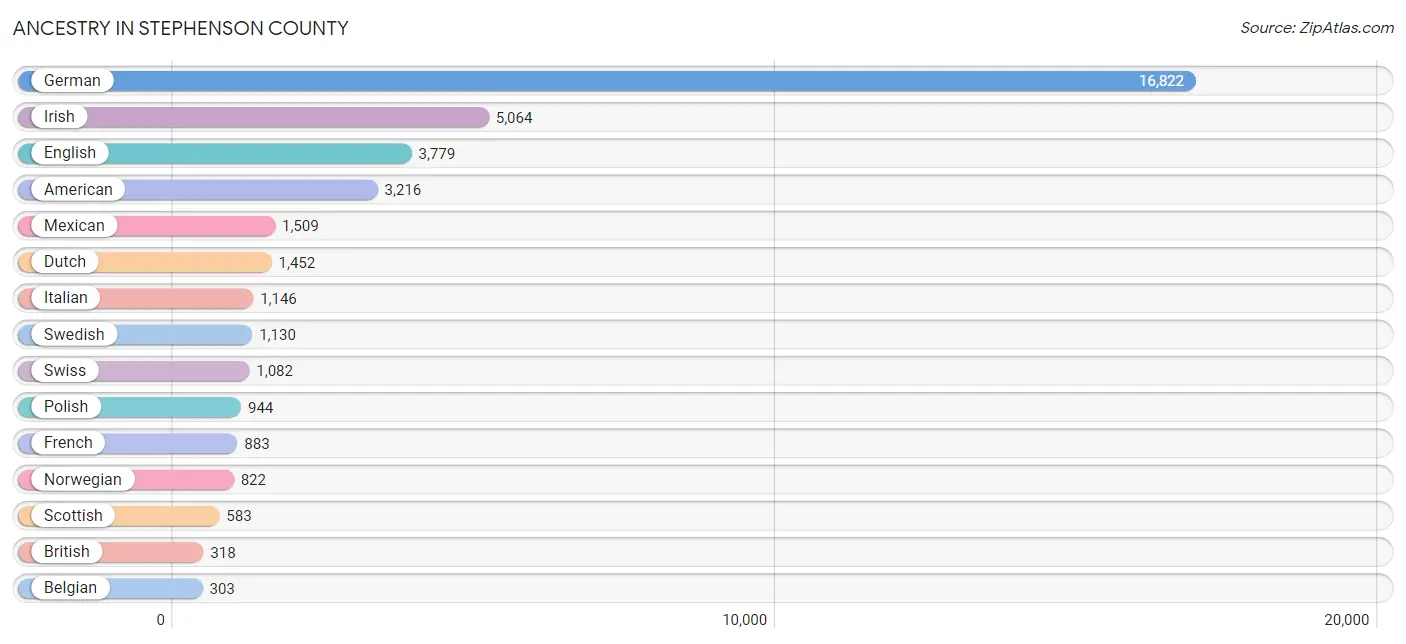
| Ancestry | # Population | % Population |
| African | 211 | 0.5% |
| Albanian | 14 | 0.0% |
| American | 3,216 | 7.2% |
| Arab | 57 | 0.1% |
| Austrian | 46 | 0.1% |
| Belgian | 303 | 0.7% |
| Bhutanese | 36 | 0.1% |
| Blackfeet | 3 | 0.0% |
| British | 318 | 0.7% |
| Burmese | 46 | 0.1% |
| Canadian | 12 | 0.0% |
| Central American Indian | 4 | 0.0% |
| Cherokee | 32 | 0.1% |
| Chinese | 2 | 0.0% |
| Chippewa | 26 | 0.1% |
| Colombian | 37 | 0.1% |
| Croatian | 20 | 0.0% |
| Cuban | 24 | 0.1% |
| Czech | 256 | 0.6% |
| Czechoslovakian | 18 | 0.0% |
| Danish | 181 | 0.4% |
| Dutch | 1,452 | 3.3% |
| Eastern European | 20 | 0.0% |
| Ecuadorian | 21 | 0.1% |
| English | 3,779 | 8.5% |
| Ethiopian | 8 | 0.0% |
| European | 296 | 0.7% |
| Finnish | 42 | 0.1% |
| French | 883 | 2.0% |
| French Canadian | 109 | 0.3% |
| German | 16,822 | 37.8% |
| Greek | 120 | 0.3% |
| Haitian | 1 | 0.0% |
| Hungarian | 67 | 0.2% |
| Indian (Asian) | 176 | 0.4% |
| Iraqi | 4 | 0.0% |
| Irish | 5,064 | 11.4% |
| Iroquois | 14 | 0.0% |
| Italian | 1,146 | 2.6% |
| Korean | 111 | 0.3% |
| Lebanese | 9 | 0.0% |
| Lithuanian | 127 | 0.3% |
| Macedonian | 5 | 0.0% |
| Mexican | 1,509 | 3.4% |
| Mexican American Indian | 50 | 0.1% |
| Native Hawaiian | 2 | 0.0% |
| Northern European | 46 | 0.1% |
| Norwegian | 822 | 1.8% |
| Pennsylvania German | 101 | 0.2% |
| Peruvian | 89 | 0.2% |
| Polish | 944 | 2.1% |
| Portuguese | 7 | 0.0% |
| Potawatomi | 5 | 0.0% |
| Puerto Rican | 264 | 0.6% |
| Romanian | 13 | 0.0% |
| Russian | 57 | 0.1% |
| Scandinavian | 88 | 0.2% |
| Scotch-Irish | 218 | 0.5% |
| Scottish | 583 | 1.3% |
| Sioux | 14 | 0.0% |
| Slovak | 3 | 0.0% |
| South African | 6 | 0.0% |
| South American | 147 | 0.3% |
| Spaniard | 60 | 0.1% |
| Spanish | 24 | 0.1% |
| Sri Lankan | 12 | 0.0% |
| Subsaharan African | 234 | 0.5% |
| Swedish | 1,130 | 2.5% |
| Swiss | 1,082 | 2.4% |
| Thai | 103 | 0.2% |
| Ukrainian | 11 | 0.0% |
| Welsh | 274 | 0.6% |
| Yugoslavian | 8 | 0.0% | View All 73 Rows |
Immigrants in Stephenson County
The most numerous immigrant groups reported in Stephenson County came from Latin America (358 | 0.8%), Europe (338 | 0.8%), Asia (303 | 0.7%), Central America (292 | 0.7%), and Mexico (292 | 0.7%), together accounting for 3.6% of all Stephenson County residents.
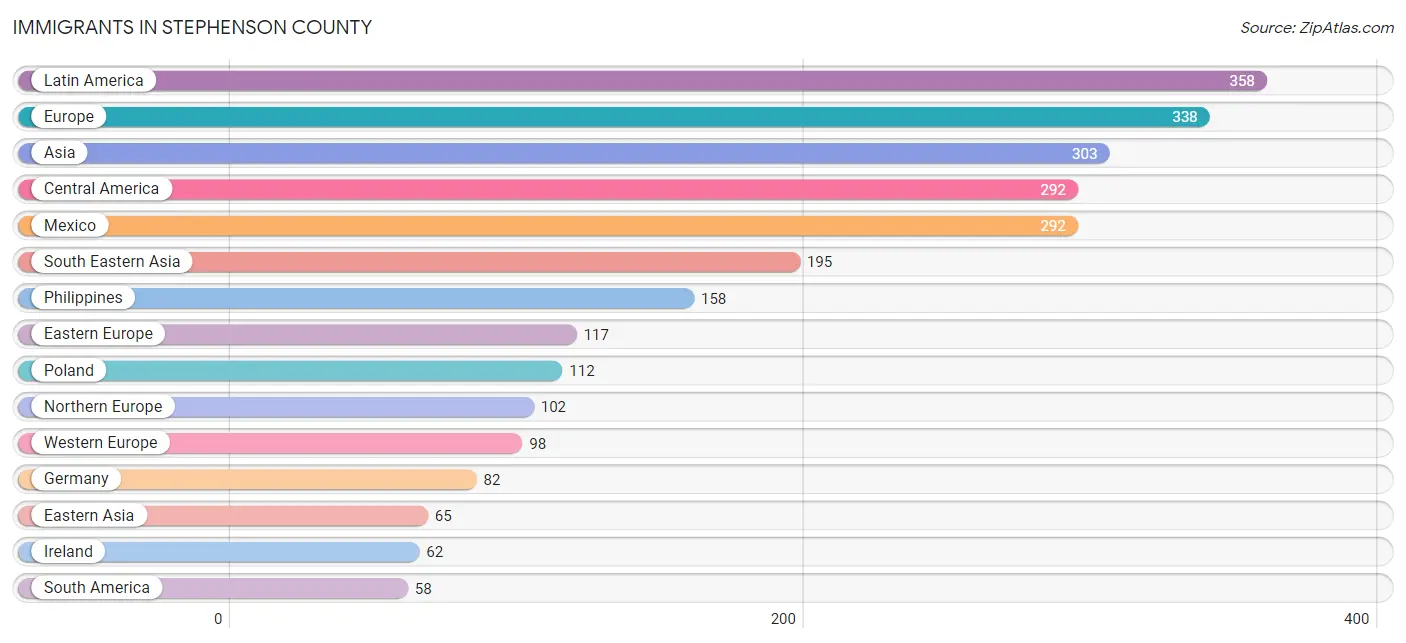
| Immigration Origin | # Population | % Population |
| Africa | 31 | 0.1% |
| Albania | 5 | 0.0% |
| Asia | 303 | 0.7% |
| Canada | 25 | 0.1% |
| Caribbean | 8 | 0.0% |
| Central America | 292 | 0.7% |
| China | 13 | 0.0% |
| Colombia | 37 | 0.1% |
| Cuba | 8 | 0.0% |
| Eastern Africa | 25 | 0.1% |
| Eastern Asia | 65 | 0.2% |
| Eastern Europe | 117 | 0.3% |
| Ecuador | 21 | 0.1% |
| England | 17 | 0.0% |
| Ethiopia | 8 | 0.0% |
| Europe | 338 | 0.8% |
| France | 9 | 0.0% |
| Germany | 82 | 0.2% |
| Greece | 21 | 0.1% |
| India | 36 | 0.1% |
| Iraq | 4 | 0.0% |
| Ireland | 62 | 0.1% |
| Japan | 24 | 0.1% |
| Kenya | 17 | 0.0% |
| Korea | 28 | 0.1% |
| Laos | 25 | 0.1% |
| Latin America | 358 | 0.8% |
| Mexico | 292 | 0.7% |
| Northern Europe | 102 | 0.2% |
| Pakistan | 3 | 0.0% |
| Philippines | 158 | 0.4% |
| Poland | 112 | 0.3% |
| South Africa | 6 | 0.0% |
| South America | 58 | 0.1% |
| South Central Asia | 39 | 0.1% |
| South Eastern Asia | 195 | 0.4% |
| Southern Europe | 21 | 0.1% |
| Switzerland | 7 | 0.0% |
| Vietnam | 12 | 0.0% |
| Western Asia | 4 | 0.0% |
| Western Europe | 98 | 0.2% | View All 41 Rows |
Sex and Age in Stephenson County
Sex and Age in Stephenson County
The most populous age groups in Stephenson County are 40 to 44 Years (1,692 | 7.8%) for men and 60 to 64 Years (1,772 | 7.8%) for women.
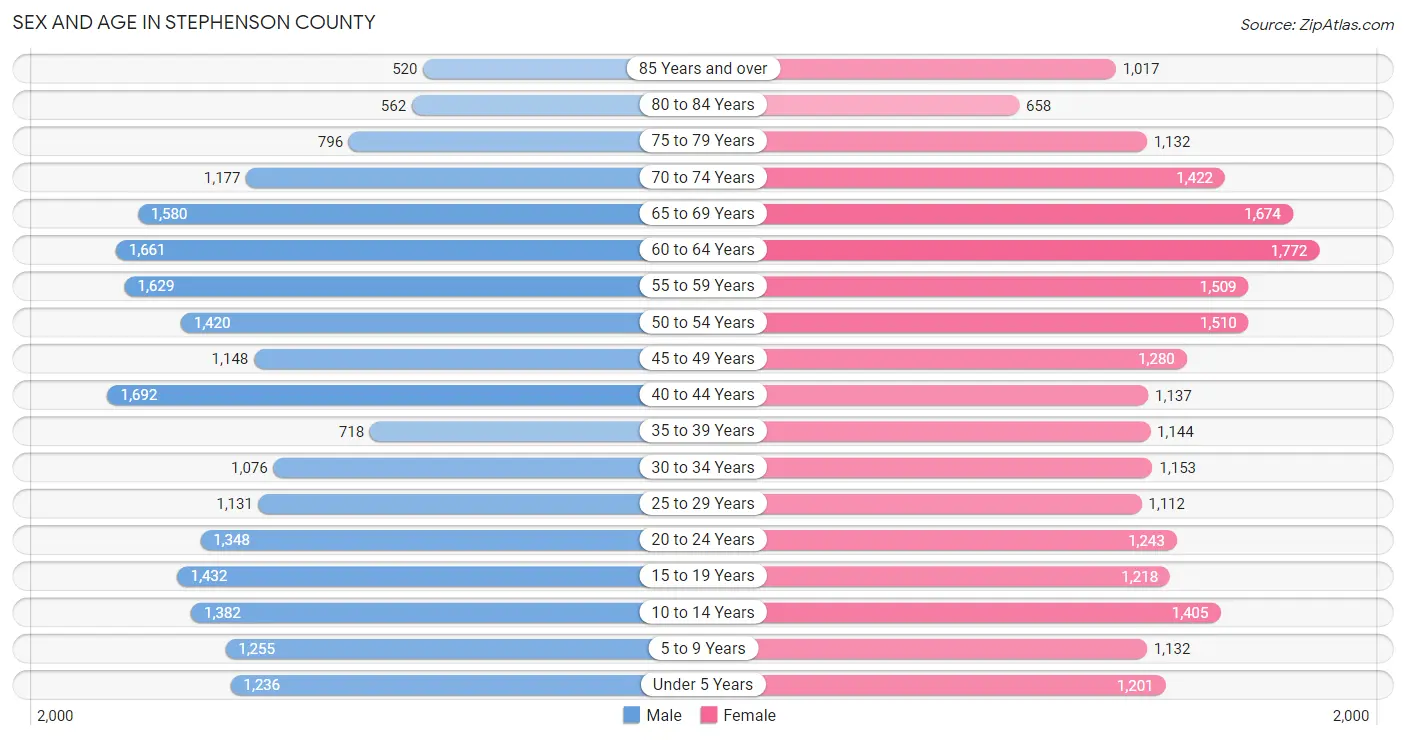
| Age Bracket | Male | Female |
| Under 5 Years | 1,236 (5.7%) | 1,201 (5.3%) |
| 5 to 9 Years | 1,255 (5.8%) | 1,132 (5.0%) |
| 10 to 14 Years | 1,382 (6.4%) | 1,405 (6.2%) |
| 15 to 19 Years | 1,432 (6.6%) | 1,218 (5.4%) |
| 20 to 24 Years | 1,348 (6.2%) | 1,243 (5.5%) |
| 25 to 29 Years | 1,131 (5.2%) | 1,112 (4.9%) |
| 30 to 34 Years | 1,076 (4.9%) | 1,153 (5.1%) |
| 35 to 39 Years | 718 (3.3%) | 1,144 (5.0%) |
| 40 to 44 Years | 1,692 (7.8%) | 1,137 (5.0%) |
| 45 to 49 Years | 1,148 (5.3%) | 1,280 (5.6%) |
| 50 to 54 Years | 1,420 (6.5%) | 1,510 (6.7%) |
| 55 to 59 Years | 1,629 (7.5%) | 1,509 (6.6%) |
| 60 to 64 Years | 1,661 (7.6%) | 1,772 (7.8%) |
| 65 to 69 Years | 1,580 (7.3%) | 1,674 (7.4%) |
| 70 to 74 Years | 1,177 (5.4%) | 1,422 (6.3%) |
| 75 to 79 Years | 796 (3.7%) | 1,132 (5.0%) |
| 80 to 84 Years | 562 (2.6%) | 658 (2.9%) |
| 85 Years and over | 520 (2.4%) | 1,017 (4.5%) |
| Total | 21,763 (100.0%) | 22,719 (100.0%) |
Families and Households in Stephenson County
Median Family Size in Stephenson County
The median family size in Stephenson County is 2.82 persons per family, with single female/mother families (2,086 | 17.4%) accounting for the largest median family size of 2.97 persons per family. On the other hand, single male/father families (820 | 6.8%) represent the smallest median family size with 2.49 persons per family.
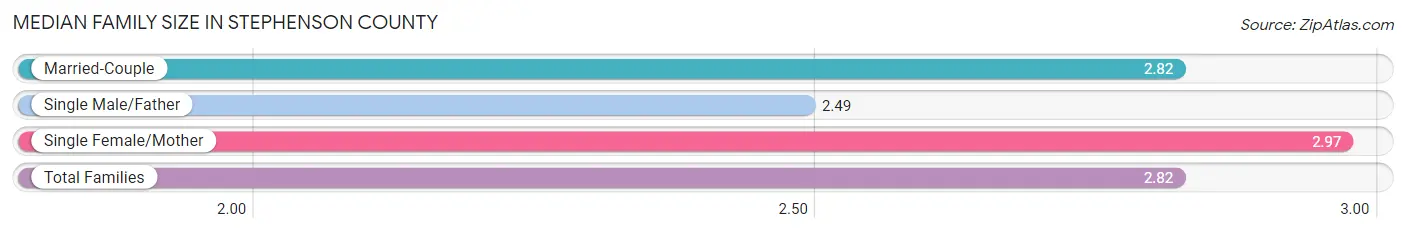
| Family Type | # Families | Family Size |
| Married-Couple | 9,110 (75.8%) | 2.82 |
| Single Male/Father | 820 (6.8%) | 2.49 |
| Single Female/Mother | 2,086 (17.4%) | 2.97 |
| Total Families | 12,016 (100.0%) | 2.82 |
Median Household Size in Stephenson County
The median household size in Stephenson County is 2.26 persons per household, with single male/father households (820 | 4.2%) accounting for the largest median household size of 3.33 persons per household. non-family households (7,321 | 37.9%) represent the smallest median household size with 1.16 persons per household.
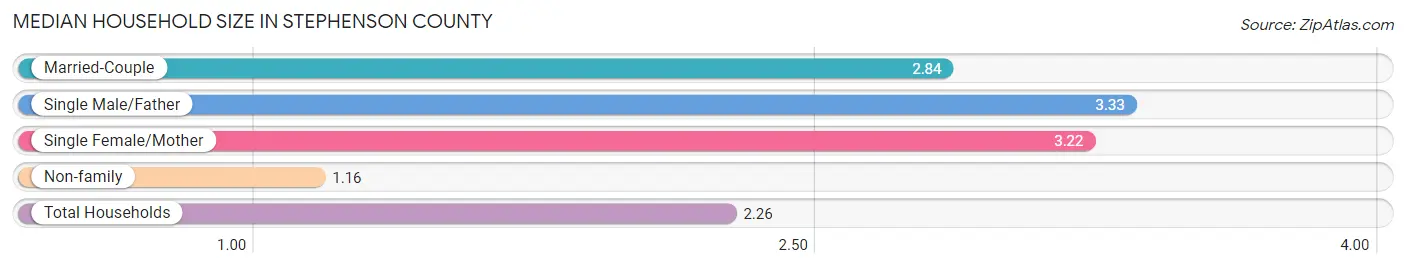
| Household Type | # Households | Household Size |
| Married-Couple | 9,110 (47.1%) | 2.84 |
| Single Male/Father | 820 (4.2%) | 3.33 |
| Single Female/Mother | 2,086 (10.8%) | 3.22 |
| Non-family | 7,321 (37.9%) | 1.16 |
| Total Households | 19,337 (100.0%) | 2.26 |
Household Size by Marriage Status in Stephenson County
Out of a total of 19,337 households in Stephenson County, 12,016 (62.1%) are family households, while 7,321 (37.9%) are nonfamily households. The most numerous type of family households are 2-person households, comprising 6,470, and the most common type of nonfamily households are 1-person households, comprising 6,262.
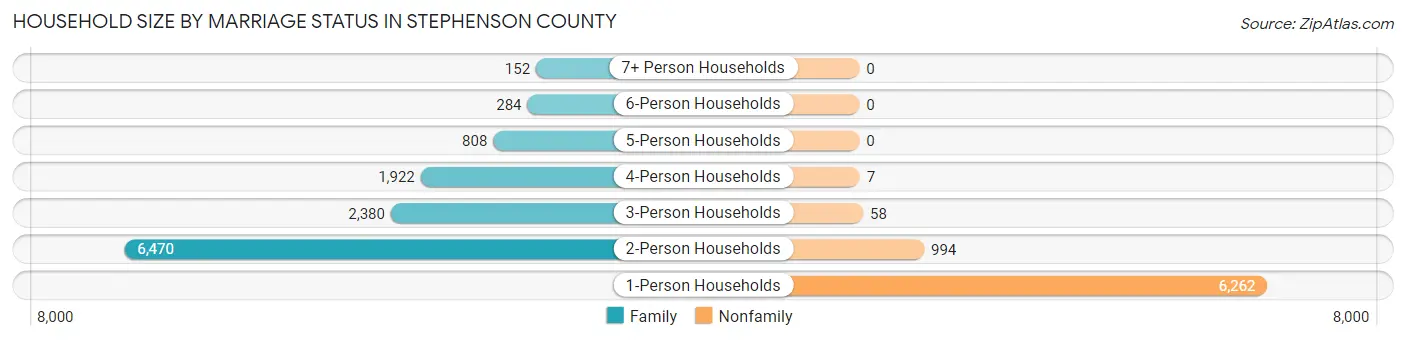
| Household Size | Family Households | Nonfamily Households |
| 1-Person Households | - | 6,262 (32.4%) |
| 2-Person Households | 6,470 (33.5%) | 994 (5.1%) |
| 3-Person Households | 2,380 (12.3%) | 58 (0.3%) |
| 4-Person Households | 1,922 (9.9%) | 7 (0.0%) |
| 5-Person Households | 808 (4.2%) | 0 (0.0%) |
| 6-Person Households | 284 (1.5%) | 0 (0.0%) |
| 7+ Person Households | 152 (0.8%) | 0 (0.0%) |
| Total | 12,016 (62.1%) | 7,321 (37.9%) |
Female Fertility in Stephenson County
Fertility by Age in Stephenson County
Average fertility rate in Stephenson County is 63.0 births per 1,000 women. Women in the age bracket of 20 to 34 years have the highest fertility rate with 117.0 births per 1,000 women. Women in the age bracket of 20 to 34 years acount for 76.2% of all women with births.
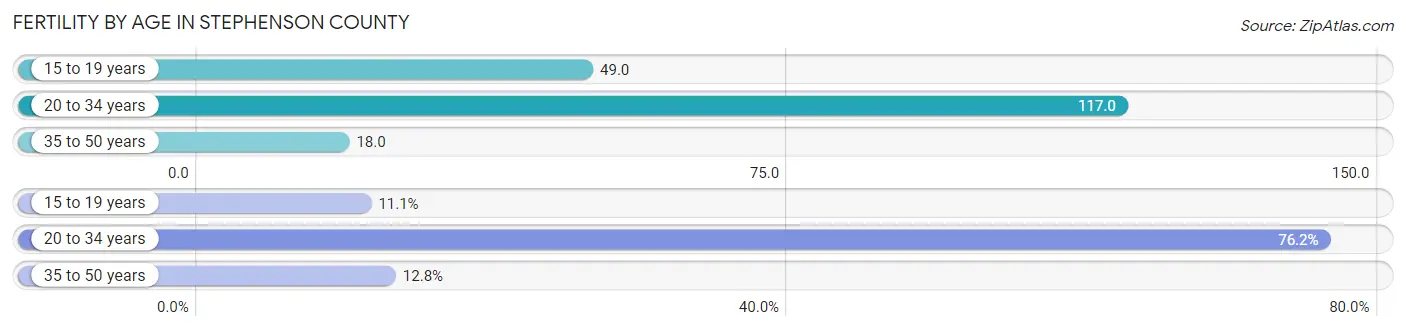
| Age Bracket | Women with Births | Births / 1,000 Women |
| 15 to 19 years | 60 (11.1%) | 49.0 |
| 20 to 34 years | 412 (76.2%) | 117.0 |
| 35 to 50 years | 69 (12.8%) | 18.0 |
| Total | 541 (100.0%) | 63.0 |
Fertility by Age by Marriage Status in Stephenson County
53.6% of women with births (541) in Stephenson County are married. The highest percentage of unmarried women with births falls into 15 to 19 years age bracket with 100.0% of them unmarried at the time of birth, while the lowest percentage of unmarried women with births belong to 20 to 34 years age bracket with 38.3% of them unmarried.
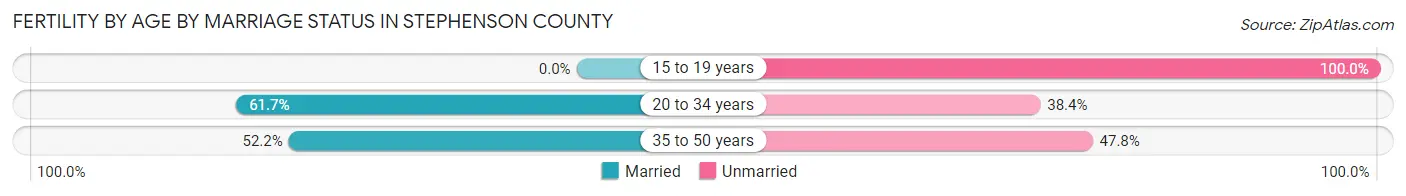
| Age Bracket | Married | Unmarried |
| 15 to 19 years | 0 (0.0%) | 60 (100.0%) |
| 20 to 34 years | 254 (61.7%) | 158 (38.4%) |
| 35 to 50 years | 36 (52.2%) | 33 (47.8%) |
| Total | 290 (53.6%) | 251 (46.4%) |
Fertility by Education in Stephenson County
Average fertility rate in Stephenson County is 63.0 births per 1,000 women. Women with the education attainment of high school diploma have the highest fertility rate of 99.0 births per 1,000 women, while women with the education attainment of graduate degree have the lowest fertility at 13.0 births per 1,000 women. Women with the education attainment of college or associate's degree represent 43.8% of all women with births.
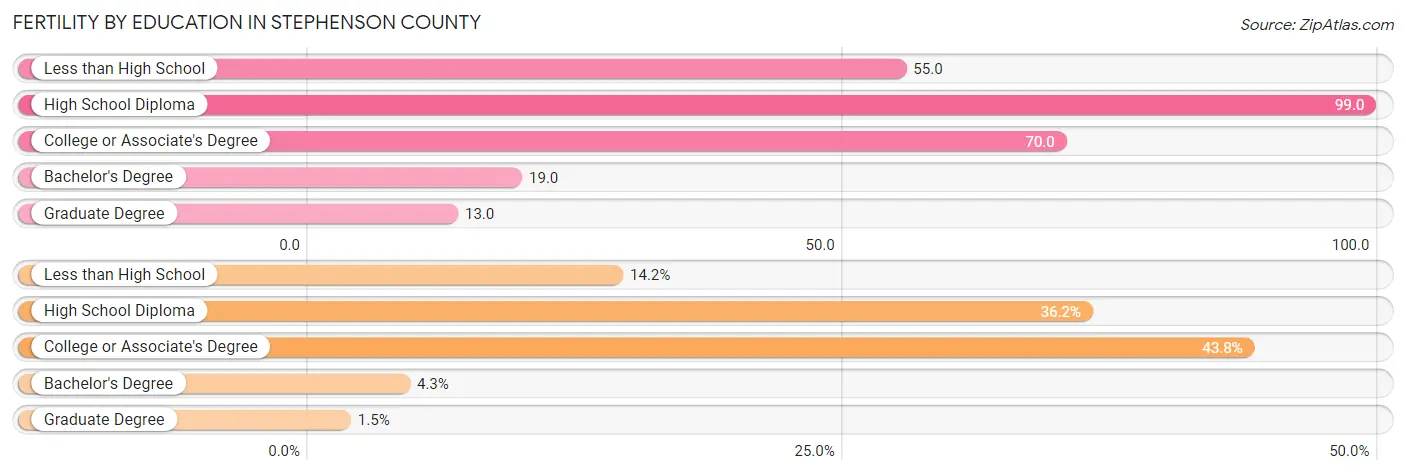
| Educational Attainment | Women with Births | Births / 1,000 Women |
| Less than High School | 77 (14.2%) | 55.0 |
| High School Diploma | 196 (36.2%) | 99.0 |
| College or Associate's Degree | 237 (43.8%) | 70.0 |
| Bachelor's Degree | 23 (4.3%) | 19.0 |
| Graduate Degree | 8 (1.5%) | 13.0 |
| Total | 541 (100.0%) | 63.0 |
Fertility by Education by Marriage Status in Stephenson County
46.4% of women with births in Stephenson County are unmarried. Women with the educational attainment of graduate degree are most likely to be married with 100.0% of them married at childbirth, while women with the educational attainment of bachelor's degree are least likely to be married with 91.3% of them unmarried at childbirth.
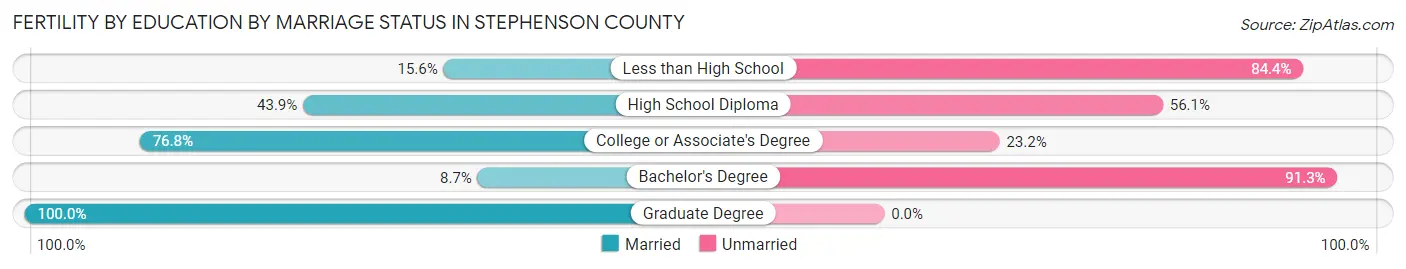
| Educational Attainment | Married | Unmarried |
| Less than High School | 12 (15.6%) | 65 (84.4%) |
| High School Diploma | 86 (43.9%) | 110 (56.1%) |
| College or Associate's Degree | 182 (76.8%) | 55 (23.2%) |
| Bachelor's Degree | 2 (8.7%) | 21 (91.3%) |
| Graduate Degree | 8 (100.0%) | 0 (0.0%) |
| Total | 290 (53.6%) | 251 (46.4%) |
Employment Characteristics in Stephenson County
Employment by Class of Employer in Stephenson County
Among the 20,106 employed individuals in Stephenson County, private company employees (13,133 | 65.3%), not-for-profit organizations (2,186 | 10.9%), and local government employees (1,620 | 8.1%) make up the most common classes of employment.
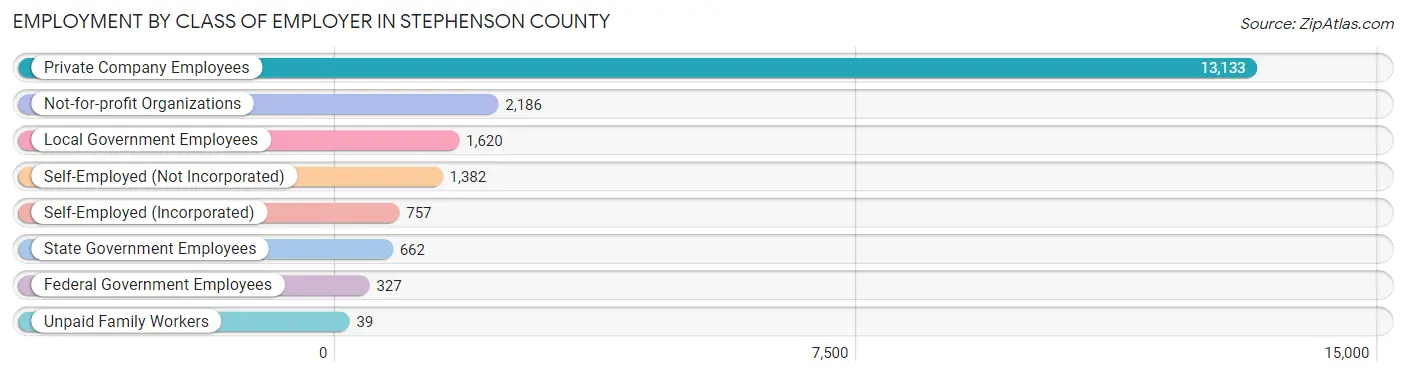
| Employer Class | # Employees | % Employees |
| Private Company Employees | 13,133 | 65.3% |
| Self-Employed (Incorporated) | 757 | 3.8% |
| Self-Employed (Not Incorporated) | 1,382 | 6.9% |
| Not-for-profit Organizations | 2,186 | 10.9% |
| Local Government Employees | 1,620 | 8.1% |
| State Government Employees | 662 | 3.3% |
| Federal Government Employees | 327 | 1.6% |
| Unpaid Family Workers | 39 | 0.2% |
| Total | 20,106 | 100.0% |
Employment Status by Age in Stephenson County
According to the labor force statistics for Stephenson County, out of the total population over 16 years of age (36,267), 59.3% or 21,506 individuals are in the labor force, with 5.3% or 1,140 of them unemployed. The age group with the highest labor force participation rate is 20 to 24 years, with 89.7% or 2,324 individuals in the labor force. Within the labor force, the 20 to 24 years age range has the highest percentage of unemployed individuals, with 14.5% or 337 of them being unemployed.
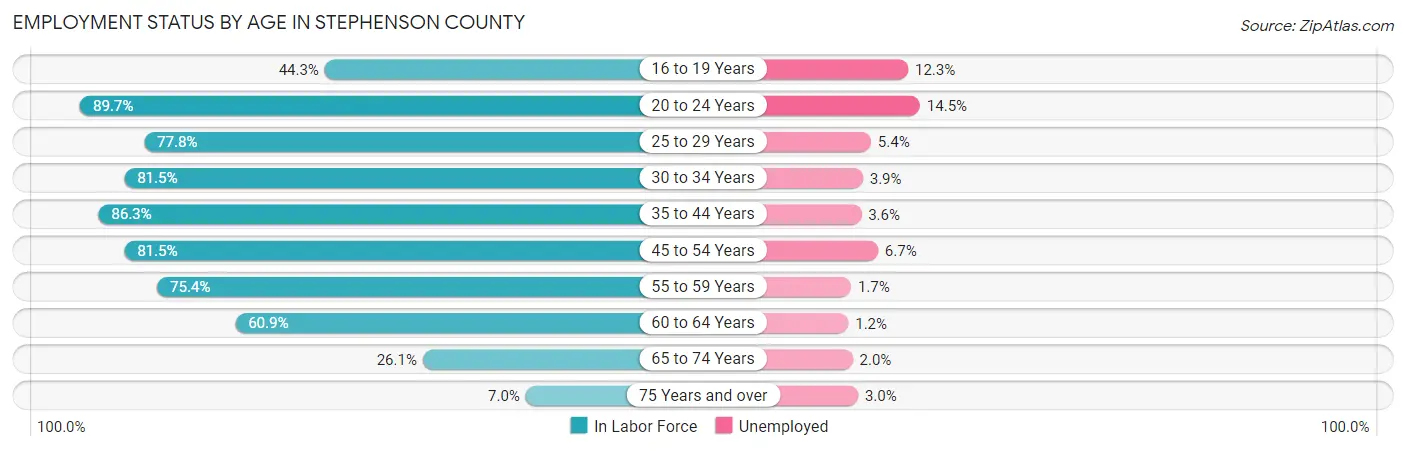
| Age Bracket | In Labor Force | Unemployed |
| 16 to 19 Years | 906 (44.3%) | 111 (12.3%) |
| 20 to 24 Years | 2,324 (89.7%) | 337 (14.5%) |
| 25 to 29 Years | 1,745 (77.8%) | 94 (5.4%) |
| 30 to 34 Years | 1,817 (81.5%) | 71 (3.9%) |
| 35 to 44 Years | 4,048 (86.3%) | 146 (3.6%) |
| 45 to 54 Years | 4,367 (81.5%) | 293 (6.7%) |
| 55 to 59 Years | 2,366 (75.4%) | 40 (1.7%) |
| 60 to 64 Years | 2,091 (60.9%) | 25 (1.2%) |
| 65 to 74 Years | 1,528 (26.1%) | 31 (2.0%) |
| 75 Years and over | 328 (7.0%) | 10 (3.0%) |
| Total | 21,506 (59.3%) | 1,140 (5.3%) |
Employment Status by Educational Attainment in Stephenson County
According to labor force statistics for Stephenson County, 77.9% of individuals (16,431) out of the total population between 25 and 64 years of age (21,092) are in the labor force, with 4.1% or 674 of them being unemployed. The group with the highest labor force participation rate are those with the educational attainment of bachelor's degree or higher, with 87.5% or 4,036 individuals in the labor force. Within the labor force, individuals with less than high school education have the highest percentage of unemployment, with 17.5% or 133 of them being unemployed.
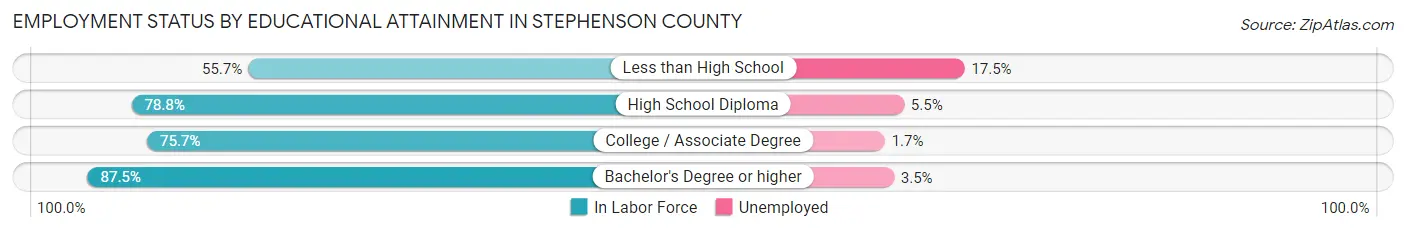
| Educational Attainment | In Labor Force | Unemployed |
| Less than High School | 758 (55.7%) | 238 (17.5%) |
| High School Diploma | 5,139 (78.8%) | 359 (5.5%) |
| College / Associate Degree | 6,507 (75.7%) | 146 (1.7%) |
| Bachelor's Degree or higher | 4,036 (87.5%) | 161 (3.5%) |
| Total | 16,431 (77.9%) | 865 (4.1%) |
Employment Occupations by Sex in Stephenson County
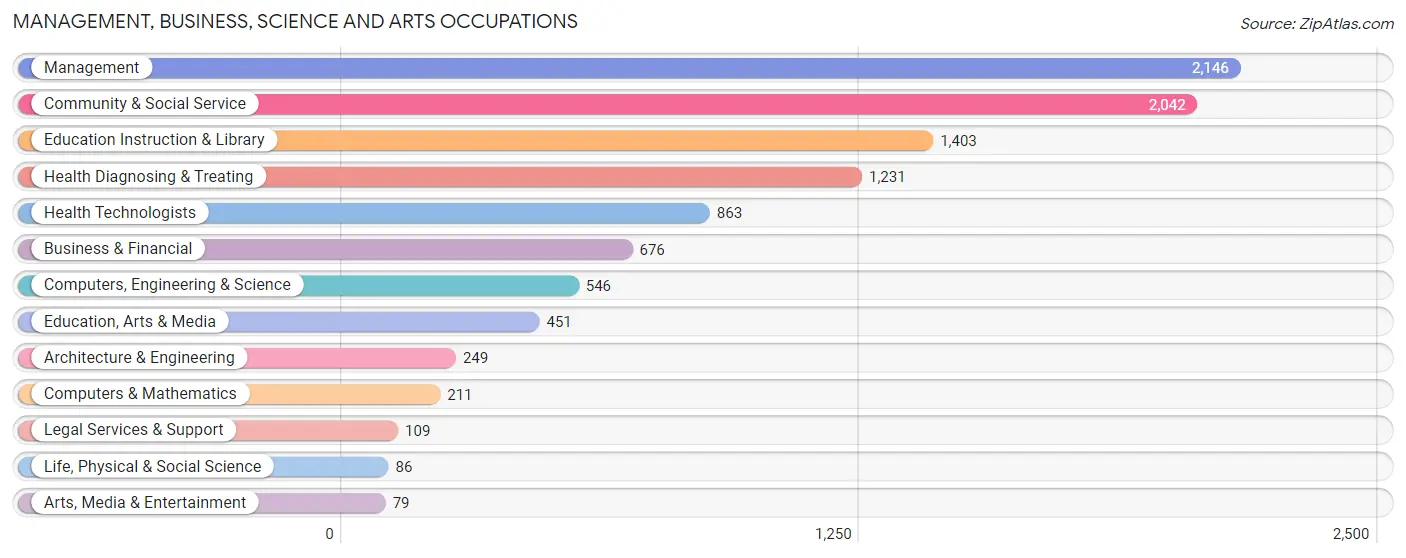
Management, Business, Science and Arts Occupations
The most common Management, Business, Science and Arts occupations in Stephenson County are Management (2,146 | 10.6%), Community & Social Service (2,042 | 10.1%), Education Instruction & Library (1,403 | 6.9%), Health Diagnosing & Treating (1,231 | 6.1%), and Health Technologists (863 | 4.3%).
Management, Business, Science and Arts Occupations by Sex
Within the Management, Business, Science and Arts occupations in Stephenson County, the most male-oriented occupations are Life, Physical & Social Science (94.2%), Architecture & Engineering (90.8%), and Legal Services & Support (88.1%), while the most female-oriented occupations are Health Technologists (83.7%), Health Diagnosing & Treating (81.5%), and Education Instruction & Library (70.7%).
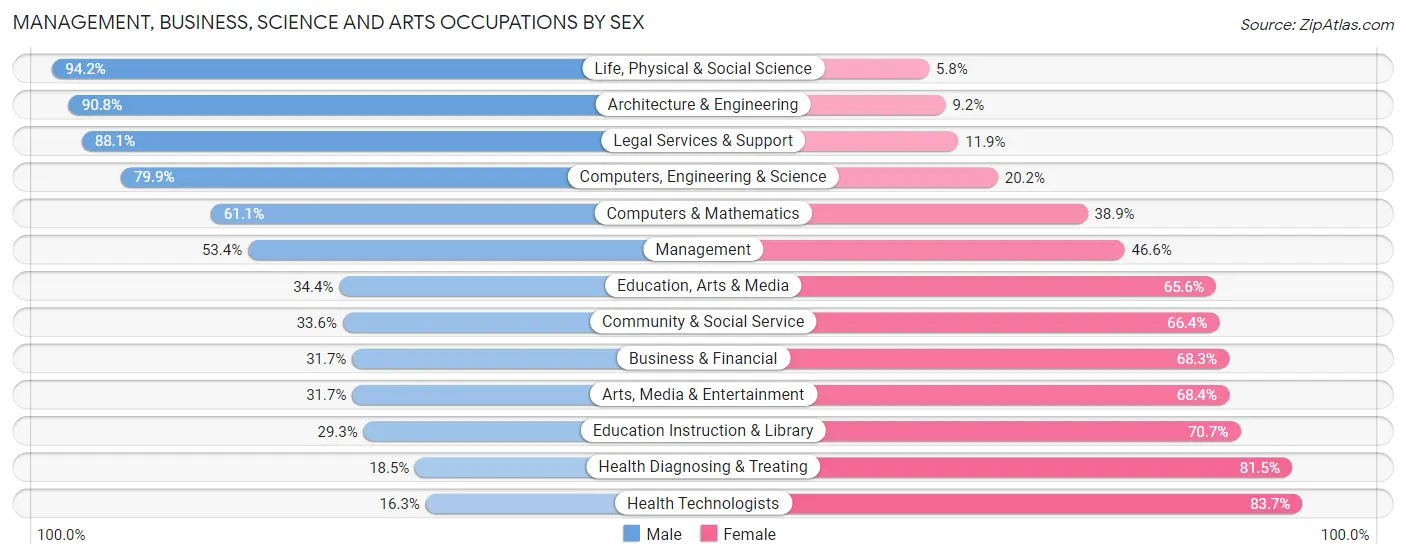
| Occupation | Male | Female |
| Management | 1,146 (53.4%) | 1,000 (46.6%) |
| Business & Financial | 214 (31.7%) | 462 (68.3%) |
| Computers, Engineering & Science | 436 (79.8%) | 110 (20.2%) |
| Computers & Mathematics | 129 (61.1%) | 82 (38.9%) |
| Architecture & Engineering | 226 (90.8%) | 23 (9.2%) |
| Life, Physical & Social Science | 81 (94.2%) | 5 (5.8%) |
| Community & Social Service | 687 (33.6%) | 1,355 (66.4%) |
| Education, Arts & Media | 155 (34.4%) | 296 (65.6%) |
| Legal Services & Support | 96 (88.1%) | 13 (11.9%) |
| Education Instruction & Library | 411 (29.3%) | 992 (70.7%) |
| Arts, Media & Entertainment | 25 (31.7%) | 54 (68.3%) |
| Health Diagnosing & Treating | 228 (18.5%) | 1,003 (81.5%) |
| Health Technologists | 141 (16.3%) | 722 (83.7%) |
| Total (Category) | 2,711 (40.8%) | 3,930 (59.2%) |
| Total (Overall) | 10,151 (50.2%) | 10,070 (49.8%) |
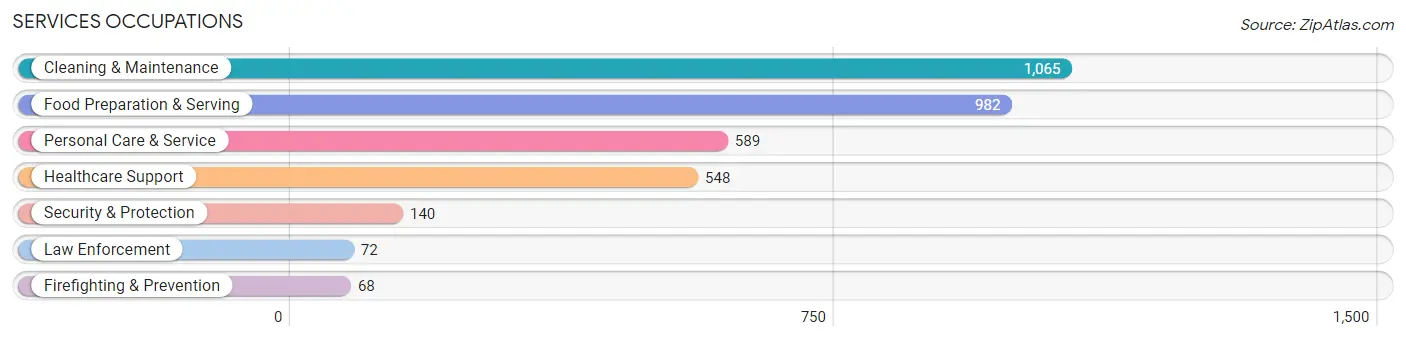
Services Occupations
The most common Services occupations in Stephenson County are Cleaning & Maintenance (1,065 | 5.3%), Food Preparation & Serving (982 | 4.9%), Personal Care & Service (589 | 2.9%), Healthcare Support (548 | 2.7%), and Security & Protection (140 | 0.7%).
Services Occupations by Sex
Within the Services occupations in Stephenson County, the most male-oriented occupations are Law Enforcement (87.5%), Cleaning & Maintenance (71.4%), and Food Preparation & Serving (55.5%), while the most female-oriented occupations are Healthcare Support (92.1%), Personal Care & Service (86.1%), and Firefighting & Prevention (83.8%).
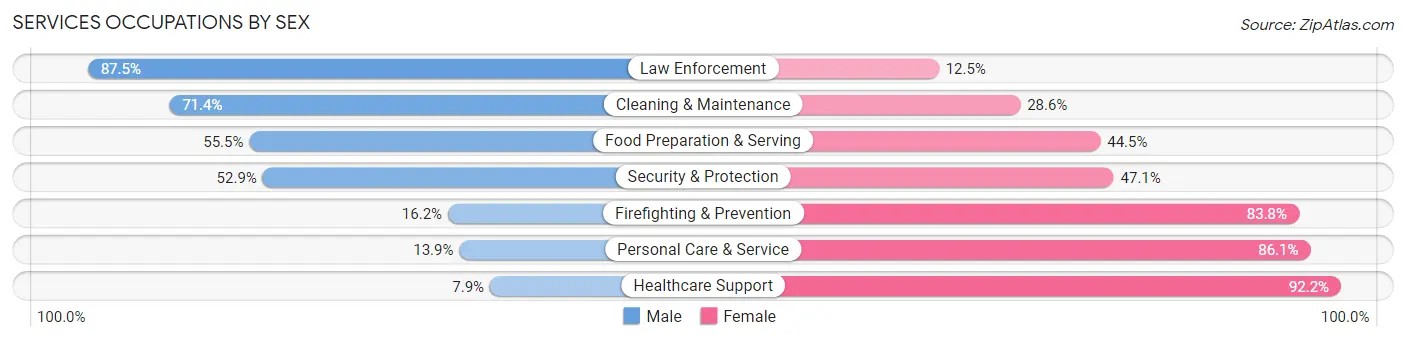
| Occupation | Male | Female |
| Healthcare Support | 43 (7.9%) | 505 (92.1%) |
| Security & Protection | 74 (52.9%) | 66 (47.1%) |
| Firefighting & Prevention | 11 (16.2%) | 57 (83.8%) |
| Law Enforcement | 63 (87.5%) | 9 (12.5%) |
| Food Preparation & Serving | 545 (55.5%) | 437 (44.5%) |
| Cleaning & Maintenance | 760 (71.4%) | 305 (28.6%) |
| Personal Care & Service | 82 (13.9%) | 507 (86.1%) |
| Total (Category) | 1,504 (45.3%) | 1,820 (54.7%) |
| Total (Overall) | 10,151 (50.2%) | 10,070 (49.8%) |
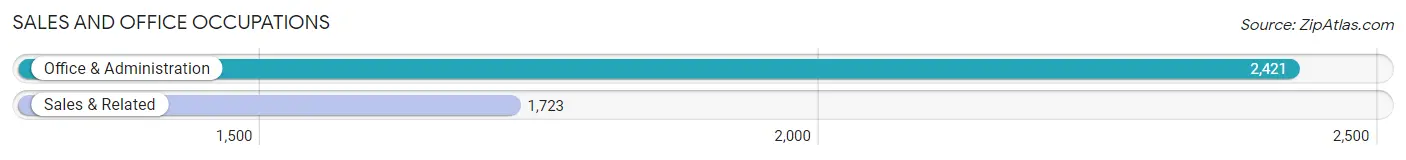
Sales and Office Occupations
The most common Sales and Office occupations in Stephenson County are Office & Administration (2,421 | 12.0%), and Sales & Related (1,723 | 8.5%).
Sales and Office Occupations by Sex
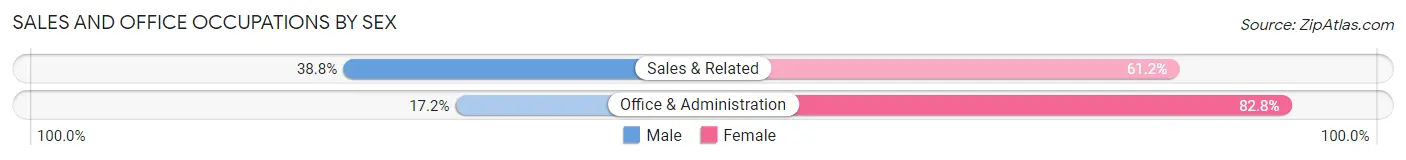
| Occupation | Male | Female |
| Sales & Related | 668 (38.8%) | 1,055 (61.2%) |
| Office & Administration | 416 (17.2%) | 2,005 (82.8%) |
| Total (Category) | 1,084 (26.2%) | 3,060 (73.8%) |
| Total (Overall) | 10,151 (50.2%) | 10,070 (49.8%) |
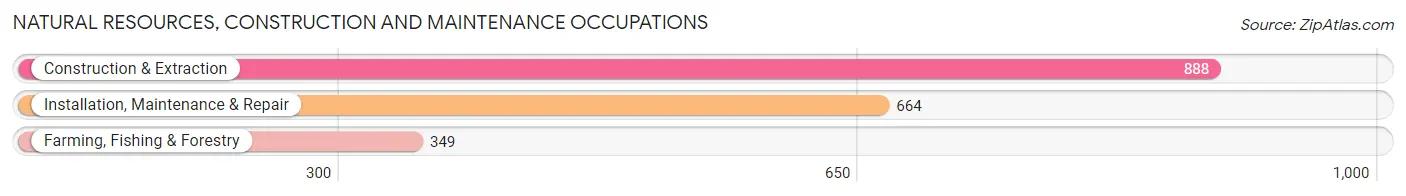
Natural Resources, Construction and Maintenance Occupations
The most common Natural Resources, Construction and Maintenance occupations in Stephenson County are Construction & Extraction (888 | 4.4%), Installation, Maintenance & Repair (664 | 3.3%), and Farming, Fishing & Forestry (349 | 1.7%).
Natural Resources, Construction and Maintenance Occupations by Sex
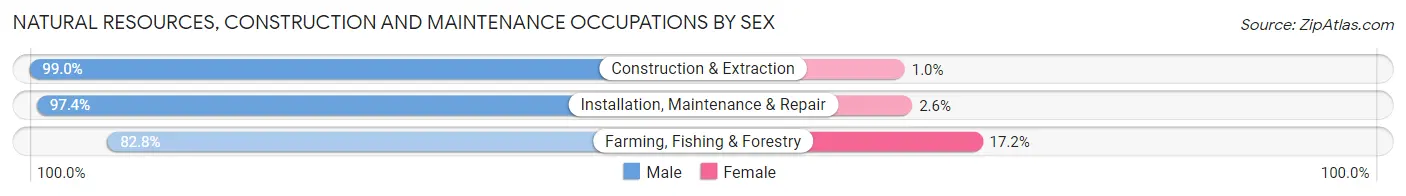
| Occupation | Male | Female |
| Farming, Fishing & Forestry | 289 (82.8%) | 60 (17.2%) |
| Construction & Extraction | 879 (99.0%) | 9 (1.0%) |
| Installation, Maintenance & Repair | 647 (97.4%) | 17 (2.6%) |
| Total (Category) | 1,815 (95.5%) | 86 (4.5%) |
| Total (Overall) | 10,151 (50.2%) | 10,070 (49.8%) |
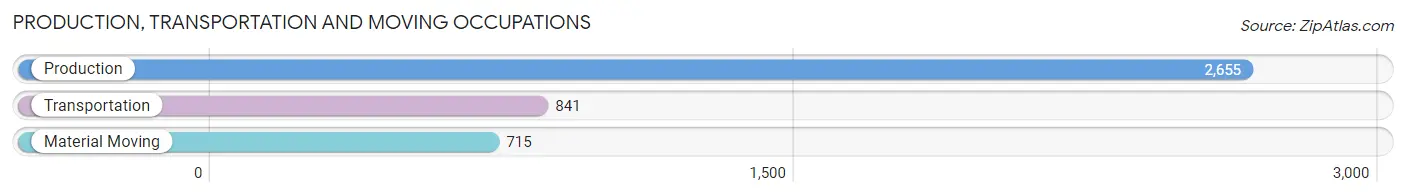
Production, Transportation and Moving Occupations
The most common Production, Transportation and Moving occupations in Stephenson County are Production (2,655 | 13.1%), Transportation (841 | 4.2%), and Material Moving (715 | 3.5%).
Production, Transportation and Moving Occupations by Sex
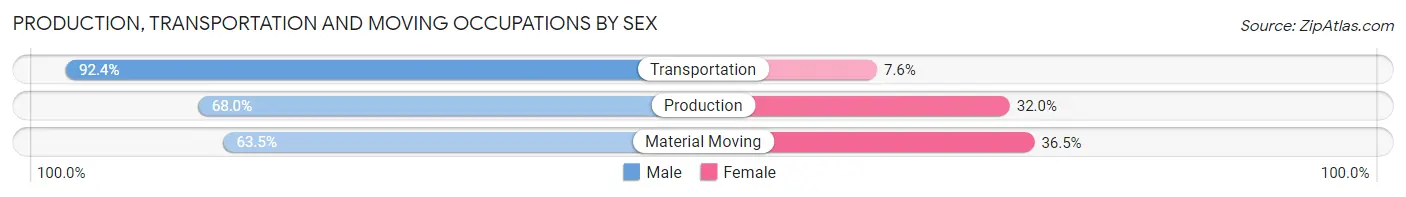
| Occupation | Male | Female |
| Production | 1,806 (68.0%) | 849 (32.0%) |
| Transportation | 777 (92.4%) | 64 (7.6%) |
| Material Moving | 454 (63.5%) | 261 (36.5%) |
| Total (Category) | 3,037 (72.1%) | 1,174 (27.9%) |
| Total (Overall) | 10,151 (50.2%) | 10,070 (49.8%) |
Employment Industries by Sex in Stephenson County
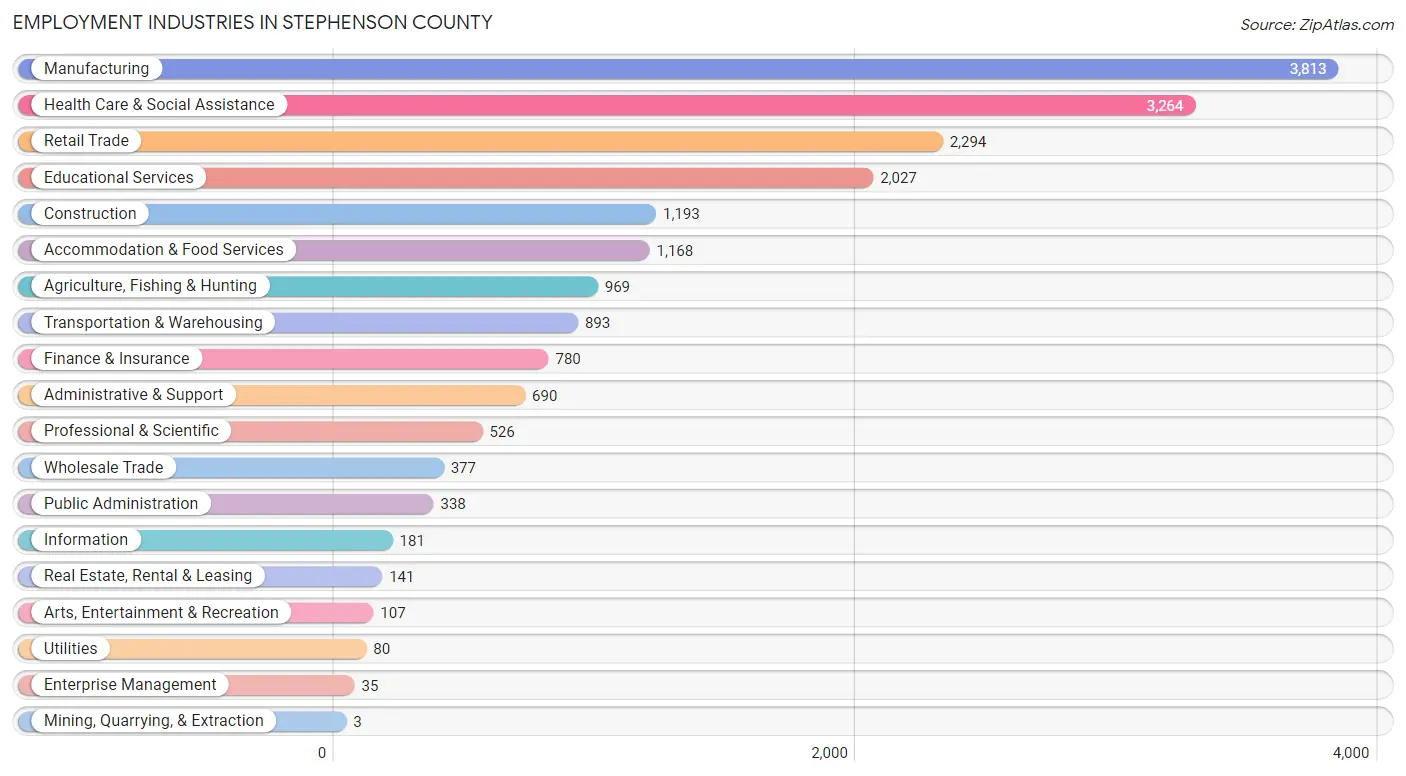
Employment Industries in Stephenson County
The major employment industries in Stephenson County include Manufacturing (3,813 | 18.9%), Health Care & Social Assistance (3,264 | 16.1%), Retail Trade (2,294 | 11.3%), Educational Services (2,027 | 10.0%), and Construction (1,193 | 5.9%).
Employment Industries by Sex in Stephenson County
The Stephenson County industries that see more men than women are Utilities (100.0%), Construction (92.5%), and Agriculture, Fishing & Hunting (84.7%), whereas the industries that tend to have a higher number of women are Mining, Quarrying, & Extraction (100.0%), Enterprise Management (97.1%), and Health Care & Social Assistance (83.4%).
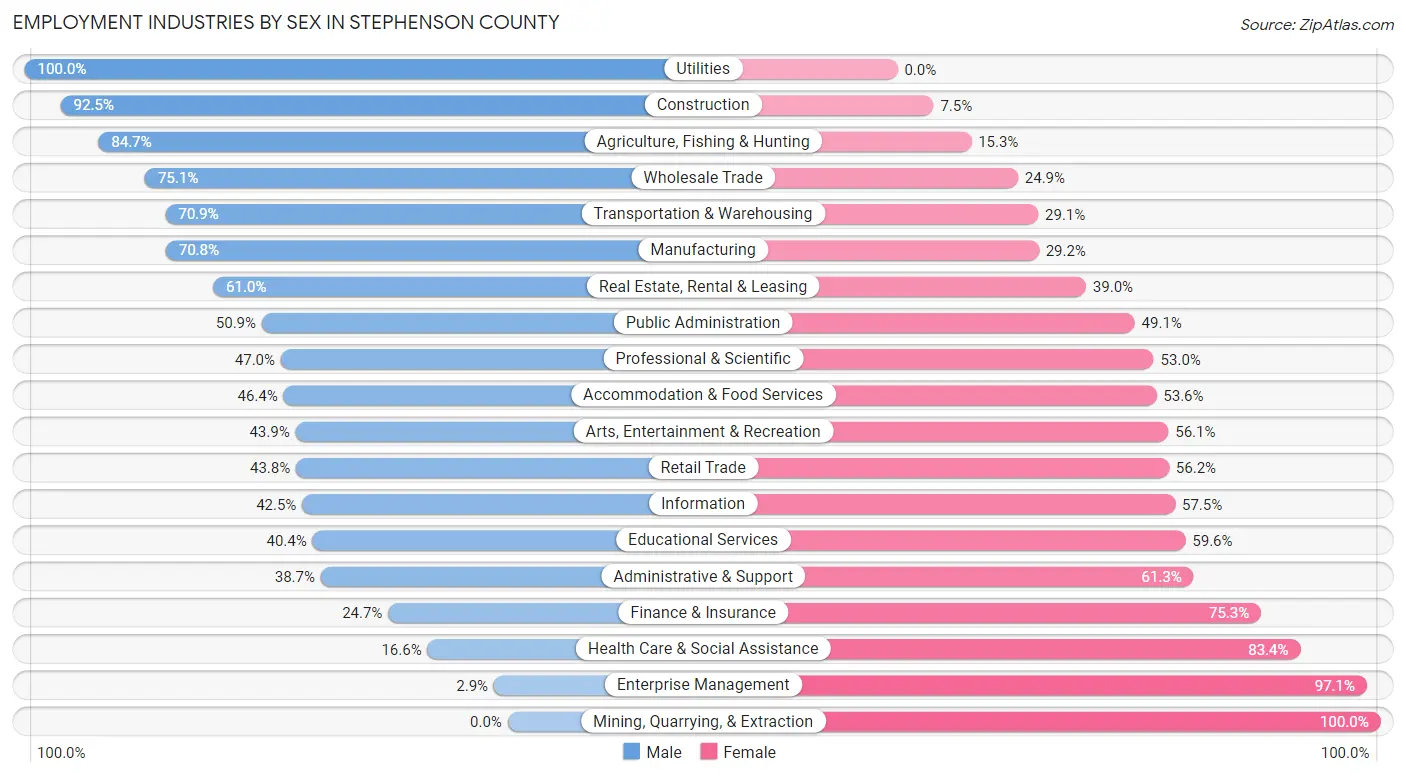
| Industry | Male | Female |
| Agriculture, Fishing & Hunting | 821 (84.7%) | 148 (15.3%) |
| Mining, Quarrying, & Extraction | 0 (0.0%) | 3 (100.0%) |
| Construction | 1,104 (92.5%) | 89 (7.5%) |
| Manufacturing | 2,698 (70.8%) | 1,115 (29.2%) |
| Wholesale Trade | 283 (75.1%) | 94 (24.9%) |
| Retail Trade | 1,005 (43.8%) | 1,289 (56.2%) |
| Transportation & Warehousing | 633 (70.9%) | 260 (29.1%) |
| Utilities | 80 (100.0%) | 0 (0.0%) |
| Information | 77 (42.5%) | 104 (57.5%) |
| Finance & Insurance | 193 (24.7%) | 587 (75.3%) |
| Real Estate, Rental & Leasing | 86 (61.0%) | 55 (39.0%) |
| Professional & Scientific | 247 (47.0%) | 279 (53.0%) |
| Enterprise Management | 1 (2.9%) | 34 (97.1%) |
| Administrative & Support | 267 (38.7%) | 423 (61.3%) |
| Educational Services | 819 (40.4%) | 1,208 (59.6%) |
| Health Care & Social Assistance | 542 (16.6%) | 2,722 (83.4%) |
| Arts, Entertainment & Recreation | 47 (43.9%) | 60 (56.1%) |
| Accommodation & Food Services | 542 (46.4%) | 626 (53.6%) |
| Public Administration | 172 (50.9%) | 166 (49.1%) |
| Total | 10,151 (50.2%) | 10,070 (49.8%) |
Education in Stephenson County
School Enrollment in Stephenson County
The most common levels of schooling among the 9,061 students in Stephenson County are high school (2,113 | 23.3%), middle school (2,068 | 22.8%), and elementary school (1,876 | 20.7%).
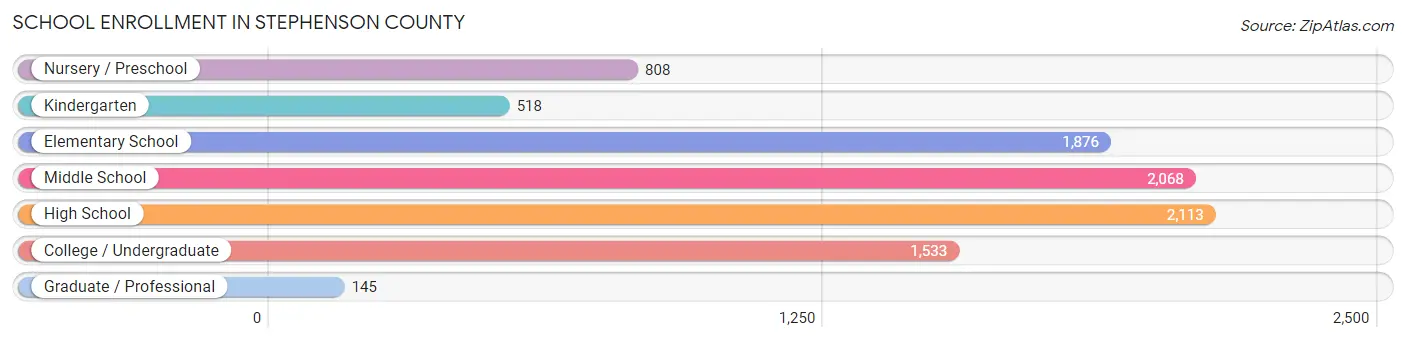
| School Level | # Students | % Students |
| Nursery / Preschool | 808 | 8.9% |
| Kindergarten | 518 | 5.7% |
| Elementary School | 1,876 | 20.7% |
| Middle School | 2,068 | 22.8% |
| High School | 2,113 | 23.3% |
| College / Undergraduate | 1,533 | 16.9% |
| Graduate / Professional | 145 | 1.6% |
| Total | 9,061 | 100.0% |
School Enrollment by Age by Funding Source in Stephenson County
Out of a total of 9,061 students who are enrolled in schools in Stephenson County, 1,486 (16.4%) attend a private institution, while the remaining 7,575 (83.6%) are enrolled in public schools. The age group of 3 to 4 year olds has the highest likelihood of being enrolled in private schools, with 266 (40.6% in the age bracket) enrolled. Conversely, the age group of 15 to 17 year olds has the lowest likelihood of being enrolled in a private school, with 1,641 (92.5% in the age bracket) attending a public institution.
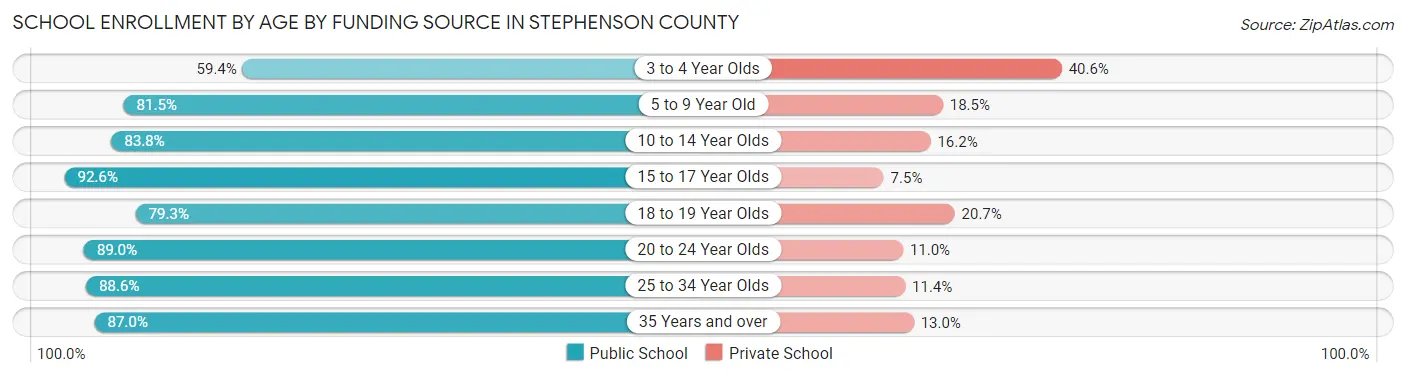
| Age Bracket | Public School | Private School |
| 3 to 4 Year Olds | 389 (59.4%) | 266 (40.6%) |
| 5 to 9 Year Old | 1,696 (81.5%) | 384 (18.5%) |
| 10 to 14 Year Olds | 2,276 (83.8%) | 439 (16.2%) |
| 15 to 17 Year Olds | 1,641 (92.5%) | 132 (7.4%) |
| 18 to 19 Year Olds | 430 (79.3%) | 112 (20.7%) |
| 20 to 24 Year Olds | 395 (89.0%) | 49 (11.0%) |
| 25 to 34 Year Olds | 449 (88.6%) | 58 (11.4%) |
| 35 Years and over | 300 (87.0%) | 45 (13.0%) |
| Total | 7,575 (83.6%) | 1,486 (16.4%) |
Educational Attainment by Field of Study in Stephenson County
Education (1,199 | 17.3%), business (1,010 | 14.6%), science & technology (941 | 13.6%), bio, nature & agricultural (621 | 9.0%), and arts & humanities (596 | 8.6%) are the most common fields of study among 6,919 individuals in Stephenson County who have obtained a bachelor's degree or higher.
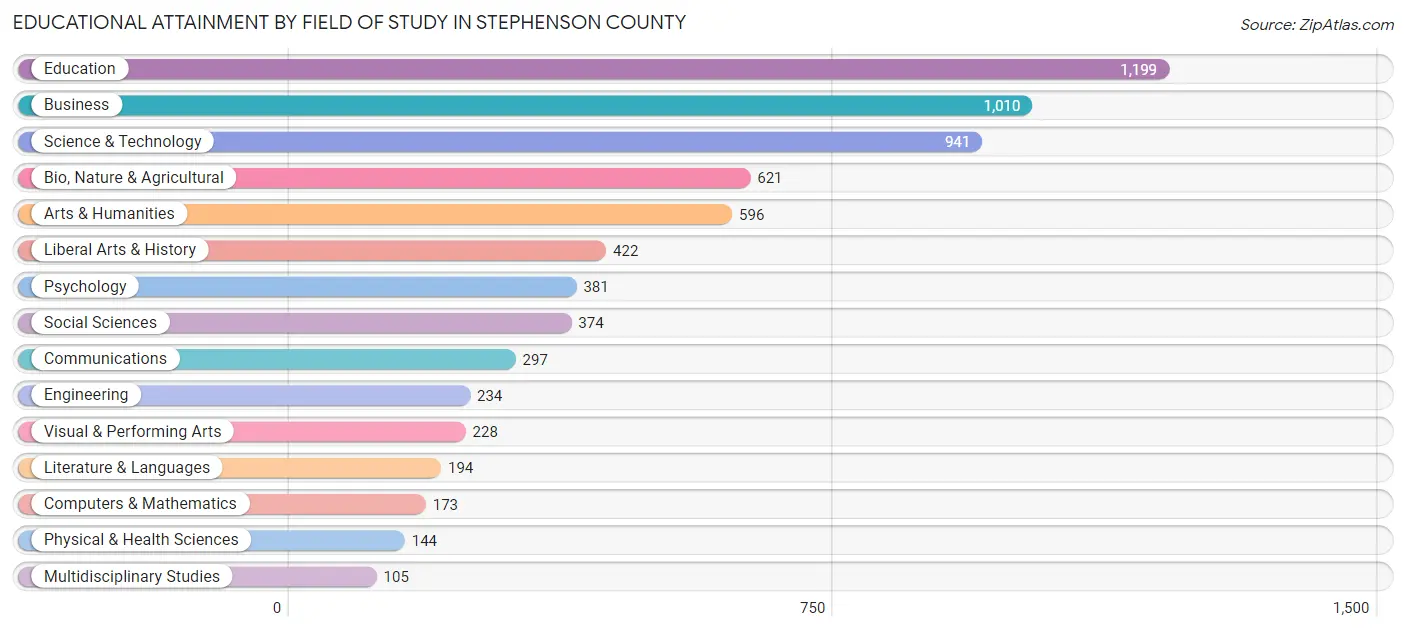
| Field of Study | # Graduates | % Graduates |
| Computers & Mathematics | 173 | 2.5% |
| Bio, Nature & Agricultural | 621 | 9.0% |
| Physical & Health Sciences | 144 | 2.1% |
| Psychology | 381 | 5.5% |
| Social Sciences | 374 | 5.4% |
| Engineering | 234 | 3.4% |
| Multidisciplinary Studies | 105 | 1.5% |
| Science & Technology | 941 | 13.6% |
| Business | 1,010 | 14.6% |
| Education | 1,199 | 17.3% |
| Literature & Languages | 194 | 2.8% |
| Liberal Arts & History | 422 | 6.1% |
| Visual & Performing Arts | 228 | 3.3% |
| Communications | 297 | 4.3% |
| Arts & Humanities | 596 | 8.6% |
| Total | 6,919 | 100.0% |
Transportation & Commute in Stephenson County
Vehicle Availability by Sex in Stephenson County
The most prevalent vehicle ownership categories in Stephenson County are males with 2 vehicles (4,339, accounting for 42.7%) and females with 2 vehicles (4,252, making up 43.9%).
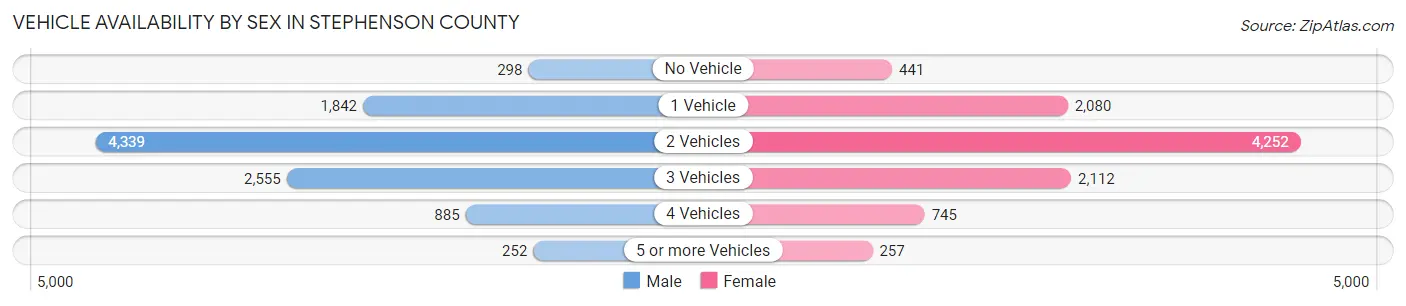
| Vehicles Available | Male | Female |
| No Vehicle | 298 (2.9%) | 441 (4.5%) |
| 1 Vehicle | 1,842 (18.1%) | 2,080 (21.0%) |
| 2 Vehicles | 4,339 (42.7%) | 4,252 (43.0%) |
| 3 Vehicles | 2,555 (25.1%) | 2,112 (21.4%) |
| 4 Vehicles | 885 (8.7%) | 745 (7.5%) |
| 5 or more Vehicles | 252 (2.5%) | 257 (2.6%) |
| Total | 10,171 (100.0%) | 9,887 (100.0%) |
Commute Time in Stephenson County
The most frequently occuring commute durations in Stephenson County are 5 to 9 minutes (3,645 commuters, 19.9%), 10 to 14 minutes (3,368 commuters, 18.4%), and 15 to 19 minutes (2,393 commuters, 13.1%).
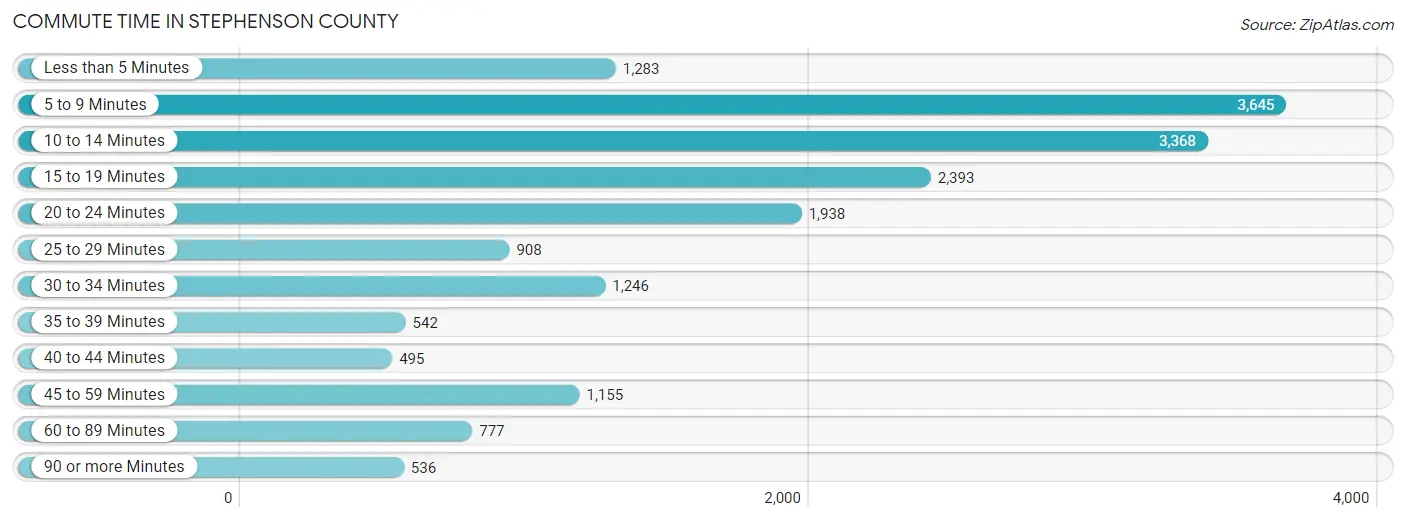
| Commute Time | # Commuters | % Commuters |
| Less than 5 Minutes | 1,283 | 7.0% |
| 5 to 9 Minutes | 3,645 | 19.9% |
| 10 to 14 Minutes | 3,368 | 18.4% |
| 15 to 19 Minutes | 2,393 | 13.1% |
| 20 to 24 Minutes | 1,938 | 10.6% |
| 25 to 29 Minutes | 908 | 5.0% |
| 30 to 34 Minutes | 1,246 | 6.8% |
| 35 to 39 Minutes | 542 | 3.0% |
| 40 to 44 Minutes | 495 | 2.7% |
| 45 to 59 Minutes | 1,155 | 6.3% |
| 60 to 89 Minutes | 777 | 4.3% |
| 90 or more Minutes | 536 | 2.9% |
Commute Time by Sex in Stephenson County
The most common commute times in Stephenson County are 10 to 14 minutes (1,982 commuters, 21.1%) for males and 5 to 9 minutes (2,350 commuters, 26.4%) for females.
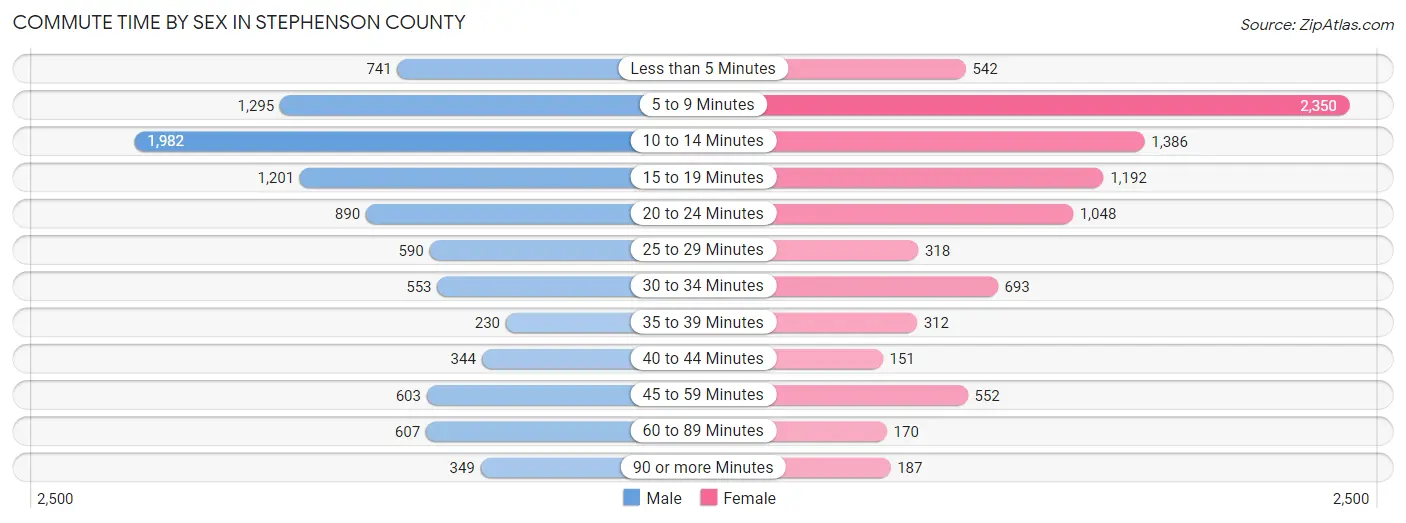
| Commute Time | Male | Female |
| Less than 5 Minutes | 741 (7.9%) | 542 (6.1%) |
| 5 to 9 Minutes | 1,295 (13.8%) | 2,350 (26.4%) |
| 10 to 14 Minutes | 1,982 (21.1%) | 1,386 (15.6%) |
| 15 to 19 Minutes | 1,201 (12.8%) | 1,192 (13.4%) |
| 20 to 24 Minutes | 890 (9.5%) | 1,048 (11.8%) |
| 25 to 29 Minutes | 590 (6.3%) | 318 (3.6%) |
| 30 to 34 Minutes | 553 (5.9%) | 693 (7.8%) |
| 35 to 39 Minutes | 230 (2.5%) | 312 (3.5%) |
| 40 to 44 Minutes | 344 (3.7%) | 151 (1.7%) |
| 45 to 59 Minutes | 603 (6.4%) | 552 (6.2%) |
| 60 to 89 Minutes | 607 (6.5%) | 170 (1.9%) |
| 90 or more Minutes | 349 (3.7%) | 187 (2.1%) |
Time of Departure to Work by Sex in Stephenson County
The most frequent times of departure to work in Stephenson County are 7:00 AM to 7:29 AM (1,389, 14.8%) for males and 6:30 AM to 6:59 AM (1,312, 14.7%) for females.
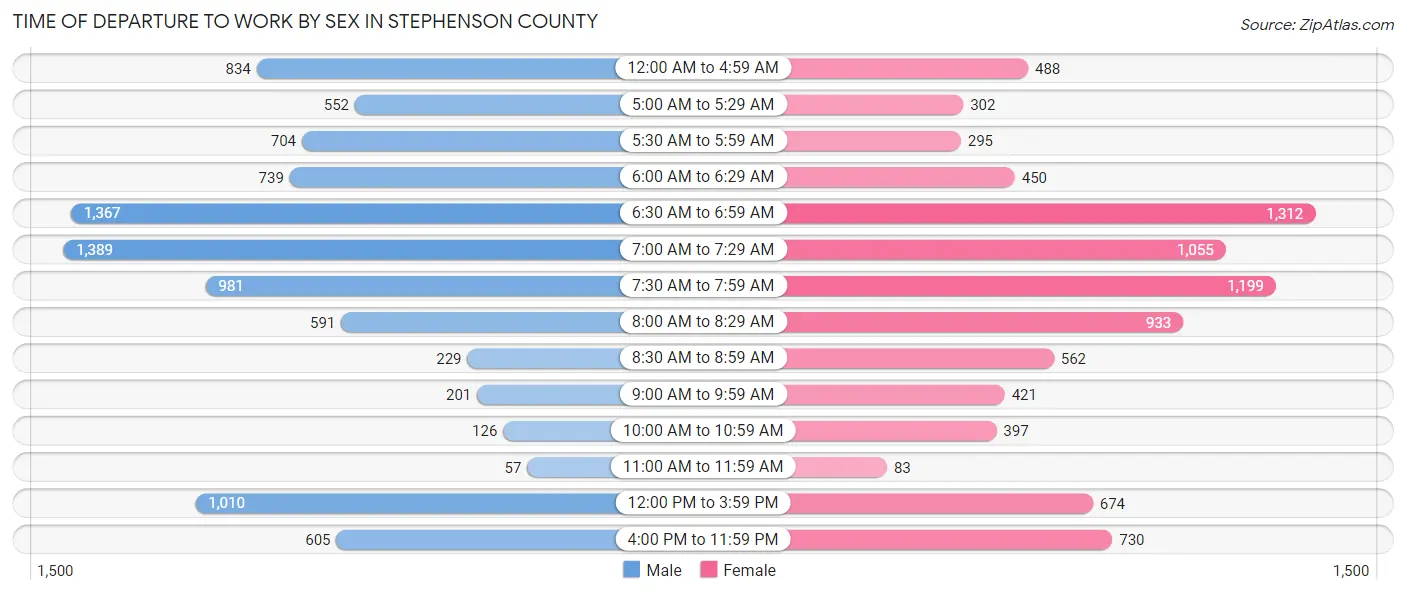
| Time of Departure | Male | Female |
| 12:00 AM to 4:59 AM | 834 (8.9%) | 488 (5.5%) |
| 5:00 AM to 5:29 AM | 552 (5.9%) | 302 (3.4%) |
| 5:30 AM to 5:59 AM | 704 (7.5%) | 295 (3.3%) |
| 6:00 AM to 6:29 AM | 739 (7.9%) | 450 (5.1%) |
| 6:30 AM to 6:59 AM | 1,367 (14.6%) | 1,312 (14.7%) |
| 7:00 AM to 7:29 AM | 1,389 (14.8%) | 1,055 (11.8%) |
| 7:30 AM to 7:59 AM | 981 (10.4%) | 1,199 (13.5%) |
| 8:00 AM to 8:29 AM | 591 (6.3%) | 933 (10.5%) |
| 8:30 AM to 8:59 AM | 229 (2.4%) | 562 (6.3%) |
| 9:00 AM to 9:59 AM | 201 (2.1%) | 421 (4.7%) |
| 10:00 AM to 10:59 AM | 126 (1.3%) | 397 (4.5%) |
| 11:00 AM to 11:59 AM | 57 (0.6%) | 83 (0.9%) |
| 12:00 PM to 3:59 PM | 1,010 (10.8%) | 674 (7.6%) |
| 4:00 PM to 11:59 PM | 605 (6.5%) | 730 (8.2%) |
| Total | 9,385 (100.0%) | 8,901 (100.0%) |
Housing Occupancy in Stephenson County
Occupancy by Ownership in Stephenson County
Of the total 19,337 dwellings in Stephenson County, owner-occupied units account for 13,448 (69.6%), while renter-occupied units make up 5,889 (30.4%).
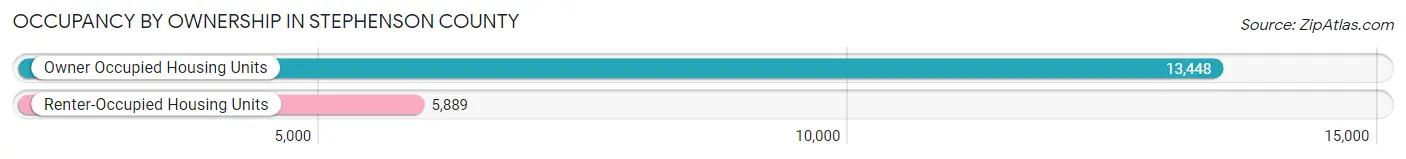
| Occupancy | # Housing Units | % Housing Units |
| Owner Occupied Housing Units | 13,448 | 69.6% |
| Renter-Occupied Housing Units | 5,889 | 30.4% |
| Total Occupied Housing Units | 19,337 | 100.0% |
Occupancy by Household Size in Stephenson County
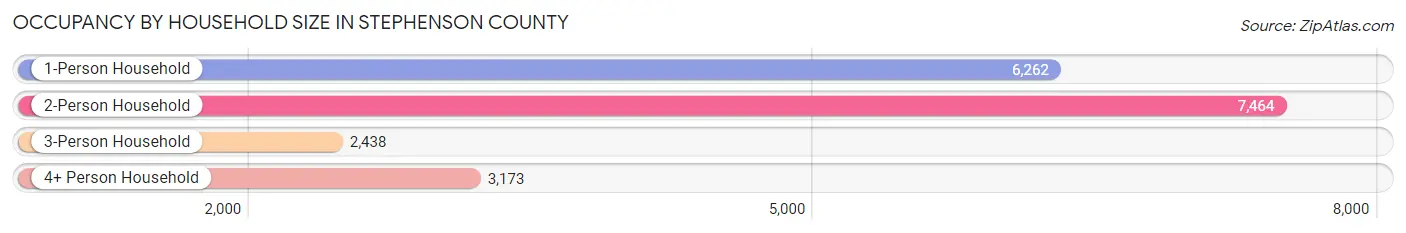
| Household Size | # Housing Units | % Housing Units |
| 1-Person Household | 6,262 | 32.4% |
| 2-Person Household | 7,464 | 38.6% |
| 3-Person Household | 2,438 | 12.6% |
| 4+ Person Household | 3,173 | 16.4% |
| Total Housing Units | 19,337 | 100.0% |
Occupancy by Ownership by Household Size in Stephenson County
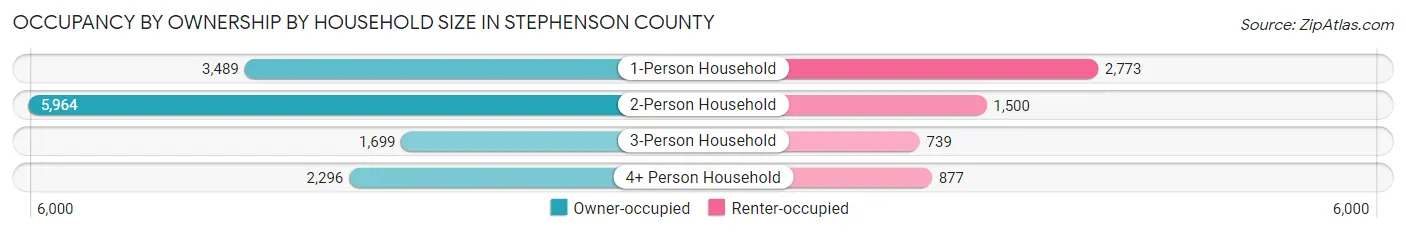
| Household Size | Owner-occupied | Renter-occupied |
| 1-Person Household | 3,489 (55.7%) | 2,773 (44.3%) |
| 2-Person Household | 5,964 (79.9%) | 1,500 (20.1%) |
| 3-Person Household | 1,699 (69.7%) | 739 (30.3%) |
| 4+ Person Household | 2,296 (72.4%) | 877 (27.6%) |
| Total Housing Units | 13,448 (69.6%) | 5,889 (30.4%) |
Occupancy by Educational Attainment in Stephenson County
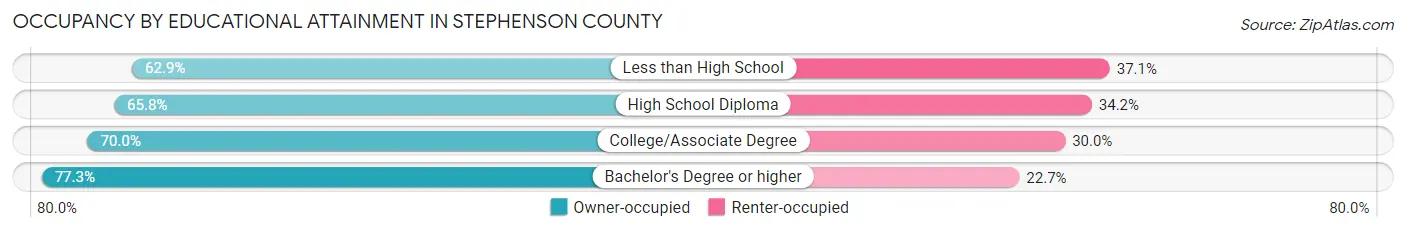
| Household Size | Owner-occupied | Renter-occupied |
| Less than High School | 873 (62.9%) | 514 (37.1%) |
| High School Diploma | 4,240 (65.8%) | 2,205 (34.2%) |
| College/Associate Degree | 5,363 (70.0%) | 2,296 (30.0%) |
| Bachelor's Degree or higher | 2,972 (77.3%) | 874 (22.7%) |
Occupancy by Age of Householder in Stephenson County
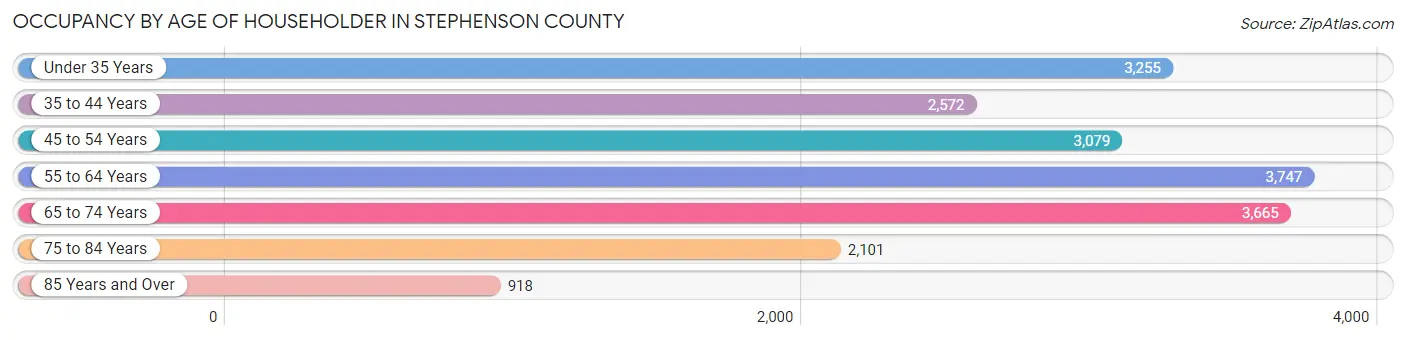
| Age Bracket | # Households | % Households |
| Under 35 Years | 3,255 | 16.8% |
| 35 to 44 Years | 2,572 | 13.3% |
| 45 to 54 Years | 3,079 | 15.9% |
| 55 to 64 Years | 3,747 | 19.4% |
| 65 to 74 Years | 3,665 | 19.0% |
| 75 to 84 Years | 2,101 | 10.9% |
| 85 Years and Over | 918 | 4.8% |
| Total | 19,337 | 100.0% |
Housing Finances in Stephenson County
Median Income by Occupancy in Stephenson County
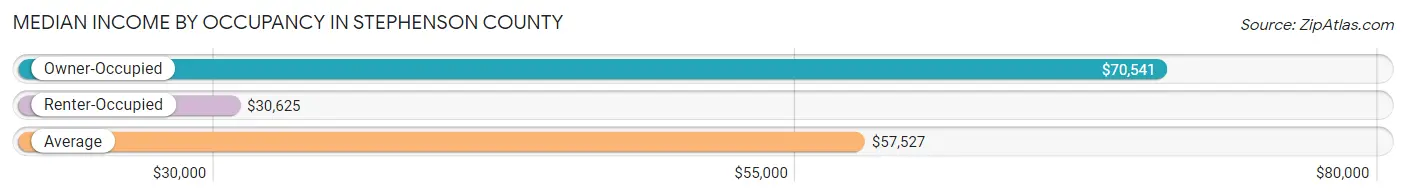
| Occupancy Type | # Households | Median Income |
| Owner-Occupied | 13,448 (69.6%) | $70,541 |
| Renter-Occupied | 5,889 (30.4%) | $30,625 |
| Average | 19,337 (100.0%) | $57,527 |
Occupancy by Householder Income Bracket in Stephenson County
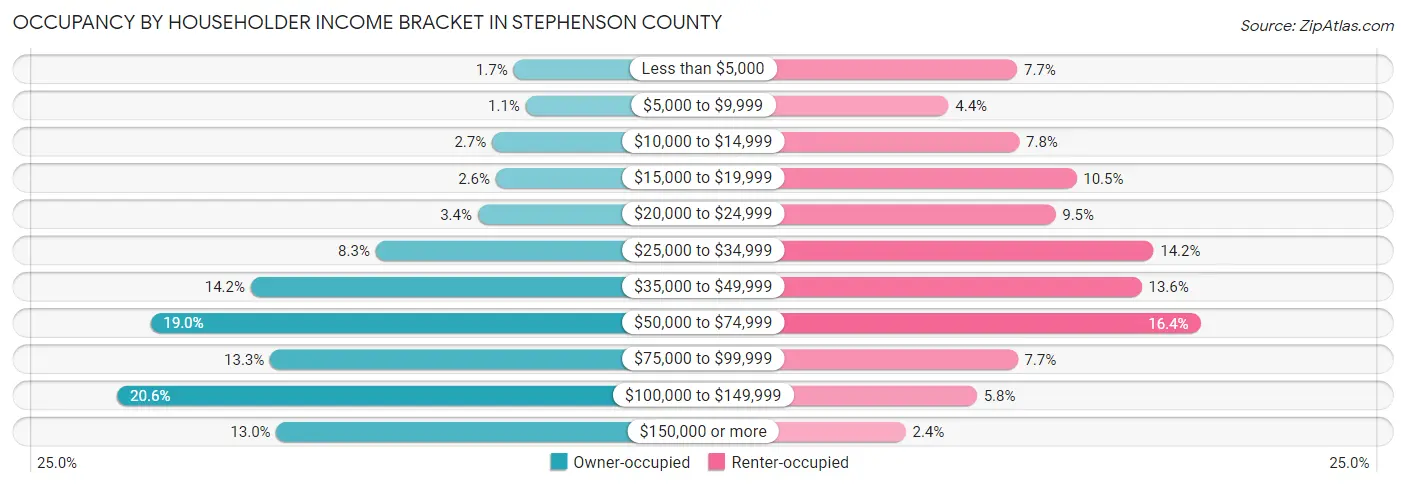
| Income Bracket | Owner-occupied | Renter-occupied |
| Less than $5,000 | 231 (1.7%) | 453 (7.7%) |
| $5,000 to $9,999 | 153 (1.1%) | 260 (4.4%) |
| $10,000 to $14,999 | 368 (2.7%) | 459 (7.8%) |
| $15,000 to $19,999 | 344 (2.6%) | 619 (10.5%) |
| $20,000 to $24,999 | 460 (3.4%) | 560 (9.5%) |
| $25,000 to $34,999 | 1,113 (8.3%) | 835 (14.2%) |
| $35,000 to $49,999 | 1,914 (14.2%) | 802 (13.6%) |
| $50,000 to $74,999 | 2,557 (19.0%) | 967 (16.4%) |
| $75,000 to $99,999 | 1,790 (13.3%) | 454 (7.7%) |
| $100,000 to $149,999 | 2,769 (20.6%) | 340 (5.8%) |
| $150,000 or more | 1,749 (13.0%) | 140 (2.4%) |
| Total | 13,448 (100.0%) | 5,889 (100.0%) |
Monthly Housing Cost Tiers in Stephenson County
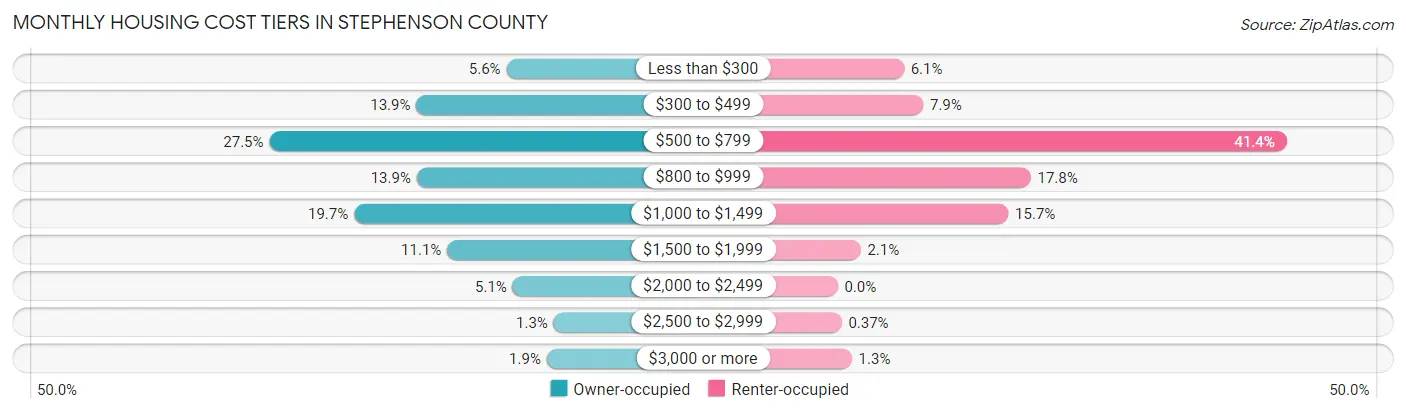
| Monthly Cost | Owner-occupied | Renter-occupied |
| Less than $300 | 758 (5.6%) | 359 (6.1%) |
| $300 to $499 | 1,875 (13.9%) | 464 (7.9%) |
| $500 to $799 | 3,694 (27.5%) | 2,435 (41.3%) |
| $800 to $999 | 1,869 (13.9%) | 1,047 (17.8%) |
| $1,000 to $1,499 | 2,645 (19.7%) | 926 (15.7%) |
| $1,500 to $1,999 | 1,493 (11.1%) | 125 (2.1%) |
| $2,000 to $2,499 | 682 (5.1%) | 0 (0.0%) |
| $2,500 to $2,999 | 173 (1.3%) | 22 (0.4%) |
| $3,000 or more | 259 (1.9%) | 77 (1.3%) |
| Total | 13,448 (100.0%) | 5,889 (100.0%) |
Physical Housing Characteristics in Stephenson County
Housing Structures in Stephenson County
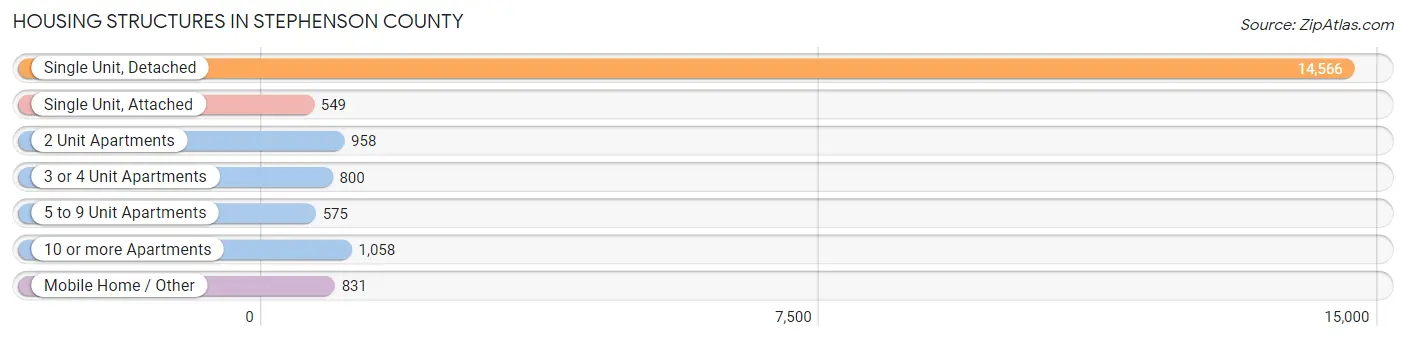
| Structure Type | # Housing Units | % Housing Units |
| Single Unit, Detached | 14,566 | 75.3% |
| Single Unit, Attached | 549 | 2.8% |
| 2 Unit Apartments | 958 | 5.0% |
| 3 or 4 Unit Apartments | 800 | 4.1% |
| 5 to 9 Unit Apartments | 575 | 3.0% |
| 10 or more Apartments | 1,058 | 5.5% |
| Mobile Home / Other | 831 | 4.3% |
| Total | 19,337 | 100.0% |
Housing Structures by Occupancy in Stephenson County
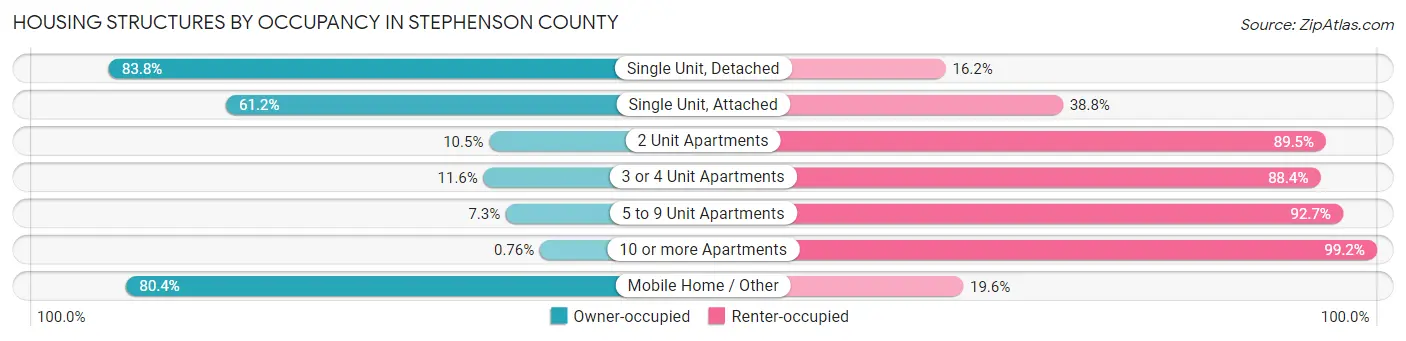
| Structure Type | Owner-occupied | Renter-occupied |
| Single Unit, Detached | 12,200 (83.8%) | 2,366 (16.2%) |
| Single Unit, Attached | 336 (61.2%) | 213 (38.8%) |
| 2 Unit Apartments | 101 (10.5%) | 857 (89.5%) |
| 3 or 4 Unit Apartments | 93 (11.6%) | 707 (88.4%) |
| 5 to 9 Unit Apartments | 42 (7.3%) | 533 (92.7%) |
| 10 or more Apartments | 8 (0.8%) | 1,050 (99.2%) |
| Mobile Home / Other | 668 (80.4%) | 163 (19.6%) |
| Total | 13,448 (69.6%) | 5,889 (30.4%) |
Housing Structures by Number of Rooms in Stephenson County
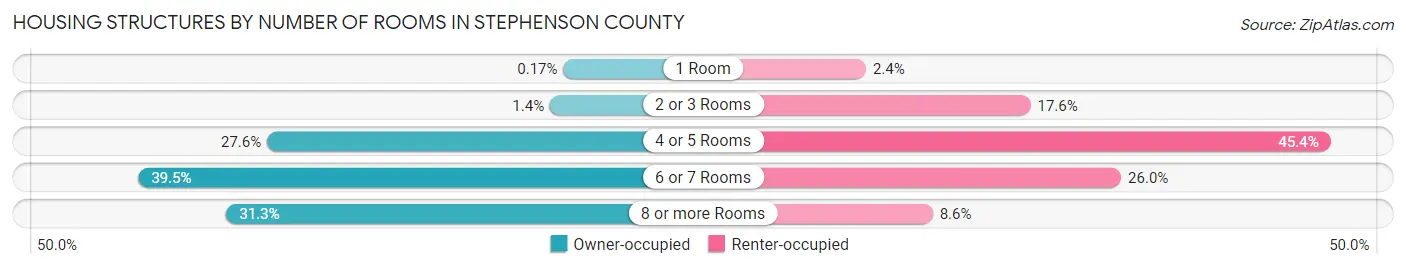
| Number of Rooms | Owner-occupied | Renter-occupied |
| 1 Room | 23 (0.2%) | 142 (2.4%) |
| 2 or 3 Rooms | 190 (1.4%) | 1,038 (17.6%) |
| 4 or 5 Rooms | 3,709 (27.6%) | 2,672 (45.4%) |
| 6 or 7 Rooms | 5,311 (39.5%) | 1,532 (26.0%) |
| 8 or more Rooms | 4,215 (31.3%) | 505 (8.6%) |
| Total | 13,448 (100.0%) | 5,889 (100.0%) |
Housing Structure by Heating Type in Stephenson County
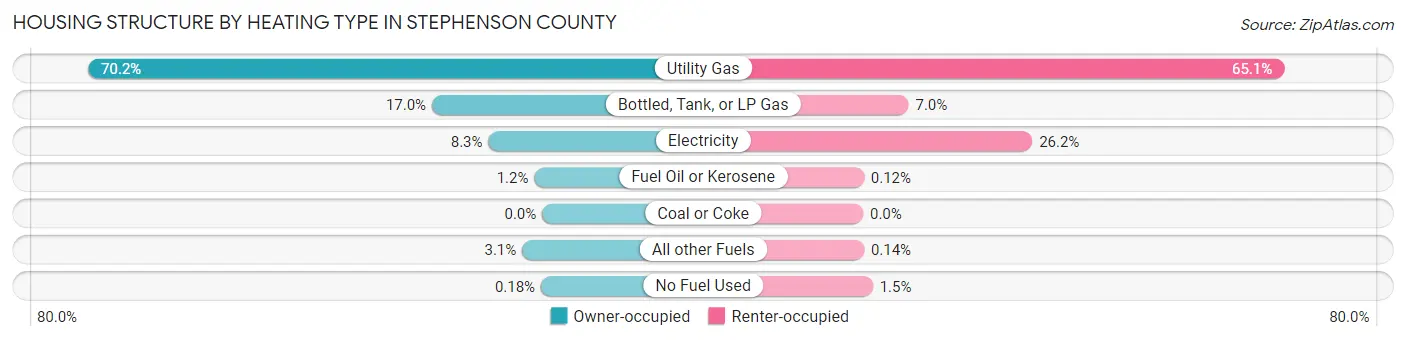
| Heating Type | Owner-occupied | Renter-occupied |
| Utility Gas | 9,440 (70.2%) | 3,832 (65.1%) |
| Bottled, Tank, or LP Gas | 2,290 (17.0%) | 414 (7.0%) |
| Electricity | 1,117 (8.3%) | 1,540 (26.2%) |
| Fuel Oil or Kerosene | 161 (1.2%) | 7 (0.1%) |
| Coal or Coke | 0 (0.0%) | 0 (0.0%) |
| All other Fuels | 416 (3.1%) | 8 (0.1%) |
| No Fuel Used | 24 (0.2%) | 88 (1.5%) |
| Total | 13,448 (100.0%) | 5,889 (100.0%) |
Household Vehicle Usage in Stephenson County
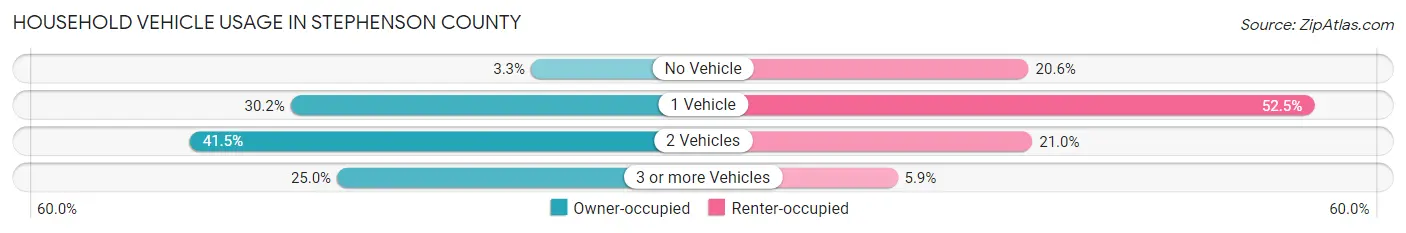
| Vehicles per Household | Owner-occupied | Renter-occupied |
| No Vehicle | 443 (3.3%) | 1,212 (20.6%) |
| 1 Vehicle | 4,062 (30.2%) | 3,094 (52.5%) |
| 2 Vehicles | 5,579 (41.5%) | 1,236 (21.0%) |
| 3 or more Vehicles | 3,364 (25.0%) | 347 (5.9%) |
| Total | 13,448 (100.0%) | 5,889 (100.0%) |
Real Estate & Mortgages in Stephenson County
Real Estate and Mortgage Overview in Stephenson County
| Characteristic | Without Mortgage | With Mortgage |
| Housing Units | 6,558 | 6,890 |
| Median Property Value | $111,900 | $131,000 |
| Median Household Income | $56,817 | $1,216 |
| Monthly Housing Costs | $558 | $248 |
| Real Estate Taxes | $2,836 | $197 |
Property Value by Mortgage Status in Stephenson County
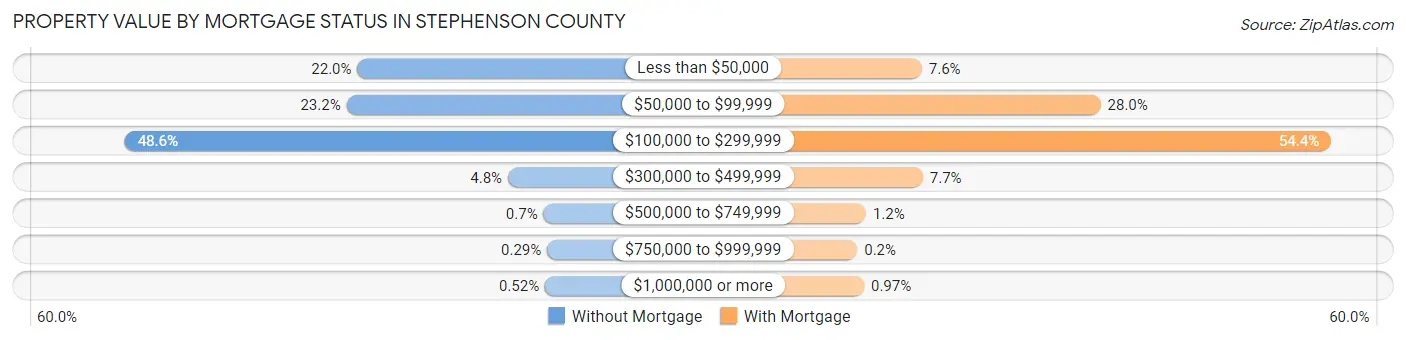
| Property Value | Without Mortgage | With Mortgage |
| Less than $50,000 | 1,441 (22.0%) | 522 (7.6%) |
| $50,000 to $99,999 | 1,522 (23.2%) | 1,930 (28.0%) |
| $100,000 to $299,999 | 3,184 (48.5%) | 3,745 (54.3%) |
| $300,000 to $499,999 | 312 (4.8%) | 530 (7.7%) |
| $500,000 to $749,999 | 46 (0.7%) | 82 (1.2%) |
| $750,000 to $999,999 | 19 (0.3%) | 14 (0.2%) |
| $1,000,000 or more | 34 (0.5%) | 67 (1.0%) |
| Total | 6,558 (100.0%) | 6,890 (100.0%) |
Household Income by Mortgage Status in Stephenson County
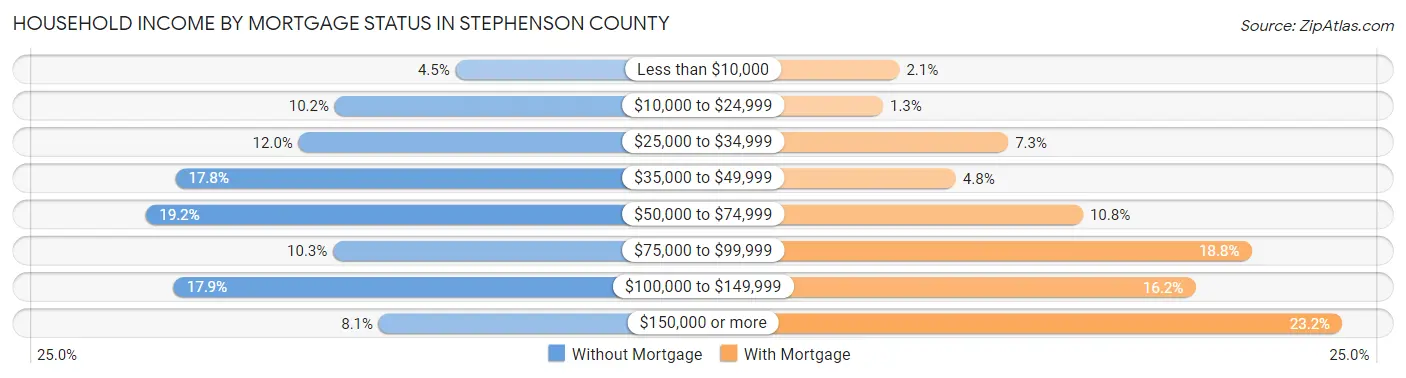
| Household Income | Without Mortgage | With Mortgage |
| Less than $10,000 | 294 (4.5%) | 144 (2.1%) |
| $10,000 to $24,999 | 671 (10.2%) | 90 (1.3%) |
| $25,000 to $34,999 | 784 (11.9%) | 501 (7.3%) |
| $35,000 to $49,999 | 1,168 (17.8%) | 329 (4.8%) |
| $50,000 to $74,999 | 1,259 (19.2%) | 746 (10.8%) |
| $75,000 to $99,999 | 676 (10.3%) | 1,298 (18.8%) |
| $100,000 to $149,999 | 1,173 (17.9%) | 1,114 (16.2%) |
| $150,000 or more | 533 (8.1%) | 1,596 (23.2%) |
| Total | 6,558 (100.0%) | 6,890 (100.0%) |
Property Value to Household Income Ratio in Stephenson County
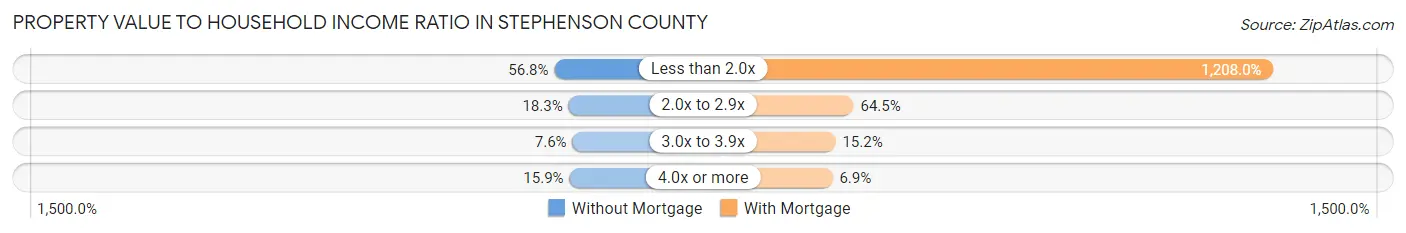
| Value-to-Income Ratio | Without Mortgage | With Mortgage |
| Less than 2.0x | 3,726 (56.8%) | 83,234 (1,208.0%) |
| 2.0x to 2.9x | 1,201 (18.3%) | 4,441 (64.5%) |
| 3.0x to 3.9x | 498 (7.6%) | 1,047 (15.2%) |
| 4.0x or more | 1,041 (15.9%) | 478 (6.9%) |
| Total | 6,558 (100.0%) | 6,890 (100.0%) |
Real Estate Taxes by Mortgage Status in Stephenson County
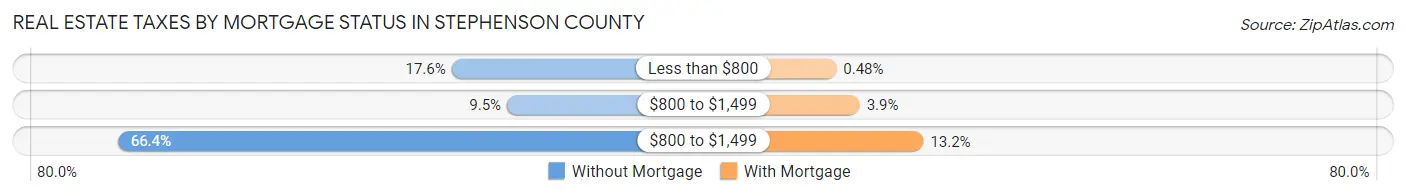
| Property Taxes | Without Mortgage | With Mortgage |
| Less than $800 | 1,155 (17.6%) | 33 (0.5%) |
| $800 to $1,499 | 624 (9.5%) | 269 (3.9%) |
| $800 to $1,499 | 4,353 (66.4%) | 910 (13.2%) |
| Total | 6,558 (100.0%) | 6,890 (100.0%) |
Health & Disability in Stephenson County
Health Insurance Coverage by Age in Stephenson County
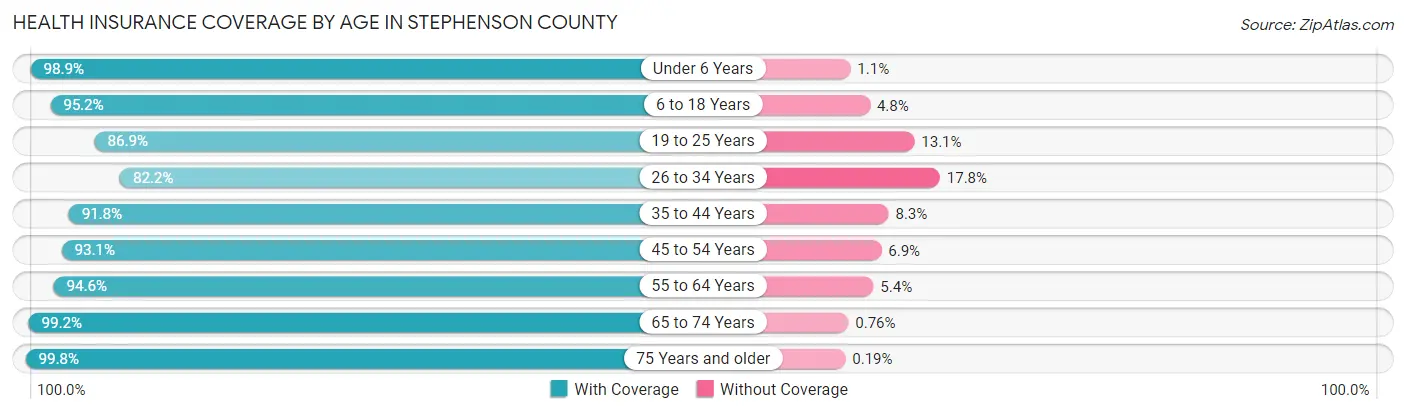
| Age Bracket | With Coverage | Without Coverage |
| Under 6 Years | 3,038 (98.9%) | 35 (1.1%) |
| 6 to 18 Years | 6,399 (95.2%) | 322 (4.8%) |
| 19 to 25 Years | 2,727 (86.9%) | 410 (13.1%) |
| 26 to 34 Years | 3,395 (82.2%) | 736 (17.8%) |
| 35 to 44 Years | 4,261 (91.7%) | 383 (8.3%) |
| 45 to 54 Years | 4,972 (93.1%) | 369 (6.9%) |
| 55 to 64 Years | 6,198 (94.6%) | 356 (5.4%) |
| 65 to 74 Years | 5,739 (99.2%) | 44 (0.8%) |
| 75 Years and older | 4,294 (99.8%) | 8 (0.2%) |
| Total | 41,023 (93.9%) | 2,663 (6.1%) |
Health Insurance Coverage by Citizenship Status in Stephenson County
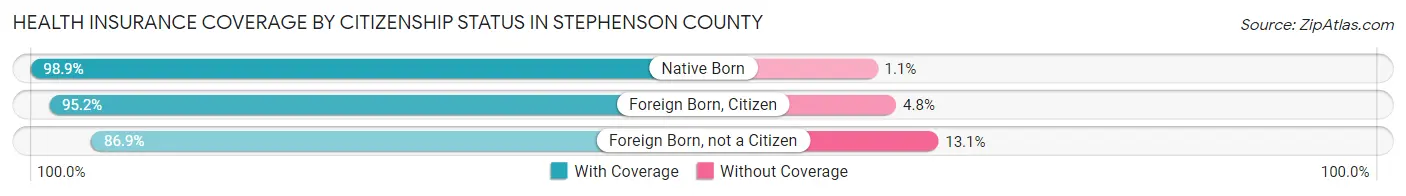
| Citizenship Status | With Coverage | Without Coverage |
| Native Born | 3,038 (98.9%) | 35 (1.1%) |
| Foreign Born, Citizen | 6,399 (95.2%) | 322 (4.8%) |
| Foreign Born, not a Citizen | 2,727 (86.9%) | 410 (13.1%) |
Health Insurance Coverage by Household Income in Stephenson County
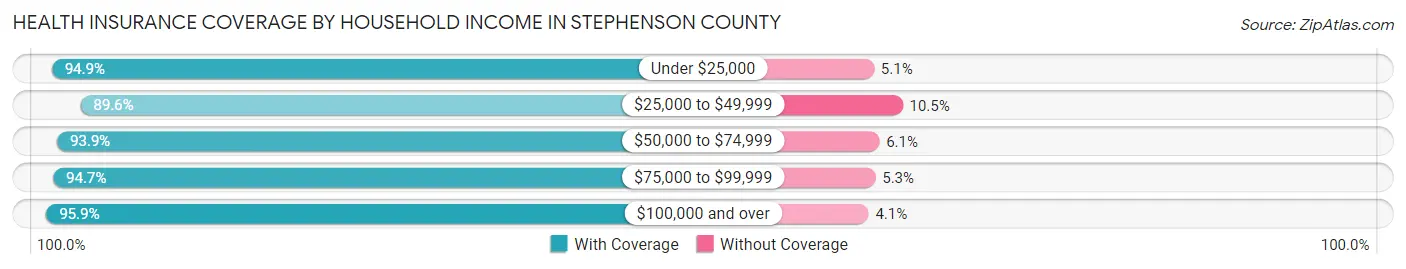
| Household Income | With Coverage | Without Coverage |
| Under $25,000 | 5,327 (94.9%) | 285 (5.1%) |
| $25,000 to $49,999 | 8,368 (89.5%) | 976 (10.4%) |
| $50,000 to $74,999 | 7,539 (93.9%) | 487 (6.1%) |
| $75,000 to $99,999 | 5,819 (94.7%) | 328 (5.3%) |
| $100,000 and over | 13,864 (95.9%) | 587 (4.1%) |
Public vs Private Health Insurance Coverage by Age in Stephenson County
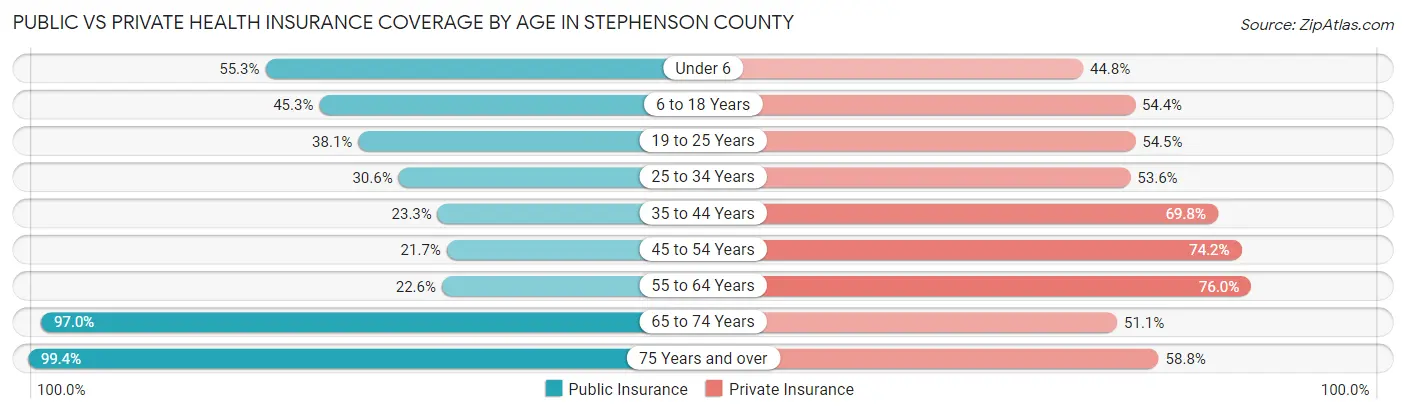
| Age Bracket | Public Insurance | Private Insurance |
| Under 6 | 1,700 (55.3%) | 1,376 (44.8%) |
| 6 to 18 Years | 3,045 (45.3%) | 3,657 (54.4%) |
| 19 to 25 Years | 1,195 (38.1%) | 1,709 (54.5%) |
| 25 to 34 Years | 1,264 (30.6%) | 2,213 (53.6%) |
| 35 to 44 Years | 1,084 (23.3%) | 3,240 (69.8%) |
| 45 to 54 Years | 1,157 (21.7%) | 3,961 (74.2%) |
| 55 to 64 Years | 1,479 (22.6%) | 4,979 (76.0%) |
| 65 to 74 Years | 5,607 (97.0%) | 2,955 (51.1%) |
| 75 Years and over | 4,276 (99.4%) | 2,530 (58.8%) |
| Total | 20,807 (47.6%) | 26,620 (60.9%) |
Disability Status by Sex by Age in Stephenson County
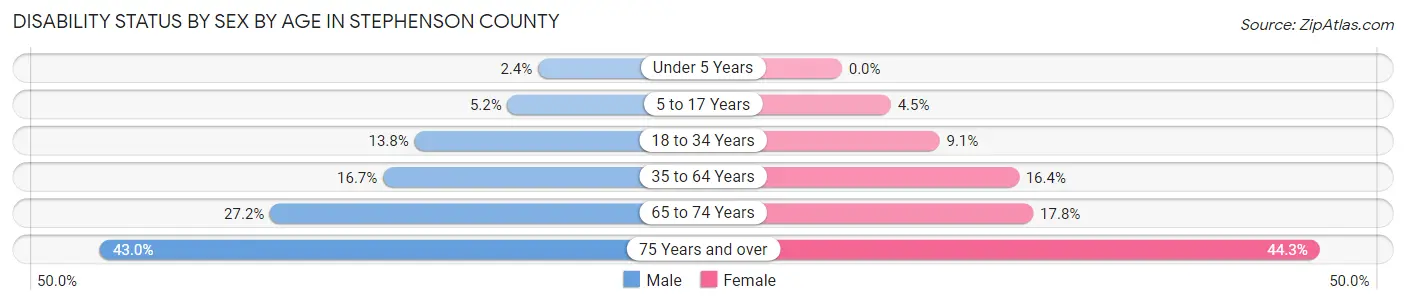
| Age Bracket | Male | Female |
| Under 5 Years | 29 (2.4%) | 0 (0.0%) |
| 5 to 17 Years | 190 (5.2%) | 152 (4.5%) |
| 18 to 34 Years | 516 (13.8%) | 351 (9.1%) |
| 35 to 64 Years | 1,373 (16.7%) | 1,368 (16.4%) |
| 65 to 74 Years | 740 (27.2%) | 544 (17.8%) |
| 75 Years and over | 756 (43.0%) | 1,128 (44.3%) |
Disability Class by Sex by Age in Stephenson County
Disability Class: Hearing Difficulty
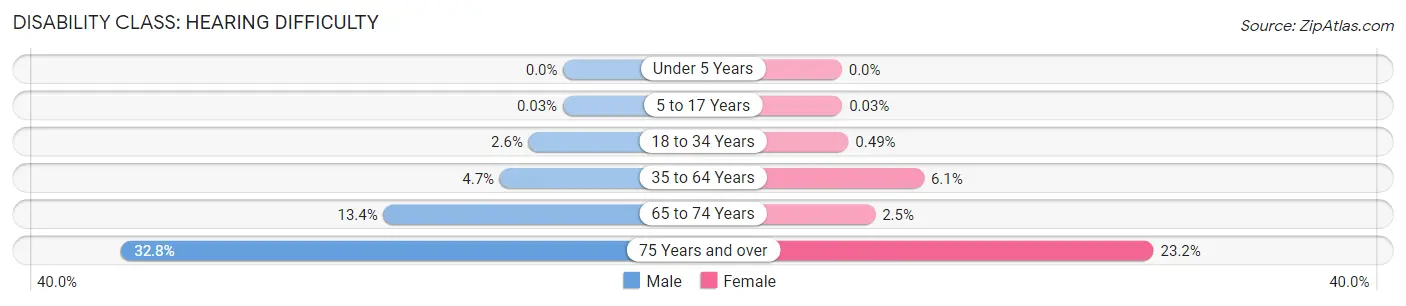
| Age Bracket | Male | Female |
| Under 5 Years | 0 (0.0%) | 0 (0.0%) |
| 5 to 17 Years | 1 (0.0%) | 1 (0.0%) |
| 18 to 34 Years | 96 (2.6%) | 19 (0.5%) |
| 35 to 64 Years | 387 (4.7%) | 508 (6.1%) |
| 65 to 74 Years | 363 (13.4%) | 76 (2.5%) |
| 75 Years and over | 577 (32.8%) | 589 (23.2%) |
Disability Class: Vision Difficulty
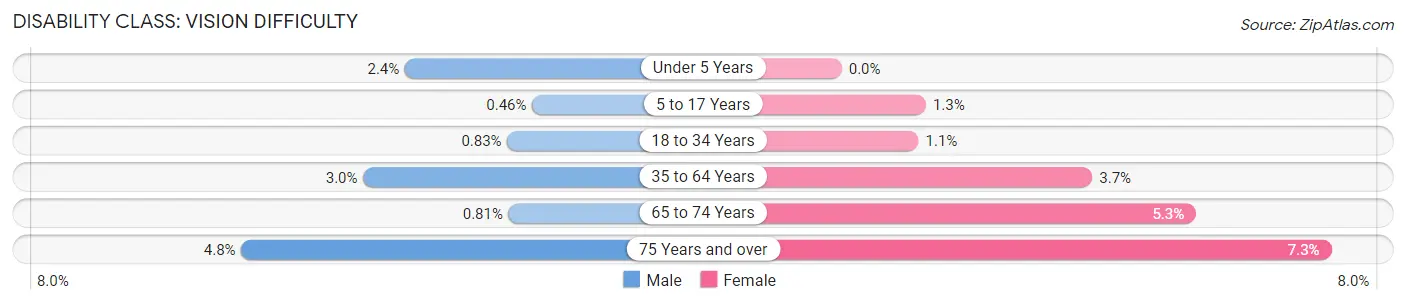
| Age Bracket | Male | Female |
| Under 5 Years | 29 (2.4%) | 0 (0.0%) |
| 5 to 17 Years | 17 (0.5%) | 42 (1.3%) |
| 18 to 34 Years | 31 (0.8%) | 44 (1.1%) |
| 35 to 64 Years | 244 (3.0%) | 310 (3.7%) |
| 65 to 74 Years | 22 (0.8%) | 161 (5.3%) |
| 75 Years and over | 84 (4.8%) | 185 (7.3%) |
Disability Class: Cognitive Difficulty
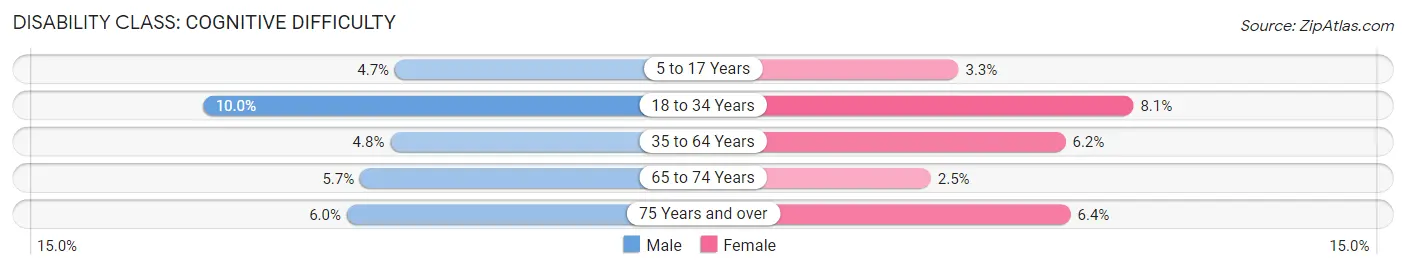
| Age Bracket | Male | Female |
| 5 to 17 Years | 172 (4.7%) | 109 (3.3%) |
| 18 to 34 Years | 375 (10.0%) | 314 (8.1%) |
| 35 to 64 Years | 396 (4.8%) | 519 (6.2%) |
| 65 to 74 Years | 154 (5.7%) | 76 (2.5%) |
| 75 Years and over | 106 (6.0%) | 162 (6.4%) |
Disability Class: Ambulatory Difficulty
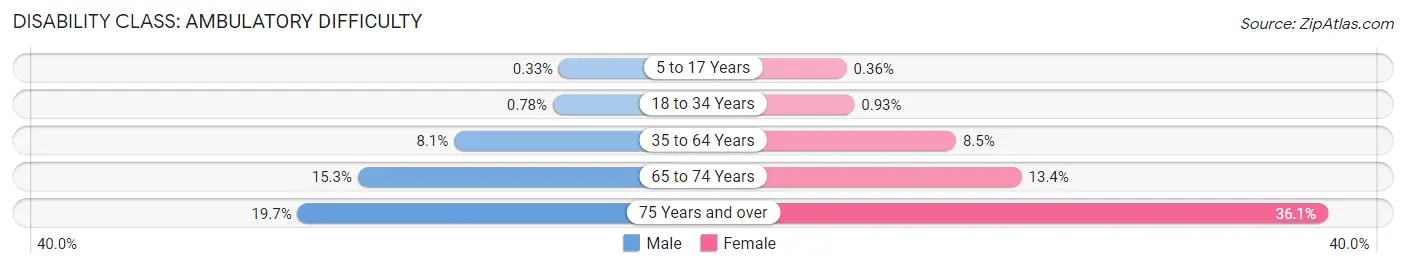
| Age Bracket | Male | Female |
| 5 to 17 Years | 12 (0.3%) | 12 (0.4%) |
| 18 to 34 Years | 29 (0.8%) | 36 (0.9%) |
| 35 to 64 Years | 666 (8.1%) | 706 (8.5%) |
| 65 to 74 Years | 415 (15.3%) | 409 (13.4%) |
| 75 Years and over | 347 (19.7%) | 918 (36.1%) |
Disability Class: Self-Care Difficulty
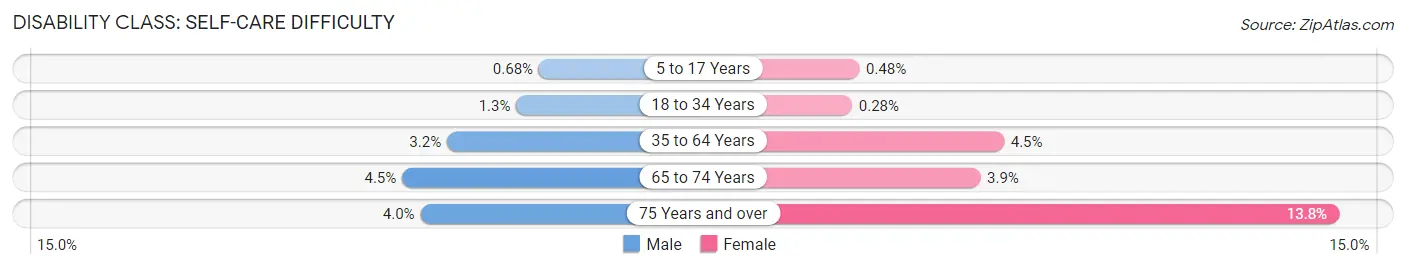
| Age Bracket | Male | Female |
| 5 to 17 Years | 25 (0.7%) | 16 (0.5%) |
| 18 to 34 Years | 49 (1.3%) | 11 (0.3%) |
| 35 to 64 Years | 266 (3.2%) | 376 (4.5%) |
| 65 to 74 Years | 122 (4.5%) | 118 (3.8%) |
| 75 Years and over | 70 (4.0%) | 352 (13.8%) |
Technology Access in Stephenson County
Computing Device Access in Stephenson County
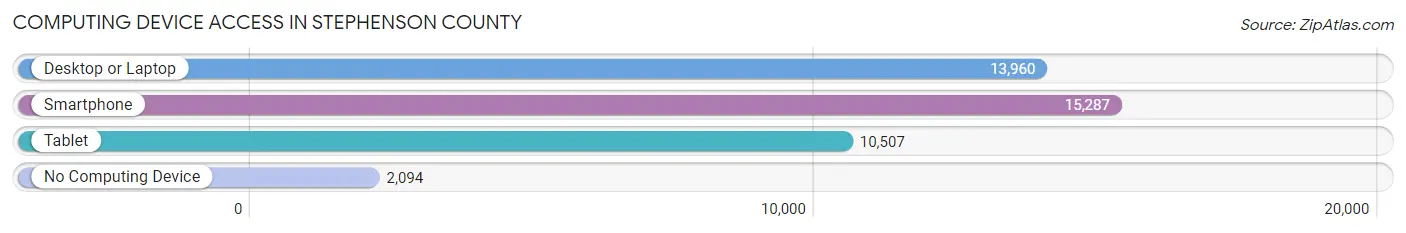
| Device Type | # Households | % Households |
| Desktop or Laptop | 13,960 | 72.2% |
| Smartphone | 15,287 | 79.1% |
| Tablet | 10,507 | 54.3% |
| No Computing Device | 2,094 | 10.8% |
| Total | 19,337 | 100.0% |
Internet Access in Stephenson County
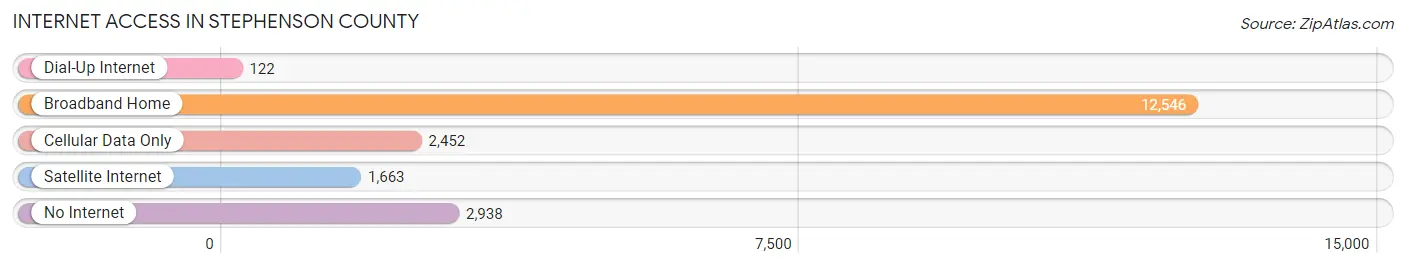
| Internet Type | # Households | % Households |
| Dial-Up Internet | 122 | 0.6% |
| Broadband Home | 12,546 | 64.9% |
| Cellular Data Only | 2,452 | 12.7% |
| Satellite Internet | 1,663 | 8.6% |
| No Internet | 2,938 | 15.2% |
| Total | 19,337 | 100.0% |
Stephenson County Summary
Stephenson County is located in the northwestern corner of Illinois, and is part of the Rockford Metropolitan Statistical Area. The county was established in 1837 and named after Colonel Benjamin Stephenson, a veteran of the War of 1812. The county seat is Freeport, and the population was 47,711 at the 2010 census.
Geography
Stephenson County is located in the northwestern corner of Illinois, and is bordered by Wisconsin to the north, Jo Daviess County to the east, Winnebago County to the south, and Ogle County to the west. The county has a total area of 576 square miles, of which 573 square miles is land and 3 square miles is water. The terrain is mostly flat, with some rolling hills in the northern part of the county. The highest point in the county is located in the northern part of the county, at an elevation of 890 feet.
The county is drained by the Pecatonica River, which flows through the county from east to west. The Pecatonica River is a tributary of the Rock River, which flows through the county from south to north. The county also contains several small lakes, including Lake Le-Aqua-Na, Lake Summerset, and Lake Carroll.
Climate
Stephenson County has a humid continental climate, with cold, snowy winters and hot, humid summers. The average annual temperature is 48°F, and the average annual precipitation is 36 inches.
Demographics
As of the 2010 census, there were 47,711 people, 18,845 households, and 12,717 families residing in the county. The population density was 83 people per square mile. The racial makeup of the county was 93.2% White, 1.3% African American, 0.3% Native American, 0.7% Asian, 0.1% Pacific Islander, 3.2% from other races, and 1.4% from two or more races. Hispanic or Latino of any race were 6.7% of the population.
The median income for a household in the county was $45,945, and the median income for a family was $54,945. The per capita income for the county was $22,845. About 8.2% of families and 11.2% of the population were below the poverty line, including 15.2% of those under age 18 and 7.2% of those age 65 or over.
Economy
The economy of Stephenson County is largely based on agriculture and manufacturing. The county is home to several large agricultural operations, including the Stephenson County Farm Bureau, which is the largest agricultural organization in the county. The county is also home to several large manufacturing companies, including the Freeport-based John Deere, which produces agricultural and construction equipment.
The county is also home to several large retail stores, including Walmart, Target, and Kohl's. The county is also home to several large medical facilities, including the Freeport Memorial Hospital and the Stephenson County Health Department.
The unemployment rate in Stephenson County was 4.2% in 2019, which is lower than the national average of 3.7%.
Conclusion
Stephenson County is located in the northwestern corner of Illinois and is part of the Rockford Metropolitan Statistical Area. The county was established in 1837 and named after Colonel Benjamin Stephenson, a veteran of the War of 1812. The county has a total area of 576 square miles, and the population was 47,711 at the 2010 census. The economy of Stephenson County is largely based on agriculture and manufacturing, and the unemployment rate in 2019 was 4.2%.
Common Questions
What is Per Capita Income in Stephenson County?
Per Capita income in Stephenson County is $32,900.
What is the Median Family Income in Stephenson County?
Median Family Income in Stephenson County is $73,244.
What is the Median Household income in Stephenson County?
Median Household Income in Stephenson County is $57,527.
What is Income or Wage Gap in Stephenson County?
Income or Wage Gap in Stephenson County is 30.8%.
Women in Stephenson County earn 69.2 cents for every dollar earned by a man.
What is Family Income Deficit in Stephenson County?
Family Income Deficit in Stephenson County is $7,641.
Families that are below poverty line in Stephenson County earn $7,641 less on average than the poverty threshold level.
What is Inequality or Gini Index in Stephenson County?
Inequality or Gini Index in Stephenson County is 0.44.
What is the Total Population of Stephenson County?
Total Population of Stephenson County is 44,482.
What is the Total Male Population of Stephenson County?
Total Male Population of Stephenson County is 21,763.
What is the Total Female Population of Stephenson County?
Total Female Population of Stephenson County is 22,719.
What is the Ratio of Males per 100 Females in Stephenson County?
There are 95.79 Males per 100 Females in Stephenson County.
What is the Ratio of Females per 100 Males in Stephenson County?
There are 104.39 Females per 100 Males in Stephenson County.
What is the Median Population Age in Stephenson County?
Median Population Age in Stephenson County is 45.6 Years.
What is the Average Family Size in Stephenson County
Average Family Size in Stephenson County is 2.8 People.
What is the Average Household Size in Stephenson County
Average Household Size in Stephenson County is 2.3 People.
How Large is the Labor Force in Stephenson County?
There are 21,506 People in the Labor Forcein in Stephenson County.
What is the Percentage of People in the Labor Force in Stephenson County?
59.3% of People are in the Labor Force in Stephenson County.
What is the Unemployment Rate in Stephenson County?
Unemployment Rate in Stephenson County is 5.3%.