Saline County, IL Map & Demographics
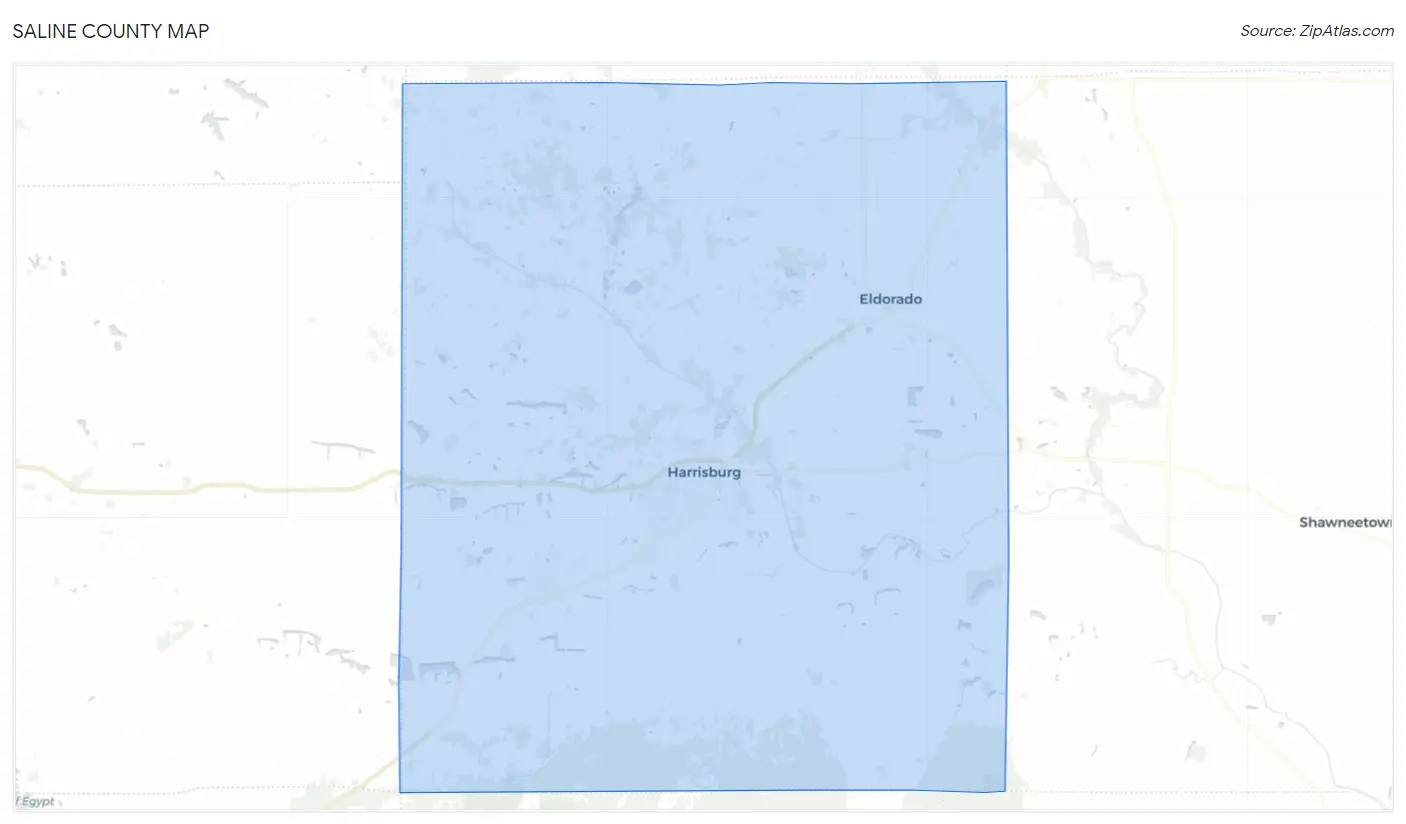
Saline County Map
Saline County Overview
$34,340
PER CAPITA INCOME
$69,712
AVG FAMILY INCOME
$51,710
AVG HOUSEHOLD INCOME
33.5%
WAGE / INCOME GAP [ % ]
66.5¢/ $1
WAGE / INCOME GAP [ $ ]
$9,103
FAMILY INCOME DEFICIT
0.51
INEQUALITY / GINI INDEX
23,662
TOTAL POPULATION
11,604
MALE POPULATION
12,058
FEMALE POPULATION
96.23
MALES / 100 FEMALES
103.91
FEMALES / 100 MALES
43.2
MEDIAN AGE
2.9
AVG FAMILY SIZE
2.3
AVG HOUSEHOLD SIZE
10,807
LABOR FORCE [ PEOPLE ]
55.9%
PERCENT IN LABOR FORCE
5.9%
UNEMPLOYMENT RATE
Saline County Area Codes
Income in Saline County
Income Overview in Saline County
Per Capita Income in Saline County is $34,340, while median incomes of families and households are $69,712 and $51,710 respectively.
| Characteristic | Number | Measure |
| Per Capita Income | 23,662 | $34,340 |
| Median Family Income | 6,431 | $69,712 |
| Mean Family Income | 6,431 | $93,630 |
| Median Household Income | 10,165 | $51,710 |
| Mean Household Income | 10,165 | $78,176 |
| Income Deficit | 6,431 | $9,103 |
| Wage / Income Gap (%) | 23,662 | 33.48% |
| Wage / Income Gap ($) | 23,662 | 66.52¢ per $1 |
| Gini / Inequality Index | 23,662 | 0.51 |
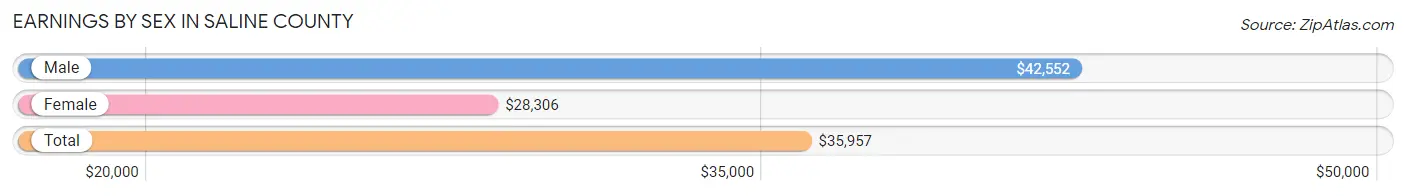
Earnings by Sex in Saline County
Average Earnings in Saline County are $35,957, $42,552 for men and $28,306 for women, a difference of 33.5%.
| Sex | Number | Average Earnings |
| Male | 5,748 (51.7%) | $42,552 |
| Female | 5,374 (48.3%) | $28,306 |
| Total | 11,122 (100.0%) | $35,957 |
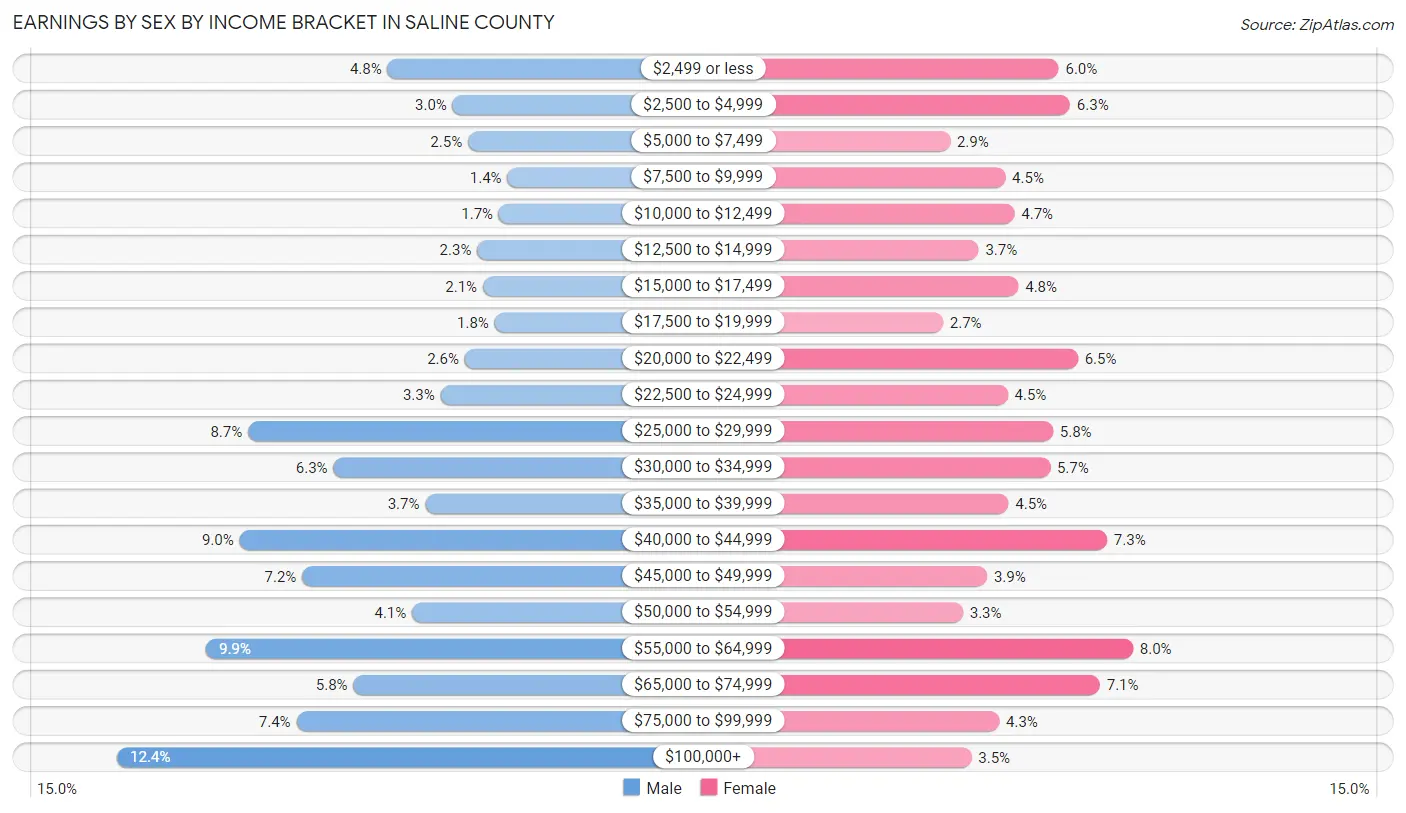
Earnings by Sex by Income Bracket in Saline County
The most common earnings brackets in Saline County are $100,000+ for men (713 | 12.4%) and $55,000 to $64,999 for women (432 | 8.0%).
| Income | Male | Female |
| $2,499 or less | 276 (4.8%) | 320 (5.9%) |
| $2,500 to $4,999 | 171 (3.0%) | 337 (6.3%) |
| $5,000 to $7,499 | 146 (2.5%) | 156 (2.9%) |
| $7,500 to $9,999 | 82 (1.4%) | 239 (4.4%) |
| $10,000 to $12,499 | 96 (1.7%) | 253 (4.7%) |
| $12,500 to $14,999 | 131 (2.3%) | 199 (3.7%) |
| $15,000 to $17,499 | 122 (2.1%) | 259 (4.8%) |
| $17,500 to $19,999 | 103 (1.8%) | 145 (2.7%) |
| $20,000 to $22,499 | 151 (2.6%) | 349 (6.5%) |
| $22,500 to $24,999 | 190 (3.3%) | 243 (4.5%) |
| $25,000 to $29,999 | 501 (8.7%) | 311 (5.8%) |
| $30,000 to $34,999 | 363 (6.3%) | 307 (5.7%) |
| $35,000 to $39,999 | 215 (3.7%) | 244 (4.5%) |
| $40,000 to $44,999 | 515 (9.0%) | 393 (7.3%) |
| $45,000 to $49,999 | 414 (7.2%) | 212 (3.9%) |
| $50,000 to $54,999 | 236 (4.1%) | 175 (3.3%) |
| $55,000 to $64,999 | 569 (9.9%) | 432 (8.0%) |
| $65,000 to $74,999 | 331 (5.8%) | 382 (7.1%) |
| $75,000 to $99,999 | 423 (7.4%) | 230 (4.3%) |
| $100,000+ | 713 (12.4%) | 188 (3.5%) |
| Total | 5,748 (100.0%) | 5,374 (100.0%) |
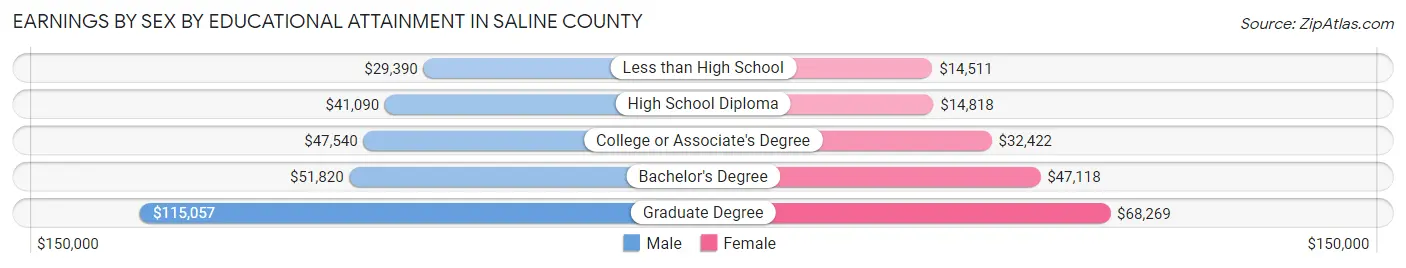
Earnings by Sex by Educational Attainment in Saline County
Average earnings in Saline County are $45,801 for men and $33,318 for women, a difference of 27.3%. Men with an educational attainment of graduate degree enjoy the highest average annual earnings of $115,057, while those with less than high school education earn the least with $29,390. Women with an educational attainment of graduate degree earn the most with the average annual earnings of $68,269, while those with less than high school education have the smallest earnings of $14,511.
| Educational Attainment | Male Income | Female Income |
| Less than High School | $29,390 | $14,511 |
| High School Diploma | $41,090 | $14,818 |
| College or Associate's Degree | $47,540 | $32,422 |
| Bachelor's Degree | $51,820 | $47,118 |
| Graduate Degree | $115,057 | $68,269 |
| Total | $45,801 | $33,318 |
Family Income in Saline County
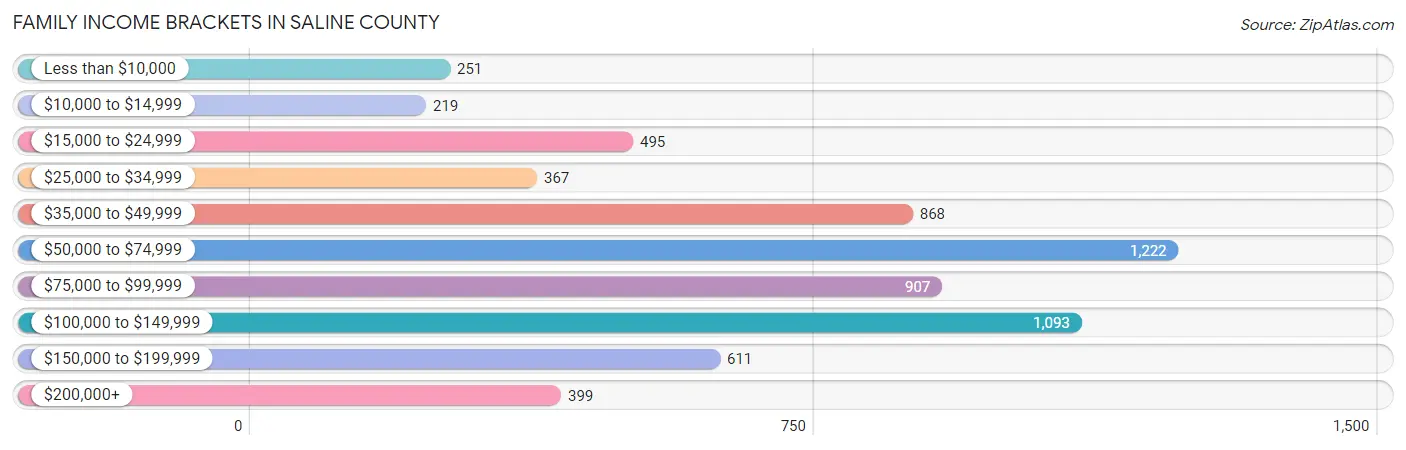
Family Income Brackets in Saline County
According to the Saline County family income data, there are 1,222 families falling into the $50,000 to $74,999 income range, which is the most common income bracket and makes up 19.0% of all families. Conversely, the $10,000 to $14,999 income bracket is the least frequent group with only 219 families (3.4%) belonging to this category.
| Income Bracket | # Families | % Families |
| Less than $10,000 | 251 | 3.9% |
| $10,000 to $14,999 | 219 | 3.4% |
| $15,000 to $24,999 | 495 | 7.7% |
| $25,000 to $34,999 | 367 | 5.7% |
| $35,000 to $49,999 | 868 | 13.5% |
| $50,000 to $74,999 | 1,222 | 19.0% |
| $75,000 to $99,999 | 907 | 14.1% |
| $100,000 to $149,999 | 1,093 | 17.0% |
| $150,000 to $199,999 | 611 | 9.5% |
| $200,000+ | 399 | 6.2% |
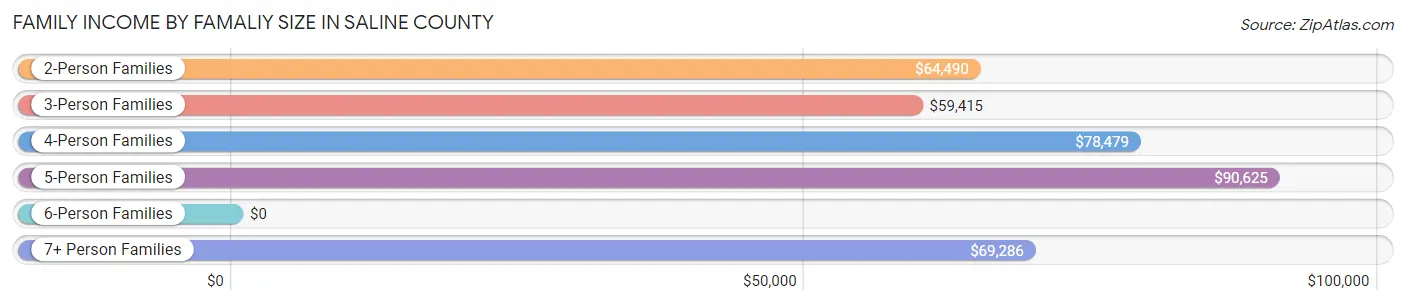
Family Income by Famaliy Size in Saline County
5-person families (367 | 5.7%) account for the highest median family income in Saline County with $90,625 per family, while 2-person families (3,408 | 53.0%) have the highest median income of $32,245 per family member.
| Income Bracket | # Families | Median Income |
| 2-Person Families | 3,408 (53.0%) | $64,490 |
| 3-Person Families | 1,277 (19.9%) | $59,415 |
| 4-Person Families | 1,215 (18.9%) | $78,479 |
| 5-Person Families | 367 (5.7%) | $90,625 |
| 6-Person Families | 50 (0.8%) | $0 |
| 7+ Person Families | 114 (1.8%) | $69,286 |
| Total | 6,431 (100.0%) | $69,712 |
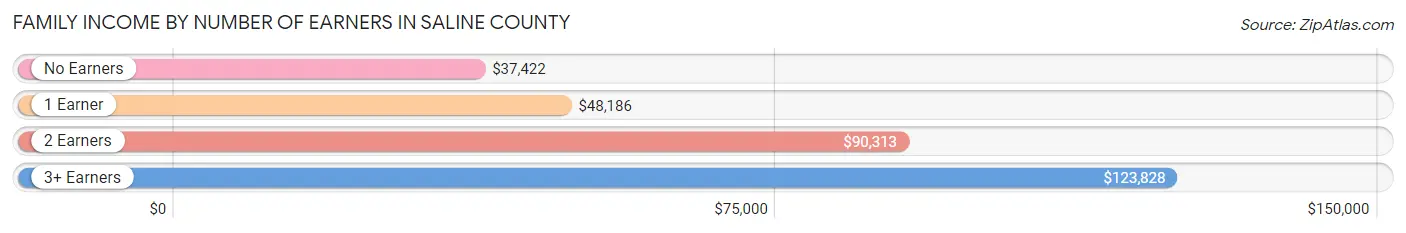
Family Income by Number of Earners in Saline County
The median family income in Saline County is $69,712, with families comprising 3+ earners (335) having the highest median family income of $123,828, while families with no earners (1,093) have the lowest median family income of $37,422, accounting for 5.2% and 17.0% of families, respectively.
| Number of Earners | # Families | Median Income |
| No Earners | 1,093 (17.0%) | $37,422 |
| 1 Earner | 2,406 (37.4%) | $48,186 |
| 2 Earners | 2,597 (40.4%) | $90,313 |
| 3+ Earners | 335 (5.2%) | $123,828 |
| Total | 6,431 (100.0%) | $69,712 |
Household Income in Saline County
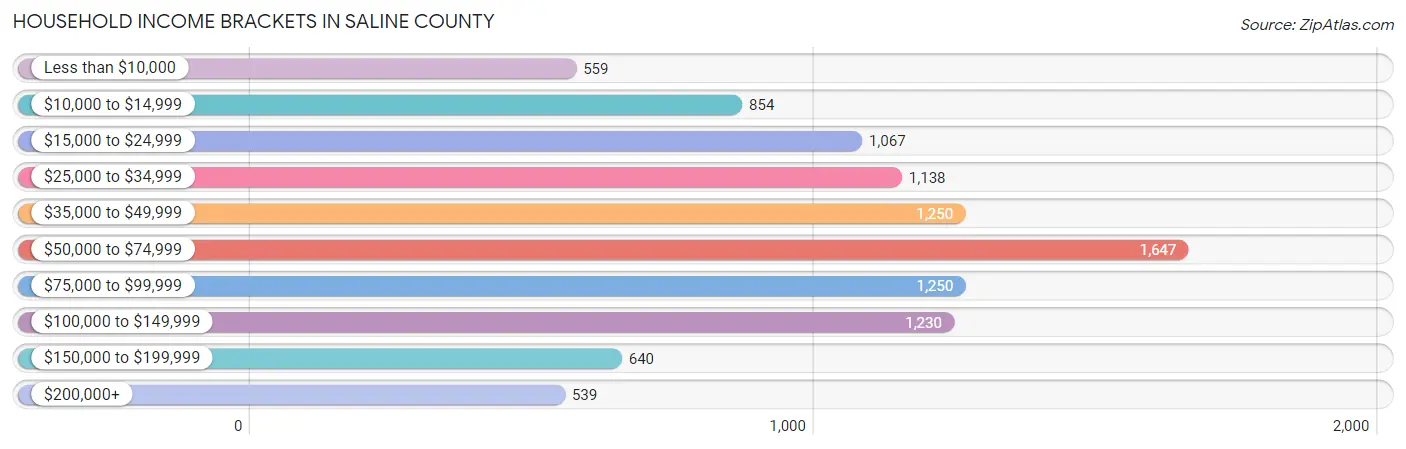
Household Income Brackets in Saline County
With 1,647 households falling in the category, the $50,000 to $74,999 income range is the most frequent in Saline County, accounting for 16.2% of all households. In contrast, only 539 households (5.3%) fall into the $200,000+ income bracket, making it the least populous group.
| Income Bracket | # Households | % Households |
| Less than $10,000 | 559 | 5.5% |
| $10,000 to $14,999 | 854 | 8.4% |
| $15,000 to $24,999 | 1,067 | 10.5% |
| $25,000 to $34,999 | 1,138 | 11.2% |
| $35,000 to $49,999 | 1,250 | 12.3% |
| $50,000 to $74,999 | 1,647 | 16.2% |
| $75,000 to $99,999 | 1,250 | 12.3% |
| $100,000 to $149,999 | 1,230 | 12.1% |
| $150,000 to $199,999 | 640 | 6.3% |
| $200,000+ | 539 | 5.3% |
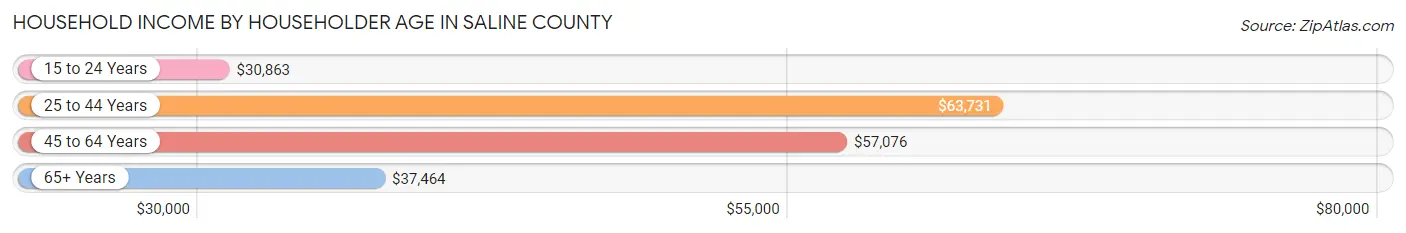
Household Income by Householder Age in Saline County
The median household income in Saline County is $51,710, with the highest median household income of $63,731 found in the 25 to 44 years age bracket for the primary householder. A total of 2,784 households (27.4%) fall into this category. Meanwhile, the 15 to 24 years age bracket for the primary householder has the lowest median household income of $30,863, with 233 households (2.3%) in this group.
| Income Bracket | # Households | Median Income |
| 15 to 24 Years | 233 (2.3%) | $30,863 |
| 25 to 44 Years | 2,784 (27.4%) | $63,731 |
| 45 to 64 Years | 3,795 (37.3%) | $57,076 |
| 65+ Years | 3,353 (33.0%) | $37,464 |
| Total | 10,165 (100.0%) | $51,710 |
Poverty in Saline County
Income Below Poverty by Sex and Age in Saline County
With 16.8% poverty level for males and 19.1% for females among the residents of Saline County, 5 year old males and 15 year old females are the most vulnerable to poverty, with 63 males (41.7%) and 46 females (56.1%) in their respective age groups living below the poverty level.
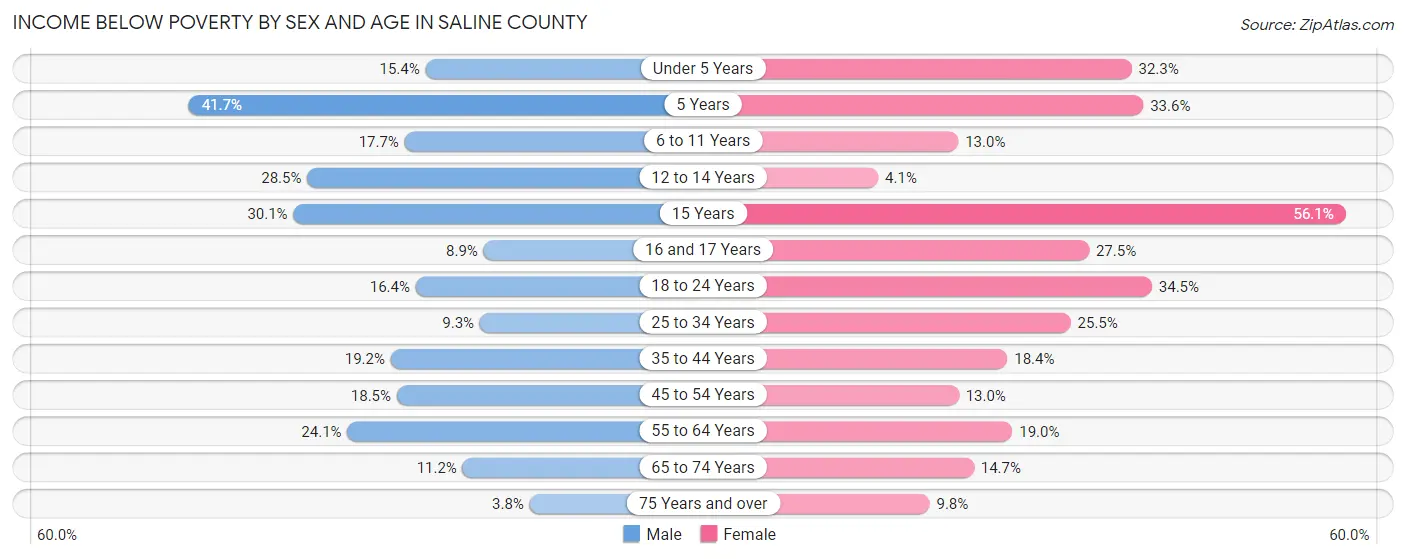
| Age Bracket | Male | Female |
| Under 5 Years | 107 (15.3%) | 212 (32.3%) |
| 5 Years | 63 (41.7%) | 48 (33.6%) |
| 6 to 11 Years | 117 (17.7%) | 100 (13.0%) |
| 12 to 14 Years | 146 (28.5%) | 14 (4.1%) |
| 15 Years | 52 (30.1%) | 46 (56.1%) |
| 16 and 17 Years | 22 (8.9%) | 79 (27.5%) |
| 18 to 24 Years | 126 (16.4%) | 259 (34.5%) |
| 25 to 34 Years | 129 (9.3%) | 381 (25.5%) |
| 35 to 44 Years | 262 (19.2%) | 251 (18.4%) |
| 45 to 54 Years | 274 (18.5%) | 189 (13.0%) |
| 55 to 64 Years | 431 (24.0%) | 355 (19.0%) |
| 65 to 74 Years | 146 (11.2%) | 201 (14.7%) |
| 75 Years and over | 31 (3.7%) | 115 (9.8%) |
| Total | 1,906 (16.8%) | 2,250 (19.1%) |
Income Above Poverty by Sex and Age in Saline County
According to the poverty statistics in Saline County, males aged 75 years and over and females aged 12 to 14 years are the age groups that are most secure financially, with 96.3% of males and 96.0% of females in these age groups living above the poverty line.
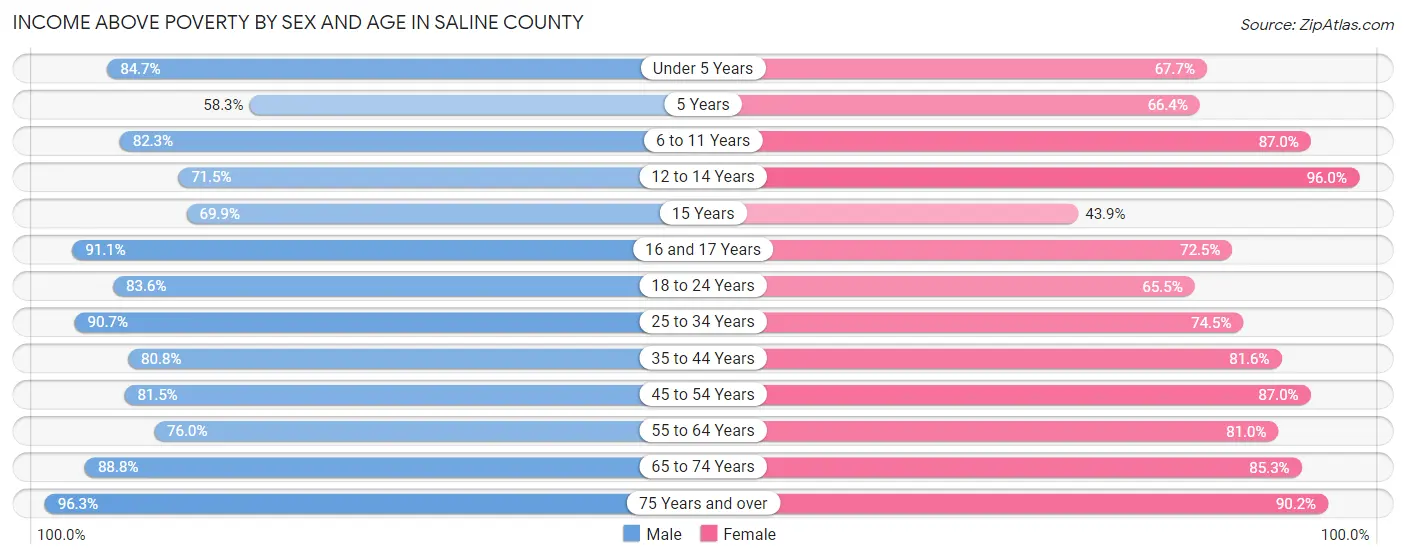
| Age Bracket | Male | Female |
| Under 5 Years | 590 (84.7%) | 445 (67.7%) |
| 5 Years | 88 (58.3%) | 95 (66.4%) |
| 6 to 11 Years | 545 (82.3%) | 671 (87.0%) |
| 12 to 14 Years | 366 (71.5%) | 332 (96.0%) |
| 15 Years | 121 (69.9%) | 36 (43.9%) |
| 16 and 17 Years | 226 (91.1%) | 208 (72.5%) |
| 18 to 24 Years | 641 (83.6%) | 491 (65.5%) |
| 25 to 34 Years | 1,259 (90.7%) | 1,114 (74.5%) |
| 35 to 44 Years | 1,101 (80.8%) | 1,111 (81.6%) |
| 45 to 54 Years | 1,204 (81.5%) | 1,263 (87.0%) |
| 55 to 64 Years | 1,361 (75.9%) | 1,514 (81.0%) |
| 65 to 74 Years | 1,156 (88.8%) | 1,166 (85.3%) |
| 75 Years and over | 795 (96.3%) | 1,062 (90.2%) |
| Total | 9,453 (83.2%) | 9,508 (80.9%) |
Income Below Poverty Among Married-Couple Families in Saline County
The poverty statistics for married-couple families in Saline County show that 6.4% or 304 of the total 4,740 families live below the poverty line. Families with 3 or 4 children have the highest poverty rate of 11.1%, comprising of 38 families. On the other hand, families with 5 or more children have the lowest poverty rate of 0.0%, which includes 0 families.
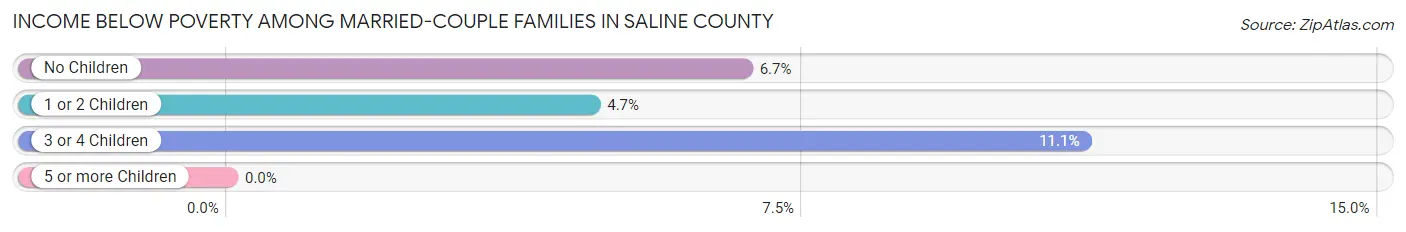
| Children | Above Poverty | Below Poverty |
| No Children | 2,775 (93.3%) | 200 (6.7%) |
| 1 or 2 Children | 1,330 (95.3%) | 66 (4.7%) |
| 3 or 4 Children | 303 (88.9%) | 38 (11.1%) |
| 5 or more Children | 28 (100.0%) | 0 (0.0%) |
| Total | 4,436 (93.6%) | 304 (6.4%) |
Income Below Poverty Among Single-Parent Households in Saline County
According to the poverty data in Saline County, 19.4% or 106 single-father households and 43.8% or 502 single-mother households are living below the poverty line. Among single-father households, those with 1 or 2 children have the highest poverty rate, with 79 households (23.0%) experiencing poverty. Likewise, among single-mother households, those with 3 or 4 children have the highest poverty rate, with 154 households (71.0%) falling below the poverty line.
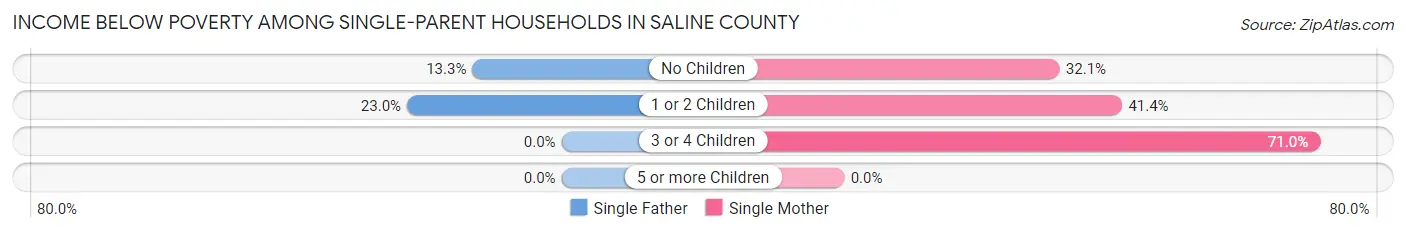
| Children | Single Father | Single Mother |
| No Children | 27 (13.3%) | 110 (32.1%) |
| 1 or 2 Children | 79 (23.0%) | 238 (41.4%) |
| 3 or 4 Children | 0 (0.0%) | 154 (71.0%) |
| 5 or more Children | 0 (0.0%) | 0 (0.0%) |
| Total | 106 (19.4%) | 502 (43.8%) |
Income Below Poverty Among Married-Couple vs Single-Parent Households in Saline County
The poverty data for Saline County shows that 304 of the married-couple family households (6.4%) and 608 of the single-parent households (36.0%) are living below the poverty level. Within the married-couple family households, those with 3 or 4 children have the highest poverty rate, with 38 households (11.1%) falling below the poverty line. Among the single-parent households, those with 3 or 4 children have the highest poverty rate, with 154 household (71.0%) living below poverty.
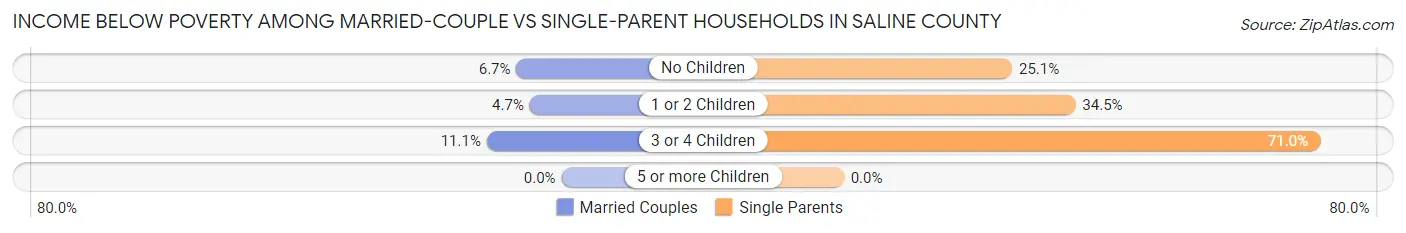
| Children | Married-Couple Families | Single-Parent Households |
| No Children | 200 (6.7%) | 137 (25.1%) |
| 1 or 2 Children | 66 (4.7%) | 317 (34.5%) |
| 3 or 4 Children | 38 (11.1%) | 154 (71.0%) |
| 5 or more Children | 0 (0.0%) | 0 (0.0%) |
| Total | 304 (6.4%) | 608 (36.0%) |
Race in Saline County
The most populous races in Saline County are White / Caucasian (21,992 | 92.9%), Two or more Races (773 | 3.3%), and Black / African American (589 | 2.5%).
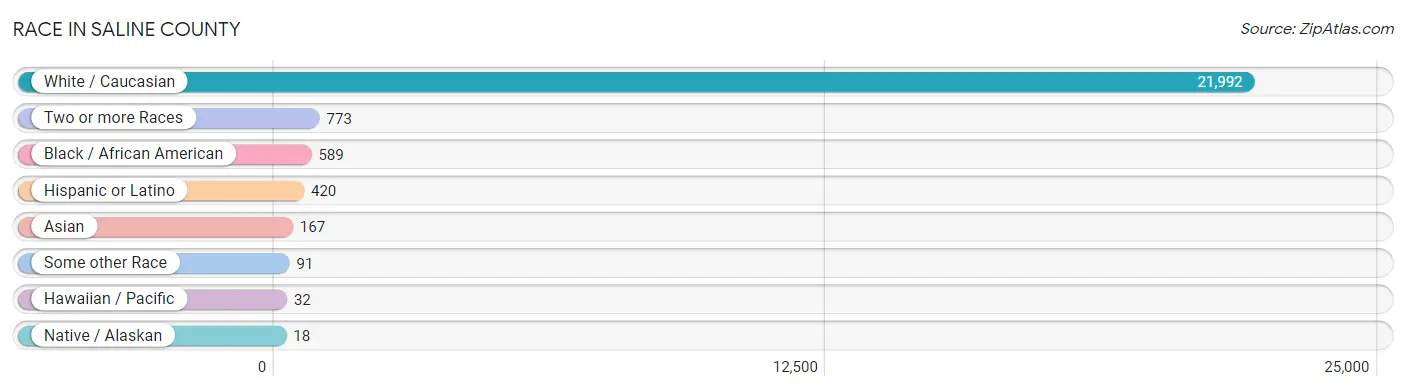
| Race | # Population | % Population |
| Asian | 167 | 0.7% |
| Black / African American | 589 | 2.5% |
| Hawaiian / Pacific | 32 | 0.1% |
| Hispanic or Latino | 420 | 1.8% |
| Native / Alaskan | 18 | 0.1% |
| White / Caucasian | 21,992 | 92.9% |
| Two or more Races | 773 | 3.3% |
| Some other Race | 91 | 0.4% |
| Total | 23,662 | 100.0% |
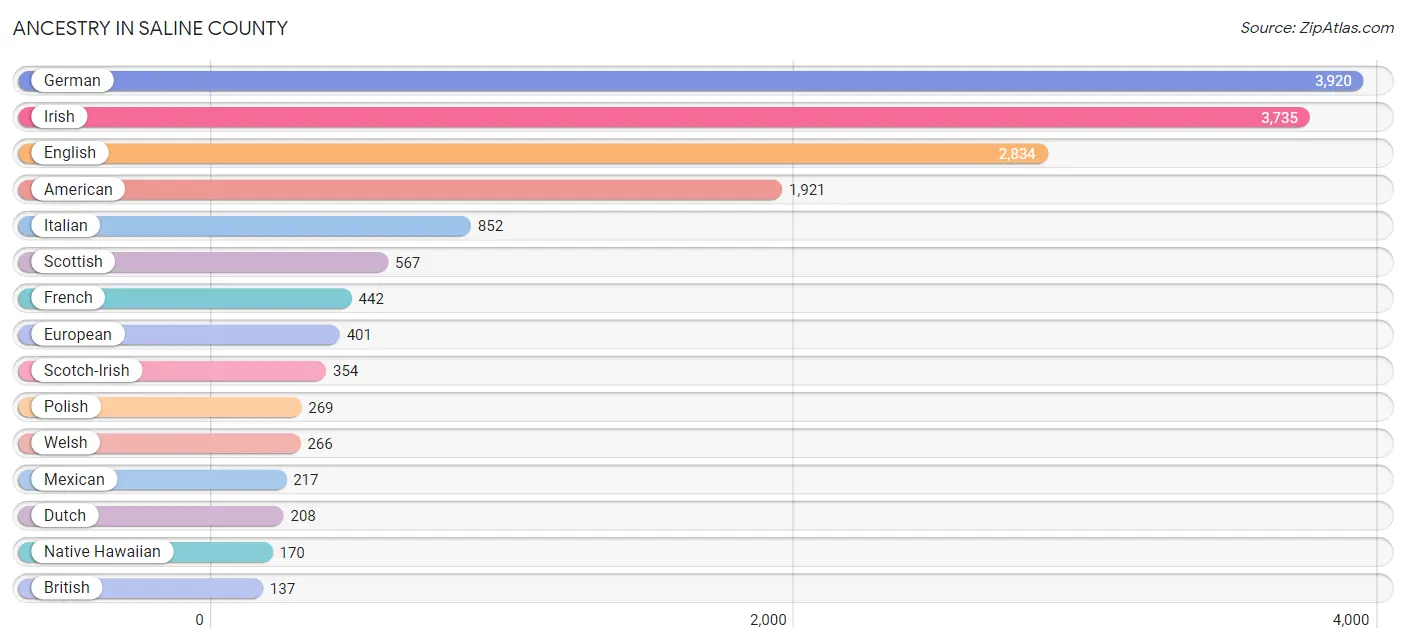
Ancestry in Saline County
The most populous ancestries reported in Saline County are German (3,920 | 16.6%), Irish (3,735 | 15.8%), English (2,834 | 12.0%), American (1,921 | 8.1%), and Italian (852 | 3.6%), together accounting for 56.0% of all Saline County residents.
| Ancestry | # Population | % Population |
| African | 15 | 0.1% |
| American | 1,921 | 8.1% |
| Apache | 42 | 0.2% |
| Austrian | 14 | 0.1% |
| Belgian | 10 | 0.0% |
| Bhutanese | 10 | 0.0% |
| Blackfeet | 42 | 0.2% |
| British | 137 | 0.6% |
| Burmese | 49 | 0.2% |
| Canadian | 7 | 0.0% |
| Central American | 49 | 0.2% |
| Cherokee | 108 | 0.5% |
| Choctaw | 7 | 0.0% |
| Croatian | 5 | 0.0% |
| Czech | 25 | 0.1% |
| Czechoslovakian | 17 | 0.1% |
| Danish | 4 | 0.0% |
| Delaware | 5 | 0.0% |
| Dutch | 208 | 0.9% |
| Eastern European | 53 | 0.2% |
| English | 2,834 | 12.0% |
| European | 401 | 1.7% |
| French | 442 | 1.9% |
| French Canadian | 30 | 0.1% |
| German | 3,920 | 16.6% |
| Greek | 46 | 0.2% |
| Guatemalan | 12 | 0.1% |
| Honduran | 37 | 0.2% |
| Hungarian | 36 | 0.2% |
| Indian (Asian) | 67 | 0.3% |
| Irish | 3,735 | 15.8% |
| Italian | 852 | 3.6% |
| Korean | 65 | 0.3% |
| Lithuanian | 75 | 0.3% |
| Mexican | 217 | 0.9% |
| Native Hawaiian | 170 | 0.7% |
| Norwegian | 15 | 0.1% |
| Pennsylvania German | 111 | 0.5% |
| Pima | 10 | 0.0% |
| Polish | 269 | 1.1% |
| Puerto Rican | 112 | 0.5% |
| Russian | 134 | 0.6% |
| Scandinavian | 28 | 0.1% |
| Scotch-Irish | 354 | 1.5% |
| Scottish | 567 | 2.4% |
| Seminole | 3 | 0.0% |
| Spaniard | 42 | 0.2% |
| Sri Lankan | 21 | 0.1% |
| Subsaharan African | 15 | 0.1% |
| Swedish | 49 | 0.2% |
| Swiss | 33 | 0.1% |
| U.S. Virgin Islander | 7 | 0.0% |
| Welsh | 266 | 1.1% | View All 53 Rows |
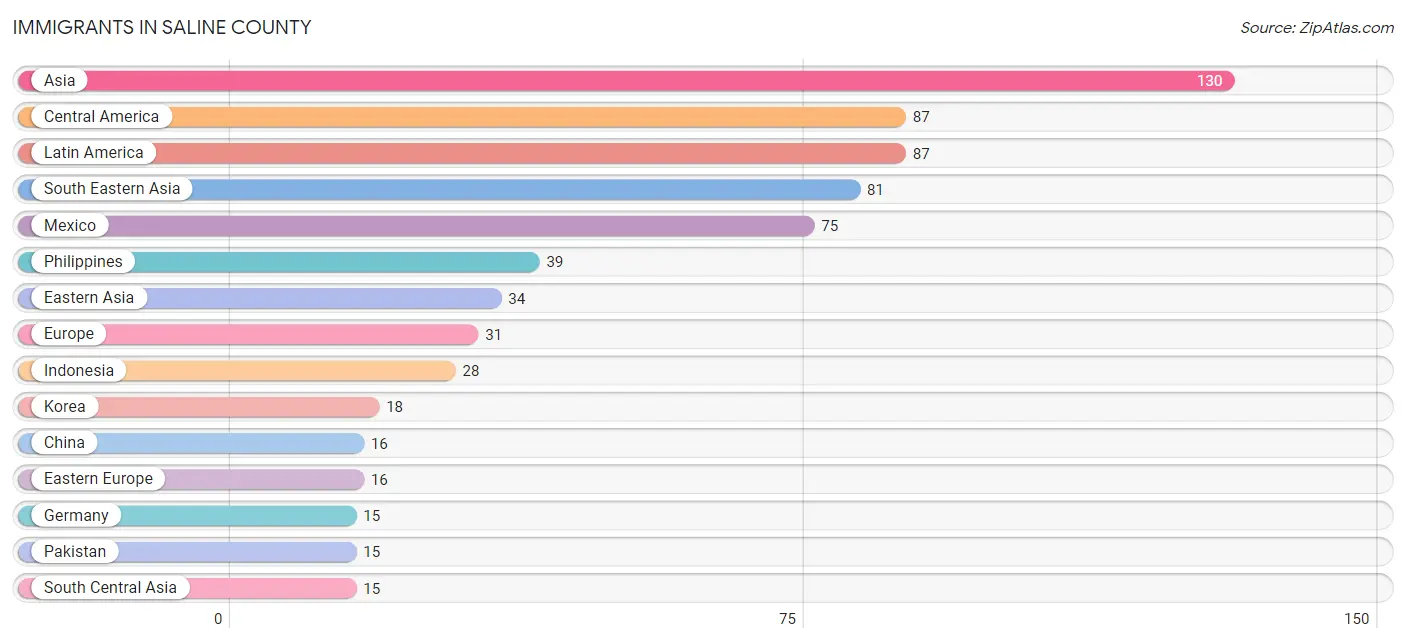
Immigrants in Saline County
The most numerous immigrant groups reported in Saline County came from Asia (130 | 0.5%), Central America (87 | 0.4%), Latin America (87 | 0.4%), South Eastern Asia (81 | 0.3%), and Mexico (75 | 0.3%), together accounting for 1.9% of all Saline County residents.
| Immigration Origin | # Population | % Population |
| Asia | 130 | 0.5% |
| Central America | 87 | 0.4% |
| China | 16 | 0.1% |
| Eastern Asia | 34 | 0.1% |
| Eastern Europe | 16 | 0.1% |
| Europe | 31 | 0.1% |
| Germany | 15 | 0.1% |
| Guatemala | 12 | 0.1% |
| Hungary | 5 | 0.0% |
| Indonesia | 28 | 0.1% |
| Korea | 18 | 0.1% |
| Latin America | 87 | 0.4% |
| Mexico | 75 | 0.3% |
| Pakistan | 15 | 0.1% |
| Philippines | 39 | 0.2% |
| Poland | 11 | 0.1% |
| South Central Asia | 15 | 0.1% |
| South Eastern Asia | 81 | 0.3% |
| Vietnam | 8 | 0.0% |
| Western Europe | 15 | 0.1% | View All 20 Rows |
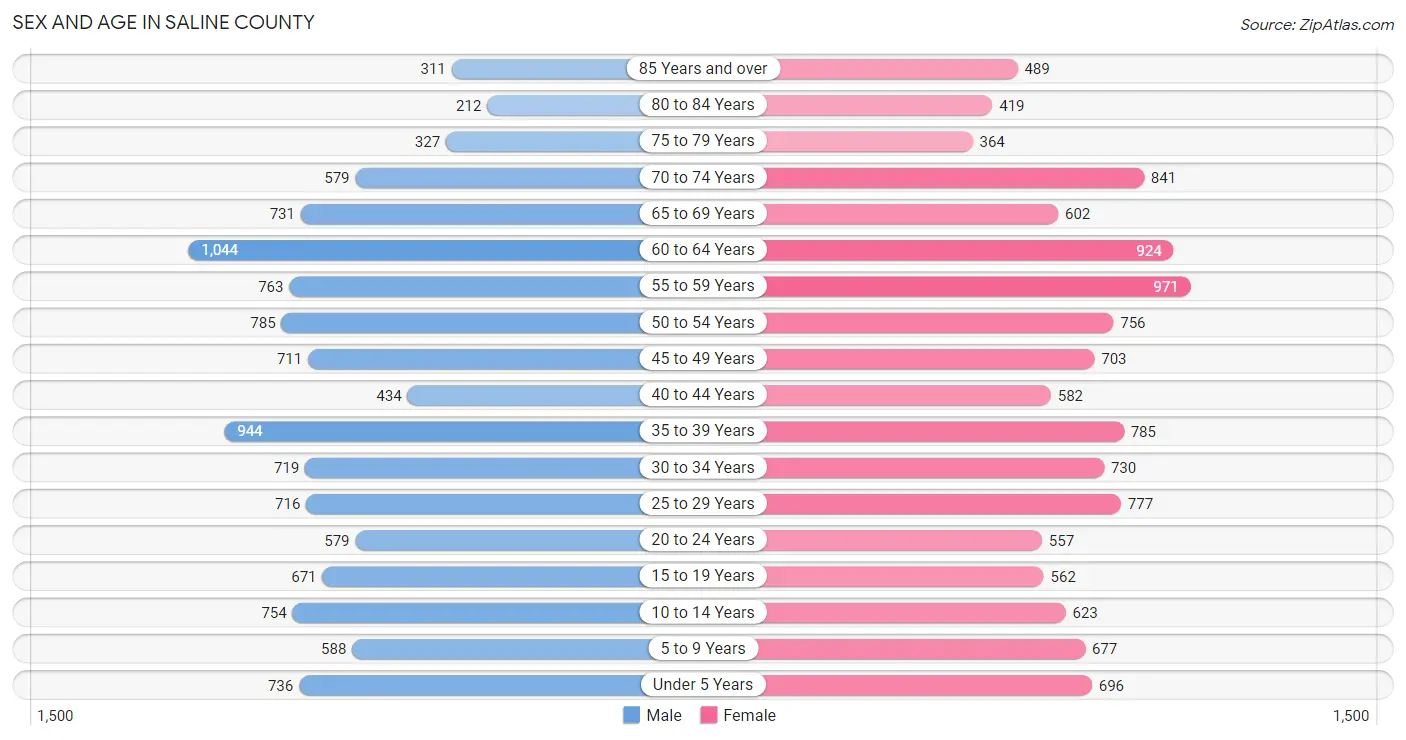
Sex and Age in Saline County
Sex and Age in Saline County
The most populous age groups in Saline County are 60 to 64 Years (1,044 | 9.0%) for men and 55 to 59 Years (971 | 8.1%) for women.
| Age Bracket | Male | Female |
| Under 5 Years | 736 (6.3%) | 696 (5.8%) |
| 5 to 9 Years | 588 (5.1%) | 677 (5.6%) |
| 10 to 14 Years | 754 (6.5%) | 623 (5.2%) |
| 15 to 19 Years | 671 (5.8%) | 562 (4.7%) |
| 20 to 24 Years | 579 (5.0%) | 557 (4.6%) |
| 25 to 29 Years | 716 (6.2%) | 777 (6.4%) |
| 30 to 34 Years | 719 (6.2%) | 730 (6.0%) |
| 35 to 39 Years | 944 (8.1%) | 785 (6.5%) |
| 40 to 44 Years | 434 (3.7%) | 582 (4.8%) |
| 45 to 49 Years | 711 (6.1%) | 703 (5.8%) |
| 50 to 54 Years | 785 (6.8%) | 756 (6.3%) |
| 55 to 59 Years | 763 (6.6%) | 971 (8.1%) |
| 60 to 64 Years | 1,044 (9.0%) | 924 (7.7%) |
| 65 to 69 Years | 731 (6.3%) | 602 (5.0%) |
| 70 to 74 Years | 579 (5.0%) | 841 (7.0%) |
| 75 to 79 Years | 327 (2.8%) | 364 (3.0%) |
| 80 to 84 Years | 212 (1.8%) | 419 (3.5%) |
| 85 Years and over | 311 (2.7%) | 489 (4.1%) |
| Total | 11,604 (100.0%) | 12,058 (100.0%) |
Families and Households in Saline County
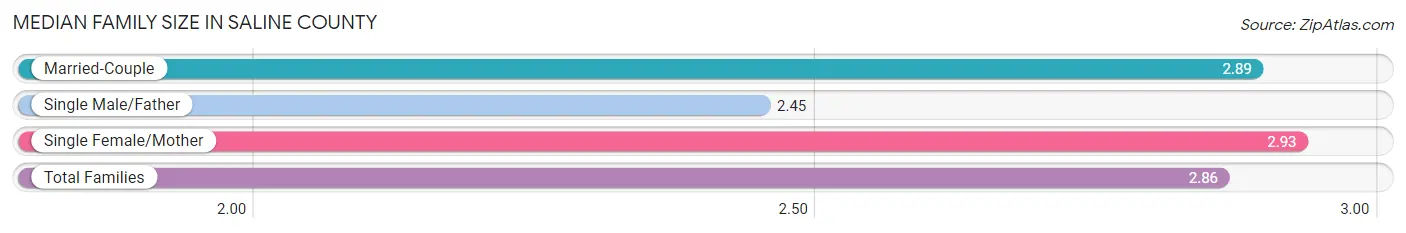
Median Family Size in Saline County
The median family size in Saline County is 2.86 persons per family, with single female/mother families (1,145 | 17.8%) accounting for the largest median family size of 2.93 persons per family. On the other hand, single male/father families (546 | 8.5%) represent the smallest median family size with 2.45 persons per family.
| Family Type | # Families | Family Size |
| Married-Couple | 4,740 (73.7%) | 2.89 |
| Single Male/Father | 546 (8.5%) | 2.45 |
| Single Female/Mother | 1,145 (17.8%) | 2.93 |
| Total Families | 6,431 (100.0%) | 2.86 |
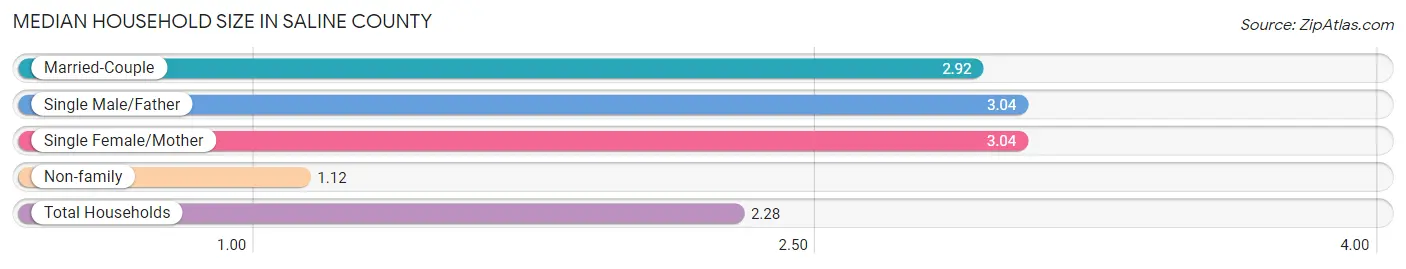
Median Household Size in Saline County
The median household size in Saline County is 2.28 persons per household, with single male/father households (546 | 5.4%) accounting for the largest median household size of 3.04 persons per household. non-family households (3,734 | 36.7%) represent the smallest median household size with 1.12 persons per household.
| Household Type | # Households | Household Size |
| Married-Couple | 4,740 (46.6%) | 2.92 |
| Single Male/Father | 546 (5.4%) | 3.04 |
| Single Female/Mother | 1,145 (11.3%) | 3.04 |
| Non-family | 3,734 (36.7%) | 1.12 |
| Total Households | 10,165 (100.0%) | 2.28 |
Household Size by Marriage Status in Saline County
Out of a total of 10,165 households in Saline County, 6,431 (63.3%) are family households, while 3,734 (36.7%) are nonfamily households. The most numerous type of family households are 2-person households, comprising 3,168, and the most common type of nonfamily households are 1-person households, comprising 3,396.
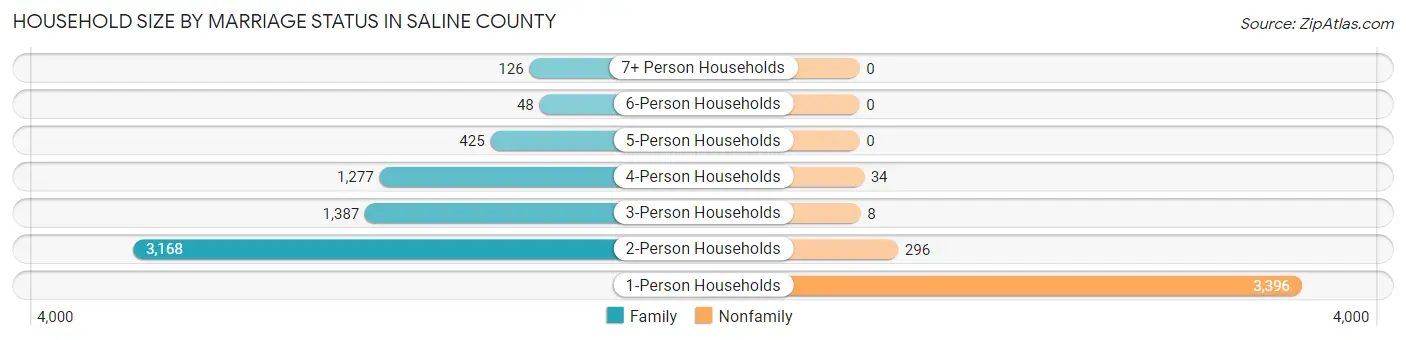
| Household Size | Family Households | Nonfamily Households |
| 1-Person Households | - | 3,396 (33.4%) |
| 2-Person Households | 3,168 (31.2%) | 296 (2.9%) |
| 3-Person Households | 1,387 (13.6%) | 8 (0.1%) |
| 4-Person Households | 1,277 (12.6%) | 34 (0.3%) |
| 5-Person Households | 425 (4.2%) | 0 (0.0%) |
| 6-Person Households | 48 (0.5%) | 0 (0.0%) |
| 7+ Person Households | 126 (1.2%) | 0 (0.0%) |
| Total | 6,431 (63.3%) | 3,734 (36.7%) |
Female Fertility in Saline County
Fertility by Age in Saline County
Average fertility rate in Saline County is 59.0 births per 1,000 women. Women in the age bracket of 20 to 34 years have the highest fertility rate with 120.0 births per 1,000 women. Women in the age bracket of 20 to 34 years acount for 87.0% of all women with births.
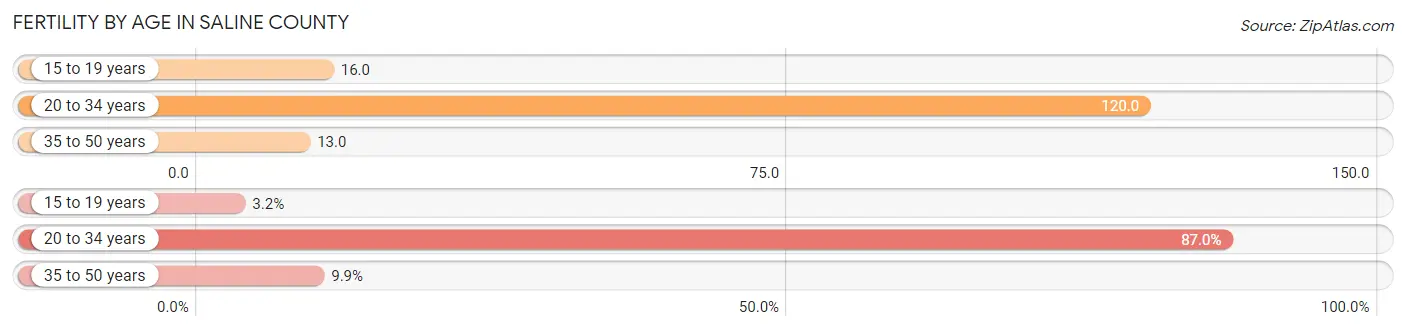
| Age Bracket | Women with Births | Births / 1,000 Women |
| 15 to 19 years | 9 (3.2%) | 16.0 |
| 20 to 34 years | 247 (87.0%) | 120.0 |
| 35 to 50 years | 28 (9.9%) | 13.0 |
| Total | 284 (100.0%) | 59.0 |
Fertility by Age by Marriage Status in Saline County
63.0% of women with births (284) in Saline County are married. The highest percentage of unmarried women with births falls into 15 to 19 years age bracket with 100.0% of them unmarried at the time of birth, while the lowest percentage of unmarried women with births belong to 35 to 50 years age bracket with 0.0% of them unmarried.
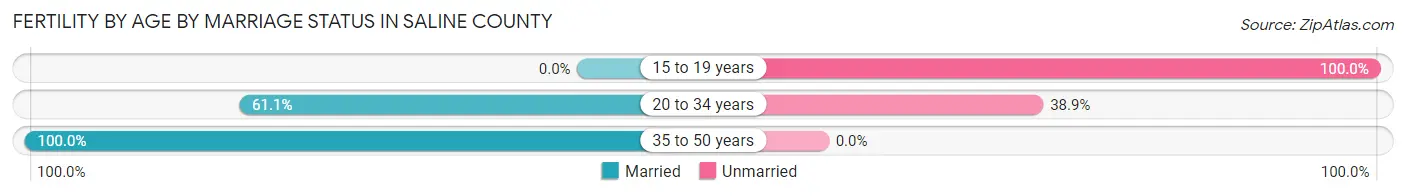
| Age Bracket | Married | Unmarried |
| 15 to 19 years | 0 (0.0%) | 9 (100.0%) |
| 20 to 34 years | 151 (61.1%) | 96 (38.9%) |
| 35 to 50 years | 28 (100.0%) | 0 (0.0%) |
| Total | 179 (63.0%) | 105 (37.0%) |
Fertility by Education in Saline County
Average fertility rate in Saline County is 59.0 births per 1,000 women. Women with the education attainment of high school diploma have the highest fertility rate of 112.0 births per 1,000 women, while women with the education attainment of less than high school have the lowest fertility at 8.0 births per 1,000 women. Women with the education attainment of college or associate's degree represent 48.2% of all women with births.
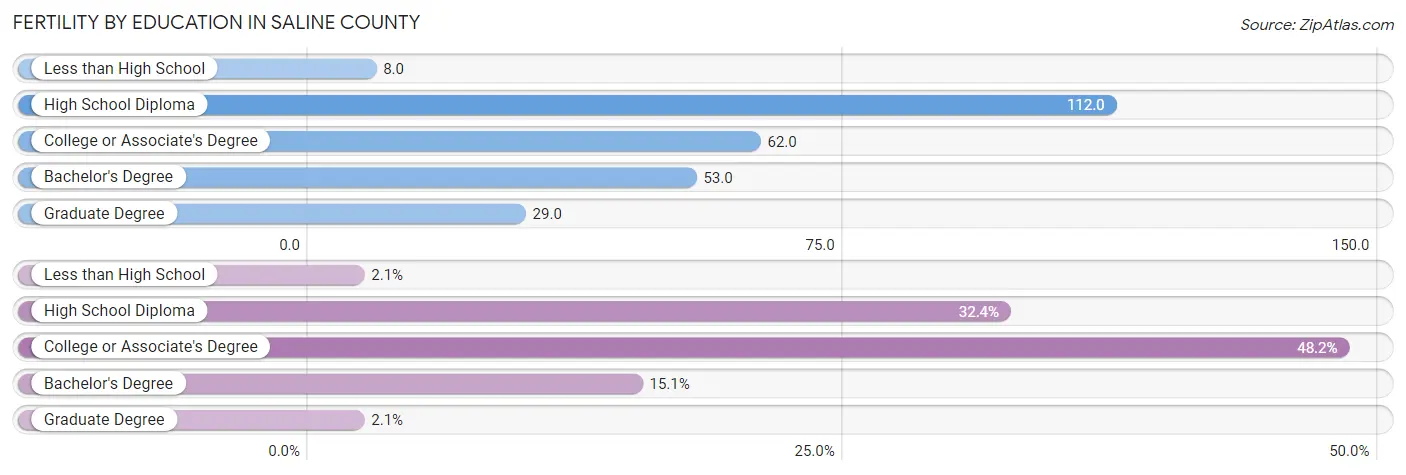
| Educational Attainment | Women with Births | Births / 1,000 Women |
| Less than High School | 6 (2.1%) | 8.0 |
| High School Diploma | 92 (32.4%) | 112.0 |
| College or Associate's Degree | 137 (48.2%) | 62.0 |
| Bachelor's Degree | 43 (15.1%) | 53.0 |
| Graduate Degree | 6 (2.1%) | 29.0 |
| Total | 284 (100.0%) | 59.0 |
Fertility by Education by Marriage Status in Saline County
37.0% of women with births in Saline County are unmarried. Women with the educational attainment of less than high school are most likely to be married with 100.0% of them married at childbirth, while women with the educational attainment of high school diploma are least likely to be married with 83.7% of them unmarried at childbirth.
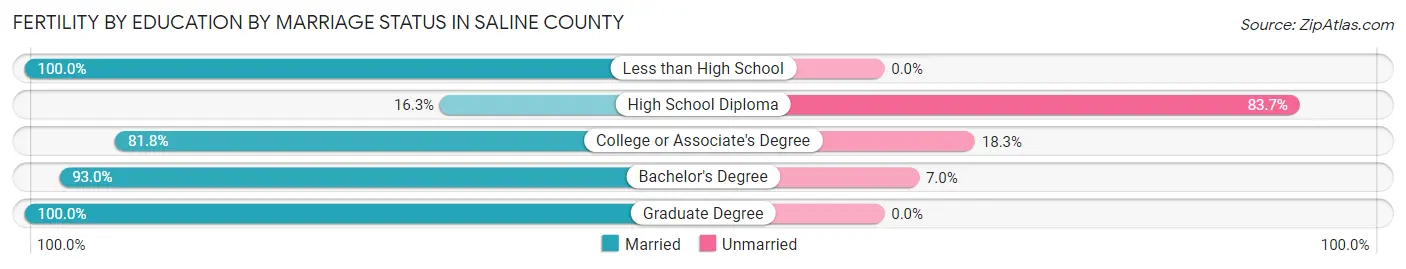
| Educational Attainment | Married | Unmarried |
| Less than High School | 6 (100.0%) | 0 (0.0%) |
| High School Diploma | 15 (16.3%) | 77 (83.7%) |
| College or Associate's Degree | 112 (81.8%) | 25 (18.2%) |
| Bachelor's Degree | 40 (93.0%) | 3 (7.0%) |
| Graduate Degree | 6 (100.0%) | 0 (0.0%) |
| Total | 179 (63.0%) | 105 (37.0%) |
Employment Characteristics in Saline County
Employment by Class of Employer in Saline County
Among the 9,695 employed individuals in Saline County, private company employees (5,782 | 59.6%), local government employees (1,068 | 11.0%), and not-for-profit organizations (854 | 8.8%) make up the most common classes of employment.
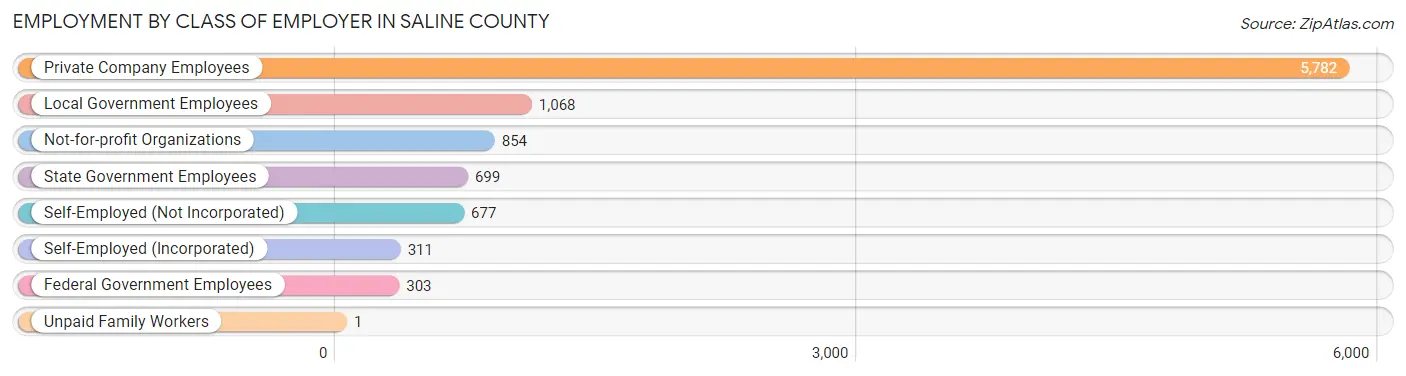
| Employer Class | # Employees | % Employees |
| Private Company Employees | 5,782 | 59.6% |
| Self-Employed (Incorporated) | 311 | 3.2% |
| Self-Employed (Not Incorporated) | 677 | 7.0% |
| Not-for-profit Organizations | 854 | 8.8% |
| Local Government Employees | 1,068 | 11.0% |
| State Government Employees | 699 | 7.2% |
| Federal Government Employees | 303 | 3.1% |
| Unpaid Family Workers | 1 | 0.0% |
| Total | 9,695 | 100.0% |
Employment Status by Age in Saline County
According to the labor force statistics for Saline County, out of the total population over 16 years of age (19,332), 55.9% or 10,807 individuals are in the labor force, with 5.9% or 638 of them unemployed. The age group with the highest labor force participation rate is 30 to 34 years, with 88.4% or 1,281 individuals in the labor force. Within the labor force, the 16 to 19 years age range has the highest percentage of unemployed individuals, with 19.0% or 99 of them being unemployed.
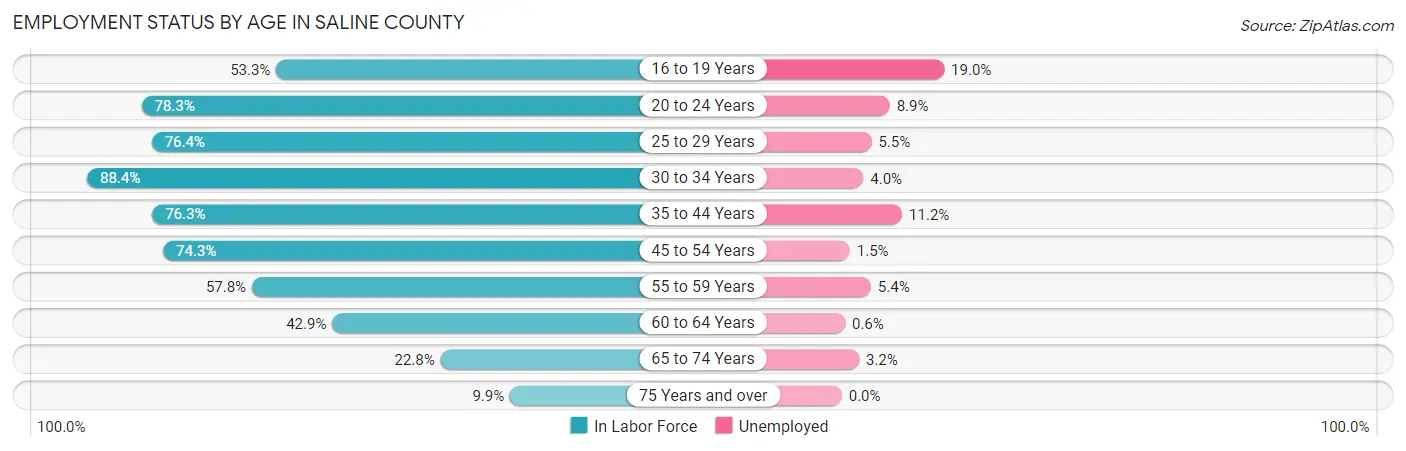
| Age Bracket | In Labor Force | Unemployed |
| 16 to 19 Years | 521 (53.3%) | 99 (19.0%) |
| 20 to 24 Years | 889 (78.3%) | 79 (8.9%) |
| 25 to 29 Years | 1,141 (76.4%) | 63 (5.5%) |
| 30 to 34 Years | 1,281 (88.4%) | 51 (4.0%) |
| 35 to 44 Years | 2,094 (76.3%) | 235 (11.2%) |
| 45 to 54 Years | 2,196 (74.3%) | 33 (1.5%) |
| 55 to 59 Years | 1,002 (57.8%) | 54 (5.4%) |
| 60 to 64 Years | 844 (42.9%) | 5 (0.6%) |
| 65 to 74 Years | 628 (22.8%) | 20 (3.2%) |
| 75 Years and over | 210 (9.9%) | 0 (0.0%) |
| Total | 10,807 (55.9%) | 638 (5.9%) |
Employment Status by Educational Attainment in Saline County
According to labor force statistics for Saline County, 69.3% of individuals (8,554) out of the total population between 25 and 64 years of age (12,344) are in the labor force, with 5.1% or 436 of them being unemployed. The group with the highest labor force participation rate are those with the educational attainment of bachelor's degree or higher, with 86.2% or 2,217 individuals in the labor force. Within the labor force, individuals with less than high school education have the highest percentage of unemployment, with 13.9% or 88 of them being unemployed.
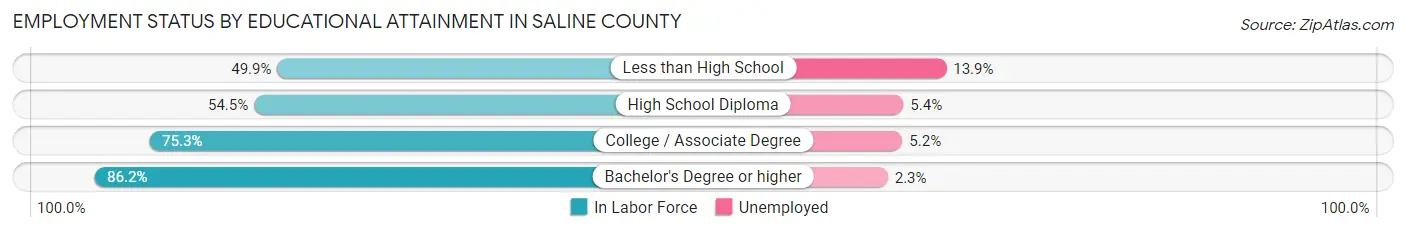
| Educational Attainment | In Labor Force | Unemployed |
| Less than High School | 634 (49.9%) | 177 (13.9%) |
| High School Diploma | 1,828 (54.5%) | 181 (5.4%) |
| College / Associate Degree | 3,876 (75.3%) | 268 (5.2%) |
| Bachelor's Degree or higher | 2,217 (86.2%) | 59 (2.3%) |
| Total | 8,554 (69.3%) | 630 (5.1%) |
Employment Occupations by Sex in Saline County
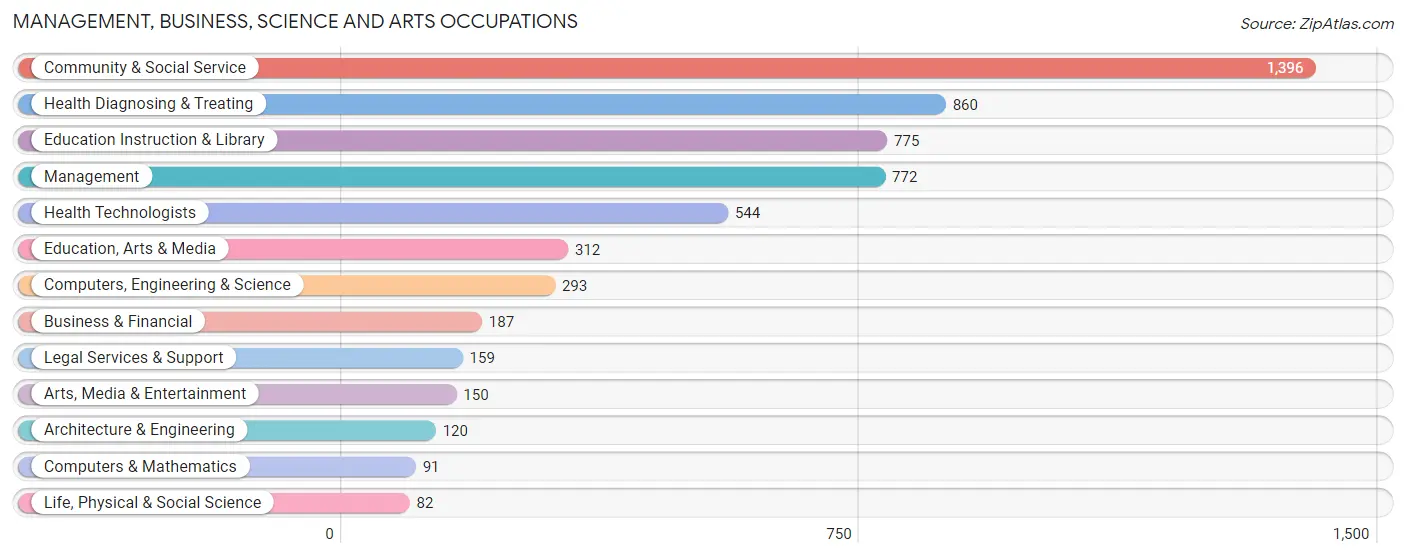
Management, Business, Science and Arts Occupations
The most common Management, Business, Science and Arts occupations in Saline County are Community & Social Service (1,396 | 13.7%), Health Diagnosing & Treating (860 | 8.5%), Education Instruction & Library (775 | 7.6%), Management (772 | 7.6%), and Health Technologists (544 | 5.3%).
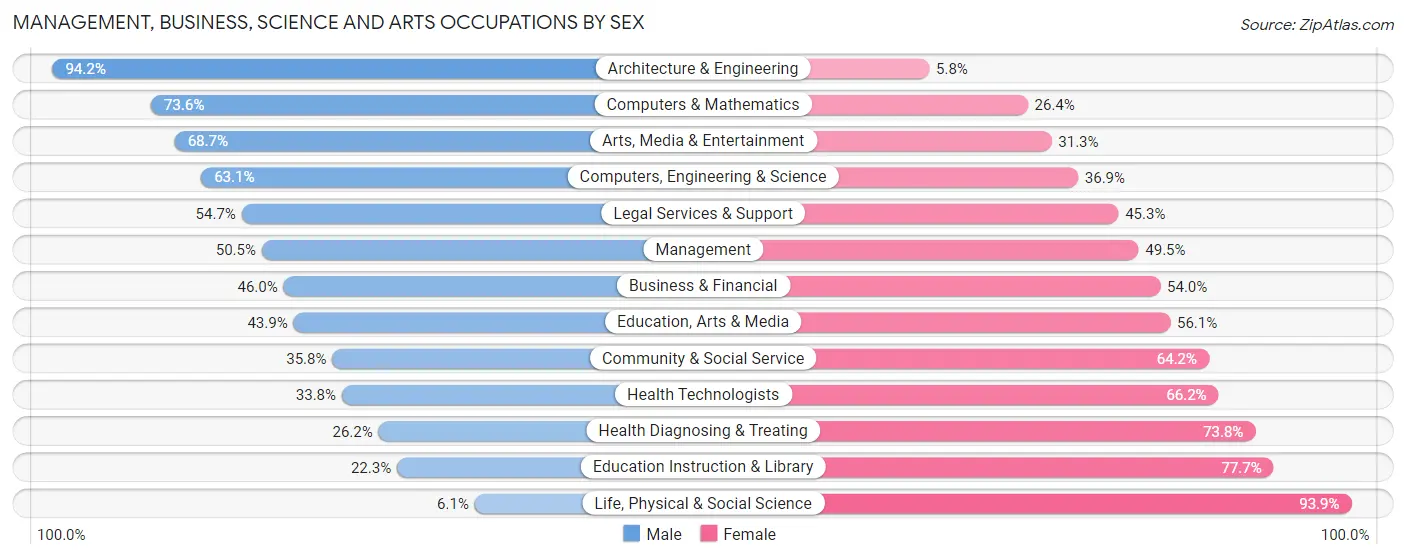
Management, Business, Science and Arts Occupations by Sex
Within the Management, Business, Science and Arts occupations in Saline County, the most male-oriented occupations are Architecture & Engineering (94.2%), Computers & Mathematics (73.6%), and Arts, Media & Entertainment (68.7%), while the most female-oriented occupations are Life, Physical & Social Science (93.9%), Education Instruction & Library (77.7%), and Health Diagnosing & Treating (73.8%).
| Occupation | Male | Female |
| Management | 390 (50.5%) | 382 (49.5%) |
| Business & Financial | 86 (46.0%) | 101 (54.0%) |
| Computers, Engineering & Science | 185 (63.1%) | 108 (36.9%) |
| Computers & Mathematics | 67 (73.6%) | 24 (26.4%) |
| Architecture & Engineering | 113 (94.2%) | 7 (5.8%) |
| Life, Physical & Social Science | 5 (6.1%) | 77 (93.9%) |
| Community & Social Service | 500 (35.8%) | 896 (64.2%) |
| Education, Arts & Media | 137 (43.9%) | 175 (56.1%) |
| Legal Services & Support | 87 (54.7%) | 72 (45.3%) |
| Education Instruction & Library | 173 (22.3%) | 602 (77.7%) |
| Arts, Media & Entertainment | 103 (68.7%) | 47 (31.3%) |
| Health Diagnosing & Treating | 225 (26.2%) | 635 (73.8%) |
| Health Technologists | 184 (33.8%) | 360 (66.2%) |
| Total (Category) | 1,386 (39.5%) | 2,122 (60.5%) |
| Total (Overall) | 5,214 (51.3%) | 4,953 (48.7%) |
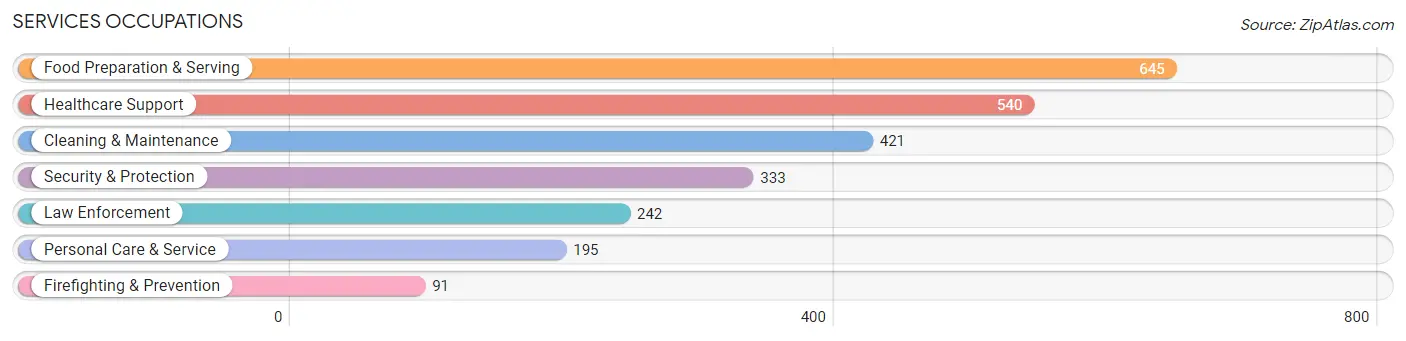
Services Occupations
The most common Services occupations in Saline County are Food Preparation & Serving (645 | 6.3%), Healthcare Support (540 | 5.3%), Cleaning & Maintenance (421 | 4.1%), Security & Protection (333 | 3.3%), and Law Enforcement (242 | 2.4%).
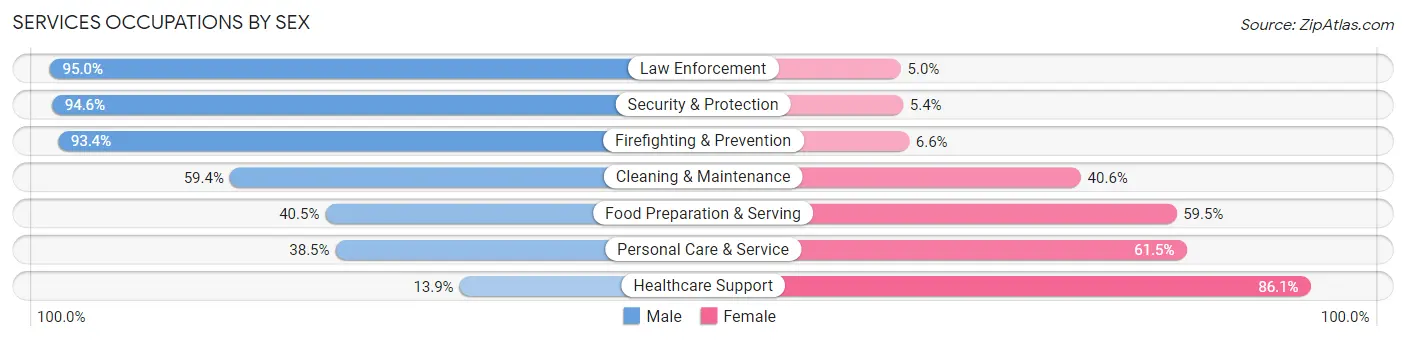
Services Occupations by Sex
Within the Services occupations in Saline County, the most male-oriented occupations are Law Enforcement (95.0%), Security & Protection (94.6%), and Firefighting & Prevention (93.4%), while the most female-oriented occupations are Healthcare Support (86.1%), Personal Care & Service (61.5%), and Food Preparation & Serving (59.5%).
| Occupation | Male | Female |
| Healthcare Support | 75 (13.9%) | 465 (86.1%) |
| Security & Protection | 315 (94.6%) | 18 (5.4%) |
| Firefighting & Prevention | 85 (93.4%) | 6 (6.6%) |
| Law Enforcement | 230 (95.0%) | 12 (5.0%) |
| Food Preparation & Serving | 261 (40.5%) | 384 (59.5%) |
| Cleaning & Maintenance | 250 (59.4%) | 171 (40.6%) |
| Personal Care & Service | 75 (38.5%) | 120 (61.5%) |
| Total (Category) | 976 (45.7%) | 1,158 (54.3%) |
| Total (Overall) | 5,214 (51.3%) | 4,953 (48.7%) |
Sales and Office Occupations
The most common Sales and Office occupations in Saline County are Office & Administration (1,198 | 11.8%), and Sales & Related (729 | 7.2%).
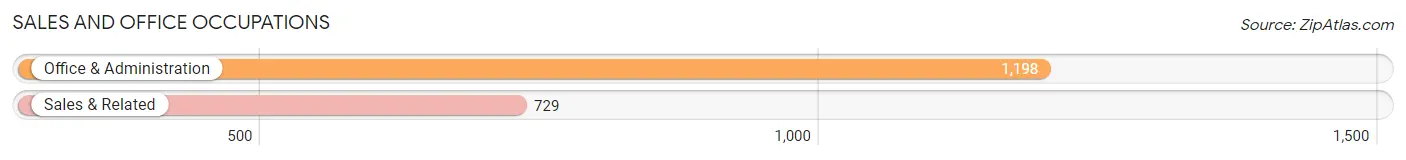
Sales and Office Occupations by Sex
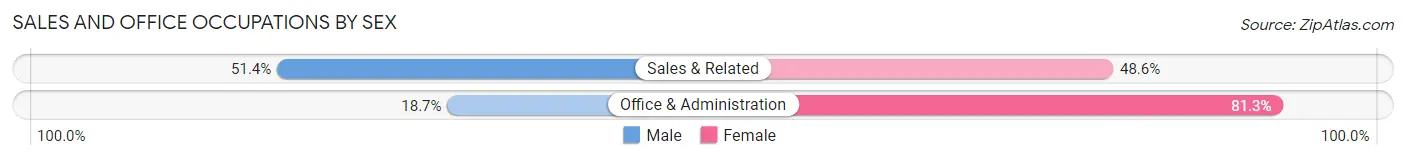
| Occupation | Male | Female |
| Sales & Related | 375 (51.4%) | 354 (48.6%) |
| Office & Administration | 224 (18.7%) | 974 (81.3%) |
| Total (Category) | 599 (31.1%) | 1,328 (68.9%) |
| Total (Overall) | 5,214 (51.3%) | 4,953 (48.7%) |
Natural Resources, Construction and Maintenance Occupations
The most common Natural Resources, Construction and Maintenance occupations in Saline County are Construction & Extraction (886 | 8.7%), Installation, Maintenance & Repair (312 | 3.1%), and Farming, Fishing & Forestry (87 | 0.9%).
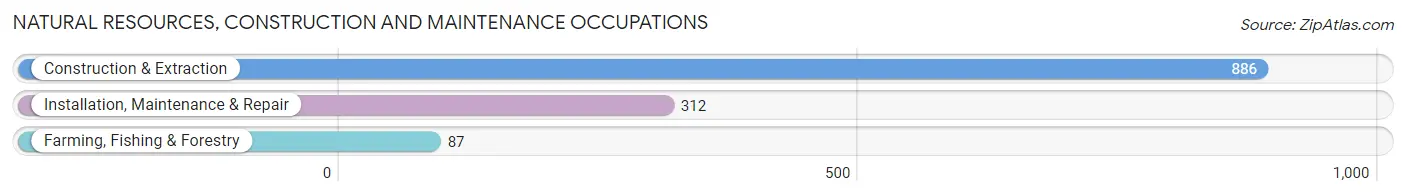
Natural Resources, Construction and Maintenance Occupations by Sex
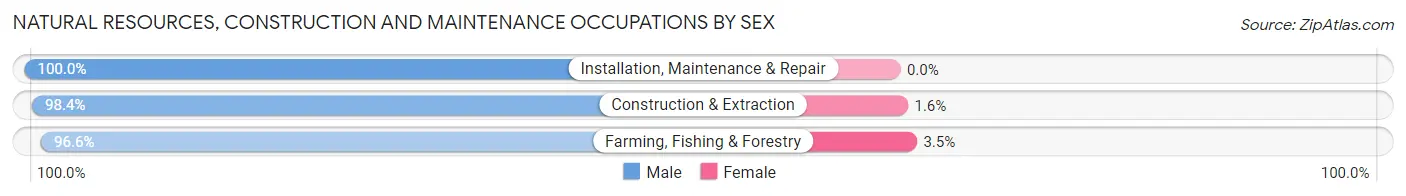
| Occupation | Male | Female |
| Farming, Fishing & Forestry | 84 (96.6%) | 3 (3.5%) |
| Construction & Extraction | 872 (98.4%) | 14 (1.6%) |
| Installation, Maintenance & Repair | 312 (100.0%) | 0 (0.0%) |
| Total (Category) | 1,268 (98.7%) | 17 (1.3%) |
| Total (Overall) | 5,214 (51.3%) | 4,953 (48.7%) |
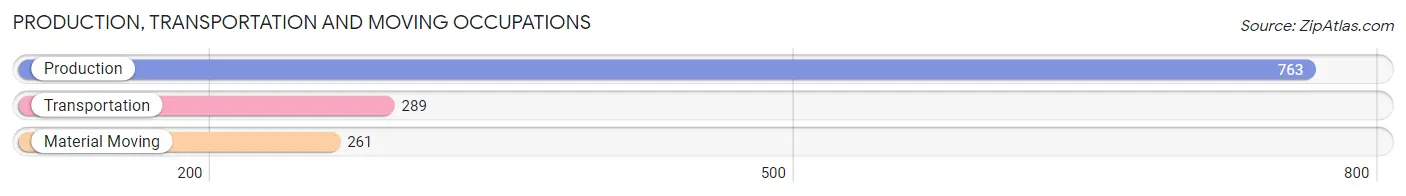
Production, Transportation and Moving Occupations
The most common Production, Transportation and Moving occupations in Saline County are Production (763 | 7.5%), Transportation (289 | 2.8%), and Material Moving (261 | 2.6%).
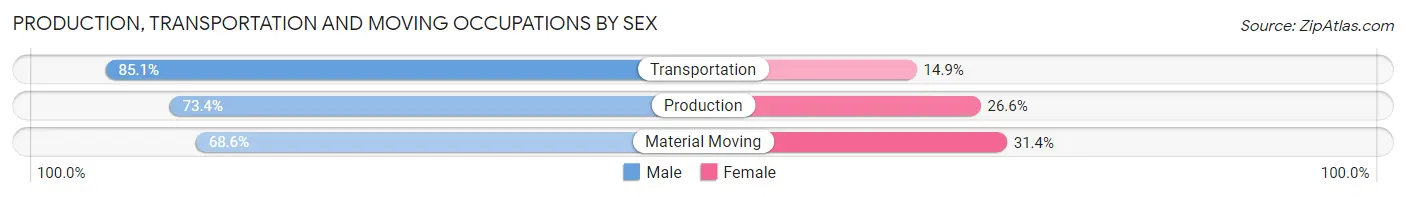
Production, Transportation and Moving Occupations by Sex
| Occupation | Male | Female |
| Production | 560 (73.4%) | 203 (26.6%) |
| Transportation | 246 (85.1%) | 43 (14.9%) |
| Material Moving | 179 (68.6%) | 82 (31.4%) |
| Total (Category) | 985 (75.0%) | 328 (25.0%) |
| Total (Overall) | 5,214 (51.3%) | 4,953 (48.7%) |
Employment Industries by Sex in Saline County
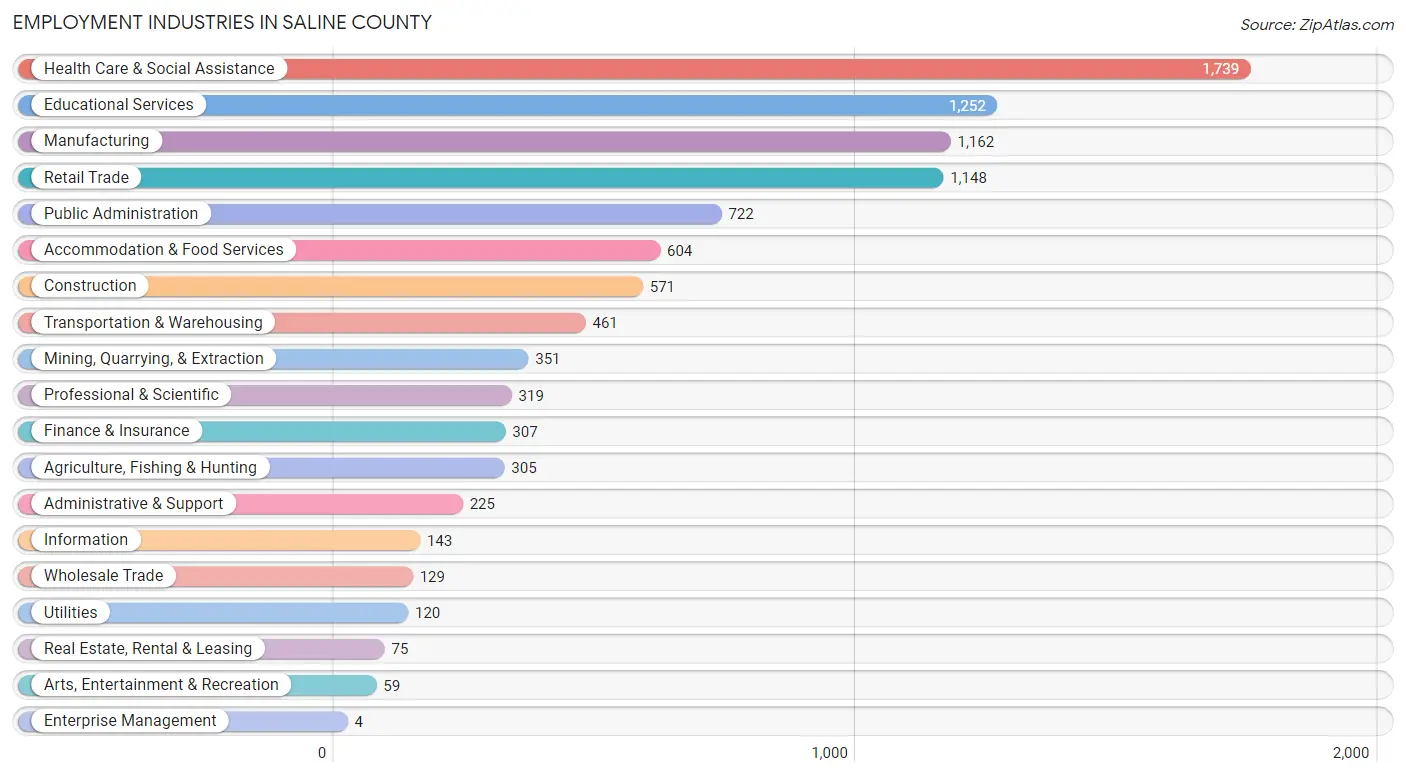
Employment Industries in Saline County
The major employment industries in Saline County include Health Care & Social Assistance (1,739 | 17.1%), Educational Services (1,252 | 12.3%), Manufacturing (1,162 | 11.4%), Retail Trade (1,148 | 11.3%), and Public Administration (722 | 7.1%).
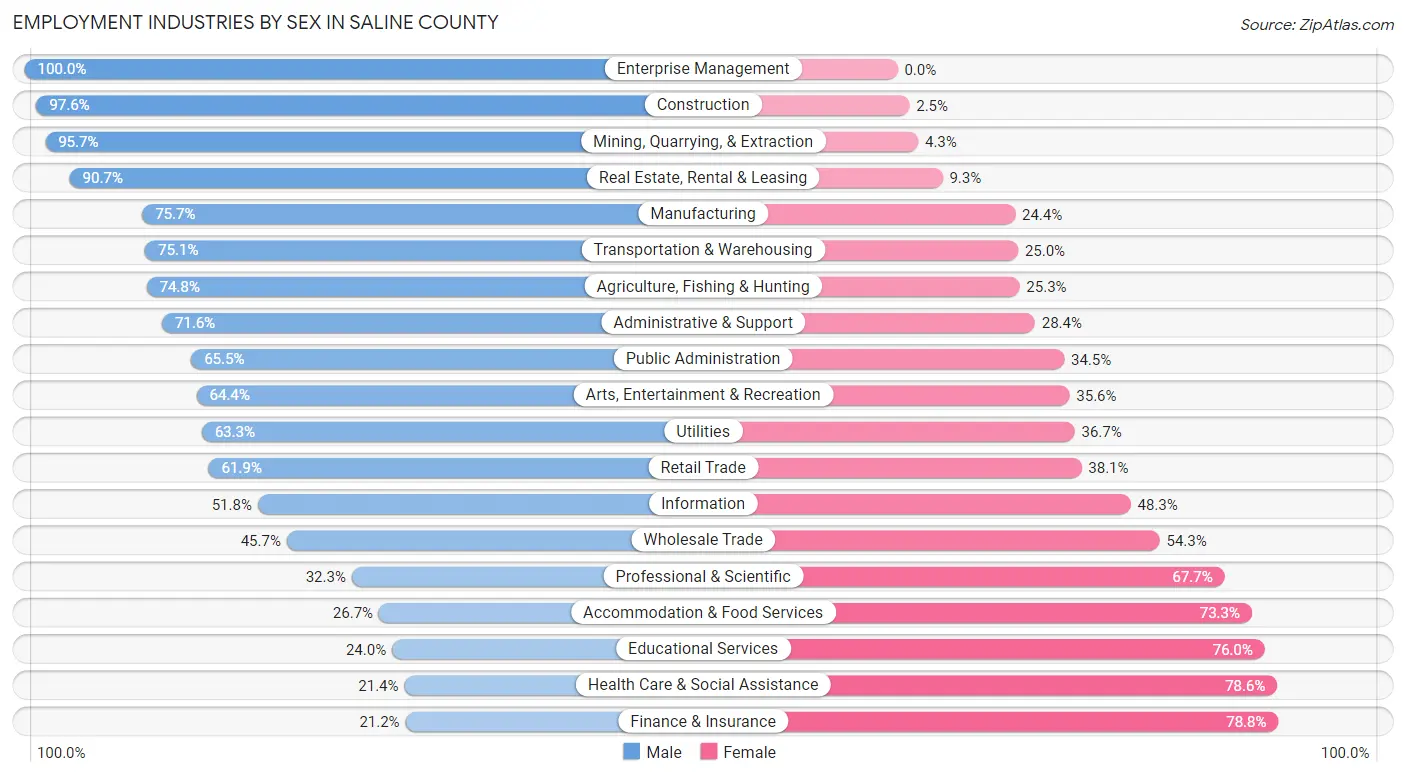
Employment Industries by Sex in Saline County
The Saline County industries that see more men than women are Enterprise Management (100.0%), Construction (97.6%), and Mining, Quarrying, & Extraction (95.7%), whereas the industries that tend to have a higher number of women are Finance & Insurance (78.8%), Health Care & Social Assistance (78.6%), and Educational Services (76.0%).
| Industry | Male | Female |
| Agriculture, Fishing & Hunting | 228 (74.8%) | 77 (25.3%) |
| Mining, Quarrying, & Extraction | 336 (95.7%) | 15 (4.3%) |
| Construction | 557 (97.6%) | 14 (2.5%) |
| Manufacturing | 879 (75.6%) | 283 (24.3%) |
| Wholesale Trade | 59 (45.7%) | 70 (54.3%) |
| Retail Trade | 711 (61.9%) | 437 (38.1%) |
| Transportation & Warehousing | 346 (75.0%) | 115 (24.9%) |
| Utilities | 76 (63.3%) | 44 (36.7%) |
| Information | 74 (51.7%) | 69 (48.2%) |
| Finance & Insurance | 65 (21.2%) | 242 (78.8%) |
| Real Estate, Rental & Leasing | 68 (90.7%) | 7 (9.3%) |
| Professional & Scientific | 103 (32.3%) | 216 (67.7%) |
| Enterprise Management | 4 (100.0%) | 0 (0.0%) |
| Administrative & Support | 161 (71.6%) | 64 (28.4%) |
| Educational Services | 300 (24.0%) | 952 (76.0%) |
| Health Care & Social Assistance | 372 (21.4%) | 1,367 (78.6%) |
| Arts, Entertainment & Recreation | 38 (64.4%) | 21 (35.6%) |
| Accommodation & Food Services | 161 (26.7%) | 443 (73.3%) |
| Public Administration | 473 (65.5%) | 249 (34.5%) |
| Total | 5,214 (51.3%) | 4,953 (48.7%) |
Education in Saline County
School Enrollment in Saline County
The most common levels of schooling among the 4,454 students in Saline County are middle school (1,103 | 24.8%), elementary school (976 | 21.9%), and high school (934 | 21.0%).
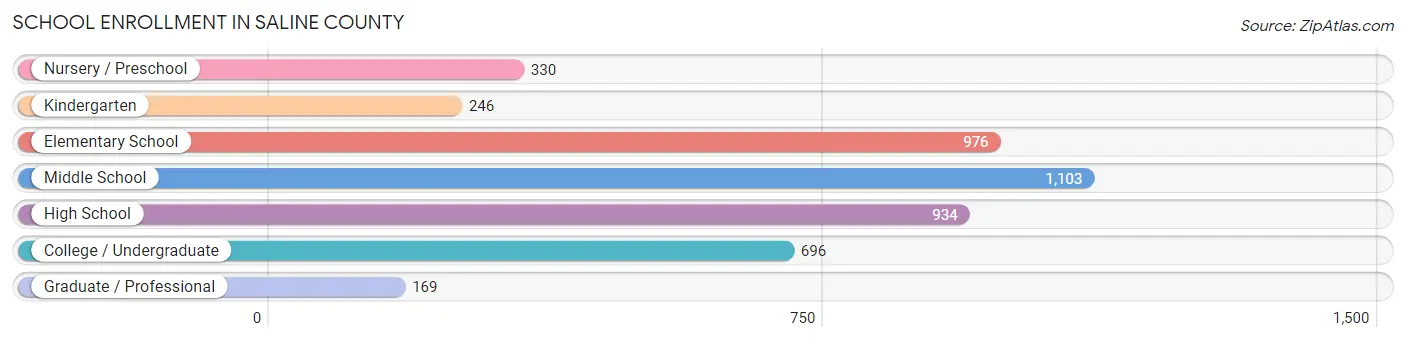
| School Level | # Students | % Students |
| Nursery / Preschool | 330 | 7.4% |
| Kindergarten | 246 | 5.5% |
| Elementary School | 976 | 21.9% |
| Middle School | 1,103 | 24.8% |
| High School | 934 | 21.0% |
| College / Undergraduate | 696 | 15.6% |
| Graduate / Professional | 169 | 3.8% |
| Total | 4,454 | 100.0% |
School Enrollment by Age by Funding Source in Saline County
Out of a total of 4,454 students who are enrolled in schools in Saline County, 387 (8.7%) attend a private institution, while the remaining 4,067 (91.3%) are enrolled in public schools. The age group of 3 to 4 year olds has the highest likelihood of being enrolled in private schools, with 81 (32.3% in the age bracket) enrolled. Conversely, the age group of 10 to 14 year olds has the lowest likelihood of being enrolled in a private school, with 1,272 (97.7% in the age bracket) attending a public institution.
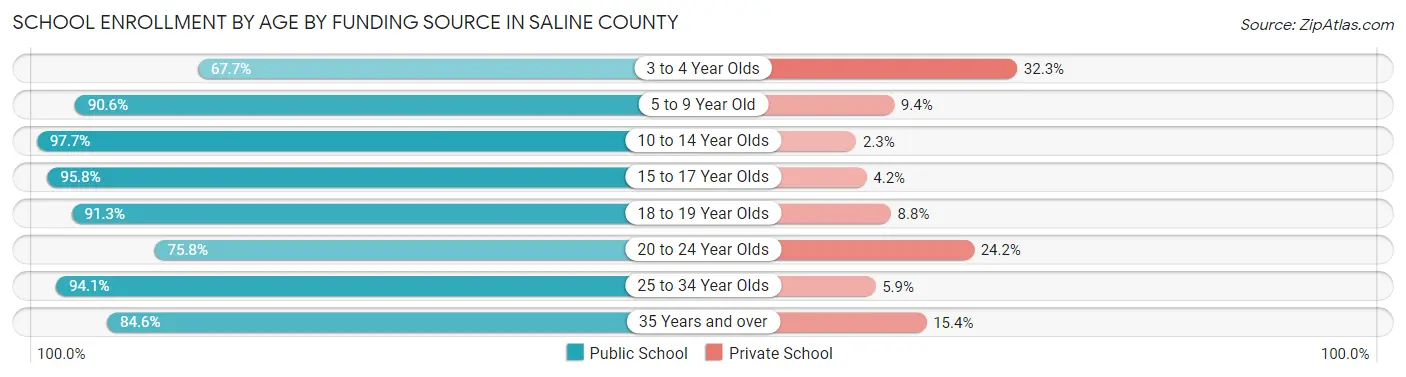
| Age Bracket | Public School | Private School |
| 3 to 4 Year Olds | 170 (67.7%) | 81 (32.3%) |
| 5 to 9 Year Old | 1,123 (90.6%) | 116 (9.4%) |
| 10 to 14 Year Olds | 1,272 (97.7%) | 30 (2.3%) |
| 15 to 17 Year Olds | 702 (95.8%) | 31 (4.2%) |
| 18 to 19 Year Olds | 240 (91.2%) | 23 (8.7%) |
| 20 to 24 Year Olds | 169 (75.8%) | 54 (24.2%) |
| 25 to 34 Year Olds | 160 (94.1%) | 10 (5.9%) |
| 35 Years and over | 231 (84.6%) | 42 (15.4%) |
| Total | 4,067 (91.3%) | 387 (8.7%) |
Educational Attainment by Field of Study in Saline County
Education (989 | 27.3%), science & technology (605 | 16.7%), business (549 | 15.1%), arts & humanities (324 | 8.9%), and bio, nature & agricultural (235 | 6.5%) are the most common fields of study among 3,628 individuals in Saline County who have obtained a bachelor's degree or higher.
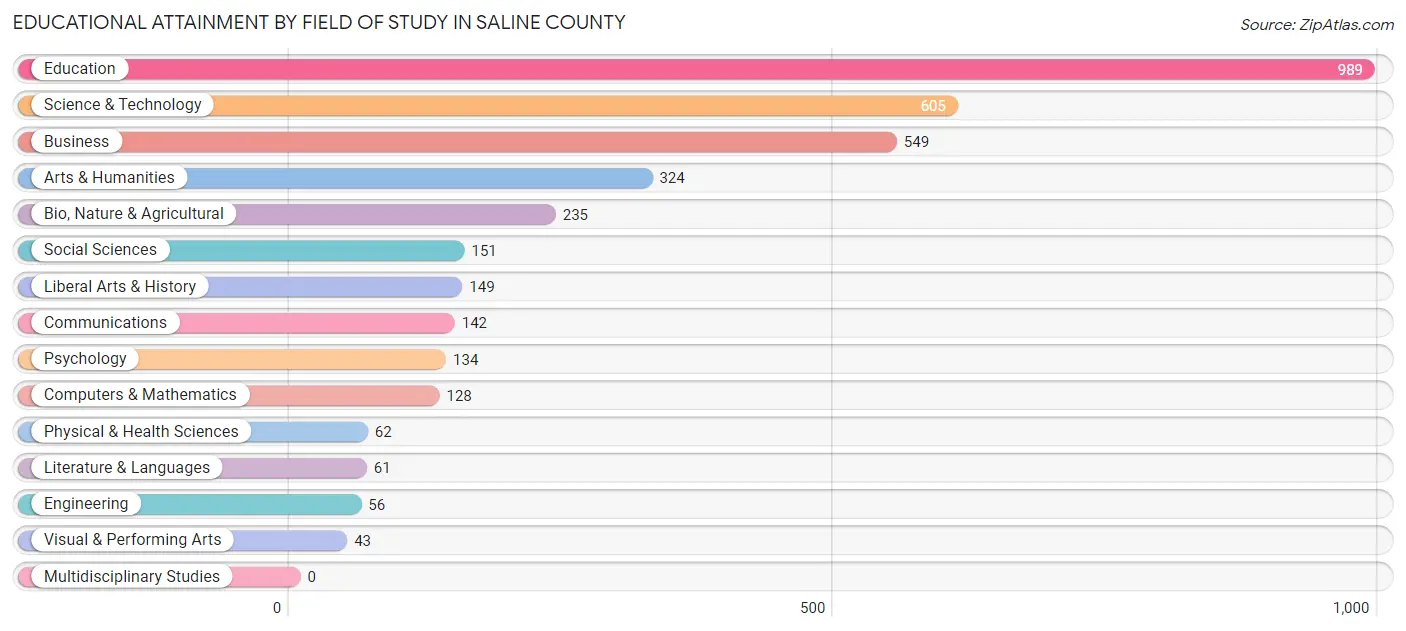
| Field of Study | # Graduates | % Graduates |
| Computers & Mathematics | 128 | 3.5% |
| Bio, Nature & Agricultural | 235 | 6.5% |
| Physical & Health Sciences | 62 | 1.7% |
| Psychology | 134 | 3.7% |
| Social Sciences | 151 | 4.2% |
| Engineering | 56 | 1.5% |
| Multidisciplinary Studies | 0 | 0.0% |
| Science & Technology | 605 | 16.7% |
| Business | 549 | 15.1% |
| Education | 989 | 27.3% |
| Literature & Languages | 61 | 1.7% |
| Liberal Arts & History | 149 | 4.1% |
| Visual & Performing Arts | 43 | 1.2% |
| Communications | 142 | 3.9% |
| Arts & Humanities | 324 | 8.9% |
| Total | 3,628 | 100.0% |
Transportation & Commute in Saline County
Vehicle Availability by Sex in Saline County
The most prevalent vehicle ownership categories in Saline County are males with 2 vehicles (2,338, accounting for 46.8%) and females with 2 vehicles (2,127, making up 49.9%).
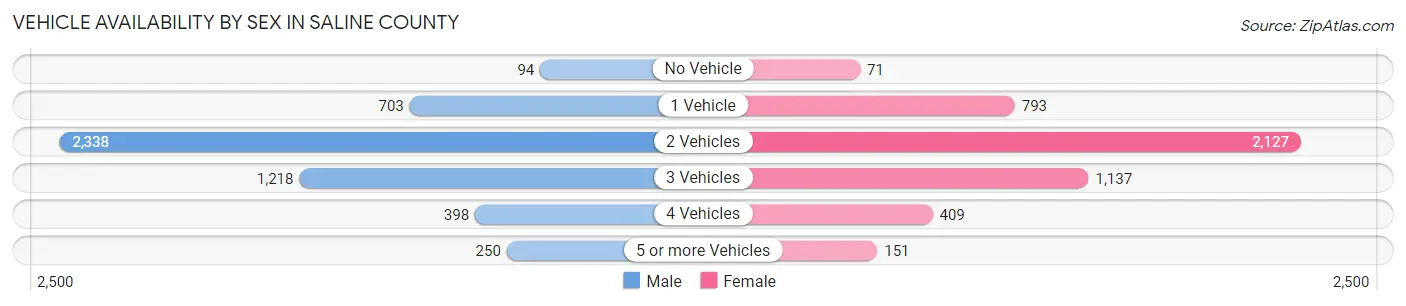
| Vehicles Available | Male | Female |
| No Vehicle | 94 (1.9%) | 71 (1.5%) |
| 1 Vehicle | 703 (14.1%) | 793 (16.9%) |
| 2 Vehicles | 2,338 (46.8%) | 2,127 (45.4%) |
| 3 Vehicles | 1,218 (24.4%) | 1,137 (24.2%) |
| 4 Vehicles | 398 (8.0%) | 409 (8.7%) |
| 5 or more Vehicles | 250 (5.0%) | 151 (3.2%) |
| Total | 5,001 (100.0%) | 4,688 (100.0%) |
Commute Time in Saline County
The most frequently occuring commute durations in Saline County are 5 to 9 minutes (1,780 commuters, 19.4%), 10 to 14 minutes (1,183 commuters, 12.9%), and 15 to 19 minutes (1,114 commuters, 12.1%).
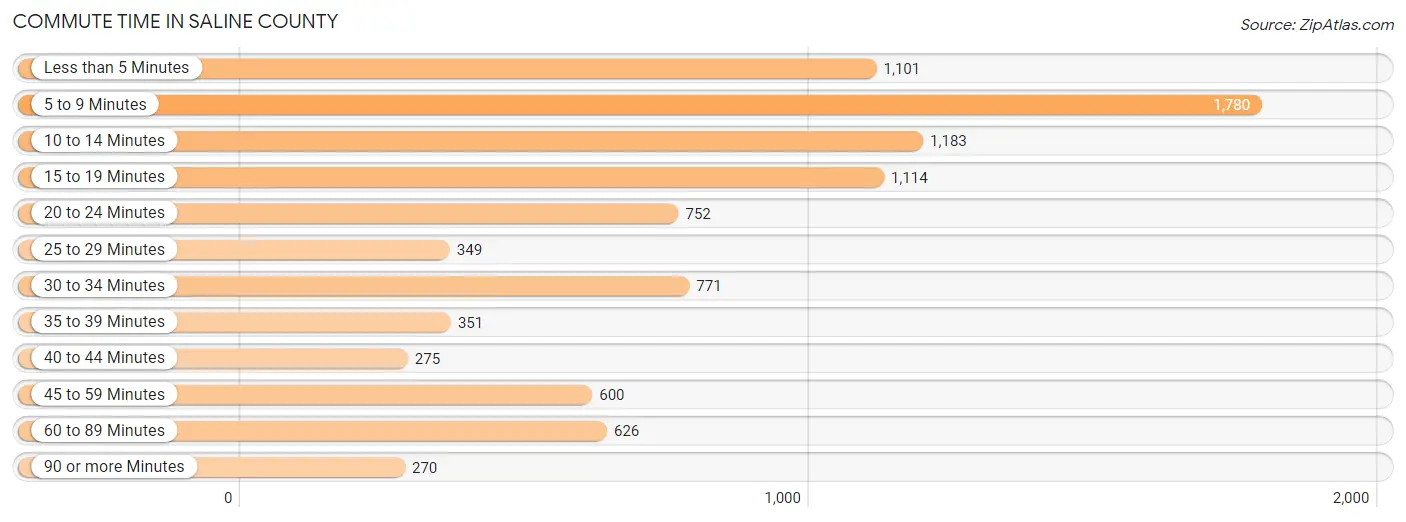
| Commute Time | # Commuters | % Commuters |
| Less than 5 Minutes | 1,101 | 12.0% |
| 5 to 9 Minutes | 1,780 | 19.4% |
| 10 to 14 Minutes | 1,183 | 12.9% |
| 15 to 19 Minutes | 1,114 | 12.1% |
| 20 to 24 Minutes | 752 | 8.2% |
| 25 to 29 Minutes | 349 | 3.8% |
| 30 to 34 Minutes | 771 | 8.4% |
| 35 to 39 Minutes | 351 | 3.8% |
| 40 to 44 Minutes | 275 | 3.0% |
| 45 to 59 Minutes | 600 | 6.5% |
| 60 to 89 Minutes | 626 | 6.8% |
| 90 or more Minutes | 270 | 2.9% |
Commute Time by Sex in Saline County
The most common commute times in Saline County are 5 to 9 minutes (763 commuters, 16.0%) for males and 5 to 9 minutes (1,017 commuters, 23.1%) for females.
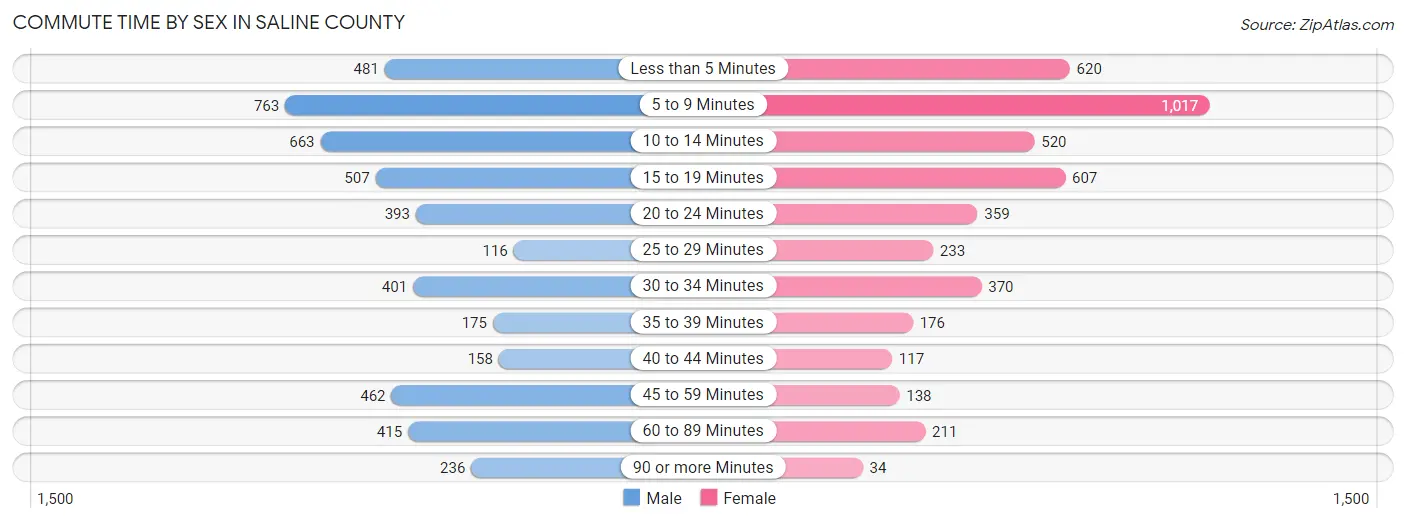
| Commute Time | Male | Female |
| Less than 5 Minutes | 481 (10.1%) | 620 (14.1%) |
| 5 to 9 Minutes | 763 (16.0%) | 1,017 (23.1%) |
| 10 to 14 Minutes | 663 (13.9%) | 520 (11.8%) |
| 15 to 19 Minutes | 507 (10.6%) | 607 (13.8%) |
| 20 to 24 Minutes | 393 (8.2%) | 359 (8.2%) |
| 25 to 29 Minutes | 116 (2.4%) | 233 (5.3%) |
| 30 to 34 Minutes | 401 (8.4%) | 370 (8.4%) |
| 35 to 39 Minutes | 175 (3.7%) | 176 (4.0%) |
| 40 to 44 Minutes | 158 (3.3%) | 117 (2.7%) |
| 45 to 59 Minutes | 462 (9.7%) | 138 (3.1%) |
| 60 to 89 Minutes | 415 (8.7%) | 211 (4.8%) |
| 90 or more Minutes | 236 (5.0%) | 34 (0.8%) |
Time of Departure to Work by Sex in Saline County
The most frequent times of departure to work in Saline County are 6:30 AM to 6:59 AM (719, 15.1%) for males and 7:30 AM to 7:59 AM (1,220, 27.7%) for females.
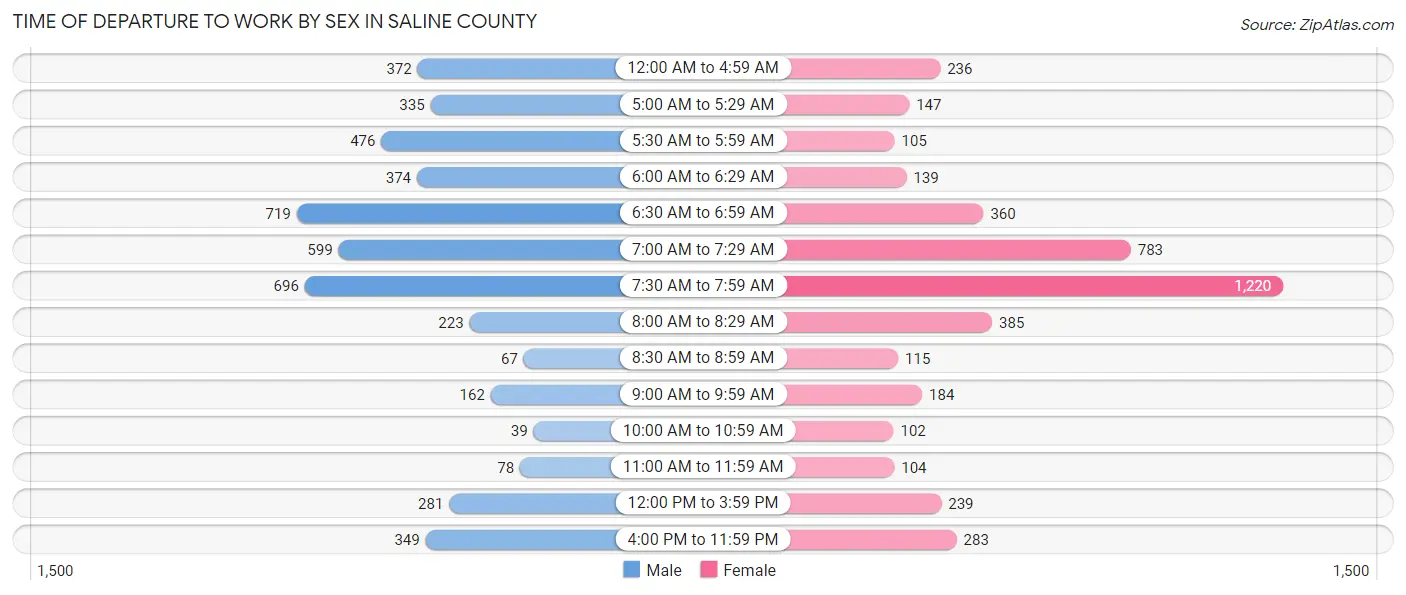
| Time of Departure | Male | Female |
| 12:00 AM to 4:59 AM | 372 (7.8%) | 236 (5.4%) |
| 5:00 AM to 5:29 AM | 335 (7.0%) | 147 (3.3%) |
| 5:30 AM to 5:59 AM | 476 (10.0%) | 105 (2.4%) |
| 6:00 AM to 6:29 AM | 374 (7.8%) | 139 (3.2%) |
| 6:30 AM to 6:59 AM | 719 (15.1%) | 360 (8.2%) |
| 7:00 AM to 7:29 AM | 599 (12.6%) | 783 (17.8%) |
| 7:30 AM to 7:59 AM | 696 (14.6%) | 1,220 (27.7%) |
| 8:00 AM to 8:29 AM | 223 (4.7%) | 385 (8.7%) |
| 8:30 AM to 8:59 AM | 67 (1.4%) | 115 (2.6%) |
| 9:00 AM to 9:59 AM | 162 (3.4%) | 184 (4.2%) |
| 10:00 AM to 10:59 AM | 39 (0.8%) | 102 (2.3%) |
| 11:00 AM to 11:59 AM | 78 (1.6%) | 104 (2.4%) |
| 12:00 PM to 3:59 PM | 281 (5.9%) | 239 (5.4%) |
| 4:00 PM to 11:59 PM | 349 (7.3%) | 283 (6.4%) |
| Total | 4,770 (100.0%) | 4,402 (100.0%) |
Housing Occupancy in Saline County
Occupancy by Ownership in Saline County
Of the total 10,165 dwellings in Saline County, owner-occupied units account for 7,542 (74.2%), while renter-occupied units make up 2,623 (25.8%).
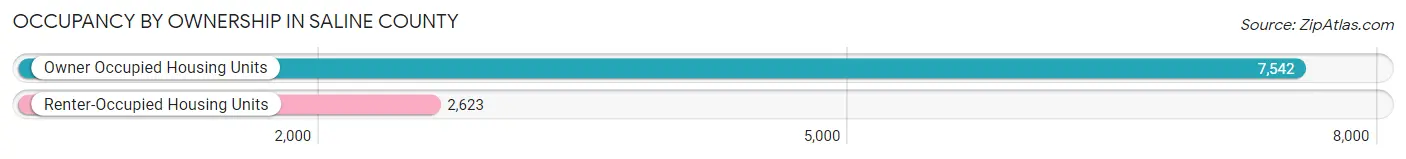
| Occupancy | # Housing Units | % Housing Units |
| Owner Occupied Housing Units | 7,542 | 74.2% |
| Renter-Occupied Housing Units | 2,623 | 25.8% |
| Total Occupied Housing Units | 10,165 | 100.0% |
Occupancy by Household Size in Saline County
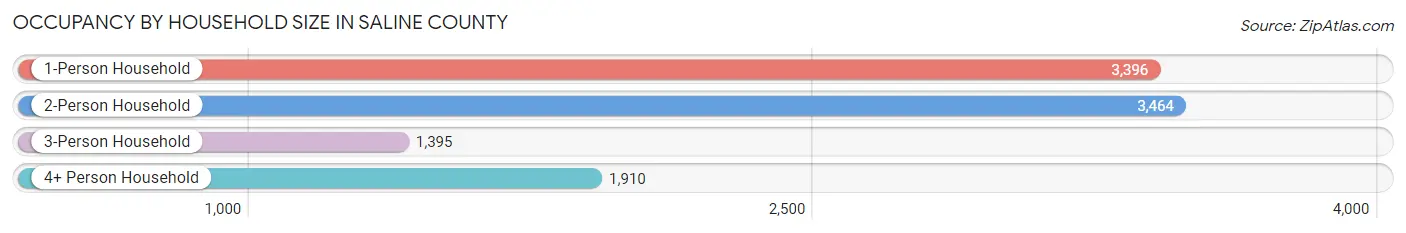
| Household Size | # Housing Units | % Housing Units |
| 1-Person Household | 3,396 | 33.4% |
| 2-Person Household | 3,464 | 34.1% |
| 3-Person Household | 1,395 | 13.7% |
| 4+ Person Household | 1,910 | 18.8% |
| Total Housing Units | 10,165 | 100.0% |
Occupancy by Ownership by Household Size in Saline County
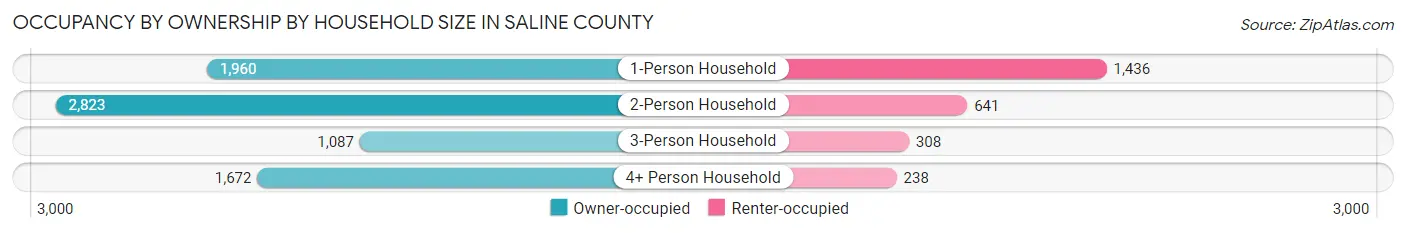
| Household Size | Owner-occupied | Renter-occupied |
| 1-Person Household | 1,960 (57.7%) | 1,436 (42.3%) |
| 2-Person Household | 2,823 (81.5%) | 641 (18.5%) |
| 3-Person Household | 1,087 (77.9%) | 308 (22.1%) |
| 4+ Person Household | 1,672 (87.5%) | 238 (12.5%) |
| Total Housing Units | 7,542 (74.2%) | 2,623 (25.8%) |
Occupancy by Educational Attainment in Saline County
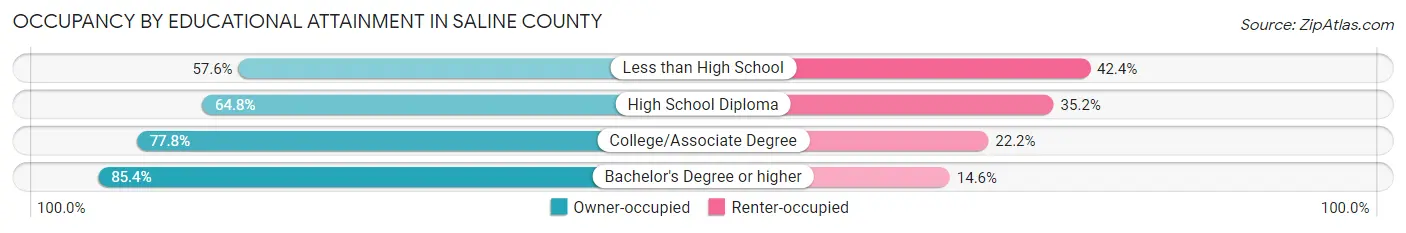
| Household Size | Owner-occupied | Renter-occupied |
| Less than High School | 519 (57.6%) | 382 (42.4%) |
| High School Diploma | 1,772 (64.8%) | 962 (35.2%) |
| College/Associate Degree | 3,311 (77.8%) | 947 (22.2%) |
| Bachelor's Degree or higher | 1,940 (85.4%) | 332 (14.6%) |
Occupancy by Age of Householder in Saline County
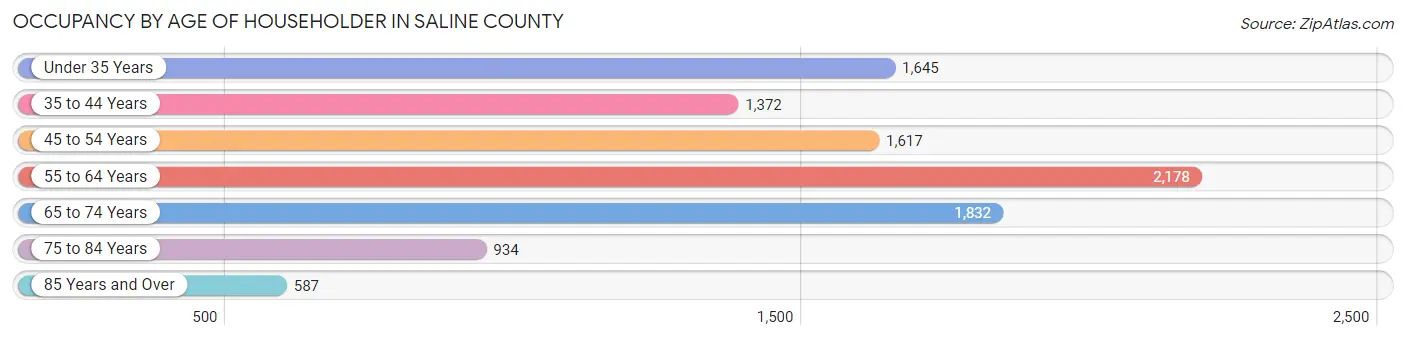
| Age Bracket | # Households | % Households |
| Under 35 Years | 1,645 | 16.2% |
| 35 to 44 Years | 1,372 | 13.5% |
| 45 to 54 Years | 1,617 | 15.9% |
| 55 to 64 Years | 2,178 | 21.4% |
| 65 to 74 Years | 1,832 | 18.0% |
| 75 to 84 Years | 934 | 9.2% |
| 85 Years and Over | 587 | 5.8% |
| Total | 10,165 | 100.0% |
Housing Finances in Saline County
Median Income by Occupancy in Saline County
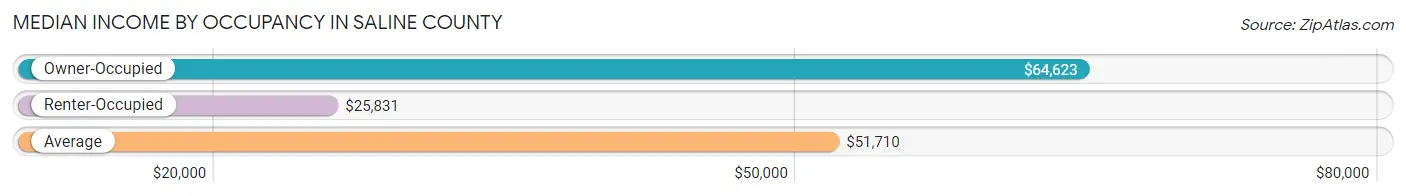
| Occupancy Type | # Households | Median Income |
| Owner-Occupied | 7,542 (74.2%) | $64,623 |
| Renter-Occupied | 2,623 (25.8%) | $25,831 |
| Average | 10,165 (100.0%) | $51,710 |
Occupancy by Householder Income Bracket in Saline County
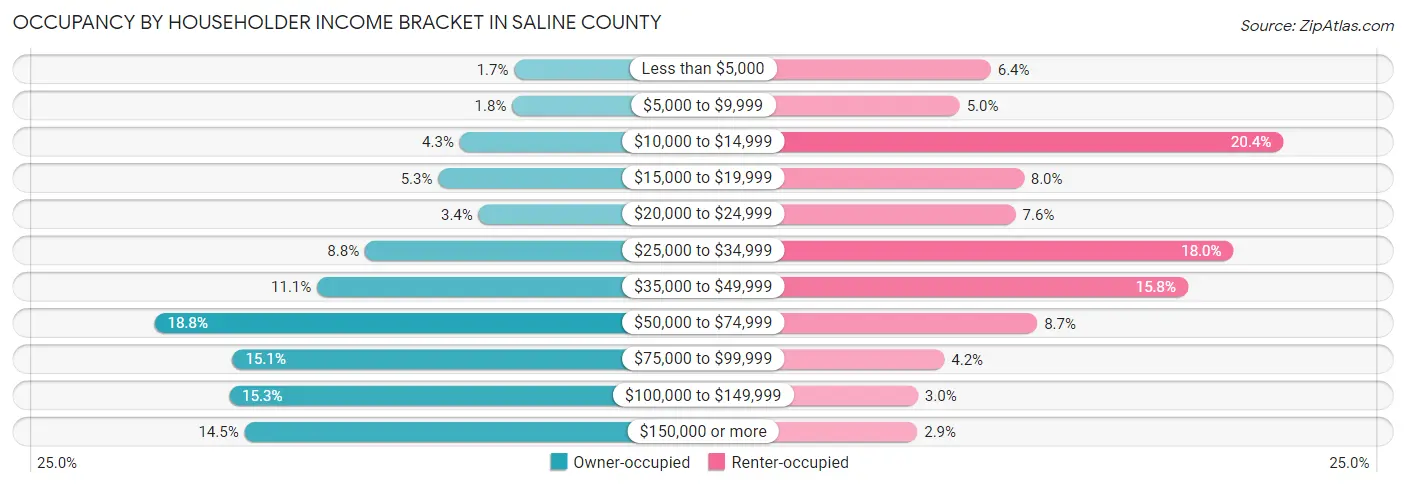
| Income Bracket | Owner-occupied | Renter-occupied |
| Less than $5,000 | 127 (1.7%) | 169 (6.4%) |
| $5,000 to $9,999 | 134 (1.8%) | 130 (5.0%) |
| $10,000 to $14,999 | 323 (4.3%) | 534 (20.4%) |
| $15,000 to $19,999 | 400 (5.3%) | 210 (8.0%) |
| $20,000 to $24,999 | 255 (3.4%) | 200 (7.6%) |
| $25,000 to $34,999 | 663 (8.8%) | 472 (18.0%) |
| $35,000 to $49,999 | 835 (11.1%) | 415 (15.8%) |
| $50,000 to $74,999 | 1,419 (18.8%) | 227 (8.6%) |
| $75,000 to $99,999 | 1,139 (15.1%) | 111 (4.2%) |
| $100,000 to $149,999 | 1,151 (15.3%) | 78 (3.0%) |
| $150,000 or more | 1,096 (14.5%) | 77 (2.9%) |
| Total | 7,542 (100.0%) | 2,623 (100.0%) |
Monthly Housing Cost Tiers in Saline County
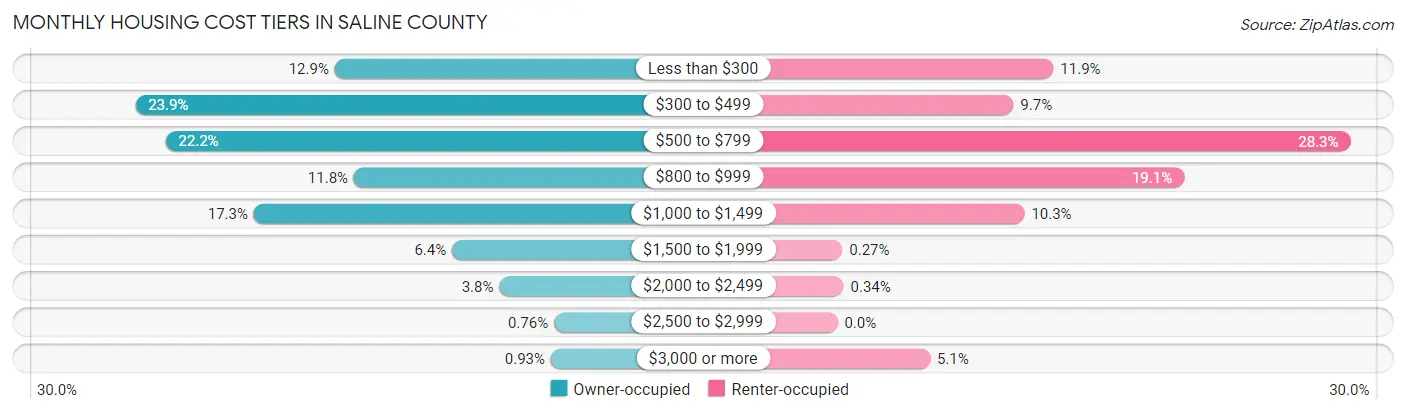
| Monthly Cost | Owner-occupied | Renter-occupied |
| Less than $300 | 971 (12.9%) | 313 (11.9%) |
| $300 to $499 | 1,802 (23.9%) | 255 (9.7%) |
| $500 to $799 | 1,676 (22.2%) | 743 (28.3%) |
| $800 to $999 | 891 (11.8%) | 502 (19.1%) |
| $1,000 to $1,499 | 1,308 (17.3%) | 271 (10.3%) |
| $1,500 to $1,999 | 482 (6.4%) | 7 (0.3%) |
| $2,000 to $2,499 | 285 (3.8%) | 9 (0.3%) |
| $2,500 to $2,999 | 57 (0.8%) | 0 (0.0%) |
| $3,000 or more | 70 (0.9%) | 134 (5.1%) |
| Total | 7,542 (100.0%) | 2,623 (100.0%) |
Physical Housing Characteristics in Saline County
Housing Structures in Saline County
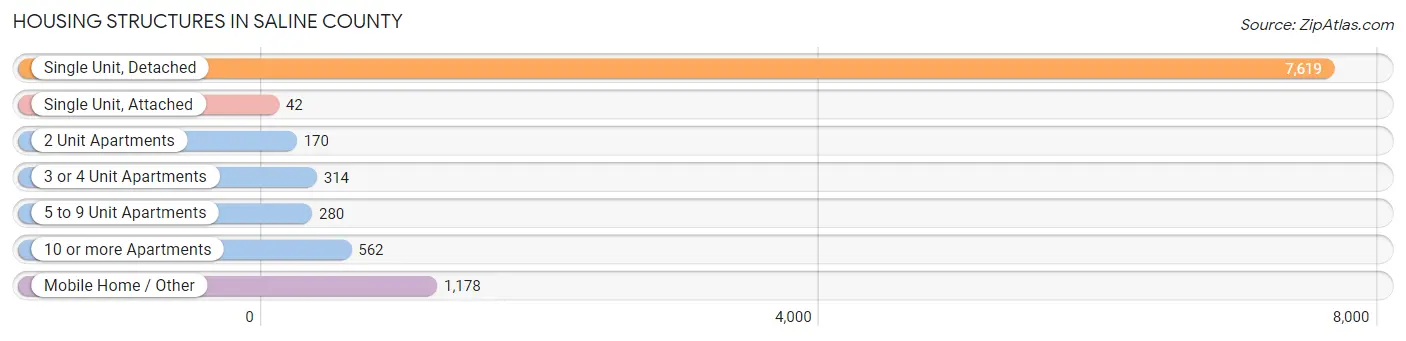
| Structure Type | # Housing Units | % Housing Units |
| Single Unit, Detached | 7,619 | 75.0% |
| Single Unit, Attached | 42 | 0.4% |
| 2 Unit Apartments | 170 | 1.7% |
| 3 or 4 Unit Apartments | 314 | 3.1% |
| 5 to 9 Unit Apartments | 280 | 2.8% |
| 10 or more Apartments | 562 | 5.5% |
| Mobile Home / Other | 1,178 | 11.6% |
| Total | 10,165 | 100.0% |
Housing Structures by Occupancy in Saline County
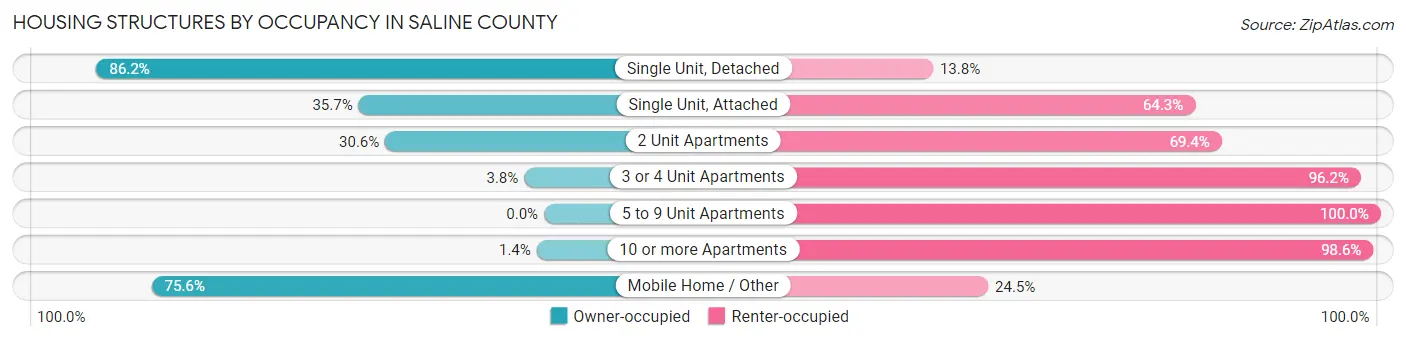
| Structure Type | Owner-occupied | Renter-occupied |
| Single Unit, Detached | 6,565 (86.2%) | 1,054 (13.8%) |
| Single Unit, Attached | 15 (35.7%) | 27 (64.3%) |
| 2 Unit Apartments | 52 (30.6%) | 118 (69.4%) |
| 3 or 4 Unit Apartments | 12 (3.8%) | 302 (96.2%) |
| 5 to 9 Unit Apartments | 0 (0.0%) | 280 (100.0%) |
| 10 or more Apartments | 8 (1.4%) | 554 (98.6%) |
| Mobile Home / Other | 890 (75.5%) | 288 (24.4%) |
| Total | 7,542 (74.2%) | 2,623 (25.8%) |
Housing Structures by Number of Rooms in Saline County
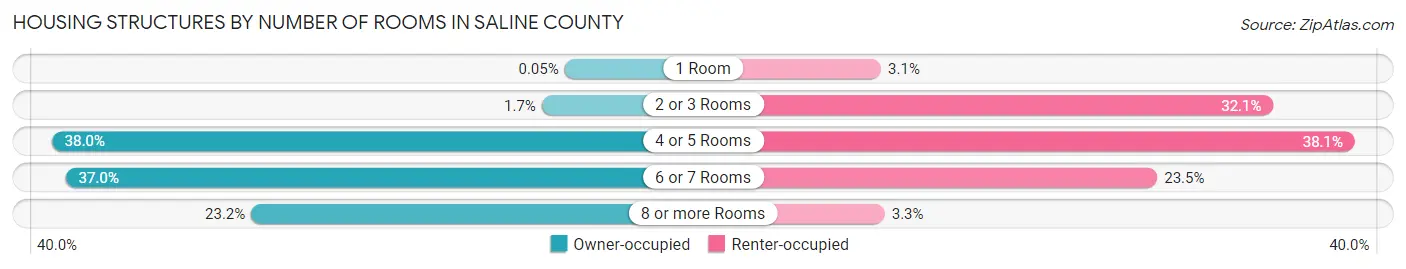
| Number of Rooms | Owner-occupied | Renter-occupied |
| 1 Room | 4 (0.1%) | 80 (3.0%) |
| 2 or 3 Rooms | 131 (1.7%) | 841 (32.1%) |
| 4 or 5 Rooms | 2,866 (38.0%) | 999 (38.1%) |
| 6 or 7 Rooms | 2,788 (37.0%) | 616 (23.5%) |
| 8 or more Rooms | 1,753 (23.2%) | 87 (3.3%) |
| Total | 7,542 (100.0%) | 2,623 (100.0%) |
Housing Structure by Heating Type in Saline County
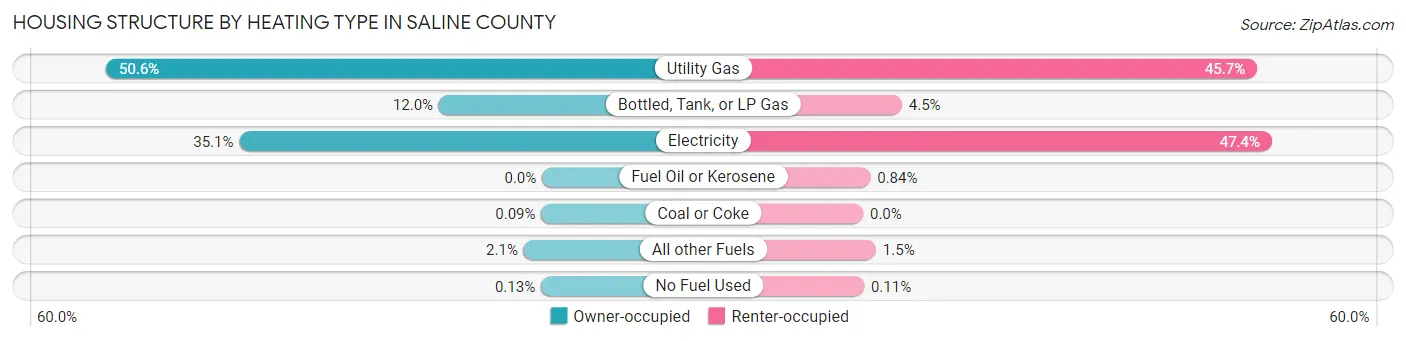
| Heating Type | Owner-occupied | Renter-occupied |
| Utility Gas | 3,814 (50.6%) | 1,198 (45.7%) |
| Bottled, Tank, or LP Gas | 902 (12.0%) | 118 (4.5%) |
| Electricity | 2,648 (35.1%) | 1,243 (47.4%) |
| Fuel Oil or Kerosene | 0 (0.0%) | 22 (0.8%) |
| Coal or Coke | 7 (0.1%) | 0 (0.0%) |
| All other Fuels | 161 (2.1%) | 39 (1.5%) |
| No Fuel Used | 10 (0.1%) | 3 (0.1%) |
| Total | 7,542 (100.0%) | 2,623 (100.0%) |
Household Vehicle Usage in Saline County
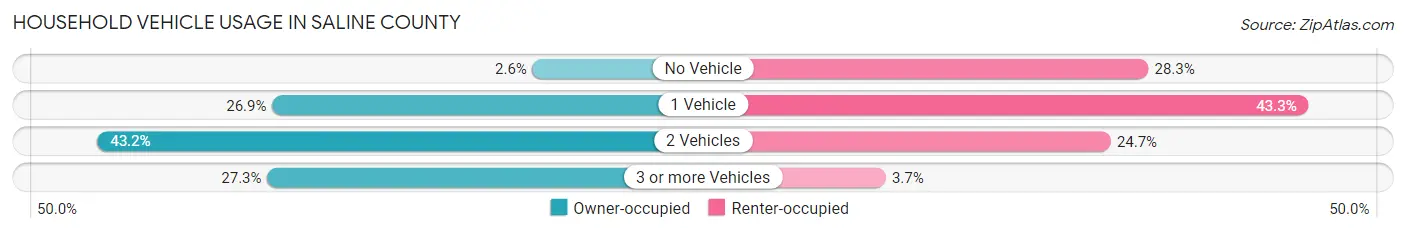
| Vehicles per Household | Owner-occupied | Renter-occupied |
| No Vehicle | 194 (2.6%) | 741 (28.2%) |
| 1 Vehicle | 2,027 (26.9%) | 1,135 (43.3%) |
| 2 Vehicles | 3,259 (43.2%) | 649 (24.7%) |
| 3 or more Vehicles | 2,062 (27.3%) | 98 (3.7%) |
| Total | 7,542 (100.0%) | 2,623 (100.0%) |
Real Estate & Mortgages in Saline County
Real Estate and Mortgage Overview in Saline County
| Characteristic | Without Mortgage | With Mortgage |
| Housing Units | 4,272 | 3,270 |
| Median Property Value | $73,500 | $120,500 |
| Median Household Income | $56,453 | $605 |
| Monthly Housing Costs | $399 | $36 |
| Real Estate Taxes | $1,043 | $80 |
Property Value by Mortgage Status in Saline County
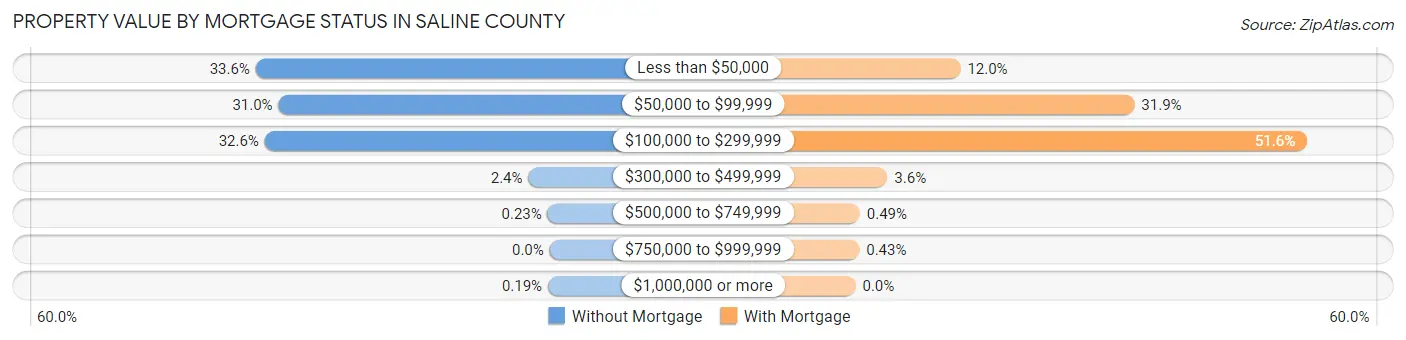
| Property Value | Without Mortgage | With Mortgage |
| Less than $50,000 | 1,435 (33.6%) | 392 (12.0%) |
| $50,000 to $99,999 | 1,324 (31.0%) | 1,042 (31.9%) |
| $100,000 to $299,999 | 1,391 (32.6%) | 1,687 (51.6%) |
| $300,000 to $499,999 | 104 (2.4%) | 119 (3.6%) |
| $500,000 to $749,999 | 10 (0.2%) | 16 (0.5%) |
| $750,000 to $999,999 | 0 (0.0%) | 14 (0.4%) |
| $1,000,000 or more | 8 (0.2%) | 0 (0.0%) |
| Total | 4,272 (100.0%) | 3,270 (100.0%) |
Household Income by Mortgage Status in Saline County
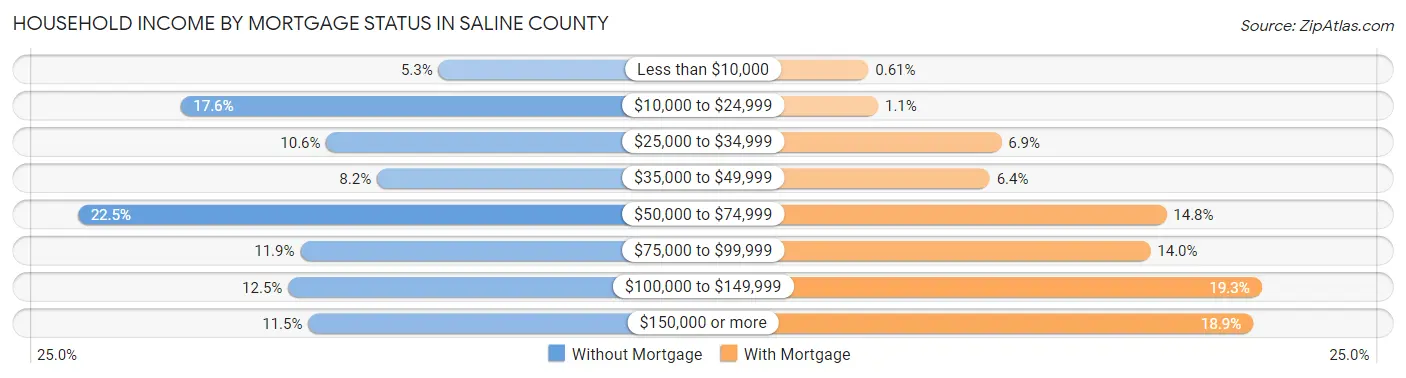
| Household Income | Without Mortgage | With Mortgage |
| Less than $10,000 | 226 (5.3%) | 20 (0.6%) |
| $10,000 to $24,999 | 751 (17.6%) | 35 (1.1%) |
| $25,000 to $34,999 | 454 (10.6%) | 227 (6.9%) |
| $35,000 to $49,999 | 351 (8.2%) | 209 (6.4%) |
| $50,000 to $74,999 | 960 (22.5%) | 484 (14.8%) |
| $75,000 to $99,999 | 507 (11.9%) | 459 (14.0%) |
| $100,000 to $149,999 | 532 (12.4%) | 632 (19.3%) |
| $150,000 or more | 491 (11.5%) | 619 (18.9%) |
| Total | 4,272 (100.0%) | 3,270 (100.0%) |
Property Value to Household Income Ratio in Saline County
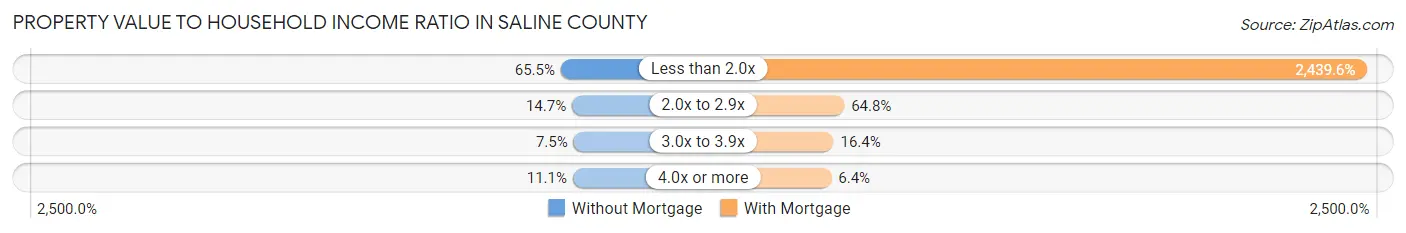
| Value-to-Income Ratio | Without Mortgage | With Mortgage |
| Less than 2.0x | 2,798 (65.5%) | 79,775 (2,439.6%) |
| 2.0x to 2.9x | 629 (14.7%) | 2,120 (64.8%) |
| 3.0x to 3.9x | 321 (7.5%) | 536 (16.4%) |
| 4.0x or more | 474 (11.1%) | 210 (6.4%) |
| Total | 4,272 (100.0%) | 3,270 (100.0%) |
Real Estate Taxes by Mortgage Status in Saline County
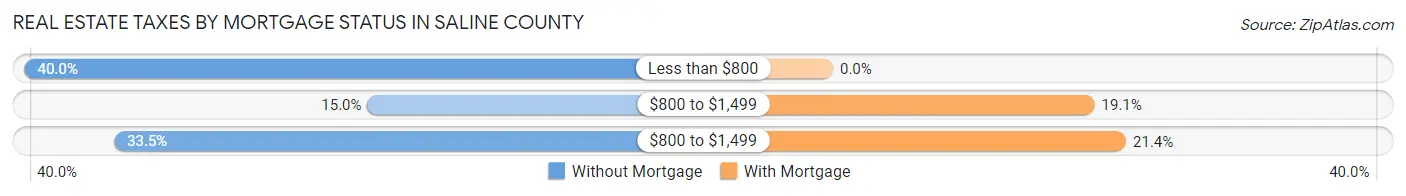
| Property Taxes | Without Mortgage | With Mortgage |
| Less than $800 | 1,709 (40.0%) | 0 (0.0%) |
| $800 to $1,499 | 639 (15.0%) | 625 (19.1%) |
| $800 to $1,499 | 1,430 (33.5%) | 700 (21.4%) |
| Total | 4,272 (100.0%) | 3,270 (100.0%) |
Health & Disability in Saline County
Health Insurance Coverage by Age in Saline County
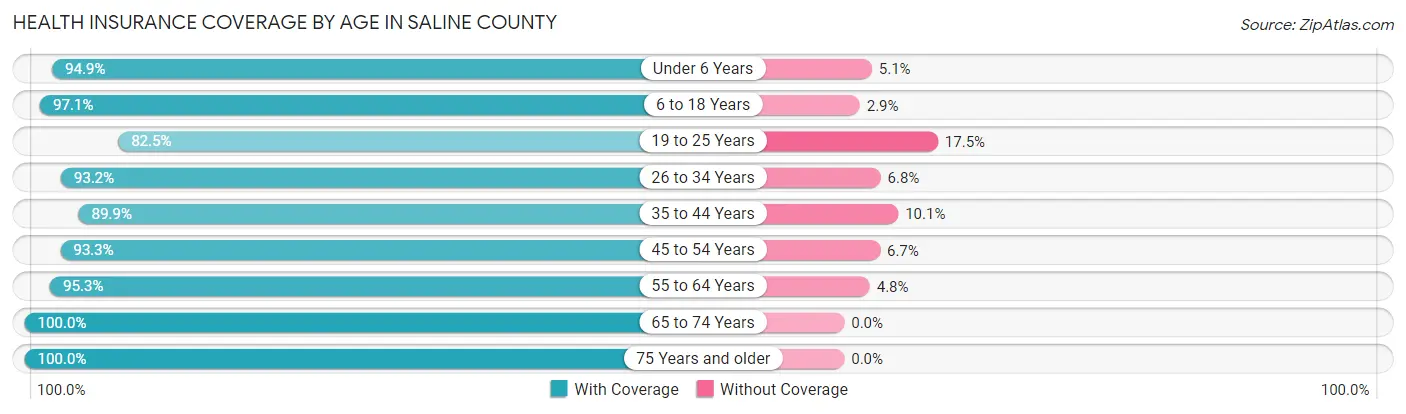
| Age Bracket | With Coverage | Without Coverage |
| Under 6 Years | 1,643 (94.9%) | 89 (5.1%) |
| 6 to 18 Years | 3,127 (97.1%) | 93 (2.9%) |
| 19 to 25 Years | 1,352 (82.5%) | 286 (17.5%) |
| 26 to 34 Years | 2,493 (93.2%) | 181 (6.8%) |
| 35 to 44 Years | 2,451 (89.9%) | 274 (10.1%) |
| 45 to 54 Years | 2,735 (93.3%) | 195 (6.7%) |
| 55 to 64 Years | 3,487 (95.3%) | 174 (4.8%) |
| 65 to 74 Years | 2,669 (100.0%) | 0 (0.0%) |
| 75 Years and older | 2,003 (100.0%) | 0 (0.0%) |
| Total | 21,960 (94.4%) | 1,292 (5.6%) |
Health Insurance Coverage by Citizenship Status in Saline County
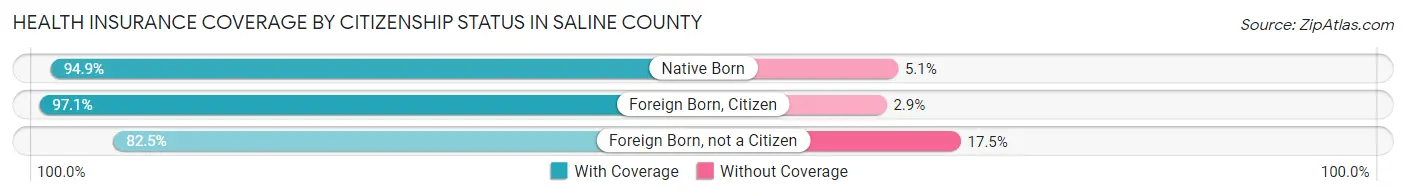
| Citizenship Status | With Coverage | Without Coverage |
| Native Born | 1,643 (94.9%) | 89 (5.1%) |
| Foreign Born, Citizen | 3,127 (97.1%) | 93 (2.9%) |
| Foreign Born, not a Citizen | 1,352 (82.5%) | 286 (17.5%) |
Health Insurance Coverage by Household Income in Saline County
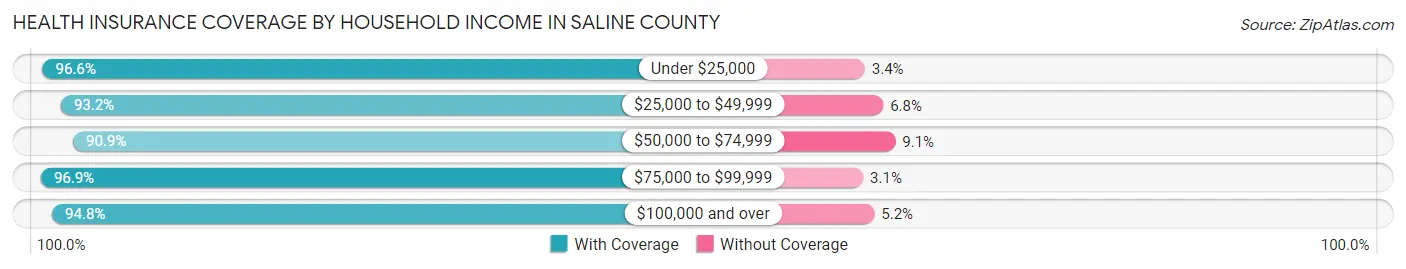
| Household Income | With Coverage | Without Coverage |
| Under $25,000 | 3,941 (96.6%) | 138 (3.4%) |
| $25,000 to $49,999 | 4,452 (93.2%) | 326 (6.8%) |
| $50,000 to $74,999 | 3,652 (90.9%) | 365 (9.1%) |
| $75,000 to $99,999 | 3,220 (96.9%) | 102 (3.1%) |
| $100,000 and over | 6,617 (94.8%) | 361 (5.2%) |
Public vs Private Health Insurance Coverage by Age in Saline County
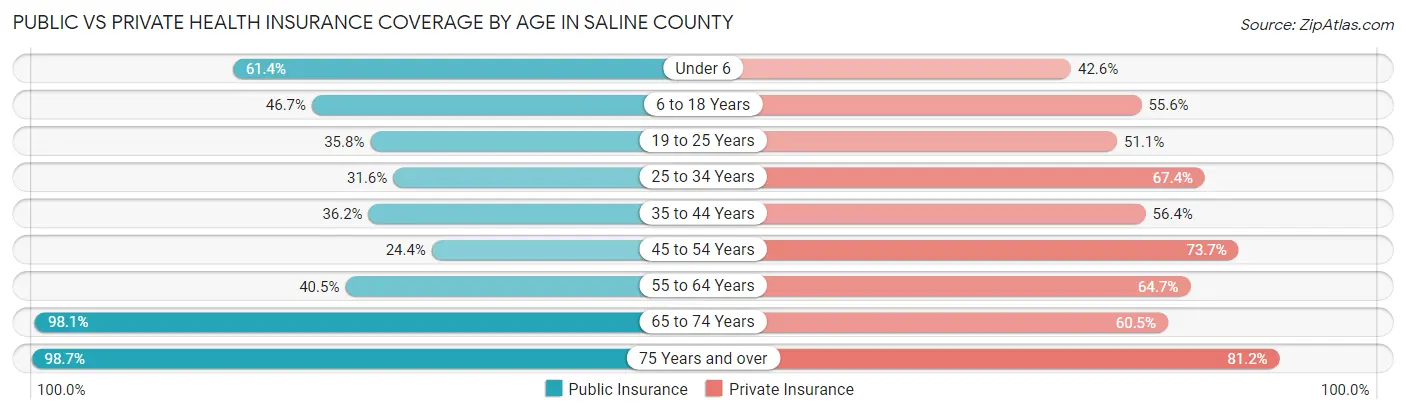
| Age Bracket | Public Insurance | Private Insurance |
| Under 6 | 1,063 (61.4%) | 737 (42.5%) |
| 6 to 18 Years | 1,503 (46.7%) | 1,791 (55.6%) |
| 19 to 25 Years | 587 (35.8%) | 837 (51.1%) |
| 25 to 34 Years | 845 (31.6%) | 1,802 (67.4%) |
| 35 to 44 Years | 986 (36.2%) | 1,537 (56.4%) |
| 45 to 54 Years | 716 (24.4%) | 2,158 (73.7%) |
| 55 to 64 Years | 1,482 (40.5%) | 2,367 (64.6%) |
| 65 to 74 Years | 2,617 (98.1%) | 1,615 (60.5%) |
| 75 Years and over | 1,977 (98.7%) | 1,627 (81.2%) |
| Total | 11,776 (50.6%) | 14,471 (62.2%) |
Disability Status by Sex by Age in Saline County
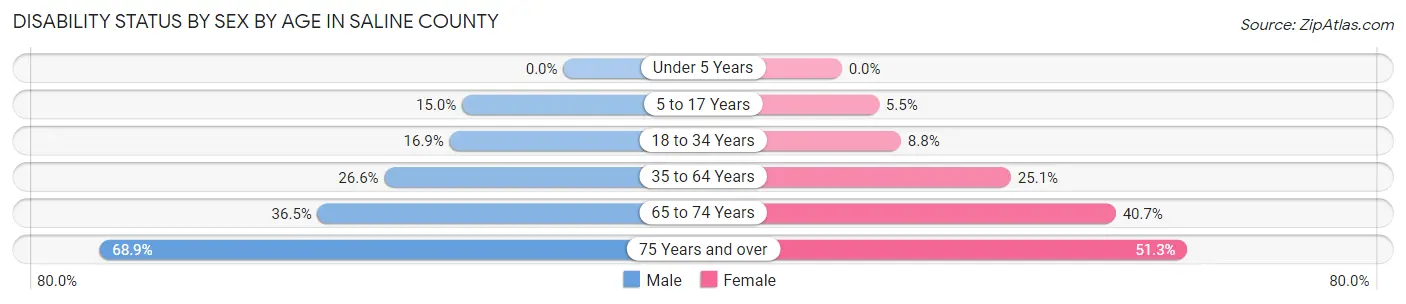
| Age Bracket | Male | Female |
| Under 5 Years | 0 (0.0%) | 0 (0.0%) |
| 5 to 17 Years | 265 (15.0%) | 92 (5.5%) |
| 18 to 34 Years | 364 (16.9%) | 197 (8.8%) |
| 35 to 64 Years | 1,231 (26.6%) | 1,176 (25.1%) |
| 65 to 74 Years | 475 (36.5%) | 556 (40.7%) |
| 75 Years and over | 569 (68.9%) | 604 (51.3%) |
Disability Class by Sex by Age in Saline County
Disability Class: Hearing Difficulty
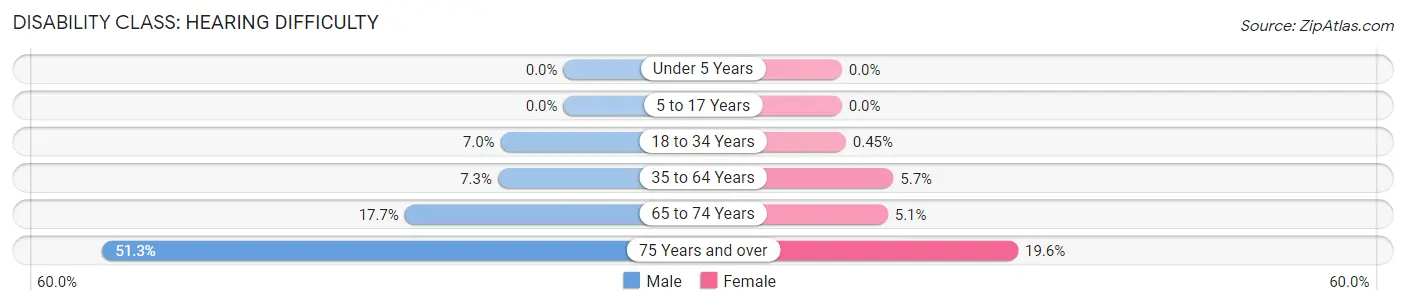
| Age Bracket | Male | Female |
| Under 5 Years | 0 (0.0%) | 0 (0.0%) |
| 5 to 17 Years | 0 (0.0%) | 0 (0.0%) |
| 18 to 34 Years | 151 (7.0%) | 10 (0.4%) |
| 35 to 64 Years | 338 (7.3%) | 269 (5.7%) |
| 65 to 74 Years | 230 (17.7%) | 70 (5.1%) |
| 75 Years and over | 424 (51.3%) | 231 (19.6%) |
Disability Class: Vision Difficulty
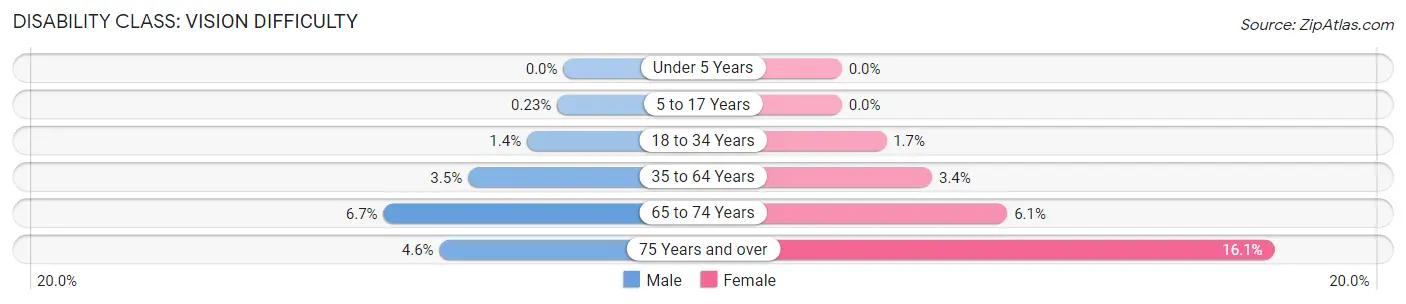
| Age Bracket | Male | Female |
| Under 5 Years | 0 (0.0%) | 0 (0.0%) |
| 5 to 17 Years | 4 (0.2%) | 0 (0.0%) |
| 18 to 34 Years | 29 (1.3%) | 37 (1.7%) |
| 35 to 64 Years | 164 (3.5%) | 157 (3.4%) |
| 65 to 74 Years | 87 (6.7%) | 84 (6.1%) |
| 75 Years and over | 38 (4.6%) | 189 (16.1%) |
Disability Class: Cognitive Difficulty
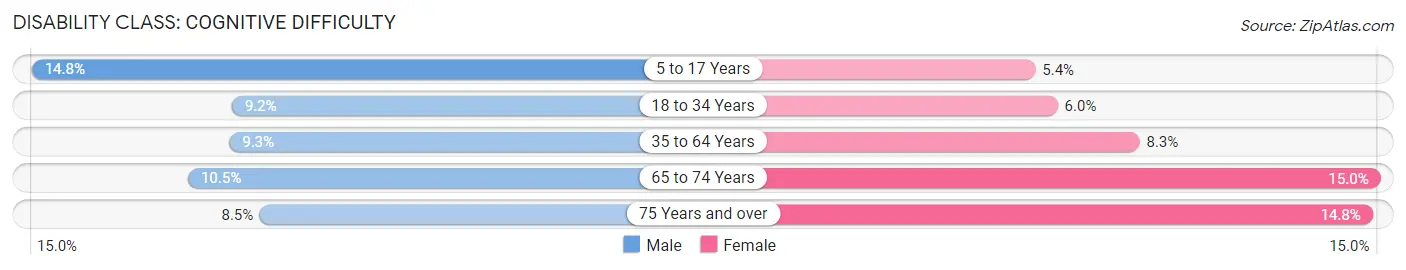
| Age Bracket | Male | Female |
| 5 to 17 Years | 261 (14.8%) | 90 (5.4%) |
| 18 to 34 Years | 199 (9.2%) | 135 (6.0%) |
| 35 to 64 Years | 431 (9.3%) | 388 (8.3%) |
| 65 to 74 Years | 136 (10.4%) | 205 (15.0%) |
| 75 Years and over | 70 (8.5%) | 174 (14.8%) |
Disability Class: Ambulatory Difficulty
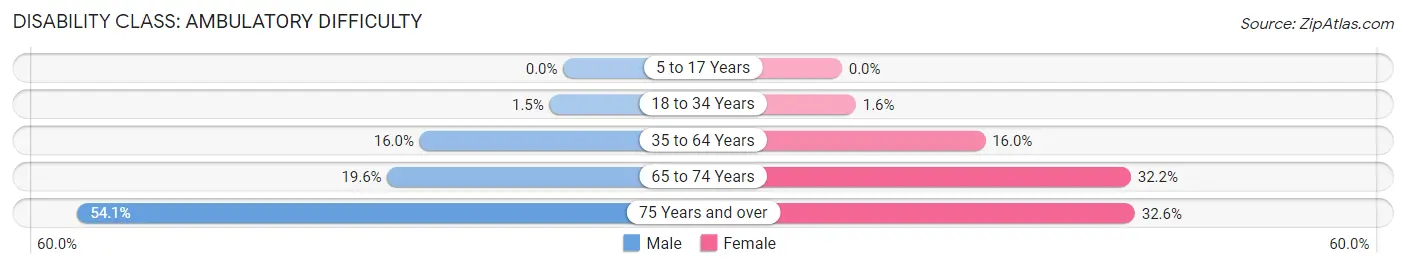
| Age Bracket | Male | Female |
| 5 to 17 Years | 0 (0.0%) | 0 (0.0%) |
| 18 to 34 Years | 33 (1.5%) | 35 (1.6%) |
| 35 to 64 Years | 741 (16.0%) | 748 (16.0%) |
| 65 to 74 Years | 255 (19.6%) | 440 (32.2%) |
| 75 Years and over | 447 (54.1%) | 384 (32.6%) |
Disability Class: Self-Care Difficulty
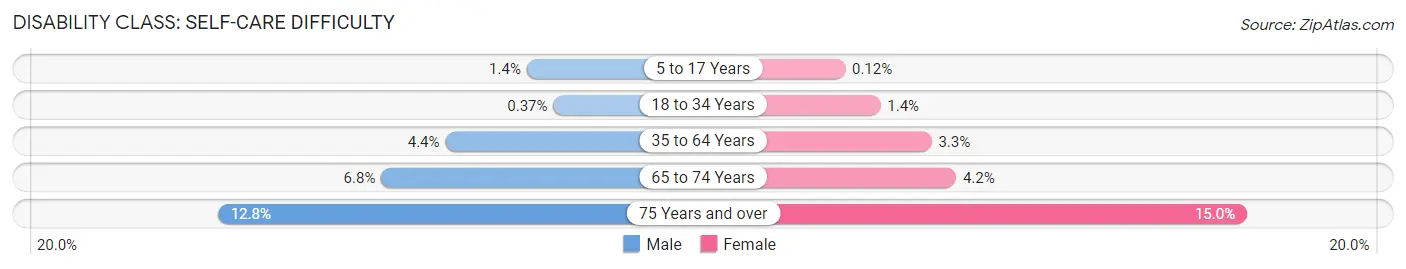
| Age Bracket | Male | Female |
| 5 to 17 Years | 24 (1.4%) | 2 (0.1%) |
| 18 to 34 Years | 8 (0.4%) | 32 (1.4%) |
| 35 to 64 Years | 203 (4.4%) | 156 (3.3%) |
| 65 to 74 Years | 88 (6.8%) | 58 (4.2%) |
| 75 Years and over | 106 (12.8%) | 177 (15.0%) |
Technology Access in Saline County
Computing Device Access in Saline County

| Device Type | # Households | % Households |
| Desktop or Laptop | 6,000 | 59.0% |
| Smartphone | 7,538 | 74.2% |
| Tablet | 5,092 | 50.1% |
| No Computing Device | 1,764 | 17.3% |
| Total | 10,165 | 100.0% |
Internet Access in Saline County
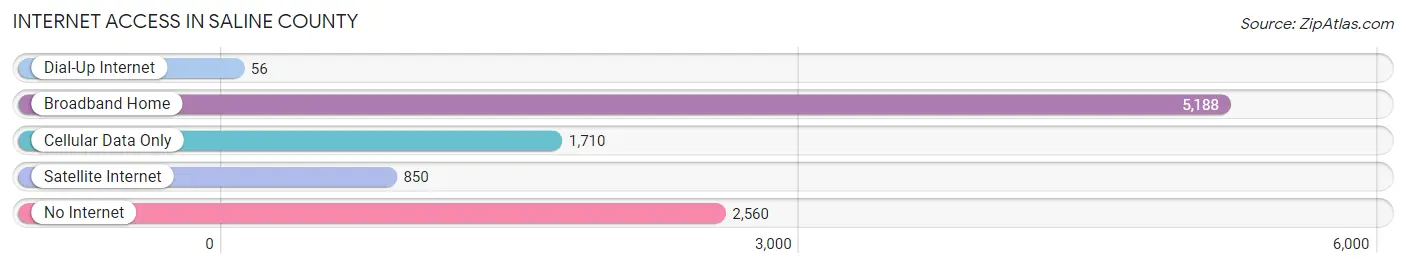
| Internet Type | # Households | % Households |
| Dial-Up Internet | 56 | 0.5% |
| Broadband Home | 5,188 | 51.0% |
| Cellular Data Only | 1,710 | 16.8% |
| Satellite Internet | 850 | 8.4% |
| No Internet | 2,560 | 25.2% |
| Total | 10,165 | 100.0% |
Saline County Summary
Saline County is located in the south-central region of Illinois, and is part of the Metro East region of the state. It is bordered by Gallatin County to the north, Hamilton County to the east, White County to the south, and Williamson County to the west. The county seat is Harrisburg, and the largest city is Eldorado. The county has a total area of 517 square miles, and a population of 24,913 as of the 2010 census.
History
Saline County was formed in 1847 from parts of Gallatin and Hamilton counties. It was named for the salt springs that were located in the area. The county was originally settled by Native Americans, and later by European settlers. The first settlers arrived in the early 1800s, and the county was officially organized in 1847.
The county was an important part of the Underground Railroad, with many of the county's residents helping to hide and transport escaped slaves. During the Civil War, the county was divided between Union and Confederate sympathizers, and the county was the site of several skirmishes.
Geography
Saline County is located in the south-central region of Illinois, and is part of the Metro East region of the state. It is bordered by Gallatin County to the north, Hamilton County to the east, White County to the south, and Williamson County to the west. The county has a total area of 517 square miles, and is mostly flat with some rolling hills. The terrain is mostly prairie, with some wooded areas. The county is drained by the Saline River, which flows through the county from north to south.
Economy
The economy of Saline County is largely based on agriculture, with corn, soybeans, and wheat being the main crops. Other crops grown in the county include hay, oats, and sorghum. Livestock production is also important, with beef cattle, dairy cattle, and hogs being the main animals raised.
The county also has a number of manufacturing and industrial businesses, including a steel mill, a paper mill, and a plastics plant. The county is also home to several coal mines, and there is a large oil and gas industry in the area.
Demographics
As of the 2010 census, Saline County had a population of 24,913. The population was spread out, with 48.3% male and 51.7% female. The median age was 40.7 years. The racial makeup of the county was 97.2% White, 0.7% African American, 0.3% Native American, 0.3% Asian, 0.2% from other races, and 1.4% from two or more races. Hispanic or Latino of any race were 1.2% of the population.
The median household income was $41,945, and the median family income was $50,945. The per capita income was $20,945. About 11.2% of the population was below the poverty line.
Common Questions
What is Per Capita Income in Saline County?
Per Capita income in Saline County is $34,340.
What is the Median Family Income in Saline County?
Median Family Income in Saline County is $69,712.
What is the Median Household income in Saline County?
Median Household Income in Saline County is $51,710.
What is Income or Wage Gap in Saline County?
Income or Wage Gap in Saline County is 33.5%.
Women in Saline County earn 66.5 cents for every dollar earned by a man.
What is Family Income Deficit in Saline County?
Family Income Deficit in Saline County is $9,103.
Families that are below poverty line in Saline County earn $9,103 less on average than the poverty threshold level.
What is Inequality or Gini Index in Saline County?
Inequality or Gini Index in Saline County is 0.51.
What is the Total Population of Saline County?
Total Population of Saline County is 23,662.
What is the Total Male Population of Saline County?
Total Male Population of Saline County is 11,604.
What is the Total Female Population of Saline County?
Total Female Population of Saline County is 12,058.
What is the Ratio of Males per 100 Females in Saline County?
There are 96.23 Males per 100 Females in Saline County.
What is the Ratio of Females per 100 Males in Saline County?
There are 103.91 Females per 100 Males in Saline County.
What is the Median Population Age in Saline County?
Median Population Age in Saline County is 43.2 Years.
What is the Average Family Size in Saline County
Average Family Size in Saline County is 2.9 People.
What is the Average Household Size in Saline County
Average Household Size in Saline County is 2.3 People.
How Large is the Labor Force in Saline County?
There are 10,807 People in the Labor Forcein in Saline County.
What is the Percentage of People in the Labor Force in Saline County?
55.9% of People are in the Labor Force in Saline County.
What is the Unemployment Rate in Saline County?
Unemployment Rate in Saline County is 5.9%.