Randolph County, IL Map & Demographics
Randolph County Map
Randolph County Overview
$29,832
PER CAPITA INCOME
$81,142
AVG FAMILY INCOME
$63,860
AVG HOUSEHOLD INCOME
39.6%
WAGE / INCOME GAP [ % ]
60.4¢/ $1
WAGE / INCOME GAP [ $ ]
$9,056
FAMILY INCOME DEFICIT
0.40
INEQUALITY / GINI INDEX
30,413
TOTAL POPULATION
16,471
MALE POPULATION
13,942
FEMALE POPULATION
118.14
MALES / 100 FEMALES
84.65
FEMALES / 100 MALES
43.0
MEDIAN AGE
2.9
AVG FAMILY SIZE
2.3
AVG HOUSEHOLD SIZE
13,307
LABOR FORCE [ PEOPLE ]
52.9%
PERCENT IN LABOR FORCE
5.2%
UNEMPLOYMENT RATE
Randolph County Area Codes
Income in Randolph County
Income Overview in Randolph County
Per Capita Income in Randolph County is $29,832, while median incomes of families and households are $81,142 and $63,860 respectively.
| Characteristic | Number | Measure |
| Per Capita Income | 30,413 | $29,832 |
| Median Family Income | 7,547 | $81,142 |
| Mean Family Income | 7,547 | $89,980 |
| Median Household Income | 11,650 | $63,860 |
| Mean Household Income | 11,650 | $76,855 |
| Income Deficit | 7,547 | $9,056 |
| Wage / Income Gap (%) | 30,413 | 39.57% |
| Wage / Income Gap ($) | 30,413 | 60.43¢ per $1 |
| Gini / Inequality Index | 30,413 | 0.40 |
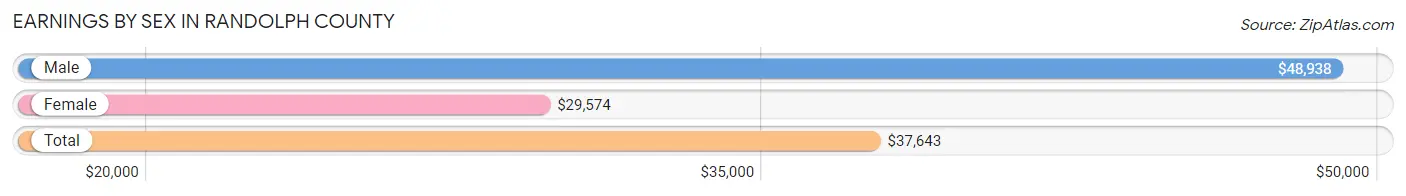
Earnings by Sex in Randolph County
Average Earnings in Randolph County are $37,643, $48,938 for men and $29,574 for women, a difference of 39.6%.
| Sex | Number | Average Earnings |
| Male | 7,328 (52.9%) | $48,938 |
| Female | 6,524 (47.1%) | $29,574 |
| Total | 13,852 (100.0%) | $37,643 |
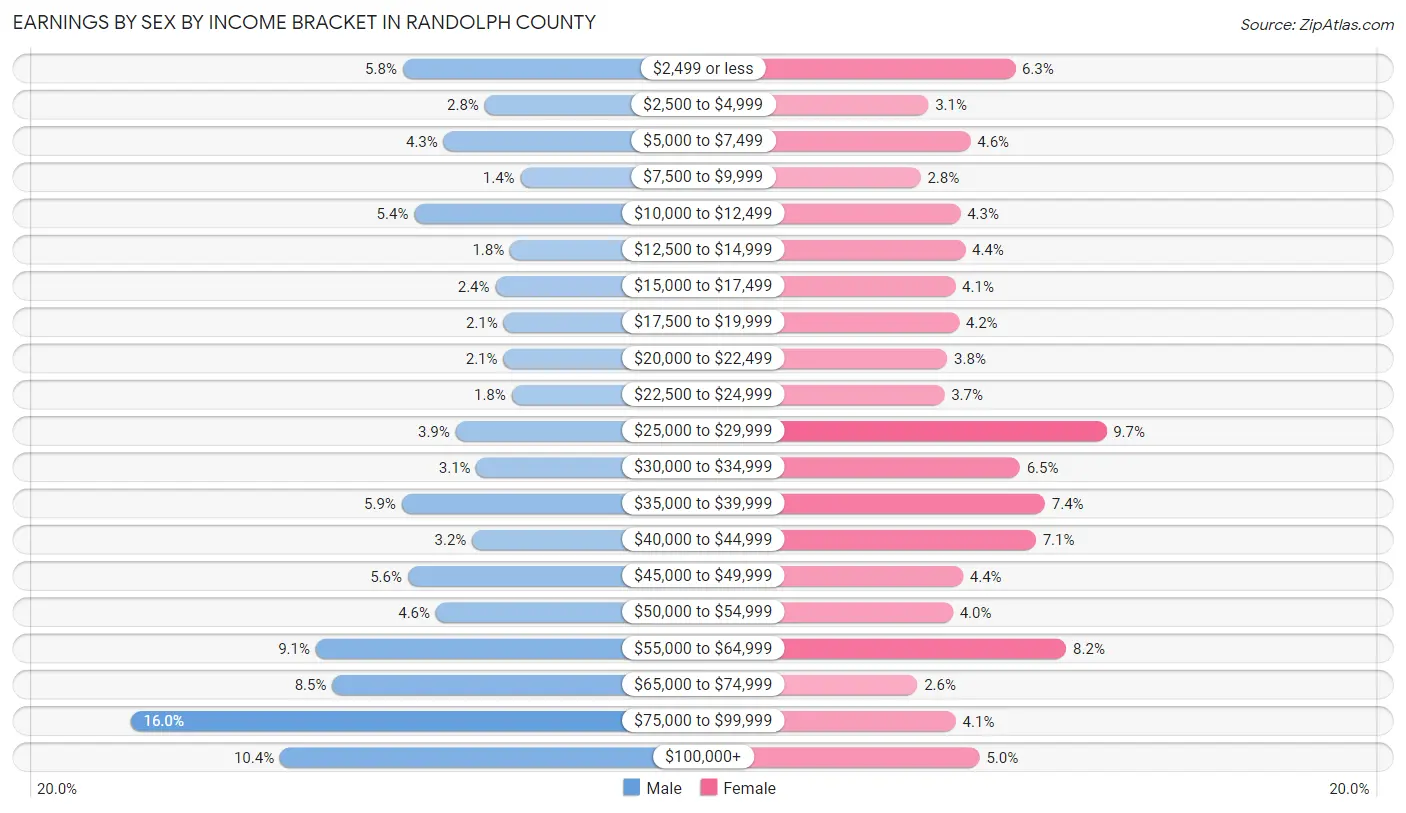
Earnings by Sex by Income Bracket in Randolph County
The most common earnings brackets in Randolph County are $75,000 to $99,999 for men (1,175 | 16.0%) and $25,000 to $29,999 for women (634 | 9.7%).
| Income | Male | Female |
| $2,499 or less | 427 (5.8%) | 411 (6.3%) |
| $2,500 to $4,999 | 202 (2.8%) | 199 (3.0%) |
| $5,000 to $7,499 | 315 (4.3%) | 302 (4.6%) |
| $7,500 to $9,999 | 104 (1.4%) | 180 (2.8%) |
| $10,000 to $12,499 | 396 (5.4%) | 277 (4.3%) |
| $12,500 to $14,999 | 133 (1.8%) | 289 (4.4%) |
| $15,000 to $17,499 | 173 (2.4%) | 265 (4.1%) |
| $17,500 to $19,999 | 150 (2.1%) | 274 (4.2%) |
| $20,000 to $22,499 | 151 (2.1%) | 245 (3.8%) |
| $22,500 to $24,999 | 128 (1.8%) | 238 (3.6%) |
| $25,000 to $29,999 | 282 (3.8%) | 634 (9.7%) |
| $30,000 to $34,999 | 225 (3.1%) | 423 (6.5%) |
| $35,000 to $39,999 | 430 (5.9%) | 484 (7.4%) |
| $40,000 to $44,999 | 237 (3.2%) | 462 (7.1%) |
| $45,000 to $49,999 | 413 (5.6%) | 284 (4.3%) |
| $50,000 to $54,999 | 336 (4.6%) | 259 (4.0%) |
| $55,000 to $64,999 | 666 (9.1%) | 536 (8.2%) |
| $65,000 to $74,999 | 621 (8.5%) | 172 (2.6%) |
| $75,000 to $99,999 | 1,175 (16.0%) | 266 (4.1%) |
| $100,000+ | 764 (10.4%) | 324 (5.0%) |
| Total | 7,328 (100.0%) | 6,524 (100.0%) |
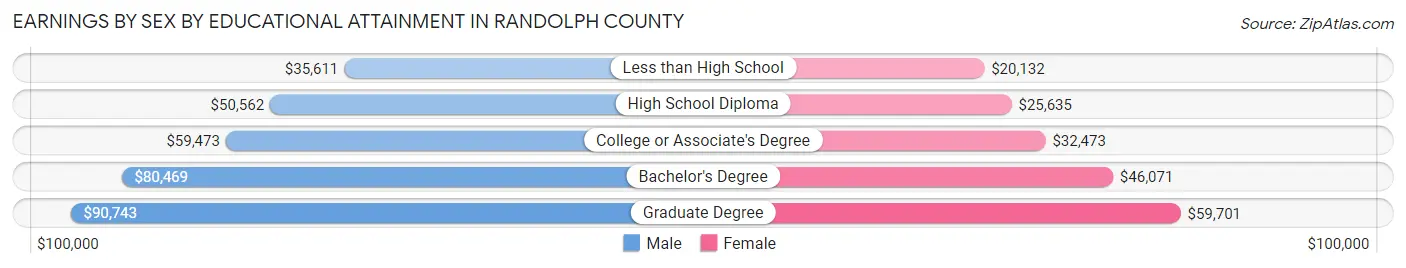
Earnings by Sex by Educational Attainment in Randolph County
Average earnings in Randolph County are $56,368 for men and $34,515 for women, a difference of 38.8%. Men with an educational attainment of graduate degree enjoy the highest average annual earnings of $90,743, while those with less than high school education earn the least with $35,611. Women with an educational attainment of graduate degree earn the most with the average annual earnings of $59,701, while those with less than high school education have the smallest earnings of $20,132.
| Educational Attainment | Male Income | Female Income |
| Less than High School | $35,611 | $20,132 |
| High School Diploma | $50,562 | $25,635 |
| College or Associate's Degree | $59,473 | $32,473 |
| Bachelor's Degree | $80,469 | $46,071 |
| Graduate Degree | $90,743 | $59,701 |
| Total | $56,368 | $34,515 |
Family Income in Randolph County
Family Income Brackets in Randolph County
According to the Randolph County family income data, there are 1,721 families falling into the $100,000 to $149,999 income range, which is the most common income bracket and makes up 22.8% of all families. Conversely, the less than $10,000 income bracket is the least frequent group with only 181 families (2.4%) belonging to this category.
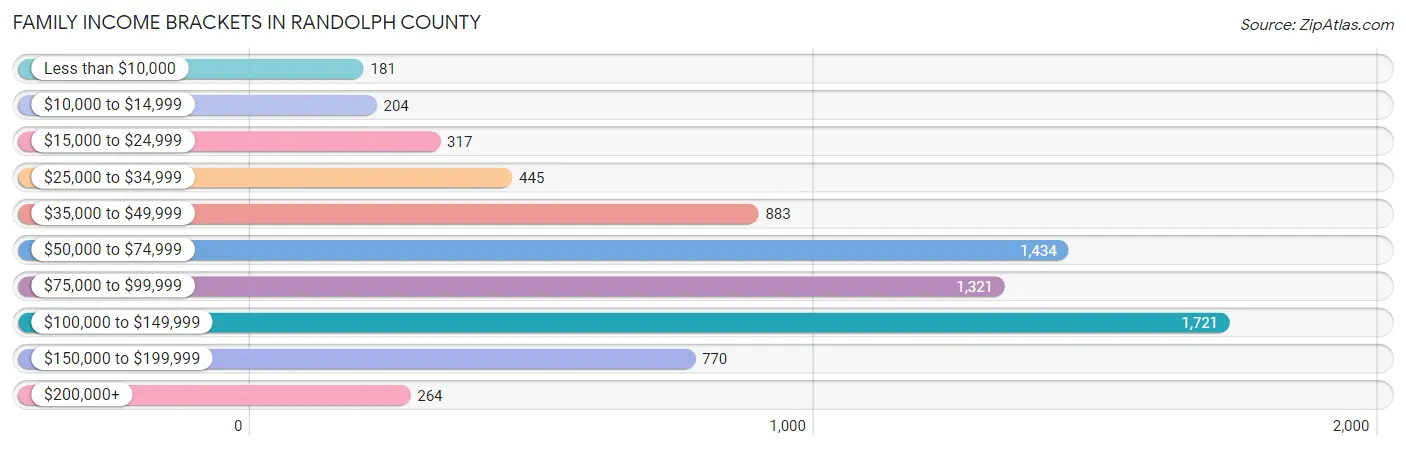
| Income Bracket | # Families | % Families |
| Less than $10,000 | 181 | 2.4% |
| $10,000 to $14,999 | 204 | 2.7% |
| $15,000 to $24,999 | 317 | 4.2% |
| $25,000 to $34,999 | 445 | 5.9% |
| $35,000 to $49,999 | 883 | 11.7% |
| $50,000 to $74,999 | 1,434 | 19.0% |
| $75,000 to $99,999 | 1,321 | 17.5% |
| $100,000 to $149,999 | 1,721 | 22.8% |
| $150,000 to $199,999 | 770 | 10.2% |
| $200,000+ | 264 | 3.5% |
Family Income by Famaliy Size in Randolph County
7+ person families (46 | 0.6%) account for the highest median family income in Randolph County with $165,517 per family, while 2-person families (4,182 | 55.4%) have the highest median income of $35,890 per family member.
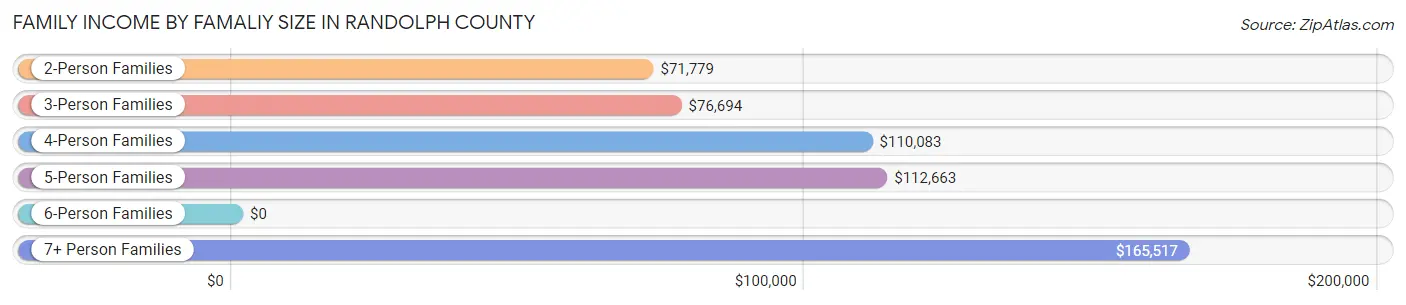
| Income Bracket | # Families | Median Income |
| 2-Person Families | 4,182 (55.4%) | $71,779 |
| 3-Person Families | 1,510 (20.0%) | $76,694 |
| 4-Person Families | 1,292 (17.1%) | $110,083 |
| 5-Person Families | 445 (5.9%) | $112,663 |
| 6-Person Families | 72 (0.9%) | $0 |
| 7+ Person Families | 46 (0.6%) | $165,517 |
| Total | 7,547 (100.0%) | $81,142 |
Family Income by Number of Earners in Randolph County
The median family income in Randolph County is $81,142, with families comprising 3+ earners (755) having the highest median family income of $126,838, while families with no earners (1,550) have the lowest median family income of $56,992, accounting for 10.0% and 20.5% of families, respectively.
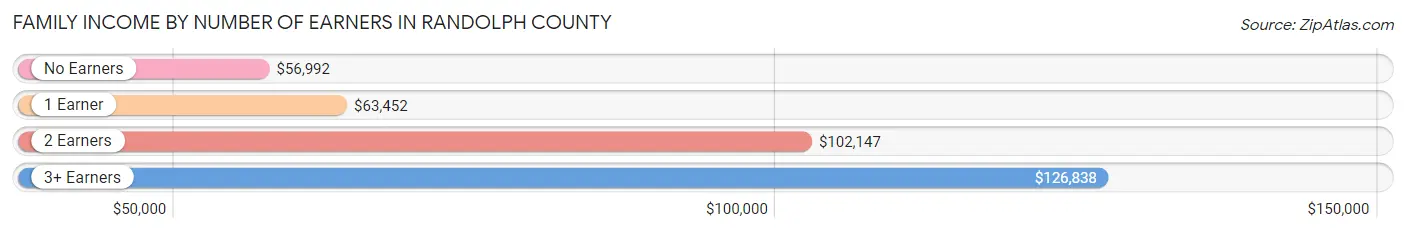
| Number of Earners | # Families | Median Income |
| No Earners | 1,550 (20.5%) | $56,992 |
| 1 Earner | 2,252 (29.8%) | $63,452 |
| 2 Earners | 2,990 (39.6%) | $102,147 |
| 3+ Earners | 755 (10.0%) | $126,838 |
| Total | 7,547 (100.0%) | $81,142 |
Household Income in Randolph County
Household Income Brackets in Randolph County
With 2,202 households falling in the category, the $50,000 to $74,999 income range is the most frequent in Randolph County, accounting for 18.9% of all households. In contrast, only 291 households (2.5%) fall into the $200,000+ income bracket, making it the least populous group.
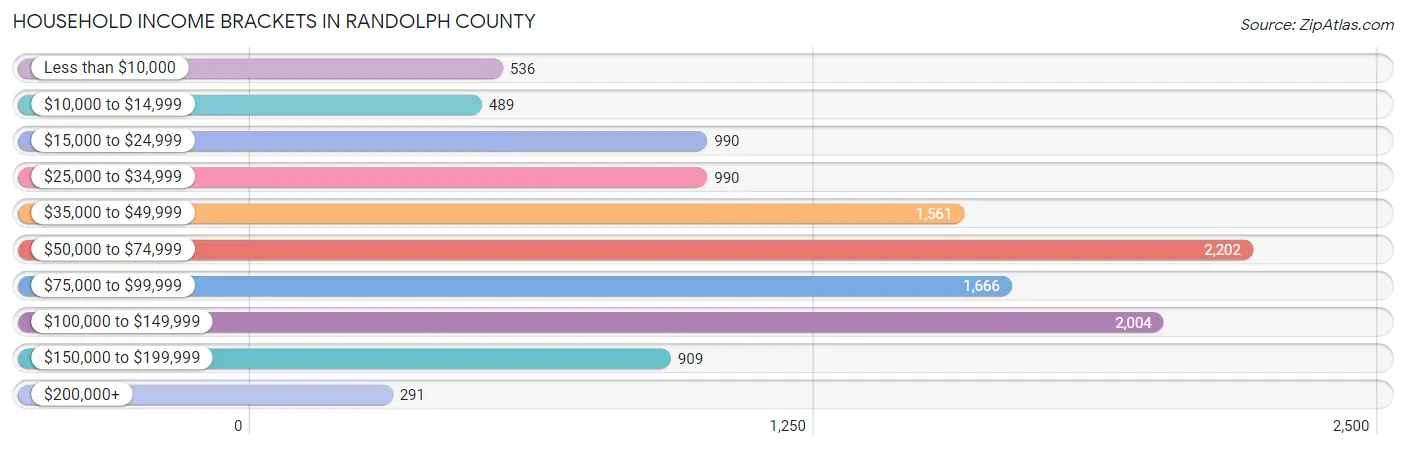
| Income Bracket | # Households | % Households |
| Less than $10,000 | 536 | 4.6% |
| $10,000 to $14,999 | 489 | 4.2% |
| $15,000 to $24,999 | 990 | 8.5% |
| $25,000 to $34,999 | 990 | 8.5% |
| $35,000 to $49,999 | 1,561 | 13.4% |
| $50,000 to $74,999 | 2,202 | 18.9% |
| $75,000 to $99,999 | 1,666 | 14.3% |
| $100,000 to $149,999 | 2,004 | 17.2% |
| $150,000 to $199,999 | 909 | 7.8% |
| $200,000+ | 291 | 2.5% |
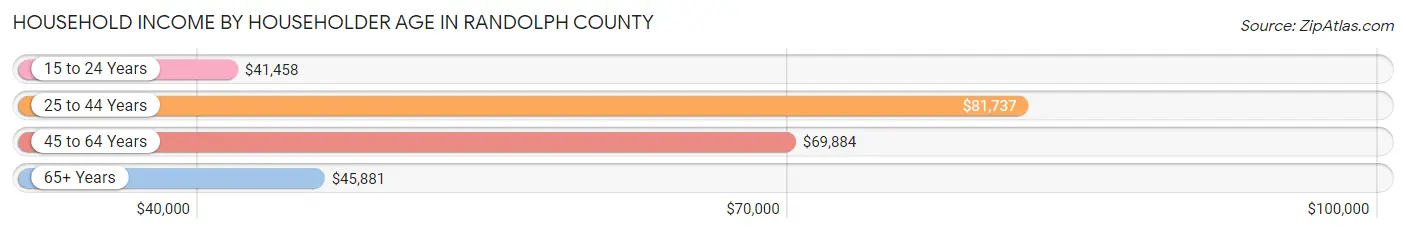
Household Income by Householder Age in Randolph County
The median household income in Randolph County is $63,860, with the highest median household income of $81,737 found in the 25 to 44 years age bracket for the primary householder. A total of 3,095 households (26.6%) fall into this category. Meanwhile, the 15 to 24 years age bracket for the primary householder has the lowest median household income of $41,458, with 436 households (3.7%) in this group.
| Income Bracket | # Households | Median Income |
| 15 to 24 Years | 436 (3.7%) | $41,458 |
| 25 to 44 Years | 3,095 (26.6%) | $81,737 |
| 45 to 64 Years | 4,278 (36.7%) | $69,884 |
| 65+ Years | 3,841 (33.0%) | $45,881 |
| Total | 11,650 (100.0%) | $63,860 |
Poverty in Randolph County
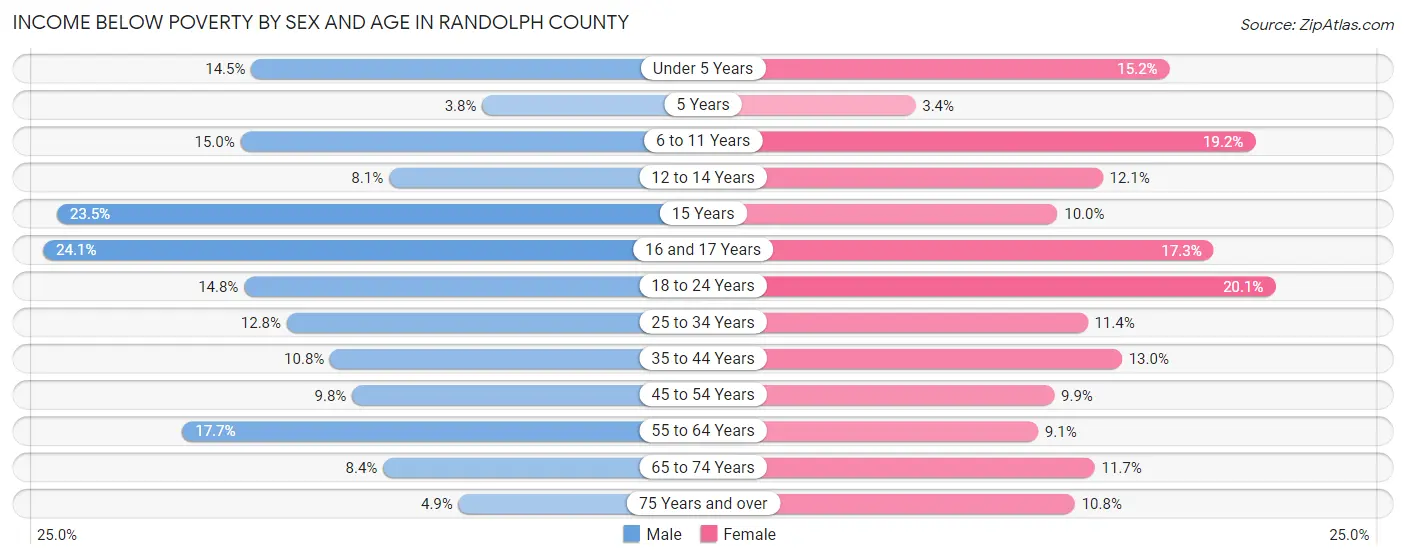
Income Below Poverty by Sex and Age in Randolph County
With 12.6% poverty level for males and 12.5% for females among the residents of Randolph County, 16 and 17 year old males and 18 to 24 year old females are the most vulnerable to poverty, with 119 males (24.1%) and 189 females (20.1%) in their respective age groups living below the poverty level.
| Age Bracket | Male | Female |
| Under 5 Years | 107 (14.5%) | 114 (15.2%) |
| 5 Years | 7 (3.8%) | 3 (3.4%) |
| 6 to 11 Years | 144 (15.0%) | 174 (19.2%) |
| 12 to 14 Years | 48 (8.1%) | 76 (12.1%) |
| 15 Years | 47 (23.5%) | 11 (10.0%) |
| 16 and 17 Years | 119 (24.1%) | 64 (17.2%) |
| 18 to 24 Years | 168 (14.8%) | 189 (20.1%) |
| 25 to 34 Years | 195 (12.8%) | 161 (11.4%) |
| 35 to 44 Years | 175 (10.8%) | 201 (13.0%) |
| 45 to 54 Years | 158 (9.8%) | 163 (9.9%) |
| 55 to 64 Years | 376 (17.7%) | 182 (9.1%) |
| 65 to 74 Years | 133 (8.4%) | 203 (11.7%) |
| 75 Years and over | 45 (4.9%) | 165 (10.8%) |
| Total | 1,722 (12.6%) | 1,706 (12.5%) |
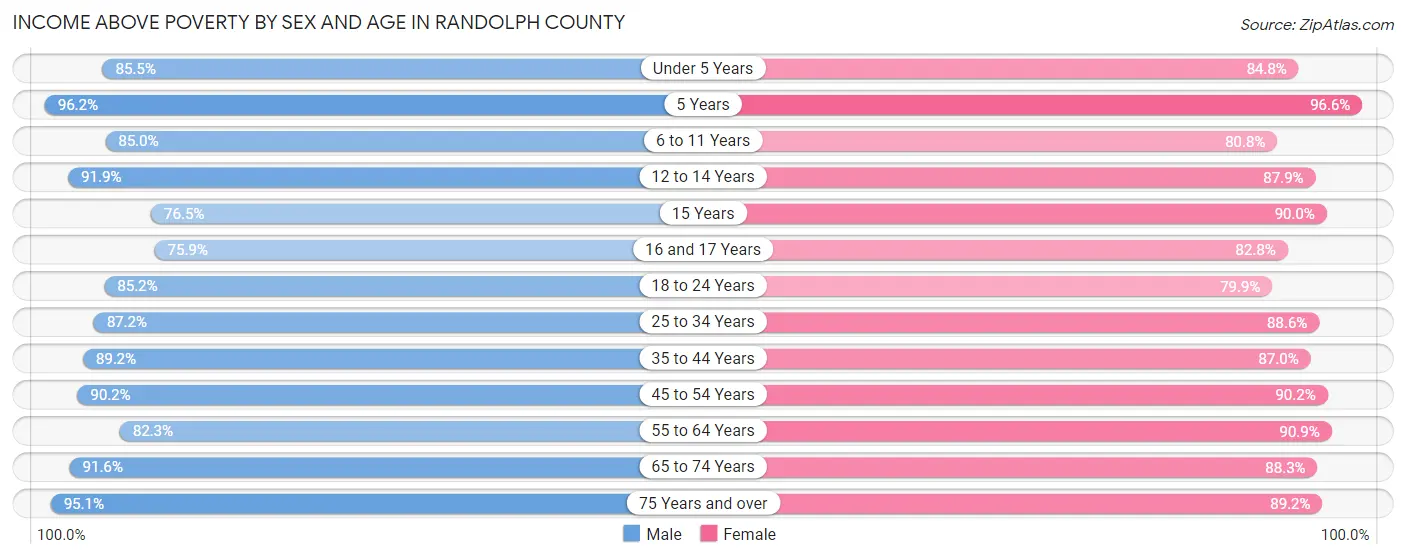
Income Above Poverty by Sex and Age in Randolph County
According to the poverty statistics in Randolph County, males aged 5 years and females aged 5 years are the age groups that are most secure financially, with 96.2% of males and 96.6% of females in these age groups living above the poverty line.
| Age Bracket | Male | Female |
| Under 5 Years | 632 (85.5%) | 636 (84.8%) |
| 5 Years | 179 (96.2%) | 85 (96.6%) |
| 6 to 11 Years | 817 (85.0%) | 733 (80.8%) |
| 12 to 14 Years | 545 (91.9%) | 552 (87.9%) |
| 15 Years | 153 (76.5%) | 99 (90.0%) |
| 16 and 17 Years | 374 (75.9%) | 307 (82.8%) |
| 18 to 24 Years | 966 (85.2%) | 751 (79.9%) |
| 25 to 34 Years | 1,325 (87.2%) | 1,251 (88.6%) |
| 35 to 44 Years | 1,443 (89.2%) | 1,346 (87.0%) |
| 45 to 54 Years | 1,455 (90.2%) | 1,491 (90.1%) |
| 55 to 64 Years | 1,751 (82.3%) | 1,817 (90.9%) |
| 65 to 74 Years | 1,457 (91.6%) | 1,528 (88.3%) |
| 75 Years and over | 880 (95.1%) | 1,362 (89.2%) |
| Total | 11,977 (87.4%) | 11,958 (87.5%) |
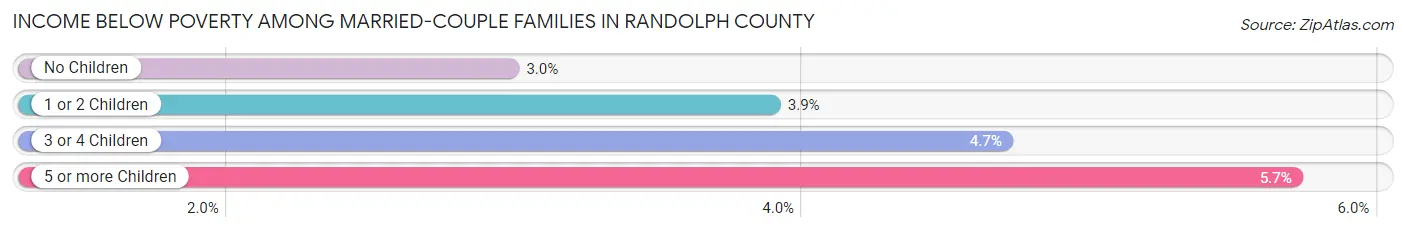
Income Below Poverty Among Married-Couple Families in Randolph County
The poverty statistics for married-couple families in Randolph County show that 3.4% or 186 of the total 5,548 families live below the poverty line. Families with 5 or more children have the highest poverty rate of 5.7%, comprising of 2 families. On the other hand, families with no children have the lowest poverty rate of 3.0%, which includes 107 families.
| Children | Above Poverty | Below Poverty |
| No Children | 3,489 (97.0%) | 107 (3.0%) |
| 1 or 2 Children | 1,556 (96.1%) | 63 (3.9%) |
| 3 or 4 Children | 284 (95.3%) | 14 (4.7%) |
| 5 or more Children | 33 (94.3%) | 2 (5.7%) |
| Total | 5,362 (96.7%) | 186 (3.4%) |
Income Below Poverty Among Single-Parent Households in Randolph County
According to the poverty data in Randolph County, 26.1% or 190 single-father households and 22.7% or 289 single-mother households are living below the poverty line. Among single-father households, those with no children have the highest poverty rate, with 118 households (31.7%) experiencing poverty. Likewise, among single-mother households, those with 5 or more children have the highest poverty rate, with 11 households (100.0%) falling below the poverty line.
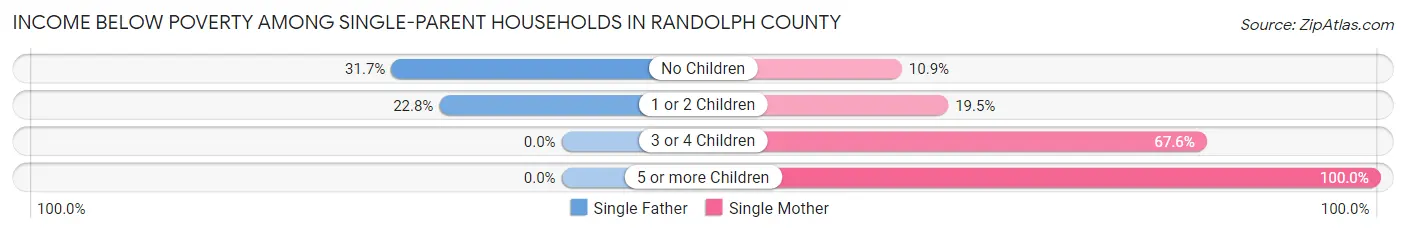
| Children | Single Father | Single Mother |
| No Children | 118 (31.7%) | 47 (10.8%) |
| 1 or 2 Children | 72 (22.8%) | 133 (19.5%) |
| 3 or 4 Children | 0 (0.0%) | 98 (67.6%) |
| 5 or more Children | 0 (0.0%) | 11 (100.0%) |
| Total | 190 (26.1%) | 289 (22.7%) |
Income Below Poverty Among Married-Couple vs Single-Parent Households in Randolph County
The poverty data for Randolph County shows that 186 of the married-couple family households (3.4%) and 479 of the single-parent households (24.0%) are living below the poverty level. Within the married-couple family households, those with 5 or more children have the highest poverty rate, with 2 households (5.7%) falling below the poverty line. Among the single-parent households, those with 5 or more children have the highest poverty rate, with 11 household (100.0%) living below poverty.
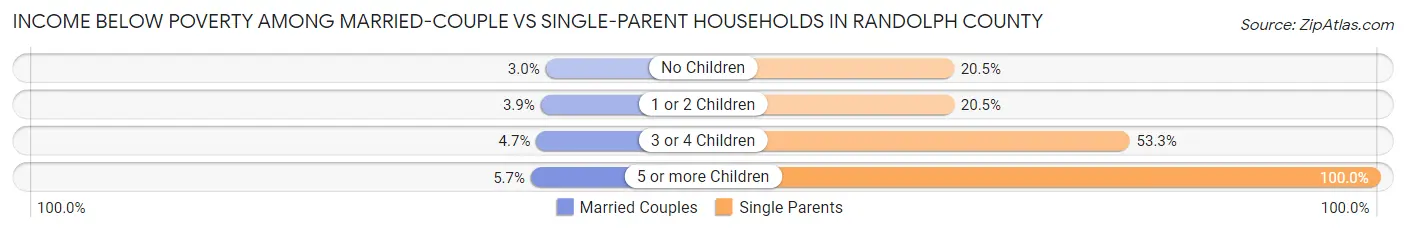
| Children | Married-Couple Families | Single-Parent Households |
| No Children | 107 (3.0%) | 165 (20.5%) |
| 1 or 2 Children | 63 (3.9%) | 205 (20.5%) |
| 3 or 4 Children | 14 (4.7%) | 98 (53.3%) |
| 5 or more Children | 2 (5.7%) | 11 (100.0%) |
| Total | 186 (3.4%) | 479 (24.0%) |
Race in Randolph County
The most populous races in Randolph County are White / Caucasian (26,603 | 87.5%), Black / African American (2,428 | 8.0%), and Hispanic or Latino (965 | 3.2%).
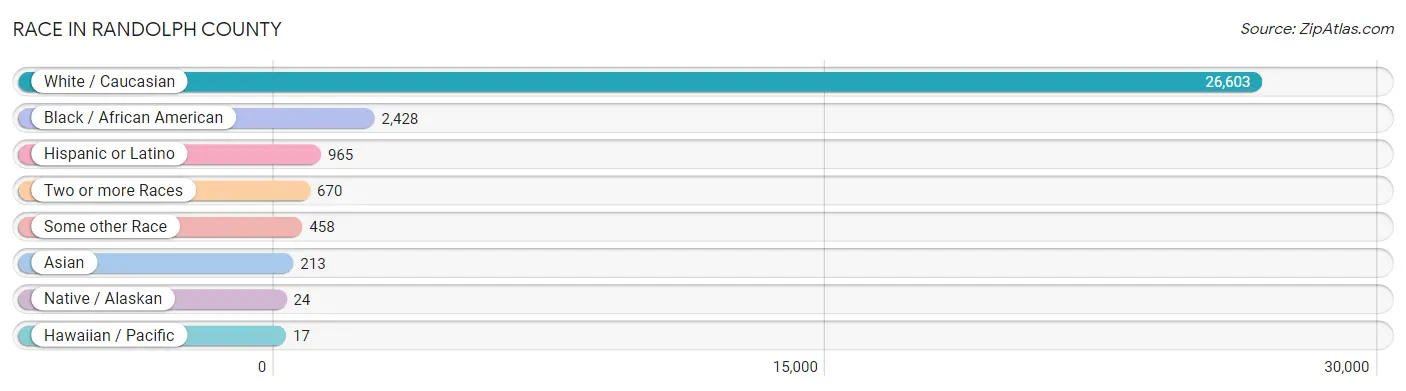
| Race | # Population | % Population |
| Asian | 213 | 0.7% |
| Black / African American | 2,428 | 8.0% |
| Hawaiian / Pacific | 17 | 0.1% |
| Hispanic or Latino | 965 | 3.2% |
| Native / Alaskan | 24 | 0.1% |
| White / Caucasian | 26,603 | 87.5% |
| Two or more Races | 670 | 2.2% |
| Some other Race | 458 | 1.5% |
| Total | 30,413 | 100.0% |
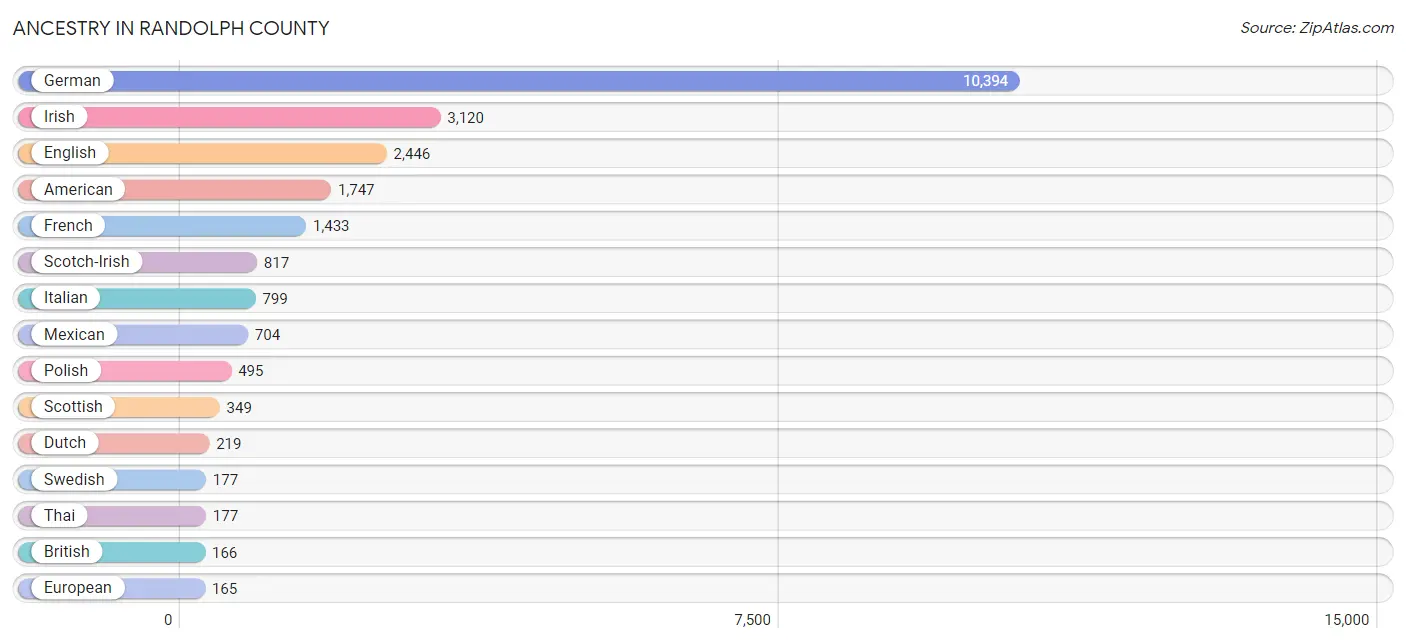
Ancestry in Randolph County
The most populous ancestries reported in Randolph County are German (10,394 | 34.2%), Irish (3,120 | 10.3%), English (2,446 | 8.0%), American (1,747 | 5.7%), and French (1,433 | 4.7%), together accounting for 62.9% of all Randolph County residents.
| Ancestry | # Population | % Population |
| African | 17 | 0.1% |
| Alsatian | 14 | 0.1% |
| American | 1,747 | 5.7% |
| Arab | 52 | 0.2% |
| Austrian | 9 | 0.0% |
| Belgian | 16 | 0.1% |
| Bhutanese | 17 | 0.1% |
| Blackfeet | 1 | 0.0% |
| British | 166 | 0.5% |
| Bulgarian | 8 | 0.0% |
| Cajun | 9 | 0.0% |
| Canadian | 3 | 0.0% |
| Central American | 116 | 0.4% |
| Central American Indian | 3 | 0.0% |
| Cherokee | 101 | 0.3% |
| Choctaw | 2 | 0.0% |
| Croatian | 1 | 0.0% |
| Cuban | 54 | 0.2% |
| Czech | 46 | 0.2% |
| Czechoslovakian | 16 | 0.1% |
| Danish | 16 | 0.1% |
| Dutch | 219 | 0.7% |
| Eastern European | 10 | 0.0% |
| English | 2,446 | 8.0% |
| European | 165 | 0.5% |
| French | 1,433 | 4.7% |
| French Canadian | 57 | 0.2% |
| German | 10,394 | 34.2% |
| Greek | 26 | 0.1% |
| Guatemalan | 81 | 0.3% |
| Guyanese | 6 | 0.0% |
| Honduran | 25 | 0.1% |
| Hungarian | 37 | 0.1% |
| Iraqi | 9 | 0.0% |
| Irish | 3,120 | 10.3% |
| Italian | 799 | 2.6% |
| Korean | 15 | 0.1% |
| Lebanese | 34 | 0.1% |
| Lithuanian | 33 | 0.1% |
| Macedonian | 4 | 0.0% |
| Mexican | 704 | 2.3% |
| Native Hawaiian | 15 | 0.1% |
| Northern European | 7 | 0.0% |
| Norwegian | 88 | 0.3% |
| Polish | 495 | 1.6% |
| Portuguese | 20 | 0.1% |
| Puerto Rican | 55 | 0.2% |
| Romanian | 9 | 0.0% |
| Russian | 65 | 0.2% |
| Salvadoran | 10 | 0.0% |
| Scandinavian | 2 | 0.0% |
| Scotch-Irish | 817 | 2.7% |
| Scottish | 349 | 1.1% |
| Sioux | 8 | 0.0% |
| Slovak | 27 | 0.1% |
| Spanish | 15 | 0.1% |
| Spanish American Indian | 6 | 0.0% |
| Subsaharan African | 19 | 0.1% |
| Swedish | 177 | 0.6% |
| Swiss | 33 | 0.1% |
| Thai | 177 | 0.6% |
| Ukrainian | 2 | 0.0% |
| Welsh | 164 | 0.5% | View All 63 Rows |
Immigrants in Randolph County
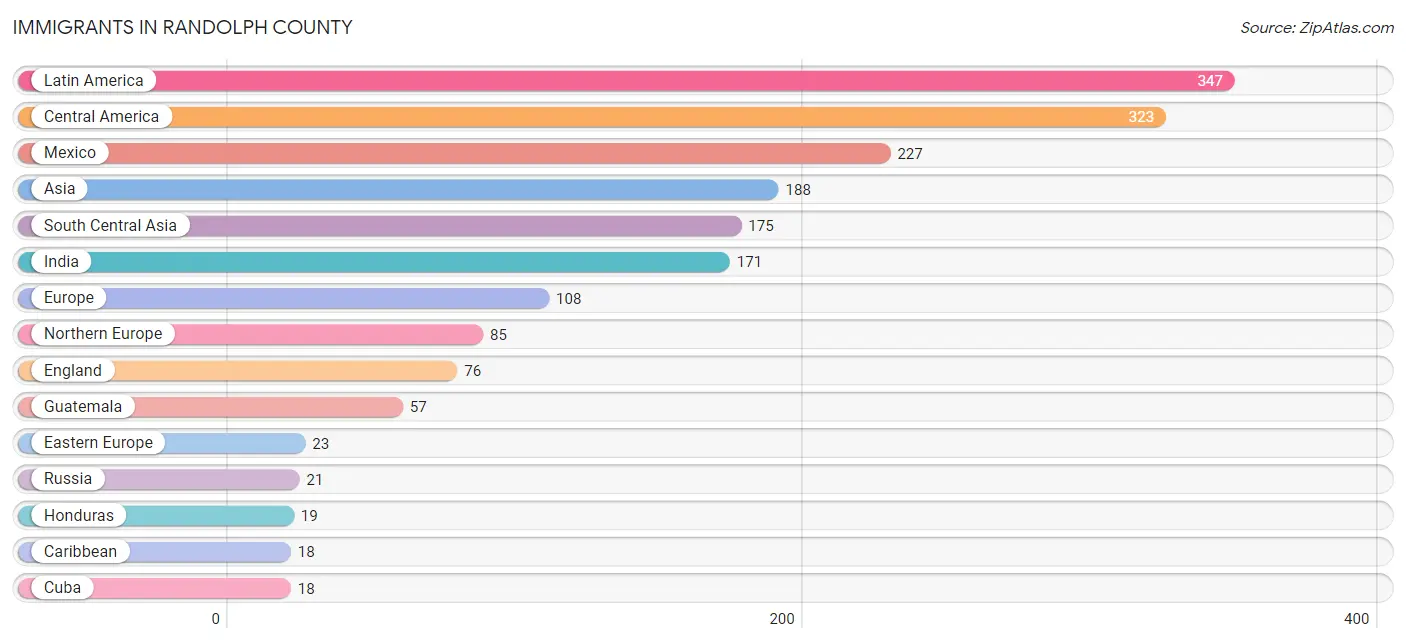
The most numerous immigrant groups reported in Randolph County came from Latin America (347 | 1.1%), Central America (323 | 1.1%), Mexico (227 | 0.7%), Asia (188 | 0.6%), and South Central Asia (175 | 0.6%), together accounting for 4.1% of all Randolph County residents.
| Immigration Origin | # Population | % Population |
| Africa | 2 | 0.0% |
| Asia | 188 | 0.6% |
| Caribbean | 18 | 0.1% |
| Central America | 323 | 1.1% |
| Cuba | 18 | 0.1% |
| Eastern Africa | 2 | 0.0% |
| Eastern Europe | 23 | 0.1% |
| El Salvador | 10 | 0.0% |
| England | 76 | 0.3% |
| Europe | 108 | 0.4% |
| Guatemala | 57 | 0.2% |
| Guyana | 6 | 0.0% |
| Honduras | 19 | 0.1% |
| India | 171 | 0.6% |
| Iraq | 6 | 0.0% |
| Latin America | 347 | 1.1% |
| Mexico | 227 | 0.7% |
| Northern Europe | 85 | 0.3% |
| Pakistan | 4 | 0.0% |
| Panama | 10 | 0.0% |
| Philippines | 7 | 0.0% |
| Poland | 2 | 0.0% |
| Russia | 21 | 0.1% |
| South America | 6 | 0.0% |
| South Central Asia | 175 | 0.6% |
| South Eastern Asia | 7 | 0.0% |
| Western Asia | 6 | 0.0% | View All 27 Rows |
Sex and Age in Randolph County
Sex and Age in Randolph County
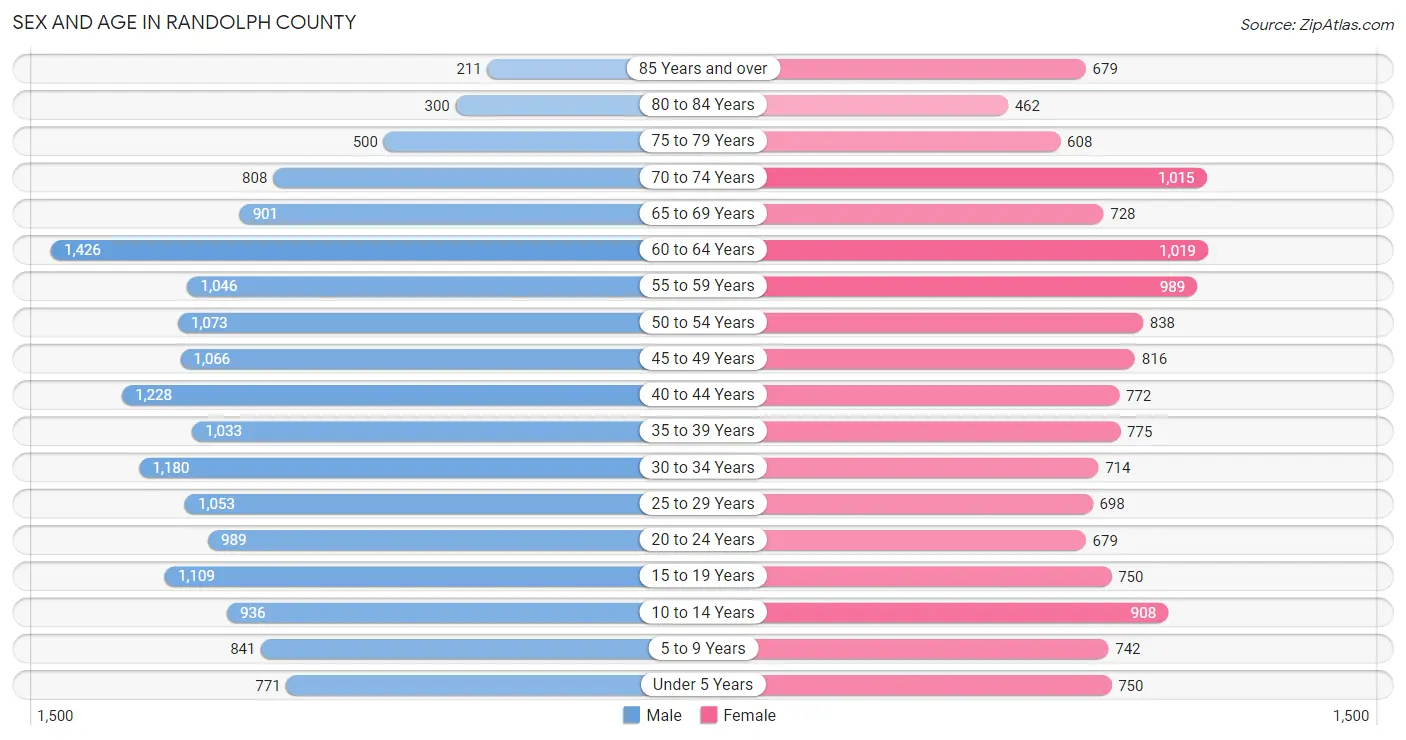
The most populous age groups in Randolph County are 60 to 64 Years (1,426 | 8.7%) for men and 60 to 64 Years (1,019 | 7.3%) for women.
| Age Bracket | Male | Female |
| Under 5 Years | 771 (4.7%) | 750 (5.4%) |
| 5 to 9 Years | 841 (5.1%) | 742 (5.3%) |
| 10 to 14 Years | 936 (5.7%) | 908 (6.5%) |
| 15 to 19 Years | 1,109 (6.7%) | 750 (5.4%) |
| 20 to 24 Years | 989 (6.0%) | 679 (4.9%) |
| 25 to 29 Years | 1,053 (6.4%) | 698 (5.0%) |
| 30 to 34 Years | 1,180 (7.2%) | 714 (5.1%) |
| 35 to 39 Years | 1,033 (6.3%) | 775 (5.6%) |
| 40 to 44 Years | 1,228 (7.5%) | 772 (5.5%) |
| 45 to 49 Years | 1,066 (6.5%) | 816 (5.9%) |
| 50 to 54 Years | 1,073 (6.5%) | 838 (6.0%) |
| 55 to 59 Years | 1,046 (6.4%) | 989 (7.1%) |
| 60 to 64 Years | 1,426 (8.7%) | 1,019 (7.3%) |
| 65 to 69 Years | 901 (5.5%) | 728 (5.2%) |
| 70 to 74 Years | 808 (4.9%) | 1,015 (7.3%) |
| 75 to 79 Years | 500 (3.0%) | 608 (4.4%) |
| 80 to 84 Years | 300 (1.8%) | 462 (3.3%) |
| 85 Years and over | 211 (1.3%) | 679 (4.9%) |
| Total | 16,471 (100.0%) | 13,942 (100.0%) |
Families and Households in Randolph County
Median Family Size in Randolph County
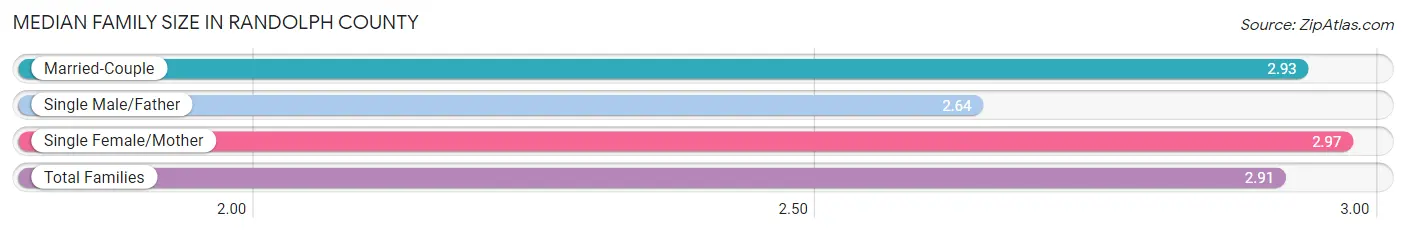
The median family size in Randolph County is 2.91 persons per family, with single female/mother families (1,272 | 16.9%) accounting for the largest median family size of 2.97 persons per family. On the other hand, single male/father families (727 | 9.6%) represent the smallest median family size with 2.64 persons per family.
| Family Type | # Families | Family Size |
| Married-Couple | 5,548 (73.5%) | 2.93 |
| Single Male/Father | 727 (9.6%) | 2.64 |
| Single Female/Mother | 1,272 (16.9%) | 2.97 |
| Total Families | 7,547 (100.0%) | 2.91 |
Median Household Size in Randolph County
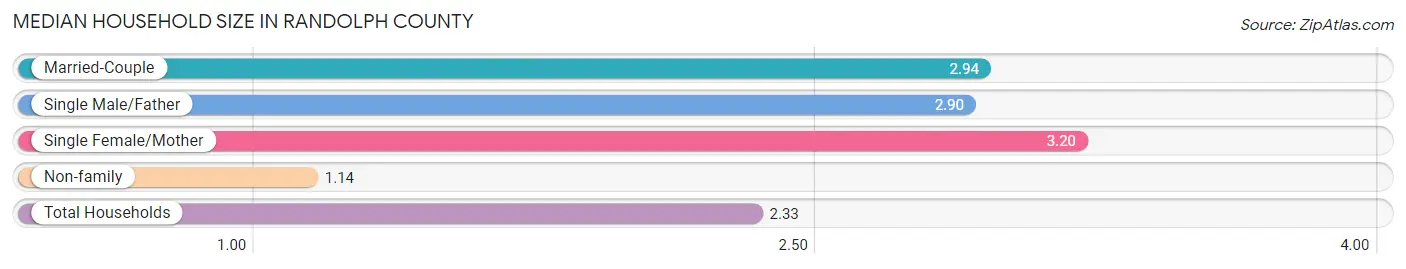
The median household size in Randolph County is 2.33 persons per household, with single female/mother households (1,272 | 10.9%) accounting for the largest median household size of 3.2 persons per household. non-family households (4,103 | 35.2%) represent the smallest median household size with 1.14 persons per household.
| Household Type | # Households | Household Size |
| Married-Couple | 5,548 (47.6%) | 2.94 |
| Single Male/Father | 727 (6.2%) | 2.90 |
| Single Female/Mother | 1,272 (10.9%) | 3.20 |
| Non-family | 4,103 (35.2%) | 1.14 |
| Total Households | 11,650 (100.0%) | 2.33 |
Household Size by Marriage Status in Randolph County
Out of a total of 11,650 households in Randolph County, 7,547 (64.8%) are family households, while 4,103 (35.2%) are nonfamily households. The most numerous type of family households are 2-person households, comprising 3,917, and the most common type of nonfamily households are 1-person households, comprising 3,565.
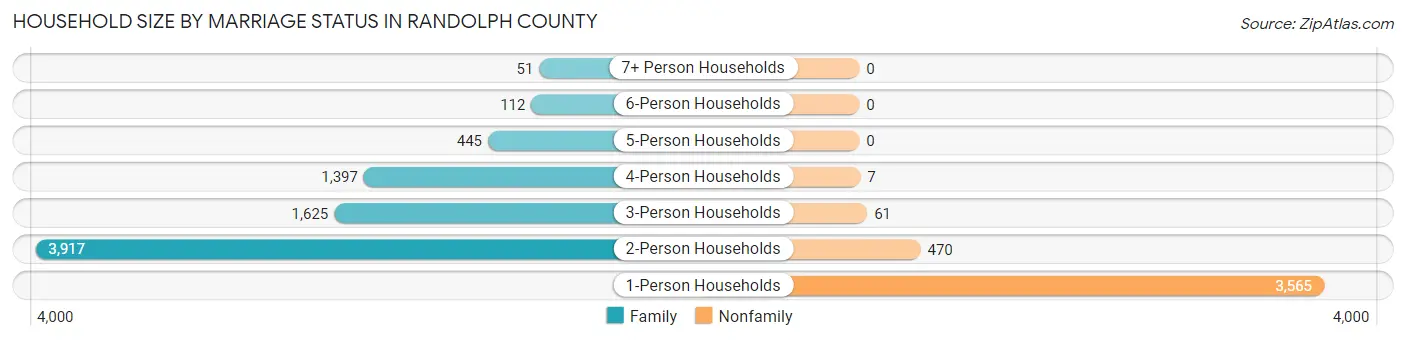
| Household Size | Family Households | Nonfamily Households |
| 1-Person Households | - | 3,565 (30.6%) |
| 2-Person Households | 3,917 (33.6%) | 470 (4.0%) |
| 3-Person Households | 1,625 (14.0%) | 61 (0.5%) |
| 4-Person Households | 1,397 (12.0%) | 7 (0.1%) |
| 5-Person Households | 445 (3.8%) | 0 (0.0%) |
| 6-Person Households | 112 (1.0%) | 0 (0.0%) |
| 7+ Person Households | 51 (0.4%) | 0 (0.0%) |
| Total | 7,547 (64.8%) | 4,103 (35.2%) |
Female Fertility in Randolph County
Fertility by Age in Randolph County
Average fertility rate in Randolph County is 70.0 births per 1,000 women. Women in the age bracket of 20 to 34 years have the highest fertility rate with 138.0 births per 1,000 women. Women in the age bracket of 20 to 34 years acount for 76.2% of all women with births.
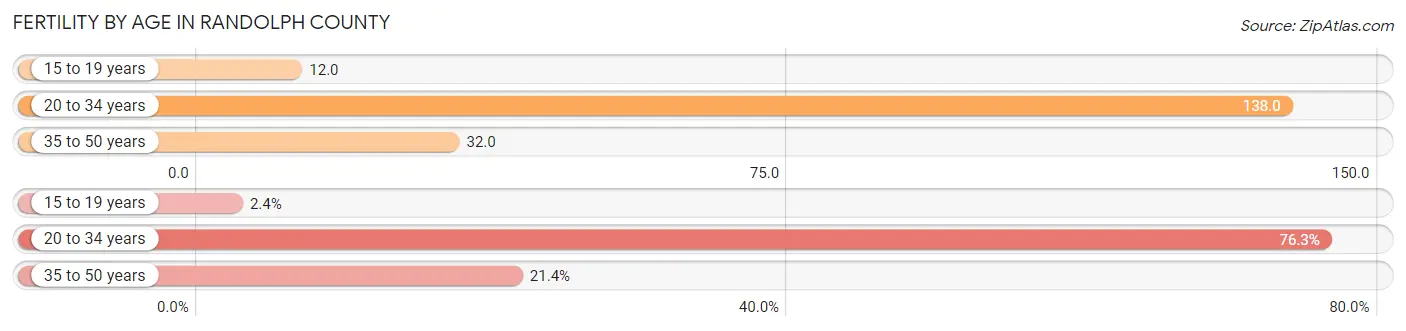
| Age Bracket | Women with Births | Births / 1,000 Women |
| 15 to 19 years | 9 (2.4%) | 12.0 |
| 20 to 34 years | 289 (76.2%) | 138.0 |
| 35 to 50 years | 81 (21.4%) | 32.0 |
| Total | 379 (100.0%) | 70.0 |
Fertility by Age by Marriage Status in Randolph County
72.0% of women with births (379) in Randolph County are married. The highest percentage of unmarried women with births falls into 20 to 34 years age bracket with 35.6% of them unmarried at the time of birth, while the lowest percentage of unmarried women with births belong to 35 to 50 years age bracket with 0.0% of them unmarried.
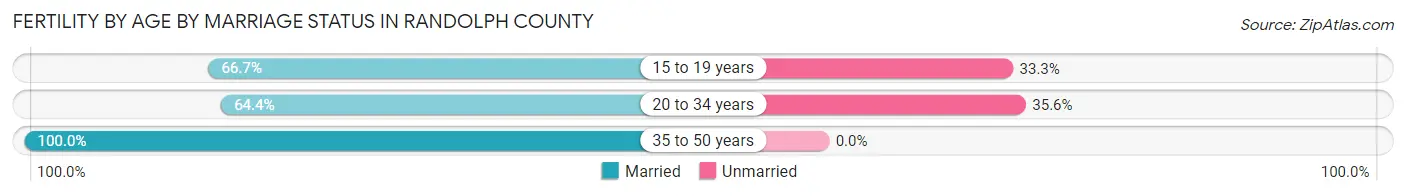
| Age Bracket | Married | Unmarried |
| 15 to 19 years | 6 (66.7%) | 3 (33.3%) |
| 20 to 34 years | 186 (64.4%) | 103 (35.6%) |
| 35 to 50 years | 81 (100.0%) | 0 (0.0%) |
| Total | 273 (72.0%) | 106 (28.0%) |
Fertility by Education in Randolph County
Average fertility rate in Randolph County is 70.0 births per 1,000 women. Women with the education attainment of high school diploma have the highest fertility rate of 135.0 births per 1,000 women, while women with the education attainment of graduate degree have the lowest fertility at 17.0 births per 1,000 women. Women with the education attainment of high school diploma represent 44.3% of all women with births.
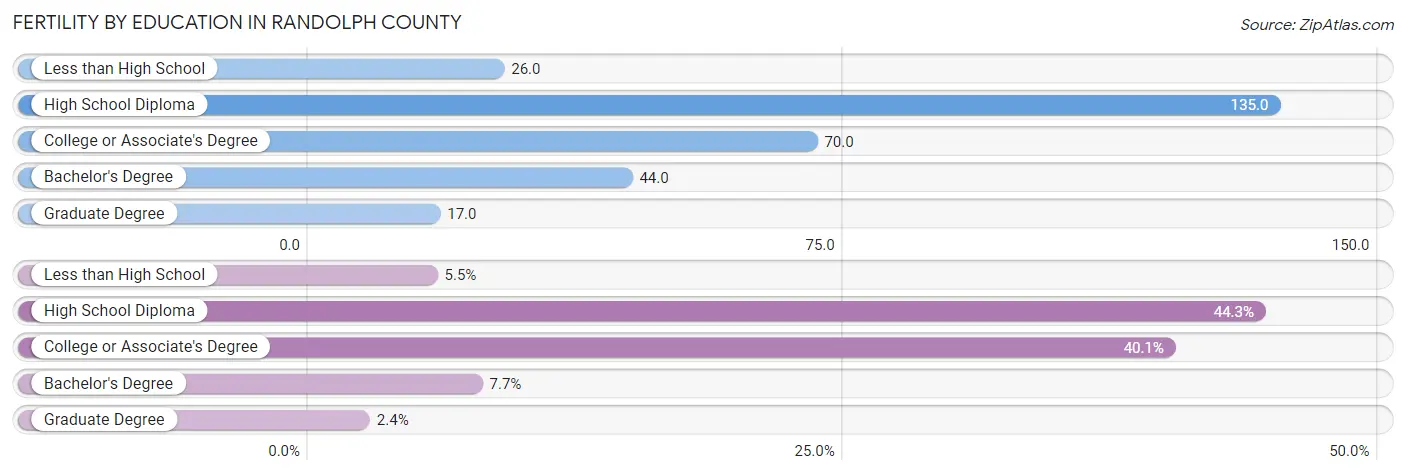
| Educational Attainment | Women with Births | Births / 1,000 Women |
| Less than High School | 21 (5.5%) | 26.0 |
| High School Diploma | 168 (44.3%) | 135.0 |
| College or Associate's Degree | 152 (40.1%) | 70.0 |
| Bachelor's Degree | 29 (7.6%) | 44.0 |
| Graduate Degree | 9 (2.4%) | 17.0 |
| Total | 379 (100.0%) | 70.0 |
Fertility by Education by Marriage Status in Randolph County
28.0% of women with births in Randolph County are unmarried. Women with the educational attainment of bachelor's degree are most likely to be married with 100.0% of them married at childbirth, while women with the educational attainment of college or associate's degree are least likely to be married with 32.9% of them unmarried at childbirth.
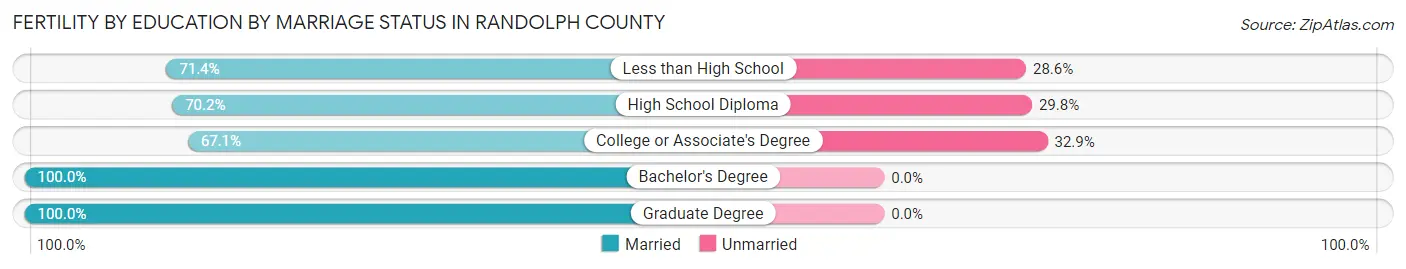
| Educational Attainment | Married | Unmarried |
| Less than High School | 15 (71.4%) | 6 (28.6%) |
| High School Diploma | 118 (70.2%) | 50 (29.8%) |
| College or Associate's Degree | 102 (67.1%) | 50 (32.9%) |
| Bachelor's Degree | 29 (100.0%) | 0 (0.0%) |
| Graduate Degree | 9 (100.0%) | 0 (0.0%) |
| Total | 273 (72.0%) | 106 (28.0%) |
Employment Characteristics in Randolph County
Employment by Class of Employer in Randolph County
Among the 12,228 employed individuals in Randolph County, private company employees (7,716 | 63.1%), state government employees (1,388 | 11.4%), and local government employees (1,045 | 8.6%) make up the most common classes of employment.
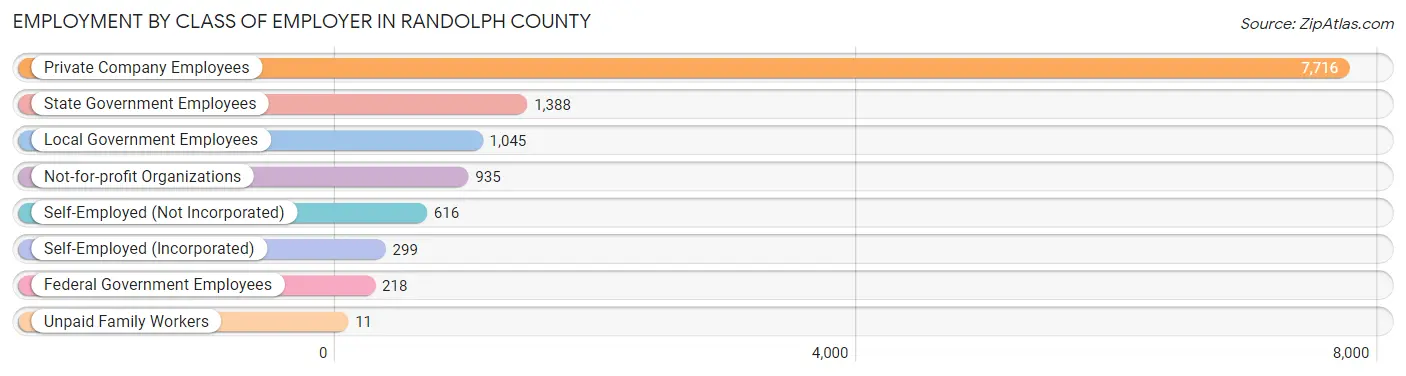
| Employer Class | # Employees | % Employees |
| Private Company Employees | 7,716 | 63.1% |
| Self-Employed (Incorporated) | 299 | 2.5% |
| Self-Employed (Not Incorporated) | 616 | 5.0% |
| Not-for-profit Organizations | 935 | 7.6% |
| Local Government Employees | 1,045 | 8.6% |
| State Government Employees | 1,388 | 11.4% |
| Federal Government Employees | 218 | 1.8% |
| Unpaid Family Workers | 11 | 0.1% |
| Total | 12,228 | 100.0% |
Employment Status by Age in Randolph County
According to the labor force statistics for Randolph County, out of the total population over 16 years of age (25,155), 52.9% or 13,307 individuals are in the labor force, with 5.2% or 692 of them unemployed. The age group with the highest labor force participation rate is 35 to 44 years, with 74.4% or 2,833 individuals in the labor force. Within the labor force, the 20 to 24 years age range has the highest percentage of unemployed individuals, with 11.9% or 140 of them being unemployed.
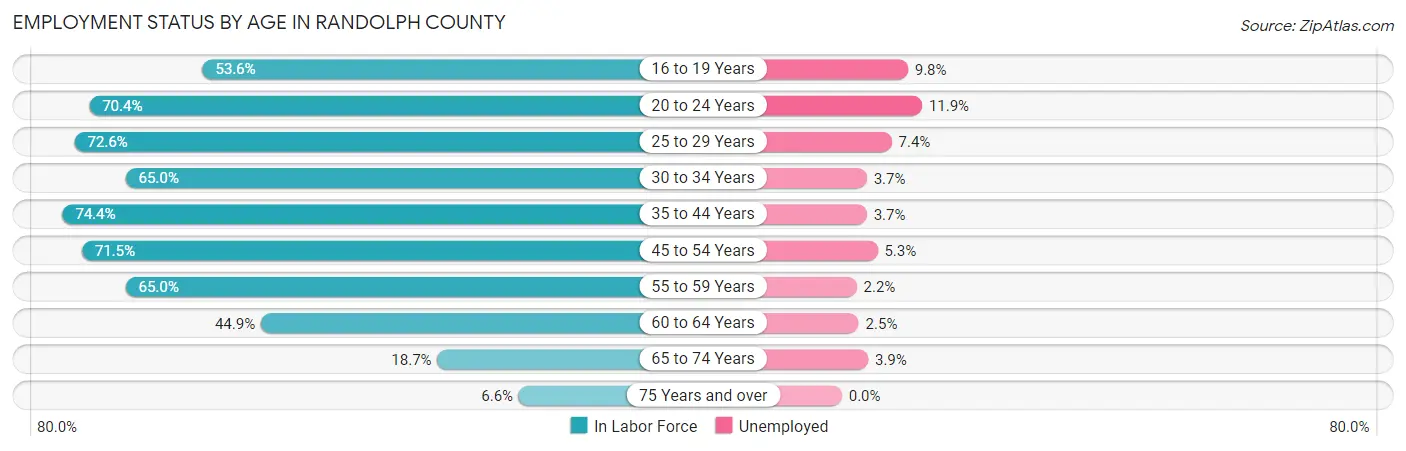
| Age Bracket | In Labor Force | Unemployed |
| 16 to 19 Years | 830 (53.6%) | 81 (9.8%) |
| 20 to 24 Years | 1,174 (70.4%) | 140 (11.9%) |
| 25 to 29 Years | 1,271 (72.6%) | 94 (7.4%) |
| 30 to 34 Years | 1,231 (65.0%) | 46 (3.7%) |
| 35 to 44 Years | 2,833 (74.4%) | 105 (3.7%) |
| 45 to 54 Years | 2,712 (71.5%) | 144 (5.3%) |
| 55 to 59 Years | 1,323 (65.0%) | 29 (2.2%) |
| 60 to 64 Years | 1,098 (44.9%) | 27 (2.5%) |
| 65 to 74 Years | 646 (18.7%) | 25 (3.9%) |
| 75 Years and over | 182 (6.6%) | 0 (0.0%) |
| Total | 13,307 (52.9%) | 692 (5.2%) |
Employment Status by Educational Attainment in Randolph County
According to labor force statistics for Randolph County, 66.6% of individuals (10,474) out of the total population between 25 and 64 years of age (15,726) are in the labor force, with 4.3% or 450 of them being unemployed. The group with the highest labor force participation rate are those with the educational attainment of bachelor's degree or higher, with 90.5% or 1,885 individuals in the labor force. Within the labor force, individuals with less than high school education have the highest percentage of unemployment, with 13.0% or 74 of them being unemployed.
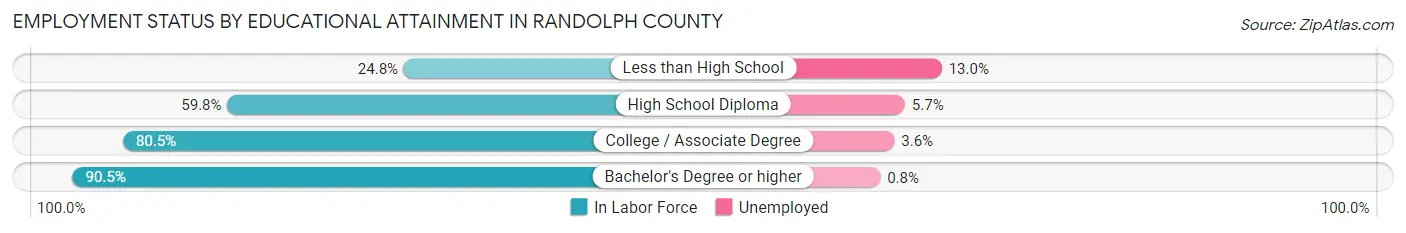
| Educational Attainment | In Labor Force | Unemployed |
| Less than High School | 572 (24.8%) | 300 (13.0%) |
| High School Diploma | 3,229 (59.8%) | 308 (5.7%) |
| College / Associate Degree | 4,780 (80.5%) | 214 (3.6%) |
| Bachelor's Degree or higher | 1,885 (90.5%) | 17 (0.8%) |
| Total | 10,474 (66.6%) | 676 (4.3%) |
Employment Occupations by Sex in Randolph County
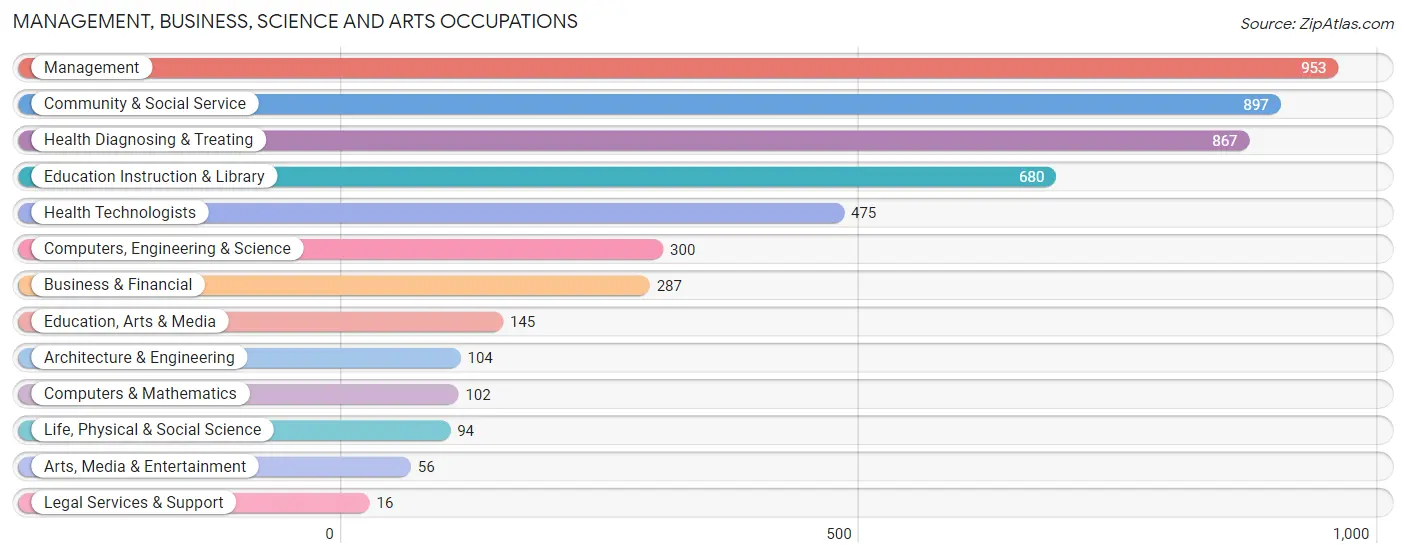
Management, Business, Science and Arts Occupations
The most common Management, Business, Science and Arts occupations in Randolph County are Management (953 | 7.6%), Community & Social Service (897 | 7.1%), Health Diagnosing & Treating (867 | 6.9%), Education Instruction & Library (680 | 5.4%), and Health Technologists (475 | 3.8%).
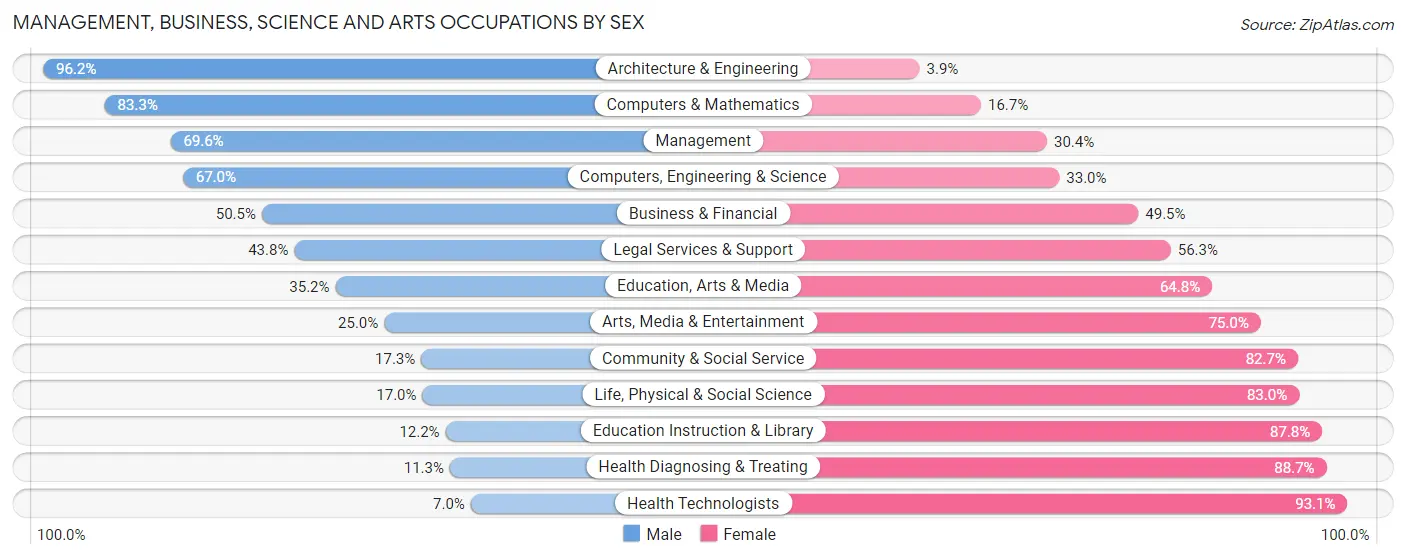
Management, Business, Science and Arts Occupations by Sex
Within the Management, Business, Science and Arts occupations in Randolph County, the most male-oriented occupations are Architecture & Engineering (96.2%), Computers & Mathematics (83.3%), and Management (69.6%), while the most female-oriented occupations are Health Technologists (93.0%), Health Diagnosing & Treating (88.7%), and Education Instruction & Library (87.8%).
| Occupation | Male | Female |
| Management | 663 (69.6%) | 290 (30.4%) |
| Business & Financial | 145 (50.5%) | 142 (49.5%) |
| Computers, Engineering & Science | 201 (67.0%) | 99 (33.0%) |
| Computers & Mathematics | 85 (83.3%) | 17 (16.7%) |
| Architecture & Engineering | 100 (96.2%) | 4 (3.8%) |
| Life, Physical & Social Science | 16 (17.0%) | 78 (83.0%) |
| Community & Social Service | 155 (17.3%) | 742 (82.7%) |
| Education, Arts & Media | 51 (35.2%) | 94 (64.8%) |
| Legal Services & Support | 7 (43.8%) | 9 (56.2%) |
| Education Instruction & Library | 83 (12.2%) | 597 (87.8%) |
| Arts, Media & Entertainment | 14 (25.0%) | 42 (75.0%) |
| Health Diagnosing & Treating | 98 (11.3%) | 769 (88.7%) |
| Health Technologists | 33 (7.0%) | 442 (93.0%) |
| Total (Category) | 1,262 (38.2%) | 2,042 (61.8%) |
| Total (Overall) | 6,581 (52.3%) | 5,989 (47.6%) |
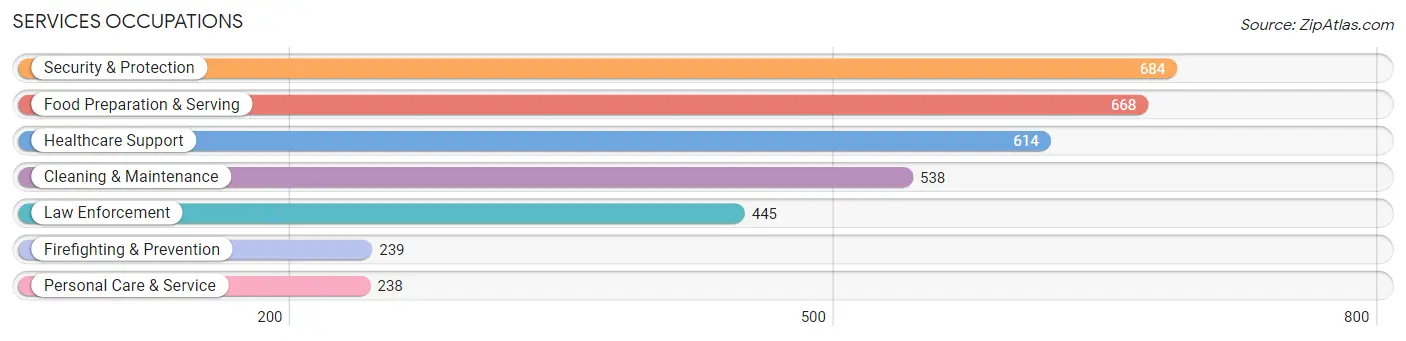
Services Occupations
The most common Services occupations in Randolph County are Security & Protection (684 | 5.4%), Food Preparation & Serving (668 | 5.3%), Healthcare Support (614 | 4.9%), Cleaning & Maintenance (538 | 4.3%), and Law Enforcement (445 | 3.5%).
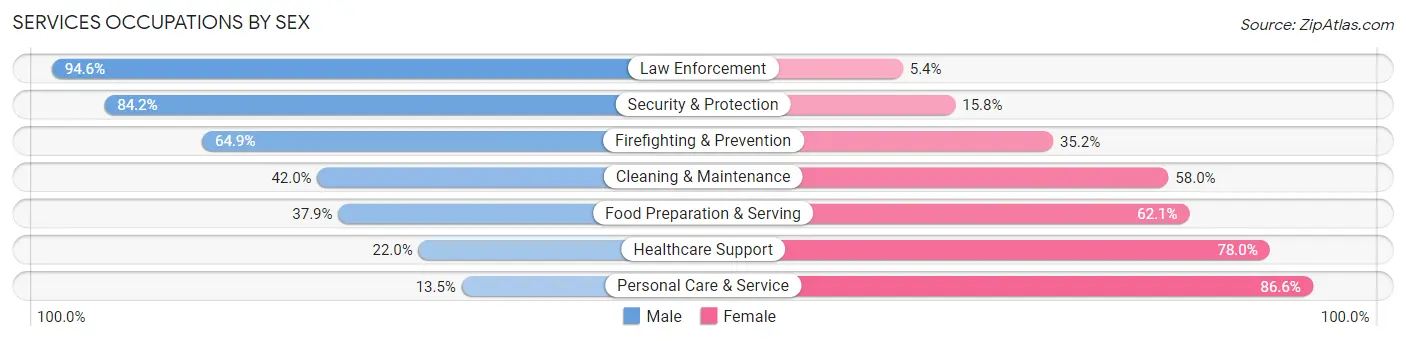
Services Occupations by Sex
Within the Services occupations in Randolph County, the most male-oriented occupations are Law Enforcement (94.6%), Security & Protection (84.2%), and Firefighting & Prevention (64.8%), while the most female-oriented occupations are Personal Care & Service (86.6%), Healthcare Support (78.0%), and Food Preparation & Serving (62.1%).
| Occupation | Male | Female |
| Healthcare Support | 135 (22.0%) | 479 (78.0%) |
| Security & Protection | 576 (84.2%) | 108 (15.8%) |
| Firefighting & Prevention | 155 (64.8%) | 84 (35.1%) |
| Law Enforcement | 421 (94.6%) | 24 (5.4%) |
| Food Preparation & Serving | 253 (37.9%) | 415 (62.1%) |
| Cleaning & Maintenance | 226 (42.0%) | 312 (58.0%) |
| Personal Care & Service | 32 (13.5%) | 206 (86.6%) |
| Total (Category) | 1,222 (44.6%) | 1,520 (55.4%) |
| Total (Overall) | 6,581 (52.3%) | 5,989 (47.6%) |
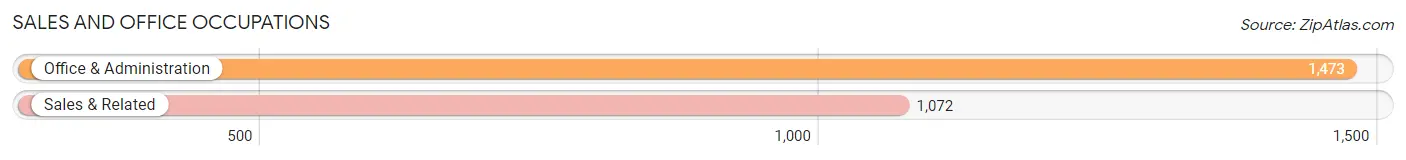
Sales and Office Occupations
The most common Sales and Office occupations in Randolph County are Office & Administration (1,473 | 11.7%), and Sales & Related (1,072 | 8.5%).
Sales and Office Occupations by Sex
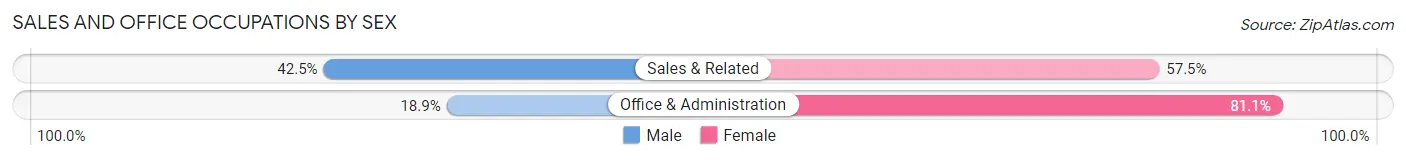
| Occupation | Male | Female |
| Sales & Related | 456 (42.5%) | 616 (57.5%) |
| Office & Administration | 278 (18.9%) | 1,195 (81.1%) |
| Total (Category) | 734 (28.8%) | 1,811 (71.2%) |
| Total (Overall) | 6,581 (52.3%) | 5,989 (47.6%) |
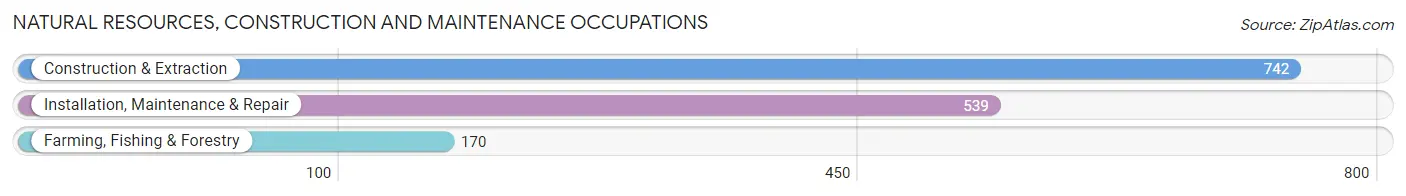
Natural Resources, Construction and Maintenance Occupations
The most common Natural Resources, Construction and Maintenance occupations in Randolph County are Construction & Extraction (742 | 5.9%), Installation, Maintenance & Repair (539 | 4.3%), and Farming, Fishing & Forestry (170 | 1.3%).
Natural Resources, Construction and Maintenance Occupations by Sex
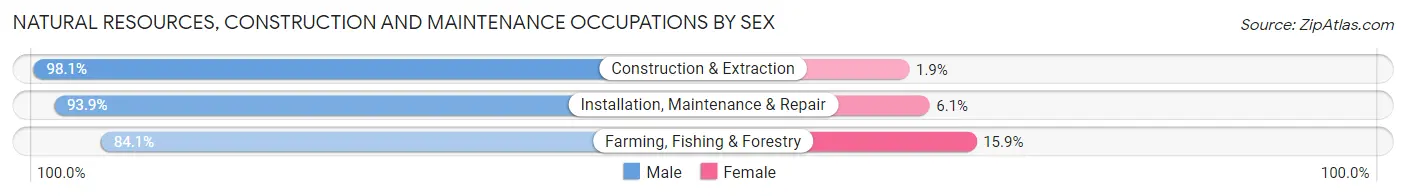
| Occupation | Male | Female |
| Farming, Fishing & Forestry | 143 (84.1%) | 27 (15.9%) |
| Construction & Extraction | 728 (98.1%) | 14 (1.9%) |
| Installation, Maintenance & Repair | 506 (93.9%) | 33 (6.1%) |
| Total (Category) | 1,377 (94.9%) | 74 (5.1%) |
| Total (Overall) | 6,581 (52.3%) | 5,989 (47.6%) |
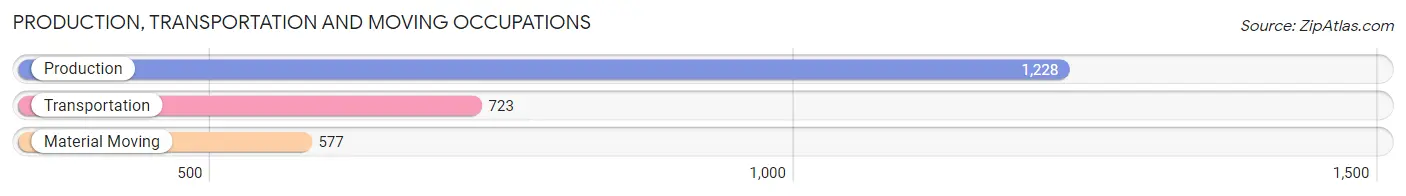
Production, Transportation and Moving Occupations
The most common Production, Transportation and Moving occupations in Randolph County are Production (1,228 | 9.8%), Transportation (723 | 5.8%), and Material Moving (577 | 4.6%).
Production, Transportation and Moving Occupations by Sex
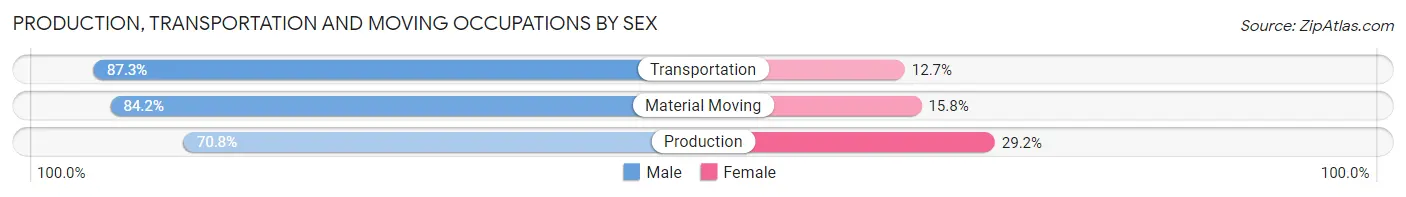
| Occupation | Male | Female |
| Production | 869 (70.8%) | 359 (29.2%) |
| Transportation | 631 (87.3%) | 92 (12.7%) |
| Material Moving | 486 (84.2%) | 91 (15.8%) |
| Total (Category) | 1,986 (78.6%) | 542 (21.4%) |
| Total (Overall) | 6,581 (52.3%) | 5,989 (47.6%) |
Employment Industries by Sex in Randolph County
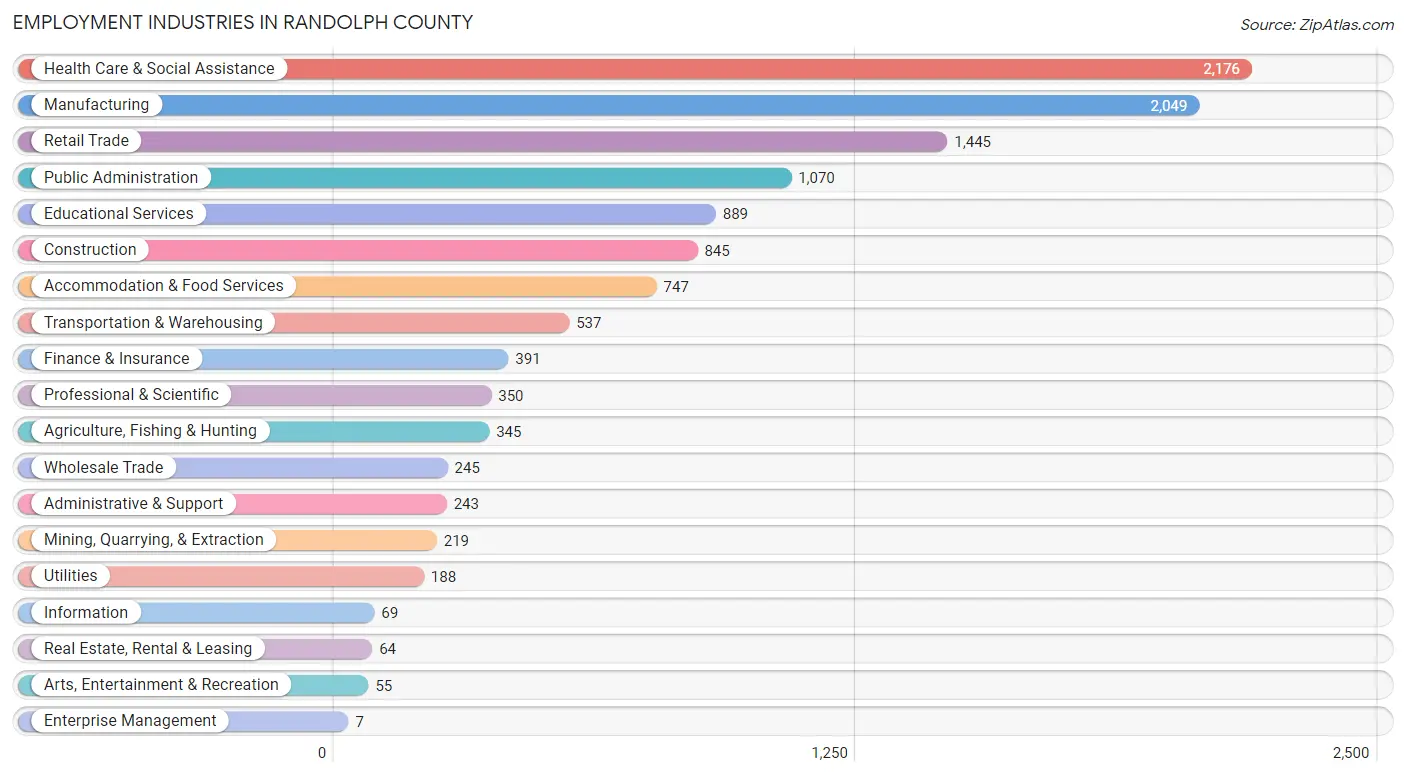
Employment Industries in Randolph County
The major employment industries in Randolph County include Health Care & Social Assistance (2,176 | 17.3%), Manufacturing (2,049 | 16.3%), Retail Trade (1,445 | 11.5%), Public Administration (1,070 | 8.5%), and Educational Services (889 | 7.1%).
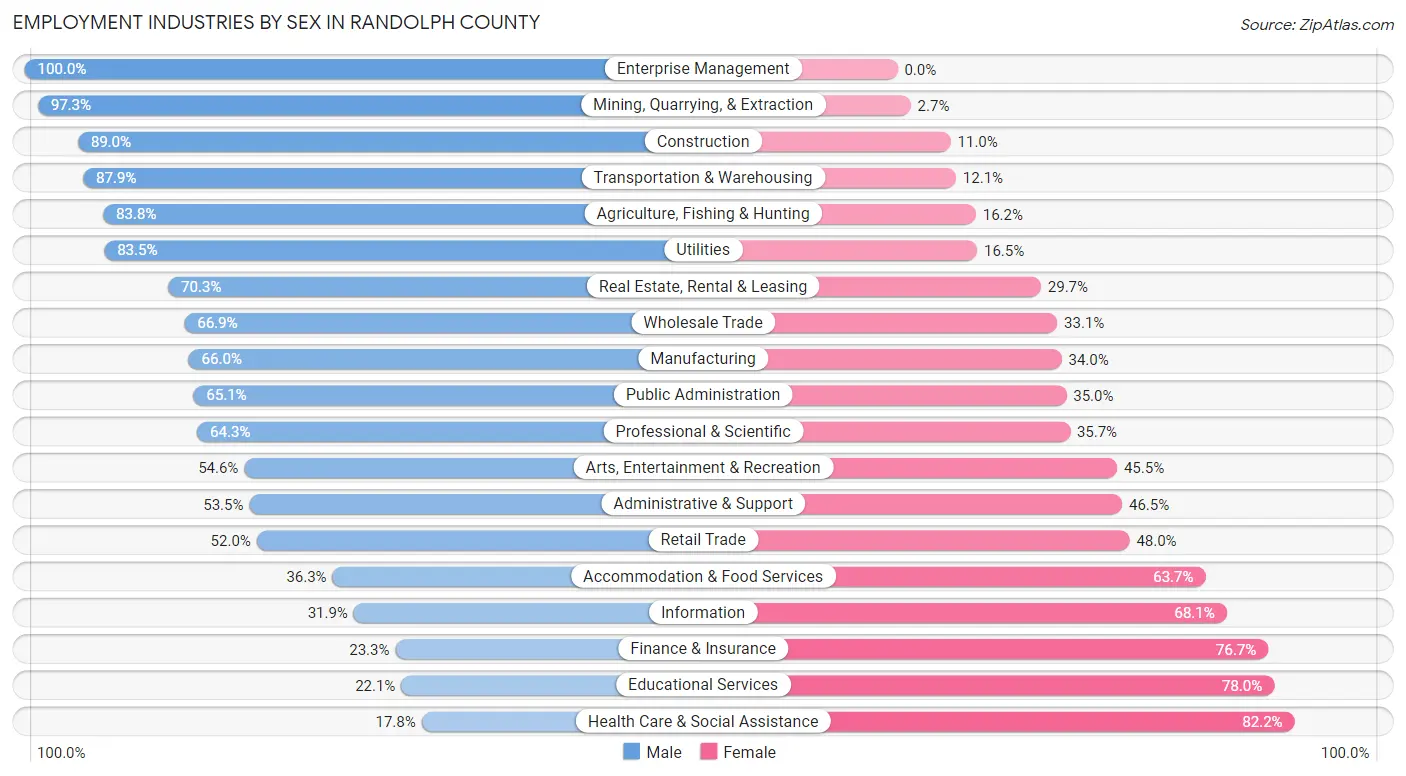
Employment Industries by Sex in Randolph County
The Randolph County industries that see more men than women are Enterprise Management (100.0%), Mining, Quarrying, & Extraction (97.3%), and Construction (89.0%), whereas the industries that tend to have a higher number of women are Health Care & Social Assistance (82.2%), Educational Services (77.9%), and Finance & Insurance (76.7%).
| Industry | Male | Female |
| Agriculture, Fishing & Hunting | 289 (83.8%) | 56 (16.2%) |
| Mining, Quarrying, & Extraction | 213 (97.3%) | 6 (2.7%) |
| Construction | 752 (89.0%) | 93 (11.0%) |
| Manufacturing | 1,353 (66.0%) | 696 (34.0%) |
| Wholesale Trade | 164 (66.9%) | 81 (33.1%) |
| Retail Trade | 751 (52.0%) | 694 (48.0%) |
| Transportation & Warehousing | 472 (87.9%) | 65 (12.1%) |
| Utilities | 157 (83.5%) | 31 (16.5%) |
| Information | 22 (31.9%) | 47 (68.1%) |
| Finance & Insurance | 91 (23.3%) | 300 (76.7%) |
| Real Estate, Rental & Leasing | 45 (70.3%) | 19 (29.7%) |
| Professional & Scientific | 225 (64.3%) | 125 (35.7%) |
| Enterprise Management | 7 (100.0%) | 0 (0.0%) |
| Administrative & Support | 130 (53.5%) | 113 (46.5%) |
| Educational Services | 196 (22.1%) | 693 (77.9%) |
| Health Care & Social Assistance | 388 (17.8%) | 1,788 (82.2%) |
| Arts, Entertainment & Recreation | 30 (54.5%) | 25 (45.5%) |
| Accommodation & Food Services | 271 (36.3%) | 476 (63.7%) |
| Public Administration | 696 (65.0%) | 374 (34.9%) |
| Total | 6,581 (52.3%) | 5,989 (47.6%) |
Education in Randolph County
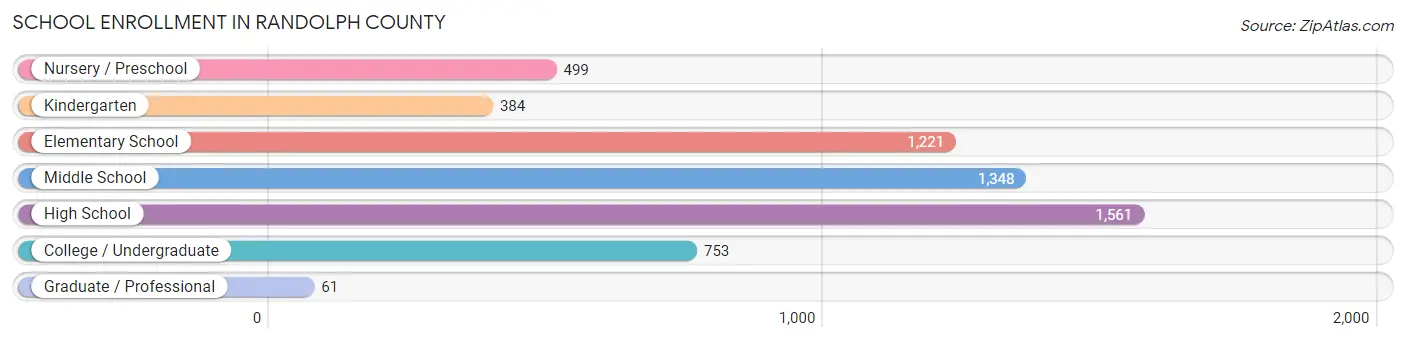
School Enrollment in Randolph County
The most common levels of schooling among the 5,827 students in Randolph County are high school (1,561 | 26.8%), middle school (1,348 | 23.1%), and elementary school (1,221 | 20.9%).
| School Level | # Students | % Students |
| Nursery / Preschool | 499 | 8.6% |
| Kindergarten | 384 | 6.6% |
| Elementary School | 1,221 | 20.9% |
| Middle School | 1,348 | 23.1% |
| High School | 1,561 | 26.8% |
| College / Undergraduate | 753 | 12.9% |
| Graduate / Professional | 61 | 1.1% |
| Total | 5,827 | 100.0% |
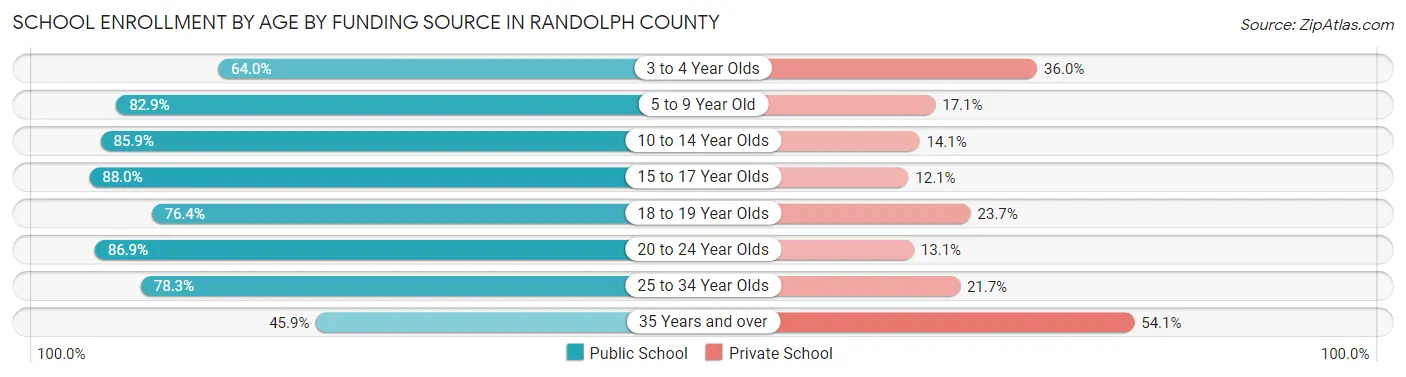
School Enrollment by Age by Funding Source in Randolph County
Out of a total of 5,827 students who are enrolled in schools in Randolph County, 1,037 (17.8%) attend a private institution, while the remaining 4,790 (82.2%) are enrolled in public schools. The age group of 35 years and over has the highest likelihood of being enrolled in private schools, with 59 (54.1% in the age bracket) enrolled. Conversely, the age group of 15 to 17 year olds has the lowest likelihood of being enrolled in a private school, with 963 (87.9% in the age bracket) attending a public institution.
| Age Bracket | Public School | Private School |
| 3 to 4 Year Olds | 268 (64.0%) | 151 (36.0%) |
| 5 to 9 Year Old | 1,249 (82.9%) | 257 (17.1%) |
| 10 to 14 Year Olds | 1,560 (85.9%) | 257 (14.1%) |
| 15 to 17 Year Olds | 963 (87.9%) | 132 (12.0%) |
| 18 to 19 Year Olds | 326 (76.3%) | 101 (23.6%) |
| 20 to 24 Year Olds | 206 (86.9%) | 31 (13.1%) |
| 25 to 34 Year Olds | 170 (78.3%) | 47 (21.7%) |
| 35 Years and over | 50 (45.9%) | 59 (54.1%) |
| Total | 4,790 (82.2%) | 1,037 (17.8%) |
Educational Attainment by Field of Study in Randolph County
Education (757 | 23.6%), science & technology (533 | 16.6%), business (502 | 15.6%), bio, nature & agricultural (242 | 7.5%), and arts & humanities (235 | 7.3%) are the most common fields of study among 3,209 individuals in Randolph County who have obtained a bachelor's degree or higher.
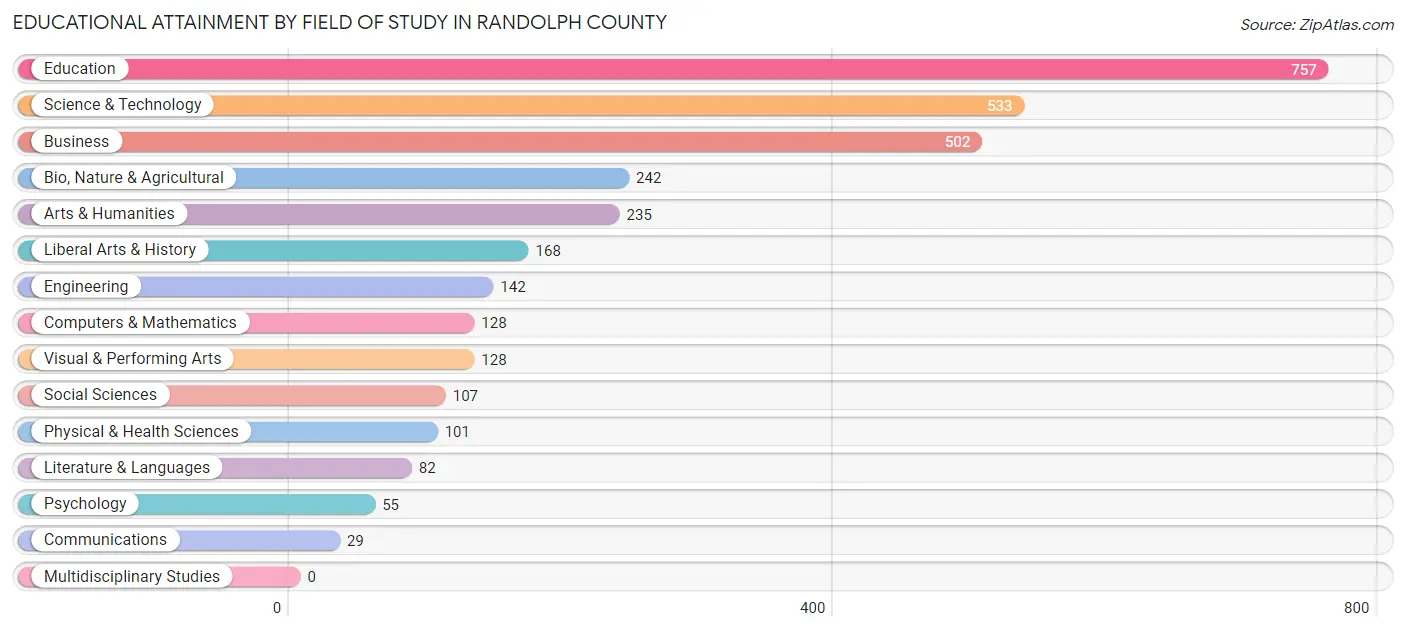
| Field of Study | # Graduates | % Graduates |
| Computers & Mathematics | 128 | 4.0% |
| Bio, Nature & Agricultural | 242 | 7.5% |
| Physical & Health Sciences | 101 | 3.2% |
| Psychology | 55 | 1.7% |
| Social Sciences | 107 | 3.3% |
| Engineering | 142 | 4.4% |
| Multidisciplinary Studies | 0 | 0.0% |
| Science & Technology | 533 | 16.6% |
| Business | 502 | 15.6% |
| Education | 757 | 23.6% |
| Literature & Languages | 82 | 2.6% |
| Liberal Arts & History | 168 | 5.2% |
| Visual & Performing Arts | 128 | 4.0% |
| Communications | 29 | 0.9% |
| Arts & Humanities | 235 | 7.3% |
| Total | 3,209 | 100.0% |
Transportation & Commute in Randolph County
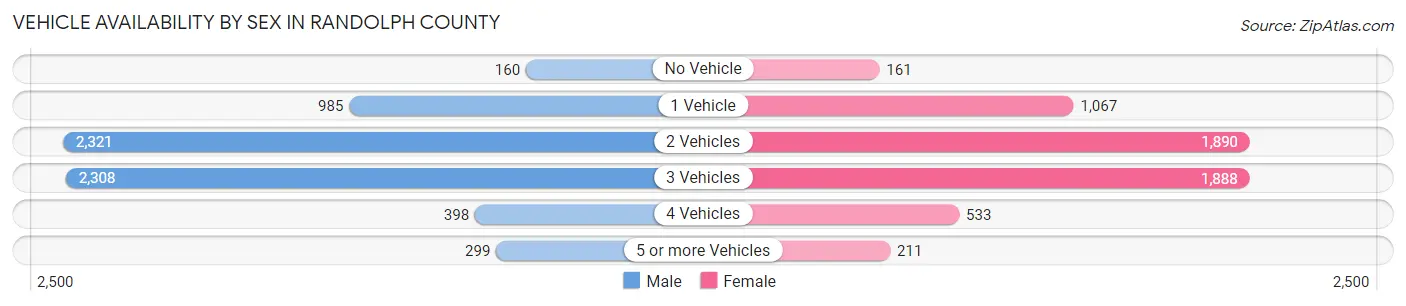
Vehicle Availability by Sex in Randolph County
The most prevalent vehicle ownership categories in Randolph County are males with 2 vehicles (2,321, accounting for 35.9%) and females with 2 vehicles (1,890, making up 40.4%).
| Vehicles Available | Male | Female |
| No Vehicle | 160 (2.5%) | 161 (2.8%) |
| 1 Vehicle | 985 (15.2%) | 1,067 (18.6%) |
| 2 Vehicles | 2,321 (35.9%) | 1,890 (32.9%) |
| 3 Vehicles | 2,308 (35.7%) | 1,888 (32.8%) |
| 4 Vehicles | 398 (6.1%) | 533 (9.3%) |
| 5 or more Vehicles | 299 (4.6%) | 211 (3.7%) |
| Total | 6,471 (100.0%) | 5,750 (100.0%) |
Commute Time in Randolph County
The most frequently occuring commute durations in Randolph County are 5 to 9 minutes (1,909 commuters, 16.2%), 15 to 19 minutes (1,510 commuters, 12.9%), and 10 to 14 minutes (1,465 commuters, 12.5%).
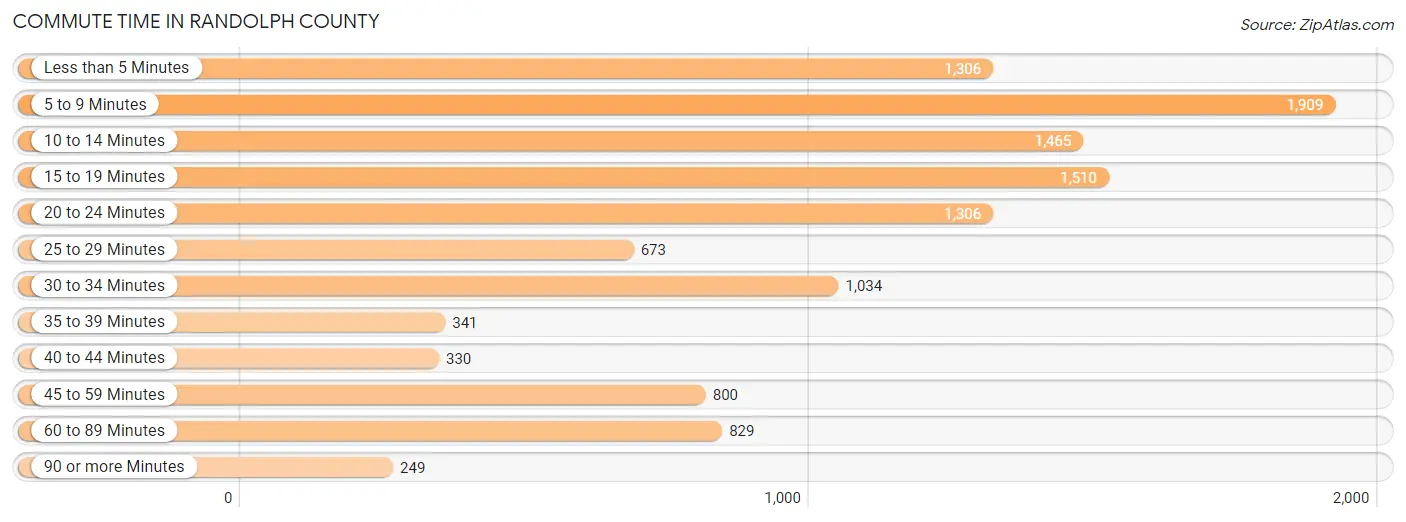
| Commute Time | # Commuters | % Commuters |
| Less than 5 Minutes | 1,306 | 11.1% |
| 5 to 9 Minutes | 1,909 | 16.2% |
| 10 to 14 Minutes | 1,465 | 12.5% |
| 15 to 19 Minutes | 1,510 | 12.9% |
| 20 to 24 Minutes | 1,306 | 11.1% |
| 25 to 29 Minutes | 673 | 5.7% |
| 30 to 34 Minutes | 1,034 | 8.8% |
| 35 to 39 Minutes | 341 | 2.9% |
| 40 to 44 Minutes | 330 | 2.8% |
| 45 to 59 Minutes | 800 | 6.8% |
| 60 to 89 Minutes | 829 | 7.0% |
| 90 or more Minutes | 249 | 2.1% |
Commute Time by Sex in Randolph County
The most common commute times in Randolph County are 5 to 9 minutes (1,062 commuters, 17.2%) for males and 5 to 9 minutes (847 commuters, 15.2%) for females.
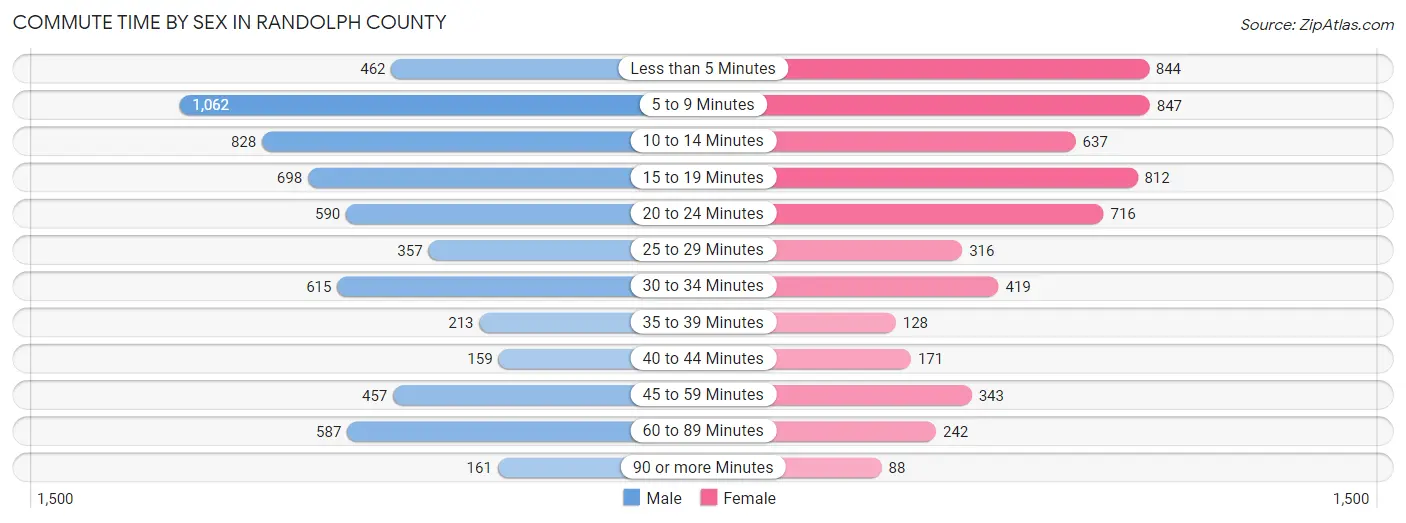
| Commute Time | Male | Female |
| Less than 5 Minutes | 462 (7.5%) | 844 (15.2%) |
| 5 to 9 Minutes | 1,062 (17.2%) | 847 (15.2%) |
| 10 to 14 Minutes | 828 (13.4%) | 637 (11.5%) |
| 15 to 19 Minutes | 698 (11.3%) | 812 (14.6%) |
| 20 to 24 Minutes | 590 (9.5%) | 716 (12.9%) |
| 25 to 29 Minutes | 357 (5.8%) | 316 (5.7%) |
| 30 to 34 Minutes | 615 (9.9%) | 419 (7.5%) |
| 35 to 39 Minutes | 213 (3.4%) | 128 (2.3%) |
| 40 to 44 Minutes | 159 (2.6%) | 171 (3.1%) |
| 45 to 59 Minutes | 457 (7.4%) | 343 (6.2%) |
| 60 to 89 Minutes | 587 (9.5%) | 242 (4.3%) |
| 90 or more Minutes | 161 (2.6%) | 88 (1.6%) |
Time of Departure to Work by Sex in Randolph County
The most frequent times of departure to work in Randolph County are 6:00 AM to 6:29 AM (896, 14.5%) for males and 7:30 AM to 7:59 AM (1,154, 20.7%) for females.
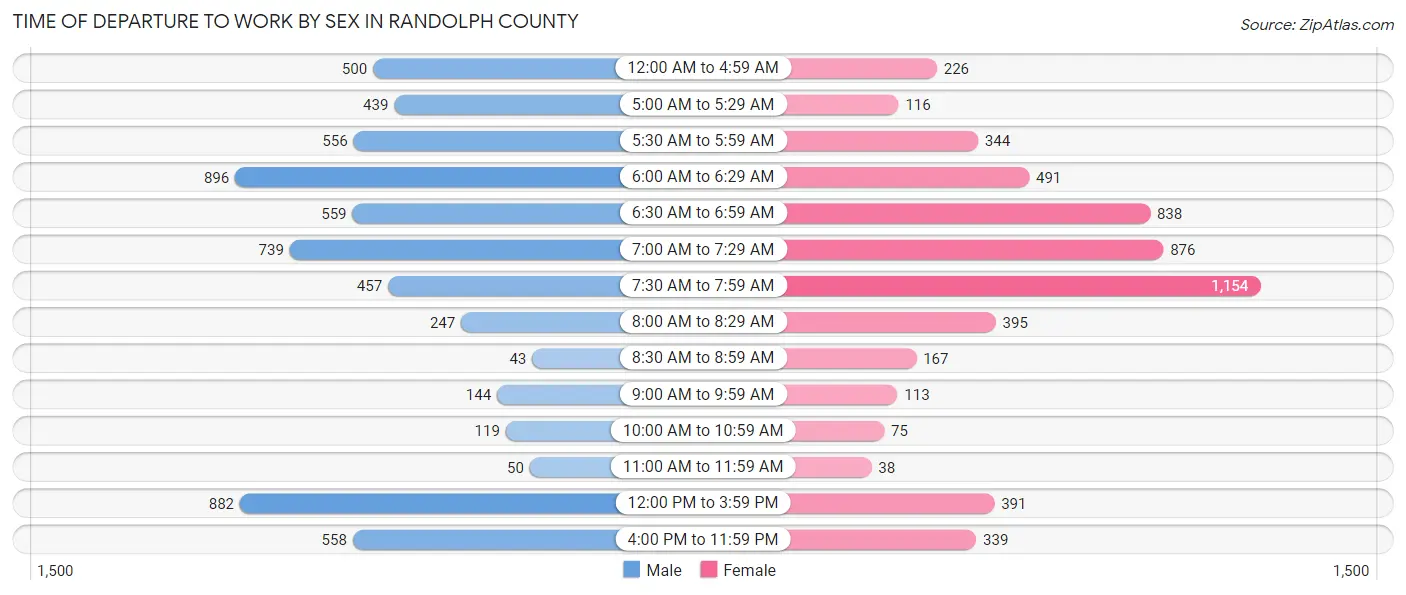
| Time of Departure | Male | Female |
| 12:00 AM to 4:59 AM | 500 (8.1%) | 226 (4.1%) |
| 5:00 AM to 5:29 AM | 439 (7.1%) | 116 (2.1%) |
| 5:30 AM to 5:59 AM | 556 (9.0%) | 344 (6.2%) |
| 6:00 AM to 6:29 AM | 896 (14.5%) | 491 (8.8%) |
| 6:30 AM to 6:59 AM | 559 (9.0%) | 838 (15.1%) |
| 7:00 AM to 7:29 AM | 739 (11.9%) | 876 (15.8%) |
| 7:30 AM to 7:59 AM | 457 (7.4%) | 1,154 (20.7%) |
| 8:00 AM to 8:29 AM | 247 (4.0%) | 395 (7.1%) |
| 8:30 AM to 8:59 AM | 43 (0.7%) | 167 (3.0%) |
| 9:00 AM to 9:59 AM | 144 (2.3%) | 113 (2.0%) |
| 10:00 AM to 10:59 AM | 119 (1.9%) | 75 (1.3%) |
| 11:00 AM to 11:59 AM | 50 (0.8%) | 38 (0.7%) |
| 12:00 PM to 3:59 PM | 882 (14.2%) | 391 (7.0%) |
| 4:00 PM to 11:59 PM | 558 (9.0%) | 339 (6.1%) |
| Total | 6,189 (100.0%) | 5,563 (100.0%) |
Housing Occupancy in Randolph County
Occupancy by Ownership in Randolph County
Of the total 11,650 dwellings in Randolph County, owner-occupied units account for 8,853 (76.0%), while renter-occupied units make up 2,797 (24.0%).
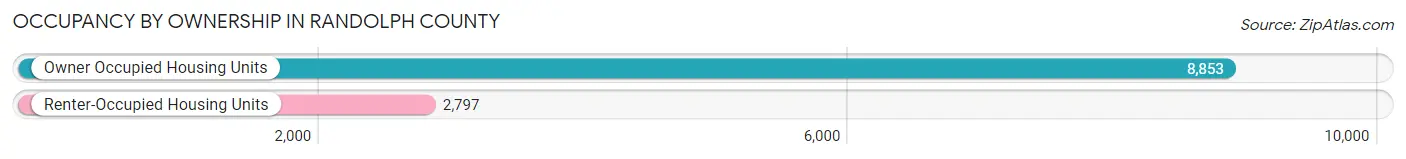
| Occupancy | # Housing Units | % Housing Units |
| Owner Occupied Housing Units | 8,853 | 76.0% |
| Renter-Occupied Housing Units | 2,797 | 24.0% |
| Total Occupied Housing Units | 11,650 | 100.0% |
Occupancy by Household Size in Randolph County
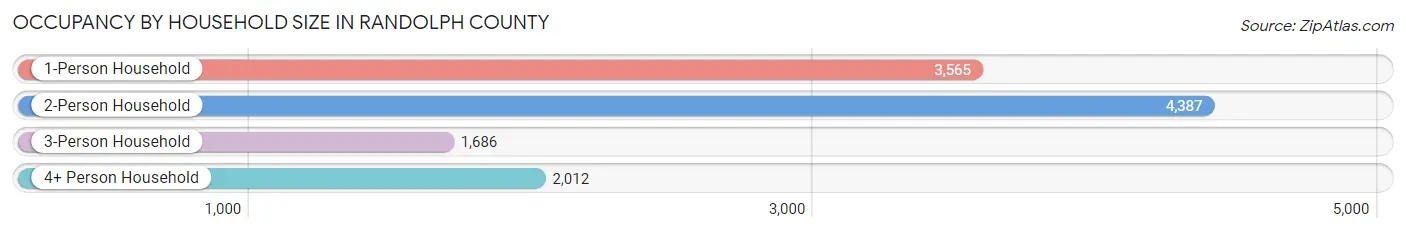
| Household Size | # Housing Units | % Housing Units |
| 1-Person Household | 3,565 | 30.6% |
| 2-Person Household | 4,387 | 37.7% |
| 3-Person Household | 1,686 | 14.5% |
| 4+ Person Household | 2,012 | 17.3% |
| Total Housing Units | 11,650 | 100.0% |
Occupancy by Ownership by Household Size in Randolph County
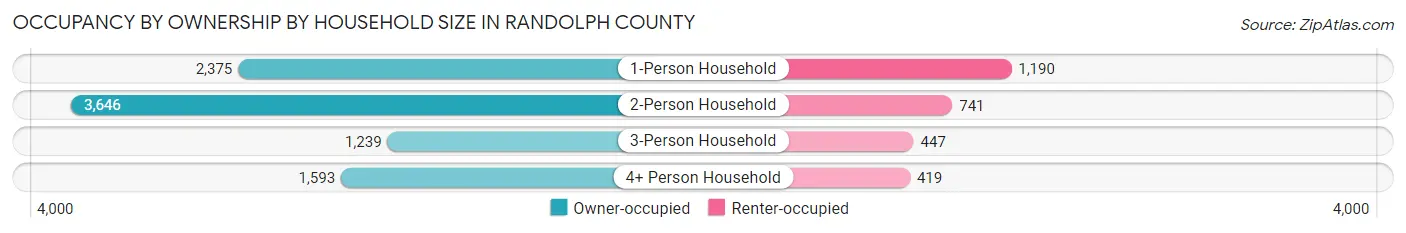
| Household Size | Owner-occupied | Renter-occupied |
| 1-Person Household | 2,375 (66.6%) | 1,190 (33.4%) |
| 2-Person Household | 3,646 (83.1%) | 741 (16.9%) |
| 3-Person Household | 1,239 (73.5%) | 447 (26.5%) |
| 4+ Person Household | 1,593 (79.2%) | 419 (20.8%) |
| Total Housing Units | 8,853 (76.0%) | 2,797 (24.0%) |
Occupancy by Educational Attainment in Randolph County
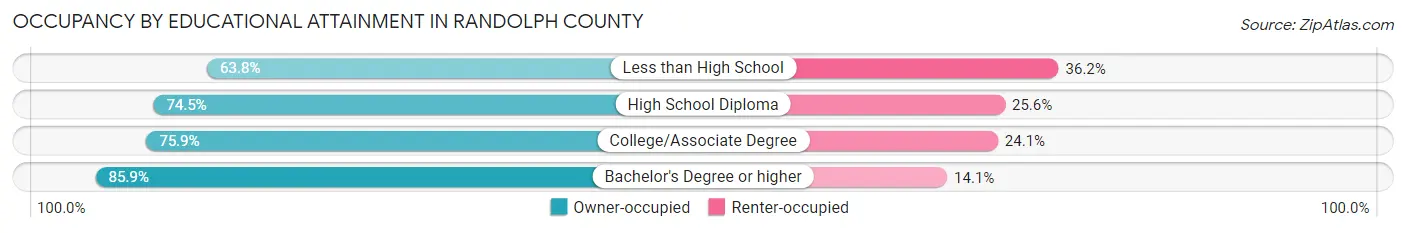
| Household Size | Owner-occupied | Renter-occupied |
| Less than High School | 600 (63.8%) | 340 (36.2%) |
| High School Diploma | 3,174 (74.5%) | 1,089 (25.6%) |
| College/Associate Degree | 3,473 (75.9%) | 1,105 (24.1%) |
| Bachelor's Degree or higher | 1,606 (85.9%) | 263 (14.1%) |
Occupancy by Age of Householder in Randolph County
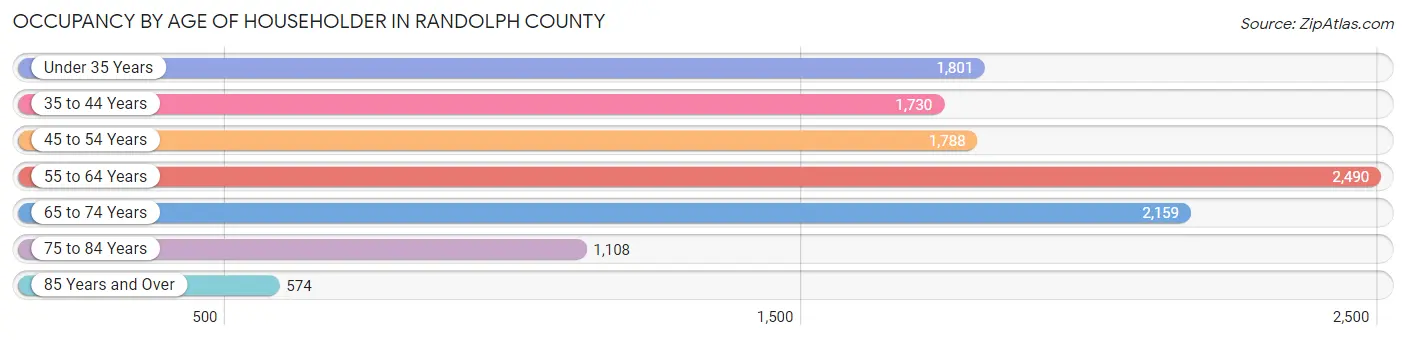
| Age Bracket | # Households | % Households |
| Under 35 Years | 1,801 | 15.5% |
| 35 to 44 Years | 1,730 | 14.8% |
| 45 to 54 Years | 1,788 | 15.3% |
| 55 to 64 Years | 2,490 | 21.4% |
| 65 to 74 Years | 2,159 | 18.5% |
| 75 to 84 Years | 1,108 | 9.5% |
| 85 Years and Over | 574 | 4.9% |
| Total | 11,650 | 100.0% |
Housing Finances in Randolph County
Median Income by Occupancy in Randolph County
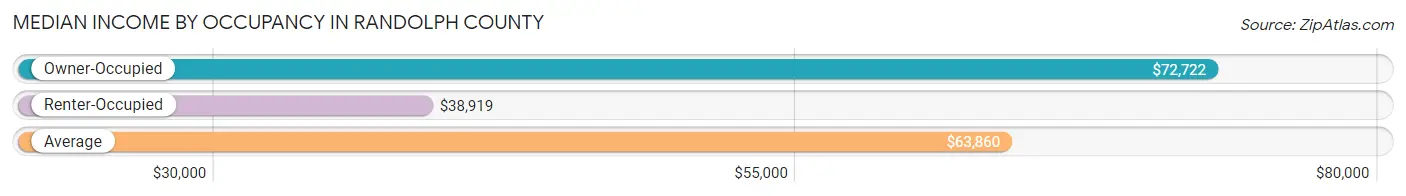
| Occupancy Type | # Households | Median Income |
| Owner-Occupied | 8,853 (76.0%) | $72,722 |
| Renter-Occupied | 2,797 (24.0%) | $38,919 |
| Average | 11,650 (100.0%) | $63,860 |
Occupancy by Householder Income Bracket in Randolph County
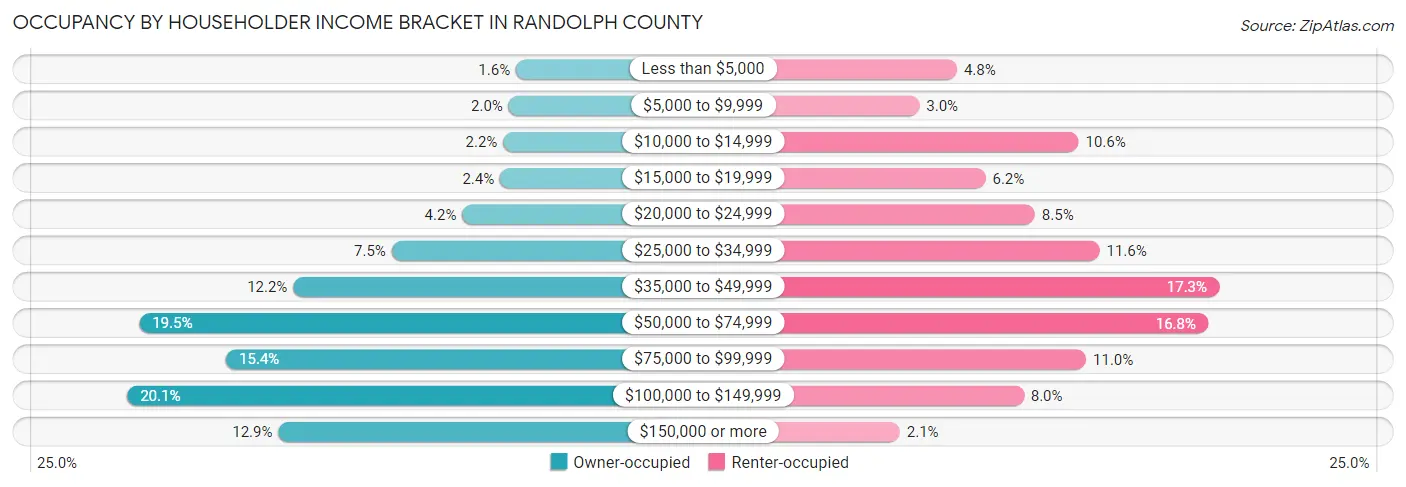
| Income Bracket | Owner-occupied | Renter-occupied |
| Less than $5,000 | 142 (1.6%) | 135 (4.8%) |
| $5,000 to $9,999 | 173 (1.9%) | 85 (3.0%) |
| $10,000 to $14,999 | 196 (2.2%) | 297 (10.6%) |
| $15,000 to $19,999 | 209 (2.4%) | 173 (6.2%) |
| $20,000 to $24,999 | 368 (4.2%) | 239 (8.5%) |
| $25,000 to $34,999 | 666 (7.5%) | 325 (11.6%) |
| $35,000 to $49,999 | 1,081 (12.2%) | 484 (17.3%) |
| $50,000 to $74,999 | 1,730 (19.5%) | 469 (16.8%) |
| $75,000 to $99,999 | 1,364 (15.4%) | 307 (11.0%) |
| $100,000 to $149,999 | 1,780 (20.1%) | 224 (8.0%) |
| $150,000 or more | 1,144 (12.9%) | 59 (2.1%) |
| Total | 8,853 (100.0%) | 2,797 (100.0%) |
Monthly Housing Cost Tiers in Randolph County
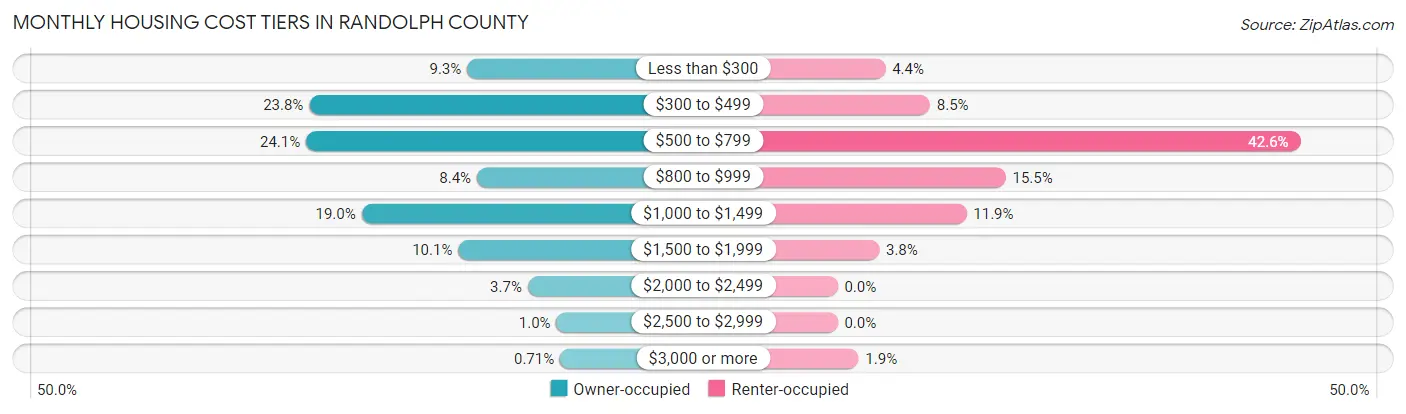
| Monthly Cost | Owner-occupied | Renter-occupied |
| Less than $300 | 820 (9.3%) | 123 (4.4%) |
| $300 to $499 | 2,107 (23.8%) | 238 (8.5%) |
| $500 to $799 | 2,133 (24.1%) | 1,192 (42.6%) |
| $800 to $999 | 740 (8.4%) | 433 (15.5%) |
| $1,000 to $1,499 | 1,680 (19.0%) | 332 (11.9%) |
| $1,500 to $1,999 | 892 (10.1%) | 107 (3.8%) |
| $2,000 to $2,499 | 326 (3.7%) | 0 (0.0%) |
| $2,500 to $2,999 | 92 (1.0%) | 0 (0.0%) |
| $3,000 or more | 63 (0.7%) | 54 (1.9%) |
| Total | 8,853 (100.0%) | 2,797 (100.0%) |
Physical Housing Characteristics in Randolph County
Housing Structures in Randolph County
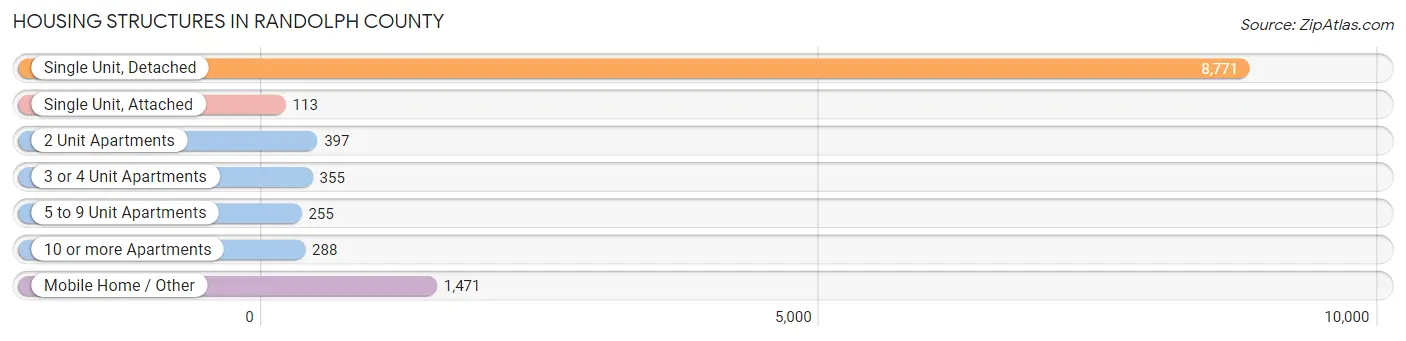
| Structure Type | # Housing Units | % Housing Units |
| Single Unit, Detached | 8,771 | 75.3% |
| Single Unit, Attached | 113 | 1.0% |
| 2 Unit Apartments | 397 | 3.4% |
| 3 or 4 Unit Apartments | 355 | 3.0% |
| 5 to 9 Unit Apartments | 255 | 2.2% |
| 10 or more Apartments | 288 | 2.5% |
| Mobile Home / Other | 1,471 | 12.6% |
| Total | 11,650 | 100.0% |
Housing Structures by Occupancy in Randolph County
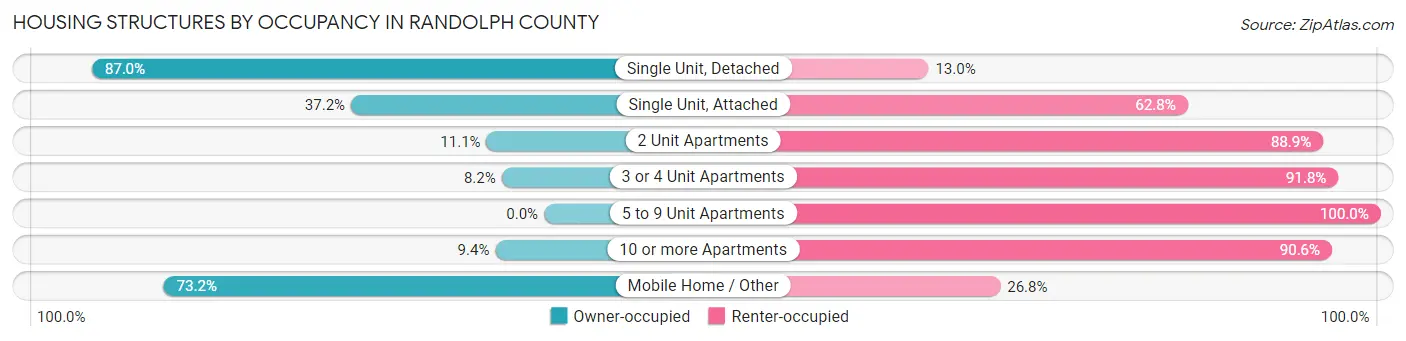
| Structure Type | Owner-occupied | Renter-occupied |
| Single Unit, Detached | 7,634 (87.0%) | 1,137 (13.0%) |
| Single Unit, Attached | 42 (37.2%) | 71 (62.8%) |
| 2 Unit Apartments | 44 (11.1%) | 353 (88.9%) |
| 3 or 4 Unit Apartments | 29 (8.2%) | 326 (91.8%) |
| 5 to 9 Unit Apartments | 0 (0.0%) | 255 (100.0%) |
| 10 or more Apartments | 27 (9.4%) | 261 (90.6%) |
| Mobile Home / Other | 1,077 (73.2%) | 394 (26.8%) |
| Total | 8,853 (76.0%) | 2,797 (24.0%) |
Housing Structures by Number of Rooms in Randolph County

| Number of Rooms | Owner-occupied | Renter-occupied |
| 1 Room | 67 (0.8%) | 59 (2.1%) |
| 2 or 3 Rooms | 189 (2.1%) | 490 (17.5%) |
| 4 or 5 Rooms | 2,913 (32.9%) | 1,526 (54.6%) |
| 6 or 7 Rooms | 3,639 (41.1%) | 602 (21.5%) |
| 8 or more Rooms | 2,045 (23.1%) | 120 (4.3%) |
| Total | 8,853 (100.0%) | 2,797 (100.0%) |
Housing Structure by Heating Type in Randolph County

| Heating Type | Owner-occupied | Renter-occupied |
| Utility Gas | 4,131 (46.7%) | 1,177 (42.1%) |
| Bottled, Tank, or LP Gas | 1,477 (16.7%) | 176 (6.3%) |
| Electricity | 2,979 (33.7%) | 1,353 (48.4%) |
| Fuel Oil or Kerosene | 37 (0.4%) | 8 (0.3%) |
| Coal or Coke | 0 (0.0%) | 0 (0.0%) |
| All other Fuels | 210 (2.4%) | 53 (1.9%) |
| No Fuel Used | 19 (0.2%) | 30 (1.1%) |
| Total | 8,853 (100.0%) | 2,797 (100.0%) |
Household Vehicle Usage in Randolph County
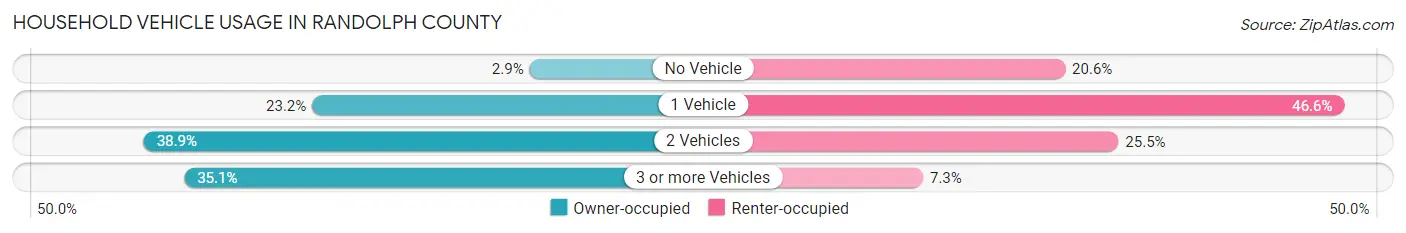
| Vehicles per Household | Owner-occupied | Renter-occupied |
| No Vehicle | 254 (2.9%) | 575 (20.6%) |
| 1 Vehicle | 2,050 (23.2%) | 1,304 (46.6%) |
| 2 Vehicles | 3,442 (38.9%) | 714 (25.5%) |
| 3 or more Vehicles | 3,107 (35.1%) | 204 (7.3%) |
| Total | 8,853 (100.0%) | 2,797 (100.0%) |
Real Estate & Mortgages in Randolph County
Real Estate and Mortgage Overview in Randolph County
| Characteristic | Without Mortgage | With Mortgage |
| Housing Units | 4,630 | 4,223 |
| Median Property Value | $118,900 | $141,000 |
| Median Household Income | $58,320 | $799 |
| Monthly Housing Costs | $452 | $63 |
| Real Estate Taxes | $1,559 | $97 |
Property Value by Mortgage Status in Randolph County
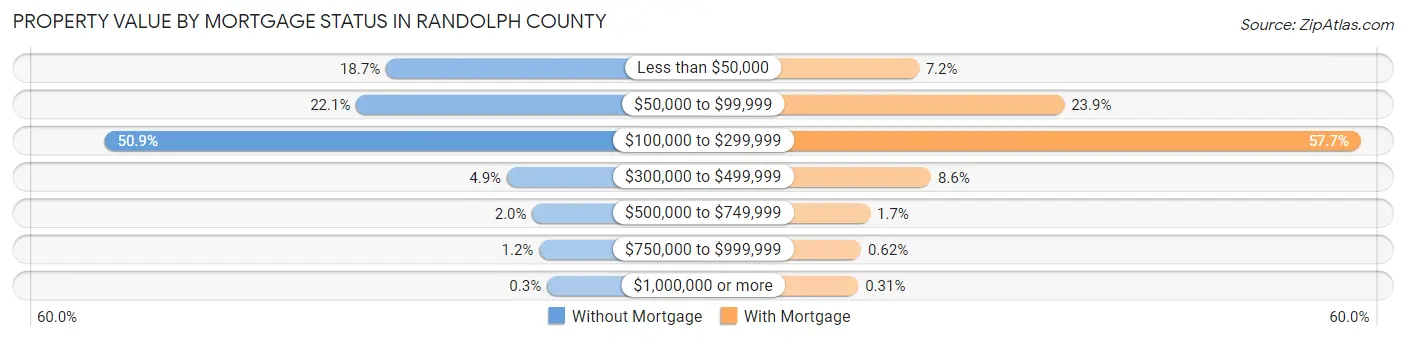
| Property Value | Without Mortgage | With Mortgage |
| Less than $50,000 | 866 (18.7%) | 305 (7.2%) |
| $50,000 to $99,999 | 1,023 (22.1%) | 1,007 (23.8%) |
| $100,000 to $299,999 | 2,355 (50.9%) | 2,438 (57.7%) |
| $300,000 to $499,999 | 226 (4.9%) | 364 (8.6%) |
| $500,000 to $749,999 | 91 (2.0%) | 70 (1.7%) |
| $750,000 to $999,999 | 55 (1.2%) | 26 (0.6%) |
| $1,000,000 or more | 14 (0.3%) | 13 (0.3%) |
| Total | 4,630 (100.0%) | 4,223 (100.0%) |
Household Income by Mortgage Status in Randolph County
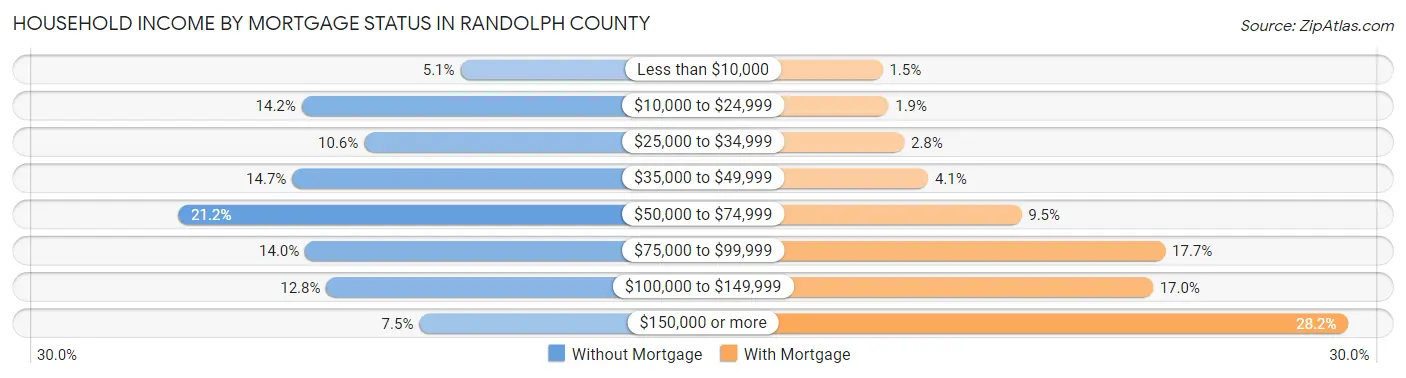
| Household Income | Without Mortgage | With Mortgage |
| Less than $10,000 | 236 (5.1%) | 65 (1.5%) |
| $10,000 to $24,999 | 656 (14.2%) | 79 (1.9%) |
| $25,000 to $34,999 | 491 (10.6%) | 117 (2.8%) |
| $35,000 to $49,999 | 681 (14.7%) | 175 (4.1%) |
| $50,000 to $74,999 | 983 (21.2%) | 400 (9.5%) |
| $75,000 to $99,999 | 647 (14.0%) | 747 (17.7%) |
| $100,000 to $149,999 | 591 (12.8%) | 717 (17.0%) |
| $150,000 or more | 345 (7.4%) | 1,189 (28.2%) |
| Total | 4,630 (100.0%) | 4,223 (100.0%) |
Property Value to Household Income Ratio in Randolph County
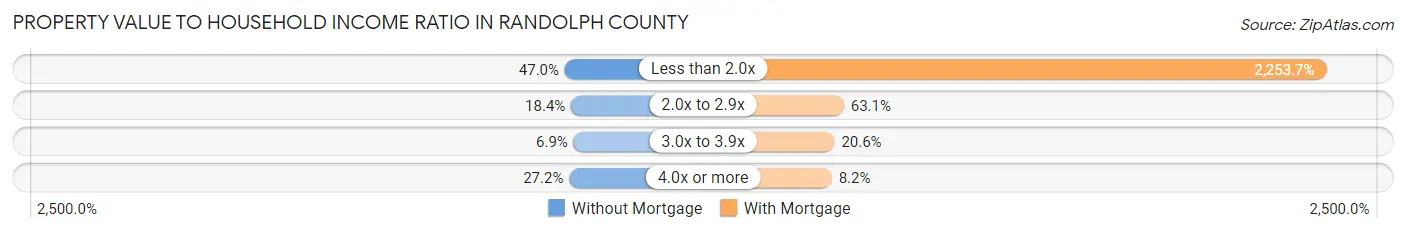
| Value-to-Income Ratio | Without Mortgage | With Mortgage |
| Less than 2.0x | 2,176 (47.0%) | 95,174 (2,253.7%) |
| 2.0x to 2.9x | 850 (18.4%) | 2,666 (63.1%) |
| 3.0x to 3.9x | 317 (6.9%) | 868 (20.5%) |
| 4.0x or more | 1,257 (27.2%) | 346 (8.2%) |
| Total | 4,630 (100.0%) | 4,223 (100.0%) |
Real Estate Taxes by Mortgage Status in Randolph County
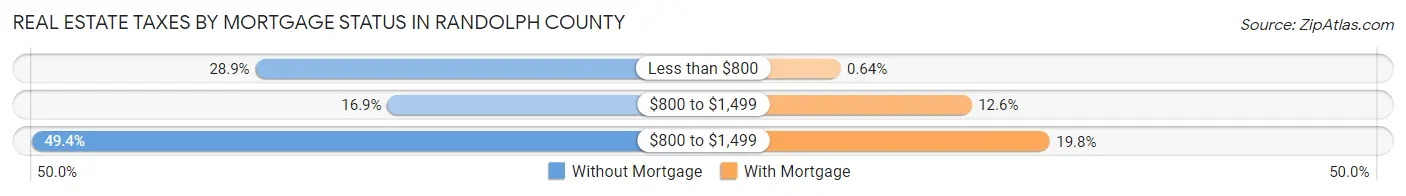
| Property Taxes | Without Mortgage | With Mortgage |
| Less than $800 | 1,339 (28.9%) | 27 (0.6%) |
| $800 to $1,499 | 781 (16.9%) | 533 (12.6%) |
| $800 to $1,499 | 2,286 (49.4%) | 834 (19.8%) |
| Total | 4,630 (100.0%) | 4,223 (100.0%) |
Health & Disability in Randolph County
Health Insurance Coverage by Age in Randolph County
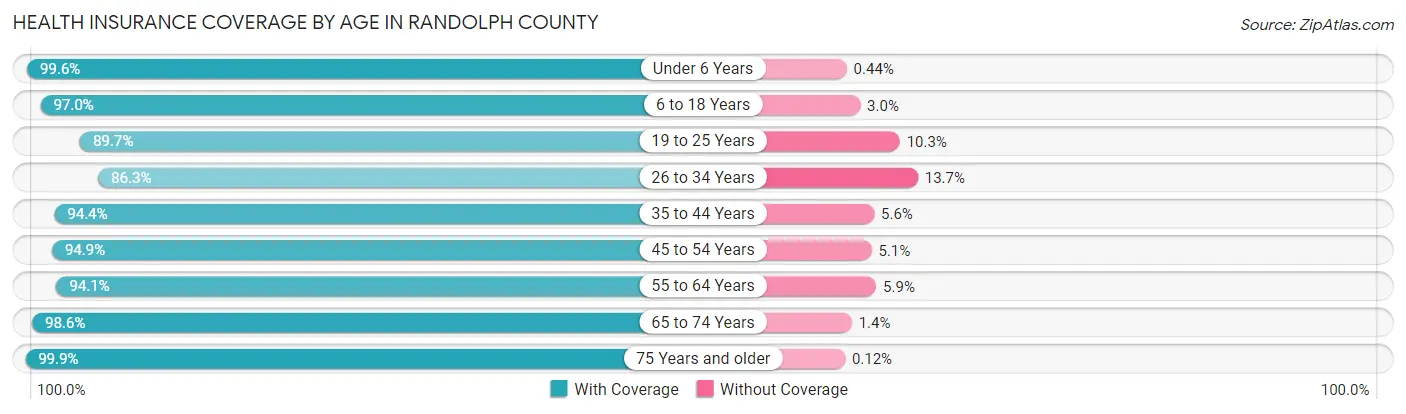
| Age Bracket | With Coverage | Without Coverage |
| Under 6 Years | 1,794 (99.6%) | 8 (0.4%) |
| 6 to 18 Years | 4,585 (97.0%) | 140 (3.0%) |
| 19 to 25 Years | 1,919 (89.7%) | 221 (10.3%) |
| 26 to 34 Years | 2,095 (86.3%) | 333 (13.7%) |
| 35 to 44 Years | 2,989 (94.4%) | 176 (5.6%) |
| 45 to 54 Years | 3,101 (94.9%) | 166 (5.1%) |
| 55 to 64 Years | 3,881 (94.1%) | 245 (5.9%) |
| 65 to 74 Years | 3,275 (98.6%) | 46 (1.4%) |
| 75 Years and older | 2,449 (99.9%) | 3 (0.1%) |
| Total | 26,088 (95.1%) | 1,338 (4.9%) |
Health Insurance Coverage by Citizenship Status in Randolph County
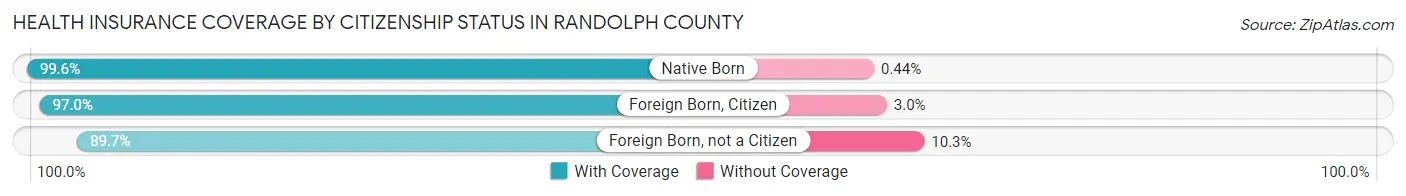
| Citizenship Status | With Coverage | Without Coverage |
| Native Born | 1,794 (99.6%) | 8 (0.4%) |
| Foreign Born, Citizen | 4,585 (97.0%) | 140 (3.0%) |
| Foreign Born, not a Citizen | 1,919 (89.7%) | 221 (10.3%) |
Health Insurance Coverage by Household Income in Randolph County
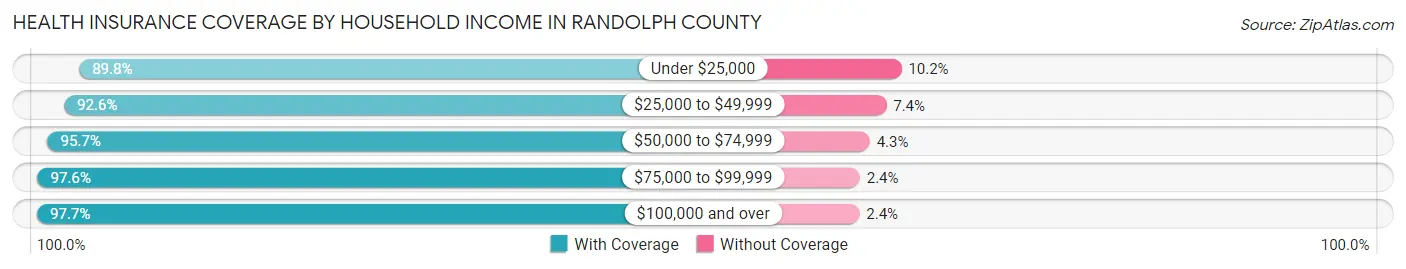
| Household Income | With Coverage | Without Coverage |
| Under $25,000 | 2,850 (89.8%) | 325 (10.2%) |
| $25,000 to $49,999 | 4,620 (92.6%) | 369 (7.4%) |
| $50,000 to $74,999 | 4,630 (95.7%) | 208 (4.3%) |
| $75,000 to $99,999 | 3,983 (97.6%) | 99 (2.4%) |
| $100,000 and over | 9,803 (97.7%) | 236 (2.4%) |
Public vs Private Health Insurance Coverage by Age in Randolph County
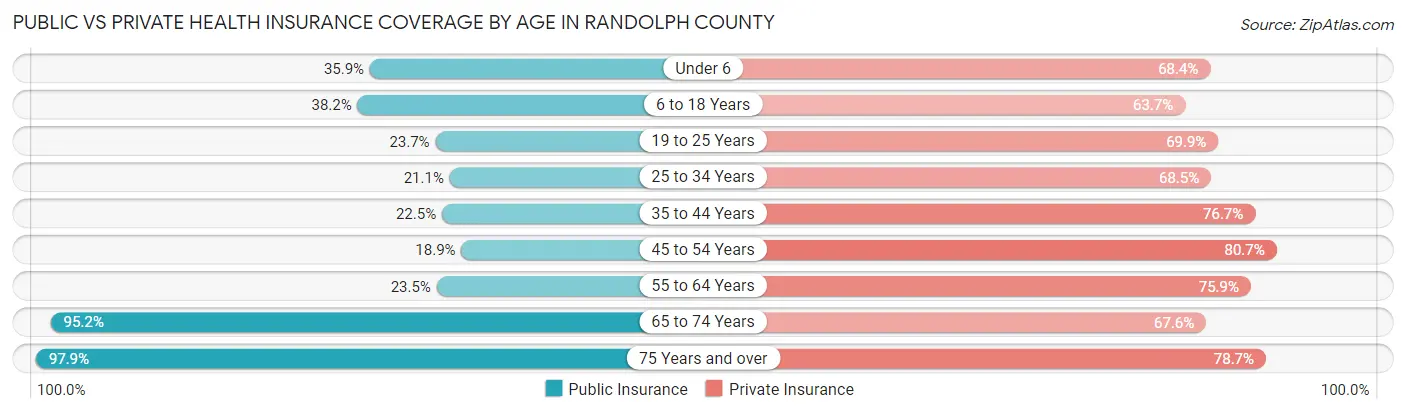
| Age Bracket | Public Insurance | Private Insurance |
| Under 6 | 647 (35.9%) | 1,232 (68.4%) |
| 6 to 18 Years | 1,805 (38.2%) | 3,010 (63.7%) |
| 19 to 25 Years | 508 (23.7%) | 1,495 (69.9%) |
| 25 to 34 Years | 512 (21.1%) | 1,664 (68.5%) |
| 35 to 44 Years | 713 (22.5%) | 2,428 (76.7%) |
| 45 to 54 Years | 618 (18.9%) | 2,636 (80.7%) |
| 55 to 64 Years | 970 (23.5%) | 3,132 (75.9%) |
| 65 to 74 Years | 3,161 (95.2%) | 2,245 (67.6%) |
| 75 Years and over | 2,401 (97.9%) | 1,930 (78.7%) |
| Total | 11,335 (41.3%) | 19,772 (72.1%) |
Disability Status by Sex by Age in Randolph County
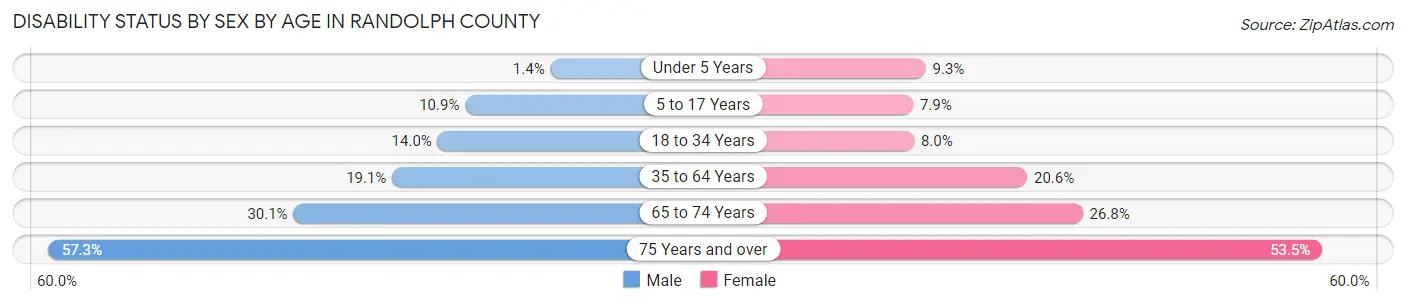
| Age Bracket | Male | Female |
| Under 5 Years | 11 (1.4%) | 70 (9.3%) |
| 5 to 17 Years | 270 (10.9%) | 169 (7.9%) |
| 18 to 34 Years | 367 (14.0%) | 189 (8.0%) |
| 35 to 64 Years | 1,021 (19.1%) | 1,073 (20.6%) |
| 65 to 74 Years | 478 (30.1%) | 464 (26.8%) |
| 75 Years and over | 530 (57.3%) | 817 (53.5%) |
Disability Class by Sex by Age in Randolph County
Disability Class: Hearing Difficulty
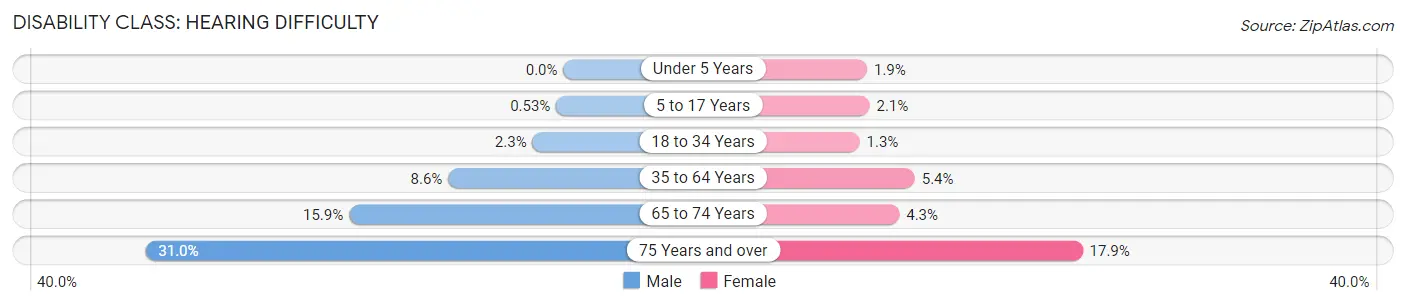
| Age Bracket | Male | Female |
| Under 5 Years | 0 (0.0%) | 14 (1.9%) |
| 5 to 17 Years | 13 (0.5%) | 44 (2.1%) |
| 18 to 34 Years | 60 (2.3%) | 31 (1.3%) |
| 35 to 64 Years | 458 (8.6%) | 282 (5.4%) |
| 65 to 74 Years | 253 (15.9%) | 74 (4.3%) |
| 75 Years and over | 287 (31.0%) | 273 (17.9%) |
Disability Class: Vision Difficulty
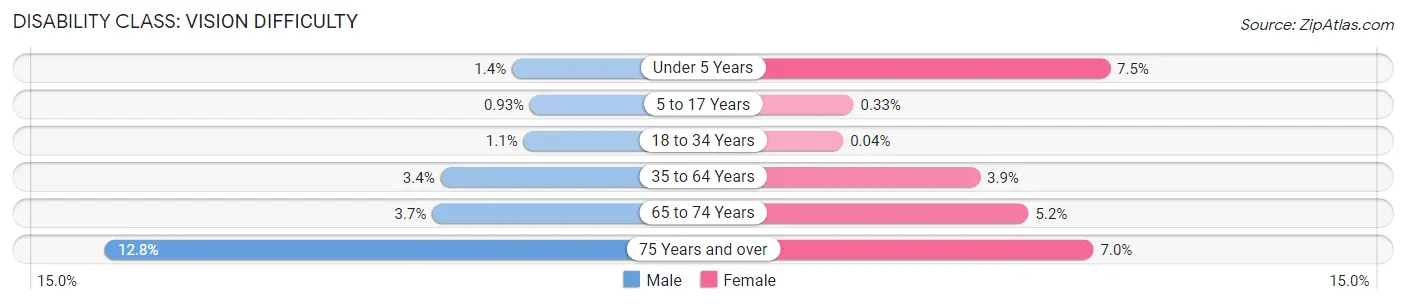
| Age Bracket | Male | Female |
| Under 5 Years | 11 (1.4%) | 56 (7.5%) |
| 5 to 17 Years | 23 (0.9%) | 7 (0.3%) |
| 18 to 34 Years | 29 (1.1%) | 1 (0.0%) |
| 35 to 64 Years | 183 (3.4%) | 200 (3.8%) |
| 65 to 74 Years | 58 (3.6%) | 90 (5.2%) |
| 75 Years and over | 118 (12.8%) | 107 (7.0%) |
Disability Class: Cognitive Difficulty
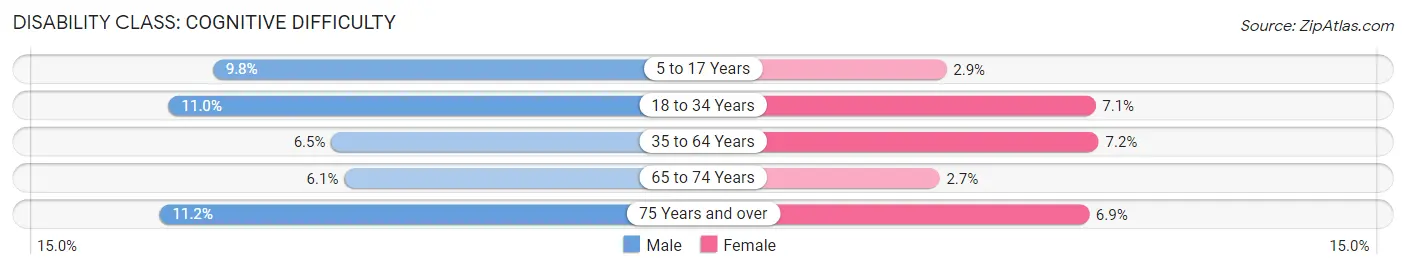
| Age Bracket | Male | Female |
| 5 to 17 Years | 241 (9.8%) | 62 (2.9%) |
| 18 to 34 Years | 288 (11.0%) | 166 (7.1%) |
| 35 to 64 Years | 346 (6.5%) | 372 (7.1%) |
| 65 to 74 Years | 97 (6.1%) | 47 (2.7%) |
| 75 Years and over | 104 (11.2%) | 105 (6.9%) |
Disability Class: Ambulatory Difficulty
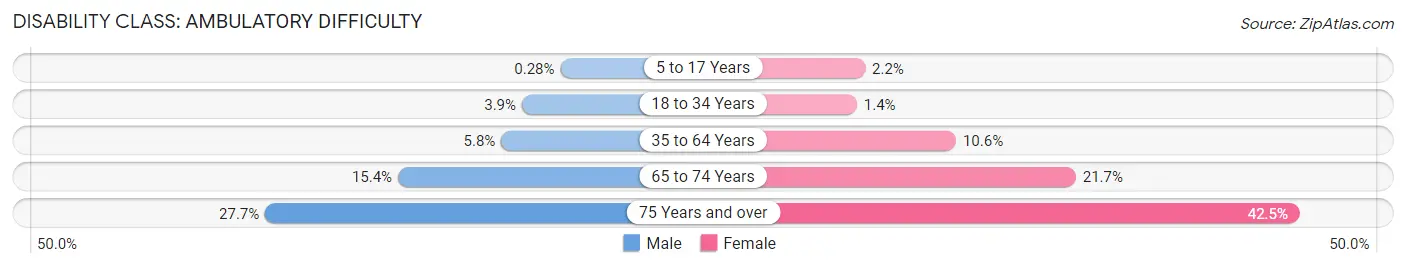
| Age Bracket | Male | Female |
| 5 to 17 Years | 7 (0.3%) | 46 (2.2%) |
| 18 to 34 Years | 101 (3.8%) | 33 (1.4%) |
| 35 to 64 Years | 309 (5.8%) | 551 (10.6%) |
| 65 to 74 Years | 244 (15.3%) | 376 (21.7%) |
| 75 Years and over | 256 (27.7%) | 649 (42.5%) |
Disability Class: Self-Care Difficulty
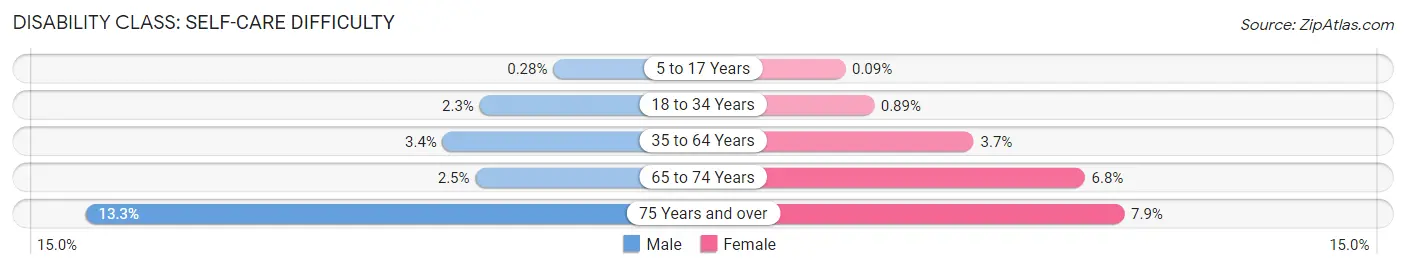
| Age Bracket | Male | Female |
| 5 to 17 Years | 7 (0.3%) | 2 (0.1%) |
| 18 to 34 Years | 61 (2.3%) | 21 (0.9%) |
| 35 to 64 Years | 180 (3.4%) | 191 (3.7%) |
| 65 to 74 Years | 39 (2.5%) | 117 (6.8%) |
| 75 Years and over | 123 (13.3%) | 120 (7.9%) |
Technology Access in Randolph County
Computing Device Access in Randolph County

| Device Type | # Households | % Households |
| Desktop or Laptop | 7,646 | 65.6% |
| Smartphone | 9,574 | 82.2% |
| Tablet | 6,135 | 52.7% |
| No Computing Device | 1,289 | 11.1% |
| Total | 11,650 | 100.0% |
Internet Access in Randolph County
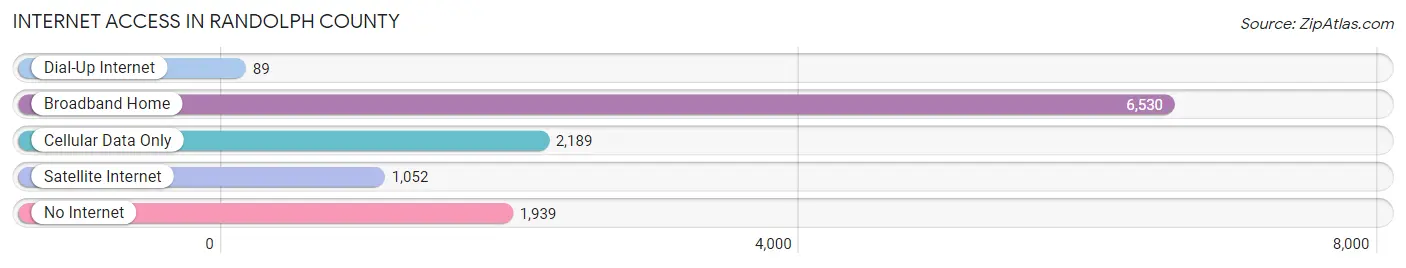
| Internet Type | # Households | % Households |
| Dial-Up Internet | 89 | 0.8% |
| Broadband Home | 6,530 | 56.0% |
| Cellular Data Only | 2,189 | 18.8% |
| Satellite Internet | 1,052 | 9.0% |
| No Internet | 1,939 | 16.6% |
| Total | 11,650 | 100.0% |
Randolph County Summary
Randolph County is located in the southwestern corner of Illinois, and is part of the St. Louis Metropolitan Statistical Area. It is bordered by the Mississippi River to the west, Monroe County to the north, Jackson County to the east, and St. Clair County to the south. The county seat is Chester, and the largest city is Sparta. As of the 2010 census, the population was 33,476.
History
Randolph County was formed in 1818 from parts of St. Clair and Madison counties. It was named after Edmund Randolph, the first U.S. Attorney General. The county was initially divided into six townships: Kaskaskia, Prairie du Long, Red Bud, Rockwood, St. John, and Union. The county was later divided into twelve townships: Baldwin, Belleview, Chester, Coulterville, Evansville, Kaskaskia, Prairie du Long, Red Bud, Rockwood, St. John, Union, and Walshville.
The first settlers in Randolph County were French-Canadian immigrants who arrived in the early 1800s. They were followed by German immigrants in the mid-1800s. The county was largely agricultural, with corn, wheat, and oats being the main crops. The county also had a thriving timber industry, with lumber being shipped down the Mississippi River to St. Louis.
Geography
Randolph County is located in the southwestern corner of Illinois, and is part of the St. Louis Metropolitan Statistical Area. It is bordered by the Mississippi River to the west, Monroe County to the north, Jackson County to the east, and St. Clair County to the south. The county has a total area of 576 square miles, of which 573 square miles is land and 3 square miles is water.
The terrain of Randolph County is mostly flat, with some rolling hills in the northern and western parts of the county. The highest point in the county is located in the northwest corner, at an elevation of 830 feet. The county is drained by the Kaskaskia River, which flows through the center of the county.
Economy
The economy of Randolph County is largely based on agriculture and manufacturing. The county is home to several large farms, which produce corn, wheat, soybeans, and other crops. The county also has a thriving timber industry, with lumber being shipped down the Mississippi River to St. Louis.
Manufacturing is also an important part of the county’s economy. The county is home to several factories, including a paper mill, a steel mill, and a plastics plant. The county also has a growing tourism industry, with several wineries, golf courses, and other attractions.
Demographics
As of the 2010 census, there were 33,476 people, 12,945 households, and 8,945 families living in Randolph County. The population density was 58.3 people per square mile. The racial makeup of the county was 95.2% White, 1.7% African American, 0.3% Native American, 0.5% Asian, 0.1% Pacific Islander, 1.2% from other races, and 1.1% from two or more races. Hispanic or Latino of any race were 3.2% of the population.
The median income for a household in the county was $41,945, and the median income for a family was $50,945. The per capita income for the county was $20,945. About 11.2% of families and 14.2% of the population were below the poverty line, including 19.2% of those under age 18 and 8.2% of those age 65 or over.
Common Questions
What is Per Capita Income in Randolph County?
Per Capita income in Randolph County is $29,832.
What is the Median Family Income in Randolph County?
Median Family Income in Randolph County is $81,142.
What is the Median Household income in Randolph County?
Median Household Income in Randolph County is $63,860.
What is Income or Wage Gap in Randolph County?
Income or Wage Gap in Randolph County is 39.6%.
Women in Randolph County earn 60.4 cents for every dollar earned by a man.
What is Family Income Deficit in Randolph County?
Family Income Deficit in Randolph County is $9,056.
Families that are below poverty line in Randolph County earn $9,056 less on average than the poverty threshold level.
What is Inequality or Gini Index in Randolph County?
Inequality or Gini Index in Randolph County is 0.40.
What is the Total Population of Randolph County?
Total Population of Randolph County is 30,413.
What is the Total Male Population of Randolph County?
Total Male Population of Randolph County is 16,471.
What is the Total Female Population of Randolph County?
Total Female Population of Randolph County is 13,942.
What is the Ratio of Males per 100 Females in Randolph County?
There are 118.14 Males per 100 Females in Randolph County.
What is the Ratio of Females per 100 Males in Randolph County?
There are 84.65 Females per 100 Males in Randolph County.
What is the Median Population Age in Randolph County?
Median Population Age in Randolph County is 43.0 Years.
What is the Average Family Size in Randolph County
Average Family Size in Randolph County is 2.9 People.
What is the Average Household Size in Randolph County
Average Household Size in Randolph County is 2.3 People.
How Large is the Labor Force in Randolph County?
There are 13,307 People in the Labor Forcein in Randolph County.
What is the Percentage of People in the Labor Force in Randolph County?
52.9% of People are in the Labor Force in Randolph County.
What is the Unemployment Rate in Randolph County?
Unemployment Rate in Randolph County is 5.2%.