Pulaski County, IL Map & Demographics
Pulaski County Map
Pulaski County Overview
$22,947
PER CAPITA INCOME
$59,957
AVG FAMILY INCOME
$41,038
AVG HOUSEHOLD INCOME
35.6%
WAGE / INCOME GAP [ % ]
64.4¢/ $1
WAGE / INCOME GAP [ $ ]
0.46
INEQUALITY / GINI INDEX
5,177
TOTAL POPULATION
2,600
MALE POPULATION
2,577
FEMALE POPULATION
100.89
MALES / 100 FEMALES
99.12
FEMALES / 100 MALES
43.9
MEDIAN AGE
3.5
AVG FAMILY SIZE
2.7
AVG HOUSEHOLD SIZE
1,855
LABOR FORCE [ PEOPLE ]
43.6%
PERCENT IN LABOR FORCE
4.2%
UNEMPLOYMENT RATE
Pulaski County Area Codes
Income in Pulaski County
Income Overview in Pulaski County
Per Capita Income in Pulaski County is $22,947, while median incomes of families and households are $59,957 and $41,038 respectively.
| Characteristic | Number | Measure |
| Per Capita Income | 5,177 | $22,947 |
| Median Family Income | 1,129 | $59,957 |
| Mean Family Income | 1,129 | $71,944 |
| Median Household Income | 1,886 | $41,038 |
| Mean Household Income | 1,886 | $56,897 |
| Income Deficit | 1,129 | $0 |
| Wage / Income Gap (%) | 5,177 | 35.57% |
| Wage / Income Gap ($) | 5,177 | 64.43¢ per $1 |
| Gini / Inequality Index | 5,177 | 0.46 |
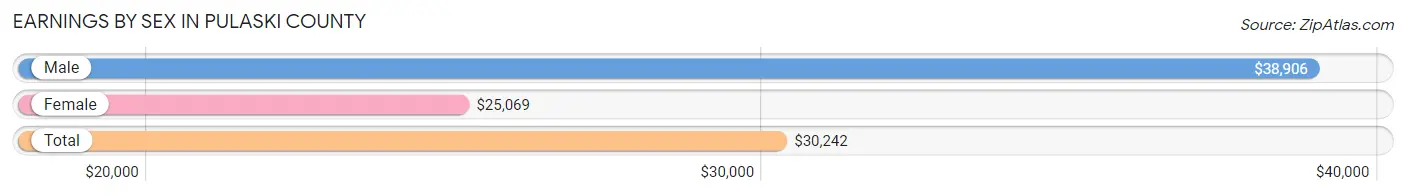
Earnings by Sex in Pulaski County
Average Earnings in Pulaski County are $30,242, $38,906 for men and $25,069 for women, a difference of 35.6%.
| Sex | Number | Average Earnings |
| Male | 1,039 (54.6%) | $38,906 |
| Female | 863 (45.4%) | $25,069 |
| Total | 1,902 (100.0%) | $30,242 |
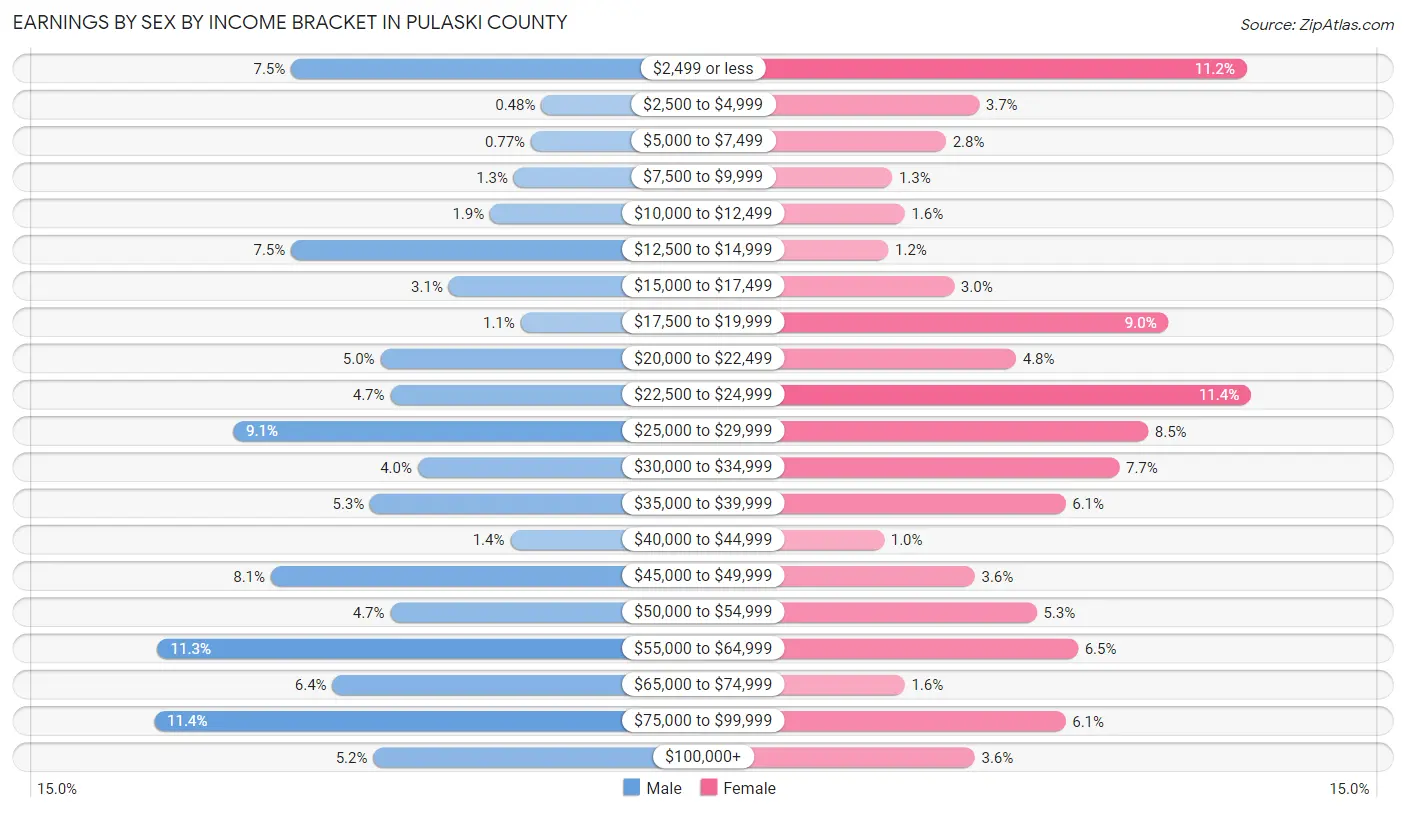
Earnings by Sex by Income Bracket in Pulaski County
The most common earnings brackets in Pulaski County are $75,000 to $99,999 for men (118 | 11.4%) and $22,500 to $24,999 for women (98 | 11.4%).
| Income | Male | Female |
| $2,499 or less | 78 (7.5%) | 97 (11.2%) |
| $2,500 to $4,999 | 5 (0.5%) | 32 (3.7%) |
| $5,000 to $7,499 | 8 (0.8%) | 24 (2.8%) |
| $7,500 to $9,999 | 13 (1.3%) | 11 (1.3%) |
| $10,000 to $12,499 | 20 (1.9%) | 14 (1.6%) |
| $12,500 to $14,999 | 78 (7.5%) | 10 (1.2%) |
| $15,000 to $17,499 | 32 (3.1%) | 26 (3.0%) |
| $17,500 to $19,999 | 11 (1.1%) | 78 (9.0%) |
| $20,000 to $22,499 | 52 (5.0%) | 41 (4.8%) |
| $22,500 to $24,999 | 49 (4.7%) | 98 (11.4%) |
| $25,000 to $29,999 | 95 (9.1%) | 73 (8.5%) |
| $30,000 to $34,999 | 41 (4.0%) | 66 (7.6%) |
| $35,000 to $39,999 | 55 (5.3%) | 53 (6.1%) |
| $40,000 to $44,999 | 14 (1.3%) | 9 (1.0%) |
| $45,000 to $49,999 | 84 (8.1%) | 31 (3.6%) |
| $50,000 to $54,999 | 49 (4.7%) | 46 (5.3%) |
| $55,000 to $64,999 | 117 (11.3%) | 56 (6.5%) |
| $65,000 to $74,999 | 66 (6.4%) | 14 (1.6%) |
| $75,000 to $99,999 | 118 (11.4%) | 53 (6.1%) |
| $100,000+ | 54 (5.2%) | 31 (3.6%) |
| Total | 1,039 (100.0%) | 863 (100.0%) |
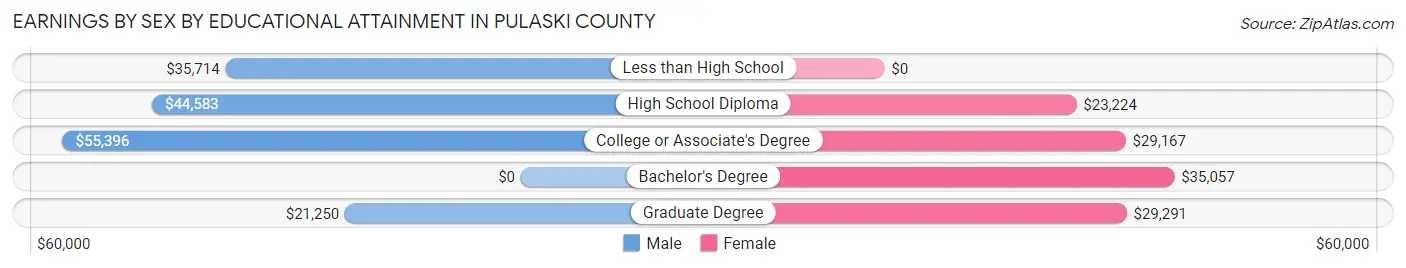
Earnings by Sex by Educational Attainment in Pulaski County
Average earnings in Pulaski County are $48,601 for men and $26,875 for women, a difference of 44.7%. Men with an educational attainment of college or associate's degree enjoy the highest average annual earnings of $55,396, while those with graduate degree education earn the least with $21,250. Women with an educational attainment of bachelor's degree earn the most with the average annual earnings of $35,057, while those with high school diploma education have the smallest earnings of $23,224.
| Educational Attainment | Male Income | Female Income |
| Less than High School | $35,714 | $0 |
| High School Diploma | $44,583 | $23,224 |
| College or Associate's Degree | $55,396 | $29,167 |
| Bachelor's Degree | - | - |
| Graduate Degree | $21,250 | $29,291 |
| Total | $48,601 | $26,875 |
Family Income in Pulaski County
Family Income Brackets in Pulaski County
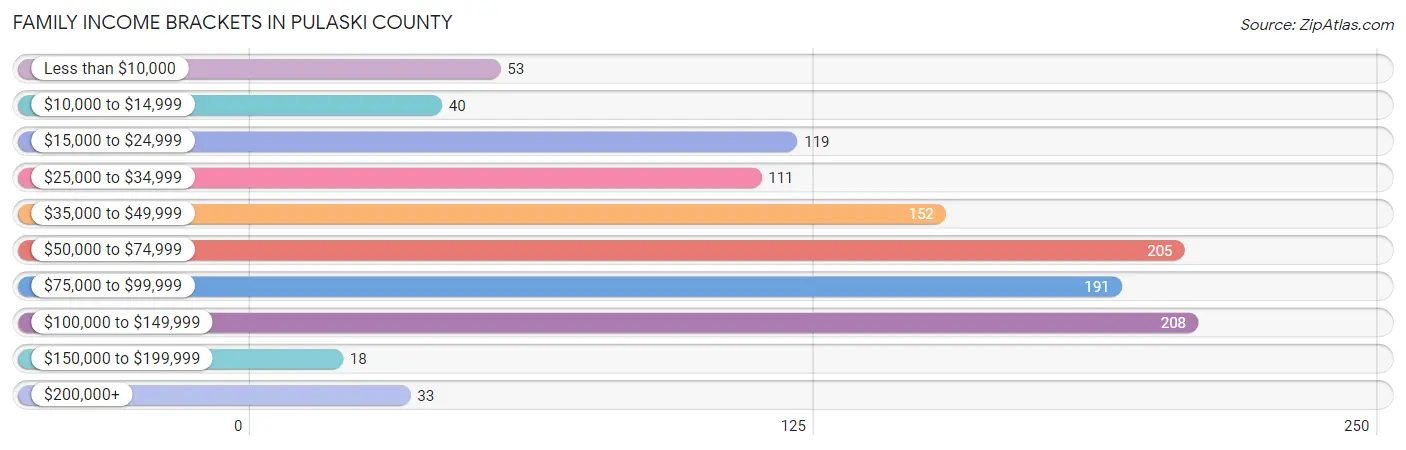
According to the Pulaski County family income data, there are 208 families falling into the $100,000 to $149,999 income range, which is the most common income bracket and makes up 18.4% of all families. Conversely, the $150,000 to $199,999 income bracket is the least frequent group with only 18 families (1.6%) belonging to this category.
| Income Bracket | # Families | % Families |
| Less than $10,000 | 53 | 4.7% |
| $10,000 to $14,999 | 40 | 3.5% |
| $15,000 to $24,999 | 119 | 10.5% |
| $25,000 to $34,999 | 111 | 9.8% |
| $35,000 to $49,999 | 152 | 13.5% |
| $50,000 to $74,999 | 205 | 18.2% |
| $75,000 to $99,999 | 191 | 16.9% |
| $100,000 to $149,999 | 208 | 18.4% |
| $150,000 to $199,999 | 18 | 1.6% |
| $200,000+ | 33 | 2.9% |
Family Income by Famaliy Size in Pulaski County
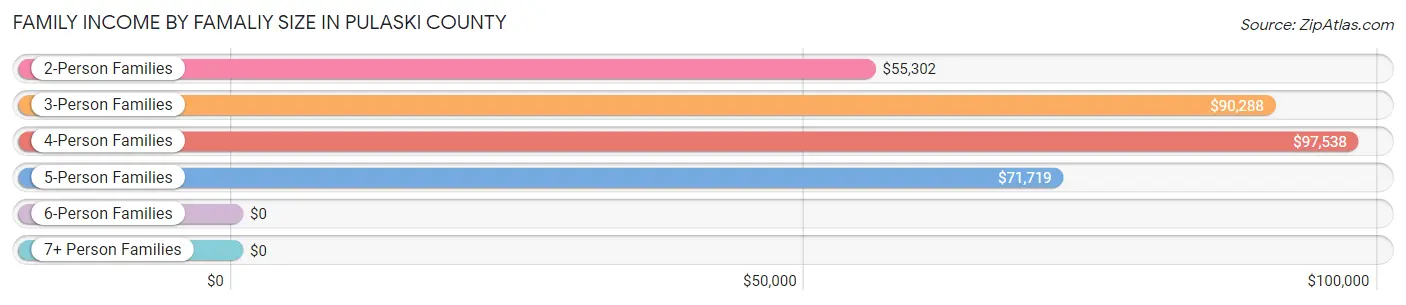
4-person families (111 | 9.8%) account for the highest median family income in Pulaski County with $97,538 per family, while 3-person families (217 | 19.2%) have the highest median income of $30,096 per family member.
| Income Bracket | # Families | Median Income |
| 2-Person Families | 665 (58.9%) | $55,302 |
| 3-Person Families | 217 (19.2%) | $90,288 |
| 4-Person Families | 111 (9.8%) | $97,538 |
| 5-Person Families | 116 (10.3%) | $71,719 |
| 6-Person Families | 20 (1.8%) | $0 |
| 7+ Person Families | 0 (0.0%) | $0 |
| Total | 1,129 (100.0%) | $59,957 |
Family Income by Number of Earners in Pulaski County
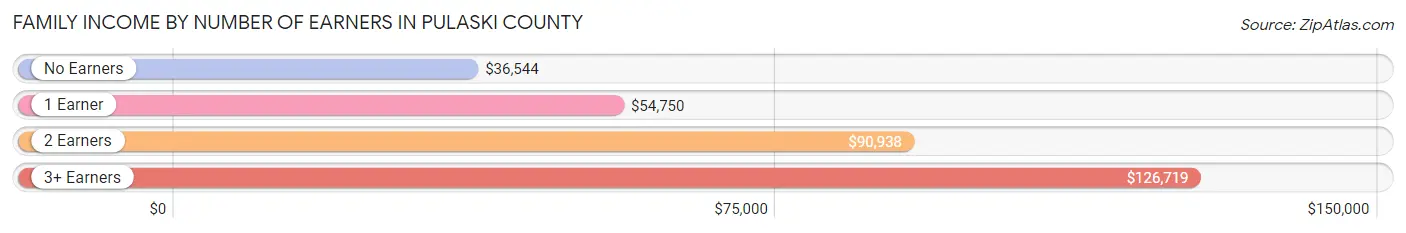
The median family income in Pulaski County is $59,957, with families comprising 3+ earners (44) having the highest median family income of $126,719, while families with no earners (392) have the lowest median family income of $36,544, accounting for 3.9% and 34.7% of families, respectively.
| Number of Earners | # Families | Median Income |
| No Earners | 392 (34.7%) | $36,544 |
| 1 Earner | 335 (29.7%) | $54,750 |
| 2 Earners | 358 (31.7%) | $90,938 |
| 3+ Earners | 44 (3.9%) | $126,719 |
| Total | 1,129 (100.0%) | $59,957 |
Household Income in Pulaski County
Household Income Brackets in Pulaski County
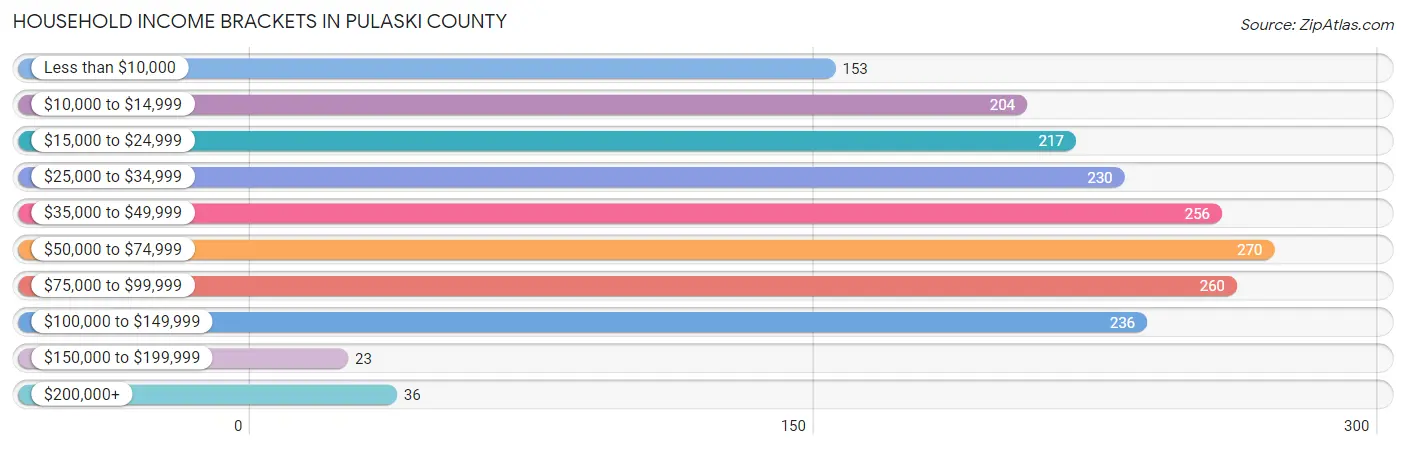
With 270 households falling in the category, the $50,000 to $74,999 income range is the most frequent in Pulaski County, accounting for 14.3% of all households. In contrast, only 23 households (1.2%) fall into the $150,000 to $199,999 income bracket, making it the least populous group.
| Income Bracket | # Households | % Households |
| Less than $10,000 | 153 | 8.1% |
| $10,000 to $14,999 | 204 | 10.8% |
| $15,000 to $24,999 | 217 | 11.5% |
| $25,000 to $34,999 | 230 | 12.2% |
| $35,000 to $49,999 | 256 | 13.6% |
| $50,000 to $74,999 | 270 | 14.3% |
| $75,000 to $99,999 | 260 | 13.8% |
| $100,000 to $149,999 | 236 | 12.5% |
| $150,000 to $199,999 | 23 | 1.2% |
| $200,000+ | 36 | 1.9% |
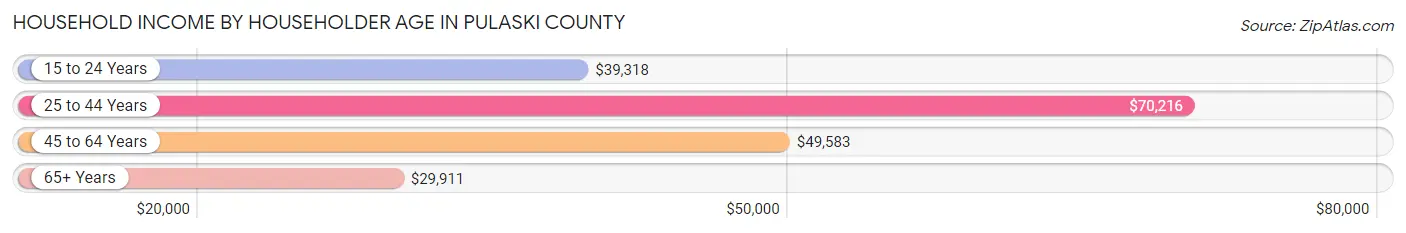
Household Income by Householder Age in Pulaski County
The median household income in Pulaski County is $41,038, with the highest median household income of $70,216 found in the 25 to 44 years age bracket for the primary householder. A total of 275 households (14.6%) fall into this category. Meanwhile, the 65+ years age bracket for the primary householder has the lowest median household income of $29,911, with 754 households (40.0%) in this group.
| Income Bracket | # Households | Median Income |
| 15 to 24 Years | 60 (3.2%) | $39,318 |
| 25 to 44 Years | 275 (14.6%) | $70,216 |
| 45 to 64 Years | 797 (42.3%) | $49,583 |
| 65+ Years | 754 (40.0%) | $29,911 |
| Total | 1,886 (100.0%) | $41,038 |
Poverty in Pulaski County
Income Below Poverty by Sex and Age in Pulaski County
With 20.3% poverty level for males and 29.7% for females among the residents of Pulaski County, 6 to 11 year old males and 16 and 17 year old females are the most vulnerable to poverty, with 62 males (47.3%) and 55 females (83.3%) in their respective age groups living below the poverty level.
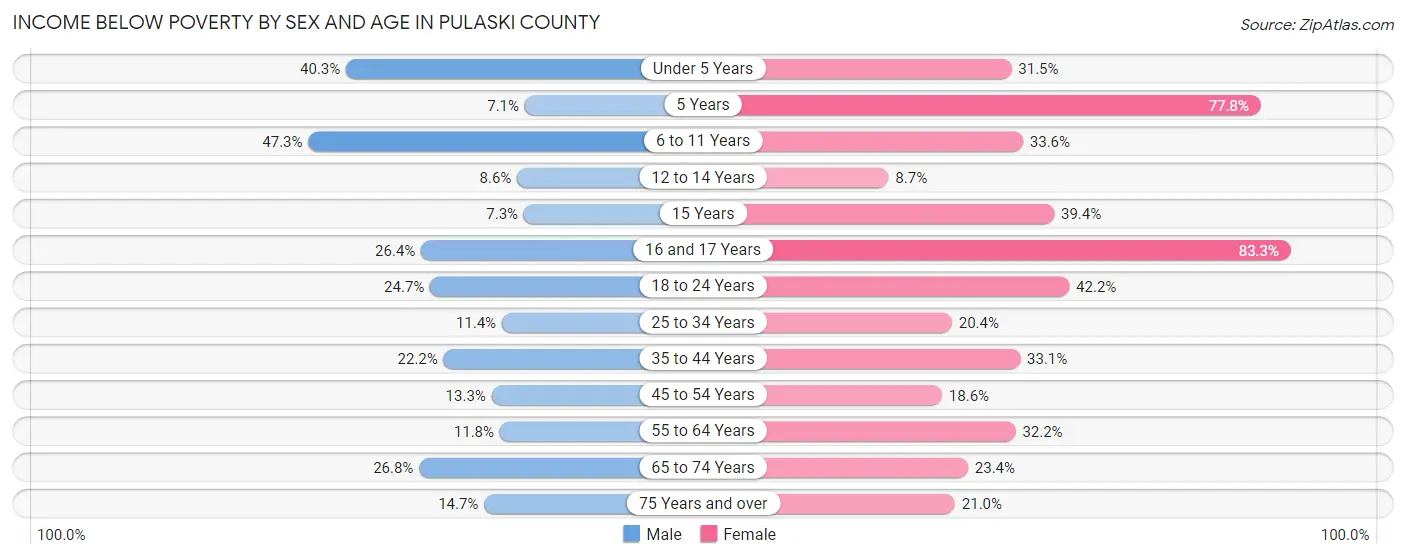
| Age Bracket | Male | Female |
| Under 5 Years | 50 (40.3%) | 45 (31.5%) |
| 5 Years | 3 (7.1%) | 42 (77.8%) |
| 6 to 11 Years | 62 (47.3%) | 41 (33.6%) |
| 12 to 14 Years | 9 (8.6%) | 9 (8.6%) |
| 15 Years | 3 (7.3%) | 13 (39.4%) |
| 16 and 17 Years | 19 (26.4%) | 55 (83.3%) |
| 18 to 24 Years | 67 (24.7%) | 92 (42.2%) |
| 25 to 34 Years | 22 (11.4%) | 39 (20.4%) |
| 35 to 44 Years | 76 (22.2%) | 96 (33.1%) |
| 45 to 54 Years | 41 (13.3%) | 60 (18.6%) |
| 55 to 64 Years | 43 (11.8%) | 127 (32.2%) |
| 65 to 74 Years | 91 (26.8%) | 84 (23.4%) |
| 75 Years and over | 31 (14.7%) | 51 (21.0%) |
| Total | 517 (20.3%) | 754 (29.7%) |
Income Above Poverty by Sex and Age in Pulaski County
According to the poverty statistics in Pulaski County, males aged 5 years and females aged 12 to 14 years are the age groups that are most secure financially, with 92.9% of males and 91.3% of females in these age groups living above the poverty line.
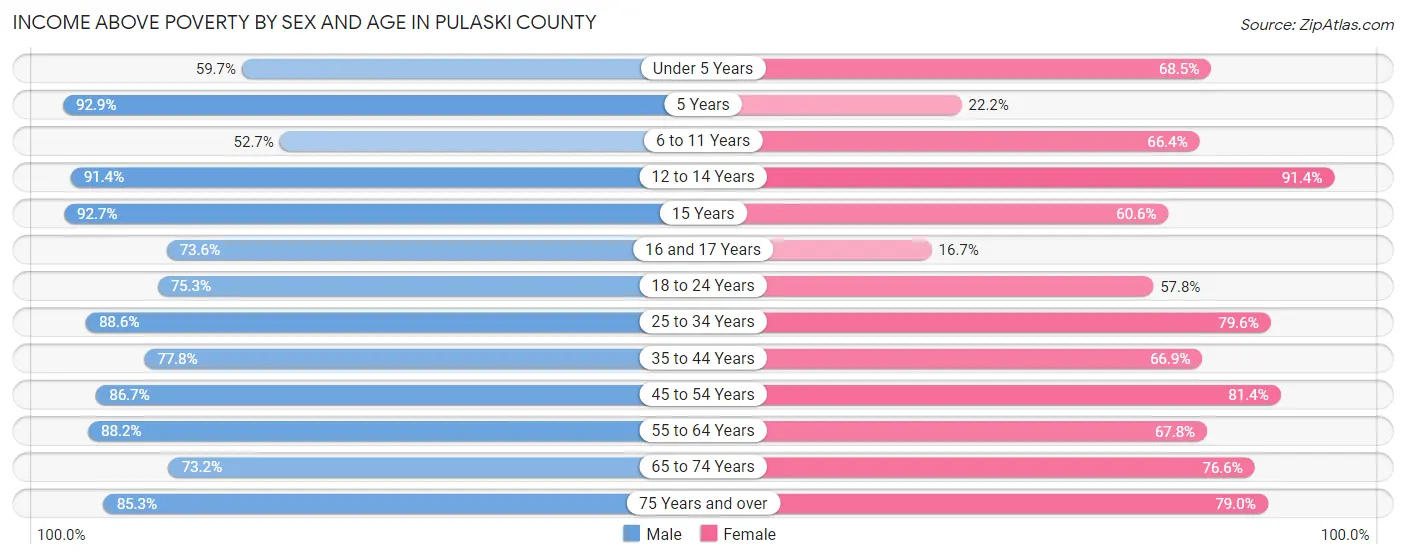
| Age Bracket | Male | Female |
| Under 5 Years | 74 (59.7%) | 98 (68.5%) |
| 5 Years | 39 (92.9%) | 12 (22.2%) |
| 6 to 11 Years | 69 (52.7%) | 81 (66.4%) |
| 12 to 14 Years | 96 (91.4%) | 95 (91.3%) |
| 15 Years | 38 (92.7%) | 20 (60.6%) |
| 16 and 17 Years | 53 (73.6%) | 11 (16.7%) |
| 18 to 24 Years | 204 (75.3%) | 126 (57.8%) |
| 25 to 34 Years | 171 (88.6%) | 152 (79.6%) |
| 35 to 44 Years | 266 (77.8%) | 194 (66.9%) |
| 45 to 54 Years | 267 (86.7%) | 263 (81.4%) |
| 55 to 64 Years | 322 (88.2%) | 267 (67.8%) |
| 65 to 74 Years | 249 (73.2%) | 275 (76.6%) |
| 75 Years and over | 180 (85.3%) | 192 (79.0%) |
| Total | 2,028 (79.7%) | 1,786 (70.3%) |
Income Below Poverty Among Married-Couple Families in Pulaski County
The poverty statistics for married-couple families in Pulaski County show that 6.7% or 57 of the total 851 families live below the poverty line. Families with 1 or 2 children have the highest poverty rate of 12.3%, comprising of 26 families. On the other hand, families with no children have the lowest poverty rate of 4.5%, which includes 27 families.
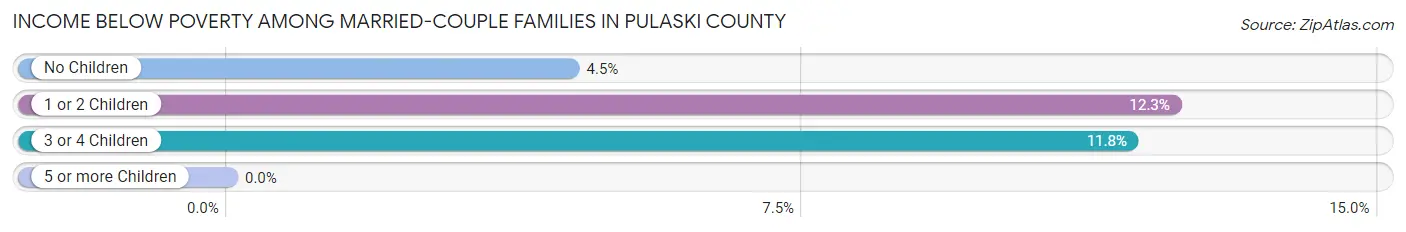
| Children | Above Poverty | Below Poverty |
| No Children | 579 (95.5%) | 27 (4.5%) |
| 1 or 2 Children | 185 (87.7%) | 26 (12.3%) |
| 3 or 4 Children | 30 (88.2%) | 4 (11.8%) |
| 5 or more Children | 0 (0.0%) | 0 (0.0%) |
| Total | 794 (93.3%) | 57 (6.7%) |
Income Below Poverty Among Single-Parent Households in Pulaski County
According to the poverty data in Pulaski County, 22.2% or 10 single-father households and 45.1% or 105 single-mother households are living below the poverty line. Among single-father households, those with 5 or more children have the highest poverty rate, with 2 households (100.0%) experiencing poverty. Likewise, among single-mother households, those with 3 or 4 children have the highest poverty rate, with 27 households (62.8%) falling below the poverty line.
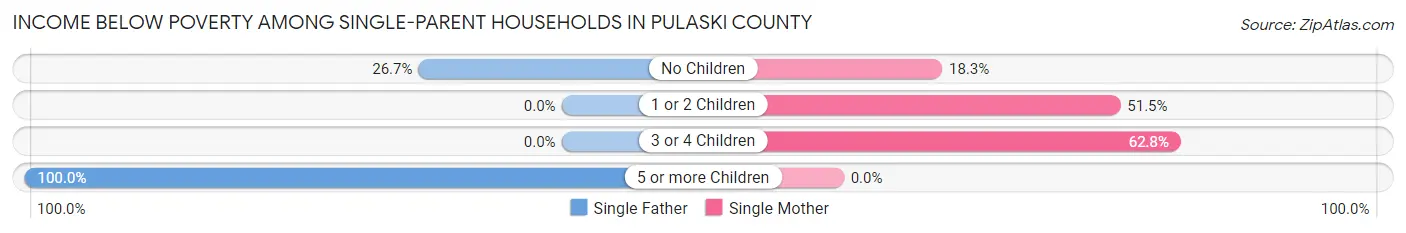
| Children | Single Father | Single Mother |
| No Children | 8 (26.7%) | 11 (18.3%) |
| 1 or 2 Children | 0 (0.0%) | 67 (51.5%) |
| 3 or 4 Children | 0 (0.0%) | 27 (62.8%) |
| 5 or more Children | 2 (100.0%) | 0 (0.0%) |
| Total | 10 (22.2%) | 105 (45.1%) |
Income Below Poverty Among Married-Couple vs Single-Parent Households in Pulaski County
The poverty data for Pulaski County shows that 57 of the married-couple family households (6.7%) and 115 of the single-parent households (41.4%) are living below the poverty level. Within the married-couple family households, those with 1 or 2 children have the highest poverty rate, with 26 households (12.3%) falling below the poverty line. Among the single-parent households, those with 5 or more children have the highest poverty rate, with 2 household (100.0%) living below poverty.
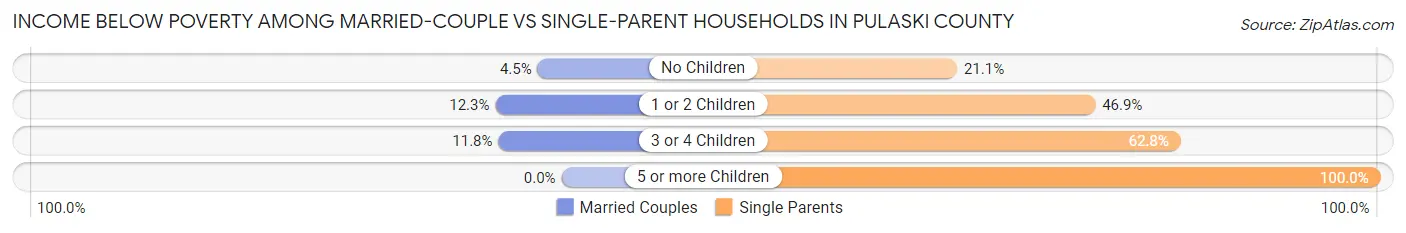
| Children | Married-Couple Families | Single-Parent Households |
| No Children | 27 (4.5%) | 19 (21.1%) |
| 1 or 2 Children | 26 (12.3%) | 67 (46.9%) |
| 3 or 4 Children | 4 (11.8%) | 27 (62.8%) |
| 5 or more Children | 0 (0.0%) | 2 (100.0%) |
| Total | 57 (6.7%) | 115 (41.4%) |
Race in Pulaski County
The most populous races in Pulaski County are White / Caucasian (3,304 | 63.8%), Black / African American (1,630 | 31.5%), and Two or more Races (229 | 4.4%).
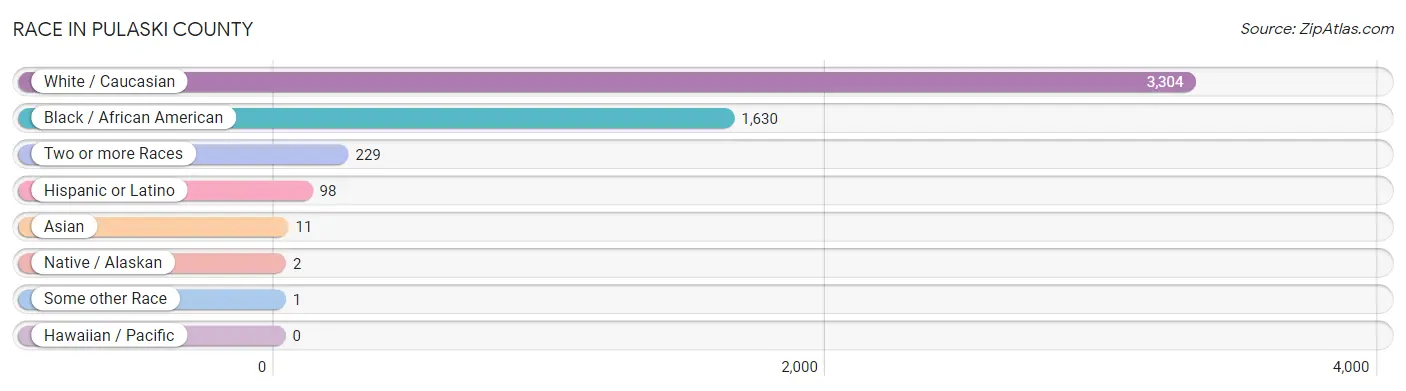
| Race | # Population | % Population |
| Asian | 11 | 0.2% |
| Black / African American | 1,630 | 31.5% |
| Hawaiian / Pacific | 0 | 0.0% |
| Hispanic or Latino | 98 | 1.9% |
| Native / Alaskan | 2 | 0.0% |
| White / Caucasian | 3,304 | 63.8% |
| Two or more Races | 229 | 4.4% |
| Some other Race | 1 | 0.0% |
| Total | 5,177 | 100.0% |
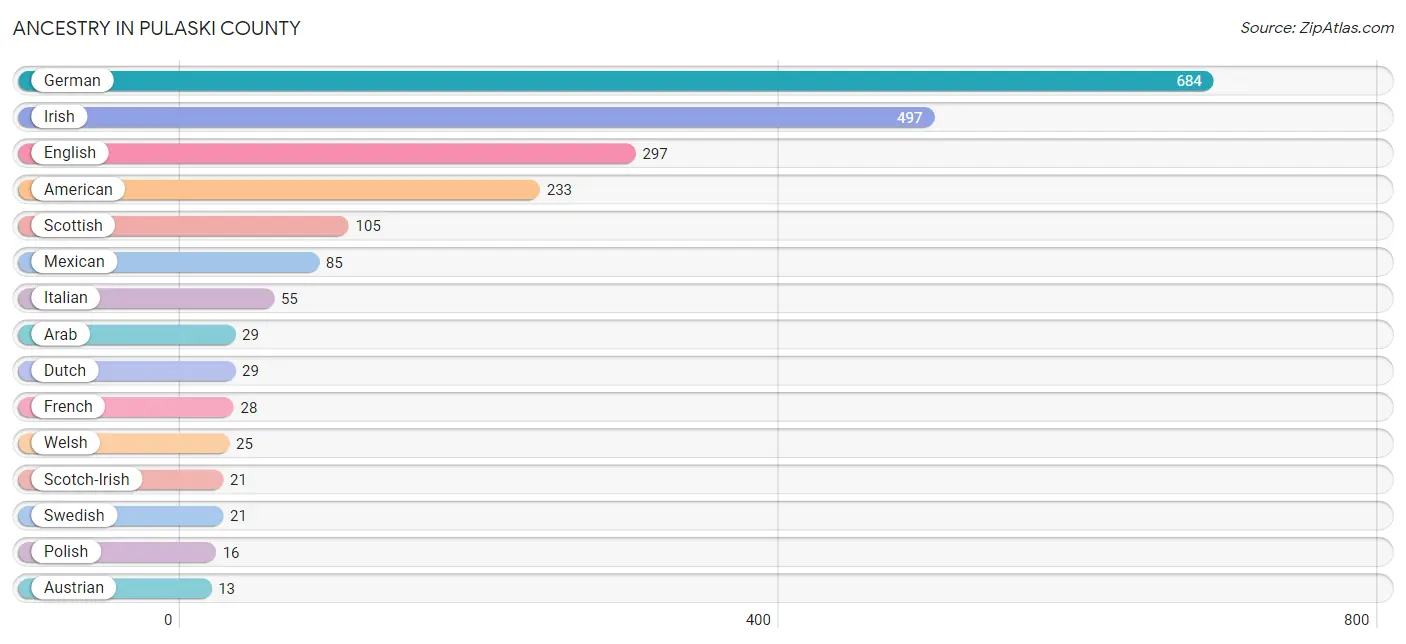
Ancestry in Pulaski County
The most populous ancestries reported in Pulaski County are German (684 | 13.2%), Irish (497 | 9.6%), English (297 | 5.7%), American (233 | 4.5%), and Scottish (105 | 2.0%), together accounting for 35.1% of all Pulaski County residents.
| Ancestry | # Population | % Population |
| African | 4 | 0.1% |
| American | 233 | 4.5% |
| Arab | 29 | 0.6% |
| Austrian | 13 | 0.3% |
| British | 2 | 0.0% |
| Canadian | 6 | 0.1% |
| Cherokee | 2 | 0.0% |
| Cuban | 6 | 0.1% |
| Czechoslovakian | 4 | 0.1% |
| Dutch | 29 | 0.6% |
| English | 297 | 5.7% |
| European | 4 | 0.1% |
| French | 28 | 0.5% |
| German | 684 | 13.2% |
| Guamanian / Chamorro | 1 | 0.0% |
| Irish | 497 | 9.6% |
| Italian | 55 | 1.1% |
| Korean | 9 | 0.2% |
| Lithuanian | 4 | 0.1% |
| Mexican | 85 | 1.6% |
| Norwegian | 2 | 0.0% |
| Polish | 16 | 0.3% |
| Russian | 2 | 0.0% |
| Scandinavian | 7 | 0.1% |
| Scotch-Irish | 21 | 0.4% |
| Scottish | 105 | 2.0% |
| Serbian | 2 | 0.0% |
| Slovak | 11 | 0.2% |
| South American | 2 | 0.0% |
| Spanish | 4 | 0.1% |
| Subsaharan African | 4 | 0.1% |
| Swedish | 21 | 0.4% |
| Swiss | 11 | 0.2% |
| Venezuelan | 2 | 0.0% |
| Welsh | 25 | 0.5% | View All 35 Rows |
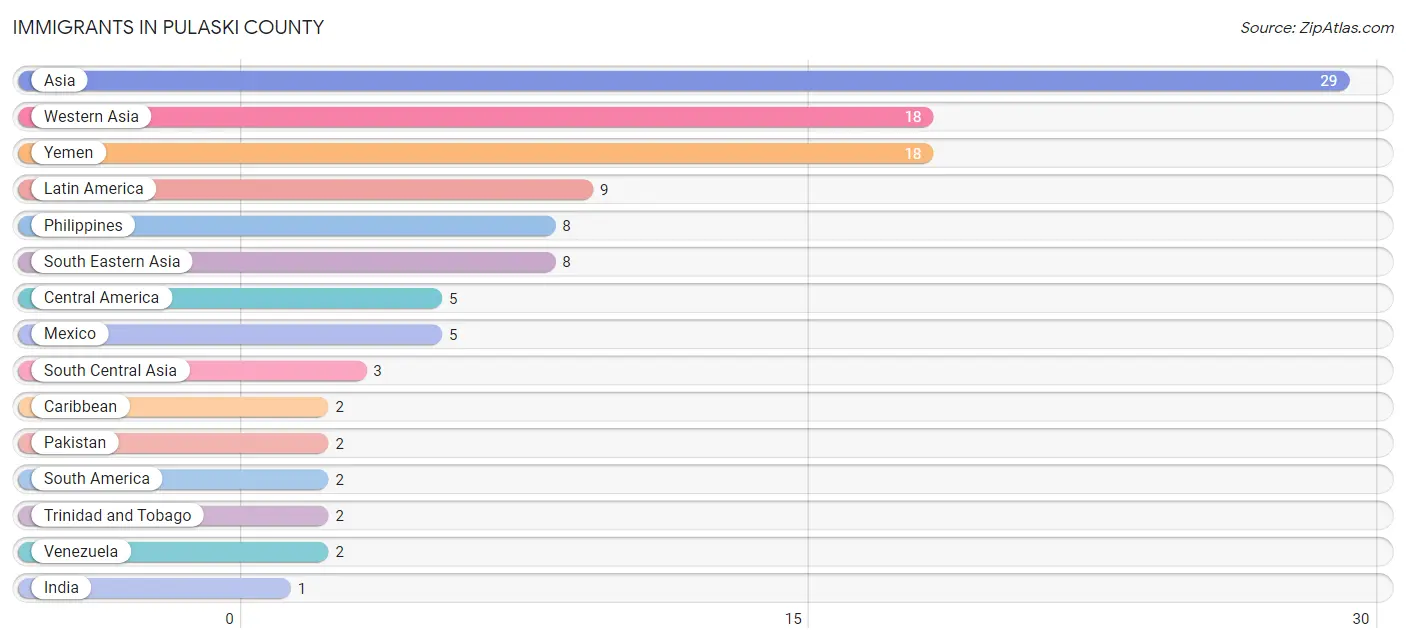
Immigrants in Pulaski County
The most numerous immigrant groups reported in Pulaski County came from Asia (29 | 0.6%), Western Asia (18 | 0.4%), Yemen (18 | 0.4%), Latin America (9 | 0.2%), and Philippines (8 | 0.2%), together accounting for 1.6% of all Pulaski County residents.
| Immigration Origin | # Population | % Population |
| Asia | 29 | 0.6% |
| Caribbean | 2 | 0.0% |
| Central America | 5 | 0.1% |
| India | 1 | 0.0% |
| Latin America | 9 | 0.2% |
| Mexico | 5 | 0.1% |
| Pakistan | 2 | 0.0% |
| Philippines | 8 | 0.2% |
| South America | 2 | 0.0% |
| South Central Asia | 3 | 0.1% |
| South Eastern Asia | 8 | 0.2% |
| Trinidad and Tobago | 2 | 0.0% |
| Venezuela | 2 | 0.0% |
| Western Asia | 18 | 0.4% |
| Yemen | 18 | 0.4% | View All 15 Rows |
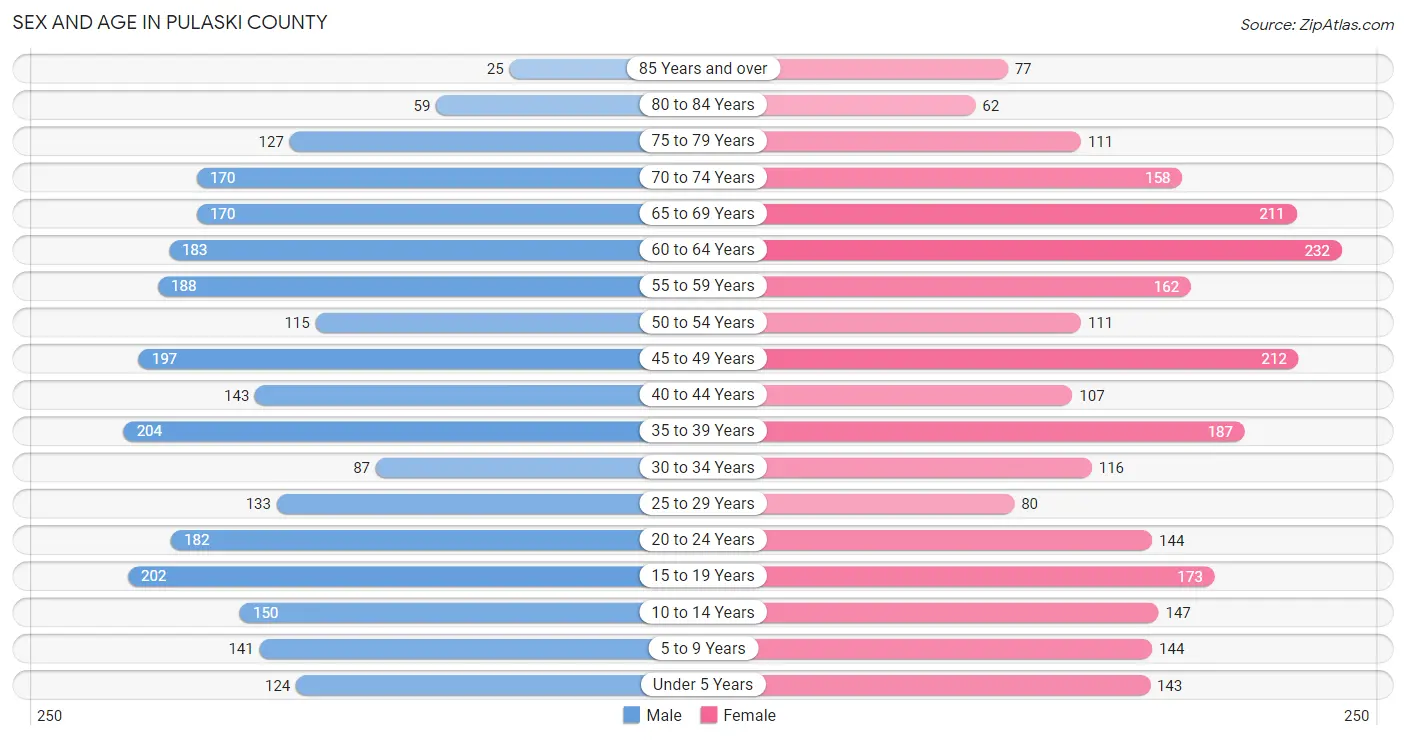
Sex and Age in Pulaski County
Sex and Age in Pulaski County
The most populous age groups in Pulaski County are 35 to 39 Years (204 | 7.9%) for men and 60 to 64 Years (232 | 9.0%) for women.
| Age Bracket | Male | Female |
| Under 5 Years | 124 (4.8%) | 143 (5.6%) |
| 5 to 9 Years | 141 (5.4%) | 144 (5.6%) |
| 10 to 14 Years | 150 (5.8%) | 147 (5.7%) |
| 15 to 19 Years | 202 (7.8%) | 173 (6.7%) |
| 20 to 24 Years | 182 (7.0%) | 144 (5.6%) |
| 25 to 29 Years | 133 (5.1%) | 80 (3.1%) |
| 30 to 34 Years | 87 (3.4%) | 116 (4.5%) |
| 35 to 39 Years | 204 (7.9%) | 187 (7.3%) |
| 40 to 44 Years | 143 (5.5%) | 107 (4.2%) |
| 45 to 49 Years | 197 (7.6%) | 212 (8.2%) |
| 50 to 54 Years | 115 (4.4%) | 111 (4.3%) |
| 55 to 59 Years | 188 (7.2%) | 162 (6.3%) |
| 60 to 64 Years | 183 (7.0%) | 232 (9.0%) |
| 65 to 69 Years | 170 (6.5%) | 211 (8.2%) |
| 70 to 74 Years | 170 (6.5%) | 158 (6.1%) |
| 75 to 79 Years | 127 (4.9%) | 111 (4.3%) |
| 80 to 84 Years | 59 (2.3%) | 62 (2.4%) |
| 85 Years and over | 25 (1.0%) | 77 (3.0%) |
| Total | 2,600 (100.0%) | 2,577 (100.0%) |
Families and Households in Pulaski County
Median Family Size in Pulaski County
The median family size in Pulaski County is 3.52 persons per family, with single female/mother families (233 | 20.6%) accounting for the largest median family size of 5.19 persons per family. On the other hand, married-couple families (851 | 75.4%) represent the smallest median family size with 2.98 persons per family.

| Family Type | # Families | Family Size |
| Married-Couple | 851 (75.4%) | 2.98 |
| Single Male/Father | 45 (4.0%) | 4.93 |
| Single Female/Mother | 233 (20.6%) | 5.19 |
| Total Families | 1,129 (100.0%) | 3.52 |
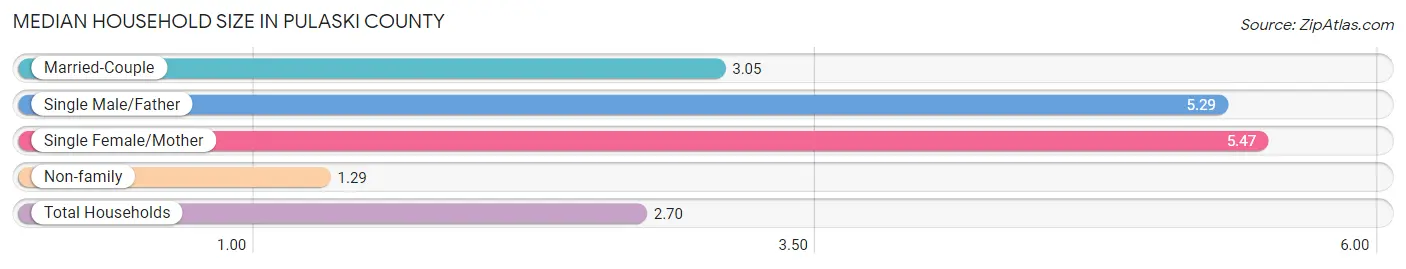
Median Household Size in Pulaski County
The median household size in Pulaski County is 2.70 persons per household, with single female/mother households (233 | 12.3%) accounting for the largest median household size of 5.47 persons per household. non-family households (757 | 40.1%) represent the smallest median household size with 1.29 persons per household.
| Household Type | # Households | Household Size |
| Married-Couple | 851 (45.1%) | 3.05 |
| Single Male/Father | 45 (2.4%) | 5.29 |
| Single Female/Mother | 233 (12.3%) | 5.47 |
| Non-family | 757 (40.1%) | 1.29 |
| Total Households | 1,886 (100.0%) | 2.70 |
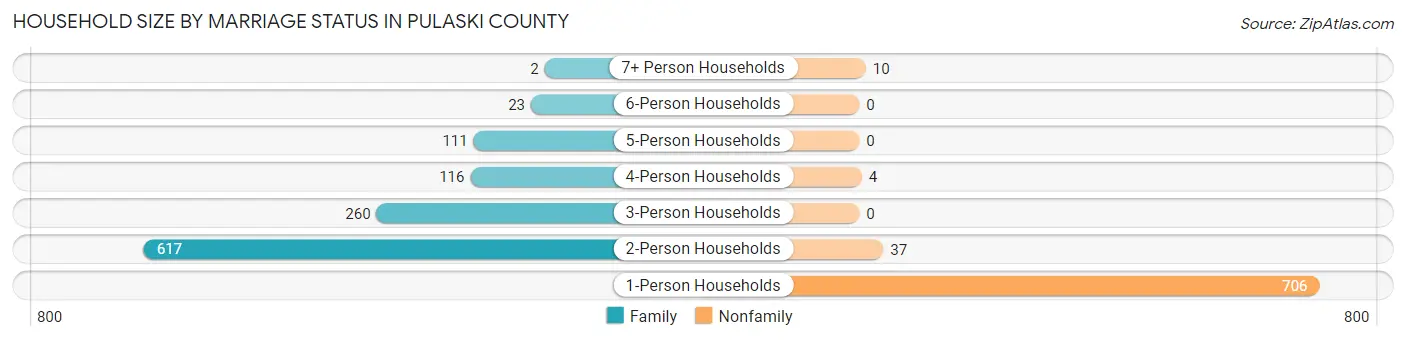
Household Size by Marriage Status in Pulaski County
Out of a total of 1,886 households in Pulaski County, 1,129 (59.9%) are family households, while 757 (40.1%) are nonfamily households. The most numerous type of family households are 2-person households, comprising 617, and the most common type of nonfamily households are 1-person households, comprising 706.
| Household Size | Family Households | Nonfamily Households |
| 1-Person Households | - | 706 (37.4%) |
| 2-Person Households | 617 (32.7%) | 37 (2.0%) |
| 3-Person Households | 260 (13.8%) | 0 (0.0%) |
| 4-Person Households | 116 (6.1%) | 4 (0.2%) |
| 5-Person Households | 111 (5.9%) | 0 (0.0%) |
| 6-Person Households | 23 (1.2%) | 0 (0.0%) |
| 7+ Person Households | 2 (0.1%) | 10 (0.5%) |
| Total | 1,129 (59.9%) | 757 (40.1%) |
Female Fertility in Pulaski County
Fertility by Age in Pulaski County
Average fertility rate in Pulaski County is 38.0 births per 1,000 women. Women in the age bracket of 15 to 19 years have the highest fertility rate with 133.0 births per 1,000 women. Women in the age bracket of 15 to 19 years acount for 57.5% of all women with births.
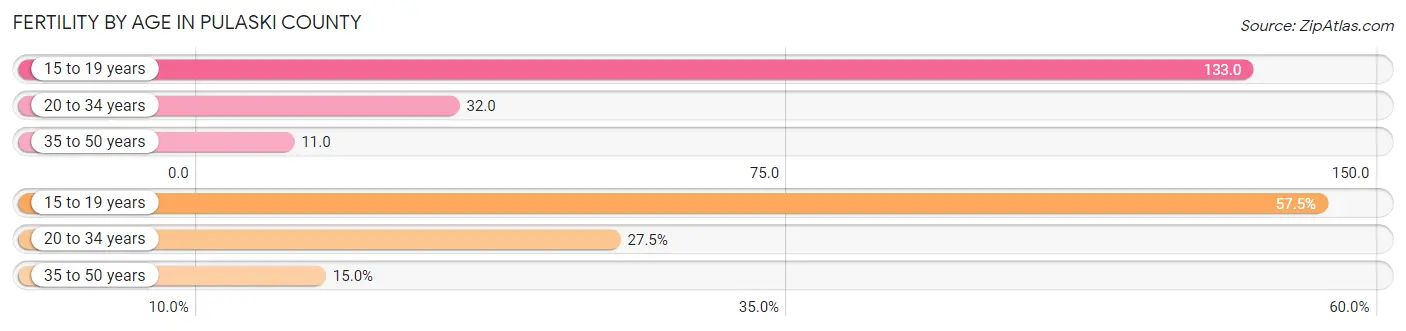
| Age Bracket | Women with Births | Births / 1,000 Women |
| 15 to 19 years | 23 (57.5%) | 133.0 |
| 20 to 34 years | 11 (27.5%) | 32.0 |
| 35 to 50 years | 6 (15.0%) | 11.0 |
| Total | 40 (100.0%) | 38.0 |
Fertility by Age by Marriage Status in Pulaski County
25.0% of women with births (40) in Pulaski County are married. The highest percentage of unmarried women with births falls into 15 to 19 years age bracket with 100.0% of them unmarried at the time of birth, while the lowest percentage of unmarried women with births belong to 20 to 34 years age bracket with 9.1% of them unmarried.
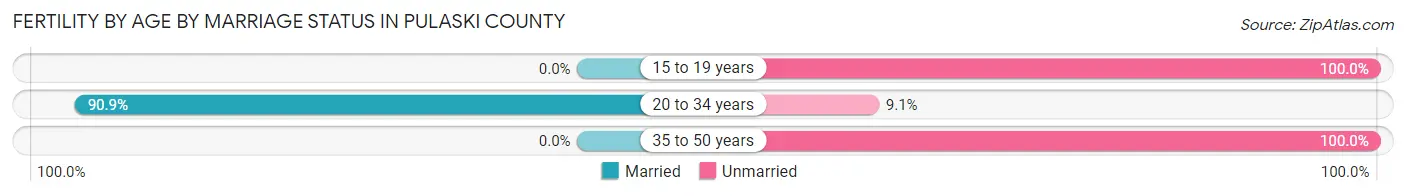
| Age Bracket | Married | Unmarried |
| 15 to 19 years | 0 (0.0%) | 23 (100.0%) |
| 20 to 34 years | 10 (90.9%) | 1 (9.1%) |
| 35 to 50 years | 0 (0.0%) | 6 (100.0%) |
| Total | 10 (25.0%) | 30 (75.0%) |
Fertility by Education in Pulaski County
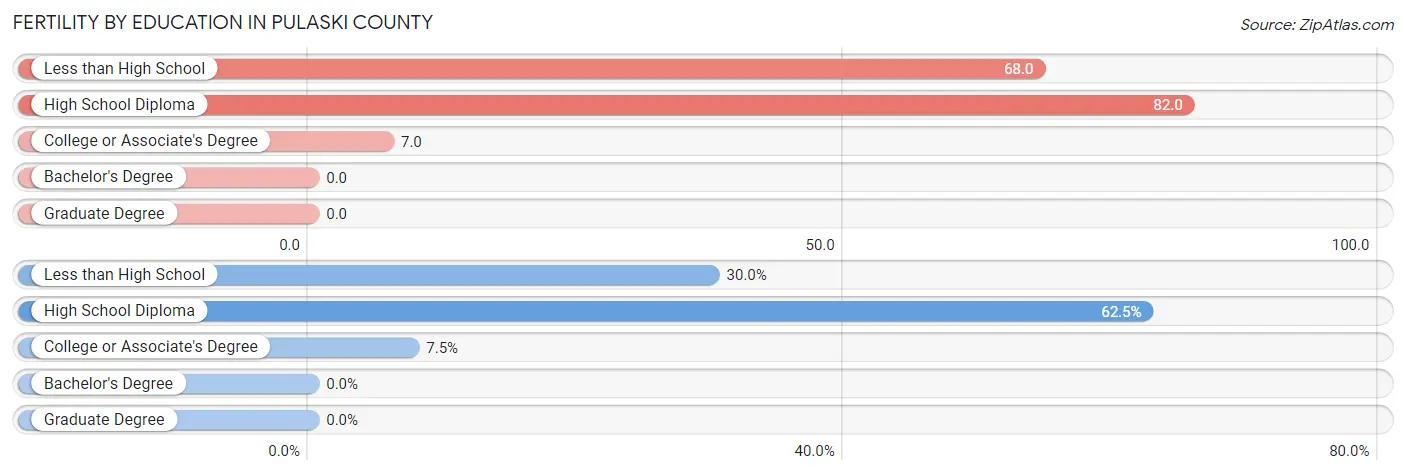
| Educational Attainment | Women with Births | Births / 1,000 Women |
| Less than High School | 12 (30.0%) | 68.0 |
| High School Diploma | 25 (62.5%) | 82.0 |
| College or Associate's Degree | 3 (7.5%) | 7.0 |
| Bachelor's Degree | 0 (0.0%) | 0.0 |
| Graduate Degree | 0 (0.0%) | 0.0 |
| Total | 40 (100.0%) | 38.0 |
Fertility by Education by Marriage Status in Pulaski County
75.0% of women with births in Pulaski County are unmarried. Women with the educational attainment of college or associate's degree are most likely to be married with 66.7% of them married at childbirth, while women with the educational attainment of high school diploma are least likely to be married with 92.0% of them unmarried at childbirth.
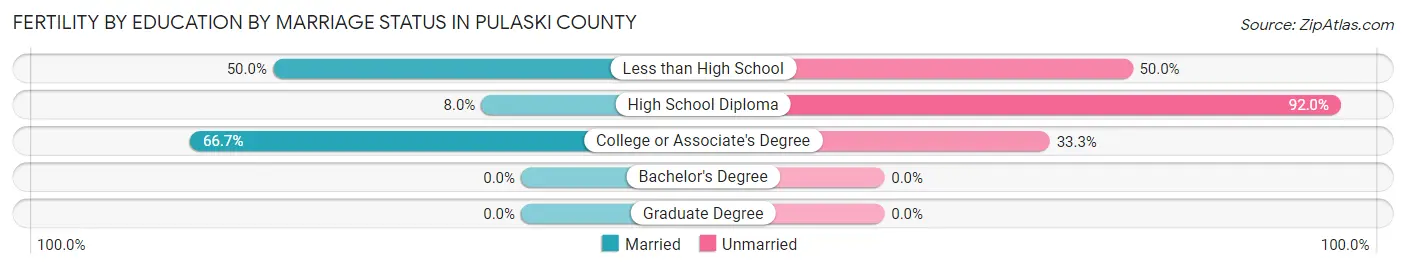
| Educational Attainment | Married | Unmarried |
| Less than High School | 6 (50.0%) | 6 (50.0%) |
| High School Diploma | 2 (8.0%) | 23 (92.0%) |
| College or Associate's Degree | 2 (66.7%) | 1 (33.3%) |
| Bachelor's Degree | 0 (0.0%) | 0 (0.0%) |
| Graduate Degree | 0 (0.0%) | 0 (0.0%) |
| Total | 10 (25.0%) | 30 (75.0%) |
Employment Characteristics in Pulaski County
Employment by Class of Employer in Pulaski County
Among the 1,690 employed individuals in Pulaski County, private company employees (1,034 | 61.2%), state government employees (274 | 16.2%), and self-employed (incorporated) (111 | 6.6%) make up the most common classes of employment.
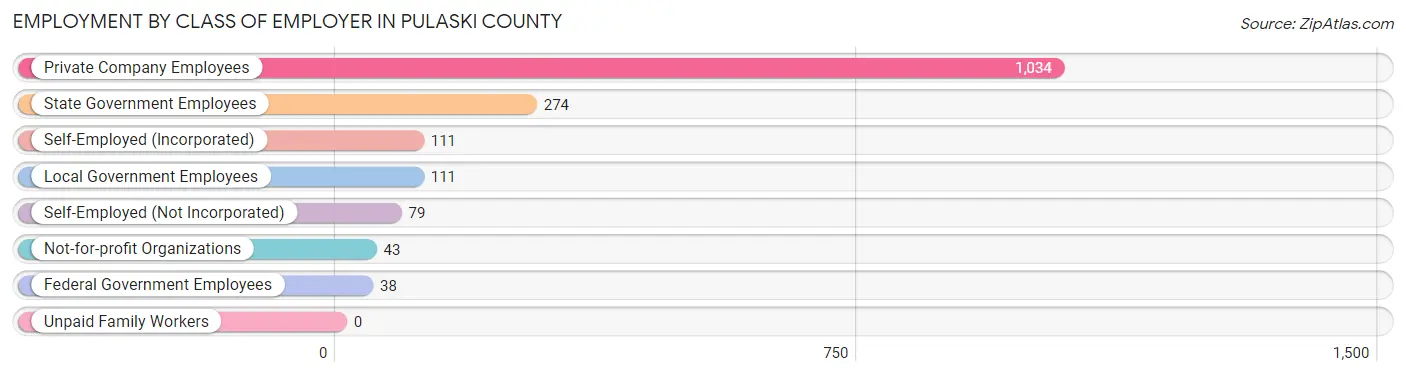
| Employer Class | # Employees | % Employees |
| Private Company Employees | 1,034 | 61.2% |
| Self-Employed (Incorporated) | 111 | 6.6% |
| Self-Employed (Not Incorporated) | 79 | 4.7% |
| Not-for-profit Organizations | 43 | 2.5% |
| Local Government Employees | 111 | 6.6% |
| State Government Employees | 274 | 16.2% |
| Federal Government Employees | 38 | 2.2% |
| Unpaid Family Workers | 0 | 0.0% |
| Total | 1,690 | 100.0% |
Employment Status by Age in Pulaski County
According to the labor force statistics for Pulaski County, out of the total population over 16 years of age (4,254), 43.6% or 1,855 individuals are in the labor force, with 4.2% or 78 of them unemployed. The age group with the highest labor force participation rate is 35 to 44 years, with 77.2% or 495 individuals in the labor force. Within the labor force, the 16 to 19 years age range has the highest percentage of unemployed individuals, with 19.3% or 11 of them being unemployed.
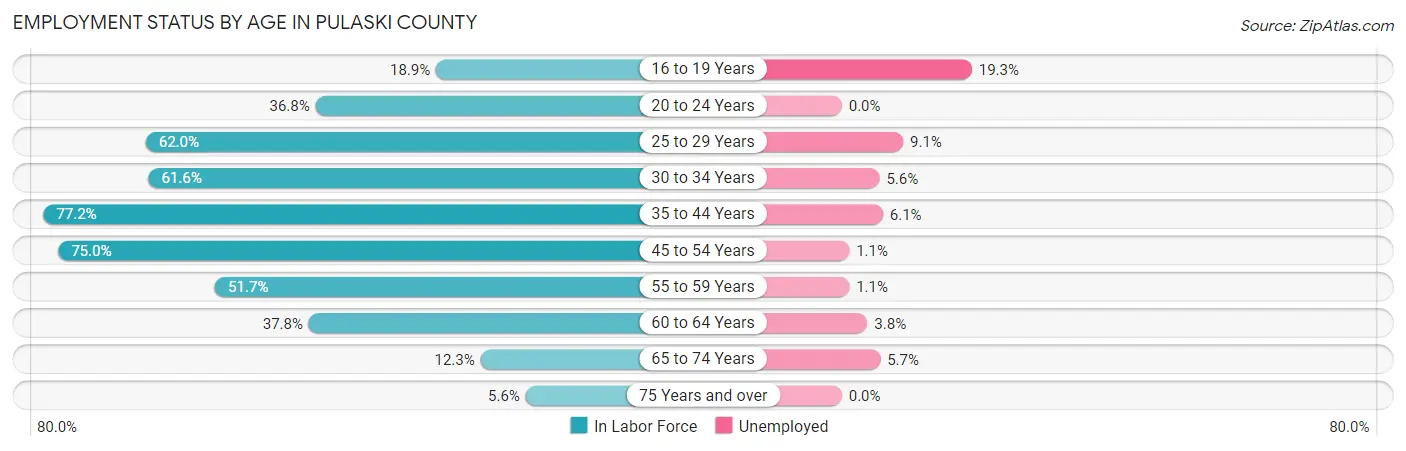
| Age Bracket | In Labor Force | Unemployed |
| 16 to 19 Years | 57 (18.9%) | 11 (19.3%) |
| 20 to 24 Years | 120 (36.8%) | 0 (0.0%) |
| 25 to 29 Years | 132 (62.0%) | 12 (9.1%) |
| 30 to 34 Years | 125 (61.6%) | 7 (5.6%) |
| 35 to 44 Years | 495 (77.2%) | 30 (6.1%) |
| 45 to 54 Years | 476 (75.0%) | 5 (1.1%) |
| 55 to 59 Years | 181 (51.7%) | 2 (1.1%) |
| 60 to 64 Years | 157 (37.8%) | 6 (3.8%) |
| 65 to 74 Years | 87 (12.3%) | 5 (5.7%) |
| 75 Years and over | 26 (5.6%) | 0 (0.0%) |
| Total | 1,855 (43.6%) | 78 (4.2%) |
Employment Status by Educational Attainment in Pulaski County
According to labor force statistics for Pulaski County, 63.7% of individuals (1,565) out of the total population between 25 and 64 years of age (2,457) are in the labor force, with 4.0% or 63 of them being unemployed. The group with the highest labor force participation rate are those with the educational attainment of bachelor's degree or higher, with 77.6% or 298 individuals in the labor force. Within the labor force, individuals with less than high school education have the highest percentage of unemployment, with 12.5% or 10 of them being unemployed.
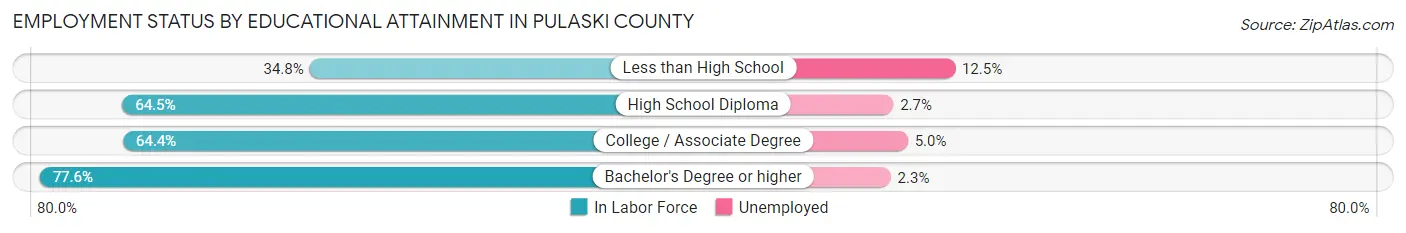
| Educational Attainment | In Labor Force | Unemployed |
| Less than High School | 80 (34.8%) | 29 (12.5%) |
| High School Diploma | 624 (64.5%) | 26 (2.7%) |
| College / Associate Degree | 564 (64.4%) | 44 (5.0%) |
| Bachelor's Degree or higher | 298 (77.6%) | 9 (2.3%) |
| Total | 1,565 (63.7%) | 98 (4.0%) |
Employment Occupations by Sex in Pulaski County
Management, Business, Science and Arts Occupations
The most common Management, Business, Science and Arts occupations in Pulaski County are Management (143 | 8.0%), Health Diagnosing & Treating (139 | 7.8%), Community & Social Service (132 | 7.4%), Health Technologists (114 | 6.4%), and Education Instruction & Library (68 | 3.8%).
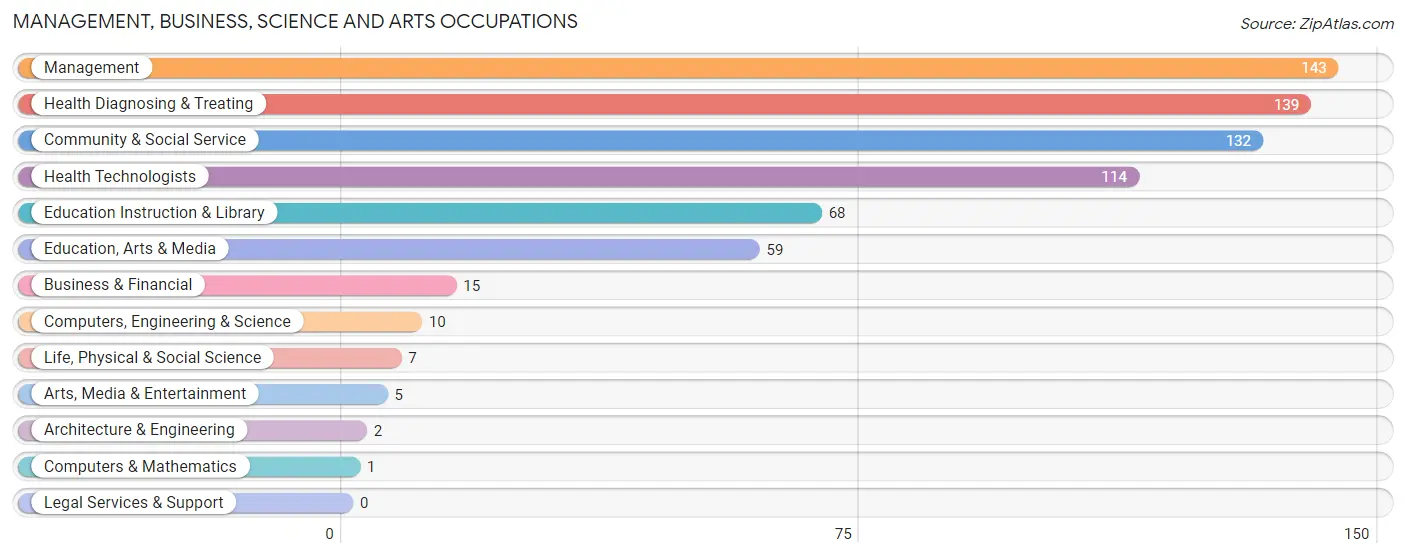
Management, Business, Science and Arts Occupations by Sex
Within the Management, Business, Science and Arts occupations in Pulaski County, the most male-oriented occupations are Architecture & Engineering (100.0%), Arts, Media & Entertainment (100.0%), and Management (60.8%), while the most female-oriented occupations are Computers & Mathematics (100.0%), Life, Physical & Social Science (100.0%), and Education, Arts & Media (100.0%).
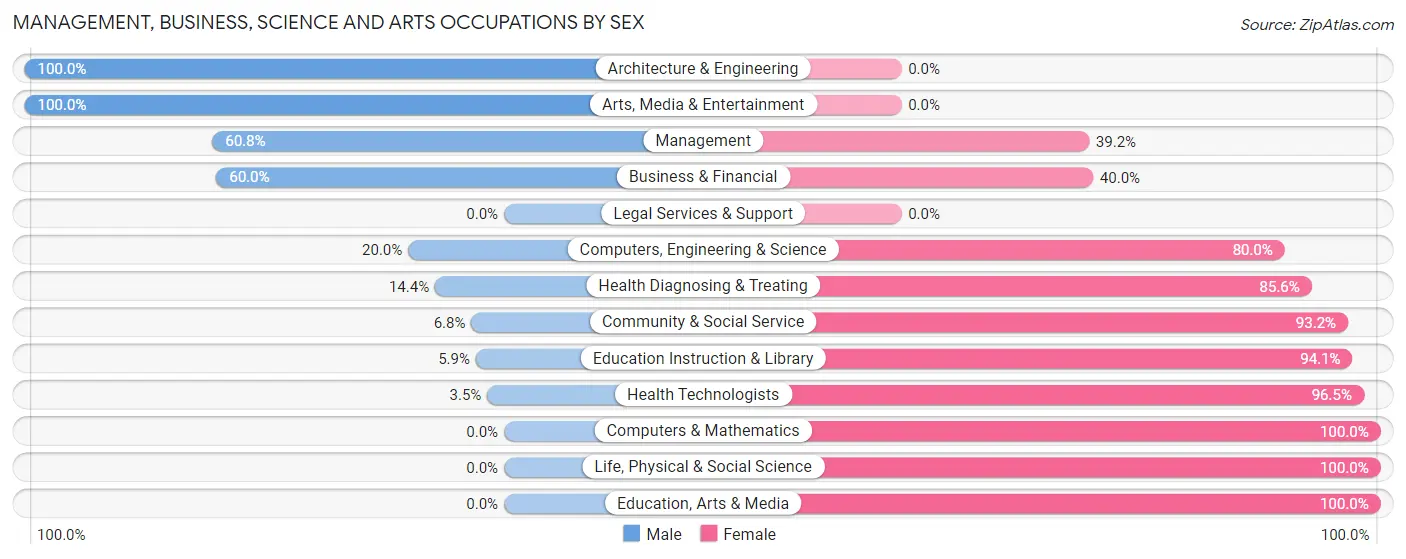
| Occupation | Male | Female |
| Management | 87 (60.8%) | 56 (39.2%) |
| Business & Financial | 9 (60.0%) | 6 (40.0%) |
| Computers, Engineering & Science | 2 (20.0%) | 8 (80.0%) |
| Computers & Mathematics | 0 (0.0%) | 1 (100.0%) |
| Architecture & Engineering | 2 (100.0%) | 0 (0.0%) |
| Life, Physical & Social Science | 0 (0.0%) | 7 (100.0%) |
| Community & Social Service | 9 (6.8%) | 123 (93.2%) |
| Education, Arts & Media | 0 (0.0%) | 59 (100.0%) |
| Legal Services & Support | 0 (0.0%) | 0 (0.0%) |
| Education Instruction & Library | 4 (5.9%) | 64 (94.1%) |
| Arts, Media & Entertainment | 5 (100.0%) | 0 (0.0%) |
| Health Diagnosing & Treating | 20 (14.4%) | 119 (85.6%) |
| Health Technologists | 4 (3.5%) | 110 (96.5%) |
| Total (Category) | 127 (28.9%) | 312 (71.1%) |
| Total (Overall) | 951 (53.5%) | 827 (46.5%) |
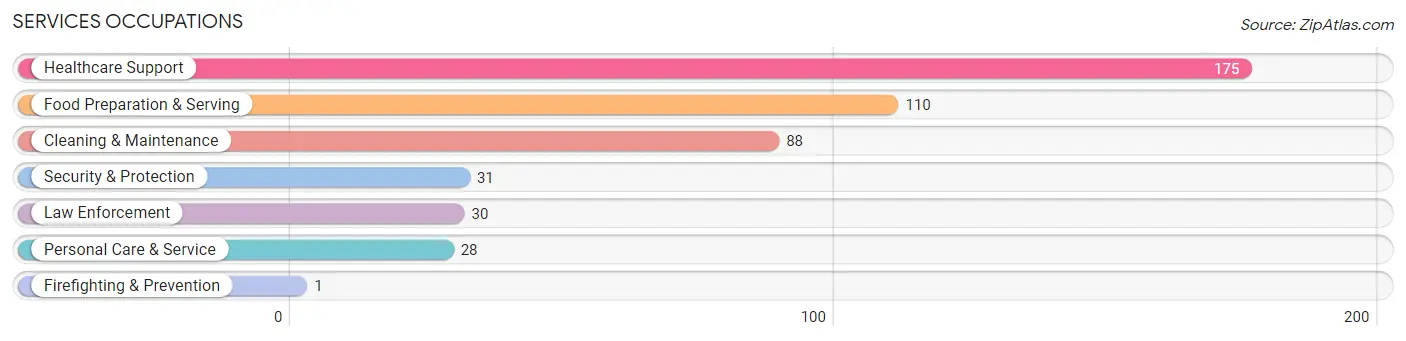
Services Occupations
The most common Services occupations in Pulaski County are Healthcare Support (175 | 9.8%), Food Preparation & Serving (110 | 6.2%), Cleaning & Maintenance (88 | 5.0%), Security & Protection (31 | 1.7%), and Law Enforcement (30 | 1.7%).
Services Occupations by Sex
Within the Services occupations in Pulaski County, the most male-oriented occupations are Firefighting & Prevention (100.0%), Security & Protection (90.3%), and Law Enforcement (90.0%), while the most female-oriented occupations are Personal Care & Service (100.0%), Food Preparation & Serving (64.5%), and Healthcare Support (63.4%).
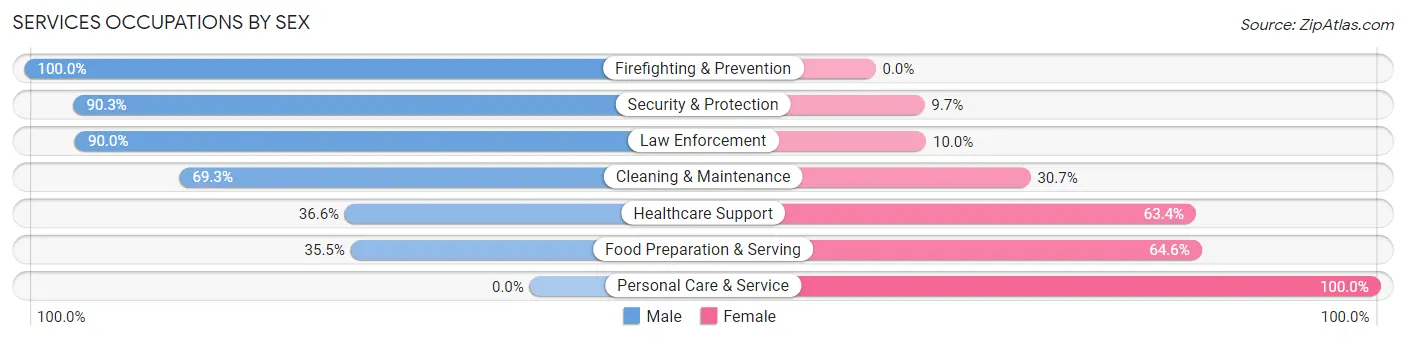
| Occupation | Male | Female |
| Healthcare Support | 64 (36.6%) | 111 (63.4%) |
| Security & Protection | 28 (90.3%) | 3 (9.7%) |
| Firefighting & Prevention | 1 (100.0%) | 0 (0.0%) |
| Law Enforcement | 27 (90.0%) | 3 (10.0%) |
| Food Preparation & Serving | 39 (35.4%) | 71 (64.5%) |
| Cleaning & Maintenance | 61 (69.3%) | 27 (30.7%) |
| Personal Care & Service | 0 (0.0%) | 28 (100.0%) |
| Total (Category) | 192 (44.4%) | 240 (55.6%) |
| Total (Overall) | 951 (53.5%) | 827 (46.5%) |
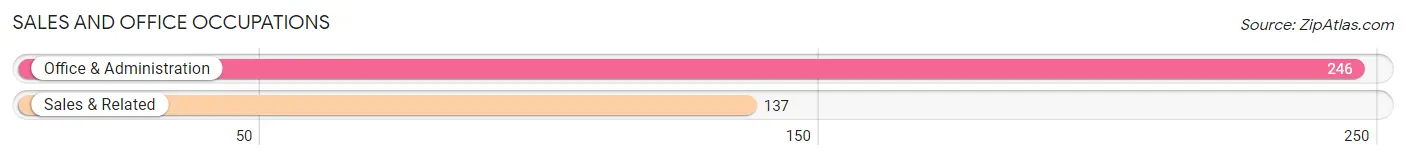
Sales and Office Occupations
The most common Sales and Office occupations in Pulaski County are Office & Administration (246 | 13.8%), and Sales & Related (137 | 7.7%).
Sales and Office Occupations by Sex
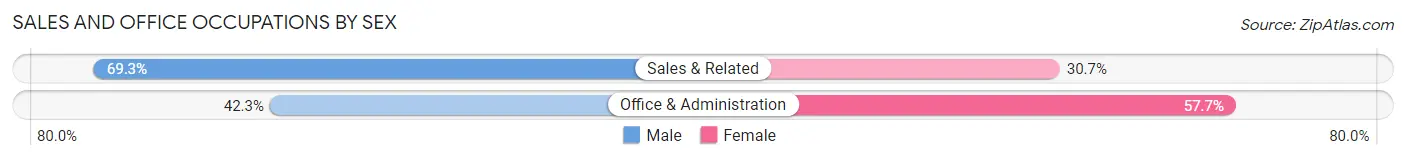
| Occupation | Male | Female |
| Sales & Related | 95 (69.3%) | 42 (30.7%) |
| Office & Administration | 104 (42.3%) | 142 (57.7%) |
| Total (Category) | 199 (52.0%) | 184 (48.0%) |
| Total (Overall) | 951 (53.5%) | 827 (46.5%) |
Natural Resources, Construction and Maintenance Occupations
The most common Natural Resources, Construction and Maintenance occupations in Pulaski County are Construction & Extraction (109 | 6.1%), Farming, Fishing & Forestry (67 | 3.8%), and Installation, Maintenance & Repair (46 | 2.6%).

Natural Resources, Construction and Maintenance Occupations by Sex
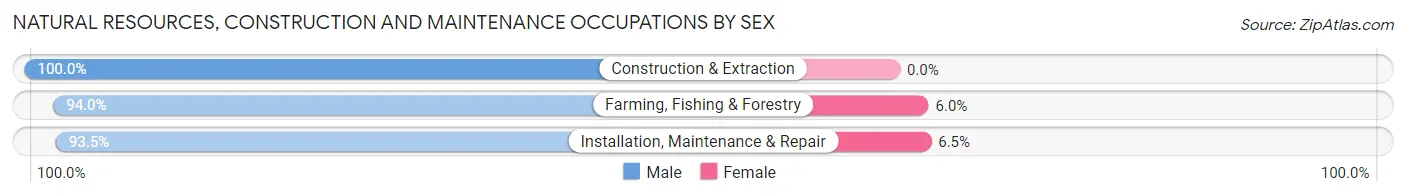
| Occupation | Male | Female |
| Farming, Fishing & Forestry | 63 (94.0%) | 4 (6.0%) |
| Construction & Extraction | 109 (100.0%) | 0 (0.0%) |
| Installation, Maintenance & Repair | 43 (93.5%) | 3 (6.5%) |
| Total (Category) | 215 (96.9%) | 7 (3.2%) |
| Total (Overall) | 951 (53.5%) | 827 (46.5%) |
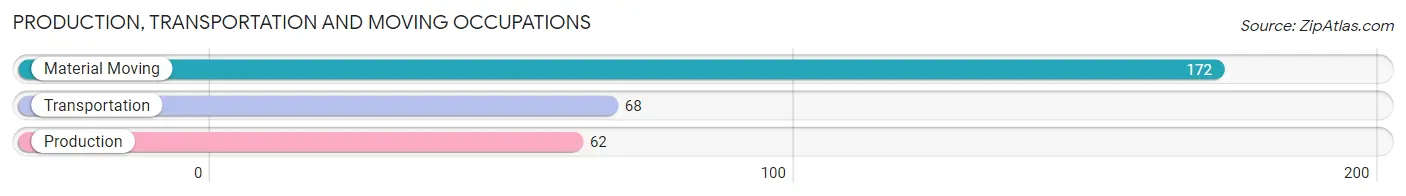
Production, Transportation and Moving Occupations
The most common Production, Transportation and Moving occupations in Pulaski County are Material Moving (172 | 9.7%), Transportation (68 | 3.8%), and Production (62 | 3.5%).
Production, Transportation and Moving Occupations by Sex
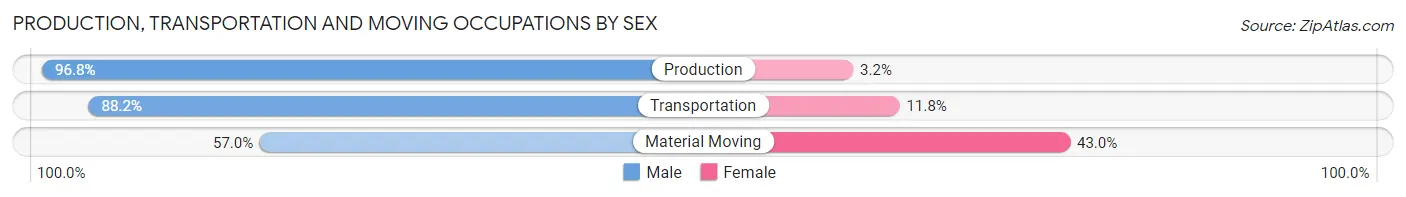
| Occupation | Male | Female |
| Production | 60 (96.8%) | 2 (3.2%) |
| Transportation | 60 (88.2%) | 8 (11.8%) |
| Material Moving | 98 (57.0%) | 74 (43.0%) |
| Total (Category) | 218 (72.2%) | 84 (27.8%) |
| Total (Overall) | 951 (53.5%) | 827 (46.5%) |
Employment Industries by Sex in Pulaski County
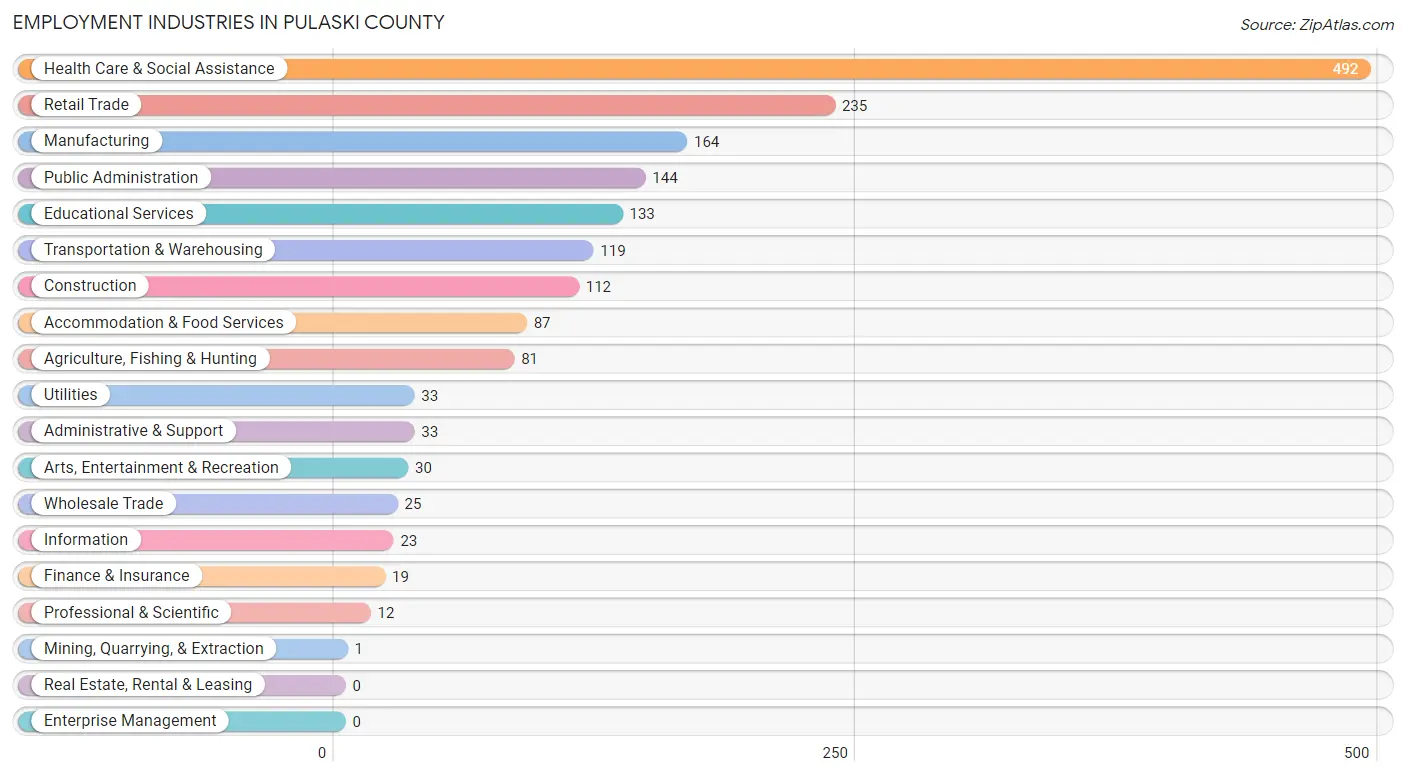
Employment Industries in Pulaski County
The major employment industries in Pulaski County include Health Care & Social Assistance (492 | 27.7%), Retail Trade (235 | 13.2%), Manufacturing (164 | 9.2%), Public Administration (144 | 8.1%), and Educational Services (133 | 7.5%).
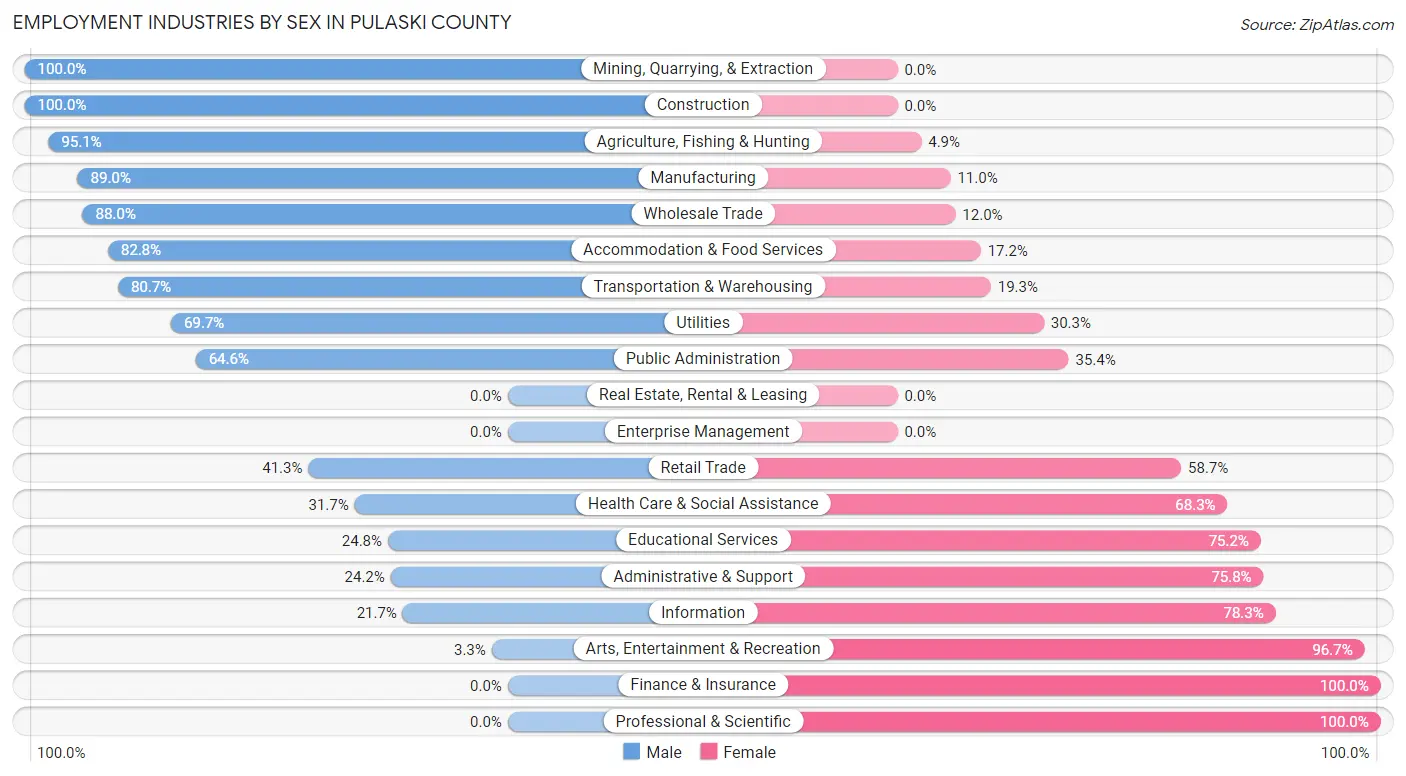
Employment Industries by Sex in Pulaski County
The Pulaski County industries that see more men than women are Mining, Quarrying, & Extraction (100.0%), Construction (100.0%), and Agriculture, Fishing & Hunting (95.1%), whereas the industries that tend to have a higher number of women are Finance & Insurance (100.0%), Professional & Scientific (100.0%), and Arts, Entertainment & Recreation (96.7%).
| Industry | Male | Female |
| Agriculture, Fishing & Hunting | 77 (95.1%) | 4 (4.9%) |
| Mining, Quarrying, & Extraction | 1 (100.0%) | 0 (0.0%) |
| Construction | 112 (100.0%) | 0 (0.0%) |
| Manufacturing | 146 (89.0%) | 18 (11.0%) |
| Wholesale Trade | 22 (88.0%) | 3 (12.0%) |
| Retail Trade | 97 (41.3%) | 138 (58.7%) |
| Transportation & Warehousing | 96 (80.7%) | 23 (19.3%) |
| Utilities | 23 (69.7%) | 10 (30.3%) |
| Information | 5 (21.7%) | 18 (78.3%) |
| Finance & Insurance | 0 (0.0%) | 19 (100.0%) |
| Real Estate, Rental & Leasing | 0 (0.0%) | 0 (0.0%) |
| Professional & Scientific | 0 (0.0%) | 12 (100.0%) |
| Enterprise Management | 0 (0.0%) | 0 (0.0%) |
| Administrative & Support | 8 (24.2%) | 25 (75.8%) |
| Educational Services | 33 (24.8%) | 100 (75.2%) |
| Health Care & Social Assistance | 156 (31.7%) | 336 (68.3%) |
| Arts, Entertainment & Recreation | 1 (3.3%) | 29 (96.7%) |
| Accommodation & Food Services | 72 (82.8%) | 15 (17.2%) |
| Public Administration | 93 (64.6%) | 51 (35.4%) |
| Total | 951 (53.5%) | 827 (46.5%) |
Education in Pulaski County
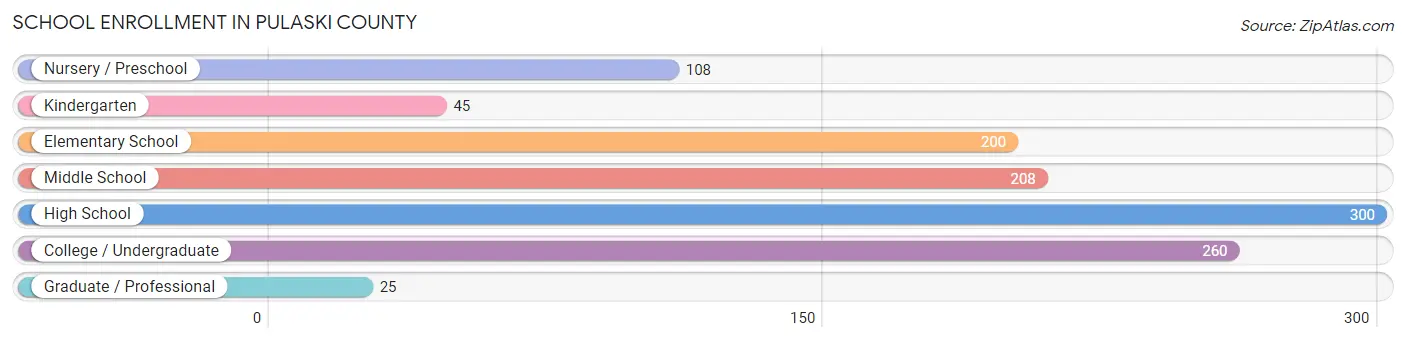
School Enrollment in Pulaski County
The most common levels of schooling among the 1,146 students in Pulaski County are high school (300 | 26.2%), college / undergraduate (260 | 22.7%), and middle school (208 | 18.1%).
| School Level | # Students | % Students |
| Nursery / Preschool | 108 | 9.4% |
| Kindergarten | 45 | 3.9% |
| Elementary School | 200 | 17.4% |
| Middle School | 208 | 18.1% |
| High School | 300 | 26.2% |
| College / Undergraduate | 260 | 22.7% |
| Graduate / Professional | 25 | 2.2% |
| Total | 1,146 | 100.0% |
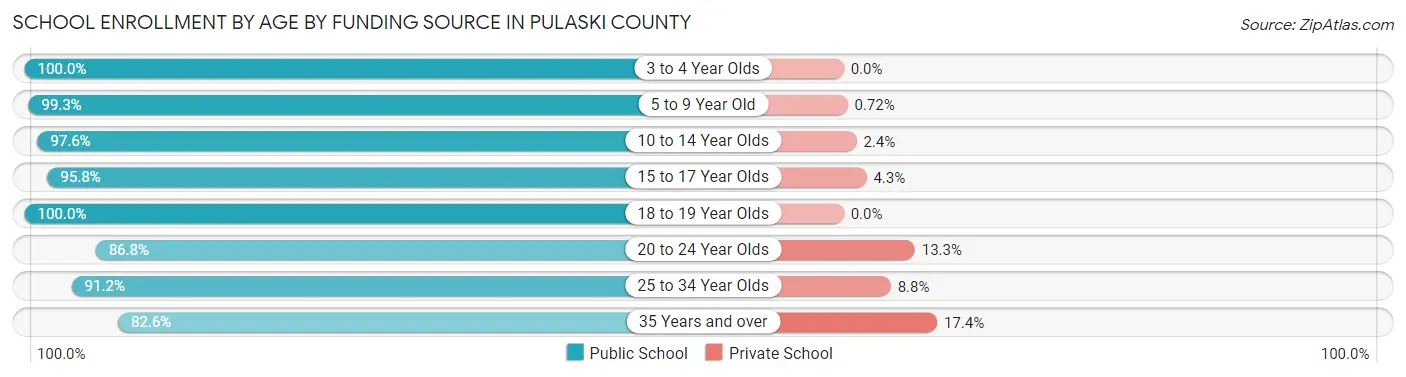
School Enrollment by Age by Funding Source in Pulaski County
Out of a total of 1,146 students who are enrolled in schools in Pulaski County, 47 (4.1%) attend a private institution, while the remaining 1,099 (95.9%) are enrolled in public schools. The age group of 35 years and over has the highest likelihood of being enrolled in private schools, with 4 (17.4% in the age bracket) enrolled. Conversely, the age group of 3 to 4 year olds has the lowest likelihood of being enrolled in a private school, with 61 (100.0% in the age bracket) attending a public institution.
| Age Bracket | Public School | Private School |
| 3 to 4 Year Olds | 61 (100.0%) | 0 (0.0%) |
| 5 to 9 Year Old | 276 (99.3%) | 2 (0.7%) |
| 10 to 14 Year Olds | 286 (97.6%) | 7 (2.4%) |
| 15 to 17 Year Olds | 203 (95.8%) | 9 (4.3%) |
| 18 to 19 Year Olds | 71 (100.0%) | 0 (0.0%) |
| 20 to 24 Year Olds | 131 (86.8%) | 20 (13.3%) |
| 25 to 34 Year Olds | 52 (91.2%) | 5 (8.8%) |
| 35 Years and over | 19 (82.6%) | 4 (17.4%) |
| Total | 1,099 (95.9%) | 47 (4.1%) |
Educational Attainment by Field of Study in Pulaski County
Arts & humanities (114 | 21.1%), education (99 | 18.3%), business (90 | 16.7%), engineering (37 | 6.9%), and bio, nature & agricultural (33 | 6.1%) are the most common fields of study among 540 individuals in Pulaski County who have obtained a bachelor's degree or higher.
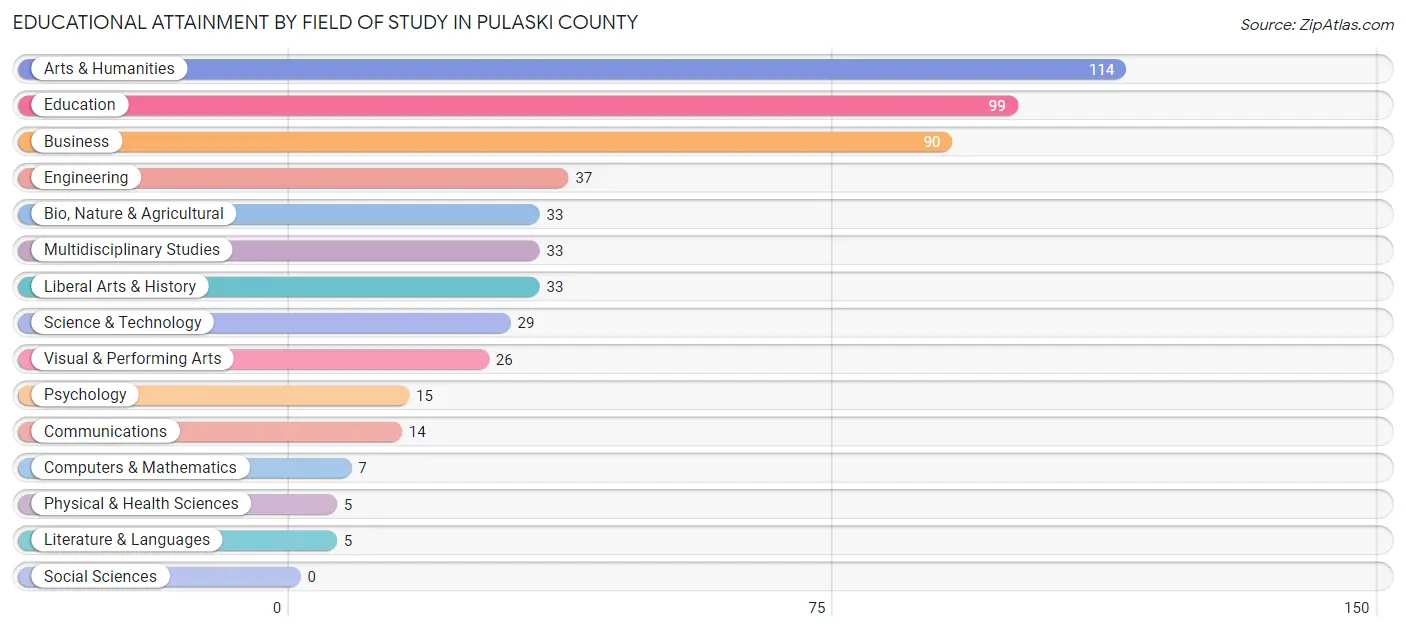
| Field of Study | # Graduates | % Graduates |
| Computers & Mathematics | 7 | 1.3% |
| Bio, Nature & Agricultural | 33 | 6.1% |
| Physical & Health Sciences | 5 | 0.9% |
| Psychology | 15 | 2.8% |
| Social Sciences | 0 | 0.0% |
| Engineering | 37 | 6.9% |
| Multidisciplinary Studies | 33 | 6.1% |
| Science & Technology | 29 | 5.4% |
| Business | 90 | 16.7% |
| Education | 99 | 18.3% |
| Literature & Languages | 5 | 0.9% |
| Liberal Arts & History | 33 | 6.1% |
| Visual & Performing Arts | 26 | 4.8% |
| Communications | 14 | 2.6% |
| Arts & Humanities | 114 | 21.1% |
| Total | 540 | 100.0% |
Transportation & Commute in Pulaski County
Vehicle Availability by Sex in Pulaski County
The most prevalent vehicle ownership categories in Pulaski County are males with 2 vehicles (325, accounting for 36.7%) and females with 2 vehicles (334, making up 40.9%).
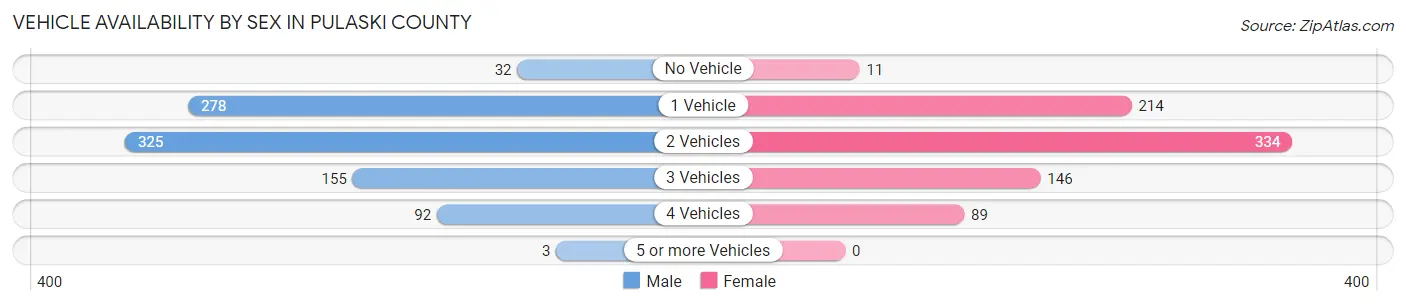
| Vehicles Available | Male | Female |
| No Vehicle | 32 (3.6%) | 11 (1.4%) |
| 1 Vehicle | 278 (31.4%) | 214 (27.0%) |
| 2 Vehicles | 325 (36.7%) | 334 (42.1%) |
| 3 Vehicles | 155 (17.5%) | 146 (18.4%) |
| 4 Vehicles | 92 (10.4%) | 89 (11.2%) |
| 5 or more Vehicles | 3 (0.3%) | 0 (0.0%) |
| Total | 885 (100.0%) | 794 (100.0%) |
Commute Time in Pulaski County
The most frequently occuring commute durations in Pulaski County are 30 to 34 minutes (469 commuters, 29.8%), 20 to 24 minutes (258 commuters, 16.4%), and 45 to 59 minutes (160 commuters, 10.2%).
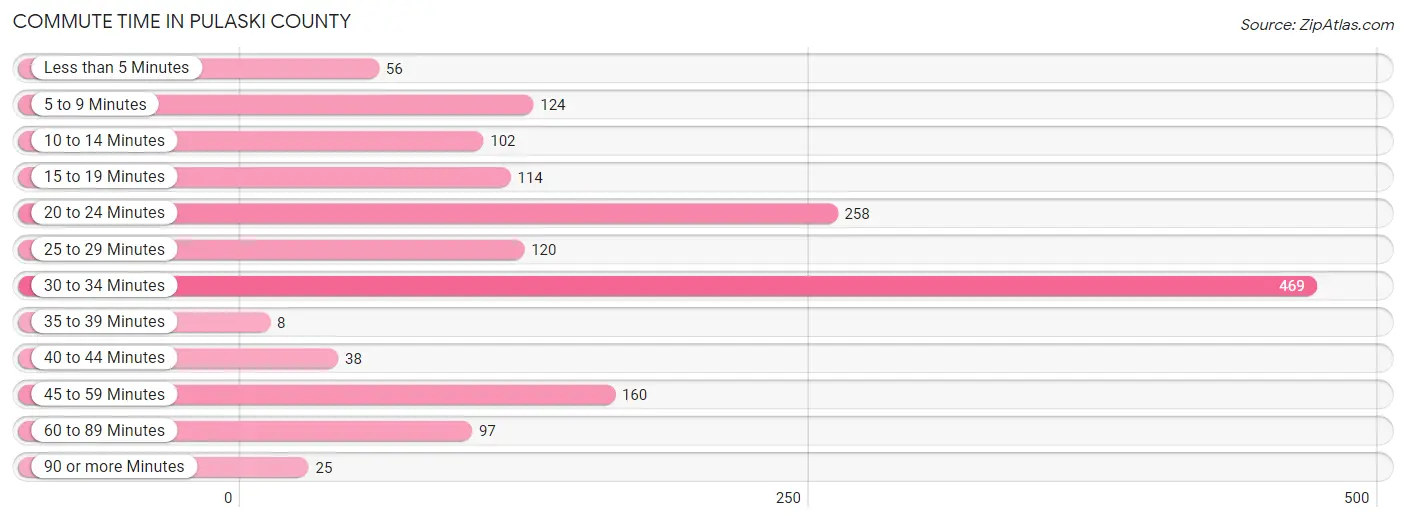
| Commute Time | # Commuters | % Commuters |
| Less than 5 Minutes | 56 | 3.6% |
| 5 to 9 Minutes | 124 | 7.9% |
| 10 to 14 Minutes | 102 | 6.5% |
| 15 to 19 Minutes | 114 | 7.3% |
| 20 to 24 Minutes | 258 | 16.4% |
| 25 to 29 Minutes | 120 | 7.6% |
| 30 to 34 Minutes | 469 | 29.8% |
| 35 to 39 Minutes | 8 | 0.5% |
| 40 to 44 Minutes | 38 | 2.4% |
| 45 to 59 Minutes | 160 | 10.2% |
| 60 to 89 Minutes | 97 | 6.2% |
| 90 or more Minutes | 25 | 1.6% |
Commute Time by Sex in Pulaski County
The most common commute times in Pulaski County are 30 to 34 minutes (236 commuters, 28.6%) for males and 30 to 34 minutes (233 commuters, 31.3%) for females.
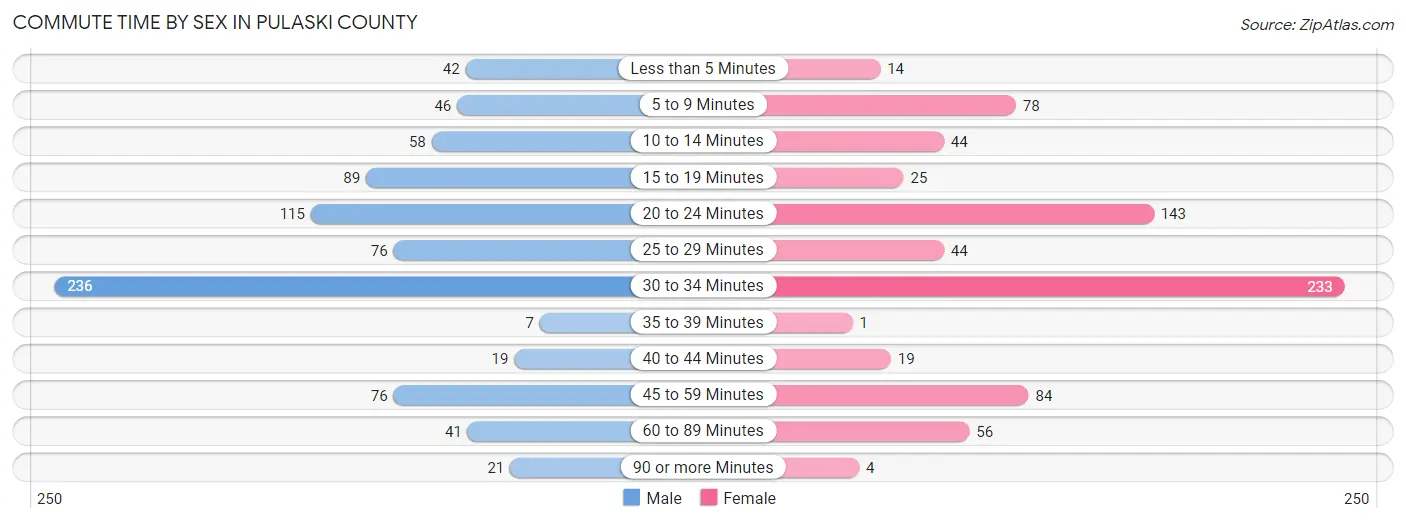
| Commute Time | Male | Female |
| Less than 5 Minutes | 42 (5.1%) | 14 (1.9%) |
| 5 to 9 Minutes | 46 (5.6%) | 78 (10.5%) |
| 10 to 14 Minutes | 58 (7.0%) | 44 (5.9%) |
| 15 to 19 Minutes | 89 (10.8%) | 25 (3.4%) |
| 20 to 24 Minutes | 115 (13.9%) | 143 (19.2%) |
| 25 to 29 Minutes | 76 (9.2%) | 44 (5.9%) |
| 30 to 34 Minutes | 236 (28.6%) | 233 (31.3%) |
| 35 to 39 Minutes | 7 (0.9%) | 1 (0.1%) |
| 40 to 44 Minutes | 19 (2.3%) | 19 (2.5%) |
| 45 to 59 Minutes | 76 (9.2%) | 84 (11.3%) |
| 60 to 89 Minutes | 41 (5.0%) | 56 (7.5%) |
| 90 or more Minutes | 21 (2.5%) | 4 (0.5%) |
Time of Departure to Work by Sex in Pulaski County
The most frequent times of departure to work in Pulaski County are 8:00 AM to 8:29 AM (165, 20.0%) for males and 8:00 AM to 8:29 AM (201, 27.0%) for females.
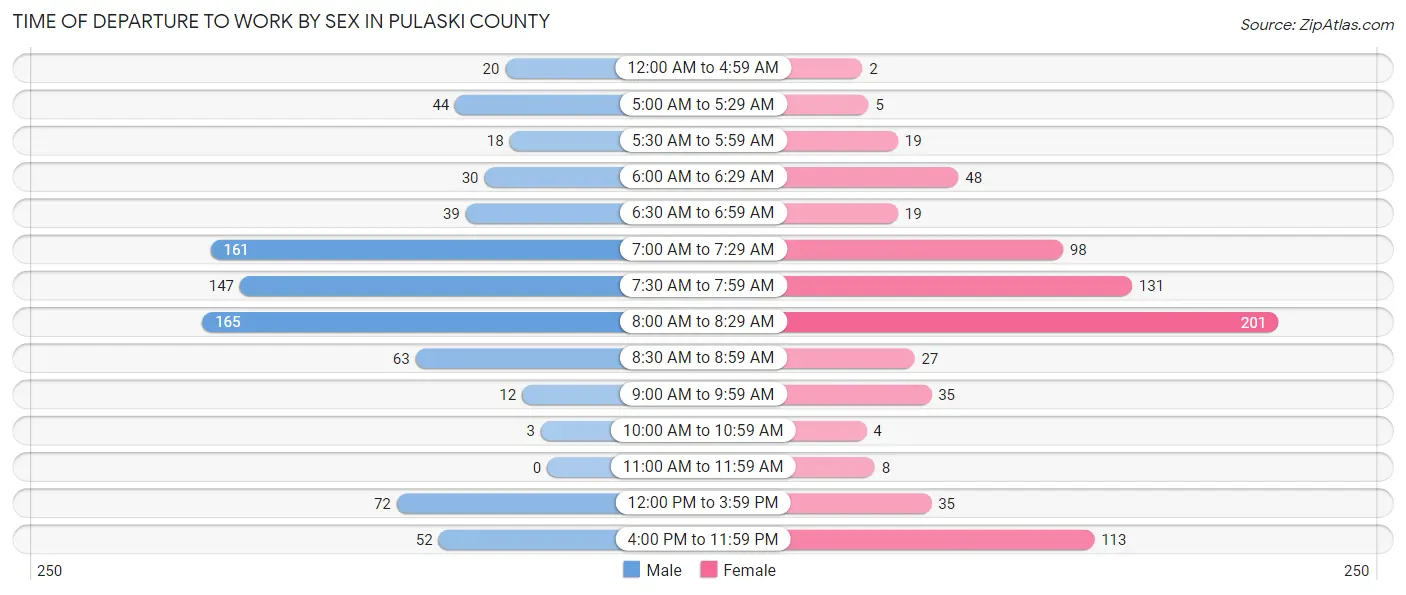
| Time of Departure | Male | Female |
| 12:00 AM to 4:59 AM | 20 (2.4%) | 2 (0.3%) |
| 5:00 AM to 5:29 AM | 44 (5.3%) | 5 (0.7%) |
| 5:30 AM to 5:59 AM | 18 (2.2%) | 19 (2.5%) |
| 6:00 AM to 6:29 AM | 30 (3.6%) | 48 (6.4%) |
| 6:30 AM to 6:59 AM | 39 (4.7%) | 19 (2.5%) |
| 7:00 AM to 7:29 AM | 161 (19.5%) | 98 (13.2%) |
| 7:30 AM to 7:59 AM | 147 (17.8%) | 131 (17.6%) |
| 8:00 AM to 8:29 AM | 165 (20.0%) | 201 (27.0%) |
| 8:30 AM to 8:59 AM | 63 (7.6%) | 27 (3.6%) |
| 9:00 AM to 9:59 AM | 12 (1.5%) | 35 (4.7%) |
| 10:00 AM to 10:59 AM | 3 (0.4%) | 4 (0.5%) |
| 11:00 AM to 11:59 AM | 0 (0.0%) | 8 (1.1%) |
| 12:00 PM to 3:59 PM | 72 (8.7%) | 35 (4.7%) |
| 4:00 PM to 11:59 PM | 52 (6.3%) | 113 (15.2%) |
| Total | 826 (100.0%) | 745 (100.0%) |
Housing Occupancy in Pulaski County
Occupancy by Ownership in Pulaski County
Of the total 1,886 dwellings in Pulaski County, owner-occupied units account for 1,352 (71.7%), while renter-occupied units make up 534 (28.3%).
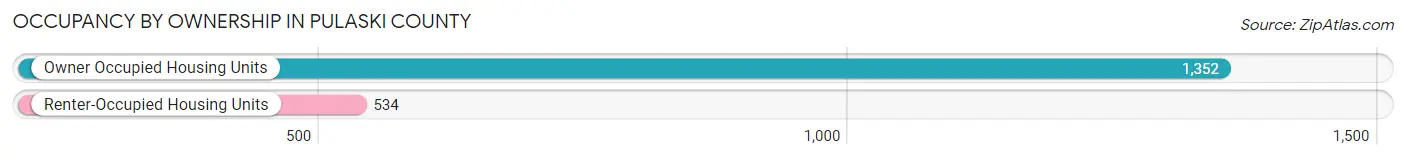
| Occupancy | # Housing Units | % Housing Units |
| Owner Occupied Housing Units | 1,352 | 71.7% |
| Renter-Occupied Housing Units | 534 | 28.3% |
| Total Occupied Housing Units | 1,886 | 100.0% |
Occupancy by Household Size in Pulaski County
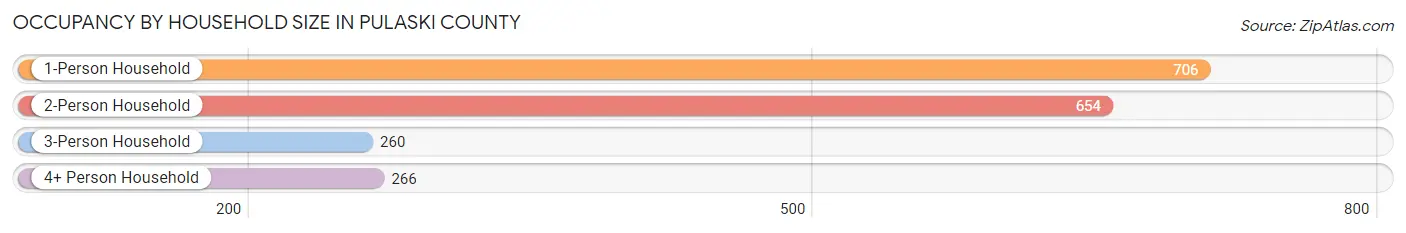
| Household Size | # Housing Units | % Housing Units |
| 1-Person Household | 706 | 37.4% |
| 2-Person Household | 654 | 34.7% |
| 3-Person Household | 260 | 13.8% |
| 4+ Person Household | 266 | 14.1% |
| Total Housing Units | 1,886 | 100.0% |
Occupancy by Ownership by Household Size in Pulaski County
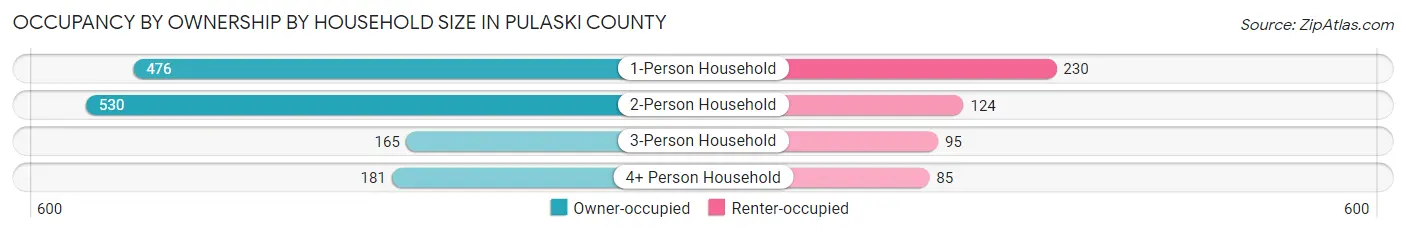
| Household Size | Owner-occupied | Renter-occupied |
| 1-Person Household | 476 (67.4%) | 230 (32.6%) |
| 2-Person Household | 530 (81.0%) | 124 (19.0%) |
| 3-Person Household | 165 (63.5%) | 95 (36.5%) |
| 4+ Person Household | 181 (68.0%) | 85 (32.0%) |
| Total Housing Units | 1,352 (71.7%) | 534 (28.3%) |
Occupancy by Educational Attainment in Pulaski County
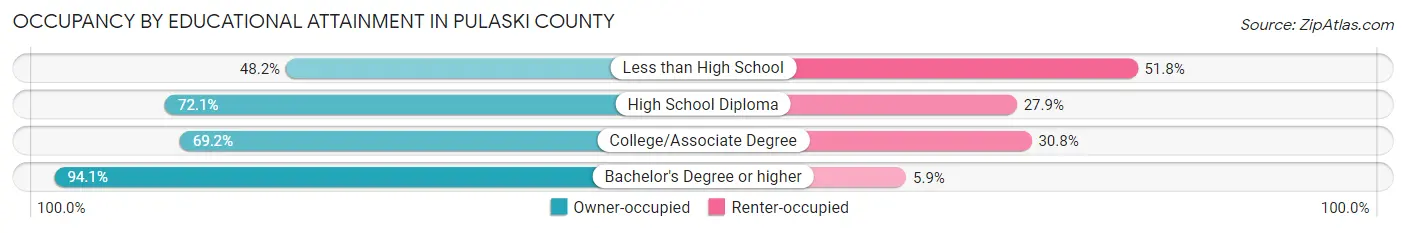
| Household Size | Owner-occupied | Renter-occupied |
| Less than High School | 93 (48.2%) | 100 (51.8%) |
| High School Diploma | 497 (72.1%) | 192 (27.9%) |
| College/Associate Degree | 508 (69.2%) | 226 (30.8%) |
| Bachelor's Degree or higher | 254 (94.1%) | 16 (5.9%) |
Occupancy by Age of Householder in Pulaski County
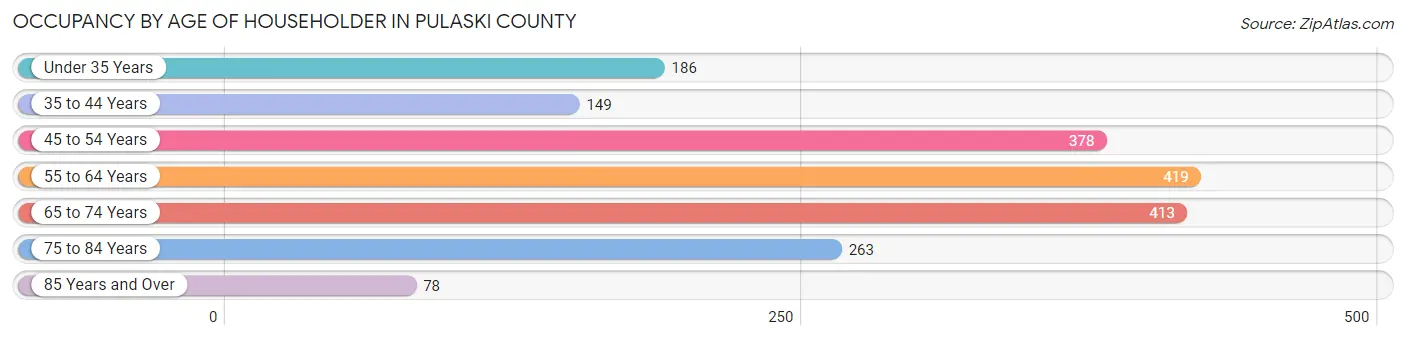
| Age Bracket | # Households | % Households |
| Under 35 Years | 186 | 9.9% |
| 35 to 44 Years | 149 | 7.9% |
| 45 to 54 Years | 378 | 20.0% |
| 55 to 64 Years | 419 | 22.2% |
| 65 to 74 Years | 413 | 21.9% |
| 75 to 84 Years | 263 | 13.9% |
| 85 Years and Over | 78 | 4.1% |
| Total | 1,886 | 100.0% |
Housing Finances in Pulaski County
Median Income by Occupancy in Pulaski County
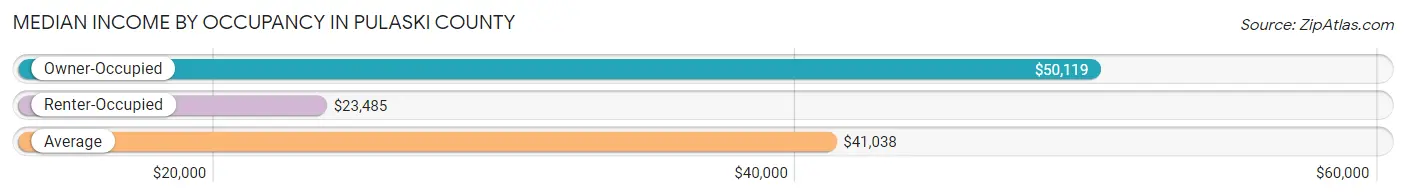
| Occupancy Type | # Households | Median Income |
| Owner-Occupied | 1,352 (71.7%) | $50,119 |
| Renter-Occupied | 534 (28.3%) | $23,485 |
| Average | 1,886 (100.0%) | $41,038 |
Occupancy by Householder Income Bracket in Pulaski County
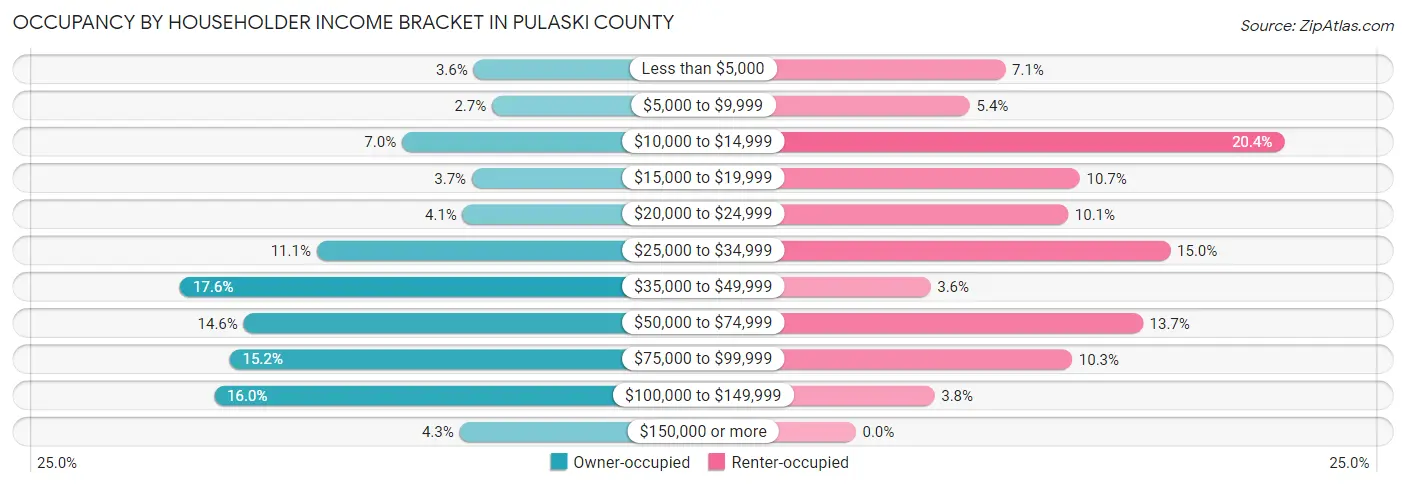
| Income Bracket | Owner-occupied | Renter-occupied |
| Less than $5,000 | 49 (3.6%) | 38 (7.1%) |
| $5,000 to $9,999 | 37 (2.7%) | 29 (5.4%) |
| $10,000 to $14,999 | 95 (7.0%) | 109 (20.4%) |
| $15,000 to $19,999 | 50 (3.7%) | 57 (10.7%) |
| $20,000 to $24,999 | 56 (4.1%) | 54 (10.1%) |
| $25,000 to $34,999 | 150 (11.1%) | 80 (15.0%) |
| $35,000 to $49,999 | 238 (17.6%) | 19 (3.6%) |
| $50,000 to $74,999 | 197 (14.6%) | 73 (13.7%) |
| $75,000 to $99,999 | 206 (15.2%) | 55 (10.3%) |
| $100,000 to $149,999 | 216 (16.0%) | 20 (3.7%) |
| $150,000 or more | 58 (4.3%) | 0 (0.0%) |
| Total | 1,352 (100.0%) | 534 (100.0%) |
Monthly Housing Cost Tiers in Pulaski County
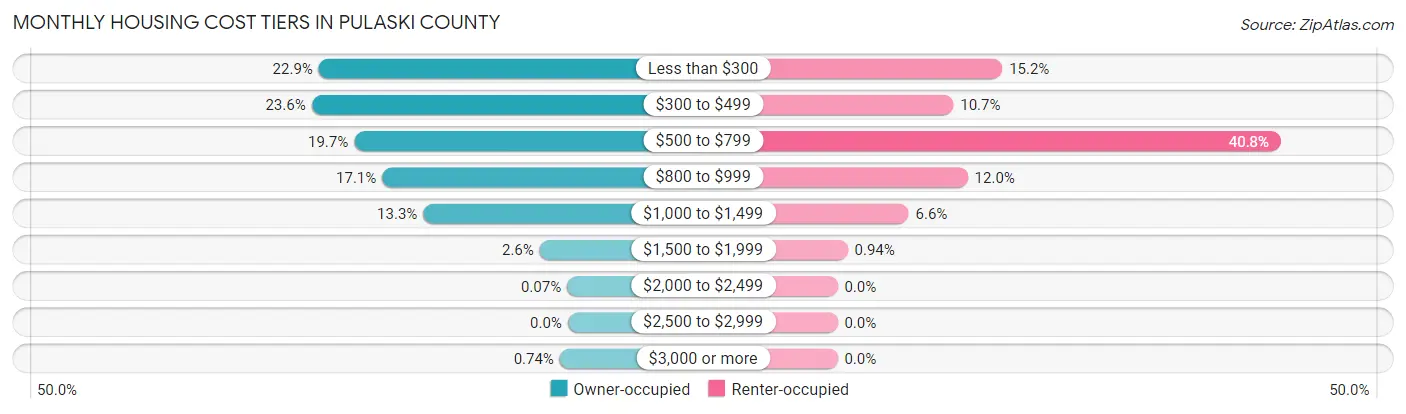
| Monthly Cost | Owner-occupied | Renter-occupied |
| Less than $300 | 310 (22.9%) | 81 (15.2%) |
| $300 to $499 | 319 (23.6%) | 57 (10.7%) |
| $500 to $799 | 266 (19.7%) | 218 (40.8%) |
| $800 to $999 | 231 (17.1%) | 64 (12.0%) |
| $1,000 to $1,499 | 180 (13.3%) | 35 (6.6%) |
| $1,500 to $1,999 | 35 (2.6%) | 5 (0.9%) |
| $2,000 to $2,499 | 1 (0.1%) | 0 (0.0%) |
| $2,500 to $2,999 | 0 (0.0%) | 0 (0.0%) |
| $3,000 or more | 10 (0.7%) | 0 (0.0%) |
| Total | 1,352 (100.0%) | 534 (100.0%) |
Physical Housing Characteristics in Pulaski County
Housing Structures in Pulaski County
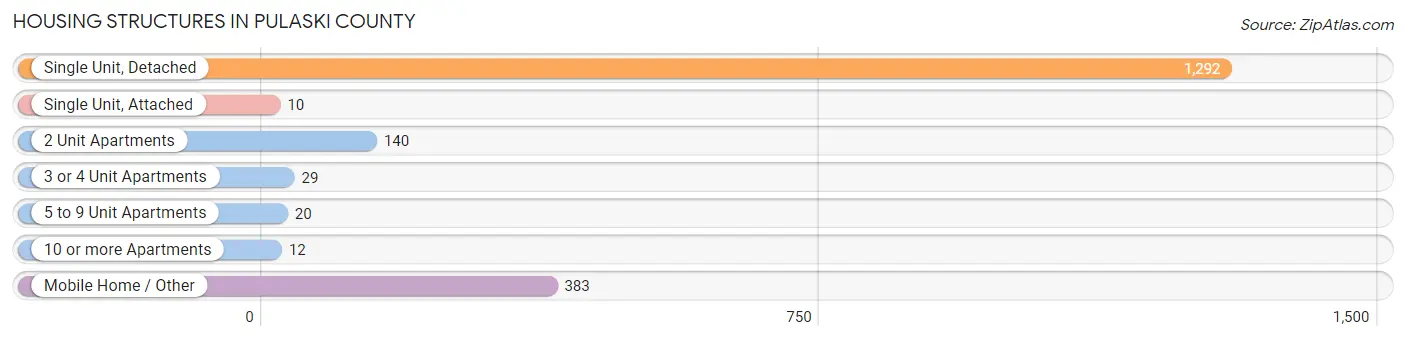
| Structure Type | # Housing Units | % Housing Units |
| Single Unit, Detached | 1,292 | 68.5% |
| Single Unit, Attached | 10 | 0.5% |
| 2 Unit Apartments | 140 | 7.4% |
| 3 or 4 Unit Apartments | 29 | 1.5% |
| 5 to 9 Unit Apartments | 20 | 1.1% |
| 10 or more Apartments | 12 | 0.6% |
| Mobile Home / Other | 383 | 20.3% |
| Total | 1,886 | 100.0% |
Housing Structures by Occupancy in Pulaski County
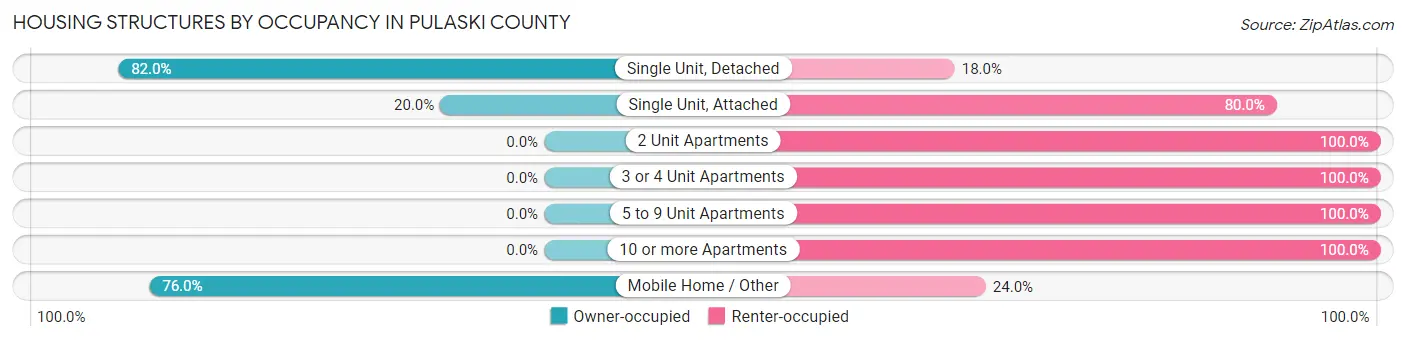
| Structure Type | Owner-occupied | Renter-occupied |
| Single Unit, Detached | 1,059 (82.0%) | 233 (18.0%) |
| Single Unit, Attached | 2 (20.0%) | 8 (80.0%) |
| 2 Unit Apartments | 0 (0.0%) | 140 (100.0%) |
| 3 or 4 Unit Apartments | 0 (0.0%) | 29 (100.0%) |
| 5 to 9 Unit Apartments | 0 (0.0%) | 20 (100.0%) |
| 10 or more Apartments | 0 (0.0%) | 12 (100.0%) |
| Mobile Home / Other | 291 (76.0%) | 92 (24.0%) |
| Total | 1,352 (71.7%) | 534 (28.3%) |
Housing Structures by Number of Rooms in Pulaski County

| Number of Rooms | Owner-occupied | Renter-occupied |
| 1 Room | 0 (0.0%) | 83 (15.5%) |
| 2 or 3 Rooms | 65 (4.8%) | 70 (13.1%) |
| 4 or 5 Rooms | 584 (43.2%) | 233 (43.6%) |
| 6 or 7 Rooms | 486 (35.9%) | 121 (22.7%) |
| 8 or more Rooms | 217 (16.1%) | 27 (5.1%) |
| Total | 1,352 (100.0%) | 534 (100.0%) |
Housing Structure by Heating Type in Pulaski County

| Heating Type | Owner-occupied | Renter-occupied |
| Utility Gas | 463 (34.3%) | 173 (32.4%) |
| Bottled, Tank, or LP Gas | 277 (20.5%) | 72 (13.5%) |
| Electricity | 556 (41.1%) | 278 (52.1%) |
| Fuel Oil or Kerosene | 0 (0.0%) | 0 (0.0%) |
| Coal or Coke | 0 (0.0%) | 0 (0.0%) |
| All other Fuels | 52 (3.8%) | 0 (0.0%) |
| No Fuel Used | 4 (0.3%) | 11 (2.1%) |
| Total | 1,352 (100.0%) | 534 (100.0%) |
Household Vehicle Usage in Pulaski County
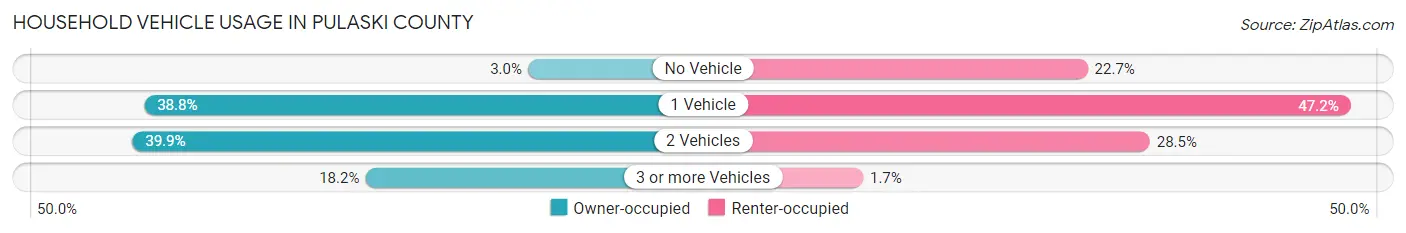
| Vehicles per Household | Owner-occupied | Renter-occupied |
| No Vehicle | 41 (3.0%) | 121 (22.7%) |
| 1 Vehicle | 525 (38.8%) | 252 (47.2%) |
| 2 Vehicles | 540 (39.9%) | 152 (28.5%) |
| 3 or more Vehicles | 246 (18.2%) | 9 (1.7%) |
| Total | 1,352 (100.0%) | 534 (100.0%) |
Real Estate & Mortgages in Pulaski County
Real Estate and Mortgage Overview in Pulaski County
| Characteristic | Without Mortgage | With Mortgage |
| Housing Units | 923 | 429 |
| Median Property Value | $81,900 | $81,200 |
| Median Household Income | $40,335 | $28 |
| Monthly Housing Costs | $392 | $10 |
| Real Estate Taxes | $558 | $18 |
Property Value by Mortgage Status in Pulaski County
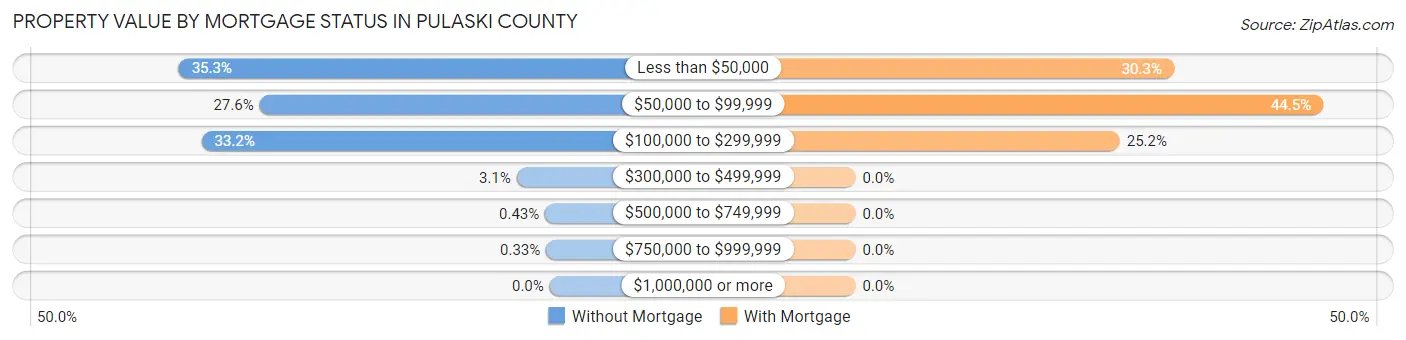
| Property Value | Without Mortgage | With Mortgage |
| Less than $50,000 | 326 (35.3%) | 130 (30.3%) |
| $50,000 to $99,999 | 255 (27.6%) | 191 (44.5%) |
| $100,000 to $299,999 | 306 (33.2%) | 108 (25.2%) |
| $300,000 to $499,999 | 29 (3.1%) | 0 (0.0%) |
| $500,000 to $749,999 | 4 (0.4%) | 0 (0.0%) |
| $750,000 to $999,999 | 3 (0.3%) | 0 (0.0%) |
| $1,000,000 or more | 0 (0.0%) | 0 (0.0%) |
| Total | 923 (100.0%) | 429 (100.0%) |
Household Income by Mortgage Status in Pulaski County
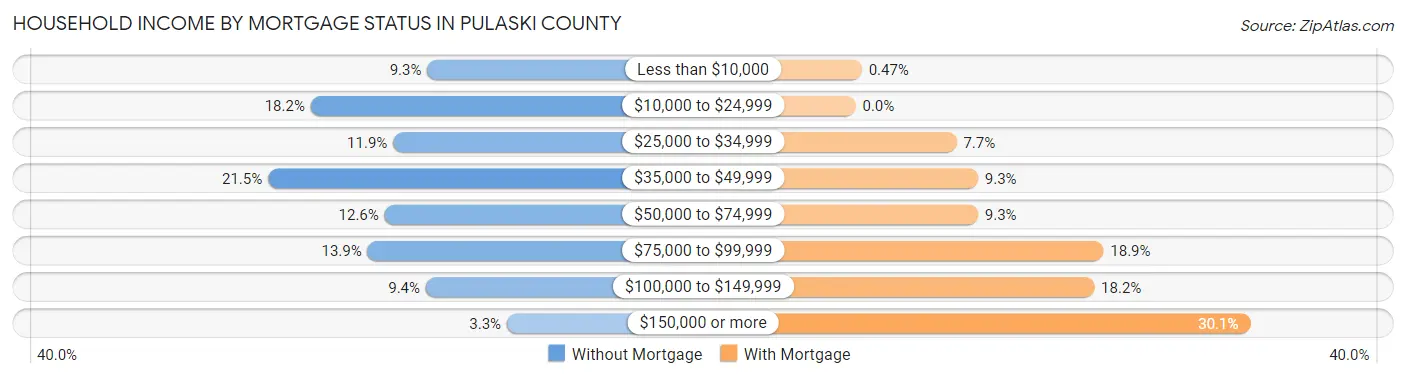
| Household Income | Without Mortgage | With Mortgage |
| Less than $10,000 | 86 (9.3%) | 2 (0.5%) |
| $10,000 to $24,999 | 168 (18.2%) | 0 (0.0%) |
| $25,000 to $34,999 | 110 (11.9%) | 33 (7.7%) |
| $35,000 to $49,999 | 198 (21.4%) | 40 (9.3%) |
| $50,000 to $74,999 | 116 (12.6%) | 40 (9.3%) |
| $75,000 to $99,999 | 128 (13.9%) | 81 (18.9%) |
| $100,000 to $149,999 | 87 (9.4%) | 78 (18.2%) |
| $150,000 or more | 30 (3.3%) | 129 (30.1%) |
| Total | 923 (100.0%) | 429 (100.0%) |
Property Value to Household Income Ratio in Pulaski County
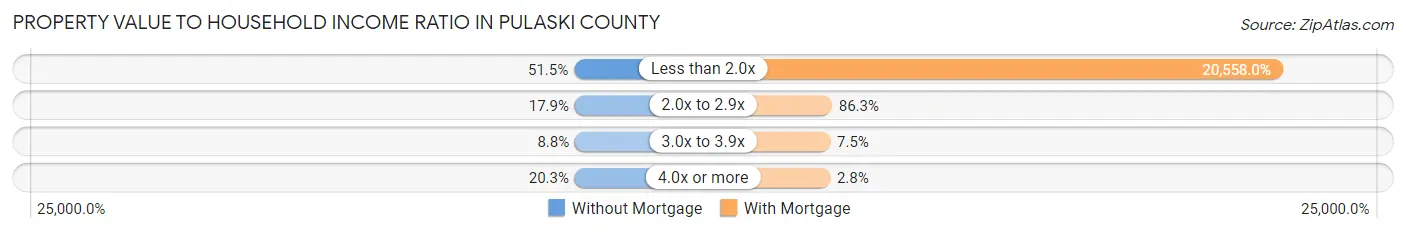
| Value-to-Income Ratio | Without Mortgage | With Mortgage |
| Less than 2.0x | 475 (51.5%) | 88,194 (20,558.0%) |
| 2.0x to 2.9x | 165 (17.9%) | 370 (86.3%) |
| 3.0x to 3.9x | 81 (8.8%) | 32 (7.5%) |
| 4.0x or more | 187 (20.3%) | 12 (2.8%) |
| Total | 923 (100.0%) | 429 (100.0%) |
Real Estate Taxes by Mortgage Status in Pulaski County
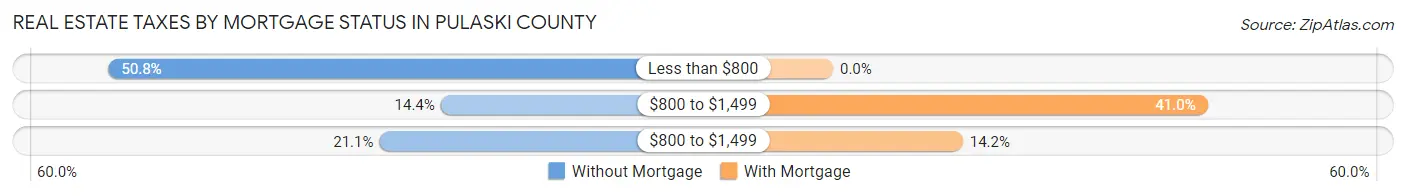
| Property Taxes | Without Mortgage | With Mortgage |
| Less than $800 | 469 (50.8%) | 0 (0.0%) |
| $800 to $1,499 | 133 (14.4%) | 176 (41.0%) |
| $800 to $1,499 | 195 (21.1%) | 61 (14.2%) |
| Total | 923 (100.0%) | 429 (100.0%) |
Health & Disability in Pulaski County
Health Insurance Coverage by Age in Pulaski County
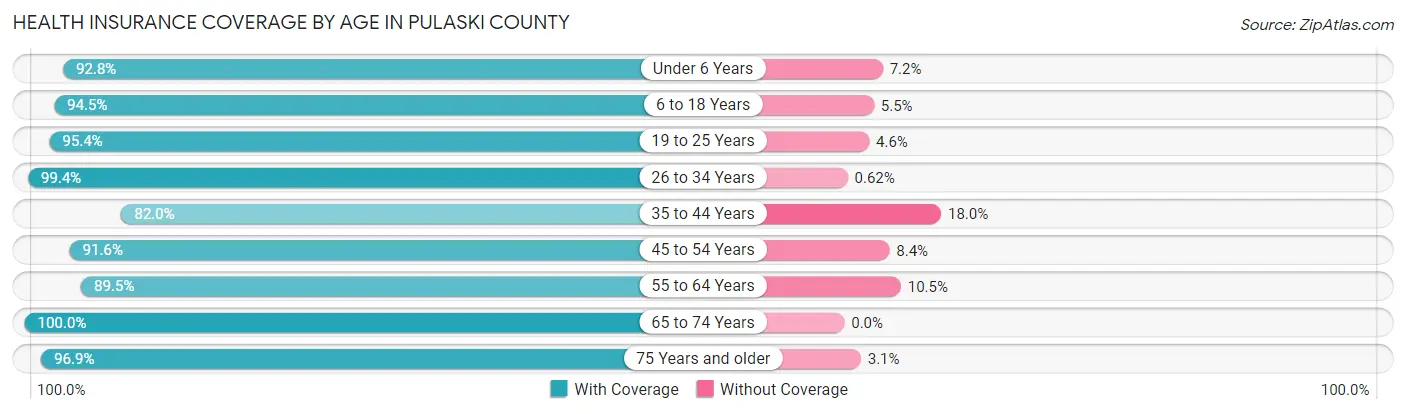
| Age Bracket | With Coverage | Without Coverage |
| Under 6 Years | 337 (92.8%) | 26 (7.2%) |
| 6 to 18 Years | 771 (94.5%) | 45 (5.5%) |
| 19 to 25 Years | 412 (95.4%) | 20 (4.6%) |
| 26 to 34 Years | 321 (99.4%) | 2 (0.6%) |
| 35 to 44 Years | 518 (82.0%) | 114 (18.0%) |
| 45 to 54 Years | 578 (91.6%) | 53 (8.4%) |
| 55 to 64 Years | 679 (89.5%) | 80 (10.5%) |
| 65 to 74 Years | 699 (100.0%) | 0 (0.0%) |
| 75 Years and older | 440 (96.9%) | 14 (3.1%) |
| Total | 4,755 (93.1%) | 354 (6.9%) |
Health Insurance Coverage by Citizenship Status in Pulaski County
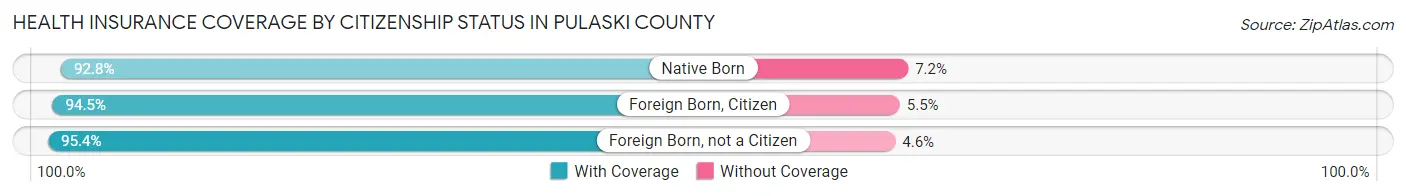
| Citizenship Status | With Coverage | Without Coverage |
| Native Born | 337 (92.8%) | 26 (7.2%) |
| Foreign Born, Citizen | 771 (94.5%) | 45 (5.5%) |
| Foreign Born, not a Citizen | 412 (95.4%) | 20 (4.6%) |
Health Insurance Coverage by Household Income in Pulaski County
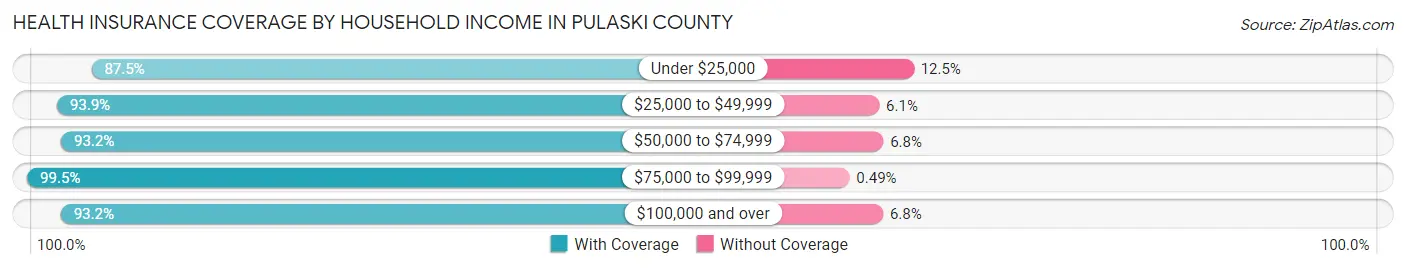
| Household Income | With Coverage | Without Coverage |
| Under $25,000 | 1,040 (87.5%) | 149 (12.5%) |
| $25,000 to $49,999 | 1,117 (93.9%) | 72 (6.1%) |
| $50,000 to $74,999 | 750 (93.2%) | 55 (6.8%) |
| $75,000 to $99,999 | 808 (99.5%) | 4 (0.5%) |
| $100,000 and over | 1,018 (93.2%) | 74 (6.8%) |
Public vs Private Health Insurance Coverage by Age in Pulaski County

| Age Bracket | Public Insurance | Private Insurance |
| Under 6 | 287 (79.1%) | 54 (14.9%) |
| 6 to 18 Years | 480 (58.8%) | 295 (36.1%) |
| 19 to 25 Years | 172 (39.8%) | 258 (59.7%) |
| 25 to 34 Years | 186 (57.6%) | 171 (52.9%) |
| 35 to 44 Years | 249 (39.4%) | 275 (43.5%) |
| 45 to 54 Years | 182 (28.8%) | 430 (68.1%) |
| 55 to 64 Years | 270 (35.6%) | 422 (55.6%) |
| 65 to 74 Years | 688 (98.4%) | 273 (39.1%) |
| 75 Years and over | 439 (96.7%) | 187 (41.2%) |
| Total | 2,953 (57.8%) | 2,365 (46.3%) |
Disability Status by Sex by Age in Pulaski County
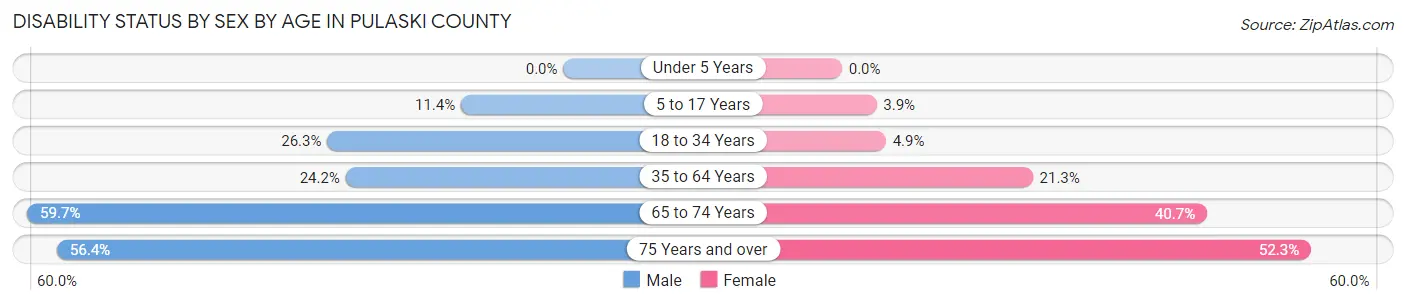
| Age Bracket | Male | Female |
| Under 5 Years | 0 (0.0%) | 0 (0.0%) |
| 5 to 17 Years | 46 (11.4%) | 15 (3.8%) |
| 18 to 34 Years | 122 (26.3%) | 20 (4.9%) |
| 35 to 64 Years | 246 (24.2%) | 214 (21.2%) |
| 65 to 74 Years | 203 (59.7%) | 146 (40.7%) |
| 75 Years and over | 119 (56.4%) | 127 (52.3%) |
Disability Class by Sex by Age in Pulaski County
Disability Class: Hearing Difficulty
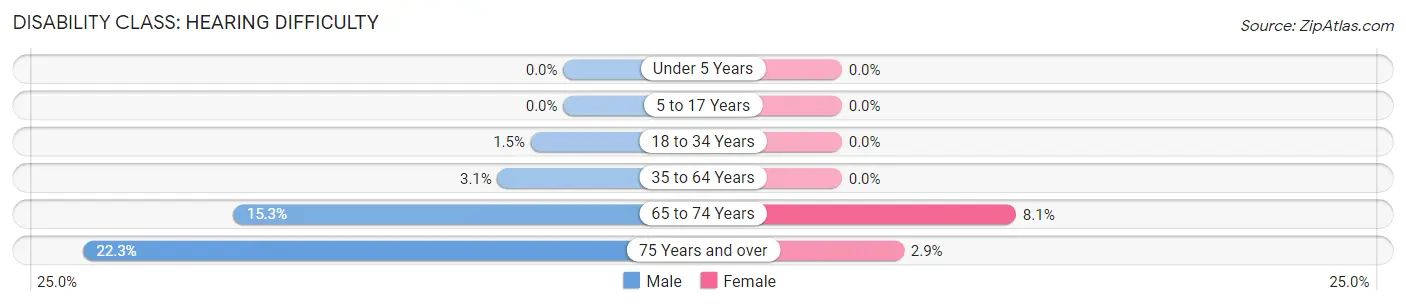
| Age Bracket | Male | Female |
| Under 5 Years | 0 (0.0%) | 0 (0.0%) |
| 5 to 17 Years | 0 (0.0%) | 0 (0.0%) |
| 18 to 34 Years | 7 (1.5%) | 0 (0.0%) |
| 35 to 64 Years | 31 (3.0%) | 0 (0.0%) |
| 65 to 74 Years | 52 (15.3%) | 29 (8.1%) |
| 75 Years and over | 47 (22.3%) | 7 (2.9%) |
Disability Class: Vision Difficulty
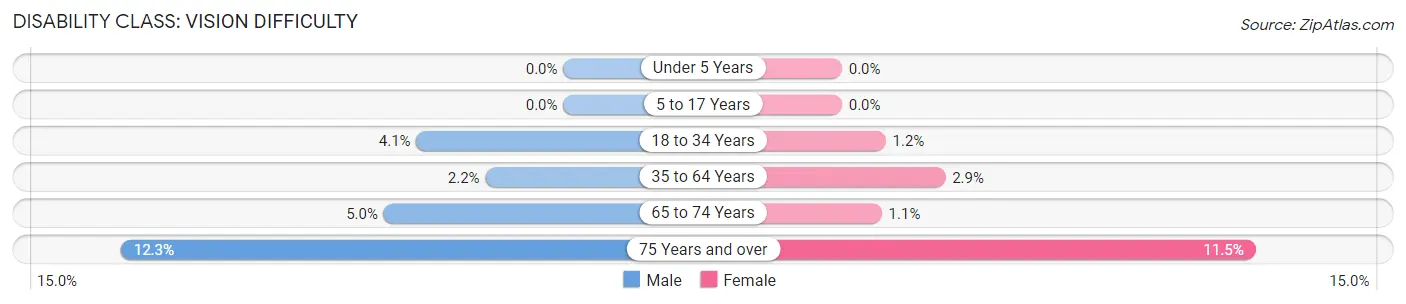
| Age Bracket | Male | Female |
| Under 5 Years | 0 (0.0%) | 0 (0.0%) |
| 5 to 17 Years | 0 (0.0%) | 0 (0.0%) |
| 18 to 34 Years | 19 (4.1%) | 5 (1.2%) |
| 35 to 64 Years | 22 (2.2%) | 29 (2.9%) |
| 65 to 74 Years | 17 (5.0%) | 4 (1.1%) |
| 75 Years and over | 26 (12.3%) | 28 (11.5%) |
Disability Class: Cognitive Difficulty
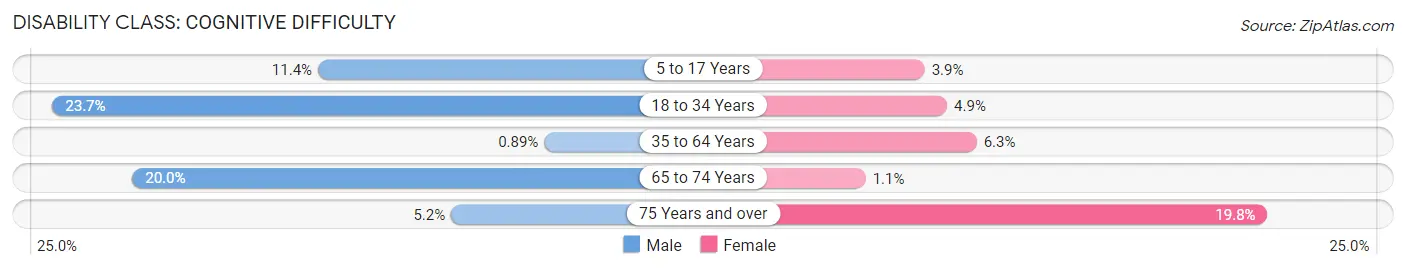
| Age Bracket | Male | Female |
| 5 to 17 Years | 46 (11.4%) | 15 (3.8%) |
| 18 to 34 Years | 110 (23.7%) | 20 (4.9%) |
| 35 to 64 Years | 9 (0.9%) | 63 (6.3%) |
| 65 to 74 Years | 68 (20.0%) | 4 (1.1%) |
| 75 Years and over | 11 (5.2%) | 48 (19.8%) |
Disability Class: Ambulatory Difficulty
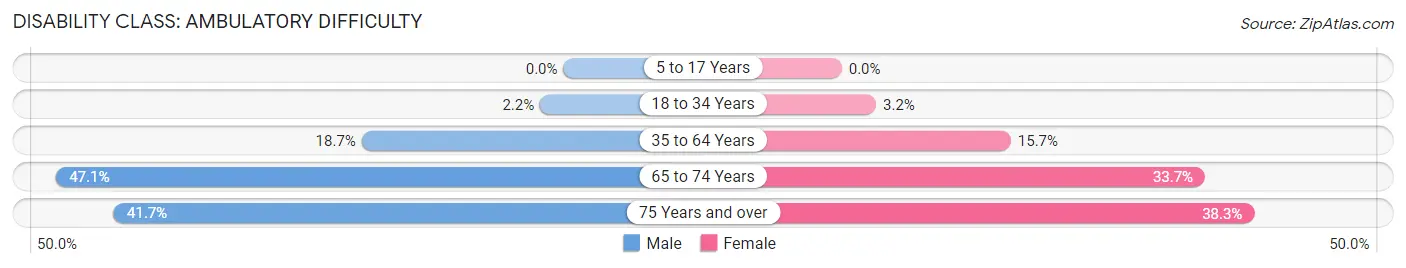
| Age Bracket | Male | Female |
| 5 to 17 Years | 0 (0.0%) | 0 (0.0%) |
| 18 to 34 Years | 10 (2.2%) | 13 (3.2%) |
| 35 to 64 Years | 190 (18.7%) | 158 (15.7%) |
| 65 to 74 Years | 160 (47.1%) | 121 (33.7%) |
| 75 Years and over | 88 (41.7%) | 93 (38.3%) |
Disability Class: Self-Care Difficulty
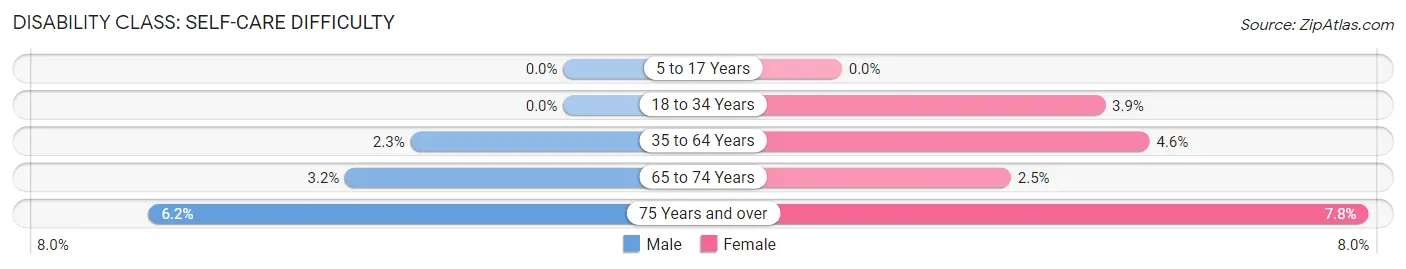
| Age Bracket | Male | Female |
| 5 to 17 Years | 0 (0.0%) | 0 (0.0%) |
| 18 to 34 Years | 0 (0.0%) | 16 (3.9%) |
| 35 to 64 Years | 23 (2.3%) | 46 (4.6%) |
| 65 to 74 Years | 11 (3.2%) | 9 (2.5%) |
| 75 Years and over | 13 (6.2%) | 19 (7.8%) |
Technology Access in Pulaski County
Computing Device Access in Pulaski County

| Device Type | # Households | % Households |
| Desktop or Laptop | 585 | 31.0% |
| Smartphone | 1,145 | 60.7% |
| Tablet | 577 | 30.6% |
| No Computing Device | 652 | 34.6% |
| Total | 1,886 | 100.0% |
Internet Access in Pulaski County
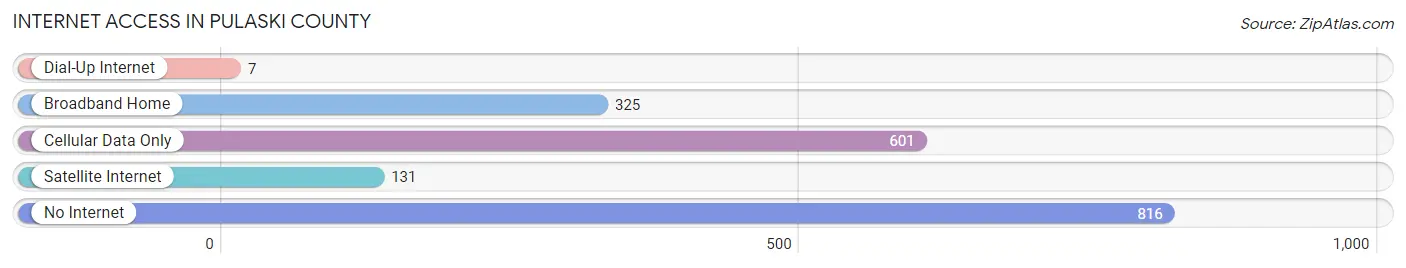
| Internet Type | # Households | % Households |
| Dial-Up Internet | 7 | 0.4% |
| Broadband Home | 325 | 17.2% |
| Cellular Data Only | 601 | 31.9% |
| Satellite Internet | 131 | 7.0% |
| No Internet | 816 | 43.3% |
| Total | 1,886 | 100.0% |
Pulaski County Summary
Pulaski County, Illinois is located in the southernmost part of the state, bordering the states of Missouri and Kentucky. It is part of the Little Egypt region of Illinois, and is the only county in the state to border two other states. The county seat is Mound City, and the largest city is Ullin. The county was named after Kazimierz Pułaski, a Polish-Lithuanian military leader who fought in the American Revolutionary War.
Geography
Pulaski County is located in the southernmost part of Illinois, and is bordered by the states of Missouri and Kentucky. It is part of the Little Egypt region of Illinois, and is the only county in the state to border two other states. The county has a total area of 545 square miles, of which 543 square miles is land and 2.2 square miles is water. The county is mostly flat, with some rolling hills in the northern part. The highest point in the county is located in the northwest corner, at an elevation of 590 feet. The county is drained by the Ohio River, which forms its western border.
The climate of Pulaski County is humid continental, with hot, humid summers and cold, dry winters. The average annual temperature is 54°F, and the average annual precipitation is 40 inches.
Demographics
As of the 2010 United States Census, there were 12,945 people, 5,093 households, and 3,541 families living in Pulaski County. The population density was 24 people per square mile. The racial makeup of the county was 95.2% White, 1.7% African American, 0.3% Native American, 0.2% Asian, 0.1% Pacific Islander, 1.2% from other races, and 1.4% from two or more races. Hispanic or Latino of any race were 3.2% of the population.
The median income for a household in the county was $35,945, and the median income for a family was $41,945. The per capita income for the county was $17,845. About 15.2% of families and 19.2% of the population were below the poverty line, including 25.2% of those under age 18 and 11.2% of those age 65 or over.
Economy
The economy of Pulaski County is largely based on agriculture. The county is home to several large farms, and the main crops grown are corn, soybeans, and wheat. The county is also home to several small businesses, including a few restaurants, a few retail stores, and a few manufacturing companies.
The unemployment rate in Pulaski County is 5.2%, which is lower than the national average of 6.7%. The median household income is $35,945, which is lower than the national average of $60,336.
History
Pulaski County was formed in 1843 from parts of Alexander and Johnson counties. It was named after Kazimierz Pułaski, a Polish-Lithuanian military leader who fought in the American Revolutionary War.
The county was largely rural until the 1950s, when the population began to grow rapidly due to the construction of several large factories in the area. The factories provided jobs for many of the county's residents, and the population continued to grow until the 1980s.
In the late 1980s, the factories began to close, and the population began to decline. The population has continued to decline since then, and as of 2010, the population was 12,945.
Common Questions
What is Per Capita Income in Pulaski County?
Per Capita income in Pulaski County is $22,947.
What is the Median Family Income in Pulaski County?
Median Family Income in Pulaski County is $59,957.
What is the Median Household income in Pulaski County?
Median Household Income in Pulaski County is $41,038.
What is Income or Wage Gap in Pulaski County?
Income or Wage Gap in Pulaski County is 35.6%.
Women in Pulaski County earn 64.4 cents for every dollar earned by a man.
What is Inequality or Gini Index in Pulaski County?
Inequality or Gini Index in Pulaski County is 0.46.
What is the Total Population of Pulaski County?
Total Population of Pulaski County is 5,177.
What is the Total Male Population of Pulaski County?
Total Male Population of Pulaski County is 2,600.
What is the Total Female Population of Pulaski County?
Total Female Population of Pulaski County is 2,577.
What is the Ratio of Males per 100 Females in Pulaski County?
There are 100.89 Males per 100 Females in Pulaski County.
What is the Ratio of Females per 100 Males in Pulaski County?
There are 99.12 Females per 100 Males in Pulaski County.
What is the Median Population Age in Pulaski County?
Median Population Age in Pulaski County is 43.9 Years.
What is the Average Family Size in Pulaski County
Average Family Size in Pulaski County is 3.5 People.
What is the Average Household Size in Pulaski County
Average Household Size in Pulaski County is 2.7 People.
How Large is the Labor Force in Pulaski County?
There are 1,855 People in the Labor Forcein in Pulaski County.
What is the Percentage of People in the Labor Force in Pulaski County?
43.6% of People are in the Labor Force in Pulaski County.
What is the Unemployment Rate in Pulaski County?
Unemployment Rate in Pulaski County is 4.2%.