Pope County, IL Map & Demographics
Pope County Map
Pope County Overview
$26,251
PER CAPITA INCOME
$73,598
AVG FAMILY INCOME
$57,582
AVG HOUSEHOLD INCOME
28.5%
WAGE / INCOME GAP [ % ]
71.5¢/ $1
WAGE / INCOME GAP [ $ ]
$15,298
FAMILY INCOME DEFICIT
0.44
INEQUALITY / GINI INDEX
3,799
TOTAL POPULATION
1,966
MALE POPULATION
1,833
FEMALE POPULATION
107.26
MALES / 100 FEMALES
93.23
FEMALES / 100 MALES
49.7
MEDIAN AGE
3.4
AVG FAMILY SIZE
2.7
AVG HOUSEHOLD SIZE
1,414
LABOR FORCE [ PEOPLE ]
43.7%
PERCENT IN LABOR FORCE
9.1%
UNEMPLOYMENT RATE
Pope County Area Codes
Income in Pope County
Income Overview in Pope County
Per Capita Income in Pope County is $26,251, while median incomes of families and households are $73,598 and $57,582 respectively.
| Characteristic | Number | Measure |
| Per Capita Income | 3,799 | $26,251 |
| Median Family Income | 854 | $73,598 |
| Mean Family Income | 854 | $82,514 |
| Median Household Income | 1,349 | $57,582 |
| Mean Household Income | 1,349 | $66,317 |
| Income Deficit | 854 | $15,298 |
| Wage / Income Gap (%) | 3,799 | 28.46% |
| Wage / Income Gap ($) | 3,799 | 71.54¢ per $1 |
| Gini / Inequality Index | 3,799 | 0.44 |
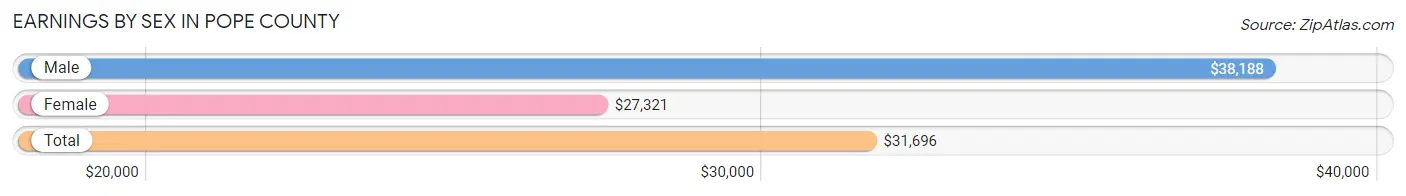
Earnings by Sex in Pope County
Average Earnings in Pope County are $31,696, $38,188 for men and $27,321 for women, a difference of 28.5%.
| Sex | Number | Average Earnings |
| Male | 753 (49.3%) | $38,188 |
| Female | 775 (50.7%) | $27,321 |
| Total | 1,528 (100.0%) | $31,696 |
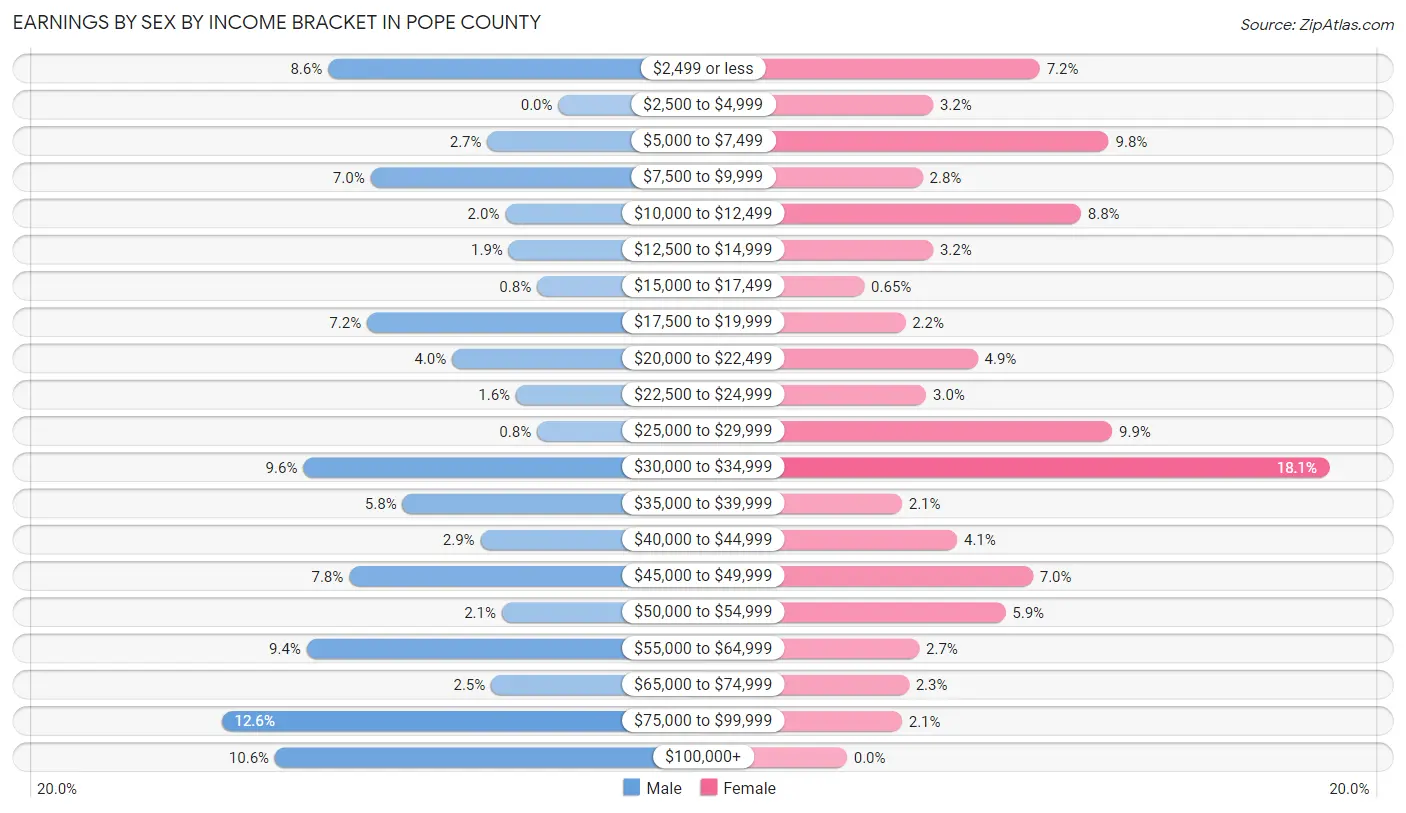
Earnings by Sex by Income Bracket in Pope County
The most common earnings brackets in Pope County are $75,000 to $99,999 for men (95 | 12.6%) and $30,000 to $34,999 for women (140 | 18.1%).
| Income | Male | Female |
| $2,499 or less | 65 (8.6%) | 56 (7.2%) |
| $2,500 to $4,999 | 0 (0.0%) | 25 (3.2%) |
| $5,000 to $7,499 | 20 (2.7%) | 76 (9.8%) |
| $7,500 to $9,999 | 53 (7.0%) | 22 (2.8%) |
| $10,000 to $12,499 | 15 (2.0%) | 68 (8.8%) |
| $12,500 to $14,999 | 14 (1.9%) | 25 (3.2%) |
| $15,000 to $17,499 | 6 (0.8%) | 5 (0.6%) |
| $17,500 to $19,999 | 54 (7.2%) | 17 (2.2%) |
| $20,000 to $22,499 | 30 (4.0%) | 38 (4.9%) |
| $22,500 to $24,999 | 12 (1.6%) | 23 (3.0%) |
| $25,000 to $29,999 | 6 (0.8%) | 77 (9.9%) |
| $30,000 to $34,999 | 72 (9.6%) | 140 (18.1%) |
| $35,000 to $39,999 | 44 (5.8%) | 16 (2.1%) |
| $40,000 to $44,999 | 22 (2.9%) | 32 (4.1%) |
| $45,000 to $49,999 | 59 (7.8%) | 54 (7.0%) |
| $50,000 to $54,999 | 16 (2.1%) | 46 (5.9%) |
| $55,000 to $64,999 | 71 (9.4%) | 21 (2.7%) |
| $65,000 to $74,999 | 19 (2.5%) | 18 (2.3%) |
| $75,000 to $99,999 | 95 (12.6%) | 16 (2.1%) |
| $100,000+ | 80 (10.6%) | 0 (0.0%) |
| Total | 753 (100.0%) | 775 (100.0%) |
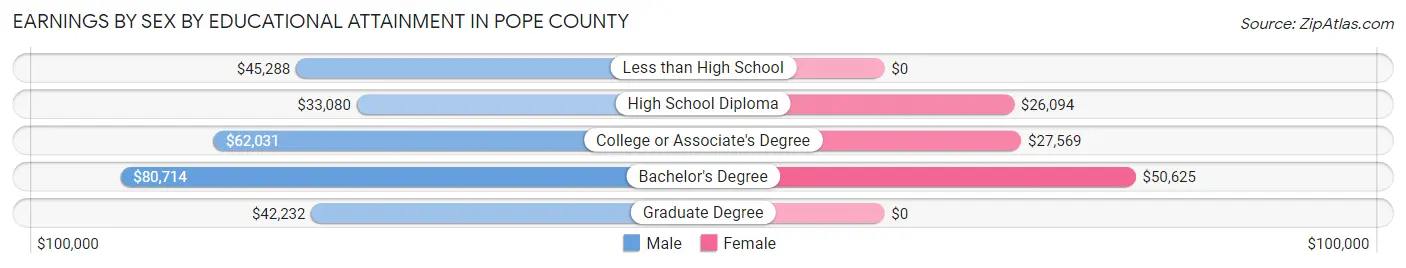
Earnings by Sex by Educational Attainment in Pope County
Average earnings in Pope County are $45,625 for men and $29,077 for women, a difference of 36.3%. Men with an educational attainment of bachelor's degree enjoy the highest average annual earnings of $80,714, while those with high school diploma education earn the least with $33,080. Women with an educational attainment of bachelor's degree earn the most with the average annual earnings of $50,625, while those with high school diploma education have the smallest earnings of $26,094.
| Educational Attainment | Male Income | Female Income |
| Less than High School | $45,288 | $0 |
| High School Diploma | $33,080 | $26,094 |
| College or Associate's Degree | $62,031 | $27,569 |
| Bachelor's Degree | $80,714 | $50,625 |
| Graduate Degree | $42,232 | $0 |
| Total | $45,625 | $29,077 |
Family Income in Pope County
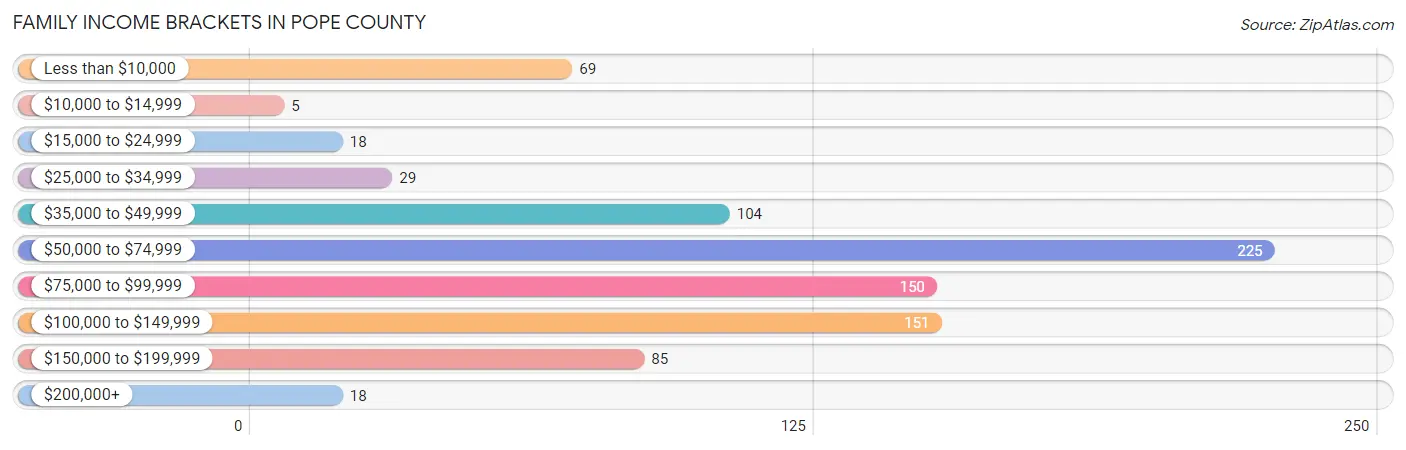
Family Income Brackets in Pope County
According to the Pope County family income data, there are 225 families falling into the $50,000 to $74,999 income range, which is the most common income bracket and makes up 26.4% of all families. Conversely, the $10,000 to $14,999 income bracket is the least frequent group with only 5 families (0.6%) belonging to this category.
| Income Bracket | # Families | % Families |
| Less than $10,000 | 69 | 8.1% |
| $10,000 to $14,999 | 5 | 0.6% |
| $15,000 to $24,999 | 18 | 2.1% |
| $25,000 to $34,999 | 29 | 3.4% |
| $35,000 to $49,999 | 104 | 12.2% |
| $50,000 to $74,999 | 225 | 26.3% |
| $75,000 to $99,999 | 150 | 17.6% |
| $100,000 to $149,999 | 151 | 17.7% |
| $150,000 to $199,999 | 85 | 10.0% |
| $200,000+ | 18 | 2.1% |
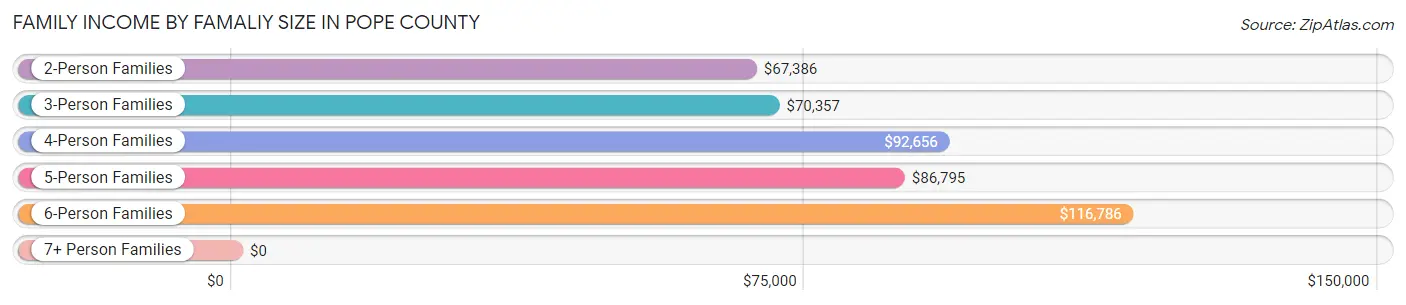
Family Income by Famaliy Size in Pope County
6-person families (22 | 2.6%) account for the highest median family income in Pope County with $116,786 per family, while 2-person families (501 | 58.7%) have the highest median income of $33,693 per family member.
| Income Bracket | # Families | Median Income |
| 2-Person Families | 501 (58.7%) | $67,386 |
| 3-Person Families | 180 (21.1%) | $70,357 |
| 4-Person Families | 77 (9.0%) | $92,656 |
| 5-Person Families | 74 (8.7%) | $86,795 |
| 6-Person Families | 22 (2.6%) | $116,786 |
| 7+ Person Families | 0 (0.0%) | $0 |
| Total | 854 (100.0%) | $73,598 |
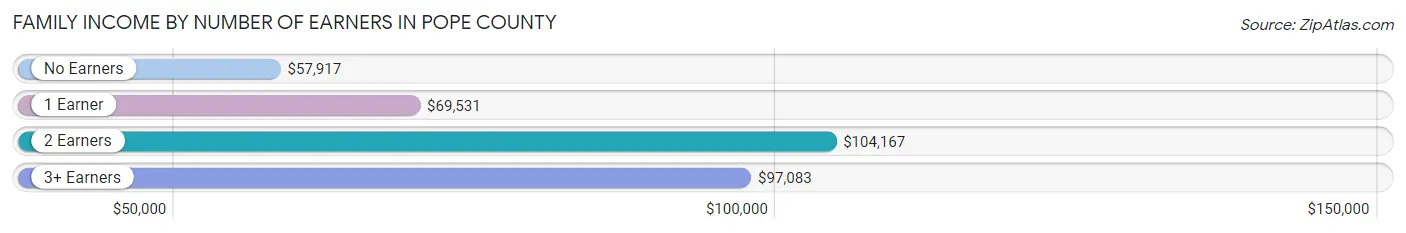
Family Income by Number of Earners in Pope County
The median family income in Pope County is $73,598, with families comprising 2 earners (242) having the highest median family income of $104,167, while families with no earners (261) have the lowest median family income of $57,917, accounting for 28.3% and 30.6% of families, respectively.
| Number of Earners | # Families | Median Income |
| No Earners | 261 (30.6%) | $57,917 |
| 1 Earner | 301 (35.2%) | $69,531 |
| 2 Earners | 242 (28.3%) | $104,167 |
| 3+ Earners | 50 (5.9%) | $97,083 |
| Total | 854 (100.0%) | $73,598 |
Household Income in Pope County
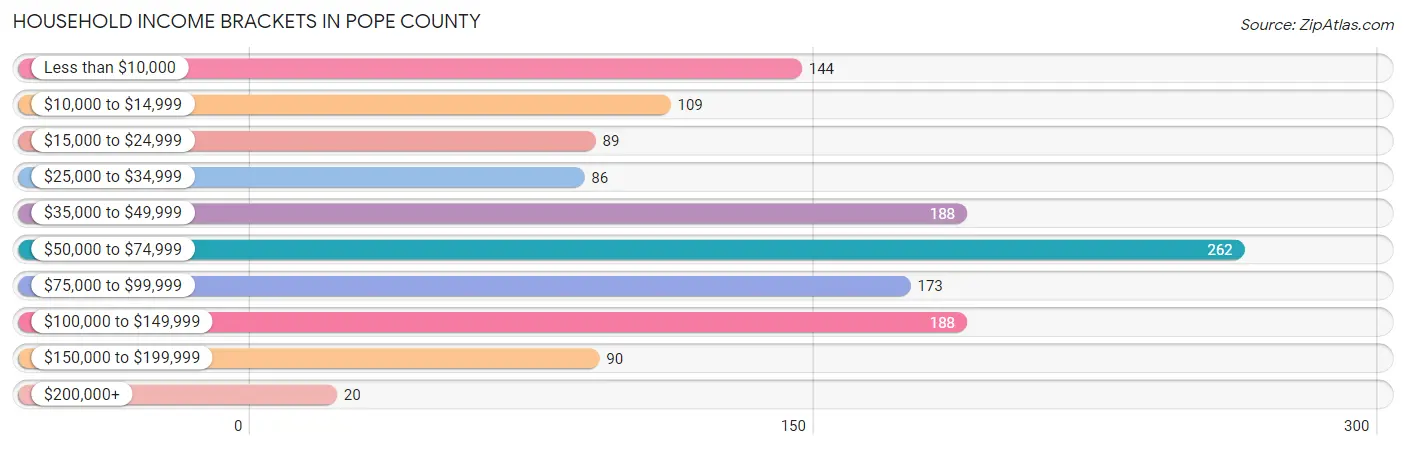
Household Income Brackets in Pope County
With 262 households falling in the category, the $50,000 to $74,999 income range is the most frequent in Pope County, accounting for 19.4% of all households. In contrast, only 20 households (1.5%) fall into the $200,000+ income bracket, making it the least populous group.
| Income Bracket | # Households | % Households |
| Less than $10,000 | 144 | 10.7% |
| $10,000 to $14,999 | 109 | 8.1% |
| $15,000 to $24,999 | 89 | 6.6% |
| $25,000 to $34,999 | 86 | 6.4% |
| $35,000 to $49,999 | 188 | 13.9% |
| $50,000 to $74,999 | 262 | 19.4% |
| $75,000 to $99,999 | 173 | 12.8% |
| $100,000 to $149,999 | 188 | 13.9% |
| $150,000 to $199,999 | 90 | 6.7% |
| $200,000+ | 20 | 1.5% |
Household Income by Householder Age in Pope County
The median household income in Pope County is $57,582, with the highest median household income of $94,063 found in the 25 to 44 years age bracket for the primary householder. A total of 221 households (16.4%) fall into this category. Meanwhile, the 15 to 24 years age bracket for the primary householder has the lowest median household income of $0, with 17 households (1.3%) in this group.
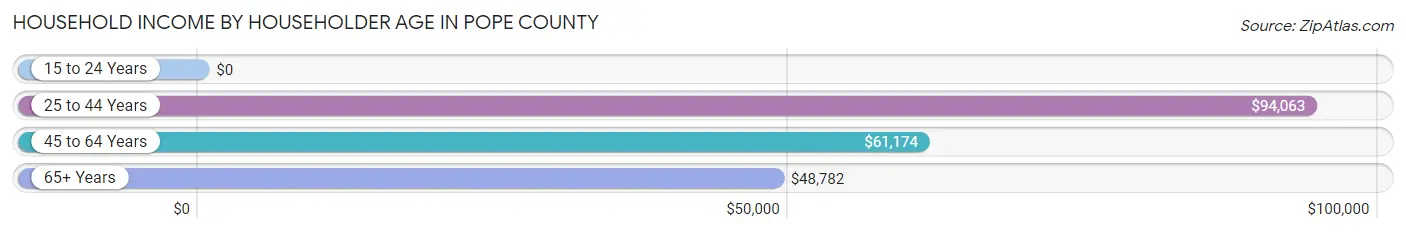
| Income Bracket | # Households | Median Income |
| 15 to 24 Years | 17 (1.3%) | $0 |
| 25 to 44 Years | 221 (16.4%) | $94,063 |
| 45 to 64 Years | 497 (36.8%) | $61,174 |
| 65+ Years | 614 (45.5%) | $48,782 |
| Total | 1,349 (100.0%) | $57,582 |
Poverty in Pope County
Income Below Poverty by Sex and Age in Pope County
With 19.3% poverty level for males and 18.1% for females among the residents of Pope County, 5 year old males and under 5 year old females are the most vulnerable to poverty, with 16 males (72.7%) and 63 females (52.5%) in their respective age groups living below the poverty level.
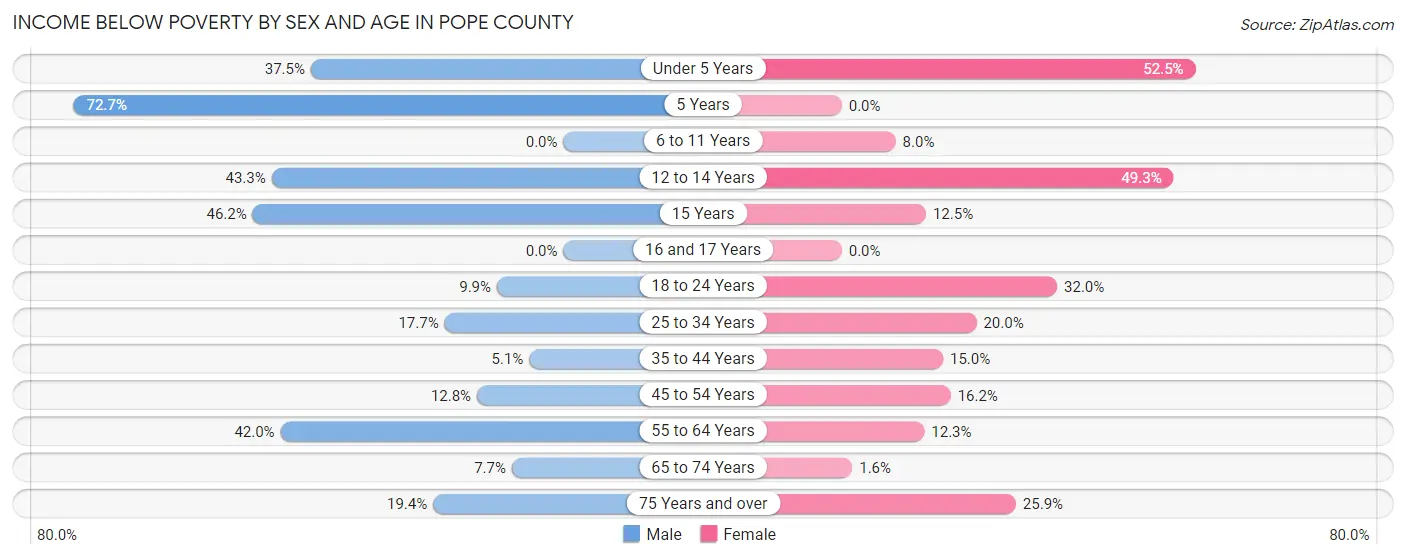
| Age Bracket | Male | Female |
| Under 5 Years | 27 (37.5%) | 63 (52.5%) |
| 5 Years | 16 (72.7%) | 0 (0.0%) |
| 6 to 11 Years | 0 (0.0%) | 4 (8.0%) |
| 12 to 14 Years | 13 (43.3%) | 33 (49.2%) |
| 15 Years | 6 (46.2%) | 3 (12.5%) |
| 16 and 17 Years | 0 (0.0%) | 0 (0.0%) |
| 18 to 24 Years | 15 (9.9%) | 39 (32.0%) |
| 25 to 34 Years | 24 (17.6%) | 23 (20.0%) |
| 35 to 44 Years | 11 (5.1%) | 26 (15.0%) |
| 45 to 54 Years | 29 (12.8%) | 43 (16.2%) |
| 55 to 64 Years | 155 (42.0%) | 45 (12.3%) |
| 65 to 74 Years | 25 (7.6%) | 4 (1.6%) |
| 75 Years and over | 36 (19.4%) | 38 (25.9%) |
| Total | 357 (19.3%) | 321 (18.1%) |
Income Above Poverty by Sex and Age in Pope County
According to the poverty statistics in Pope County, males aged 6 to 11 years and females aged 5 years are the age groups that are most secure financially, with 100.0% of males and 100.0% of females in these age groups living above the poverty line.
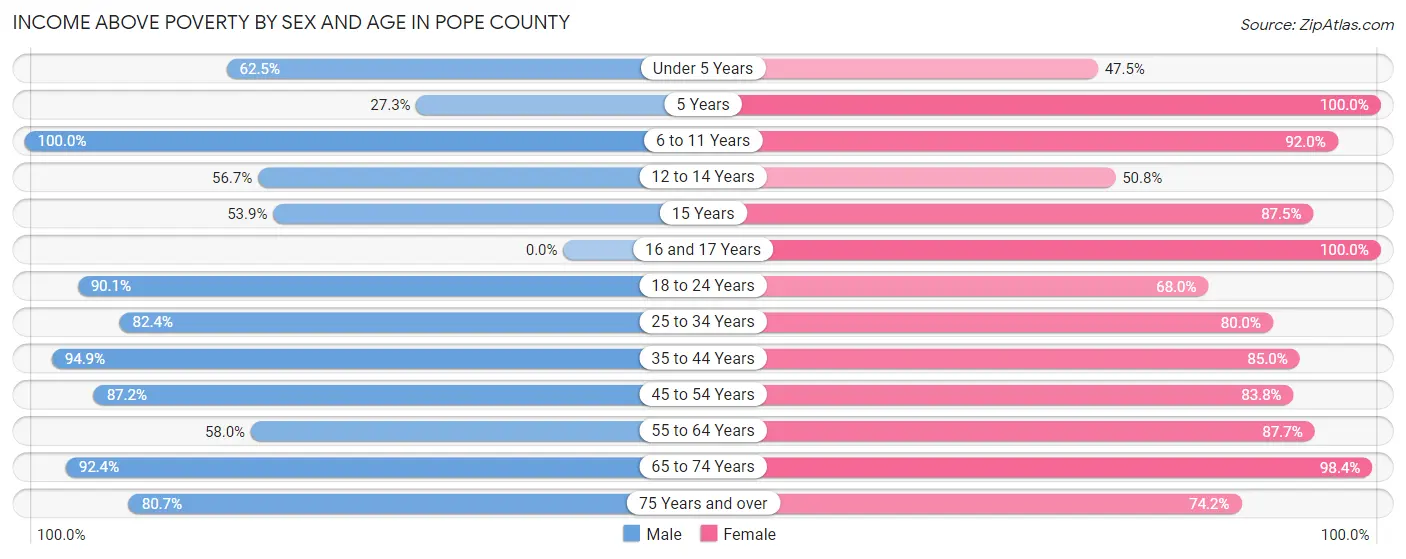
| Age Bracket | Male | Female |
| Under 5 Years | 45 (62.5%) | 57 (47.5%) |
| 5 Years | 6 (27.3%) | 16 (100.0%) |
| 6 to 11 Years | 99 (100.0%) | 46 (92.0%) |
| 12 to 14 Years | 17 (56.7%) | 34 (50.7%) |
| 15 Years | 7 (53.8%) | 21 (87.5%) |
| 16 and 17 Years | 0 (0.0%) | 53 (100.0%) |
| 18 to 24 Years | 137 (90.1%) | 83 (68.0%) |
| 25 to 34 Years | 112 (82.4%) | 92 (80.0%) |
| 35 to 44 Years | 206 (94.9%) | 147 (85.0%) |
| 45 to 54 Years | 197 (87.2%) | 223 (83.8%) |
| 55 to 64 Years | 214 (58.0%) | 322 (87.7%) |
| 65 to 74 Years | 302 (92.3%) | 252 (98.4%) |
| 75 Years and over | 150 (80.6%) | 109 (74.2%) |
| Total | 1,492 (80.7%) | 1,455 (81.9%) |
Income Below Poverty Among Married-Couple Families in Pope County
The poverty statistics for married-couple families in Pope County show that 4.6% or 33 of the total 724 families live below the poverty line. Families with no children have the highest poverty rate of 5.7%, comprising of 31 families. On the other hand, families with 3 or 4 children have the lowest poverty rate of 0.0%, which includes 0 families.
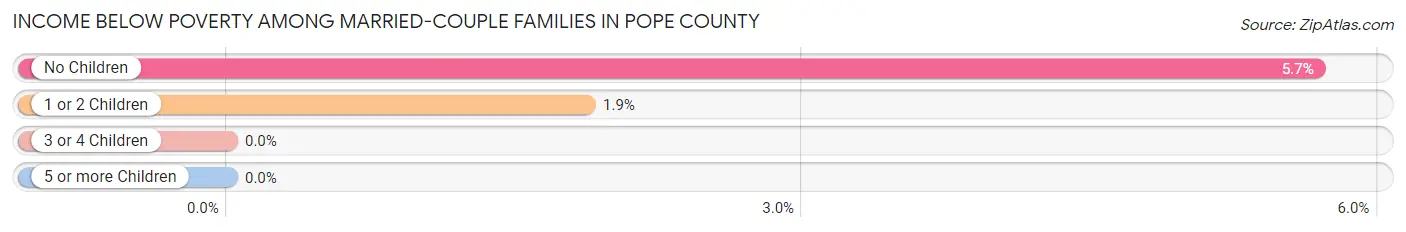
| Children | Above Poverty | Below Poverty |
| No Children | 515 (94.3%) | 31 (5.7%) |
| 1 or 2 Children | 105 (98.1%) | 2 (1.9%) |
| 3 or 4 Children | 71 (100.0%) | 0 (0.0%) |
| 5 or more Children | 0 (0.0%) | 0 (0.0%) |
| Total | 691 (95.4%) | 33 (4.6%) |
Income Below Poverty Among Single-Parent Households in Pope County
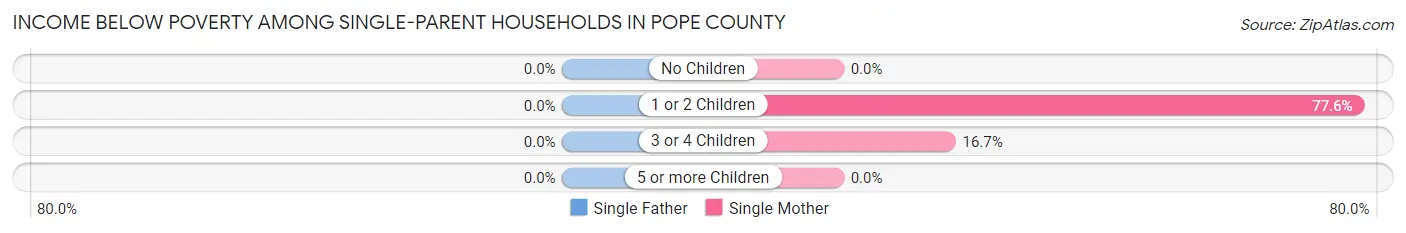
| Children | Single Father | Single Mother |
| No Children | 0 (0.0%) | 0 (0.0%) |
| 1 or 2 Children | 0 (0.0%) | 45 (77.6%) |
| 3 or 4 Children | 0 (0.0%) | 4 (16.7%) |
| 5 or more Children | 0 (0.0%) | 0 (0.0%) |
| Total | 0 (0.0%) | 49 (54.4%) |
Income Below Poverty Among Married-Couple vs Single-Parent Households in Pope County
The poverty data for Pope County shows that 33 of the married-couple family households (4.6%) and 49 of the single-parent households (37.7%) are living below the poverty level. Within the married-couple family households, those with no children have the highest poverty rate, with 31 households (5.7%) falling below the poverty line. Among the single-parent households, those with 1 or 2 children have the highest poverty rate, with 45 household (56.2%) living below poverty.
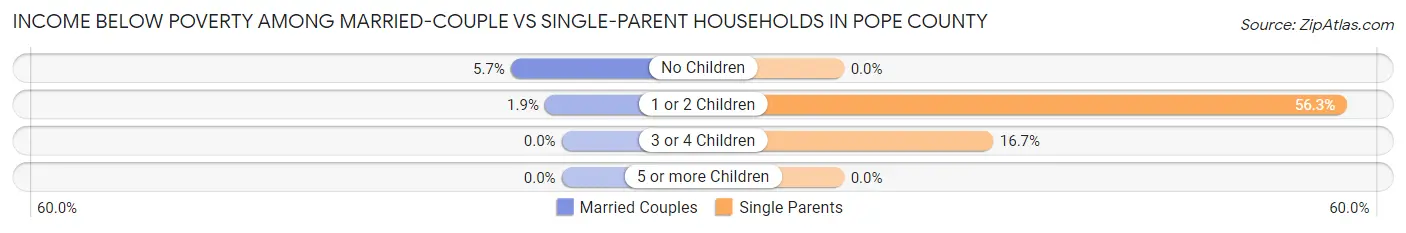
| Children | Married-Couple Families | Single-Parent Households |
| No Children | 31 (5.7%) | 0 (0.0%) |
| 1 or 2 Children | 2 (1.9%) | 45 (56.2%) |
| 3 or 4 Children | 0 (0.0%) | 4 (16.7%) |
| 5 or more Children | 0 (0.0%) | 0 (0.0%) |
| Total | 33 (4.6%) | 49 (37.7%) |
Race in Pope County
The most populous races in Pope County are White / Caucasian (3,421 | 90.0%), Two or more Races (133 | 3.5%), and Black / African American (126 | 3.3%).
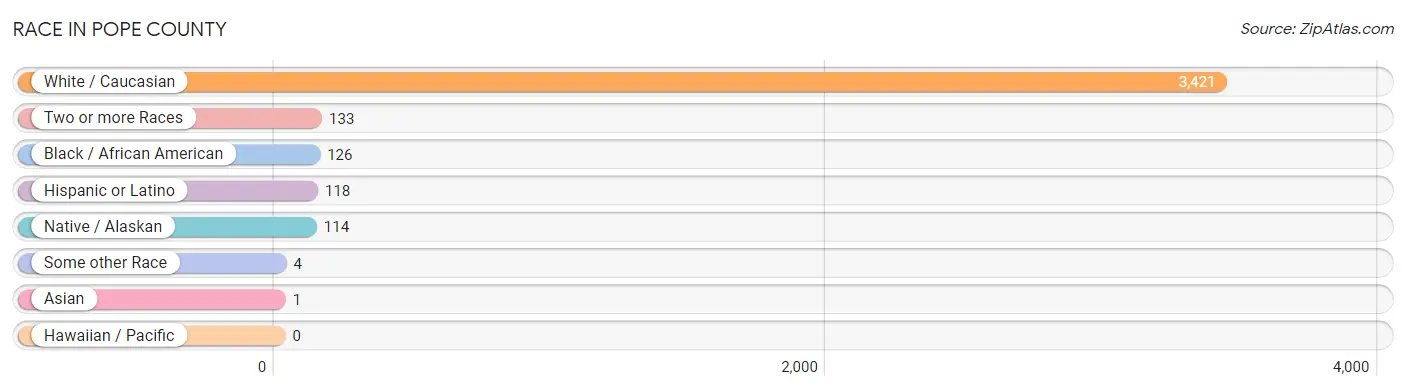
| Race | # Population | % Population |
| Asian | 1 | 0.0% |
| Black / African American | 126 | 3.3% |
| Hawaiian / Pacific | 0 | 0.0% |
| Hispanic or Latino | 118 | 3.1% |
| Native / Alaskan | 114 | 3.0% |
| White / Caucasian | 3,421 | 90.0% |
| Two or more Races | 133 | 3.5% |
| Some other Race | 4 | 0.1% |
| Total | 3,799 | 100.0% |
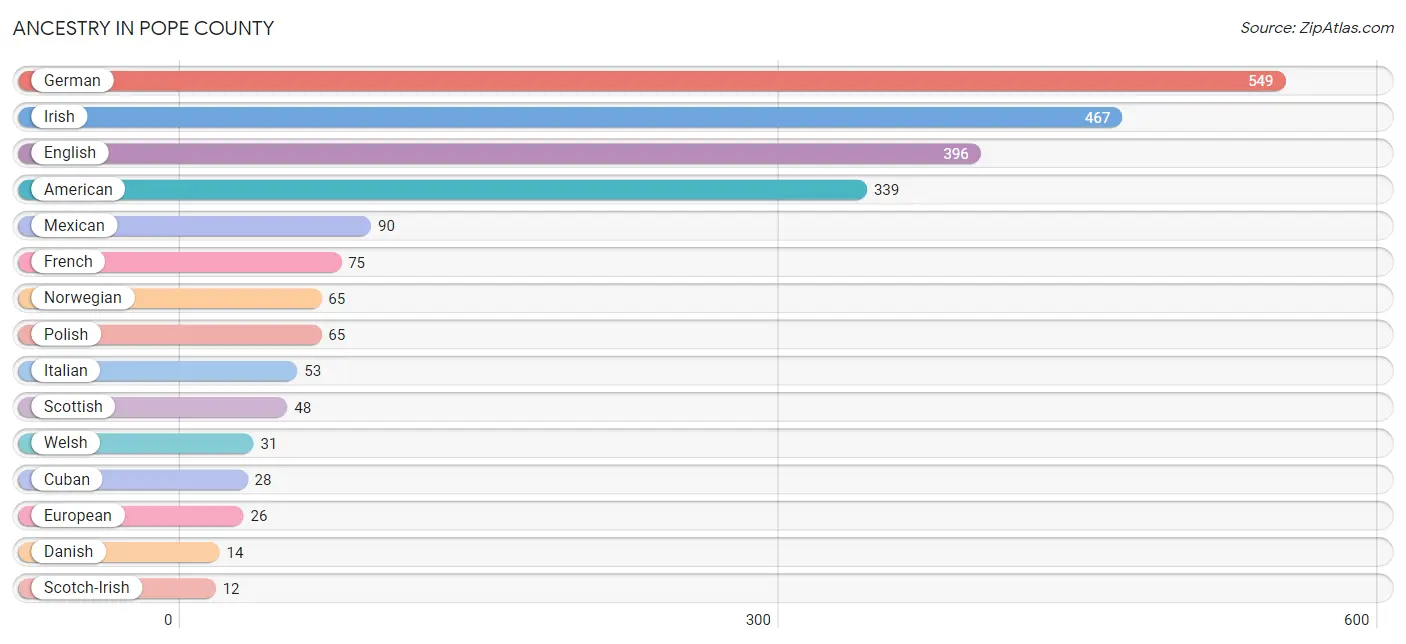
Ancestry in Pope County
The most populous ancestries reported in Pope County are German (549 | 14.4%), Irish (467 | 12.3%), English (396 | 10.4%), American (339 | 8.9%), and Mexican (90 | 2.4%), together accounting for 48.4% of all Pope County residents.
| Ancestry | # Population | % Population |
| American | 339 | 8.9% |
| Apache | 2 | 0.1% |
| Bhutanese | 1 | 0.0% |
| Cherokee | 5 | 0.1% |
| Cuban | 28 | 0.7% |
| Danish | 14 | 0.4% |
| Dutch | 11 | 0.3% |
| English | 396 | 10.4% |
| European | 26 | 0.7% |
| Finnish | 5 | 0.1% |
| French | 75 | 2.0% |
| German | 549 | 14.4% |
| Greek | 6 | 0.2% |
| Irish | 467 | 12.3% |
| Italian | 53 | 1.4% |
| Lithuanian | 9 | 0.2% |
| Mexican | 90 | 2.4% |
| Norwegian | 65 | 1.7% |
| Ottawa | 10 | 0.3% |
| Polish | 65 | 1.7% |
| Puget Sound Salish | 6 | 0.2% |
| Russian | 9 | 0.2% |
| Scotch-Irish | 12 | 0.3% |
| Scottish | 48 | 1.3% |
| Swedish | 7 | 0.2% |
| Swiss | 9 | 0.2% |
| Welsh | 31 | 0.8% | View All 27 Rows |
Immigrants in Pope County
The most numerous immigrant groups reported in Pope County came from Europe (21 | 0.5%), Latin America (14 | 0.4%), Central America (10 | 0.3%), Mexico (10 | 0.3%), and Italy (8 | 0.2%), together accounting for 1.7% of all Pope County residents.
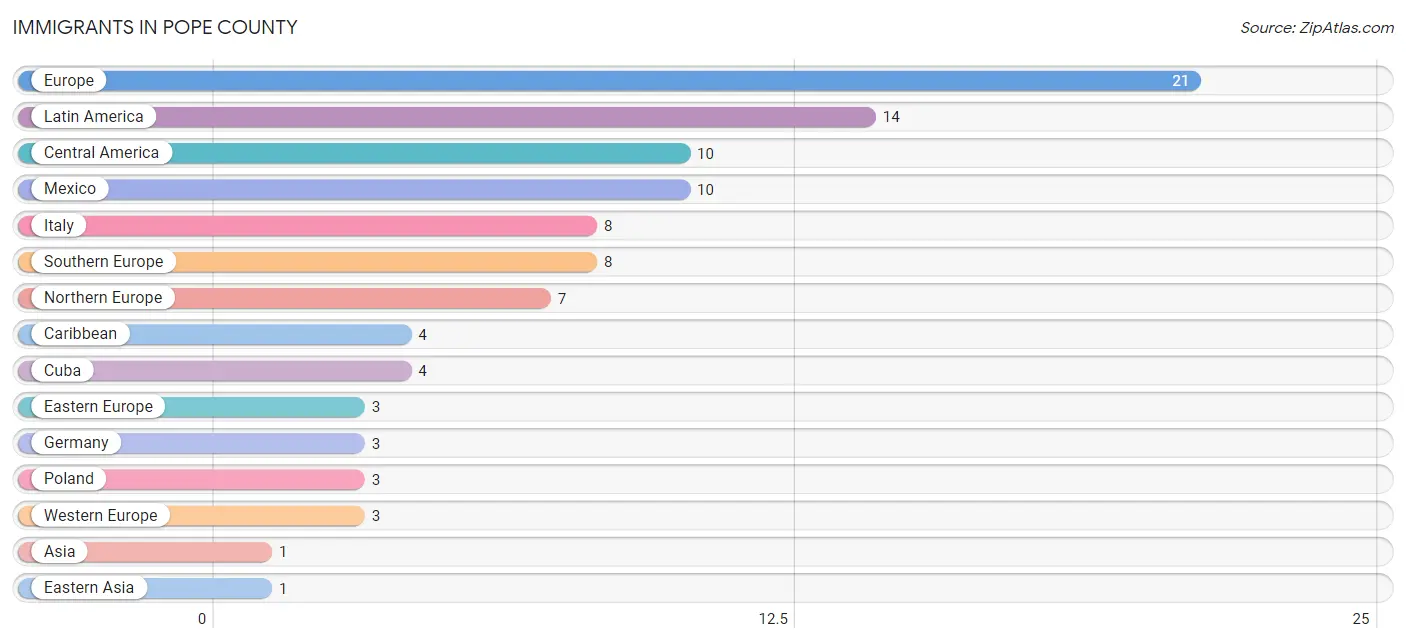
| Immigration Origin | # Population | % Population |
| Asia | 1 | 0.0% |
| Caribbean | 4 | 0.1% |
| Central America | 10 | 0.3% |
| Cuba | 4 | 0.1% |
| Eastern Asia | 1 | 0.0% |
| Eastern Europe | 3 | 0.1% |
| Europe | 21 | 0.5% |
| Germany | 3 | 0.1% |
| Italy | 8 | 0.2% |
| Japan | 1 | 0.0% |
| Latin America | 14 | 0.4% |
| Mexico | 10 | 0.3% |
| Northern Europe | 7 | 0.2% |
| Poland | 3 | 0.1% |
| Southern Europe | 8 | 0.2% |
| Western Europe | 3 | 0.1% | View All 16 Rows |
Sex and Age in Pope County
Sex and Age in Pope County
The most populous age groups in Pope County are 55 to 59 Years (264 | 13.4%) for men and 60 to 64 Years (239 | 13.0%) for women.
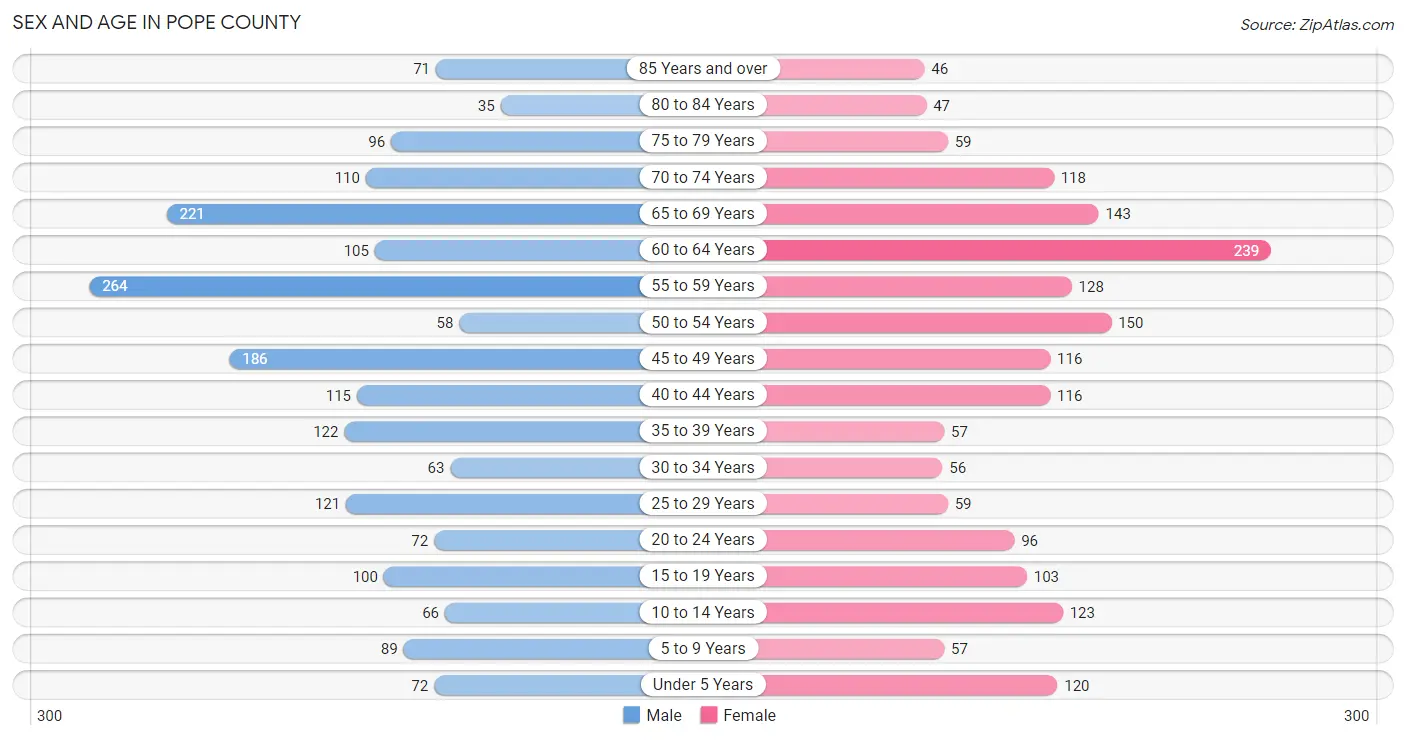
| Age Bracket | Male | Female |
| Under 5 Years | 72 (3.7%) | 120 (6.6%) |
| 5 to 9 Years | 89 (4.5%) | 57 (3.1%) |
| 10 to 14 Years | 66 (3.4%) | 123 (6.7%) |
| 15 to 19 Years | 100 (5.1%) | 103 (5.6%) |
| 20 to 24 Years | 72 (3.7%) | 96 (5.2%) |
| 25 to 29 Years | 121 (6.1%) | 59 (3.2%) |
| 30 to 34 Years | 63 (3.2%) | 56 (3.1%) |
| 35 to 39 Years | 122 (6.2%) | 57 (3.1%) |
| 40 to 44 Years | 115 (5.9%) | 116 (6.3%) |
| 45 to 49 Years | 186 (9.5%) | 116 (6.3%) |
| 50 to 54 Years | 58 (2.9%) | 150 (8.2%) |
| 55 to 59 Years | 264 (13.4%) | 128 (7.0%) |
| 60 to 64 Years | 105 (5.3%) | 239 (13.0%) |
| 65 to 69 Years | 221 (11.2%) | 143 (7.8%) |
| 70 to 74 Years | 110 (5.6%) | 118 (6.4%) |
| 75 to 79 Years | 96 (4.9%) | 59 (3.2%) |
| 80 to 84 Years | 35 (1.8%) | 47 (2.6%) |
| 85 Years and over | 71 (3.6%) | 46 (2.5%) |
| Total | 1,966 (100.0%) | 1,833 (100.0%) |
Families and Households in Pope County
Median Family Size in Pope County
The median family size in Pope County is 3.43 persons per family, with single male/father families (40 | 4.7%) accounting for the largest median family size of 8.95 persons per family. On the other hand, married-couple families (724 | 84.8%) represent the smallest median family size with 2.94 persons per family.
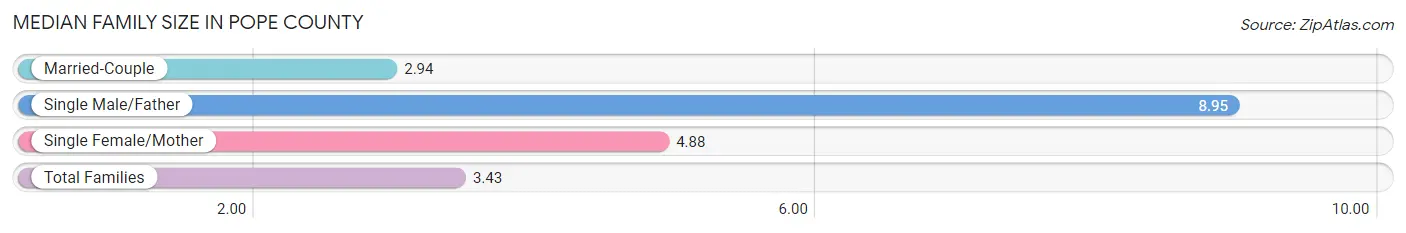
| Family Type | # Families | Family Size |
| Married-Couple | 724 (84.8%) | 2.94 |
| Single Male/Father | 40 (4.7%) | 8.95 |
| Single Female/Mother | 90 (10.5%) | 4.88 |
| Total Families | 854 (100.0%) | 3.43 |
Median Household Size in Pope County
The median household size in Pope County is 2.68 persons per household, with single male/father households (40 | 3.0%) accounting for the largest median household size of 9.38 persons per household. non-family households (495 | 36.7%) represent the smallest median household size with 1.03 persons per household.
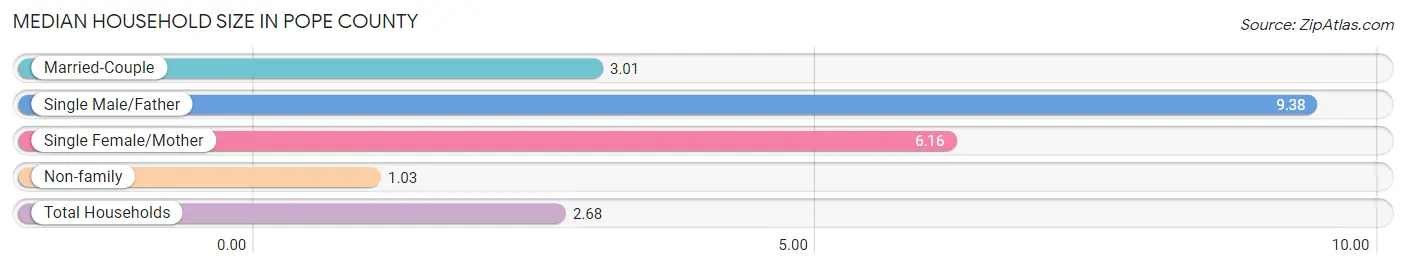
| Household Type | # Households | Household Size |
| Married-Couple | 724 (53.7%) | 3.01 |
| Single Male/Father | 40 (3.0%) | 9.38 |
| Single Female/Mother | 90 (6.7%) | 6.16 |
| Non-family | 495 (36.7%) | 1.03 |
| Total Households | 1,349 (100.0%) | 2.68 |
Household Size by Marriage Status in Pope County
Out of a total of 1,349 households in Pope County, 854 (63.3%) are family households, while 495 (36.7%) are nonfamily households. The most numerous type of family households are 2-person households, comprising 483, and the most common type of nonfamily households are 1-person households, comprising 484.
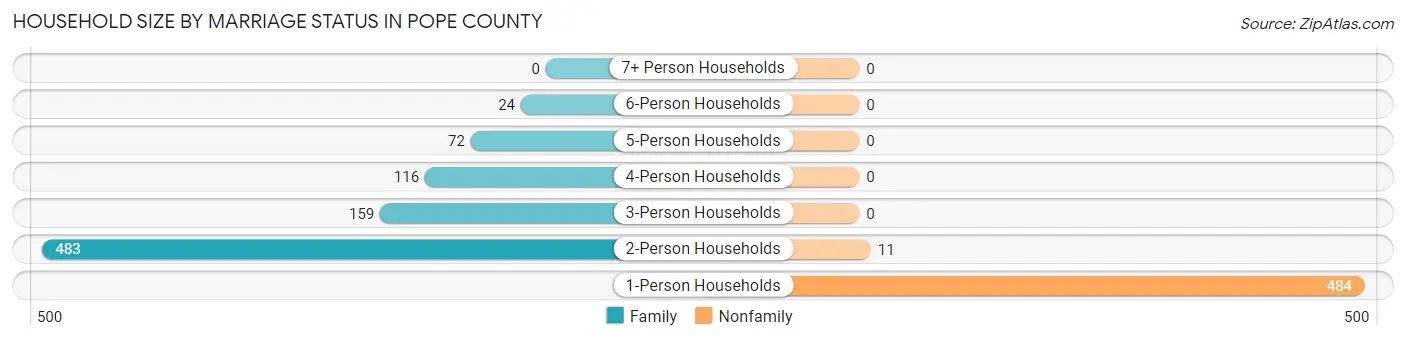
| Household Size | Family Households | Nonfamily Households |
| 1-Person Households | - | 484 (35.9%) |
| 2-Person Households | 483 (35.8%) | 11 (0.8%) |
| 3-Person Households | 159 (11.8%) | 0 (0.0%) |
| 4-Person Households | 116 (8.6%) | 0 (0.0%) |
| 5-Person Households | 72 (5.3%) | 0 (0.0%) |
| 6-Person Households | 24 (1.8%) | 0 (0.0%) |
| 7+ Person Households | 0 (0.0%) | 0 (0.0%) |
| Total | 854 (63.3%) | 495 (36.7%) |
Female Fertility in Pope County
Fertility by Age in Pope County
Average fertility rate in Pope County is 67.0 births per 1,000 women. Women in the age bracket of 20 to 34 years have the highest fertility rate with 114.0 births per 1,000 women. Women in the age bracket of 20 to 34 years acount for 55.8% of all women with births.
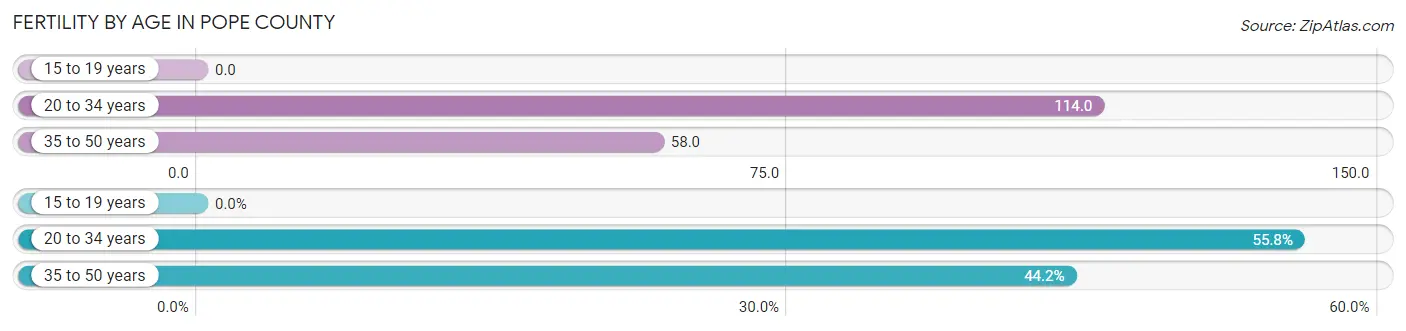
| Age Bracket | Women with Births | Births / 1,000 Women |
| 15 to 19 years | 0 (0.0%) | 0.0 |
| 20 to 34 years | 24 (55.8%) | 114.0 |
| 35 to 50 years | 19 (44.2%) | 58.0 |
| Total | 43 (100.0%) | 67.0 |
Fertility by Age by Marriage Status in Pope County
76.7% of women with births (43) in Pope County are married. The highest percentage of unmarried women with births falls into 20 to 34 years age bracket with 41.7% of them unmarried at the time of birth, while the lowest percentage of unmarried women with births belong to 35 to 50 years age bracket with 0.0% of them unmarried.
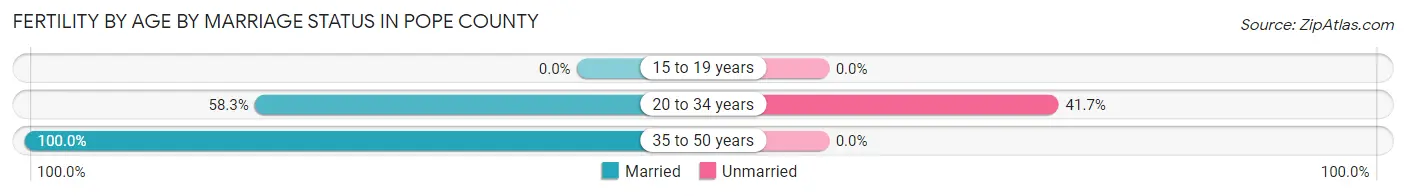
| Age Bracket | Married | Unmarried |
| 15 to 19 years | 0 (0.0%) | 0 (0.0%) |
| 20 to 34 years | 14 (58.3%) | 10 (41.7%) |
| 35 to 50 years | 19 (100.0%) | 0 (0.0%) |
| Total | 33 (76.7%) | 10 (23.3%) |
Fertility by Education in Pope County
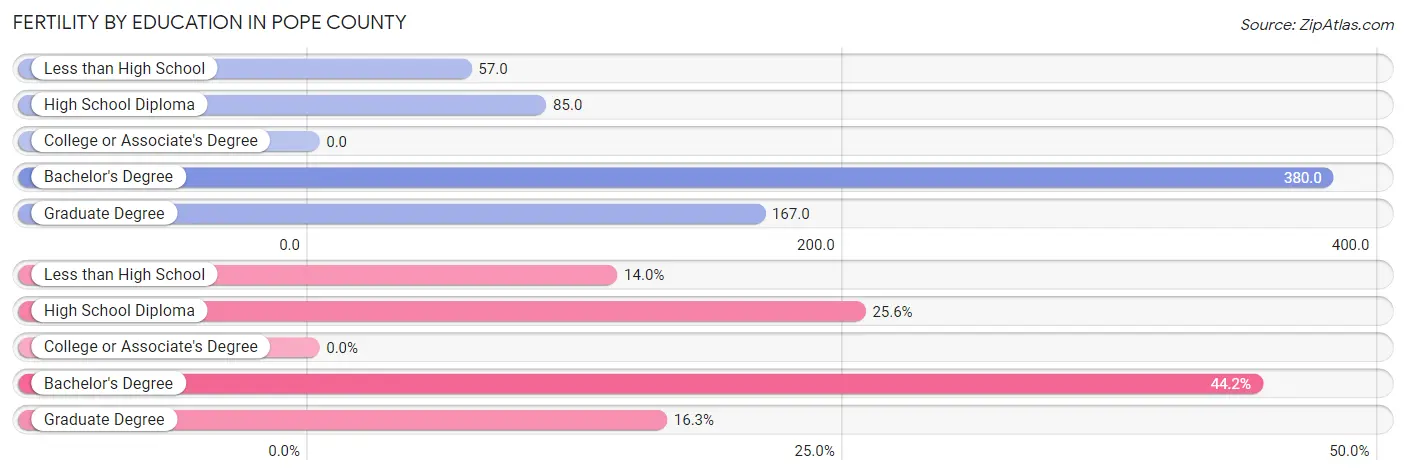
| Educational Attainment | Women with Births | Births / 1,000 Women |
| Less than High School | 6 (14.0%) | 57.0 |
| High School Diploma | 11 (25.6%) | 85.0 |
| College or Associate's Degree | 0 (0.0%) | 0.0 |
| Bachelor's Degree | 19 (44.2%) | 380.0 |
| Graduate Degree | 7 (16.3%) | 167.0 |
| Total | 43 (100.0%) | 67.0 |
Fertility by Education by Marriage Status in Pope County
23.3% of women with births in Pope County are unmarried. Women with the educational attainment of bachelor's degree are most likely to be married with 100.0% of them married at childbirth, while women with the educational attainment of less than high school are least likely to be married with 66.7% of them unmarried at childbirth.
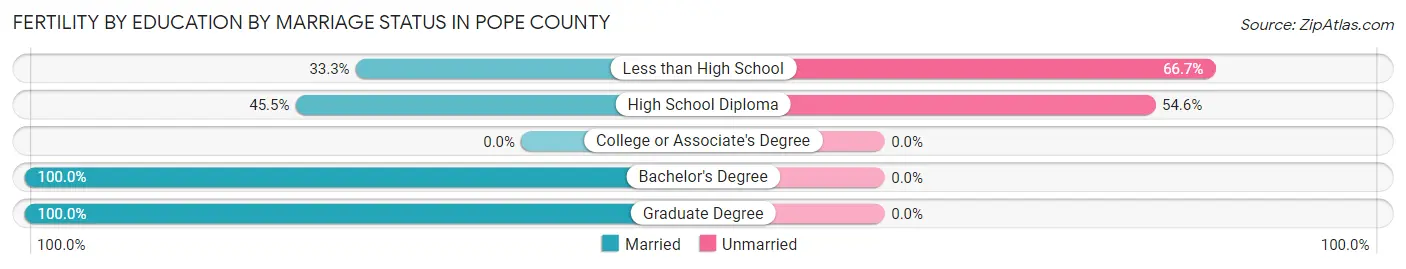
| Educational Attainment | Married | Unmarried |
| Less than High School | 2 (33.3%) | 4 (66.7%) |
| High School Diploma | 5 (45.5%) | 6 (54.5%) |
| College or Associate's Degree | 0 (0.0%) | 0 (0.0%) |
| Bachelor's Degree | 19 (100.0%) | 0 (0.0%) |
| Graduate Degree | 7 (100.0%) | 0 (0.0%) |
| Total | 33 (76.7%) | 10 (23.3%) |
Employment Characteristics in Pope County
Employment by Class of Employer in Pope County
Among the 1,263 employed individuals in Pope County, private company employees (653 | 51.7%), local government employees (159 | 12.6%), and state government employees (142 | 11.2%) make up the most common classes of employment.
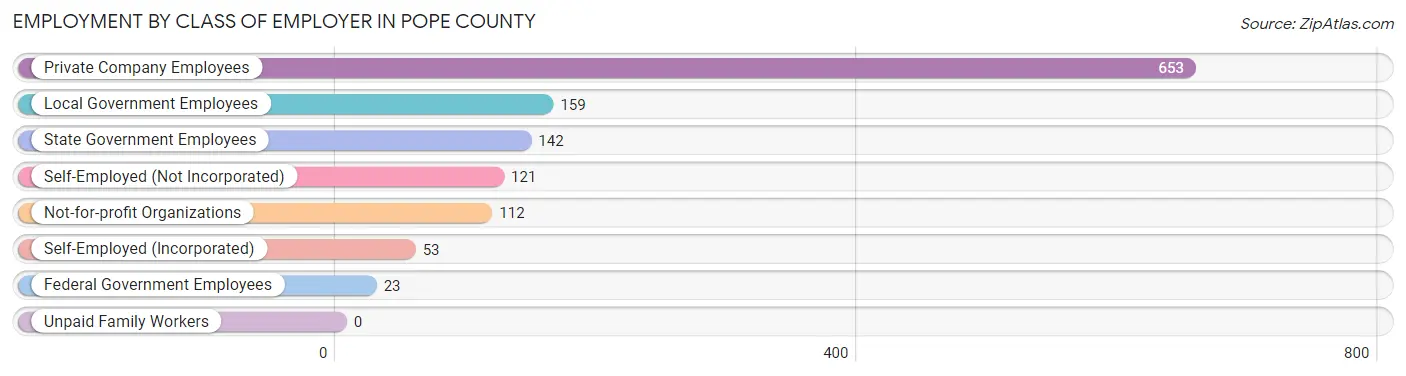
| Employer Class | # Employees | % Employees |
| Private Company Employees | 653 | 51.7% |
| Self-Employed (Incorporated) | 53 | 4.2% |
| Self-Employed (Not Incorporated) | 121 | 9.6% |
| Not-for-profit Organizations | 112 | 8.9% |
| Local Government Employees | 159 | 12.6% |
| State Government Employees | 142 | 11.2% |
| Federal Government Employees | 23 | 1.8% |
| Unpaid Family Workers | 0 | 0.0% |
| Total | 1,263 | 100.0% |
Employment Status by Age in Pope County
According to the labor force statistics for Pope County, out of the total population over 16 years of age (3,235), 43.7% or 1,414 individuals are in the labor force, with 9.1% or 129 of them unemployed. The age group with the highest labor force participation rate is 20 to 24 years, with 86.3% or 145 individuals in the labor force. Within the labor force, the 25 to 29 years age range has the highest percentage of unemployed individuals, with 31.7% or 32 of them being unemployed.
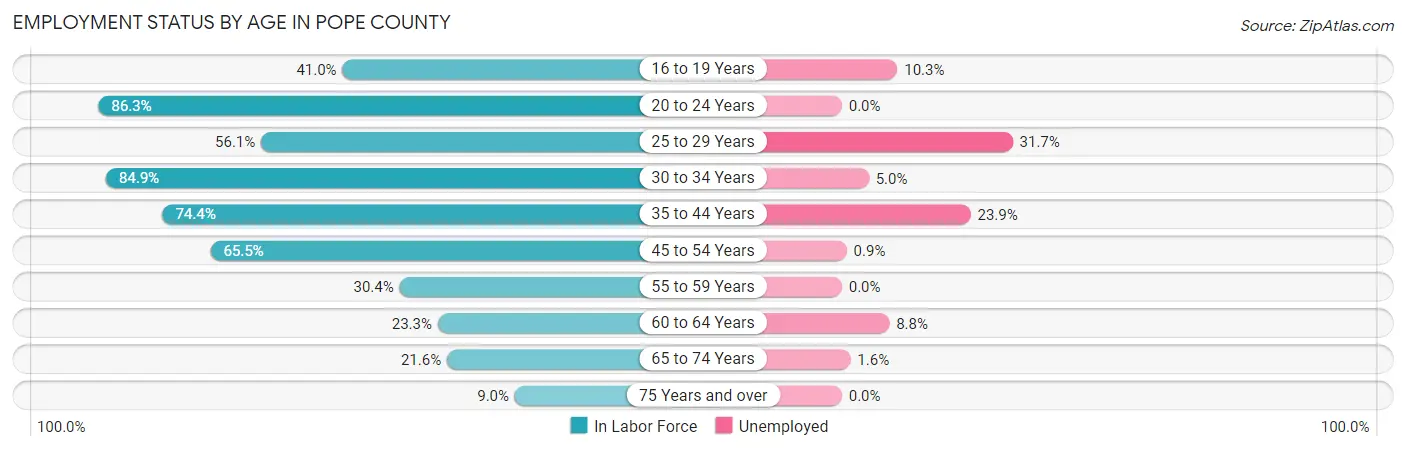
| Age Bracket | In Labor Force | Unemployed |
| 16 to 19 Years | 68 (41.0%) | 7 (10.3%) |
| 20 to 24 Years | 145 (86.3%) | 0 (0.0%) |
| 25 to 29 Years | 101 (56.1%) | 32 (31.7%) |
| 30 to 34 Years | 101 (84.9%) | 5 (5.0%) |
| 35 to 44 Years | 305 (74.4%) | 73 (23.9%) |
| 45 to 54 Years | 334 (65.5%) | 3 (0.9%) |
| 55 to 59 Years | 119 (30.4%) | 0 (0.0%) |
| 60 to 64 Years | 80 (23.3%) | 7 (8.8%) |
| 65 to 74 Years | 128 (21.6%) | 2 (1.6%) |
| 75 Years and over | 32 (9.0%) | 0 (0.0%) |
| Total | 1,414 (43.7%) | 129 (9.1%) |
Employment Status by Educational Attainment in Pope County
According to labor force statistics for Pope County, 53.2% of individuals (1,040) out of the total population between 25 and 64 years of age (1,955) are in the labor force, with 11.5% or 120 of them being unemployed. The group with the highest labor force participation rate are those with the educational attainment of bachelor's degree or higher, with 81.2% or 251 individuals in the labor force. Within the labor force, individuals with high school diploma education have the highest percentage of unemployment, with 24.4% or 88 of them being unemployed.
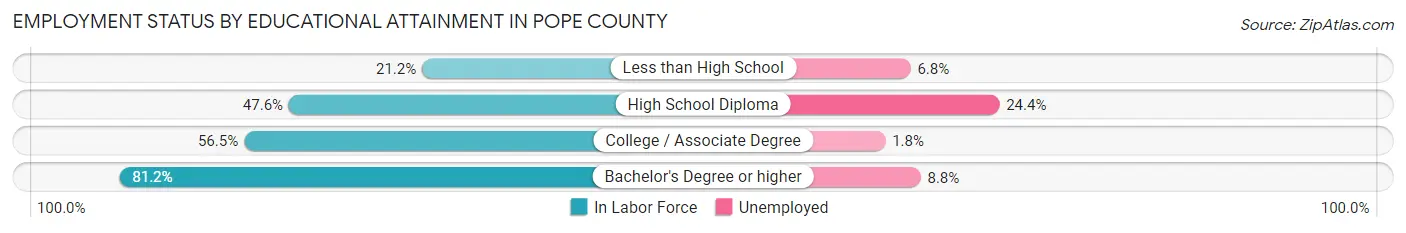
| Educational Attainment | In Labor Force | Unemployed |
| Less than High School | 44 (21.2%) | 14 (6.8%) |
| High School Diploma | 361 (47.6%) | 185 (24.4%) |
| College / Associate Degree | 384 (56.5%) | 12 (1.8%) |
| Bachelor's Degree or higher | 251 (81.2%) | 27 (8.8%) |
| Total | 1,040 (53.2%) | 225 (11.5%) |
Employment Occupations by Sex in Pope County
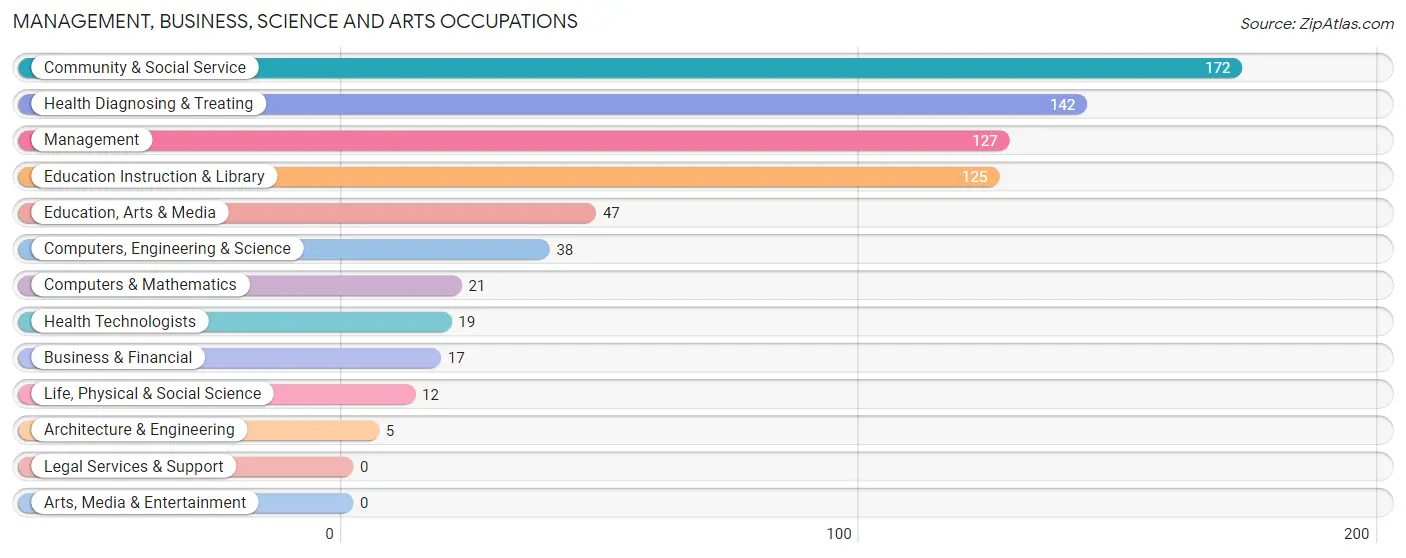
Management, Business, Science and Arts Occupations
The most common Management, Business, Science and Arts occupations in Pope County are Community & Social Service (172 | 13.4%), Health Diagnosing & Treating (142 | 11.1%), Management (127 | 9.9%), Education Instruction & Library (125 | 9.7%), and Education, Arts & Media (47 | 3.7%).
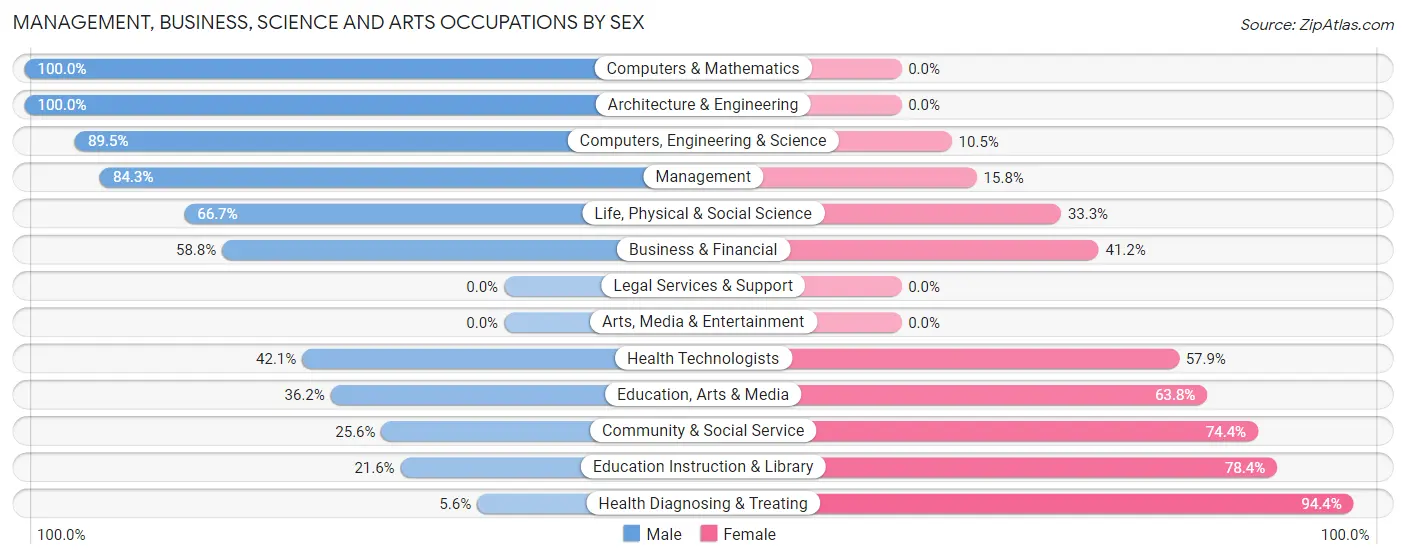
Management, Business, Science and Arts Occupations by Sex
Within the Management, Business, Science and Arts occupations in Pope County, the most male-oriented occupations are Computers & Mathematics (100.0%), Architecture & Engineering (100.0%), and Computers, Engineering & Science (89.5%), while the most female-oriented occupations are Health Diagnosing & Treating (94.4%), Education Instruction & Library (78.4%), and Community & Social Service (74.4%).
| Occupation | Male | Female |
| Management | 107 (84.3%) | 20 (15.8%) |
| Business & Financial | 10 (58.8%) | 7 (41.2%) |
| Computers, Engineering & Science | 34 (89.5%) | 4 (10.5%) |
| Computers & Mathematics | 21 (100.0%) | 0 (0.0%) |
| Architecture & Engineering | 5 (100.0%) | 0 (0.0%) |
| Life, Physical & Social Science | 8 (66.7%) | 4 (33.3%) |
| Community & Social Service | 44 (25.6%) | 128 (74.4%) |
| Education, Arts & Media | 17 (36.2%) | 30 (63.8%) |
| Legal Services & Support | 0 (0.0%) | 0 (0.0%) |
| Education Instruction & Library | 27 (21.6%) | 98 (78.4%) |
| Arts, Media & Entertainment | 0 (0.0%) | 0 (0.0%) |
| Health Diagnosing & Treating | 8 (5.6%) | 134 (94.4%) |
| Health Technologists | 8 (42.1%) | 11 (57.9%) |
| Total (Category) | 203 (40.9%) | 293 (59.1%) |
| Total (Overall) | 597 (46.5%) | 687 (53.5%) |
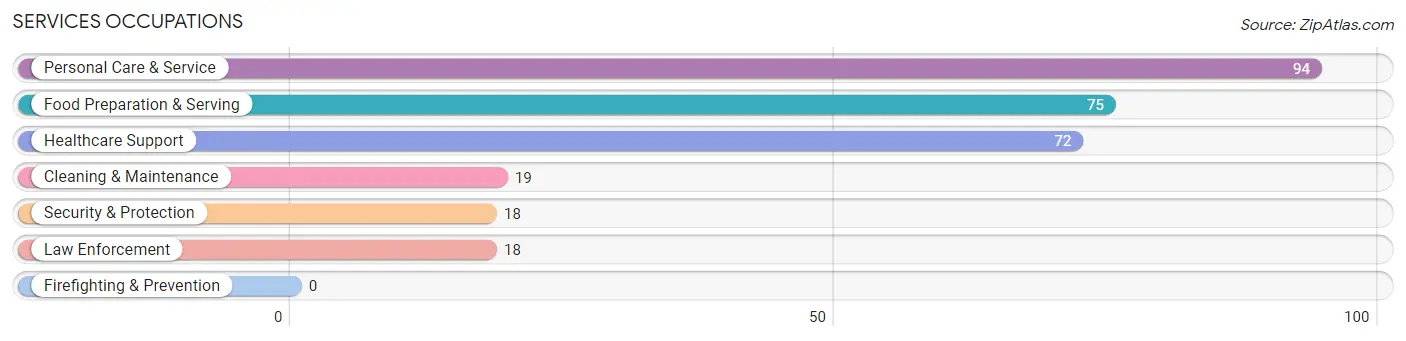
Services Occupations
The most common Services occupations in Pope County are Personal Care & Service (94 | 7.3%), Food Preparation & Serving (75 | 5.8%), Healthcare Support (72 | 5.6%), Cleaning & Maintenance (19 | 1.5%), and Security & Protection (18 | 1.4%).
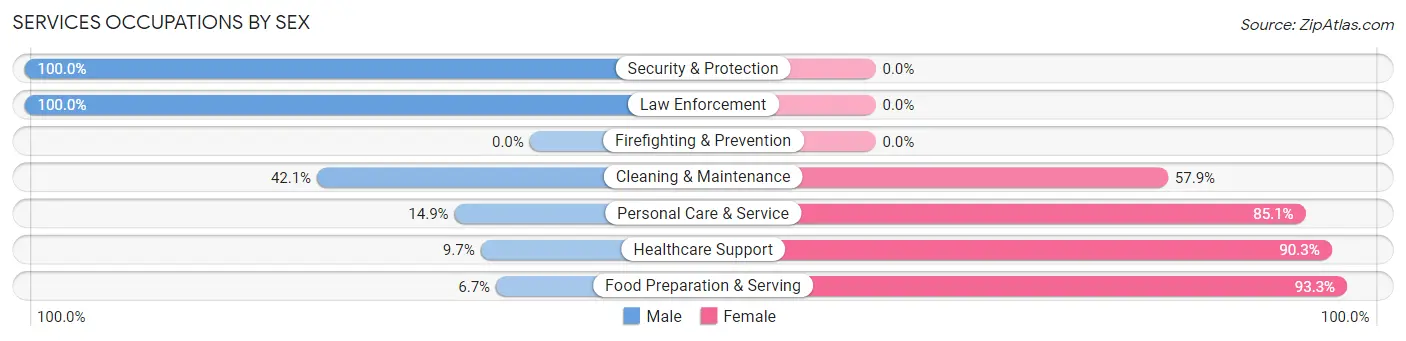
Services Occupations by Sex
Within the Services occupations in Pope County, the most male-oriented occupations are Security & Protection (100.0%), Law Enforcement (100.0%), and Cleaning & Maintenance (42.1%), while the most female-oriented occupations are Food Preparation & Serving (93.3%), Healthcare Support (90.3%), and Personal Care & Service (85.1%).
| Occupation | Male | Female |
| Healthcare Support | 7 (9.7%) | 65 (90.3%) |
| Security & Protection | 18 (100.0%) | 0 (0.0%) |
| Firefighting & Prevention | 0 (0.0%) | 0 (0.0%) |
| Law Enforcement | 18 (100.0%) | 0 (0.0%) |
| Food Preparation & Serving | 5 (6.7%) | 70 (93.3%) |
| Cleaning & Maintenance | 8 (42.1%) | 11 (57.9%) |
| Personal Care & Service | 14 (14.9%) | 80 (85.1%) |
| Total (Category) | 52 (18.7%) | 226 (81.3%) |
| Total (Overall) | 597 (46.5%) | 687 (53.5%) |
Sales and Office Occupations
The most common Sales and Office occupations in Pope County are Sales & Related (104 | 8.1%), and Office & Administration (67 | 5.2%).
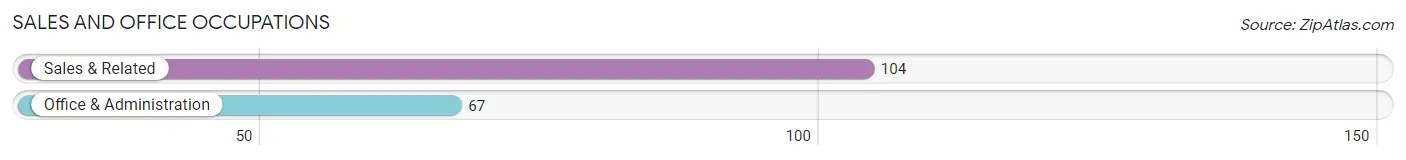
Sales and Office Occupations by Sex

| Occupation | Male | Female |
| Sales & Related | 19 (18.3%) | 85 (81.7%) |
| Office & Administration | 30 (44.8%) | 37 (55.2%) |
| Total (Category) | 49 (28.6%) | 122 (71.4%) |
| Total (Overall) | 597 (46.5%) | 687 (53.5%) |
Natural Resources, Construction and Maintenance Occupations
The most common Natural Resources, Construction and Maintenance occupations in Pope County are Construction & Extraction (93 | 7.2%), and Installation, Maintenance & Repair (36 | 2.8%).
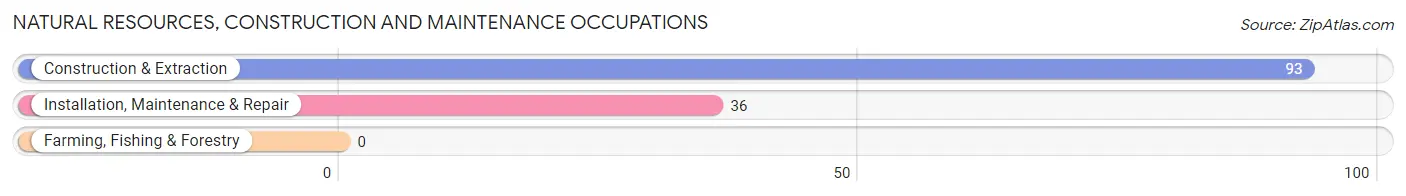
Natural Resources, Construction and Maintenance Occupations by Sex
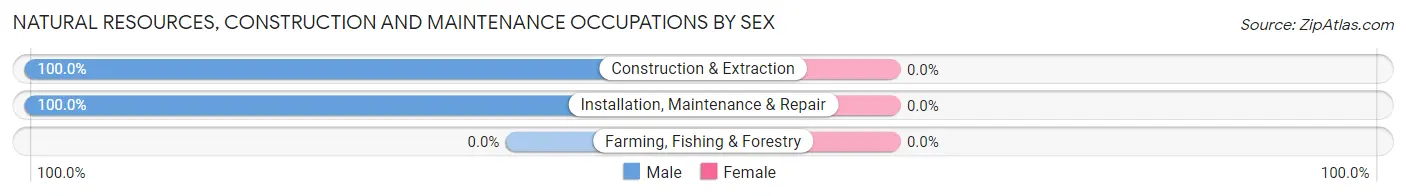
| Occupation | Male | Female |
| Farming, Fishing & Forestry | 0 (0.0%) | 0 (0.0%) |
| Construction & Extraction | 93 (100.0%) | 0 (0.0%) |
| Installation, Maintenance & Repair | 36 (100.0%) | 0 (0.0%) |
| Total (Category) | 129 (100.0%) | 0 (0.0%) |
| Total (Overall) | 597 (46.5%) | 687 (53.5%) |
Production, Transportation and Moving Occupations
The most common Production, Transportation and Moving occupations in Pope County are Transportation (86 | 6.7%), Production (62 | 4.8%), and Material Moving (62 | 4.8%).
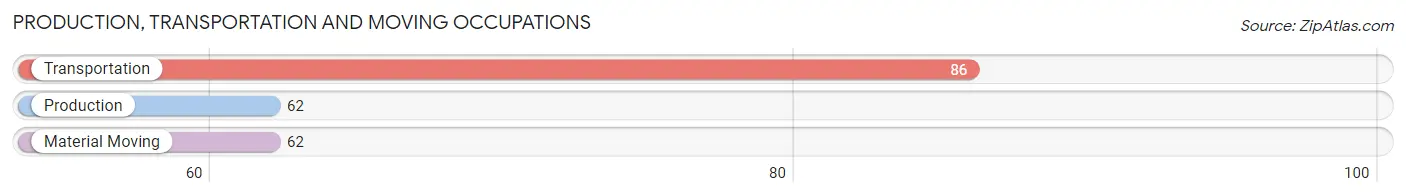
Production, Transportation and Moving Occupations by Sex
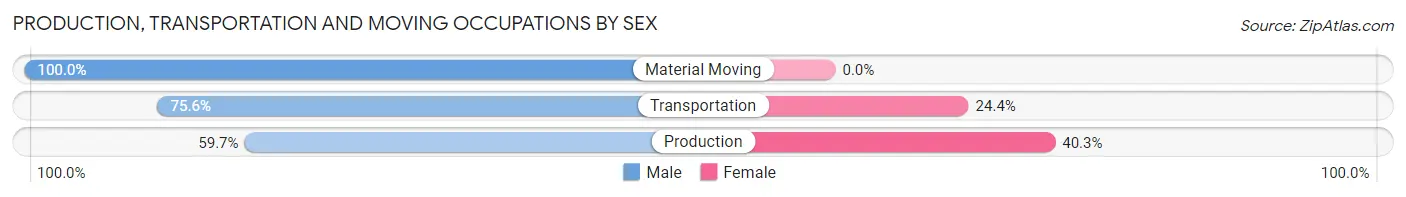
| Occupation | Male | Female |
| Production | 37 (59.7%) | 25 (40.3%) |
| Transportation | 65 (75.6%) | 21 (24.4%) |
| Material Moving | 62 (100.0%) | 0 (0.0%) |
| Total (Category) | 164 (78.1%) | 46 (21.9%) |
| Total (Overall) | 597 (46.5%) | 687 (53.5%) |
Employment Industries by Sex in Pope County
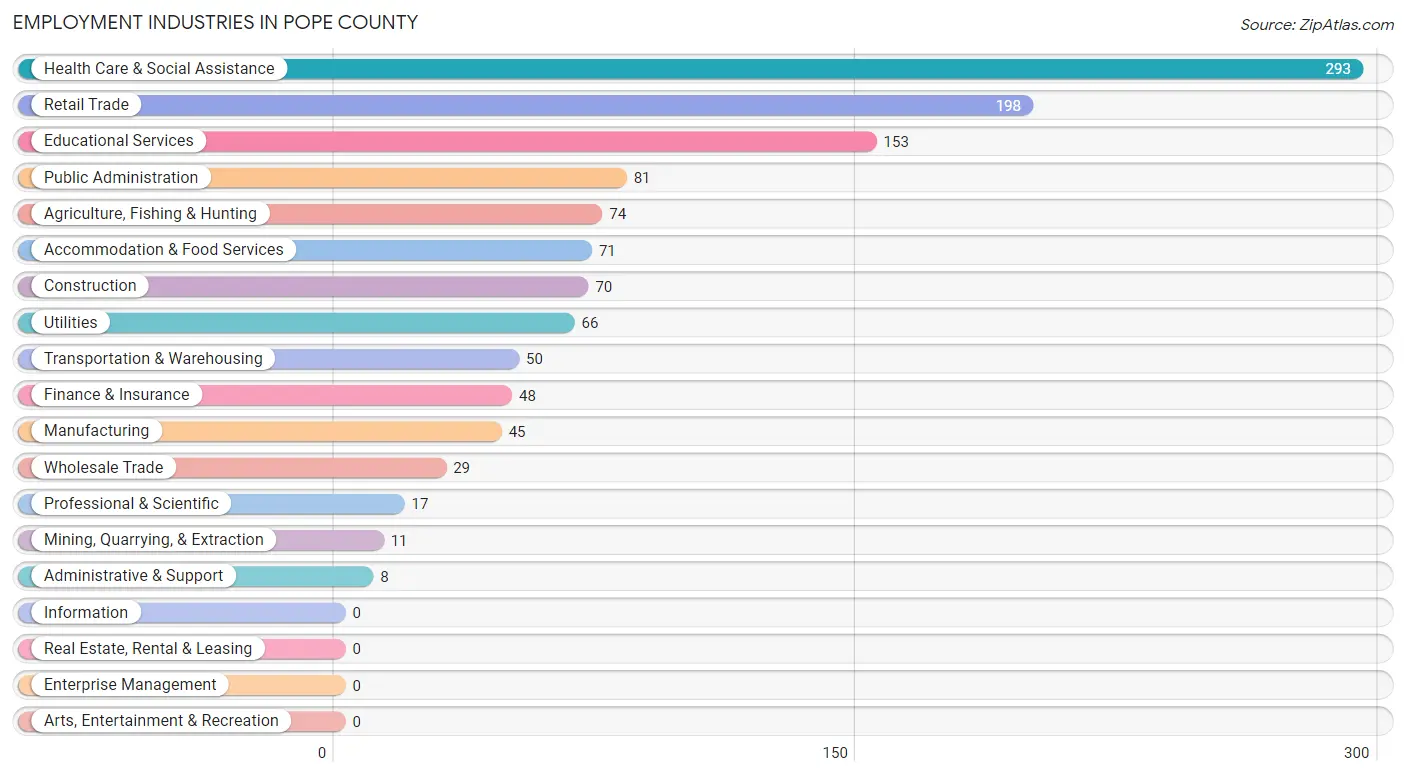
Employment Industries in Pope County
The major employment industries in Pope County include Health Care & Social Assistance (293 | 22.8%), Retail Trade (198 | 15.4%), Educational Services (153 | 11.9%), Public Administration (81 | 6.3%), and Agriculture, Fishing & Hunting (74 | 5.8%).
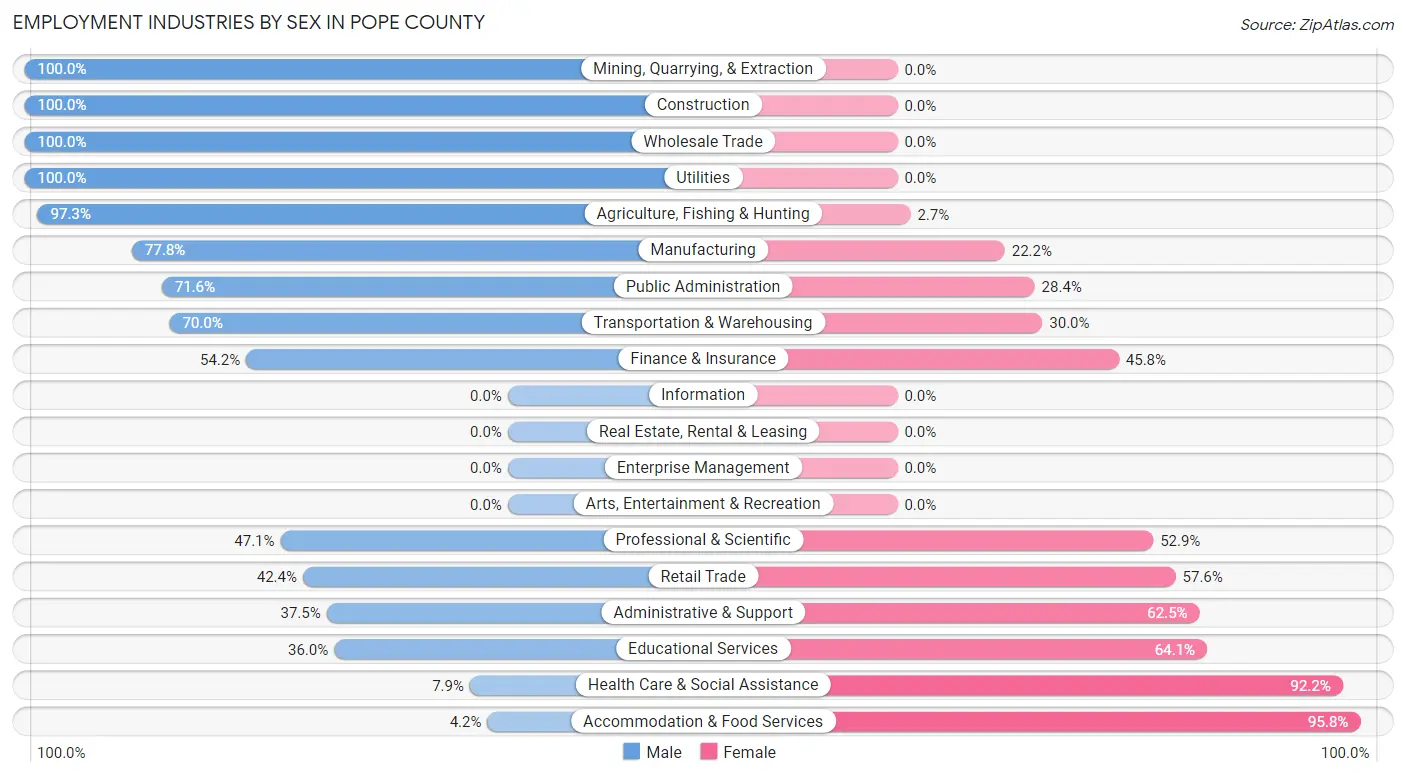
Employment Industries by Sex in Pope County
The Pope County industries that see more men than women are Mining, Quarrying, & Extraction (100.0%), Construction (100.0%), and Wholesale Trade (100.0%), whereas the industries that tend to have a higher number of women are Accommodation & Food Services (95.8%), Health Care & Social Assistance (92.1%), and Educational Services (64.0%).
| Industry | Male | Female |
| Agriculture, Fishing & Hunting | 72 (97.3%) | 2 (2.7%) |
| Mining, Quarrying, & Extraction | 11 (100.0%) | 0 (0.0%) |
| Construction | 70 (100.0%) | 0 (0.0%) |
| Manufacturing | 35 (77.8%) | 10 (22.2%) |
| Wholesale Trade | 29 (100.0%) | 0 (0.0%) |
| Retail Trade | 84 (42.4%) | 114 (57.6%) |
| Transportation & Warehousing | 35 (70.0%) | 15 (30.0%) |
| Utilities | 66 (100.0%) | 0 (0.0%) |
| Information | 0 (0.0%) | 0 (0.0%) |
| Finance & Insurance | 26 (54.2%) | 22 (45.8%) |
| Real Estate, Rental & Leasing | 0 (0.0%) | 0 (0.0%) |
| Professional & Scientific | 8 (47.1%) | 9 (52.9%) |
| Enterprise Management | 0 (0.0%) | 0 (0.0%) |
| Administrative & Support | 3 (37.5%) | 5 (62.5%) |
| Educational Services | 55 (35.9%) | 98 (64.0%) |
| Health Care & Social Assistance | 23 (7.9%) | 270 (92.1%) |
| Arts, Entertainment & Recreation | 0 (0.0%) | 0 (0.0%) |
| Accommodation & Food Services | 3 (4.2%) | 68 (95.8%) |
| Public Administration | 58 (71.6%) | 23 (28.4%) |
| Total | 597 (46.5%) | 687 (53.5%) |
Education in Pope County
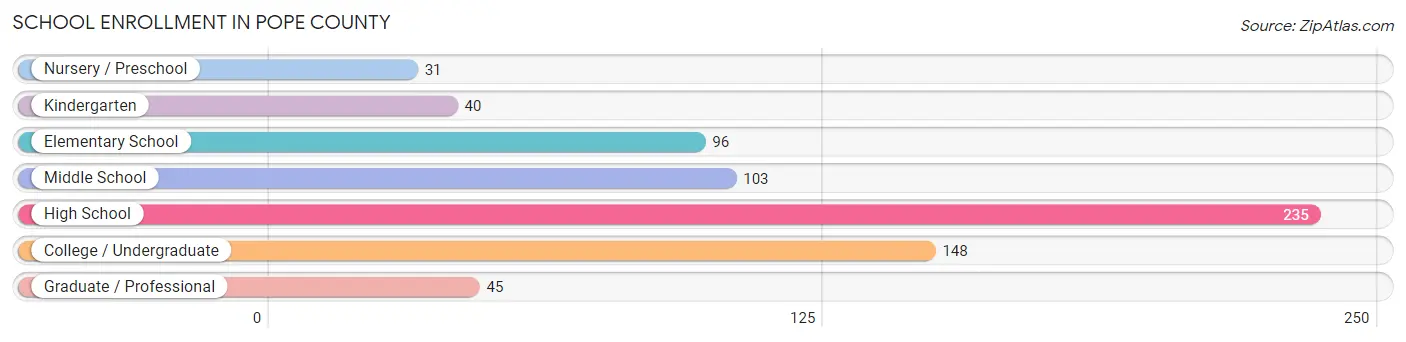
School Enrollment in Pope County
The most common levels of schooling among the 698 students in Pope County are high school (235 | 33.7%), college / undergraduate (148 | 21.2%), and middle school (103 | 14.8%).
| School Level | # Students | % Students |
| Nursery / Preschool | 31 | 4.4% |
| Kindergarten | 40 | 5.7% |
| Elementary School | 96 | 13.8% |
| Middle School | 103 | 14.8% |
| High School | 235 | 33.7% |
| College / Undergraduate | 148 | 21.2% |
| Graduate / Professional | 45 | 6.5% |
| Total | 698 | 100.0% |
School Enrollment by Age by Funding Source in Pope County
Out of a total of 698 students who are enrolled in schools in Pope County, 86 (12.3%) attend a private institution, while the remaining 612 (87.7%) are enrolled in public schools. The age group of 25 to 34 year olds has the highest likelihood of being enrolled in private schools, with 24 (36.4% in the age bracket) enrolled. Conversely, the age group of 18 to 19 year olds has the lowest likelihood of being enrolled in a private school, with 106 (100.0% in the age bracket) attending a public institution.
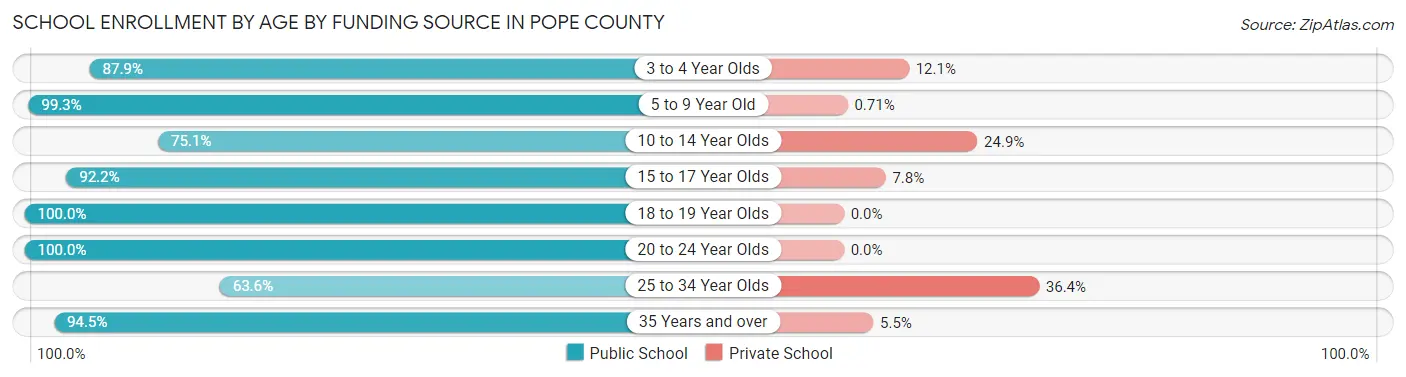
| Age Bracket | Public School | Private School |
| 3 to 4 Year Olds | 29 (87.9%) | 4 (12.1%) |
| 5 to 9 Year Old | 140 (99.3%) | 1 (0.7%) |
| 10 to 14 Year Olds | 139 (75.1%) | 46 (24.9%) |
| 15 to 17 Year Olds | 83 (92.2%) | 7 (7.8%) |
| 18 to 19 Year Olds | 106 (100.0%) | 0 (0.0%) |
| 20 to 24 Year Olds | 4 (100.0%) | 0 (0.0%) |
| 25 to 34 Year Olds | 42 (63.6%) | 24 (36.4%) |
| 35 Years and over | 69 (94.5%) | 4 (5.5%) |
| Total | 612 (87.7%) | 86 (12.3%) |
Educational Attainment by Field of Study in Pope County
Education (105 | 22.2%), bio, nature & agricultural (90 | 19.0%), business (80 | 16.9%), arts & humanities (69 | 14.6%), and science & technology (39 | 8.2%) are the most common fields of study among 474 individuals in Pope County who have obtained a bachelor's degree or higher.
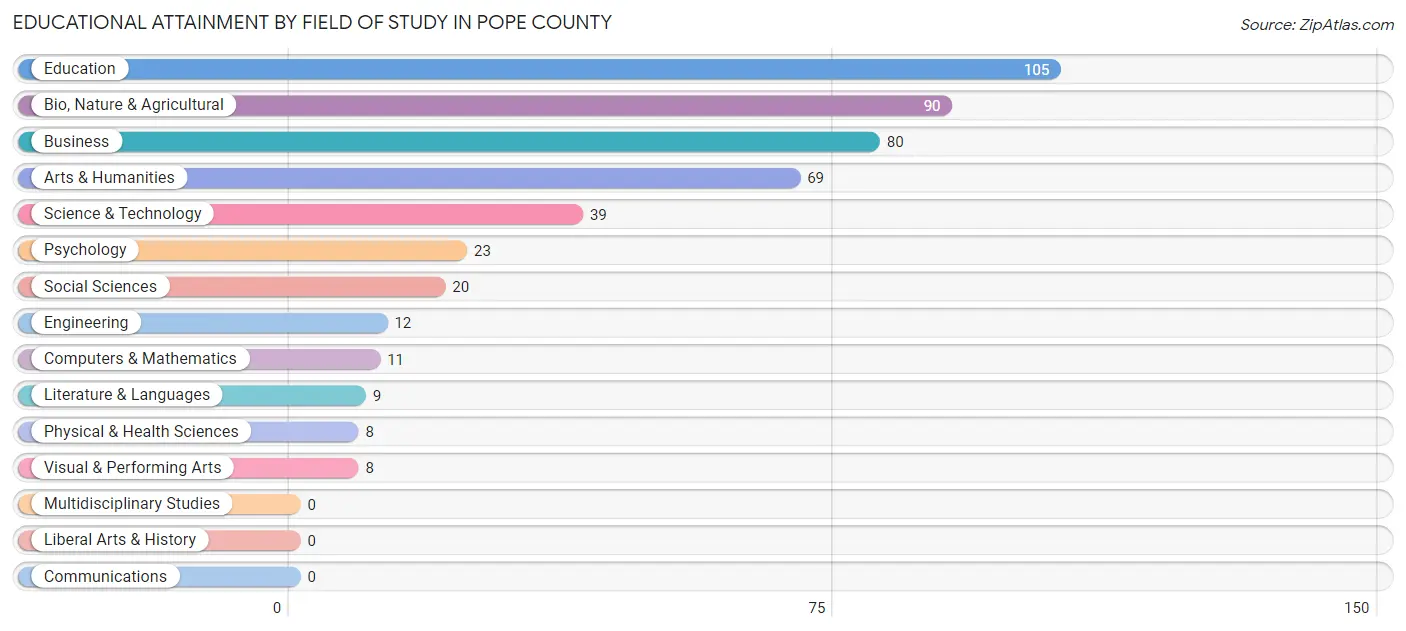
| Field of Study | # Graduates | % Graduates |
| Computers & Mathematics | 11 | 2.3% |
| Bio, Nature & Agricultural | 90 | 19.0% |
| Physical & Health Sciences | 8 | 1.7% |
| Psychology | 23 | 4.9% |
| Social Sciences | 20 | 4.2% |
| Engineering | 12 | 2.5% |
| Multidisciplinary Studies | 0 | 0.0% |
| Science & Technology | 39 | 8.2% |
| Business | 80 | 16.9% |
| Education | 105 | 22.2% |
| Literature & Languages | 9 | 1.9% |
| Liberal Arts & History | 0 | 0.0% |
| Visual & Performing Arts | 8 | 1.7% |
| Communications | 0 | 0.0% |
| Arts & Humanities | 69 | 14.6% |
| Total | 474 | 100.0% |
Transportation & Commute in Pope County
Vehicle Availability by Sex in Pope County
The most prevalent vehicle ownership categories in Pope County are males with 3 vehicles (170, accounting for 29.6%) and females with 3 vehicles (150, making up 25.0%).
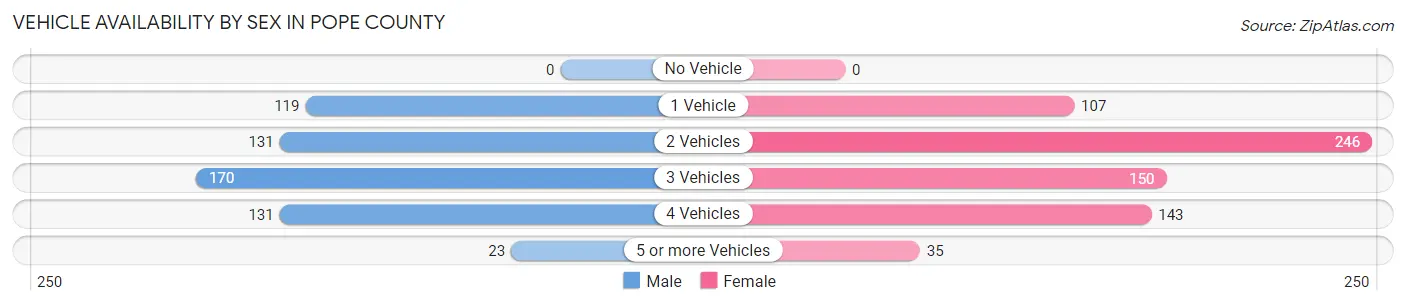
| Vehicles Available | Male | Female |
| No Vehicle | 0 (0.0%) | 0 (0.0%) |
| 1 Vehicle | 119 (20.7%) | 107 (15.7%) |
| 2 Vehicles | 131 (22.8%) | 246 (36.1%) |
| 3 Vehicles | 170 (29.6%) | 150 (22.0%) |
| 4 Vehicles | 131 (22.8%) | 143 (21.0%) |
| 5 or more Vehicles | 23 (4.0%) | 35 (5.1%) |
| Total | 574 (100.0%) | 681 (100.0%) |
Commute Time in Pope County
The most frequently occuring commute durations in Pope County are 30 to 34 minutes (255 commuters, 21.9%), 60 to 89 minutes (147 commuters, 12.6%), and 10 to 14 minutes (138 commuters, 11.9%).
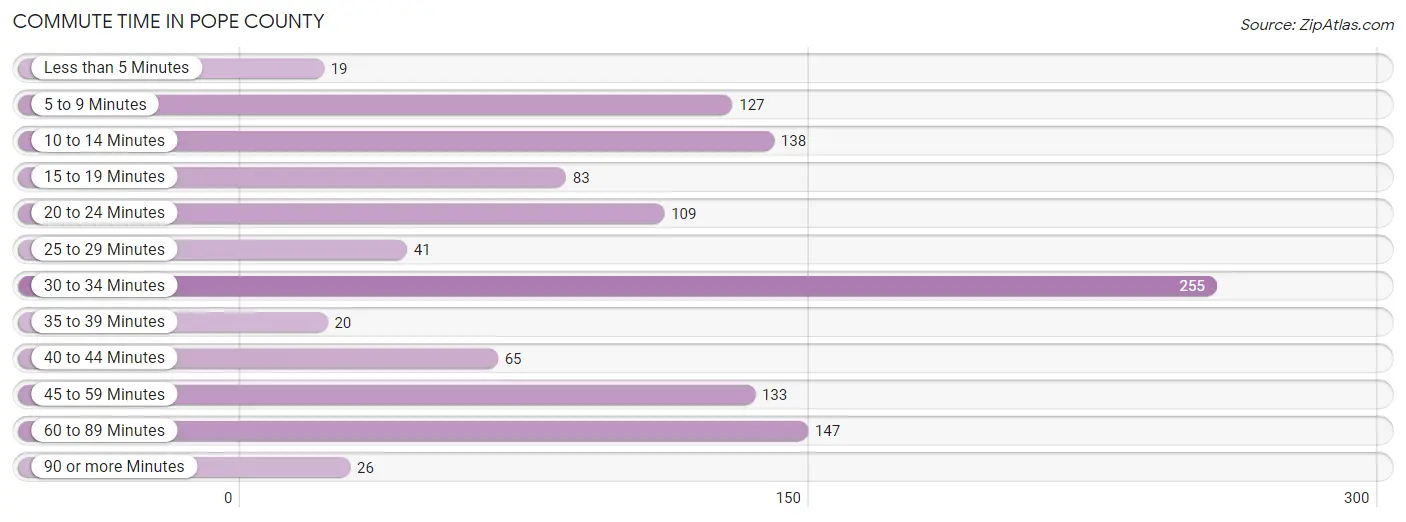
| Commute Time | # Commuters | % Commuters |
| Less than 5 Minutes | 19 | 1.6% |
| 5 to 9 Minutes | 127 | 10.9% |
| 10 to 14 Minutes | 138 | 11.9% |
| 15 to 19 Minutes | 83 | 7.1% |
| 20 to 24 Minutes | 109 | 9.4% |
| 25 to 29 Minutes | 41 | 3.5% |
| 30 to 34 Minutes | 255 | 21.9% |
| 35 to 39 Minutes | 20 | 1.7% |
| 40 to 44 Minutes | 65 | 5.6% |
| 45 to 59 Minutes | 133 | 11.4% |
| 60 to 89 Minutes | 147 | 12.6% |
| 90 or more Minutes | 26 | 2.2% |
Commute Time by Sex in Pope County
The most common commute times in Pope County are 60 to 89 minutes (125 commuters, 24.6%) for males and 30 to 34 minutes (199 commuters, 30.3%) for females.
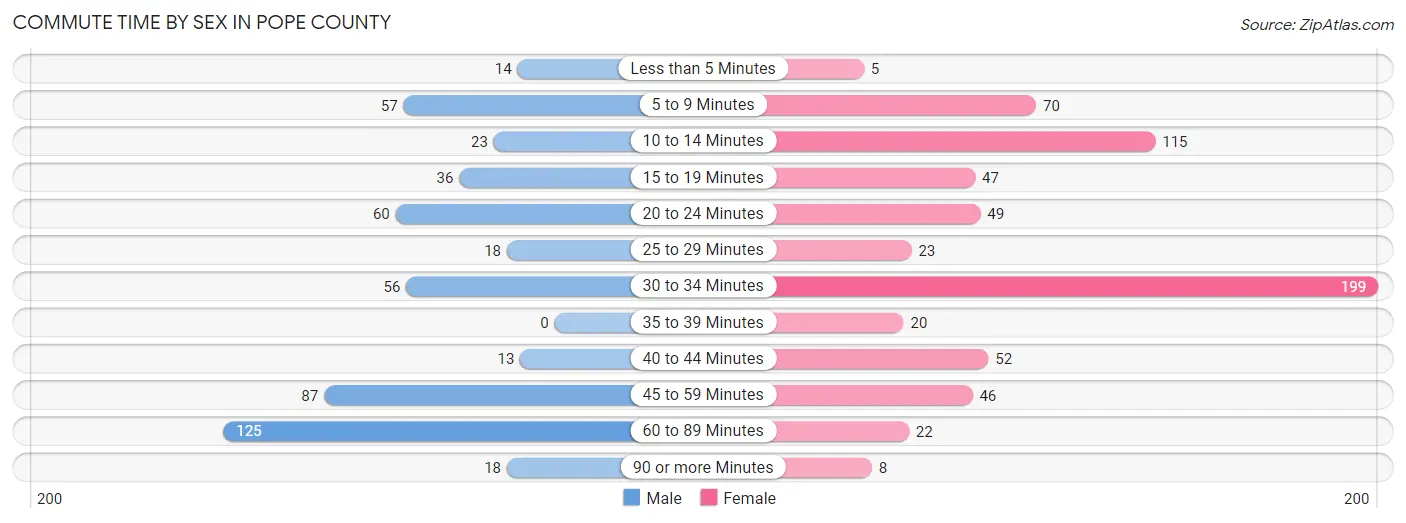
| Commute Time | Male | Female |
| Less than 5 Minutes | 14 (2.8%) | 5 (0.8%) |
| 5 to 9 Minutes | 57 (11.2%) | 70 (10.7%) |
| 10 to 14 Minutes | 23 (4.5%) | 115 (17.5%) |
| 15 to 19 Minutes | 36 (7.1%) | 47 (7.2%) |
| 20 to 24 Minutes | 60 (11.8%) | 49 (7.5%) |
| 25 to 29 Minutes | 18 (3.5%) | 23 (3.5%) |
| 30 to 34 Minutes | 56 (11.1%) | 199 (30.3%) |
| 35 to 39 Minutes | 0 (0.0%) | 20 (3.0%) |
| 40 to 44 Minutes | 13 (2.6%) | 52 (7.9%) |
| 45 to 59 Minutes | 87 (17.2%) | 46 (7.0%) |
| 60 to 89 Minutes | 125 (24.6%) | 22 (3.4%) |
| 90 or more Minutes | 18 (3.5%) | 8 (1.2%) |
Time of Departure to Work by Sex in Pope County
The most frequent times of departure to work in Pope County are 8:00 AM to 8:29 AM (121, 23.9%) for males and 7:00 AM to 7:29 AM (157, 23.9%) for females.
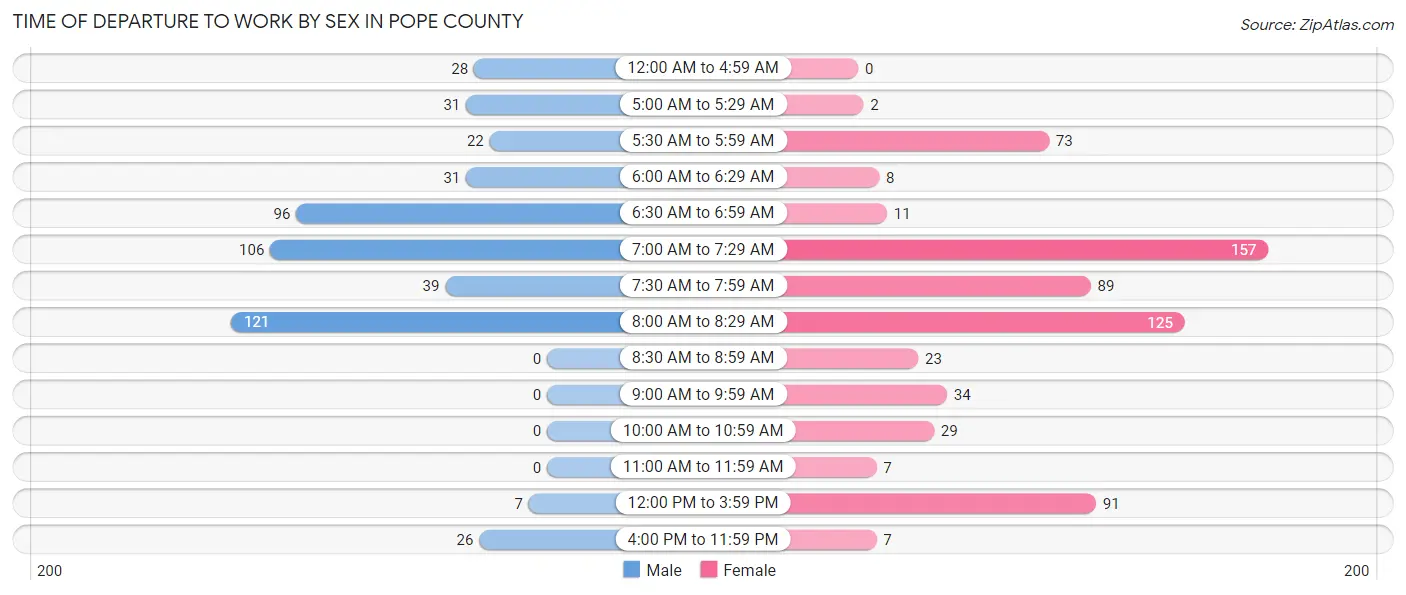
| Time of Departure | Male | Female |
| 12:00 AM to 4:59 AM | 28 (5.5%) | 0 (0.0%) |
| 5:00 AM to 5:29 AM | 31 (6.1%) | 2 (0.3%) |
| 5:30 AM to 5:59 AM | 22 (4.3%) | 73 (11.1%) |
| 6:00 AM to 6:29 AM | 31 (6.1%) | 8 (1.2%) |
| 6:30 AM to 6:59 AM | 96 (18.9%) | 11 (1.7%) |
| 7:00 AM to 7:29 AM | 106 (20.9%) | 157 (23.9%) |
| 7:30 AM to 7:59 AM | 39 (7.7%) | 89 (13.6%) |
| 8:00 AM to 8:29 AM | 121 (23.9%) | 125 (19.1%) |
| 8:30 AM to 8:59 AM | 0 (0.0%) | 23 (3.5%) |
| 9:00 AM to 9:59 AM | 0 (0.0%) | 34 (5.2%) |
| 10:00 AM to 10:59 AM | 0 (0.0%) | 29 (4.4%) |
| 11:00 AM to 11:59 AM | 0 (0.0%) | 7 (1.1%) |
| 12:00 PM to 3:59 PM | 7 (1.4%) | 91 (13.9%) |
| 4:00 PM to 11:59 PM | 26 (5.1%) | 7 (1.1%) |
| Total | 507 (100.0%) | 656 (100.0%) |
Housing Occupancy in Pope County
Occupancy by Ownership in Pope County
Of the total 1,349 dwellings in Pope County, owner-occupied units account for 1,115 (82.7%), while renter-occupied units make up 234 (17.3%).
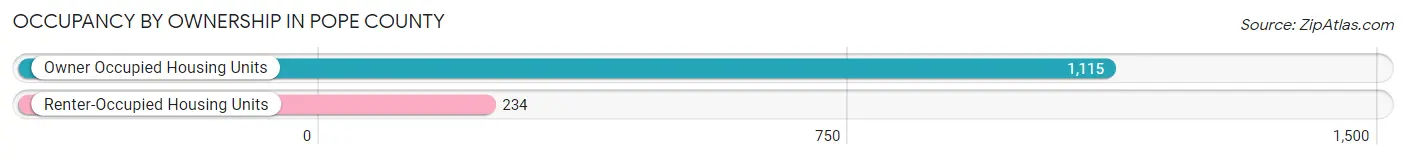
| Occupancy | # Housing Units | % Housing Units |
| Owner Occupied Housing Units | 1,115 | 82.7% |
| Renter-Occupied Housing Units | 234 | 17.3% |
| Total Occupied Housing Units | 1,349 | 100.0% |
Occupancy by Household Size in Pope County
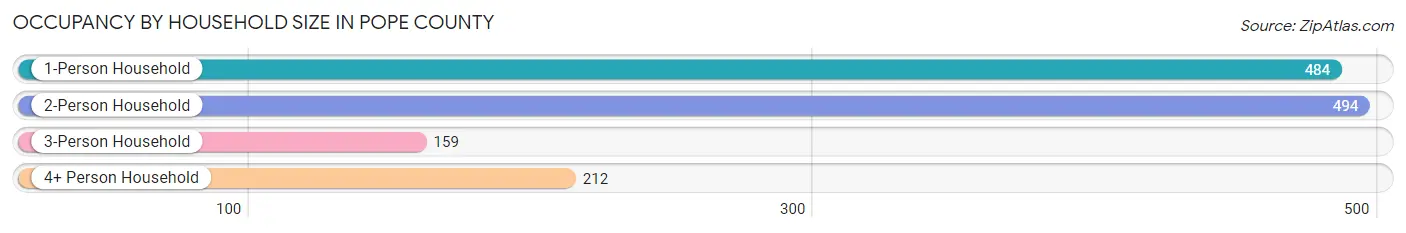
| Household Size | # Housing Units | % Housing Units |
| 1-Person Household | 484 | 35.9% |
| 2-Person Household | 494 | 36.6% |
| 3-Person Household | 159 | 11.8% |
| 4+ Person Household | 212 | 15.7% |
| Total Housing Units | 1,349 | 100.0% |
Occupancy by Ownership by Household Size in Pope County
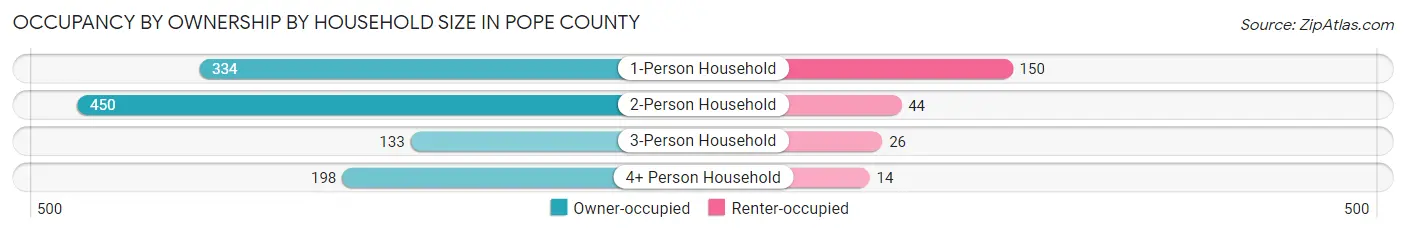
| Household Size | Owner-occupied | Renter-occupied |
| 1-Person Household | 334 (69.0%) | 150 (31.0%) |
| 2-Person Household | 450 (91.1%) | 44 (8.9%) |
| 3-Person Household | 133 (83.7%) | 26 (16.4%) |
| 4+ Person Household | 198 (93.4%) | 14 (6.6%) |
| Total Housing Units | 1,115 (82.7%) | 234 (17.3%) |
Occupancy by Educational Attainment in Pope County
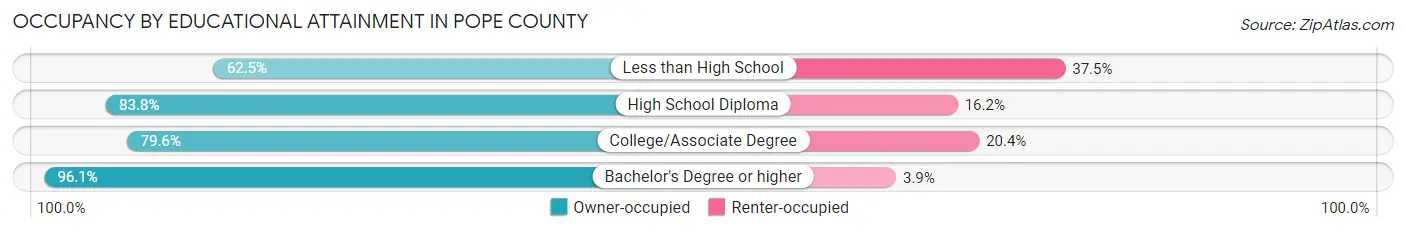
| Household Size | Owner-occupied | Renter-occupied |
| Less than High School | 85 (62.5%) | 51 (37.5%) |
| High School Diploma | 451 (83.8%) | 87 (16.2%) |
| College/Associate Degree | 335 (79.6%) | 86 (20.4%) |
| Bachelor's Degree or higher | 244 (96.1%) | 10 (3.9%) |
Occupancy by Age of Householder in Pope County
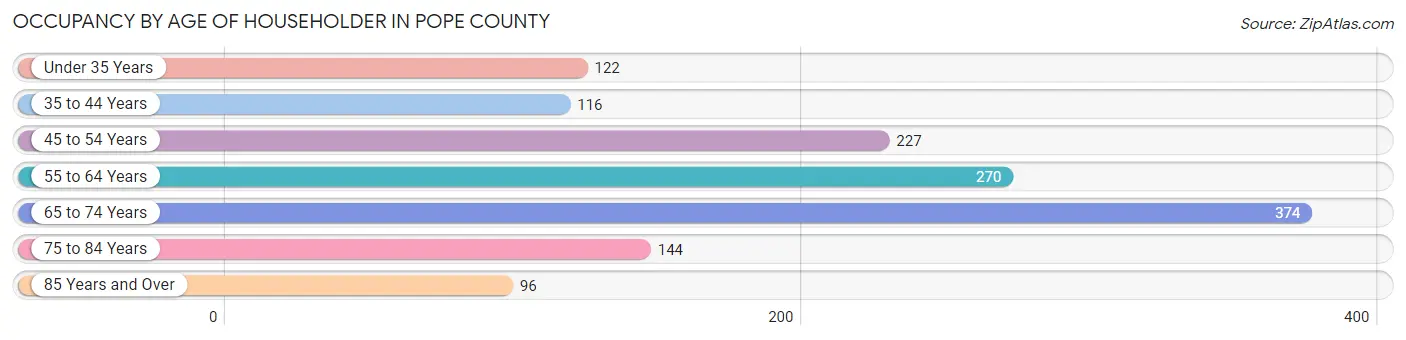
| Age Bracket | # Households | % Households |
| Under 35 Years | 122 | 9.0% |
| 35 to 44 Years | 116 | 8.6% |
| 45 to 54 Years | 227 | 16.8% |
| 55 to 64 Years | 270 | 20.0% |
| 65 to 74 Years | 374 | 27.7% |
| 75 to 84 Years | 144 | 10.7% |
| 85 Years and Over | 96 | 7.1% |
| Total | 1,349 | 100.0% |
Housing Finances in Pope County
Median Income by Occupancy in Pope County
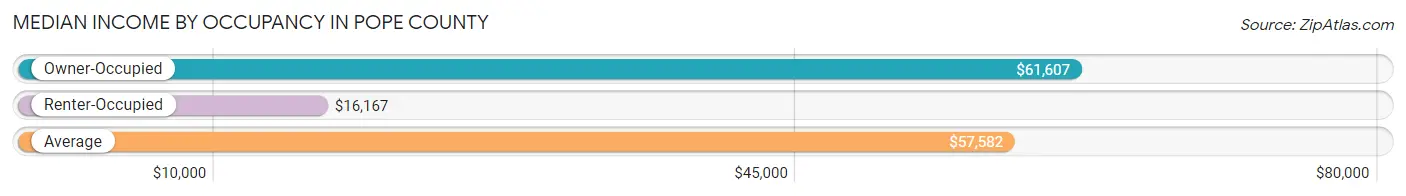
| Occupancy Type | # Households | Median Income |
| Owner-Occupied | 1,115 (82.7%) | $61,607 |
| Renter-Occupied | 234 (17.3%) | $16,167 |
| Average | 1,349 (100.0%) | $57,582 |
Occupancy by Householder Income Bracket in Pope County
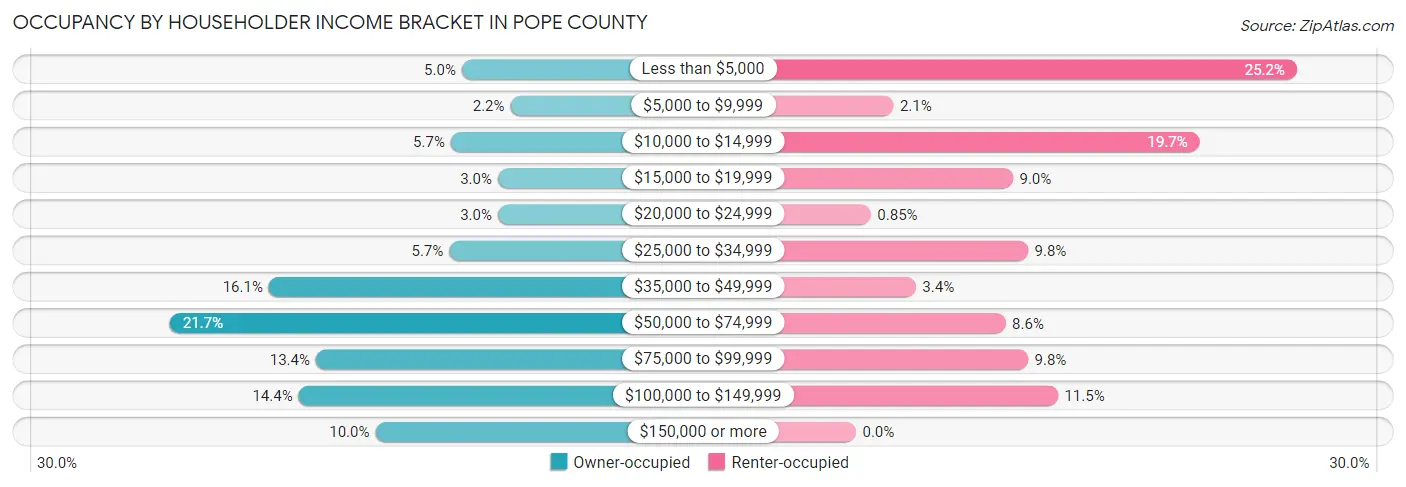
| Income Bracket | Owner-occupied | Renter-occupied |
| Less than $5,000 | 56 (5.0%) | 59 (25.2%) |
| $5,000 to $9,999 | 25 (2.2%) | 5 (2.1%) |
| $10,000 to $14,999 | 63 (5.7%) | 46 (19.7%) |
| $15,000 to $19,999 | 33 (3.0%) | 21 (9.0%) |
| $20,000 to $24,999 | 33 (3.0%) | 2 (0.9%) |
| $25,000 to $34,999 | 64 (5.7%) | 23 (9.8%) |
| $35,000 to $49,999 | 179 (16.1%) | 8 (3.4%) |
| $50,000 to $74,999 | 242 (21.7%) | 20 (8.6%) |
| $75,000 to $99,999 | 149 (13.4%) | 23 (9.8%) |
| $100,000 to $149,999 | 160 (14.3%) | 27 (11.5%) |
| $150,000 or more | 111 (10.0%) | 0 (0.0%) |
| Total | 1,115 (100.0%) | 234 (100.0%) |
Monthly Housing Cost Tiers in Pope County
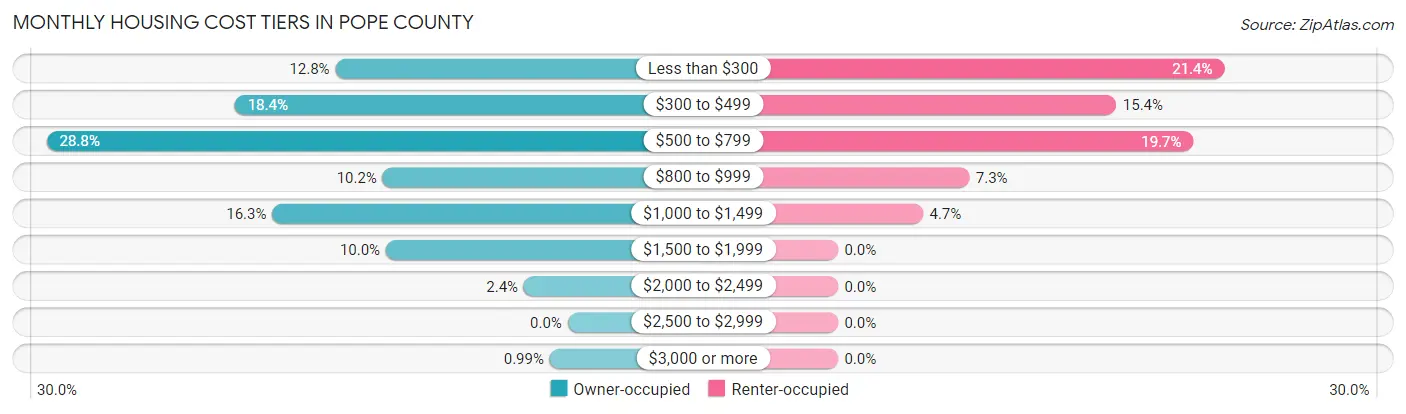
| Monthly Cost | Owner-occupied | Renter-occupied |
| Less than $300 | 143 (12.8%) | 50 (21.4%) |
| $300 to $499 | 205 (18.4%) | 36 (15.4%) |
| $500 to $799 | 321 (28.8%) | 46 (19.7%) |
| $800 to $999 | 114 (10.2%) | 17 (7.3%) |
| $1,000 to $1,499 | 182 (16.3%) | 11 (4.7%) |
| $1,500 to $1,999 | 112 (10.0%) | 0 (0.0%) |
| $2,000 to $2,499 | 27 (2.4%) | 0 (0.0%) |
| $2,500 to $2,999 | 0 (0.0%) | 0 (0.0%) |
| $3,000 or more | 11 (1.0%) | 0 (0.0%) |
| Total | 1,115 (100.0%) | 234 (100.0%) |
Physical Housing Characteristics in Pope County
Housing Structures in Pope County
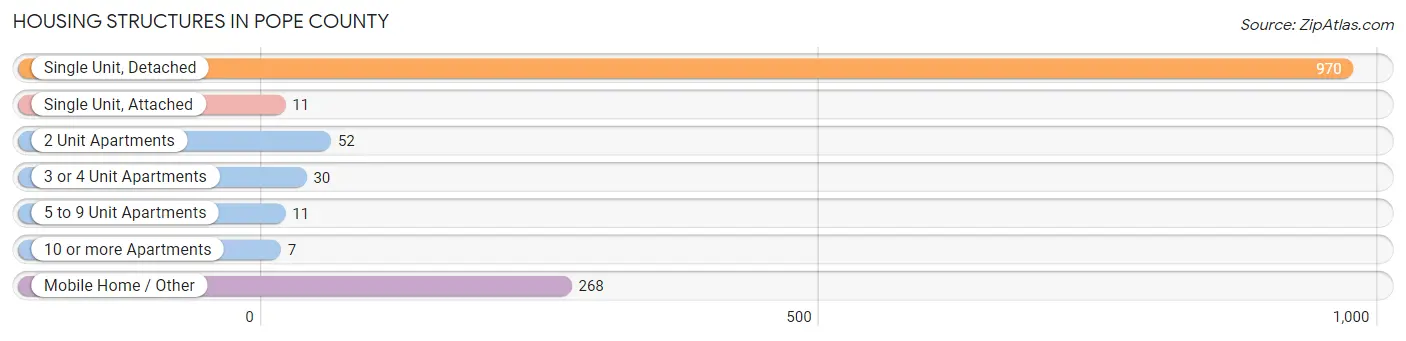
| Structure Type | # Housing Units | % Housing Units |
| Single Unit, Detached | 970 | 71.9% |
| Single Unit, Attached | 11 | 0.8% |
| 2 Unit Apartments | 52 | 3.8% |
| 3 or 4 Unit Apartments | 30 | 2.2% |
| 5 to 9 Unit Apartments | 11 | 0.8% |
| 10 or more Apartments | 7 | 0.5% |
| Mobile Home / Other | 268 | 19.9% |
| Total | 1,349 | 100.0% |
Housing Structures by Occupancy in Pope County
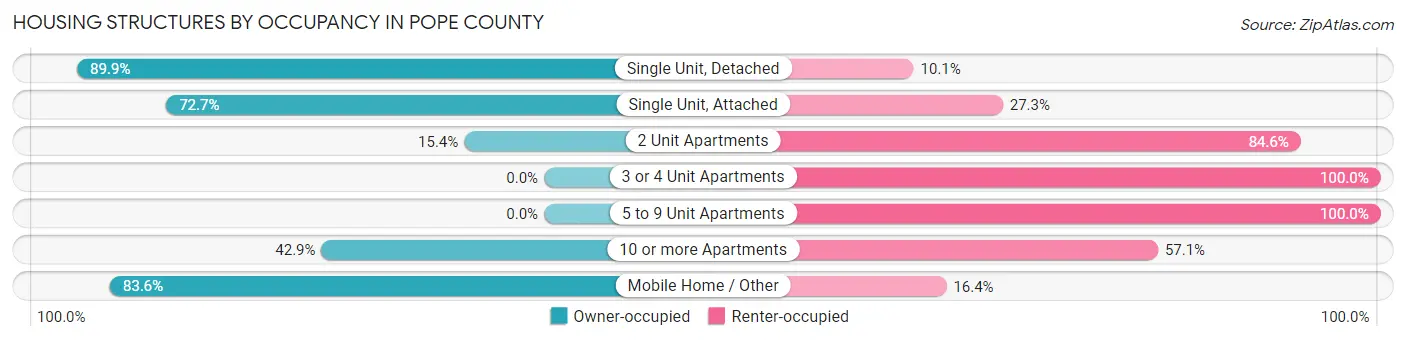
| Structure Type | Owner-occupied | Renter-occupied |
| Single Unit, Detached | 872 (89.9%) | 98 (10.1%) |
| Single Unit, Attached | 8 (72.7%) | 3 (27.3%) |
| 2 Unit Apartments | 8 (15.4%) | 44 (84.6%) |
| 3 or 4 Unit Apartments | 0 (0.0%) | 30 (100.0%) |
| 5 to 9 Unit Apartments | 0 (0.0%) | 11 (100.0%) |
| 10 or more Apartments | 3 (42.9%) | 4 (57.1%) |
| Mobile Home / Other | 224 (83.6%) | 44 (16.4%) |
| Total | 1,115 (82.7%) | 234 (17.3%) |
Housing Structures by Number of Rooms in Pope County
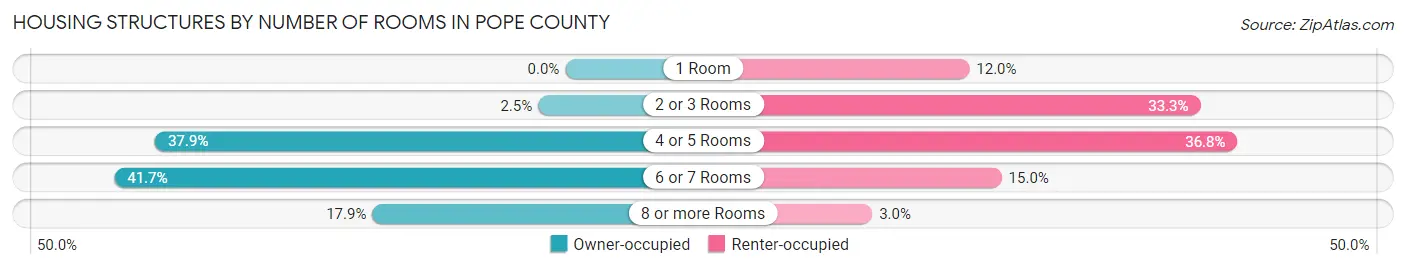
| Number of Rooms | Owner-occupied | Renter-occupied |
| 1 Room | 0 (0.0%) | 28 (12.0%) |
| 2 or 3 Rooms | 28 (2.5%) | 78 (33.3%) |
| 4 or 5 Rooms | 423 (37.9%) | 86 (36.7%) |
| 6 or 7 Rooms | 465 (41.7%) | 35 (15.0%) |
| 8 or more Rooms | 199 (17.8%) | 7 (3.0%) |
| Total | 1,115 (100.0%) | 234 (100.0%) |
Housing Structure by Heating Type in Pope County
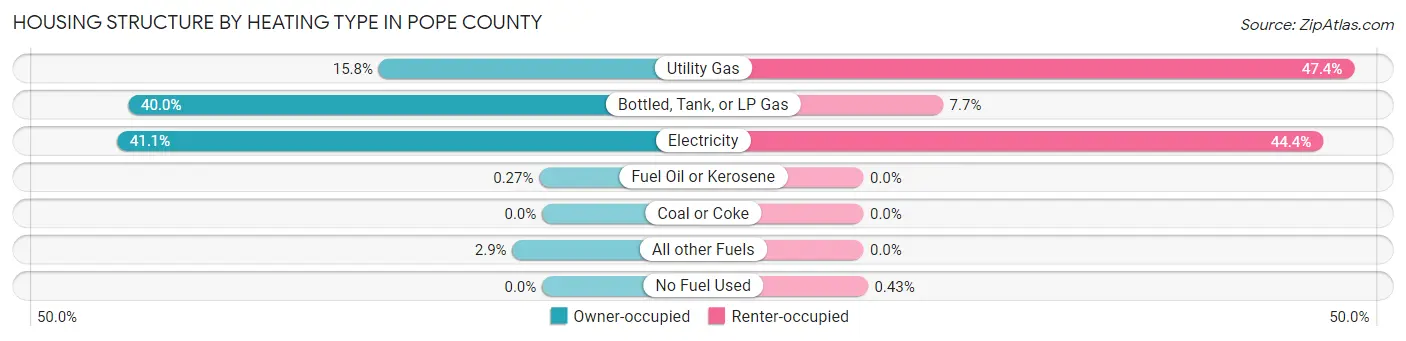
| Heating Type | Owner-occupied | Renter-occupied |
| Utility Gas | 176 (15.8%) | 111 (47.4%) |
| Bottled, Tank, or LP Gas | 446 (40.0%) | 18 (7.7%) |
| Electricity | 458 (41.1%) | 104 (44.4%) |
| Fuel Oil or Kerosene | 3 (0.3%) | 0 (0.0%) |
| Coal or Coke | 0 (0.0%) | 0 (0.0%) |
| All other Fuels | 32 (2.9%) | 0 (0.0%) |
| No Fuel Used | 0 (0.0%) | 1 (0.4%) |
| Total | 1,115 (100.0%) | 234 (100.0%) |
Household Vehicle Usage in Pope County
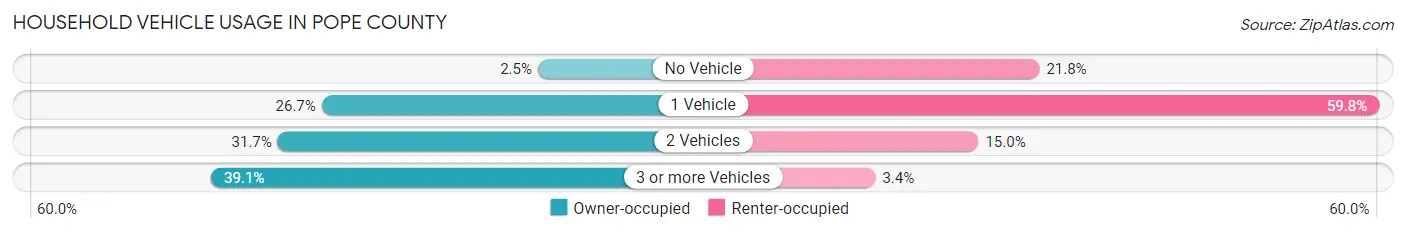
| Vehicles per Household | Owner-occupied | Renter-occupied |
| No Vehicle | 28 (2.5%) | 51 (21.8%) |
| 1 Vehicle | 298 (26.7%) | 140 (59.8%) |
| 2 Vehicles | 353 (31.7%) | 35 (15.0%) |
| 3 or more Vehicles | 436 (39.1%) | 8 (3.4%) |
| Total | 1,115 (100.0%) | 234 (100.0%) |
Real Estate & Mortgages in Pope County
Real Estate and Mortgage Overview in Pope County
| Characteristic | Without Mortgage | With Mortgage |
| Housing Units | 717 | 398 |
| Median Property Value | $116,000 | $164,200 |
| Median Household Income | $51,780 | $55 |
| Monthly Housing Costs | $508 | $11 |
| Real Estate Taxes | $1,942 | $14 |
Property Value by Mortgage Status in Pope County
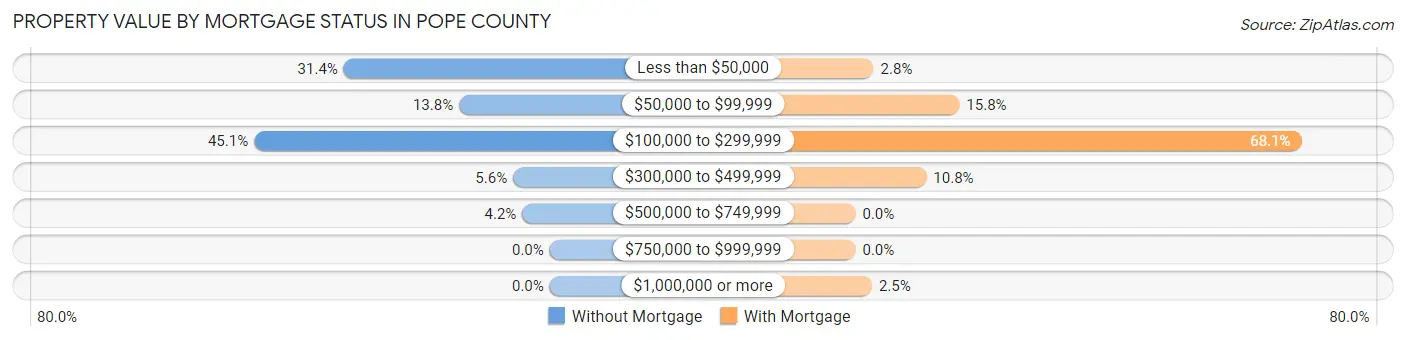
| Property Value | Without Mortgage | With Mortgage |
| Less than $50,000 | 225 (31.4%) | 11 (2.8%) |
| $50,000 to $99,999 | 99 (13.8%) | 63 (15.8%) |
| $100,000 to $299,999 | 323 (45.1%) | 271 (68.1%) |
| $300,000 to $499,999 | 40 (5.6%) | 43 (10.8%) |
| $500,000 to $749,999 | 30 (4.2%) | 0 (0.0%) |
| $750,000 to $999,999 | 0 (0.0%) | 0 (0.0%) |
| $1,000,000 or more | 0 (0.0%) | 10 (2.5%) |
| Total | 717 (100.0%) | 398 (100.0%) |
Household Income by Mortgage Status in Pope County
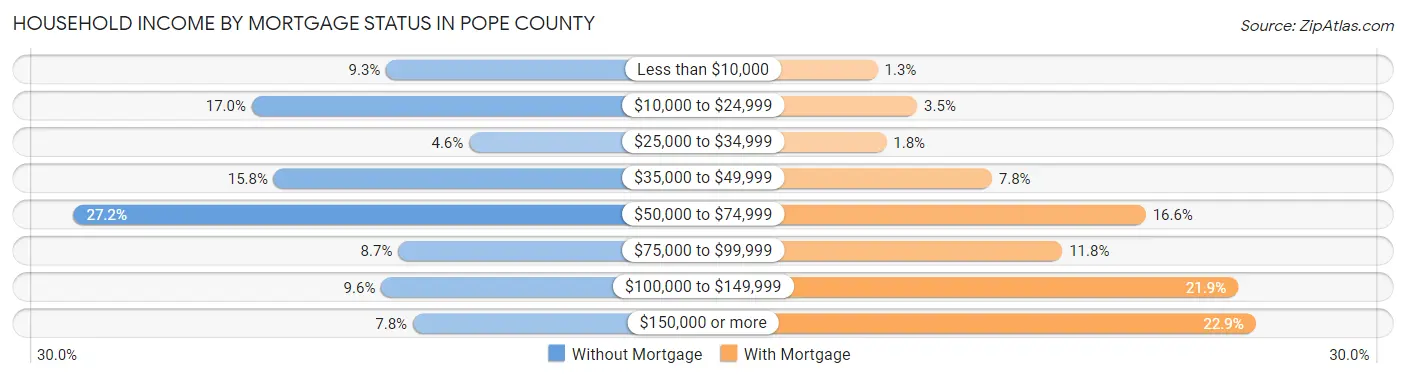
| Household Income | Without Mortgage | With Mortgage |
| Less than $10,000 | 67 (9.3%) | 5 (1.3%) |
| $10,000 to $24,999 | 122 (17.0%) | 14 (3.5%) |
| $25,000 to $34,999 | 33 (4.6%) | 7 (1.8%) |
| $35,000 to $49,999 | 113 (15.8%) | 31 (7.8%) |
| $50,000 to $74,999 | 195 (27.2%) | 66 (16.6%) |
| $75,000 to $99,999 | 62 (8.6%) | 47 (11.8%) |
| $100,000 to $149,999 | 69 (9.6%) | 87 (21.9%) |
| $150,000 or more | 56 (7.8%) | 91 (22.9%) |
| Total | 717 (100.0%) | 398 (100.0%) |
Property Value to Household Income Ratio in Pope County
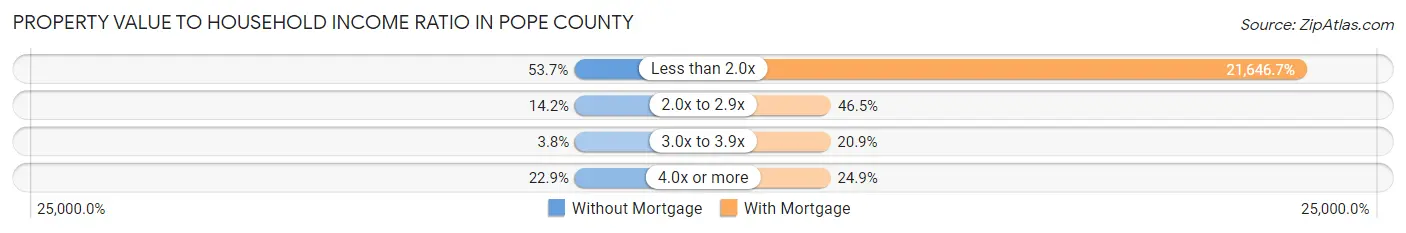
| Value-to-Income Ratio | Without Mortgage | With Mortgage |
| Less than 2.0x | 385 (53.7%) | 86,154 (21,646.7%) |
| 2.0x to 2.9x | 102 (14.2%) | 185 (46.5%) |
| 3.0x to 3.9x | 27 (3.8%) | 83 (20.8%) |
| 4.0x or more | 164 (22.9%) | 99 (24.9%) |
| Total | 717 (100.0%) | 398 (100.0%) |
Real Estate Taxes by Mortgage Status in Pope County
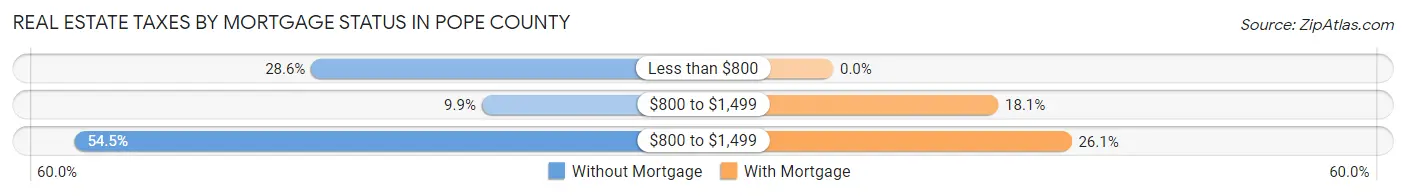
| Property Taxes | Without Mortgage | With Mortgage |
| Less than $800 | 205 (28.6%) | 0 (0.0%) |
| $800 to $1,499 | 71 (9.9%) | 72 (18.1%) |
| $800 to $1,499 | 391 (54.5%) | 104 (26.1%) |
| Total | 717 (100.0%) | 398 (100.0%) |
Health & Disability in Pope County
Health Insurance Coverage by Age in Pope County
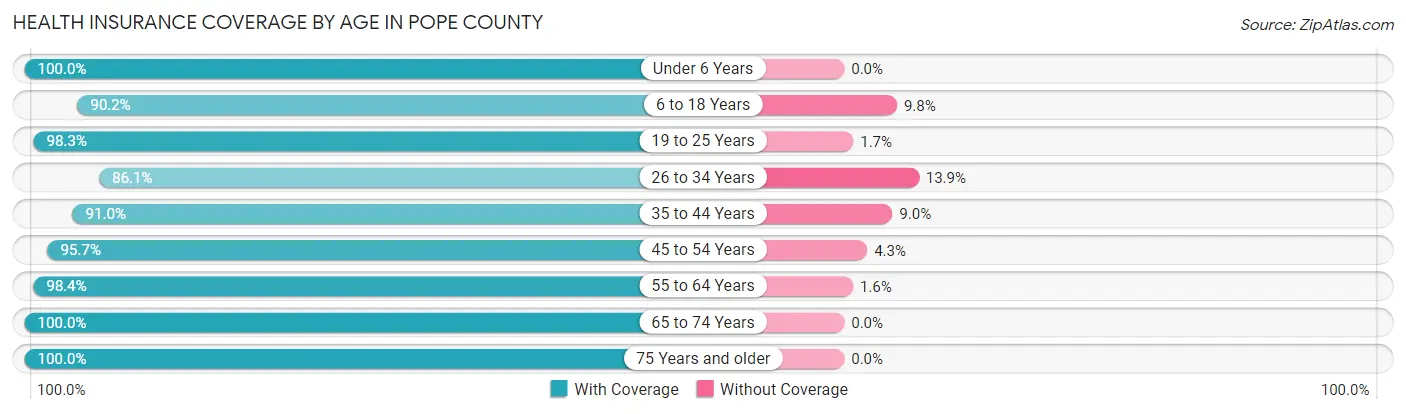
| Age Bracket | With Coverage | Without Coverage |
| Under 6 Years | 230 (100.0%) | 0 (0.0%) |
| 6 to 18 Years | 413 (90.2%) | 45 (9.8%) |
| 19 to 25 Years | 234 (98.3%) | 4 (1.7%) |
| 26 to 34 Years | 186 (86.1%) | 30 (13.9%) |
| 35 to 44 Years | 355 (91.0%) | 35 (9.0%) |
| 45 to 54 Years | 471 (95.7%) | 21 (4.3%) |
| 55 to 64 Years | 724 (98.4%) | 12 (1.6%) |
| 65 to 74 Years | 583 (100.0%) | 0 (0.0%) |
| 75 Years and older | 333 (100.0%) | 0 (0.0%) |
| Total | 3,529 (96.0%) | 147 (4.0%) |
Health Insurance Coverage by Citizenship Status in Pope County
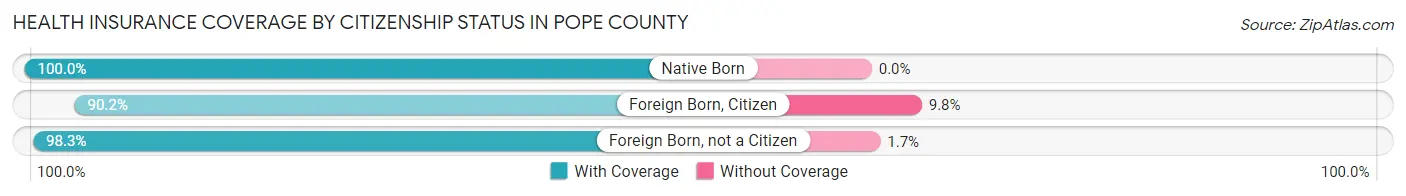
| Citizenship Status | With Coverage | Without Coverage |
| Native Born | 230 (100.0%) | 0 (0.0%) |
| Foreign Born, Citizen | 413 (90.2%) | 45 (9.8%) |
| Foreign Born, not a Citizen | 234 (98.3%) | 4 (1.7%) |
Health Insurance Coverage by Household Income in Pope County
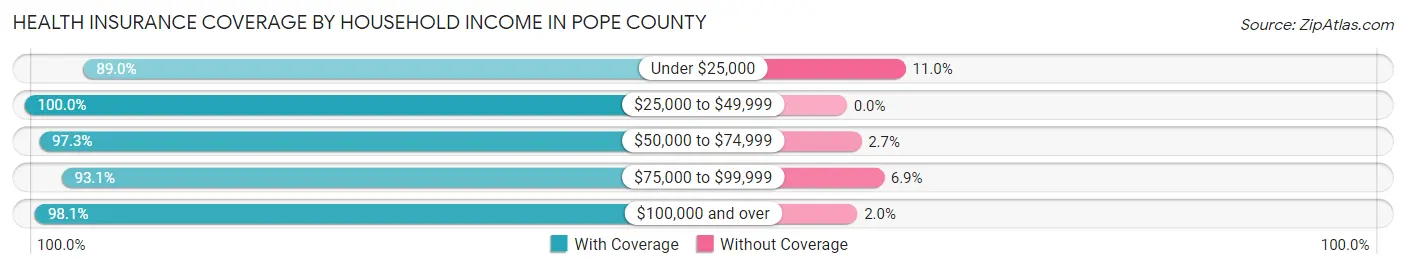
| Household Income | With Coverage | Without Coverage |
| Under $25,000 | 558 (89.0%) | 69 (11.0%) |
| $25,000 to $49,999 | 565 (100.0%) | 0 (0.0%) |
| $50,000 to $74,999 | 721 (97.3%) | 20 (2.7%) |
| $75,000 to $99,999 | 470 (93.1%) | 35 (6.9%) |
| $100,000 and over | 1,156 (98.1%) | 23 (1.9%) |
Public vs Private Health Insurance Coverage by Age in Pope County
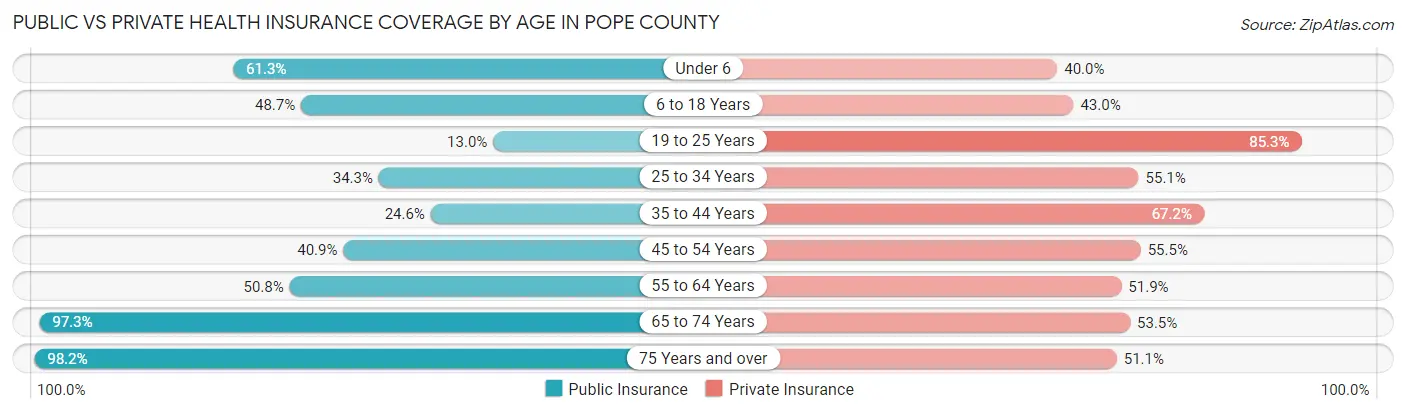
| Age Bracket | Public Insurance | Private Insurance |
| Under 6 | 141 (61.3%) | 92 (40.0%) |
| 6 to 18 Years | 223 (48.7%) | 197 (43.0%) |
| 19 to 25 Years | 31 (13.0%) | 203 (85.3%) |
| 25 to 34 Years | 74 (34.3%) | 119 (55.1%) |
| 35 to 44 Years | 96 (24.6%) | 262 (67.2%) |
| 45 to 54 Years | 201 (40.8%) | 273 (55.5%) |
| 55 to 64 Years | 374 (50.8%) | 382 (51.9%) |
| 65 to 74 Years | 567 (97.3%) | 312 (53.5%) |
| 75 Years and over | 327 (98.2%) | 170 (51.0%) |
| Total | 2,034 (55.3%) | 2,010 (54.7%) |
Disability Status by Sex by Age in Pope County
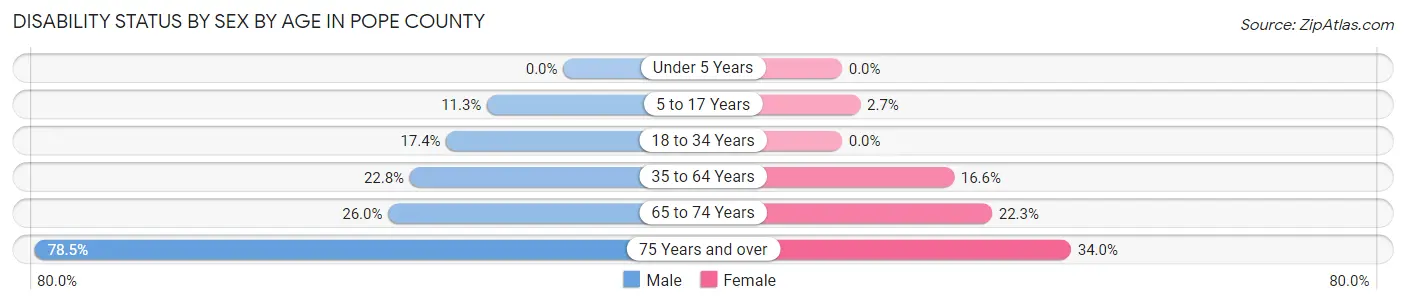
| Age Bracket | Male | Female |
| Under 5 Years | 0 (0.0%) | 0 (0.0%) |
| 5 to 17 Years | 19 (11.3%) | 7 (2.7%) |
| 18 to 34 Years | 50 (17.4%) | 0 (0.0%) |
| 35 to 64 Years | 185 (22.8%) | 134 (16.6%) |
| 65 to 74 Years | 85 (26.0%) | 57 (22.3%) |
| 75 Years and over | 146 (78.5%) | 50 (34.0%) |
Disability Class by Sex by Age in Pope County
Disability Class: Hearing Difficulty
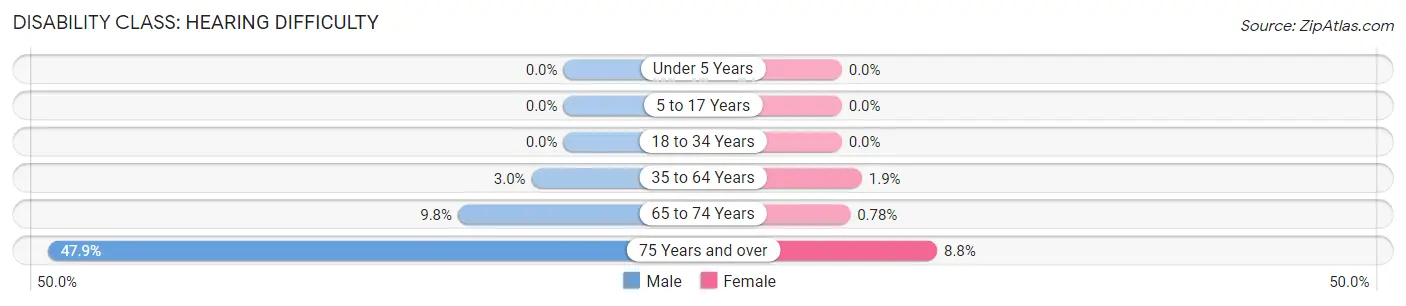
| Age Bracket | Male | Female |
| Under 5 Years | 0 (0.0%) | 0 (0.0%) |
| 5 to 17 Years | 0 (0.0%) | 0 (0.0%) |
| 18 to 34 Years | 0 (0.0%) | 0 (0.0%) |
| 35 to 64 Years | 24 (3.0%) | 15 (1.9%) |
| 65 to 74 Years | 32 (9.8%) | 2 (0.8%) |
| 75 Years and over | 89 (47.8%) | 13 (8.8%) |
Disability Class: Vision Difficulty
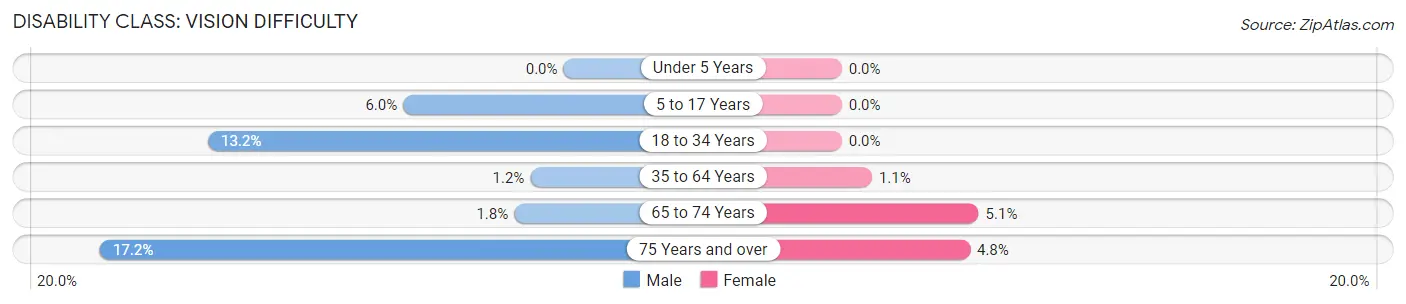
| Age Bracket | Male | Female |
| Under 5 Years | 0 (0.0%) | 0 (0.0%) |
| 5 to 17 Years | 10 (5.9%) | 0 (0.0%) |
| 18 to 34 Years | 38 (13.2%) | 0 (0.0%) |
| 35 to 64 Years | 10 (1.2%) | 9 (1.1%) |
| 65 to 74 Years | 6 (1.8%) | 13 (5.1%) |
| 75 Years and over | 32 (17.2%) | 7 (4.8%) |
Disability Class: Cognitive Difficulty
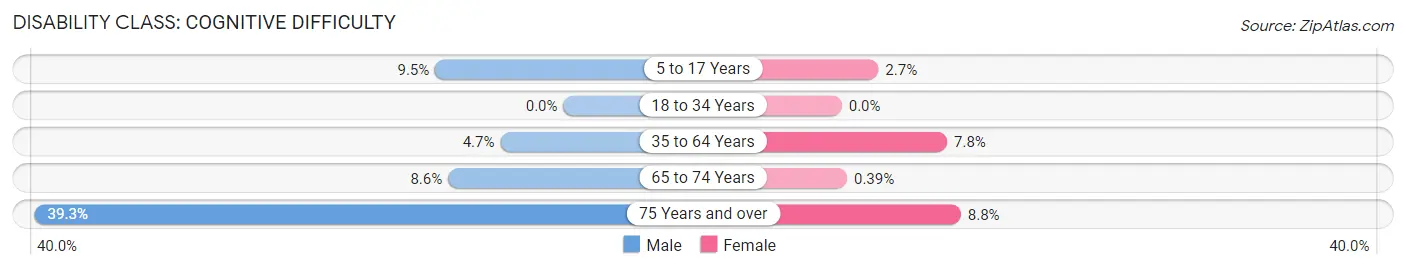
| Age Bracket | Male | Female |
| 5 to 17 Years | 16 (9.5%) | 7 (2.7%) |
| 18 to 34 Years | 0 (0.0%) | 0 (0.0%) |
| 35 to 64 Years | 38 (4.7%) | 63 (7.8%) |
| 65 to 74 Years | 28 (8.6%) | 1 (0.4%) |
| 75 Years and over | 73 (39.3%) | 13 (8.8%) |
Disability Class: Ambulatory Difficulty
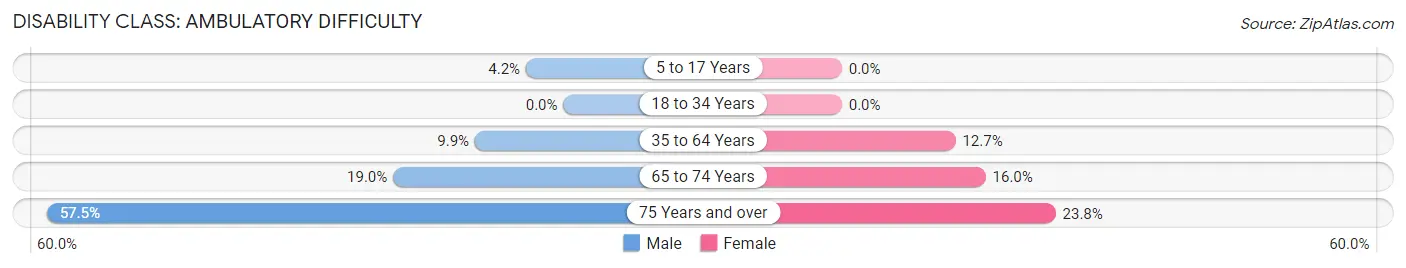
| Age Bracket | Male | Female |
| 5 to 17 Years | 7 (4.2%) | 0 (0.0%) |
| 18 to 34 Years | 0 (0.0%) | 0 (0.0%) |
| 35 to 64 Years | 80 (9.9%) | 102 (12.7%) |
| 65 to 74 Years | 62 (19.0%) | 41 (16.0%) |
| 75 Years and over | 107 (57.5%) | 35 (23.8%) |
Disability Class: Self-Care Difficulty
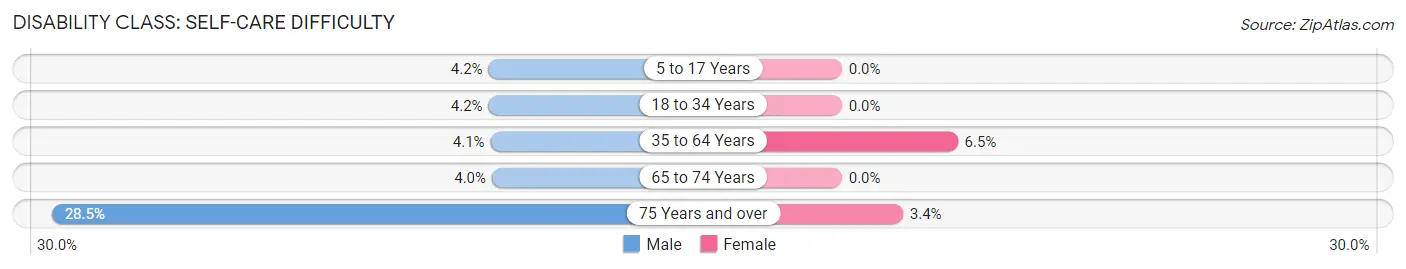
| Age Bracket | Male | Female |
| 5 to 17 Years | 7 (4.2%) | 0 (0.0%) |
| 18 to 34 Years | 12 (4.2%) | 0 (0.0%) |
| 35 to 64 Years | 33 (4.1%) | 52 (6.5%) |
| 65 to 74 Years | 13 (4.0%) | 0 (0.0%) |
| 75 Years and over | 53 (28.5%) | 5 (3.4%) |
Technology Access in Pope County
Computing Device Access in Pope County
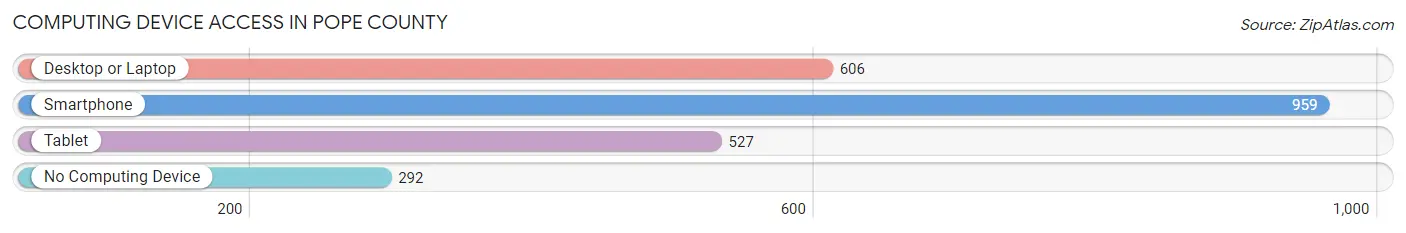
| Device Type | # Households | % Households |
| Desktop or Laptop | 606 | 44.9% |
| Smartphone | 959 | 71.1% |
| Tablet | 527 | 39.1% |
| No Computing Device | 292 | 21.6% |
| Total | 1,349 | 100.0% |
Internet Access in Pope County
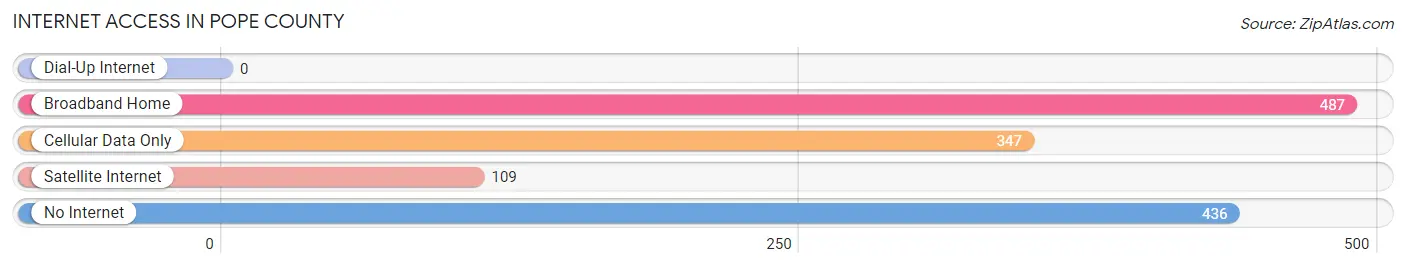
| Internet Type | # Households | % Households |
| Dial-Up Internet | 0 | 0.0% |
| Broadband Home | 487 | 36.1% |
| Cellular Data Only | 347 | 25.7% |
| Satellite Internet | 109 | 8.1% |
| No Internet | 436 | 32.3% |
| Total | 1,349 | 100.0% |
Pope County Summary
Introduction
Pope County is located in the southernmost part of Illinois, and is part of the Shawnee National Forest. It is bordered by Hardin County to the north, Massac County to the east, Johnson County to the south, and Saline County to the west. The county seat is Golconda, and the largest city is Golconda. The county was established in 1816 and named after Nathaniel Pope, a delegate to the U.S. Congress from Illinois. The population of Pope County was 8,945 in the 2010 census.
History
Pope County was formed in 1816 from parts of Johnson and Hardin counties. It was named after Nathaniel Pope, a delegate to the U.S. Congress from Illinois. The county was originally part of the Northwest Territory, and was later part of the Illinois Territory. The first settlers arrived in the area in the early 1800s, and the county was officially organized in 1816.
The county was largely agricultural in its early years, with corn, wheat, and oats being the main crops. The county also had a thriving timber industry, with the Shawnee National Forest providing an abundance of timber. The county was also home to several coal mines, which provided employment for many of the county’s residents.
In the late 1800s, the county began to experience a population boom, as many people moved to the area to take advantage of the abundant natural resources. The county’s population peaked in the 1920s, when it reached a high of 12,000.
Geography
Pope County is located in the southernmost part of Illinois, and is part of the Shawnee National Forest. It is bordered by Hardin County to the north, Massac County to the east, Johnson County to the south, and Saline County to the west. The county has a total area of 517 square miles, of which 514 square miles is land and 3 square miles is water.
The county is mostly flat, with some rolling hills in the northern part of the county. The highest point in the county is located in the Shawnee National Forest, at an elevation of 1,068 feet. The county is drained by the Ohio River, which forms the western border of the county.
Economy
Pope County’s economy is largely based on agriculture and tourism. The county is home to several large farms, which produce corn, wheat, soybeans, and other crops. The county is also home to several wineries, which produce a variety of wines.
The county is also home to several tourist attractions, including the Shawnee National Forest, the Ohio River, and several state parks. The county is also home to several historic sites, including the Golconda Historic District and the Pope County Courthouse.
Demographics
As of the 2010 census, the population of Pope County was 8,945. The racial makeup of the county was 97.2% White, 0.7% African American, 0.2% Native American, 0.2% Asian, 0.1% Pacific Islander, 0.7% from other races, and 0.9% from two or more races. Hispanic or Latino of any race were 1.7% of the population.
The median income for a household in the county was $37,945, and the median income for a family was $45,938. The per capita income for the county was $18,945. About 11.2% of families and 14.2% of the population were below the poverty line, including 19.2% of those under age 18 and 8.2% of those age 65 or over.
Conclusion
Pope County is a rural county located in the southernmost part of Illinois. It is bordered by Hardin County to the north, Massac County to the east, Johnson County to the south, and Saline County to the west. The county was established in 1816 and named after Nathaniel Pope, a delegate to the U.S. Congress from Illinois. The population of Pope County was 8,945 in the 2010 census. The county’s economy is largely based on agriculture and tourism, and the county is home to several large farms, wineries, and tourist attractions. The racial makeup of the county is 97.2% White, 0.7% African American, 0.2% Native American, 0.2% Asian, 0.1% Pacific Islander, 0.7% from other races, and 0.9% from two or more races. The median income for a household in the county was $37,945, and the median income for a family was $45,938. Pope County is a rural county with a rich history and a diverse population.
Common Questions
What is Per Capita Income in Pope County?
Per Capita income in Pope County is $26,251.
What is the Median Family Income in Pope County?
Median Family Income in Pope County is $73,598.
What is the Median Household income in Pope County?
Median Household Income in Pope County is $57,582.
What is Income or Wage Gap in Pope County?
Income or Wage Gap in Pope County is 28.5%.
Women in Pope County earn 71.5 cents for every dollar earned by a man.
What is Family Income Deficit in Pope County?
Family Income Deficit in Pope County is $15,298.
Families that are below poverty line in Pope County earn $15,298 less on average than the poverty threshold level.
What is Inequality or Gini Index in Pope County?
Inequality or Gini Index in Pope County is 0.44.
What is the Total Population of Pope County?
Total Population of Pope County is 3,799.
What is the Total Male Population of Pope County?
Total Male Population of Pope County is 1,966.
What is the Total Female Population of Pope County?
Total Female Population of Pope County is 1,833.
What is the Ratio of Males per 100 Females in Pope County?
There are 107.26 Males per 100 Females in Pope County.
What is the Ratio of Females per 100 Males in Pope County?
There are 93.23 Females per 100 Males in Pope County.
What is the Median Population Age in Pope County?
Median Population Age in Pope County is 49.7 Years.
What is the Average Family Size in Pope County
Average Family Size in Pope County is 3.4 People.
What is the Average Household Size in Pope County
Average Household Size in Pope County is 2.7 People.
How Large is the Labor Force in Pope County?
There are 1,414 People in the Labor Forcein in Pope County.
What is the Percentage of People in the Labor Force in Pope County?
43.7% of People are in the Labor Force in Pope County.
What is the Unemployment Rate in Pope County?
Unemployment Rate in Pope County is 9.1%.