Mercer County, IL Map & Demographics
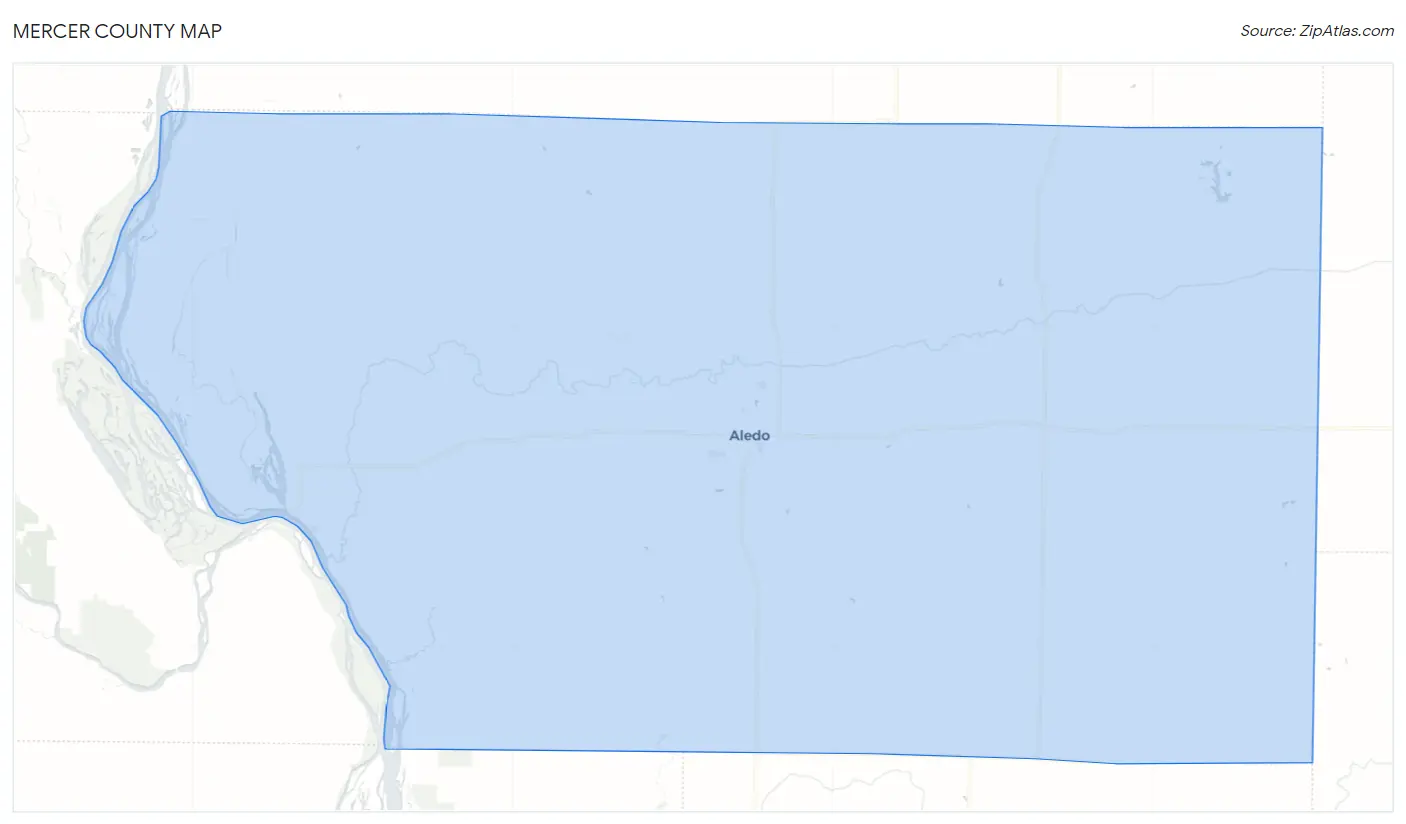
Mercer County Map
Mercer County Overview
$34,455
PER CAPITA INCOME
$84,315
AVG FAMILY INCOME
$67,028
AVG HOUSEHOLD INCOME
38.0%
WAGE / INCOME GAP [ % ]
62.0¢/ $1
WAGE / INCOME GAP [ $ ]
$13,565
FAMILY INCOME DEFICIT
0.41
INEQUALITY / GINI INDEX
15,692
TOTAL POPULATION
7,951
MALE POPULATION
7,741
FEMALE POPULATION
102.71
MALES / 100 FEMALES
97.36
FEMALES / 100 MALES
44.7
MEDIAN AGE
2.9
AVG FAMILY SIZE
2.4
AVG HOUSEHOLD SIZE
7,642
LABOR FORCE [ PEOPLE ]
59.8%
PERCENT IN LABOR FORCE
3.3%
UNEMPLOYMENT RATE
Mercer County Area Codes
Income in Mercer County
Income Overview in Mercer County
Per Capita Income in Mercer County is $34,455, while median incomes of families and households are $84,315 and $67,028 respectively.
| Characteristic | Number | Measure |
| Per Capita Income | 15,692 | $34,455 |
| Median Family Income | 4,467 | $84,315 |
| Mean Family Income | 4,467 | $97,649 |
| Median Household Income | 6,435 | $67,028 |
| Mean Household Income | 6,435 | $82,414 |
| Income Deficit | 4,467 | $13,565 |
| Wage / Income Gap (%) | 15,692 | 37.98% |
| Wage / Income Gap ($) | 15,692 | 62.02¢ per $1 |
| Gini / Inequality Index | 15,692 | 0.41 |
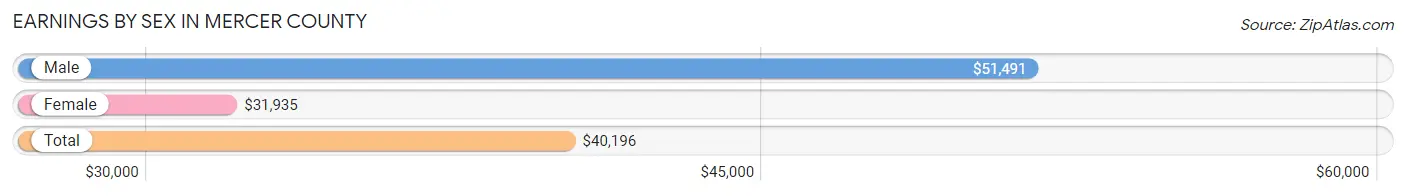
Earnings by Sex in Mercer County
Average Earnings in Mercer County are $40,196, $51,491 for men and $31,935 for women, a difference of 38.0%.
| Sex | Number | Average Earnings |
| Male | 4,376 (53.1%) | $51,491 |
| Female | 3,860 (46.9%) | $31,935 |
| Total | 8,236 (100.0%) | $40,196 |
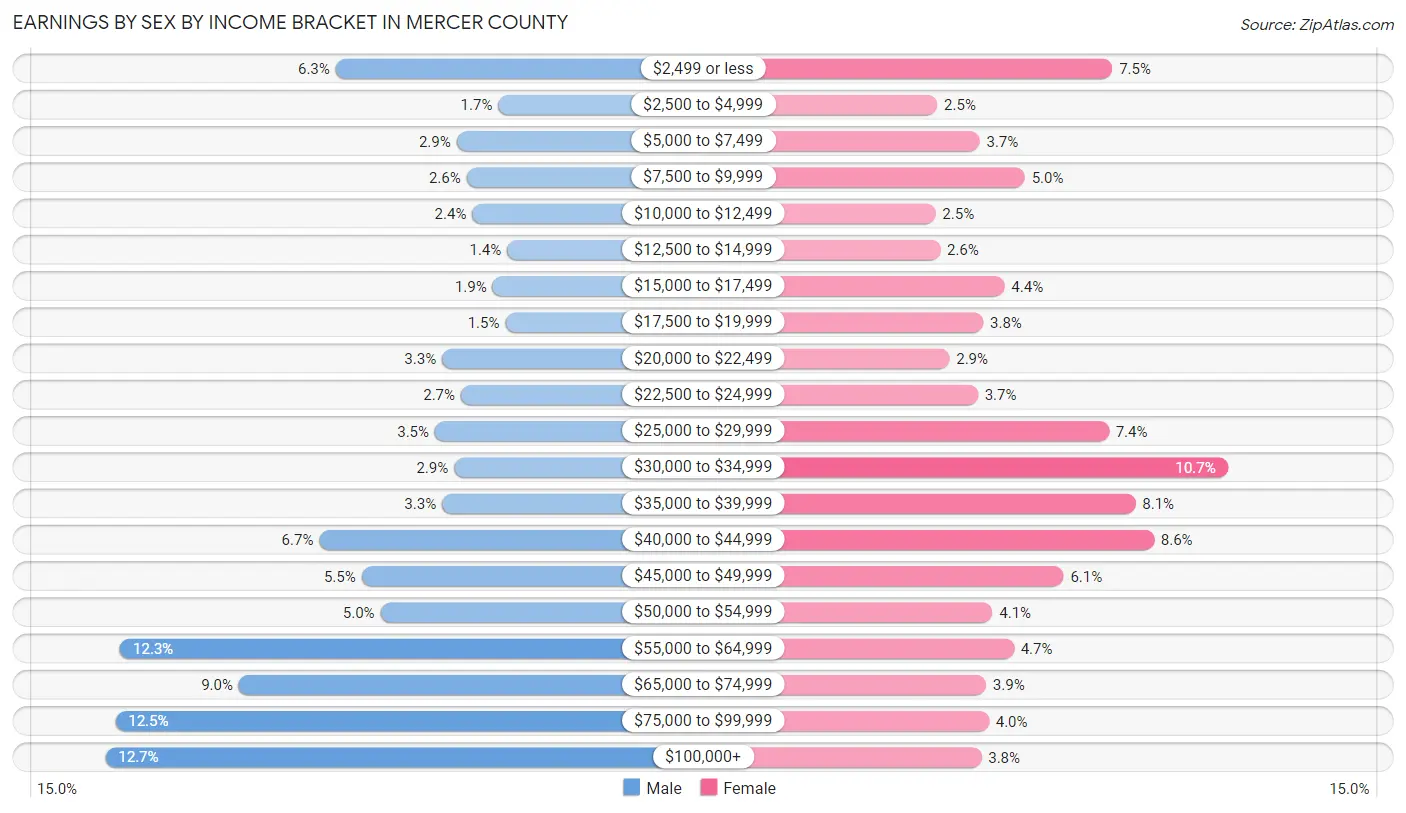
Earnings by Sex by Income Bracket in Mercer County
The most common earnings brackets in Mercer County are $100,000+ for men (557 | 12.7%) and $30,000 to $34,999 for women (413 | 10.7%).
| Income | Male | Female |
| $2,499 or less | 274 (6.3%) | 288 (7.5%) |
| $2,500 to $4,999 | 74 (1.7%) | 98 (2.5%) |
| $5,000 to $7,499 | 125 (2.9%) | 144 (3.7%) |
| $7,500 to $9,999 | 113 (2.6%) | 193 (5.0%) |
| $10,000 to $12,499 | 106 (2.4%) | 96 (2.5%) |
| $12,500 to $14,999 | 63 (1.4%) | 101 (2.6%) |
| $15,000 to $17,499 | 81 (1.8%) | 171 (4.4%) |
| $17,500 to $19,999 | 65 (1.5%) | 148 (3.8%) |
| $20,000 to $22,499 | 143 (3.3%) | 111 (2.9%) |
| $22,500 to $24,999 | 120 (2.7%) | 142 (3.7%) |
| $25,000 to $29,999 | 152 (3.5%) | 284 (7.4%) |
| $30,000 to $34,999 | 128 (2.9%) | 413 (10.7%) |
| $35,000 to $39,999 | 143 (3.3%) | 313 (8.1%) |
| $40,000 to $44,999 | 294 (6.7%) | 333 (8.6%) |
| $45,000 to $49,999 | 242 (5.5%) | 235 (6.1%) |
| $50,000 to $54,999 | 219 (5.0%) | 158 (4.1%) |
| $55,000 to $64,999 | 539 (12.3%) | 181 (4.7%) |
| $65,000 to $74,999 | 393 (9.0%) | 151 (3.9%) |
| $75,000 to $99,999 | 545 (12.4%) | 154 (4.0%) |
| $100,000+ | 557 (12.7%) | 146 (3.8%) |
| Total | 4,376 (100.0%) | 3,860 (100.0%) |
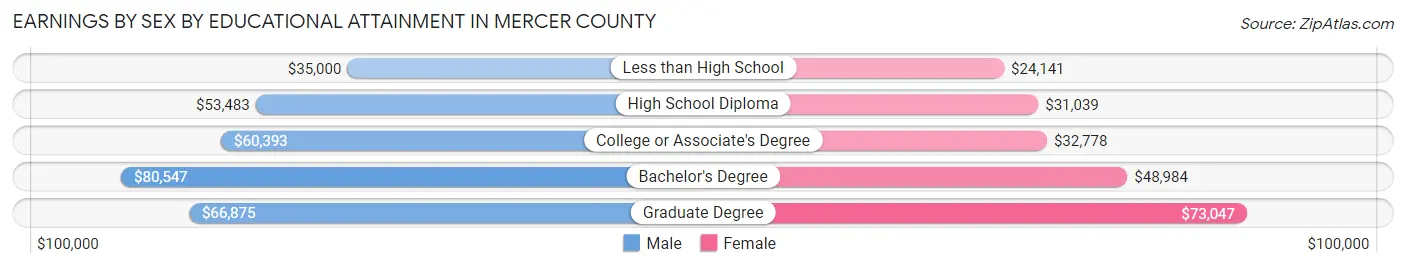
Earnings by Sex by Educational Attainment in Mercer County
Average earnings in Mercer County are $57,823 for men and $34,592 for women, a difference of 40.2%. Men with an educational attainment of bachelor's degree enjoy the highest average annual earnings of $80,547, while those with less than high school education earn the least with $35,000. Women with an educational attainment of graduate degree earn the most with the average annual earnings of $73,047, while those with less than high school education have the smallest earnings of $24,141.
| Educational Attainment | Male Income | Female Income |
| Less than High School | $35,000 | $24,141 |
| High School Diploma | $53,483 | $31,039 |
| College or Associate's Degree | $60,393 | $32,778 |
| Bachelor's Degree | $80,547 | $48,984 |
| Graduate Degree | $66,875 | $73,047 |
| Total | $57,823 | $34,592 |
Family Income in Mercer County
Family Income Brackets in Mercer County
According to the Mercer County family income data, there are 974 families falling into the $100,000 to $149,999 income range, which is the most common income bracket and makes up 21.8% of all families. Conversely, the $10,000 to $14,999 income bracket is the least frequent group with only 76 families (1.7%) belonging to this category.
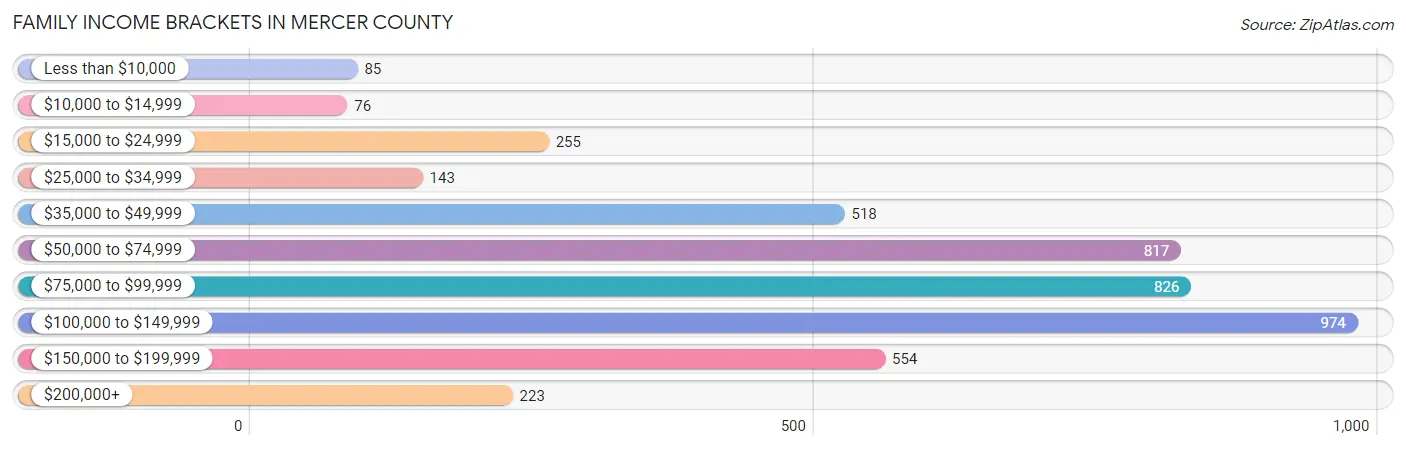
| Income Bracket | # Families | % Families |
| Less than $10,000 | 85 | 1.9% |
| $10,000 to $14,999 | 76 | 1.7% |
| $15,000 to $24,999 | 255 | 5.7% |
| $25,000 to $34,999 | 143 | 3.2% |
| $35,000 to $49,999 | 518 | 11.6% |
| $50,000 to $74,999 | 817 | 18.3% |
| $75,000 to $99,999 | 826 | 18.5% |
| $100,000 to $149,999 | 974 | 21.8% |
| $150,000 to $199,999 | 554 | 12.4% |
| $200,000+ | 223 | 5.0% |
Family Income by Famaliy Size in Mercer County
7+ person families (32 | 0.7%) account for the highest median family income in Mercer County with $134,125 per family, while 2-person families (2,345 | 52.5%) have the highest median income of $39,417 per family member.
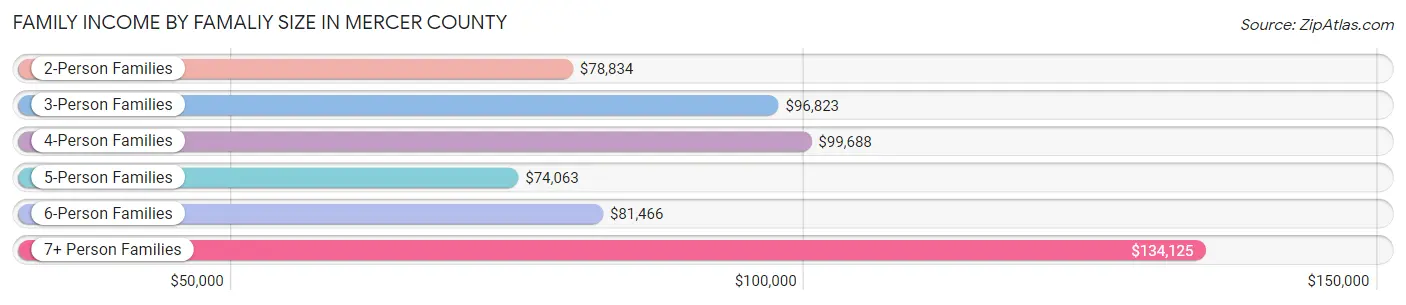
| Income Bracket | # Families | Median Income |
| 2-Person Families | 2,345 (52.5%) | $78,834 |
| 3-Person Families | 943 (21.1%) | $96,823 |
| 4-Person Families | 638 (14.3%) | $99,688 |
| 5-Person Families | 429 (9.6%) | $74,063 |
| 6-Person Families | 80 (1.8%) | $81,466 |
| 7+ Person Families | 32 (0.7%) | $134,125 |
| Total | 4,467 (100.0%) | $84,315 |
Family Income by Number of Earners in Mercer County
The median family income in Mercer County is $84,315, with families comprising 3+ earners (540) having the highest median family income of $143,824, while families with no earners (798) have the lowest median family income of $48,125, accounting for 12.1% and 17.9% of families, respectively.
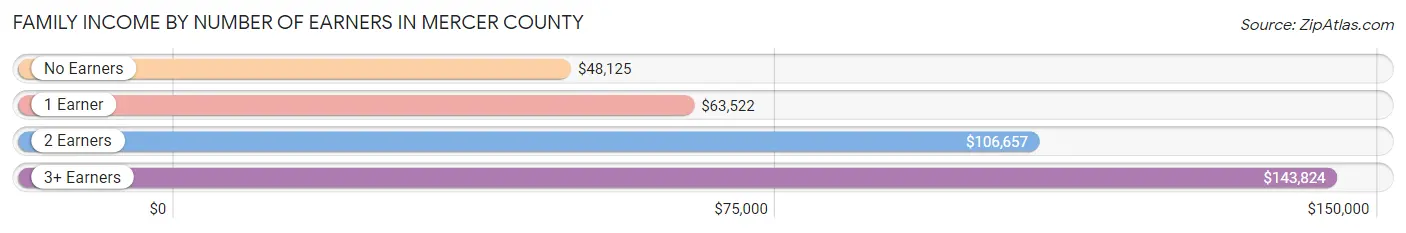
| Number of Earners | # Families | Median Income |
| No Earners | 798 (17.9%) | $48,125 |
| 1 Earner | 1,304 (29.2%) | $63,522 |
| 2 Earners | 1,825 (40.9%) | $106,657 |
| 3+ Earners | 540 (12.1%) | $143,824 |
| Total | 4,467 (100.0%) | $84,315 |
Household Income in Mercer County
Household Income Brackets in Mercer County
With 1,133 households falling in the category, the $50,000 to $74,999 income range is the most frequent in Mercer County, accounting for 17.6% of all households. In contrast, only 232 households (3.6%) fall into the $200,000+ income bracket, making it the least populous group.
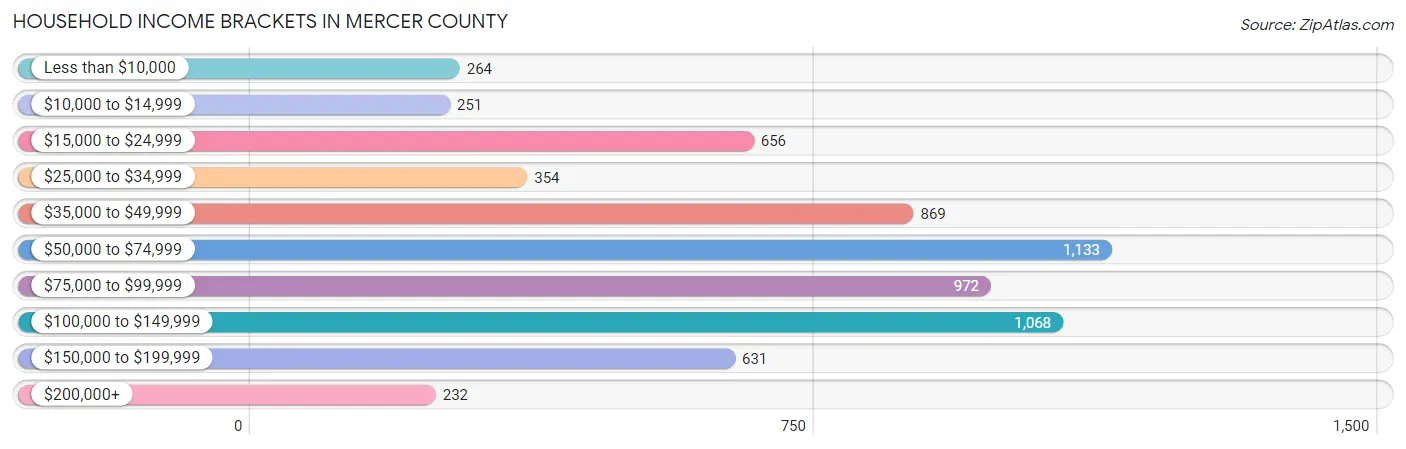
| Income Bracket | # Households | % Households |
| Less than $10,000 | 264 | 4.1% |
| $10,000 to $14,999 | 251 | 3.9% |
| $15,000 to $24,999 | 656 | 10.2% |
| $25,000 to $34,999 | 354 | 5.5% |
| $35,000 to $49,999 | 869 | 13.5% |
| $50,000 to $74,999 | 1,133 | 17.6% |
| $75,000 to $99,999 | 972 | 15.1% |
| $100,000 to $149,999 | 1,068 | 16.6% |
| $150,000 to $199,999 | 631 | 9.8% |
| $200,000+ | 232 | 3.6% |
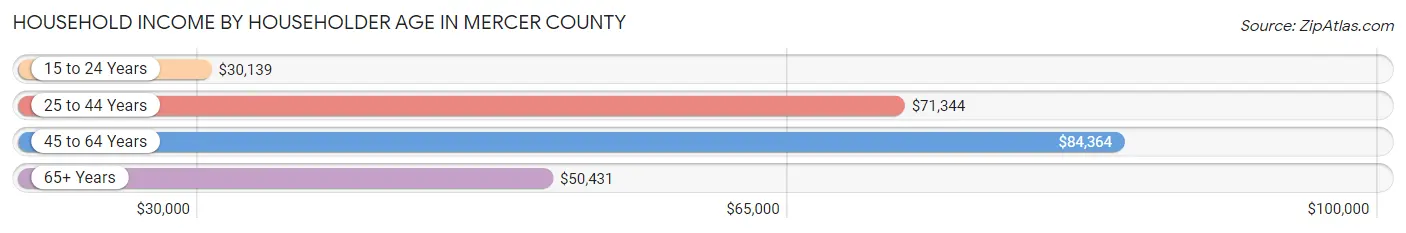
Household Income by Householder Age in Mercer County
The median household income in Mercer County is $67,028, with the highest median household income of $84,364 found in the 45 to 64 years age bracket for the primary householder. A total of 2,468 households (38.4%) fall into this category. Meanwhile, the 15 to 24 years age bracket for the primary householder has the lowest median household income of $30,139, with 180 households (2.8%) in this group.
| Income Bracket | # Households | Median Income |
| 15 to 24 Years | 180 (2.8%) | $30,139 |
| 25 to 44 Years | 1,687 (26.2%) | $71,344 |
| 45 to 64 Years | 2,468 (38.4%) | $84,364 |
| 65+ Years | 2,100 (32.6%) | $50,431 |
| Total | 6,435 (100.0%) | $67,028 |
Poverty in Mercer County
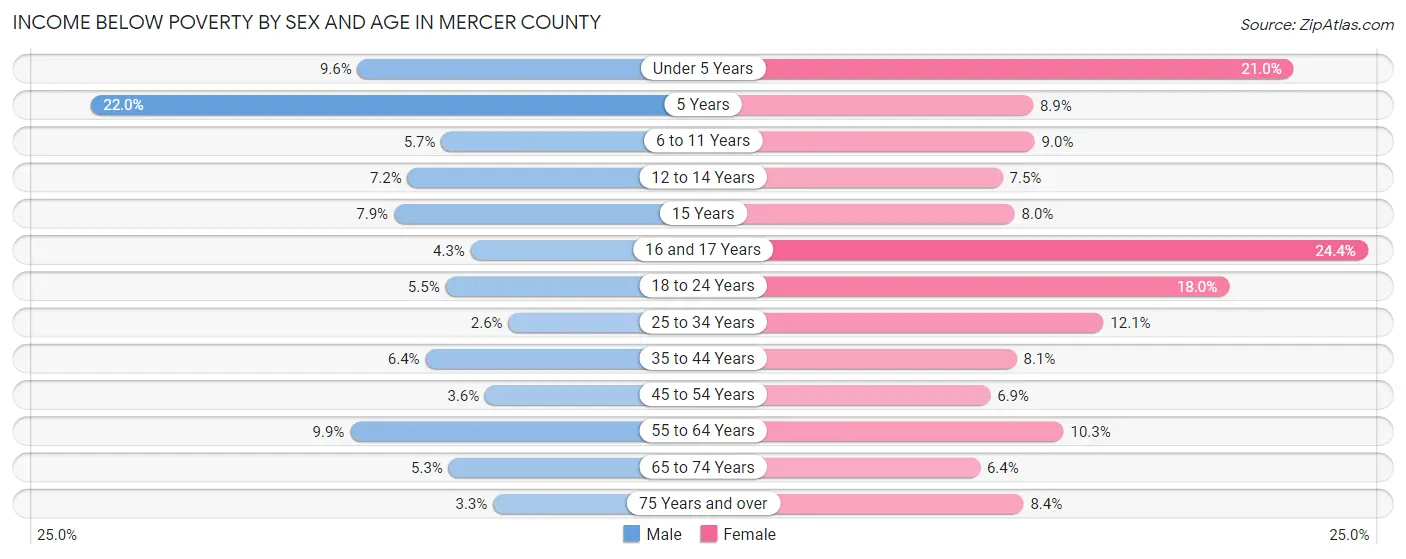
Income Below Poverty by Sex and Age in Mercer County
With 5.9% poverty level for males and 10.2% for females among the residents of Mercer County, 5 year old males and 16 and 17 year old females are the most vulnerable to poverty, with 9 males (22.0%) and 41 females (24.4%) in their respective age groups living below the poverty level.
| Age Bracket | Male | Female |
| Under 5 Years | 38 (9.6%) | 74 (21.0%) |
| 5 Years | 9 (22.0%) | 11 (8.9%) |
| 6 to 11 Years | 30 (5.7%) | 47 (8.9%) |
| 12 to 14 Years | 25 (7.2%) | 20 (7.5%) |
| 15 Years | 11 (7.9%) | 13 (8.0%) |
| 16 and 17 Years | 8 (4.3%) | 41 (24.4%) |
| 18 to 24 Years | 37 (5.5%) | 92 (18.0%) |
| 25 to 34 Years | 20 (2.5%) | 94 (12.1%) |
| 35 to 44 Years | 60 (6.4%) | 75 (8.1%) |
| 45 to 54 Years | 36 (3.6%) | 69 (6.9%) |
| 55 to 64 Years | 119 (9.9%) | 117 (10.3%) |
| 65 to 74 Years | 51 (5.3%) | 59 (6.4%) |
| 75 Years and over | 21 (3.3%) | 67 (8.4%) |
| Total | 465 (5.9%) | 779 (10.2%) |
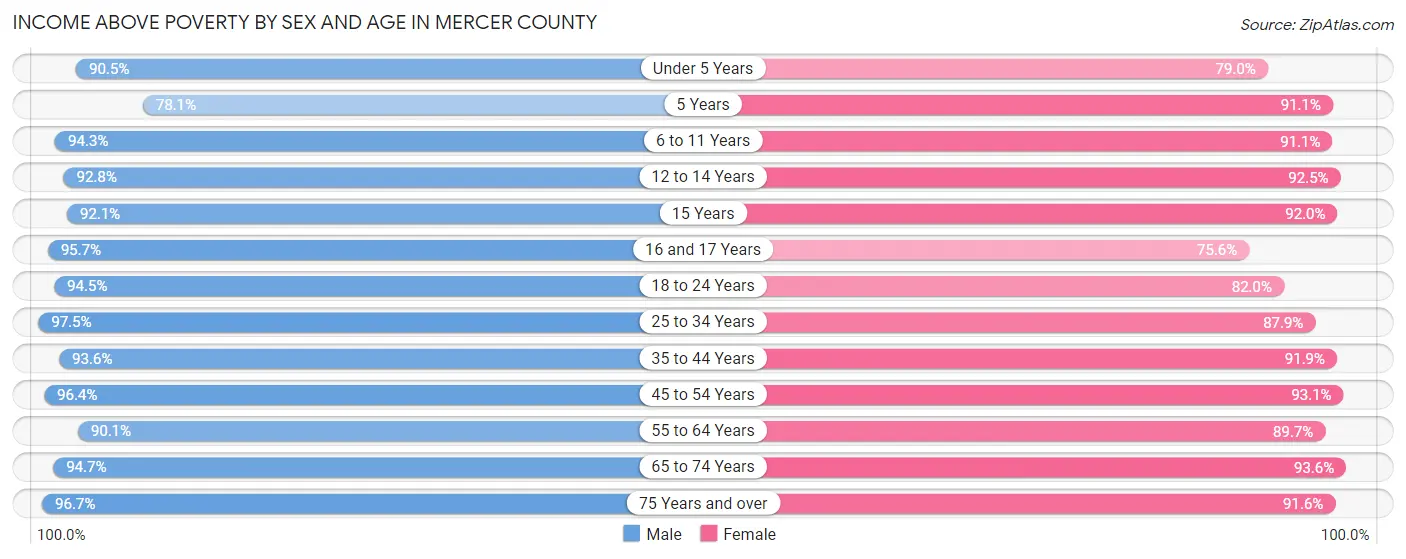
Income Above Poverty by Sex and Age in Mercer County
According to the poverty statistics in Mercer County, males aged 25 to 34 years and females aged 65 to 74 years are the age groups that are most secure financially, with 97.5% of males and 93.6% of females in these age groups living above the poverty line.
| Age Bracket | Male | Female |
| Under 5 Years | 360 (90.4%) | 279 (79.0%) |
| 5 Years | 32 (78.0%) | 113 (91.1%) |
| 6 to 11 Years | 500 (94.3%) | 478 (91.0%) |
| 12 to 14 Years | 321 (92.8%) | 248 (92.5%) |
| 15 Years | 129 (92.1%) | 149 (92.0%) |
| 16 and 17 Years | 178 (95.7%) | 127 (75.6%) |
| 18 to 24 Years | 639 (94.5%) | 420 (82.0%) |
| 25 to 34 Years | 765 (97.5%) | 680 (87.9%) |
| 35 to 44 Years | 878 (93.6%) | 850 (91.9%) |
| 45 to 54 Years | 956 (96.4%) | 933 (93.1%) |
| 55 to 64 Years | 1,084 (90.1%) | 1,020 (89.7%) |
| 65 to 74 Years | 908 (94.7%) | 862 (93.6%) |
| 75 Years and over | 624 (96.7%) | 728 (91.6%) |
| Total | 7,374 (94.1%) | 6,887 (89.8%) |
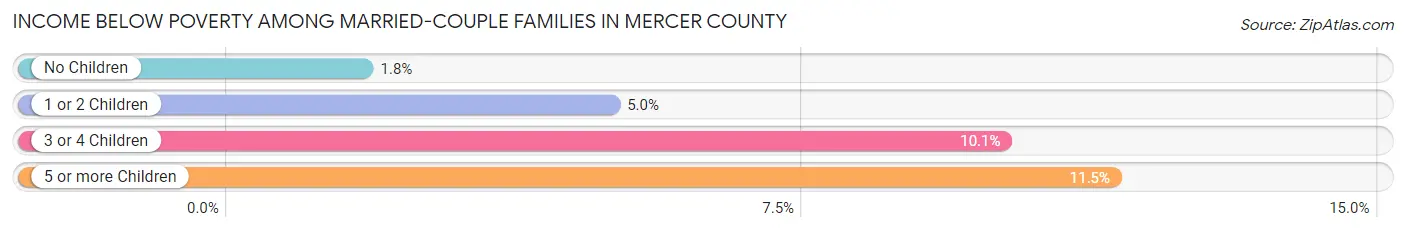
Income Below Poverty Among Married-Couple Families in Mercer County
The poverty statistics for married-couple families in Mercer County show that 3.5% or 133 of the total 3,810 families live below the poverty line. Families with 5 or more children have the highest poverty rate of 11.5%, comprising of 3 families. On the other hand, families with no children have the lowest poverty rate of 1.8%, which includes 43 families.
| Children | Above Poverty | Below Poverty |
| No Children | 2,384 (98.2%) | 43 (1.8%) |
| 1 or 2 Children | 932 (95.0%) | 49 (5.0%) |
| 3 or 4 Children | 338 (89.9%) | 38 (10.1%) |
| 5 or more Children | 23 (88.5%) | 3 (11.5%) |
| Total | 3,677 (96.5%) | 133 (3.5%) |
Income Below Poverty Among Single-Parent Households in Mercer County
According to the poverty data in Mercer County, 10.5% or 25 single-father households and 22.4% or 94 single-mother households are living below the poverty line. Among single-father households, those with 3 or 4 children have the highest poverty rate, with 15 households (41.7%) experiencing poverty. Likewise, among single-mother households, those with 3 or 4 children have the highest poverty rate, with 25 households (58.1%) falling below the poverty line.
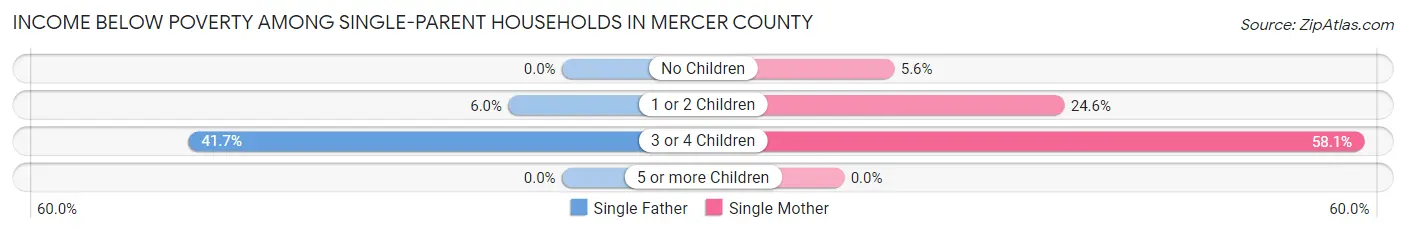
| Children | Single Father | Single Mother |
| No Children | 0 (0.0%) | 7 (5.6%) |
| 1 or 2 Children | 10 (6.0%) | 62 (24.6%) |
| 3 or 4 Children | 15 (41.7%) | 25 (58.1%) |
| 5 or more Children | 0 (0.0%) | 0 (0.0%) |
| Total | 25 (10.5%) | 94 (22.4%) |
Income Below Poverty Among Married-Couple vs Single-Parent Households in Mercer County
The poverty data for Mercer County shows that 133 of the married-couple family households (3.5%) and 119 of the single-parent households (18.1%) are living below the poverty level. Within the married-couple family households, those with 5 or more children have the highest poverty rate, with 3 households (11.5%) falling below the poverty line. Among the single-parent households, those with 3 or 4 children have the highest poverty rate, with 40 household (50.6%) living below poverty.
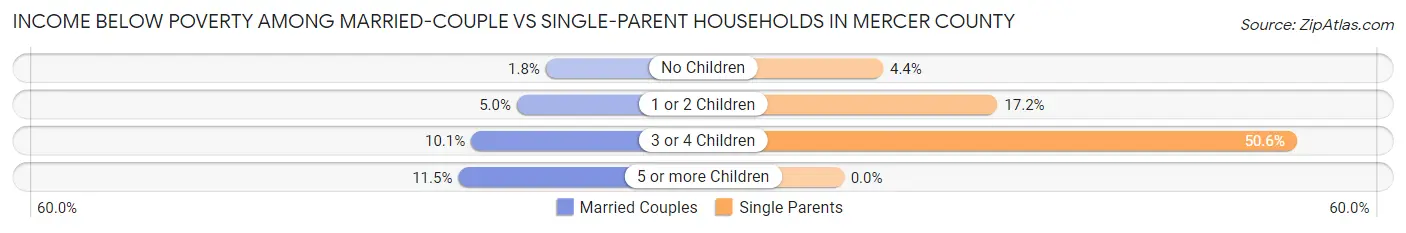
| Children | Married-Couple Families | Single-Parent Households |
| No Children | 43 (1.8%) | 7 (4.4%) |
| 1 or 2 Children | 49 (5.0%) | 72 (17.2%) |
| 3 or 4 Children | 38 (10.1%) | 40 (50.6%) |
| 5 or more Children | 3 (11.5%) | 0 (0.0%) |
| Total | 133 (3.5%) | 119 (18.1%) |
Race in Mercer County
The most populous races in Mercer County are White / Caucasian (14,961 | 95.3%), Two or more Races (464 | 3.0%), and Hispanic or Latino (436 | 2.8%).
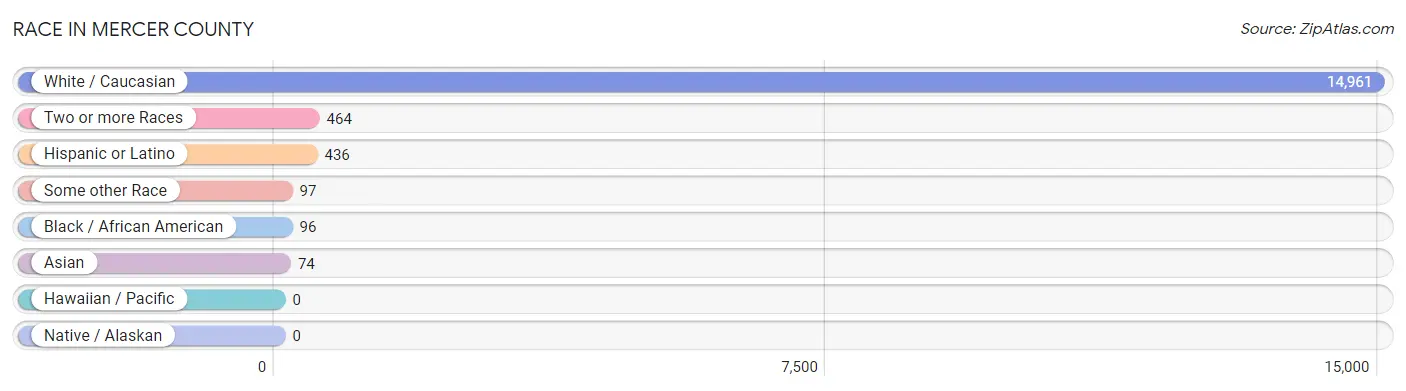
| Race | # Population | % Population |
| Asian | 74 | 0.5% |
| Black / African American | 96 | 0.6% |
| Hawaiian / Pacific | 0 | 0.0% |
| Hispanic or Latino | 436 | 2.8% |
| Native / Alaskan | 0 | 0.0% |
| White / Caucasian | 14,961 | 95.3% |
| Two or more Races | 464 | 3.0% |
| Some other Race | 97 | 0.6% |
| Total | 15,692 | 100.0% |
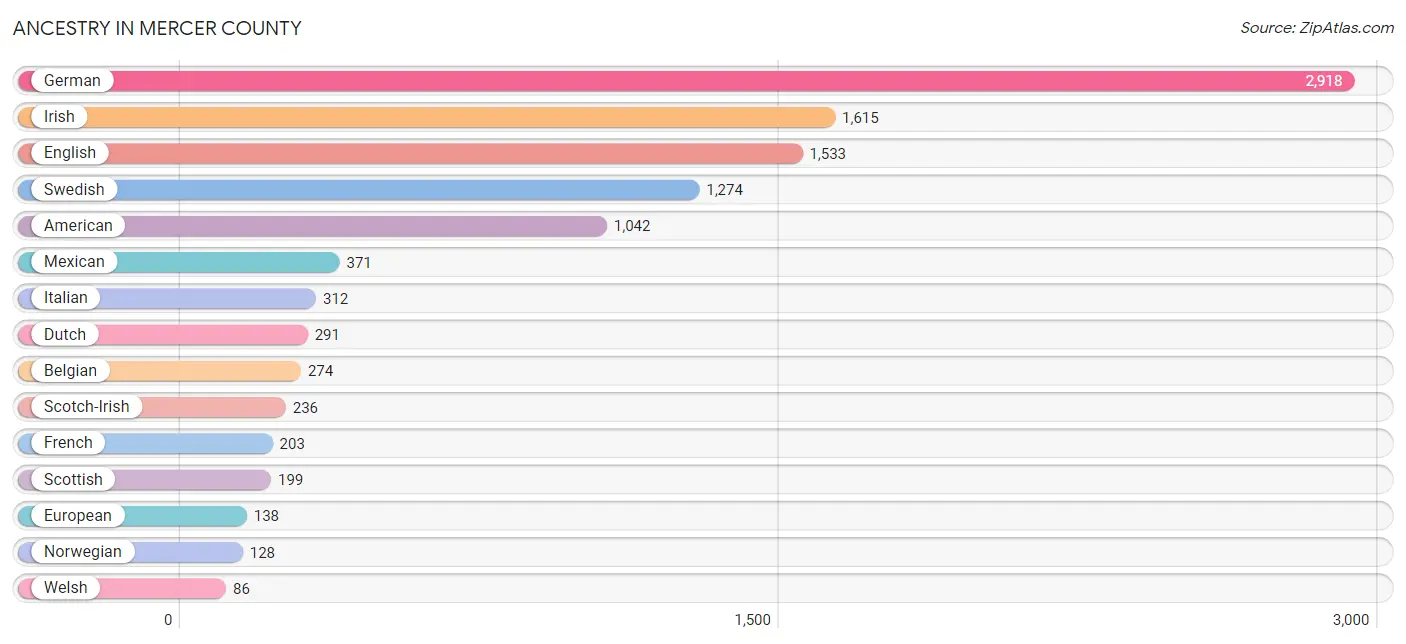
Ancestry in Mercer County
The most populous ancestries reported in Mercer County are German (2,918 | 18.6%), Irish (1,615 | 10.3%), English (1,533 | 9.8%), Swedish (1,274 | 8.1%), and American (1,042 | 6.6%), together accounting for 53.4% of all Mercer County residents.
| Ancestry | # Population | % Population |
| American | 1,042 | 6.6% |
| Arab | 41 | 0.3% |
| Austrian | 78 | 0.5% |
| Belgian | 274 | 1.8% |
| Blackfeet | 8 | 0.1% |
| Bolivian | 27 | 0.2% |
| British | 25 | 0.2% |
| Burmese | 29 | 0.2% |
| Canadian | 30 | 0.2% |
| Cherokee | 21 | 0.1% |
| Cheyenne | 10 | 0.1% |
| Comanche | 13 | 0.1% |
| Croatian | 31 | 0.2% |
| Cuban | 10 | 0.1% |
| Czech | 54 | 0.3% |
| Czechoslovakian | 12 | 0.1% |
| Danish | 61 | 0.4% |
| Dutch | 291 | 1.8% |
| Eastern European | 11 | 0.1% |
| English | 1,533 | 9.8% |
| European | 138 | 0.9% |
| Finnish | 1 | 0.0% |
| French | 203 | 1.3% |
| French Canadian | 21 | 0.1% |
| German | 2,918 | 18.6% |
| Greek | 8 | 0.1% |
| Haitian | 3 | 0.0% |
| Hungarian | 6 | 0.0% |
| Irish | 1,615 | 10.3% |
| Italian | 312 | 2.0% |
| Jamaican | 12 | 0.1% |
| Kiowa | 13 | 0.1% |
| Korean | 36 | 0.2% |
| Laotian | 6 | 0.0% |
| Lebanese | 4 | 0.0% |
| Lithuanian | 8 | 0.1% |
| Luxembourger | 8 | 0.1% |
| Mexican | 371 | 2.4% |
| Northern European | 3 | 0.0% |
| Norwegian | 128 | 0.8% |
| Pakistani | 7 | 0.0% |
| Pennsylvania German | 6 | 0.0% |
| Polish | 80 | 0.5% |
| Portuguese | 4 | 0.0% |
| Puerto Rican | 2 | 0.0% |
| Russian | 16 | 0.1% |
| Scandinavian | 39 | 0.3% |
| Scotch-Irish | 236 | 1.5% |
| Scottish | 199 | 1.3% |
| Serbian | 2 | 0.0% |
| Slovak | 31 | 0.2% |
| South American | 27 | 0.2% |
| Spaniard | 4 | 0.0% |
| Spanish | 16 | 0.1% |
| Sri Lankan | 24 | 0.2% |
| Swedish | 1,274 | 8.1% |
| Swiss | 35 | 0.2% |
| Thai | 7 | 0.0% |
| Ukrainian | 10 | 0.1% |
| Welsh | 86 | 0.5% |
| Yugoslavian | 42 | 0.3% | View All 61 Rows |
Immigrants in Mercer County
The most numerous immigrant groups reported in Mercer County came from Latin America (78 | 0.5%), Central America (73 | 0.5%), Mexico (73 | 0.5%), Asia (58 | 0.4%), and Europe (34 | 0.2%), together accounting for 2.0% of all Mercer County residents.
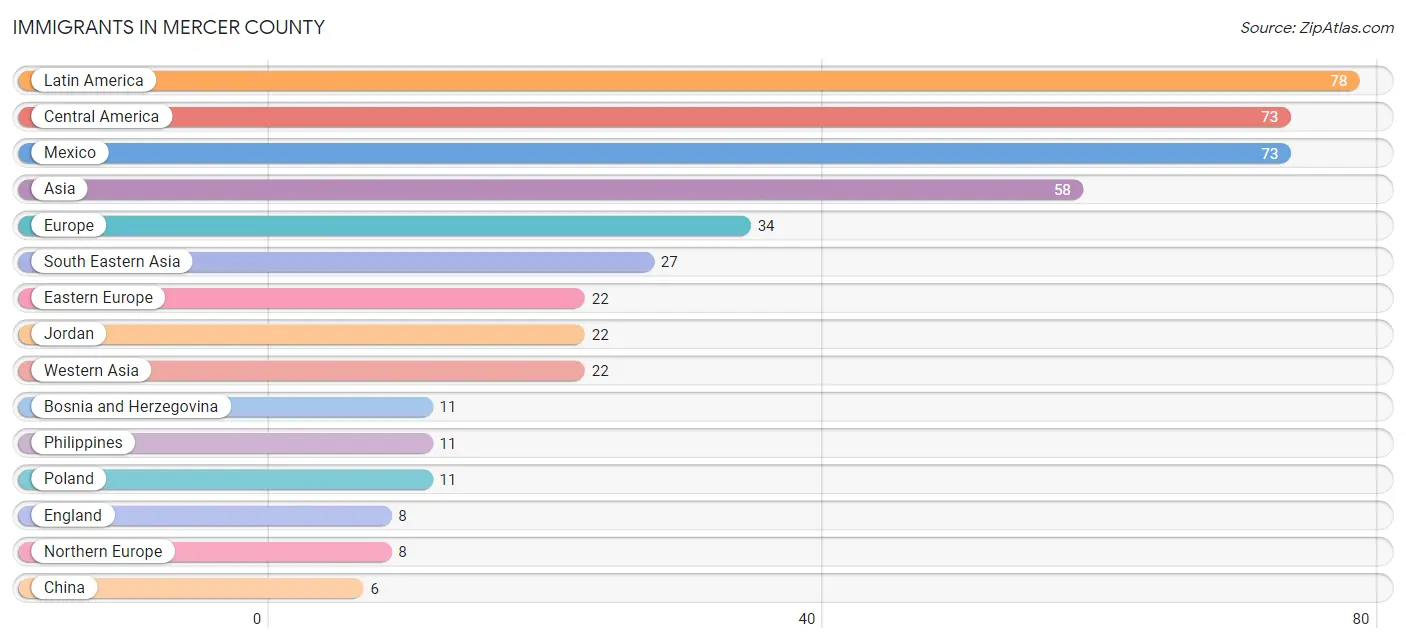
| Immigration Origin | # Population | % Population |
| Argentina | 2 | 0.0% |
| Asia | 58 | 0.4% |
| Bosnia and Herzegovina | 11 | 0.1% |
| Canada | 5 | 0.0% |
| Caribbean | 3 | 0.0% |
| Central America | 73 | 0.5% |
| China | 6 | 0.0% |
| Cuba | 3 | 0.0% |
| Eastern Asia | 6 | 0.0% |
| Eastern Europe | 22 | 0.1% |
| England | 8 | 0.1% |
| Europe | 34 | 0.2% |
| Germany | 4 | 0.0% |
| India | 3 | 0.0% |
| Indonesia | 6 | 0.0% |
| Jordan | 22 | 0.1% |
| Latin America | 78 | 0.5% |
| Mexico | 73 | 0.5% |
| Northern Europe | 8 | 0.1% |
| Philippines | 11 | 0.1% |
| Poland | 11 | 0.1% |
| South America | 2 | 0.0% |
| South Central Asia | 3 | 0.0% |
| South Eastern Asia | 27 | 0.2% |
| Thailand | 6 | 0.0% |
| Vietnam | 4 | 0.0% |
| Western Asia | 22 | 0.1% |
| Western Europe | 4 | 0.0% | View All 28 Rows |
Sex and Age in Mercer County
Sex and Age in Mercer County
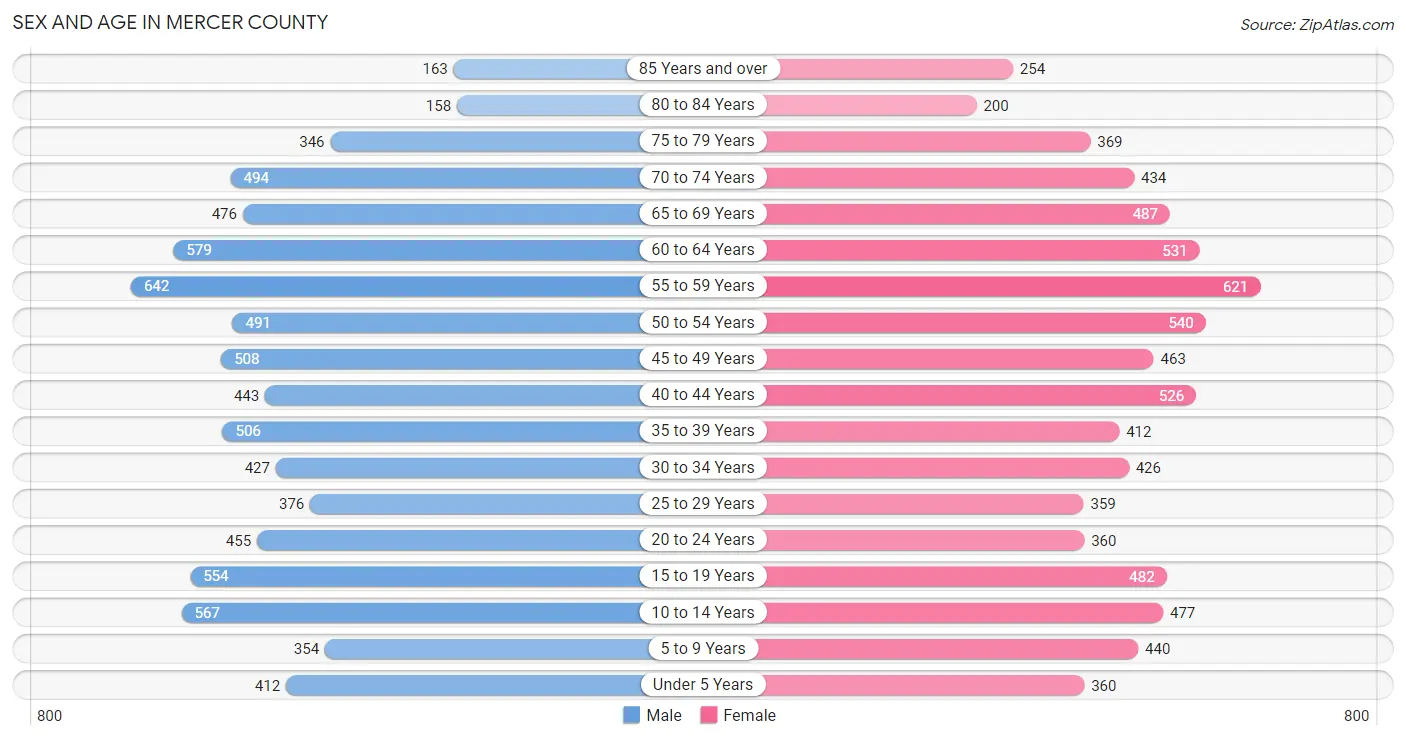
The most populous age groups in Mercer County are 55 to 59 Years (642 | 8.1%) for men and 55 to 59 Years (621 | 8.0%) for women.
| Age Bracket | Male | Female |
| Under 5 Years | 412 (5.2%) | 360 (4.6%) |
| 5 to 9 Years | 354 (4.4%) | 440 (5.7%) |
| 10 to 14 Years | 567 (7.1%) | 477 (6.2%) |
| 15 to 19 Years | 554 (7.0%) | 482 (6.2%) |
| 20 to 24 Years | 455 (5.7%) | 360 (4.6%) |
| 25 to 29 Years | 376 (4.7%) | 359 (4.6%) |
| 30 to 34 Years | 427 (5.4%) | 426 (5.5%) |
| 35 to 39 Years | 506 (6.4%) | 412 (5.3%) |
| 40 to 44 Years | 443 (5.6%) | 526 (6.8%) |
| 45 to 49 Years | 508 (6.4%) | 463 (6.0%) |
| 50 to 54 Years | 491 (6.2%) | 540 (7.0%) |
| 55 to 59 Years | 642 (8.1%) | 621 (8.0%) |
| 60 to 64 Years | 579 (7.3%) | 531 (6.9%) |
| 65 to 69 Years | 476 (6.0%) | 487 (6.3%) |
| 70 to 74 Years | 494 (6.2%) | 434 (5.6%) |
| 75 to 79 Years | 346 (4.3%) | 369 (4.8%) |
| 80 to 84 Years | 158 (2.0%) | 200 (2.6%) |
| 85 Years and over | 163 (2.1%) | 254 (3.3%) |
| Total | 7,951 (100.0%) | 7,741 (100.0%) |
Families and Households in Mercer County
Median Family Size in Mercer County
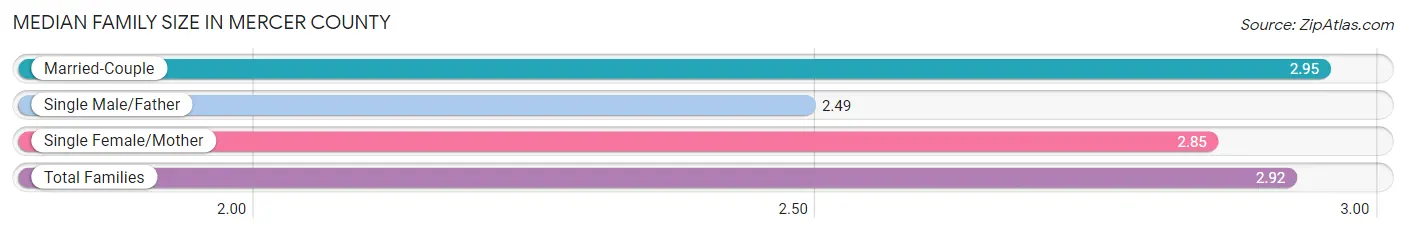
The median family size in Mercer County is 2.92 persons per family, with married-couple families (3,810 | 85.3%) accounting for the largest median family size of 2.95 persons per family. On the other hand, single male/father families (237 | 5.3%) represent the smallest median family size with 2.49 persons per family.
| Family Type | # Families | Family Size |
| Married-Couple | 3,810 (85.3%) | 2.95 |
| Single Male/Father | 237 (5.3%) | 2.49 |
| Single Female/Mother | 420 (9.4%) | 2.85 |
| Total Families | 4,467 (100.0%) | 2.92 |
Median Household Size in Mercer County
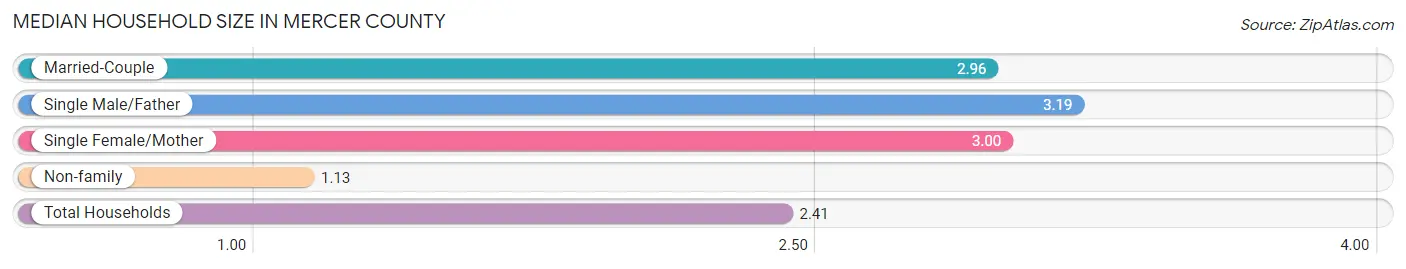
The median household size in Mercer County is 2.41 persons per household, with single male/father households (237 | 3.7%) accounting for the largest median household size of 3.19 persons per household. non-family households (1,968 | 30.6%) represent the smallest median household size with 1.13 persons per household.
| Household Type | # Households | Household Size |
| Married-Couple | 3,810 (59.2%) | 2.96 |
| Single Male/Father | 237 (3.7%) | 3.19 |
| Single Female/Mother | 420 (6.5%) | 3.00 |
| Non-family | 1,968 (30.6%) | 1.13 |
| Total Households | 6,435 (100.0%) | 2.41 |
Household Size by Marriage Status in Mercer County
Out of a total of 6,435 households in Mercer County, 4,467 (69.4%) are family households, while 1,968 (30.6%) are nonfamily households. The most numerous type of family households are 2-person households, comprising 2,278, and the most common type of nonfamily households are 1-person households, comprising 1,749.
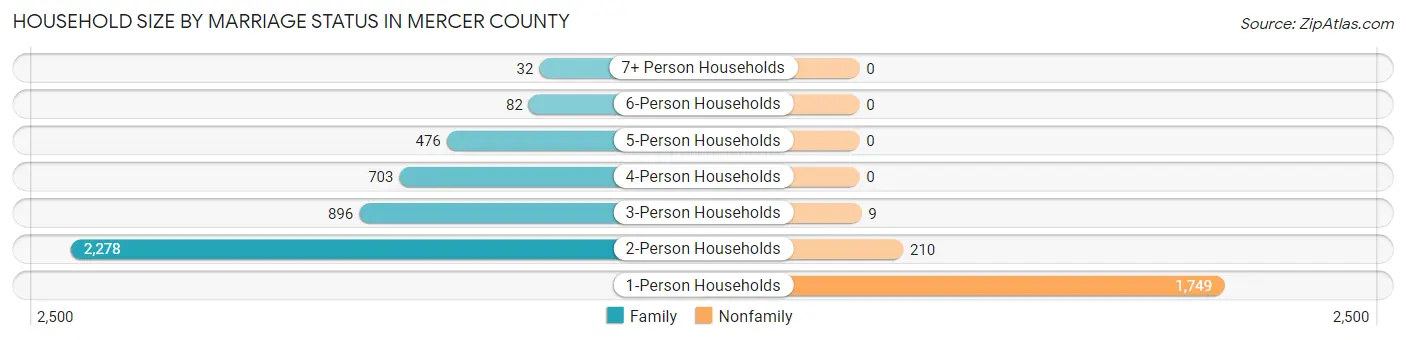
| Household Size | Family Households | Nonfamily Households |
| 1-Person Households | - | 1,749 (27.2%) |
| 2-Person Households | 2,278 (35.4%) | 210 (3.3%) |
| 3-Person Households | 896 (13.9%) | 9 (0.1%) |
| 4-Person Households | 703 (10.9%) | 0 (0.0%) |
| 5-Person Households | 476 (7.4%) | 0 (0.0%) |
| 6-Person Households | 82 (1.3%) | 0 (0.0%) |
| 7+ Person Households | 32 (0.5%) | 0 (0.0%) |
| Total | 4,467 (69.4%) | 1,968 (30.6%) |
Female Fertility in Mercer County
Fertility by Age in Mercer County
Average fertility rate in Mercer County is 41.0 births per 1,000 women. Women in the age bracket of 20 to 34 years have the highest fertility rate with 87.0 births per 1,000 women. Women in the age bracket of 20 to 34 years acount for 75.8% of all women with births.
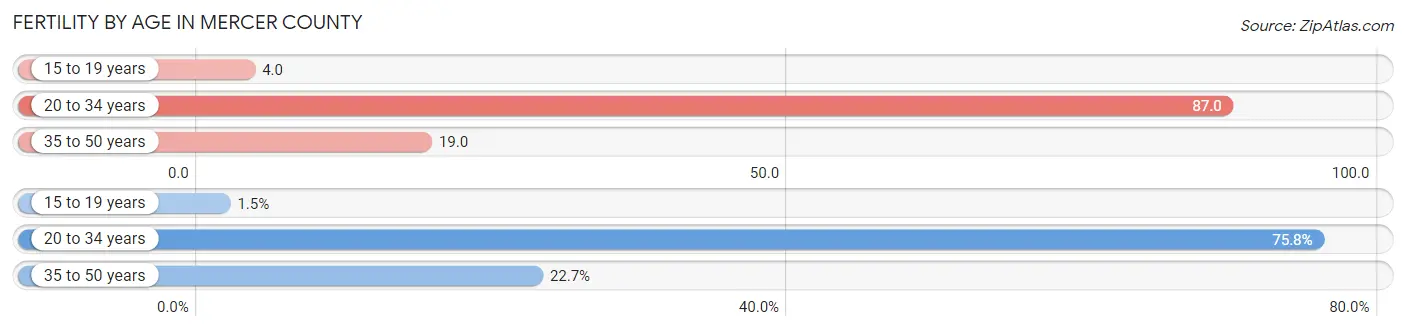
| Age Bracket | Women with Births | Births / 1,000 Women |
| 15 to 19 years | 2 (1.5%) | 4.0 |
| 20 to 34 years | 100 (75.8%) | 87.0 |
| 35 to 50 years | 30 (22.7%) | 19.0 |
| Total | 132 (100.0%) | 41.0 |
Fertility by Age by Marriage Status in Mercer County
54.5% of women with births (132) in Mercer County are married. The highest percentage of unmarried women with births falls into 15 to 19 years age bracket with 100.0% of them unmarried at the time of birth, while the lowest percentage of unmarried women with births belong to 20 to 34 years age bracket with 42.0% of them unmarried.
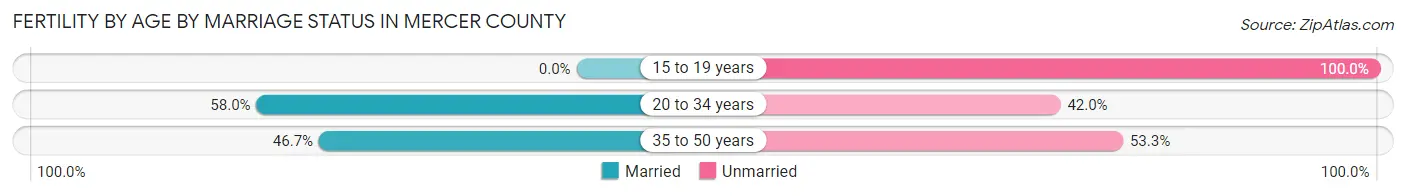
| Age Bracket | Married | Unmarried |
| 15 to 19 years | 0 (0.0%) | 2 (100.0%) |
| 20 to 34 years | 58 (58.0%) | 42 (42.0%) |
| 35 to 50 years | 14 (46.7%) | 16 (53.3%) |
| Total | 72 (54.5%) | 60 (45.5%) |
Fertility by Education in Mercer County
Average fertility rate in Mercer County is 41.0 births per 1,000 women. Women with the education attainment of less than high school have the highest fertility rate of 81.0 births per 1,000 women, while women with the education attainment of bachelor's degree have the lowest fertility at 20.0 births per 1,000 women. Women with the education attainment of college or associate's degree represent 43.2% of all women with births.
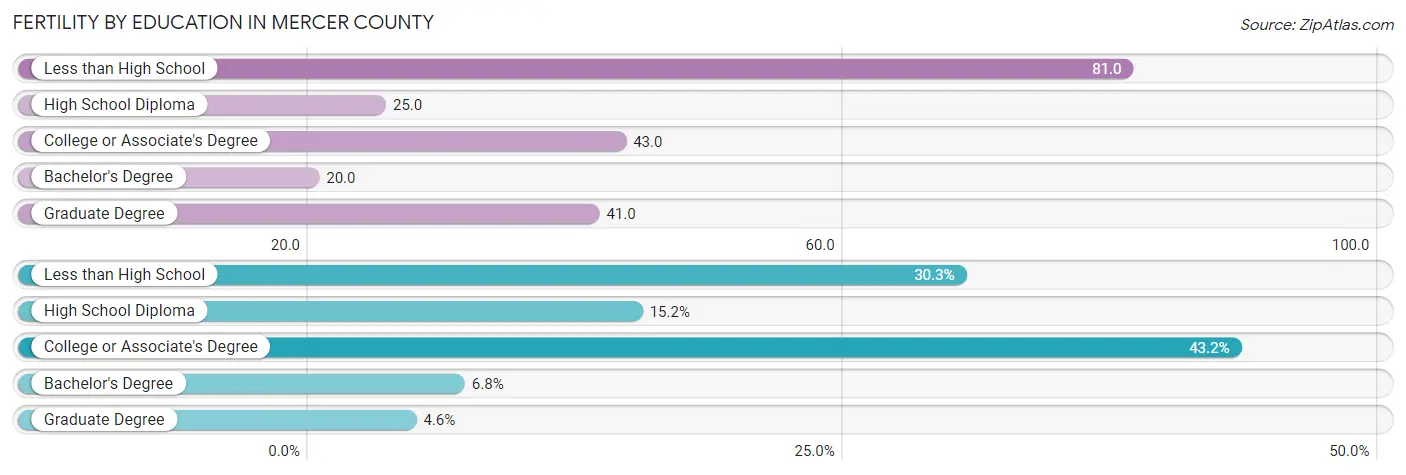
| Educational Attainment | Women with Births | Births / 1,000 Women |
| Less than High School | 40 (30.3%) | 81.0 |
| High School Diploma | 20 (15.1%) | 25.0 |
| College or Associate's Degree | 57 (43.2%) | 43.0 |
| Bachelor's Degree | 9 (6.8%) | 20.0 |
| Graduate Degree | 6 (4.5%) | 41.0 |
| Total | 132 (100.0%) | 41.0 |
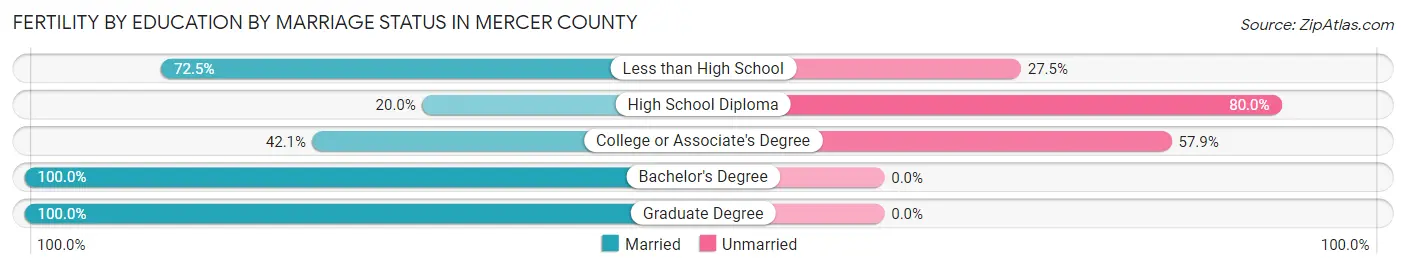
Fertility by Education by Marriage Status in Mercer County
45.5% of women with births in Mercer County are unmarried. Women with the educational attainment of bachelor's degree are most likely to be married with 100.0% of them married at childbirth, while women with the educational attainment of high school diploma are least likely to be married with 80.0% of them unmarried at childbirth.
| Educational Attainment | Married | Unmarried |
| Less than High School | 29 (72.5%) | 11 (27.5%) |
| High School Diploma | 4 (20.0%) | 16 (80.0%) |
| College or Associate's Degree | 24 (42.1%) | 33 (57.9%) |
| Bachelor's Degree | 9 (100.0%) | 0 (0.0%) |
| Graduate Degree | 6 (100.0%) | 0 (0.0%) |
| Total | 72 (54.5%) | 60 (45.5%) |
Employment Characteristics in Mercer County
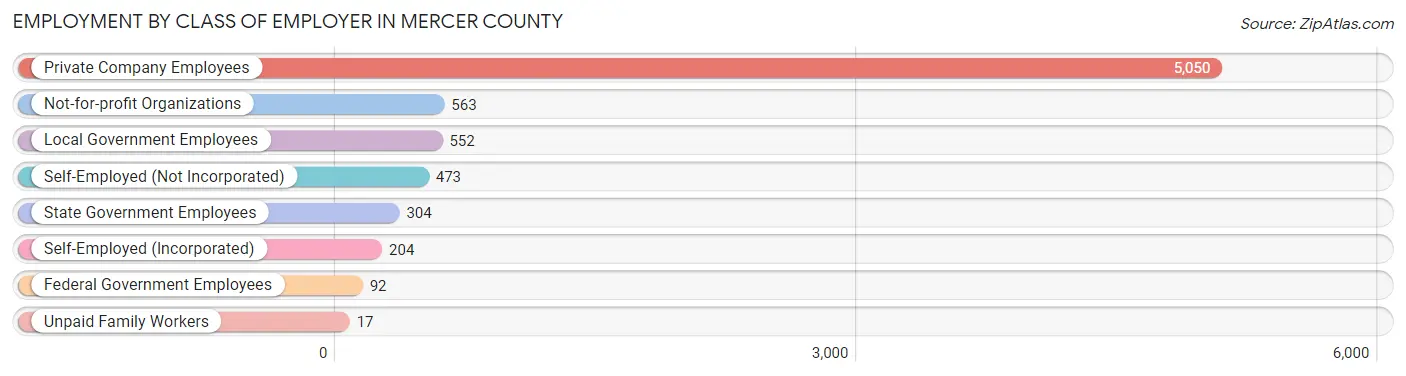
Employment by Class of Employer in Mercer County
Among the 7,255 employed individuals in Mercer County, private company employees (5,050 | 69.6%), not-for-profit organizations (563 | 7.8%), and local government employees (552 | 7.6%) make up the most common classes of employment.
| Employer Class | # Employees | % Employees |
| Private Company Employees | 5,050 | 69.6% |
| Self-Employed (Incorporated) | 204 | 2.8% |
| Self-Employed (Not Incorporated) | 473 | 6.5% |
| Not-for-profit Organizations | 563 | 7.8% |
| Local Government Employees | 552 | 7.6% |
| State Government Employees | 304 | 4.2% |
| Federal Government Employees | 92 | 1.3% |
| Unpaid Family Workers | 17 | 0.2% |
| Total | 7,255 | 100.0% |
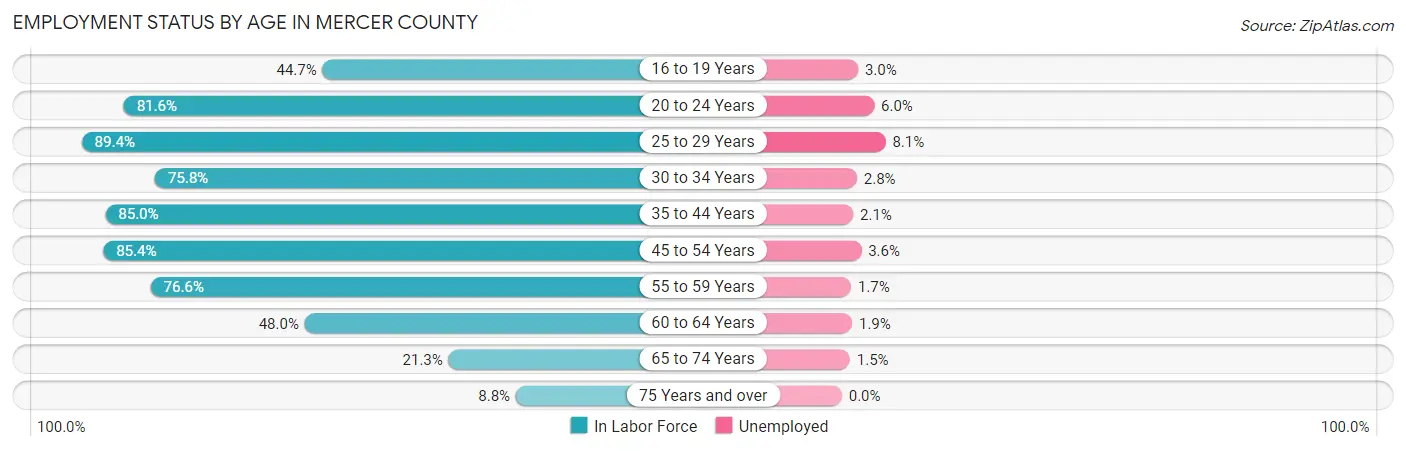
Employment Status by Age in Mercer County
According to the labor force statistics for Mercer County, out of the total population over 16 years of age (12,780), 59.8% or 7,642 individuals are in the labor force, with 3.3% or 252 of them unemployed. The age group with the highest labor force participation rate is 25 to 29 years, with 89.4% or 657 individuals in the labor force. Within the labor force, the 25 to 29 years age range has the highest percentage of unemployed individuals, with 8.1% or 53 of them being unemployed.
| Age Bracket | In Labor Force | Unemployed |
| 16 to 19 Years | 328 (44.7%) | 10 (3.0%) |
| 20 to 24 Years | 665 (81.6%) | 40 (6.0%) |
| 25 to 29 Years | 657 (89.4%) | 53 (8.1%) |
| 30 to 34 Years | 647 (75.8%) | 18 (2.8%) |
| 35 to 44 Years | 1,604 (85.0%) | 34 (2.1%) |
| 45 to 54 Years | 1,710 (85.4%) | 62 (3.6%) |
| 55 to 59 Years | 967 (76.6%) | 16 (1.7%) |
| 60 to 64 Years | 533 (48.0%) | 10 (1.9%) |
| 65 to 74 Years | 403 (21.3%) | 6 (1.5%) |
| 75 Years and over | 131 (8.8%) | 0 (0.0%) |
| Total | 7,642 (59.8%) | 252 (3.3%) |
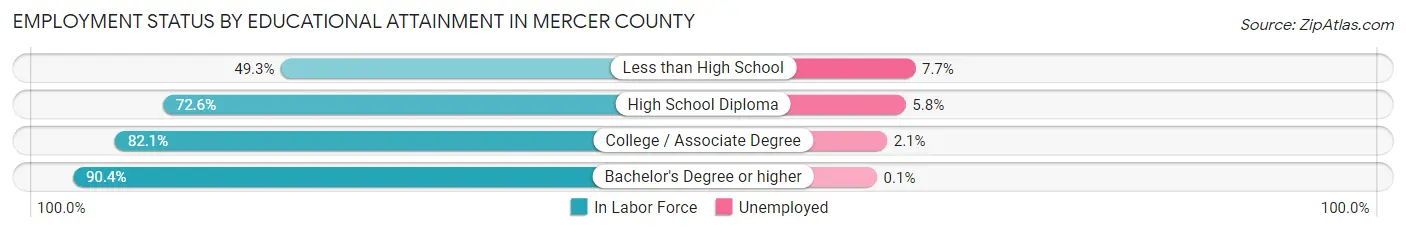
Employment Status by Educational Attainment in Mercer County
According to labor force statistics for Mercer County, 77.9% of individuals (6,115) out of the total population between 25 and 64 years of age (7,850) are in the labor force, with 3.2% or 196 of them being unemployed. The group with the highest labor force participation rate are those with the educational attainment of bachelor's degree or higher, with 90.4% or 1,378 individuals in the labor force. Within the labor force, individuals with less than high school education have the highest percentage of unemployment, with 7.7% or 20 of them being unemployed.
| Educational Attainment | In Labor Force | Unemployed |
| Less than High School | 261 (49.3%) | 41 (7.7%) |
| High School Diploma | 2,131 (72.6%) | 170 (5.8%) |
| College / Associate Degree | 2,350 (82.1%) | 60 (2.1%) |
| Bachelor's Degree or higher | 1,378 (90.4%) | 2 (0.1%) |
| Total | 6,115 (77.9%) | 251 (3.2%) |
Employment Occupations by Sex in Mercer County
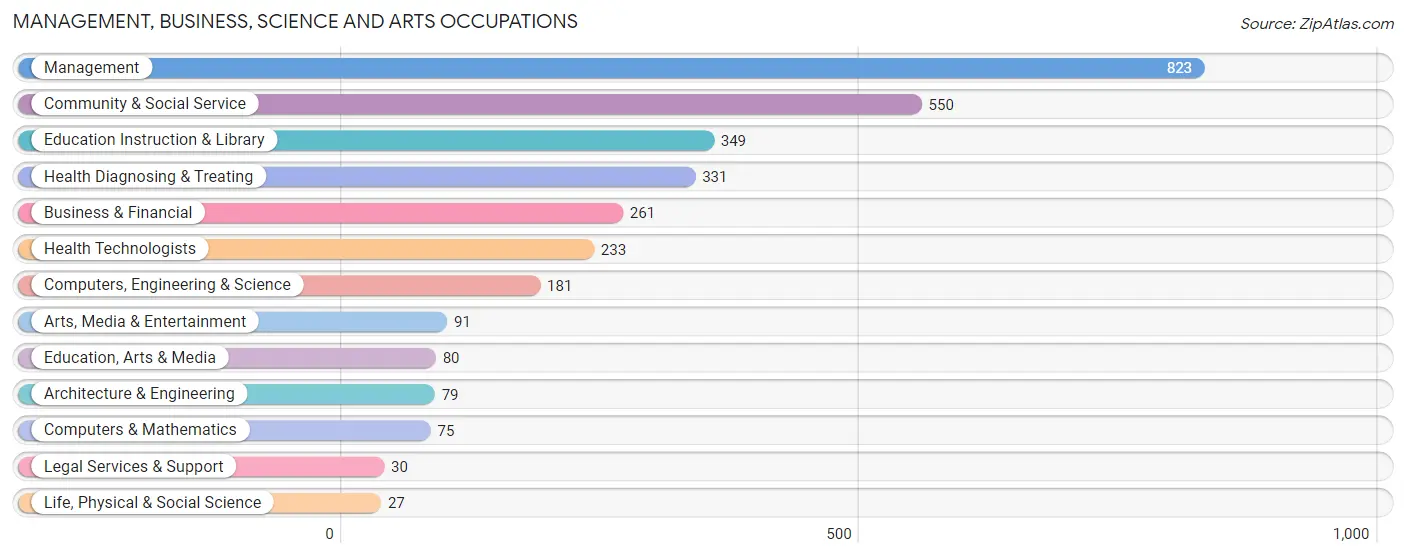
Management, Business, Science and Arts Occupations
The most common Management, Business, Science and Arts occupations in Mercer County are Management (823 | 11.2%), Community & Social Service (550 | 7.4%), Education Instruction & Library (349 | 4.7%), Health Diagnosing & Treating (331 | 4.5%), and Business & Financial (261 | 3.5%).
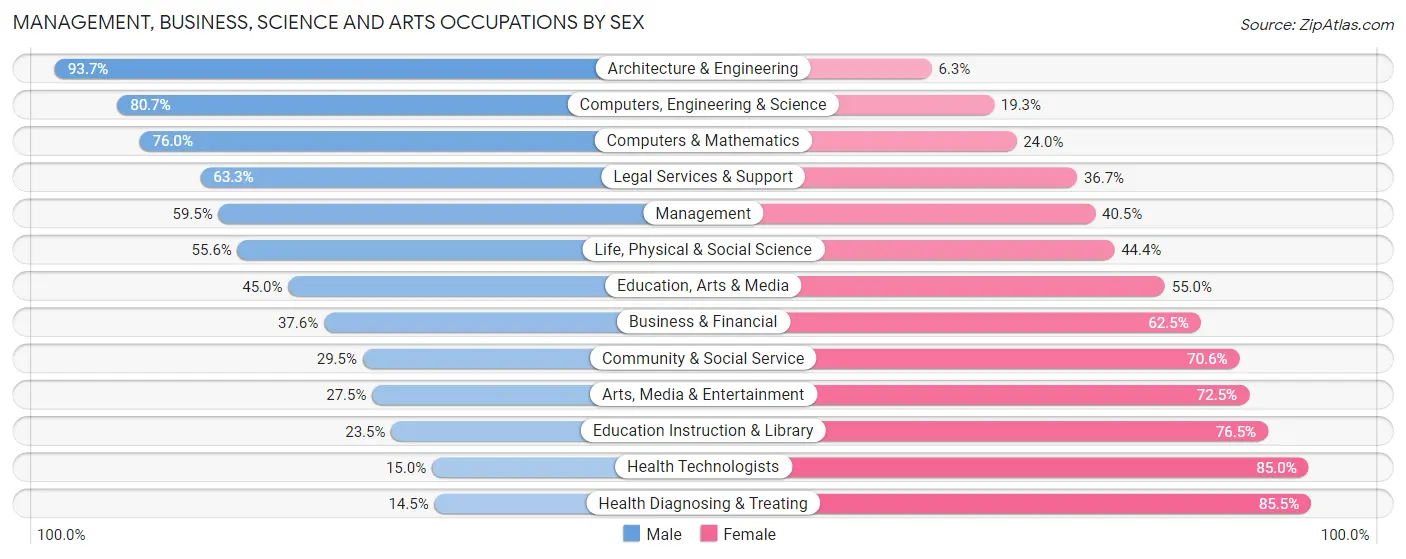
Management, Business, Science and Arts Occupations by Sex
Within the Management, Business, Science and Arts occupations in Mercer County, the most male-oriented occupations are Architecture & Engineering (93.7%), Computers, Engineering & Science (80.7%), and Computers & Mathematics (76.0%), while the most female-oriented occupations are Health Diagnosing & Treating (85.5%), Health Technologists (85.0%), and Education Instruction & Library (76.5%).
| Occupation | Male | Female |
| Management | 490 (59.5%) | 333 (40.5%) |
| Business & Financial | 98 (37.6%) | 163 (62.5%) |
| Computers, Engineering & Science | 146 (80.7%) | 35 (19.3%) |
| Computers & Mathematics | 57 (76.0%) | 18 (24.0%) |
| Architecture & Engineering | 74 (93.7%) | 5 (6.3%) |
| Life, Physical & Social Science | 15 (55.6%) | 12 (44.4%) |
| Community & Social Service | 162 (29.4%) | 388 (70.6%) |
| Education, Arts & Media | 36 (45.0%) | 44 (55.0%) |
| Legal Services & Support | 19 (63.3%) | 11 (36.7%) |
| Education Instruction & Library | 82 (23.5%) | 267 (76.5%) |
| Arts, Media & Entertainment | 25 (27.5%) | 66 (72.5%) |
| Health Diagnosing & Treating | 48 (14.5%) | 283 (85.5%) |
| Health Technologists | 35 (15.0%) | 198 (85.0%) |
| Total (Category) | 944 (44.0%) | 1,202 (56.0%) |
| Total (Overall) | 3,892 (52.7%) | 3,490 (47.3%) |
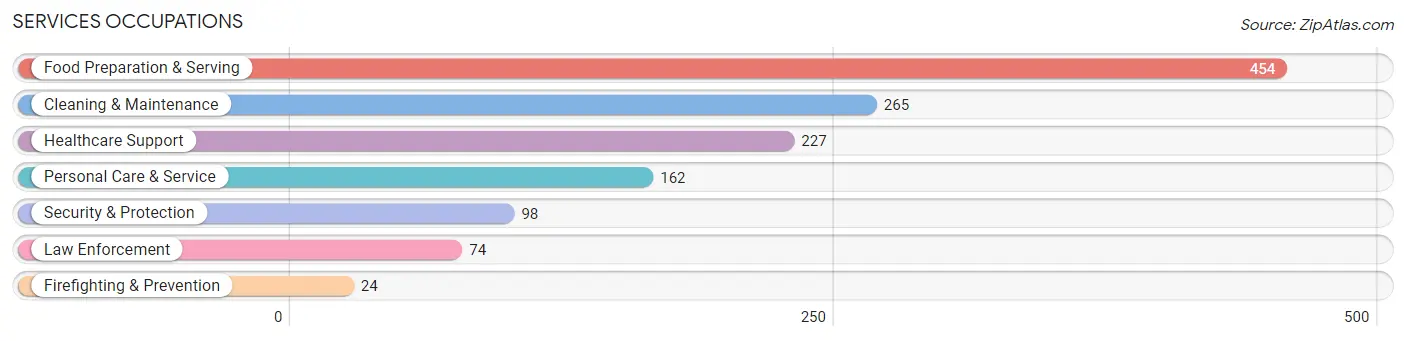
Services Occupations
The most common Services occupations in Mercer County are Food Preparation & Serving (454 | 6.1%), Cleaning & Maintenance (265 | 3.6%), Healthcare Support (227 | 3.1%), Personal Care & Service (162 | 2.2%), and Security & Protection (98 | 1.3%).
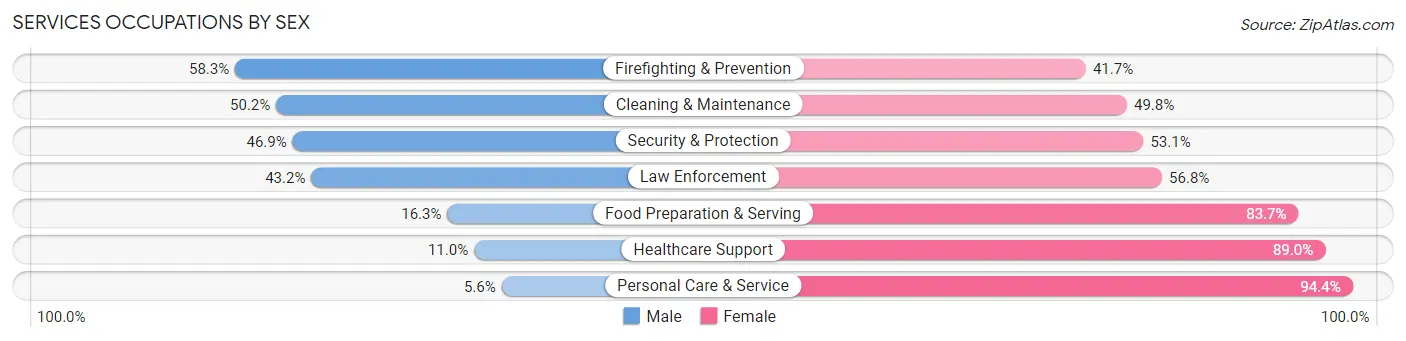
Services Occupations by Sex
Within the Services occupations in Mercer County, the most male-oriented occupations are Firefighting & Prevention (58.3%), Cleaning & Maintenance (50.2%), and Security & Protection (46.9%), while the most female-oriented occupations are Personal Care & Service (94.4%), Healthcare Support (89.0%), and Food Preparation & Serving (83.7%).
| Occupation | Male | Female |
| Healthcare Support | 25 (11.0%) | 202 (89.0%) |
| Security & Protection | 46 (46.9%) | 52 (53.1%) |
| Firefighting & Prevention | 14 (58.3%) | 10 (41.7%) |
| Law Enforcement | 32 (43.2%) | 42 (56.8%) |
| Food Preparation & Serving | 74 (16.3%) | 380 (83.7%) |
| Cleaning & Maintenance | 133 (50.2%) | 132 (49.8%) |
| Personal Care & Service | 9 (5.6%) | 153 (94.4%) |
| Total (Category) | 287 (23.8%) | 919 (76.2%) |
| Total (Overall) | 3,892 (52.7%) | 3,490 (47.3%) |
Sales and Office Occupations
The most common Sales and Office occupations in Mercer County are Office & Administration (957 | 13.0%), and Sales & Related (672 | 9.1%).
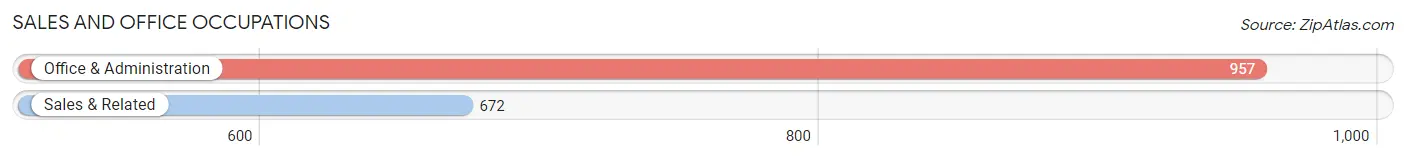
Sales and Office Occupations by Sex

| Occupation | Male | Female |
| Sales & Related | 397 (59.1%) | 275 (40.9%) |
| Office & Administration | 136 (14.2%) | 821 (85.8%) |
| Total (Category) | 533 (32.7%) | 1,096 (67.3%) |
| Total (Overall) | 3,892 (52.7%) | 3,490 (47.3%) |
Natural Resources, Construction and Maintenance Occupations
The most common Natural Resources, Construction and Maintenance occupations in Mercer County are Construction & Extraction (692 | 9.4%), Installation, Maintenance & Repair (308 | 4.2%), and Farming, Fishing & Forestry (137 | 1.9%).
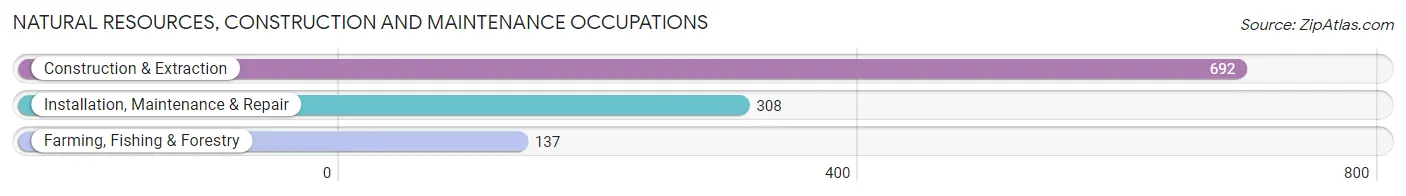
Natural Resources, Construction and Maintenance Occupations by Sex
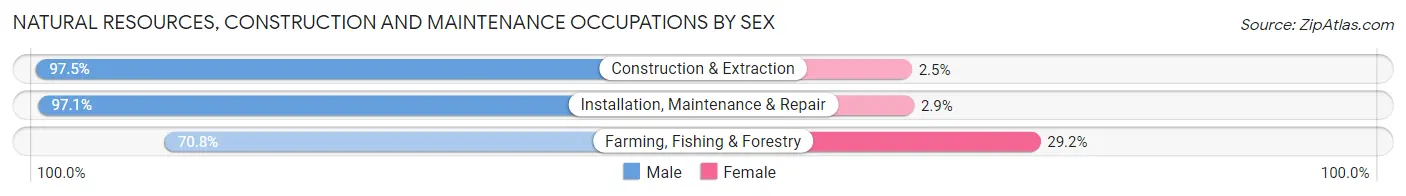
| Occupation | Male | Female |
| Farming, Fishing & Forestry | 97 (70.8%) | 40 (29.2%) |
| Construction & Extraction | 675 (97.5%) | 17 (2.5%) |
| Installation, Maintenance & Repair | 299 (97.1%) | 9 (2.9%) |
| Total (Category) | 1,071 (94.2%) | 66 (5.8%) |
| Total (Overall) | 3,892 (52.7%) | 3,490 (47.3%) |
Production, Transportation and Moving Occupations
The most common Production, Transportation and Moving occupations in Mercer County are Production (533 | 7.2%), Material Moving (400 | 5.4%), and Transportation (331 | 4.5%).
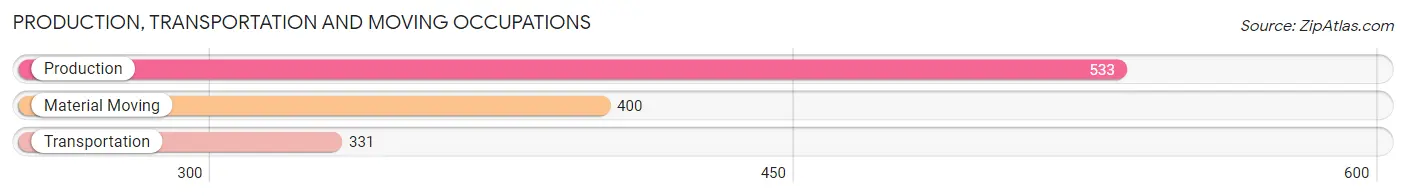
Production, Transportation and Moving Occupations by Sex
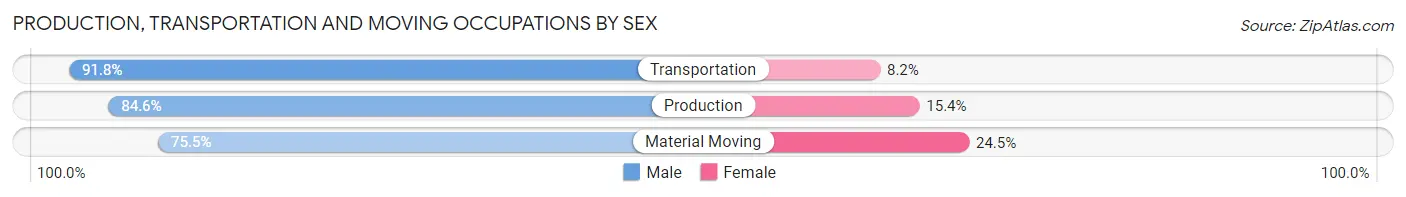
| Occupation | Male | Female |
| Production | 451 (84.6%) | 82 (15.4%) |
| Transportation | 304 (91.8%) | 27 (8.2%) |
| Material Moving | 302 (75.5%) | 98 (24.5%) |
| Total (Category) | 1,057 (83.6%) | 207 (16.4%) |
| Total (Overall) | 3,892 (52.7%) | 3,490 (47.3%) |
Employment Industries by Sex in Mercer County
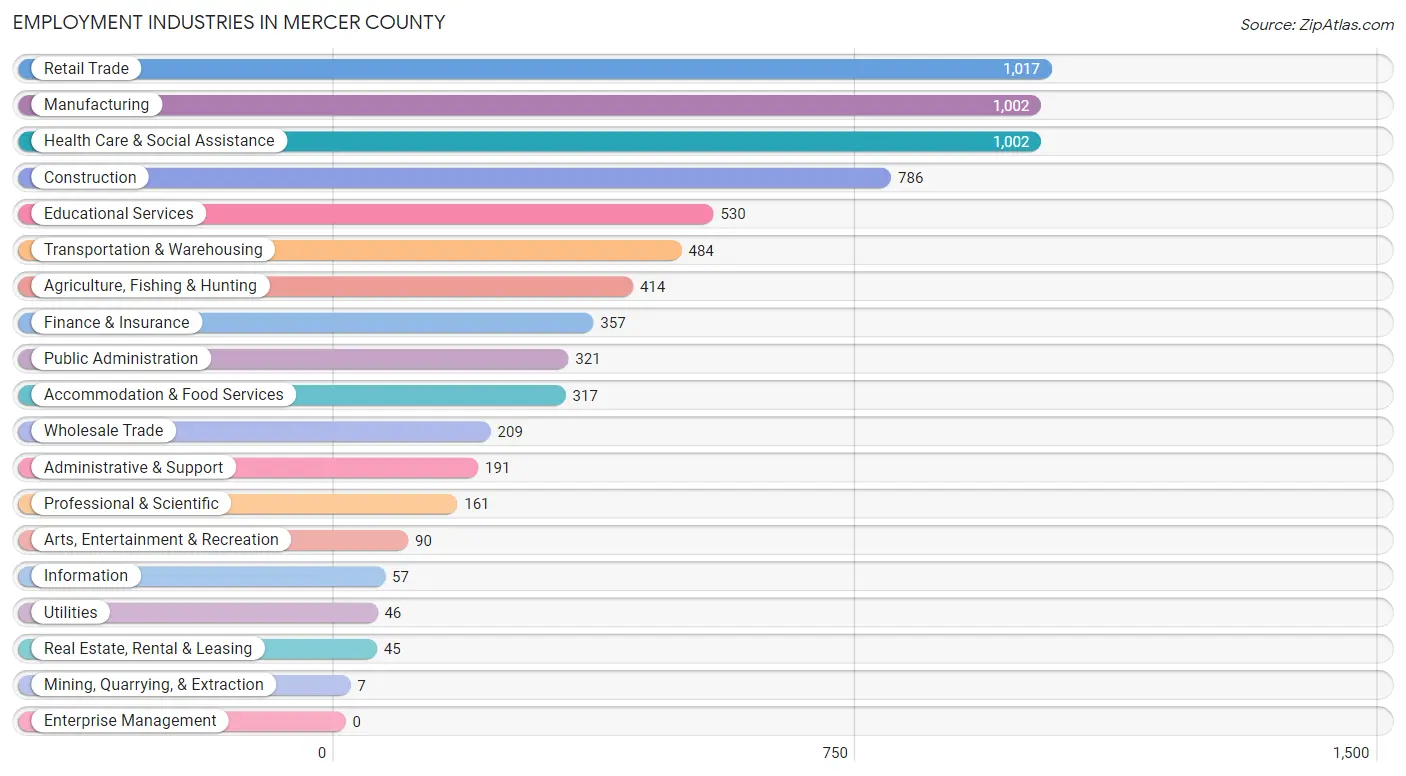
Employment Industries in Mercer County
The major employment industries in Mercer County include Retail Trade (1,017 | 13.8%), Manufacturing (1,002 | 13.6%), Health Care & Social Assistance (1,002 | 13.6%), Construction (786 | 10.6%), and Educational Services (530 | 7.2%).
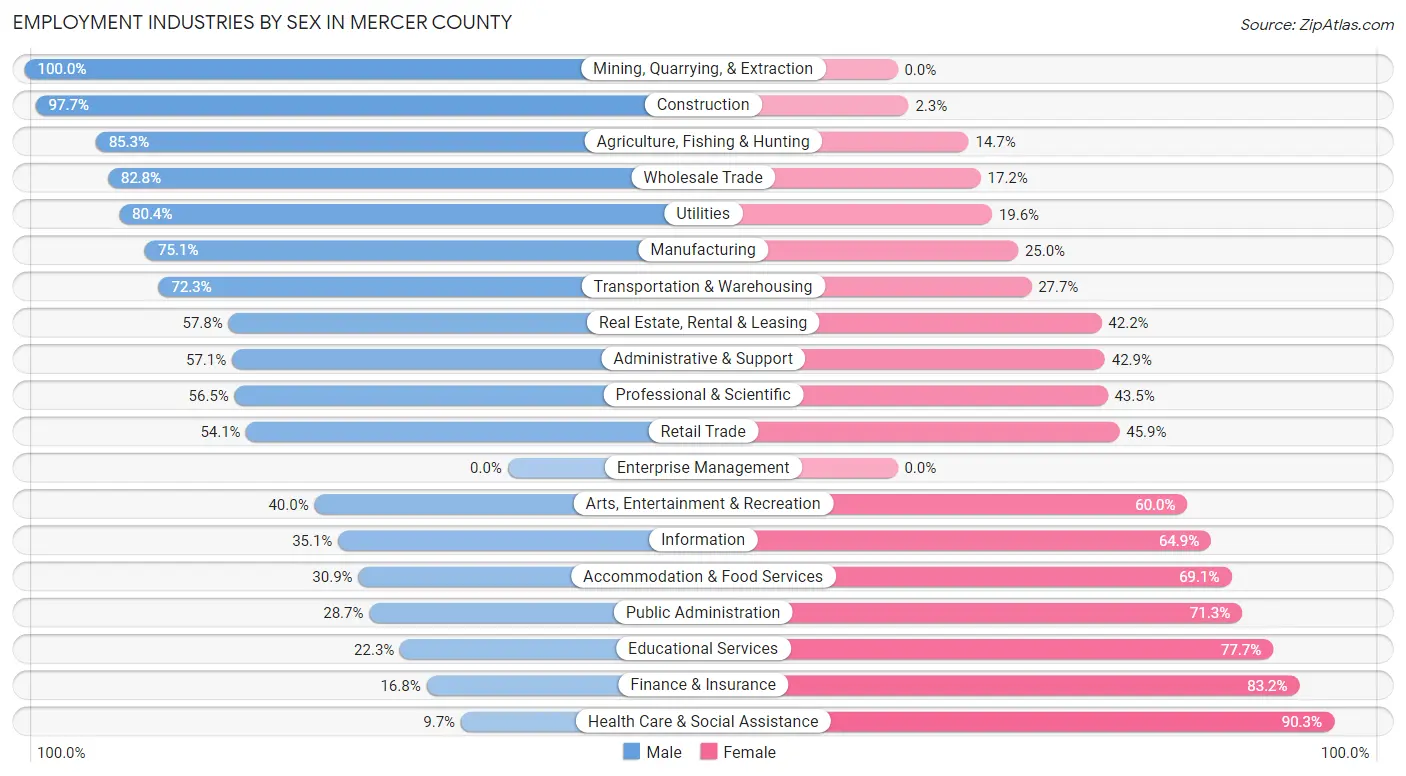
Employment Industries by Sex in Mercer County
The Mercer County industries that see more men than women are Mining, Quarrying, & Extraction (100.0%), Construction (97.7%), and Agriculture, Fishing & Hunting (85.3%), whereas the industries that tend to have a higher number of women are Health Care & Social Assistance (90.3%), Finance & Insurance (83.2%), and Educational Services (77.7%).
| Industry | Male | Female |
| Agriculture, Fishing & Hunting | 353 (85.3%) | 61 (14.7%) |
| Mining, Quarrying, & Extraction | 7 (100.0%) | 0 (0.0%) |
| Construction | 768 (97.7%) | 18 (2.3%) |
| Manufacturing | 752 (75.0%) | 250 (24.9%) |
| Wholesale Trade | 173 (82.8%) | 36 (17.2%) |
| Retail Trade | 550 (54.1%) | 467 (45.9%) |
| Transportation & Warehousing | 350 (72.3%) | 134 (27.7%) |
| Utilities | 37 (80.4%) | 9 (19.6%) |
| Information | 20 (35.1%) | 37 (64.9%) |
| Finance & Insurance | 60 (16.8%) | 297 (83.2%) |
| Real Estate, Rental & Leasing | 26 (57.8%) | 19 (42.2%) |
| Professional & Scientific | 91 (56.5%) | 70 (43.5%) |
| Enterprise Management | 0 (0.0%) | 0 (0.0%) |
| Administrative & Support | 109 (57.1%) | 82 (42.9%) |
| Educational Services | 118 (22.3%) | 412 (77.7%) |
| Health Care & Social Assistance | 97 (9.7%) | 905 (90.3%) |
| Arts, Entertainment & Recreation | 36 (40.0%) | 54 (60.0%) |
| Accommodation & Food Services | 98 (30.9%) | 219 (69.1%) |
| Public Administration | 92 (28.7%) | 229 (71.3%) |
| Total | 3,892 (52.7%) | 3,490 (47.3%) |
Education in Mercer County
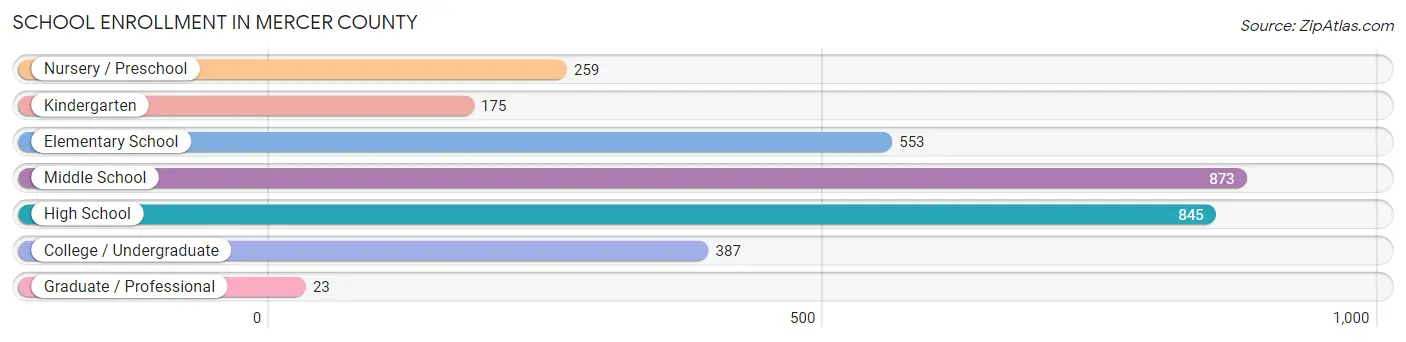
School Enrollment in Mercer County
The most common levels of schooling among the 3,115 students in Mercer County are middle school (873 | 28.0%), high school (845 | 27.1%), and elementary school (553 | 17.7%).
| School Level | # Students | % Students |
| Nursery / Preschool | 259 | 8.3% |
| Kindergarten | 175 | 5.6% |
| Elementary School | 553 | 17.7% |
| Middle School | 873 | 28.0% |
| High School | 845 | 27.1% |
| College / Undergraduate | 387 | 12.4% |
| Graduate / Professional | 23 | 0.7% |
| Total | 3,115 | 100.0% |
School Enrollment by Age by Funding Source in Mercer County
Out of a total of 3,115 students who are enrolled in schools in Mercer County, 386 (12.4%) attend a private institution, while the remaining 2,729 (87.6%) are enrolled in public schools. The age group of 20 to 24 year olds has the highest likelihood of being enrolled in private schools, with 58 (26.2% in the age bracket) enrolled. Conversely, the age group of 25 to 34 year olds has the lowest likelihood of being enrolled in a private school, with 50 (94.3% in the age bracket) attending a public institution.
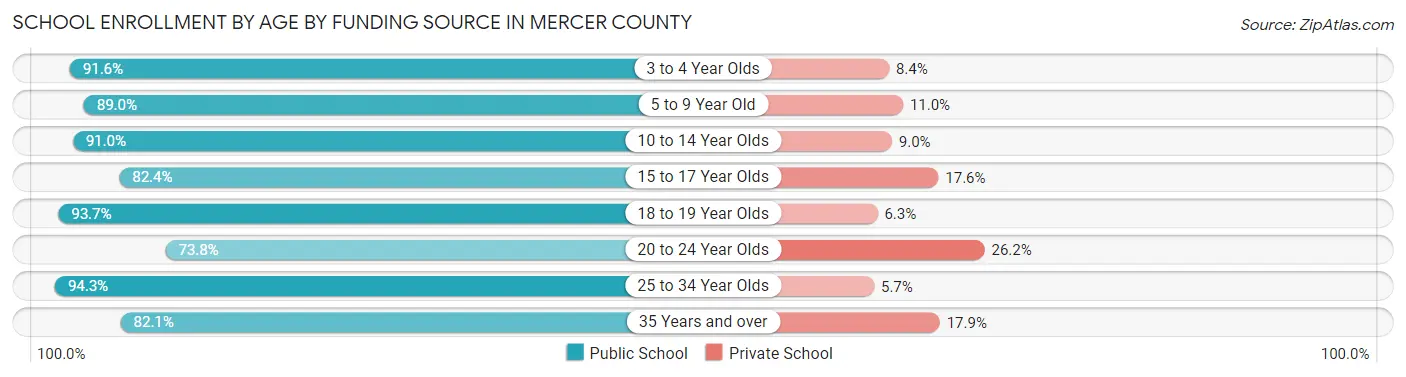
| Age Bracket | Public School | Private School |
| 3 to 4 Year Olds | 141 (91.6%) | 13 (8.4%) |
| 5 to 9 Year Old | 693 (89.0%) | 86 (11.0%) |
| 10 to 14 Year Olds | 944 (91.0%) | 93 (9.0%) |
| 15 to 17 Year Olds | 495 (82.4%) | 106 (17.6%) |
| 18 to 19 Year Olds | 164 (93.7%) | 11 (6.3%) |
| 20 to 24 Year Olds | 163 (73.8%) | 58 (26.2%) |
| 25 to 34 Year Olds | 50 (94.3%) | 3 (5.7%) |
| 35 Years and over | 78 (82.1%) | 17 (17.9%) |
| Total | 2,729 (87.6%) | 386 (12.4%) |
Educational Attainment by Field of Study in Mercer County
Education (420 | 19.8%), business (358 | 16.9%), science & technology (321 | 15.1%), bio, nature & agricultural (289 | 13.6%), and arts & humanities (114 | 5.4%) are the most common fields of study among 2,124 individuals in Mercer County who have obtained a bachelor's degree or higher.
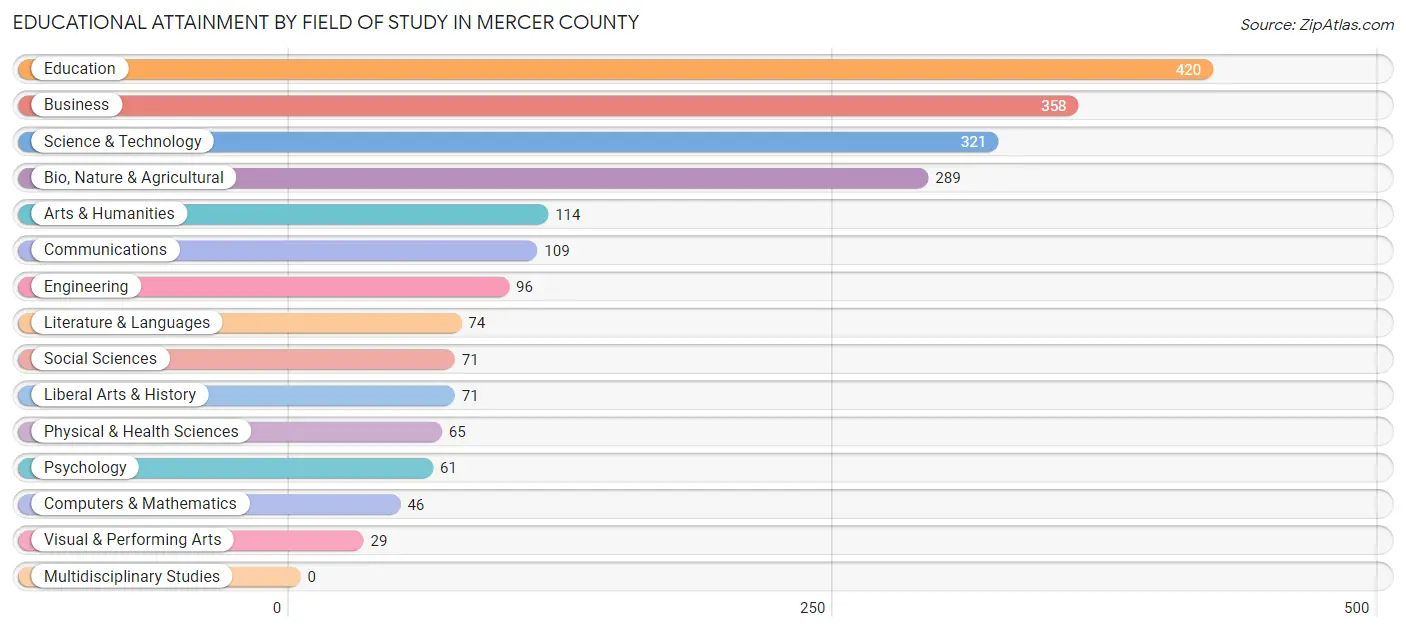
| Field of Study | # Graduates | % Graduates |
| Computers & Mathematics | 46 | 2.2% |
| Bio, Nature & Agricultural | 289 | 13.6% |
| Physical & Health Sciences | 65 | 3.1% |
| Psychology | 61 | 2.9% |
| Social Sciences | 71 | 3.3% |
| Engineering | 96 | 4.5% |
| Multidisciplinary Studies | 0 | 0.0% |
| Science & Technology | 321 | 15.1% |
| Business | 358 | 16.9% |
| Education | 420 | 19.8% |
| Literature & Languages | 74 | 3.5% |
| Liberal Arts & History | 71 | 3.3% |
| Visual & Performing Arts | 29 | 1.4% |
| Communications | 109 | 5.1% |
| Arts & Humanities | 114 | 5.4% |
| Total | 2,124 | 100.0% |
Transportation & Commute in Mercer County
Vehicle Availability by Sex in Mercer County
The most prevalent vehicle ownership categories in Mercer County are males with 2 vehicles (1,535, accounting for 40.4%) and females with 2 vehicles (1,322, making up 44.5%).
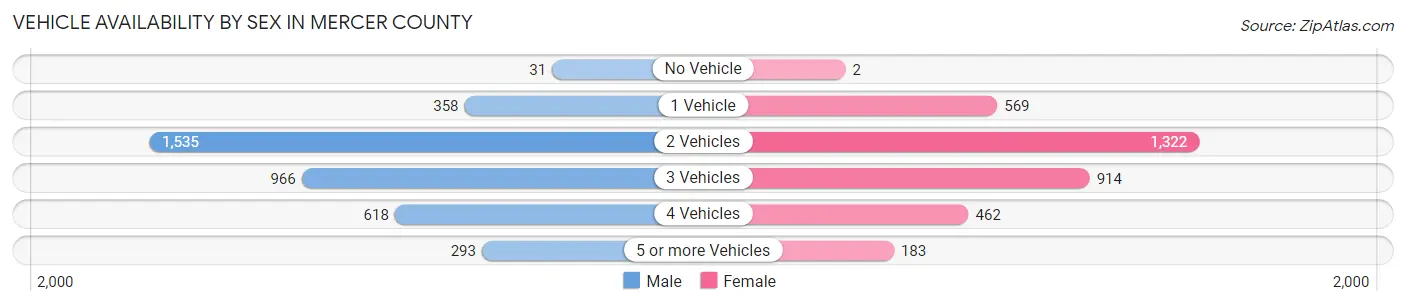
| Vehicles Available | Male | Female |
| No Vehicle | 31 (0.8%) | 2 (0.1%) |
| 1 Vehicle | 358 (9.4%) | 569 (16.5%) |
| 2 Vehicles | 1,535 (40.4%) | 1,322 (38.3%) |
| 3 Vehicles | 966 (25.4%) | 914 (26.5%) |
| 4 Vehicles | 618 (16.3%) | 462 (13.4%) |
| 5 or more Vehicles | 293 (7.7%) | 183 (5.3%) |
| Total | 3,801 (100.0%) | 3,452 (100.0%) |
Commute Time in Mercer County
The most frequently occuring commute durations in Mercer County are 45 to 59 minutes (985 commuters, 14.6%), 30 to 34 minutes (918 commuters, 13.6%), and 5 to 9 minutes (774 commuters, 11.5%).
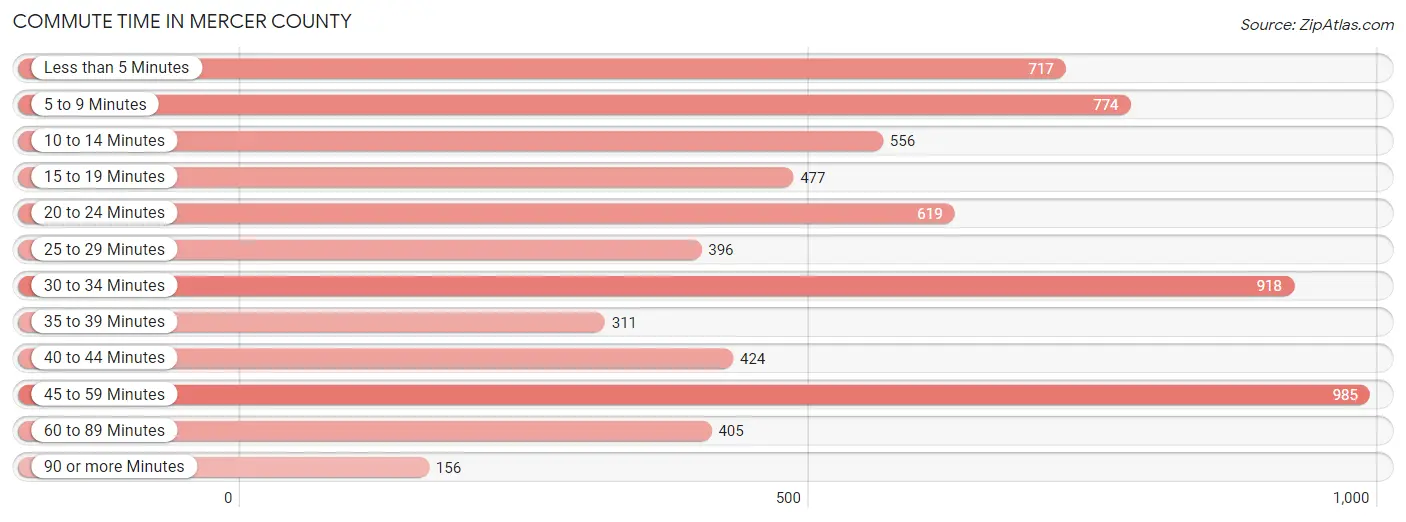
| Commute Time | # Commuters | % Commuters |
| Less than 5 Minutes | 717 | 10.6% |
| 5 to 9 Minutes | 774 | 11.5% |
| 10 to 14 Minutes | 556 | 8.3% |
| 15 to 19 Minutes | 477 | 7.1% |
| 20 to 24 Minutes | 619 | 9.2% |
| 25 to 29 Minutes | 396 | 5.9% |
| 30 to 34 Minutes | 918 | 13.6% |
| 35 to 39 Minutes | 311 | 4.6% |
| 40 to 44 Minutes | 424 | 6.3% |
| 45 to 59 Minutes | 985 | 14.6% |
| 60 to 89 Minutes | 405 | 6.0% |
| 90 or more Minutes | 156 | 2.3% |
Commute Time by Sex in Mercer County
The most common commute times in Mercer County are 45 to 59 minutes (589 commuters, 16.7%) for males and less than 5 minutes (413 commuters, 12.9%) for females.
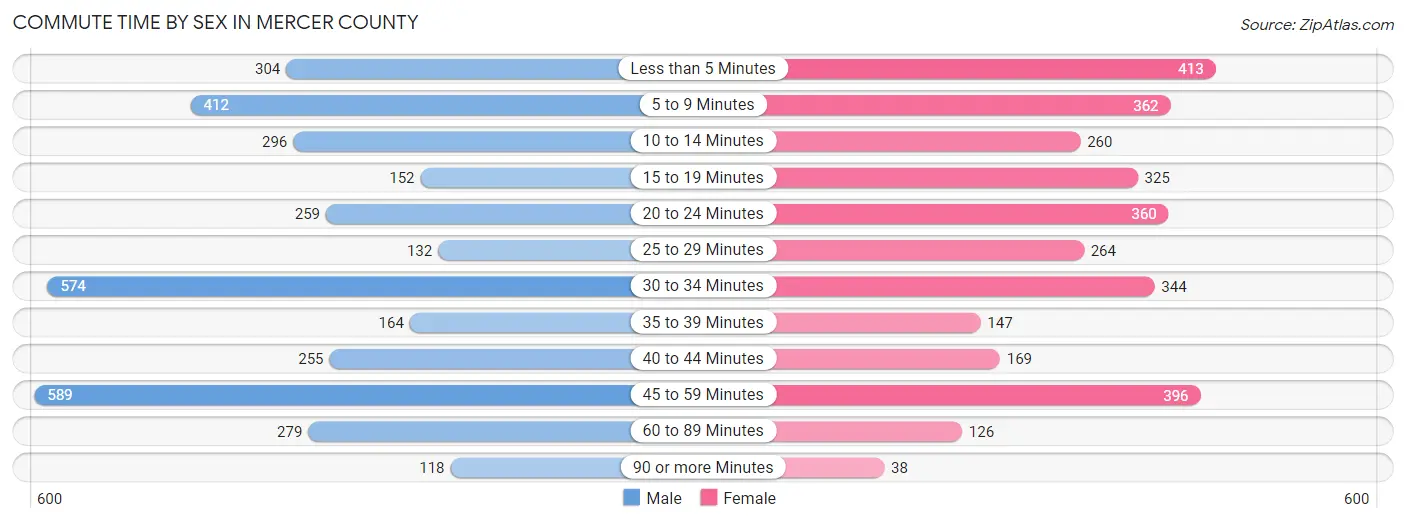
| Commute Time | Male | Female |
| Less than 5 Minutes | 304 (8.6%) | 413 (12.9%) |
| 5 to 9 Minutes | 412 (11.7%) | 362 (11.3%) |
| 10 to 14 Minutes | 296 (8.4%) | 260 (8.1%) |
| 15 to 19 Minutes | 152 (4.3%) | 325 (10.1%) |
| 20 to 24 Minutes | 259 (7.3%) | 360 (11.2%) |
| 25 to 29 Minutes | 132 (3.7%) | 264 (8.2%) |
| 30 to 34 Minutes | 574 (16.2%) | 344 (10.7%) |
| 35 to 39 Minutes | 164 (4.6%) | 147 (4.6%) |
| 40 to 44 Minutes | 255 (7.2%) | 169 (5.3%) |
| 45 to 59 Minutes | 589 (16.7%) | 396 (12.4%) |
| 60 to 89 Minutes | 279 (7.9%) | 126 (3.9%) |
| 90 or more Minutes | 118 (3.3%) | 38 (1.2%) |
Time of Departure to Work by Sex in Mercer County
The most frequent times of departure to work in Mercer County are 5:30 AM to 5:59 AM (509, 14.4%) for males and 7:00 AM to 7:29 AM (559, 17.4%) for females.
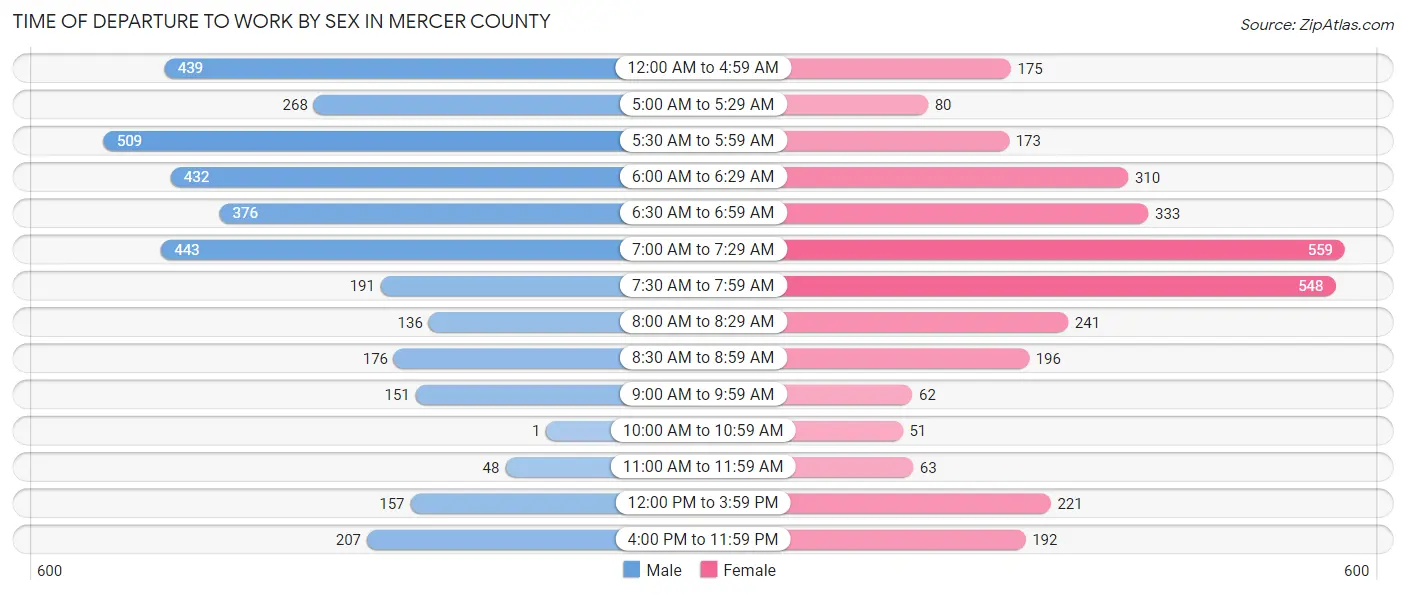
| Time of Departure | Male | Female |
| 12:00 AM to 4:59 AM | 439 (12.4%) | 175 (5.5%) |
| 5:00 AM to 5:29 AM | 268 (7.6%) | 80 (2.5%) |
| 5:30 AM to 5:59 AM | 509 (14.4%) | 173 (5.4%) |
| 6:00 AM to 6:29 AM | 432 (12.2%) | 310 (9.7%) |
| 6:30 AM to 6:59 AM | 376 (10.6%) | 333 (10.4%) |
| 7:00 AM to 7:29 AM | 443 (12.5%) | 559 (17.4%) |
| 7:30 AM to 7:59 AM | 191 (5.4%) | 548 (17.1%) |
| 8:00 AM to 8:29 AM | 136 (3.8%) | 241 (7.5%) |
| 8:30 AM to 8:59 AM | 176 (5.0%) | 196 (6.1%) |
| 9:00 AM to 9:59 AM | 151 (4.3%) | 62 (1.9%) |
| 10:00 AM to 10:59 AM | 1 (0.0%) | 51 (1.6%) |
| 11:00 AM to 11:59 AM | 48 (1.4%) | 63 (2.0%) |
| 12:00 PM to 3:59 PM | 157 (4.4%) | 221 (6.9%) |
| 4:00 PM to 11:59 PM | 207 (5.9%) | 192 (6.0%) |
| Total | 3,534 (100.0%) | 3,204 (100.0%) |
Housing Occupancy in Mercer County
Occupancy by Ownership in Mercer County
Of the total 6,435 dwellings in Mercer County, owner-occupied units account for 5,115 (79.5%), while renter-occupied units make up 1,320 (20.5%).
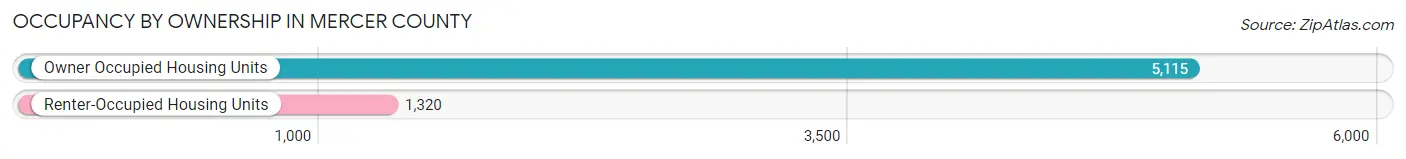
| Occupancy | # Housing Units | % Housing Units |
| Owner Occupied Housing Units | 5,115 | 79.5% |
| Renter-Occupied Housing Units | 1,320 | 20.5% |
| Total Occupied Housing Units | 6,435 | 100.0% |
Occupancy by Household Size in Mercer County
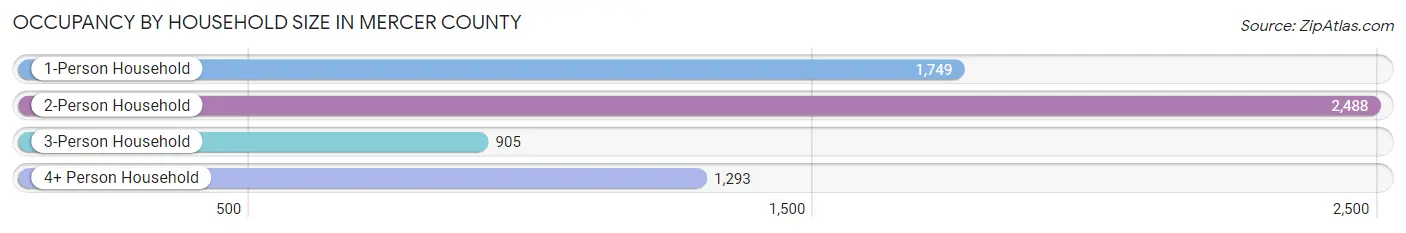
| Household Size | # Housing Units | % Housing Units |
| 1-Person Household | 1,749 | 27.2% |
| 2-Person Household | 2,488 | 38.7% |
| 3-Person Household | 905 | 14.1% |
| 4+ Person Household | 1,293 | 20.1% |
| Total Housing Units | 6,435 | 100.0% |
Occupancy by Ownership by Household Size in Mercer County
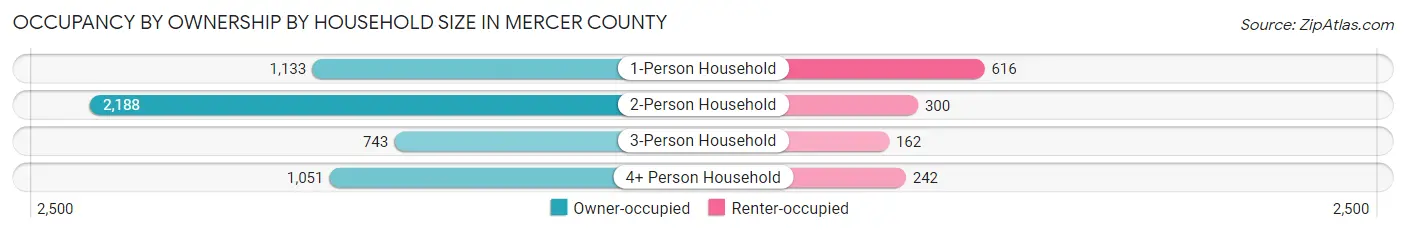
| Household Size | Owner-occupied | Renter-occupied |
| 1-Person Household | 1,133 (64.8%) | 616 (35.2%) |
| 2-Person Household | 2,188 (87.9%) | 300 (12.1%) |
| 3-Person Household | 743 (82.1%) | 162 (17.9%) |
| 4+ Person Household | 1,051 (81.3%) | 242 (18.7%) |
| Total Housing Units | 5,115 (79.5%) | 1,320 (20.5%) |
Occupancy by Educational Attainment in Mercer County
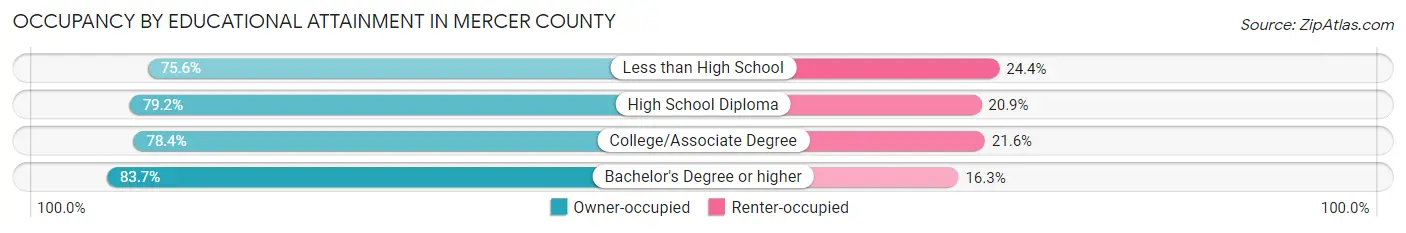
| Household Size | Owner-occupied | Renter-occupied |
| Less than High School | 350 (75.6%) | 113 (24.4%) |
| High School Diploma | 1,864 (79.1%) | 491 (20.8%) |
| College/Associate Degree | 1,881 (78.4%) | 517 (21.6%) |
| Bachelor's Degree or higher | 1,020 (83.7%) | 199 (16.3%) |
Occupancy by Age of Householder in Mercer County
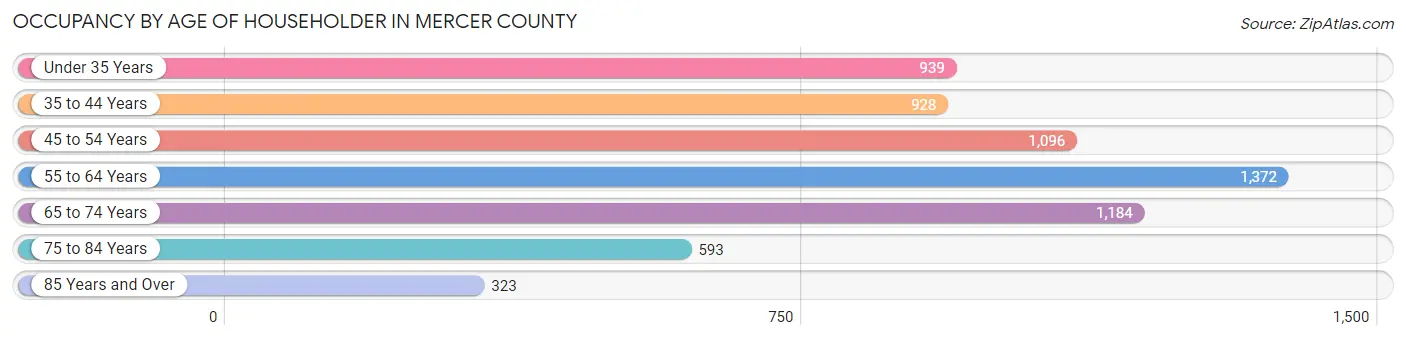
| Age Bracket | # Households | % Households |
| Under 35 Years | 939 | 14.6% |
| 35 to 44 Years | 928 | 14.4% |
| 45 to 54 Years | 1,096 | 17.0% |
| 55 to 64 Years | 1,372 | 21.3% |
| 65 to 74 Years | 1,184 | 18.4% |
| 75 to 84 Years | 593 | 9.2% |
| 85 Years and Over | 323 | 5.0% |
| Total | 6,435 | 100.0% |
Housing Finances in Mercer County
Median Income by Occupancy in Mercer County
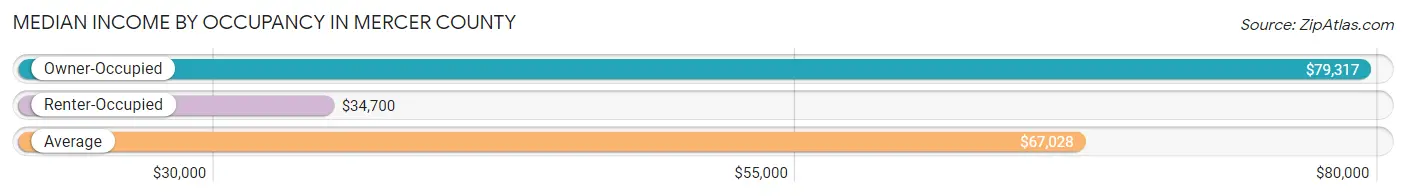
| Occupancy Type | # Households | Median Income |
| Owner-Occupied | 5,115 (79.5%) | $79,317 |
| Renter-Occupied | 1,320 (20.5%) | $34,700 |
| Average | 6,435 (100.0%) | $67,028 |
Occupancy by Householder Income Bracket in Mercer County
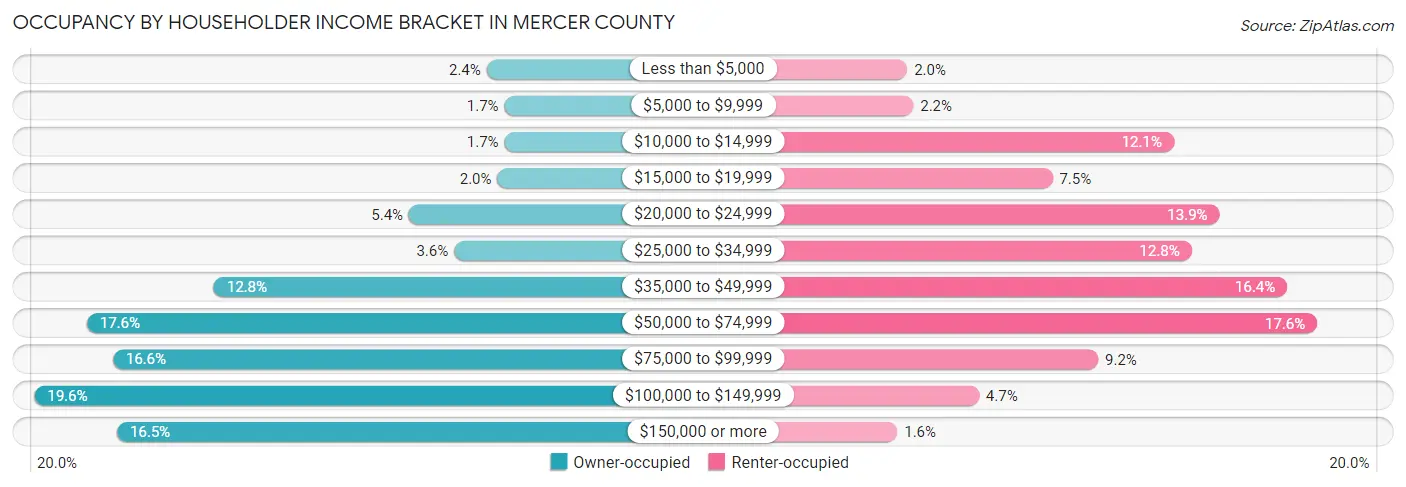
| Income Bracket | Owner-occupied | Renter-occupied |
| Less than $5,000 | 123 (2.4%) | 26 (2.0%) |
| $5,000 to $9,999 | 88 (1.7%) | 29 (2.2%) |
| $10,000 to $14,999 | 88 (1.7%) | 160 (12.1%) |
| $15,000 to $19,999 | 102 (2.0%) | 99 (7.5%) |
| $20,000 to $24,999 | 274 (5.4%) | 183 (13.9%) |
| $25,000 to $34,999 | 186 (3.6%) | 169 (12.8%) |
| $35,000 to $49,999 | 654 (12.8%) | 217 (16.4%) |
| $50,000 to $74,999 | 902 (17.6%) | 232 (17.6%) |
| $75,000 to $99,999 | 851 (16.6%) | 122 (9.2%) |
| $100,000 to $149,999 | 1,004 (19.6%) | 62 (4.7%) |
| $150,000 or more | 843 (16.5%) | 21 (1.6%) |
| Total | 5,115 (100.0%) | 1,320 (100.0%) |
Monthly Housing Cost Tiers in Mercer County
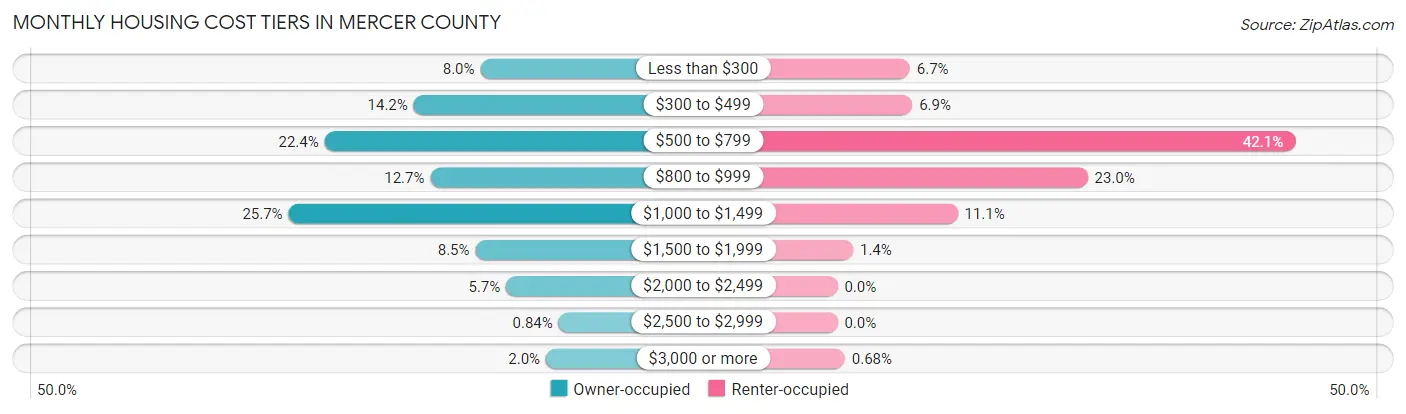
| Monthly Cost | Owner-occupied | Renter-occupied |
| Less than $300 | 411 (8.0%) | 88 (6.7%) |
| $300 to $499 | 726 (14.2%) | 91 (6.9%) |
| $500 to $799 | 1,145 (22.4%) | 556 (42.1%) |
| $800 to $999 | 647 (12.7%) | 304 (23.0%) |
| $1,000 to $1,499 | 1,315 (25.7%) | 146 (11.1%) |
| $1,500 to $1,999 | 435 (8.5%) | 19 (1.4%) |
| $2,000 to $2,499 | 290 (5.7%) | 0 (0.0%) |
| $2,500 to $2,999 | 43 (0.8%) | 0 (0.0%) |
| $3,000 or more | 103 (2.0%) | 9 (0.7%) |
| Total | 5,115 (100.0%) | 1,320 (100.0%) |
Physical Housing Characteristics in Mercer County
Housing Structures in Mercer County
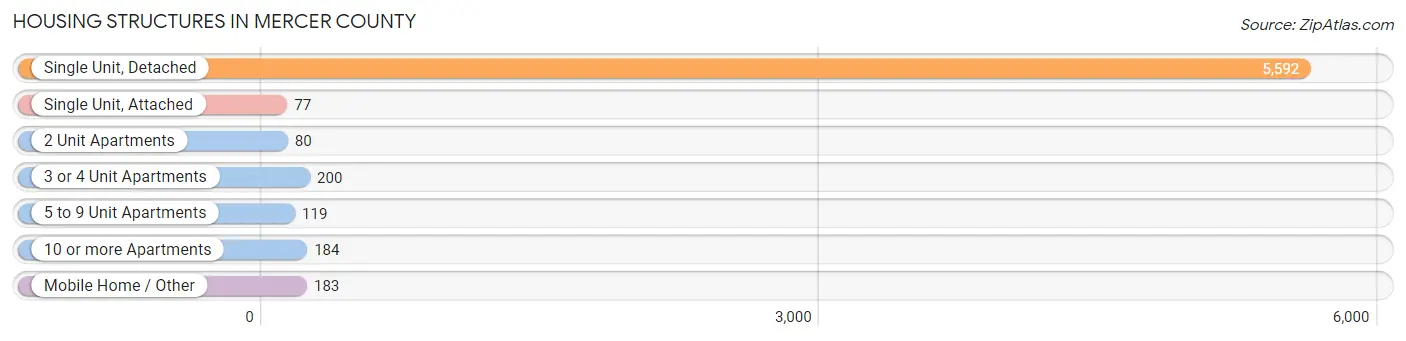
| Structure Type | # Housing Units | % Housing Units |
| Single Unit, Detached | 5,592 | 86.9% |
| Single Unit, Attached | 77 | 1.2% |
| 2 Unit Apartments | 80 | 1.2% |
| 3 or 4 Unit Apartments | 200 | 3.1% |
| 5 to 9 Unit Apartments | 119 | 1.8% |
| 10 or more Apartments | 184 | 2.9% |
| Mobile Home / Other | 183 | 2.8% |
| Total | 6,435 | 100.0% |
Housing Structures by Occupancy in Mercer County
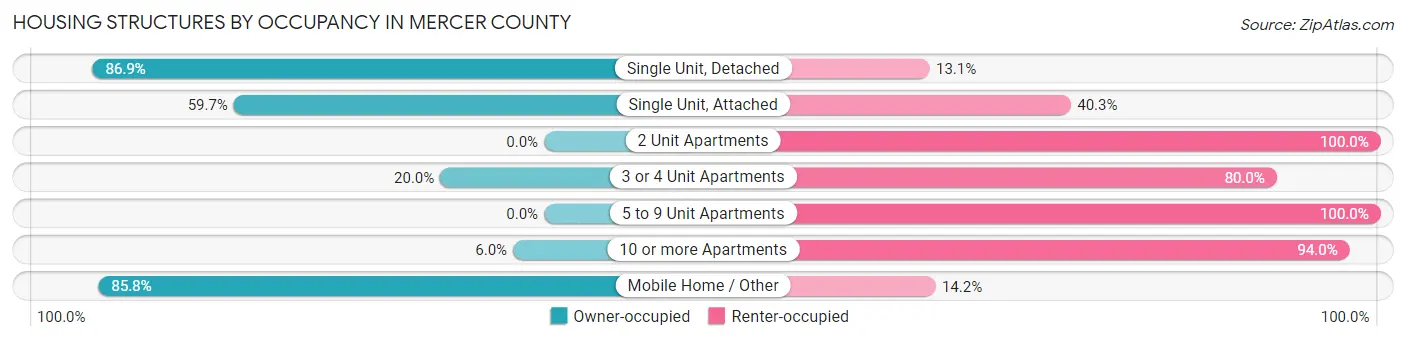
| Structure Type | Owner-occupied | Renter-occupied |
| Single Unit, Detached | 4,861 (86.9%) | 731 (13.1%) |
| Single Unit, Attached | 46 (59.7%) | 31 (40.3%) |
| 2 Unit Apartments | 0 (0.0%) | 80 (100.0%) |
| 3 or 4 Unit Apartments | 40 (20.0%) | 160 (80.0%) |
| 5 to 9 Unit Apartments | 0 (0.0%) | 119 (100.0%) |
| 10 or more Apartments | 11 (6.0%) | 173 (94.0%) |
| Mobile Home / Other | 157 (85.8%) | 26 (14.2%) |
| Total | 5,115 (79.5%) | 1,320 (20.5%) |
Housing Structures by Number of Rooms in Mercer County
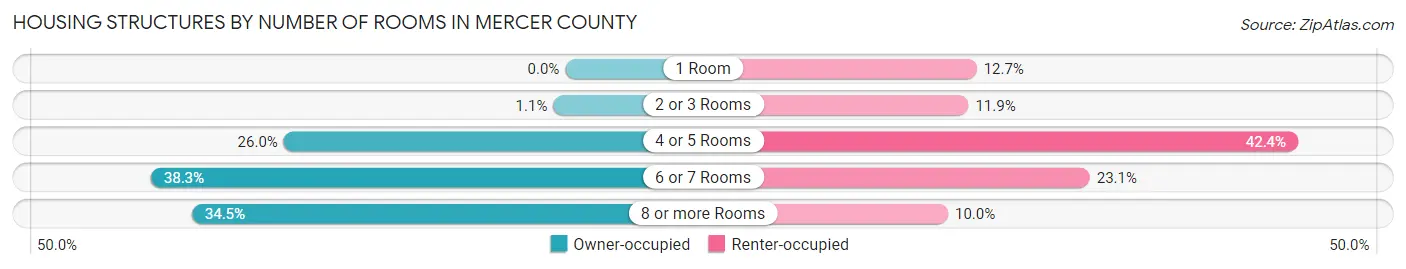
| Number of Rooms | Owner-occupied | Renter-occupied |
| 1 Room | 0 (0.0%) | 167 (12.7%) |
| 2 or 3 Rooms | 57 (1.1%) | 157 (11.9%) |
| 4 or 5 Rooms | 1,332 (26.0%) | 559 (42.3%) |
| 6 or 7 Rooms | 1,960 (38.3%) | 305 (23.1%) |
| 8 or more Rooms | 1,766 (34.5%) | 132 (10.0%) |
| Total | 5,115 (100.0%) | 1,320 (100.0%) |
Housing Structure by Heating Type in Mercer County
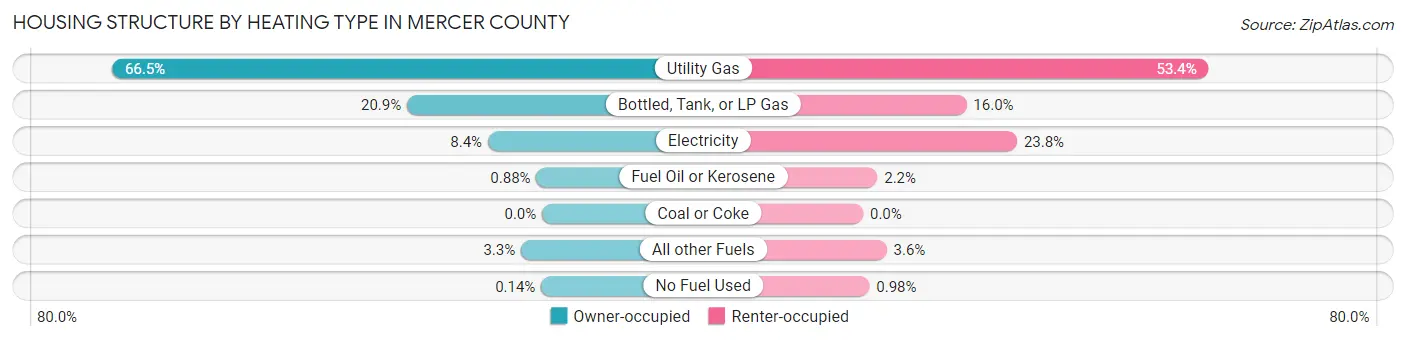
| Heating Type | Owner-occupied | Renter-occupied |
| Utility Gas | 3,401 (66.5%) | 705 (53.4%) |
| Bottled, Tank, or LP Gas | 1,068 (20.9%) | 211 (16.0%) |
| Electricity | 428 (8.4%) | 314 (23.8%) |
| Fuel Oil or Kerosene | 45 (0.9%) | 29 (2.2%) |
| Coal or Coke | 0 (0.0%) | 0 (0.0%) |
| All other Fuels | 166 (3.3%) | 48 (3.6%) |
| No Fuel Used | 7 (0.1%) | 13 (1.0%) |
| Total | 5,115 (100.0%) | 1,320 (100.0%) |
Household Vehicle Usage in Mercer County
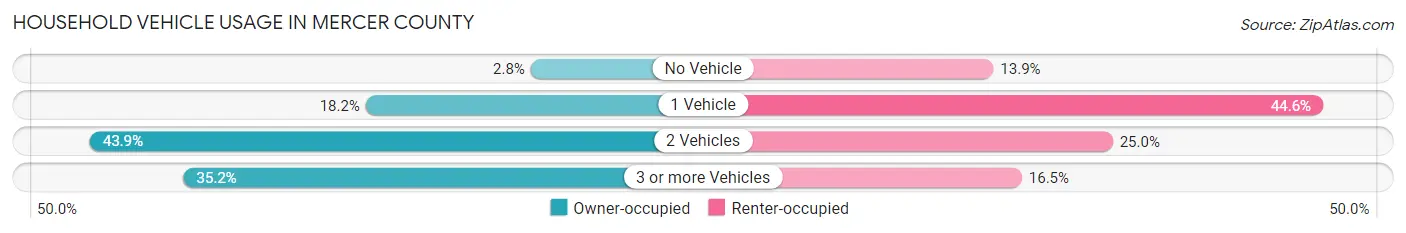
| Vehicles per Household | Owner-occupied | Renter-occupied |
| No Vehicle | 141 (2.8%) | 183 (13.9%) |
| 1 Vehicle | 929 (18.2%) | 589 (44.6%) |
| 2 Vehicles | 2,246 (43.9%) | 330 (25.0%) |
| 3 or more Vehicles | 1,799 (35.2%) | 218 (16.5%) |
| Total | 5,115 (100.0%) | 1,320 (100.0%) |
Real Estate & Mortgages in Mercer County
Real Estate and Mortgage Overview in Mercer County
| Characteristic | Without Mortgage | With Mortgage |
| Housing Units | 2,149 | 2,966 |
| Median Property Value | $111,100 | $145,600 |
| Median Household Income | $59,639 | $619 |
| Monthly Housing Costs | $504 | $103 |
| Real Estate Taxes | $2,177 | $69 |
Property Value by Mortgage Status in Mercer County
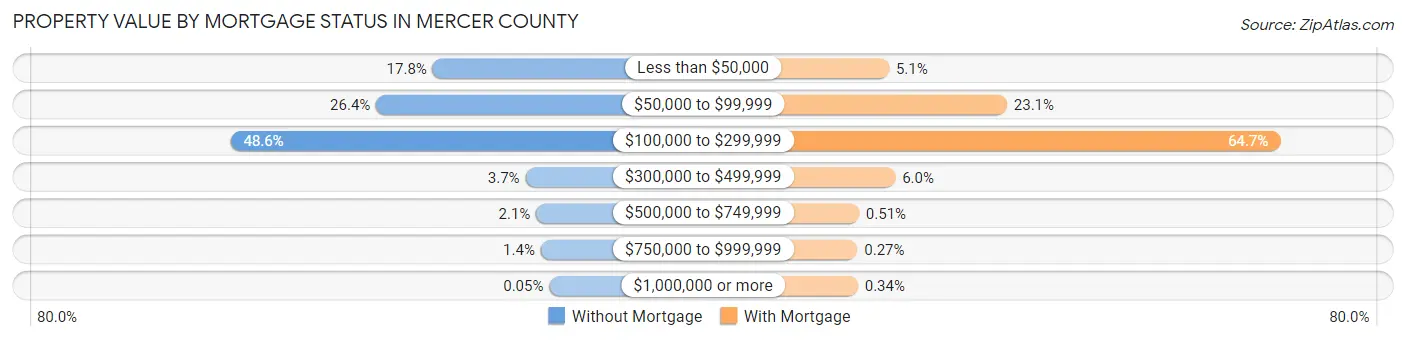
| Property Value | Without Mortgage | With Mortgage |
| Less than $50,000 | 383 (17.8%) | 151 (5.1%) |
| $50,000 to $99,999 | 568 (26.4%) | 684 (23.1%) |
| $100,000 to $299,999 | 1,045 (48.6%) | 1,919 (64.7%) |
| $300,000 to $499,999 | 79 (3.7%) | 179 (6.0%) |
| $500,000 to $749,999 | 44 (2.1%) | 15 (0.5%) |
| $750,000 to $999,999 | 29 (1.3%) | 8 (0.3%) |
| $1,000,000 or more | 1 (0.1%) | 10 (0.3%) |
| Total | 2,149 (100.0%) | 2,966 (100.0%) |
Household Income by Mortgage Status in Mercer County
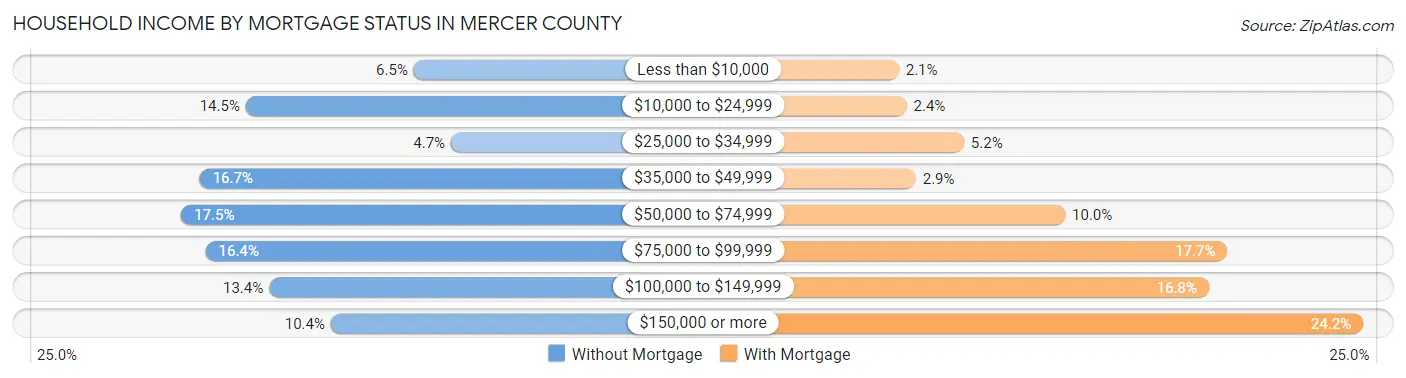
| Household Income | Without Mortgage | With Mortgage |
| Less than $10,000 | 139 (6.5%) | 61 (2.1%) |
| $10,000 to $24,999 | 311 (14.5%) | 72 (2.4%) |
| $25,000 to $34,999 | 101 (4.7%) | 153 (5.2%) |
| $35,000 to $49,999 | 358 (16.7%) | 85 (2.9%) |
| $50,000 to $74,999 | 377 (17.5%) | 296 (10.0%) |
| $75,000 to $99,999 | 352 (16.4%) | 525 (17.7%) |
| $100,000 to $149,999 | 287 (13.4%) | 499 (16.8%) |
| $150,000 or more | 224 (10.4%) | 717 (24.2%) |
| Total | 2,149 (100.0%) | 2,966 (100.0%) |
Property Value to Household Income Ratio in Mercer County
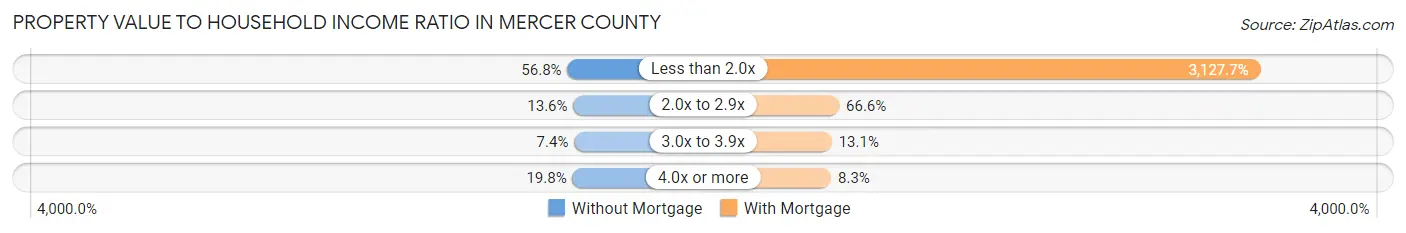
| Value-to-Income Ratio | Without Mortgage | With Mortgage |
| Less than 2.0x | 1,220 (56.8%) | 92,767 (3,127.7%) |
| 2.0x to 2.9x | 292 (13.6%) | 1,975 (66.6%) |
| 3.0x to 3.9x | 158 (7.3%) | 388 (13.1%) |
| 4.0x or more | 426 (19.8%) | 247 (8.3%) |
| Total | 2,149 (100.0%) | 2,966 (100.0%) |
Real Estate Taxes by Mortgage Status in Mercer County
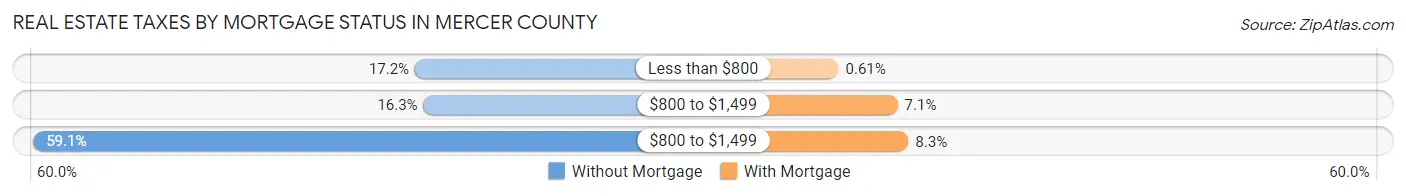
| Property Taxes | Without Mortgage | With Mortgage |
| Less than $800 | 370 (17.2%) | 18 (0.6%) |
| $800 to $1,499 | 350 (16.3%) | 210 (7.1%) |
| $800 to $1,499 | 1,269 (59.1%) | 245 (8.3%) |
| Total | 2,149 (100.0%) | 2,966 (100.0%) |
Health & Disability in Mercer County
Health Insurance Coverage by Age in Mercer County
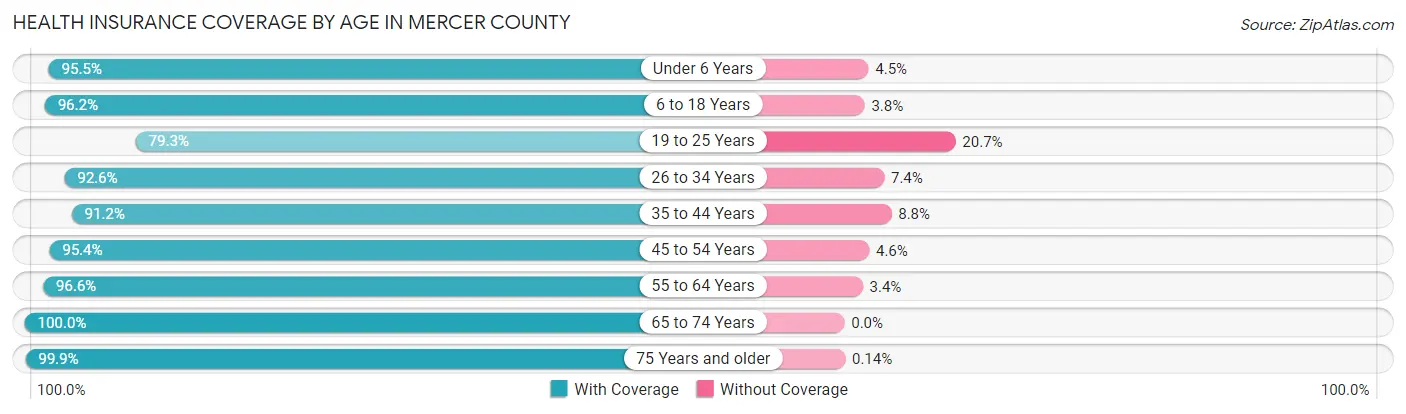
| Age Bracket | With Coverage | Without Coverage |
| Under 6 Years | 895 (95.5%) | 42 (4.5%) |
| 6 to 18 Years | 2,408 (96.2%) | 94 (3.8%) |
| 19 to 25 Years | 907 (79.3%) | 237 (20.7%) |
| 26 to 34 Years | 1,324 (92.6%) | 106 (7.4%) |
| 35 to 44 Years | 1,687 (91.2%) | 162 (8.8%) |
| 45 to 54 Years | 1,902 (95.4%) | 92 (4.6%) |
| 55 to 64 Years | 2,260 (96.6%) | 80 (3.4%) |
| 65 to 74 Years | 1,880 (100.0%) | 0 (0.0%) |
| 75 Years and older | 1,438 (99.9%) | 2 (0.1%) |
| Total | 14,701 (94.8%) | 815 (5.2%) |
Health Insurance Coverage by Citizenship Status in Mercer County
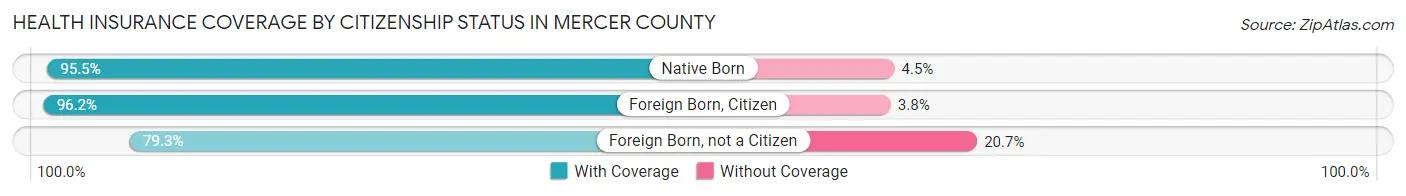
| Citizenship Status | With Coverage | Without Coverage |
| Native Born | 895 (95.5%) | 42 (4.5%) |
| Foreign Born, Citizen | 2,408 (96.2%) | 94 (3.8%) |
| Foreign Born, not a Citizen | 907 (79.3%) | 237 (20.7%) |
Health Insurance Coverage by Household Income in Mercer County
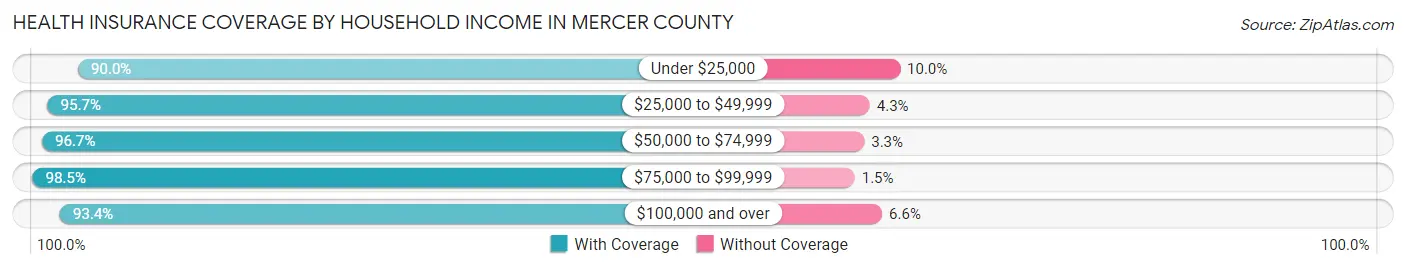
| Household Income | With Coverage | Without Coverage |
| Under $25,000 | 1,657 (90.0%) | 184 (10.0%) |
| $25,000 to $49,999 | 2,436 (95.7%) | 110 (4.3%) |
| $50,000 to $74,999 | 2,505 (96.7%) | 85 (3.3%) |
| $75,000 to $99,999 | 2,487 (98.5%) | 38 (1.5%) |
| $100,000 and over | 5,611 (93.4%) | 398 (6.6%) |
Public vs Private Health Insurance Coverage by Age in Mercer County
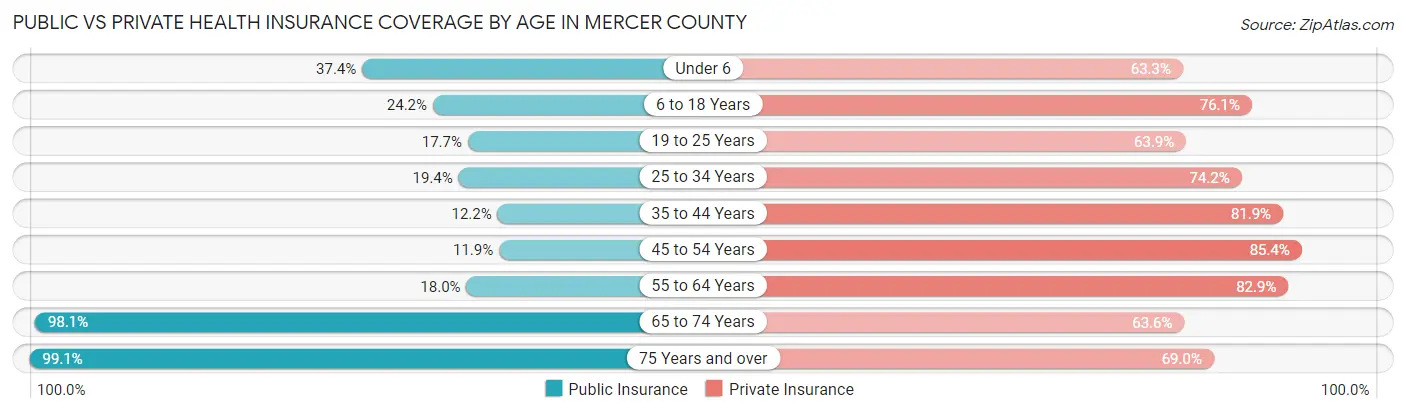
| Age Bracket | Public Insurance | Private Insurance |
| Under 6 | 350 (37.3%) | 593 (63.3%) |
| 6 to 18 Years | 606 (24.2%) | 1,904 (76.1%) |
| 19 to 25 Years | 203 (17.7%) | 731 (63.9%) |
| 25 to 34 Years | 278 (19.4%) | 1,061 (74.2%) |
| 35 to 44 Years | 226 (12.2%) | 1,514 (81.9%) |
| 45 to 54 Years | 238 (11.9%) | 1,702 (85.4%) |
| 55 to 64 Years | 421 (18.0%) | 1,939 (82.9%) |
| 65 to 74 Years | 1,844 (98.1%) | 1,195 (63.6%) |
| 75 Years and over | 1,427 (99.1%) | 994 (69.0%) |
| Total | 5,593 (36.0%) | 11,633 (75.0%) |
Disability Status by Sex by Age in Mercer County
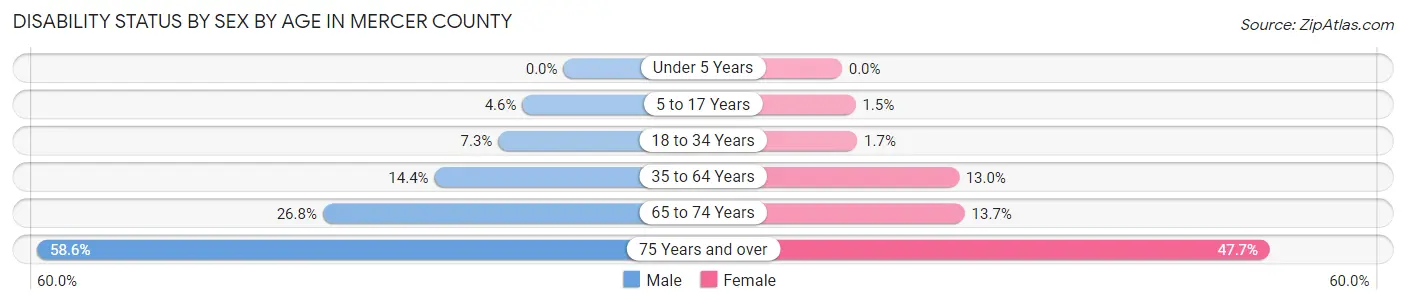
| Age Bracket | Male | Female |
| Under 5 Years | 0 (0.0%) | 0 (0.0%) |
| 5 to 17 Years | 57 (4.6%) | 19 (1.5%) |
| 18 to 34 Years | 106 (7.3%) | 22 (1.7%) |
| 35 to 64 Years | 448 (14.4%) | 399 (13.0%) |
| 65 to 74 Years | 257 (26.8%) | 126 (13.7%) |
| 75 Years and over | 378 (58.6%) | 379 (47.7%) |
Disability Class by Sex by Age in Mercer County
Disability Class: Hearing Difficulty
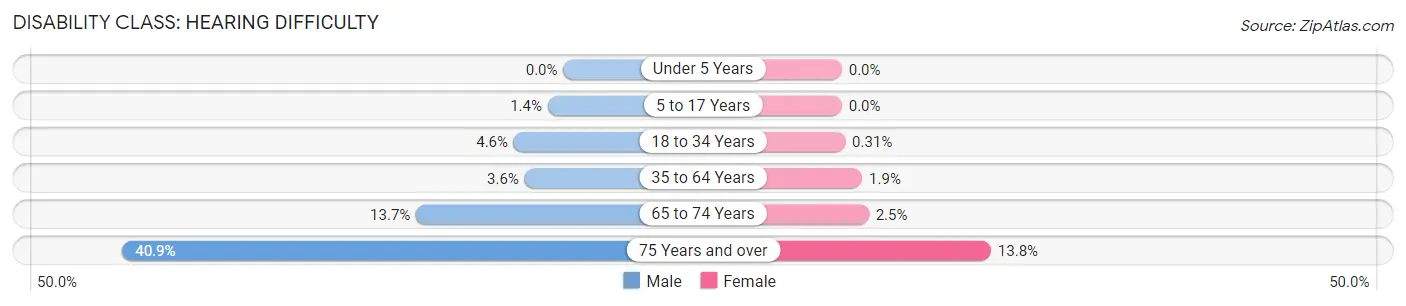
| Age Bracket | Male | Female |
| Under 5 Years | 0 (0.0%) | 0 (0.0%) |
| 5 to 17 Years | 18 (1.4%) | 0 (0.0%) |
| 18 to 34 Years | 67 (4.6%) | 4 (0.3%) |
| 35 to 64 Years | 112 (3.6%) | 58 (1.9%) |
| 65 to 74 Years | 131 (13.7%) | 23 (2.5%) |
| 75 Years and over | 264 (40.9%) | 110 (13.8%) |
Disability Class: Vision Difficulty
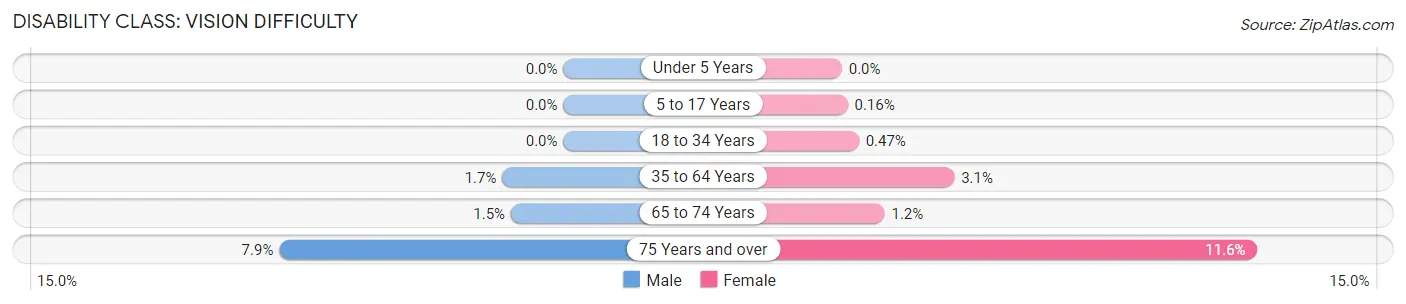
| Age Bracket | Male | Female |
| Under 5 Years | 0 (0.0%) | 0 (0.0%) |
| 5 to 17 Years | 0 (0.0%) | 2 (0.2%) |
| 18 to 34 Years | 0 (0.0%) | 6 (0.5%) |
| 35 to 64 Years | 53 (1.7%) | 96 (3.1%) |
| 65 to 74 Years | 14 (1.5%) | 11 (1.2%) |
| 75 Years and over | 51 (7.9%) | 92 (11.6%) |
Disability Class: Cognitive Difficulty
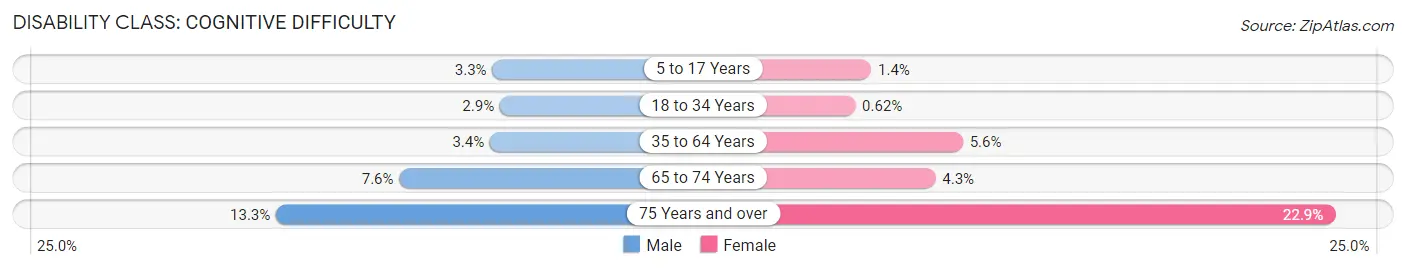
| Age Bracket | Male | Female |
| 5 to 17 Years | 41 (3.3%) | 17 (1.4%) |
| 18 to 34 Years | 43 (2.9%) | 8 (0.6%) |
| 35 to 64 Years | 106 (3.4%) | 172 (5.6%) |
| 65 to 74 Years | 73 (7.6%) | 40 (4.3%) |
| 75 Years and over | 86 (13.3%) | 182 (22.9%) |
Disability Class: Ambulatory Difficulty
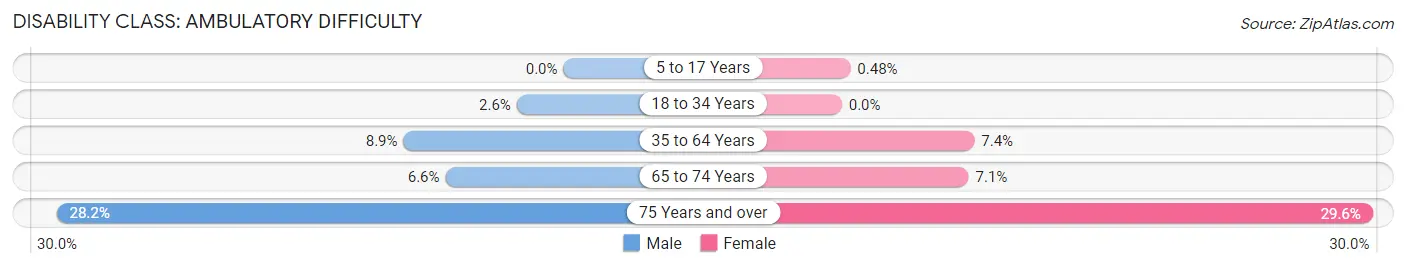
| Age Bracket | Male | Female |
| 5 to 17 Years | 0 (0.0%) | 6 (0.5%) |
| 18 to 34 Years | 38 (2.6%) | 0 (0.0%) |
| 35 to 64 Years | 278 (8.9%) | 226 (7.4%) |
| 65 to 74 Years | 63 (6.6%) | 65 (7.1%) |
| 75 Years and over | 182 (28.2%) | 235 (29.6%) |
Disability Class: Self-Care Difficulty
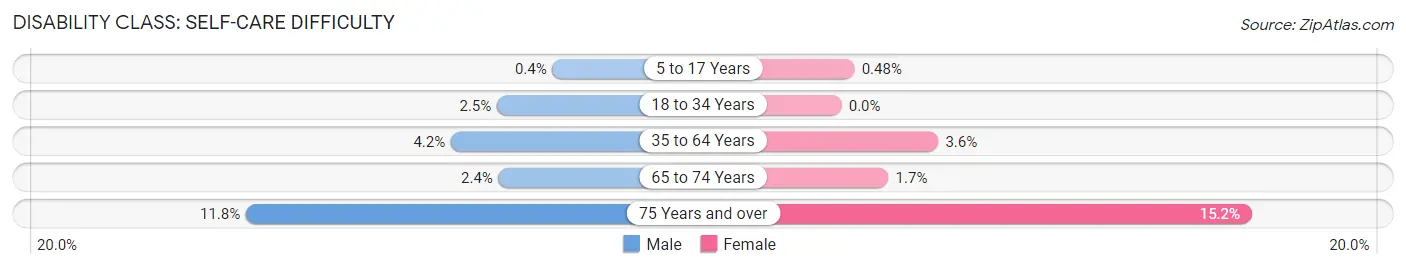
| Age Bracket | Male | Female |
| 5 to 17 Years | 5 (0.4%) | 6 (0.5%) |
| 18 to 34 Years | 36 (2.5%) | 0 (0.0%) |
| 35 to 64 Years | 130 (4.2%) | 110 (3.6%) |
| 65 to 74 Years | 23 (2.4%) | 16 (1.7%) |
| 75 Years and over | 76 (11.8%) | 121 (15.2%) |
Technology Access in Mercer County
Computing Device Access in Mercer County
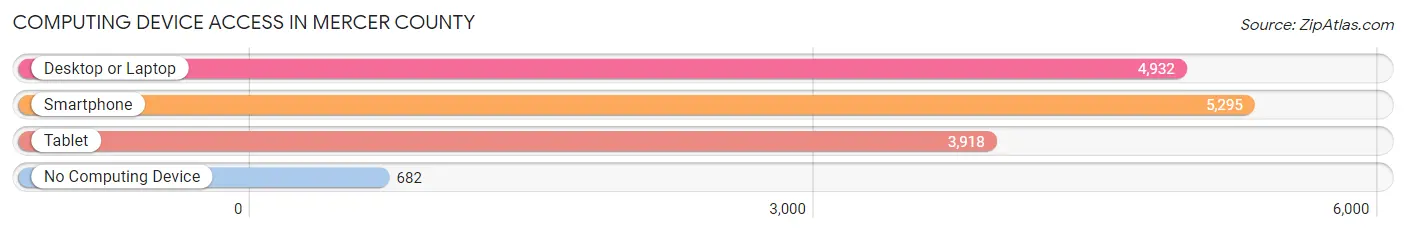
| Device Type | # Households | % Households |
| Desktop or Laptop | 4,932 | 76.6% |
| Smartphone | 5,295 | 82.3% |
| Tablet | 3,918 | 60.9% |
| No Computing Device | 682 | 10.6% |
| Total | 6,435 | 100.0% |
Internet Access in Mercer County
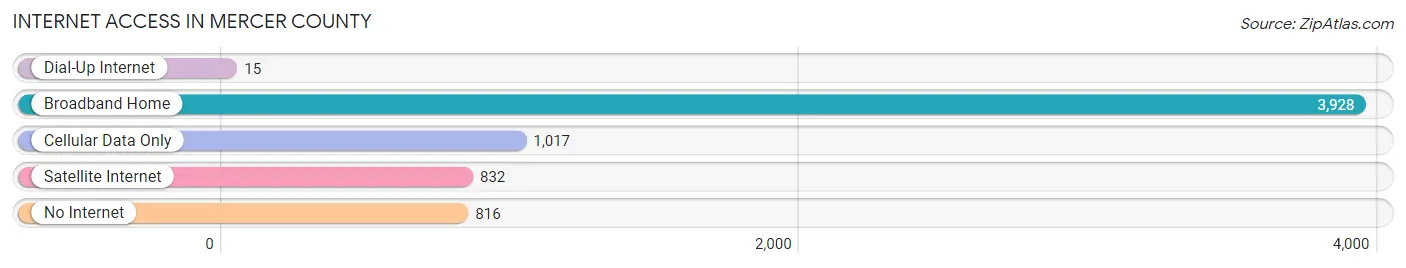
| Internet Type | # Households | % Households |
| Dial-Up Internet | 15 | 0.2% |
| Broadband Home | 3,928 | 61.0% |
| Cellular Data Only | 1,017 | 15.8% |
| Satellite Internet | 832 | 12.9% |
| No Internet | 816 | 12.7% |
| Total | 6,435 | 100.0% |
Mercer County Summary
Mercer County is located in the western part of Illinois, in the United States. It is part of the Quad Cities metropolitan area, which includes the cities of Moline, East Moline, and Rock Island in Illinois, and Davenport and Bettendorf in Iowa. The county seat is Aledo, and the largest city is Keithsburg. The county was established in 1825 and named for Hugh Mercer, a Revolutionary War general.
Geography
Mercer County covers an area of 576 square miles, making it the 33rd largest county in Illinois. It is bordered by Rock Island County to the north, Henry County to the east, Henderson County to the south, and Warren County to the west. The county is mostly flat, with some rolling hills in the northern and western parts. The highest point in the county is located in the northwest corner, at an elevation of 810 feet. The county is drained by the Mississippi River, which forms its western border.
The climate of Mercer County is humid continental, with hot, humid summers and cold, snowy winters. The average annual temperature is 52°F, and the average annual precipitation is 36 inches.
Demographics
As of the 2010 census, Mercer County had a population of 16,434. The racial makeup of the county was 97.2% White, 0.7% African American, 0.3% Native American, 0.3% Asian, 0.2% from other races, and 1.3% from two or more races. Hispanic or Latino of any race were 1.2% of the population.
The median household income in Mercer County was $50,945 in 2018, and the median family income was $60,945. The per capita income was $25,845. About 8.7% of families and 11.2% of the population were below the poverty line.
Economy
Agriculture is the main economic activity in Mercer County. The county is home to a variety of crops, including corn, soybeans, wheat, oats, hay, and alfalfa. Livestock production is also important, with beef cattle, dairy cattle, and hogs being the main animals raised.
Manufacturing is also an important part of the economy. The county is home to several factories, including a John Deere plant in Keithsburg, a Caterpillar plant in Aledo, and a Tyson Foods plant in Viola.
Mercer County is also home to several tourist attractions, including the Mercer County Historical Society Museum in Aledo, the Keithsburg Historical Museum, and the Viola Historical Museum.
Conclusion
Mercer County is a rural county located in western Illinois. It is part of the Quad Cities metropolitan area and is home to a variety of crops and livestock. Manufacturing and tourism are also important parts of the economy. The county has a population of 16,434, and the median household income is $50,945.
Common Questions
What is Per Capita Income in Mercer County?
Per Capita income in Mercer County is $34,455.
What is the Median Family Income in Mercer County?
Median Family Income in Mercer County is $84,315.
What is the Median Household income in Mercer County?
Median Household Income in Mercer County is $67,028.
What is Income or Wage Gap in Mercer County?
Income or Wage Gap in Mercer County is 38.0%.
Women in Mercer County earn 62.0 cents for every dollar earned by a man.
What is Family Income Deficit in Mercer County?
Family Income Deficit in Mercer County is $13,565.
Families that are below poverty line in Mercer County earn $13,565 less on average than the poverty threshold level.
What is Inequality or Gini Index in Mercer County?
Inequality or Gini Index in Mercer County is 0.41.
What is the Total Population of Mercer County?
Total Population of Mercer County is 15,692.
What is the Total Male Population of Mercer County?
Total Male Population of Mercer County is 7,951.
What is the Total Female Population of Mercer County?
Total Female Population of Mercer County is 7,741.
What is the Ratio of Males per 100 Females in Mercer County?
There are 102.71 Males per 100 Females in Mercer County.
What is the Ratio of Females per 100 Males in Mercer County?
There are 97.36 Females per 100 Males in Mercer County.
What is the Median Population Age in Mercer County?
Median Population Age in Mercer County is 44.7 Years.
What is the Average Family Size in Mercer County
Average Family Size in Mercer County is 2.9 People.
What is the Average Household Size in Mercer County
Average Household Size in Mercer County is 2.4 People.
How Large is the Labor Force in Mercer County?
There are 7,642 People in the Labor Forcein in Mercer County.
What is the Percentage of People in the Labor Force in Mercer County?
59.8% of People are in the Labor Force in Mercer County.
What is the Unemployment Rate in Mercer County?
Unemployment Rate in Mercer County is 3.3%.