Marshall County, IL Map & Demographics
Marshall County Map
Marshall County Overview
$34,369
PER CAPITA INCOME
$83,559
AVG FAMILY INCOME
$64,940
AVG HOUSEHOLD INCOME
41.5%
WAGE / INCOME GAP [ % ]
58.5¢/ $1
WAGE / INCOME GAP [ $ ]
$9,503
FAMILY INCOME DEFICIT
0.42
INEQUALITY / GINI INDEX
11,740
TOTAL POPULATION
5,906
MALE POPULATION
5,834
FEMALE POPULATION
101.23
MALES / 100 FEMALES
98.78
FEMALES / 100 MALES
46.2
MEDIAN AGE
2.8
AVG FAMILY SIZE
2.3
AVG HOUSEHOLD SIZE
5,408
LABOR FORCE [ PEOPLE ]
56.4%
PERCENT IN LABOR FORCE
4.2%
UNEMPLOYMENT RATE
Income in Marshall County
Income Overview in Marshall County
Per Capita Income in Marshall County is $34,369, while median incomes of families and households are $83,559 and $64,940 respectively.
| Characteristic | Number | Measure |
| Per Capita Income | 11,740 | $34,369 |
| Median Family Income | 3,212 | $83,559 |
| Mean Family Income | 3,212 | $92,895 |
| Median Household Income | 4,967 | $64,940 |
| Mean Household Income | 4,967 | $78,116 |
| Income Deficit | 3,212 | $9,503 |
| Wage / Income Gap (%) | 11,740 | 41.52% |
| Wage / Income Gap ($) | 11,740 | 58.48¢ per $1 |
| Gini / Inequality Index | 11,740 | 0.42 |
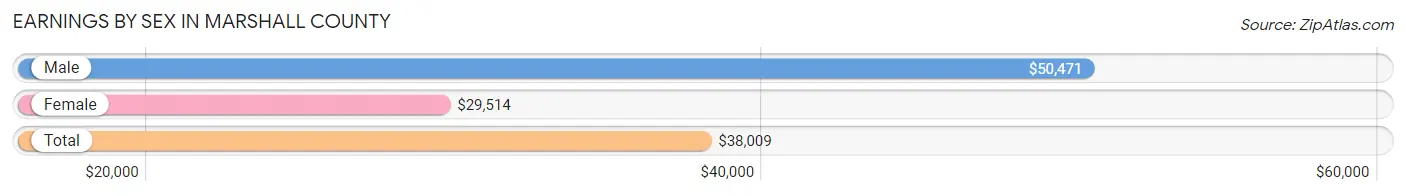
Earnings by Sex in Marshall County
Average Earnings in Marshall County are $38,009, $50,471 for men and $29,514 for women, a difference of 41.5%.
| Sex | Number | Average Earnings |
| Male | 3,143 (54.4%) | $50,471 |
| Female | 2,636 (45.6%) | $29,514 |
| Total | 5,779 (100.0%) | $38,009 |
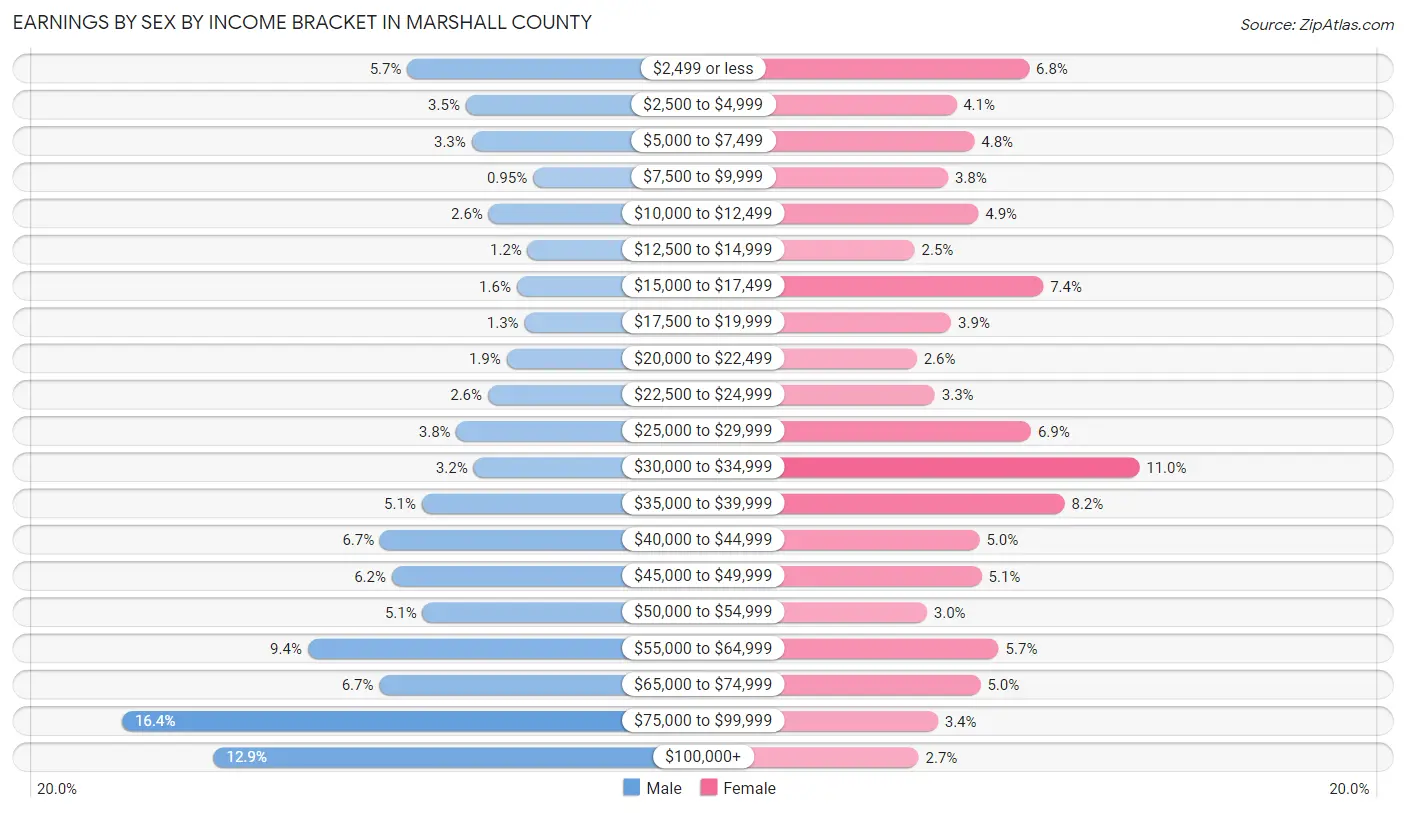
Earnings by Sex by Income Bracket in Marshall County
The most common earnings brackets in Marshall County are $75,000 to $99,999 for men (514 | 16.4%) and $30,000 to $34,999 for women (289 | 11.0%).
| Income | Male | Female |
| $2,499 or less | 178 (5.7%) | 180 (6.8%) |
| $2,500 to $4,999 | 109 (3.5%) | 108 (4.1%) |
| $5,000 to $7,499 | 102 (3.3%) | 126 (4.8%) |
| $7,500 to $9,999 | 30 (0.9%) | 100 (3.8%) |
| $10,000 to $12,499 | 82 (2.6%) | 130 (4.9%) |
| $12,500 to $14,999 | 36 (1.1%) | 67 (2.5%) |
| $15,000 to $17,499 | 49 (1.6%) | 194 (7.4%) |
| $17,500 to $19,999 | 40 (1.3%) | 103 (3.9%) |
| $20,000 to $22,499 | 61 (1.9%) | 69 (2.6%) |
| $22,500 to $24,999 | 83 (2.6%) | 87 (3.3%) |
| $25,000 to $29,999 | 120 (3.8%) | 182 (6.9%) |
| $30,000 to $34,999 | 100 (3.2%) | 289 (11.0%) |
| $35,000 to $39,999 | 161 (5.1%) | 215 (8.2%) |
| $40,000 to $44,999 | 210 (6.7%) | 131 (5.0%) |
| $45,000 to $49,999 | 196 (6.2%) | 133 (5.1%) |
| $50,000 to $54,999 | 160 (5.1%) | 79 (3.0%) |
| $55,000 to $64,999 | 295 (9.4%) | 150 (5.7%) |
| $65,000 to $74,999 | 211 (6.7%) | 132 (5.0%) |
| $75,000 to $99,999 | 514 (16.4%) | 90 (3.4%) |
| $100,000+ | 406 (12.9%) | 71 (2.7%) |
| Total | 3,143 (100.0%) | 2,636 (100.0%) |
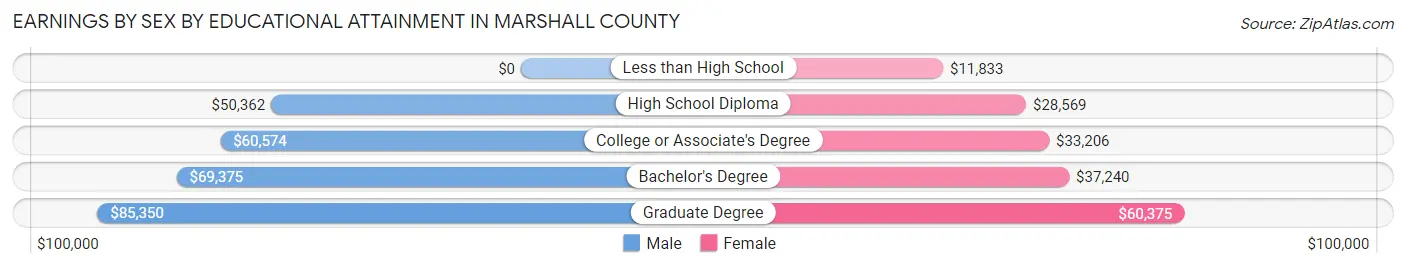
Earnings by Sex by Educational Attainment in Marshall County
Average earnings in Marshall County are $55,691 for men and $32,520 for women, a difference of 41.6%. Men with an educational attainment of graduate degree enjoy the highest average annual earnings of $85,350, while those with high school diploma education earn the least with $50,362. Women with an educational attainment of graduate degree earn the most with the average annual earnings of $60,375, while those with less than high school education have the smallest earnings of $11,833.
| Educational Attainment | Male Income | Female Income |
| Less than High School | - | - |
| High School Diploma | $50,362 | $28,569 |
| College or Associate's Degree | $60,574 | $33,206 |
| Bachelor's Degree | $69,375 | $37,240 |
| Graduate Degree | $85,350 | $60,375 |
| Total | $55,691 | $32,520 |
Family Income in Marshall County
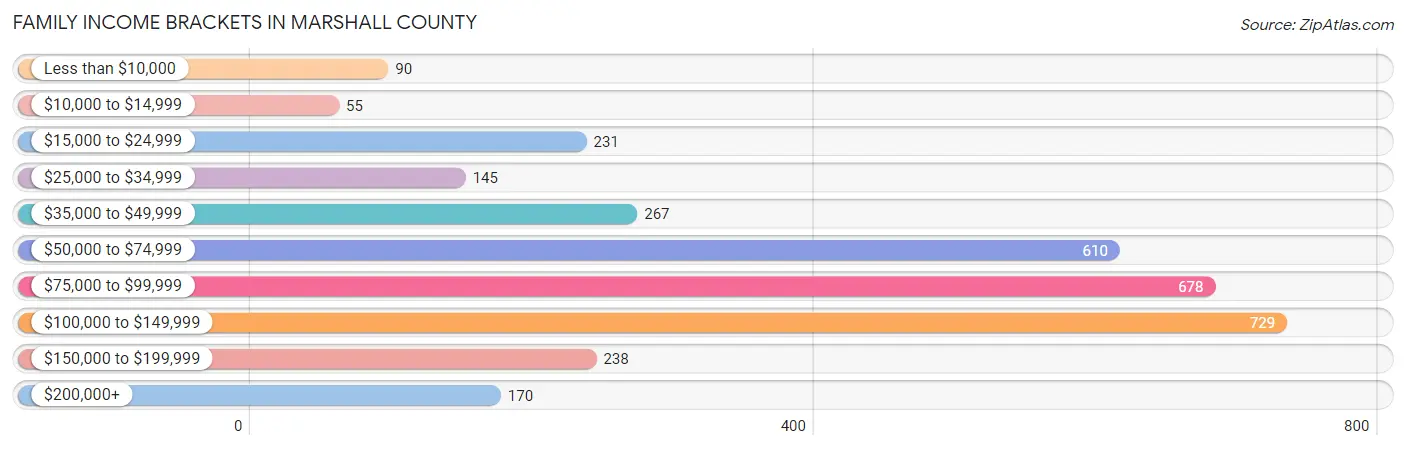
Family Income Brackets in Marshall County
According to the Marshall County family income data, there are 729 families falling into the $100,000 to $149,999 income range, which is the most common income bracket and makes up 22.7% of all families. Conversely, the $10,000 to $14,999 income bracket is the least frequent group with only 55 families (1.7%) belonging to this category.
| Income Bracket | # Families | % Families |
| Less than $10,000 | 90 | 2.8% |
| $10,000 to $14,999 | 55 | 1.7% |
| $15,000 to $24,999 | 231 | 7.2% |
| $25,000 to $34,999 | 145 | 4.5% |
| $35,000 to $49,999 | 267 | 8.3% |
| $50,000 to $74,999 | 610 | 19.0% |
| $75,000 to $99,999 | 678 | 21.1% |
| $100,000 to $149,999 | 729 | 22.7% |
| $150,000 to $199,999 | 238 | 7.4% |
| $200,000+ | 170 | 5.3% |
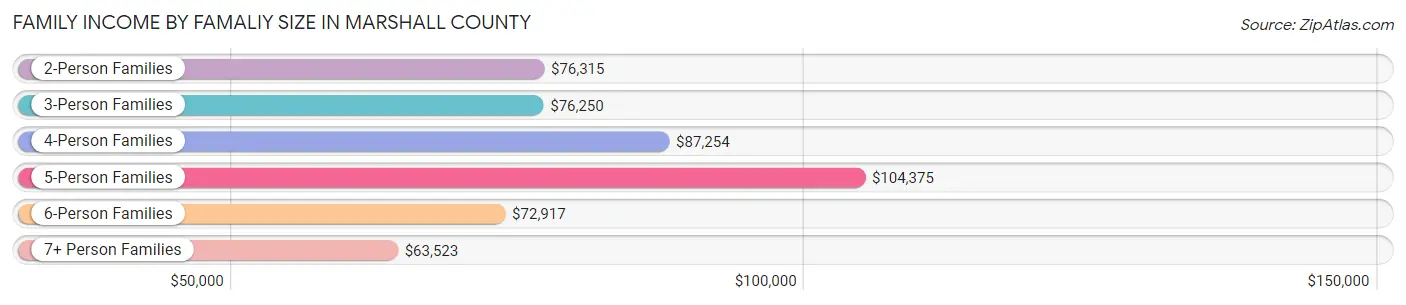
Family Income by Famaliy Size in Marshall County
5-person families (300 | 9.3%) account for the highest median family income in Marshall County with $104,375 per family, while 2-person families (1,799 | 56.0%) have the highest median income of $38,158 per family member.
| Income Bracket | # Families | Median Income |
| 2-Person Families | 1,799 (56.0%) | $76,315 |
| 3-Person Families | 542 (16.9%) | $76,250 |
| 4-Person Families | 489 (15.2%) | $87,254 |
| 5-Person Families | 300 (9.3%) | $104,375 |
| 6-Person Families | 47 (1.5%) | $72,917 |
| 7+ Person Families | 35 (1.1%) | $63,523 |
| Total | 3,212 (100.0%) | $83,559 |
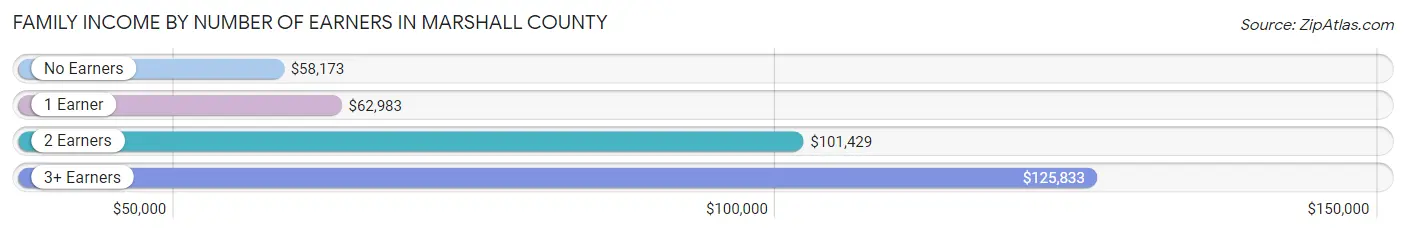
Family Income by Number of Earners in Marshall County
The median family income in Marshall County is $83,559, with families comprising 3+ earners (308) having the highest median family income of $125,833, while families with no earners (567) have the lowest median family income of $58,173, accounting for 9.6% and 17.6% of families, respectively.
| Number of Earners | # Families | Median Income |
| No Earners | 567 (17.6%) | $58,173 |
| 1 Earner | 1,237 (38.5%) | $62,983 |
| 2 Earners | 1,100 (34.3%) | $101,429 |
| 3+ Earners | 308 (9.6%) | $125,833 |
| Total | 3,212 (100.0%) | $83,559 |
Household Income in Marshall County
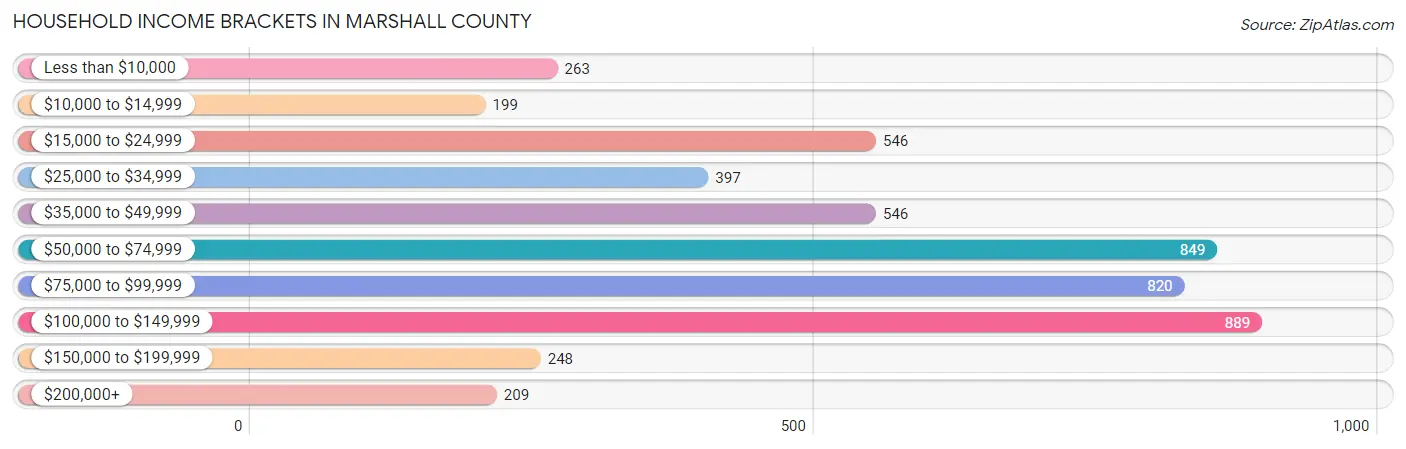
Household Income Brackets in Marshall County
With 889 households falling in the category, the $100,000 to $149,999 income range is the most frequent in Marshall County, accounting for 17.9% of all households. In contrast, only 199 households (4.0%) fall into the $10,000 to $14,999 income bracket, making it the least populous group.
| Income Bracket | # Households | % Households |
| Less than $10,000 | 263 | 5.3% |
| $10,000 to $14,999 | 199 | 4.0% |
| $15,000 to $24,999 | 546 | 11.0% |
| $25,000 to $34,999 | 397 | 8.0% |
| $35,000 to $49,999 | 546 | 11.0% |
| $50,000 to $74,999 | 849 | 17.1% |
| $75,000 to $99,999 | 820 | 16.5% |
| $100,000 to $149,999 | 889 | 17.9% |
| $150,000 to $199,999 | 248 | 5.0% |
| $200,000+ | 209 | 4.2% |
Household Income by Householder Age in Marshall County
The median household income in Marshall County is $64,940, with the highest median household income of $77,047 found in the 45 to 64 years age bracket for the primary householder. A total of 1,807 households (36.4%) fall into this category. Meanwhile, the 15 to 24 years age bracket for the primary householder has the lowest median household income of $29,167, with 206 households (4.2%) in this group.
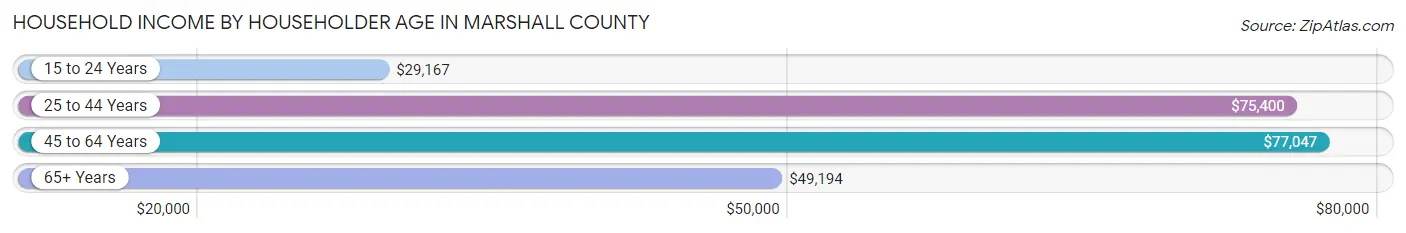
| Income Bracket | # Households | Median Income |
| 15 to 24 Years | 206 (4.2%) | $29,167 |
| 25 to 44 Years | 1,220 (24.6%) | $75,400 |
| 45 to 64 Years | 1,807 (36.4%) | $77,047 |
| 65+ Years | 1,734 (34.9%) | $49,194 |
| Total | 4,967 (100.0%) | $64,940 |
Poverty in Marshall County
Income Below Poverty by Sex and Age in Marshall County
With 10.6% poverty level for males and 14.0% for females among the residents of Marshall County, under 5 year old males and under 5 year old females are the most vulnerable to poverty, with 87 males (28.4%) and 106 females (33.5%) in their respective age groups living below the poverty level.
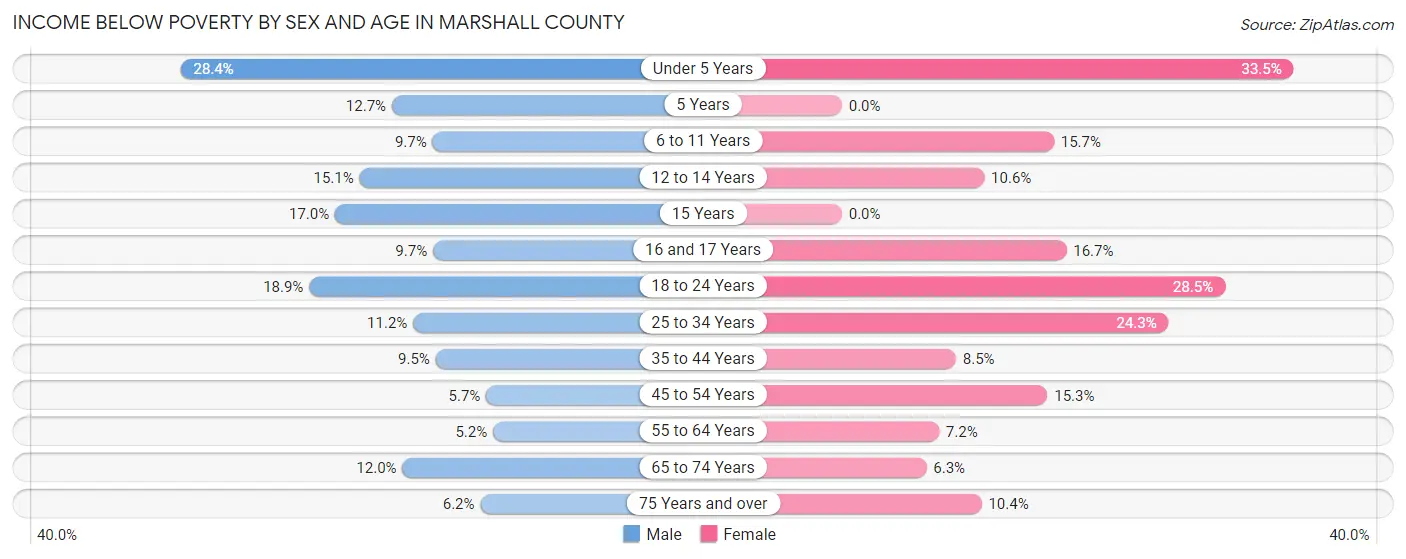
| Age Bracket | Male | Female |
| Under 5 Years | 87 (28.4%) | 106 (33.5%) |
| 5 Years | 7 (12.7%) | 0 (0.0%) |
| 6 to 11 Years | 33 (9.7%) | 51 (15.7%) |
| 12 to 14 Years | 36 (15.1%) | 26 (10.6%) |
| 15 Years | 10 (17.0%) | 0 (0.0%) |
| 16 and 17 Years | 15 (9.7%) | 21 (16.7%) |
| 18 to 24 Years | 77 (18.9%) | 103 (28.4%) |
| 25 to 34 Years | 72 (11.2%) | 148 (24.3%) |
| 35 to 44 Years | 65 (9.5%) | 51 (8.5%) |
| 45 to 54 Years | 40 (5.7%) | 107 (15.3%) |
| 55 to 64 Years | 48 (5.2%) | 62 (7.2%) |
| 65 to 74 Years | 87 (11.9%) | 47 (6.3%) |
| 75 Years and over | 30 (6.2%) | 61 (10.4%) |
| Total | 607 (10.6%) | 783 (14.0%) |
Income Above Poverty by Sex and Age in Marshall County
According to the poverty statistics in Marshall County, males aged 55 to 64 years and females aged 5 years are the age groups that are most secure financially, with 94.8% of males and 100.0% of females in these age groups living above the poverty line.
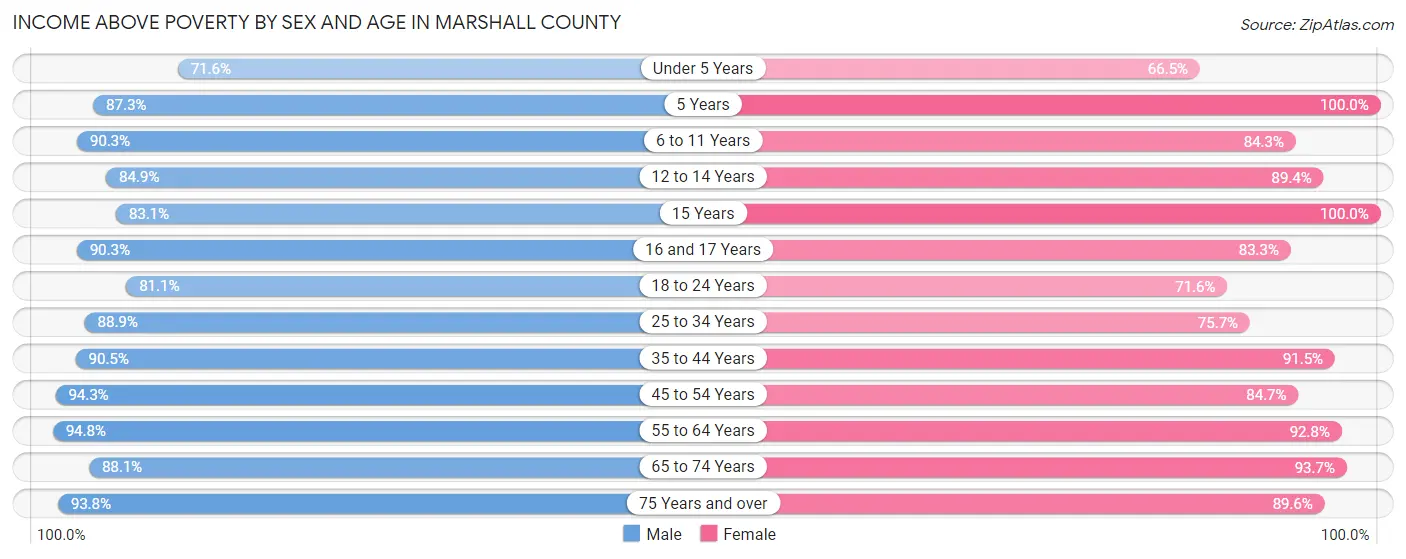
| Age Bracket | Male | Female |
| Under 5 Years | 219 (71.6%) | 210 (66.5%) |
| 5 Years | 48 (87.3%) | 38 (100.0%) |
| 6 to 11 Years | 307 (90.3%) | 273 (84.3%) |
| 12 to 14 Years | 202 (84.9%) | 220 (89.4%) |
| 15 Years | 49 (83.1%) | 66 (100.0%) |
| 16 and 17 Years | 140 (90.3%) | 105 (83.3%) |
| 18 to 24 Years | 331 (81.1%) | 259 (71.6%) |
| 25 to 34 Years | 574 (88.8%) | 462 (75.7%) |
| 35 to 44 Years | 621 (90.5%) | 551 (91.5%) |
| 45 to 54 Years | 658 (94.3%) | 594 (84.7%) |
| 55 to 64 Years | 872 (94.8%) | 798 (92.8%) |
| 65 to 74 Years | 641 (88.0%) | 701 (93.7%) |
| 75 Years and over | 457 (93.8%) | 527 (89.6%) |
| Total | 5,119 (89.4%) | 4,804 (86.0%) |
Income Below Poverty Among Married-Couple Families in Marshall County
The poverty statistics for married-couple families in Marshall County show that 3.7% or 94 of the total 2,538 families live below the poverty line. Families with 5 or more children have the highest poverty rate of 20.0%, comprising of 4 families. On the other hand, families with no children have the lowest poverty rate of 3.0%, which includes 52 families.
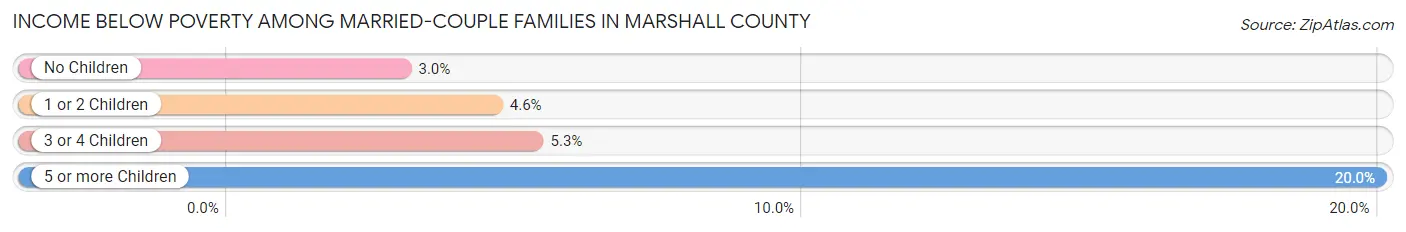
| Children | Above Poverty | Below Poverty |
| No Children | 1,670 (97.0%) | 52 (3.0%) |
| 1 or 2 Children | 580 (95.4%) | 28 (4.6%) |
| 3 or 4 Children | 178 (94.7%) | 10 (5.3%) |
| 5 or more Children | 16 (80.0%) | 4 (20.0%) |
| Total | 2,444 (96.3%) | 94 (3.7%) |
Income Below Poverty Among Single-Parent Households in Marshall County
According to the poverty data in Marshall County, 32.3% or 62 single-father households and 31.7% or 153 single-mother households are living below the poverty line. Among single-father households, those with 3 or 4 children have the highest poverty rate, with 26 households (76.5%) experiencing poverty. Likewise, among single-mother households, those with 1 or 2 children have the highest poverty rate, with 148 households (50.5%) falling below the poverty line.
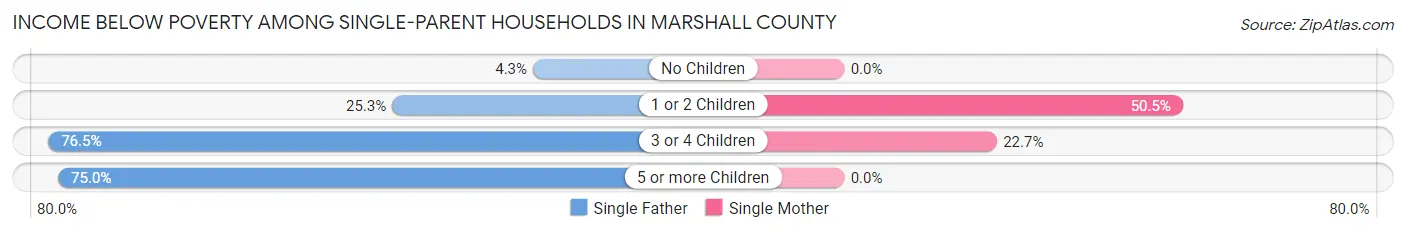
| Children | Single Father | Single Mother |
| No Children | 2 (4.3%) | 0 (0.0%) |
| 1 or 2 Children | 25 (25.3%) | 148 (50.5%) |
| 3 or 4 Children | 26 (76.5%) | 5 (22.7%) |
| 5 or more Children | 9 (75.0%) | 0 (0.0%) |
| Total | 62 (32.3%) | 153 (31.7%) |
Income Below Poverty Among Married-Couple vs Single-Parent Households in Marshall County
The poverty data for Marshall County shows that 94 of the married-couple family households (3.7%) and 215 of the single-parent households (31.9%) are living below the poverty level. Within the married-couple family households, those with 5 or more children have the highest poverty rate, with 4 households (20.0%) falling below the poverty line. Among the single-parent households, those with 5 or more children have the highest poverty rate, with 9 household (75.0%) living below poverty.
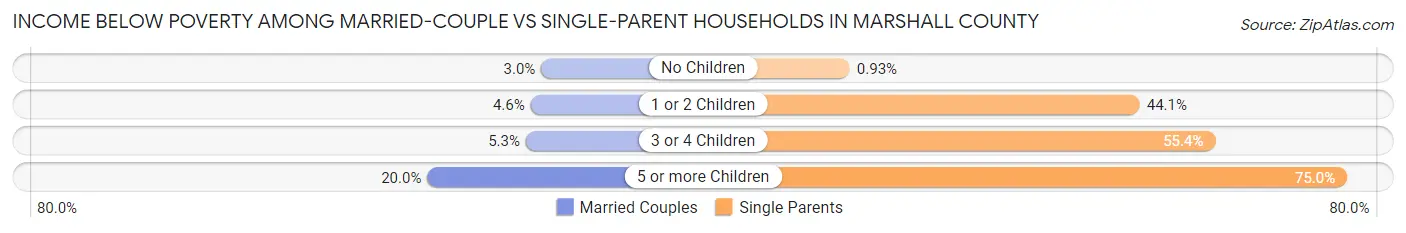
| Children | Married-Couple Families | Single-Parent Households |
| No Children | 52 (3.0%) | 2 (0.9%) |
| 1 or 2 Children | 28 (4.6%) | 173 (44.1%) |
| 3 or 4 Children | 10 (5.3%) | 31 (55.4%) |
| 5 or more Children | 4 (20.0%) | 9 (75.0%) |
| Total | 94 (3.7%) | 215 (31.9%) |
Race in Marshall County
The most populous races in Marshall County are White / Caucasian (11,079 | 94.4%), Two or more Races (437 | 3.7%), and Hispanic or Latino (359 | 3.1%).
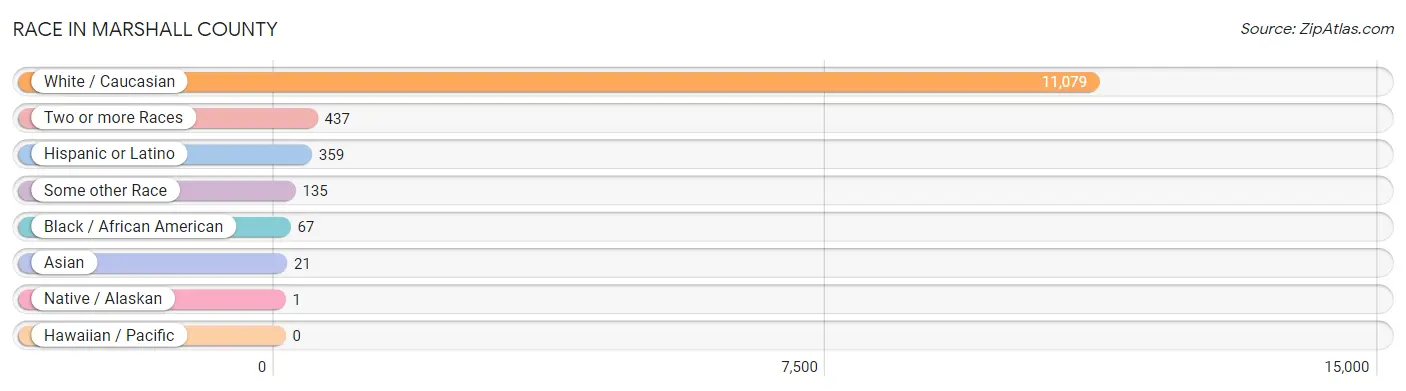
| Race | # Population | % Population |
| Asian | 21 | 0.2% |
| Black / African American | 67 | 0.6% |
| Hawaiian / Pacific | 0 | 0.0% |
| Hispanic or Latino | 359 | 3.1% |
| Native / Alaskan | 1 | 0.0% |
| White / Caucasian | 11,079 | 94.4% |
| Two or more Races | 437 | 3.7% |
| Some other Race | 135 | 1.1% |
| Total | 11,740 | 100.0% |
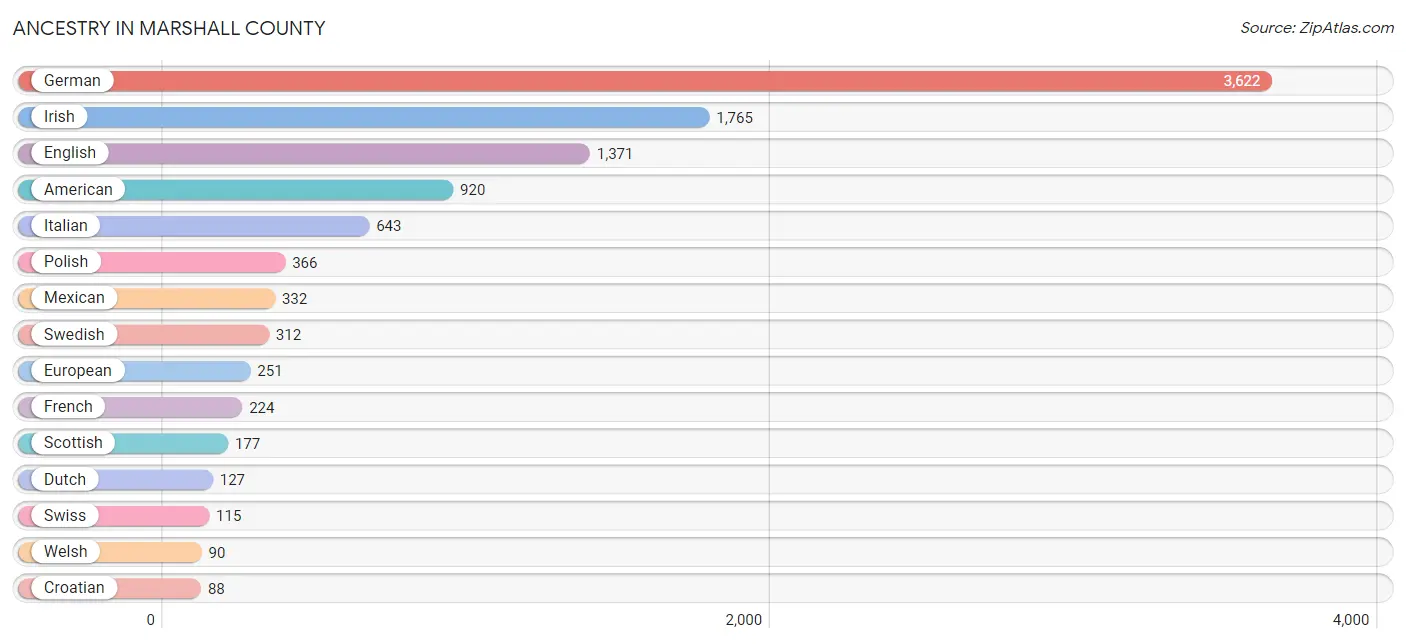
Ancestry in Marshall County
The most populous ancestries reported in Marshall County are German (3,622 | 30.8%), Irish (1,765 | 15.0%), English (1,371 | 11.7%), American (920 | 7.8%), and Italian (643 | 5.5%), together accounting for 70.9% of all Marshall County residents.
| Ancestry | # Population | % Population |
| African | 6 | 0.1% |
| American | 920 | 7.8% |
| Apache | 2 | 0.0% |
| Arab | 49 | 0.4% |
| Australian | 1 | 0.0% |
| Austrian | 23 | 0.2% |
| Belgian | 21 | 0.2% |
| Bhutanese | 12 | 0.1% |
| British | 34 | 0.3% |
| Canadian | 11 | 0.1% |
| Central American | 1 | 0.0% |
| Cherokee | 22 | 0.2% |
| Croatian | 88 | 0.7% |
| Cuban | 7 | 0.1% |
| Czech | 23 | 0.2% |
| Czechoslovakian | 3 | 0.0% |
| Danish | 86 | 0.7% |
| Dutch | 127 | 1.1% |
| Eastern European | 45 | 0.4% |
| English | 1,371 | 11.7% |
| European | 251 | 2.1% |
| Finnish | 6 | 0.1% |
| French | 224 | 1.9% |
| French American Indian | 2 | 0.0% |
| French Canadian | 4 | 0.0% |
| German | 3,622 | 30.8% |
| Greek | 11 | 0.1% |
| Guatemalan | 1 | 0.0% |
| Hungarian | 32 | 0.3% |
| Indian (Asian) | 15 | 0.1% |
| Irish | 1,765 | 15.0% |
| Italian | 643 | 5.5% |
| Korean | 19 | 0.2% |
| Lebanese | 15 | 0.1% |
| Lithuanian | 53 | 0.4% |
| Luxembourger | 4 | 0.0% |
| Mexican | 332 | 2.8% |
| Navajo | 1 | 0.0% |
| Northern European | 15 | 0.1% |
| Norwegian | 83 | 0.7% |
| Pennsylvania German | 39 | 0.3% |
| Polish | 366 | 3.1% |
| Potawatomi | 4 | 0.0% |
| Puerto Rican | 5 | 0.0% |
| Russian | 19 | 0.2% |
| Samoan | 7 | 0.1% |
| Scandinavian | 31 | 0.3% |
| Scotch-Irish | 73 | 0.6% |
| Scottish | 177 | 1.5% |
| Serbian | 10 | 0.1% |
| Sioux | 1 | 0.0% |
| Slavic | 5 | 0.0% |
| Slovak | 64 | 0.5% |
| Slovene | 1 | 0.0% |
| South African | 2 | 0.0% |
| Spanish | 5 | 0.0% |
| Subsaharan African | 8 | 0.1% |
| Swedish | 312 | 2.7% |
| Swiss | 115 | 1.0% |
| Syrian | 34 | 0.3% |
| Thai | 1 | 0.0% |
| Welsh | 90 | 0.8% |
| Yugoslavian | 2 | 0.0% | View All 63 Rows |
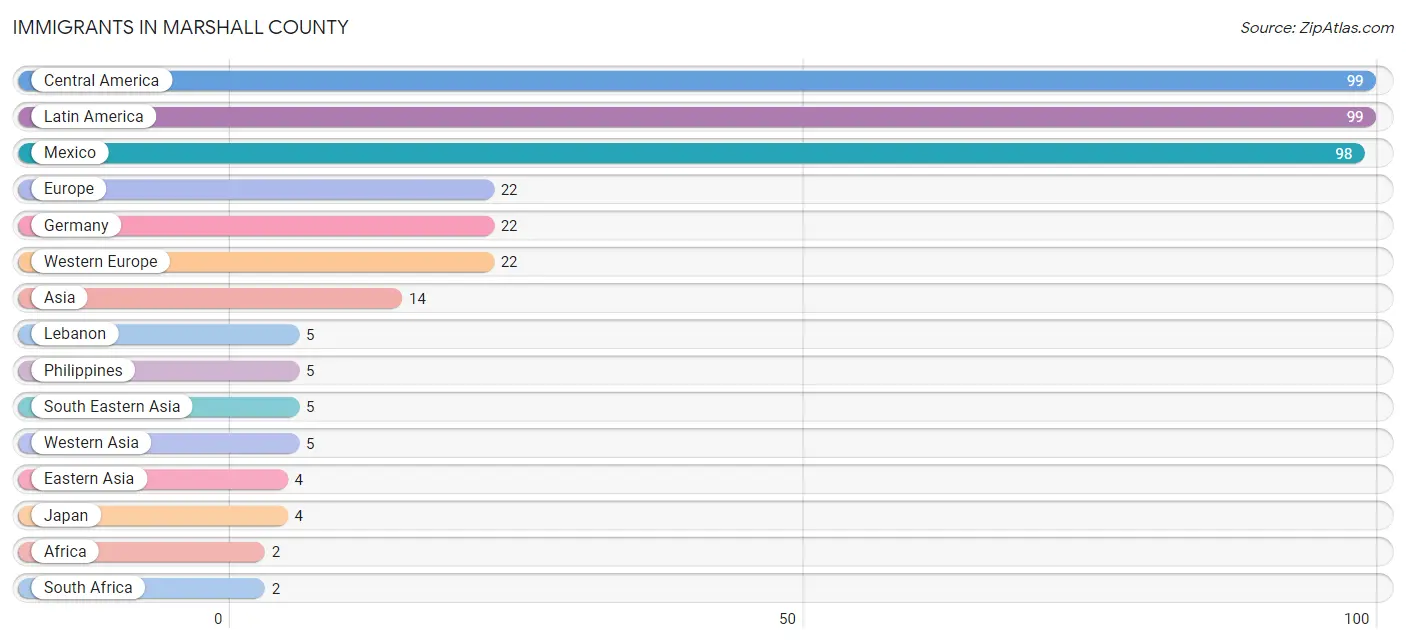
Immigrants in Marshall County
The most numerous immigrant groups reported in Marshall County came from Central America (99 | 0.8%), Latin America (99 | 0.8%), Mexico (98 | 0.8%), Europe (22 | 0.2%), and Germany (22 | 0.2%), together accounting for 2.9% of all Marshall County residents.
| Immigration Origin | # Population | % Population |
| Africa | 2 | 0.0% |
| Asia | 14 | 0.1% |
| Central America | 99 | 0.8% |
| Eastern Asia | 4 | 0.0% |
| Europe | 22 | 0.2% |
| Germany | 22 | 0.2% |
| Guatemala | 1 | 0.0% |
| Japan | 4 | 0.0% |
| Latin America | 99 | 0.8% |
| Lebanon | 5 | 0.0% |
| Mexico | 98 | 0.8% |
| Philippines | 5 | 0.0% |
| South Africa | 2 | 0.0% |
| South Eastern Asia | 5 | 0.0% |
| Western Asia | 5 | 0.0% |
| Western Europe | 22 | 0.2% | View All 16 Rows |
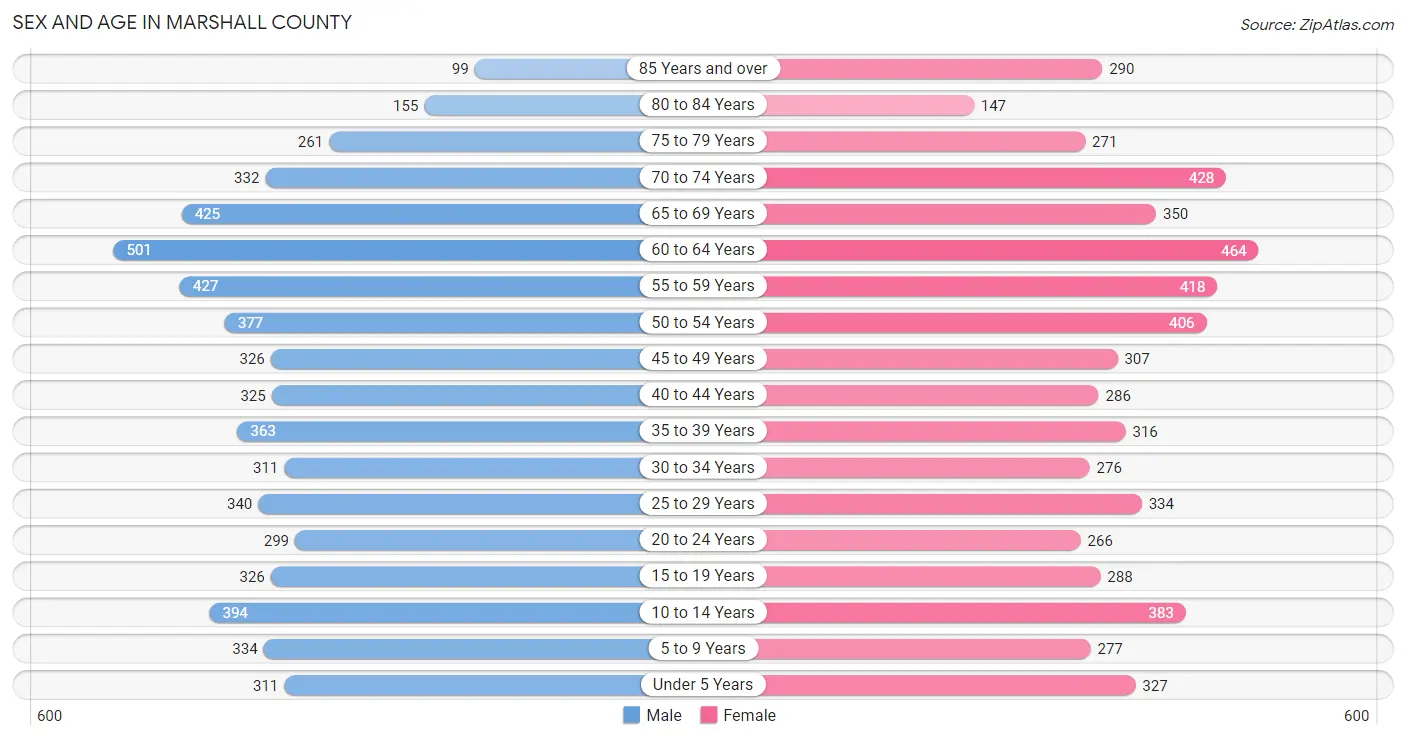
Sex and Age in Marshall County
Sex and Age in Marshall County
The most populous age groups in Marshall County are 60 to 64 Years (501 | 8.5%) for men and 60 to 64 Years (464 | 8.0%) for women.
| Age Bracket | Male | Female |
| Under 5 Years | 311 (5.3%) | 327 (5.6%) |
| 5 to 9 Years | 334 (5.7%) | 277 (4.8%) |
| 10 to 14 Years | 394 (6.7%) | 383 (6.6%) |
| 15 to 19 Years | 326 (5.5%) | 288 (4.9%) |
| 20 to 24 Years | 299 (5.1%) | 266 (4.6%) |
| 25 to 29 Years | 340 (5.8%) | 334 (5.7%) |
| 30 to 34 Years | 311 (5.3%) | 276 (4.7%) |
| 35 to 39 Years | 363 (6.1%) | 316 (5.4%) |
| 40 to 44 Years | 325 (5.5%) | 286 (4.9%) |
| 45 to 49 Years | 326 (5.5%) | 307 (5.3%) |
| 50 to 54 Years | 377 (6.4%) | 406 (7.0%) |
| 55 to 59 Years | 427 (7.2%) | 418 (7.2%) |
| 60 to 64 Years | 501 (8.5%) | 464 (8.0%) |
| 65 to 69 Years | 425 (7.2%) | 350 (6.0%) |
| 70 to 74 Years | 332 (5.6%) | 428 (7.3%) |
| 75 to 79 Years | 261 (4.4%) | 271 (4.6%) |
| 80 to 84 Years | 155 (2.6%) | 147 (2.5%) |
| 85 Years and over | 99 (1.7%) | 290 (5.0%) |
| Total | 5,906 (100.0%) | 5,834 (100.0%) |
Families and Households in Marshall County
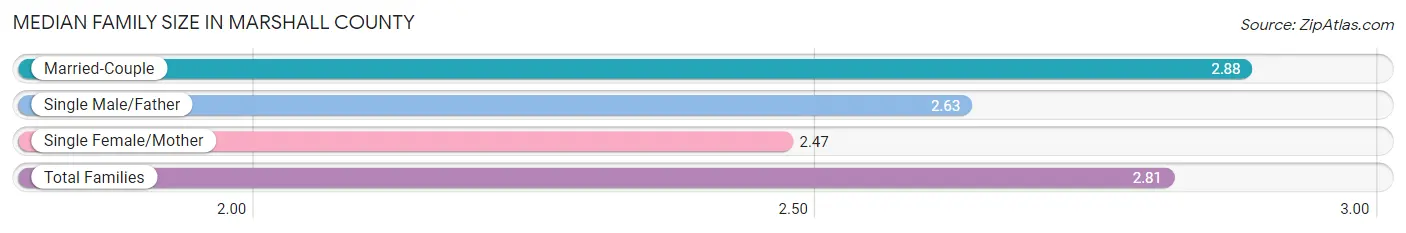
Median Family Size in Marshall County
The median family size in Marshall County is 2.81 persons per family, with married-couple families (2,538 | 79.0%) accounting for the largest median family size of 2.88 persons per family. On the other hand, single female/mother families (482 | 15.0%) represent the smallest median family size with 2.47 persons per family.
| Family Type | # Families | Family Size |
| Married-Couple | 2,538 (79.0%) | 2.88 |
| Single Male/Father | 192 (6.0%) | 2.63 |
| Single Female/Mother | 482 (15.0%) | 2.47 |
| Total Families | 3,212 (100.0%) | 2.81 |
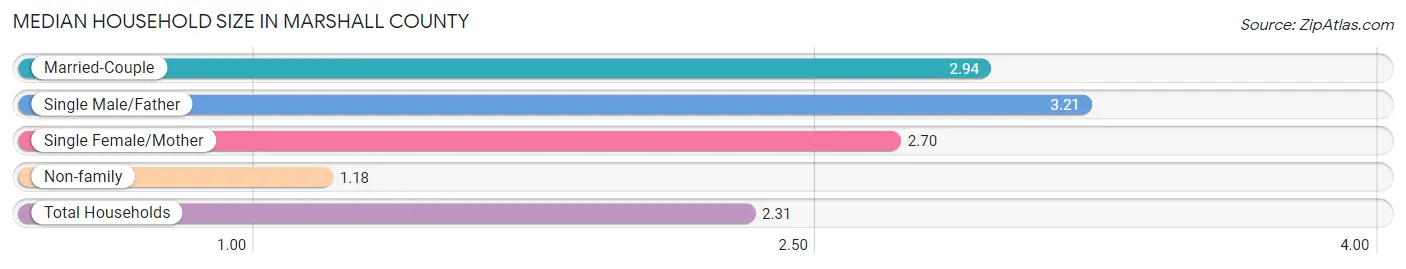
Median Household Size in Marshall County
The median household size in Marshall County is 2.31 persons per household, with single male/father households (192 | 3.9%) accounting for the largest median household size of 3.21 persons per household. non-family households (1,755 | 35.3%) represent the smallest median household size with 1.18 persons per household.
| Household Type | # Households | Household Size |
| Married-Couple | 2,538 (51.1%) | 2.94 |
| Single Male/Father | 192 (3.9%) | 3.21 |
| Single Female/Mother | 482 (9.7%) | 2.70 |
| Non-family | 1,755 (35.3%) | 1.18 |
| Total Households | 4,967 (100.0%) | 2.31 |
Household Size by Marriage Status in Marshall County
Out of a total of 4,967 households in Marshall County, 3,212 (64.7%) are family households, while 1,755 (35.3%) are nonfamily households. The most numerous type of family households are 2-person households, comprising 1,691, and the most common type of nonfamily households are 1-person households, comprising 1,476.
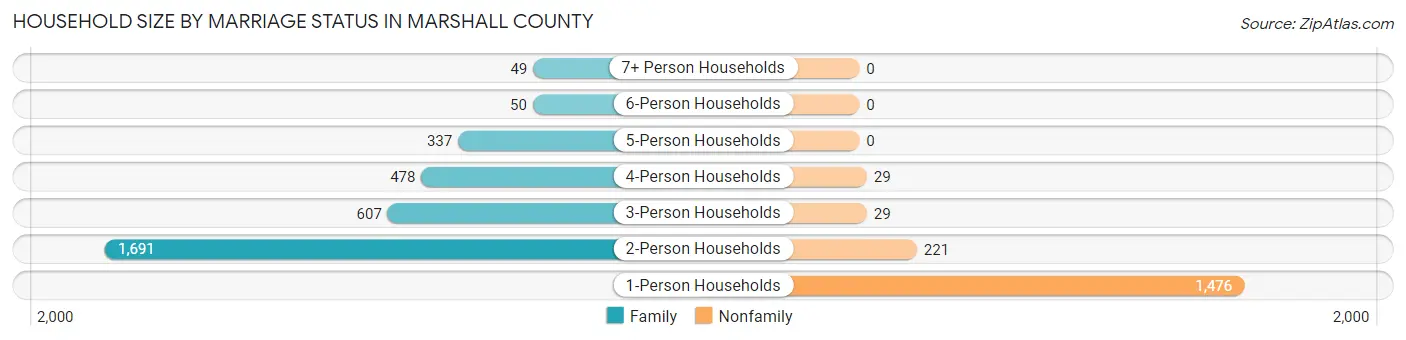
| Household Size | Family Households | Nonfamily Households |
| 1-Person Households | - | 1,476 (29.7%) |
| 2-Person Households | 1,691 (34.0%) | 221 (4.4%) |
| 3-Person Households | 607 (12.2%) | 29 (0.6%) |
| 4-Person Households | 478 (9.6%) | 29 (0.6%) |
| 5-Person Households | 337 (6.8%) | 0 (0.0%) |
| 6-Person Households | 50 (1.0%) | 0 (0.0%) |
| 7+ Person Households | 49 (1.0%) | 0 (0.0%) |
| Total | 3,212 (64.7%) | 1,755 (35.3%) |
Female Fertility in Marshall County
Fertility by Age in Marshall County
Average fertility rate in Marshall County is 88.0 births per 1,000 women. Women in the age bracket of 20 to 34 years have the highest fertility rate with 155.0 births per 1,000 women. Women in the age bracket of 20 to 34 years acount for 71.6% of all women with births.
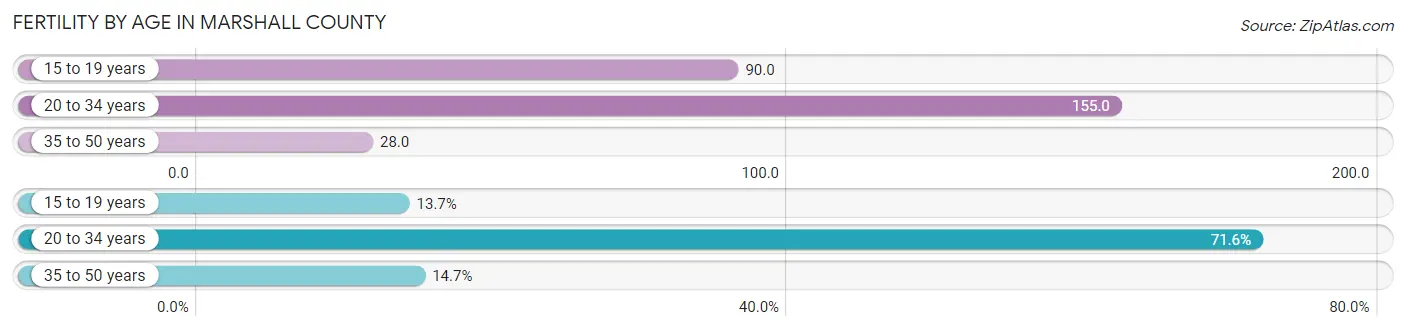
| Age Bracket | Women with Births | Births / 1,000 Women |
| 15 to 19 years | 26 (13.7%) | 90.0 |
| 20 to 34 years | 136 (71.6%) | 155.0 |
| 35 to 50 years | 28 (14.7%) | 28.0 |
| Total | 190 (100.0%) | 88.0 |
Fertility by Age by Marriage Status in Marshall County
49.5% of women with births (190) in Marshall County are married. The highest percentage of unmarried women with births falls into 15 to 19 years age bracket with 100.0% of them unmarried at the time of birth, while the lowest percentage of unmarried women with births belong to 35 to 50 years age bracket with 0.0% of them unmarried.
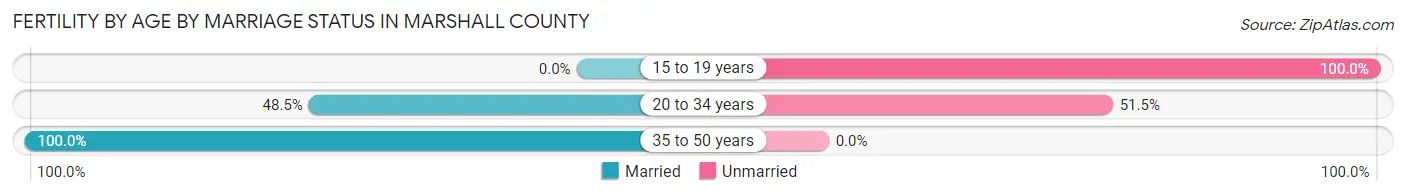
| Age Bracket | Married | Unmarried |
| 15 to 19 years | 0 (0.0%) | 26 (100.0%) |
| 20 to 34 years | 66 (48.5%) | 70 (51.5%) |
| 35 to 50 years | 28 (100.0%) | 0 (0.0%) |
| Total | 94 (49.5%) | 96 (50.5%) |
Fertility by Education in Marshall County
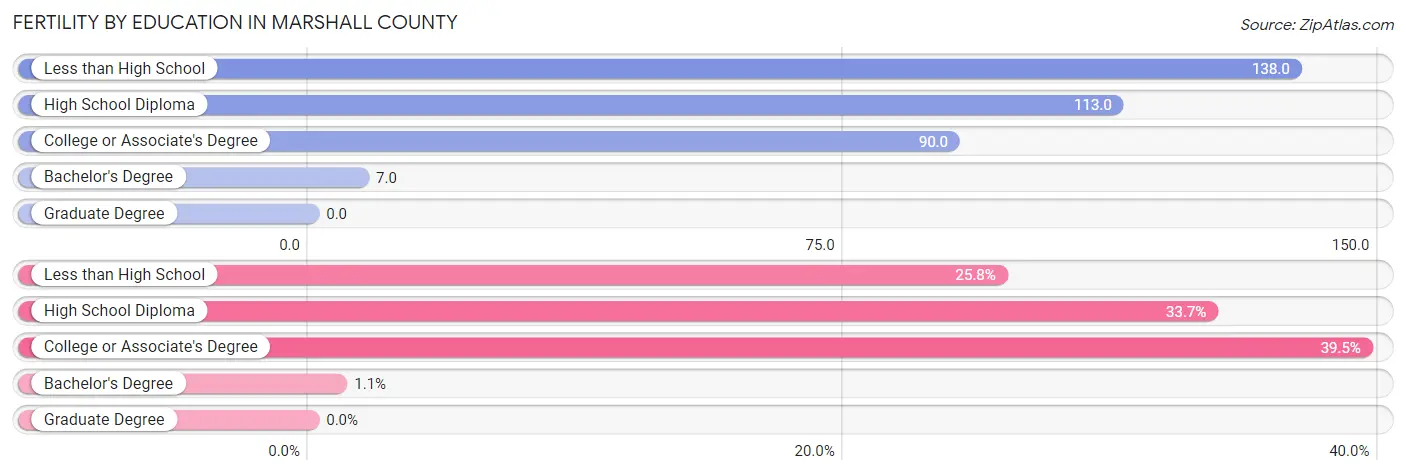
| Educational Attainment | Women with Births | Births / 1,000 Women |
| Less than High School | 49 (25.8%) | 138.0 |
| High School Diploma | 64 (33.7%) | 113.0 |
| College or Associate's Degree | 75 (39.5%) | 90.0 |
| Bachelor's Degree | 2 (1.1%) | 7.0 |
| Graduate Degree | 0 (0.0%) | 0.0 |
| Total | 190 (100.0%) | 88.0 |
Fertility by Education by Marriage Status in Marshall County
50.5% of women with births in Marshall County are unmarried. Women with the educational attainment of bachelor's degree are most likely to be married with 100.0% of them married at childbirth, while women with the educational attainment of high school diploma are least likely to be married with 70.3% of them unmarried at childbirth.
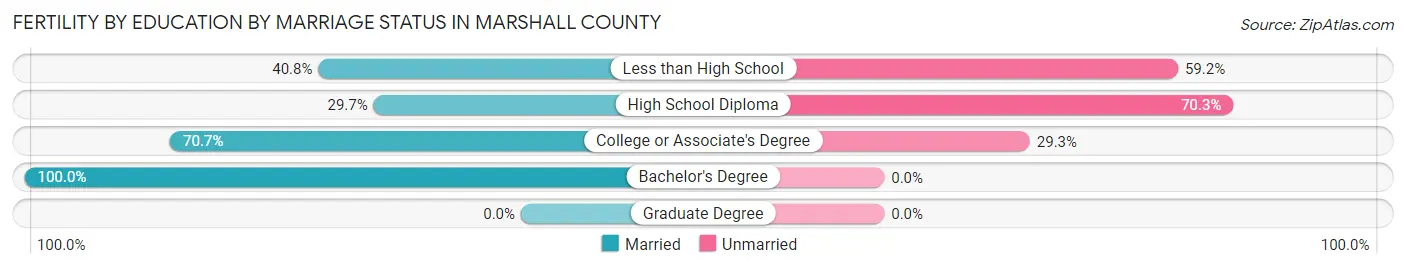
| Educational Attainment | Married | Unmarried |
| Less than High School | 20 (40.8%) | 29 (59.2%) |
| High School Diploma | 19 (29.7%) | 45 (70.3%) |
| College or Associate's Degree | 53 (70.7%) | 22 (29.3%) |
| Bachelor's Degree | 2 (100.0%) | 0 (0.0%) |
| Graduate Degree | 0 (0.0%) | 0 (0.0%) |
| Total | 94 (49.5%) | 96 (50.5%) |
Employment Characteristics in Marshall County
Employment by Class of Employer in Marshall County
Among the 5,110 employed individuals in Marshall County, private company employees (3,471 | 67.9%), not-for-profit organizations (463 | 9.1%), and local government employees (408 | 8.0%) make up the most common classes of employment.
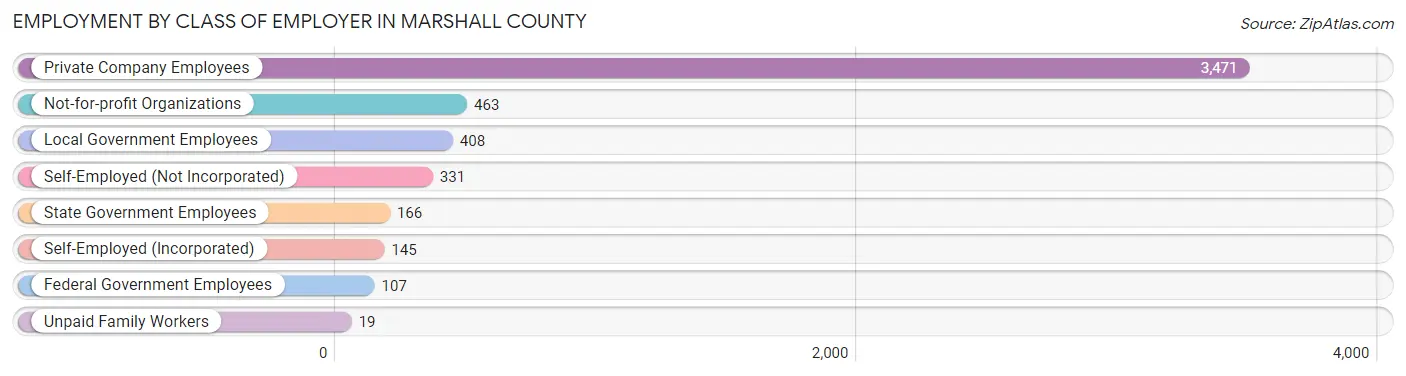
| Employer Class | # Employees | % Employees |
| Private Company Employees | 3,471 | 67.9% |
| Self-Employed (Incorporated) | 145 | 2.8% |
| Self-Employed (Not Incorporated) | 331 | 6.5% |
| Not-for-profit Organizations | 463 | 9.1% |
| Local Government Employees | 408 | 8.0% |
| State Government Employees | 166 | 3.3% |
| Federal Government Employees | 107 | 2.1% |
| Unpaid Family Workers | 19 | 0.4% |
| Total | 5,110 | 100.0% |
Employment Status by Age in Marshall County
According to the labor force statistics for Marshall County, out of the total population over 16 years of age (9,589), 56.4% or 5,408 individuals are in the labor force, with 4.2% or 227 of them unemployed. The age group with the highest labor force participation rate is 30 to 34 years, with 88.1% or 517 individuals in the labor force. Within the labor force, the 20 to 24 years age range has the highest percentage of unemployed individuals, with 12.9% or 58 of them being unemployed.
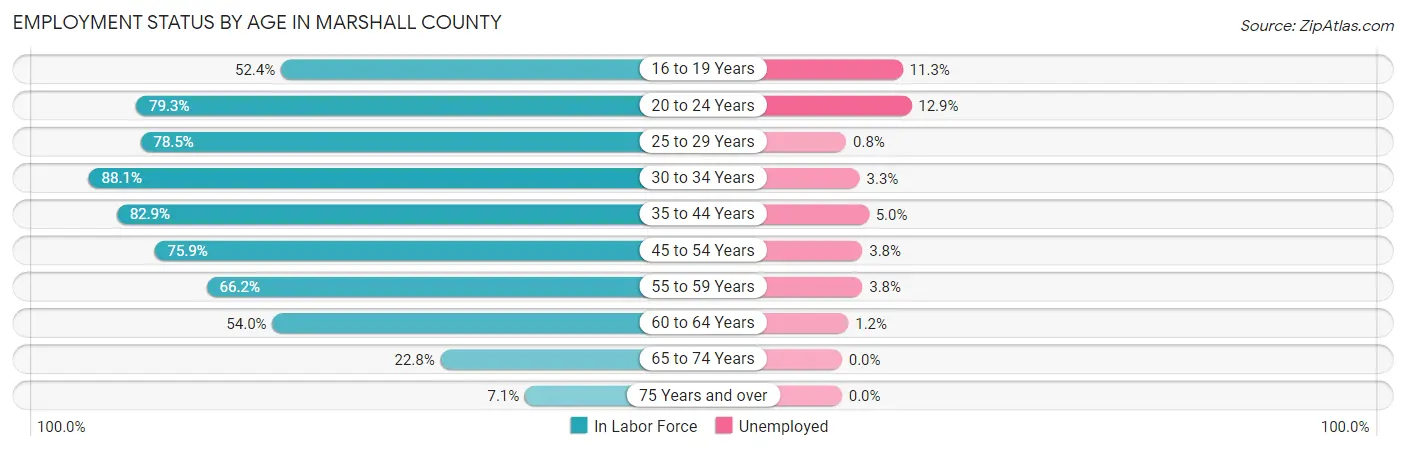
| Age Bracket | In Labor Force | Unemployed |
| 16 to 19 Years | 256 (52.4%) | 29 (11.3%) |
| 20 to 24 Years | 448 (79.3%) | 58 (12.9%) |
| 25 to 29 Years | 529 (78.5%) | 4 (0.8%) |
| 30 to 34 Years | 517 (88.1%) | 17 (3.3%) |
| 35 to 44 Years | 1,069 (82.9%) | 53 (5.0%) |
| 45 to 54 Years | 1,075 (75.9%) | 41 (3.8%) |
| 55 to 59 Years | 559 (66.2%) | 21 (3.8%) |
| 60 to 64 Years | 521 (54.0%) | 6 (1.2%) |
| 65 to 74 Years | 350 (22.8%) | 0 (0.0%) |
| 75 Years and over | 87 (7.1%) | 0 (0.0%) |
| Total | 5,408 (56.4%) | 227 (4.2%) |
Employment Status by Educational Attainment in Marshall County
According to labor force statistics for Marshall County, 73.9% of individuals (4,269) out of the total population between 25 and 64 years of age (5,777) are in the labor force, with 3.3% or 141 of them being unemployed. The group with the highest labor force participation rate are those with the educational attainment of bachelor's degree or higher, with 78.9% or 877 individuals in the labor force. Within the labor force, individuals with less than high school education have the highest percentage of unemployment, with 13.5% or 23 of them being unemployed.
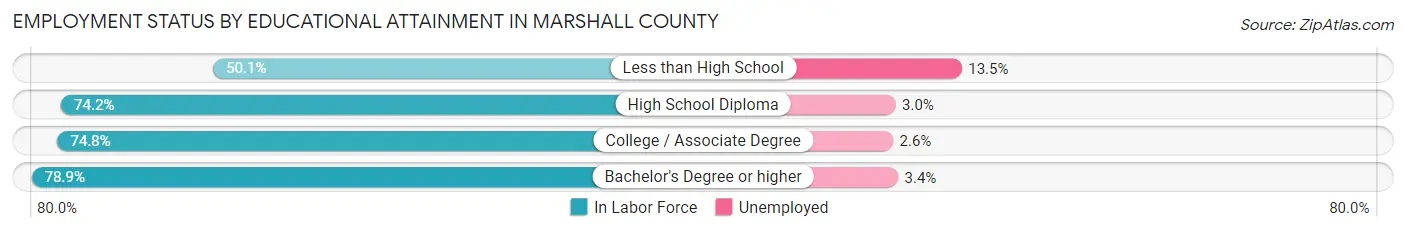
| Educational Attainment | In Labor Force | Unemployed |
| Less than High School | 170 (50.1%) | 46 (13.5%) |
| High School Diploma | 1,498 (74.2%) | 61 (3.0%) |
| College / Associate Degree | 1,726 (74.8%) | 60 (2.6%) |
| Bachelor's Degree or higher | 877 (78.9%) | 38 (3.4%) |
| Total | 4,269 (73.9%) | 191 (3.3%) |
Employment Occupations by Sex in Marshall County
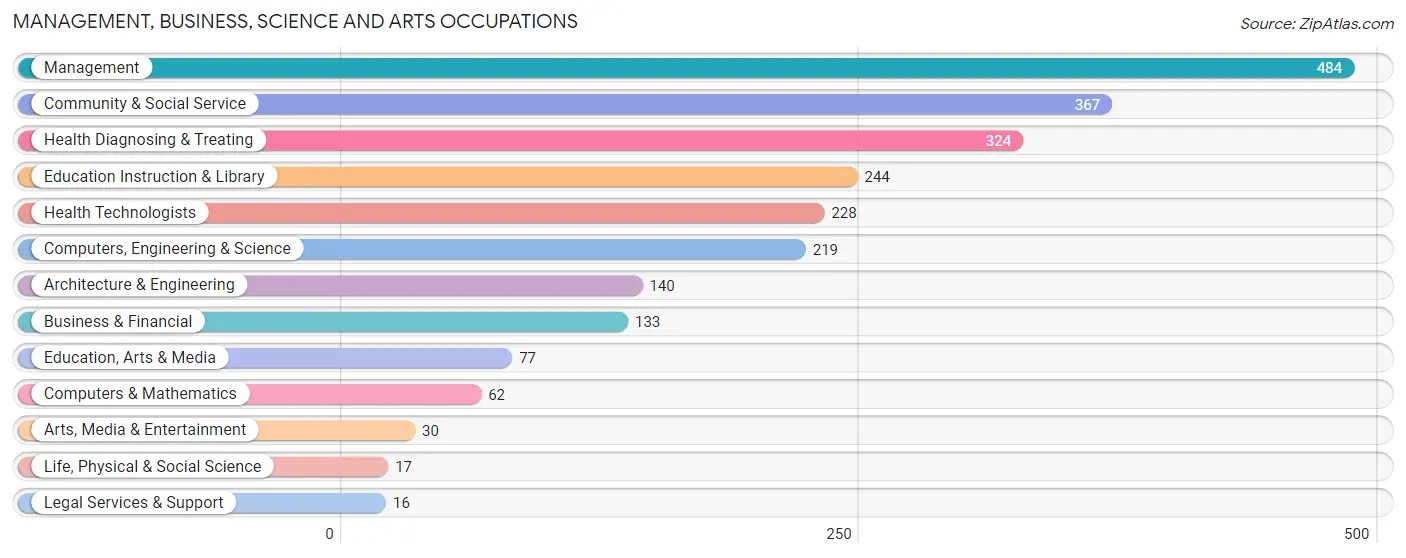
Management, Business, Science and Arts Occupations
The most common Management, Business, Science and Arts occupations in Marshall County are Management (484 | 9.3%), Community & Social Service (367 | 7.1%), Health Diagnosing & Treating (324 | 6.2%), Education Instruction & Library (244 | 4.7%), and Health Technologists (228 | 4.4%).
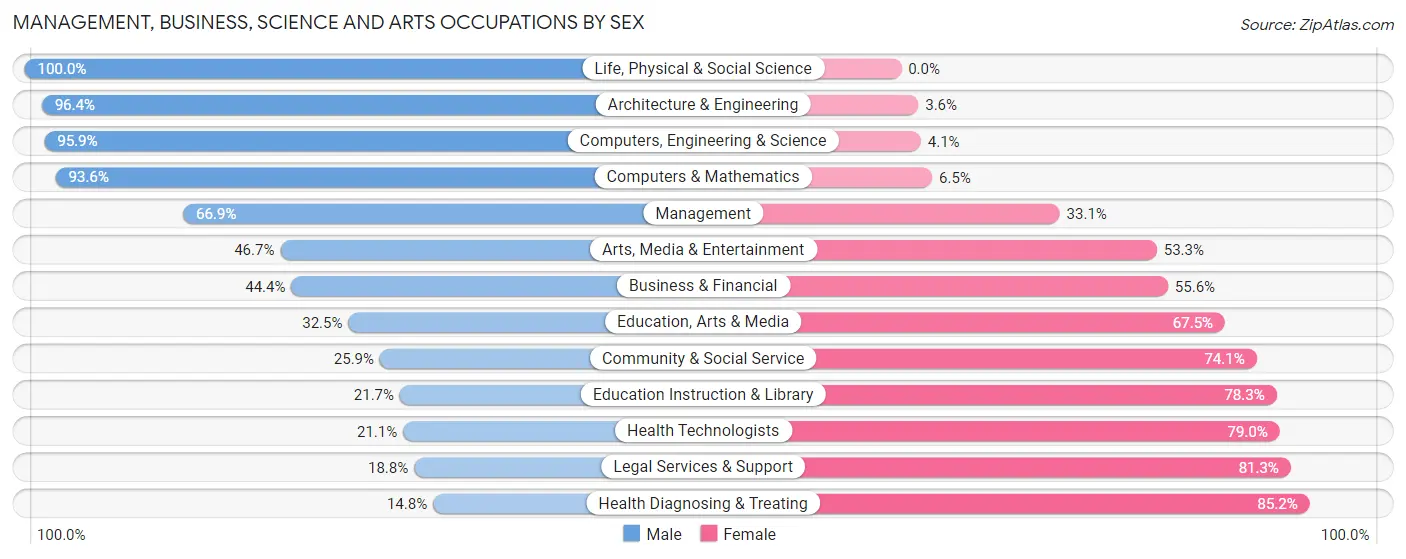
Management, Business, Science and Arts Occupations by Sex
Within the Management, Business, Science and Arts occupations in Marshall County, the most male-oriented occupations are Life, Physical & Social Science (100.0%), Architecture & Engineering (96.4%), and Computers, Engineering & Science (95.9%), while the most female-oriented occupations are Health Diagnosing & Treating (85.2%), Legal Services & Support (81.2%), and Health Technologists (78.9%).
| Occupation | Male | Female |
| Management | 324 (66.9%) | 160 (33.1%) |
| Business & Financial | 59 (44.4%) | 74 (55.6%) |
| Computers, Engineering & Science | 210 (95.9%) | 9 (4.1%) |
| Computers & Mathematics | 58 (93.5%) | 4 (6.5%) |
| Architecture & Engineering | 135 (96.4%) | 5 (3.6%) |
| Life, Physical & Social Science | 17 (100.0%) | 0 (0.0%) |
| Community & Social Service | 95 (25.9%) | 272 (74.1%) |
| Education, Arts & Media | 25 (32.5%) | 52 (67.5%) |
| Legal Services & Support | 3 (18.8%) | 13 (81.2%) |
| Education Instruction & Library | 53 (21.7%) | 191 (78.3%) |
| Arts, Media & Entertainment | 14 (46.7%) | 16 (53.3%) |
| Health Diagnosing & Treating | 48 (14.8%) | 276 (85.2%) |
| Health Technologists | 48 (21.0%) | 180 (78.9%) |
| Total (Category) | 736 (48.2%) | 791 (51.8%) |
| Total (Overall) | 2,857 (55.1%) | 2,325 (44.9%) |
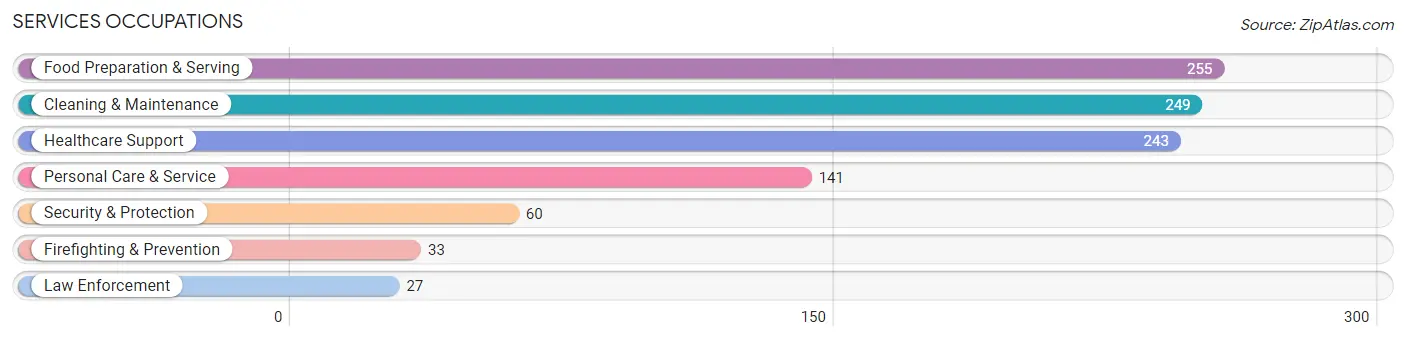
Services Occupations
The most common Services occupations in Marshall County are Food Preparation & Serving (255 | 4.9%), Cleaning & Maintenance (249 | 4.8%), Healthcare Support (243 | 4.7%), Personal Care & Service (141 | 2.7%), and Security & Protection (60 | 1.2%).
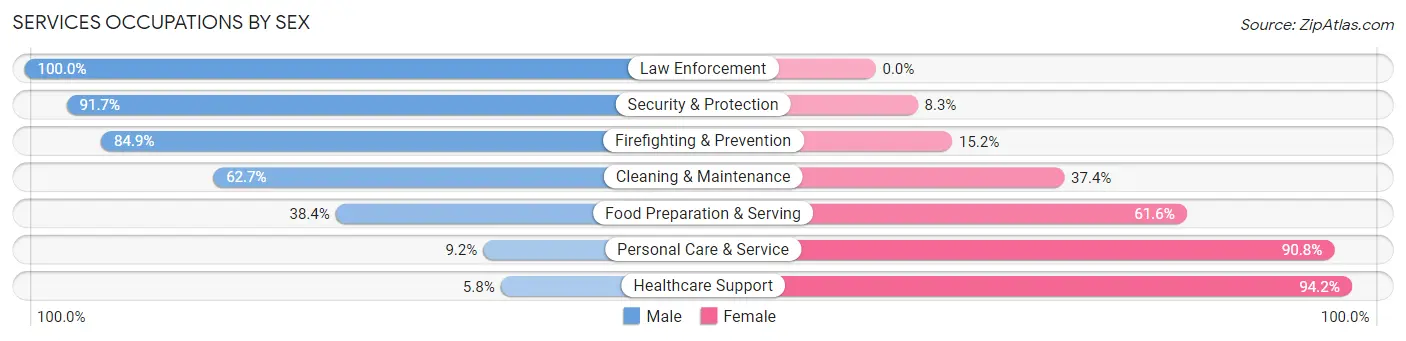
Services Occupations by Sex
Within the Services occupations in Marshall County, the most male-oriented occupations are Law Enforcement (100.0%), Security & Protection (91.7%), and Firefighting & Prevention (84.9%), while the most female-oriented occupations are Healthcare Support (94.2%), Personal Care & Service (90.8%), and Food Preparation & Serving (61.6%).
| Occupation | Male | Female |
| Healthcare Support | 14 (5.8%) | 229 (94.2%) |
| Security & Protection | 55 (91.7%) | 5 (8.3%) |
| Firefighting & Prevention | 28 (84.9%) | 5 (15.1%) |
| Law Enforcement | 27 (100.0%) | 0 (0.0%) |
| Food Preparation & Serving | 98 (38.4%) | 157 (61.6%) |
| Cleaning & Maintenance | 156 (62.6%) | 93 (37.3%) |
| Personal Care & Service | 13 (9.2%) | 128 (90.8%) |
| Total (Category) | 336 (35.4%) | 612 (64.6%) |
| Total (Overall) | 2,857 (55.1%) | 2,325 (44.9%) |
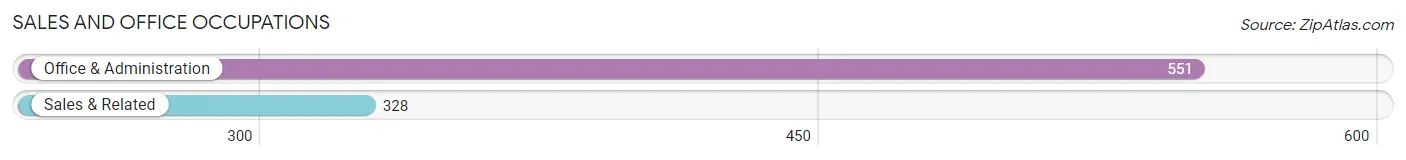
Sales and Office Occupations
The most common Sales and Office occupations in Marshall County are Office & Administration (551 | 10.6%), and Sales & Related (328 | 6.3%).
Sales and Office Occupations by Sex
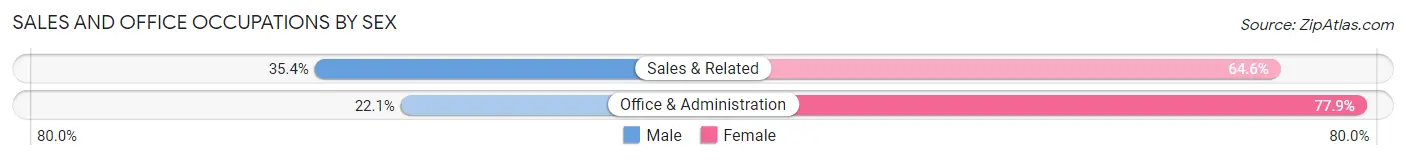
| Occupation | Male | Female |
| Sales & Related | 116 (35.4%) | 212 (64.6%) |
| Office & Administration | 122 (22.1%) | 429 (77.9%) |
| Total (Category) | 238 (27.1%) | 641 (72.9%) |
| Total (Overall) | 2,857 (55.1%) | 2,325 (44.9%) |
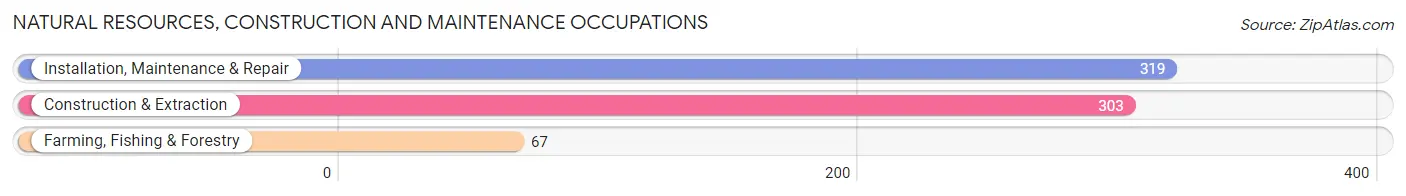
Natural Resources, Construction and Maintenance Occupations
The most common Natural Resources, Construction and Maintenance occupations in Marshall County are Installation, Maintenance & Repair (319 | 6.2%), Construction & Extraction (303 | 5.9%), and Farming, Fishing & Forestry (67 | 1.3%).
Natural Resources, Construction and Maintenance Occupations by Sex
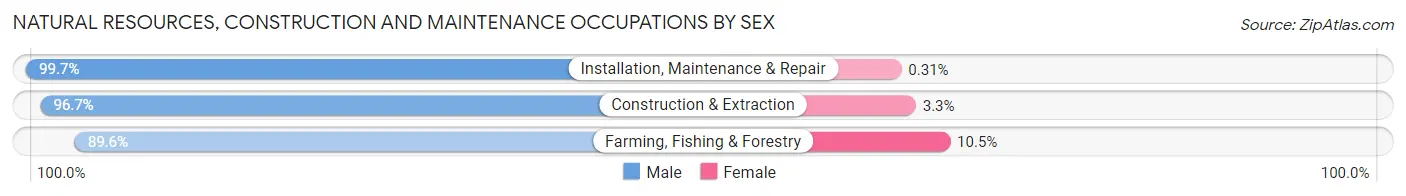
| Occupation | Male | Female |
| Farming, Fishing & Forestry | 60 (89.5%) | 7 (10.4%) |
| Construction & Extraction | 293 (96.7%) | 10 (3.3%) |
| Installation, Maintenance & Repair | 318 (99.7%) | 1 (0.3%) |
| Total (Category) | 671 (97.4%) | 18 (2.6%) |
| Total (Overall) | 2,857 (55.1%) | 2,325 (44.9%) |
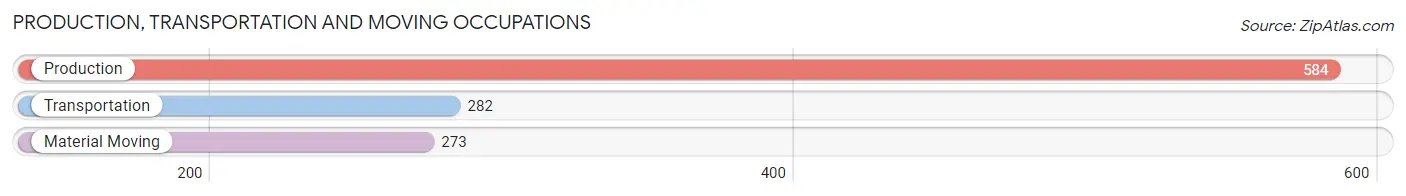
Production, Transportation and Moving Occupations
The most common Production, Transportation and Moving occupations in Marshall County are Production (584 | 11.3%), Transportation (282 | 5.4%), and Material Moving (273 | 5.3%).
Production, Transportation and Moving Occupations by Sex
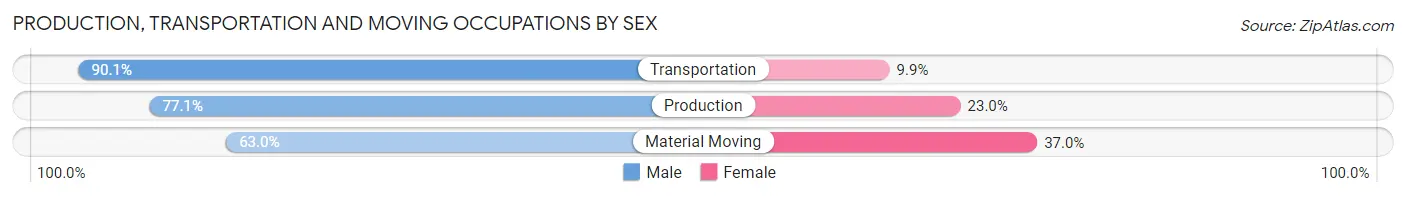
| Occupation | Male | Female |
| Production | 450 (77.0%) | 134 (23.0%) |
| Transportation | 254 (90.1%) | 28 (9.9%) |
| Material Moving | 172 (63.0%) | 101 (37.0%) |
| Total (Category) | 876 (76.9%) | 263 (23.1%) |
| Total (Overall) | 2,857 (55.1%) | 2,325 (44.9%) |
Employment Industries by Sex in Marshall County
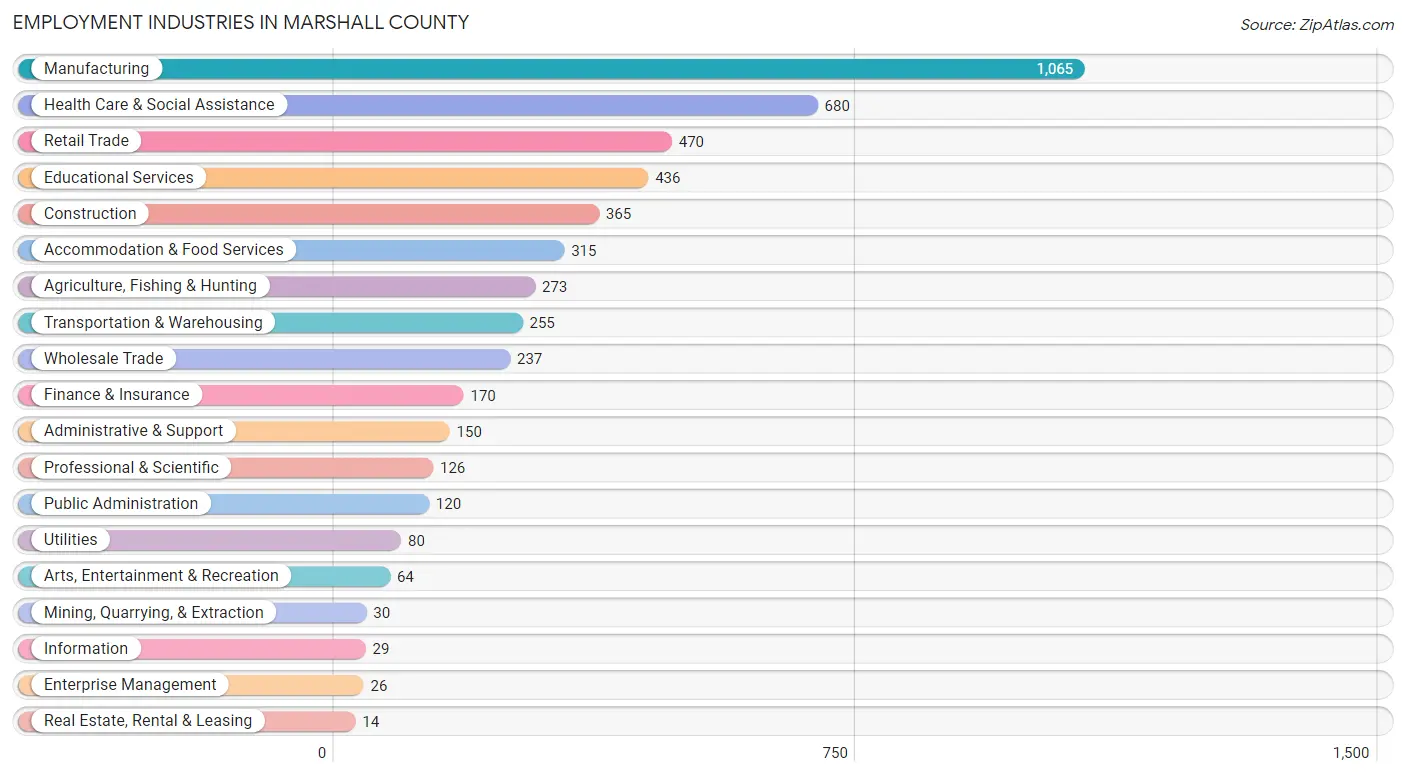
Employment Industries in Marshall County
The major employment industries in Marshall County include Manufacturing (1,065 | 20.5%), Health Care & Social Assistance (680 | 13.1%), Retail Trade (470 | 9.1%), Educational Services (436 | 8.4%), and Construction (365 | 7.0%).
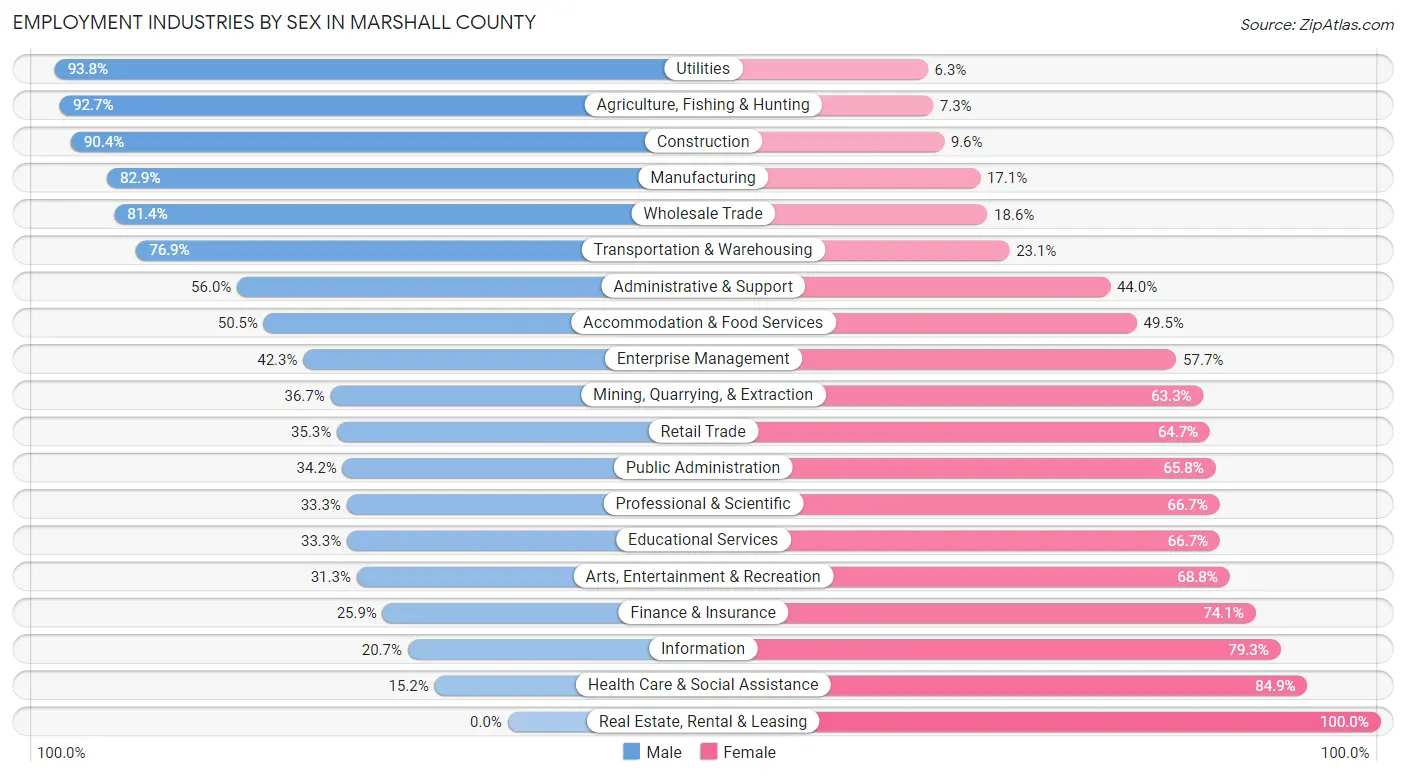
Employment Industries by Sex in Marshall County
The Marshall County industries that see more men than women are Utilities (93.8%), Agriculture, Fishing & Hunting (92.7%), and Construction (90.4%), whereas the industries that tend to have a higher number of women are Real Estate, Rental & Leasing (100.0%), Health Care & Social Assistance (84.9%), and Information (79.3%).
| Industry | Male | Female |
| Agriculture, Fishing & Hunting | 253 (92.7%) | 20 (7.3%) |
| Mining, Quarrying, & Extraction | 11 (36.7%) | 19 (63.3%) |
| Construction | 330 (90.4%) | 35 (9.6%) |
| Manufacturing | 883 (82.9%) | 182 (17.1%) |
| Wholesale Trade | 193 (81.4%) | 44 (18.6%) |
| Retail Trade | 166 (35.3%) | 304 (64.7%) |
| Transportation & Warehousing | 196 (76.9%) | 59 (23.1%) |
| Utilities | 75 (93.8%) | 5 (6.2%) |
| Information | 6 (20.7%) | 23 (79.3%) |
| Finance & Insurance | 44 (25.9%) | 126 (74.1%) |
| Real Estate, Rental & Leasing | 0 (0.0%) | 14 (100.0%) |
| Professional & Scientific | 42 (33.3%) | 84 (66.7%) |
| Enterprise Management | 11 (42.3%) | 15 (57.7%) |
| Administrative & Support | 84 (56.0%) | 66 (44.0%) |
| Educational Services | 145 (33.3%) | 291 (66.7%) |
| Health Care & Social Assistance | 103 (15.1%) | 577 (84.9%) |
| Arts, Entertainment & Recreation | 20 (31.2%) | 44 (68.8%) |
| Accommodation & Food Services | 159 (50.5%) | 156 (49.5%) |
| Public Administration | 41 (34.2%) | 79 (65.8%) |
| Total | 2,857 (55.1%) | 2,325 (44.9%) |
Education in Marshall County
School Enrollment in Marshall County
The most common levels of schooling among the 2,216 students in Marshall County are middle school (688 | 31.0%), high school (547 | 24.7%), and elementary school (498 | 22.5%).
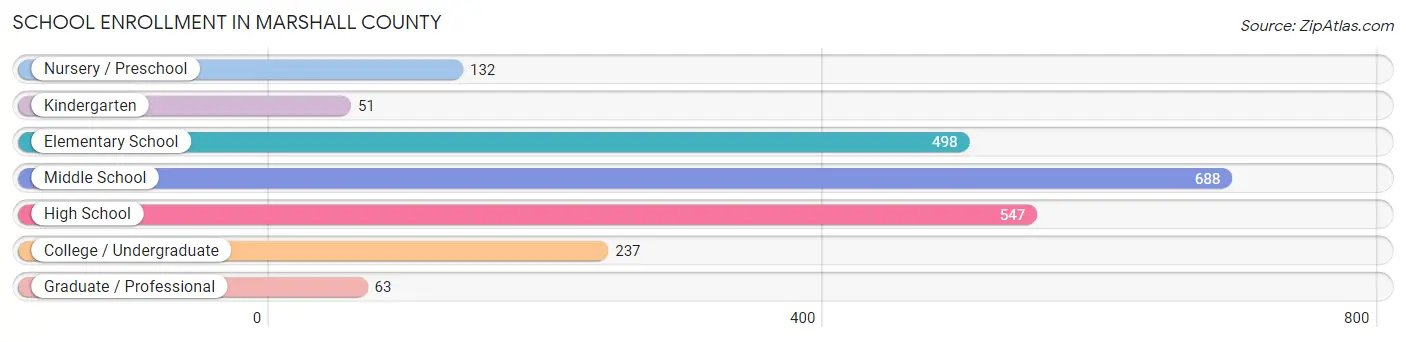
| School Level | # Students | % Students |
| Nursery / Preschool | 132 | 6.0% |
| Kindergarten | 51 | 2.3% |
| Elementary School | 498 | 22.5% |
| Middle School | 688 | 31.0% |
| High School | 547 | 24.7% |
| College / Undergraduate | 237 | 10.7% |
| Graduate / Professional | 63 | 2.8% |
| Total | 2,216 | 100.0% |
School Enrollment by Age by Funding Source in Marshall County
Out of a total of 2,216 students who are enrolled in schools in Marshall County, 250 (11.3%) attend a private institution, while the remaining 1,966 (88.7%) are enrolled in public schools. The age group of 3 to 4 year olds has the highest likelihood of being enrolled in private schools, with 27 (31.0% in the age bracket) enrolled. Conversely, the age group of 18 to 19 year olds has the lowest likelihood of being enrolled in a private school, with 110 (95.7% in the age bracket) attending a public institution.
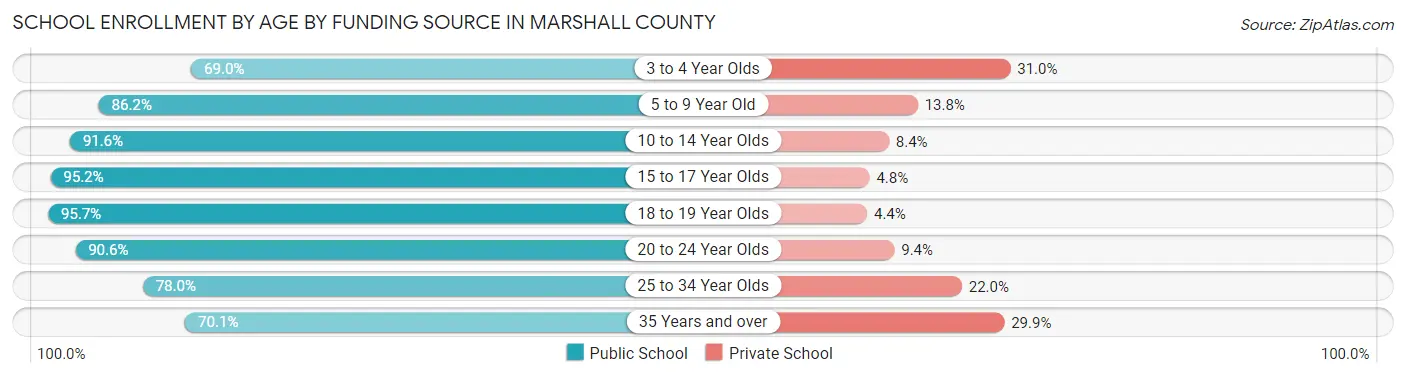
| Age Bracket | Public School | Private School |
| 3 to 4 Year Olds | 60 (69.0%) | 27 (31.0%) |
| 5 to 9 Year Old | 494 (86.2%) | 79 (13.8%) |
| 10 to 14 Year Olds | 707 (91.6%) | 65 (8.4%) |
| 15 to 17 Year Olds | 377 (95.2%) | 19 (4.8%) |
| 18 to 19 Year Olds | 110 (95.7%) | 5 (4.3%) |
| 20 to 24 Year Olds | 96 (90.6%) | 10 (9.4%) |
| 25 to 34 Year Olds | 39 (78.0%) | 11 (22.0%) |
| 35 Years and over | 82 (70.1%) | 35 (29.9%) |
| Total | 1,966 (88.7%) | 250 (11.3%) |
Educational Attainment by Field of Study in Marshall County
Education (274 | 17.2%), science & technology (263 | 16.5%), business (223 | 14.0%), engineering (175 | 11.0%), and bio, nature & agricultural (155 | 9.7%) are the most common fields of study among 1,592 individuals in Marshall County who have obtained a bachelor's degree or higher.
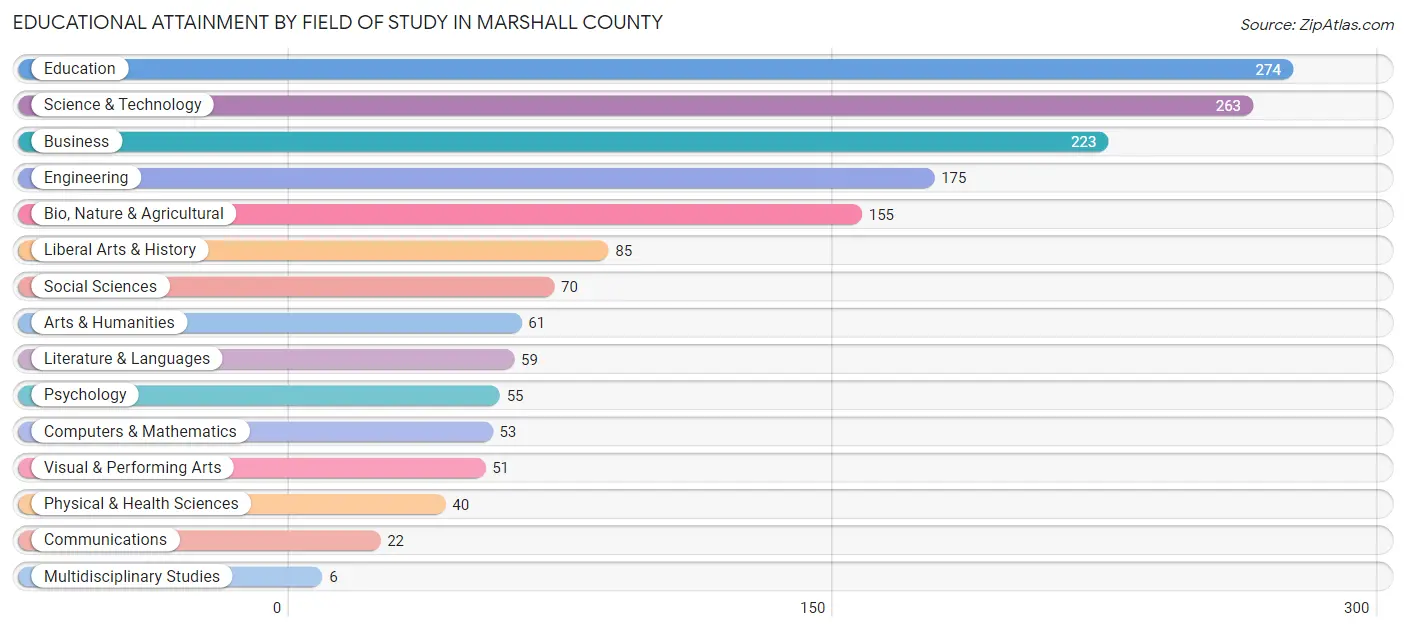
| Field of Study | # Graduates | % Graduates |
| Computers & Mathematics | 53 | 3.3% |
| Bio, Nature & Agricultural | 155 | 9.7% |
| Physical & Health Sciences | 40 | 2.5% |
| Psychology | 55 | 3.5% |
| Social Sciences | 70 | 4.4% |
| Engineering | 175 | 11.0% |
| Multidisciplinary Studies | 6 | 0.4% |
| Science & Technology | 263 | 16.5% |
| Business | 223 | 14.0% |
| Education | 274 | 17.2% |
| Literature & Languages | 59 | 3.7% |
| Liberal Arts & History | 85 | 5.3% |
| Visual & Performing Arts | 51 | 3.2% |
| Communications | 22 | 1.4% |
| Arts & Humanities | 61 | 3.8% |
| Total | 1,592 | 100.0% |
Transportation & Commute in Marshall County
Vehicle Availability by Sex in Marshall County
The most prevalent vehicle ownership categories in Marshall County are males with 2 vehicles (1,095, accounting for 38.9%) and females with 2 vehicles (904, making up 47.8%).
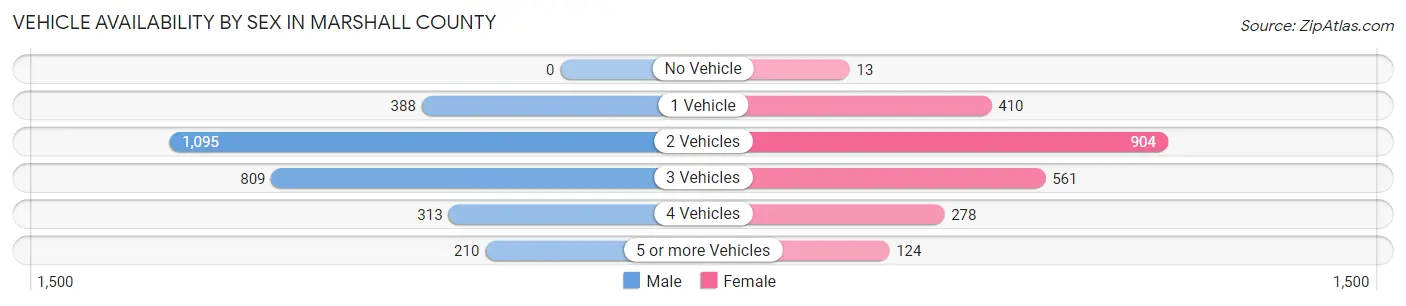
| Vehicles Available | Male | Female |
| No Vehicle | 0 (0.0%) | 13 (0.6%) |
| 1 Vehicle | 388 (13.8%) | 410 (17.9%) |
| 2 Vehicles | 1,095 (38.9%) | 904 (39.5%) |
| 3 Vehicles | 809 (28.7%) | 561 (24.5%) |
| 4 Vehicles | 313 (11.1%) | 278 (12.1%) |
| 5 or more Vehicles | 210 (7.5%) | 124 (5.4%) |
| Total | 2,815 (100.0%) | 2,290 (100.0%) |
Commute Time in Marshall County
The most frequently occuring commute durations in Marshall County are 5 to 9 minutes (587 commuters, 12.1%), 30 to 34 minutes (562 commuters, 11.6%), and 10 to 14 minutes (507 commuters, 10.5%).
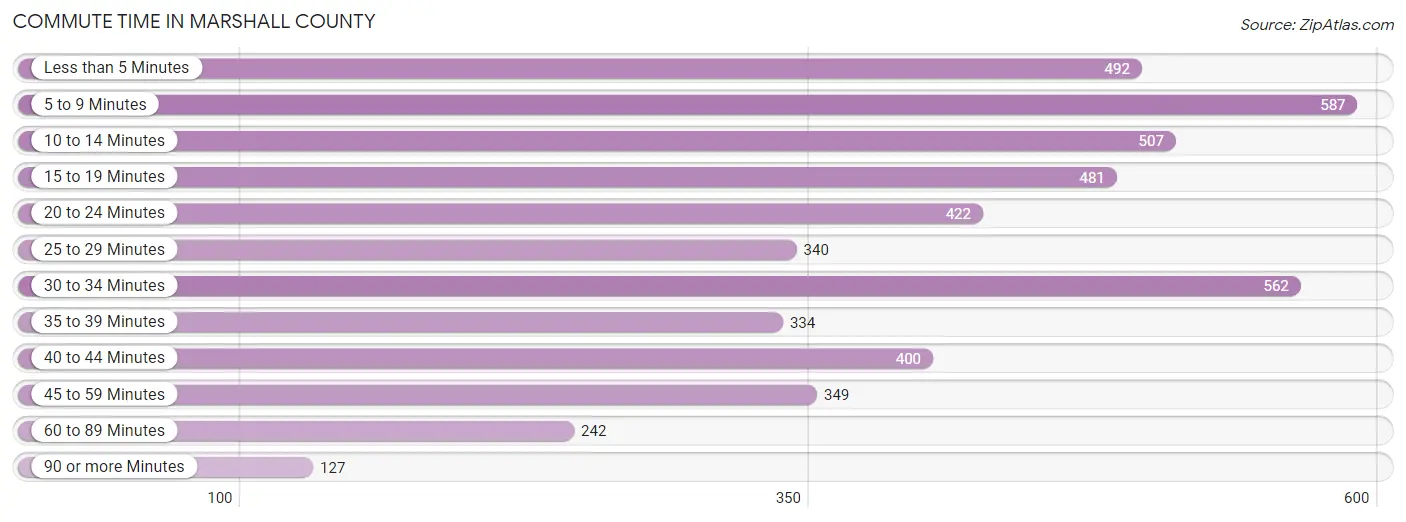
| Commute Time | # Commuters | % Commuters |
| Less than 5 Minutes | 492 | 10.2% |
| 5 to 9 Minutes | 587 | 12.1% |
| 10 to 14 Minutes | 507 | 10.5% |
| 15 to 19 Minutes | 481 | 9.9% |
| 20 to 24 Minutes | 422 | 8.7% |
| 25 to 29 Minutes | 340 | 7.0% |
| 30 to 34 Minutes | 562 | 11.6% |
| 35 to 39 Minutes | 334 | 6.9% |
| 40 to 44 Minutes | 400 | 8.3% |
| 45 to 59 Minutes | 349 | 7.2% |
| 60 to 89 Minutes | 242 | 5.0% |
| 90 or more Minutes | 127 | 2.6% |
Commute Time by Sex in Marshall County
The most common commute times in Marshall County are 30 to 34 minutes (335 commuters, 12.4%) for males and 5 to 9 minutes (314 commuters, 14.6%) for females.
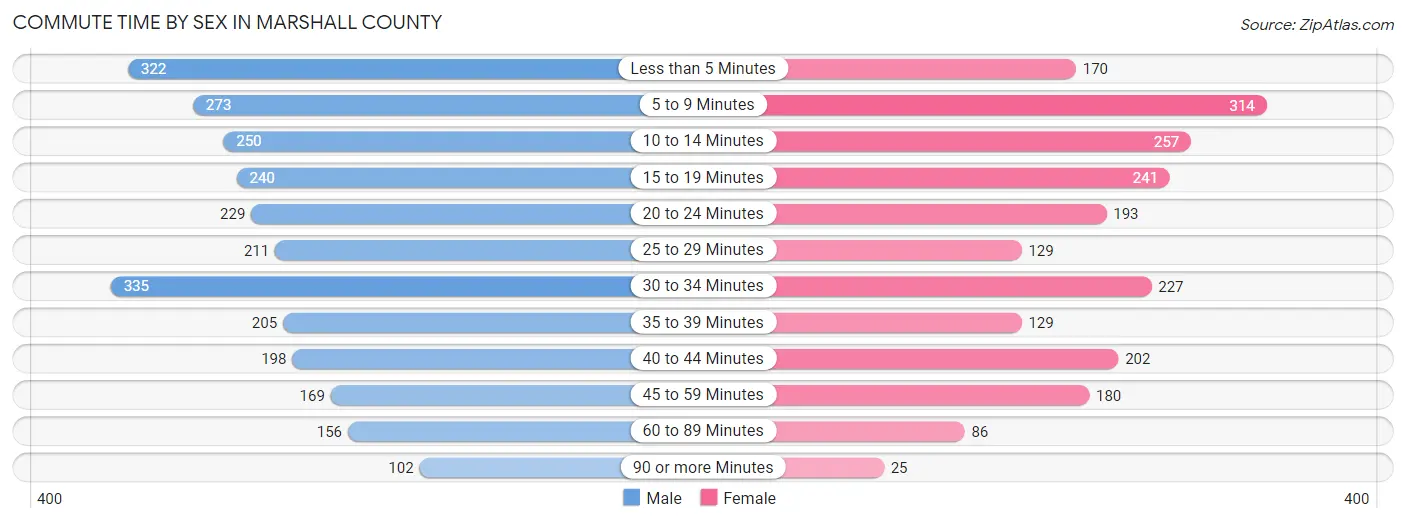
| Commute Time | Male | Female |
| Less than 5 Minutes | 322 (12.0%) | 170 (7.9%) |
| 5 to 9 Minutes | 273 (10.2%) | 314 (14.6%) |
| 10 to 14 Minutes | 250 (9.3%) | 257 (11.9%) |
| 15 to 19 Minutes | 240 (8.9%) | 241 (11.2%) |
| 20 to 24 Minutes | 229 (8.5%) | 193 (9.0%) |
| 25 to 29 Minutes | 211 (7.8%) | 129 (6.0%) |
| 30 to 34 Minutes | 335 (12.4%) | 227 (10.5%) |
| 35 to 39 Minutes | 205 (7.6%) | 129 (6.0%) |
| 40 to 44 Minutes | 198 (7.4%) | 202 (9.4%) |
| 45 to 59 Minutes | 169 (6.3%) | 180 (8.4%) |
| 60 to 89 Minutes | 156 (5.8%) | 86 (4.0%) |
| 90 or more Minutes | 102 (3.8%) | 25 (1.2%) |
Time of Departure to Work by Sex in Marshall County
The most frequent times of departure to work in Marshall County are 6:30 AM to 6:59 AM (415, 15.4%) for males and 7:00 AM to 7:29 AM (370, 17.2%) for females.
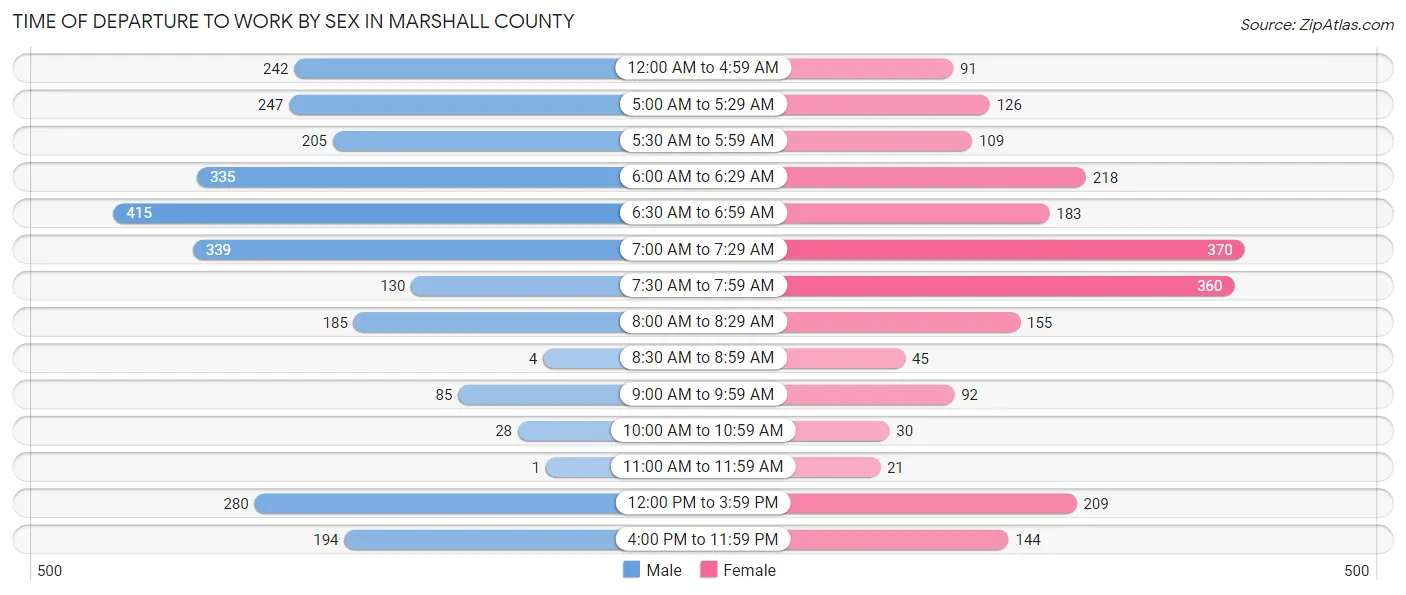
| Time of Departure | Male | Female |
| 12:00 AM to 4:59 AM | 242 (9.0%) | 91 (4.2%) |
| 5:00 AM to 5:29 AM | 247 (9.2%) | 126 (5.9%) |
| 5:30 AM to 5:59 AM | 205 (7.6%) | 109 (5.1%) |
| 6:00 AM to 6:29 AM | 335 (12.4%) | 218 (10.1%) |
| 6:30 AM to 6:59 AM | 415 (15.4%) | 183 (8.5%) |
| 7:00 AM to 7:29 AM | 339 (12.6%) | 370 (17.2%) |
| 7:30 AM to 7:59 AM | 130 (4.8%) | 360 (16.7%) |
| 8:00 AM to 8:29 AM | 185 (6.9%) | 155 (7.2%) |
| 8:30 AM to 8:59 AM | 4 (0.2%) | 45 (2.1%) |
| 9:00 AM to 9:59 AM | 85 (3.2%) | 92 (4.3%) |
| 10:00 AM to 10:59 AM | 28 (1.0%) | 30 (1.4%) |
| 11:00 AM to 11:59 AM | 1 (0.0%) | 21 (1.0%) |
| 12:00 PM to 3:59 PM | 280 (10.4%) | 209 (9.7%) |
| 4:00 PM to 11:59 PM | 194 (7.2%) | 144 (6.7%) |
| Total | 2,690 (100.0%) | 2,153 (100.0%) |
Housing Occupancy in Marshall County
Occupancy by Ownership in Marshall County
Of the total 4,967 dwellings in Marshall County, owner-occupied units account for 3,908 (78.7%), while renter-occupied units make up 1,059 (21.3%).
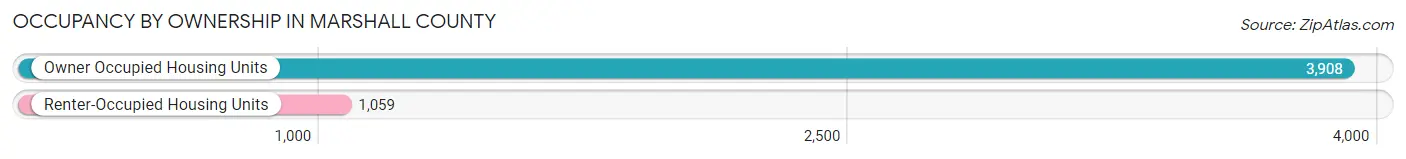
| Occupancy | # Housing Units | % Housing Units |
| Owner Occupied Housing Units | 3,908 | 78.7% |
| Renter-Occupied Housing Units | 1,059 | 21.3% |
| Total Occupied Housing Units | 4,967 | 100.0% |
Occupancy by Household Size in Marshall County
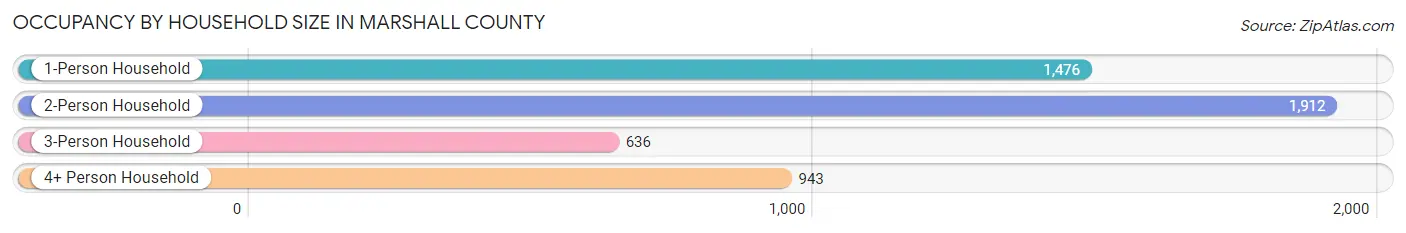
| Household Size | # Housing Units | % Housing Units |
| 1-Person Household | 1,476 | 29.7% |
| 2-Person Household | 1,912 | 38.5% |
| 3-Person Household | 636 | 12.8% |
| 4+ Person Household | 943 | 19.0% |
| Total Housing Units | 4,967 | 100.0% |
Occupancy by Ownership by Household Size in Marshall County
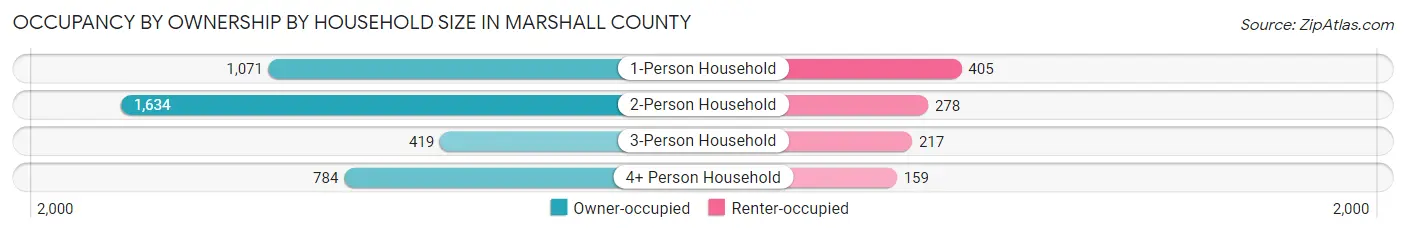
| Household Size | Owner-occupied | Renter-occupied |
| 1-Person Household | 1,071 (72.6%) | 405 (27.4%) |
| 2-Person Household | 1,634 (85.5%) | 278 (14.5%) |
| 3-Person Household | 419 (65.9%) | 217 (34.1%) |
| 4+ Person Household | 784 (83.1%) | 159 (16.9%) |
| Total Housing Units | 3,908 (78.7%) | 1,059 (21.3%) |
Occupancy by Educational Attainment in Marshall County
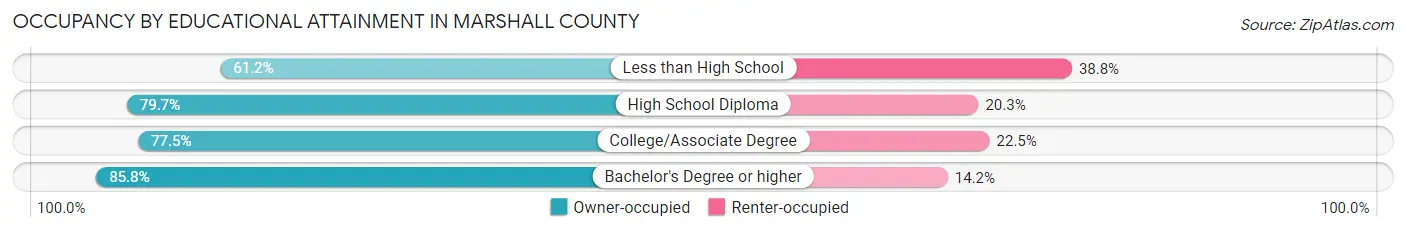
| Household Size | Owner-occupied | Renter-occupied |
| Less than High School | 208 (61.2%) | 132 (38.8%) |
| High School Diploma | 1,407 (79.7%) | 358 (20.3%) |
| College/Associate Degree | 1,520 (77.5%) | 441 (22.5%) |
| Bachelor's Degree or higher | 773 (85.8%) | 128 (14.2%) |
Occupancy by Age of Householder in Marshall County
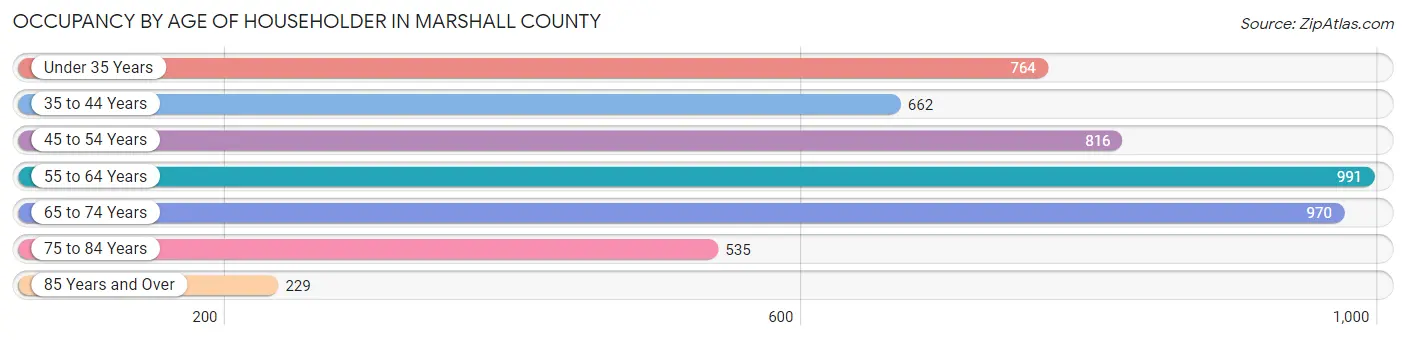
| Age Bracket | # Households | % Households |
| Under 35 Years | 764 | 15.4% |
| 35 to 44 Years | 662 | 13.3% |
| 45 to 54 Years | 816 | 16.4% |
| 55 to 64 Years | 991 | 20.0% |
| 65 to 74 Years | 970 | 19.5% |
| 75 to 84 Years | 535 | 10.8% |
| 85 Years and Over | 229 | 4.6% |
| Total | 4,967 | 100.0% |
Housing Finances in Marshall County
Median Income by Occupancy in Marshall County
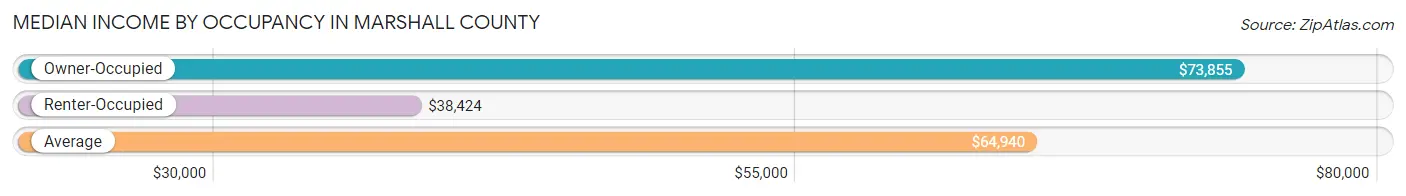
| Occupancy Type | # Households | Median Income |
| Owner-Occupied | 3,908 (78.7%) | $73,855 |
| Renter-Occupied | 1,059 (21.3%) | $38,424 |
| Average | 4,967 (100.0%) | $64,940 |
Occupancy by Householder Income Bracket in Marshall County
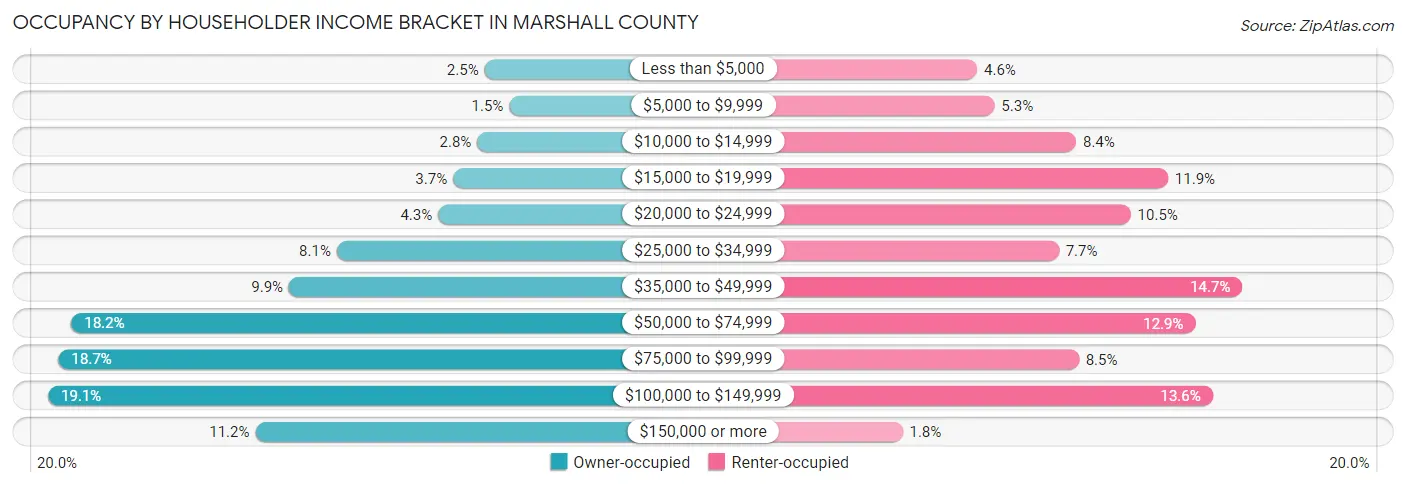
| Income Bracket | Owner-occupied | Renter-occupied |
| Less than $5,000 | 97 (2.5%) | 49 (4.6%) |
| $5,000 to $9,999 | 60 (1.5%) | 56 (5.3%) |
| $10,000 to $14,999 | 108 (2.8%) | 89 (8.4%) |
| $15,000 to $19,999 | 144 (3.7%) | 126 (11.9%) |
| $20,000 to $24,999 | 166 (4.3%) | 111 (10.5%) |
| $25,000 to $34,999 | 317 (8.1%) | 82 (7.7%) |
| $35,000 to $49,999 | 388 (9.9%) | 156 (14.7%) |
| $50,000 to $74,999 | 712 (18.2%) | 137 (12.9%) |
| $75,000 to $99,999 | 731 (18.7%) | 90 (8.5%) |
| $100,000 to $149,999 | 747 (19.1%) | 144 (13.6%) |
| $150,000 or more | 438 (11.2%) | 19 (1.8%) |
| Total | 3,908 (100.0%) | 1,059 (100.0%) |
Monthly Housing Cost Tiers in Marshall County
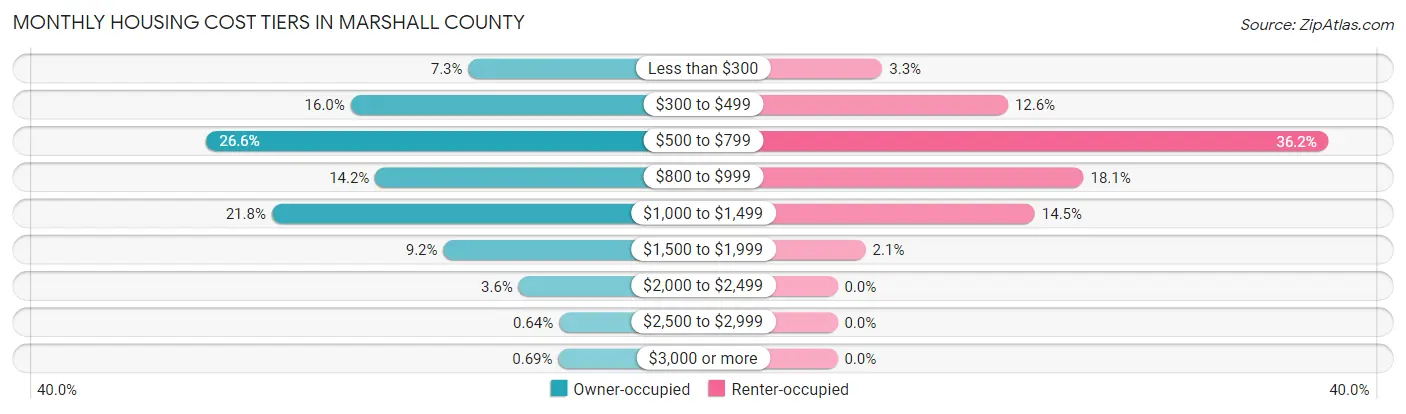
| Monthly Cost | Owner-occupied | Renter-occupied |
| Less than $300 | 286 (7.3%) | 35 (3.3%) |
| $300 to $499 | 625 (16.0%) | 133 (12.6%) |
| $500 to $799 | 1,040 (26.6%) | 383 (36.2%) |
| $800 to $999 | 554 (14.2%) | 192 (18.1%) |
| $1,000 to $1,499 | 852 (21.8%) | 154 (14.5%) |
| $1,500 to $1,999 | 358 (9.2%) | 22 (2.1%) |
| $2,000 to $2,499 | 141 (3.6%) | 0 (0.0%) |
| $2,500 to $2,999 | 25 (0.6%) | 0 (0.0%) |
| $3,000 or more | 27 (0.7%) | 0 (0.0%) |
| Total | 3,908 (100.0%) | 1,059 (100.0%) |
Physical Housing Characteristics in Marshall County
Housing Structures in Marshall County
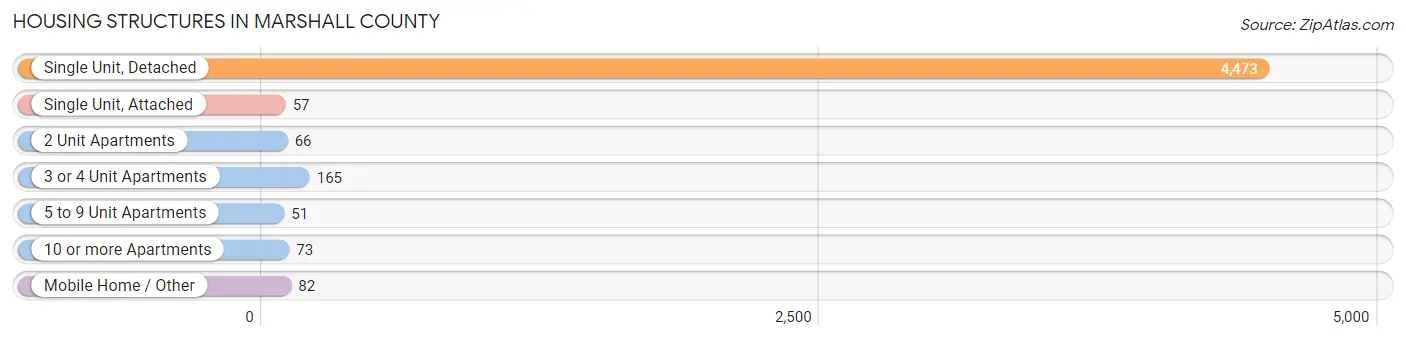
| Structure Type | # Housing Units | % Housing Units |
| Single Unit, Detached | 4,473 | 90.0% |
| Single Unit, Attached | 57 | 1.1% |
| 2 Unit Apartments | 66 | 1.3% |
| 3 or 4 Unit Apartments | 165 | 3.3% |
| 5 to 9 Unit Apartments | 51 | 1.0% |
| 10 or more Apartments | 73 | 1.5% |
| Mobile Home / Other | 82 | 1.7% |
| Total | 4,967 | 100.0% |
Housing Structures by Occupancy in Marshall County
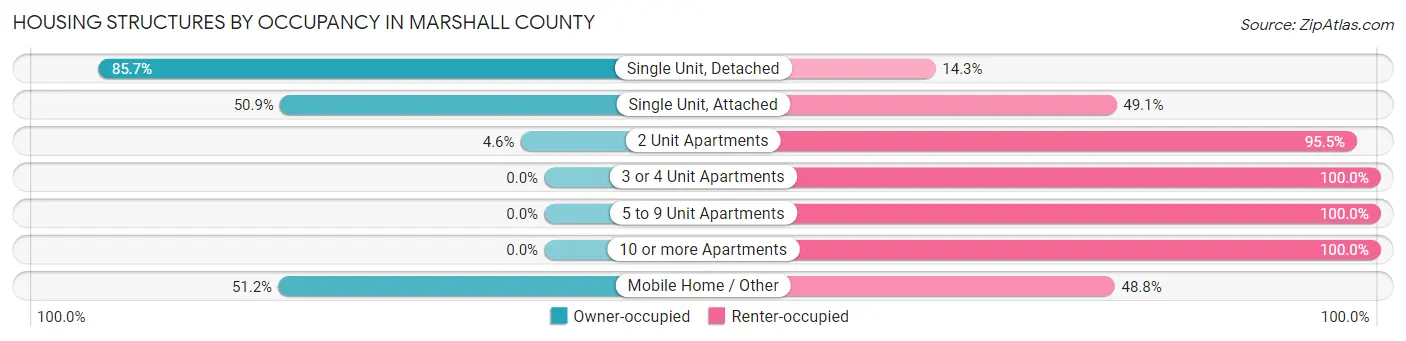
| Structure Type | Owner-occupied | Renter-occupied |
| Single Unit, Detached | 3,834 (85.7%) | 639 (14.3%) |
| Single Unit, Attached | 29 (50.9%) | 28 (49.1%) |
| 2 Unit Apartments | 3 (4.5%) | 63 (95.5%) |
| 3 or 4 Unit Apartments | 0 (0.0%) | 165 (100.0%) |
| 5 to 9 Unit Apartments | 0 (0.0%) | 51 (100.0%) |
| 10 or more Apartments | 0 (0.0%) | 73 (100.0%) |
| Mobile Home / Other | 42 (51.2%) | 40 (48.8%) |
| Total | 3,908 (78.7%) | 1,059 (21.3%) |
Housing Structures by Number of Rooms in Marshall County

| Number of Rooms | Owner-occupied | Renter-occupied |
| 1 Room | 24 (0.6%) | 6 (0.6%) |
| 2 or 3 Rooms | 78 (2.0%) | 234 (22.1%) |
| 4 or 5 Rooms | 1,020 (26.1%) | 408 (38.5%) |
| 6 or 7 Rooms | 1,573 (40.3%) | 248 (23.4%) |
| 8 or more Rooms | 1,213 (31.0%) | 163 (15.4%) |
| Total | 3,908 (100.0%) | 1,059 (100.0%) |
Housing Structure by Heating Type in Marshall County

| Heating Type | Owner-occupied | Renter-occupied |
| Utility Gas | 2,210 (56.6%) | 502 (47.4%) |
| Bottled, Tank, or LP Gas | 960 (24.6%) | 178 (16.8%) |
| Electricity | 575 (14.7%) | 363 (34.3%) |
| Fuel Oil or Kerosene | 65 (1.7%) | 0 (0.0%) |
| Coal or Coke | 0 (0.0%) | 0 (0.0%) |
| All other Fuels | 84 (2.1%) | 9 (0.9%) |
| No Fuel Used | 14 (0.4%) | 7 (0.7%) |
| Total | 3,908 (100.0%) | 1,059 (100.0%) |
Household Vehicle Usage in Marshall County
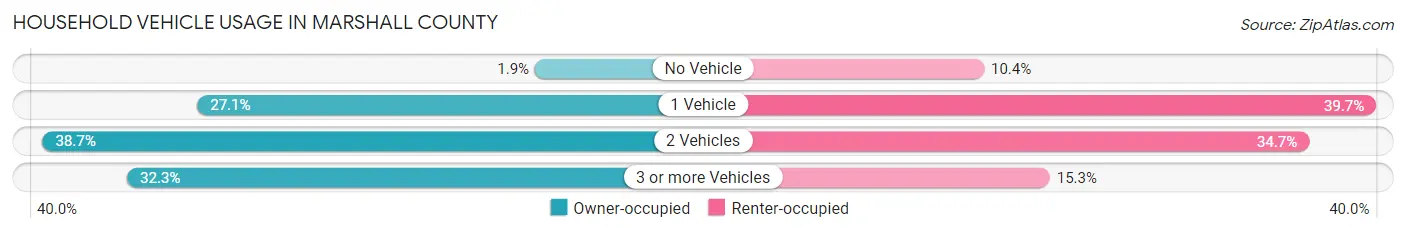
| Vehicles per Household | Owner-occupied | Renter-occupied |
| No Vehicle | 74 (1.9%) | 110 (10.4%) |
| 1 Vehicle | 1,059 (27.1%) | 420 (39.7%) |
| 2 Vehicles | 1,511 (38.7%) | 367 (34.7%) |
| 3 or more Vehicles | 1,264 (32.3%) | 162 (15.3%) |
| Total | 3,908 (100.0%) | 1,059 (100.0%) |
Real Estate & Mortgages in Marshall County
Real Estate and Mortgage Overview in Marshall County
| Characteristic | Without Mortgage | With Mortgage |
| Housing Units | 2,031 | 1,877 |
| Median Property Value | $121,400 | $129,200 |
| Median Household Income | $60,893 | $218 |
| Monthly Housing Costs | $536 | $24 |
| Real Estate Taxes | $2,478 | $24 |
Property Value by Mortgage Status in Marshall County
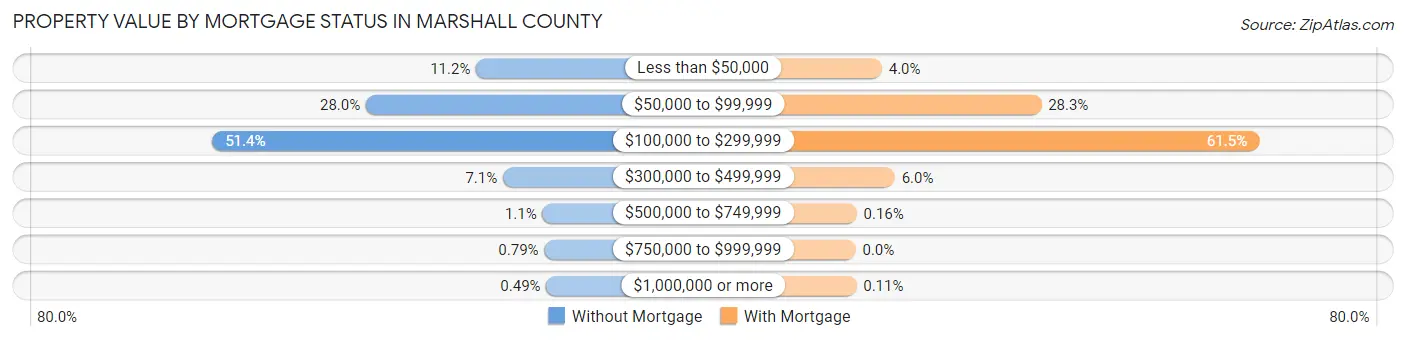
| Property Value | Without Mortgage | With Mortgage |
| Less than $50,000 | 227 (11.2%) | 75 (4.0%) |
| $50,000 to $99,999 | 568 (28.0%) | 531 (28.3%) |
| $100,000 to $299,999 | 1,044 (51.4%) | 1,154 (61.5%) |
| $300,000 to $499,999 | 144 (7.1%) | 112 (6.0%) |
| $500,000 to $749,999 | 22 (1.1%) | 3 (0.2%) |
| $750,000 to $999,999 | 16 (0.8%) | 0 (0.0%) |
| $1,000,000 or more | 10 (0.5%) | 2 (0.1%) |
| Total | 2,031 (100.0%) | 1,877 (100.0%) |
Household Income by Mortgage Status in Marshall County
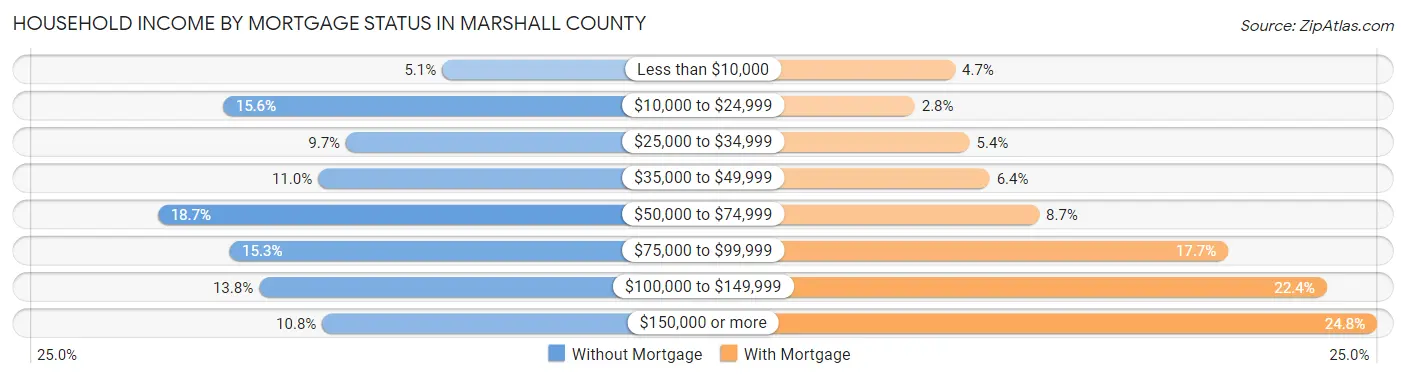
| Household Income | Without Mortgage | With Mortgage |
| Less than $10,000 | 104 (5.1%) | 89 (4.7%) |
| $10,000 to $24,999 | 316 (15.6%) | 53 (2.8%) |
| $25,000 to $34,999 | 197 (9.7%) | 102 (5.4%) |
| $35,000 to $49,999 | 224 (11.0%) | 120 (6.4%) |
| $50,000 to $74,999 | 379 (18.7%) | 164 (8.7%) |
| $75,000 to $99,999 | 310 (15.3%) | 333 (17.7%) |
| $100,000 to $149,999 | 281 (13.8%) | 421 (22.4%) |
| $150,000 or more | 220 (10.8%) | 466 (24.8%) |
| Total | 2,031 (100.0%) | 1,877 (100.0%) |
Property Value to Household Income Ratio in Marshall County
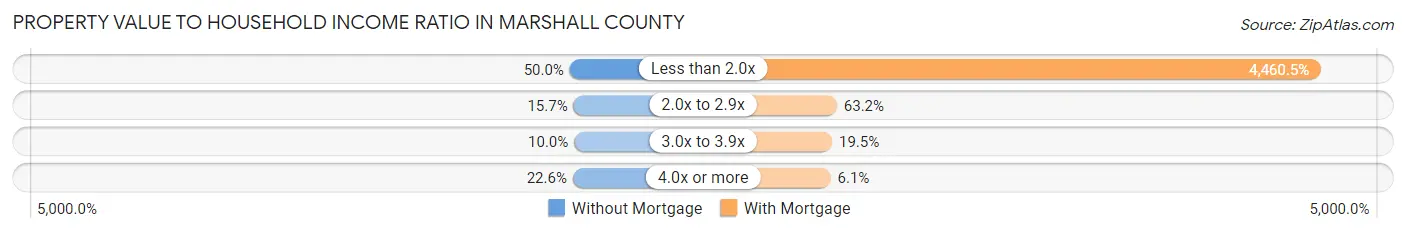
| Value-to-Income Ratio | Without Mortgage | With Mortgage |
| Less than 2.0x | 1,016 (50.0%) | 83,723 (4,460.5%) |
| 2.0x to 2.9x | 318 (15.7%) | 1,187 (63.2%) |
| 3.0x to 3.9x | 203 (10.0%) | 366 (19.5%) |
| 4.0x or more | 458 (22.6%) | 115 (6.1%) |
| Total | 2,031 (100.0%) | 1,877 (100.0%) |
Real Estate Taxes by Mortgage Status in Marshall County
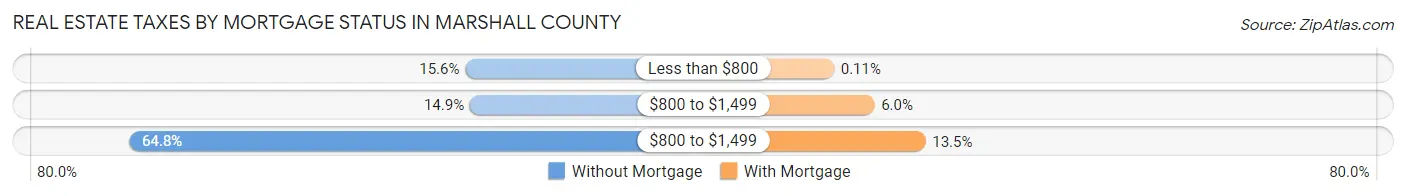
| Property Taxes | Without Mortgage | With Mortgage |
| Less than $800 | 317 (15.6%) | 2 (0.1%) |
| $800 to $1,499 | 303 (14.9%) | 113 (6.0%) |
| $800 to $1,499 | 1,315 (64.7%) | 253 (13.5%) |
| Total | 2,031 (100.0%) | 1,877 (100.0%) |
Health & Disability in Marshall County
Health Insurance Coverage by Age in Marshall County
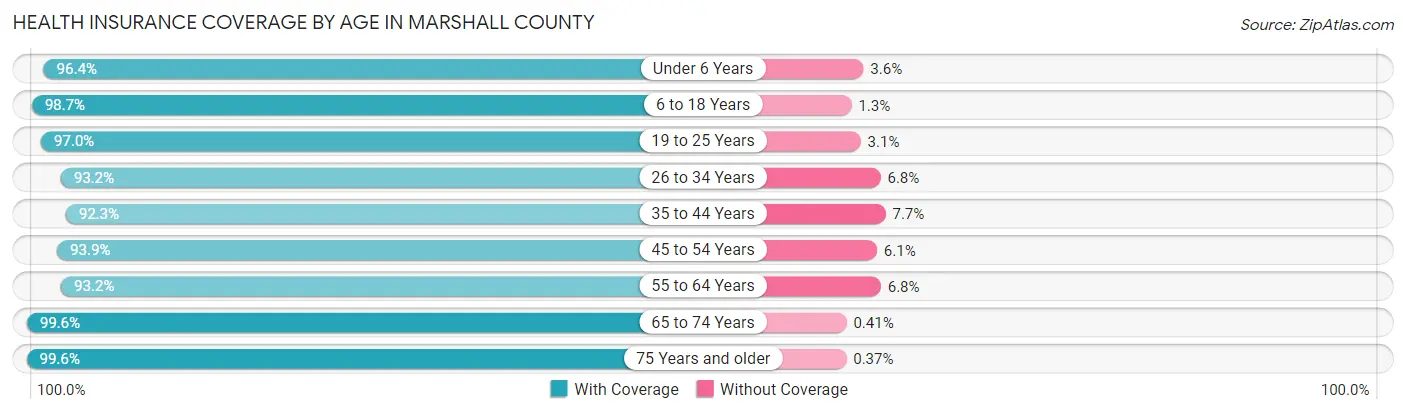
| Age Bracket | With Coverage | Without Coverage |
| Under 6 Years | 705 (96.4%) | 26 (3.6%) |
| 6 to 18 Years | 1,778 (98.7%) | 24 (1.3%) |
| 19 to 25 Years | 762 (97.0%) | 24 (3.0%) |
| 26 to 34 Years | 1,062 (93.2%) | 77 (6.8%) |
| 35 to 44 Years | 1,188 (92.3%) | 99 (7.7%) |
| 45 to 54 Years | 1,314 (93.9%) | 85 (6.1%) |
| 55 to 64 Years | 1,659 (93.2%) | 121 (6.8%) |
| 65 to 74 Years | 1,470 (99.6%) | 6 (0.4%) |
| 75 Years and older | 1,071 (99.6%) | 4 (0.4%) |
| Total | 11,009 (95.9%) | 466 (4.1%) |
Health Insurance Coverage by Citizenship Status in Marshall County
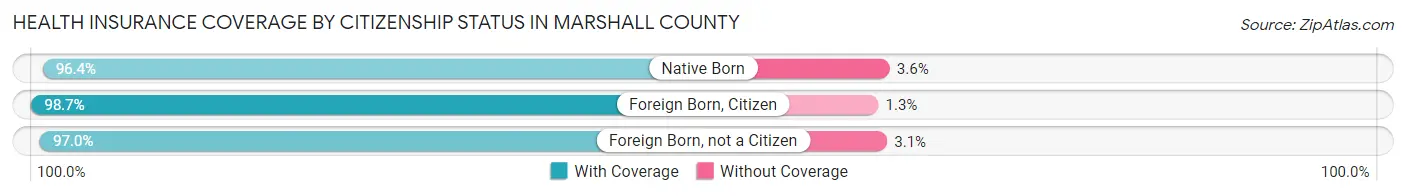
| Citizenship Status | With Coverage | Without Coverage |
| Native Born | 705 (96.4%) | 26 (3.6%) |
| Foreign Born, Citizen | 1,778 (98.7%) | 24 (1.3%) |
| Foreign Born, not a Citizen | 762 (97.0%) | 24 (3.0%) |
Health Insurance Coverage by Household Income in Marshall County
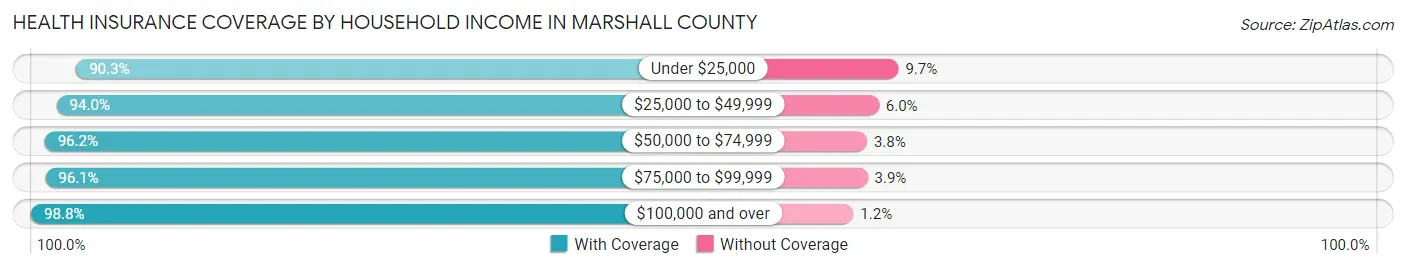
| Household Income | With Coverage | Without Coverage |
| Under $25,000 | 1,427 (90.3%) | 153 (9.7%) |
| $25,000 to $49,999 | 1,517 (94.0%) | 97 (6.0%) |
| $50,000 to $74,999 | 2,012 (96.2%) | 79 (3.8%) |
| $75,000 to $99,999 | 2,068 (96.1%) | 84 (3.9%) |
| $100,000 and over | 3,972 (98.8%) | 50 (1.2%) |
Public vs Private Health Insurance Coverage by Age in Marshall County
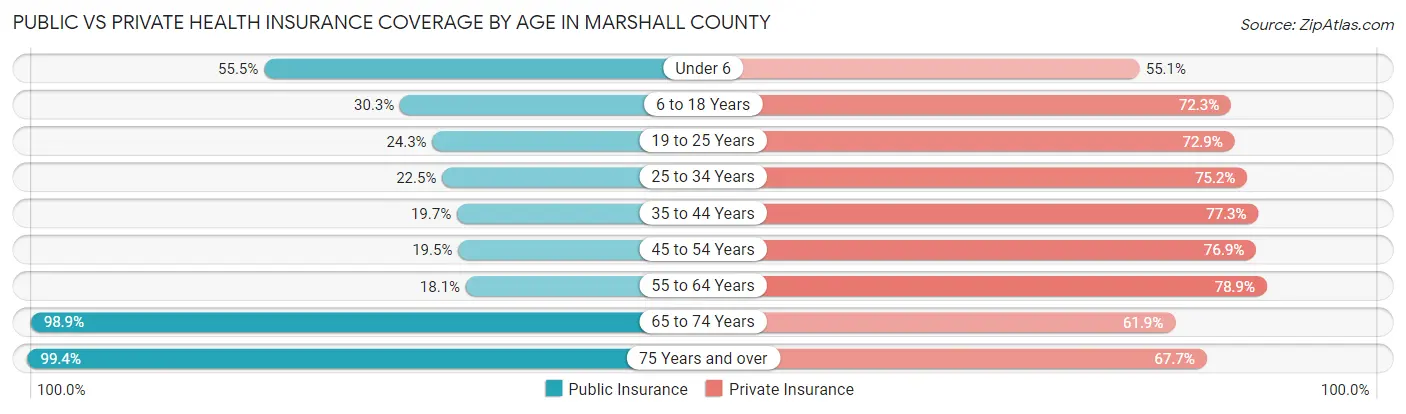
| Age Bracket | Public Insurance | Private Insurance |
| Under 6 | 406 (55.5%) | 403 (55.1%) |
| 6 to 18 Years | 546 (30.3%) | 1,302 (72.3%) |
| 19 to 25 Years | 191 (24.3%) | 573 (72.9%) |
| 25 to 34 Years | 256 (22.5%) | 857 (75.2%) |
| 35 to 44 Years | 254 (19.7%) | 995 (77.3%) |
| 45 to 54 Years | 273 (19.5%) | 1,076 (76.9%) |
| 55 to 64 Years | 322 (18.1%) | 1,404 (78.9%) |
| 65 to 74 Years | 1,459 (98.9%) | 913 (61.9%) |
| 75 Years and over | 1,069 (99.4%) | 728 (67.7%) |
| Total | 4,776 (41.6%) | 8,251 (71.9%) |
Disability Status by Sex by Age in Marshall County
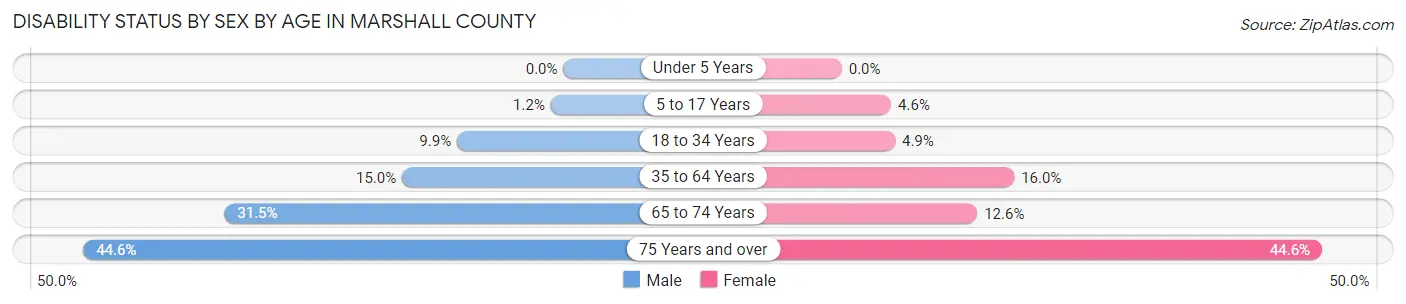
| Age Bracket | Male | Female |
| Under 5 Years | 0 (0.0%) | 0 (0.0%) |
| 5 to 17 Years | 11 (1.2%) | 39 (4.6%) |
| 18 to 34 Years | 104 (9.9%) | 48 (4.9%) |
| 35 to 64 Years | 345 (15.0%) | 346 (16.0%) |
| 65 to 74 Years | 229 (31.5%) | 94 (12.6%) |
| 75 Years and over | 217 (44.6%) | 262 (44.6%) |
Disability Class by Sex by Age in Marshall County
Disability Class: Hearing Difficulty
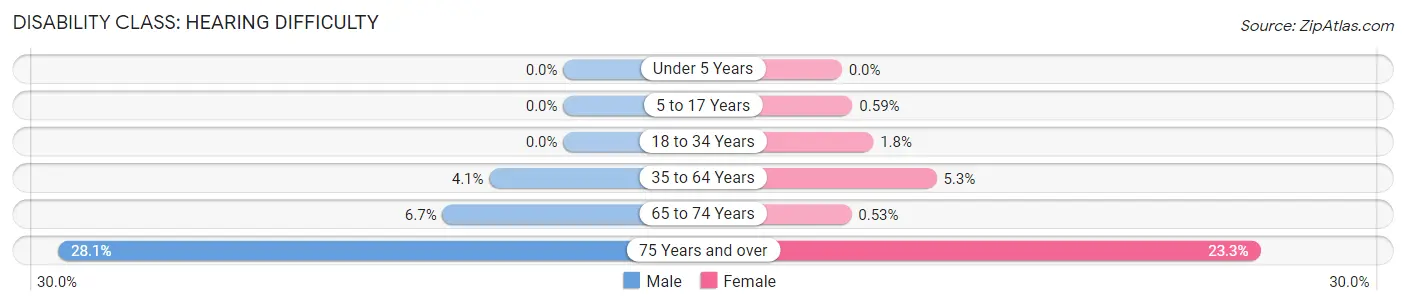
| Age Bracket | Male | Female |
| Under 5 Years | 0 (0.0%) | 0 (0.0%) |
| 5 to 17 Years | 0 (0.0%) | 5 (0.6%) |
| 18 to 34 Years | 0 (0.0%) | 17 (1.8%) |
| 35 to 64 Years | 95 (4.1%) | 114 (5.3%) |
| 65 to 74 Years | 49 (6.7%) | 4 (0.5%) |
| 75 Years and over | 137 (28.1%) | 137 (23.3%) |
Disability Class: Vision Difficulty
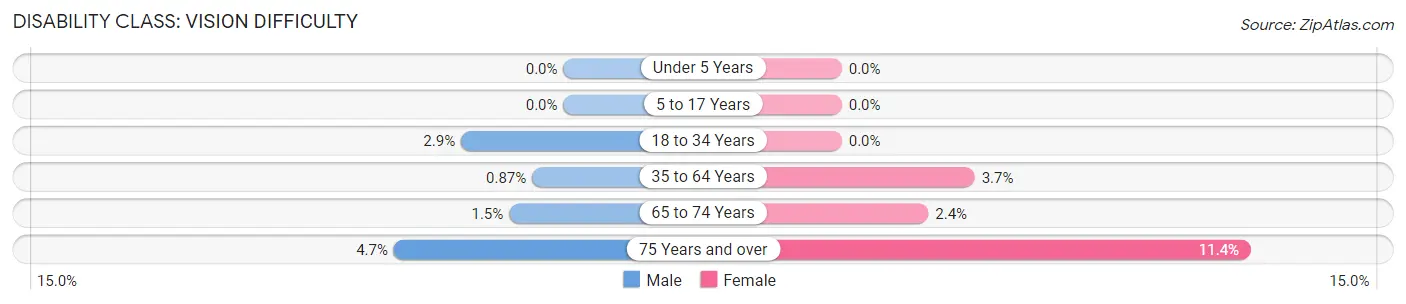
| Age Bracket | Male | Female |
| Under 5 Years | 0 (0.0%) | 0 (0.0%) |
| 5 to 17 Years | 0 (0.0%) | 0 (0.0%) |
| 18 to 34 Years | 30 (2.9%) | 0 (0.0%) |
| 35 to 64 Years | 20 (0.9%) | 80 (3.7%) |
| 65 to 74 Years | 11 (1.5%) | 18 (2.4%) |
| 75 Years and over | 23 (4.7%) | 67 (11.4%) |
Disability Class: Cognitive Difficulty
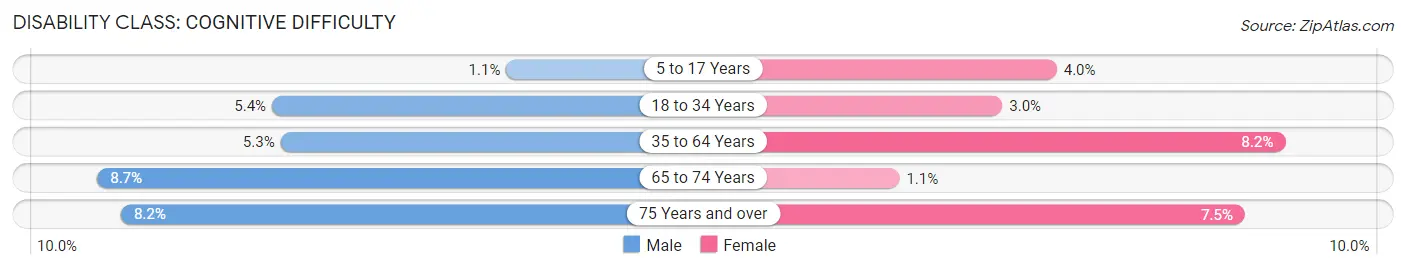
| Age Bracket | Male | Female |
| 5 to 17 Years | 10 (1.1%) | 34 (4.0%) |
| 18 to 34 Years | 57 (5.4%) | 29 (3.0%) |
| 35 to 64 Years | 121 (5.2%) | 178 (8.2%) |
| 65 to 74 Years | 63 (8.6%) | 8 (1.1%) |
| 75 Years and over | 40 (8.2%) | 44 (7.5%) |
Disability Class: Ambulatory Difficulty
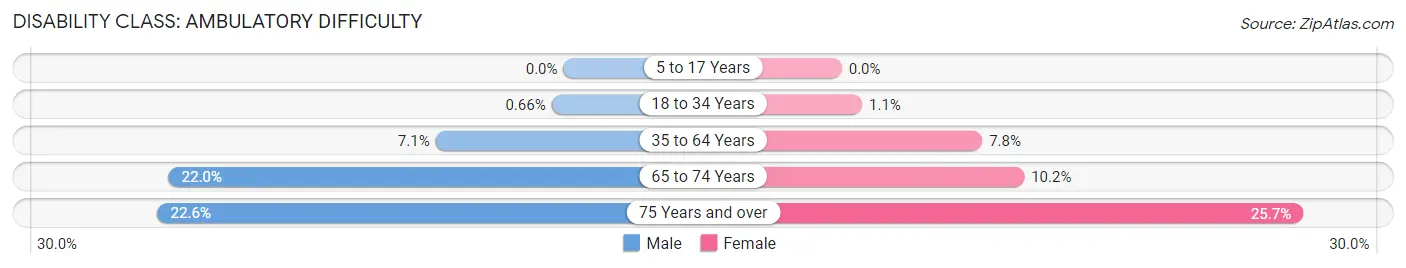
| Age Bracket | Male | Female |
| 5 to 17 Years | 0 (0.0%) | 0 (0.0%) |
| 18 to 34 Years | 7 (0.7%) | 11 (1.1%) |
| 35 to 64 Years | 164 (7.1%) | 169 (7.8%) |
| 65 to 74 Years | 160 (22.0%) | 76 (10.2%) |
| 75 Years and over | 110 (22.6%) | 151 (25.7%) |
Disability Class: Self-Care Difficulty
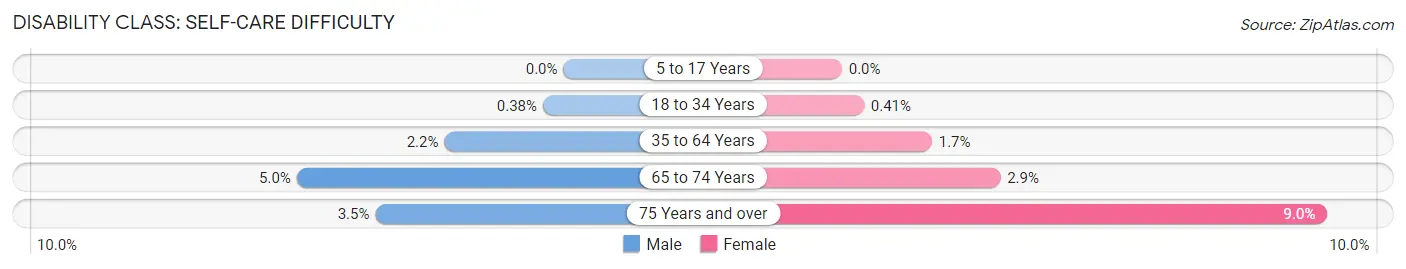
| Age Bracket | Male | Female |
| 5 to 17 Years | 0 (0.0%) | 0 (0.0%) |
| 18 to 34 Years | 4 (0.4%) | 4 (0.4%) |
| 35 to 64 Years | 51 (2.2%) | 36 (1.7%) |
| 65 to 74 Years | 36 (5.0%) | 22 (2.9%) |
| 75 Years and over | 17 (3.5%) | 53 (9.0%) |
Technology Access in Marshall County
Computing Device Access in Marshall County

| Device Type | # Households | % Households |
| Desktop or Laptop | 3,445 | 69.4% |
| Smartphone | 4,064 | 81.8% |
| Tablet | 2,758 | 55.5% |
| No Computing Device | 560 | 11.3% |
| Total | 4,967 | 100.0% |
Internet Access in Marshall County
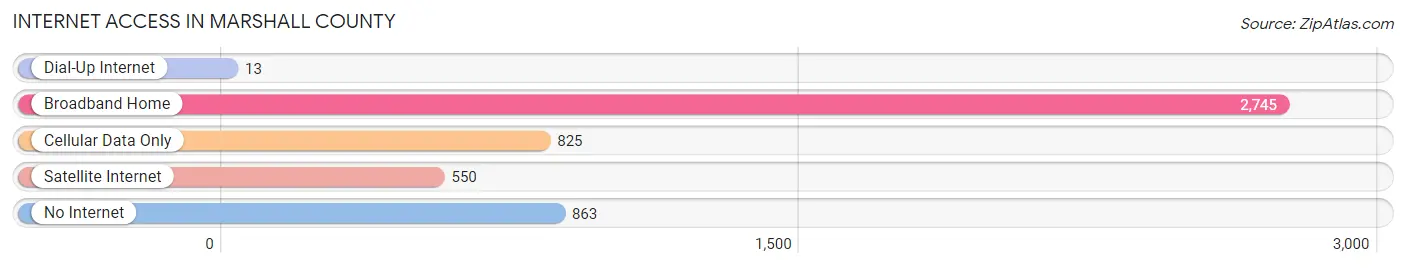
| Internet Type | # Households | % Households |
| Dial-Up Internet | 13 | 0.3% |
| Broadband Home | 2,745 | 55.3% |
| Cellular Data Only | 825 | 16.6% |
| Satellite Internet | 550 | 11.1% |
| No Internet | 863 | 17.4% |
| Total | 4,967 | 100.0% |
Marshall County Summary
Marshall County is located in the central part of Illinois, in the United States. It is bordered by the counties of Peoria, Stark, Woodford, Tazewell, and Putnam. The county seat is Lacon, and the largest city is Henry. The county was established in 1839 and named after Chief Justice of the United States Supreme Court, John Marshall.
Geography
Marshall County covers an area of 576 square miles, of which 574 square miles is land and 2 square miles is water. The county is located in the Central Till Plains region of Illinois, and is mostly flat with some rolling hills. The highest point in the county is located in the northwest corner, at an elevation of 830 feet. The county is drained by the Mackinaw River, which flows through the center of the county.
The county is home to several state parks, including Kickapoo State Park, which is located in the northwest corner of the county. The park is known for its hiking trails, fishing, and camping. Other parks in the county include the Marshall County Conservation Area, which is located in the northeast corner of the county, and the Marshall County Forest Preserve, which is located in the southeast corner of the county.
Demographics
As of the 2010 census, Marshall County had a population of 12,640. The racial makeup of the county was 97.2% White, 0.7% African American, 0.3% Native American, 0.2% Asian, 0.1% Pacific Islander, 0.6% from other races, and 0.9% from two or more races. Hispanic or Latino of any race were 1.7% of the population.
The median income for a household in the county was $45,945, and the median income for a family was $54,945. The per capita income for the county was $21,945. About 8.2% of families and 10.7% of the population were below the poverty line, including 14.2% of those under age 18 and 8.2% of those age 65 or over.
Economy
Marshall County is largely agricultural, with corn, soybeans, and wheat being the main crops. The county is also home to several manufacturing companies, including Caterpillar, Inc., which has a plant in Henry. Other industries in the county include health care, retail, and tourism.
The county is served by two airports, the Henry Airport and the Lacon Airport. The county is also served by several highways, including Interstate 39, U.S. Route 24, and Illinois Route 17.
Marshall County is home to several attractions, including the Marshall County Historical Museum, which is located in Lacon. The museum features exhibits on the history of the county, including its Native American heritage, its early settlers, and its role in the Civil War. The county is also home to the Marshall County Fair, which is held annually in Henry. The fair features carnival rides, live music, and a variety of food and craft vendors.
Common Questions
What is Per Capita Income in Marshall County?
Per Capita income in Marshall County is $34,369.
What is the Median Family Income in Marshall County?
Median Family Income in Marshall County is $83,559.
What is the Median Household income in Marshall County?
Median Household Income in Marshall County is $64,940.
What is Income or Wage Gap in Marshall County?
Income or Wage Gap in Marshall County is 41.5%.
Women in Marshall County earn 58.5 cents for every dollar earned by a man.
What is Family Income Deficit in Marshall County?
Family Income Deficit in Marshall County is $9,503.
Families that are below poverty line in Marshall County earn $9,503 less on average than the poverty threshold level.
What is Inequality or Gini Index in Marshall County?
Inequality or Gini Index in Marshall County is 0.42.
What is the Total Population of Marshall County?
Total Population of Marshall County is 11,740.
What is the Total Male Population of Marshall County?
Total Male Population of Marshall County is 5,906.
What is the Total Female Population of Marshall County?
Total Female Population of Marshall County is 5,834.
What is the Ratio of Males per 100 Females in Marshall County?
There are 101.23 Males per 100 Females in Marshall County.
What is the Ratio of Females per 100 Males in Marshall County?
There are 98.78 Females per 100 Males in Marshall County.
What is the Median Population Age in Marshall County?
Median Population Age in Marshall County is 46.2 Years.
What is the Average Family Size in Marshall County
Average Family Size in Marshall County is 2.8 People.
What is the Average Household Size in Marshall County
Average Household Size in Marshall County is 2.3 People.
How Large is the Labor Force in Marshall County?
There are 5,408 People in the Labor Forcein in Marshall County.
What is the Percentage of People in the Labor Force in Marshall County?
56.4% of People are in the Labor Force in Marshall County.
What is the Unemployment Rate in Marshall County?
Unemployment Rate in Marshall County is 4.2%.