Livingston County, IL Map & Demographics
Livingston County Map
Livingston County Overview
$34,996
PER CAPITA INCOME
$85,639
AVG FAMILY INCOME
$68,175
AVG HOUSEHOLD INCOME
34.1%
WAGE / INCOME GAP [ % ]
65.9¢/ $1
WAGE / INCOME GAP [ $ ]
$8,193
FAMILY INCOME DEFICIT
0.42
INEQUALITY / GINI INDEX
35,771
TOTAL POPULATION
18,285
MALE POPULATION
17,486
FEMALE POPULATION
104.57
MALES / 100 FEMALES
95.63
FEMALES / 100 MALES
41.9
MEDIAN AGE
2.8
AVG FAMILY SIZE
2.3
AVG HOUSEHOLD SIZE
17,356
LABOR FORCE [ PEOPLE ]
59.7%
PERCENT IN LABOR FORCE
3.7%
UNEMPLOYMENT RATE
Livingston County Area Codes
Income in Livingston County
Income Overview in Livingston County
Per Capita Income in Livingston County is $34,996, while median incomes of families and households are $85,639 and $68,175 respectively.
| Characteristic | Number | Measure |
| Per Capita Income | 35,771 | $34,996 |
| Median Family Income | 9,751 | $85,639 |
| Mean Family Income | 9,751 | $96,913 |
| Median Household Income | 14,665 | $68,175 |
| Mean Household Income | 14,665 | $85,405 |
| Income Deficit | 9,751 | $8,193 |
| Wage / Income Gap (%) | 35,771 | 34.07% |
| Wage / Income Gap ($) | 35,771 | 65.93¢ per $1 |
| Gini / Inequality Index | 35,771 | 0.42 |
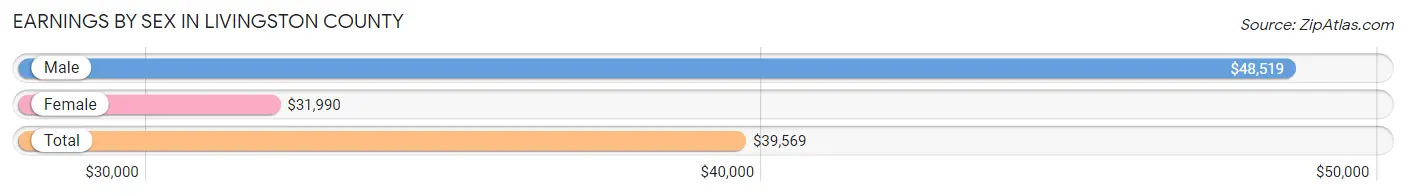
Earnings by Sex in Livingston County
Average Earnings in Livingston County are $39,569, $48,519 for men and $31,990 for women, a difference of 34.1%.
| Sex | Number | Average Earnings |
| Male | 9,858 (53.4%) | $48,519 |
| Female | 8,595 (46.6%) | $31,990 |
| Total | 18,453 (100.0%) | $39,569 |
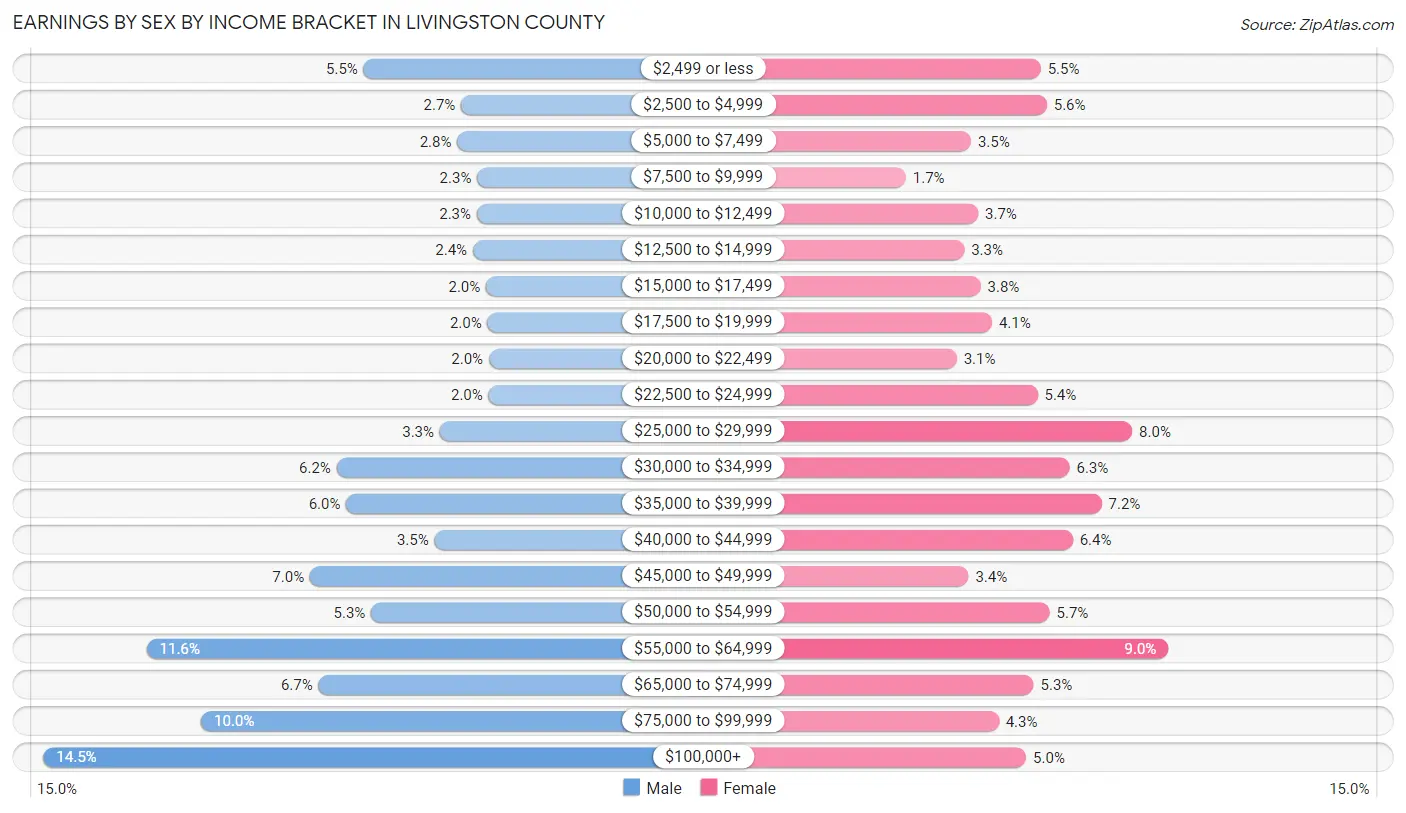
Earnings by Sex by Income Bracket in Livingston County
The most common earnings brackets in Livingston County are $100,000+ for men (1,426 | 14.5%) and $55,000 to $64,999 for women (776 | 9.0%).
| Income | Male | Female |
| $2,499 or less | 539 (5.5%) | 468 (5.4%) |
| $2,500 to $4,999 | 269 (2.7%) | 483 (5.6%) |
| $5,000 to $7,499 | 280 (2.8%) | 300 (3.5%) |
| $7,500 to $9,999 | 225 (2.3%) | 143 (1.7%) |
| $10,000 to $12,499 | 226 (2.3%) | 317 (3.7%) |
| $12,500 to $14,999 | 237 (2.4%) | 284 (3.3%) |
| $15,000 to $17,499 | 200 (2.0%) | 323 (3.8%) |
| $17,500 to $19,999 | 196 (2.0%) | 351 (4.1%) |
| $20,000 to $22,499 | 192 (1.9%) | 266 (3.1%) |
| $22,500 to $24,999 | 193 (2.0%) | 461 (5.4%) |
| $25,000 to $29,999 | 328 (3.3%) | 689 (8.0%) |
| $30,000 to $34,999 | 614 (6.2%) | 538 (6.3%) |
| $35,000 to $39,999 | 588 (6.0%) | 615 (7.2%) |
| $40,000 to $44,999 | 343 (3.5%) | 546 (6.4%) |
| $45,000 to $49,999 | 688 (7.0%) | 294 (3.4%) |
| $50,000 to $54,999 | 519 (5.3%) | 490 (5.7%) |
| $55,000 to $64,999 | 1,141 (11.6%) | 776 (9.0%) |
| $65,000 to $74,999 | 664 (6.7%) | 451 (5.2%) |
| $75,000 to $99,999 | 990 (10.0%) | 367 (4.3%) |
| $100,000+ | 1,426 (14.5%) | 433 (5.0%) |
| Total | 9,858 (100.0%) | 8,595 (100.0%) |
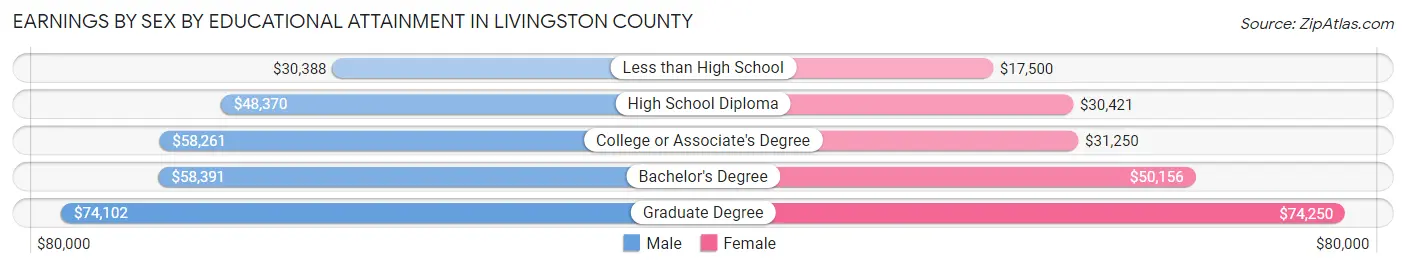
Earnings by Sex by Educational Attainment in Livingston County
Average earnings in Livingston County are $52,554 for men and $36,139 for women, a difference of 31.2%. Men with an educational attainment of graduate degree enjoy the highest average annual earnings of $74,102, while those with less than high school education earn the least with $30,388. Women with an educational attainment of graduate degree earn the most with the average annual earnings of $74,250, while those with less than high school education have the smallest earnings of $17,500.
| Educational Attainment | Male Income | Female Income |
| Less than High School | $30,388 | $17,500 |
| High School Diploma | $48,370 | $30,421 |
| College or Associate's Degree | $58,261 | $31,250 |
| Bachelor's Degree | $58,391 | $50,156 |
| Graduate Degree | $74,102 | $74,250 |
| Total | $52,554 | $36,139 |
Family Income in Livingston County
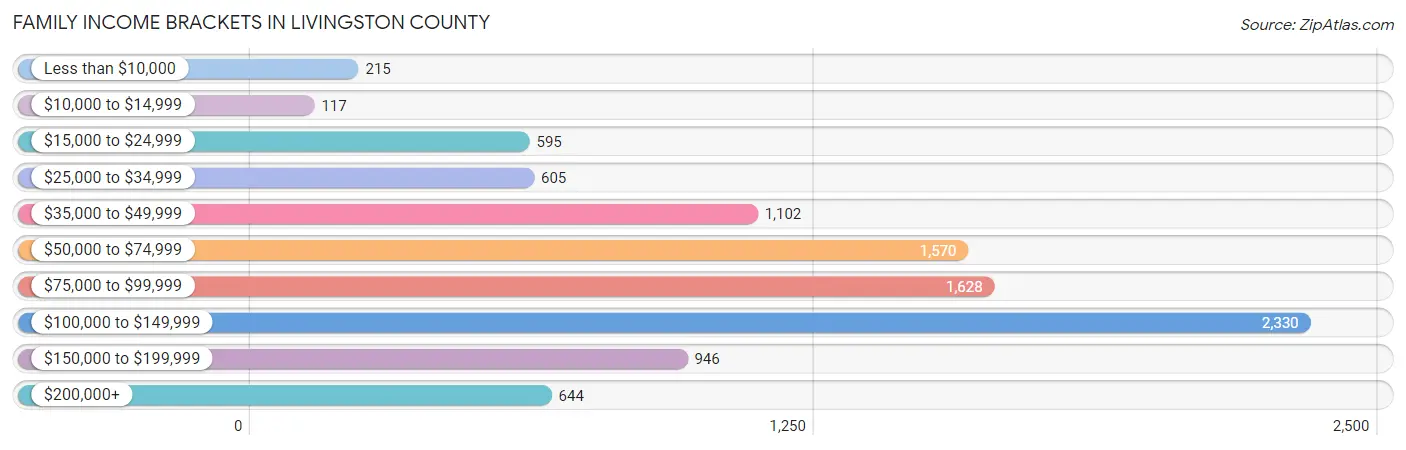
Family Income Brackets in Livingston County
According to the Livingston County family income data, there are 2,330 families falling into the $100,000 to $149,999 income range, which is the most common income bracket and makes up 23.9% of all families. Conversely, the $10,000 to $14,999 income bracket is the least frequent group with only 117 families (1.2%) belonging to this category.
| Income Bracket | # Families | % Families |
| Less than $10,000 | 215 | 2.2% |
| $10,000 to $14,999 | 117 | 1.2% |
| $15,000 to $24,999 | 595 | 6.1% |
| $25,000 to $34,999 | 605 | 6.2% |
| $35,000 to $49,999 | 1,102 | 11.3% |
| $50,000 to $74,999 | 1,570 | 16.1% |
| $75,000 to $99,999 | 1,628 | 16.7% |
| $100,000 to $149,999 | 2,330 | 23.9% |
| $150,000 to $199,999 | 946 | 9.7% |
| $200,000+ | 644 | 6.6% |
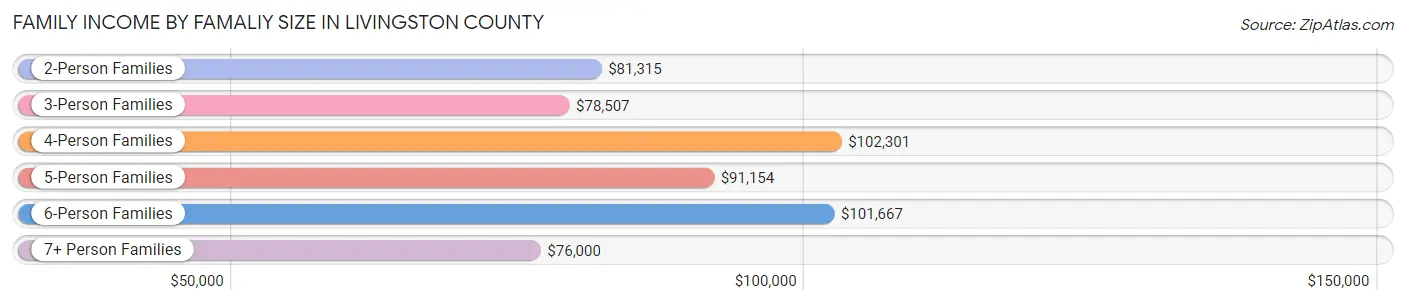
Family Income by Famaliy Size in Livingston County
4-person families (1,435 | 14.7%) account for the highest median family income in Livingston County with $102,301 per family, while 2-person families (4,961 | 50.9%) have the highest median income of $40,658 per family member.
| Income Bracket | # Families | Median Income |
| 2-Person Families | 4,961 (50.9%) | $81,315 |
| 3-Person Families | 2,171 (22.3%) | $78,507 |
| 4-Person Families | 1,435 (14.7%) | $102,301 |
| 5-Person Families | 834 (8.6%) | $91,154 |
| 6-Person Families | 198 (2.0%) | $101,667 |
| 7+ Person Families | 152 (1.6%) | $76,000 |
| Total | 9,751 (100.0%) | $85,639 |
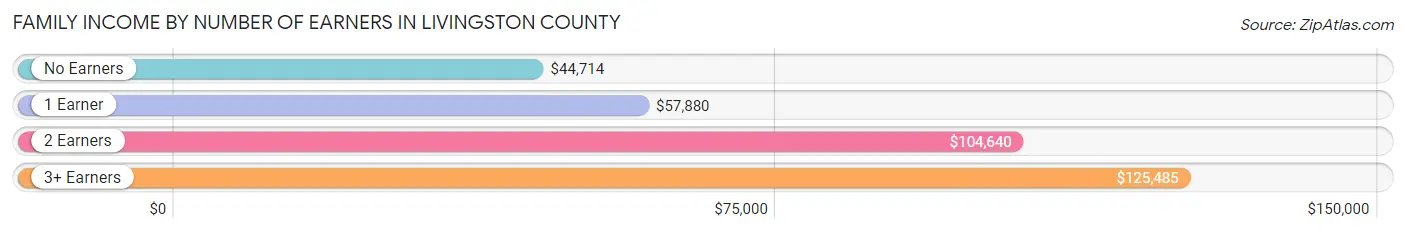
Family Income by Number of Earners in Livingston County
The median family income in Livingston County is $85,639, with families comprising 3+ earners (1,281) having the highest median family income of $125,485, while families with no earners (1,253) have the lowest median family income of $44,714, accounting for 13.1% and 12.9% of families, respectively.
| Number of Earners | # Families | Median Income |
| No Earners | 1,253 (12.9%) | $44,714 |
| 1 Earner | 3,687 (37.8%) | $57,880 |
| 2 Earners | 3,530 (36.2%) | $104,640 |
| 3+ Earners | 1,281 (13.1%) | $125,485 |
| Total | 9,751 (100.0%) | $85,639 |
Household Income in Livingston County
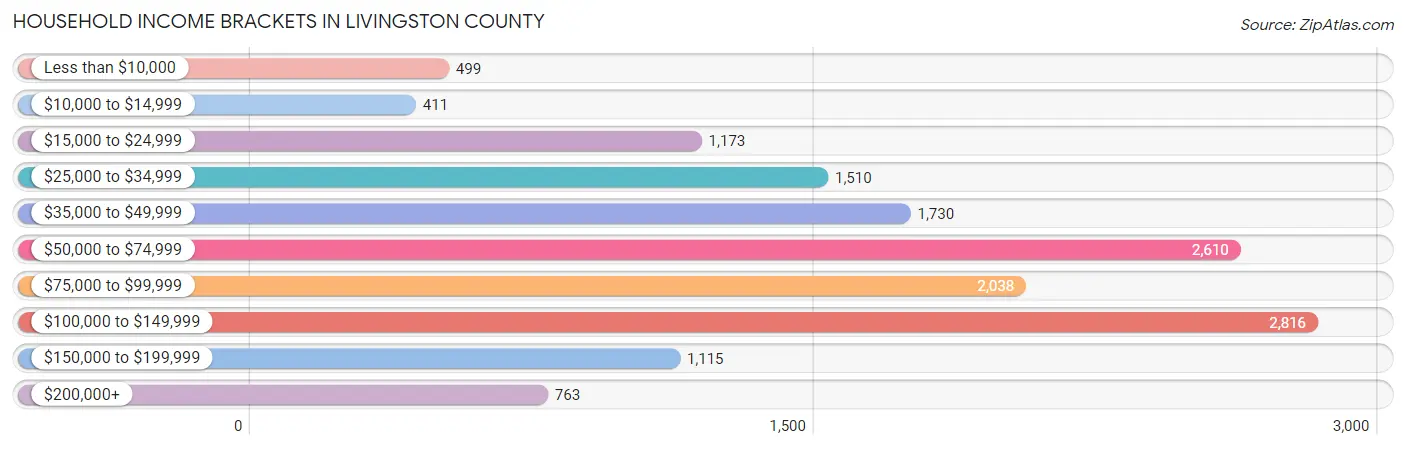
Household Income Brackets in Livingston County
With 2,816 households falling in the category, the $100,000 to $149,999 income range is the most frequent in Livingston County, accounting for 19.2% of all households. In contrast, only 411 households (2.8%) fall into the $10,000 to $14,999 income bracket, making it the least populous group.
| Income Bracket | # Households | % Households |
| Less than $10,000 | 499 | 3.4% |
| $10,000 to $14,999 | 411 | 2.8% |
| $15,000 to $24,999 | 1,173 | 8.0% |
| $25,000 to $34,999 | 1,510 | 10.3% |
| $35,000 to $49,999 | 1,730 | 11.8% |
| $50,000 to $74,999 | 2,610 | 17.8% |
| $75,000 to $99,999 | 2,038 | 13.9% |
| $100,000 to $149,999 | 2,816 | 19.2% |
| $150,000 to $199,999 | 1,115 | 7.6% |
| $200,000+ | 763 | 5.2% |
Household Income by Householder Age in Livingston County
The median household income in Livingston County is $68,175, with the highest median household income of $85,170 found in the 45 to 64 years age bracket for the primary householder. A total of 5,134 households (35.0%) fall into this category. Meanwhile, the 15 to 24 years age bracket for the primary householder has the lowest median household income of $45,391, with 661 households (4.5%) in this group.
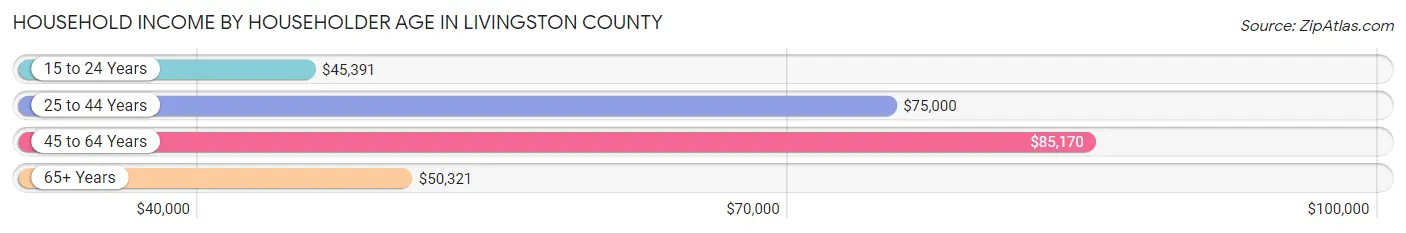
| Income Bracket | # Households | Median Income |
| 15 to 24 Years | 661 (4.5%) | $45,391 |
| 25 to 44 Years | 4,448 (30.3%) | $75,000 |
| 45 to 64 Years | 5,134 (35.0%) | $85,170 |
| 65+ Years | 4,422 (30.1%) | $50,321 |
| Total | 14,665 (100.0%) | $68,175 |
Poverty in Livingston County
Income Below Poverty by Sex and Age in Livingston County
With 8.5% poverty level for males and 11.9% for females among the residents of Livingston County, under 5 year old males and 18 to 24 year old females are the most vulnerable to poverty, with 216 males (21.5%) and 217 females (17.2%) in their respective age groups living below the poverty level.
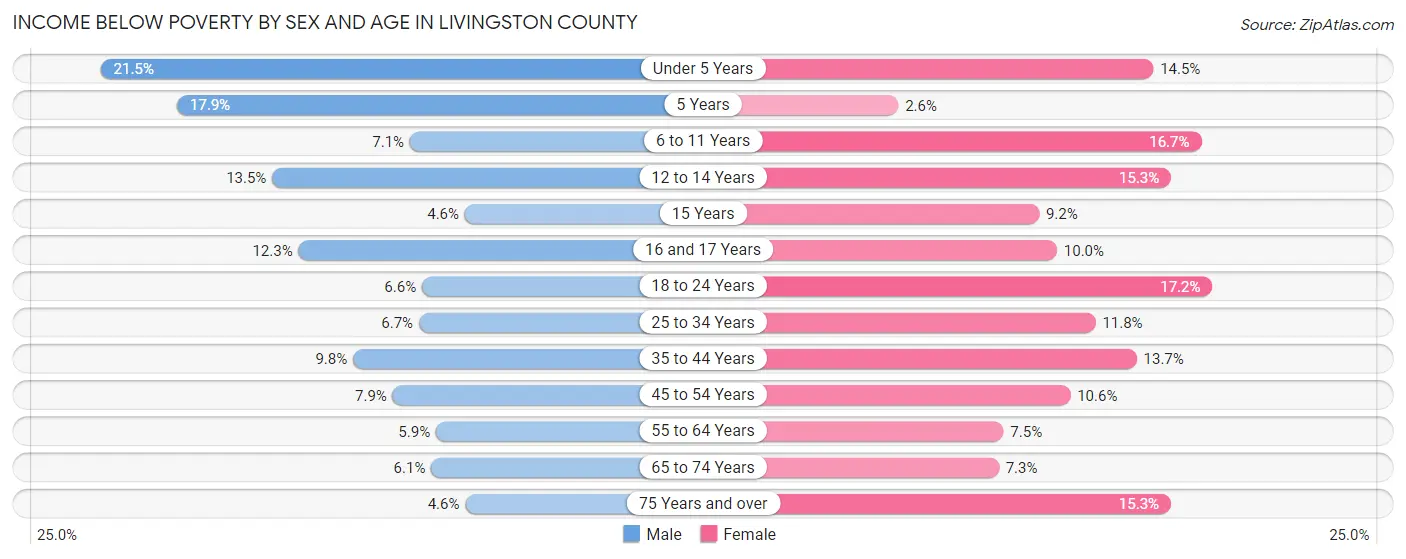
| Age Bracket | Male | Female |
| Under 5 Years | 216 (21.5%) | 135 (14.4%) |
| 5 Years | 52 (17.9%) | 5 (2.6%) |
| 6 to 11 Years | 89 (7.1%) | 198 (16.7%) |
| 12 to 14 Years | 99 (13.5%) | 101 (15.3%) |
| 15 Years | 8 (4.6%) | 15 (9.1%) |
| 16 and 17 Years | 73 (12.3%) | 53 (10.0%) |
| 18 to 24 Years | 94 (6.6%) | 217 (17.2%) |
| 25 to 34 Years | 125 (6.7%) | 236 (11.8%) |
| 35 to 44 Years | 183 (9.8%) | 289 (13.7%) |
| 45 to 54 Years | 157 (7.9%) | 207 (10.6%) |
| 55 to 64 Years | 144 (5.9%) | 190 (7.5%) |
| 65 to 74 Years | 116 (6.1%) | 141 (7.3%) |
| 75 Years and over | 51 (4.5%) | 257 (15.3%) |
| Total | 1,407 (8.5%) | 2,044 (11.9%) |
Income Above Poverty by Sex and Age in Livingston County
According to the poverty statistics in Livingston County, males aged 75 years and over and females aged 5 years are the age groups that are most secure financially, with 95.5% of males and 97.4% of females in these age groups living above the poverty line.
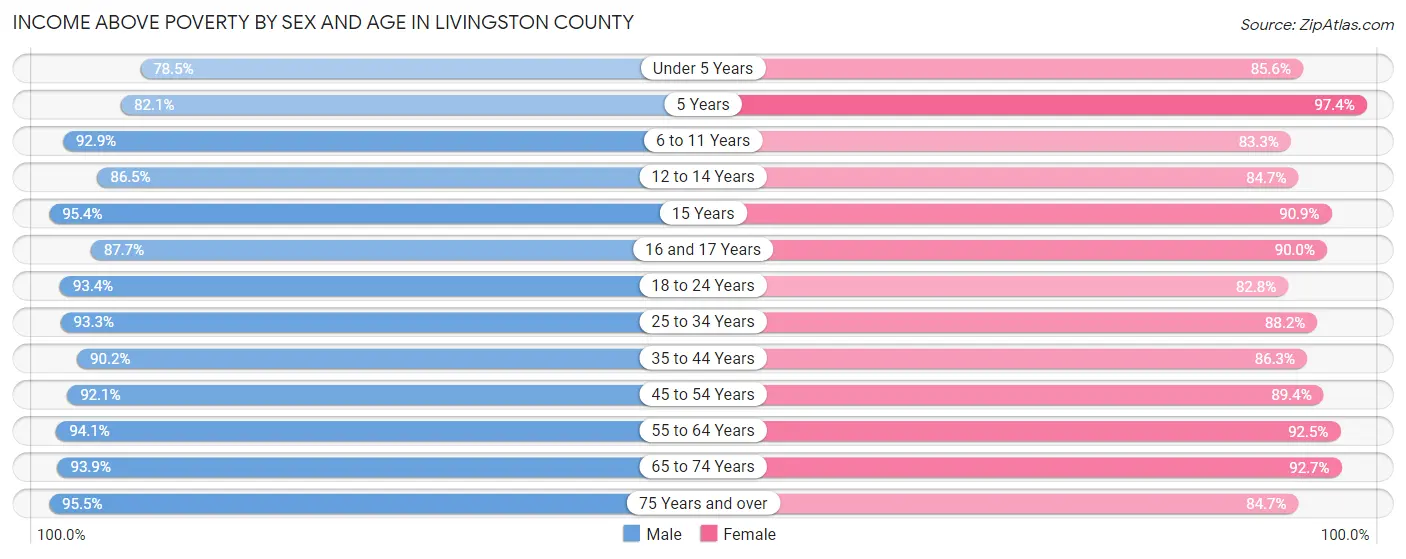
| Age Bracket | Male | Female |
| Under 5 Years | 790 (78.5%) | 799 (85.6%) |
| 5 Years | 238 (82.1%) | 186 (97.4%) |
| 6 to 11 Years | 1,161 (92.9%) | 989 (83.3%) |
| 12 to 14 Years | 634 (86.5%) | 560 (84.7%) |
| 15 Years | 167 (95.4%) | 149 (90.8%) |
| 16 and 17 Years | 521 (87.7%) | 478 (90.0%) |
| 18 to 24 Years | 1,340 (93.4%) | 1,045 (82.8%) |
| 25 to 34 Years | 1,740 (93.3%) | 1,769 (88.2%) |
| 35 to 44 Years | 1,692 (90.2%) | 1,823 (86.3%) |
| 45 to 54 Years | 1,826 (92.1%) | 1,745 (89.4%) |
| 55 to 64 Years | 2,292 (94.1%) | 2,343 (92.5%) |
| 65 to 74 Years | 1,776 (93.9%) | 1,796 (92.7%) |
| 75 Years and over | 1,069 (95.5%) | 1,426 (84.7%) |
| Total | 15,246 (91.5%) | 15,108 (88.1%) |
Income Below Poverty Among Married-Couple Families in Livingston County
The poverty statistics for married-couple families in Livingston County show that 3.6% or 257 of the total 7,154 families live below the poverty line. Families with 5 or more children have the highest poverty rate of 9.0%, comprising of 11 families. On the other hand, families with no children have the lowest poverty rate of 2.9%, which includes 134 families.
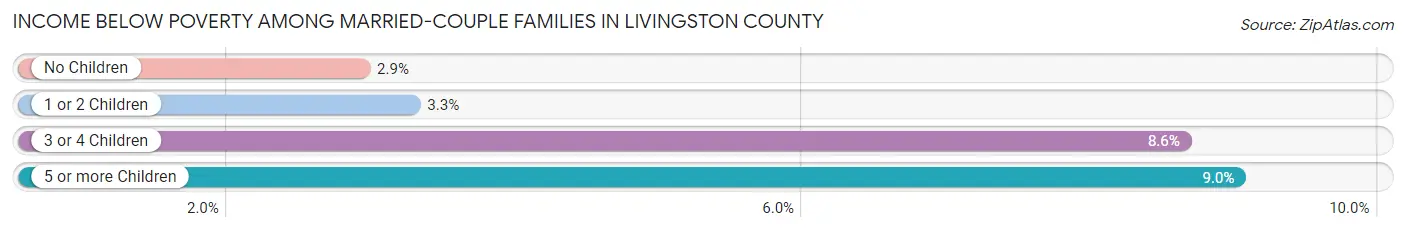
| Children | Above Poverty | Below Poverty |
| No Children | 4,459 (97.1%) | 134 (2.9%) |
| 1 or 2 Children | 1,777 (96.7%) | 60 (3.3%) |
| 3 or 4 Children | 550 (91.4%) | 52 (8.6%) |
| 5 or more Children | 111 (91.0%) | 11 (9.0%) |
| Total | 6,897 (96.4%) | 257 (3.6%) |
Income Below Poverty Among Single-Parent Households in Livingston County
According to the poverty data in Livingston County, 12.5% or 97 single-father households and 23.5% or 428 single-mother households are living below the poverty line. Among single-father households, those with 1 or 2 children have the highest poverty rate, with 78 households (18.3%) experiencing poverty. Likewise, among single-mother households, those with 5 or more children have the highest poverty rate, with 8 households (100.0%) falling below the poverty line.
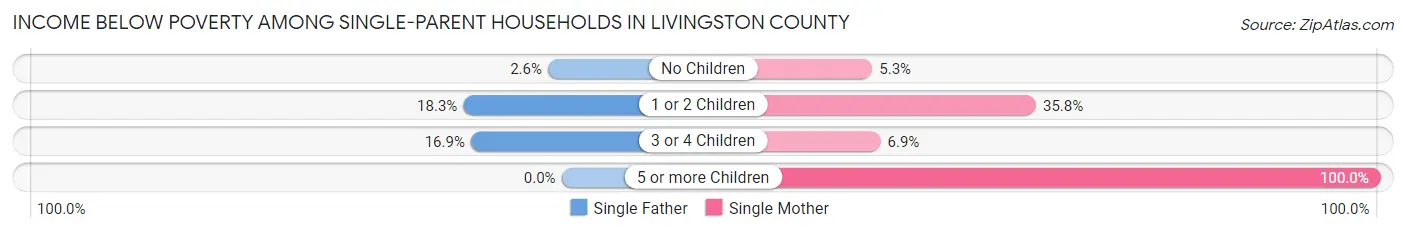
| Children | Single Father | Single Mother |
| No Children | 7 (2.5%) | 32 (5.3%) |
| 1 or 2 Children | 78 (18.3%) | 377 (35.8%) |
| 3 or 4 Children | 12 (16.9%) | 11 (6.9%) |
| 5 or more Children | 0 (0.0%) | 8 (100.0%) |
| Total | 97 (12.5%) | 428 (23.5%) |
Income Below Poverty Among Married-Couple vs Single-Parent Households in Livingston County
The poverty data for Livingston County shows that 257 of the married-couple family households (3.6%) and 525 of the single-parent households (20.2%) are living below the poverty level. Within the married-couple family households, those with 5 or more children have the highest poverty rate, with 11 households (9.0%) falling below the poverty line. Among the single-parent households, those with 5 or more children have the highest poverty rate, with 8 household (53.3%) living below poverty.
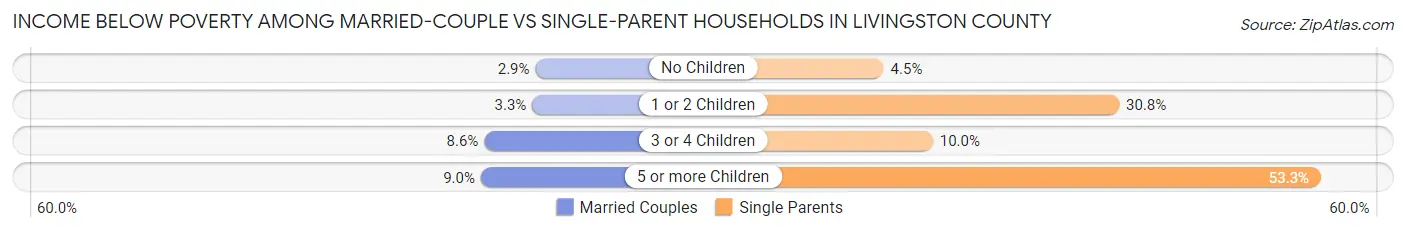
| Children | Married-Couple Families | Single-Parent Households |
| No Children | 134 (2.9%) | 39 (4.5%) |
| 1 or 2 Children | 60 (3.3%) | 455 (30.8%) |
| 3 or 4 Children | 52 (8.6%) | 23 (10.0%) |
| 5 or more Children | 11 (9.0%) | 8 (53.3%) |
| Total | 257 (3.6%) | 525 (20.2%) |
Race in Livingston County
The most populous races in Livingston County are White / Caucasian (32,689 | 91.4%), Hispanic or Latino (1,827 | 5.1%), and Black / African American (1,287 | 3.6%).
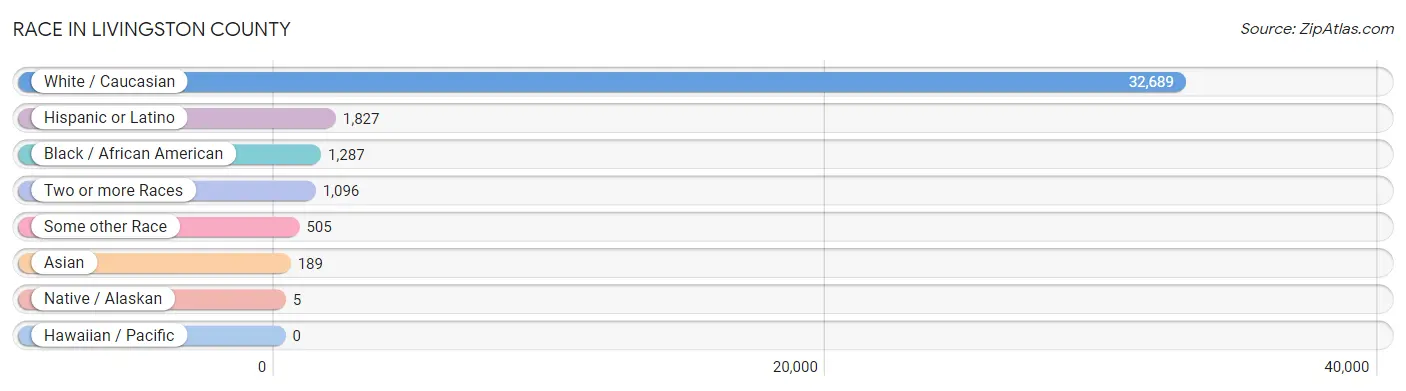
| Race | # Population | % Population |
| Asian | 189 | 0.5% |
| Black / African American | 1,287 | 3.6% |
| Hawaiian / Pacific | 0 | 0.0% |
| Hispanic or Latino | 1,827 | 5.1% |
| Native / Alaskan | 5 | 0.0% |
| White / Caucasian | 32,689 | 91.4% |
| Two or more Races | 1,096 | 3.1% |
| Some other Race | 505 | 1.4% |
| Total | 35,771 | 100.0% |
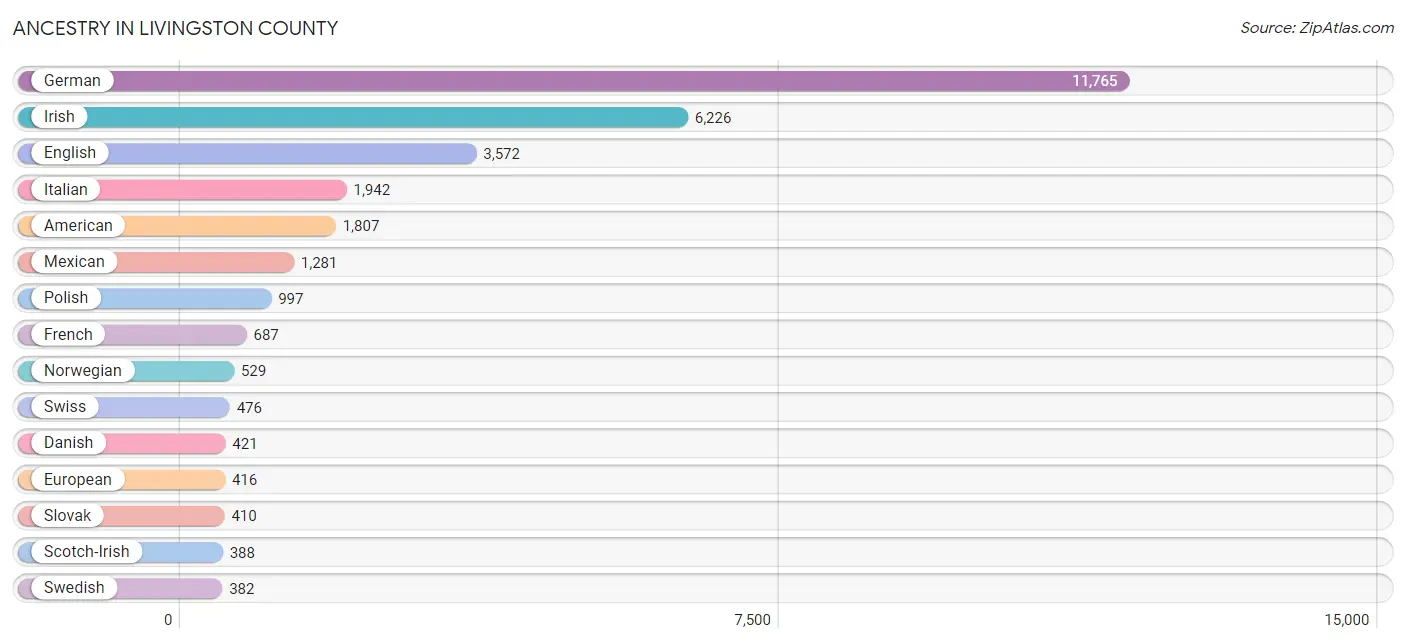
Ancestry in Livingston County
The most populous ancestries reported in Livingston County are German (11,765 | 32.9%), Irish (6,226 | 17.4%), English (3,572 | 10.0%), Italian (1,942 | 5.4%), and American (1,807 | 5.1%), together accounting for 70.8% of all Livingston County residents.
| Ancestry | # Population | % Population |
| African | 88 | 0.3% |
| Albanian | 26 | 0.1% |
| Alsatian | 2 | 0.0% |
| American | 1,807 | 5.1% |
| Arab | 51 | 0.1% |
| Austrian | 136 | 0.4% |
| Belgian | 66 | 0.2% |
| Bhutanese | 9 | 0.0% |
| Blackfeet | 10 | 0.0% |
| Brazilian | 2 | 0.0% |
| British | 230 | 0.6% |
| Burmese | 10 | 0.0% |
| Canadian | 9 | 0.0% |
| Central American | 79 | 0.2% |
| Central American Indian | 5 | 0.0% |
| Cherokee | 69 | 0.2% |
| Colombian | 4 | 0.0% |
| Cuban | 4 | 0.0% |
| Czech | 295 | 0.8% |
| Danish | 421 | 1.2% |
| Dominican | 4 | 0.0% |
| Dutch | 301 | 0.8% |
| Eastern European | 99 | 0.3% |
| Ecuadorian | 4 | 0.0% |
| Egyptian | 9 | 0.0% |
| English | 3,572 | 10.0% |
| Ethiopian | 10 | 0.0% |
| European | 416 | 1.2% |
| Finnish | 2 | 0.0% |
| French | 687 | 1.9% |
| French Canadian | 62 | 0.2% |
| German | 11,765 | 32.9% |
| Greek | 3 | 0.0% |
| Guamanian / Chamorro | 7 | 0.0% |
| Guatemalan | 14 | 0.0% |
| Haitian | 45 | 0.1% |
| Hungarian | 60 | 0.2% |
| Indian (Asian) | 27 | 0.1% |
| Irish | 6,226 | 17.4% |
| Iroquois | 2 | 0.0% |
| Italian | 1,942 | 5.4% |
| Japanese | 10 | 0.0% |
| Kenyan | 1 | 0.0% |
| Korean | 234 | 0.6% |
| Lebanese | 18 | 0.1% |
| Lithuanian | 82 | 0.2% |
| Luxembourger | 64 | 0.2% |
| Mexican | 1,281 | 3.6% |
| Mexican American Indian | 7 | 0.0% |
| Moroccan | 3 | 0.0% |
| Nigerian | 9 | 0.0% |
| Northern European | 5 | 0.0% |
| Norwegian | 529 | 1.5% |
| Ottawa | 1 | 0.0% |
| Paraguayan | 15 | 0.0% |
| Pennsylvania German | 20 | 0.1% |
| Polish | 997 | 2.8% |
| Portuguese | 5 | 0.0% |
| Pueblo | 3 | 0.0% |
| Puerto Rican | 210 | 0.6% |
| Romanian | 4 | 0.0% |
| Russian | 91 | 0.3% |
| Salvadoran | 65 | 0.2% |
| Samoan | 2 | 0.0% |
| Scandinavian | 83 | 0.2% |
| Scotch-Irish | 388 | 1.1% |
| Scottish | 339 | 0.9% |
| Sioux | 3 | 0.0% |
| Slavic | 51 | 0.1% |
| Slovak | 410 | 1.1% |
| Slovene | 37 | 0.1% |
| South American | 35 | 0.1% |
| Spaniard | 72 | 0.2% |
| Subsaharan African | 108 | 0.3% |
| Swedish | 382 | 1.1% |
| Swiss | 476 | 1.3% |
| Syrian | 19 | 0.1% |
| Thai | 11 | 0.0% |
| Ukrainian | 58 | 0.2% |
| Venezuelan | 12 | 0.0% |
| Welsh | 57 | 0.2% | View All 81 Rows |
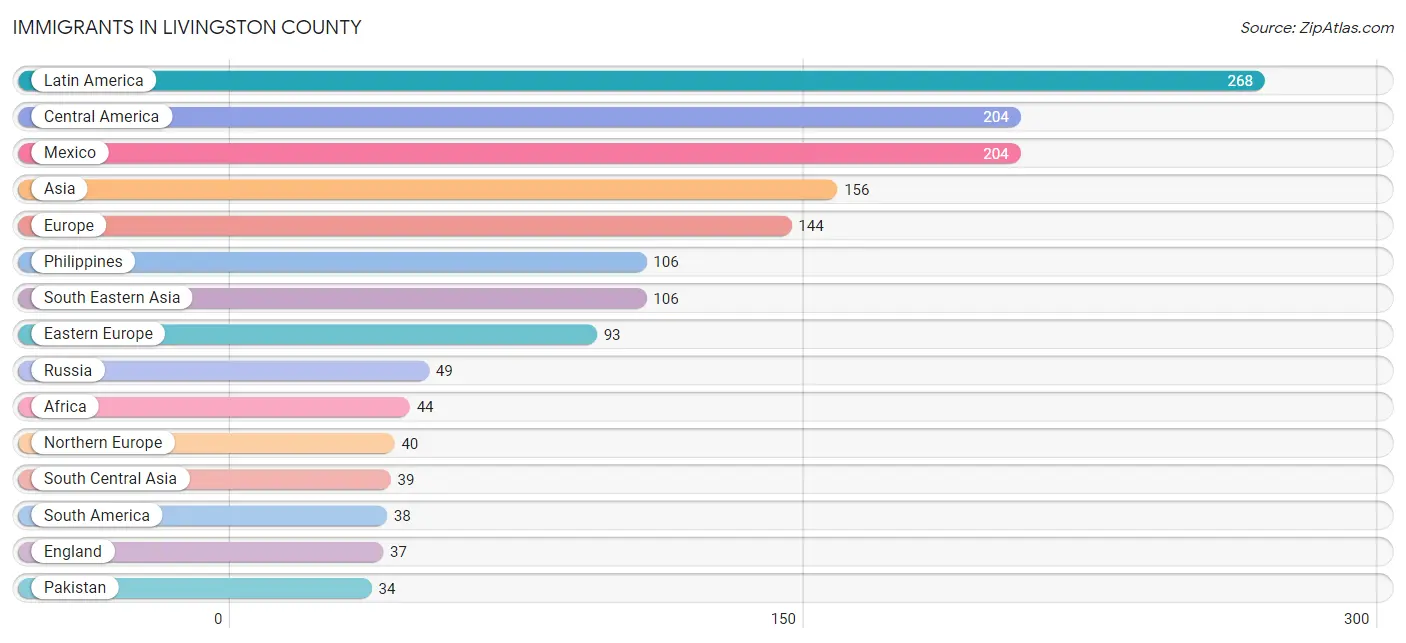
Immigrants in Livingston County
The most numerous immigrant groups reported in Livingston County came from Latin America (268 | 0.7%), Central America (204 | 0.6%), Mexico (204 | 0.6%), Asia (156 | 0.4%), and Europe (144 | 0.4%), together accounting for 2.7% of all Livingston County residents.
| Immigration Origin | # Population | % Population |
| Africa | 44 | 0.1% |
| Albania | 12 | 0.0% |
| Asia | 156 | 0.4% |
| Austria | 1 | 0.0% |
| Bahamas | 26 | 0.1% |
| Brazil | 2 | 0.0% |
| Caribbean | 26 | 0.1% |
| Central America | 204 | 0.6% |
| China | 10 | 0.0% |
| Colombia | 9 | 0.0% |
| Eastern Africa | 14 | 0.0% |
| Eastern Asia | 11 | 0.0% |
| Eastern Europe | 93 | 0.3% |
| England | 37 | 0.1% |
| Ethiopia | 10 | 0.0% |
| Europe | 144 | 0.4% |
| India | 5 | 0.0% |
| Italy | 10 | 0.0% |
| Japan | 1 | 0.0% |
| Kenya | 1 | 0.0% |
| Latin America | 268 | 0.7% |
| Mexico | 204 | 0.6% |
| Nigeria | 30 | 0.1% |
| Northern Europe | 40 | 0.1% |
| Pakistan | 34 | 0.1% |
| Philippines | 106 | 0.3% |
| Poland | 19 | 0.1% |
| Russia | 49 | 0.1% |
| Scotland | 3 | 0.0% |
| South America | 38 | 0.1% |
| South Central Asia | 39 | 0.1% |
| South Eastern Asia | 106 | 0.3% |
| Southern Europe | 10 | 0.0% |
| Ukraine | 6 | 0.0% |
| Venezuela | 12 | 0.0% |
| Western Africa | 30 | 0.1% |
| Western Europe | 1 | 0.0% | View All 37 Rows |
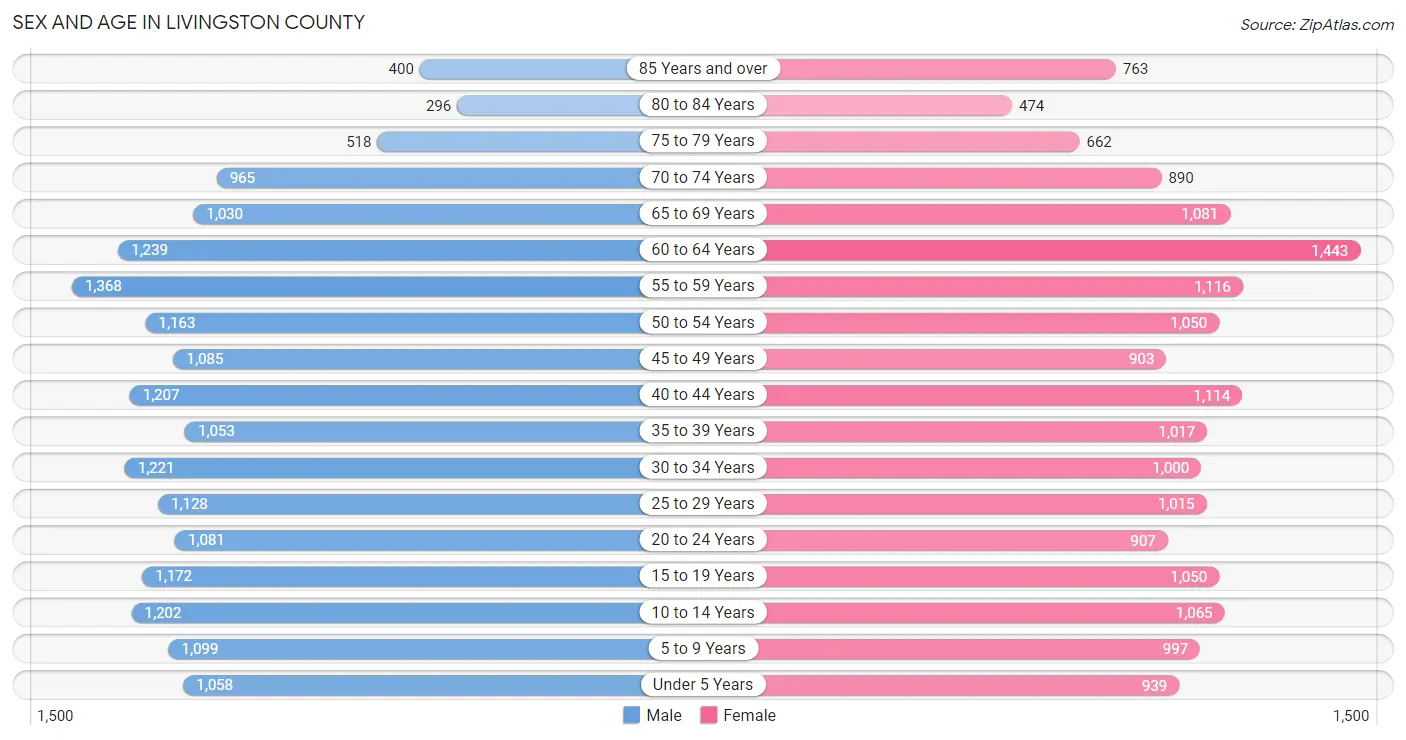
Sex and Age in Livingston County
Sex and Age in Livingston County
The most populous age groups in Livingston County are 55 to 59 Years (1,368 | 7.5%) for men and 60 to 64 Years (1,443 | 8.3%) for women.
| Age Bracket | Male | Female |
| Under 5 Years | 1,058 (5.8%) | 939 (5.4%) |
| 5 to 9 Years | 1,099 (6.0%) | 997 (5.7%) |
| 10 to 14 Years | 1,202 (6.6%) | 1,065 (6.1%) |
| 15 to 19 Years | 1,172 (6.4%) | 1,050 (6.0%) |
| 20 to 24 Years | 1,081 (5.9%) | 907 (5.2%) |
| 25 to 29 Years | 1,128 (6.2%) | 1,015 (5.8%) |
| 30 to 34 Years | 1,221 (6.7%) | 1,000 (5.7%) |
| 35 to 39 Years | 1,053 (5.8%) | 1,017 (5.8%) |
| 40 to 44 Years | 1,207 (6.6%) | 1,114 (6.4%) |
| 45 to 49 Years | 1,085 (5.9%) | 903 (5.2%) |
| 50 to 54 Years | 1,163 (6.4%) | 1,050 (6.0%) |
| 55 to 59 Years | 1,368 (7.5%) | 1,116 (6.4%) |
| 60 to 64 Years | 1,239 (6.8%) | 1,443 (8.3%) |
| 65 to 69 Years | 1,030 (5.6%) | 1,081 (6.2%) |
| 70 to 74 Years | 965 (5.3%) | 890 (5.1%) |
| 75 to 79 Years | 518 (2.8%) | 662 (3.8%) |
| 80 to 84 Years | 296 (1.6%) | 474 (2.7%) |
| 85 Years and over | 400 (2.2%) | 763 (4.4%) |
| Total | 18,285 (100.0%) | 17,486 (100.0%) |
Families and Households in Livingston County
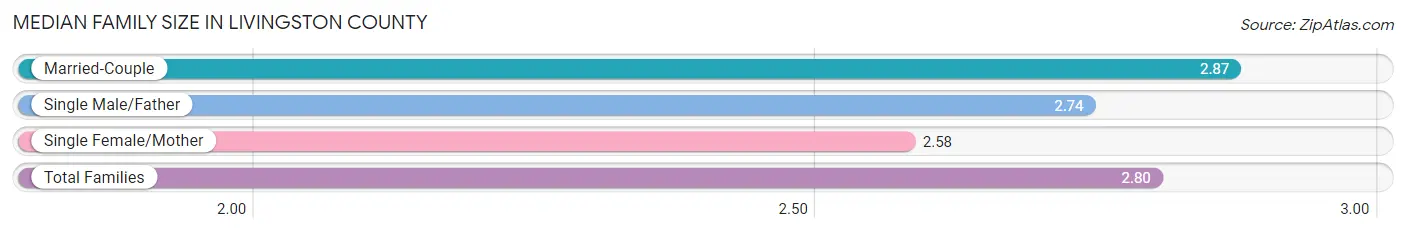
Median Family Size in Livingston County
The median family size in Livingston County is 2.80 persons per family, with married-couple families (7,154 | 73.4%) accounting for the largest median family size of 2.87 persons per family. On the other hand, single female/mother families (1,819 | 18.6%) represent the smallest median family size with 2.58 persons per family.
| Family Type | # Families | Family Size |
| Married-Couple | 7,154 (73.4%) | 2.87 |
| Single Male/Father | 778 (8.0%) | 2.74 |
| Single Female/Mother | 1,819 (18.6%) | 2.58 |
| Total Families | 9,751 (100.0%) | 2.80 |
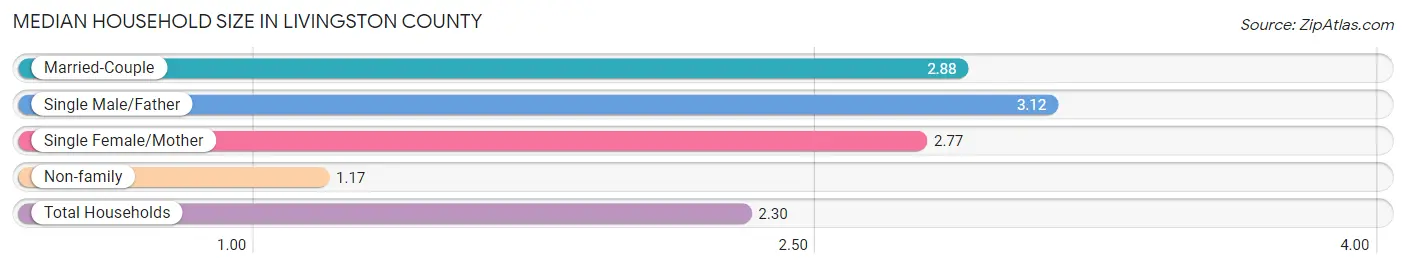
Median Household Size in Livingston County
The median household size in Livingston County is 2.30 persons per household, with single male/father households (778 | 5.3%) accounting for the largest median household size of 3.12 persons per household. non-family households (4,914 | 33.5%) represent the smallest median household size with 1.17 persons per household.
| Household Type | # Households | Household Size |
| Married-Couple | 7,154 (48.8%) | 2.88 |
| Single Male/Father | 778 (5.3%) | 3.12 |
| Single Female/Mother | 1,819 (12.4%) | 2.77 |
| Non-family | 4,914 (33.5%) | 1.17 |
| Total Households | 14,665 (100.0%) | 2.30 |
Household Size by Marriage Status in Livingston County
Out of a total of 14,665 households in Livingston County, 9,751 (66.5%) are family households, while 4,914 (33.5%) are nonfamily households. The most numerous type of family households are 2-person households, comprising 4,580, and the most common type of nonfamily households are 1-person households, comprising 4,243.
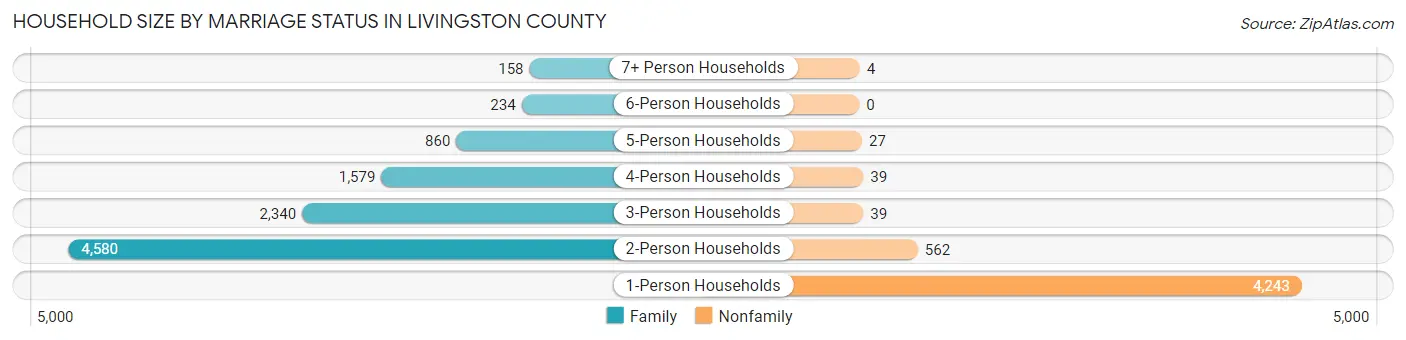
| Household Size | Family Households | Nonfamily Households |
| 1-Person Households | - | 4,243 (28.9%) |
| 2-Person Households | 4,580 (31.2%) | 562 (3.8%) |
| 3-Person Households | 2,340 (16.0%) | 39 (0.3%) |
| 4-Person Households | 1,579 (10.8%) | 39 (0.3%) |
| 5-Person Households | 860 (5.9%) | 27 (0.2%) |
| 6-Person Households | 234 (1.6%) | 0 (0.0%) |
| 7+ Person Households | 158 (1.1%) | 4 (0.0%) |
| Total | 9,751 (66.5%) | 4,914 (33.5%) |
Female Fertility in Livingston County
Fertility by Age in Livingston County
Average fertility rate in Livingston County is 68.0 births per 1,000 women. Women in the age bracket of 20 to 34 years have the highest fertility rate with 142.0 births per 1,000 women. Women in the age bracket of 20 to 34 years acount for 85.4% of all women with births.
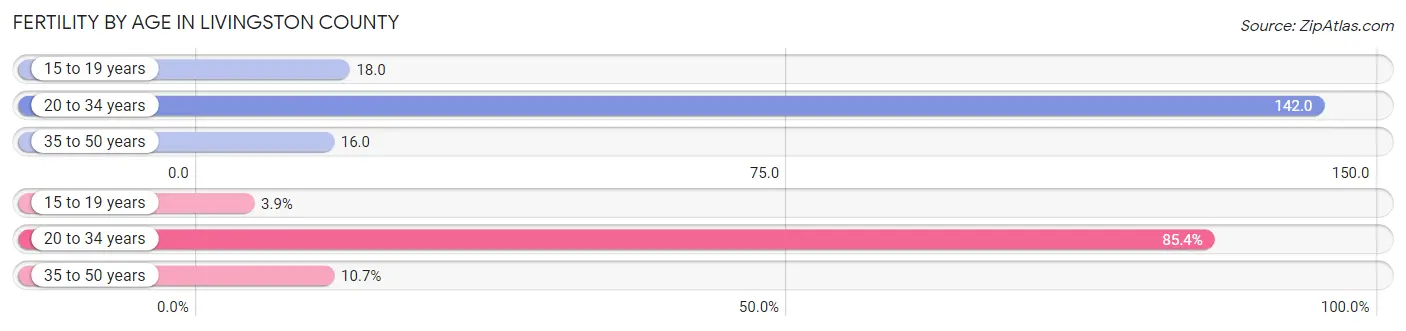
| Age Bracket | Women with Births | Births / 1,000 Women |
| 15 to 19 years | 19 (3.9%) | 18.0 |
| 20 to 34 years | 415 (85.4%) | 142.0 |
| 35 to 50 years | 52 (10.7%) | 16.0 |
| Total | 486 (100.0%) | 68.0 |
Fertility by Age by Marriage Status in Livingston County
66.3% of women with births (486) in Livingston County are married. The highest percentage of unmarried women with births falls into 15 to 19 years age bracket with 100.0% of them unmarried at the time of birth, while the lowest percentage of unmarried women with births belong to 35 to 50 years age bracket with 11.5% of them unmarried.
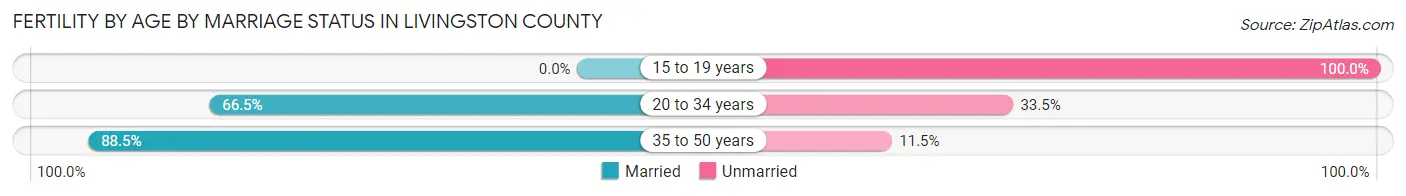
| Age Bracket | Married | Unmarried |
| 15 to 19 years | 0 (0.0%) | 19 (100.0%) |
| 20 to 34 years | 276 (66.5%) | 139 (33.5%) |
| 35 to 50 years | 46 (88.5%) | 6 (11.5%) |
| Total | 322 (66.3%) | 164 (33.7%) |
Fertility by Education in Livingston County
Average fertility rate in Livingston County is 68.0 births per 1,000 women. Women with the education attainment of college or associate's degree have the highest fertility rate of 98.0 births per 1,000 women, while women with the education attainment of less than high school have the lowest fertility at 44.0 births per 1,000 women. Women with the education attainment of college or associate's degree represent 48.6% of all women with births.
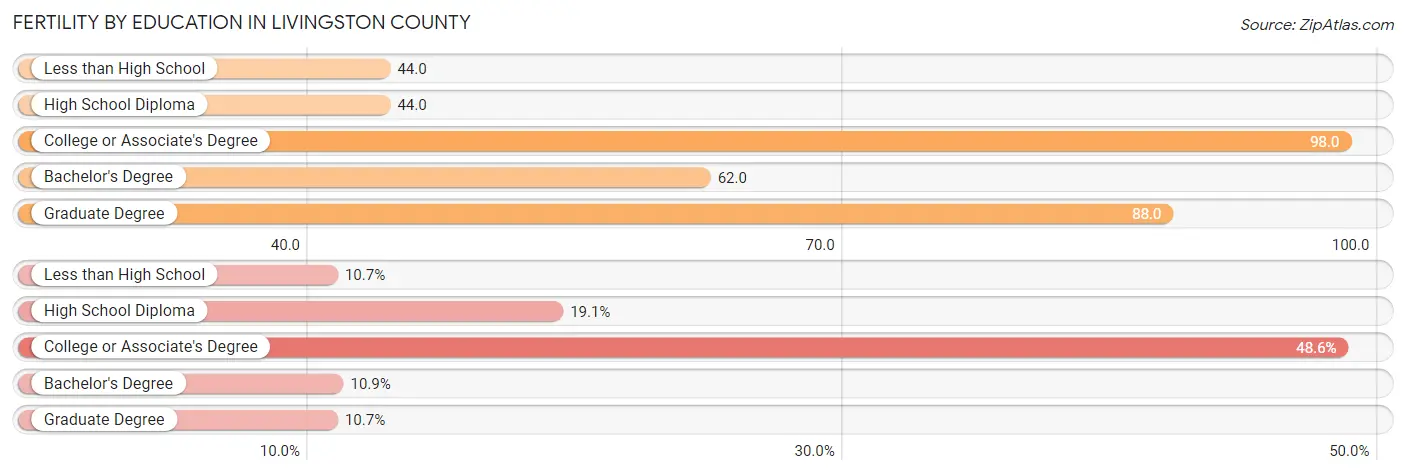
| Educational Attainment | Women with Births | Births / 1,000 Women |
| Less than High School | 52 (10.7%) | 44.0 |
| High School Diploma | 93 (19.1%) | 44.0 |
| College or Associate's Degree | 236 (48.6%) | 98.0 |
| Bachelor's Degree | 53 (10.9%) | 62.0 |
| Graduate Degree | 52 (10.7%) | 88.0 |
| Total | 486 (100.0%) | 68.0 |
Fertility by Education by Marriage Status in Livingston County
33.7% of women with births in Livingston County are unmarried. Women with the educational attainment of bachelor's degree are most likely to be married with 96.2% of them married at childbirth, while women with the educational attainment of high school diploma are least likely to be married with 46.2% of them unmarried at childbirth.
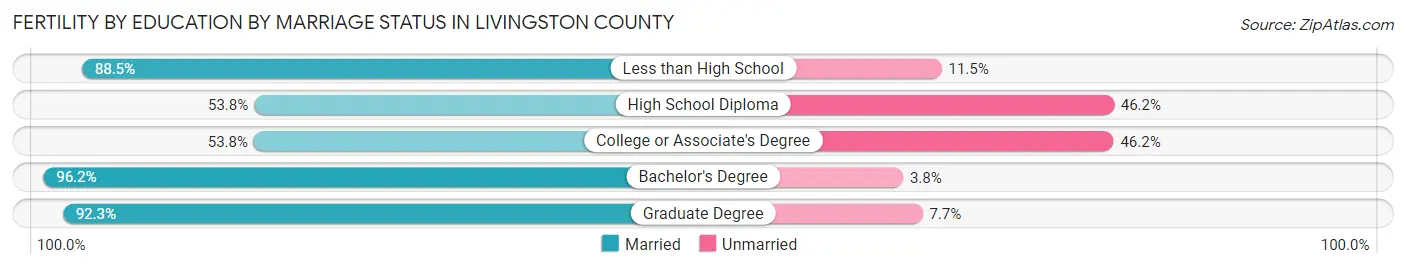
| Educational Attainment | Married | Unmarried |
| Less than High School | 46 (88.5%) | 6 (11.5%) |
| High School Diploma | 50 (53.8%) | 43 (46.2%) |
| College or Associate's Degree | 127 (53.8%) | 109 (46.2%) |
| Bachelor's Degree | 51 (96.2%) | 2 (3.8%) |
| Graduate Degree | 48 (92.3%) | 4 (7.7%) |
| Total | 322 (66.3%) | 164 (33.7%) |
Employment Characteristics in Livingston County
Employment by Class of Employer in Livingston County
Among the 16,394 employed individuals in Livingston County, private company employees (11,075 | 67.6%), local government employees (1,564 | 9.5%), and not-for-profit organizations (1,373 | 8.4%) make up the most common classes of employment.
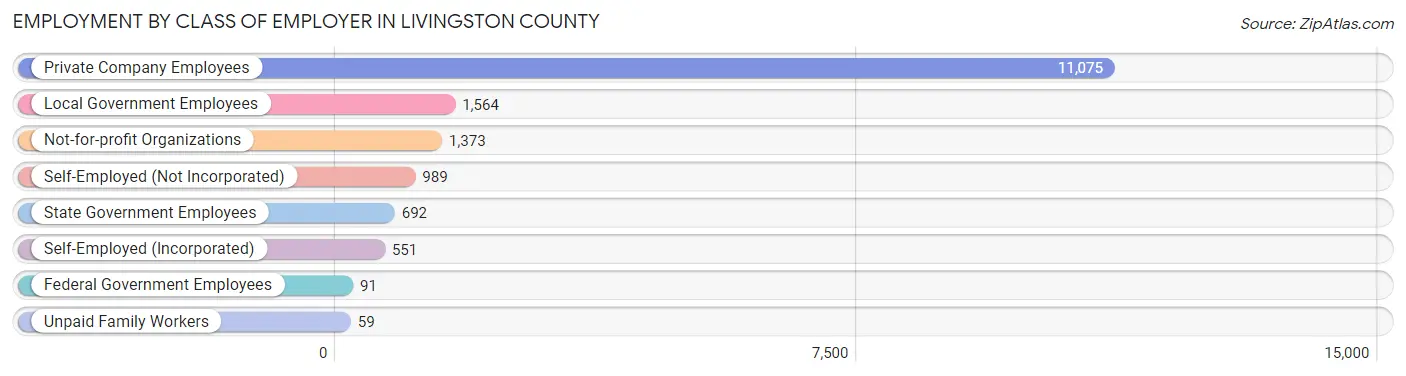
| Employer Class | # Employees | % Employees |
| Private Company Employees | 11,075 | 67.6% |
| Self-Employed (Incorporated) | 551 | 3.4% |
| Self-Employed (Not Incorporated) | 989 | 6.0% |
| Not-for-profit Organizations | 1,373 | 8.4% |
| Local Government Employees | 1,564 | 9.5% |
| State Government Employees | 692 | 4.2% |
| Federal Government Employees | 91 | 0.6% |
| Unpaid Family Workers | 59 | 0.4% |
| Total | 16,394 | 100.0% |
Employment Status by Age in Livingston County
According to the labor force statistics for Livingston County, out of the total population over 16 years of age (29,072), 59.7% or 17,356 individuals are in the labor force, with 3.7% or 642 of them unemployed. The age group with the highest labor force participation rate is 20 to 24 years, with 82.4% or 1,638 individuals in the labor force. Within the labor force, the 16 to 19 years age range has the highest percentage of unemployed individuals, with 13.0% or 117 of them being unemployed.
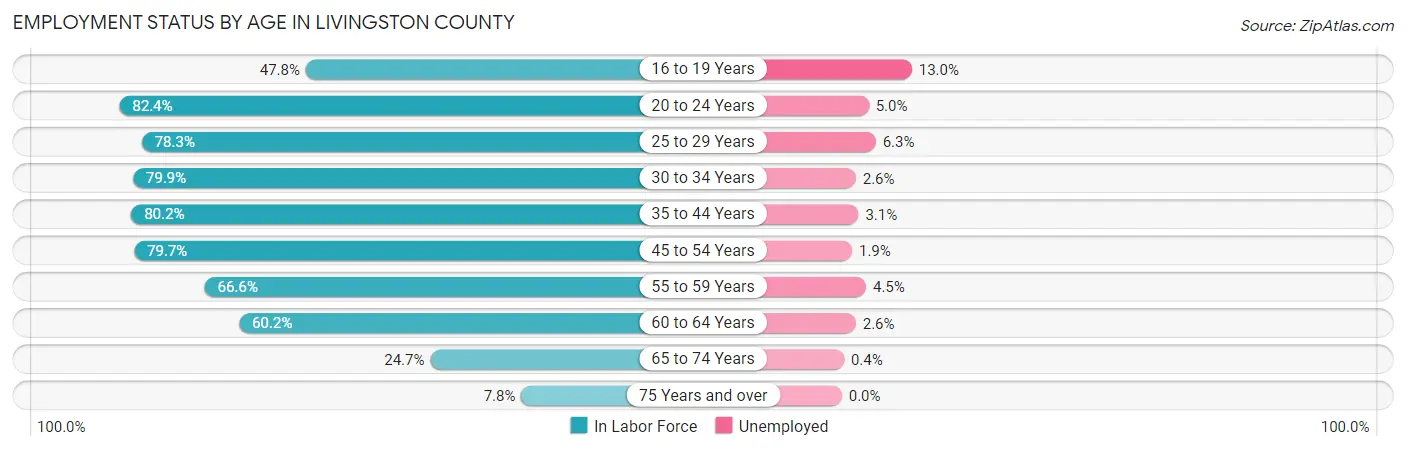
| Age Bracket | In Labor Force | Unemployed |
| 16 to 19 Years | 900 (47.8%) | 117 (13.0%) |
| 20 to 24 Years | 1,638 (82.4%) | 82 (5.0%) |
| 25 to 29 Years | 1,678 (78.3%) | 106 (6.3%) |
| 30 to 34 Years | 1,775 (79.9%) | 46 (2.6%) |
| 35 to 44 Years | 3,522 (80.2%) | 109 (3.1%) |
| 45 to 54 Years | 3,348 (79.7%) | 64 (1.9%) |
| 55 to 59 Years | 1,654 (66.6%) | 74 (4.5%) |
| 60 to 64 Years | 1,615 (60.2%) | 42 (2.6%) |
| 65 to 74 Years | 980 (24.7%) | 4 (0.4%) |
| 75 Years and over | 243 (7.8%) | 0 (0.0%) |
| Total | 17,356 (59.7%) | 642 (3.7%) |
Employment Status by Educational Attainment in Livingston County
According to labor force statistics for Livingston County, 75.0% of individuals (13,592) out of the total population between 25 and 64 years of age (18,122) are in the labor force, with 3.2% or 435 of them being unemployed. The group with the highest labor force participation rate are those with the educational attainment of bachelor's degree or higher, with 88.9% or 3,126 individuals in the labor force. Within the labor force, individuals with less than high school education have the highest percentage of unemployment, with 6.5% or 43 of them being unemployed.
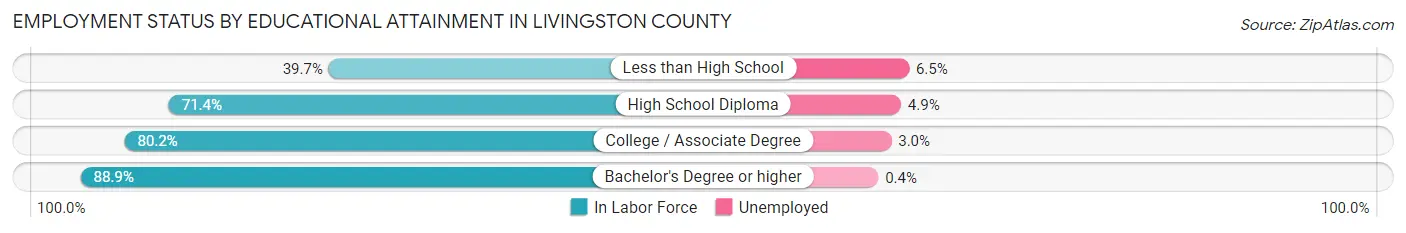
| Educational Attainment | In Labor Force | Unemployed |
| Less than High School | 658 (39.7%) | 108 (6.5%) |
| High School Diploma | 4,754 (71.4%) | 326 (4.9%) |
| College / Associate Degree | 5,045 (80.2%) | 189 (3.0%) |
| Bachelor's Degree or higher | 3,126 (88.9%) | 14 (0.4%) |
| Total | 13,592 (75.0%) | 580 (3.2%) |
Employment Occupations by Sex in Livingston County
Management, Business, Science and Arts Occupations
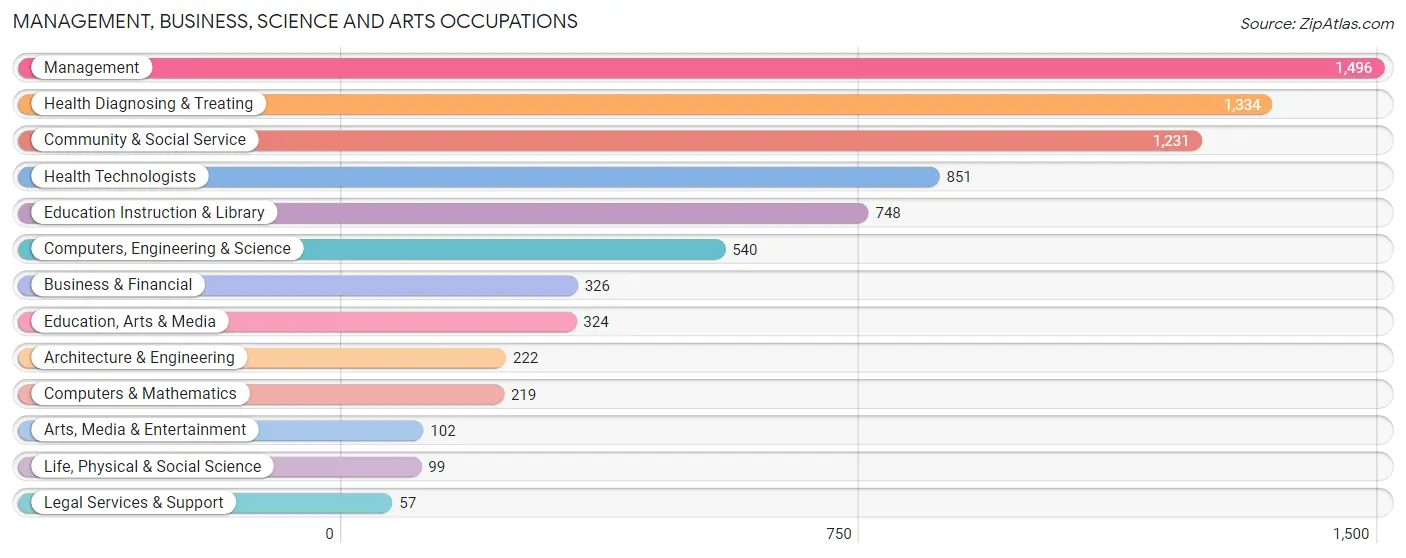
The most common Management, Business, Science and Arts occupations in Livingston County are Management (1,496 | 8.9%), Health Diagnosing & Treating (1,334 | 8.0%), Community & Social Service (1,231 | 7.4%), Health Technologists (851 | 5.1%), and Education Instruction & Library (748 | 4.5%).
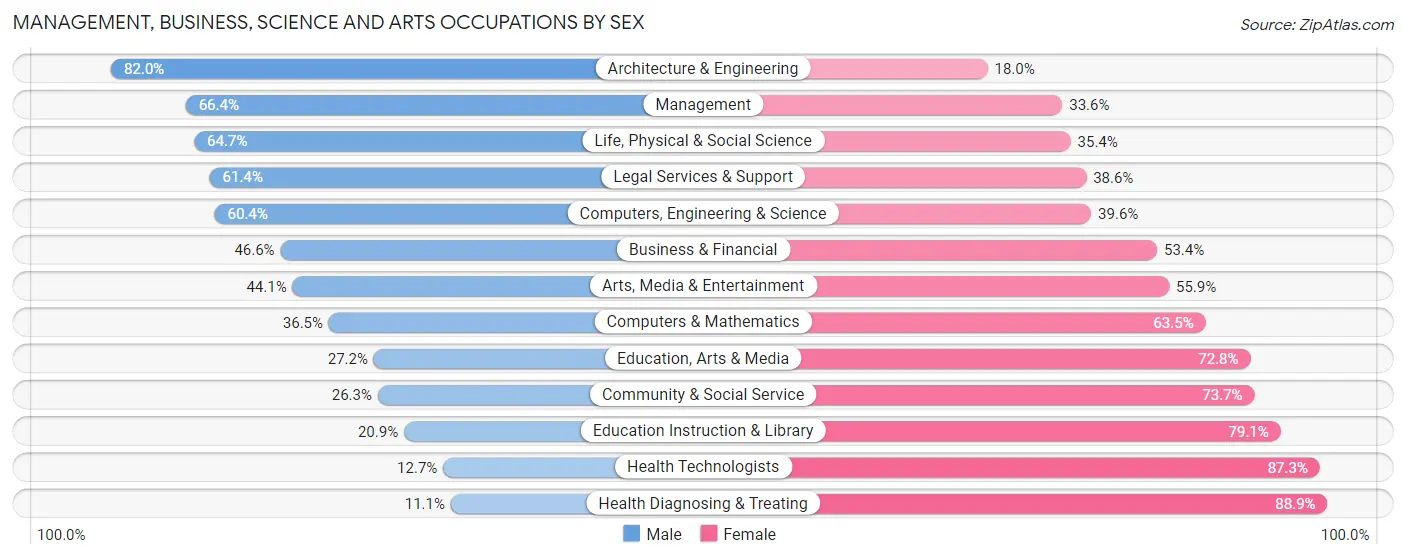
Management, Business, Science and Arts Occupations by Sex
Within the Management, Business, Science and Arts occupations in Livingston County, the most male-oriented occupations are Architecture & Engineering (82.0%), Management (66.4%), and Life, Physical & Social Science (64.6%), while the most female-oriented occupations are Health Diagnosing & Treating (88.9%), Health Technologists (87.3%), and Education Instruction & Library (79.1%).
| Occupation | Male | Female |
| Management | 993 (66.4%) | 503 (33.6%) |
| Business & Financial | 152 (46.6%) | 174 (53.4%) |
| Computers, Engineering & Science | 326 (60.4%) | 214 (39.6%) |
| Computers & Mathematics | 80 (36.5%) | 139 (63.5%) |
| Architecture & Engineering | 182 (82.0%) | 40 (18.0%) |
| Life, Physical & Social Science | 64 (64.6%) | 35 (35.3%) |
| Community & Social Service | 324 (26.3%) | 907 (73.7%) |
| Education, Arts & Media | 88 (27.2%) | 236 (72.8%) |
| Legal Services & Support | 35 (61.4%) | 22 (38.6%) |
| Education Instruction & Library | 156 (20.9%) | 592 (79.1%) |
| Arts, Media & Entertainment | 45 (44.1%) | 57 (55.9%) |
| Health Diagnosing & Treating | 148 (11.1%) | 1,186 (88.9%) |
| Health Technologists | 108 (12.7%) | 743 (87.3%) |
| Total (Category) | 1,943 (39.4%) | 2,984 (60.6%) |
| Total (Overall) | 8,771 (52.5%) | 7,936 (47.5%) |
Services Occupations
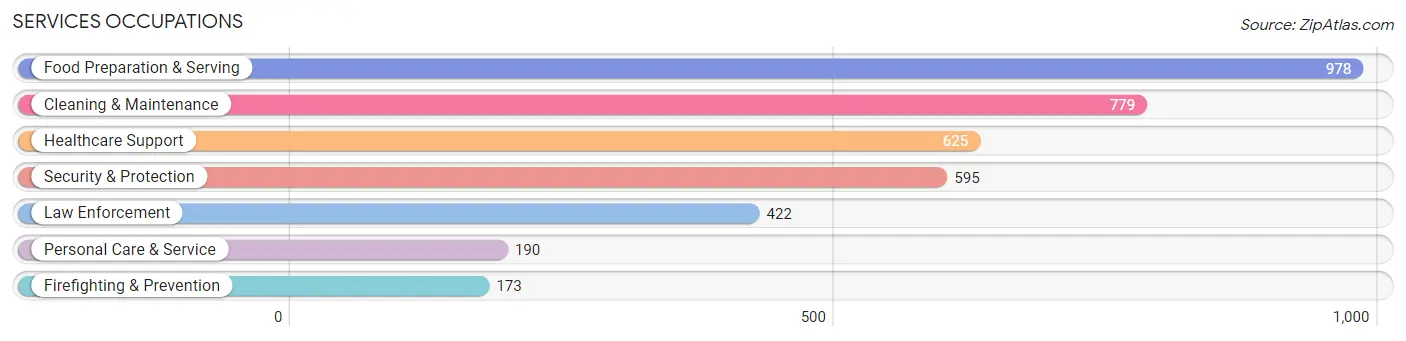
The most common Services occupations in Livingston County are Food Preparation & Serving (978 | 5.9%), Cleaning & Maintenance (779 | 4.7%), Healthcare Support (625 | 3.7%), Security & Protection (595 | 3.6%), and Law Enforcement (422 | 2.5%).
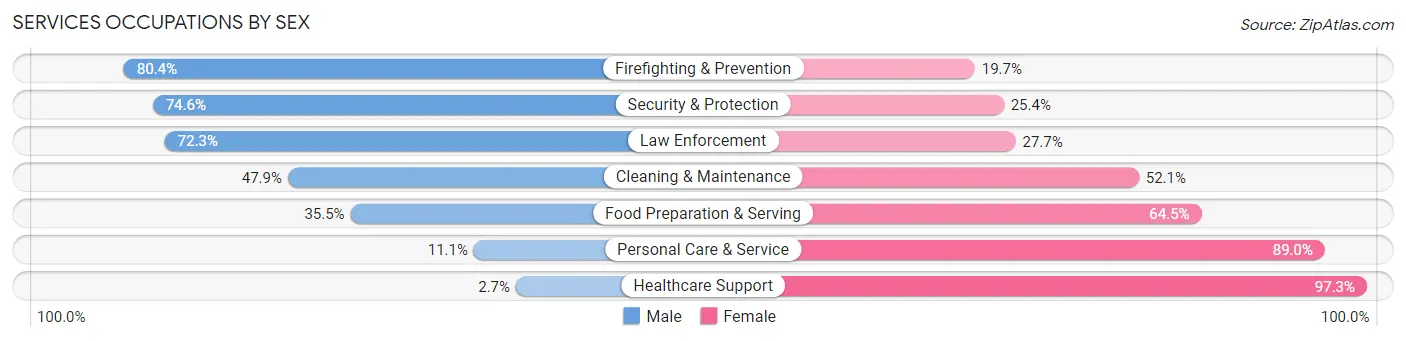
Services Occupations by Sex
Within the Services occupations in Livingston County, the most male-oriented occupations are Firefighting & Prevention (80.3%), Security & Protection (74.6%), and Law Enforcement (72.3%), while the most female-oriented occupations are Healthcare Support (97.3%), Personal Care & Service (88.9%), and Food Preparation & Serving (64.5%).
| Occupation | Male | Female |
| Healthcare Support | 17 (2.7%) | 608 (97.3%) |
| Security & Protection | 444 (74.6%) | 151 (25.4%) |
| Firefighting & Prevention | 139 (80.3%) | 34 (19.7%) |
| Law Enforcement | 305 (72.3%) | 117 (27.7%) |
| Food Preparation & Serving | 347 (35.5%) | 631 (64.5%) |
| Cleaning & Maintenance | 373 (47.9%) | 406 (52.1%) |
| Personal Care & Service | 21 (11.1%) | 169 (88.9%) |
| Total (Category) | 1,202 (38.0%) | 1,965 (62.1%) |
| Total (Overall) | 8,771 (52.5%) | 7,936 (47.5%) |
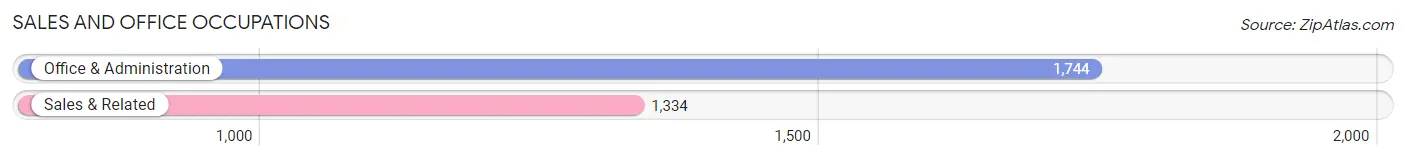
Sales and Office Occupations
The most common Sales and Office occupations in Livingston County are Office & Administration (1,744 | 10.4%), and Sales & Related (1,334 | 8.0%).
Sales and Office Occupations by Sex
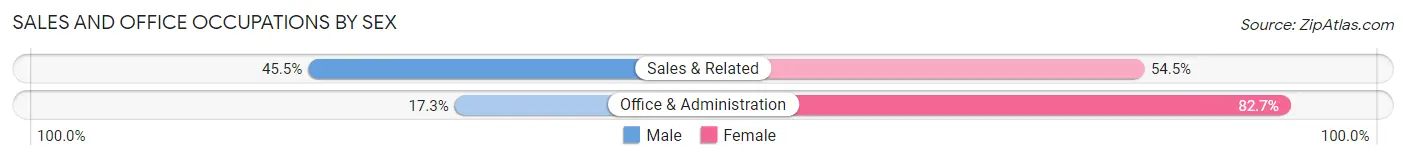
| Occupation | Male | Female |
| Sales & Related | 607 (45.5%) | 727 (54.5%) |
| Office & Administration | 302 (17.3%) | 1,442 (82.7%) |
| Total (Category) | 909 (29.5%) | 2,169 (70.5%) |
| Total (Overall) | 8,771 (52.5%) | 7,936 (47.5%) |
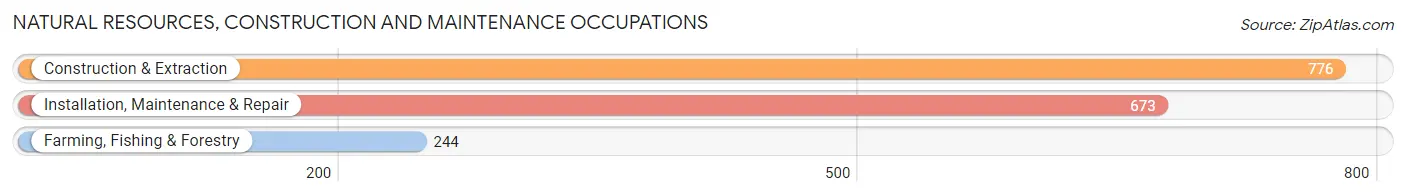
Natural Resources, Construction and Maintenance Occupations
The most common Natural Resources, Construction and Maintenance occupations in Livingston County are Construction & Extraction (776 | 4.6%), Installation, Maintenance & Repair (673 | 4.0%), and Farming, Fishing & Forestry (244 | 1.5%).
Natural Resources, Construction and Maintenance Occupations by Sex
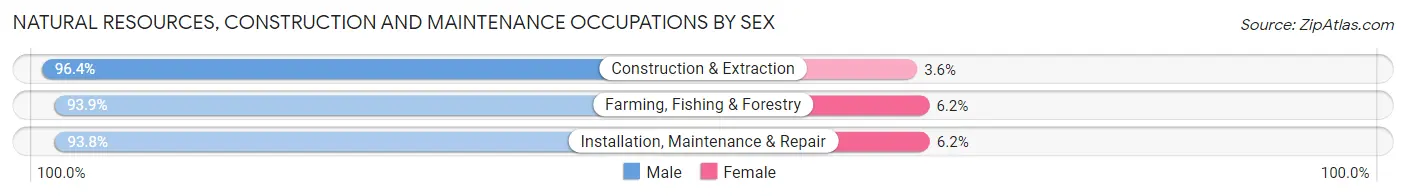
| Occupation | Male | Female |
| Farming, Fishing & Forestry | 229 (93.9%) | 15 (6.1%) |
| Construction & Extraction | 748 (96.4%) | 28 (3.6%) |
| Installation, Maintenance & Repair | 631 (93.8%) | 42 (6.2%) |
| Total (Category) | 1,608 (95.0%) | 85 (5.0%) |
| Total (Overall) | 8,771 (52.5%) | 7,936 (47.5%) |
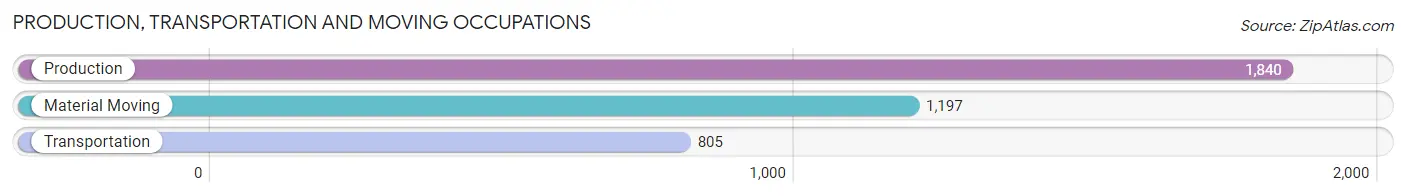
Production, Transportation and Moving Occupations
The most common Production, Transportation and Moving occupations in Livingston County are Production (1,840 | 11.0%), Material Moving (1,197 | 7.2%), and Transportation (805 | 4.8%).
Production, Transportation and Moving Occupations by Sex
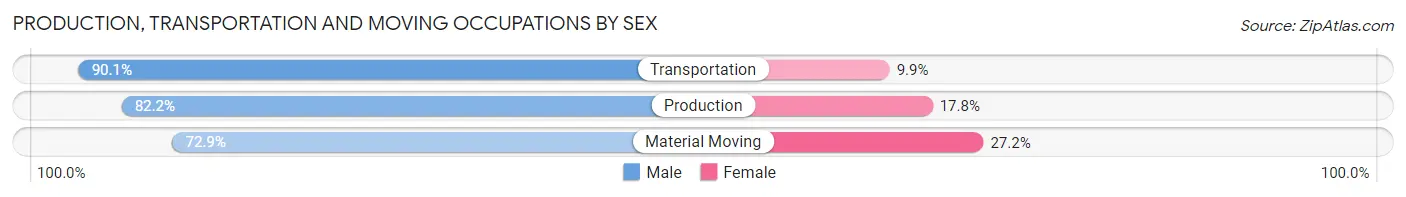
| Occupation | Male | Female |
| Production | 1,512 (82.2%) | 328 (17.8%) |
| Transportation | 725 (90.1%) | 80 (9.9%) |
| Material Moving | 872 (72.9%) | 325 (27.2%) |
| Total (Category) | 3,109 (80.9%) | 733 (19.1%) |
| Total (Overall) | 8,771 (52.5%) | 7,936 (47.5%) |
Employment Industries by Sex in Livingston County
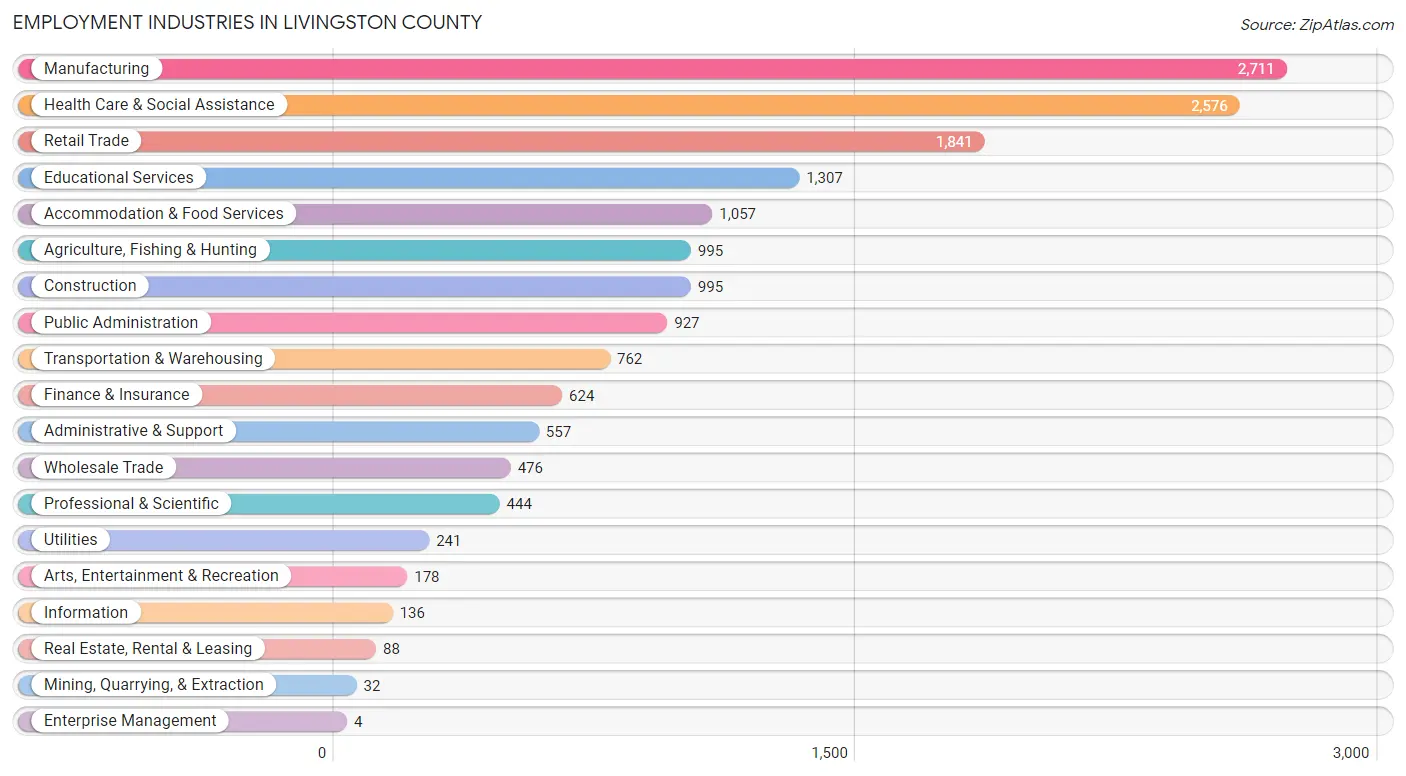
Employment Industries in Livingston County
The major employment industries in Livingston County include Manufacturing (2,711 | 16.2%), Health Care & Social Assistance (2,576 | 15.4%), Retail Trade (1,841 | 11.0%), Educational Services (1,307 | 7.8%), and Accommodation & Food Services (1,057 | 6.3%).
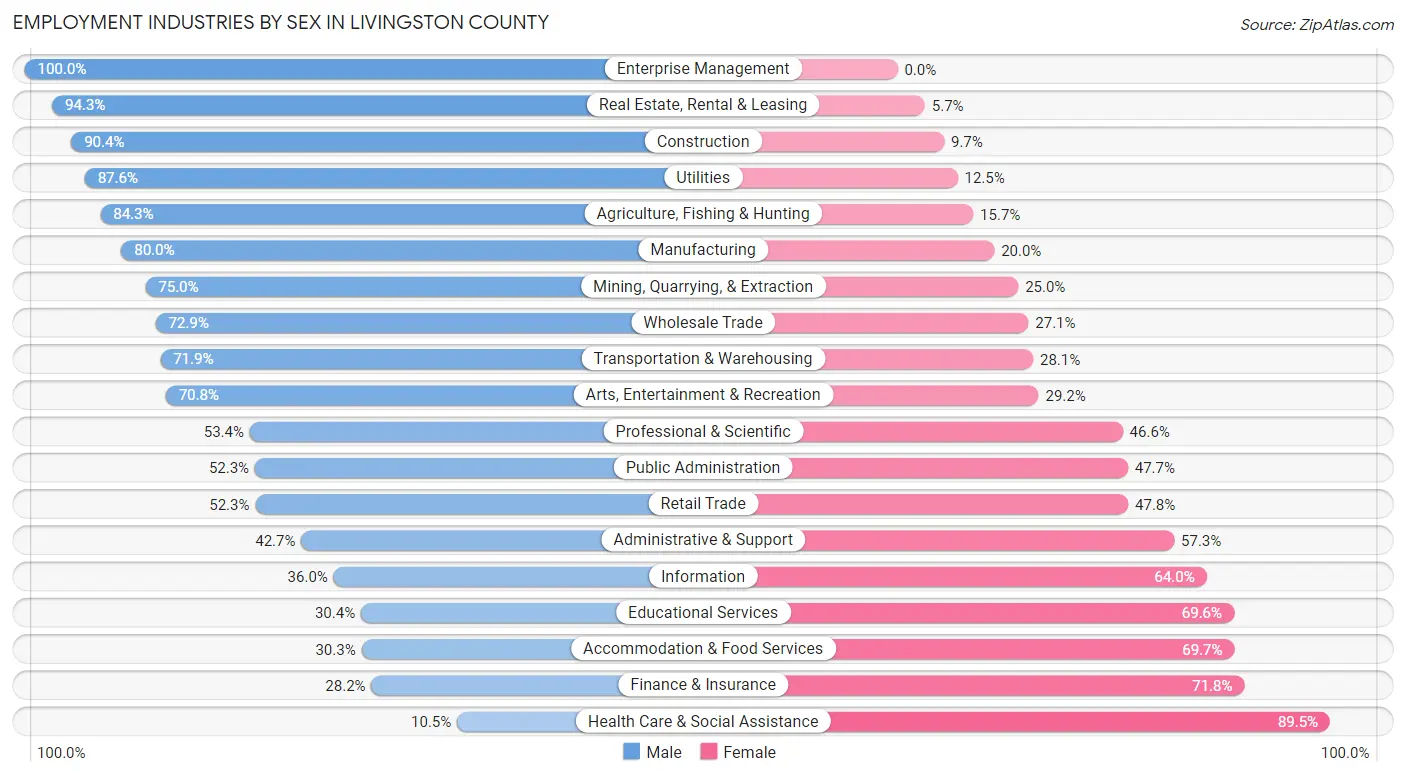
Employment Industries by Sex in Livingston County
The Livingston County industries that see more men than women are Enterprise Management (100.0%), Real Estate, Rental & Leasing (94.3%), and Construction (90.3%), whereas the industries that tend to have a higher number of women are Health Care & Social Assistance (89.5%), Finance & Insurance (71.8%), and Accommodation & Food Services (69.7%).
| Industry | Male | Female |
| Agriculture, Fishing & Hunting | 839 (84.3%) | 156 (15.7%) |
| Mining, Quarrying, & Extraction | 24 (75.0%) | 8 (25.0%) |
| Construction | 899 (90.3%) | 96 (9.7%) |
| Manufacturing | 2,168 (80.0%) | 543 (20.0%) |
| Wholesale Trade | 347 (72.9%) | 129 (27.1%) |
| Retail Trade | 962 (52.2%) | 879 (47.7%) |
| Transportation & Warehousing | 548 (71.9%) | 214 (28.1%) |
| Utilities | 211 (87.5%) | 30 (12.4%) |
| Information | 49 (36.0%) | 87 (64.0%) |
| Finance & Insurance | 176 (28.2%) | 448 (71.8%) |
| Real Estate, Rental & Leasing | 83 (94.3%) | 5 (5.7%) |
| Professional & Scientific | 237 (53.4%) | 207 (46.6%) |
| Enterprise Management | 4 (100.0%) | 0 (0.0%) |
| Administrative & Support | 238 (42.7%) | 319 (57.3%) |
| Educational Services | 397 (30.4%) | 910 (69.6%) |
| Health Care & Social Assistance | 270 (10.5%) | 2,306 (89.5%) |
| Arts, Entertainment & Recreation | 126 (70.8%) | 52 (29.2%) |
| Accommodation & Food Services | 320 (30.3%) | 737 (69.7%) |
| Public Administration | 485 (52.3%) | 442 (47.7%) |
| Total | 8,771 (52.5%) | 7,936 (47.5%) |
Education in Livingston County
School Enrollment in Livingston County
The most common levels of schooling among the 7,334 students in Livingston County are high school (2,010 | 27.4%), middle school (1,657 | 22.6%), and elementary school (1,629 | 22.2%).
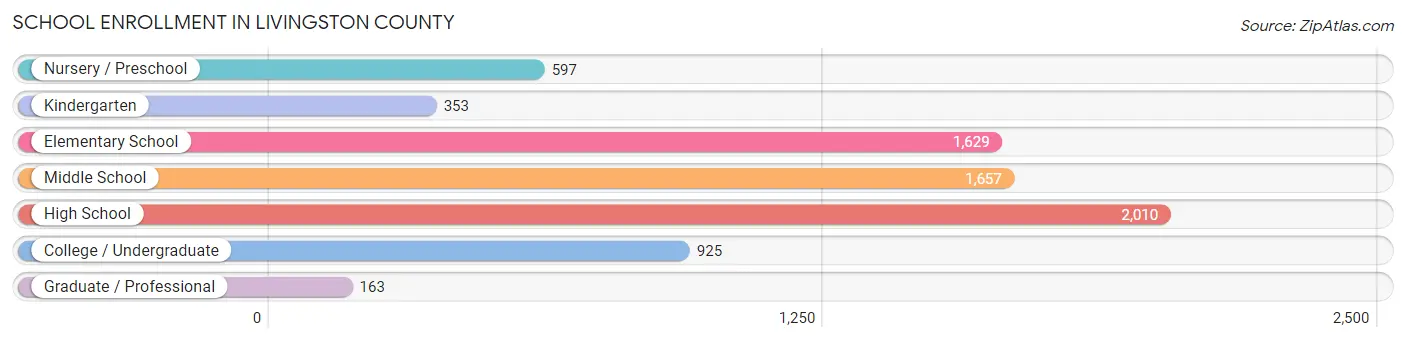
| School Level | # Students | % Students |
| Nursery / Preschool | 597 | 8.1% |
| Kindergarten | 353 | 4.8% |
| Elementary School | 1,629 | 22.2% |
| Middle School | 1,657 | 22.6% |
| High School | 2,010 | 27.4% |
| College / Undergraduate | 925 | 12.6% |
| Graduate / Professional | 163 | 2.2% |
| Total | 7,334 | 100.0% |
School Enrollment by Age by Funding Source in Livingston County
Out of a total of 7,334 students who are enrolled in schools in Livingston County, 777 (10.6%) attend a private institution, while the remaining 6,557 (89.4%) are enrolled in public schools. The age group of 25 to 34 year olds has the highest likelihood of being enrolled in private schools, with 58 (19.3% in the age bracket) enrolled. Conversely, the age group of 18 to 19 year olds has the lowest likelihood of being enrolled in a private school, with 541 (95.3% in the age bracket) attending a public institution.
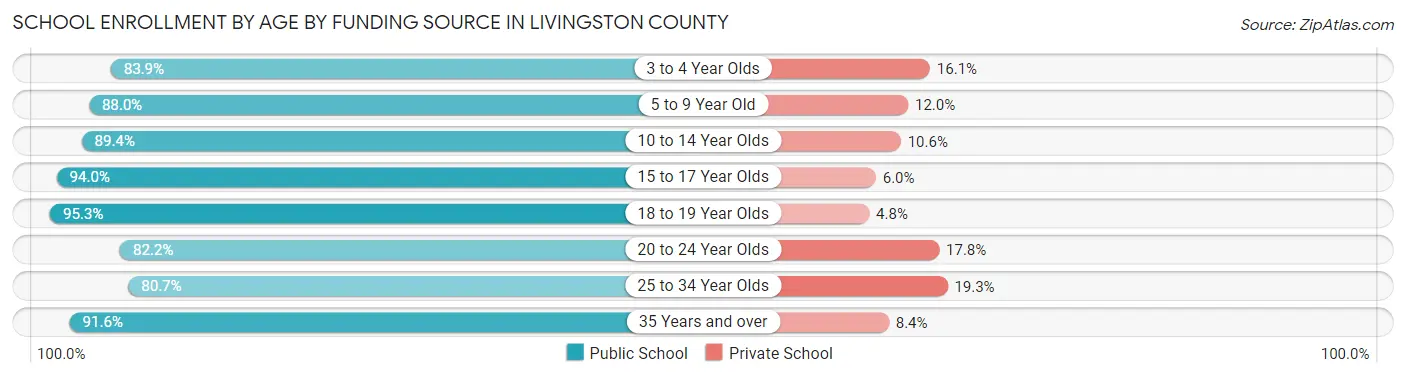
| Age Bracket | Public School | Private School |
| 3 to 4 Year Olds | 345 (83.9%) | 66 (16.1%) |
| 5 to 9 Year Old | 1,740 (88.0%) | 237 (12.0%) |
| 10 to 14 Year Olds | 1,824 (89.4%) | 217 (10.6%) |
| 15 to 17 Year Olds | 1,304 (94.0%) | 83 (6.0%) |
| 18 to 19 Year Olds | 541 (95.3%) | 27 (4.8%) |
| 20 to 24 Year Olds | 319 (82.2%) | 69 (17.8%) |
| 25 to 34 Year Olds | 242 (80.7%) | 58 (19.3%) |
| 35 Years and over | 240 (91.6%) | 22 (8.4%) |
| Total | 6,557 (89.4%) | 777 (10.6%) |
Educational Attainment by Field of Study in Livingston County
Education (1,140 | 22.7%), business (783 | 15.6%), bio, nature & agricultural (733 | 14.6%), arts & humanities (538 | 10.7%), and science & technology (458 | 9.1%) are the most common fields of study among 5,027 individuals in Livingston County who have obtained a bachelor's degree or higher.
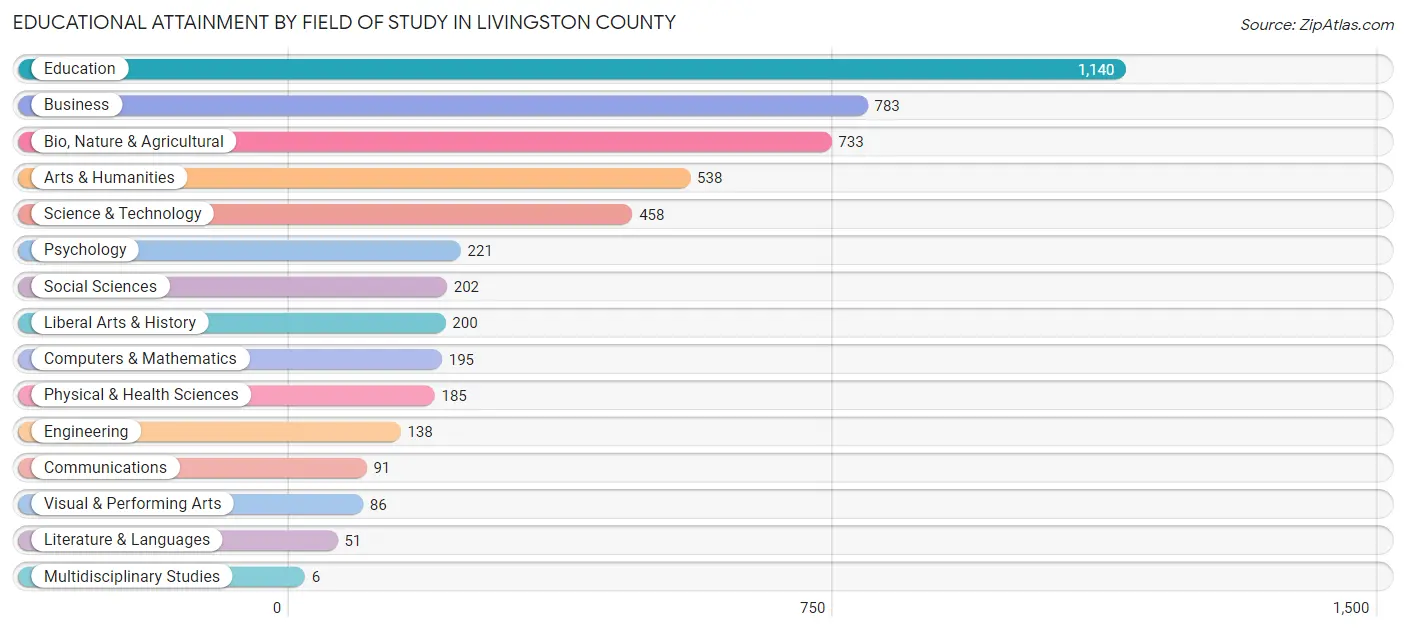
| Field of Study | # Graduates | % Graduates |
| Computers & Mathematics | 195 | 3.9% |
| Bio, Nature & Agricultural | 733 | 14.6% |
| Physical & Health Sciences | 185 | 3.7% |
| Psychology | 221 | 4.4% |
| Social Sciences | 202 | 4.0% |
| Engineering | 138 | 2.8% |
| Multidisciplinary Studies | 6 | 0.1% |
| Science & Technology | 458 | 9.1% |
| Business | 783 | 15.6% |
| Education | 1,140 | 22.7% |
| Literature & Languages | 51 | 1.0% |
| Liberal Arts & History | 200 | 4.0% |
| Visual & Performing Arts | 86 | 1.7% |
| Communications | 91 | 1.8% |
| Arts & Humanities | 538 | 10.7% |
| Total | 5,027 | 100.0% |
Transportation & Commute in Livingston County
Vehicle Availability by Sex in Livingston County
The most prevalent vehicle ownership categories in Livingston County are males with 2 vehicles (3,518, accounting for 41.0%) and females with 2 vehicles (2,419, making up 45.1%).
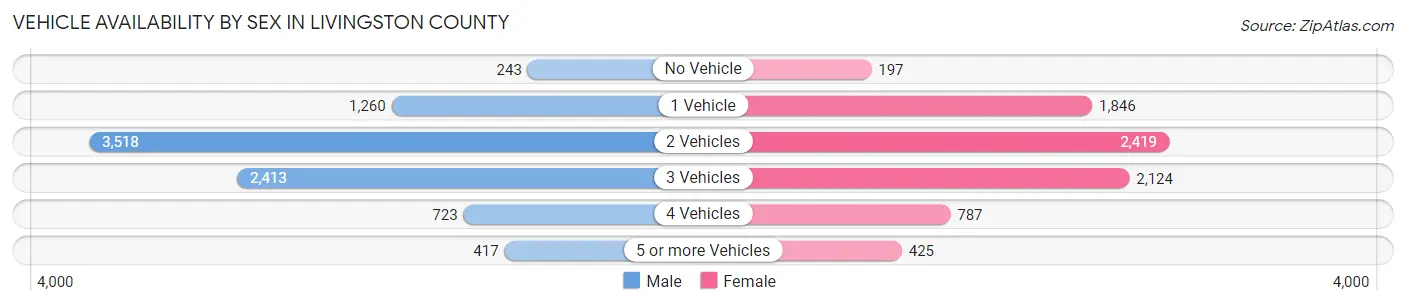
| Vehicles Available | Male | Female |
| No Vehicle | 243 (2.8%) | 197 (2.5%) |
| 1 Vehicle | 1,260 (14.7%) | 1,846 (23.7%) |
| 2 Vehicles | 3,518 (41.0%) | 2,419 (31.0%) |
| 3 Vehicles | 2,413 (28.1%) | 2,124 (27.2%) |
| 4 Vehicles | 723 (8.4%) | 787 (10.1%) |
| 5 or more Vehicles | 417 (4.9%) | 425 (5.4%) |
| Total | 8,574 (100.0%) | 7,798 (100.0%) |
Commute Time in Livingston County
The most frequently occuring commute durations in Livingston County are 5 to 9 minutes (3,372 commuters, 22.0%), 10 to 14 minutes (2,687 commuters, 17.5%), and less than 5 minutes (1,543 commuters, 10.1%).
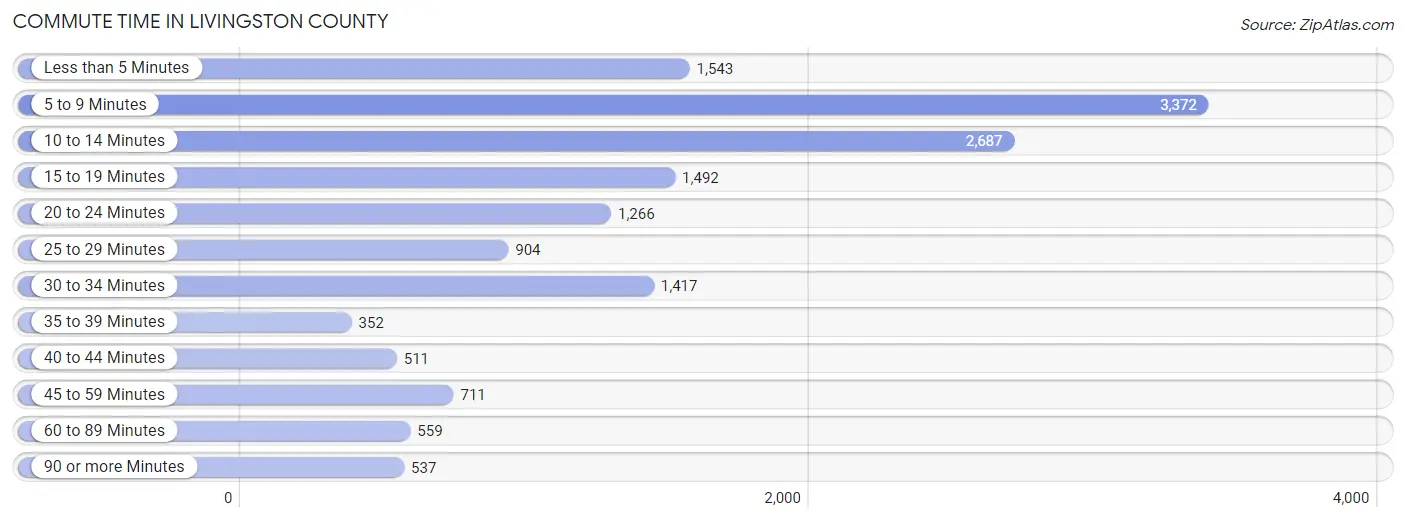
| Commute Time | # Commuters | % Commuters |
| Less than 5 Minutes | 1,543 | 10.1% |
| 5 to 9 Minutes | 3,372 | 22.0% |
| 10 to 14 Minutes | 2,687 | 17.5% |
| 15 to 19 Minutes | 1,492 | 9.7% |
| 20 to 24 Minutes | 1,266 | 8.3% |
| 25 to 29 Minutes | 904 | 5.9% |
| 30 to 34 Minutes | 1,417 | 9.2% |
| 35 to 39 Minutes | 352 | 2.3% |
| 40 to 44 Minutes | 511 | 3.3% |
| 45 to 59 Minutes | 711 | 4.6% |
| 60 to 89 Minutes | 559 | 3.6% |
| 90 or more Minutes | 537 | 3.5% |
Commute Time by Sex in Livingston County
The most common commute times in Livingston County are 5 to 9 minutes (1,885 commuters, 23.5%) for males and 10 to 14 minutes (1,524 commuters, 20.8%) for females.
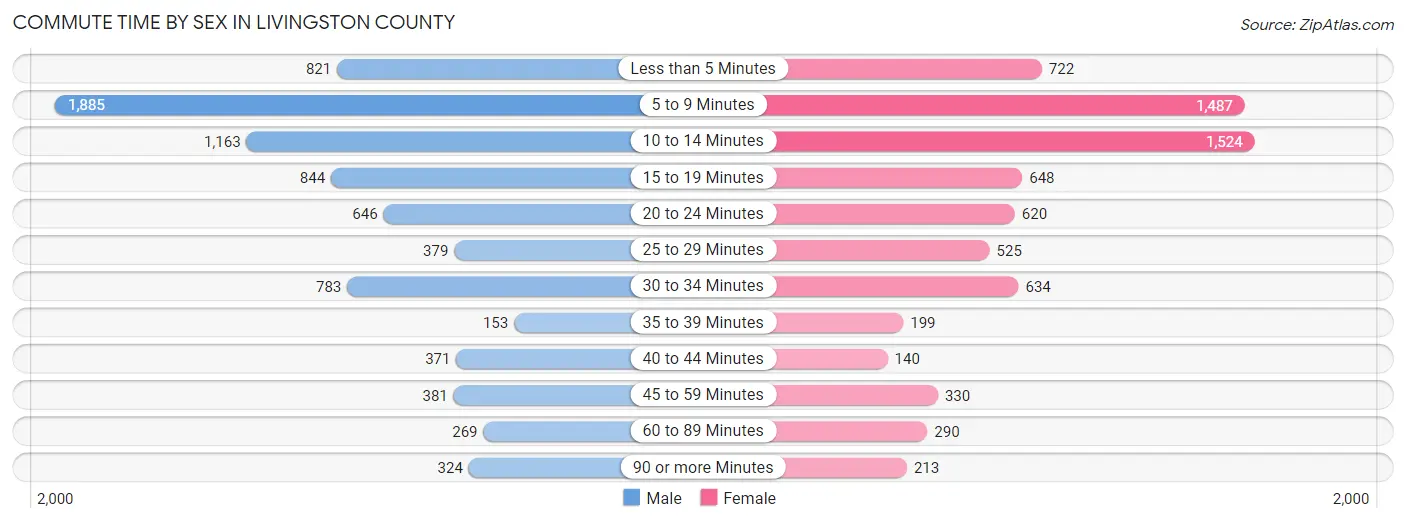
| Commute Time | Male | Female |
| Less than 5 Minutes | 821 (10.2%) | 722 (9.9%) |
| 5 to 9 Minutes | 1,885 (23.5%) | 1,487 (20.3%) |
| 10 to 14 Minutes | 1,163 (14.5%) | 1,524 (20.8%) |
| 15 to 19 Minutes | 844 (10.5%) | 648 (8.8%) |
| 20 to 24 Minutes | 646 (8.1%) | 620 (8.5%) |
| 25 to 29 Minutes | 379 (4.7%) | 525 (7.2%) |
| 30 to 34 Minutes | 783 (9.8%) | 634 (8.6%) |
| 35 to 39 Minutes | 153 (1.9%) | 199 (2.7%) |
| 40 to 44 Minutes | 371 (4.6%) | 140 (1.9%) |
| 45 to 59 Minutes | 381 (4.8%) | 330 (4.5%) |
| 60 to 89 Minutes | 269 (3.4%) | 290 (4.0%) |
| 90 or more Minutes | 324 (4.0%) | 213 (2.9%) |
Time of Departure to Work by Sex in Livingston County
The most frequent times of departure to work in Livingston County are 6:00 AM to 6:29 AM (1,183, 14.7%) for males and 7:00 AM to 7:29 AM (1,471, 20.1%) for females.
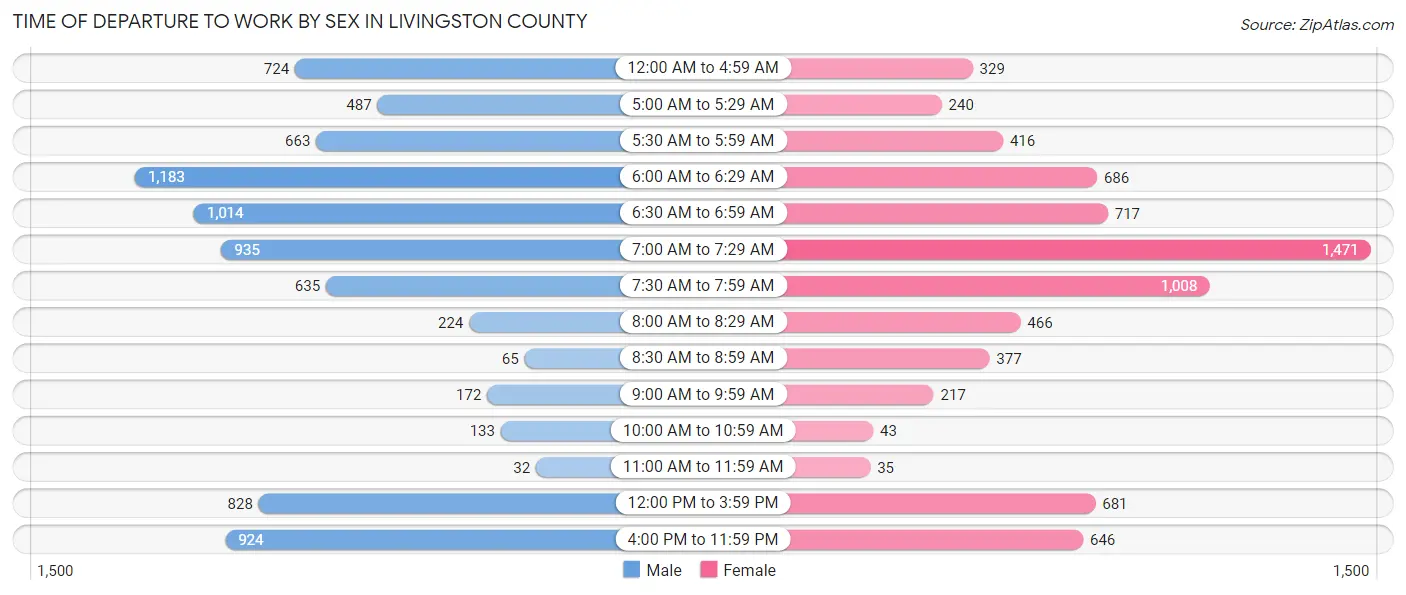
| Time of Departure | Male | Female |
| 12:00 AM to 4:59 AM | 724 (9.0%) | 329 (4.5%) |
| 5:00 AM to 5:29 AM | 487 (6.1%) | 240 (3.3%) |
| 5:30 AM to 5:59 AM | 663 (8.3%) | 416 (5.7%) |
| 6:00 AM to 6:29 AM | 1,183 (14.7%) | 686 (9.4%) |
| 6:30 AM to 6:59 AM | 1,014 (12.6%) | 717 (9.8%) |
| 7:00 AM to 7:29 AM | 935 (11.7%) | 1,471 (20.1%) |
| 7:30 AM to 7:59 AM | 635 (7.9%) | 1,008 (13.8%) |
| 8:00 AM to 8:29 AM | 224 (2.8%) | 466 (6.4%) |
| 8:30 AM to 8:59 AM | 65 (0.8%) | 377 (5.1%) |
| 9:00 AM to 9:59 AM | 172 (2.1%) | 217 (3.0%) |
| 10:00 AM to 10:59 AM | 133 (1.7%) | 43 (0.6%) |
| 11:00 AM to 11:59 AM | 32 (0.4%) | 35 (0.5%) |
| 12:00 PM to 3:59 PM | 828 (10.3%) | 681 (9.3%) |
| 4:00 PM to 11:59 PM | 924 (11.5%) | 646 (8.8%) |
| Total | 8,019 (100.0%) | 7,332 (100.0%) |
Housing Occupancy in Livingston County
Occupancy by Ownership in Livingston County
Of the total 14,665 dwellings in Livingston County, owner-occupied units account for 10,602 (72.3%), while renter-occupied units make up 4,063 (27.7%).
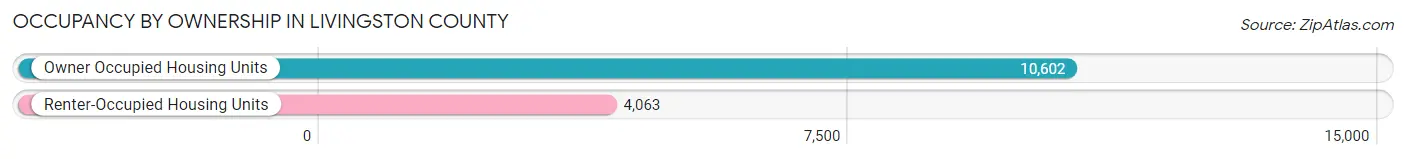
| Occupancy | # Housing Units | % Housing Units |
| Owner Occupied Housing Units | 10,602 | 72.3% |
| Renter-Occupied Housing Units | 4,063 | 27.7% |
| Total Occupied Housing Units | 14,665 | 100.0% |
Occupancy by Household Size in Livingston County
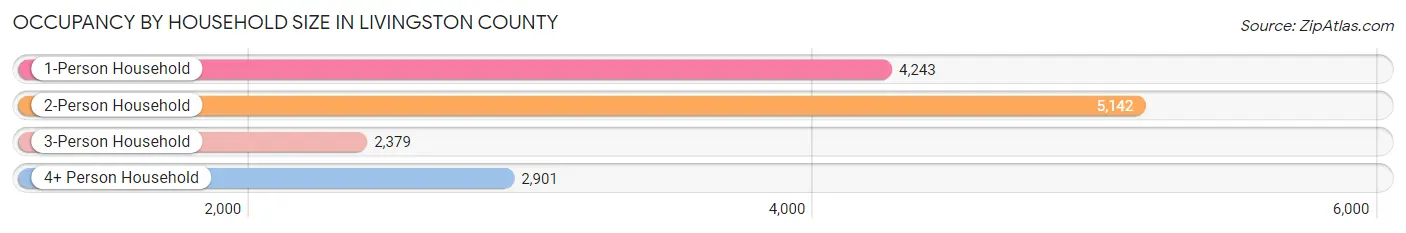
| Household Size | # Housing Units | % Housing Units |
| 1-Person Household | 4,243 | 28.9% |
| 2-Person Household | 5,142 | 35.1% |
| 3-Person Household | 2,379 | 16.2% |
| 4+ Person Household | 2,901 | 19.8% |
| Total Housing Units | 14,665 | 100.0% |
Occupancy by Ownership by Household Size in Livingston County
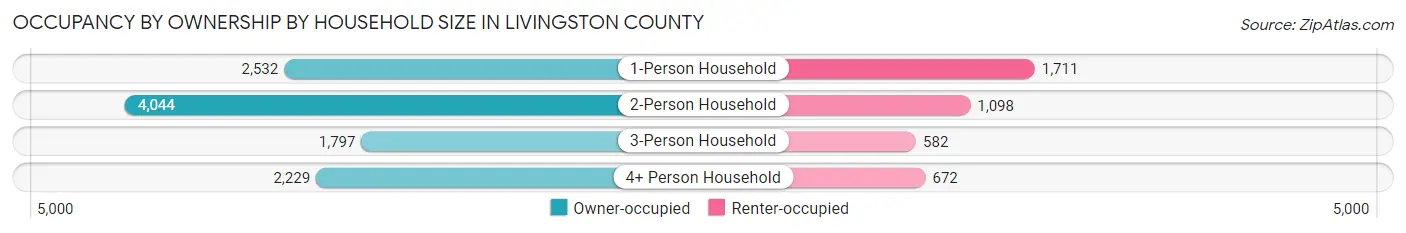
| Household Size | Owner-occupied | Renter-occupied |
| 1-Person Household | 2,532 (59.7%) | 1,711 (40.3%) |
| 2-Person Household | 4,044 (78.6%) | 1,098 (21.3%) |
| 3-Person Household | 1,797 (75.5%) | 582 (24.5%) |
| 4+ Person Household | 2,229 (76.8%) | 672 (23.2%) |
| Total Housing Units | 10,602 (72.3%) | 4,063 (27.7%) |
Occupancy by Educational Attainment in Livingston County
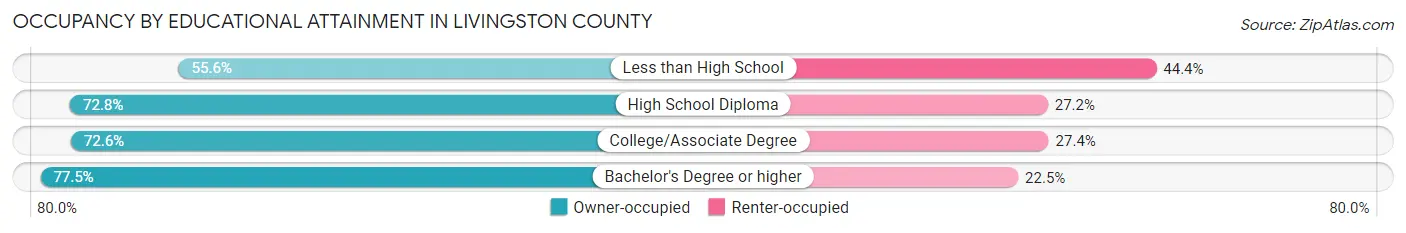
| Household Size | Owner-occupied | Renter-occupied |
| Less than High School | 620 (55.6%) | 496 (44.4%) |
| High School Diploma | 4,102 (72.8%) | 1,534 (27.2%) |
| College/Associate Degree | 3,764 (72.6%) | 1,418 (27.4%) |
| Bachelor's Degree or higher | 2,116 (77.5%) | 615 (22.5%) |
Occupancy by Age of Householder in Livingston County
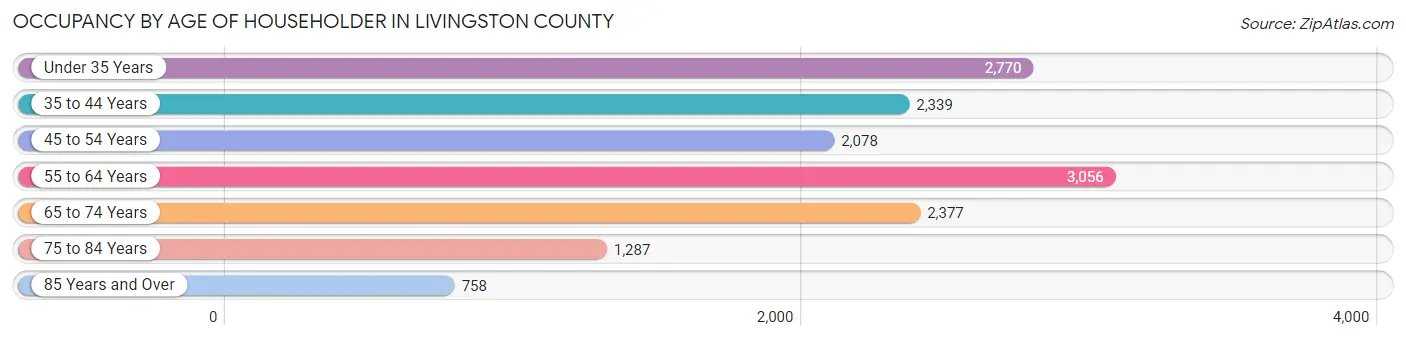
| Age Bracket | # Households | % Households |
| Under 35 Years | 2,770 | 18.9% |
| 35 to 44 Years | 2,339 | 16.0% |
| 45 to 54 Years | 2,078 | 14.2% |
| 55 to 64 Years | 3,056 | 20.8% |
| 65 to 74 Years | 2,377 | 16.2% |
| 75 to 84 Years | 1,287 | 8.8% |
| 85 Years and Over | 758 | 5.2% |
| Total | 14,665 | 100.0% |
Housing Finances in Livingston County
Median Income by Occupancy in Livingston County
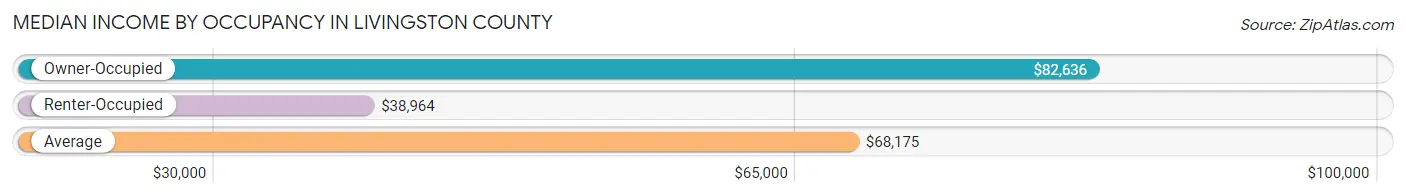
| Occupancy Type | # Households | Median Income |
| Owner-Occupied | 10,602 (72.3%) | $82,636 |
| Renter-Occupied | 4,063 (27.7%) | $38,964 |
| Average | 14,665 (100.0%) | $68,175 |
Occupancy by Householder Income Bracket in Livingston County
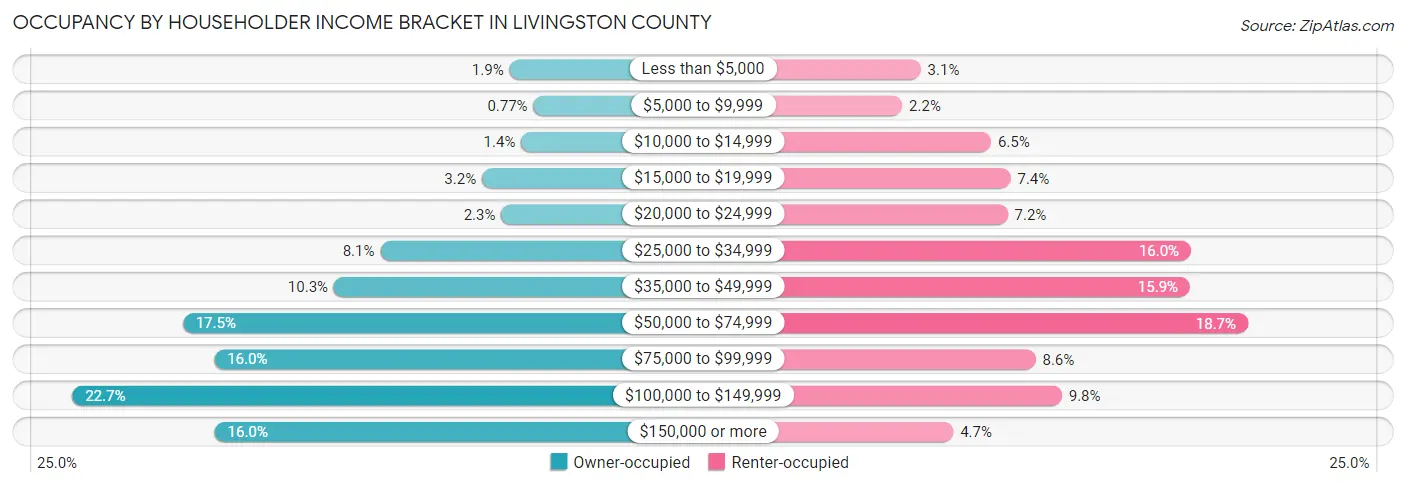
| Income Bracket | Owner-occupied | Renter-occupied |
| Less than $5,000 | 202 (1.9%) | 126 (3.1%) |
| $5,000 to $9,999 | 82 (0.8%) | 90 (2.2%) |
| $10,000 to $14,999 | 143 (1.3%) | 262 (6.5%) |
| $15,000 to $19,999 | 341 (3.2%) | 300 (7.4%) |
| $20,000 to $24,999 | 244 (2.3%) | 294 (7.2%) |
| $25,000 to $34,999 | 855 (8.1%) | 649 (16.0%) |
| $35,000 to $49,999 | 1,089 (10.3%) | 647 (15.9%) |
| $50,000 to $74,999 | 1,852 (17.5%) | 759 (18.7%) |
| $75,000 to $99,999 | 1,693 (16.0%) | 348 (8.6%) |
| $100,000 to $149,999 | 2,410 (22.7%) | 399 (9.8%) |
| $150,000 or more | 1,691 (16.0%) | 189 (4.6%) |
| Total | 10,602 (100.0%) | 4,063 (100.0%) |
Monthly Housing Cost Tiers in Livingston County
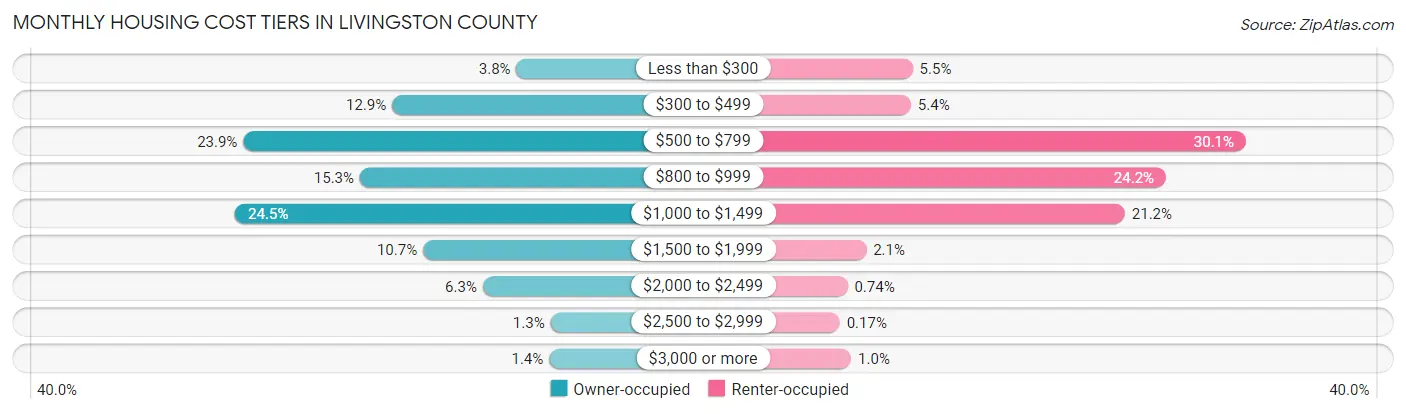
| Monthly Cost | Owner-occupied | Renter-occupied |
| Less than $300 | 401 (3.8%) | 225 (5.5%) |
| $300 to $499 | 1,372 (12.9%) | 220 (5.4%) |
| $500 to $799 | 2,534 (23.9%) | 1,222 (30.1%) |
| $800 to $999 | 1,623 (15.3%) | 983 (24.2%) |
| $1,000 to $1,499 | 2,598 (24.5%) | 860 (21.2%) |
| $1,500 to $1,999 | 1,130 (10.7%) | 86 (2.1%) |
| $2,000 to $2,499 | 664 (6.3%) | 30 (0.7%) |
| $2,500 to $2,999 | 135 (1.3%) | 7 (0.2%) |
| $3,000 or more | 145 (1.4%) | 41 (1.0%) |
| Total | 10,602 (100.0%) | 4,063 (100.0%) |
Physical Housing Characteristics in Livingston County
Housing Structures in Livingston County
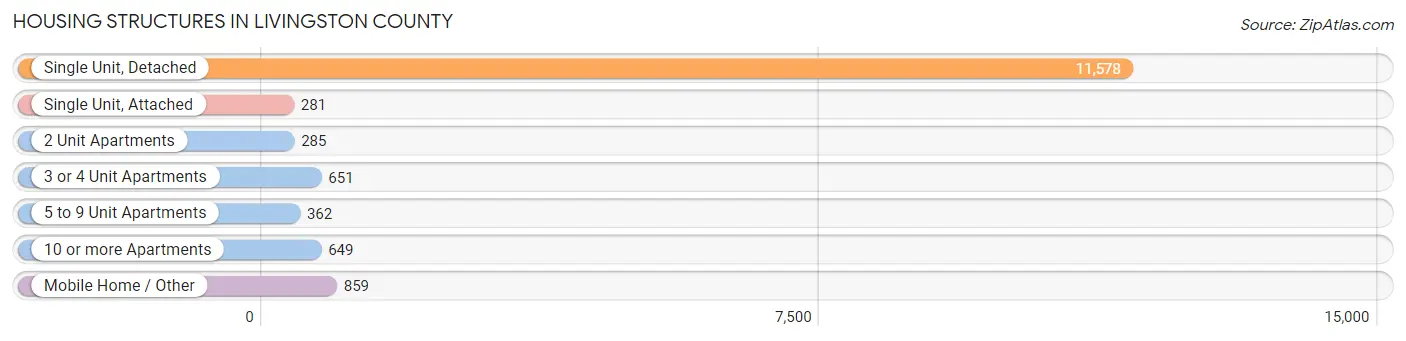
| Structure Type | # Housing Units | % Housing Units |
| Single Unit, Detached | 11,578 | 78.9% |
| Single Unit, Attached | 281 | 1.9% |
| 2 Unit Apartments | 285 | 1.9% |
| 3 or 4 Unit Apartments | 651 | 4.4% |
| 5 to 9 Unit Apartments | 362 | 2.5% |
| 10 or more Apartments | 649 | 4.4% |
| Mobile Home / Other | 859 | 5.9% |
| Total | 14,665 | 100.0% |
Housing Structures by Occupancy in Livingston County
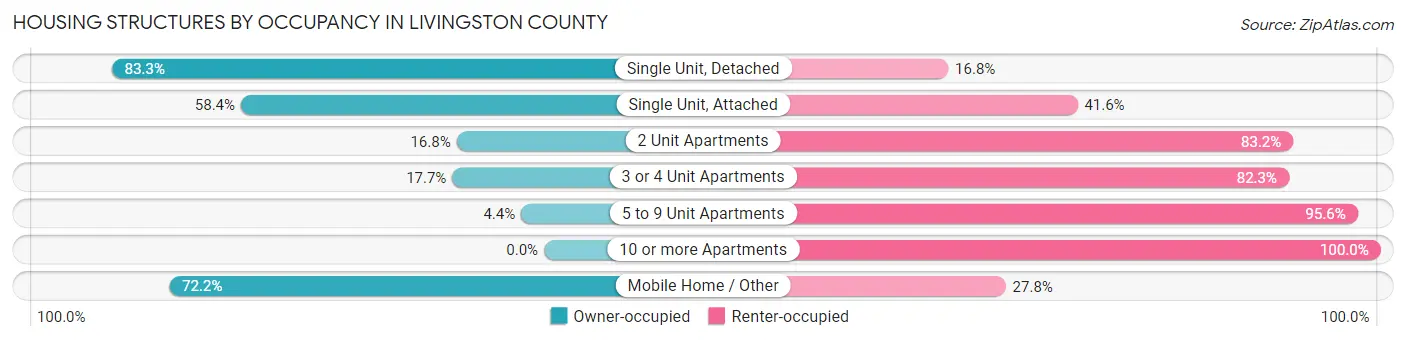
| Structure Type | Owner-occupied | Renter-occupied |
| Single Unit, Detached | 9,639 (83.3%) | 1,939 (16.8%) |
| Single Unit, Attached | 164 (58.4%) | 117 (41.6%) |
| 2 Unit Apartments | 48 (16.8%) | 237 (83.2%) |
| 3 or 4 Unit Apartments | 115 (17.7%) | 536 (82.3%) |
| 5 to 9 Unit Apartments | 16 (4.4%) | 346 (95.6%) |
| 10 or more Apartments | 0 (0.0%) | 649 (100.0%) |
| Mobile Home / Other | 620 (72.2%) | 239 (27.8%) |
| Total | 10,602 (72.3%) | 4,063 (27.7%) |
Housing Structures by Number of Rooms in Livingston County
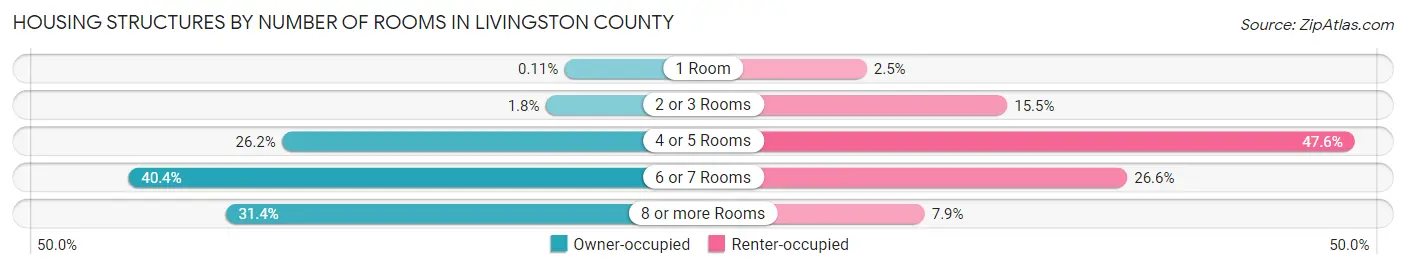
| Number of Rooms | Owner-occupied | Renter-occupied |
| 1 Room | 12 (0.1%) | 101 (2.5%) |
| 2 or 3 Rooms | 195 (1.8%) | 629 (15.5%) |
| 4 or 5 Rooms | 2,781 (26.2%) | 1,934 (47.6%) |
| 6 or 7 Rooms | 4,283 (40.4%) | 1,080 (26.6%) |
| 8 or more Rooms | 3,331 (31.4%) | 319 (7.9%) |
| Total | 10,602 (100.0%) | 4,063 (100.0%) |
Housing Structure by Heating Type in Livingston County
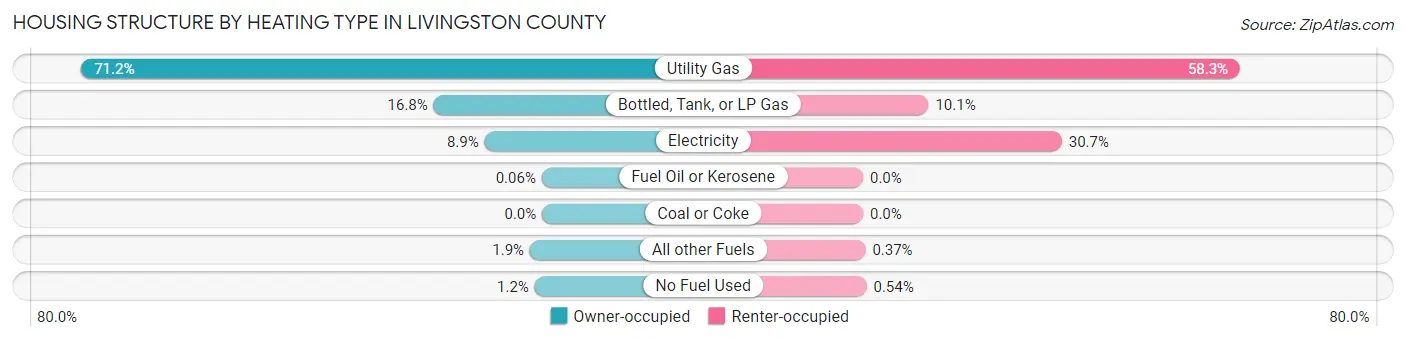
| Heating Type | Owner-occupied | Renter-occupied |
| Utility Gas | 7,553 (71.2%) | 2,367 (58.3%) |
| Bottled, Tank, or LP Gas | 1,778 (16.8%) | 411 (10.1%) |
| Electricity | 944 (8.9%) | 1,248 (30.7%) |
| Fuel Oil or Kerosene | 6 (0.1%) | 0 (0.0%) |
| Coal or Coke | 0 (0.0%) | 0 (0.0%) |
| All other Fuels | 199 (1.9%) | 15 (0.4%) |
| No Fuel Used | 122 (1.1%) | 22 (0.5%) |
| Total | 10,602 (100.0%) | 4,063 (100.0%) |
Household Vehicle Usage in Livingston County
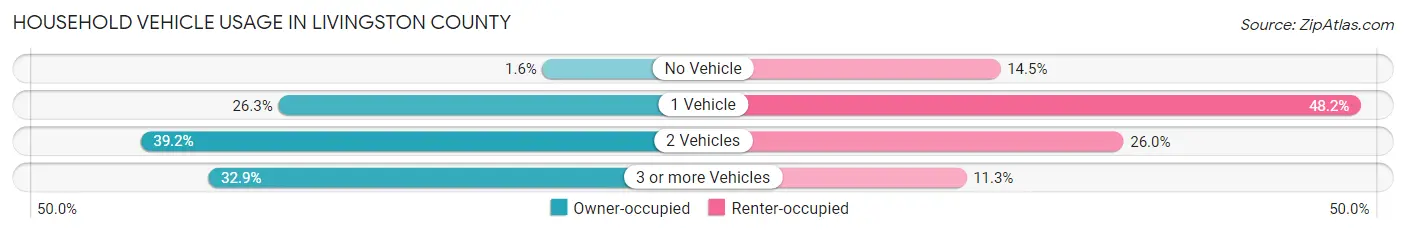
| Vehicles per Household | Owner-occupied | Renter-occupied |
| No Vehicle | 174 (1.6%) | 589 (14.5%) |
| 1 Vehicle | 2,788 (26.3%) | 1,958 (48.2%) |
| 2 Vehicles | 4,156 (39.2%) | 1,056 (26.0%) |
| 3 or more Vehicles | 3,484 (32.9%) | 460 (11.3%) |
| Total | 10,602 (100.0%) | 4,063 (100.0%) |
Real Estate & Mortgages in Livingston County
Real Estate and Mortgage Overview in Livingston County
| Characteristic | Without Mortgage | With Mortgage |
| Housing Units | 4,853 | 5,749 |
| Median Property Value | $114,700 | $139,800 |
| Median Household Income | $66,891 | $1,028 |
| Monthly Housing Costs | $587 | $145 |
| Real Estate Taxes | $2,547 | $141 |
Property Value by Mortgage Status in Livingston County
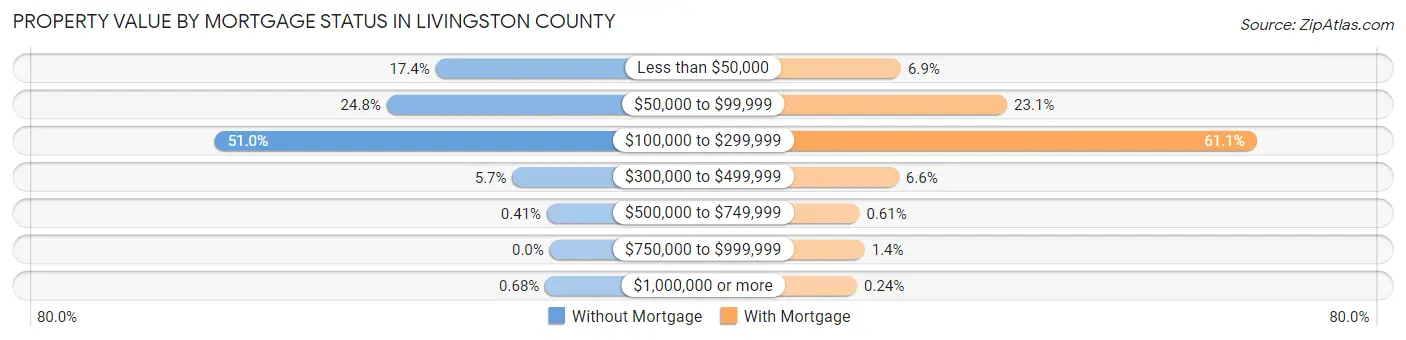
| Property Value | Without Mortgage | With Mortgage |
| Less than $50,000 | 844 (17.4%) | 399 (6.9%) |
| $50,000 to $99,999 | 1,205 (24.8%) | 1,328 (23.1%) |
| $100,000 to $299,999 | 2,476 (51.0%) | 3,512 (61.1%) |
| $300,000 to $499,999 | 275 (5.7%) | 380 (6.6%) |
| $500,000 to $749,999 | 20 (0.4%) | 35 (0.6%) |
| $750,000 to $999,999 | 0 (0.0%) | 81 (1.4%) |
| $1,000,000 or more | 33 (0.7%) | 14 (0.2%) |
| Total | 4,853 (100.0%) | 5,749 (100.0%) |
Household Income by Mortgage Status in Livingston County
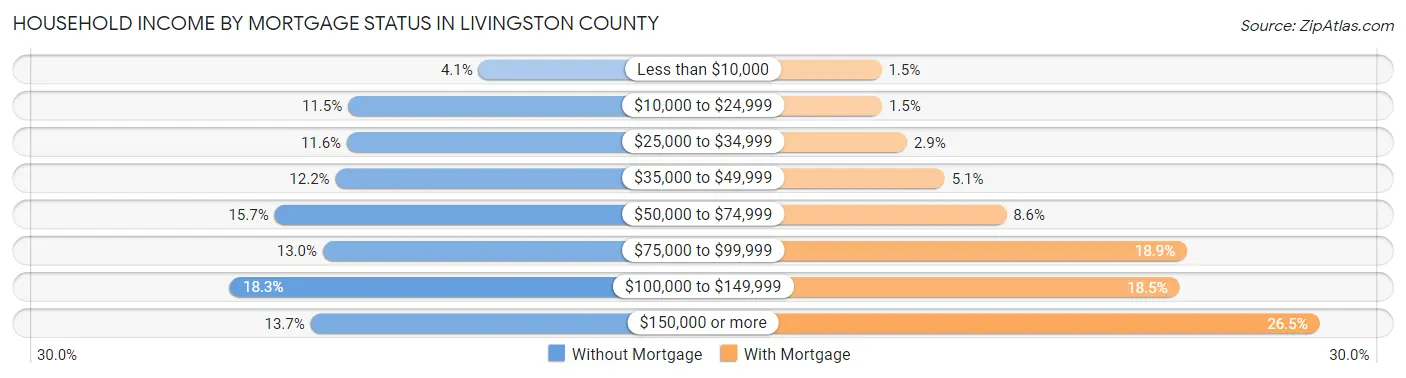
| Household Income | Without Mortgage | With Mortgage |
| Less than $10,000 | 197 (4.1%) | 85 (1.5%) |
| $10,000 to $24,999 | 559 (11.5%) | 87 (1.5%) |
| $25,000 to $34,999 | 562 (11.6%) | 169 (2.9%) |
| $35,000 to $49,999 | 594 (12.2%) | 293 (5.1%) |
| $50,000 to $74,999 | 763 (15.7%) | 495 (8.6%) |
| $75,000 to $99,999 | 629 (13.0%) | 1,089 (18.9%) |
| $100,000 to $149,999 | 886 (18.3%) | 1,064 (18.5%) |
| $150,000 or more | 663 (13.7%) | 1,524 (26.5%) |
| Total | 4,853 (100.0%) | 5,749 (100.0%) |
Property Value to Household Income Ratio in Livingston County
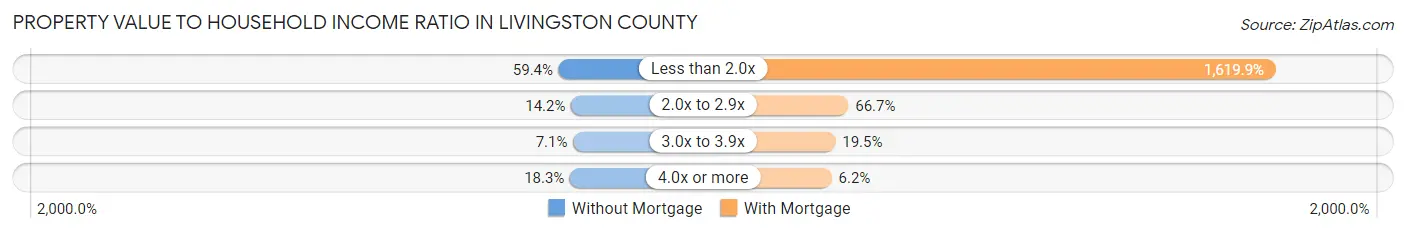
| Value-to-Income Ratio | Without Mortgage | With Mortgage |
| Less than 2.0x | 2,882 (59.4%) | 93,125 (1,619.8%) |
| 2.0x to 2.9x | 689 (14.2%) | 3,837 (66.7%) |
| 3.0x to 3.9x | 344 (7.1%) | 1,120 (19.5%) |
| 4.0x or more | 886 (18.3%) | 357 (6.2%) |
| Total | 4,853 (100.0%) | 5,749 (100.0%) |
Real Estate Taxes by Mortgage Status in Livingston County
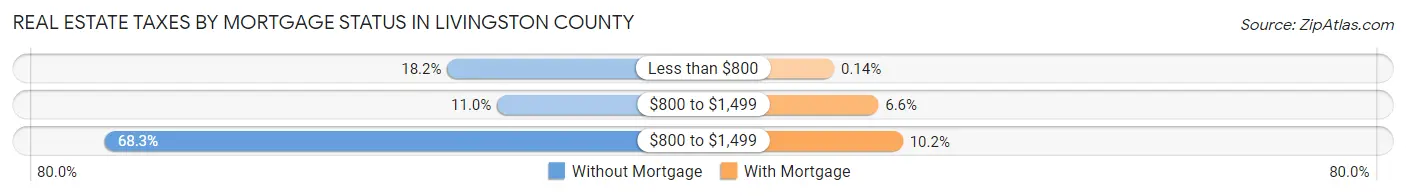
| Property Taxes | Without Mortgage | With Mortgage |
| Less than $800 | 885 (18.2%) | 8 (0.1%) |
| $800 to $1,499 | 532 (11.0%) | 380 (6.6%) |
| $800 to $1,499 | 3,313 (68.3%) | 585 (10.2%) |
| Total | 4,853 (100.0%) | 5,749 (100.0%) |
Health & Disability in Livingston County
Health Insurance Coverage by Age in Livingston County
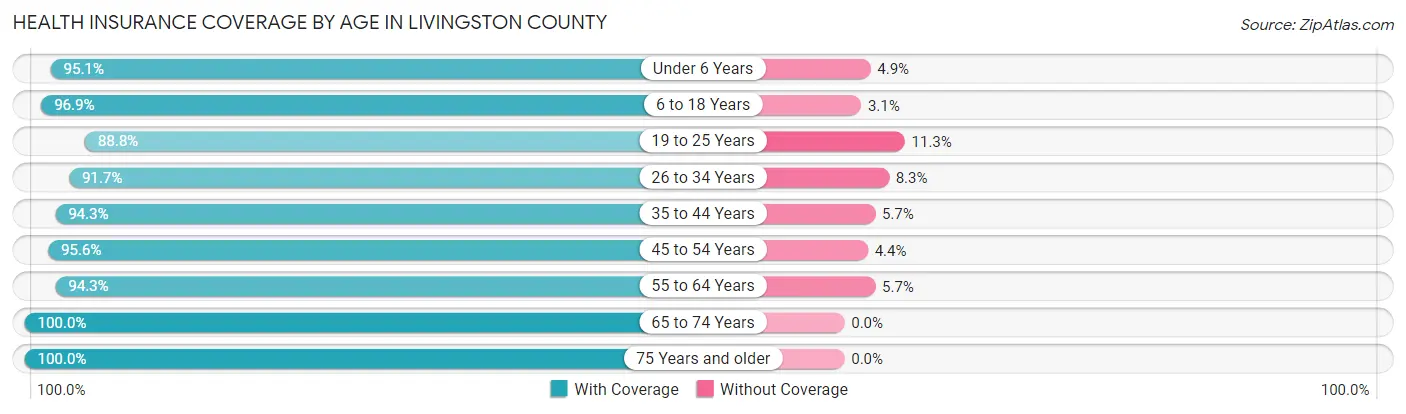
| Age Bracket | With Coverage | Without Coverage |
| Under 6 Years | 2,368 (95.1%) | 121 (4.9%) |
| 6 to 18 Years | 5,705 (96.9%) | 183 (3.1%) |
| 19 to 25 Years | 2,248 (88.7%) | 285 (11.3%) |
| 26 to 34 Years | 3,189 (91.7%) | 288 (8.3%) |
| 35 to 44 Years | 3,759 (94.3%) | 228 (5.7%) |
| 45 to 54 Years | 3,763 (95.6%) | 172 (4.4%) |
| 55 to 64 Years | 4,684 (94.3%) | 285 (5.7%) |
| 65 to 74 Years | 3,829 (100.0%) | 0 (0.0%) |
| 75 Years and older | 2,803 (100.0%) | 0 (0.0%) |
| Total | 32,348 (95.4%) | 1,562 (4.6%) |
Health Insurance Coverage by Citizenship Status in Livingston County
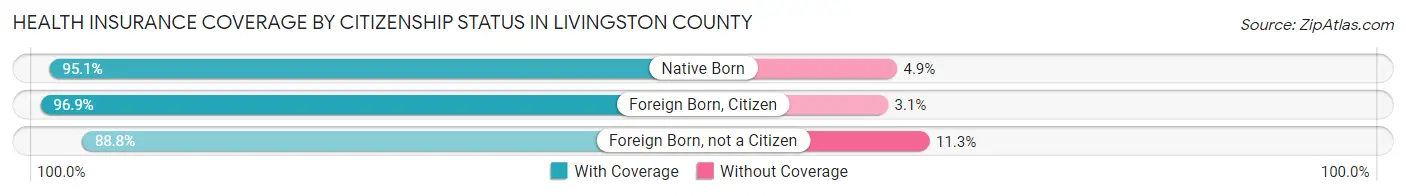
| Citizenship Status | With Coverage | Without Coverage |
| Native Born | 2,368 (95.1%) | 121 (4.9%) |
| Foreign Born, Citizen | 5,705 (96.9%) | 183 (3.1%) |
| Foreign Born, not a Citizen | 2,248 (88.7%) | 285 (11.3%) |
Health Insurance Coverage by Household Income in Livingston County
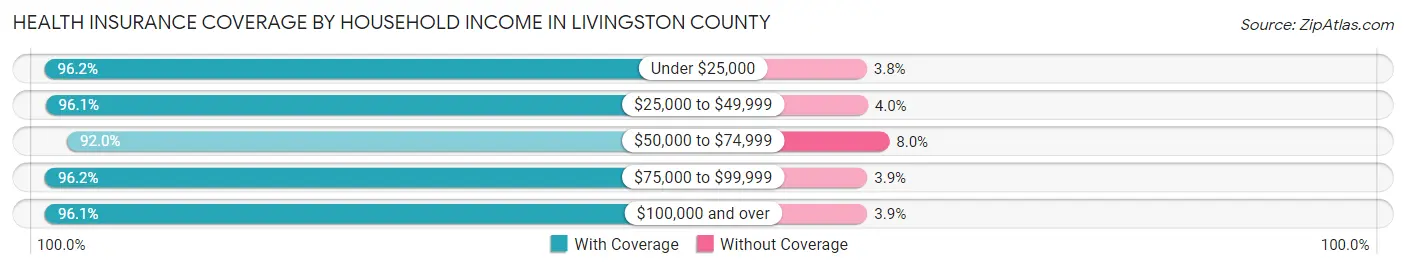
| Household Income | With Coverage | Without Coverage |
| Under $25,000 | 3,302 (96.2%) | 129 (3.8%) |
| $25,000 to $49,999 | 5,950 (96.1%) | 245 (4.0%) |
| $50,000 to $74,999 | 5,566 (92.0%) | 483 (8.0%) |
| $75,000 to $99,999 | 5,198 (96.2%) | 208 (3.8%) |
| $100,000 and over | 12,196 (96.1%) | 490 (3.9%) |
Public vs Private Health Insurance Coverage by Age in Livingston County
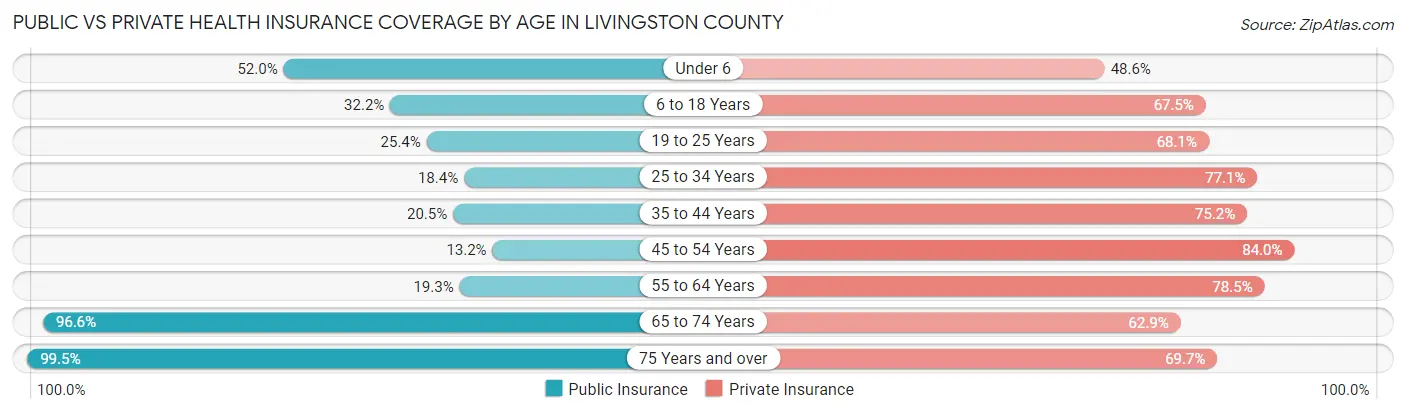
| Age Bracket | Public Insurance | Private Insurance |
| Under 6 | 1,293 (51.9%) | 1,210 (48.6%) |
| 6 to 18 Years | 1,893 (32.2%) | 3,977 (67.5%) |
| 19 to 25 Years | 643 (25.4%) | 1,725 (68.1%) |
| 25 to 34 Years | 641 (18.4%) | 2,681 (77.1%) |
| 35 to 44 Years | 816 (20.5%) | 2,999 (75.2%) |
| 45 to 54 Years | 518 (13.2%) | 3,305 (84.0%) |
| 55 to 64 Years | 958 (19.3%) | 3,898 (78.4%) |
| 65 to 74 Years | 3,699 (96.6%) | 2,408 (62.9%) |
| 75 Years and over | 2,789 (99.5%) | 1,953 (69.7%) |
| Total | 13,250 (39.1%) | 24,156 (71.2%) |
Disability Status by Sex by Age in Livingston County
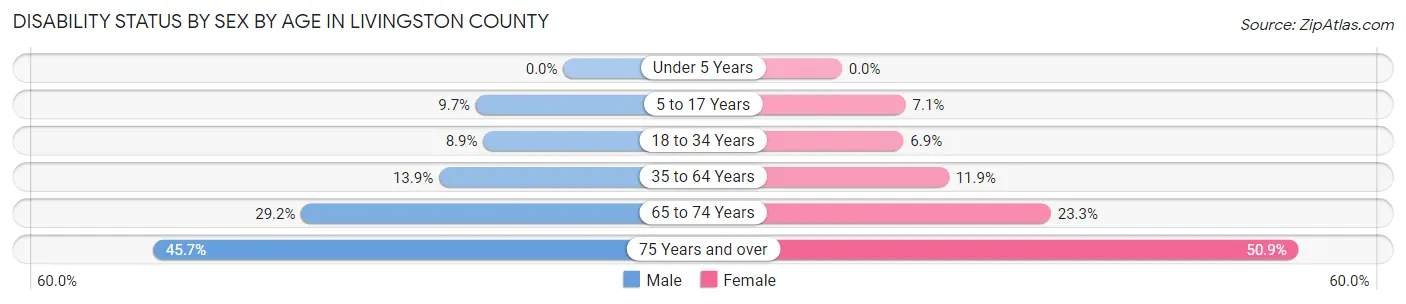
| Age Bracket | Male | Female |
| Under 5 Years | 0 (0.0%) | 0 (0.0%) |
| 5 to 17 Years | 299 (9.7%) | 196 (7.1%) |
| 18 to 34 Years | 294 (8.9%) | 224 (6.9%) |
| 35 to 64 Years | 872 (13.9%) | 786 (11.9%) |
| 65 to 74 Years | 552 (29.2%) | 451 (23.3%) |
| 75 Years and over | 512 (45.7%) | 856 (50.9%) |
Disability Class by Sex by Age in Livingston County
Disability Class: Hearing Difficulty
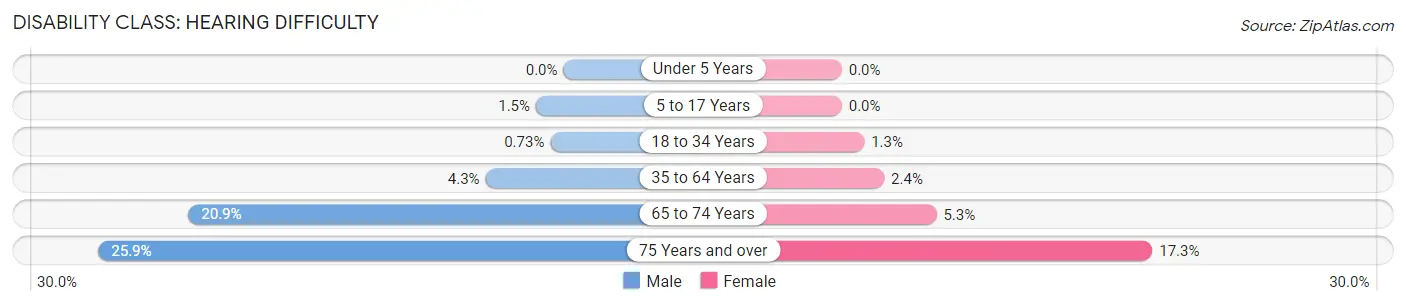
| Age Bracket | Male | Female |
| Under 5 Years | 0 (0.0%) | 0 (0.0%) |
| 5 to 17 Years | 47 (1.5%) | 0 (0.0%) |
| 18 to 34 Years | 24 (0.7%) | 41 (1.3%) |
| 35 to 64 Years | 273 (4.3%) | 156 (2.4%) |
| 65 to 74 Years | 395 (20.9%) | 102 (5.3%) |
| 75 Years and over | 290 (25.9%) | 291 (17.3%) |
Disability Class: Vision Difficulty
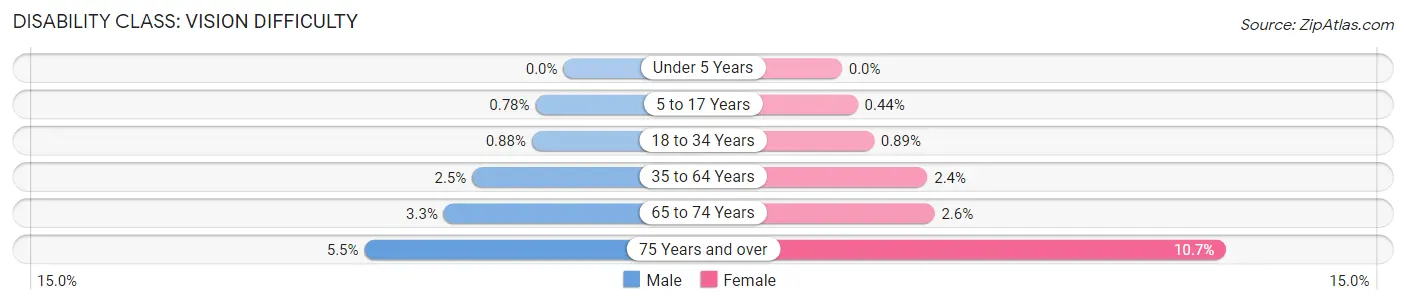
| Age Bracket | Male | Female |
| Under 5 Years | 0 (0.0%) | 0 (0.0%) |
| 5 to 17 Years | 24 (0.8%) | 12 (0.4%) |
| 18 to 34 Years | 29 (0.9%) | 29 (0.9%) |
| 35 to 64 Years | 160 (2.5%) | 157 (2.4%) |
| 65 to 74 Years | 63 (3.3%) | 50 (2.6%) |
| 75 Years and over | 62 (5.5%) | 180 (10.7%) |
Disability Class: Cognitive Difficulty
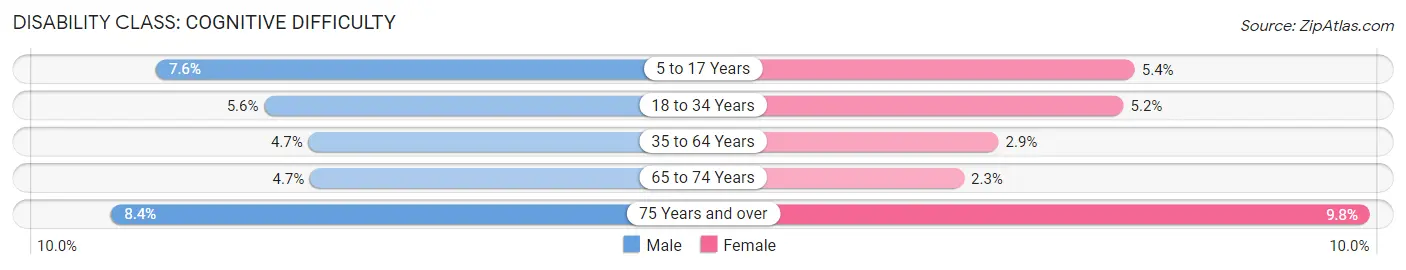
| Age Bracket | Male | Female |
| 5 to 17 Years | 232 (7.6%) | 150 (5.4%) |
| 18 to 34 Years | 183 (5.6%) | 171 (5.2%) |
| 35 to 64 Years | 298 (4.7%) | 192 (2.9%) |
| 65 to 74 Years | 89 (4.7%) | 44 (2.3%) |
| 75 Years and over | 94 (8.4%) | 165 (9.8%) |
Disability Class: Ambulatory Difficulty
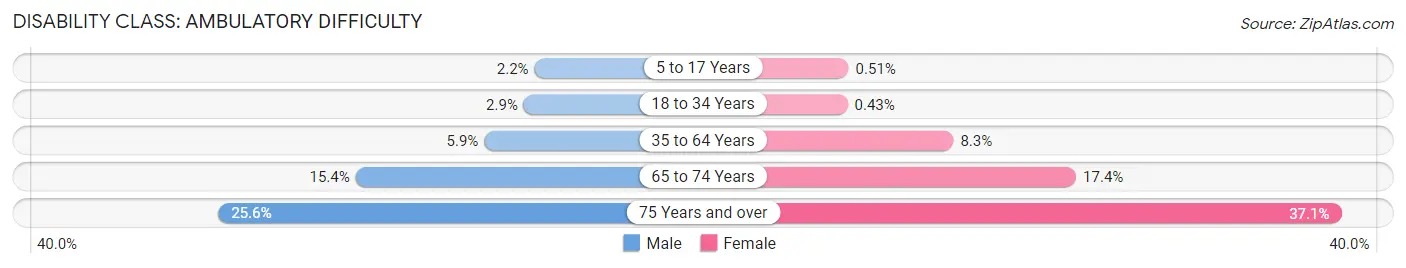
| Age Bracket | Male | Female |
| 5 to 17 Years | 66 (2.1%) | 14 (0.5%) |
| 18 to 34 Years | 97 (2.9%) | 14 (0.4%) |
| 35 to 64 Years | 370 (5.9%) | 547 (8.3%) |
| 65 to 74 Years | 292 (15.4%) | 337 (17.4%) |
| 75 Years and over | 287 (25.6%) | 624 (37.1%) |
Disability Class: Self-Care Difficulty
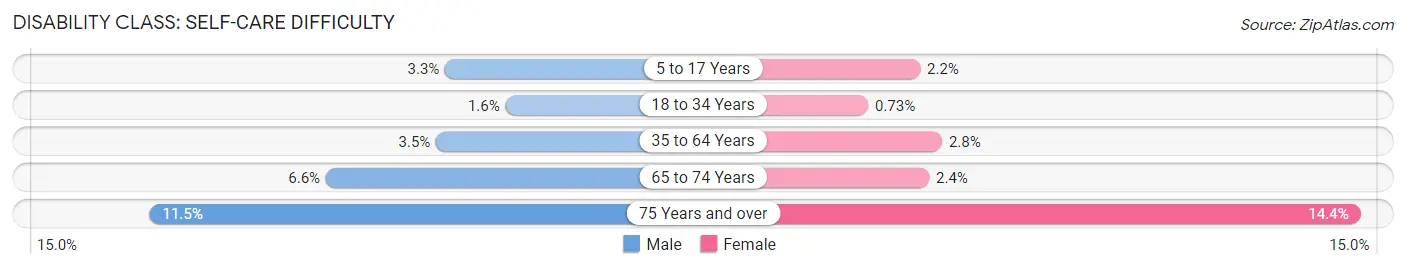
| Age Bracket | Male | Female |
| 5 to 17 Years | 101 (3.3%) | 60 (2.2%) |
| 18 to 34 Years | 53 (1.6%) | 24 (0.7%) |
| 35 to 64 Years | 223 (3.5%) | 184 (2.8%) |
| 65 to 74 Years | 125 (6.6%) | 47 (2.4%) |
| 75 Years and over | 129 (11.5%) | 243 (14.4%) |
Technology Access in Livingston County
Computing Device Access in Livingston County
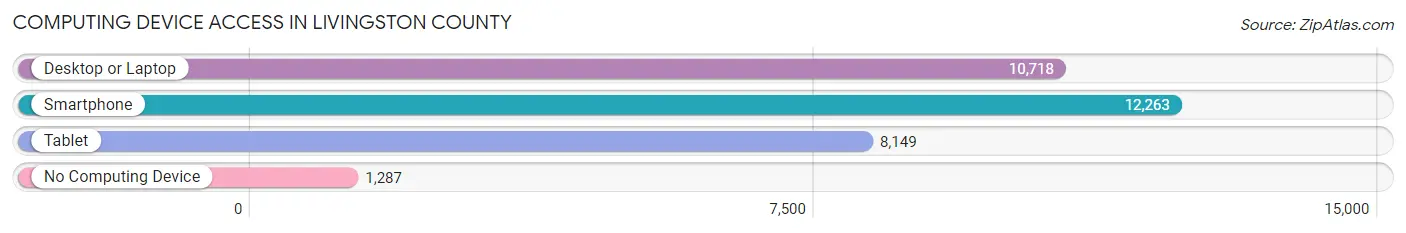
| Device Type | # Households | % Households |
| Desktop or Laptop | 10,718 | 73.1% |
| Smartphone | 12,263 | 83.6% |
| Tablet | 8,149 | 55.6% |
| No Computing Device | 1,287 | 8.8% |
| Total | 14,665 | 100.0% |
Internet Access in Livingston County
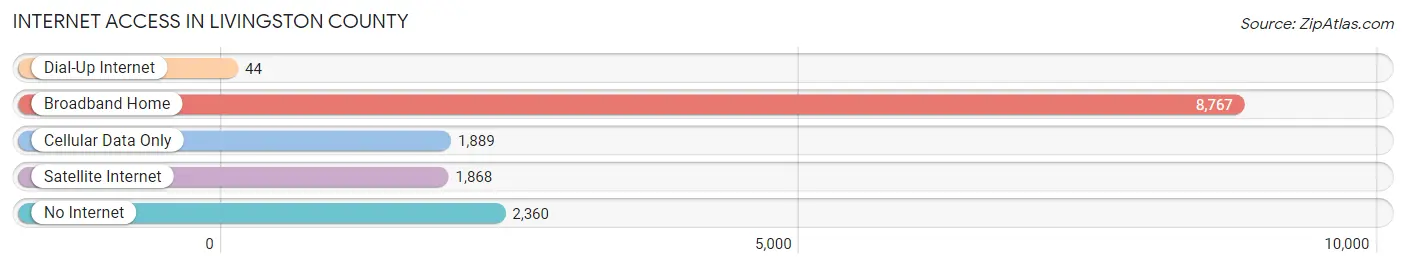
| Internet Type | # Households | % Households |
| Dial-Up Internet | 44 | 0.3% |
| Broadband Home | 8,767 | 59.8% |
| Cellular Data Only | 1,889 | 12.9% |
| Satellite Internet | 1,868 | 12.7% |
| No Internet | 2,360 | 16.1% |
| Total | 14,665 | 100.0% |
Livingston County Summary
Livingston County is located in the central part of the state of Illinois, in the United States. It is bordered by Ford County to the north, Iroquois County to the east, McLean County to the south, and Woodford County to the west. The county seat is Pontiac, and the largest city is Dwight. The county was established in 1837 and named after Edward Livingston, a prominent politician from New York.
Geography
Livingston County covers an area of 576 square miles, making it the 33rd largest county in Illinois. The county is mostly flat, with some rolling hills in the northern and western parts. The Vermilion River runs through the county, and there are several small lakes and ponds scattered throughout. The county is mostly rural, with some small towns and villages. The largest city is Dwight, with a population of around 3,000.
Climate
Livingston County has a humid continental climate, with hot, humid summers and cold, snowy winters. The average annual temperature is around 50°F, and the average annual precipitation is around 36 inches.
Demographics
As of the 2010 census, Livingston County had a population of 38,950. The racial makeup of the county was 95.3% White, 1.2% African American, 0.3% Native American, 0.5% Asian, 0.1% Pacific Islander, 1.7% from other races, and 1.1% from two or more races. Hispanic or Latino of any race were 4.2% of the population.
Economy
Livingston County is largely agricultural, with corn, soybeans, and wheat being the main crops. Livestock production is also important, with cattle, hogs, and sheep being raised in the county. Manufacturing is also an important part of the economy, with several factories located in the county. The largest employers in the county are the Pontiac Correctional Center, the Livingston County Health Department, and the Livingston County Sheriff's Office.
History
Livingston County was first settled in the early 1800s, and was officially established in 1837. The county was named after Edward Livingston, a prominent politician from New York. The county seat was originally located in the town of Fairbury, but was moved to Pontiac in 1839.
During the Civil War, Livingston County was a major center of activity, with several battles taking place in the area. After the war, the county experienced a period of growth and prosperity, with several new towns and villages being established.
In the late 19th and early 20th centuries, the county was a major center of the coal mining industry. Several coal mines were located in the county, and the industry provided jobs for many of the county's residents. The coal mining industry declined in the mid-20th century, and the county's economy shifted to agriculture and manufacturing.
Today, Livingston County is a largely rural county, with a population of around 39,000. The county is home to several small towns and villages, and is a popular destination for outdoor recreation. The county is also home to several historic sites, including the Dwight Historic District and the Pontiac Historic District.
Common Questions
What is Per Capita Income in Livingston County?
Per Capita income in Livingston County is $34,996.
What is the Median Family Income in Livingston County?
Median Family Income in Livingston County is $85,639.
What is the Median Household income in Livingston County?
Median Household Income in Livingston County is $68,175.
What is Income or Wage Gap in Livingston County?
Income or Wage Gap in Livingston County is 34.1%.
Women in Livingston County earn 65.9 cents for every dollar earned by a man.
What is Family Income Deficit in Livingston County?
Family Income Deficit in Livingston County is $8,193.
Families that are below poverty line in Livingston County earn $8,193 less on average than the poverty threshold level.
What is Inequality or Gini Index in Livingston County?
Inequality or Gini Index in Livingston County is 0.42.
What is the Total Population of Livingston County?
Total Population of Livingston County is 35,771.
What is the Total Male Population of Livingston County?
Total Male Population of Livingston County is 18,285.
What is the Total Female Population of Livingston County?
Total Female Population of Livingston County is 17,486.
What is the Ratio of Males per 100 Females in Livingston County?
There are 104.57 Males per 100 Females in Livingston County.
What is the Ratio of Females per 100 Males in Livingston County?
There are 95.63 Females per 100 Males in Livingston County.
What is the Median Population Age in Livingston County?
Median Population Age in Livingston County is 41.9 Years.
What is the Average Family Size in Livingston County
Average Family Size in Livingston County is 2.8 People.
What is the Average Household Size in Livingston County
Average Household Size in Livingston County is 2.3 People.
How Large is the Labor Force in Livingston County?
There are 17,356 People in the Labor Forcein in Livingston County.
What is the Percentage of People in the Labor Force in Livingston County?
59.7% of People are in the Labor Force in Livingston County.
What is the Unemployment Rate in Livingston County?
Unemployment Rate in Livingston County is 3.7%.