Johnson County, IL Map & Demographics
Johnson County Map
Johnson County Overview
$27,096
PER CAPITA INCOME
$77,027
AVG FAMILY INCOME
$63,295
AVG HOUSEHOLD INCOME
28.9%
WAGE / INCOME GAP [ % ]
71.1¢/ $1
WAGE / INCOME GAP [ $ ]
$11,686
FAMILY INCOME DEFICIT
0.43
INEQUALITY / GINI INDEX
13,313
TOTAL POPULATION
7,779
MALE POPULATION
5,534
FEMALE POPULATION
140.57
MALES / 100 FEMALES
71.14
FEMALES / 100 MALES
42.3
MEDIAN AGE
3.4
AVG FAMILY SIZE
2.8
AVG HOUSEHOLD SIZE
4,496
LABOR FORCE [ PEOPLE ]
41.3%
PERCENT IN LABOR FORCE
2.9%
UNEMPLOYMENT RATE
Johnson County Area Codes
Income in Johnson County
Income Overview in Johnson County
Per Capita Income in Johnson County is $27,096, while median incomes of families and households are $77,027 and $63,295 respectively.
| Characteristic | Number | Measure |
| Per Capita Income | 13,313 | $27,096 |
| Median Family Income | 2,710 | $77,027 |
| Mean Family Income | 2,710 | $91,080 |
| Median Household Income | 4,106 | $63,295 |
| Mean Household Income | 4,106 | $78,899 |
| Income Deficit | 2,710 | $11,686 |
| Wage / Income Gap (%) | 13,313 | 28.86% |
| Wage / Income Gap ($) | 13,313 | 71.14¢ per $1 |
| Gini / Inequality Index | 13,313 | 0.43 |
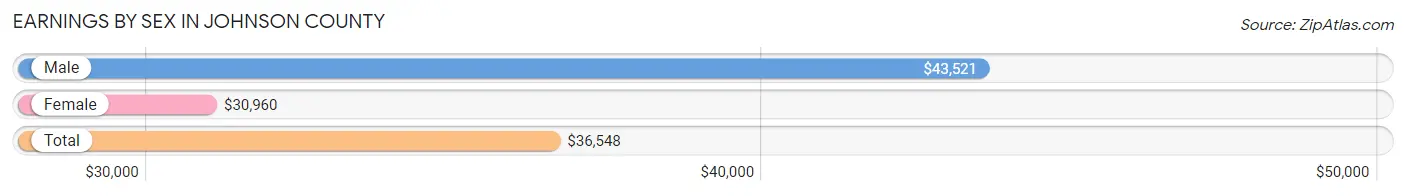
Earnings by Sex in Johnson County
Average Earnings in Johnson County are $36,548, $43,521 for men and $30,960 for women, a difference of 28.9%.
| Sex | Number | Average Earnings |
| Male | 2,854 (57.1%) | $43,521 |
| Female | 2,142 (42.9%) | $30,960 |
| Total | 4,996 (100.0%) | $36,548 |
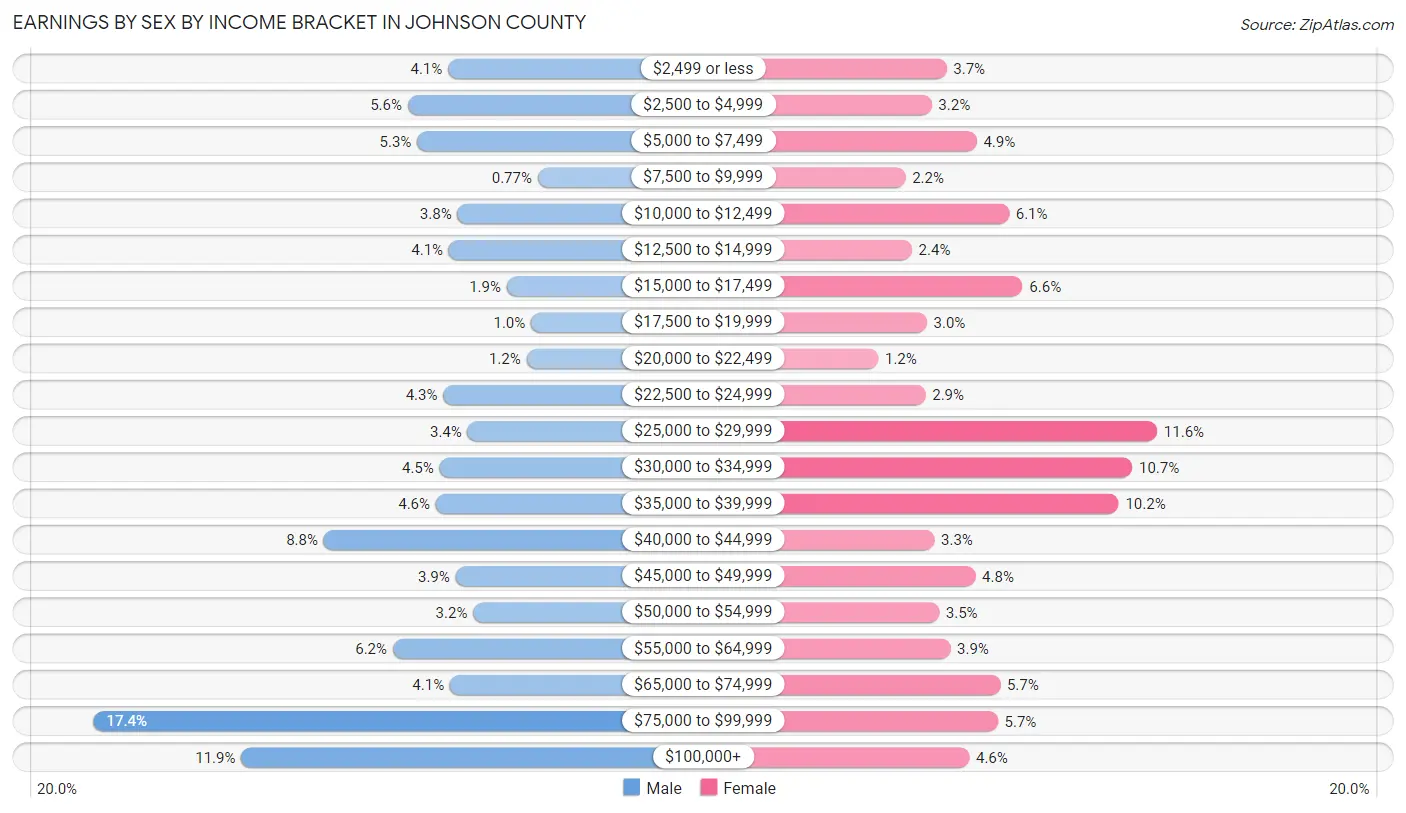
Earnings by Sex by Income Bracket in Johnson County
The most common earnings brackets in Johnson County are $75,000 to $99,999 for men (497 | 17.4%) and $25,000 to $29,999 for women (249 | 11.6%).
| Income | Male | Female |
| $2,499 or less | 118 (4.1%) | 80 (3.7%) |
| $2,500 to $4,999 | 161 (5.6%) | 68 (3.2%) |
| $5,000 to $7,499 | 151 (5.3%) | 104 (4.9%) |
| $7,500 to $9,999 | 22 (0.8%) | 47 (2.2%) |
| $10,000 to $12,499 | 108 (3.8%) | 130 (6.1%) |
| $12,500 to $14,999 | 117 (4.1%) | 52 (2.4%) |
| $15,000 to $17,499 | 55 (1.9%) | 141 (6.6%) |
| $17,500 to $19,999 | 29 (1.0%) | 64 (3.0%) |
| $20,000 to $22,499 | 34 (1.2%) | 25 (1.2%) |
| $22,500 to $24,999 | 123 (4.3%) | 63 (2.9%) |
| $25,000 to $29,999 | 97 (3.4%) | 249 (11.6%) |
| $30,000 to $34,999 | 127 (4.4%) | 229 (10.7%) |
| $35,000 to $39,999 | 131 (4.6%) | 218 (10.2%) |
| $40,000 to $44,999 | 251 (8.8%) | 70 (3.3%) |
| $45,000 to $49,999 | 110 (3.8%) | 103 (4.8%) |
| $50,000 to $54,999 | 91 (3.2%) | 74 (3.5%) |
| $55,000 to $64,999 | 177 (6.2%) | 83 (3.9%) |
| $65,000 to $74,999 | 116 (4.1%) | 123 (5.7%) |
| $75,000 to $99,999 | 497 (17.4%) | 121 (5.7%) |
| $100,000+ | 339 (11.9%) | 98 (4.6%) |
| Total | 2,854 (100.0%) | 2,142 (100.0%) |
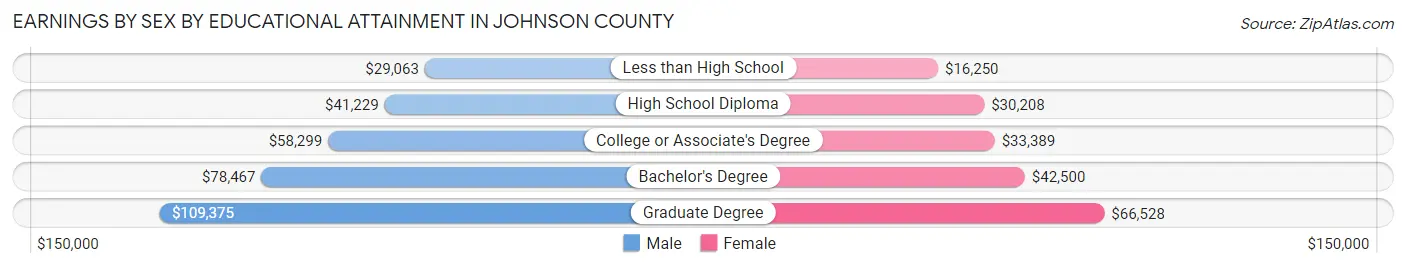
Earnings by Sex by Educational Attainment in Johnson County
Average earnings in Johnson County are $51,619 for men and $34,038 for women, a difference of 34.1%. Men with an educational attainment of graduate degree enjoy the highest average annual earnings of $109,375, while those with less than high school education earn the least with $29,063. Women with an educational attainment of graduate degree earn the most with the average annual earnings of $66,528, while those with less than high school education have the smallest earnings of $16,250.
| Educational Attainment | Male Income | Female Income |
| Less than High School | $29,063 | $16,250 |
| High School Diploma | $41,229 | $30,208 |
| College or Associate's Degree | $58,299 | $33,389 |
| Bachelor's Degree | $78,467 | $42,500 |
| Graduate Degree | $109,375 | $66,528 |
| Total | $51,619 | $34,038 |
Family Income in Johnson County
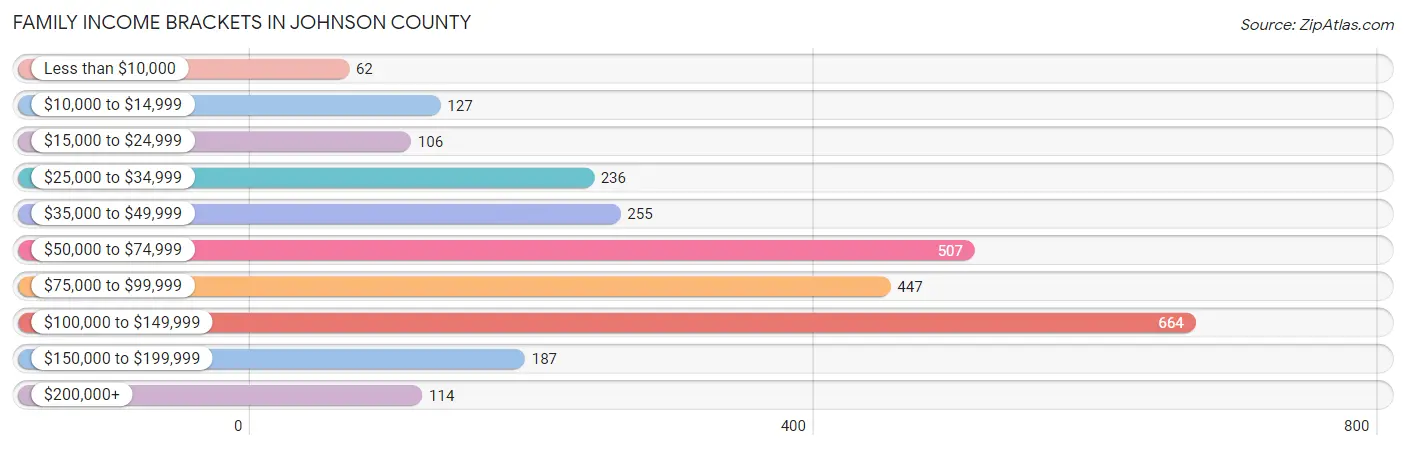
Family Income Brackets in Johnson County
According to the Johnson County family income data, there are 664 families falling into the $100,000 to $149,999 income range, which is the most common income bracket and makes up 24.5% of all families. Conversely, the less than $10,000 income bracket is the least frequent group with only 62 families (2.3%) belonging to this category.
| Income Bracket | # Families | % Families |
| Less than $10,000 | 62 | 2.3% |
| $10,000 to $14,999 | 127 | 4.7% |
| $15,000 to $24,999 | 106 | 3.9% |
| $25,000 to $34,999 | 236 | 8.7% |
| $35,000 to $49,999 | 255 | 9.4% |
| $50,000 to $74,999 | 507 | 18.7% |
| $75,000 to $99,999 | 447 | 16.5% |
| $100,000 to $149,999 | 664 | 24.5% |
| $150,000 to $199,999 | 187 | 6.9% |
| $200,000+ | 114 | 4.2% |
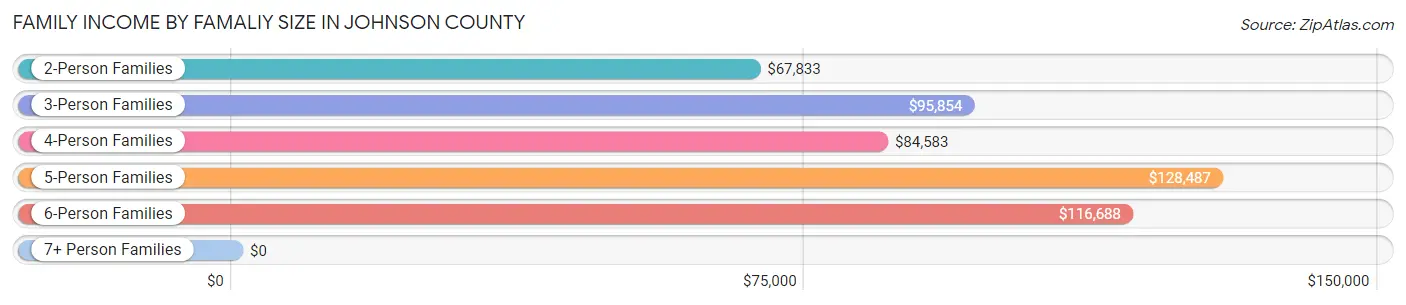
Family Income by Famaliy Size in Johnson County
5-person families (150 | 5.5%) account for the highest median family income in Johnson County with $128,487 per family, while 2-person families (1,376 | 50.8%) have the highest median income of $33,916 per family member.
| Income Bracket | # Families | Median Income |
| 2-Person Families | 1,376 (50.8%) | $67,833 |
| 3-Person Families | 652 (24.1%) | $95,854 |
| 4-Person Families | 434 (16.0%) | $84,583 |
| 5-Person Families | 150 (5.5%) | $128,487 |
| 6-Person Families | 61 (2.2%) | $116,688 |
| 7+ Person Families | 37 (1.4%) | $0 |
| Total | 2,710 (100.0%) | $77,027 |
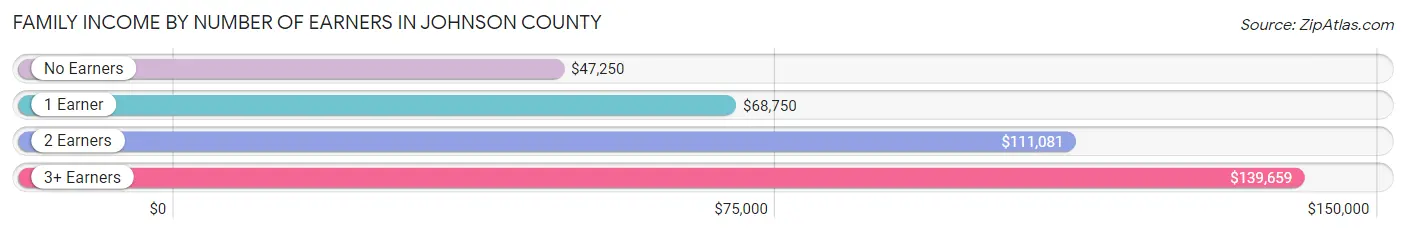
Family Income by Number of Earners in Johnson County
The median family income in Johnson County is $77,027, with families comprising 3+ earners (239) having the highest median family income of $139,659, while families with no earners (784) have the lowest median family income of $47,250, accounting for 8.8% and 28.9% of families, respectively.
| Number of Earners | # Families | Median Income |
| No Earners | 784 (28.9%) | $47,250 |
| 1 Earner | 905 (33.4%) | $68,750 |
| 2 Earners | 782 (28.9%) | $111,081 |
| 3+ Earners | 239 (8.8%) | $139,659 |
| Total | 2,710 (100.0%) | $77,027 |
Household Income in Johnson County
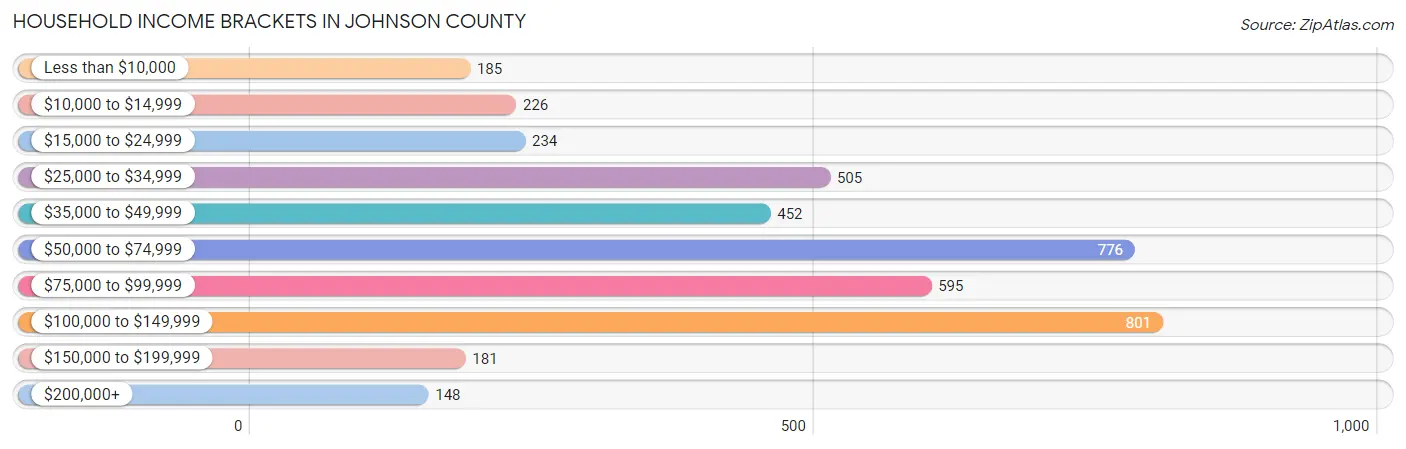
Household Income Brackets in Johnson County
With 801 households falling in the category, the $100,000 to $149,999 income range is the most frequent in Johnson County, accounting for 19.5% of all households. In contrast, only 148 households (3.6%) fall into the $200,000+ income bracket, making it the least populous group.
| Income Bracket | # Households | % Households |
| Less than $10,000 | 185 | 4.5% |
| $10,000 to $14,999 | 226 | 5.5% |
| $15,000 to $24,999 | 234 | 5.7% |
| $25,000 to $34,999 | 505 | 12.3% |
| $35,000 to $49,999 | 452 | 11.0% |
| $50,000 to $74,999 | 776 | 18.9% |
| $75,000 to $99,999 | 595 | 14.5% |
| $100,000 to $149,999 | 801 | 19.5% |
| $150,000 to $199,999 | 181 | 4.4% |
| $200,000+ | 148 | 3.6% |
Household Income by Householder Age in Johnson County
The median household income in Johnson County is $63,295, with the highest median household income of $80,667 found in the 25 to 44 years age bracket for the primary householder. A total of 902 households (22.0%) fall into this category. Meanwhile, the 65+ years age bracket for the primary householder has the lowest median household income of $51,526, with 1,517 households (36.9%) in this group.
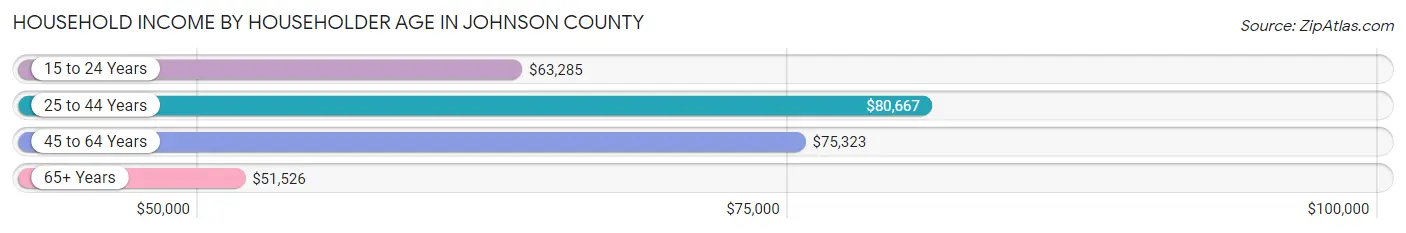
| Income Bracket | # Households | Median Income |
| 15 to 24 Years | 83 (2.0%) | $63,285 |
| 25 to 44 Years | 902 (22.0%) | $80,667 |
| 45 to 64 Years | 1,604 (39.1%) | $75,323 |
| 65+ Years | 1,517 (36.9%) | $51,526 |
| Total | 4,106 (100.0%) | $63,295 |
Poverty in Johnson County
Income Below Poverty by Sex and Age in Johnson County
With 16.2% poverty level for males and 16.7% for females among the residents of Johnson County, 6 to 11 year old males and 25 to 34 year old females are the most vulnerable to poverty, with 292 males (53.1%) and 231 females (42.2%) in their respective age groups living below the poverty level.
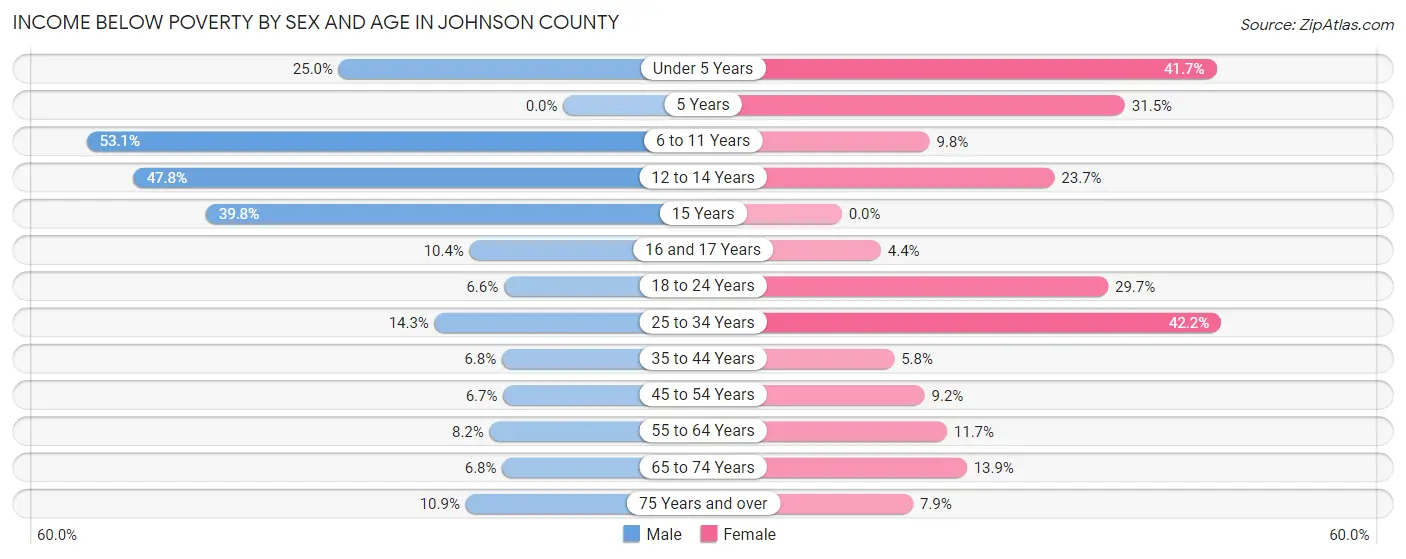
| Age Bracket | Male | Female |
| Under 5 Years | 61 (25.0%) | 108 (41.7%) |
| 5 Years | 0 (0.0%) | 35 (31.5%) |
| 6 to 11 Years | 292 (53.1%) | 39 (9.8%) |
| 12 to 14 Years | 166 (47.8%) | 45 (23.7%) |
| 15 Years | 43 (39.8%) | 0 (0.0%) |
| 16 and 17 Years | 12 (10.4%) | 7 (4.3%) |
| 18 to 24 Years | 37 (6.6%) | 110 (29.6%) |
| 25 to 34 Years | 88 (14.3%) | 231 (42.2%) |
| 35 to 44 Years | 41 (6.8%) | 34 (5.8%) |
| 45 to 54 Years | 45 (6.7%) | 58 (9.2%) |
| 55 to 64 Years | 63 (8.2%) | 100 (11.7%) |
| 65 to 74 Years | 50 (6.8%) | 100 (13.9%) |
| 75 Years and over | 56 (10.9%) | 44 (7.9%) |
| Total | 954 (16.2%) | 911 (16.7%) |
Income Above Poverty by Sex and Age in Johnson County
According to the poverty statistics in Johnson County, males aged 5 years and females aged 15 years are the age groups that are most secure financially, with 100.0% of males and 100.0% of females in these age groups living above the poverty line.
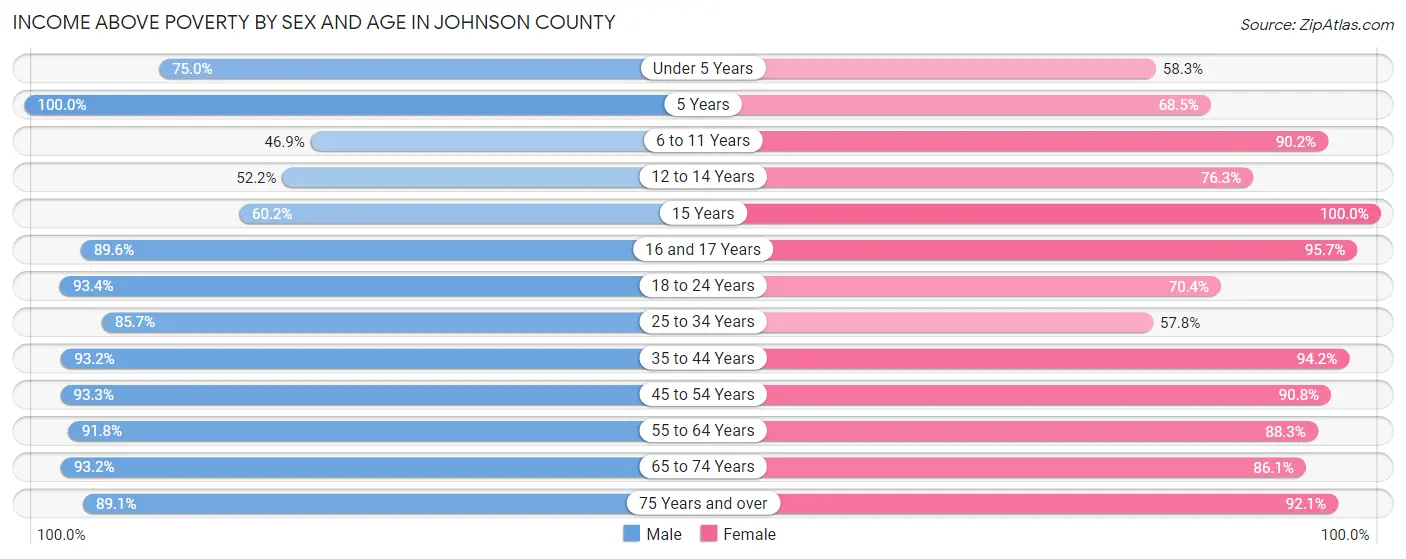
| Age Bracket | Male | Female |
| Under 5 Years | 183 (75.0%) | 151 (58.3%) |
| 5 Years | 60 (100.0%) | 76 (68.5%) |
| 6 to 11 Years | 258 (46.9%) | 360 (90.2%) |
| 12 to 14 Years | 181 (52.2%) | 145 (76.3%) |
| 15 Years | 65 (60.2%) | 67 (100.0%) |
| 16 and 17 Years | 103 (89.6%) | 154 (95.7%) |
| 18 to 24 Years | 524 (93.4%) | 261 (70.4%) |
| 25 to 34 Years | 526 (85.7%) | 316 (57.8%) |
| 35 to 44 Years | 559 (93.2%) | 548 (94.2%) |
| 45 to 54 Years | 628 (93.3%) | 571 (90.8%) |
| 55 to 64 Years | 704 (91.8%) | 755 (88.3%) |
| 65 to 74 Years | 686 (93.2%) | 619 (86.1%) |
| 75 Years and over | 459 (89.1%) | 511 (92.1%) |
| Total | 4,936 (83.8%) | 4,534 (83.3%) |
Income Below Poverty Among Married-Couple Families in Johnson County
The poverty statistics for married-couple families in Johnson County show that 4.5% or 95 of the total 2,102 families live below the poverty line. Families with 5 or more children have the highest poverty rate of 42.9%, comprising of 12 families. On the other hand, families with 1 or 2 children have the lowest poverty rate of 0.2%, which includes 1 families.
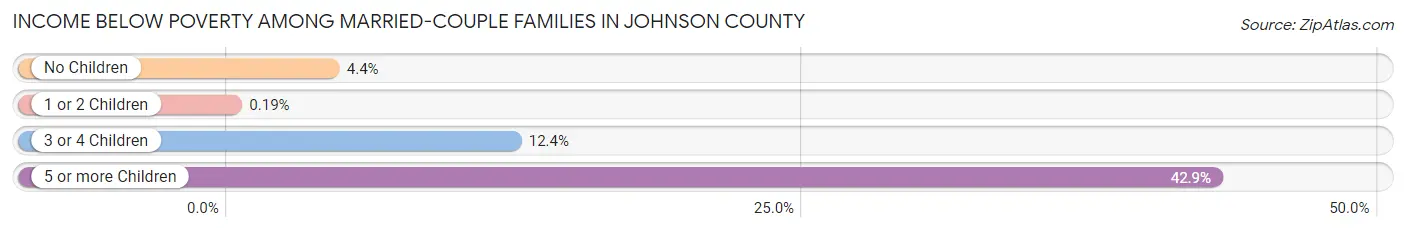
| Children | Above Poverty | Below Poverty |
| No Children | 1,336 (95.6%) | 62 (4.4%) |
| 1 or 2 Children | 513 (99.8%) | 1 (0.2%) |
| 3 or 4 Children | 142 (87.6%) | 20 (12.3%) |
| 5 or more Children | 16 (57.1%) | 12 (42.9%) |
| Total | 2,007 (95.5%) | 95 (4.5%) |
Income Below Poverty Among Single-Parent Households in Johnson County
According to the poverty data in Johnson County, 11.6% or 22 single-father households and 39.1% or 164 single-mother households are living below the poverty line. Among single-father households, those with 3 or 4 children have the highest poverty rate, with 11 households (78.6%) experiencing poverty. Likewise, among single-mother households, those with 3 or 4 children have the highest poverty rate, with 92 households (96.8%) falling below the poverty line.
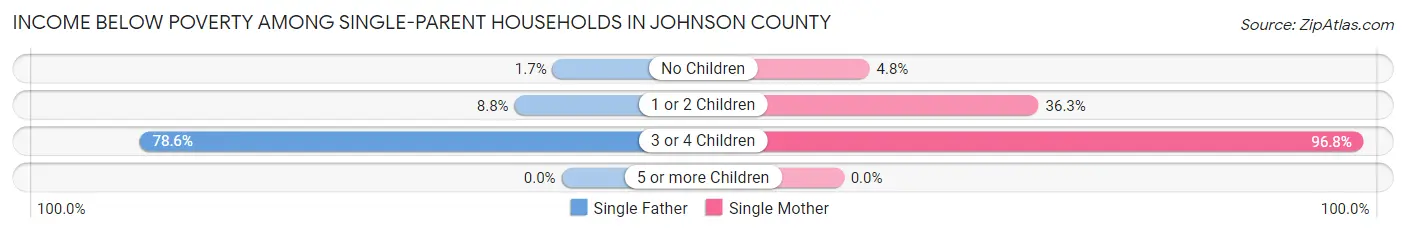
| Children | Single Father | Single Mother |
| No Children | 1 (1.7%) | 7 (4.8%) |
| 1 or 2 Children | 10 (8.8%) | 65 (36.3%) |
| 3 or 4 Children | 11 (78.6%) | 92 (96.8%) |
| 5 or more Children | 0 (0.0%) | 0 (0.0%) |
| Total | 22 (11.6%) | 164 (39.1%) |
Income Below Poverty Among Married-Couple vs Single-Parent Households in Johnson County
The poverty data for Johnson County shows that 95 of the married-couple family households (4.5%) and 186 of the single-parent households (30.6%) are living below the poverty level. Within the married-couple family households, those with 5 or more children have the highest poverty rate, with 12 households (42.9%) falling below the poverty line. Among the single-parent households, those with 3 or 4 children have the highest poverty rate, with 103 household (94.5%) living below poverty.
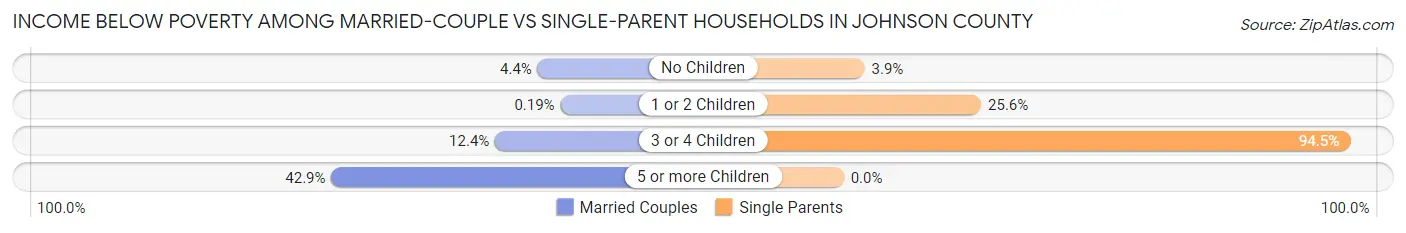
| Children | Married-Couple Families | Single-Parent Households |
| No Children | 62 (4.4%) | 8 (3.9%) |
| 1 or 2 Children | 1 (0.2%) | 75 (25.6%) |
| 3 or 4 Children | 20 (12.3%) | 103 (94.5%) |
| 5 or more Children | 12 (42.9%) | 0 (0.0%) |
| Total | 95 (4.5%) | 186 (30.6%) |
Race in Johnson County
The most populous races in Johnson County are White / Caucasian (11,036 | 82.9%), Black / African American (1,178 | 8.8%), and Two or more Races (924 | 6.9%).
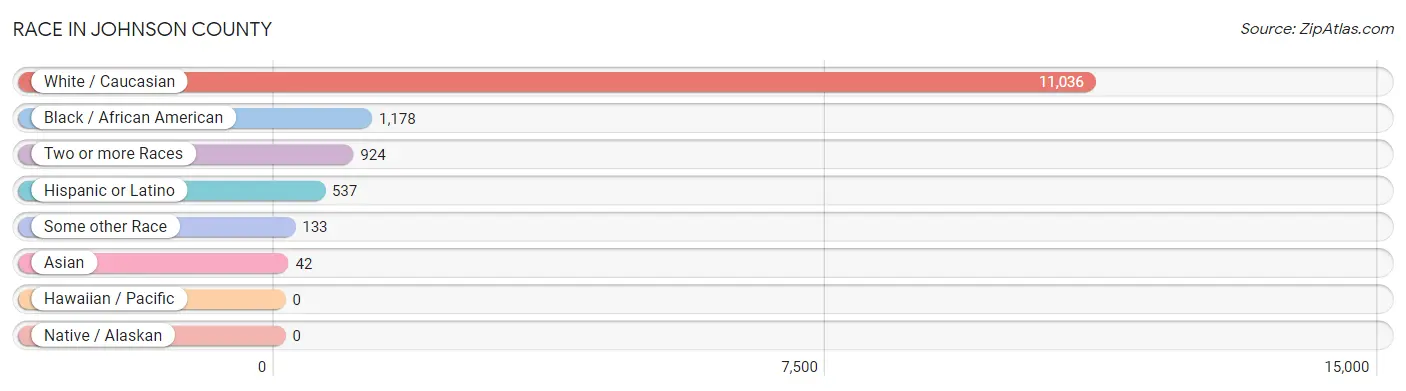
| Race | # Population | % Population |
| Asian | 42 | 0.3% |
| Black / African American | 1,178 | 8.8% |
| Hawaiian / Pacific | 0 | 0.0% |
| Hispanic or Latino | 537 | 4.0% |
| Native / Alaskan | 0 | 0.0% |
| White / Caucasian | 11,036 | 82.9% |
| Two or more Races | 924 | 6.9% |
| Some other Race | 133 | 1.0% |
| Total | 13,313 | 100.0% |
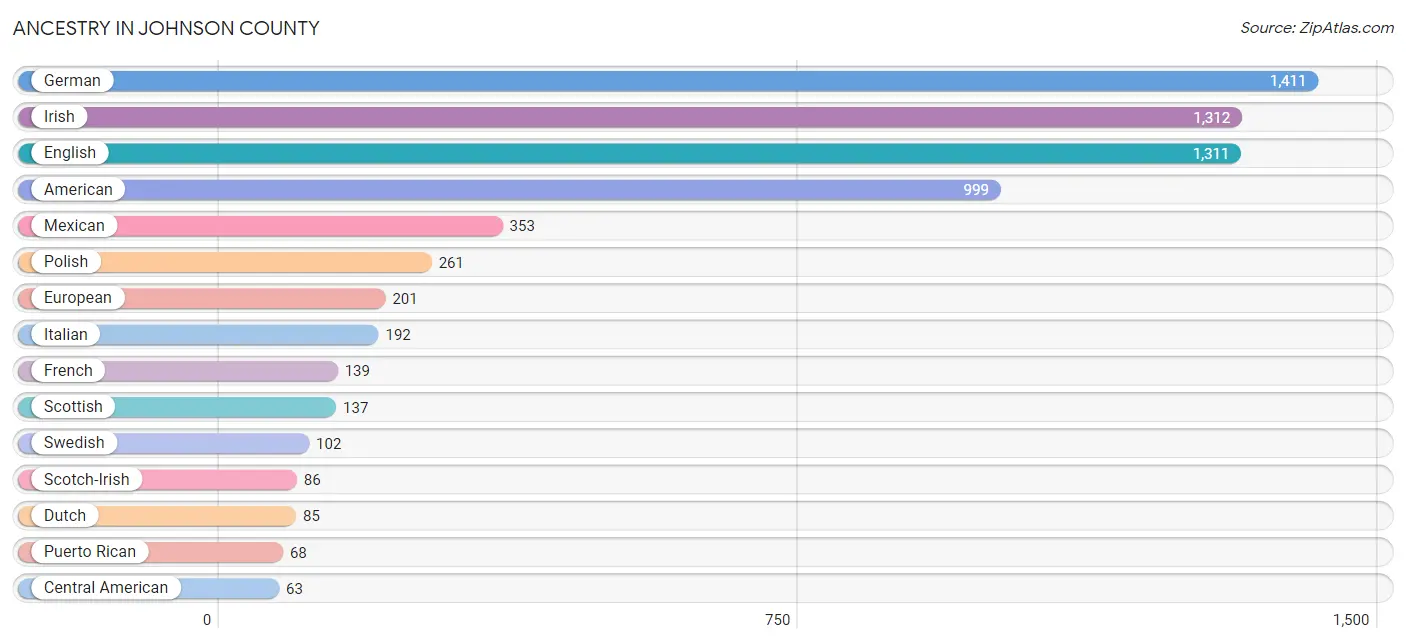
Ancestry in Johnson County
The most populous ancestries reported in Johnson County are German (1,411 | 10.6%), Irish (1,312 | 9.9%), English (1,311 | 9.9%), American (999 | 7.5%), and Mexican (353 | 2.6%), together accounting for 40.5% of all Johnson County residents.
| Ancestry | # Population | % Population |
| American | 999 | 7.5% |
| Arab | 4 | 0.0% |
| Austrian | 19 | 0.1% |
| Belgian | 4 | 0.0% |
| Bhutanese | 1 | 0.0% |
| Blackfeet | 1 | 0.0% |
| British | 39 | 0.3% |
| Burmese | 1 | 0.0% |
| Canadian | 4 | 0.0% |
| Central American | 63 | 0.5% |
| Cherokee | 26 | 0.2% |
| Chickasaw | 1 | 0.0% |
| Colombian | 22 | 0.2% |
| Cuban | 8 | 0.1% |
| Czech | 22 | 0.2% |
| Czechoslovakian | 1 | 0.0% |
| Dutch | 85 | 0.6% |
| English | 1,311 | 9.9% |
| European | 201 | 1.5% |
| Finnish | 4 | 0.0% |
| French | 139 | 1.0% |
| French Canadian | 19 | 0.1% |
| German | 1,411 | 10.6% |
| Greek | 4 | 0.0% |
| Hungarian | 12 | 0.1% |
| Indian (Asian) | 23 | 0.2% |
| Irish | 1,312 | 9.9% |
| Italian | 192 | 1.4% |
| Korean | 50 | 0.4% |
| Lithuanian | 10 | 0.1% |
| Mexican | 353 | 2.6% |
| New Zealander | 4 | 0.0% |
| Nigerian | 13 | 0.1% |
| Northern European | 5 | 0.0% |
| Norwegian | 37 | 0.3% |
| Pakistani | 1 | 0.0% |
| Polish | 261 | 2.0% |
| Puerto Rican | 68 | 0.5% |
| Russian | 8 | 0.1% |
| Salvadoran | 63 | 0.5% |
| Scotch-Irish | 86 | 0.6% |
| Scottish | 137 | 1.0% |
| Serbian | 7 | 0.1% |
| Shoshone | 2 | 0.0% |
| South American | 22 | 0.2% |
| Spaniard | 23 | 0.2% |
| Sri Lankan | 7 | 0.1% |
| Subsaharan African | 13 | 0.1% |
| Swedish | 102 | 0.8% |
| Swiss | 30 | 0.2% |
| Thai | 46 | 0.4% |
| Ukrainian | 18 | 0.1% |
| Welsh | 28 | 0.2% |
| Yugoslavian | 45 | 0.3% | View All 54 Rows |
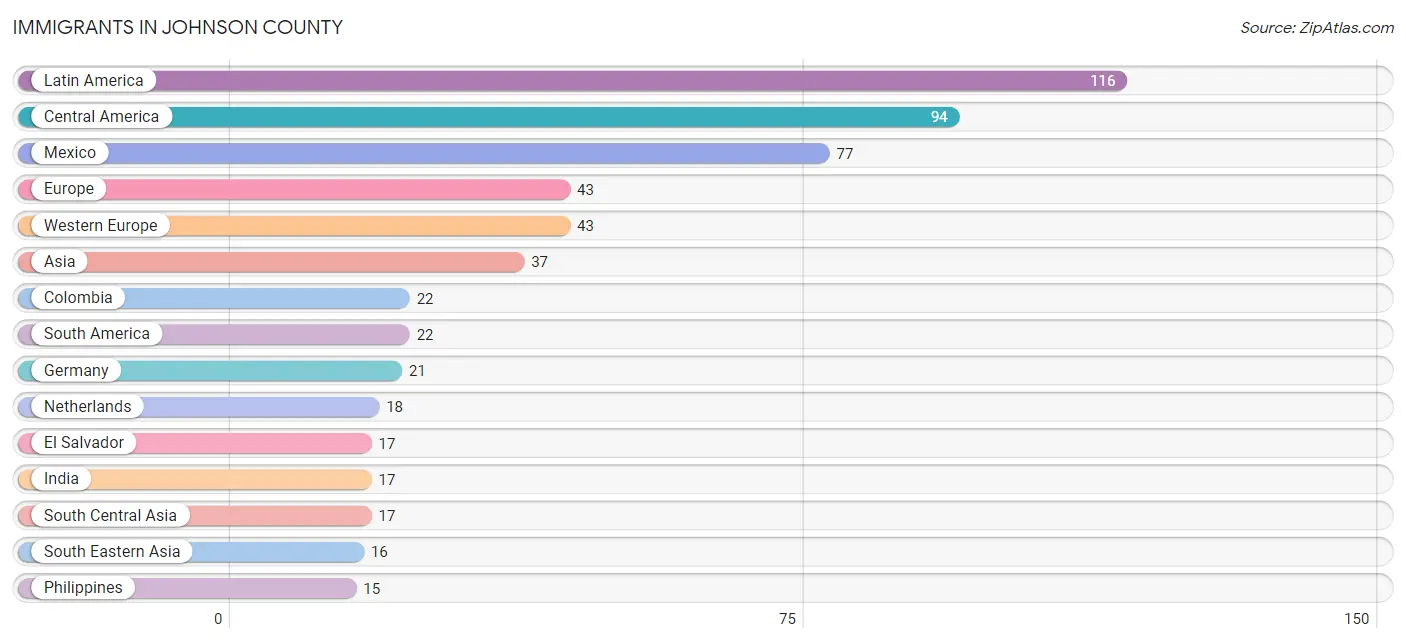
Immigrants in Johnson County
The most numerous immigrant groups reported in Johnson County came from Latin America (116 | 0.9%), Central America (94 | 0.7%), Mexico (77 | 0.6%), Europe (43 | 0.3%), and Western Europe (43 | 0.3%), together accounting for 2.8% of all Johnson County residents.
| Immigration Origin | # Population | % Population |
| Asia | 37 | 0.3% |
| Belgium | 4 | 0.0% |
| Central America | 94 | 0.7% |
| China | 4 | 0.0% |
| Colombia | 22 | 0.2% |
| Eastern Asia | 4 | 0.0% |
| El Salvador | 17 | 0.1% |
| Europe | 43 | 0.3% |
| Germany | 21 | 0.2% |
| India | 17 | 0.1% |
| Latin America | 116 | 0.9% |
| Mexico | 77 | 0.6% |
| Netherlands | 18 | 0.1% |
| Philippines | 15 | 0.1% |
| South America | 22 | 0.2% |
| South Central Asia | 17 | 0.1% |
| South Eastern Asia | 16 | 0.1% |
| Thailand | 1 | 0.0% |
| Western Europe | 43 | 0.3% | View All 19 Rows |
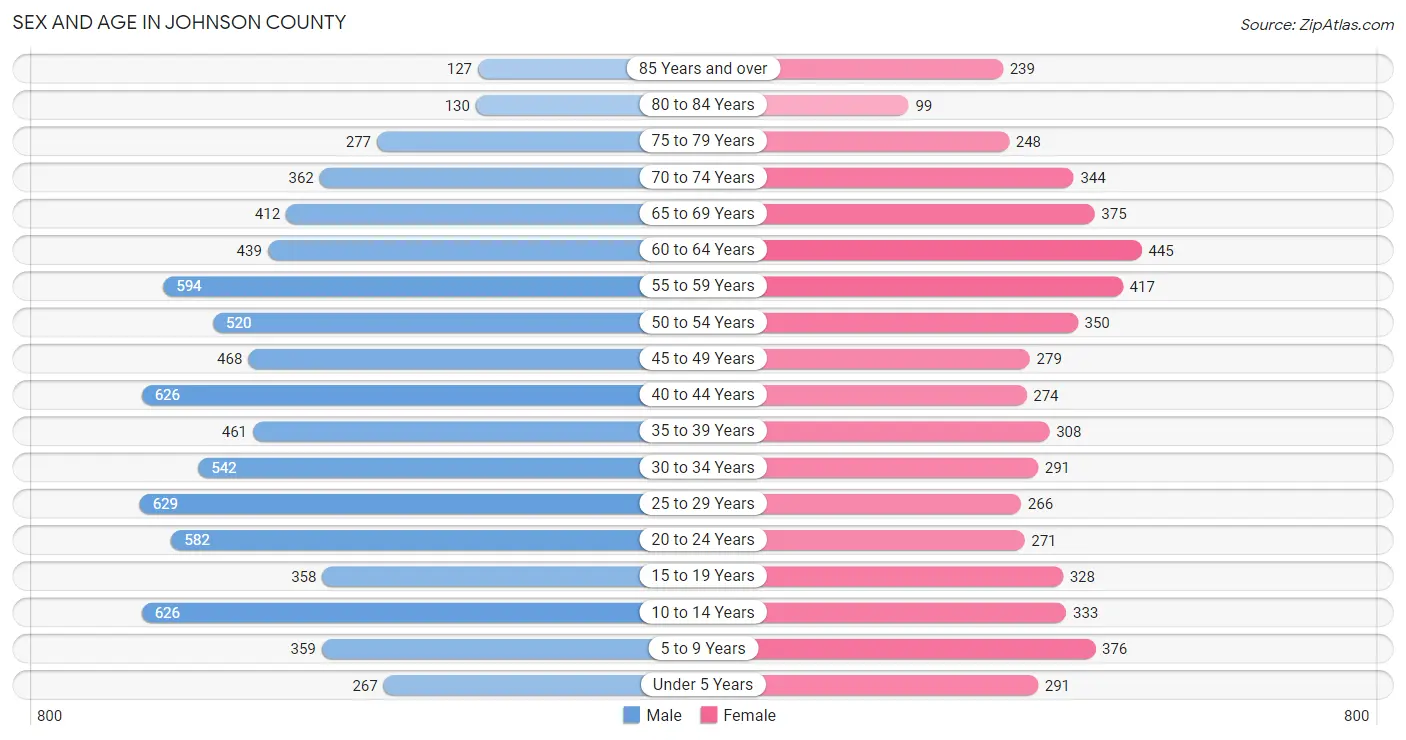
Sex and Age in Johnson County
Sex and Age in Johnson County
The most populous age groups in Johnson County are 25 to 29 Years (629 | 8.1%) for men and 60 to 64 Years (445 | 8.0%) for women.
| Age Bracket | Male | Female |
| Under 5 Years | 267 (3.4%) | 291 (5.3%) |
| 5 to 9 Years | 359 (4.6%) | 376 (6.8%) |
| 10 to 14 Years | 626 (8.1%) | 333 (6.0%) |
| 15 to 19 Years | 358 (4.6%) | 328 (5.9%) |
| 20 to 24 Years | 582 (7.5%) | 271 (4.9%) |
| 25 to 29 Years | 629 (8.1%) | 266 (4.8%) |
| 30 to 34 Years | 542 (7.0%) | 291 (5.3%) |
| 35 to 39 Years | 461 (5.9%) | 308 (5.6%) |
| 40 to 44 Years | 626 (8.1%) | 274 (5.0%) |
| 45 to 49 Years | 468 (6.0%) | 279 (5.0%) |
| 50 to 54 Years | 520 (6.7%) | 350 (6.3%) |
| 55 to 59 Years | 594 (7.6%) | 417 (7.5%) |
| 60 to 64 Years | 439 (5.6%) | 445 (8.0%) |
| 65 to 69 Years | 412 (5.3%) | 375 (6.8%) |
| 70 to 74 Years | 362 (4.6%) | 344 (6.2%) |
| 75 to 79 Years | 277 (3.6%) | 248 (4.5%) |
| 80 to 84 Years | 130 (1.7%) | 99 (1.8%) |
| 85 Years and over | 127 (1.6%) | 239 (4.3%) |
| Total | 7,779 (100.0%) | 5,534 (100.0%) |
Families and Households in Johnson County
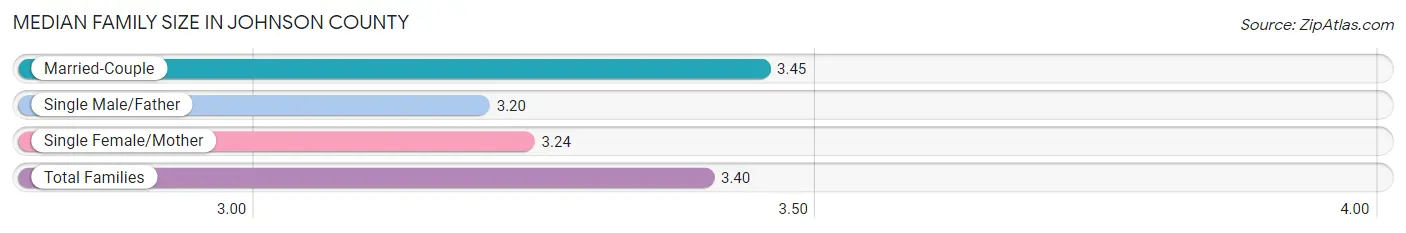
Median Family Size in Johnson County
The median family size in Johnson County is 3.40 persons per family, with married-couple families (2,102 | 77.6%) accounting for the largest median family size of 3.45 persons per family. On the other hand, single male/father families (189 | 7.0%) represent the smallest median family size with 3.20 persons per family.
| Family Type | # Families | Family Size |
| Married-Couple | 2,102 (77.6%) | 3.45 |
| Single Male/Father | 189 (7.0%) | 3.20 |
| Single Female/Mother | 419 (15.5%) | 3.24 |
| Total Families | 2,710 (100.0%) | 3.40 |
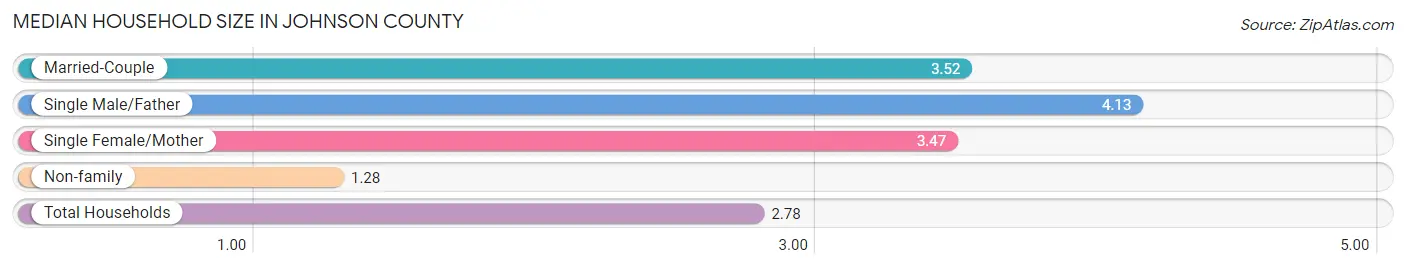
Median Household Size in Johnson County
The median household size in Johnson County is 2.78 persons per household, with single male/father households (189 | 4.6%) accounting for the largest median household size of 4.13 persons per household. non-family households (1,396 | 34.0%) represent the smallest median household size with 1.28 persons per household.
| Household Type | # Households | Household Size |
| Married-Couple | 2,102 (51.2%) | 3.52 |
| Single Male/Father | 189 (4.6%) | 4.13 |
| Single Female/Mother | 419 (10.2%) | 3.47 |
| Non-family | 1,396 (34.0%) | 1.28 |
| Total Households | 4,106 (100.0%) | 2.78 |
Household Size by Marriage Status in Johnson County
Out of a total of 4,106 households in Johnson County, 2,710 (66.0%) are family households, while 1,396 (34.0%) are nonfamily households. The most numerous type of family households are 2-person households, comprising 1,269, and the most common type of nonfamily households are 1-person households, comprising 1,127.
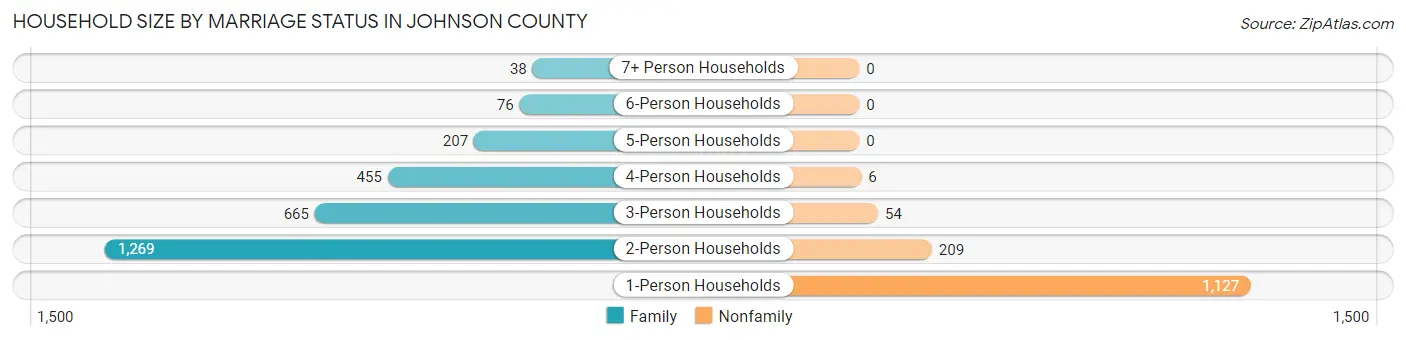
| Household Size | Family Households | Nonfamily Households |
| 1-Person Households | - | 1,127 (27.5%) |
| 2-Person Households | 1,269 (30.9%) | 209 (5.1%) |
| 3-Person Households | 665 (16.2%) | 54 (1.3%) |
| 4-Person Households | 455 (11.1%) | 6 (0.2%) |
| 5-Person Households | 207 (5.0%) | 0 (0.0%) |
| 6-Person Households | 76 (1.8%) | 0 (0.0%) |
| 7+ Person Households | 38 (0.9%) | 0 (0.0%) |
| Total | 2,710 (66.0%) | 1,396 (34.0%) |
Female Fertility in Johnson County
Fertility by Age in Johnson County
Average fertility rate in Johnson County is 39.0 births per 1,000 women. Women in the age bracket of 20 to 34 years have the highest fertility rate with 66.0 births per 1,000 women. Women in the age bracket of 20 to 34 years acount for 69.6% of all women with births.
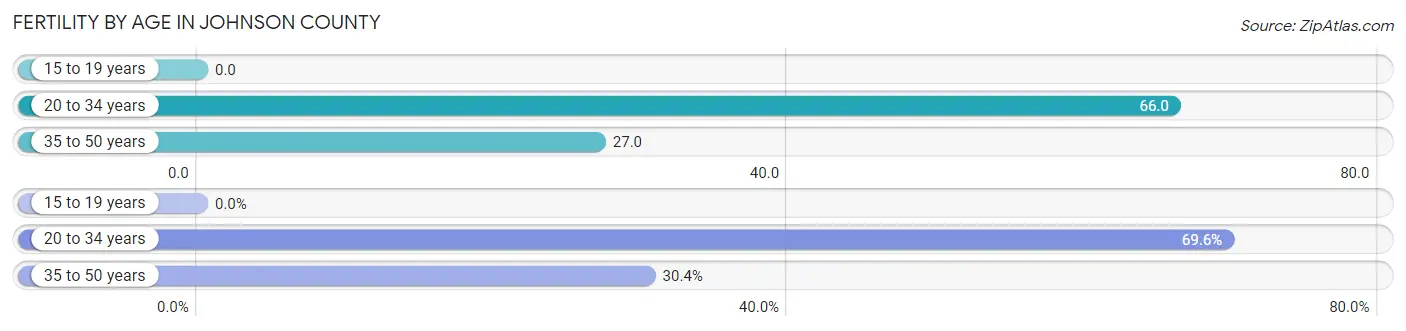
| Age Bracket | Women with Births | Births / 1,000 Women |
| 15 to 19 years | 0 (0.0%) | 0.0 |
| 20 to 34 years | 55 (69.6%) | 66.0 |
| 35 to 50 years | 24 (30.4%) | 27.0 |
| Total | 79 (100.0%) | 39.0 |
Fertility by Age by Marriage Status in Johnson County
72.2% of women with births (79) in Johnson County are married. The highest percentage of unmarried women with births falls into 20 to 34 years age bracket with 36.4% of them unmarried at the time of birth, while the lowest percentage of unmarried women with births belong to 35 to 50 years age bracket with 8.3% of them unmarried.
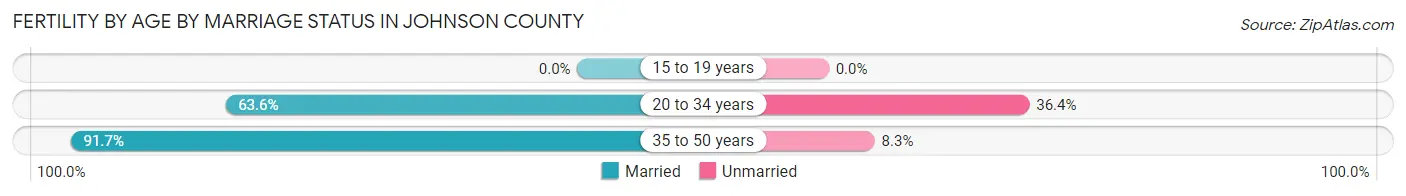
| Age Bracket | Married | Unmarried |
| 15 to 19 years | 0 (0.0%) | 0 (0.0%) |
| 20 to 34 years | 35 (63.6%) | 20 (36.4%) |
| 35 to 50 years | 22 (91.7%) | 2 (8.3%) |
| Total | 57 (72.2%) | 22 (27.9%) |
Fertility by Education in Johnson County
Average fertility rate in Johnson County is 39.0 births per 1,000 women. Women with the education attainment of graduate degree have the highest fertility rate of 79.0 births per 1,000 women, while women with the education attainment of less than high school have the lowest fertility at 13.0 births per 1,000 women. Women with the education attainment of college or associate's degree represent 50.6% of all women with births.
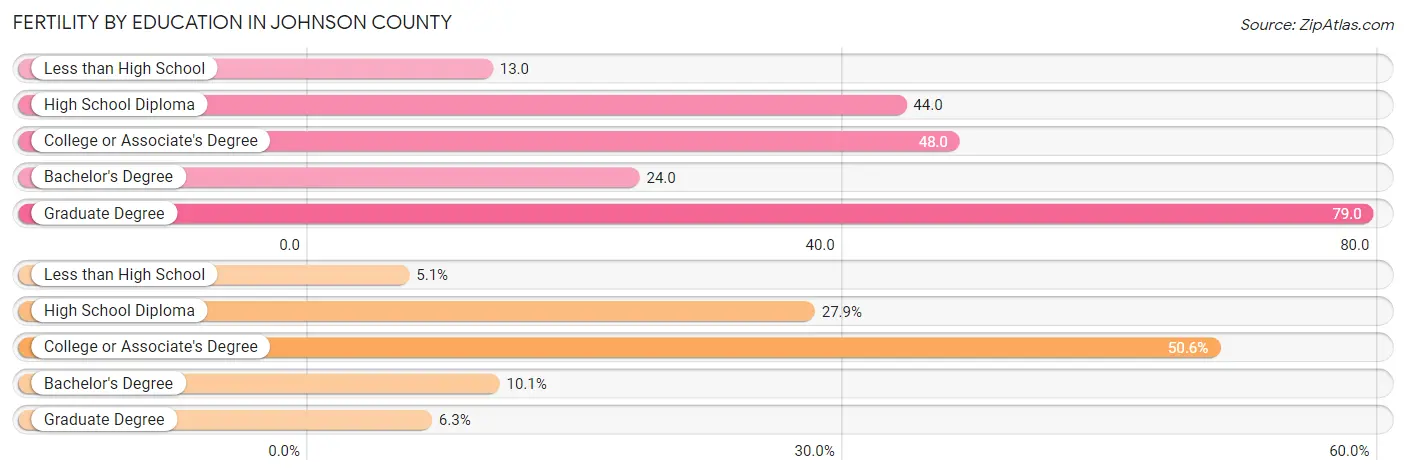
| Educational Attainment | Women with Births | Births / 1,000 Women |
| Less than High School | 4 (5.1%) | 13.0 |
| High School Diploma | 22 (27.9%) | 44.0 |
| College or Associate's Degree | 40 (50.6%) | 48.0 |
| Bachelor's Degree | 8 (10.1%) | 24.0 |
| Graduate Degree | 5 (6.3%) | 79.0 |
| Total | 79 (100.0%) | 39.0 |
Fertility by Education by Marriage Status in Johnson County
27.9% of women with births in Johnson County are unmarried. Women with the educational attainment of bachelor's degree are most likely to be married with 100.0% of them married at childbirth, while women with the educational attainment of high school diploma are least likely to be married with 59.1% of them unmarried at childbirth.
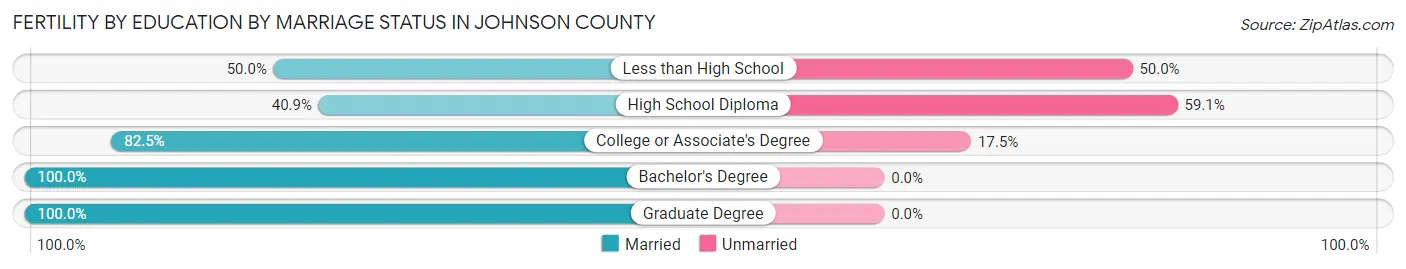
| Educational Attainment | Married | Unmarried |
| Less than High School | 2 (50.0%) | 2 (50.0%) |
| High School Diploma | 9 (40.9%) | 13 (59.1%) |
| College or Associate's Degree | 33 (82.5%) | 7 (17.5%) |
| Bachelor's Degree | 8 (100.0%) | 0 (0.0%) |
| Graduate Degree | 5 (100.0%) | 0 (0.0%) |
| Total | 57 (72.2%) | 22 (27.9%) |
Employment Characteristics in Johnson County
Employment by Class of Employer in Johnson County
Among the 4,316 employed individuals in Johnson County, private company employees (2,394 | 55.5%), state government employees (652 | 15.1%), and not-for-profit organizations (463 | 10.7%) make up the most common classes of employment.
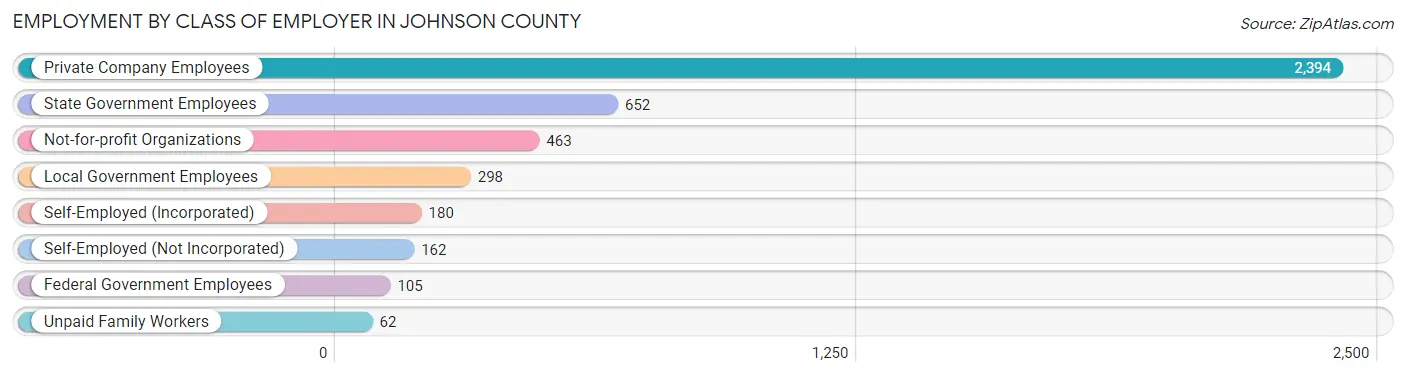
| Employer Class | # Employees | % Employees |
| Private Company Employees | 2,394 | 55.5% |
| Self-Employed (Incorporated) | 180 | 4.2% |
| Self-Employed (Not Incorporated) | 162 | 3.7% |
| Not-for-profit Organizations | 463 | 10.7% |
| Local Government Employees | 298 | 6.9% |
| State Government Employees | 652 | 15.1% |
| Federal Government Employees | 105 | 2.4% |
| Unpaid Family Workers | 62 | 1.4% |
| Total | 4,316 | 100.0% |
Employment Status by Age in Johnson County
According to the labor force statistics for Johnson County, out of the total population over 16 years of age (10,886), 41.3% or 4,496 individuals are in the labor force, with 2.9% or 130 of them unemployed. The age group with the highest labor force participation rate is 45 to 54 years, with 65.1% or 1,053 individuals in the labor force. Within the labor force, the 16 to 19 years age range has the highest percentage of unemployed individuals, with 8.2% or 18 of them being unemployed.
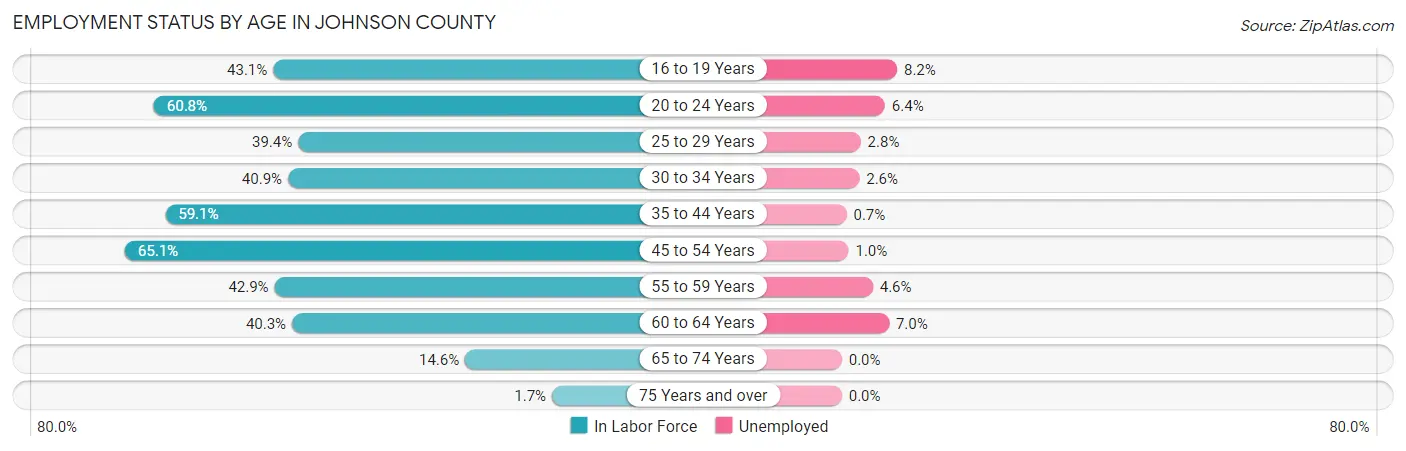
| Age Bracket | In Labor Force | Unemployed |
| 16 to 19 Years | 220 (43.1%) | 18 (8.2%) |
| 20 to 24 Years | 519 (60.8%) | 33 (6.4%) |
| 25 to 29 Years | 353 (39.4%) | 10 (2.8%) |
| 30 to 34 Years | 341 (40.9%) | 9 (2.6%) |
| 35 to 44 Years | 986 (59.1%) | 7 (0.7%) |
| 45 to 54 Years | 1,053 (65.1%) | 11 (1.0%) |
| 55 to 59 Years | 434 (42.9%) | 20 (4.6%) |
| 60 to 64 Years | 356 (40.3%) | 25 (7.0%) |
| 65 to 74 Years | 218 (14.6%) | 0 (0.0%) |
| 75 Years and over | 19 (1.7%) | 0 (0.0%) |
| Total | 4,496 (41.3%) | 130 (2.9%) |
Employment Status by Educational Attainment in Johnson County
According to labor force statistics for Johnson County, 51.0% of individuals (3,524) out of the total population between 25 and 64 years of age (6,909) are in the labor force, with 2.3% or 81 of them being unemployed. The group with the highest labor force participation rate are those with the educational attainment of bachelor's degree or higher, with 83.9% or 936 individuals in the labor force. Within the labor force, individuals with less than high school education have the highest percentage of unemployment, with 11.5% or 15 of them being unemployed.
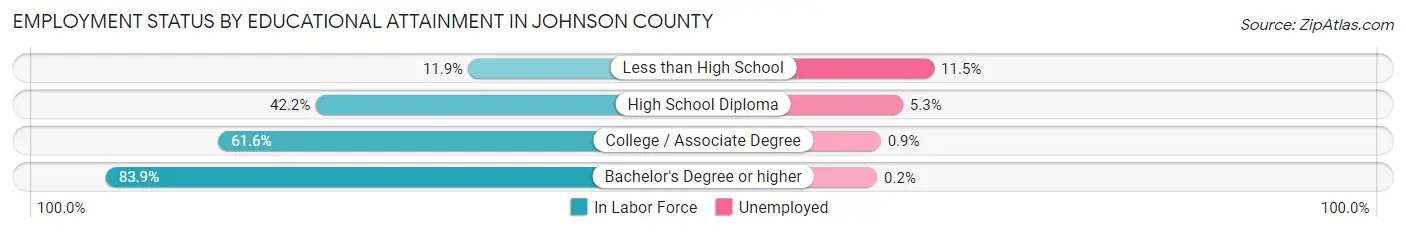
| Educational Attainment | In Labor Force | Unemployed |
| Less than High School | 131 (11.9%) | 126 (11.5%) |
| High School Diploma | 946 (42.2%) | 119 (5.3%) |
| College / Associate Degree | 1,510 (61.6%) | 22 (0.9%) |
| Bachelor's Degree or higher | 936 (83.9%) | 2 (0.2%) |
| Total | 3,524 (51.0%) | 159 (2.3%) |
Employment Occupations by Sex in Johnson County
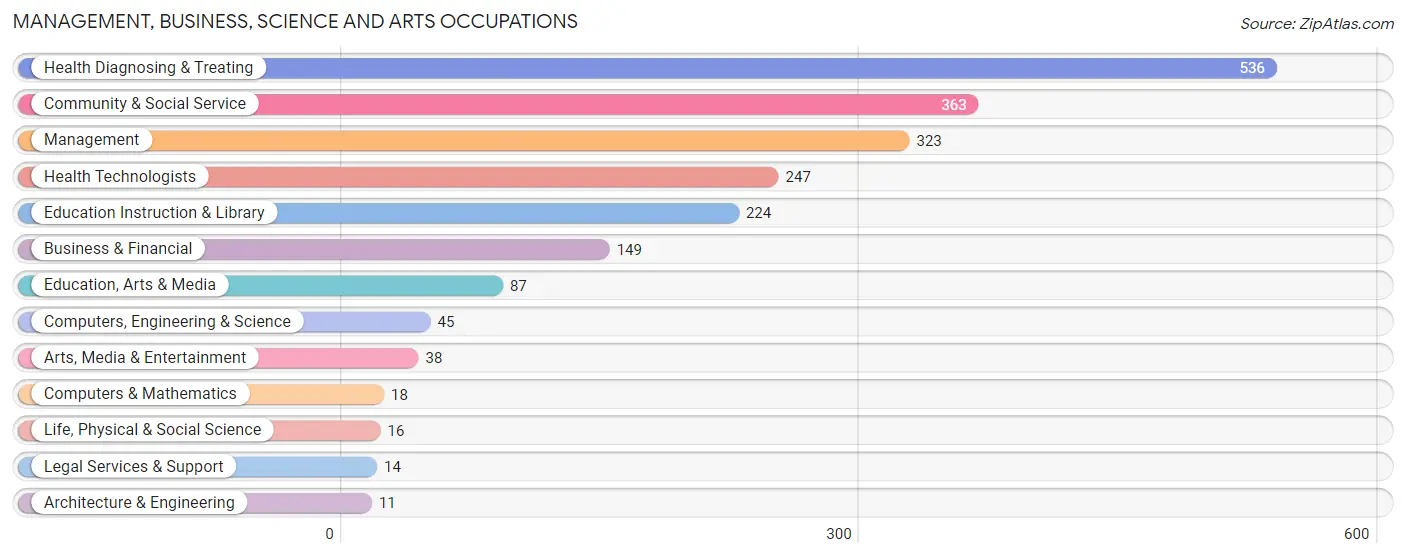
Management, Business, Science and Arts Occupations
The most common Management, Business, Science and Arts occupations in Johnson County are Health Diagnosing & Treating (536 | 12.3%), Community & Social Service (363 | 8.3%), Management (323 | 7.4%), Health Technologists (247 | 5.7%), and Education Instruction & Library (224 | 5.1%).
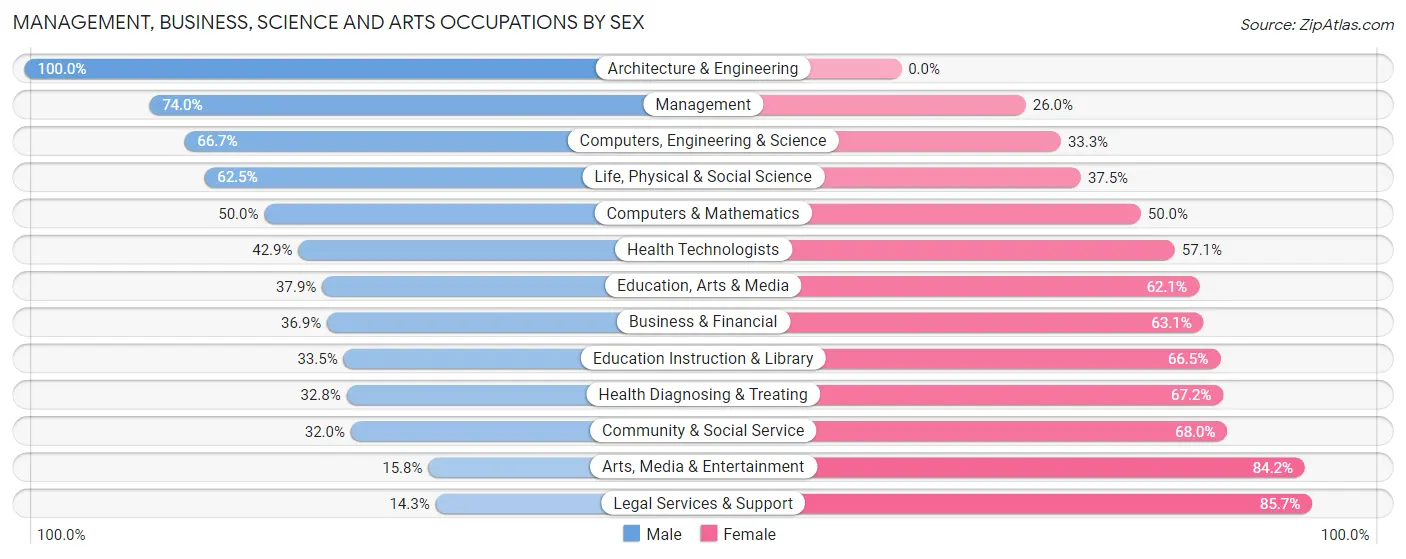
Management, Business, Science and Arts Occupations by Sex
Within the Management, Business, Science and Arts occupations in Johnson County, the most male-oriented occupations are Architecture & Engineering (100.0%), Management (74.0%), and Computers, Engineering & Science (66.7%), while the most female-oriented occupations are Legal Services & Support (85.7%), Arts, Media & Entertainment (84.2%), and Community & Social Service (68.0%).
| Occupation | Male | Female |
| Management | 239 (74.0%) | 84 (26.0%) |
| Business & Financial | 55 (36.9%) | 94 (63.1%) |
| Computers, Engineering & Science | 30 (66.7%) | 15 (33.3%) |
| Computers & Mathematics | 9 (50.0%) | 9 (50.0%) |
| Architecture & Engineering | 11 (100.0%) | 0 (0.0%) |
| Life, Physical & Social Science | 10 (62.5%) | 6 (37.5%) |
| Community & Social Service | 116 (32.0%) | 247 (68.0%) |
| Education, Arts & Media | 33 (37.9%) | 54 (62.1%) |
| Legal Services & Support | 2 (14.3%) | 12 (85.7%) |
| Education Instruction & Library | 75 (33.5%) | 149 (66.5%) |
| Arts, Media & Entertainment | 6 (15.8%) | 32 (84.2%) |
| Health Diagnosing & Treating | 176 (32.8%) | 360 (67.2%) |
| Health Technologists | 106 (42.9%) | 141 (57.1%) |
| Total (Category) | 616 (43.5%) | 800 (56.5%) |
| Total (Overall) | 2,409 (55.2%) | 1,958 (44.8%) |
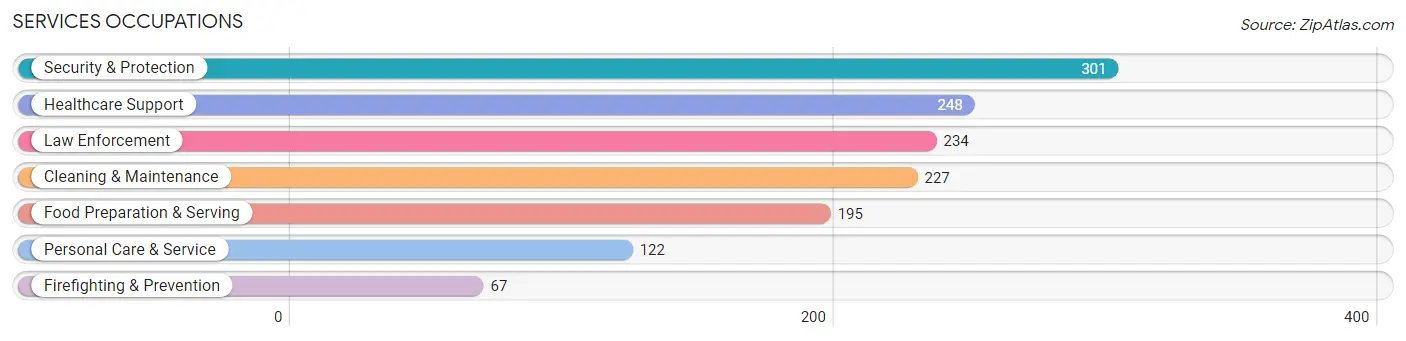
Services Occupations
The most common Services occupations in Johnson County are Security & Protection (301 | 6.9%), Healthcare Support (248 | 5.7%), Law Enforcement (234 | 5.4%), Cleaning & Maintenance (227 | 5.2%), and Food Preparation & Serving (195 | 4.5%).
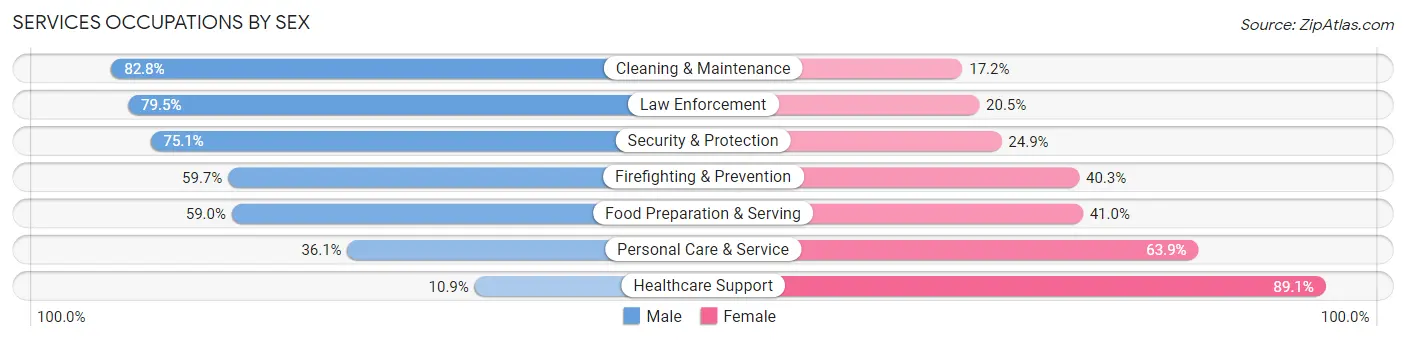
Services Occupations by Sex
Within the Services occupations in Johnson County, the most male-oriented occupations are Cleaning & Maintenance (82.8%), Law Enforcement (79.5%), and Security & Protection (75.1%), while the most female-oriented occupations are Healthcare Support (89.1%), Personal Care & Service (63.9%), and Food Preparation & Serving (41.0%).
| Occupation | Male | Female |
| Healthcare Support | 27 (10.9%) | 221 (89.1%) |
| Security & Protection | 226 (75.1%) | 75 (24.9%) |
| Firefighting & Prevention | 40 (59.7%) | 27 (40.3%) |
| Law Enforcement | 186 (79.5%) | 48 (20.5%) |
| Food Preparation & Serving | 115 (59.0%) | 80 (41.0%) |
| Cleaning & Maintenance | 188 (82.8%) | 39 (17.2%) |
| Personal Care & Service | 44 (36.1%) | 78 (63.9%) |
| Total (Category) | 600 (54.9%) | 493 (45.1%) |
| Total (Overall) | 2,409 (55.2%) | 1,958 (44.8%) |
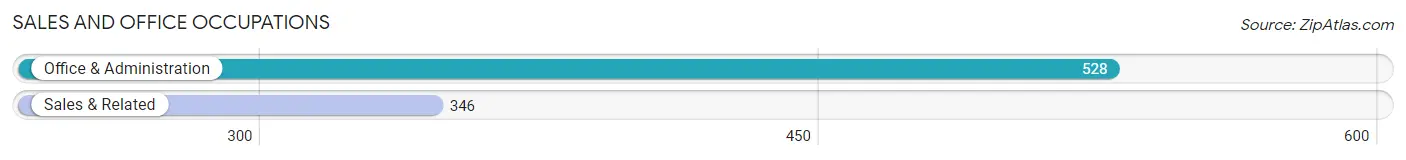
Sales and Office Occupations
The most common Sales and Office occupations in Johnson County are Office & Administration (528 | 12.1%), and Sales & Related (346 | 7.9%).
Sales and Office Occupations by Sex
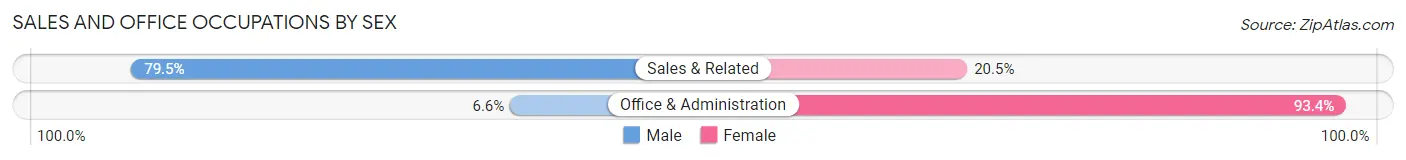
| Occupation | Male | Female |
| Sales & Related | 275 (79.5%) | 71 (20.5%) |
| Office & Administration | 35 (6.6%) | 493 (93.4%) |
| Total (Category) | 310 (35.5%) | 564 (64.5%) |
| Total (Overall) | 2,409 (55.2%) | 1,958 (44.8%) |
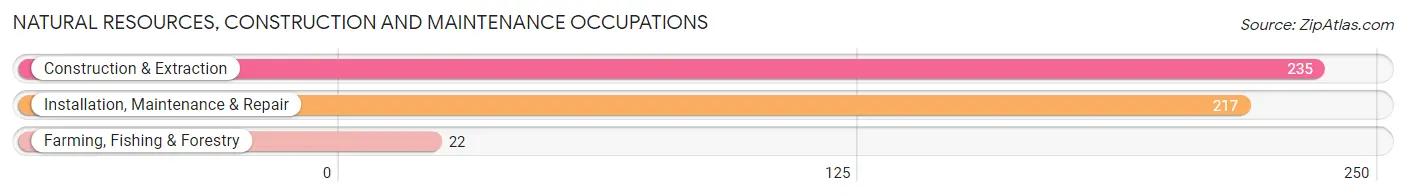
Natural Resources, Construction and Maintenance Occupations
The most common Natural Resources, Construction and Maintenance occupations in Johnson County are Construction & Extraction (235 | 5.4%), Installation, Maintenance & Repair (217 | 5.0%), and Farming, Fishing & Forestry (22 | 0.5%).
Natural Resources, Construction and Maintenance Occupations by Sex
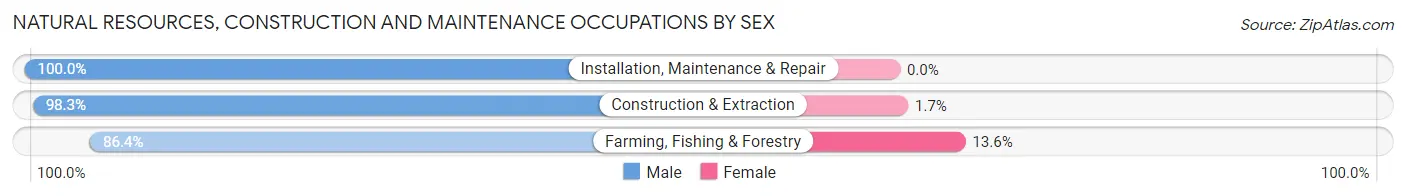
| Occupation | Male | Female |
| Farming, Fishing & Forestry | 19 (86.4%) | 3 (13.6%) |
| Construction & Extraction | 231 (98.3%) | 4 (1.7%) |
| Installation, Maintenance & Repair | 217 (100.0%) | 0 (0.0%) |
| Total (Category) | 467 (98.5%) | 7 (1.5%) |
| Total (Overall) | 2,409 (55.2%) | 1,958 (44.8%) |
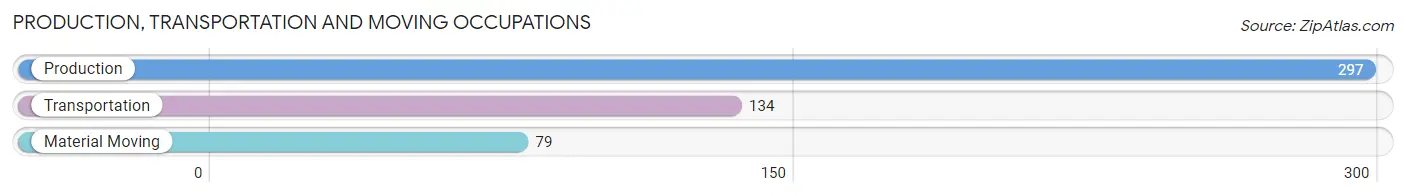
Production, Transportation and Moving Occupations
The most common Production, Transportation and Moving occupations in Johnson County are Production (297 | 6.8%), Transportation (134 | 3.1%), and Material Moving (79 | 1.8%).
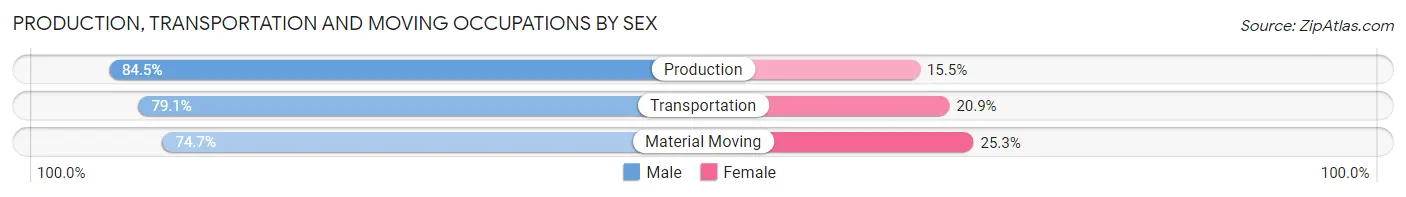
Production, Transportation and Moving Occupations by Sex
| Occupation | Male | Female |
| Production | 251 (84.5%) | 46 (15.5%) |
| Transportation | 106 (79.1%) | 28 (20.9%) |
| Material Moving | 59 (74.7%) | 20 (25.3%) |
| Total (Category) | 416 (81.6%) | 94 (18.4%) |
| Total (Overall) | 2,409 (55.2%) | 1,958 (44.8%) |
Employment Industries by Sex in Johnson County
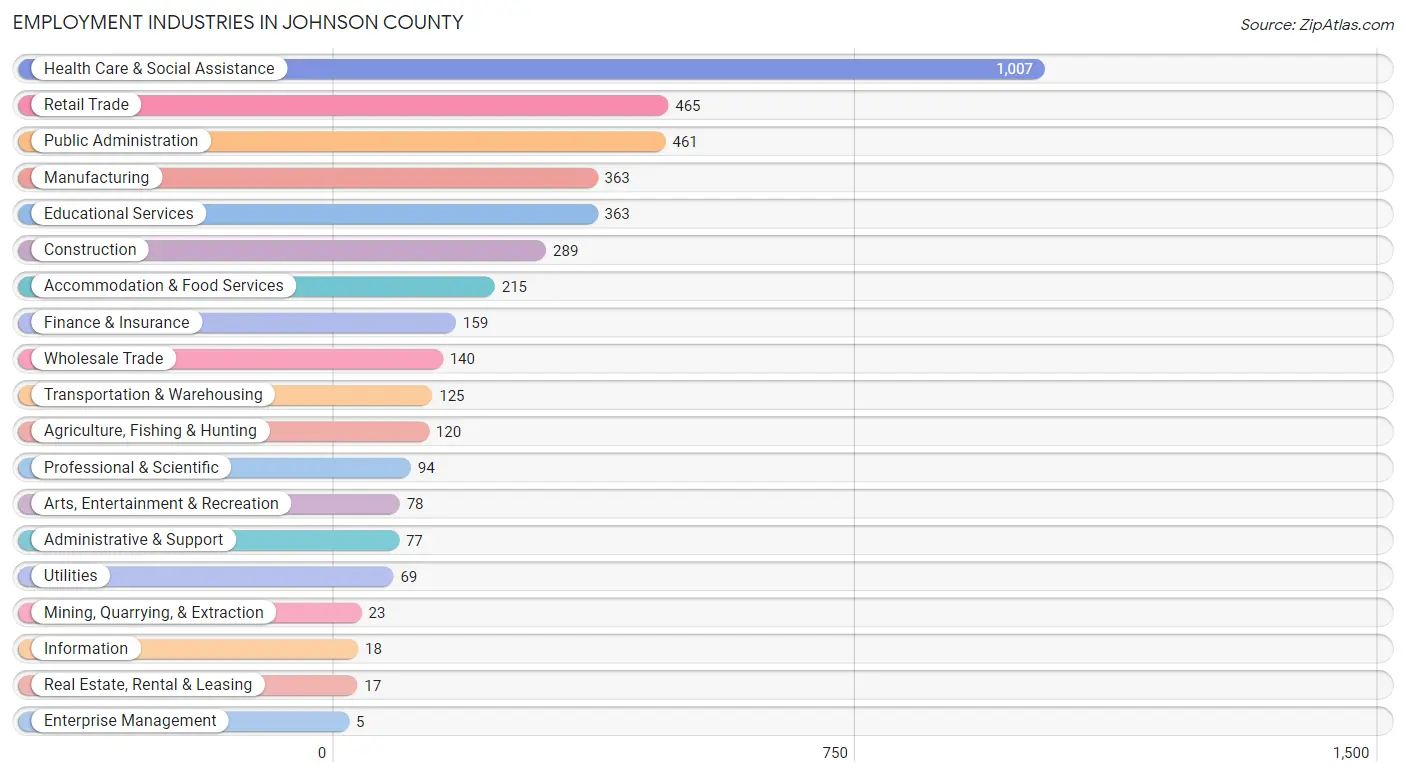
Employment Industries in Johnson County
The major employment industries in Johnson County include Health Care & Social Assistance (1,007 | 23.1%), Retail Trade (465 | 10.6%), Public Administration (461 | 10.6%), Manufacturing (363 | 8.3%), and Educational Services (363 | 8.3%).
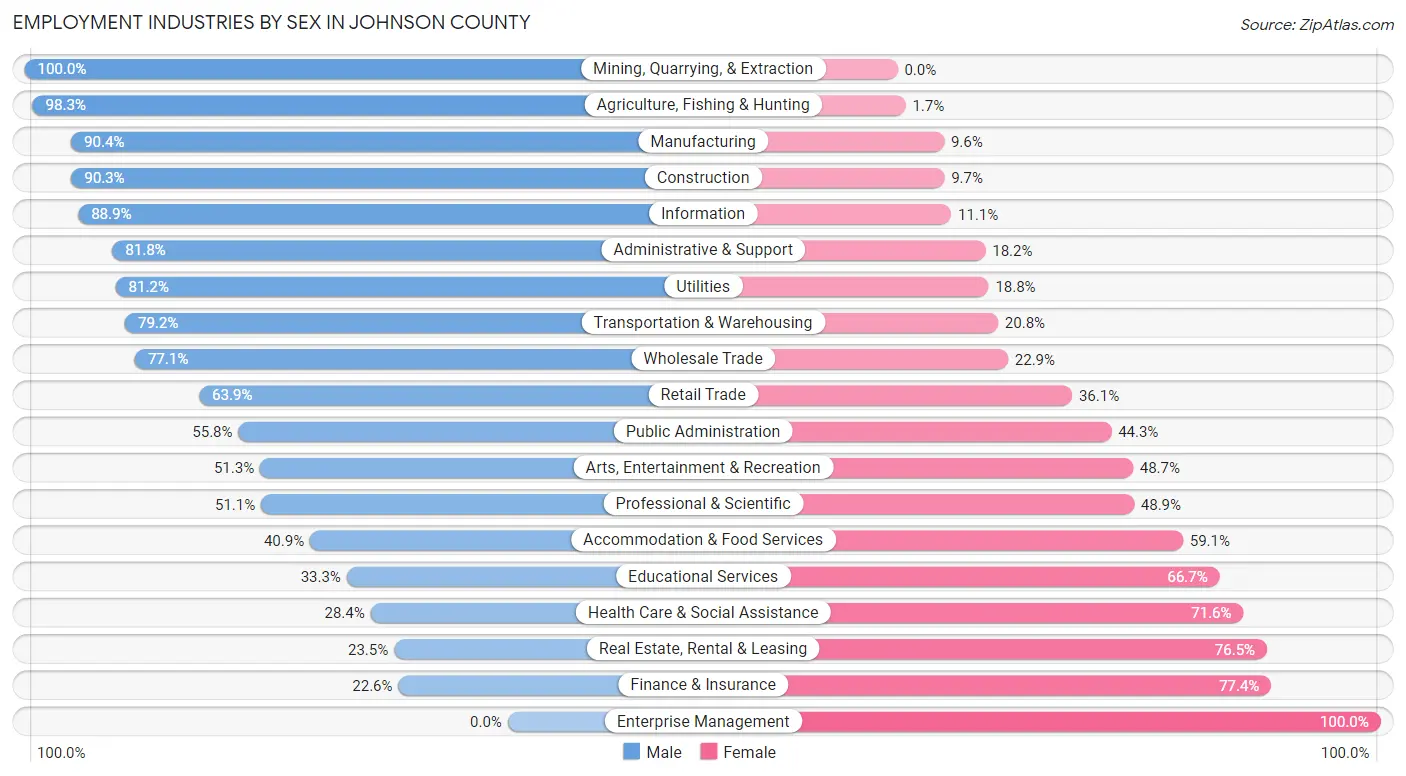
Employment Industries by Sex in Johnson County
The Johnson County industries that see more men than women are Mining, Quarrying, & Extraction (100.0%), Agriculture, Fishing & Hunting (98.3%), and Manufacturing (90.4%), whereas the industries that tend to have a higher number of women are Enterprise Management (100.0%), Finance & Insurance (77.4%), and Real Estate, Rental & Leasing (76.5%).
| Industry | Male | Female |
| Agriculture, Fishing & Hunting | 118 (98.3%) | 2 (1.7%) |
| Mining, Quarrying, & Extraction | 23 (100.0%) | 0 (0.0%) |
| Construction | 261 (90.3%) | 28 (9.7%) |
| Manufacturing | 328 (90.4%) | 35 (9.6%) |
| Wholesale Trade | 108 (77.1%) | 32 (22.9%) |
| Retail Trade | 297 (63.9%) | 168 (36.1%) |
| Transportation & Warehousing | 99 (79.2%) | 26 (20.8%) |
| Utilities | 56 (81.2%) | 13 (18.8%) |
| Information | 16 (88.9%) | 2 (11.1%) |
| Finance & Insurance | 36 (22.6%) | 123 (77.4%) |
| Real Estate, Rental & Leasing | 4 (23.5%) | 13 (76.5%) |
| Professional & Scientific | 48 (51.1%) | 46 (48.9%) |
| Enterprise Management | 0 (0.0%) | 5 (100.0%) |
| Administrative & Support | 63 (81.8%) | 14 (18.2%) |
| Educational Services | 121 (33.3%) | 242 (66.7%) |
| Health Care & Social Assistance | 286 (28.4%) | 721 (71.6%) |
| Arts, Entertainment & Recreation | 40 (51.3%) | 38 (48.7%) |
| Accommodation & Food Services | 88 (40.9%) | 127 (59.1%) |
| Public Administration | 257 (55.7%) | 204 (44.3%) |
| Total | 2,409 (55.2%) | 1,958 (44.8%) |
Education in Johnson County
School Enrollment in Johnson County
The most common levels of schooling among the 2,837 students in Johnson County are elementary school (659 | 23.2%), middle school (643 | 22.7%), and high school (602 | 21.2%).
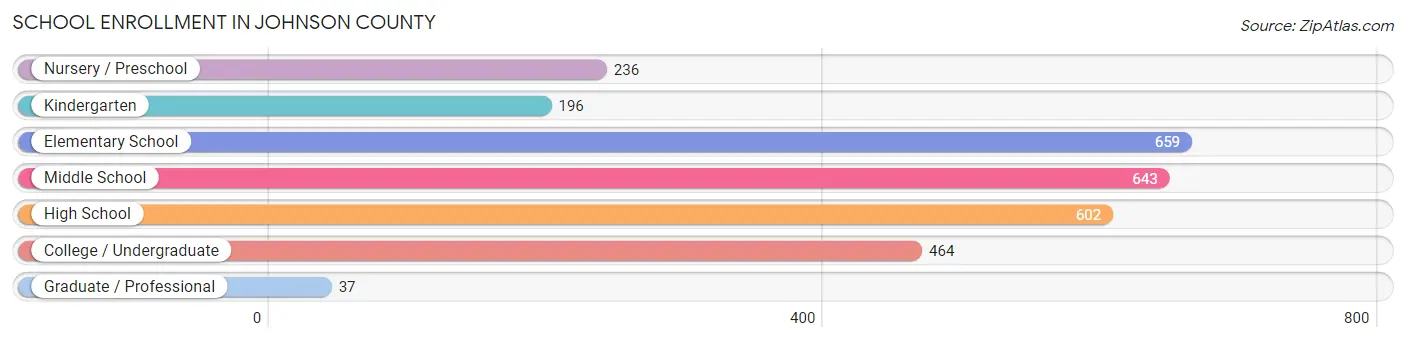
| School Level | # Students | % Students |
| Nursery / Preschool | 236 | 8.3% |
| Kindergarten | 196 | 6.9% |
| Elementary School | 659 | 23.2% |
| Middle School | 643 | 22.7% |
| High School | 602 | 21.2% |
| College / Undergraduate | 464 | 16.4% |
| Graduate / Professional | 37 | 1.3% |
| Total | 2,837 | 100.0% |
School Enrollment by Age by Funding Source in Johnson County
Out of a total of 2,837 students who are enrolled in schools in Johnson County, 165 (5.8%) attend a private institution, while the remaining 2,672 (94.2%) are enrolled in public schools. The age group of 35 years and over has the highest likelihood of being enrolled in private schools, with 21 (26.3% in the age bracket) enrolled. Conversely, the age group of 18 to 19 year olds has the lowest likelihood of being enrolled in a private school, with 158 (100.0% in the age bracket) attending a public institution.
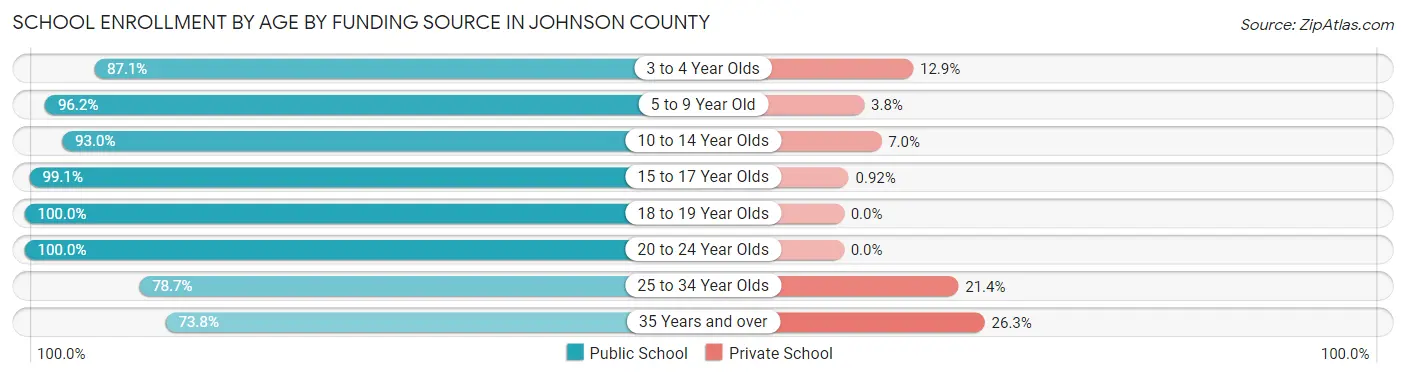
| Age Bracket | Public School | Private School |
| 3 to 4 Year Olds | 182 (87.1%) | 27 (12.9%) |
| 5 to 9 Year Old | 684 (96.2%) | 27 (3.8%) |
| 10 to 14 Year Olds | 892 (93.0%) | 67 (7.0%) |
| 15 to 17 Year Olds | 430 (99.1%) | 4 (0.9%) |
| 18 to 19 Year Olds | 158 (100.0%) | 0 (0.0%) |
| 20 to 24 Year Olds | 197 (100.0%) | 0 (0.0%) |
| 25 to 34 Year Olds | 70 (78.6%) | 19 (21.3%) |
| 35 Years and over | 59 (73.8%) | 21 (26.3%) |
| Total | 2,672 (94.2%) | 165 (5.8%) |
Educational Attainment by Field of Study in Johnson County
Education (380 | 22.4%), business (254 | 15.0%), bio, nature & agricultural (215 | 12.7%), science & technology (174 | 10.3%), and arts & humanities (165 | 9.7%) are the most common fields of study among 1,694 individuals in Johnson County who have obtained a bachelor's degree or higher.
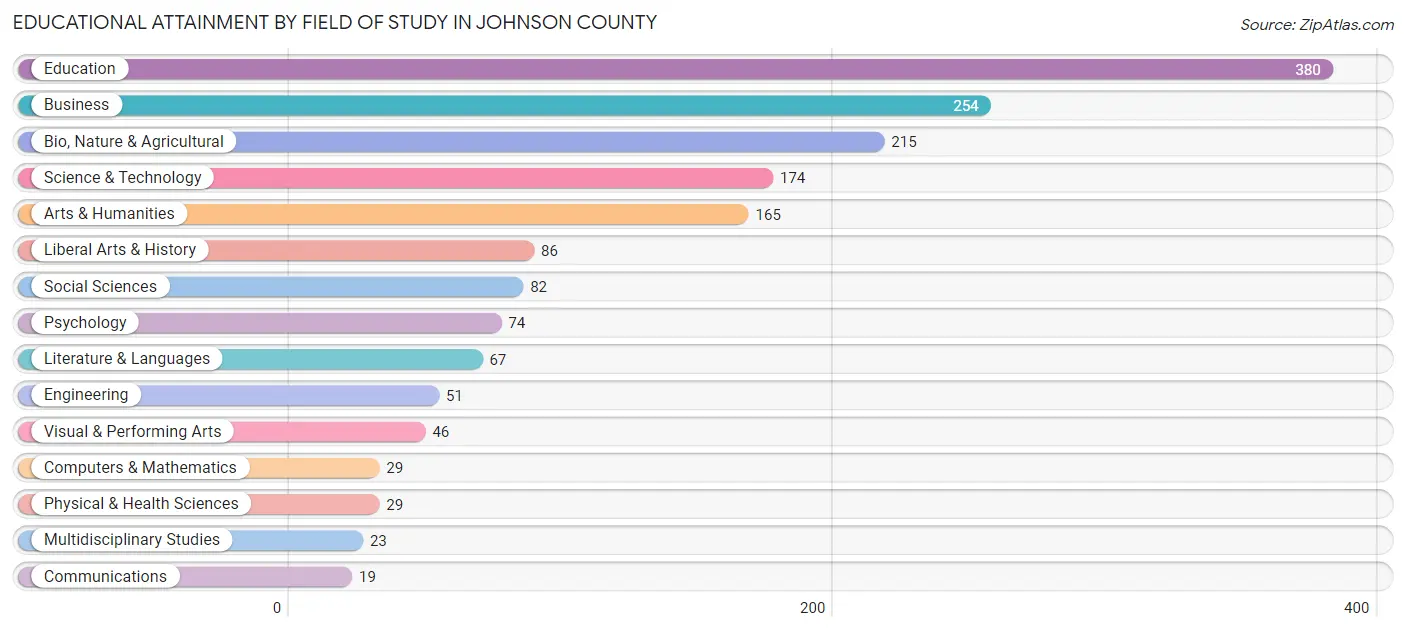
| Field of Study | # Graduates | % Graduates |
| Computers & Mathematics | 29 | 1.7% |
| Bio, Nature & Agricultural | 215 | 12.7% |
| Physical & Health Sciences | 29 | 1.7% |
| Psychology | 74 | 4.4% |
| Social Sciences | 82 | 4.8% |
| Engineering | 51 | 3.0% |
| Multidisciplinary Studies | 23 | 1.4% |
| Science & Technology | 174 | 10.3% |
| Business | 254 | 15.0% |
| Education | 380 | 22.4% |
| Literature & Languages | 67 | 4.0% |
| Liberal Arts & History | 86 | 5.1% |
| Visual & Performing Arts | 46 | 2.7% |
| Communications | 19 | 1.1% |
| Arts & Humanities | 165 | 9.7% |
| Total | 1,694 | 100.0% |
Transportation & Commute in Johnson County
Vehicle Availability by Sex in Johnson County
The most prevalent vehicle ownership categories in Johnson County are males with 3 vehicles (945, accounting for 39.7%) and females with 3 vehicles (631, making up 48.9%).
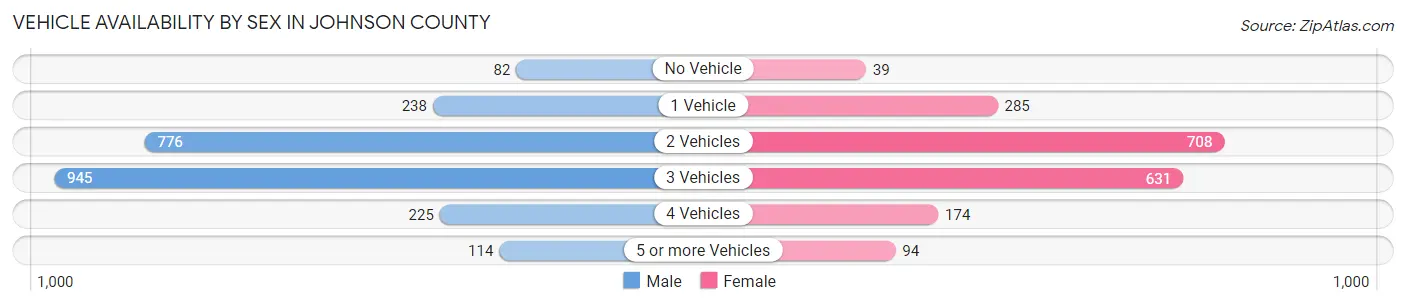
| Vehicles Available | Male | Female |
| No Vehicle | 82 (3.5%) | 39 (2.0%) |
| 1 Vehicle | 238 (10.0%) | 285 (14.8%) |
| 2 Vehicles | 776 (32.6%) | 708 (36.7%) |
| 3 Vehicles | 945 (39.7%) | 631 (32.7%) |
| 4 Vehicles | 225 (9.5%) | 174 (9.0%) |
| 5 or more Vehicles | 114 (4.8%) | 94 (4.9%) |
| Total | 2,380 (100.0%) | 1,931 (100.0%) |
Commute Time in Johnson County
The most frequently occuring commute durations in Johnson County are 30 to 34 minutes (1,059 commuters, 26.5%), 20 to 24 minutes (558 commuters, 14.0%), and 45 to 59 minutes (491 commuters, 12.3%).
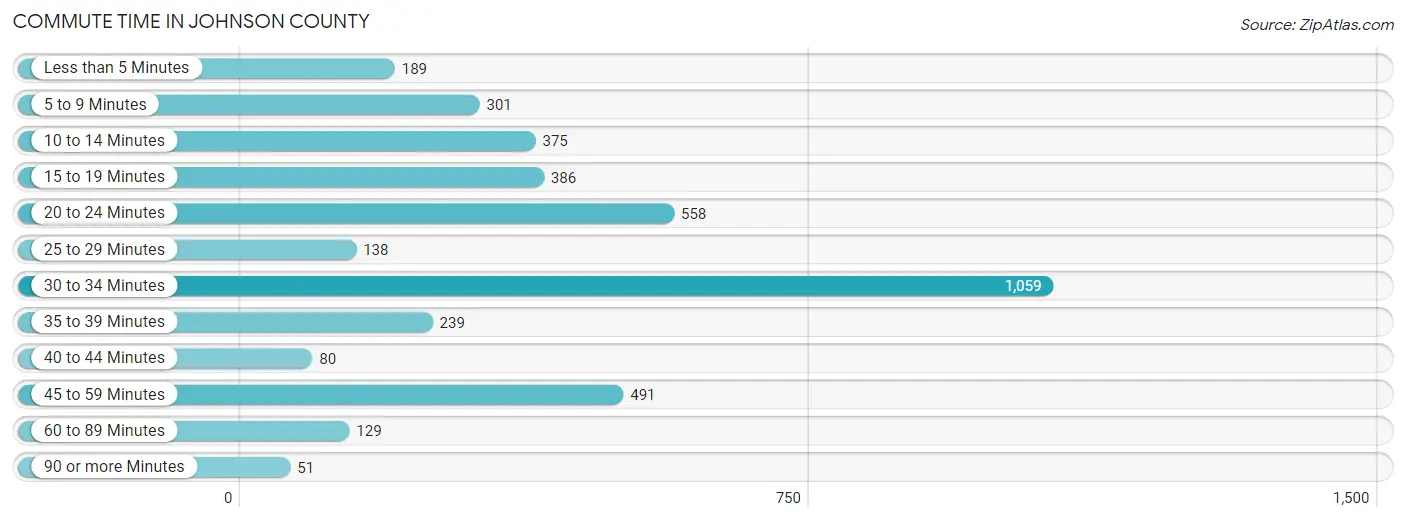
| Commute Time | # Commuters | % Commuters |
| Less than 5 Minutes | 189 | 4.7% |
| 5 to 9 Minutes | 301 | 7.5% |
| 10 to 14 Minutes | 375 | 9.4% |
| 15 to 19 Minutes | 386 | 9.7% |
| 20 to 24 Minutes | 558 | 14.0% |
| 25 to 29 Minutes | 138 | 3.5% |
| 30 to 34 Minutes | 1,059 | 26.5% |
| 35 to 39 Minutes | 239 | 6.0% |
| 40 to 44 Minutes | 80 | 2.0% |
| 45 to 59 Minutes | 491 | 12.3% |
| 60 to 89 Minutes | 129 | 3.2% |
| 90 or more Minutes | 51 | 1.3% |
Commute Time by Sex in Johnson County
The most common commute times in Johnson County are 30 to 34 minutes (592 commuters, 27.0%) for males and 30 to 34 minutes (467 commuters, 25.9%) for females.
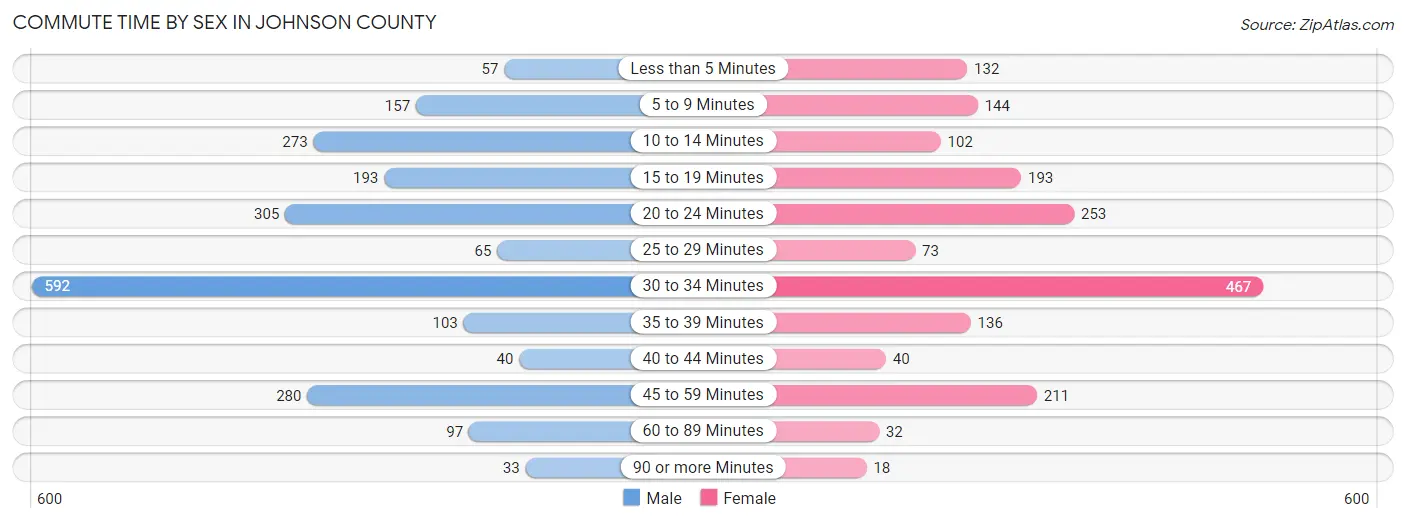
| Commute Time | Male | Female |
| Less than 5 Minutes | 57 (2.6%) | 132 (7.3%) |
| 5 to 9 Minutes | 157 (7.1%) | 144 (8.0%) |
| 10 to 14 Minutes | 273 (12.4%) | 102 (5.7%) |
| 15 to 19 Minutes | 193 (8.8%) | 193 (10.7%) |
| 20 to 24 Minutes | 305 (13.9%) | 253 (14.1%) |
| 25 to 29 Minutes | 65 (3.0%) | 73 (4.1%) |
| 30 to 34 Minutes | 592 (27.0%) | 467 (25.9%) |
| 35 to 39 Minutes | 103 (4.7%) | 136 (7.5%) |
| 40 to 44 Minutes | 40 (1.8%) | 40 (2.2%) |
| 45 to 59 Minutes | 280 (12.8%) | 211 (11.7%) |
| 60 to 89 Minutes | 97 (4.4%) | 32 (1.8%) |
| 90 or more Minutes | 33 (1.5%) | 18 (1.0%) |
Time of Departure to Work by Sex in Johnson County
The most frequent times of departure to work in Johnson County are 8:00 AM to 8:29 AM (324, 14.8%) for males and 7:30 AM to 7:59 AM (393, 21.8%) for females.
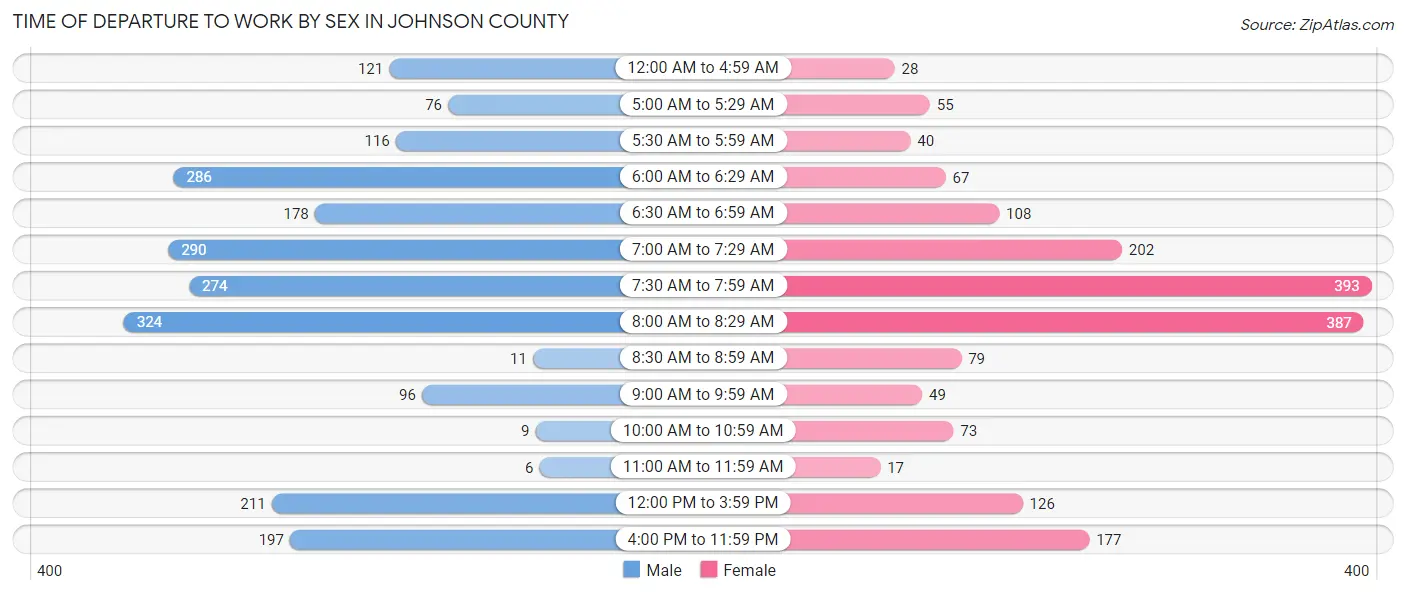
| Time of Departure | Male | Female |
| 12:00 AM to 4:59 AM | 121 (5.5%) | 28 (1.5%) |
| 5:00 AM to 5:29 AM | 76 (3.5%) | 55 (3.0%) |
| 5:30 AM to 5:59 AM | 116 (5.3%) | 40 (2.2%) |
| 6:00 AM to 6:29 AM | 286 (13.0%) | 67 (3.7%) |
| 6:30 AM to 6:59 AM | 178 (8.1%) | 108 (6.0%) |
| 7:00 AM to 7:29 AM | 290 (13.2%) | 202 (11.2%) |
| 7:30 AM to 7:59 AM | 274 (12.5%) | 393 (21.8%) |
| 8:00 AM to 8:29 AM | 324 (14.8%) | 387 (21.5%) |
| 8:30 AM to 8:59 AM | 11 (0.5%) | 79 (4.4%) |
| 9:00 AM to 9:59 AM | 96 (4.4%) | 49 (2.7%) |
| 10:00 AM to 10:59 AM | 9 (0.4%) | 73 (4.1%) |
| 11:00 AM to 11:59 AM | 6 (0.3%) | 17 (0.9%) |
| 12:00 PM to 3:59 PM | 211 (9.6%) | 126 (7.0%) |
| 4:00 PM to 11:59 PM | 197 (9.0%) | 177 (9.8%) |
| Total | 2,195 (100.0%) | 1,801 (100.0%) |
Housing Occupancy in Johnson County
Occupancy by Ownership in Johnson County
Of the total 4,106 dwellings in Johnson County, owner-occupied units account for 3,501 (85.3%), while renter-occupied units make up 605 (14.7%).
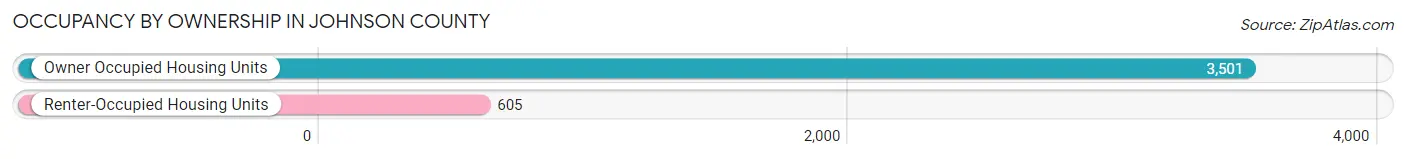
| Occupancy | # Housing Units | % Housing Units |
| Owner Occupied Housing Units | 3,501 | 85.3% |
| Renter-Occupied Housing Units | 605 | 14.7% |
| Total Occupied Housing Units | 4,106 | 100.0% |
Occupancy by Household Size in Johnson County
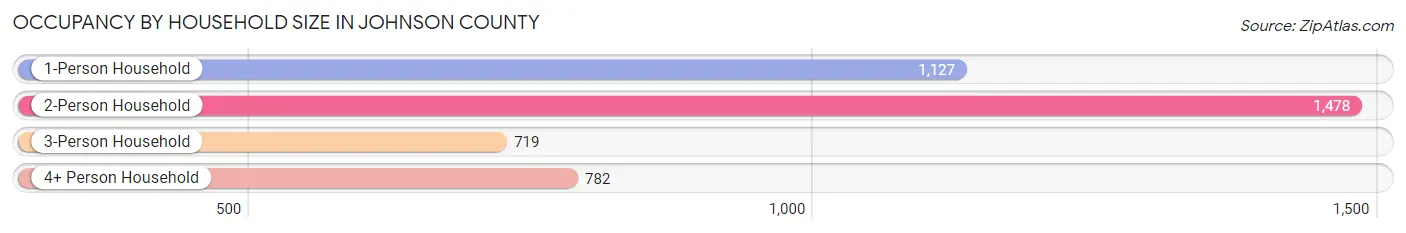
| Household Size | # Housing Units | % Housing Units |
| 1-Person Household | 1,127 | 27.5% |
| 2-Person Household | 1,478 | 36.0% |
| 3-Person Household | 719 | 17.5% |
| 4+ Person Household | 782 | 19.1% |
| Total Housing Units | 4,106 | 100.0% |
Occupancy by Ownership by Household Size in Johnson County
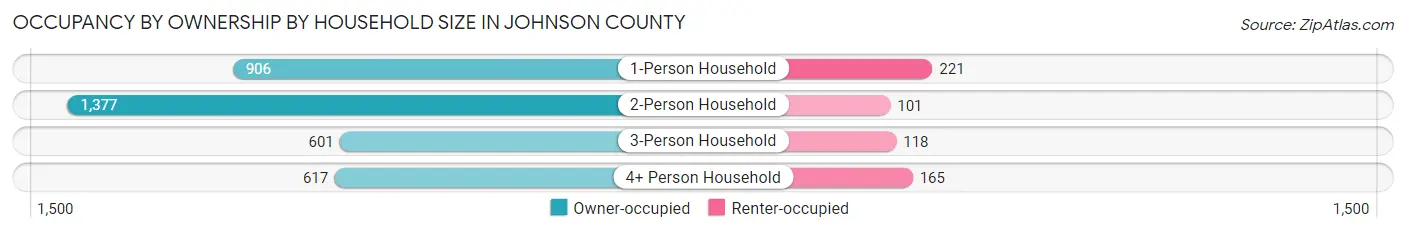
| Household Size | Owner-occupied | Renter-occupied |
| 1-Person Household | 906 (80.4%) | 221 (19.6%) |
| 2-Person Household | 1,377 (93.2%) | 101 (6.8%) |
| 3-Person Household | 601 (83.6%) | 118 (16.4%) |
| 4+ Person Household | 617 (78.9%) | 165 (21.1%) |
| Total Housing Units | 3,501 (85.3%) | 605 (14.7%) |
Occupancy by Educational Attainment in Johnson County
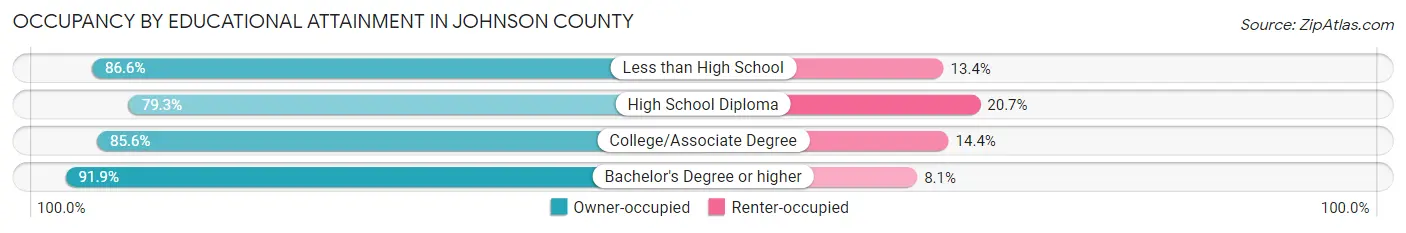
| Household Size | Owner-occupied | Renter-occupied |
| Less than High School | 233 (86.6%) | 36 (13.4%) |
| High School Diploma | 937 (79.3%) | 244 (20.7%) |
| College/Associate Degree | 1,496 (85.6%) | 251 (14.4%) |
| Bachelor's Degree or higher | 835 (91.9%) | 74 (8.1%) |
Occupancy by Age of Householder in Johnson County
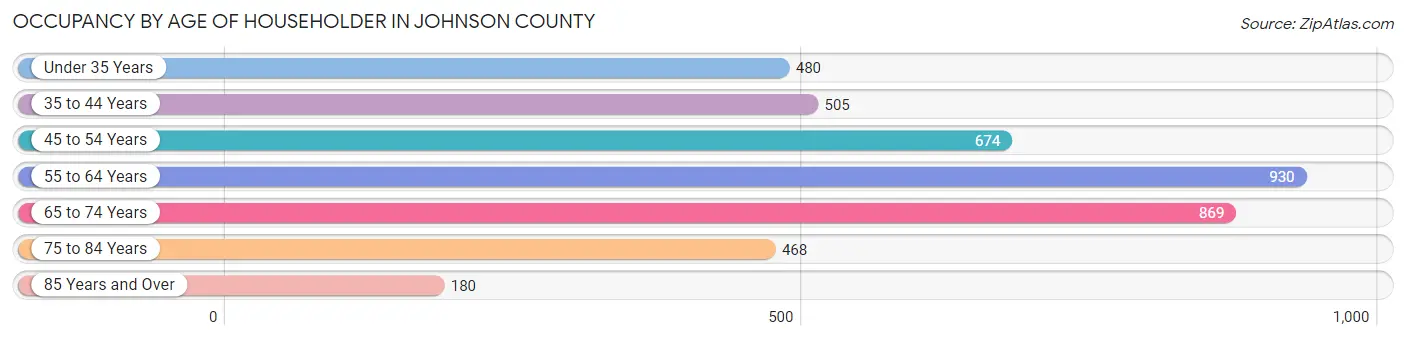
| Age Bracket | # Households | % Households |
| Under 35 Years | 480 | 11.7% |
| 35 to 44 Years | 505 | 12.3% |
| 45 to 54 Years | 674 | 16.4% |
| 55 to 64 Years | 930 | 22.7% |
| 65 to 74 Years | 869 | 21.2% |
| 75 to 84 Years | 468 | 11.4% |
| 85 Years and Over | 180 | 4.4% |
| Total | 4,106 | 100.0% |
Housing Finances in Johnson County
Median Income by Occupancy in Johnson County
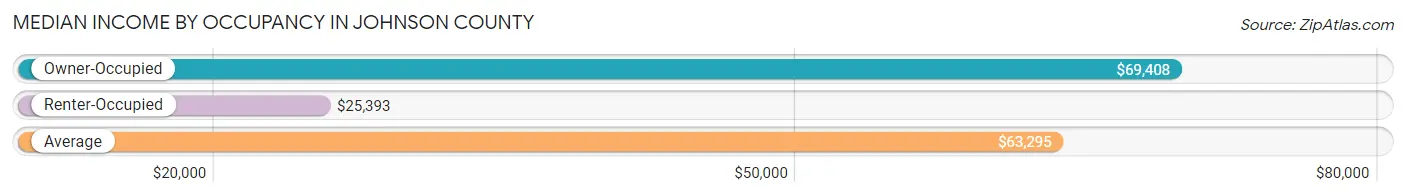
| Occupancy Type | # Households | Median Income |
| Owner-Occupied | 3,501 (85.3%) | $69,408 |
| Renter-Occupied | 605 (14.7%) | $25,393 |
| Average | 4,106 (100.0%) | $63,295 |
Occupancy by Householder Income Bracket in Johnson County
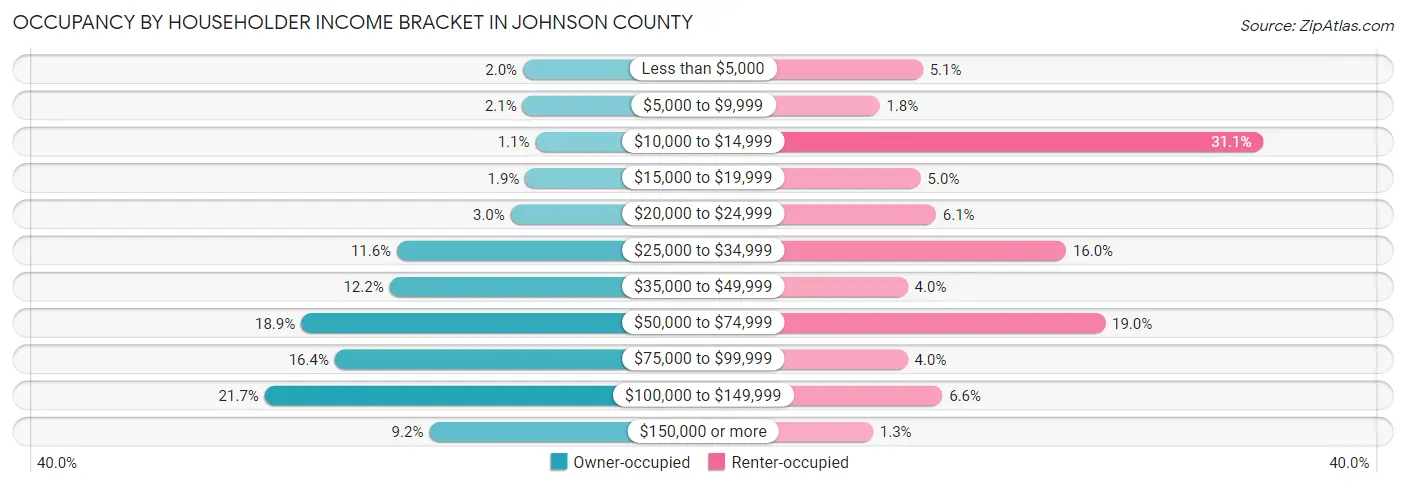
| Income Bracket | Owner-occupied | Renter-occupied |
| Less than $5,000 | 71 (2.0%) | 31 (5.1%) |
| $5,000 to $9,999 | 72 (2.1%) | 11 (1.8%) |
| $10,000 to $14,999 | 38 (1.1%) | 188 (31.1%) |
| $15,000 to $19,999 | 65 (1.9%) | 30 (5.0%) |
| $20,000 to $24,999 | 104 (3.0%) | 37 (6.1%) |
| $25,000 to $34,999 | 407 (11.6%) | 97 (16.0%) |
| $35,000 to $49,999 | 427 (12.2%) | 24 (4.0%) |
| $50,000 to $74,999 | 663 (18.9%) | 115 (19.0%) |
| $75,000 to $99,999 | 573 (16.4%) | 24 (4.0%) |
| $100,000 to $149,999 | 760 (21.7%) | 40 (6.6%) |
| $150,000 or more | 321 (9.2%) | 8 (1.3%) |
| Total | 3,501 (100.0%) | 605 (100.0%) |
Monthly Housing Cost Tiers in Johnson County
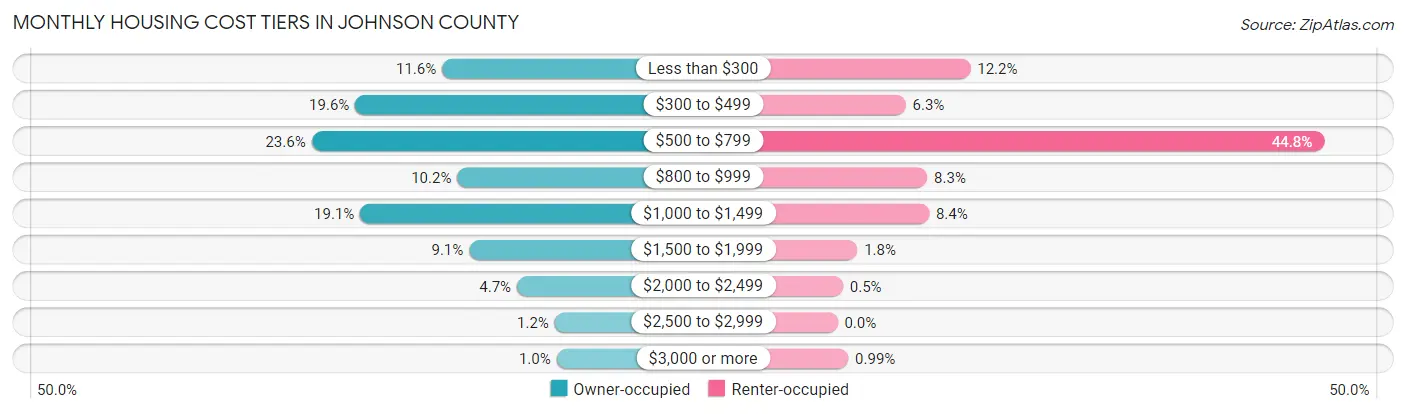
| Monthly Cost | Owner-occupied | Renter-occupied |
| Less than $300 | 405 (11.6%) | 74 (12.2%) |
| $300 to $499 | 685 (19.6%) | 38 (6.3%) |
| $500 to $799 | 826 (23.6%) | 271 (44.8%) |
| $800 to $999 | 356 (10.2%) | 50 (8.3%) |
| $1,000 to $1,499 | 669 (19.1%) | 51 (8.4%) |
| $1,500 to $1,999 | 318 (9.1%) | 11 (1.8%) |
| $2,000 to $2,499 | 164 (4.7%) | 3 (0.5%) |
| $2,500 to $2,999 | 42 (1.2%) | 0 (0.0%) |
| $3,000 or more | 36 (1.0%) | 6 (1.0%) |
| Total | 3,501 (100.0%) | 605 (100.0%) |
Physical Housing Characteristics in Johnson County
Housing Structures in Johnson County
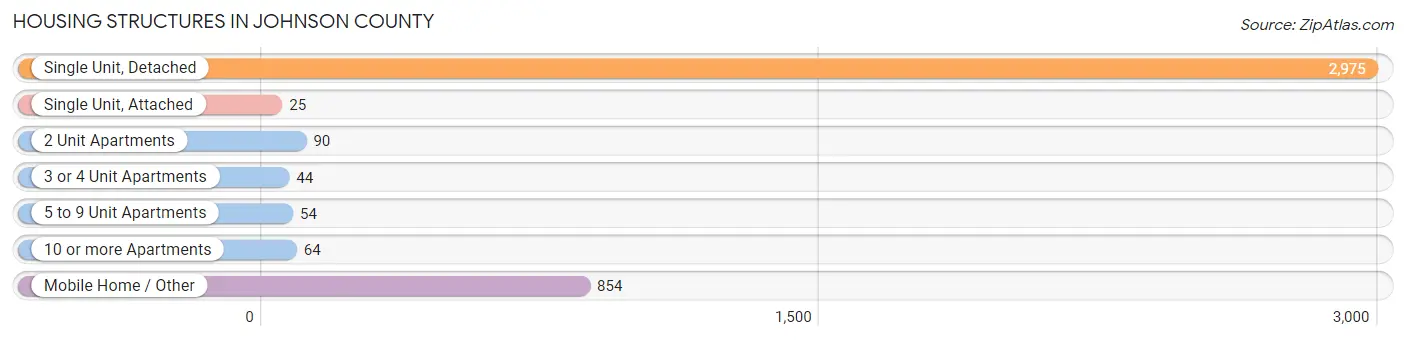
| Structure Type | # Housing Units | % Housing Units |
| Single Unit, Detached | 2,975 | 72.5% |
| Single Unit, Attached | 25 | 0.6% |
| 2 Unit Apartments | 90 | 2.2% |
| 3 or 4 Unit Apartments | 44 | 1.1% |
| 5 to 9 Unit Apartments | 54 | 1.3% |
| 10 or more Apartments | 64 | 1.6% |
| Mobile Home / Other | 854 | 20.8% |
| Total | 4,106 | 100.0% |
Housing Structures by Occupancy in Johnson County
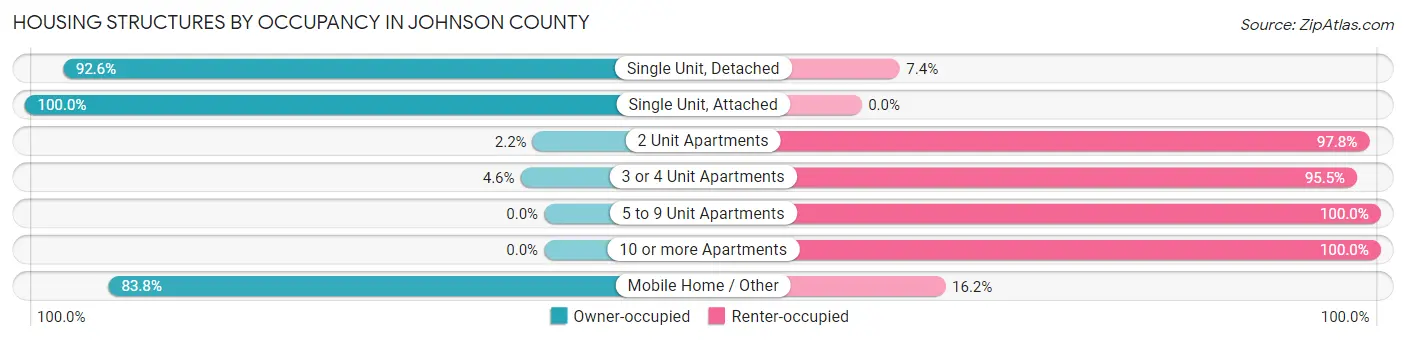
| Structure Type | Owner-occupied | Renter-occupied |
| Single Unit, Detached | 2,756 (92.6%) | 219 (7.4%) |
| Single Unit, Attached | 25 (100.0%) | 0 (0.0%) |
| 2 Unit Apartments | 2 (2.2%) | 88 (97.8%) |
| 3 or 4 Unit Apartments | 2 (4.5%) | 42 (95.5%) |
| 5 to 9 Unit Apartments | 0 (0.0%) | 54 (100.0%) |
| 10 or more Apartments | 0 (0.0%) | 64 (100.0%) |
| Mobile Home / Other | 716 (83.8%) | 138 (16.2%) |
| Total | 3,501 (85.3%) | 605 (14.7%) |
Housing Structures by Number of Rooms in Johnson County

| Number of Rooms | Owner-occupied | Renter-occupied |
| 1 Room | 9 (0.3%) | 40 (6.6%) |
| 2 or 3 Rooms | 57 (1.6%) | 71 (11.7%) |
| 4 or 5 Rooms | 1,200 (34.3%) | 360 (59.5%) |
| 6 or 7 Rooms | 1,498 (42.8%) | 111 (18.3%) |
| 8 or more Rooms | 737 (21.0%) | 23 (3.8%) |
| Total | 3,501 (100.0%) | 605 (100.0%) |
Housing Structure by Heating Type in Johnson County

| Heating Type | Owner-occupied | Renter-occupied |
| Utility Gas | 669 (19.1%) | 136 (22.5%) |
| Bottled, Tank, or LP Gas | 676 (19.3%) | 98 (16.2%) |
| Electricity | 1,975 (56.4%) | 354 (58.5%) |
| Fuel Oil or Kerosene | 0 (0.0%) | 0 (0.0%) |
| Coal or Coke | 0 (0.0%) | 0 (0.0%) |
| All other Fuels | 166 (4.7%) | 12 (2.0%) |
| No Fuel Used | 15 (0.4%) | 5 (0.8%) |
| Total | 3,501 (100.0%) | 605 (100.0%) |
Household Vehicle Usage in Johnson County
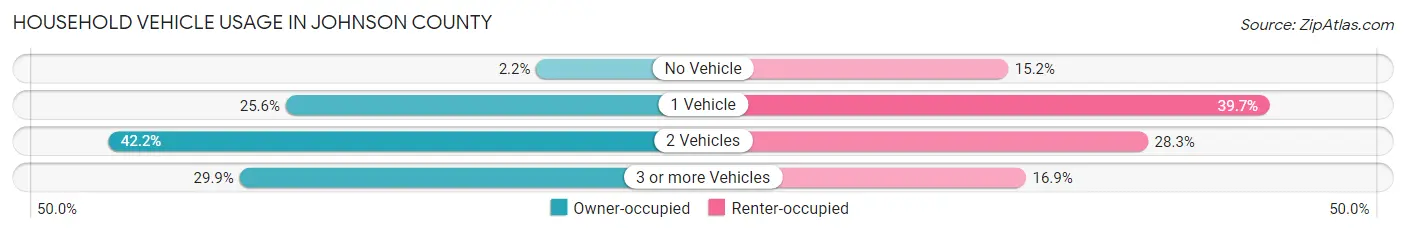
| Vehicles per Household | Owner-occupied | Renter-occupied |
| No Vehicle | 78 (2.2%) | 92 (15.2%) |
| 1 Vehicle | 897 (25.6%) | 240 (39.7%) |
| 2 Vehicles | 1,478 (42.2%) | 171 (28.3%) |
| 3 or more Vehicles | 1,048 (29.9%) | 102 (16.9%) |
| Total | 3,501 (100.0%) | 605 (100.0%) |
Real Estate & Mortgages in Johnson County
Real Estate and Mortgage Overview in Johnson County
| Characteristic | Without Mortgage | With Mortgage |
| Housing Units | 1,989 | 1,512 |
| Median Property Value | $120,300 | $158,700 |
| Median Household Income | $57,825 | $190 |
| Monthly Housing Costs | $484 | $34 |
| Real Estate Taxes | $1,606 | $107 |
Property Value by Mortgage Status in Johnson County
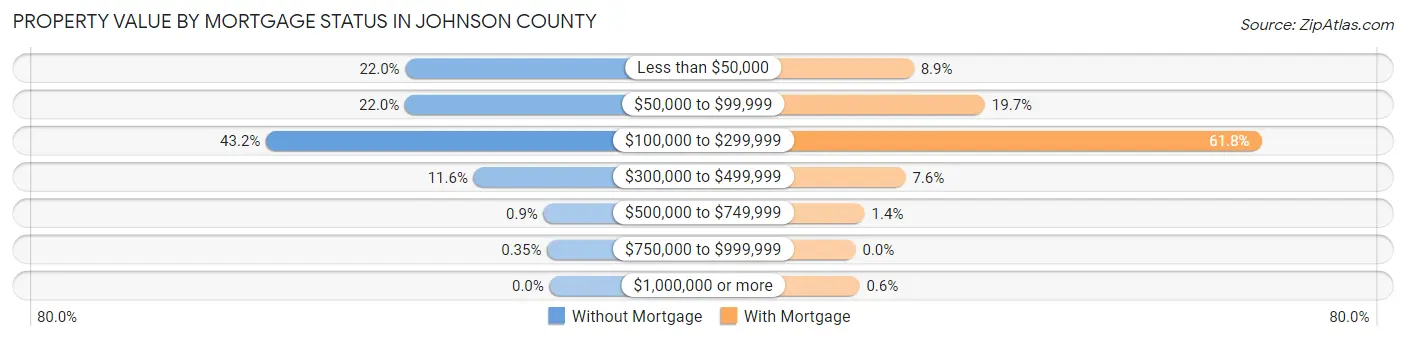
| Property Value | Without Mortgage | With Mortgage |
| Less than $50,000 | 437 (22.0%) | 134 (8.9%) |
| $50,000 to $99,999 | 438 (22.0%) | 298 (19.7%) |
| $100,000 to $299,999 | 859 (43.2%) | 935 (61.8%) |
| $300,000 to $499,999 | 230 (11.6%) | 115 (7.6%) |
| $500,000 to $749,999 | 18 (0.9%) | 21 (1.4%) |
| $750,000 to $999,999 | 7 (0.4%) | 0 (0.0%) |
| $1,000,000 or more | 0 (0.0%) | 9 (0.6%) |
| Total | 1,989 (100.0%) | 1,512 (100.0%) |
Household Income by Mortgage Status in Johnson County
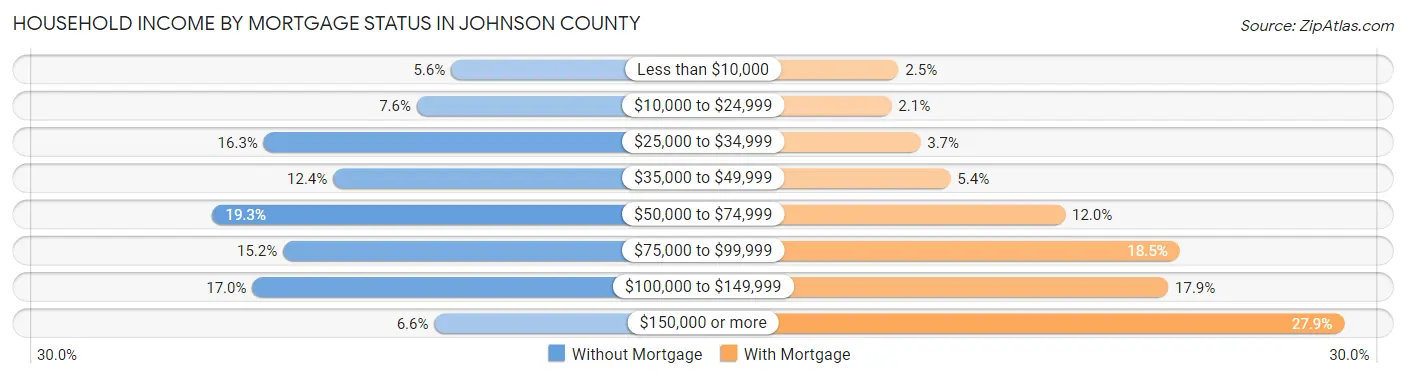
| Household Income | Without Mortgage | With Mortgage |
| Less than $10,000 | 112 (5.6%) | 37 (2.5%) |
| $10,000 to $24,999 | 151 (7.6%) | 31 (2.1%) |
| $25,000 to $34,999 | 325 (16.3%) | 56 (3.7%) |
| $35,000 to $49,999 | 246 (12.4%) | 82 (5.4%) |
| $50,000 to $74,999 | 383 (19.3%) | 181 (12.0%) |
| $75,000 to $99,999 | 303 (15.2%) | 280 (18.5%) |
| $100,000 to $149,999 | 338 (17.0%) | 270 (17.9%) |
| $150,000 or more | 131 (6.6%) | 422 (27.9%) |
| Total | 1,989 (100.0%) | 1,512 (100.0%) |
Property Value to Household Income Ratio in Johnson County
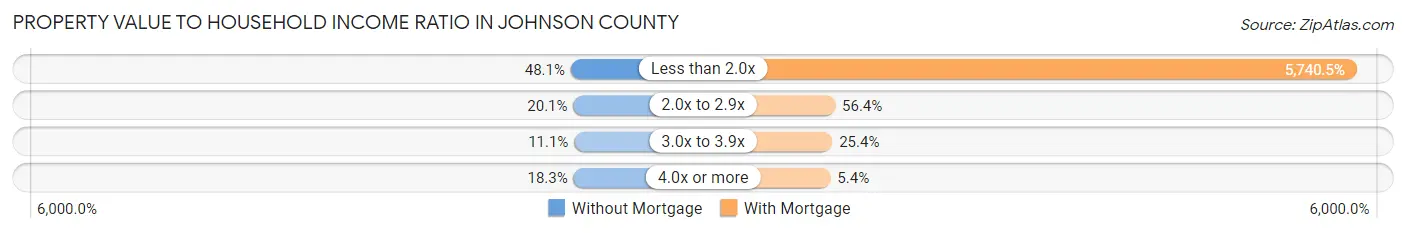
| Value-to-Income Ratio | Without Mortgage | With Mortgage |
| Less than 2.0x | 957 (48.1%) | 86,797 (5,740.5%) |
| 2.0x to 2.9x | 400 (20.1%) | 853 (56.4%) |
| 3.0x to 3.9x | 221 (11.1%) | 384 (25.4%) |
| 4.0x or more | 363 (18.2%) | 81 (5.4%) |
| Total | 1,989 (100.0%) | 1,512 (100.0%) |
Real Estate Taxes by Mortgage Status in Johnson County
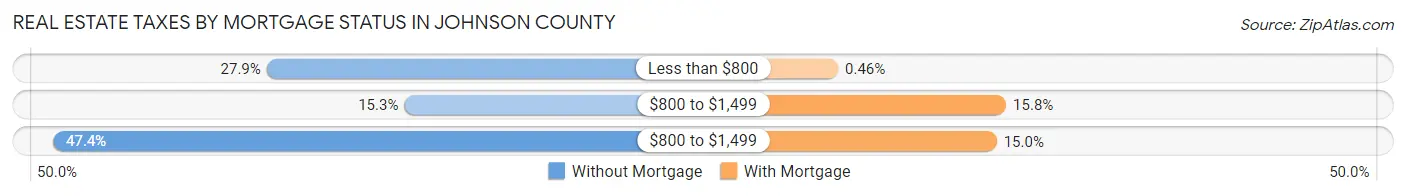
| Property Taxes | Without Mortgage | With Mortgage |
| Less than $800 | 555 (27.9%) | 7 (0.5%) |
| $800 to $1,499 | 305 (15.3%) | 239 (15.8%) |
| $800 to $1,499 | 943 (47.4%) | 226 (14.9%) |
| Total | 1,989 (100.0%) | 1,512 (100.0%) |
Health & Disability in Johnson County
Health Insurance Coverage by Age in Johnson County
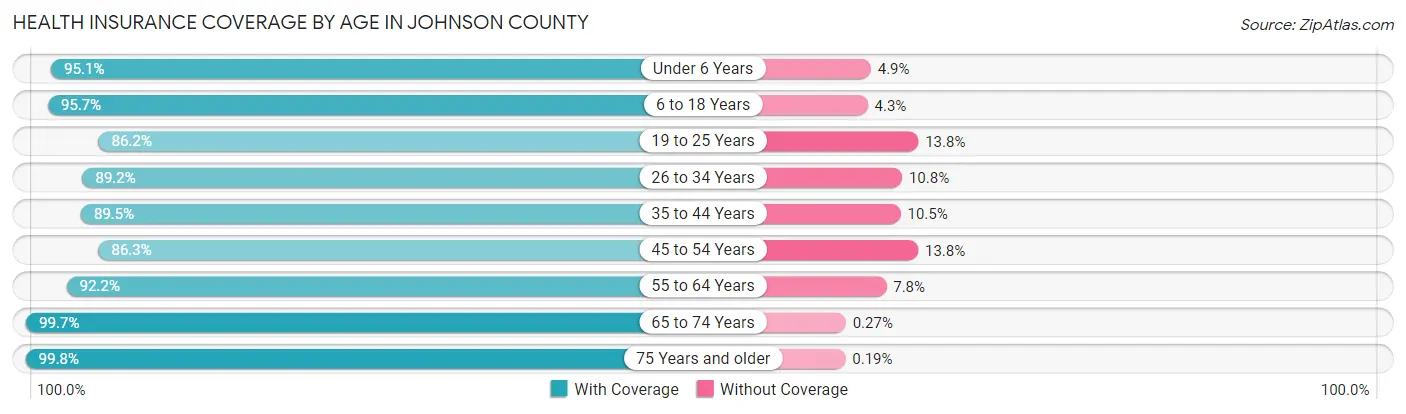
| Age Bracket | With Coverage | Without Coverage |
| Under 6 Years | 693 (95.1%) | 36 (4.9%) |
| 6 to 18 Years | 1,985 (95.7%) | 90 (4.3%) |
| 19 to 25 Years | 788 (86.2%) | 126 (13.8%) |
| 26 to 34 Years | 962 (89.2%) | 116 (10.8%) |
| 35 to 44 Years | 1,058 (89.5%) | 124 (10.5%) |
| 45 to 54 Years | 1,123 (86.3%) | 179 (13.8%) |
| 55 to 64 Years | 1,495 (92.2%) | 127 (7.8%) |
| 65 to 74 Years | 1,451 (99.7%) | 4 (0.3%) |
| 75 Years and older | 1,068 (99.8%) | 2 (0.2%) |
| Total | 10,623 (93.0%) | 804 (7.0%) |
Health Insurance Coverage by Citizenship Status in Johnson County
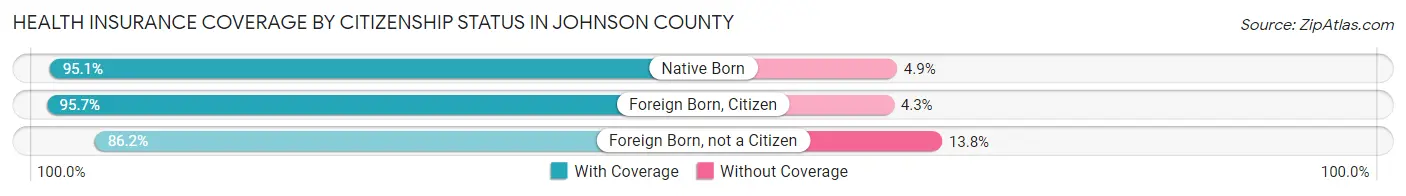
| Citizenship Status | With Coverage | Without Coverage |
| Native Born | 693 (95.1%) | 36 (4.9%) |
| Foreign Born, Citizen | 1,985 (95.7%) | 90 (4.3%) |
| Foreign Born, not a Citizen | 788 (86.2%) | 126 (13.8%) |
Health Insurance Coverage by Household Income in Johnson County
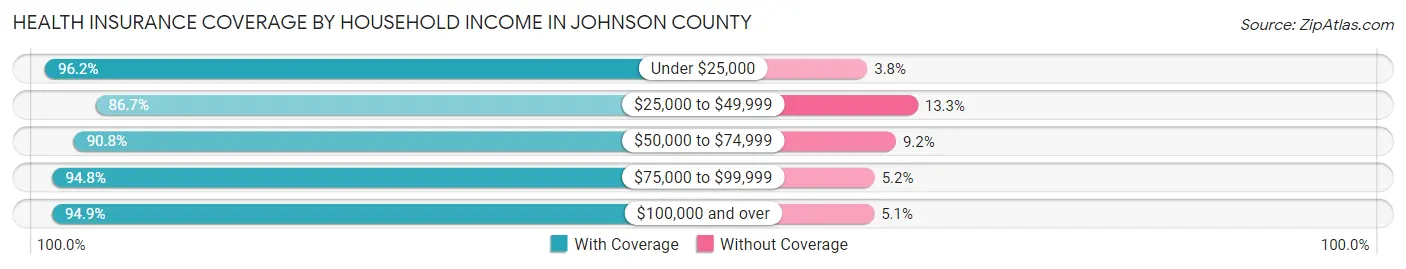
| Household Income | With Coverage | Without Coverage |
| Under $25,000 | 1,554 (96.2%) | 62 (3.8%) |
| $25,000 to $49,999 | 1,617 (86.7%) | 248 (13.3%) |
| $50,000 to $74,999 | 1,882 (90.8%) | 191 (9.2%) |
| $75,000 to $99,999 | 1,520 (94.8%) | 84 (5.2%) |
| $100,000 and over | 4,040 (94.9%) | 219 (5.1%) |
Public vs Private Health Insurance Coverage by Age in Johnson County
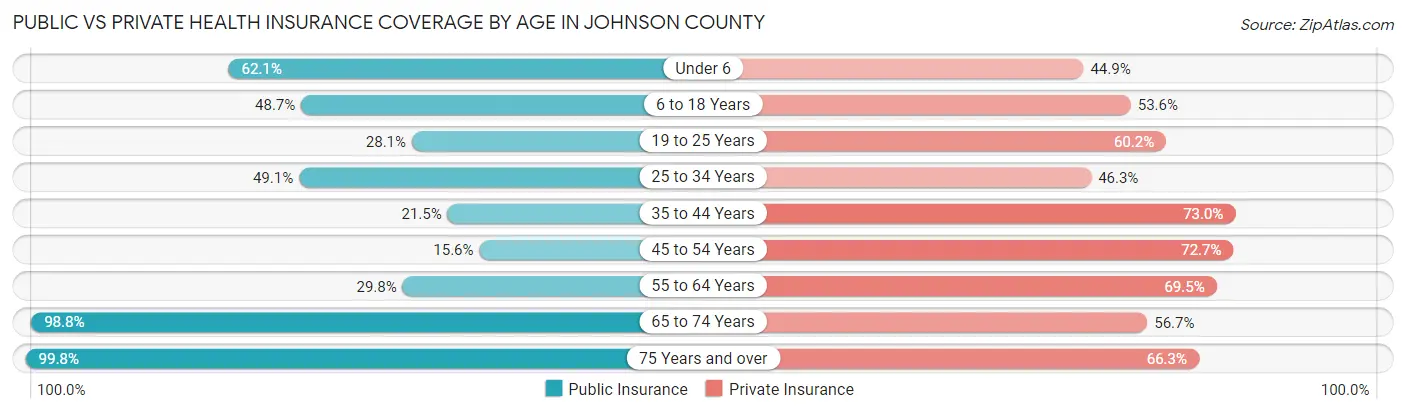
| Age Bracket | Public Insurance | Private Insurance |
| Under 6 | 453 (62.1%) | 327 (44.9%) |
| 6 to 18 Years | 1,010 (48.7%) | 1,113 (53.6%) |
| 19 to 25 Years | 257 (28.1%) | 550 (60.2%) |
| 25 to 34 Years | 529 (49.1%) | 499 (46.3%) |
| 35 to 44 Years | 254 (21.5%) | 863 (73.0%) |
| 45 to 54 Years | 203 (15.6%) | 946 (72.7%) |
| 55 to 64 Years | 484 (29.8%) | 1,128 (69.5%) |
| 65 to 74 Years | 1,437 (98.8%) | 825 (56.7%) |
| 75 Years and over | 1,068 (99.8%) | 709 (66.3%) |
| Total | 5,695 (49.8%) | 6,960 (60.9%) |
Disability Status by Sex by Age in Johnson County
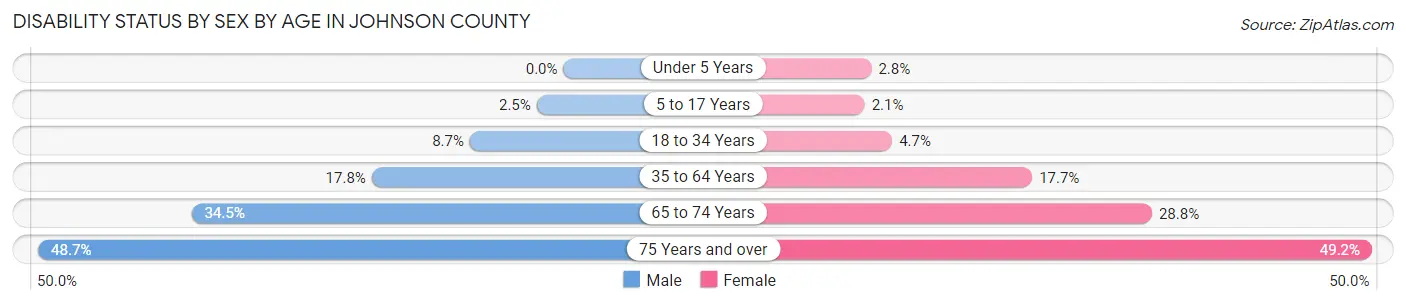
| Age Bracket | Male | Female |
| Under 5 Years | 0 (0.0%) | 8 (2.8%) |
| 5 to 17 Years | 30 (2.5%) | 20 (2.1%) |
| 18 to 34 Years | 102 (8.7%) | 43 (4.7%) |
| 35 to 64 Years | 363 (17.8%) | 365 (17.7%) |
| 65 to 74 Years | 254 (34.5%) | 207 (28.8%) |
| 75 Years and over | 251 (48.7%) | 273 (49.2%) |
Disability Class by Sex by Age in Johnson County
Disability Class: Hearing Difficulty
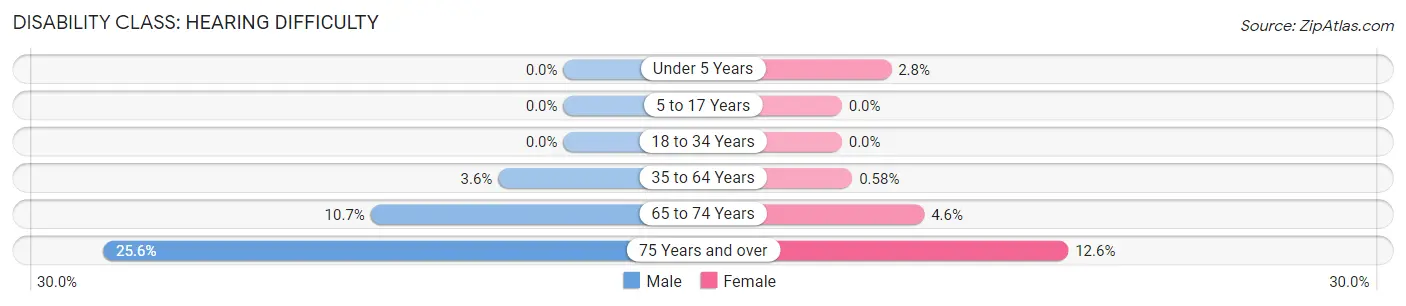
| Age Bracket | Male | Female |
| Under 5 Years | 0 (0.0%) | 8 (2.8%) |
| 5 to 17 Years | 0 (0.0%) | 0 (0.0%) |
| 18 to 34 Years | 0 (0.0%) | 0 (0.0%) |
| 35 to 64 Years | 74 (3.6%) | 12 (0.6%) |
| 65 to 74 Years | 79 (10.7%) | 33 (4.6%) |
| 75 Years and over | 132 (25.6%) | 70 (12.6%) |
Disability Class: Vision Difficulty
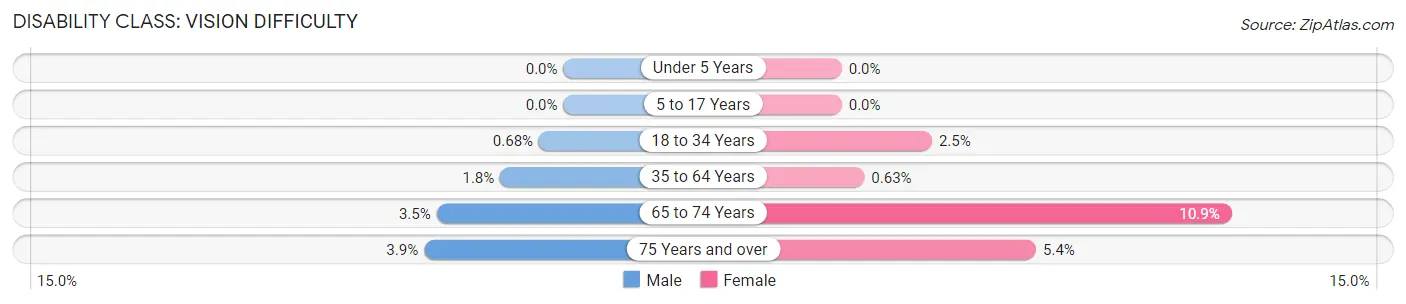
| Age Bracket | Male | Female |
| Under 5 Years | 0 (0.0%) | 0 (0.0%) |
| 5 to 17 Years | 0 (0.0%) | 0 (0.0%) |
| 18 to 34 Years | 8 (0.7%) | 23 (2.5%) |
| 35 to 64 Years | 36 (1.8%) | 13 (0.6%) |
| 65 to 74 Years | 26 (3.5%) | 78 (10.8%) |
| 75 Years and over | 20 (3.9%) | 30 (5.4%) |
Disability Class: Cognitive Difficulty
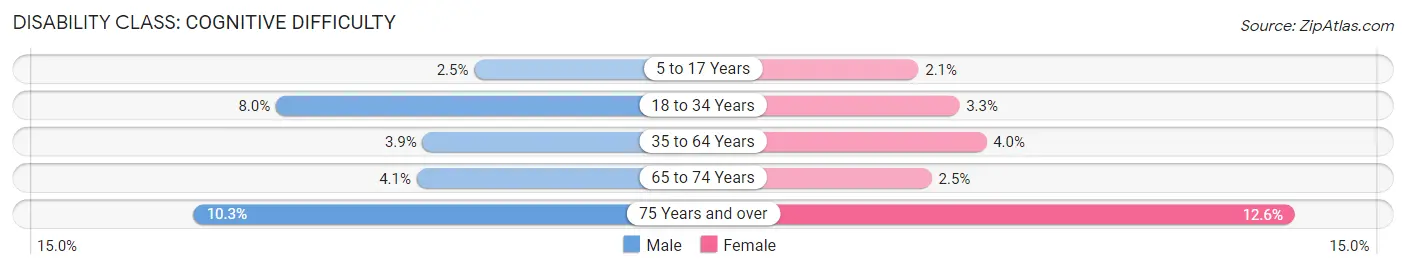
| Age Bracket | Male | Female |
| 5 to 17 Years | 30 (2.5%) | 20 (2.1%) |
| 18 to 34 Years | 94 (8.0%) | 30 (3.3%) |
| 35 to 64 Years | 80 (3.9%) | 83 (4.0%) |
| 65 to 74 Years | 30 (4.1%) | 18 (2.5%) |
| 75 Years and over | 53 (10.3%) | 70 (12.6%) |
Disability Class: Ambulatory Difficulty
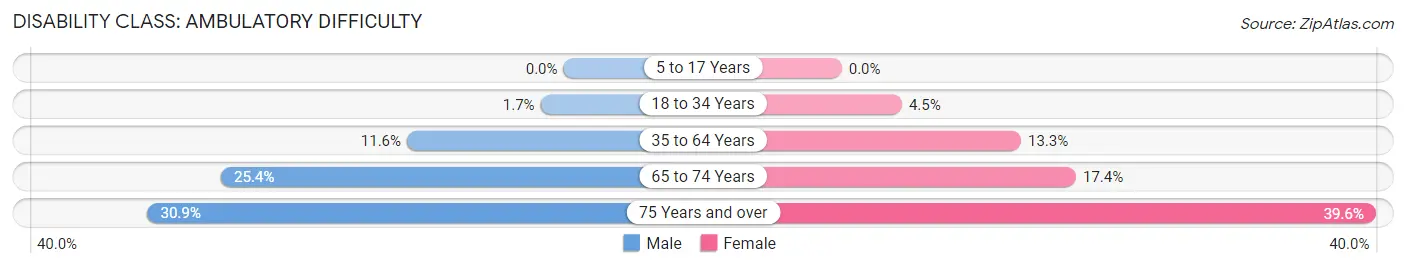
| Age Bracket | Male | Female |
| 5 to 17 Years | 0 (0.0%) | 0 (0.0%) |
| 18 to 34 Years | 20 (1.7%) | 41 (4.5%) |
| 35 to 64 Years | 237 (11.6%) | 275 (13.3%) |
| 65 to 74 Years | 187 (25.4%) | 125 (17.4%) |
| 75 Years and over | 159 (30.9%) | 220 (39.6%) |
Disability Class: Self-Care Difficulty
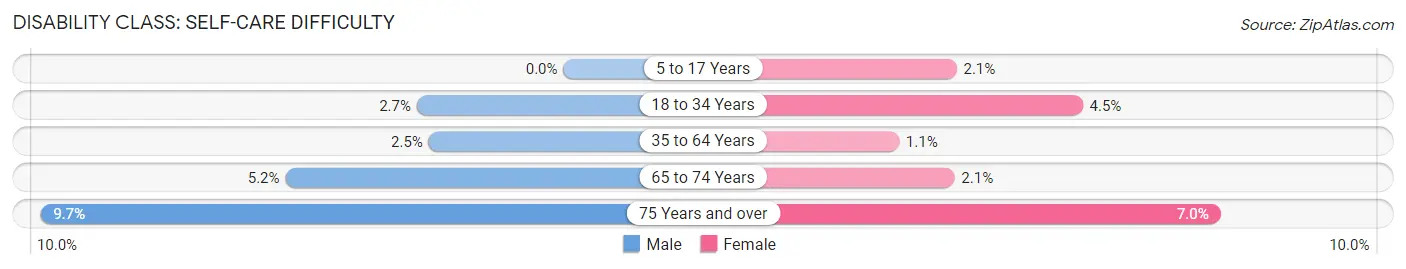
| Age Bracket | Male | Female |
| 5 to 17 Years | 0 (0.0%) | 20 (2.1%) |
| 18 to 34 Years | 32 (2.7%) | 41 (4.5%) |
| 35 to 64 Years | 51 (2.5%) | 22 (1.1%) |
| 65 to 74 Years | 38 (5.2%) | 15 (2.1%) |
| 75 Years and over | 50 (9.7%) | 39 (7.0%) |
Technology Access in Johnson County
Computing Device Access in Johnson County

| Device Type | # Households | % Households |
| Desktop or Laptop | 2,279 | 55.5% |
| Smartphone | 3,190 | 77.7% |
| Tablet | 1,778 | 43.3% |
| No Computing Device | 612 | 14.9% |
| Total | 4,106 | 100.0% |
Internet Access in Johnson County
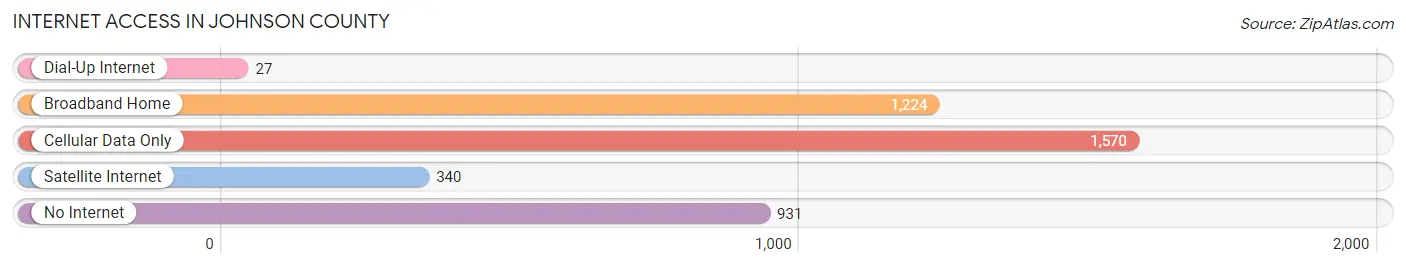
| Internet Type | # Households | % Households |
| Dial-Up Internet | 27 | 0.7% |
| Broadband Home | 1,224 | 29.8% |
| Cellular Data Only | 1,570 | 38.2% |
| Satellite Internet | 340 | 8.3% |
| No Internet | 931 | 22.7% |
| Total | 4,106 | 100.0% |
Johnson County Summary
Johnson County, Illinois is located in the southeastern corner of the state, and is bordered by the states of Kentucky and Indiana. It is part of the Metro East region of Illinois, and is the second-smallest county in the state. The county seat is Vienna, and the county is named after Richard Mentor Johnson, the ninth Vice President of the United States.
Geography
Johnson County is located in the southeastern corner of Illinois, and is bordered by the states of Kentucky and Indiana. It is part of the Metro East region of Illinois, and is the second-smallest county in the state. The county has a total area of 246 square miles, of which 241 square miles is land and 5 square miles is water. The county is mostly flat, with some rolling hills in the northern and western parts. The highest point in the county is located in the northwest corner, at an elevation of 830 feet. The county is drained by the Big Muddy River, which flows through the county from north to south.
The county is home to several state parks and wildlife areas, including the Shawnee National Forest, the Crab Orchard National Wildlife Refuge, and the Cache River State Natural Area. The county also contains several small lakes, including Lake of Egypt, Lake Glendale, and Lake Murphysboro.
Demographics
As of the 2010 census, Johnson County had a population of 12,582. The racial makeup of the county was 95.2% White, 1.7% African American, 0.3% Native American, 0.3% Asian, 0.1% Pacific Islander, 1.2% from other races, and 1.3% from two or more races. Hispanic or Latino of any race were 3.2% of the population.
The median income for a household in the county was $37,917, and the median income for a family was $45,938. The per capita income for the county was $18,845. About 13.2% of families and 17.2% of the population were below the poverty line, including 24.2% of those under age 18 and 11.2% of those age 65 or over.
Economy
Johnson County is largely rural, and the economy is largely based on agriculture. The county is home to several large farms, and the main crops grown in the county are corn, soybeans, and wheat. The county is also home to several small businesses, including restaurants, retail stores, and service providers.
The county is home to several large employers, including the Johnson County Hospital, the Johnson County Sheriff's Office, and the Johnson County School District. The county is also home to several small businesses, including restaurants, retail stores, and service providers.
History
Johnson County was formed in 1812 from parts of Pope and Gallatin counties. The county was named after Richard Mentor Johnson, the ninth Vice President of the United States. The county seat was originally located in Vienna, but was moved to Vienna in 1814.
The county was largely rural throughout its history, and the economy was largely based on agriculture. The county was home to several large farms, and the main crops grown in the county were corn, soybeans, and wheat.
In the late 19th century, the county began to experience an influx of immigrants from Europe, particularly from Germany and Ireland. This influx of immigrants helped to diversify the county's economy, and many of the immigrants opened small businesses in the county.
In the early 20th century, the county began to experience an influx of African Americans from the South. This influx of African Americans helped to diversify the county's population, and many of the African Americans opened small businesses in the county.
In the late 20th century, the county began to experience an influx of Hispanic immigrants from Mexico and Central America. This influx of immigrants helped to diversify the county's population, and many of the immigrants opened small businesses in the county.
Today, Johnson County is a largely rural county, and the economy is still largely based on agriculture. The county is home to several large farms, and the main crops grown in the county are corn, soybeans, and wheat. The county is also home to several small businesses, including restaurants, retail stores, and service providers.
Common Questions
What is Per Capita Income in Johnson County?
Per Capita income in Johnson County is $27,096.
What is the Median Family Income in Johnson County?
Median Family Income in Johnson County is $77,027.
What is the Median Household income in Johnson County?
Median Household Income in Johnson County is $63,295.
What is Income or Wage Gap in Johnson County?
Income or Wage Gap in Johnson County is 28.9%.
Women in Johnson County earn 71.1 cents for every dollar earned by a man.
What is Family Income Deficit in Johnson County?
Family Income Deficit in Johnson County is $11,686.
Families that are below poverty line in Johnson County earn $11,686 less on average than the poverty threshold level.
What is Inequality or Gini Index in Johnson County?
Inequality or Gini Index in Johnson County is 0.43.
What is the Total Population of Johnson County?
Total Population of Johnson County is 13,313.
What is the Total Male Population of Johnson County?
Total Male Population of Johnson County is 7,779.
What is the Total Female Population of Johnson County?
Total Female Population of Johnson County is 5,534.
What is the Ratio of Males per 100 Females in Johnson County?
There are 140.57 Males per 100 Females in Johnson County.
What is the Ratio of Females per 100 Males in Johnson County?
There are 71.14 Females per 100 Males in Johnson County.
What is the Median Population Age in Johnson County?
Median Population Age in Johnson County is 42.3 Years.
What is the Average Family Size in Johnson County
Average Family Size in Johnson County is 3.4 People.
What is the Average Household Size in Johnson County
Average Household Size in Johnson County is 2.8 People.
How Large is the Labor Force in Johnson County?
There are 4,496 People in the Labor Forcein in Johnson County.
What is the Percentage of People in the Labor Force in Johnson County?
41.3% of People are in the Labor Force in Johnson County.
What is the Unemployment Rate in Johnson County?
Unemployment Rate in Johnson County is 2.9%.