Hardin County, IL Map & Demographics
Hardin County Map
Hardin County Overview
$31,928
PER CAPITA INCOME
$65,778
AVG FAMILY INCOME
$53,026
AVG HOUSEHOLD INCOME
32.1%
WAGE / INCOME GAP [ % ]
67.9¢/ $1
WAGE / INCOME GAP [ $ ]
$12,862
FAMILY INCOME DEFICIT
0.47
INEQUALITY / GINI INDEX
3,665
TOTAL POPULATION
1,846
MALE POPULATION
1,819
FEMALE POPULATION
101.48
MALES / 100 FEMALES
98.54
FEMALES / 100 MALES
53.9
MEDIAN AGE
3.1
AVG FAMILY SIZE
2.4
AVG HOUSEHOLD SIZE
1,265
LABOR FORCE [ PEOPLE ]
39.2%
PERCENT IN LABOR FORCE
2.6%
UNEMPLOYMENT RATE
Hardin County Area Codes
Income in Hardin County
Income Overview in Hardin County
Per Capita Income in Hardin County is $31,928, while median incomes of families and households are $65,778 and $53,026 respectively.
| Characteristic | Number | Measure |
| Per Capita Income | 3,665 | $31,928 |
| Median Family Income | 927 | $65,778 |
| Mean Family Income | 927 | $89,436 |
| Median Household Income | 1,480 | $53,026 |
| Mean Household Income | 1,480 | $70,437 |
| Income Deficit | 927 | $12,862 |
| Wage / Income Gap (%) | 3,665 | 32.14% |
| Wage / Income Gap ($) | 3,665 | 67.86¢ per $1 |
| Gini / Inequality Index | 3,665 | 0.47 |
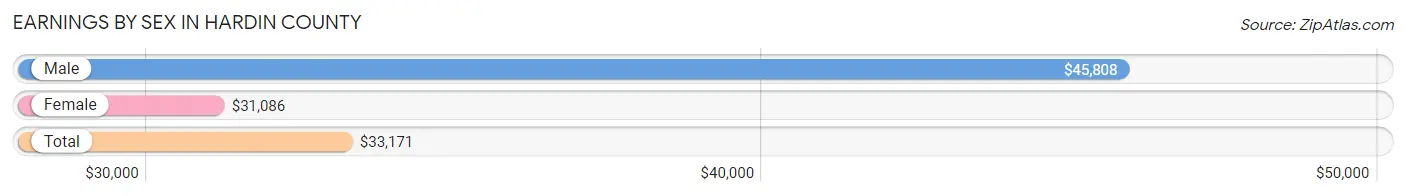
Earnings by Sex in Hardin County
Average Earnings in Hardin County are $33,171, $45,808 for men and $31,086 for women, a difference of 32.1%.
| Sex | Number | Average Earnings |
| Male | 652 (48.1%) | $45,808 |
| Female | 704 (51.9%) | $31,086 |
| Total | 1,356 (100.0%) | $33,171 |
Earnings by Sex by Income Bracket in Hardin County
The most common earnings brackets in Hardin County are $45,000 to $49,999 for men (95 | 14.6%) and $30,000 to $34,999 for women (114 | 16.2%).
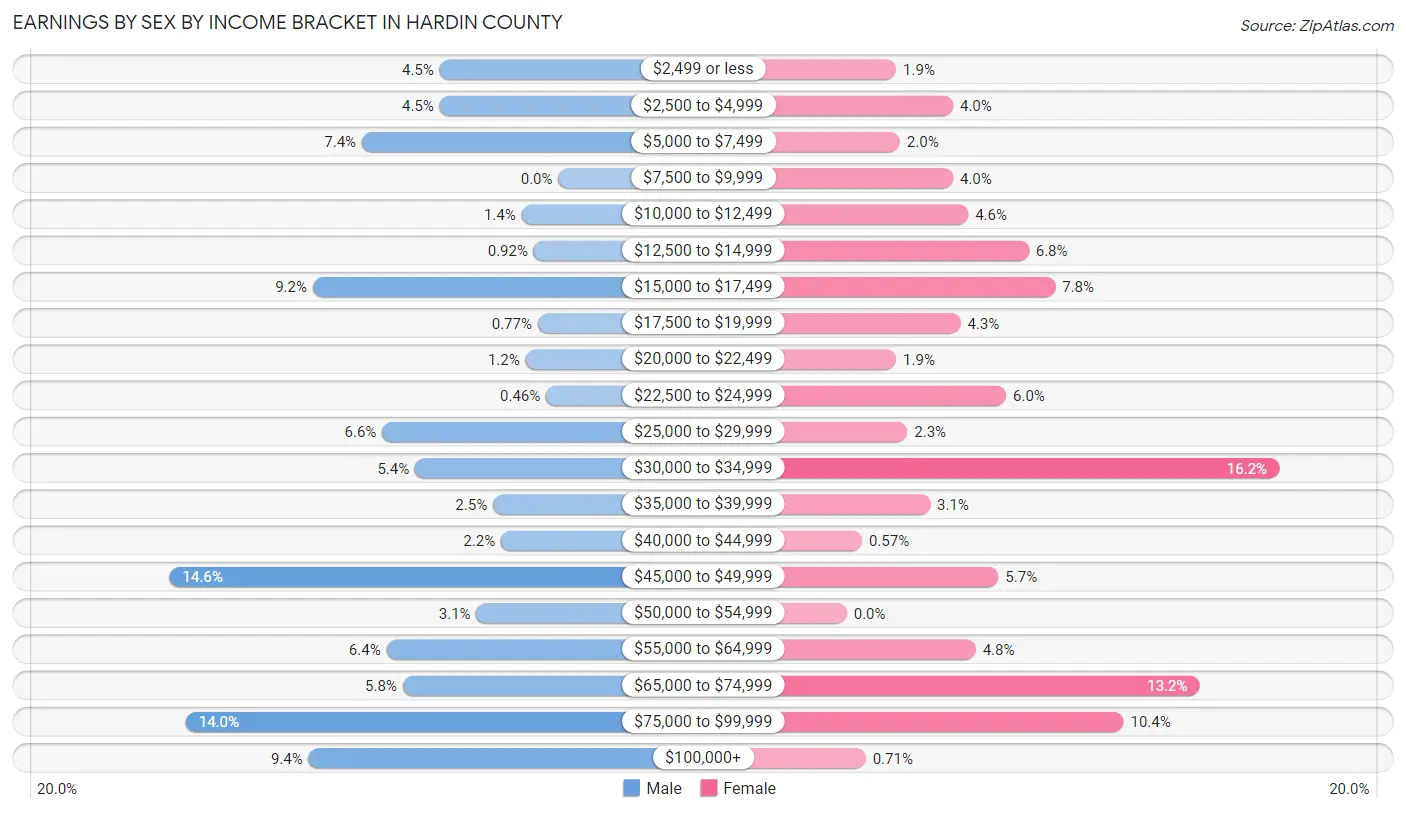
| Income | Male | Female |
| $2,499 or less | 29 (4.4%) | 13 (1.8%) |
| $2,500 to $4,999 | 29 (4.4%) | 28 (4.0%) |
| $5,000 to $7,499 | 48 (7.4%) | 14 (2.0%) |
| $7,500 to $9,999 | 0 (0.0%) | 28 (4.0%) |
| $10,000 to $12,499 | 9 (1.4%) | 32 (4.5%) |
| $12,500 to $14,999 | 6 (0.9%) | 48 (6.8%) |
| $15,000 to $17,499 | 60 (9.2%) | 55 (7.8%) |
| $17,500 to $19,999 | 5 (0.8%) | 30 (4.3%) |
| $20,000 to $22,499 | 8 (1.2%) | 13 (1.8%) |
| $22,500 to $24,999 | 3 (0.5%) | 42 (6.0%) |
| $25,000 to $29,999 | 43 (6.6%) | 16 (2.3%) |
| $30,000 to $34,999 | 35 (5.4%) | 114 (16.2%) |
| $35,000 to $39,999 | 16 (2.5%) | 22 (3.1%) |
| $40,000 to $44,999 | 14 (2.1%) | 4 (0.6%) |
| $45,000 to $49,999 | 95 (14.6%) | 40 (5.7%) |
| $50,000 to $54,999 | 20 (3.1%) | 0 (0.0%) |
| $55,000 to $64,999 | 42 (6.4%) | 34 (4.8%) |
| $65,000 to $74,999 | 38 (5.8%) | 93 (13.2%) |
| $75,000 to $99,999 | 91 (14.0%) | 73 (10.4%) |
| $100,000+ | 61 (9.4%) | 5 (0.7%) |
| Total | 652 (100.0%) | 704 (100.0%) |
Earnings by Sex by Educational Attainment in Hardin County
Average earnings in Hardin County are $48,333 for men and $31,579 for women, a difference of 34.7%. Men with an educational attainment of graduate degree enjoy the highest average annual earnings of $121,250, while those with high school diploma education earn the least with $45,324. Women with an educational attainment of college or associate's degree earn the most with the average annual earnings of $34,013, while those with high school diploma education have the smallest earnings of $30,575.
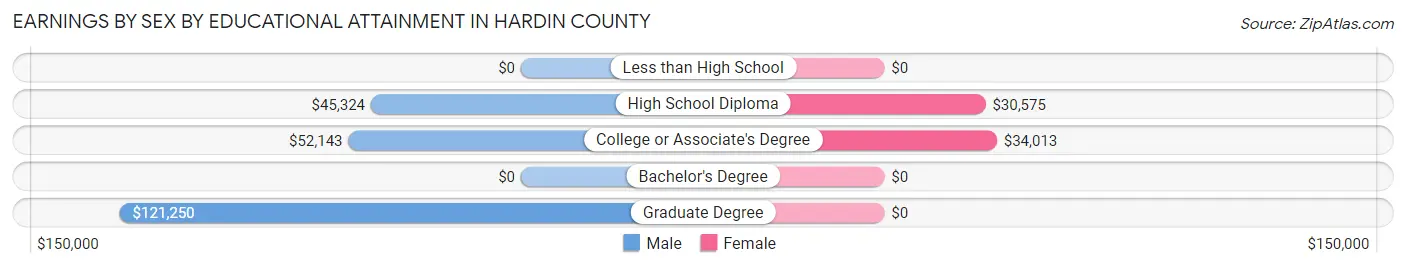
| Educational Attainment | Male Income | Female Income |
| Less than High School | - | - |
| High School Diploma | $45,324 | $30,575 |
| College or Associate's Degree | $52,143 | $34,013 |
| Bachelor's Degree | - | - |
| Graduate Degree | $121,250 | $0 |
| Total | $48,333 | $31,579 |
Family Income in Hardin County
Family Income Brackets in Hardin County
According to the Hardin County family income data, there are 250 families falling into the $50,000 to $74,999 income range, which is the most common income bracket and makes up 27.0% of all families. Conversely, the less than $10,000 income bracket is the least frequent group with only 16 families (1.7%) belonging to this category.
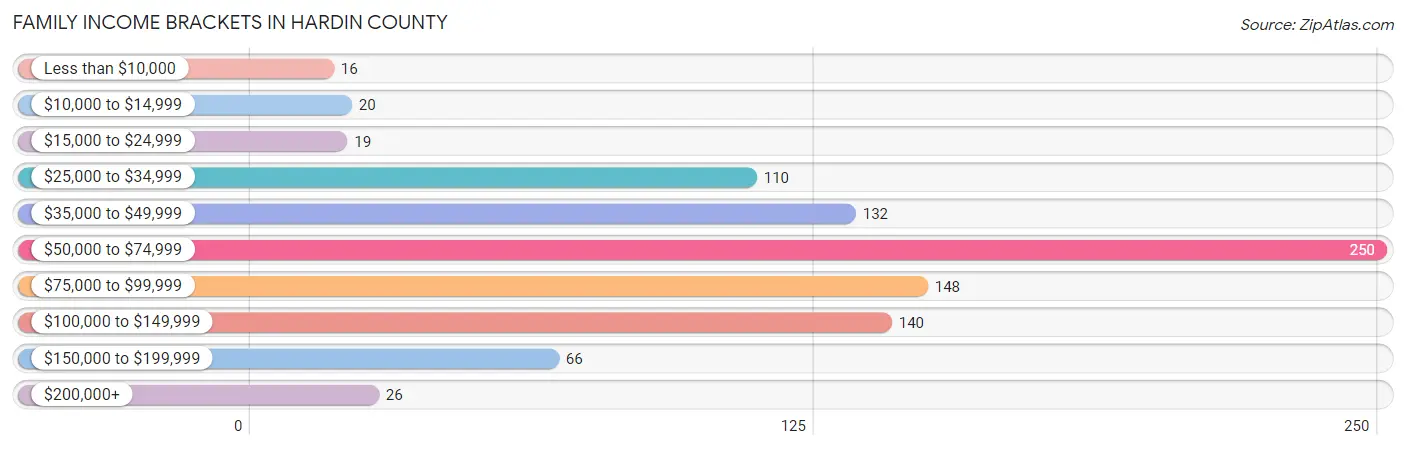
| Income Bracket | # Families | % Families |
| Less than $10,000 | 16 | 1.7% |
| $10,000 to $14,999 | 20 | 2.2% |
| $15,000 to $24,999 | 19 | 2.0% |
| $25,000 to $34,999 | 110 | 11.9% |
| $35,000 to $49,999 | 132 | 14.2% |
| $50,000 to $74,999 | 250 | 27.0% |
| $75,000 to $99,999 | 148 | 16.0% |
| $100,000 to $149,999 | 140 | 15.1% |
| $150,000 to $199,999 | 66 | 7.1% |
| $200,000+ | 26 | 2.8% |
Family Income by Famaliy Size in Hardin County
6-person families (43 | 4.6%) account for the highest median family income in Hardin County with $126,042 per family, while 2-person families (575 | 62.0%) have the highest median income of $32,866 per family member.
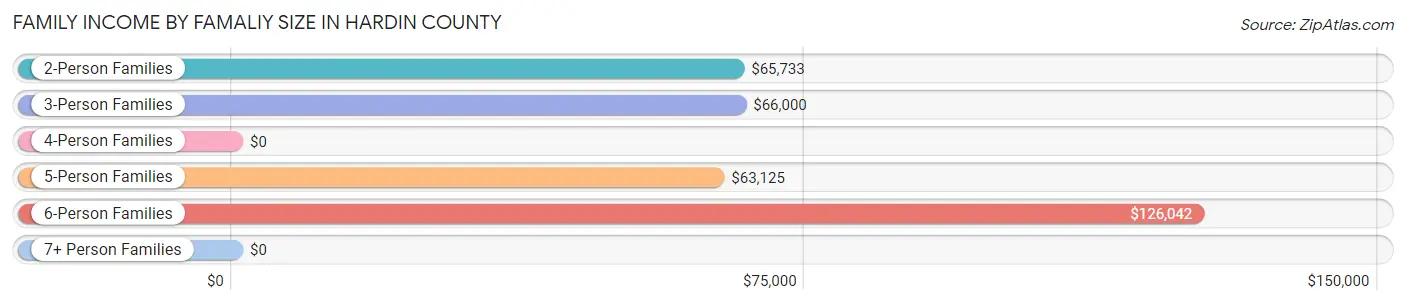
| Income Bracket | # Families | Median Income |
| 2-Person Families | 575 (62.0%) | $65,733 |
| 3-Person Families | 178 (19.2%) | $66,000 |
| 4-Person Families | 74 (8.0%) | $0 |
| 5-Person Families | 47 (5.1%) | $63,125 |
| 6-Person Families | 43 (4.6%) | $126,042 |
| 7+ Person Families | 10 (1.1%) | $0 |
| Total | 927 (100.0%) | $65,778 |
Family Income by Number of Earners in Hardin County
The median family income in Hardin County is $65,778, with families comprising 3+ earners (39) having the highest median family income of $126,319, while families with no earners (368) have the lowest median family income of $55,833, accounting for 4.2% and 39.7% of families, respectively.
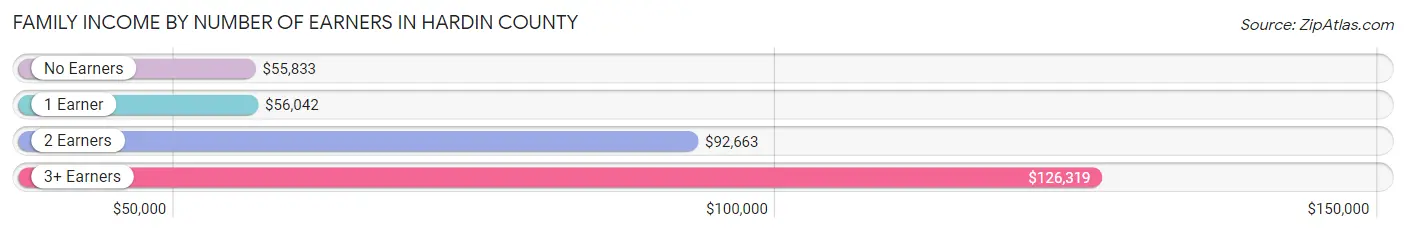
| Number of Earners | # Families | Median Income |
| No Earners | 368 (39.7%) | $55,833 |
| 1 Earner | 297 (32.0%) | $56,042 |
| 2 Earners | 223 (24.1%) | $92,663 |
| 3+ Earners | 39 (4.2%) | $126,319 |
| Total | 927 (100.0%) | $65,778 |
Household Income in Hardin County
Household Income Brackets in Hardin County
With 323 households falling in the category, the $50,000 to $74,999 income range is the most frequent in Hardin County, accounting for 21.8% of all households. In contrast, only 33 households (2.2%) fall into the $200,000+ income bracket, making it the least populous group.
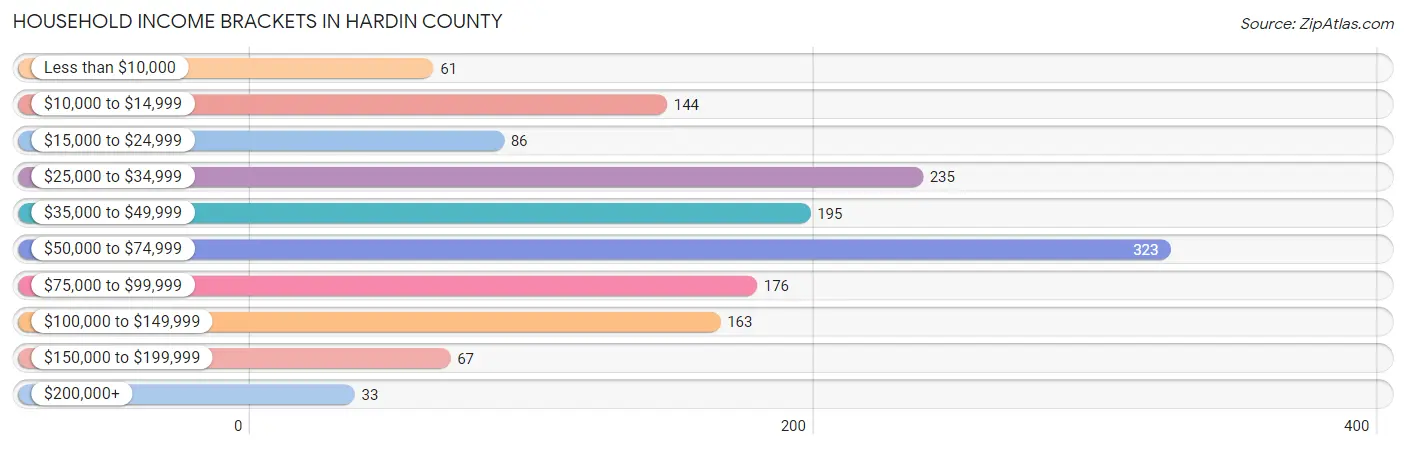
| Income Bracket | # Households | % Households |
| Less than $10,000 | 61 | 4.1% |
| $10,000 to $14,999 | 144 | 9.7% |
| $15,000 to $24,999 | 86 | 5.8% |
| $25,000 to $34,999 | 235 | 15.9% |
| $35,000 to $49,999 | 195 | 13.2% |
| $50,000 to $74,999 | 323 | 21.8% |
| $75,000 to $99,999 | 176 | 11.9% |
| $100,000 to $149,999 | 163 | 11.0% |
| $150,000 to $199,999 | 67 | 4.5% |
| $200,000+ | 33 | 2.2% |
Household Income by Householder Age in Hardin County
The median household income in Hardin County is $53,026, with the highest median household income of $67,625 found in the 25 to 44 years age bracket for the primary householder. A total of 279 households (18.9%) fall into this category. Meanwhile, the 15 to 24 years age bracket for the primary householder has the lowest median household income of $16,667, with 16 households (1.1%) in this group.
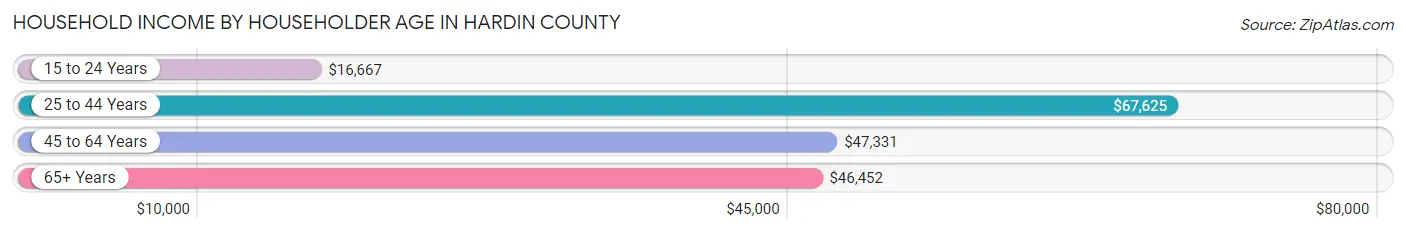
| Income Bracket | # Households | Median Income |
| 15 to 24 Years | 16 (1.1%) | $16,667 |
| 25 to 44 Years | 279 (18.9%) | $67,625 |
| 45 to 64 Years | 567 (38.3%) | $47,331 |
| 65+ Years | 618 (41.8%) | $46,452 |
| Total | 1,480 (100.0%) | $53,026 |
Poverty in Hardin County
Income Below Poverty by Sex and Age in Hardin County
With 9.9% poverty level for males and 13.1% for females among the residents of Hardin County, 55 to 64 year old males and 5 year old females are the most vulnerable to poverty, with 85 males (24.8%) and 5 females (45.5%) in their respective age groups living below the poverty level.
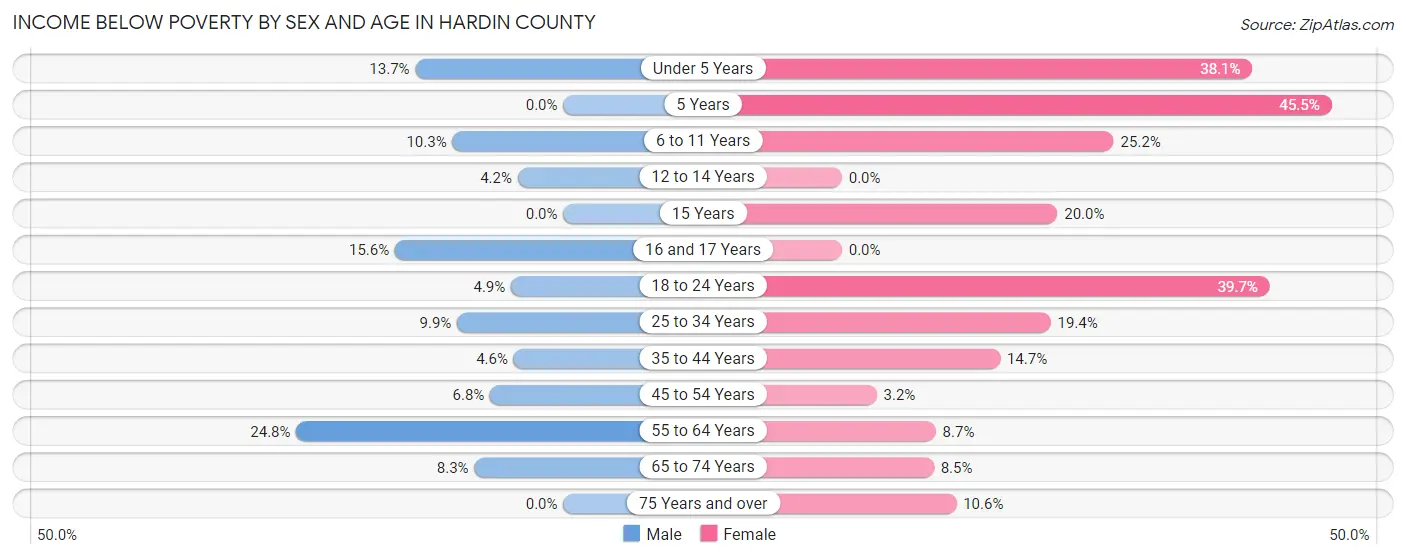
| Age Bracket | Male | Female |
| Under 5 Years | 7 (13.7%) | 16 (38.1%) |
| 5 Years | 0 (0.0%) | 5 (45.5%) |
| 6 to 11 Years | 7 (10.3%) | 27 (25.2%) |
| 12 to 14 Years | 3 (4.2%) | 0 (0.0%) |
| 15 Years | 0 (0.0%) | 5 (20.0%) |
| 16 and 17 Years | 5 (15.6%) | 0 (0.0%) |
| 18 to 24 Years | 5 (4.9%) | 27 (39.7%) |
| 25 to 34 Years | 13 (9.9%) | 37 (19.4%) |
| 35 to 44 Years | 8 (4.6%) | 32 (14.7%) |
| 45 to 54 Years | 18 (6.8%) | 6 (3.2%) |
| 55 to 64 Years | 85 (24.8%) | 25 (8.7%) |
| 65 to 74 Years | 25 (8.3%) | 29 (8.5%) |
| 75 Years and over | 0 (0.0%) | 29 (10.6%) |
| Total | 176 (9.9%) | 238 (13.1%) |
Income Above Poverty by Sex and Age in Hardin County
According to the poverty statistics in Hardin County, males aged 5 years and females aged 12 to 14 years are the age groups that are most secure financially, with 100.0% of males and 100.0% of females in these age groups living above the poverty line.
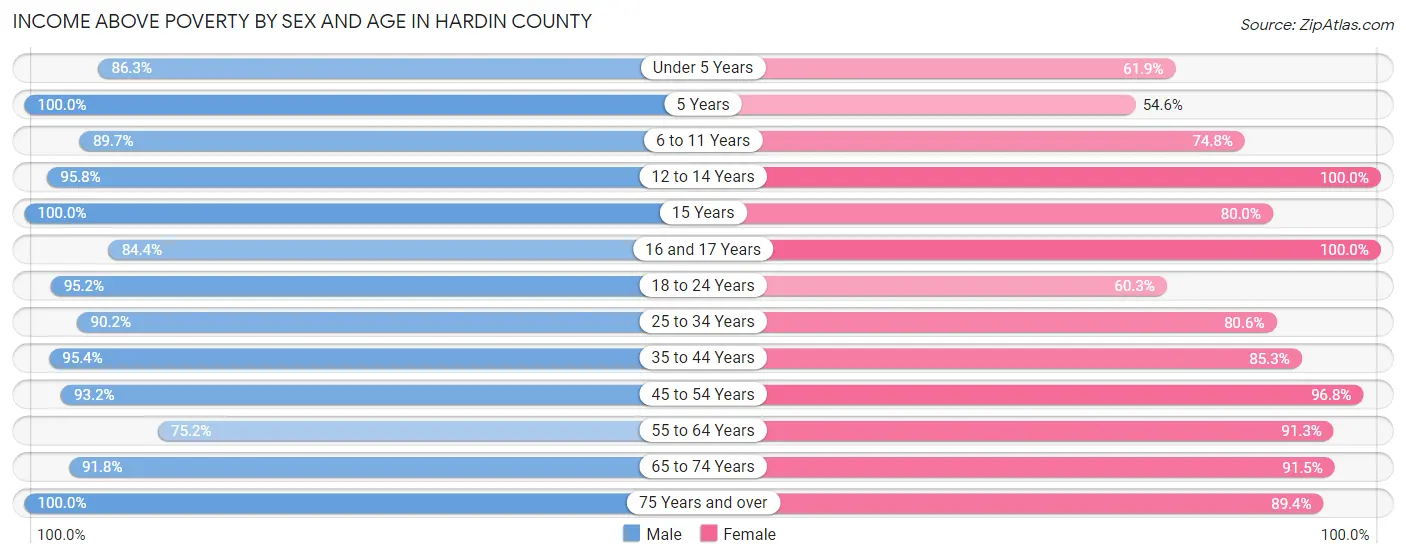
| Age Bracket | Male | Female |
| Under 5 Years | 44 (86.3%) | 26 (61.9%) |
| 5 Years | 5 (100.0%) | 6 (54.5%) |
| 6 to 11 Years | 61 (89.7%) | 80 (74.8%) |
| 12 to 14 Years | 68 (95.8%) | 35 (100.0%) |
| 15 Years | 8 (100.0%) | 20 (80.0%) |
| 16 and 17 Years | 27 (84.4%) | 32 (100.0%) |
| 18 to 24 Years | 98 (95.2%) | 41 (60.3%) |
| 25 to 34 Years | 119 (90.1%) | 154 (80.6%) |
| 35 to 44 Years | 166 (95.4%) | 186 (85.3%) |
| 45 to 54 Years | 247 (93.2%) | 180 (96.8%) |
| 55 to 64 Years | 258 (75.2%) | 262 (91.3%) |
| 65 to 74 Years | 278 (91.7%) | 311 (91.5%) |
| 75 Years and over | 220 (100.0%) | 244 (89.4%) |
| Total | 1,599 (90.1%) | 1,577 (86.9%) |
Income Below Poverty Among Married-Couple Families in Hardin County
The poverty statistics for married-couple families in Hardin County show that 0.7% or 5 of the total 719 families live below the poverty line. Families with no children have the highest poverty rate of 0.9%, comprising of 5 families. On the other hand, families with 1 or 2 children have the lowest poverty rate of 0.0%, which includes 0 families.
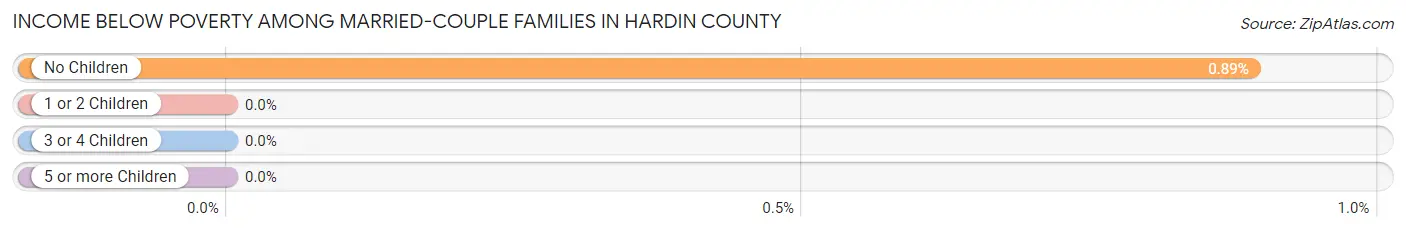
| Children | Above Poverty | Below Poverty |
| No Children | 558 (99.1%) | 5 (0.9%) |
| 1 or 2 Children | 87 (100.0%) | 0 (0.0%) |
| 3 or 4 Children | 69 (100.0%) | 0 (0.0%) |
| 5 or more Children | 0 (0.0%) | 0 (0.0%) |
| Total | 714 (99.3%) | 5 (0.7%) |
Income Below Poverty Among Single-Parent Households in Hardin County
According to the poverty data in Hardin County, 22.3% or 25 single-father households and 29.2% or 28 single-mother households are living below the poverty line. Among single-father households, those with 3 or 4 children have the highest poverty rate, with 3 households (100.0%) experiencing poverty. Likewise, among single-mother households, those with 3 or 4 children have the highest poverty rate, with 10 households (43.5%) falling below the poverty line.
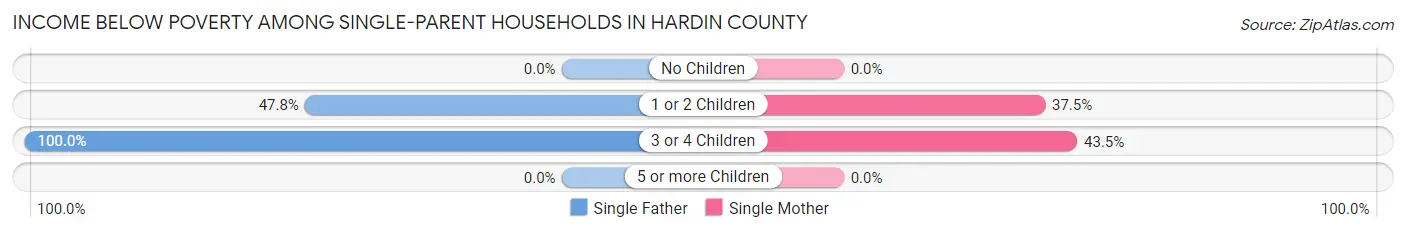
| Children | Single Father | Single Mother |
| No Children | 0 (0.0%) | 0 (0.0%) |
| 1 or 2 Children | 22 (47.8%) | 18 (37.5%) |
| 3 or 4 Children | 3 (100.0%) | 10 (43.5%) |
| 5 or more Children | 0 (0.0%) | 0 (0.0%) |
| Total | 25 (22.3%) | 28 (29.2%) |
Income Below Poverty Among Married-Couple vs Single-Parent Households in Hardin County
The poverty data for Hardin County shows that 5 of the married-couple family households (0.7%) and 53 of the single-parent households (25.5%) are living below the poverty level. Within the married-couple family households, those with no children have the highest poverty rate, with 5 households (0.9%) falling below the poverty line. Among the single-parent households, those with 3 or 4 children have the highest poverty rate, with 13 household (50.0%) living below poverty.
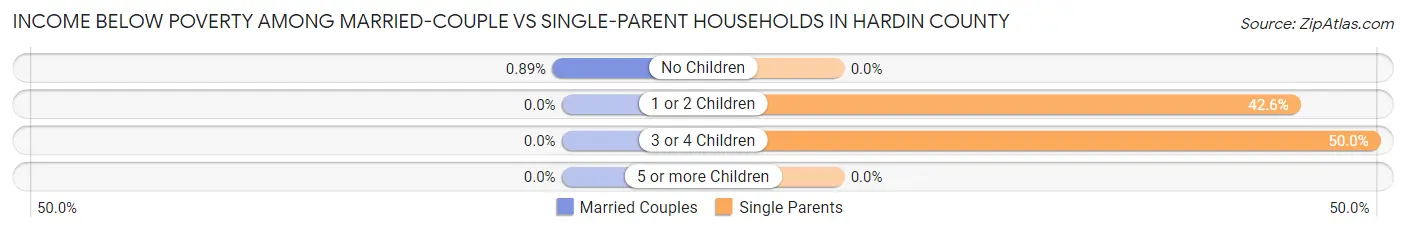
| Children | Married-Couple Families | Single-Parent Households |
| No Children | 5 (0.9%) | 0 (0.0%) |
| 1 or 2 Children | 0 (0.0%) | 40 (42.5%) |
| 3 or 4 Children | 0 (0.0%) | 13 (50.0%) |
| 5 or more Children | 0 (0.0%) | 0 (0.0%) |
| Total | 5 (0.7%) | 53 (25.5%) |
Race in Hardin County
The most populous races in Hardin County are White / Caucasian (3,585 | 97.8%), Black / African American (40 | 1.1%), and Hispanic or Latino (38 | 1.0%).
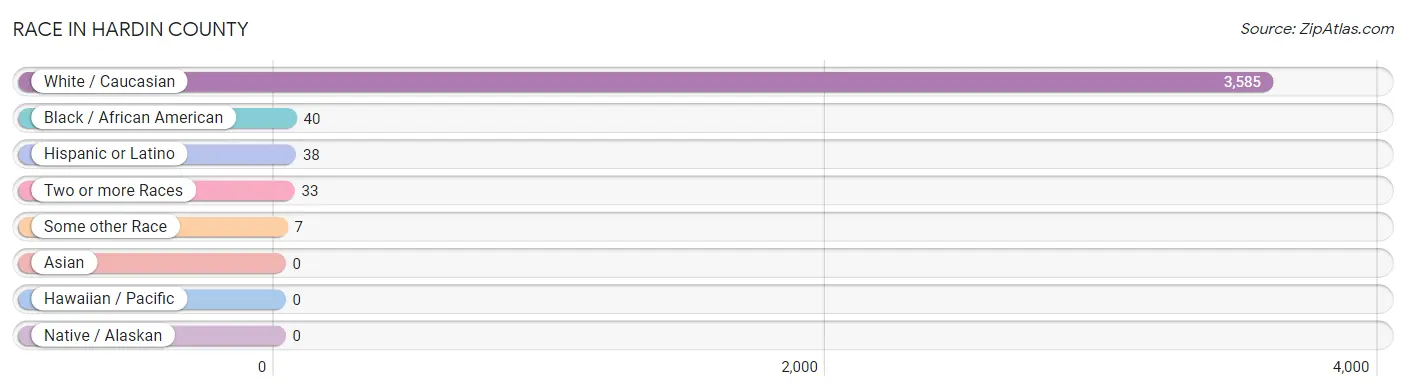
| Race | # Population | % Population |
| Asian | 0 | 0.0% |
| Black / African American | 40 | 1.1% |
| Hawaiian / Pacific | 0 | 0.0% |
| Hispanic or Latino | 38 | 1.0% |
| Native / Alaskan | 0 | 0.0% |
| White / Caucasian | 3,585 | 97.8% |
| Two or more Races | 33 | 0.9% |
| Some other Race | 7 | 0.2% |
| Total | 3,665 | 100.0% |
Ancestry in Hardin County
The most populous ancestries reported in Hardin County are German (892 | 24.3%), English (837 | 22.8%), Irish (498 | 13.6%), American (183 | 5.0%), and Scotch-Irish (168 | 4.6%), together accounting for 70.3% of all Hardin County residents.
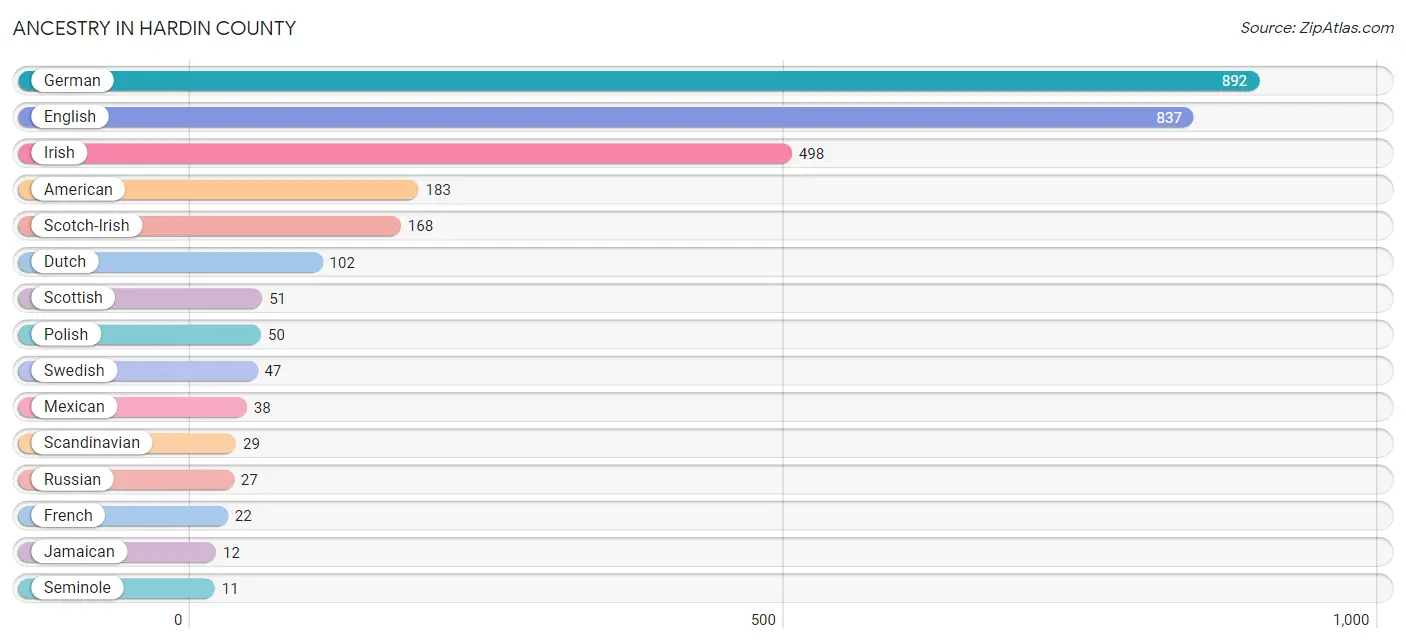
| Ancestry | # Population | % Population |
| African | 7 | 0.2% |
| American | 183 | 5.0% |
| Cherokee | 8 | 0.2% |
| Danish | 9 | 0.3% |
| Dutch | 102 | 2.8% |
| English | 837 | 22.8% |
| European | 3 | 0.1% |
| French | 22 | 0.6% |
| French Canadian | 8 | 0.2% |
| German | 892 | 24.3% |
| Irish | 498 | 13.6% |
| Italian | 9 | 0.3% |
| Jamaican | 12 | 0.3% |
| Mexican | 38 | 1.0% |
| Norwegian | 2 | 0.1% |
| Polish | 50 | 1.4% |
| Russian | 27 | 0.7% |
| Scandinavian | 29 | 0.8% |
| Scotch-Irish | 168 | 4.6% |
| Scottish | 51 | 1.4% |
| Seminole | 11 | 0.3% |
| Subsaharan African | 7 | 0.2% |
| Swedish | 47 | 1.3% |
| Swiss | 5 | 0.1% |
| Welsh | 6 | 0.2% | View All 25 Rows |
Immigrants in Hardin County
The most numerous immigrant groups reported in Hardin County came from Central America (10 | 0.3%), Latin America (10 | 0.3%), Mexico (10 | 0.3%), Asia (2 | 0.1%), and Israel (2 | 0.1%), together accounting for 0.9% of all Hardin County residents.
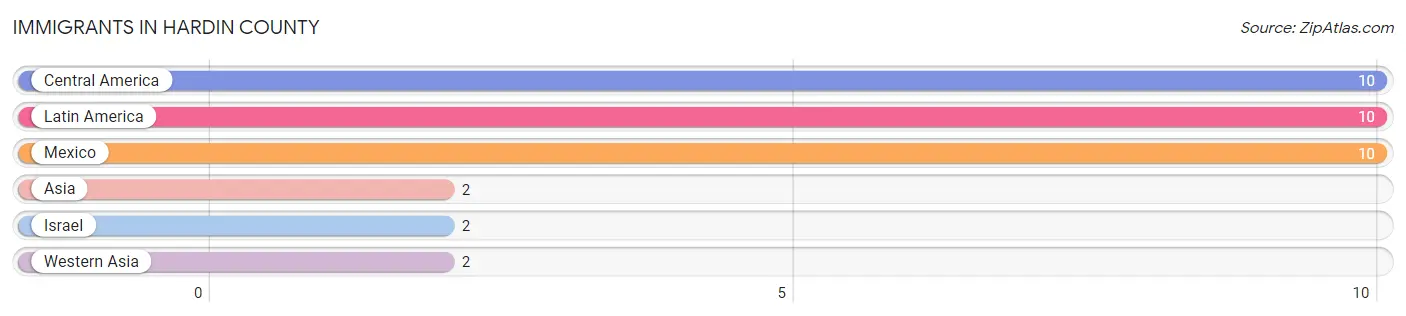
| Immigration Origin | # Population | % Population |
| Asia | 2 | 0.1% |
| Central America | 10 | 0.3% |
| Israel | 2 | 0.1% |
| Latin America | 10 | 0.3% |
| Mexico | 10 | 0.3% |
| Western Asia | 2 | 0.1% | View All 6 Rows |
Sex and Age in Hardin County
Sex and Age in Hardin County
The most populous age groups in Hardin County are 55 to 59 Years (251 | 13.6%) for men and 65 to 69 Years (222 | 12.2%) for women.
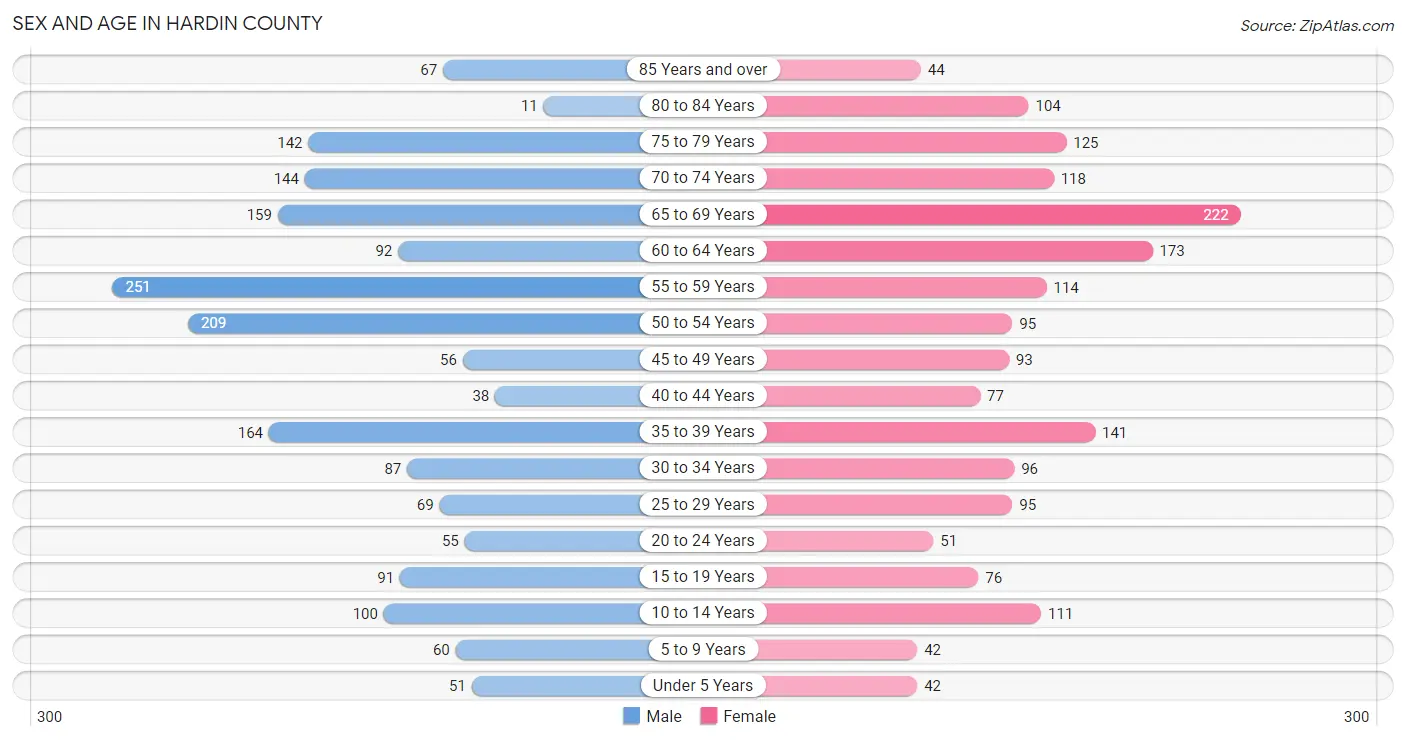
| Age Bracket | Male | Female |
| Under 5 Years | 51 (2.8%) | 42 (2.3%) |
| 5 to 9 Years | 60 (3.3%) | 42 (2.3%) |
| 10 to 14 Years | 100 (5.4%) | 111 (6.1%) |
| 15 to 19 Years | 91 (4.9%) | 76 (4.2%) |
| 20 to 24 Years | 55 (3.0%) | 51 (2.8%) |
| 25 to 29 Years | 69 (3.7%) | 95 (5.2%) |
| 30 to 34 Years | 87 (4.7%) | 96 (5.3%) |
| 35 to 39 Years | 164 (8.9%) | 141 (7.7%) |
| 40 to 44 Years | 38 (2.1%) | 77 (4.2%) |
| 45 to 49 Years | 56 (3.0%) | 93 (5.1%) |
| 50 to 54 Years | 209 (11.3%) | 95 (5.2%) |
| 55 to 59 Years | 251 (13.6%) | 114 (6.3%) |
| 60 to 64 Years | 92 (5.0%) | 173 (9.5%) |
| 65 to 69 Years | 159 (8.6%) | 222 (12.2%) |
| 70 to 74 Years | 144 (7.8%) | 118 (6.5%) |
| 75 to 79 Years | 142 (7.7%) | 125 (6.9%) |
| 80 to 84 Years | 11 (0.6%) | 104 (5.7%) |
| 85 Years and over | 67 (3.6%) | 44 (2.4%) |
| Total | 1,846 (100.0%) | 1,819 (100.0%) |
Families and Households in Hardin County
Median Family Size in Hardin County
The median family size in Hardin County is 3.13 persons per family, with single female/mother families (96 | 10.4%) accounting for the largest median family size of 3.57 persons per family. On the other hand, married-couple families (719 | 77.6%) represent the smallest median family size with 3.01 persons per family.
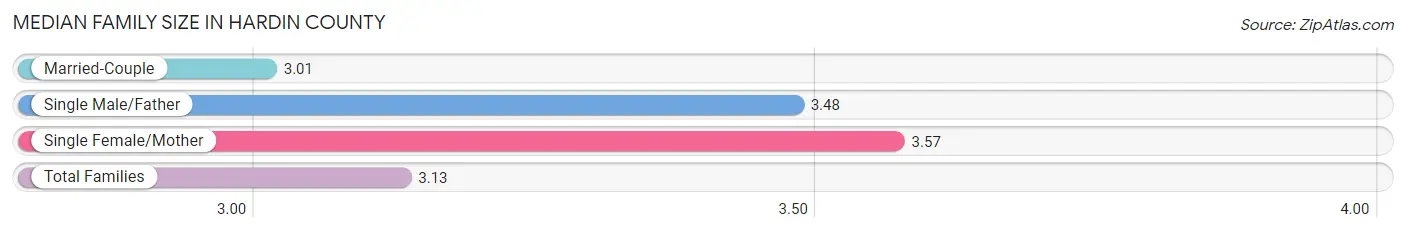
| Family Type | # Families | Family Size |
| Married-Couple | 719 (77.6%) | 3.01 |
| Single Male/Father | 112 (12.1%) | 3.48 |
| Single Female/Mother | 96 (10.4%) | 3.57 |
| Total Families | 927 (100.0%) | 3.13 |
Median Household Size in Hardin County
The median household size in Hardin County is 2.42 persons per household, with single male/father households (112 | 7.6%) accounting for the largest median household size of 3.96 persons per household. non-family households (553 | 37.4%) represent the smallest median household size with 1.07 persons per household.
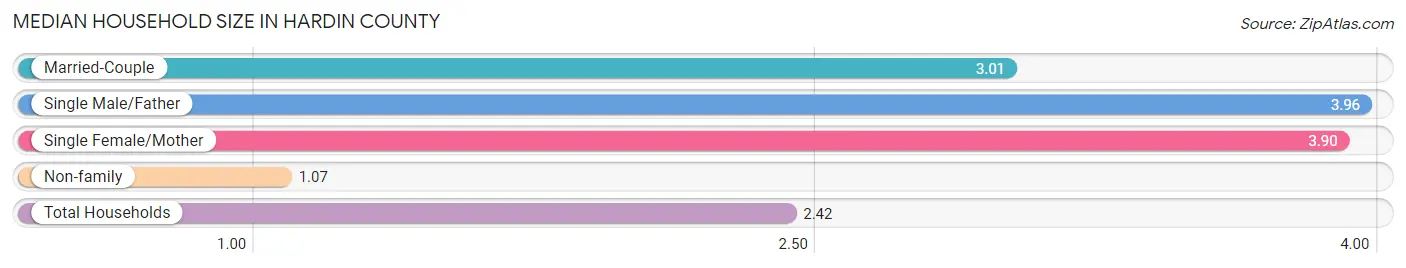
| Household Type | # Households | Household Size |
| Married-Couple | 719 (48.6%) | 3.01 |
| Single Male/Father | 112 (7.6%) | 3.96 |
| Single Female/Mother | 96 (6.5%) | 3.90 |
| Non-family | 553 (37.4%) | 1.07 |
| Total Households | 1,480 (100.0%) | 2.42 |
Household Size by Marriage Status in Hardin County
Out of a total of 1,480 households in Hardin County, 927 (62.6%) are family households, while 553 (37.4%) are nonfamily households. The most numerous type of family households are 2-person households, comprising 559, and the most common type of nonfamily households are 1-person households, comprising 505.
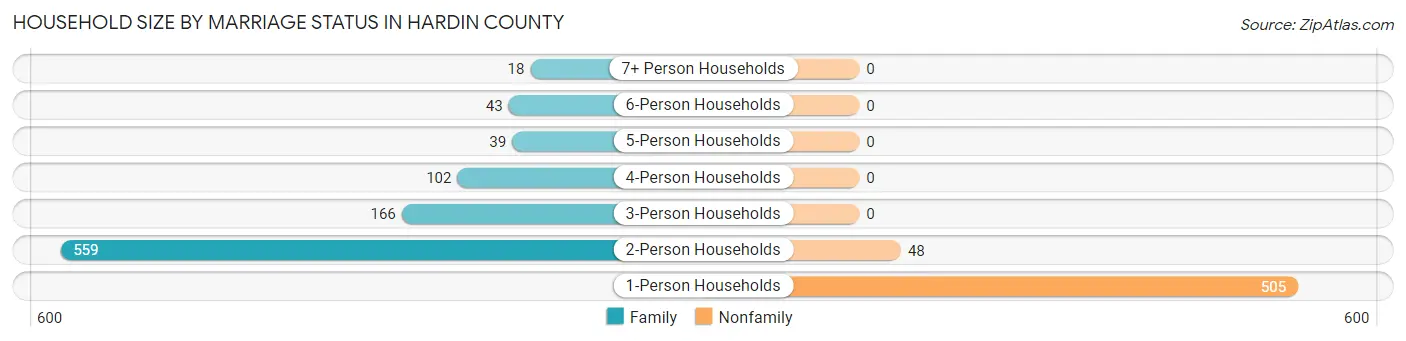
| Household Size | Family Households | Nonfamily Households |
| 1-Person Households | - | 505 (34.1%) |
| 2-Person Households | 559 (37.8%) | 48 (3.2%) |
| 3-Person Households | 166 (11.2%) | 0 (0.0%) |
| 4-Person Households | 102 (6.9%) | 0 (0.0%) |
| 5-Person Households | 39 (2.6%) | 0 (0.0%) |
| 6-Person Households | 43 (2.9%) | 0 (0.0%) |
| 7+ Person Households | 18 (1.2%) | 0 (0.0%) |
| Total | 927 (62.6%) | 553 (37.4%) |
Female Fertility in Hardin County
Fertility by Age in Hardin County
Average fertility rate in Hardin County is 30.0 births per 1,000 women. Women in the age bracket of 20 to 34 years have the highest fertility rate with 79.0 births per 1,000 women. Women in the age bracket of 20 to 34 years acount for 100.0% of all women with births.
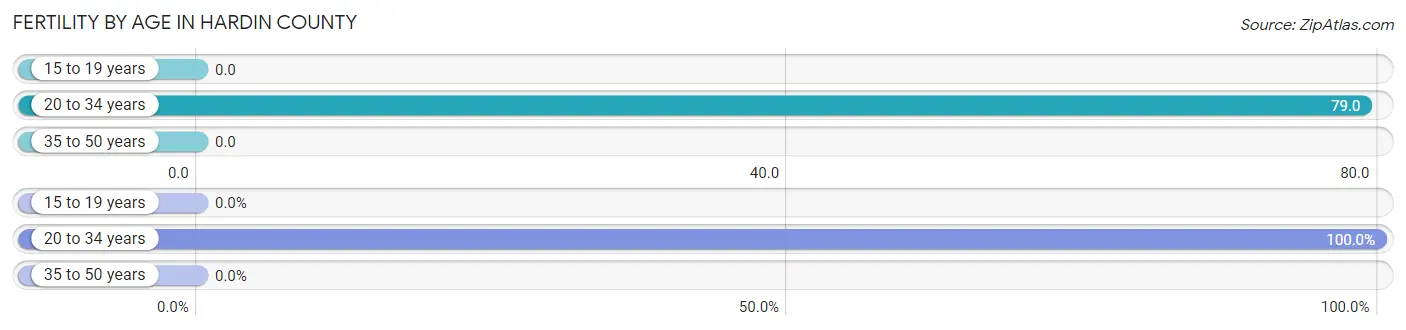
| Age Bracket | Women with Births | Births / 1,000 Women |
| 15 to 19 years | 0 (0.0%) | 0.0 |
| 20 to 34 years | 19 (100.0%) | 79.0 |
| 35 to 50 years | 0 (0.0%) | 0.0 |
| Total | 19 (100.0%) | 30.0 |
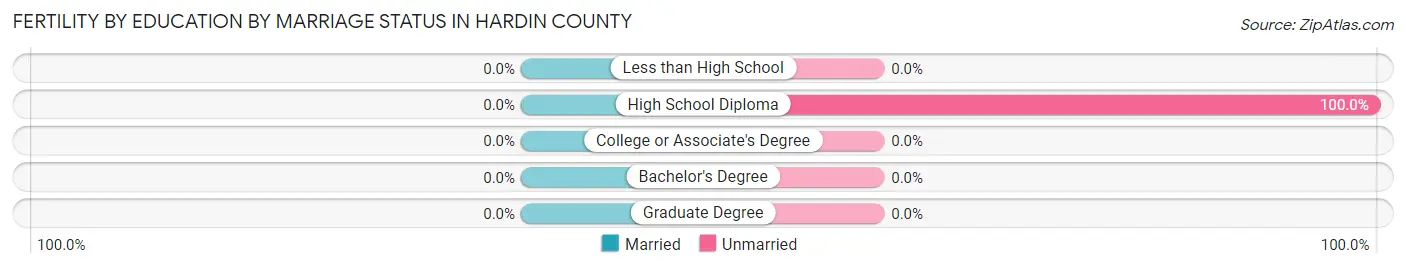
Fertility by Age by Marriage Status in Hardin County
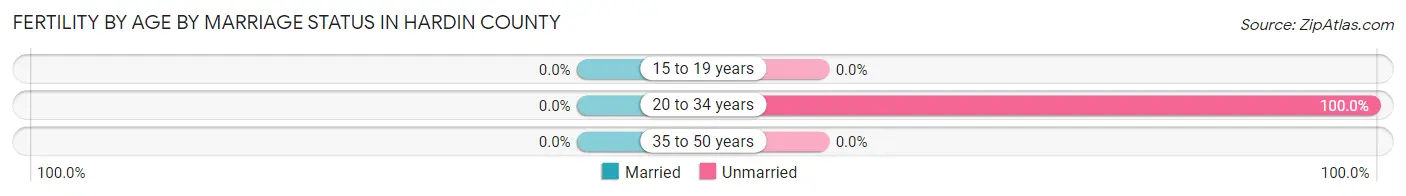
| Age Bracket | Married | Unmarried |
| 15 to 19 years | 0 (0.0%) | 0 (0.0%) |
| 20 to 34 years | 0 (0.0%) | 19 (100.0%) |
| 35 to 50 years | 0 (0.0%) | 0 (0.0%) |
| Total | 0 (0.0%) | 19 (100.0%) |
Fertility by Education in Hardin County
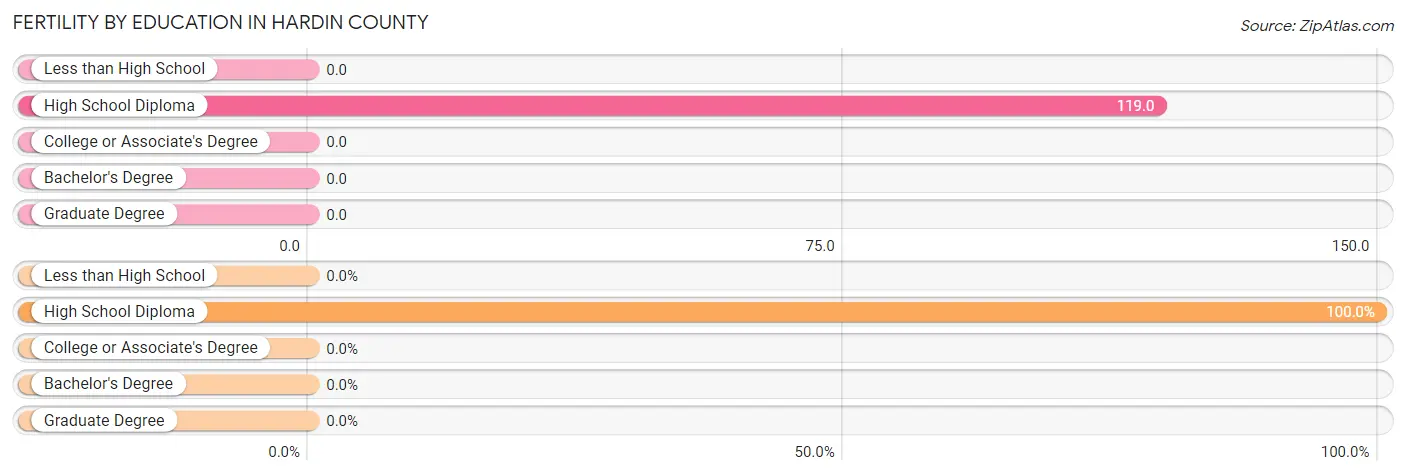
| Educational Attainment | Women with Births | Births / 1,000 Women |
| Less than High School | 0 (0.0%) | 0.0 |
| High School Diploma | 19 (100.0%) | 119.0 |
| College or Associate's Degree | 0 (0.0%) | 0.0 |
| Bachelor's Degree | 0 (0.0%) | 0.0 |
| Graduate Degree | 0 (0.0%) | 0.0 |
| Total | 19 (100.0%) | 30.0 |
Fertility by Education by Marriage Status in Hardin County
| Educational Attainment | Married | Unmarried |
| Less than High School | 0 (0.0%) | 0 (0.0%) |
| High School Diploma | 0 (0.0%) | 19 (100.0%) |
| College or Associate's Degree | 0 (0.0%) | 0 (0.0%) |
| Bachelor's Degree | 0 (0.0%) | 0 (0.0%) |
| Graduate Degree | 0 (0.0%) | 0 (0.0%) |
| Total | 0 (0.0%) | 19 (100.0%) |
Employment Characteristics in Hardin County
Employment by Class of Employer in Hardin County
Among the 1,210 employed individuals in Hardin County, private company employees (720 | 59.5%), not-for-profit organizations (221 | 18.3%), and local government employees (121 | 10.0%) make up the most common classes of employment.
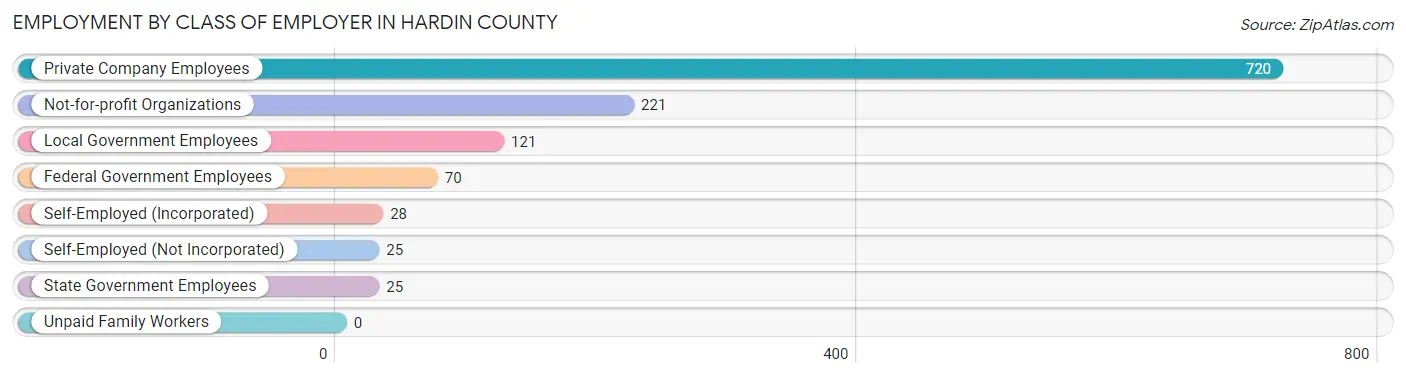
| Employer Class | # Employees | % Employees |
| Private Company Employees | 720 | 59.5% |
| Self-Employed (Incorporated) | 28 | 2.3% |
| Self-Employed (Not Incorporated) | 25 | 2.1% |
| Not-for-profit Organizations | 221 | 18.3% |
| Local Government Employees | 121 | 10.0% |
| State Government Employees | 25 | 2.1% |
| Federal Government Employees | 70 | 5.8% |
| Unpaid Family Workers | 0 | 0.0% |
| Total | 1,210 | 100.0% |
Employment Status by Age in Hardin County
According to the labor force statistics for Hardin County, out of the total population over 16 years of age (3,226), 39.2% or 1,265 individuals are in the labor force, with 2.6% or 33 of them unemployed. The age group with the highest labor force participation rate is 20 to 24 years, with 99.1% or 105 individuals in the labor force. Within the labor force, the 20 to 24 years age range has the highest percentage of unemployed individuals, with 21.9% or 23 of them being unemployed.
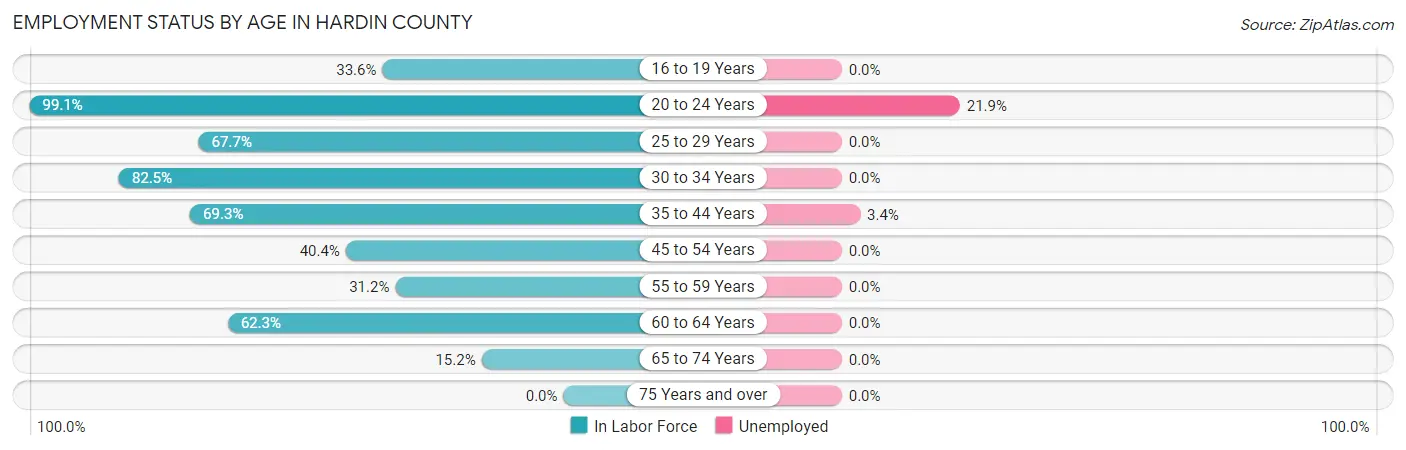
| Age Bracket | In Labor Force | Unemployed |
| 16 to 19 Years | 45 (33.6%) | 0 (0.0%) |
| 20 to 24 Years | 105 (99.1%) | 23 (21.9%) |
| 25 to 29 Years | 111 (67.7%) | 0 (0.0%) |
| 30 to 34 Years | 151 (82.5%) | 0 (0.0%) |
| 35 to 44 Years | 291 (69.3%) | 10 (3.4%) |
| 45 to 54 Years | 183 (40.4%) | 0 (0.0%) |
| 55 to 59 Years | 114 (31.2%) | 0 (0.0%) |
| 60 to 64 Years | 165 (62.3%) | 0 (0.0%) |
| 65 to 74 Years | 98 (15.2%) | 0 (0.0%) |
| 75 Years and over | 0 (0.0%) | 0 (0.0%) |
| Total | 1,265 (39.2%) | 33 (2.6%) |
Employment Status by Educational Attainment in Hardin County
According to labor force statistics for Hardin County, 54.9% of individuals (1,016) out of the total population between 25 and 64 years of age (1,850) are in the labor force, with 1.0% or 10 of them being unemployed. The group with the highest labor force participation rate are those with the educational attainment of bachelor's degree or higher, with 89.2% or 173 individuals in the labor force. Within the labor force, individuals with high school diploma education have the highest percentage of unemployment, with 2.4% or 8 of them being unemployed.
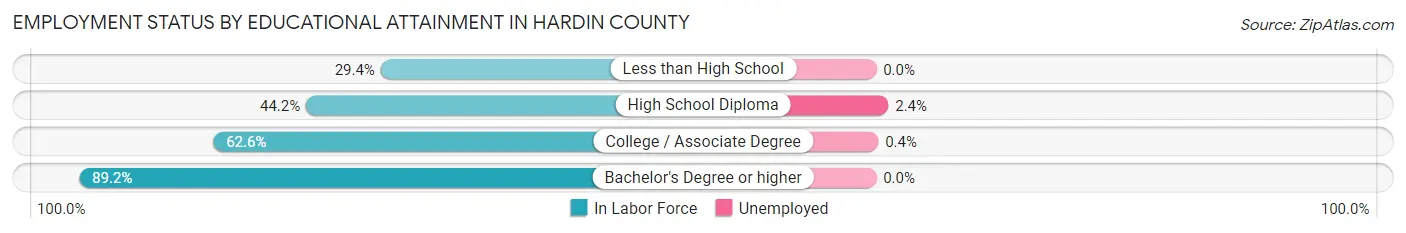
| Educational Attainment | In Labor Force | Unemployed |
| Less than High School | 50 (29.4%) | 0 (0.0%) |
| High School Diploma | 333 (44.2%) | 18 (2.4%) |
| College / Associate Degree | 459 (62.6%) | 3 (0.4%) |
| Bachelor's Degree or higher | 173 (89.2%) | 0 (0.0%) |
| Total | 1,016 (54.9%) | 18 (1.0%) |
Employment Occupations by Sex in Hardin County
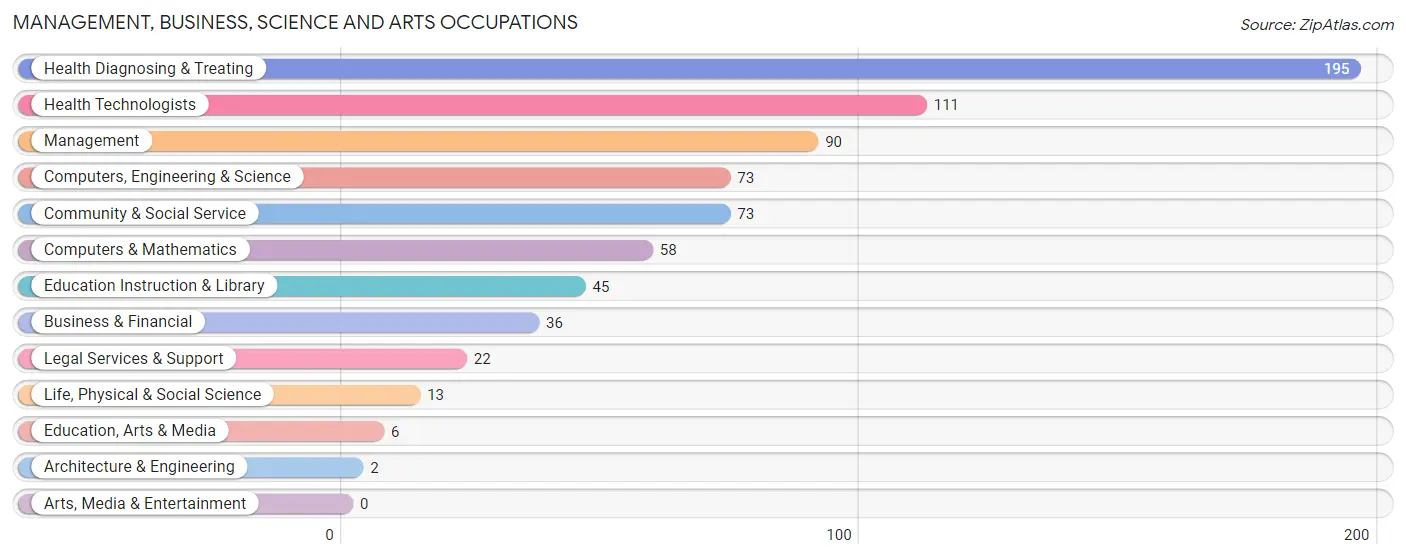
Management, Business, Science and Arts Occupations
The most common Management, Business, Science and Arts occupations in Hardin County are Health Diagnosing & Treating (195 | 15.9%), Health Technologists (111 | 9.0%), Management (90 | 7.3%), Computers, Engineering & Science (73 | 5.9%), and Community & Social Service (73 | 5.9%).
Management, Business, Science and Arts Occupations by Sex
Within the Management, Business, Science and Arts occupations in Hardin County, the most male-oriented occupations are Computers & Mathematics (100.0%), Architecture & Engineering (100.0%), and Education, Arts & Media (100.0%), while the most female-oriented occupations are Life, Physical & Social Science (100.0%), Legal Services & Support (100.0%), and Health Diagnosing & Treating (86.2%).
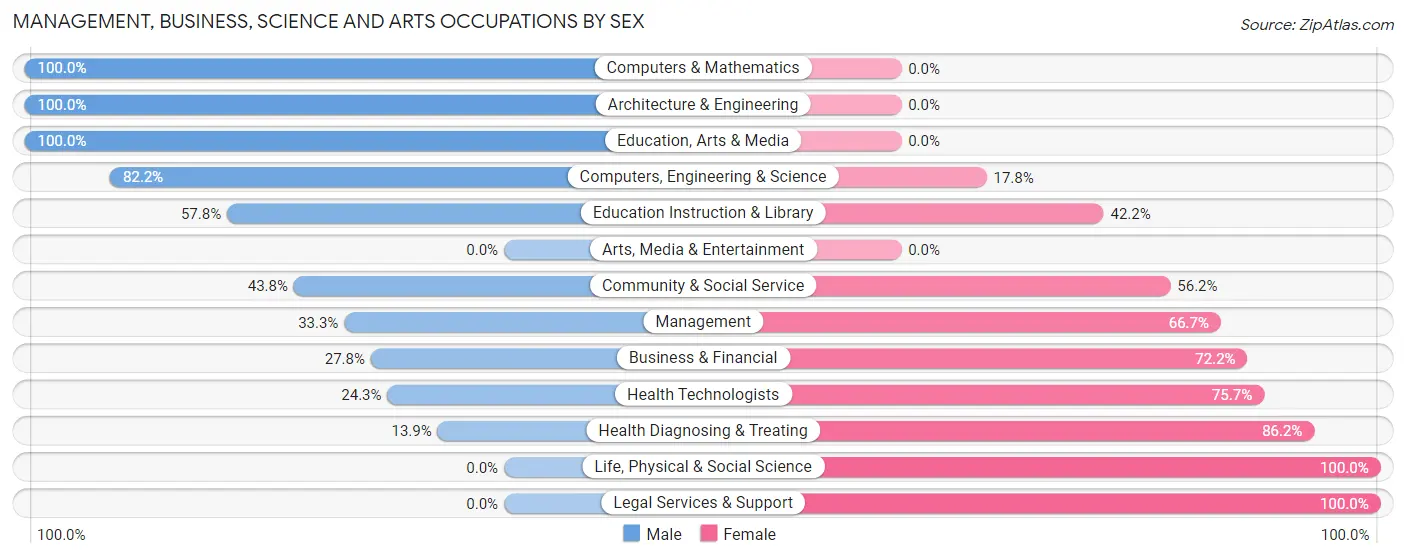
| Occupation | Male | Female |
| Management | 30 (33.3%) | 60 (66.7%) |
| Business & Financial | 10 (27.8%) | 26 (72.2%) |
| Computers, Engineering & Science | 60 (82.2%) | 13 (17.8%) |
| Computers & Mathematics | 58 (100.0%) | 0 (0.0%) |
| Architecture & Engineering | 2 (100.0%) | 0 (0.0%) |
| Life, Physical & Social Science | 0 (0.0%) | 13 (100.0%) |
| Community & Social Service | 32 (43.8%) | 41 (56.2%) |
| Education, Arts & Media | 6 (100.0%) | 0 (0.0%) |
| Legal Services & Support | 0 (0.0%) | 22 (100.0%) |
| Education Instruction & Library | 26 (57.8%) | 19 (42.2%) |
| Arts, Media & Entertainment | 0 (0.0%) | 0 (0.0%) |
| Health Diagnosing & Treating | 27 (13.9%) | 168 (86.2%) |
| Health Technologists | 27 (24.3%) | 84 (75.7%) |
| Total (Category) | 159 (34.1%) | 308 (65.9%) |
| Total (Overall) | 627 (51.0%) | 603 (49.0%) |
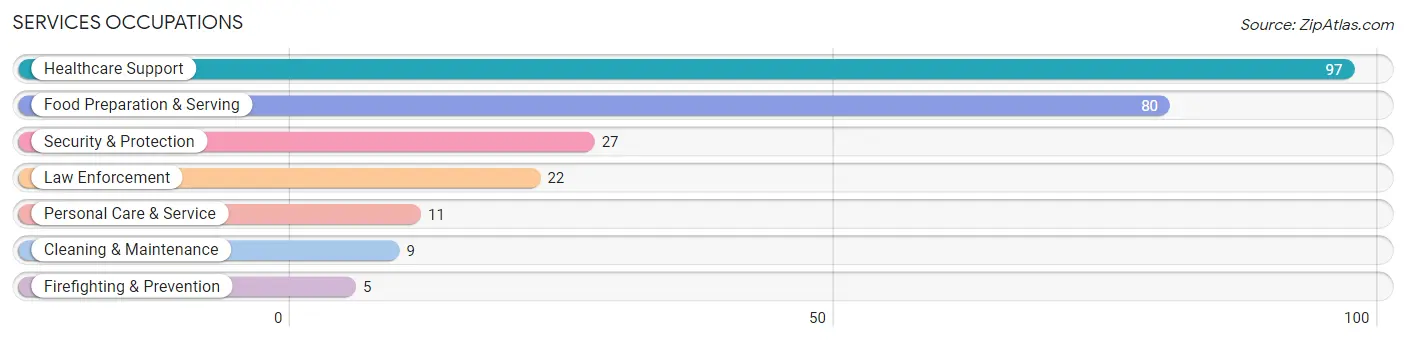
Services Occupations
The most common Services occupations in Hardin County are Healthcare Support (97 | 7.9%), Food Preparation & Serving (80 | 6.5%), Security & Protection (27 | 2.2%), Law Enforcement (22 | 1.8%), and Personal Care & Service (11 | 0.9%).
Services Occupations by Sex
Within the Services occupations in Hardin County, the most male-oriented occupations are Security & Protection (100.0%), Firefighting & Prevention (100.0%), and Law Enforcement (100.0%), while the most female-oriented occupations are Healthcare Support (87.6%), Food Preparation & Serving (68.8%), and Personal Care & Service (36.4%).
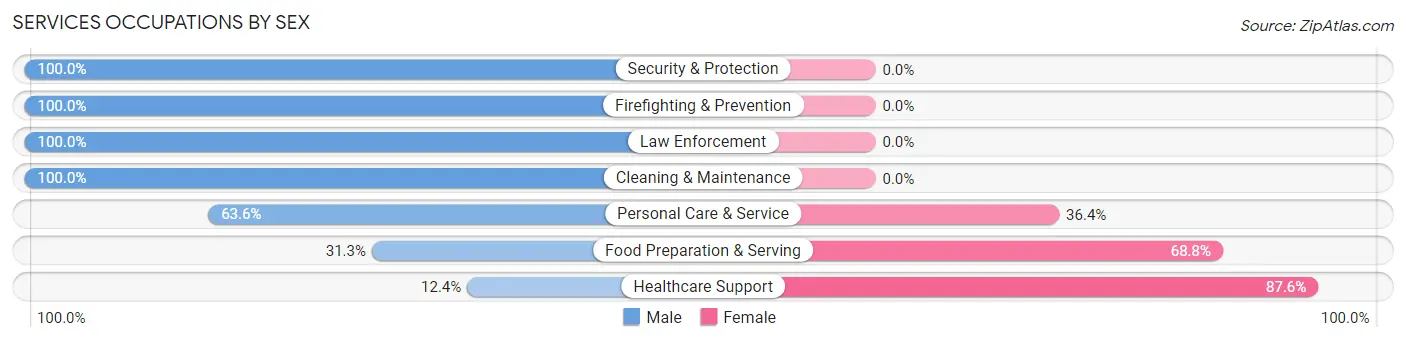
| Occupation | Male | Female |
| Healthcare Support | 12 (12.4%) | 85 (87.6%) |
| Security & Protection | 27 (100.0%) | 0 (0.0%) |
| Firefighting & Prevention | 5 (100.0%) | 0 (0.0%) |
| Law Enforcement | 22 (100.0%) | 0 (0.0%) |
| Food Preparation & Serving | 25 (31.2%) | 55 (68.8%) |
| Cleaning & Maintenance | 9 (100.0%) | 0 (0.0%) |
| Personal Care & Service | 7 (63.6%) | 4 (36.4%) |
| Total (Category) | 80 (35.7%) | 144 (64.3%) |
| Total (Overall) | 627 (51.0%) | 603 (49.0%) |
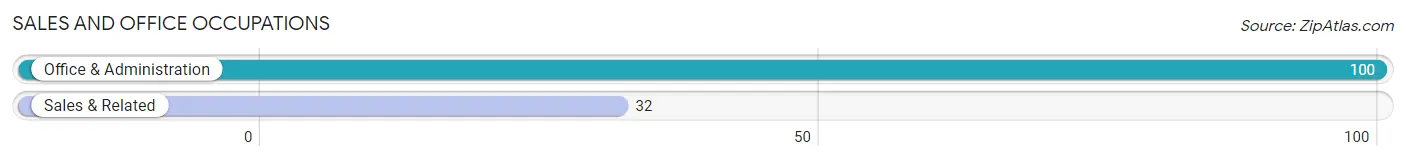
Sales and Office Occupations
The most common Sales and Office occupations in Hardin County are Office & Administration (100 | 8.1%), and Sales & Related (32 | 2.6%).
Sales and Office Occupations by Sex
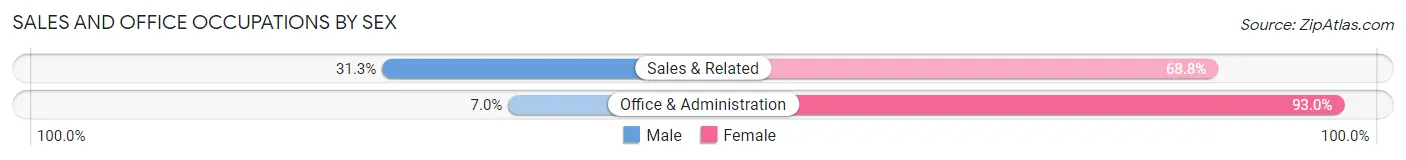
| Occupation | Male | Female |
| Sales & Related | 10 (31.2%) | 22 (68.8%) |
| Office & Administration | 7 (7.0%) | 93 (93.0%) |
| Total (Category) | 17 (12.9%) | 115 (87.1%) |
| Total (Overall) | 627 (51.0%) | 603 (49.0%) |
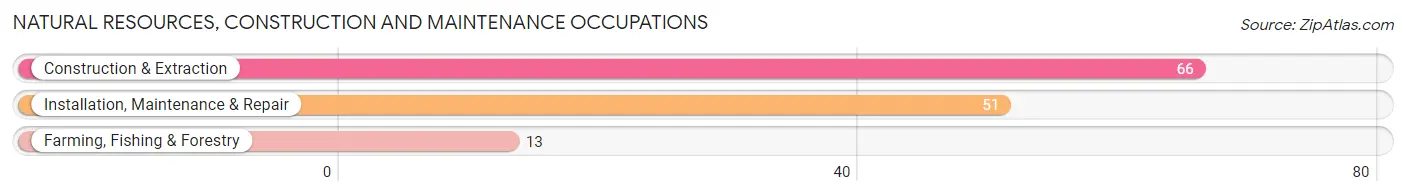
Natural Resources, Construction and Maintenance Occupations
The most common Natural Resources, Construction and Maintenance occupations in Hardin County are Construction & Extraction (66 | 5.4%), Installation, Maintenance & Repair (51 | 4.2%), and Farming, Fishing & Forestry (13 | 1.1%).
Natural Resources, Construction and Maintenance Occupations by Sex
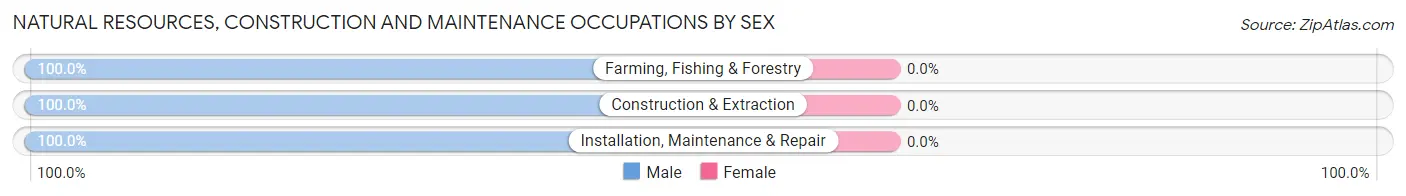
| Occupation | Male | Female |
| Farming, Fishing & Forestry | 13 (100.0%) | 0 (0.0%) |
| Construction & Extraction | 66 (100.0%) | 0 (0.0%) |
| Installation, Maintenance & Repair | 51 (100.0%) | 0 (0.0%) |
| Total (Category) | 130 (100.0%) | 0 (0.0%) |
| Total (Overall) | 627 (51.0%) | 603 (49.0%) |
Production, Transportation and Moving Occupations
The most common Production, Transportation and Moving occupations in Hardin County are Material Moving (125 | 10.2%), Production (97 | 7.9%), and Transportation (55 | 4.5%).
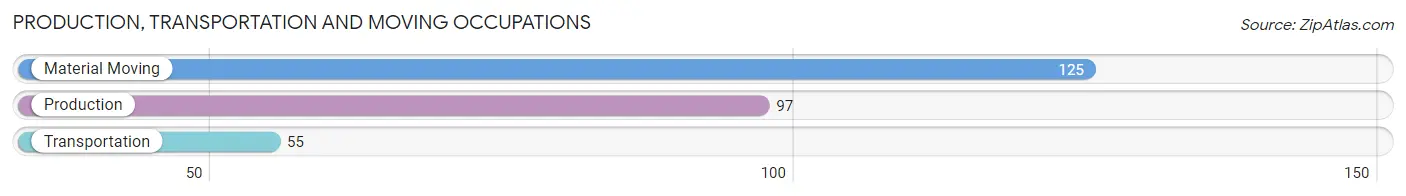
Production, Transportation and Moving Occupations by Sex
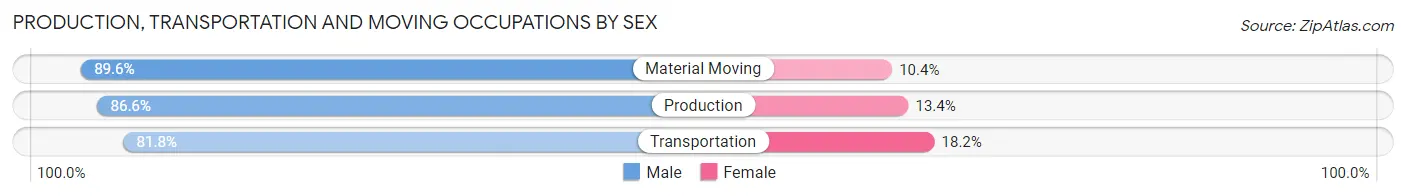
| Occupation | Male | Female |
| Production | 84 (86.6%) | 13 (13.4%) |
| Transportation | 45 (81.8%) | 10 (18.2%) |
| Material Moving | 112 (89.6%) | 13 (10.4%) |
| Total (Category) | 241 (87.0%) | 36 (13.0%) |
| Total (Overall) | 627 (51.0%) | 603 (49.0%) |
Employment Industries by Sex in Hardin County
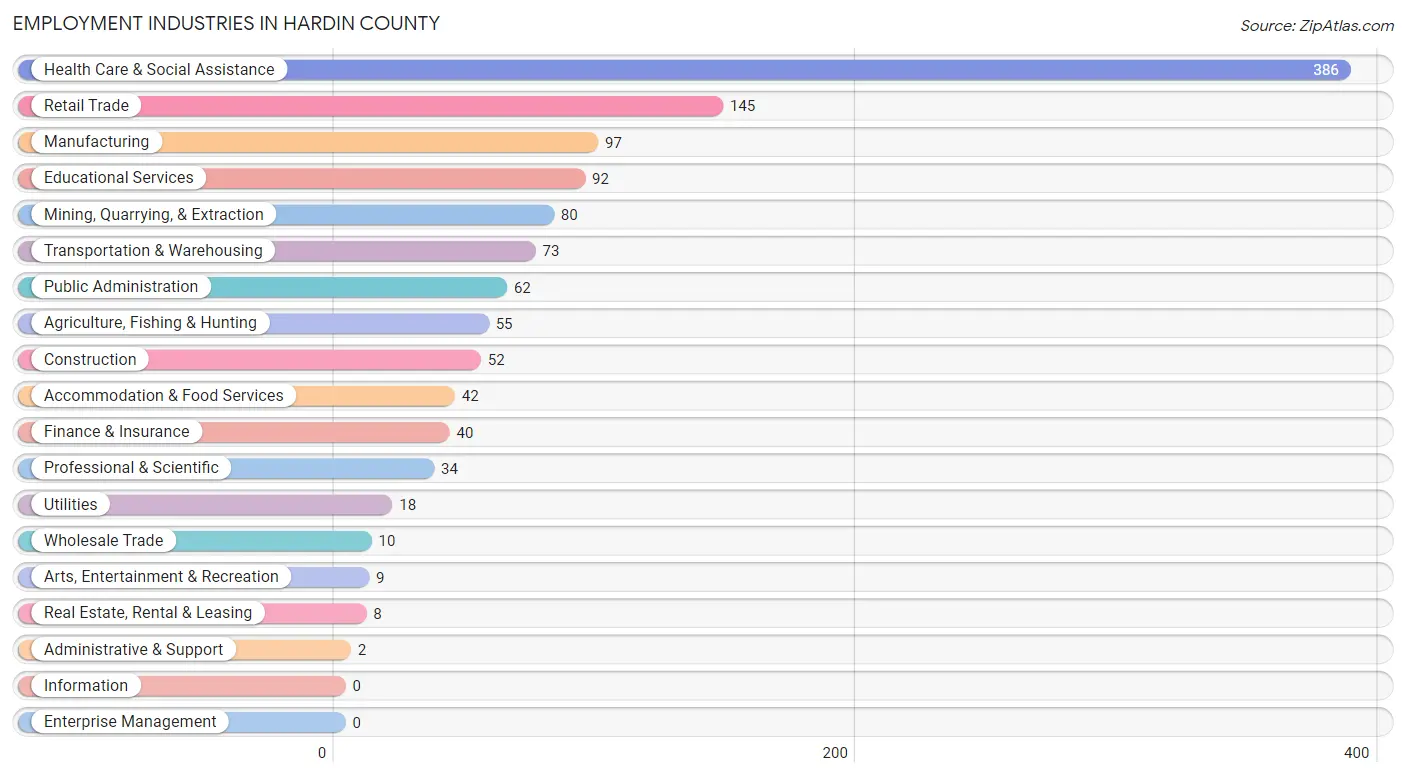
Employment Industries in Hardin County
The major employment industries in Hardin County include Health Care & Social Assistance (386 | 31.4%), Retail Trade (145 | 11.8%), Manufacturing (97 | 7.9%), Educational Services (92 | 7.5%), and Mining, Quarrying, & Extraction (80 | 6.5%).
Employment Industries by Sex in Hardin County
The Hardin County industries that see more men than women are Agriculture, Fishing & Hunting (100.0%), Mining, Quarrying, & Extraction (100.0%), and Wholesale Trade (100.0%), whereas the industries that tend to have a higher number of women are Real Estate, Rental & Leasing (100.0%), Health Care & Social Assistance (90.2%), and Professional & Scientific (64.7%).
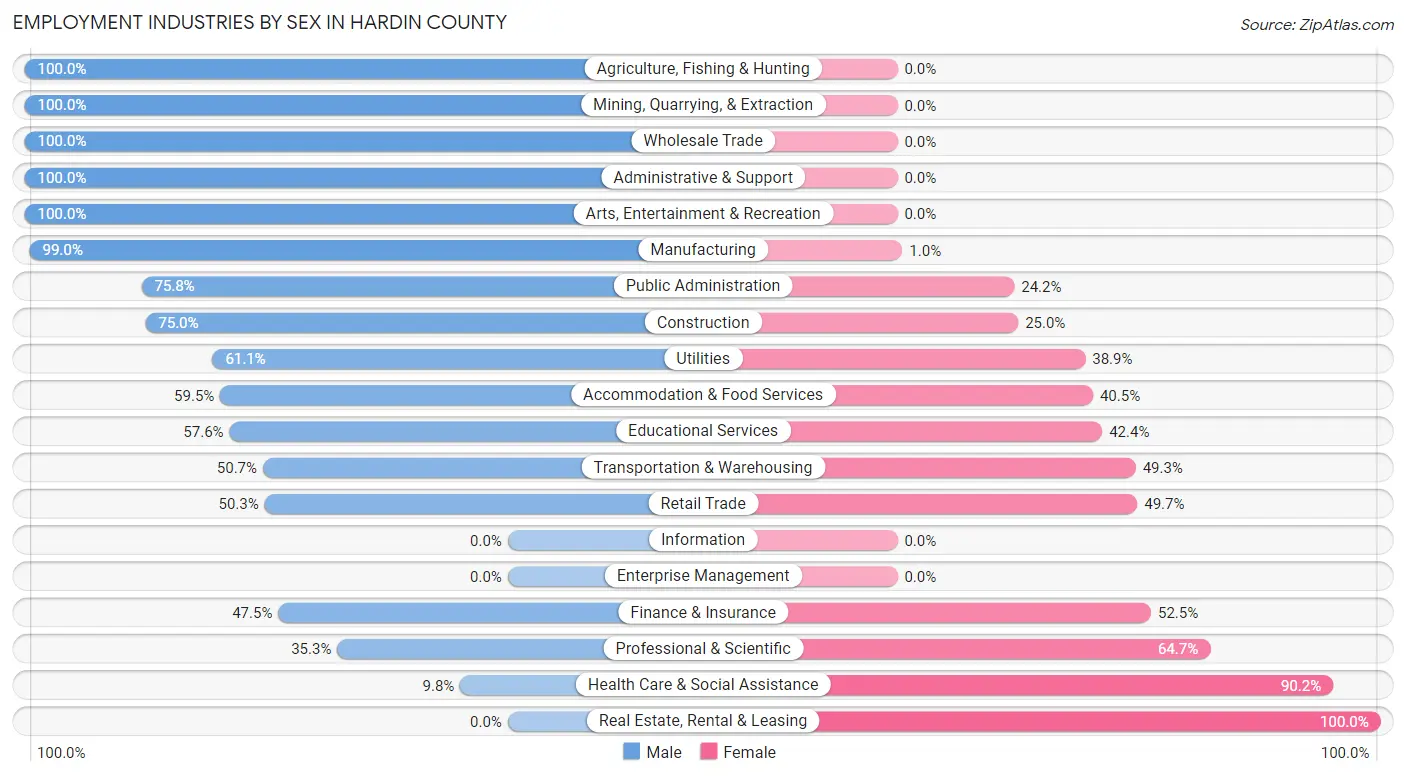
| Industry | Male | Female |
| Agriculture, Fishing & Hunting | 55 (100.0%) | 0 (0.0%) |
| Mining, Quarrying, & Extraction | 80 (100.0%) | 0 (0.0%) |
| Construction | 39 (75.0%) | 13 (25.0%) |
| Manufacturing | 96 (99.0%) | 1 (1.0%) |
| Wholesale Trade | 10 (100.0%) | 0 (0.0%) |
| Retail Trade | 73 (50.3%) | 72 (49.7%) |
| Transportation & Warehousing | 37 (50.7%) | 36 (49.3%) |
| Utilities | 11 (61.1%) | 7 (38.9%) |
| Information | 0 (0.0%) | 0 (0.0%) |
| Finance & Insurance | 19 (47.5%) | 21 (52.5%) |
| Real Estate, Rental & Leasing | 0 (0.0%) | 8 (100.0%) |
| Professional & Scientific | 12 (35.3%) | 22 (64.7%) |
| Enterprise Management | 0 (0.0%) | 0 (0.0%) |
| Administrative & Support | 2 (100.0%) | 0 (0.0%) |
| Educational Services | 53 (57.6%) | 39 (42.4%) |
| Health Care & Social Assistance | 38 (9.8%) | 348 (90.2%) |
| Arts, Entertainment & Recreation | 9 (100.0%) | 0 (0.0%) |
| Accommodation & Food Services | 25 (59.5%) | 17 (40.5%) |
| Public Administration | 47 (75.8%) | 15 (24.2%) |
| Total | 627 (51.0%) | 603 (49.0%) |
Education in Hardin County
School Enrollment in Hardin County
The most common levels of schooling among the 515 students in Hardin County are middle school (145 | 28.2%), elementary school (123 | 23.9%), and high school (123 | 23.9%).
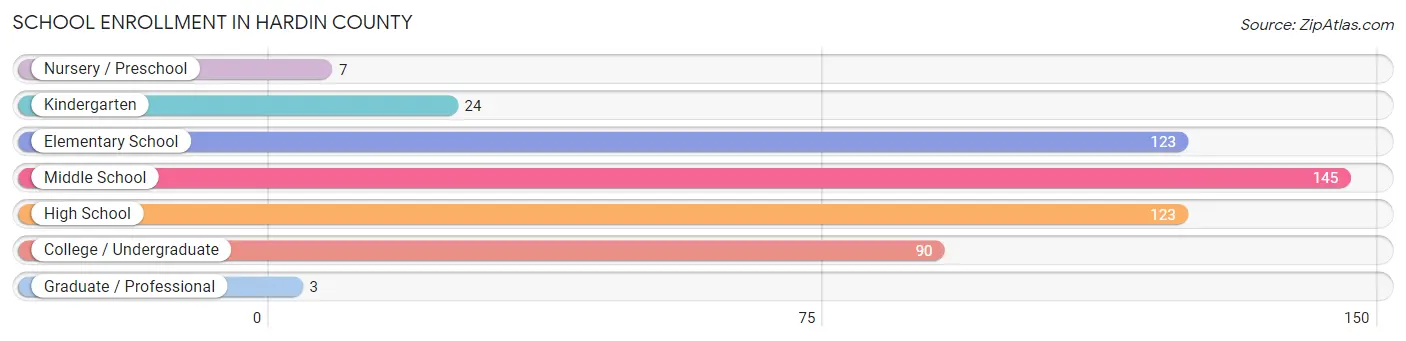
| School Level | # Students | % Students |
| Nursery / Preschool | 7 | 1.4% |
| Kindergarten | 24 | 4.7% |
| Elementary School | 123 | 23.9% |
| Middle School | 145 | 28.2% |
| High School | 123 | 23.9% |
| College / Undergraduate | 90 | 17.5% |
| Graduate / Professional | 3 | 0.6% |
| Total | 515 | 100.0% |
School Enrollment by Age by Funding Source in Hardin County
Out of a total of 515 students who are enrolled in schools in Hardin County, 7 (1.4%) attend a private institution, while the remaining 508 (98.6%) are enrolled in public schools. The age group of 3 to 4 year olds has the highest likelihood of being enrolled in private schools, with 3 (42.9% in the age bracket) enrolled. Conversely, the age group of 5 to 9 year old has the lowest likelihood of being enrolled in a private school, with 102 (100.0% in the age bracket) attending a public institution.
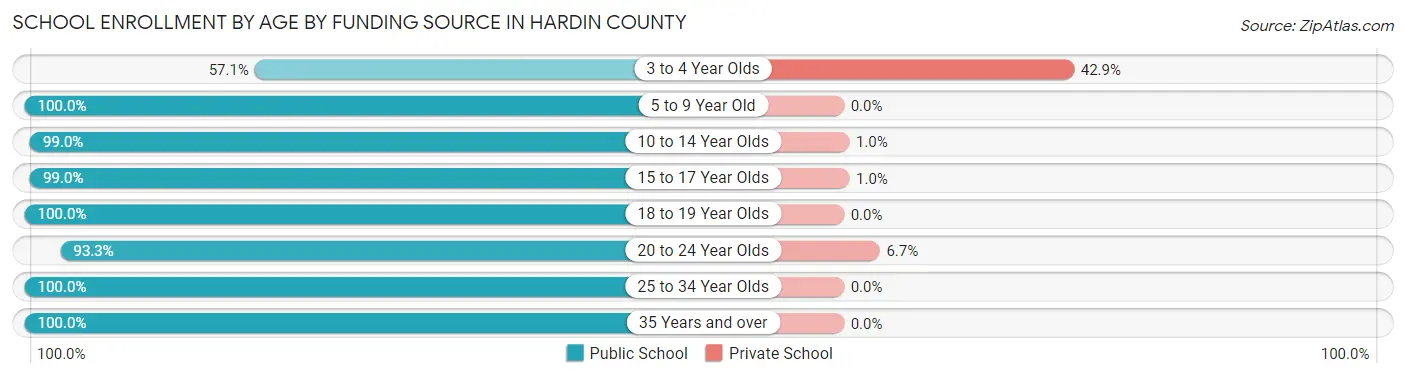
| Age Bracket | Public School | Private School |
| 3 to 4 Year Olds | 4 (57.1%) | 3 (42.9%) |
| 5 to 9 Year Old | 102 (100.0%) | 0 (0.0%) |
| 10 to 14 Year Olds | 199 (99.0%) | 2 (1.0%) |
| 15 to 17 Year Olds | 98 (99.0%) | 1 (1.0%) |
| 18 to 19 Year Olds | 52 (100.0%) | 0 (0.0%) |
| 20 to 24 Year Olds | 14 (93.3%) | 1 (6.7%) |
| 25 to 34 Year Olds | 11 (100.0%) | 0 (0.0%) |
| 35 Years and over | 28 (100.0%) | 0 (0.0%) |
| Total | 508 (98.6%) | 7 (1.4%) |
Educational Attainment by Field of Study in Hardin County
Education (113 | 29.7%), bio, nature & agricultural (58 | 15.2%), business (47 | 12.3%), engineering (43 | 11.3%), and science & technology (41 | 10.8%) are the most common fields of study among 381 individuals in Hardin County who have obtained a bachelor's degree or higher.
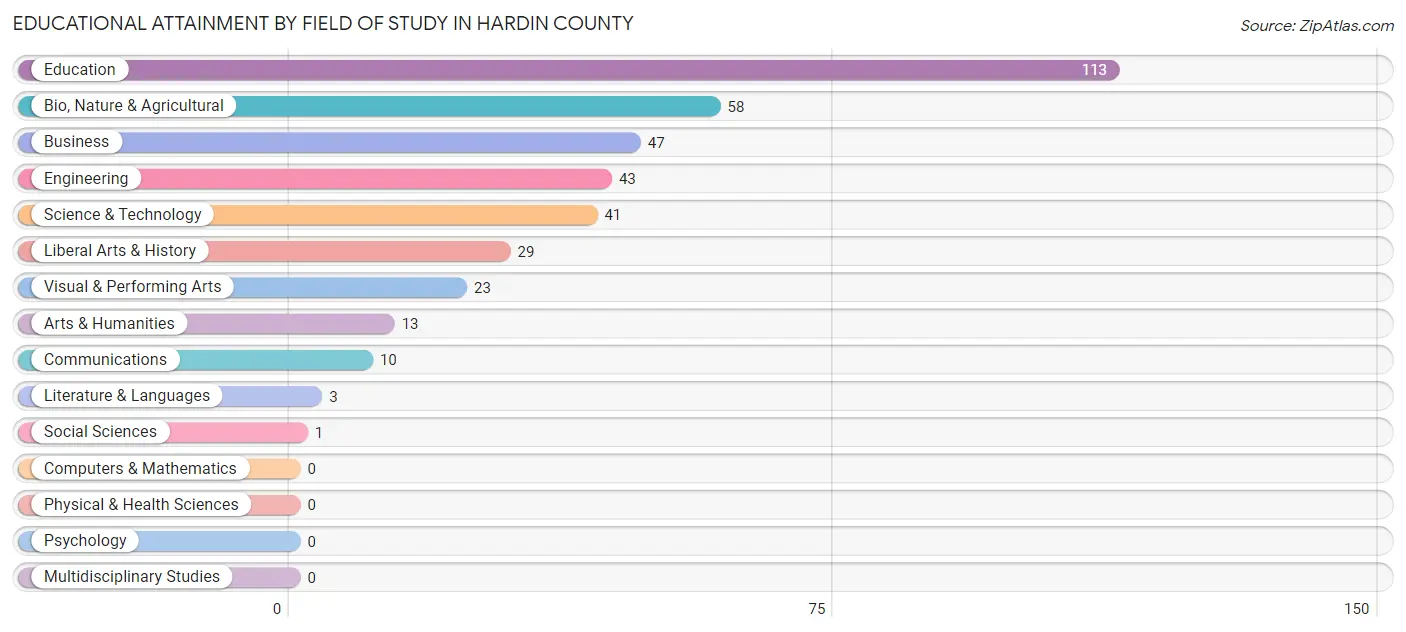
| Field of Study | # Graduates | % Graduates |
| Computers & Mathematics | 0 | 0.0% |
| Bio, Nature & Agricultural | 58 | 15.2% |
| Physical & Health Sciences | 0 | 0.0% |
| Psychology | 0 | 0.0% |
| Social Sciences | 1 | 0.3% |
| Engineering | 43 | 11.3% |
| Multidisciplinary Studies | 0 | 0.0% |
| Science & Technology | 41 | 10.8% |
| Business | 47 | 12.3% |
| Education | 113 | 29.7% |
| Literature & Languages | 3 | 0.8% |
| Liberal Arts & History | 29 | 7.6% |
| Visual & Performing Arts | 23 | 6.0% |
| Communications | 10 | 2.6% |
| Arts & Humanities | 13 | 3.4% |
| Total | 381 | 100.0% |
Transportation & Commute in Hardin County
Vehicle Availability by Sex in Hardin County
The most prevalent vehicle ownership categories in Hardin County are males with 3 vehicles (257, accounting for 41.9%) and females with 3 vehicles (218, making up 44.6%).
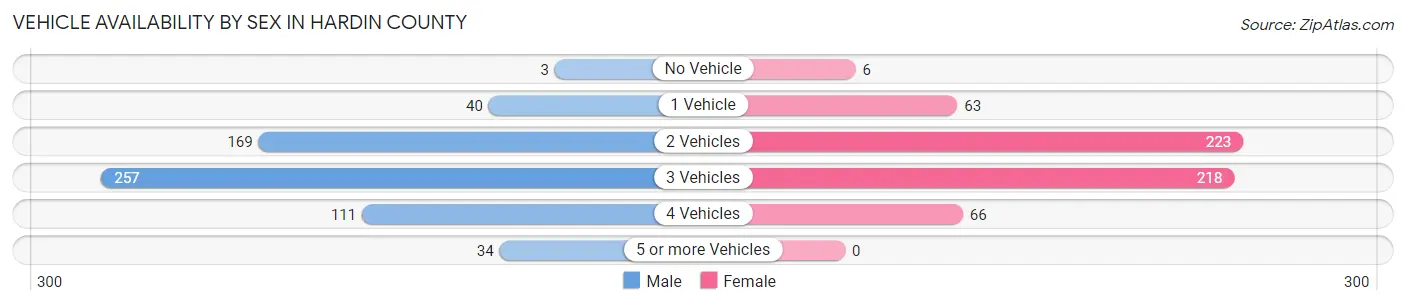
| Vehicles Available | Male | Female |
| No Vehicle | 3 (0.5%) | 6 (1.0%) |
| 1 Vehicle | 40 (6.5%) | 63 (10.9%) |
| 2 Vehicles | 169 (27.5%) | 223 (38.7%) |
| 3 Vehicles | 257 (41.9%) | 218 (37.9%) |
| 4 Vehicles | 111 (18.1%) | 66 (11.5%) |
| 5 or more Vehicles | 34 (5.5%) | 0 (0.0%) |
| Total | 614 (100.0%) | 576 (100.0%) |
Commute Time in Hardin County
The most frequently occuring commute durations in Hardin County are 10 to 14 minutes (151 commuters, 12.7%), 30 to 34 minutes (149 commuters, 12.5%), and 15 to 19 minutes (138 commuters, 11.6%).
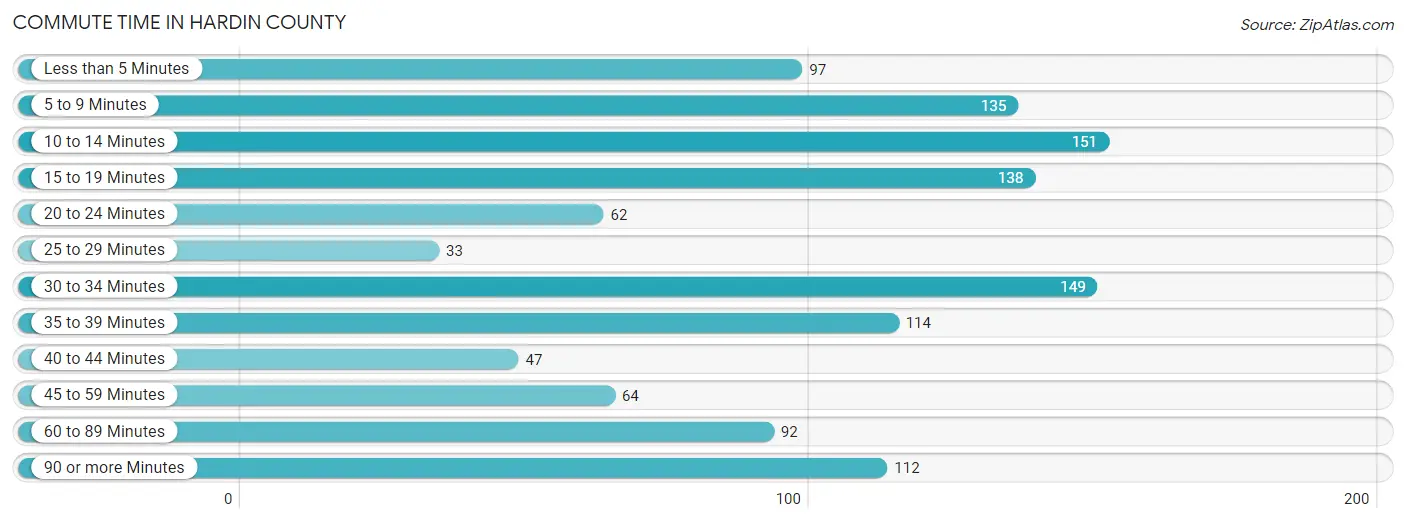
| Commute Time | # Commuters | % Commuters |
| Less than 5 Minutes | 97 | 8.1% |
| 5 to 9 Minutes | 135 | 11.3% |
| 10 to 14 Minutes | 151 | 12.7% |
| 15 to 19 Minutes | 138 | 11.6% |
| 20 to 24 Minutes | 62 | 5.2% |
| 25 to 29 Minutes | 33 | 2.8% |
| 30 to 34 Minutes | 149 | 12.5% |
| 35 to 39 Minutes | 114 | 9.6% |
| 40 to 44 Minutes | 47 | 3.9% |
| 45 to 59 Minutes | 64 | 5.4% |
| 60 to 89 Minutes | 92 | 7.7% |
| 90 or more Minutes | 112 | 9.4% |
Commute Time by Sex in Hardin County
The most common commute times in Hardin County are 30 to 34 minutes (118 commuters, 19.5%) for males and 15 to 19 minutes (102 commuters, 17.3%) for females.
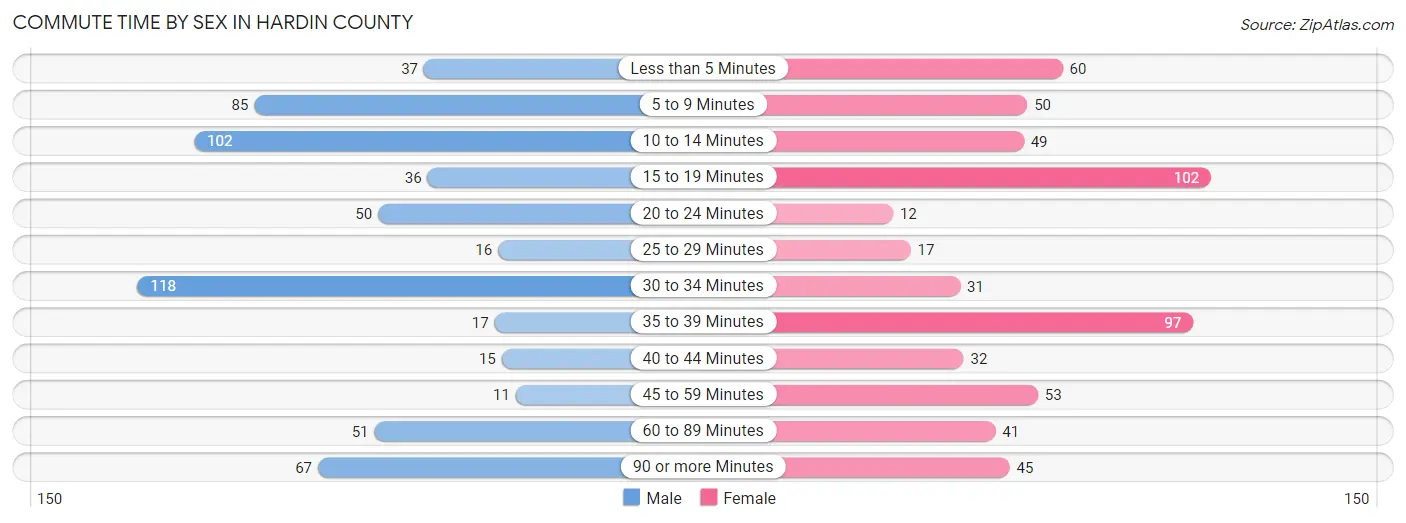
| Commute Time | Male | Female |
| Less than 5 Minutes | 37 (6.1%) | 60 (10.2%) |
| 5 to 9 Minutes | 85 (14.1%) | 50 (8.5%) |
| 10 to 14 Minutes | 102 (16.9%) | 49 (8.3%) |
| 15 to 19 Minutes | 36 (5.9%) | 102 (17.3%) |
| 20 to 24 Minutes | 50 (8.3%) | 12 (2.0%) |
| 25 to 29 Minutes | 16 (2.6%) | 17 (2.9%) |
| 30 to 34 Minutes | 118 (19.5%) | 31 (5.3%) |
| 35 to 39 Minutes | 17 (2.8%) | 97 (16.5%) |
| 40 to 44 Minutes | 15 (2.5%) | 32 (5.4%) |
| 45 to 59 Minutes | 11 (1.8%) | 53 (9.0%) |
| 60 to 89 Minutes | 51 (8.4%) | 41 (7.0%) |
| 90 or more Minutes | 67 (11.1%) | 45 (7.6%) |
Time of Departure to Work by Sex in Hardin County
The most frequent times of departure to work in Hardin County are 6:00 AM to 6:29 AM (123, 20.3%) for males and 8:00 AM to 8:29 AM (116, 19.7%) for females.
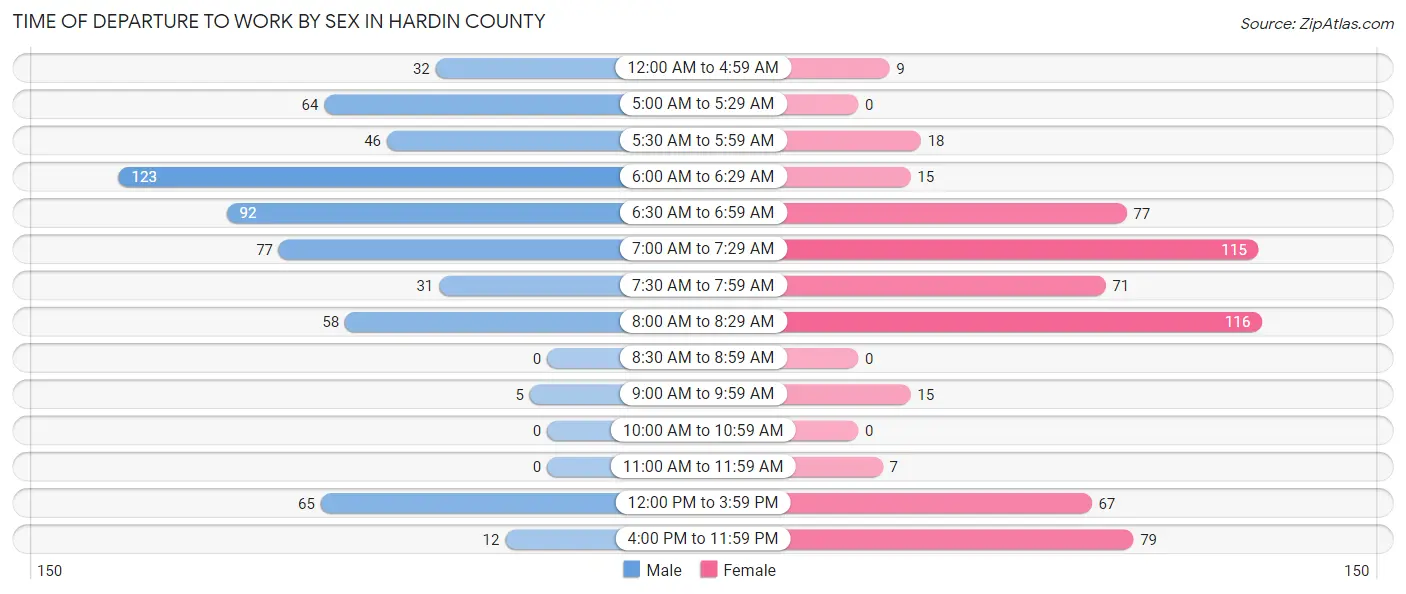
| Time of Departure | Male | Female |
| 12:00 AM to 4:59 AM | 32 (5.3%) | 9 (1.5%) |
| 5:00 AM to 5:29 AM | 64 (10.6%) | 0 (0.0%) |
| 5:30 AM to 5:59 AM | 46 (7.6%) | 18 (3.1%) |
| 6:00 AM to 6:29 AM | 123 (20.3%) | 15 (2.5%) |
| 6:30 AM to 6:59 AM | 92 (15.2%) | 77 (13.1%) |
| 7:00 AM to 7:29 AM | 77 (12.7%) | 115 (19.5%) |
| 7:30 AM to 7:59 AM | 31 (5.1%) | 71 (12.0%) |
| 8:00 AM to 8:29 AM | 58 (9.6%) | 116 (19.7%) |
| 8:30 AM to 8:59 AM | 0 (0.0%) | 0 (0.0%) |
| 9:00 AM to 9:59 AM | 5 (0.8%) | 15 (2.5%) |
| 10:00 AM to 10:59 AM | 0 (0.0%) | 0 (0.0%) |
| 11:00 AM to 11:59 AM | 0 (0.0%) | 7 (1.2%) |
| 12:00 PM to 3:59 PM | 65 (10.7%) | 67 (11.4%) |
| 4:00 PM to 11:59 PM | 12 (2.0%) | 79 (13.4%) |
| Total | 605 (100.0%) | 589 (100.0%) |
Housing Occupancy in Hardin County
Occupancy by Ownership in Hardin County
Of the total 1,480 dwellings in Hardin County, owner-occupied units account for 1,186 (80.1%), while renter-occupied units make up 294 (19.9%).
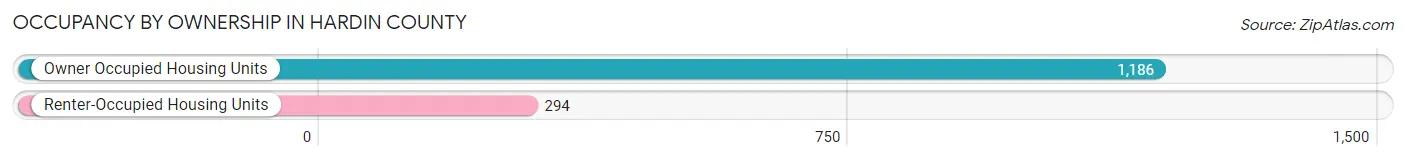
| Occupancy | # Housing Units | % Housing Units |
| Owner Occupied Housing Units | 1,186 | 80.1% |
| Renter-Occupied Housing Units | 294 | 19.9% |
| Total Occupied Housing Units | 1,480 | 100.0% |
Occupancy by Household Size in Hardin County
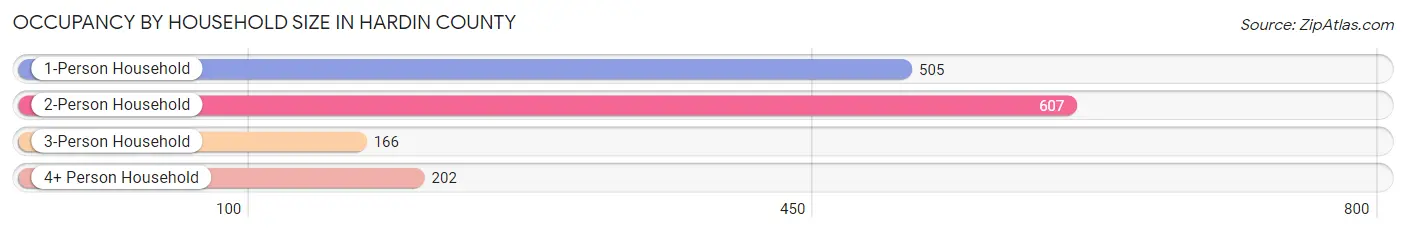
| Household Size | # Housing Units | % Housing Units |
| 1-Person Household | 505 | 34.1% |
| 2-Person Household | 607 | 41.0% |
| 3-Person Household | 166 | 11.2% |
| 4+ Person Household | 202 | 13.7% |
| Total Housing Units | 1,480 | 100.0% |
Occupancy by Ownership by Household Size in Hardin County
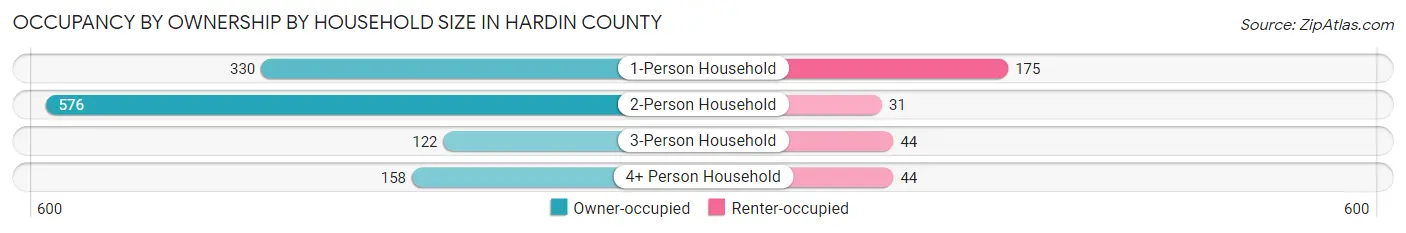
| Household Size | Owner-occupied | Renter-occupied |
| 1-Person Household | 330 (65.3%) | 175 (34.6%) |
| 2-Person Household | 576 (94.9%) | 31 (5.1%) |
| 3-Person Household | 122 (73.5%) | 44 (26.5%) |
| 4+ Person Household | 158 (78.2%) | 44 (21.8%) |
| Total Housing Units | 1,186 (80.1%) | 294 (19.9%) |
Occupancy by Educational Attainment in Hardin County
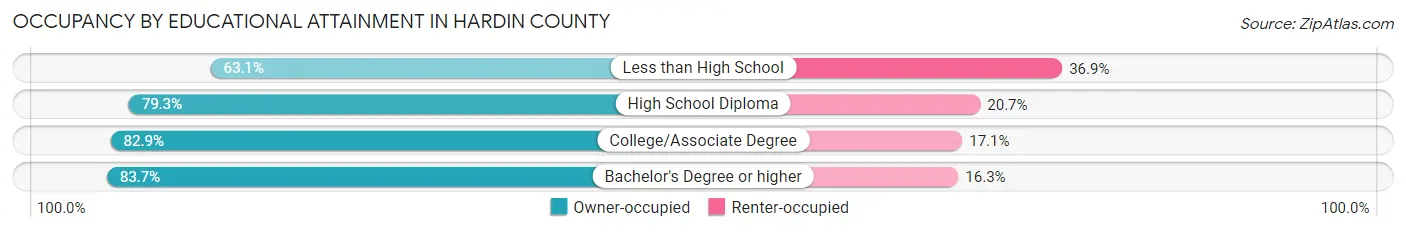
| Household Size | Owner-occupied | Renter-occupied |
| Less than High School | 77 (63.1%) | 45 (36.9%) |
| High School Diploma | 411 (79.3%) | 107 (20.7%) |
| College/Associate Degree | 544 (82.9%) | 112 (17.1%) |
| Bachelor's Degree or higher | 154 (83.7%) | 30 (16.3%) |
Occupancy by Age of Householder in Hardin County
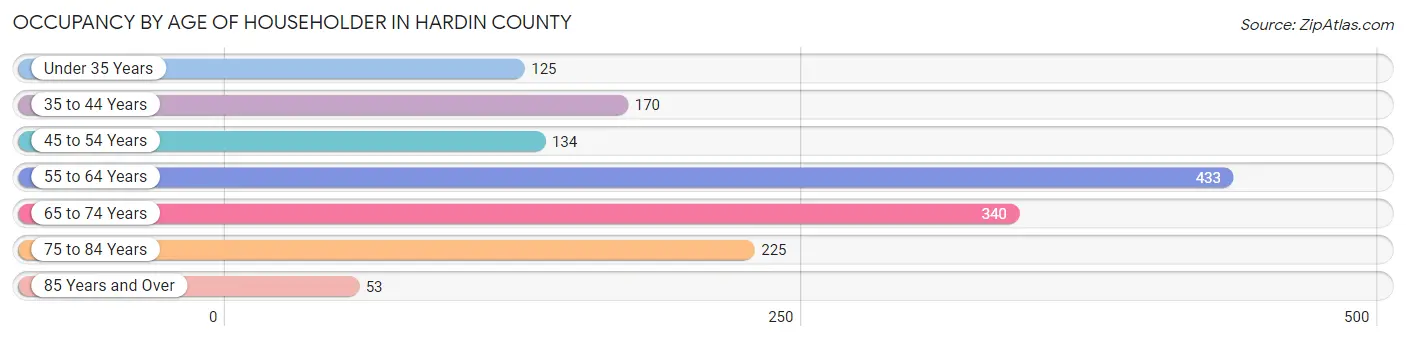
| Age Bracket | # Households | % Households |
| Under 35 Years | 125 | 8.5% |
| 35 to 44 Years | 170 | 11.5% |
| 45 to 54 Years | 134 | 9.0% |
| 55 to 64 Years | 433 | 29.3% |
| 65 to 74 Years | 340 | 23.0% |
| 75 to 84 Years | 225 | 15.2% |
| 85 Years and Over | 53 | 3.6% |
| Total | 1,480 | 100.0% |
Housing Finances in Hardin County
Median Income by Occupancy in Hardin County
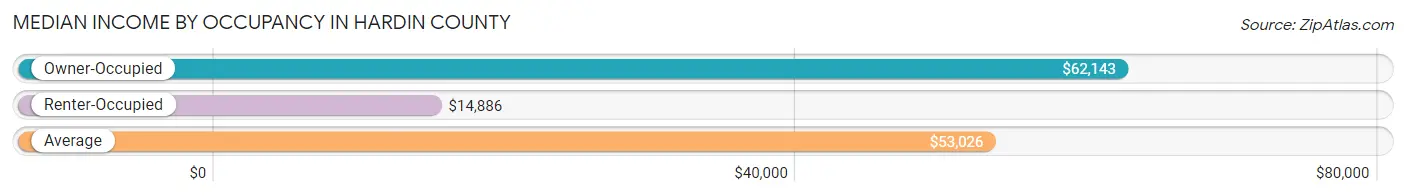
| Occupancy Type | # Households | Median Income |
| Owner-Occupied | 1,186 (80.1%) | $62,143 |
| Renter-Occupied | 294 (19.9%) | $14,886 |
| Average | 1,480 (100.0%) | $53,026 |
Occupancy by Householder Income Bracket in Hardin County
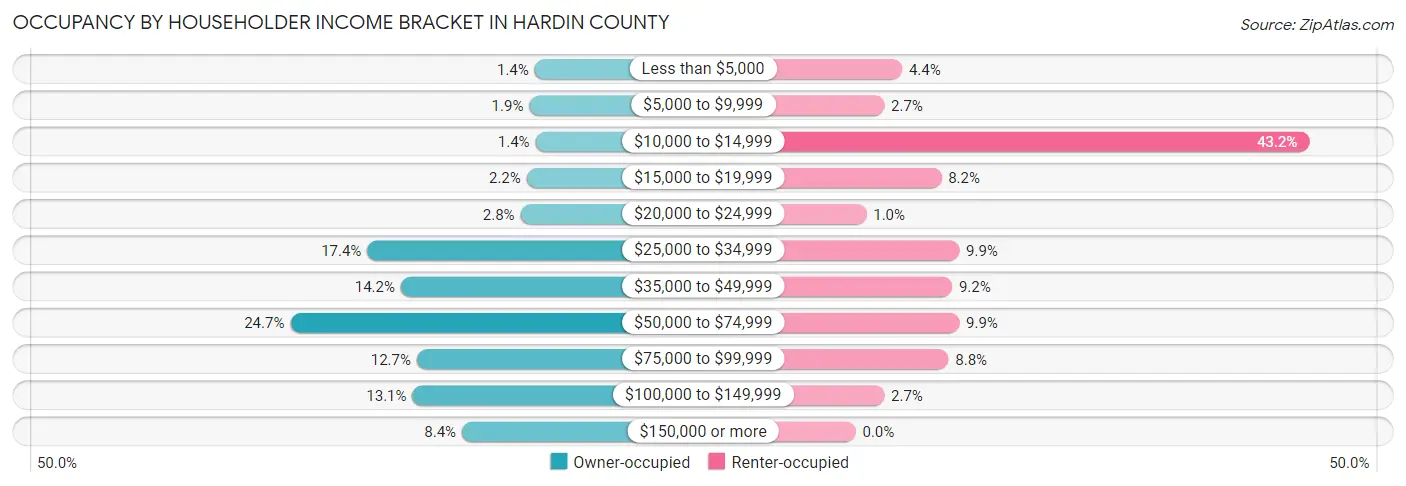
| Income Bracket | Owner-occupied | Renter-occupied |
| Less than $5,000 | 17 (1.4%) | 13 (4.4%) |
| $5,000 to $9,999 | 23 (1.9%) | 8 (2.7%) |
| $10,000 to $14,999 | 16 (1.3%) | 127 (43.2%) |
| $15,000 to $19,999 | 26 (2.2%) | 24 (8.2%) |
| $20,000 to $24,999 | 33 (2.8%) | 3 (1.0%) |
| $25,000 to $34,999 | 206 (17.4%) | 29 (9.9%) |
| $35,000 to $49,999 | 168 (14.2%) | 27 (9.2%) |
| $50,000 to $74,999 | 293 (24.7%) | 29 (9.9%) |
| $75,000 to $99,999 | 150 (12.7%) | 26 (8.8%) |
| $100,000 to $149,999 | 155 (13.1%) | 8 (2.7%) |
| $150,000 or more | 99 (8.4%) | 0 (0.0%) |
| Total | 1,186 (100.0%) | 294 (100.0%) |
Monthly Housing Cost Tiers in Hardin County
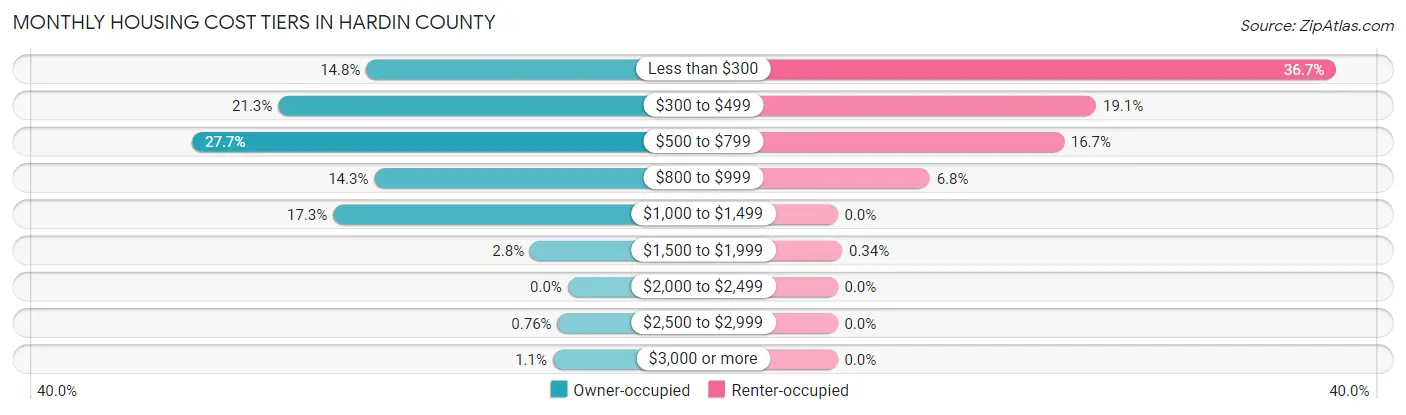
| Monthly Cost | Owner-occupied | Renter-occupied |
| Less than $300 | 176 (14.8%) | 108 (36.7%) |
| $300 to $499 | 253 (21.3%) | 56 (19.1%) |
| $500 to $799 | 328 (27.7%) | 49 (16.7%) |
| $800 to $999 | 169 (14.2%) | 20 (6.8%) |
| $1,000 to $1,499 | 205 (17.3%) | 0 (0.0%) |
| $1,500 to $1,999 | 33 (2.8%) | 1 (0.3%) |
| $2,000 to $2,499 | 0 (0.0%) | 0 (0.0%) |
| $2,500 to $2,999 | 9 (0.8%) | 0 (0.0%) |
| $3,000 or more | 13 (1.1%) | 0 (0.0%) |
| Total | 1,186 (100.0%) | 294 (100.0%) |
Physical Housing Characteristics in Hardin County
Housing Structures in Hardin County
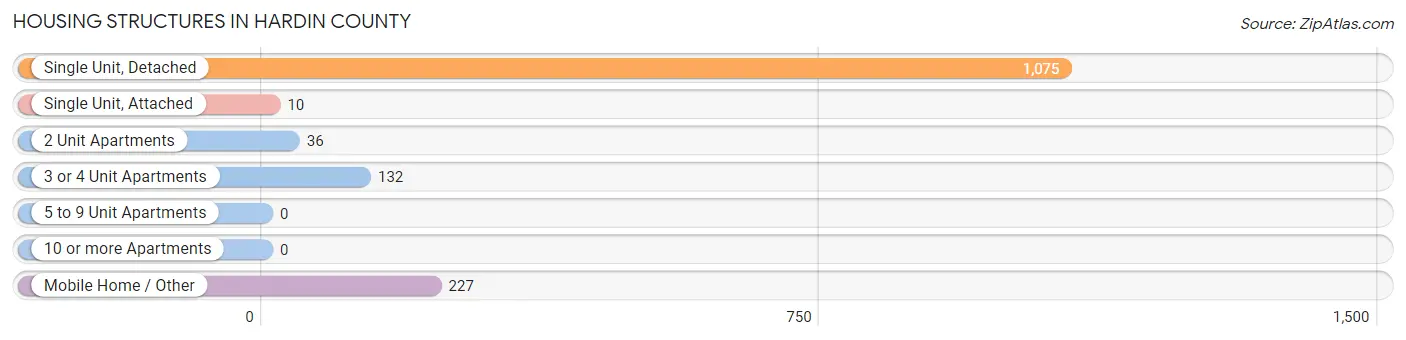
| Structure Type | # Housing Units | % Housing Units |
| Single Unit, Detached | 1,075 | 72.6% |
| Single Unit, Attached | 10 | 0.7% |
| 2 Unit Apartments | 36 | 2.4% |
| 3 or 4 Unit Apartments | 132 | 8.9% |
| 5 to 9 Unit Apartments | 0 | 0.0% |
| 10 or more Apartments | 0 | 0.0% |
| Mobile Home / Other | 227 | 15.3% |
| Total | 1,480 | 100.0% |
Housing Structures by Occupancy in Hardin County
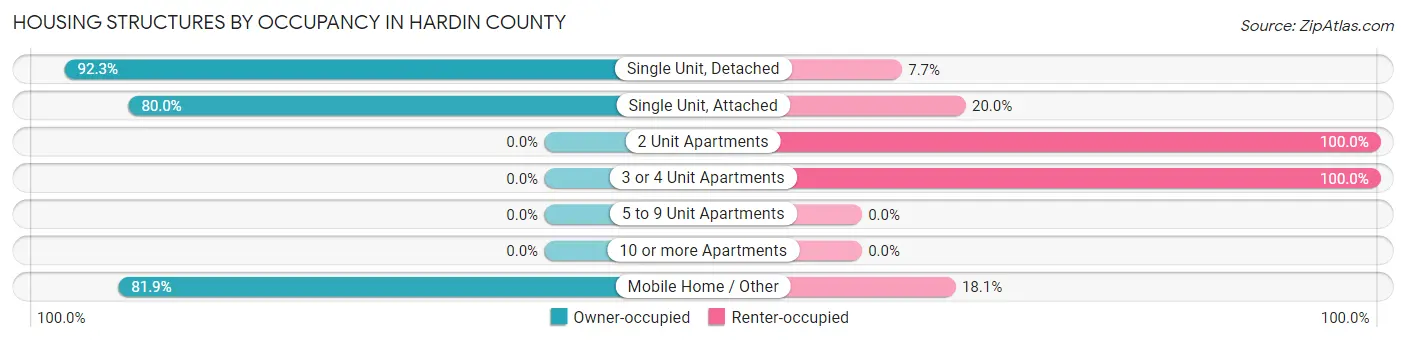
| Structure Type | Owner-occupied | Renter-occupied |
| Single Unit, Detached | 992 (92.3%) | 83 (7.7%) |
| Single Unit, Attached | 8 (80.0%) | 2 (20.0%) |
| 2 Unit Apartments | 0 (0.0%) | 36 (100.0%) |
| 3 or 4 Unit Apartments | 0 (0.0%) | 132 (100.0%) |
| 5 to 9 Unit Apartments | 0 (0.0%) | 0 (0.0%) |
| 10 or more Apartments | 0 (0.0%) | 0 (0.0%) |
| Mobile Home / Other | 186 (81.9%) | 41 (18.1%) |
| Total | 1,186 (80.1%) | 294 (19.9%) |
Housing Structures by Number of Rooms in Hardin County
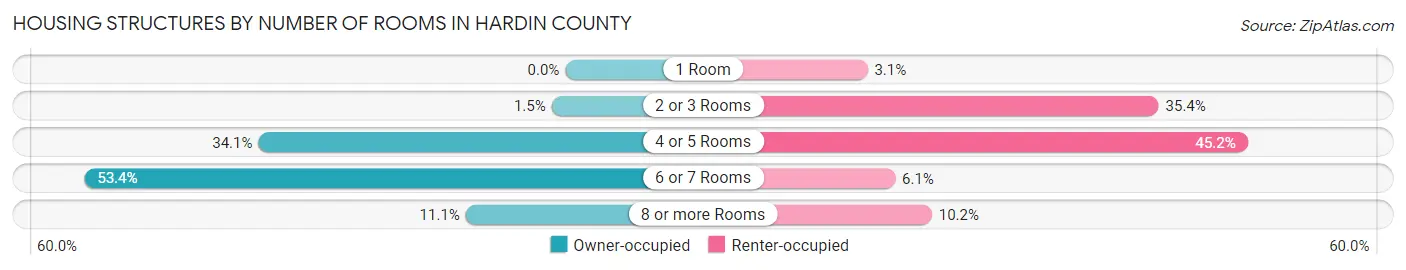
| Number of Rooms | Owner-occupied | Renter-occupied |
| 1 Room | 0 (0.0%) | 9 (3.1%) |
| 2 or 3 Rooms | 18 (1.5%) | 104 (35.4%) |
| 4 or 5 Rooms | 404 (34.1%) | 133 (45.2%) |
| 6 or 7 Rooms | 633 (53.4%) | 18 (6.1%) |
| 8 or more Rooms | 131 (11.1%) | 30 (10.2%) |
| Total | 1,186 (100.0%) | 294 (100.0%) |
Housing Structure by Heating Type in Hardin County
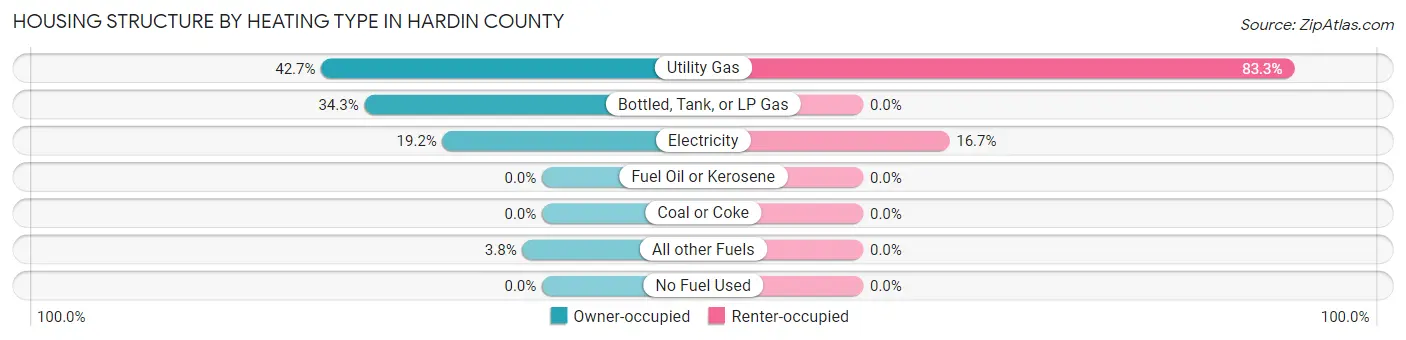
| Heating Type | Owner-occupied | Renter-occupied |
| Utility Gas | 506 (42.7%) | 245 (83.3%) |
| Bottled, Tank, or LP Gas | 407 (34.3%) | 0 (0.0%) |
| Electricity | 228 (19.2%) | 49 (16.7%) |
| Fuel Oil or Kerosene | 0 (0.0%) | 0 (0.0%) |
| Coal or Coke | 0 (0.0%) | 0 (0.0%) |
| All other Fuels | 45 (3.8%) | 0 (0.0%) |
| No Fuel Used | 0 (0.0%) | 0 (0.0%) |
| Total | 1,186 (100.0%) | 294 (100.0%) |
Household Vehicle Usage in Hardin County
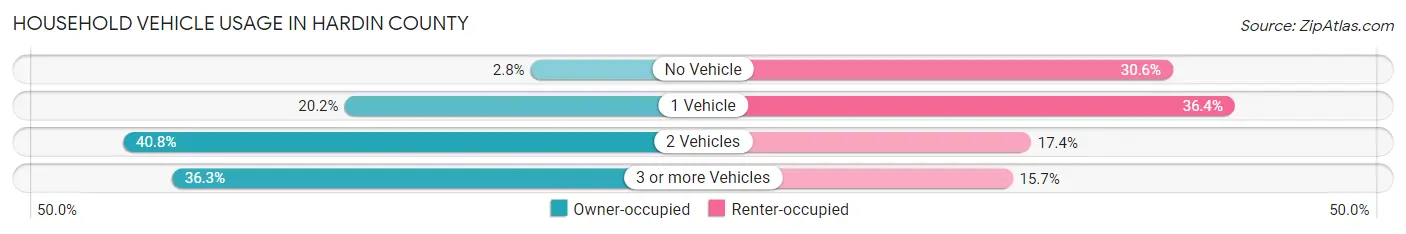
| Vehicles per Household | Owner-occupied | Renter-occupied |
| No Vehicle | 33 (2.8%) | 90 (30.6%) |
| 1 Vehicle | 239 (20.2%) | 107 (36.4%) |
| 2 Vehicles | 484 (40.8%) | 51 (17.3%) |
| 3 or more Vehicles | 430 (36.3%) | 46 (15.7%) |
| Total | 1,186 (100.0%) | 294 (100.0%) |
Real Estate & Mortgages in Hardin County
Real Estate and Mortgage Overview in Hardin County
| Characteristic | Without Mortgage | With Mortgage |
| Housing Units | 778 | 408 |
| Median Property Value | $79,600 | $100,600 |
| Median Household Income | $55,489 | $48 |
| Monthly Housing Costs | $483 | $13 |
| Real Estate Taxes | $952 | $6 |
Property Value by Mortgage Status in Hardin County
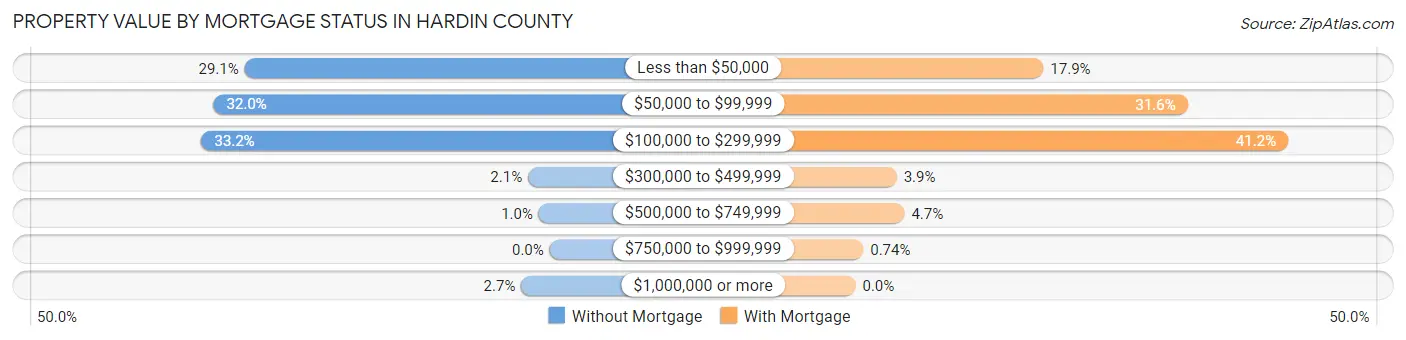
| Property Value | Without Mortgage | With Mortgage |
| Less than $50,000 | 226 (29.0%) | 73 (17.9%) |
| $50,000 to $99,999 | 249 (32.0%) | 129 (31.6%) |
| $100,000 to $299,999 | 258 (33.2%) | 168 (41.2%) |
| $300,000 to $499,999 | 16 (2.1%) | 16 (3.9%) |
| $500,000 to $749,999 | 8 (1.0%) | 19 (4.7%) |
| $750,000 to $999,999 | 0 (0.0%) | 3 (0.7%) |
| $1,000,000 or more | 21 (2.7%) | 0 (0.0%) |
| Total | 778 (100.0%) | 408 (100.0%) |
Household Income by Mortgage Status in Hardin County
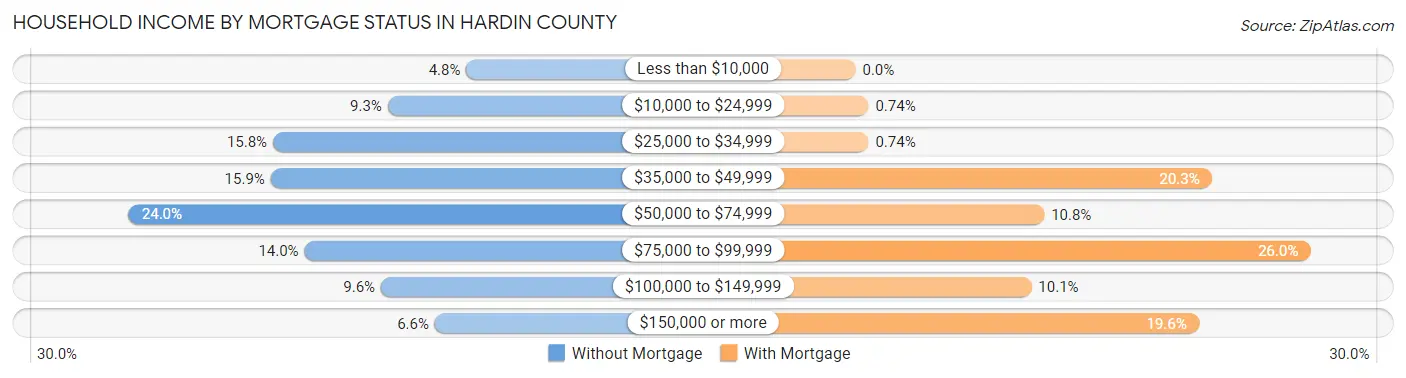
| Household Income | Without Mortgage | With Mortgage |
| Less than $10,000 | 37 (4.8%) | 0 (0.0%) |
| $10,000 to $24,999 | 72 (9.2%) | 3 (0.7%) |
| $25,000 to $34,999 | 123 (15.8%) | 3 (0.7%) |
| $35,000 to $49,999 | 124 (15.9%) | 83 (20.3%) |
| $50,000 to $74,999 | 187 (24.0%) | 44 (10.8%) |
| $75,000 to $99,999 | 109 (14.0%) | 106 (26.0%) |
| $100,000 to $149,999 | 75 (9.6%) | 41 (10.1%) |
| $150,000 or more | 51 (6.6%) | 80 (19.6%) |
| Total | 778 (100.0%) | 408 (100.0%) |
Property Value to Household Income Ratio in Hardin County
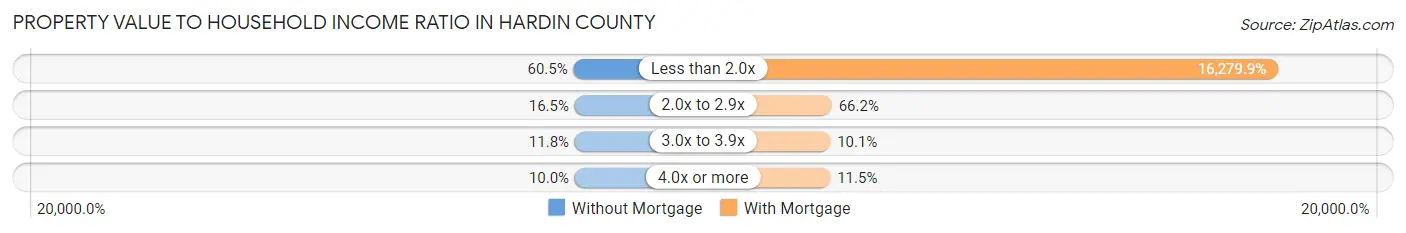
| Value-to-Income Ratio | Without Mortgage | With Mortgage |
| Less than 2.0x | 471 (60.5%) | 66,422 (16,279.9%) |
| 2.0x to 2.9x | 128 (16.5%) | 270 (66.2%) |
| 3.0x to 3.9x | 92 (11.8%) | 41 (10.1%) |
| 4.0x or more | 78 (10.0%) | 47 (11.5%) |
| Total | 778 (100.0%) | 408 (100.0%) |
Real Estate Taxes by Mortgage Status in Hardin County
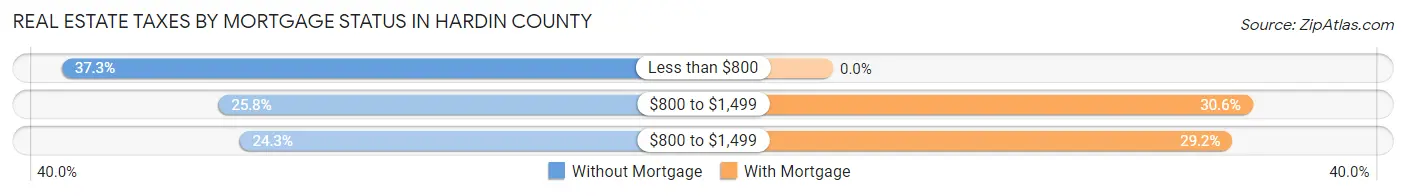
| Property Taxes | Without Mortgage | With Mortgage |
| Less than $800 | 290 (37.3%) | 0 (0.0%) |
| $800 to $1,499 | 201 (25.8%) | 125 (30.6%) |
| $800 to $1,499 | 189 (24.3%) | 119 (29.2%) |
| Total | 778 (100.0%) | 408 (100.0%) |
Health & Disability in Hardin County
Health Insurance Coverage by Age in Hardin County
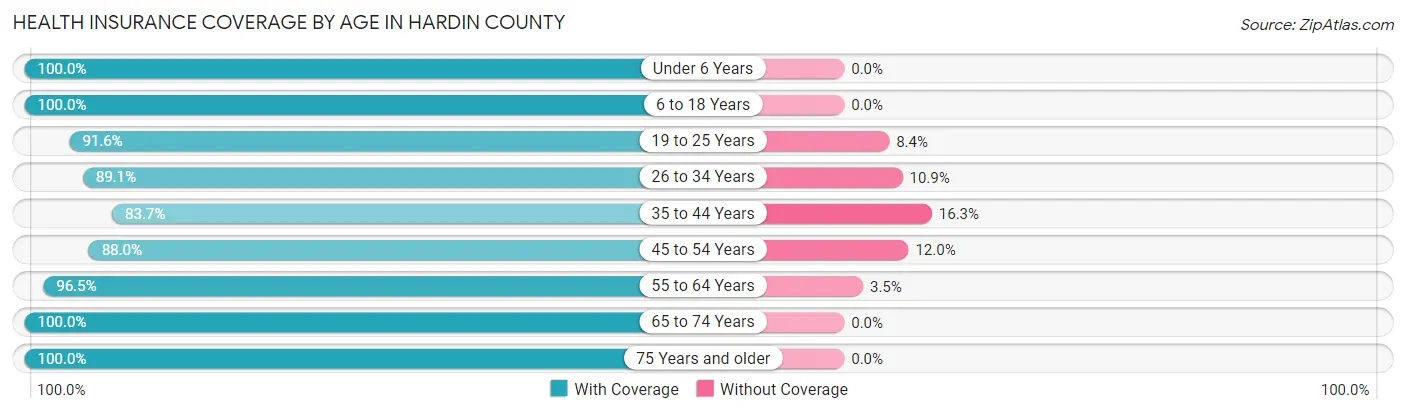
| Age Bracket | With Coverage | Without Coverage |
| Under 6 Years | 109 (100.0%) | 0 (0.0%) |
| 6 to 18 Years | 402 (100.0%) | 0 (0.0%) |
| 19 to 25 Years | 197 (91.6%) | 18 (8.4%) |
| 26 to 34 Years | 238 (89.1%) | 29 (10.9%) |
| 35 to 44 Years | 328 (83.7%) | 64 (16.3%) |
| 45 to 54 Years | 397 (88.0%) | 54 (12.0%) |
| 55 to 64 Years | 608 (96.5%) | 22 (3.5%) |
| 65 to 74 Years | 643 (100.0%) | 0 (0.0%) |
| 75 Years and older | 493 (100.0%) | 0 (0.0%) |
| Total | 3,415 (94.8%) | 187 (5.2%) |
Health Insurance Coverage by Citizenship Status in Hardin County
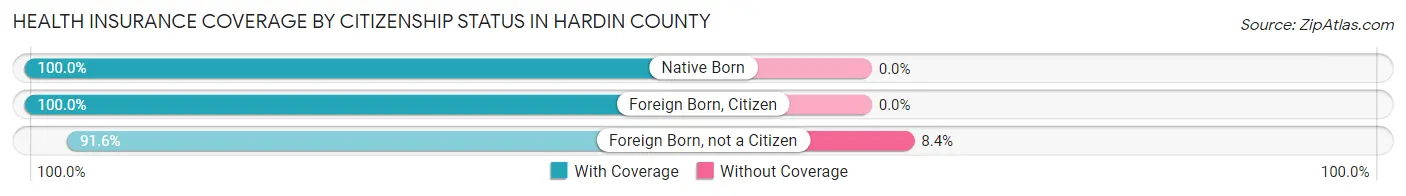
| Citizenship Status | With Coverage | Without Coverage |
| Native Born | 109 (100.0%) | 0 (0.0%) |
| Foreign Born, Citizen | 402 (100.0%) | 0 (0.0%) |
| Foreign Born, not a Citizen | 197 (91.6%) | 18 (8.4%) |
Health Insurance Coverage by Household Income in Hardin County
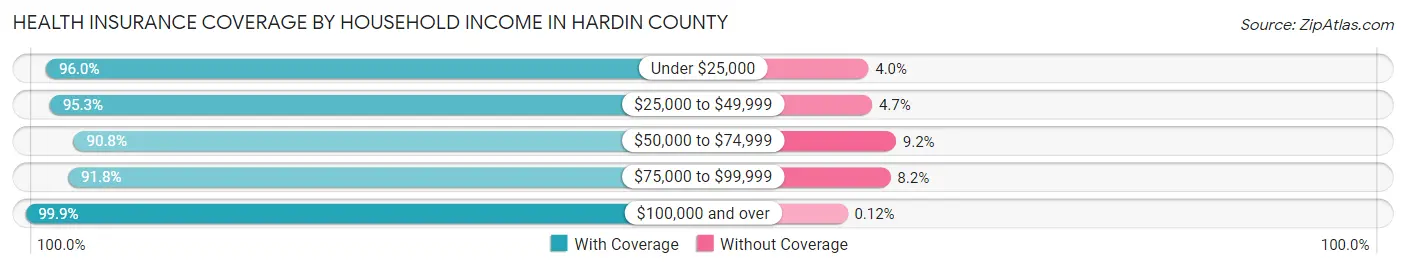
| Household Income | With Coverage | Without Coverage |
| Under $25,000 | 357 (96.0%) | 15 (4.0%) |
| $25,000 to $49,999 | 829 (95.3%) | 41 (4.7%) |
| $50,000 to $74,999 | 761 (90.8%) | 77 (9.2%) |
| $75,000 to $99,999 | 596 (91.8%) | 53 (8.2%) |
| $100,000 and over | 846 (99.9%) | 1 (0.1%) |
Public vs Private Health Insurance Coverage by Age in Hardin County
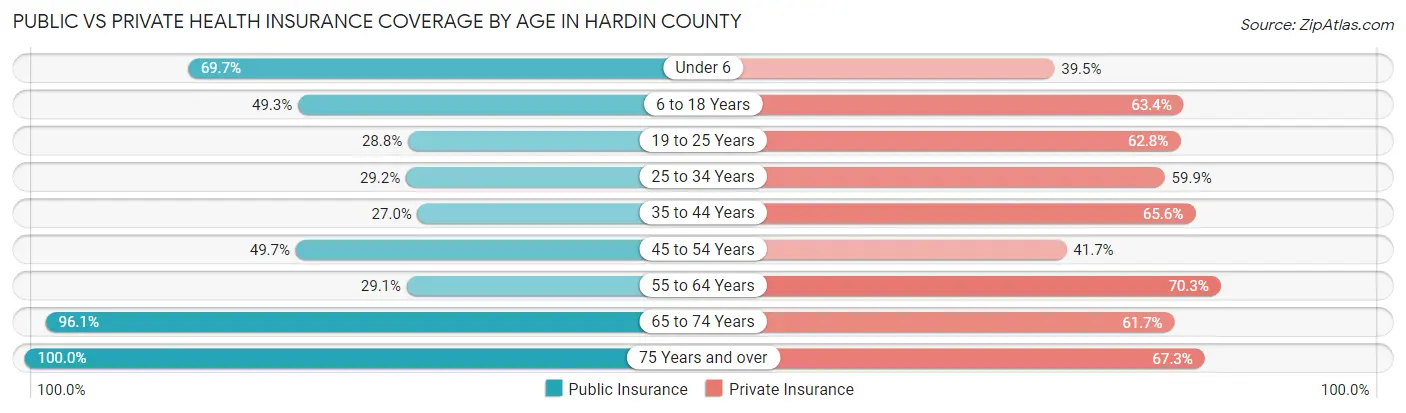
| Age Bracket | Public Insurance | Private Insurance |
| Under 6 | 76 (69.7%) | 43 (39.5%) |
| 6 to 18 Years | 198 (49.2%) | 255 (63.4%) |
| 19 to 25 Years | 62 (28.8%) | 135 (62.8%) |
| 25 to 34 Years | 78 (29.2%) | 160 (59.9%) |
| 35 to 44 Years | 106 (27.0%) | 257 (65.6%) |
| 45 to 54 Years | 224 (49.7%) | 188 (41.7%) |
| 55 to 64 Years | 183 (29.0%) | 443 (70.3%) |
| 65 to 74 Years | 618 (96.1%) | 397 (61.7%) |
| 75 Years and over | 493 (100.0%) | 332 (67.3%) |
| Total | 2,038 (56.6%) | 2,210 (61.4%) |
Disability Status by Sex by Age in Hardin County
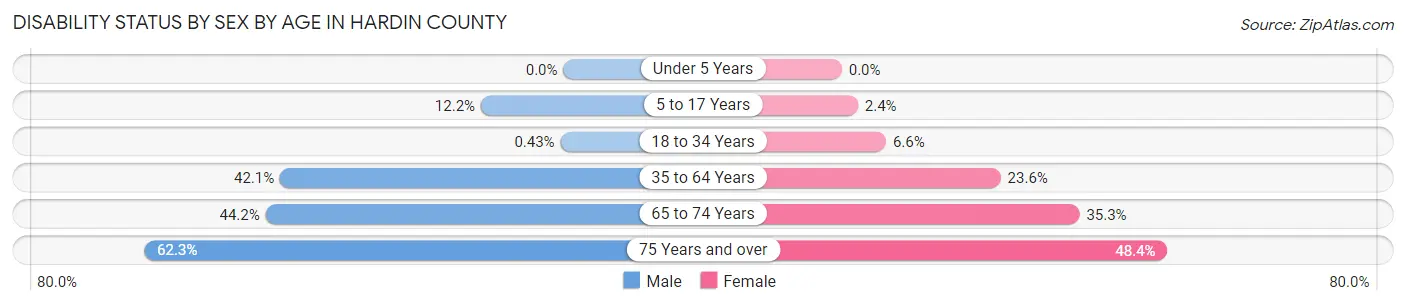
| Age Bracket | Male | Female |
| Under 5 Years | 0 (0.0%) | 0 (0.0%) |
| 5 to 17 Years | 24 (12.2%) | 5 (2.4%) |
| 18 to 34 Years | 1 (0.4%) | 17 (6.6%) |
| 35 to 64 Years | 329 (42.1%) | 163 (23.6%) |
| 65 to 74 Years | 134 (44.2%) | 120 (35.3%) |
| 75 Years and over | 137 (62.3%) | 132 (48.3%) |
Disability Class by Sex by Age in Hardin County
Disability Class: Hearing Difficulty
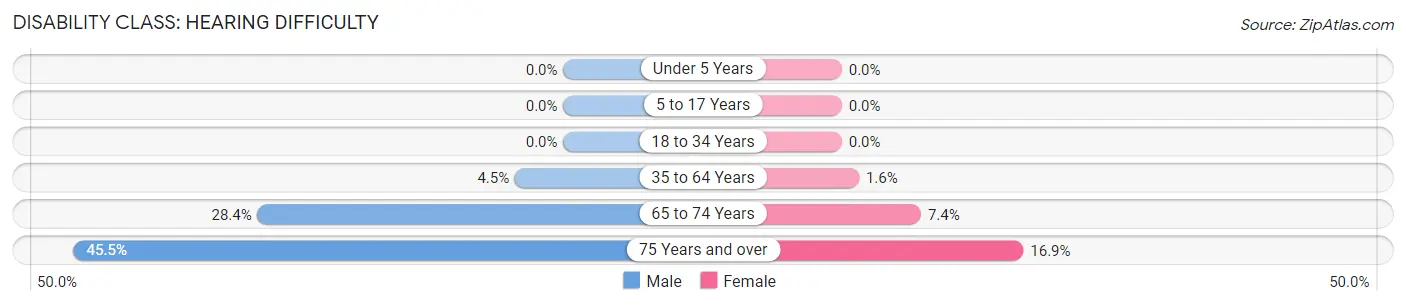
| Age Bracket | Male | Female |
| Under 5 Years | 0 (0.0%) | 0 (0.0%) |
| 5 to 17 Years | 0 (0.0%) | 0 (0.0%) |
| 18 to 34 Years | 0 (0.0%) | 0 (0.0%) |
| 35 to 64 Years | 35 (4.5%) | 11 (1.6%) |
| 65 to 74 Years | 86 (28.4%) | 25 (7.3%) |
| 75 Years and over | 100 (45.5%) | 46 (16.9%) |
Disability Class: Vision Difficulty
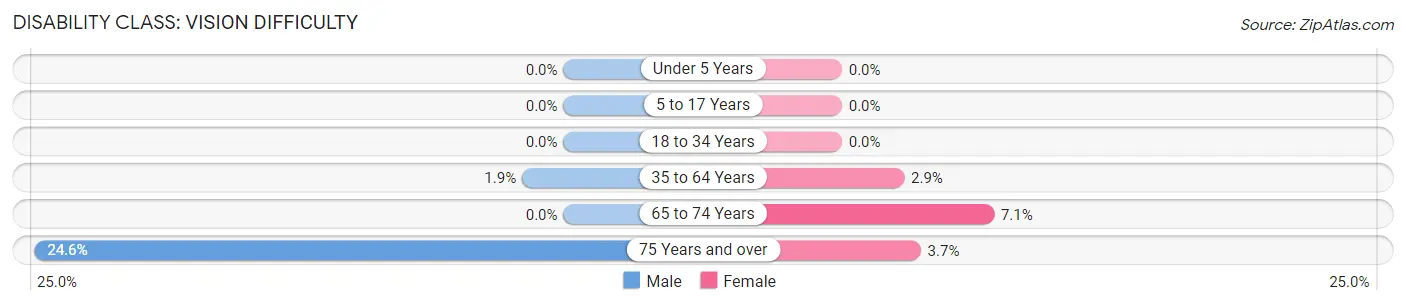
| Age Bracket | Male | Female |
| Under 5 Years | 0 (0.0%) | 0 (0.0%) |
| 5 to 17 Years | 0 (0.0%) | 0 (0.0%) |
| 18 to 34 Years | 0 (0.0%) | 0 (0.0%) |
| 35 to 64 Years | 15 (1.9%) | 20 (2.9%) |
| 65 to 74 Years | 0 (0.0%) | 24 (7.1%) |
| 75 Years and over | 54 (24.5%) | 10 (3.7%) |
Disability Class: Cognitive Difficulty
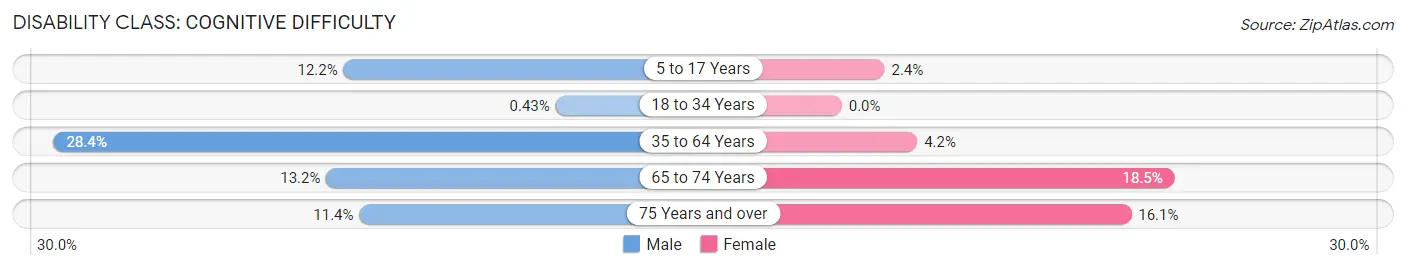
| Age Bracket | Male | Female |
| 5 to 17 Years | 24 (12.2%) | 5 (2.4%) |
| 18 to 34 Years | 1 (0.4%) | 0 (0.0%) |
| 35 to 64 Years | 222 (28.4%) | 29 (4.2%) |
| 65 to 74 Years | 40 (13.2%) | 63 (18.5%) |
| 75 Years and over | 25 (11.4%) | 44 (16.1%) |
Disability Class: Ambulatory Difficulty
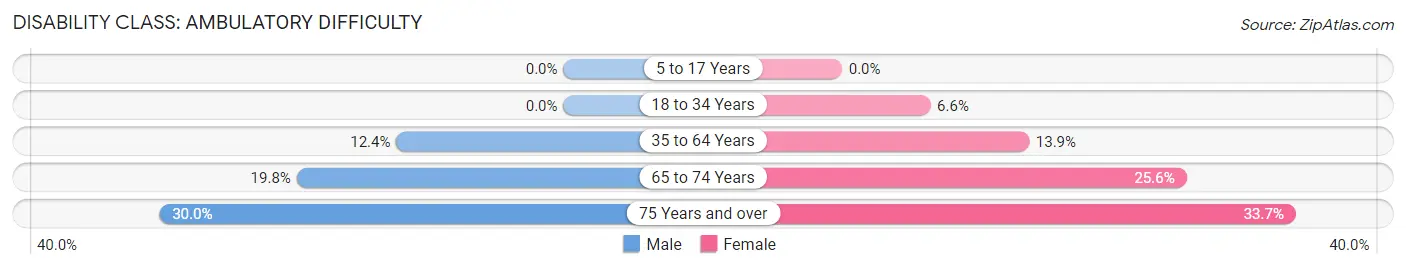
| Age Bracket | Male | Female |
| 5 to 17 Years | 0 (0.0%) | 0 (0.0%) |
| 18 to 34 Years | 0 (0.0%) | 17 (6.6%) |
| 35 to 64 Years | 97 (12.4%) | 96 (13.9%) |
| 65 to 74 Years | 60 (19.8%) | 87 (25.6%) |
| 75 Years and over | 66 (30.0%) | 92 (33.7%) |
Disability Class: Self-Care Difficulty
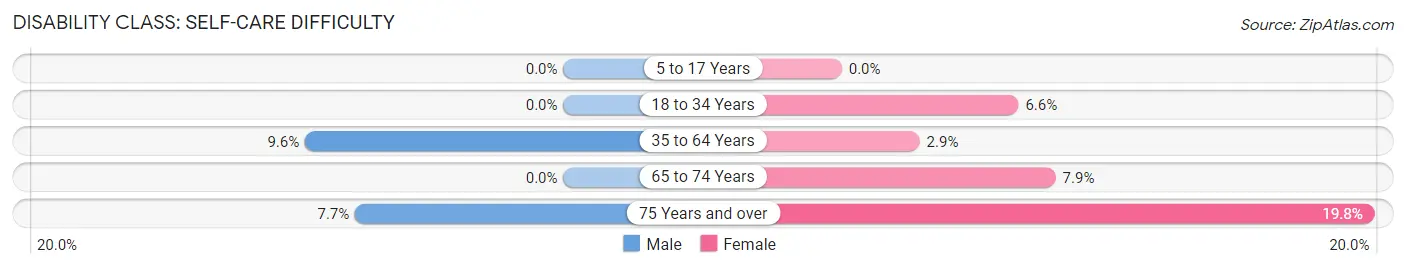
| Age Bracket | Male | Female |
| 5 to 17 Years | 0 (0.0%) | 0 (0.0%) |
| 18 to 34 Years | 0 (0.0%) | 17 (6.6%) |
| 35 to 64 Years | 75 (9.6%) | 20 (2.9%) |
| 65 to 74 Years | 0 (0.0%) | 27 (7.9%) |
| 75 Years and over | 17 (7.7%) | 54 (19.8%) |
Technology Access in Hardin County
Computing Device Access in Hardin County
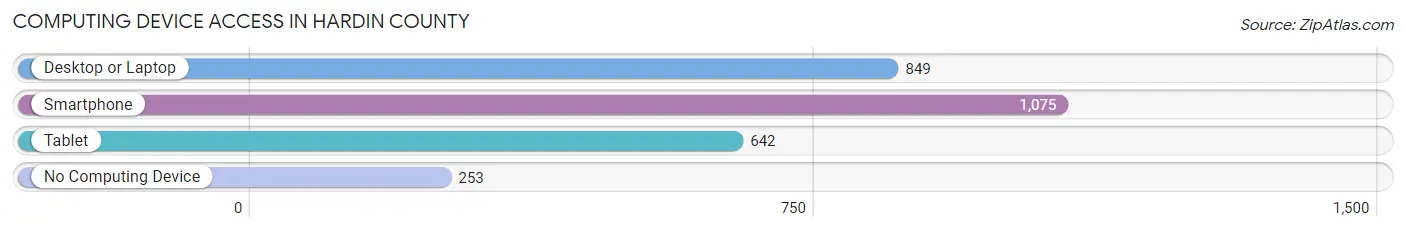
| Device Type | # Households | % Households |
| Desktop or Laptop | 849 | 57.4% |
| Smartphone | 1,075 | 72.6% |
| Tablet | 642 | 43.4% |
| No Computing Device | 253 | 17.1% |
| Total | 1,480 | 100.0% |
Internet Access in Hardin County
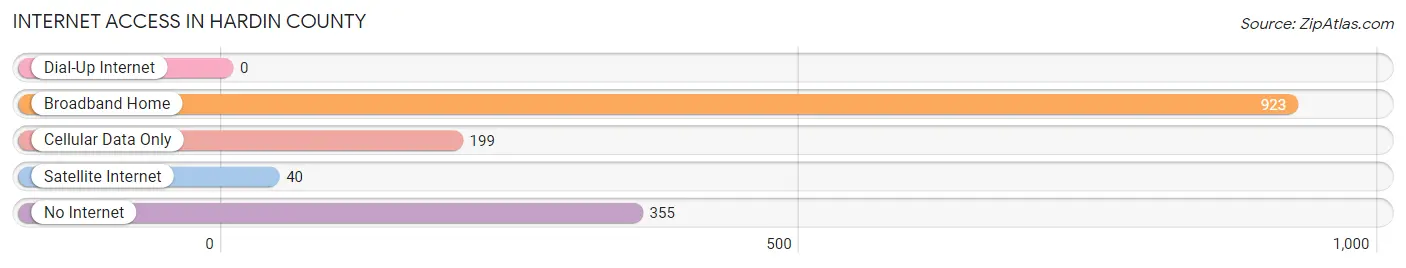
| Internet Type | # Households | % Households |
| Dial-Up Internet | 0 | 0.0% |
| Broadband Home | 923 | 62.4% |
| Cellular Data Only | 199 | 13.5% |
| Satellite Internet | 40 | 2.7% |
| No Internet | 355 | 24.0% |
| Total | 1,480 | 100.0% |
Hardin County Summary
Hardin County is located in the southeastern corner of Illinois, and is part of the Shawnee National Forest. It is bordered by Pope County to the north, Saline County to the east, Gallatin County to the south, and White County to the west. The county seat is Elizabethtown, and the county has a total area of 517 square miles.
History
Hardin County was formed in 1839 from Pope and Gallatin counties. It was named after John Hardin, a Revolutionary War soldier and Kentucky legislator. The county was originally settled by Native Americans, including the Shawnee, Kickapoo, and Piankeshaw tribes. The first European settlers arrived in the early 1800s, and the county was officially organized in 1839.
The county was largely agricultural in its early years, with corn, wheat, and oats being the main crops. The county also had a thriving timber industry, with the Shawnee National Forest providing a steady supply of lumber. The county also had a number of coal mines, which provided employment for many of the county’s residents.
Geography
Hardin County is located in the southeastern corner of Illinois, and is part of the Shawnee National Forest. It is bordered by Pope County to the north, Saline County to the east, Gallatin County to the south, and White County to the west. The county seat is Elizabethtown, and the county has a total area of 517 square miles.
The terrain of Hardin County is mostly rolling hills, with some flat areas in the northern part of the county. The county is drained by the Saline River, which flows through the county from north to south. The county is also home to several small lakes, including Lake Glendale and Lake Hardin.
Economy
The economy of Hardin County is largely based on agriculture and forestry. The county is home to a number of farms, which produce corn, wheat, oats, soybeans, and hay. The county also has a thriving timber industry, with the Shawnee National Forest providing a steady supply of lumber.
The county also has a number of coal mines, which provide employment for many of the county’s residents. The county also has a number of manufacturing businesses, including a furniture factory and a plastics plant. The county also has a number of small businesses, including restaurants, retail stores, and service providers.
Demographics
As of the 2010 census, Hardin County had a population of 17,945. The population was spread out, with 48.3% male and 51.7% female. The median age was 41.7 years. The racial makeup of the county was 97.2% White, 0.7% African American, 0.3% Native American, 0.2% Asian, 0.1% Pacific Islander, 0.5% from other races, and 1.0% from two or more races.
The median household income in Hardin County was $41,945, and the median family income was $50,945. The per capita income was $20,945. About 11.2% of the population was below the poverty line.
Hardin County is a rural county with a strong agricultural and forestry base. The county has a diverse economy, with a number of small businesses and manufacturing plants. The county also has a number of recreational opportunities, including the Shawnee National Forest and several small lakes. The county is also home to a number of historical sites, including the Hardin County Courthouse and the Elizabethtown Historic District.
Common Questions
What is Per Capita Income in Hardin County?
Per Capita income in Hardin County is $31,928.
What is the Median Family Income in Hardin County?
Median Family Income in Hardin County is $65,778.
What is the Median Household income in Hardin County?
Median Household Income in Hardin County is $53,026.
What is Income or Wage Gap in Hardin County?
Income or Wage Gap in Hardin County is 32.1%.
Women in Hardin County earn 67.9 cents for every dollar earned by a man.
What is Family Income Deficit in Hardin County?
Family Income Deficit in Hardin County is $12,862.
Families that are below poverty line in Hardin County earn $12,862 less on average than the poverty threshold level.
What is Inequality or Gini Index in Hardin County?
Inequality or Gini Index in Hardin County is 0.47.
What is the Total Population of Hardin County?
Total Population of Hardin County is 3,665.
What is the Total Male Population of Hardin County?
Total Male Population of Hardin County is 1,846.
What is the Total Female Population of Hardin County?
Total Female Population of Hardin County is 1,819.
What is the Ratio of Males per 100 Females in Hardin County?
There are 101.48 Males per 100 Females in Hardin County.
What is the Ratio of Females per 100 Males in Hardin County?
There are 98.54 Females per 100 Males in Hardin County.
What is the Median Population Age in Hardin County?
Median Population Age in Hardin County is 53.9 Years.
What is the Average Family Size in Hardin County
Average Family Size in Hardin County is 3.1 People.
What is the Average Household Size in Hardin County
Average Household Size in Hardin County is 2.4 People.
How Large is the Labor Force in Hardin County?
There are 1,265 People in the Labor Forcein in Hardin County.
What is the Percentage of People in the Labor Force in Hardin County?
39.2% of People are in the Labor Force in Hardin County.
What is the Unemployment Rate in Hardin County?
Unemployment Rate in Hardin County is 2.6%.