Hamilton County, IL Map & Demographics
Hamilton County Map
Hamilton County Overview
$29,785
PER CAPITA INCOME
$76,893
AVG FAMILY INCOME
$60,574
AVG HOUSEHOLD INCOME
26.3%
WAGE / INCOME GAP [ % ]
73.7¢/ $1
WAGE / INCOME GAP [ $ ]
$8,899
FAMILY INCOME DEFICIT
0.40
INEQUALITY / GINI INDEX
8,008
TOTAL POPULATION
3,965
MALE POPULATION
4,043
FEMALE POPULATION
98.07
MALES / 100 FEMALES
101.97
FEMALES / 100 MALES
43.0
MEDIAN AGE
3.0
AVG FAMILY SIZE
2.4
AVG HOUSEHOLD SIZE
3,534
LABOR FORCE [ PEOPLE ]
55.1%
PERCENT IN LABOR FORCE
4.4%
UNEMPLOYMENT RATE
Hamilton County Area Codes
Income in Hamilton County
Income Overview in Hamilton County
Per Capita Income in Hamilton County is $29,785, while median incomes of families and households are $76,893 and $60,574 respectively.
| Characteristic | Number | Measure |
| Per Capita Income | 8,008 | $29,785 |
| Median Family Income | 2,121 | $76,893 |
| Mean Family Income | 2,121 | $87,181 |
| Median Household Income | 3,271 | $60,574 |
| Mean Household Income | 3,271 | $72,181 |
| Income Deficit | 2,121 | $8,899 |
| Wage / Income Gap (%) | 8,008 | 26.31% |
| Wage / Income Gap ($) | 8,008 | 73.69¢ per $1 |
| Gini / Inequality Index | 8,008 | 0.40 |
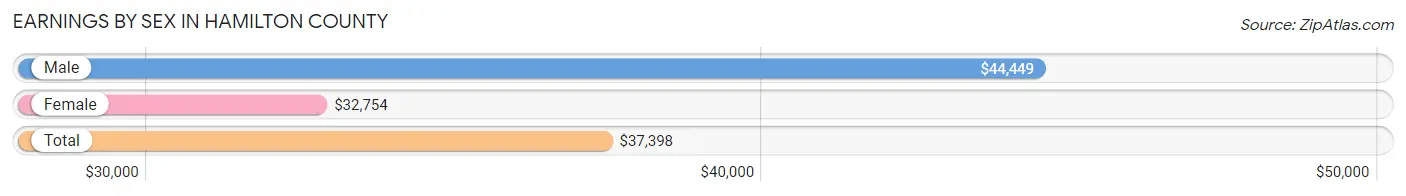
Earnings by Sex in Hamilton County
Average Earnings in Hamilton County are $37,398, $44,449 for men and $32,754 for women, a difference of 26.3%.
| Sex | Number | Average Earnings |
| Male | 2,134 (56.8%) | $44,449 |
| Female | 1,625 (43.2%) | $32,754 |
| Total | 3,759 (100.0%) | $37,398 |
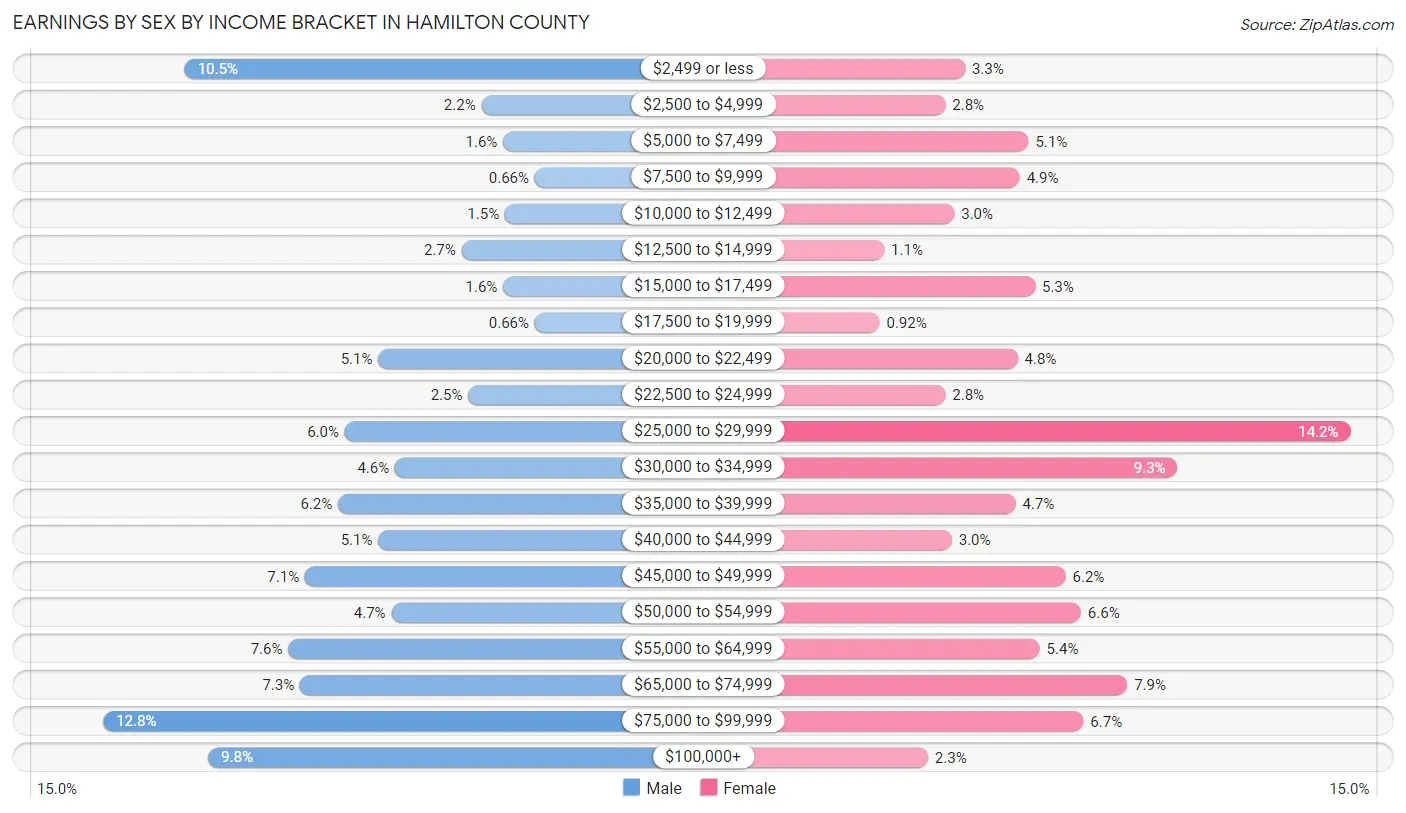
Earnings by Sex by Income Bracket in Hamilton County
The most common earnings brackets in Hamilton County are $75,000 to $99,999 for men (273 | 12.8%) and $25,000 to $29,999 for women (230 | 14.1%).
| Income | Male | Female |
| $2,499 or less | 224 (10.5%) | 54 (3.3%) |
| $2,500 to $4,999 | 46 (2.2%) | 45 (2.8%) |
| $5,000 to $7,499 | 33 (1.5%) | 83 (5.1%) |
| $7,500 to $9,999 | 14 (0.7%) | 79 (4.9%) |
| $10,000 to $12,499 | 32 (1.5%) | 49 (3.0%) |
| $12,500 to $14,999 | 58 (2.7%) | 17 (1.1%) |
| $15,000 to $17,499 | 33 (1.5%) | 86 (5.3%) |
| $17,500 to $19,999 | 14 (0.7%) | 15 (0.9%) |
| $20,000 to $22,499 | 108 (5.1%) | 78 (4.8%) |
| $22,500 to $24,999 | 54 (2.5%) | 45 (2.8%) |
| $25,000 to $29,999 | 128 (6.0%) | 230 (14.1%) |
| $30,000 to $34,999 | 98 (4.6%) | 151 (9.3%) |
| $35,000 to $39,999 | 132 (6.2%) | 77 (4.7%) |
| $40,000 to $44,999 | 108 (5.1%) | 48 (2.9%) |
| $45,000 to $49,999 | 152 (7.1%) | 100 (6.1%) |
| $50,000 to $54,999 | 100 (4.7%) | 107 (6.6%) |
| $55,000 to $64,999 | 162 (7.6%) | 88 (5.4%) |
| $65,000 to $74,999 | 155 (7.3%) | 128 (7.9%) |
| $75,000 to $99,999 | 273 (12.8%) | 108 (6.7%) |
| $100,000+ | 210 (9.8%) | 37 (2.3%) |
| Total | 2,134 (100.0%) | 1,625 (100.0%) |
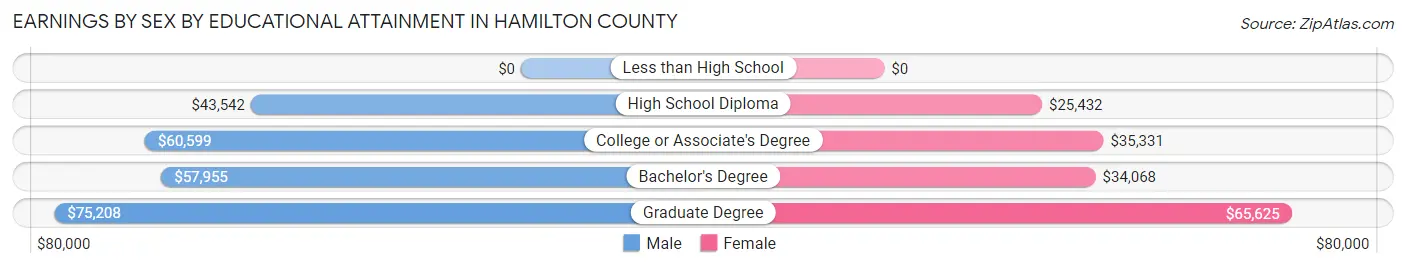
Earnings by Sex by Educational Attainment in Hamilton County
Average earnings in Hamilton County are $48,833 for men and $34,635 for women, a difference of 29.1%. Men with an educational attainment of graduate degree enjoy the highest average annual earnings of $75,208, while those with high school diploma education earn the least with $43,542. Women with an educational attainment of graduate degree earn the most with the average annual earnings of $65,625, while those with high school diploma education have the smallest earnings of $25,432.
| Educational Attainment | Male Income | Female Income |
| Less than High School | - | - |
| High School Diploma | $43,542 | $25,432 |
| College or Associate's Degree | $60,599 | $35,331 |
| Bachelor's Degree | $57,955 | $34,068 |
| Graduate Degree | $75,208 | $65,625 |
| Total | $48,833 | $34,635 |
Family Income in Hamilton County
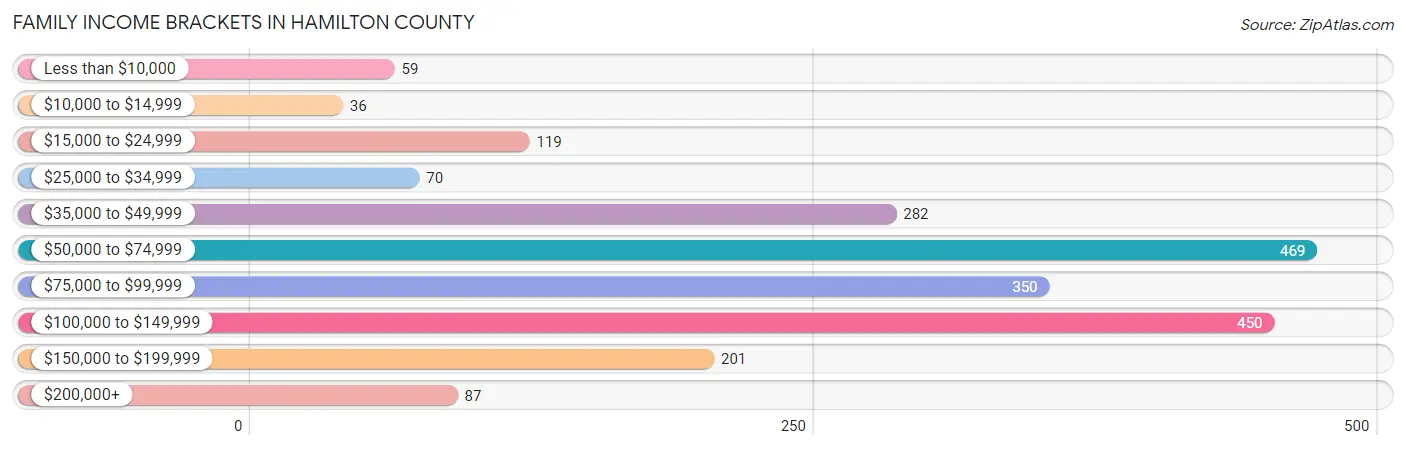
Family Income Brackets in Hamilton County
According to the Hamilton County family income data, there are 469 families falling into the $50,000 to $74,999 income range, which is the most common income bracket and makes up 22.1% of all families. Conversely, the $10,000 to $14,999 income bracket is the least frequent group with only 36 families (1.7%) belonging to this category.
| Income Bracket | # Families | % Families |
| Less than $10,000 | 59 | 2.8% |
| $10,000 to $14,999 | 36 | 1.7% |
| $15,000 to $24,999 | 119 | 5.6% |
| $25,000 to $34,999 | 70 | 3.3% |
| $35,000 to $49,999 | 282 | 13.3% |
| $50,000 to $74,999 | 469 | 22.1% |
| $75,000 to $99,999 | 350 | 16.5% |
| $100,000 to $149,999 | 450 | 21.2% |
| $150,000 to $199,999 | 201 | 9.5% |
| $200,000+ | 87 | 4.1% |
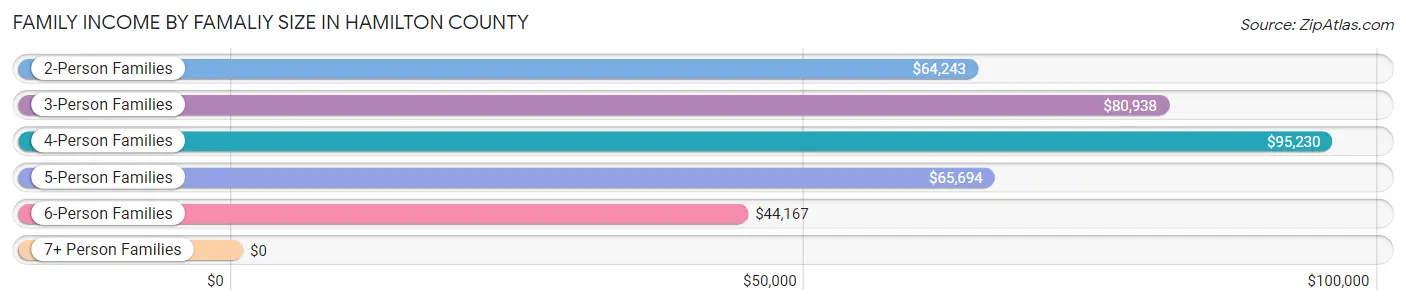
Family Income by Famaliy Size in Hamilton County
4-person families (381 | 18.0%) account for the highest median family income in Hamilton County with $95,230 per family, while 2-person families (1,111 | 52.4%) have the highest median income of $32,122 per family member.
| Income Bracket | # Families | Median Income |
| 2-Person Families | 1,111 (52.4%) | $64,243 |
| 3-Person Families | 417 (19.7%) | $80,938 |
| 4-Person Families | 381 (18.0%) | $95,230 |
| 5-Person Families | 171 (8.1%) | $65,694 |
| 6-Person Families | 24 (1.1%) | $44,167 |
| 7+ Person Families | 17 (0.8%) | $0 |
| Total | 2,121 (100.0%) | $76,893 |
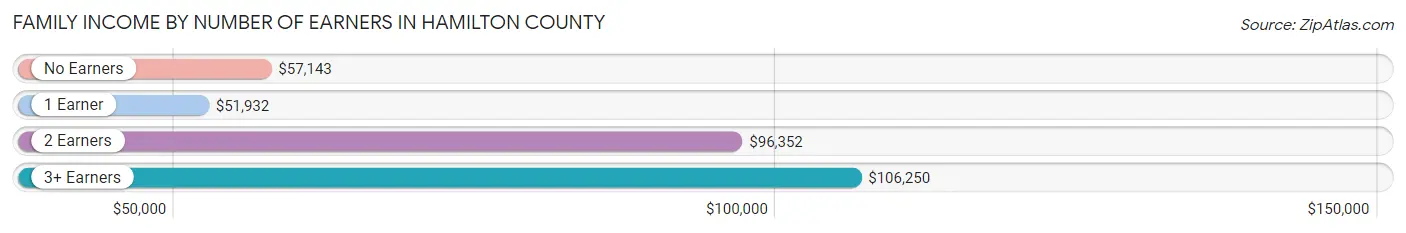
Family Income by Number of Earners in Hamilton County
The median family income in Hamilton County is $76,893, with families comprising 3+ earners (135) having the highest median family income of $106,250, while families with 1 earner (707) have the lowest median family income of $51,932, accounting for 6.4% and 33.3% of families, respectively.
| Number of Earners | # Families | Median Income |
| No Earners | 338 (15.9%) | $57,143 |
| 1 Earner | 707 (33.3%) | $51,932 |
| 2 Earners | 941 (44.4%) | $96,352 |
| 3+ Earners | 135 (6.4%) | $106,250 |
| Total | 2,121 (100.0%) | $76,893 |
Household Income in Hamilton County
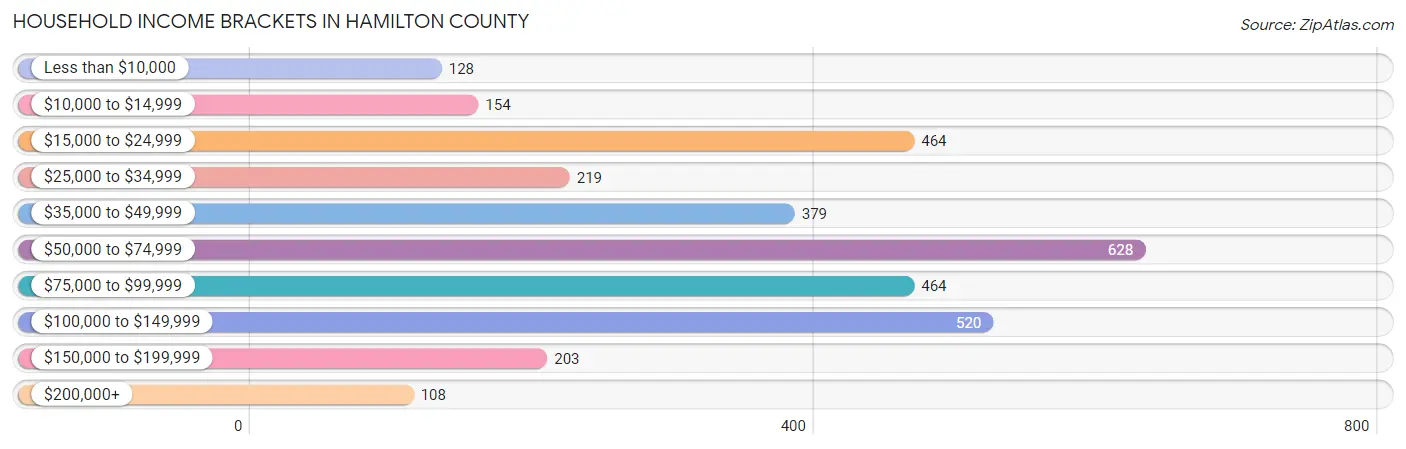
Household Income Brackets in Hamilton County
With 628 households falling in the category, the $50,000 to $74,999 income range is the most frequent in Hamilton County, accounting for 19.2% of all households. In contrast, only 108 households (3.3%) fall into the $200,000+ income bracket, making it the least populous group.
| Income Bracket | # Households | % Households |
| Less than $10,000 | 128 | 3.9% |
| $10,000 to $14,999 | 154 | 4.7% |
| $15,000 to $24,999 | 464 | 14.2% |
| $25,000 to $34,999 | 219 | 6.7% |
| $35,000 to $49,999 | 379 | 11.6% |
| $50,000 to $74,999 | 628 | 19.2% |
| $75,000 to $99,999 | 464 | 14.2% |
| $100,000 to $149,999 | 520 | 15.9% |
| $150,000 to $199,999 | 203 | 6.2% |
| $200,000+ | 108 | 3.3% |
Household Income by Householder Age in Hamilton County
The median household income in Hamilton County is $60,574, with the highest median household income of $67,662 found in the 45 to 64 years age bracket for the primary householder. A total of 1,125 households (34.4%) fall into this category. Meanwhile, the 15 to 24 years age bracket for the primary householder has the lowest median household income of $20,313, with 65 households (2.0%) in this group.
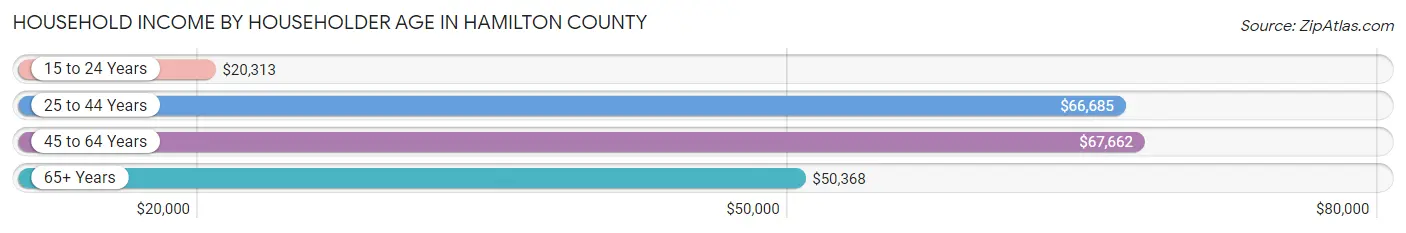
| Income Bracket | # Households | Median Income |
| 15 to 24 Years | 65 (2.0%) | $20,313 |
| 25 to 44 Years | 859 (26.3%) | $66,685 |
| 45 to 64 Years | 1,125 (34.4%) | $67,662 |
| 65+ Years | 1,222 (37.4%) | $50,368 |
| Total | 3,271 (100.0%) | $60,574 |
Poverty in Hamilton County
Income Below Poverty by Sex and Age in Hamilton County
With 9.3% poverty level for males and 16.4% for females among the residents of Hamilton County, 5 year old males and 15 year old females are the most vulnerable to poverty, with 14 males (53.8%) and 81 females (60.5%) in their respective age groups living below the poverty level.
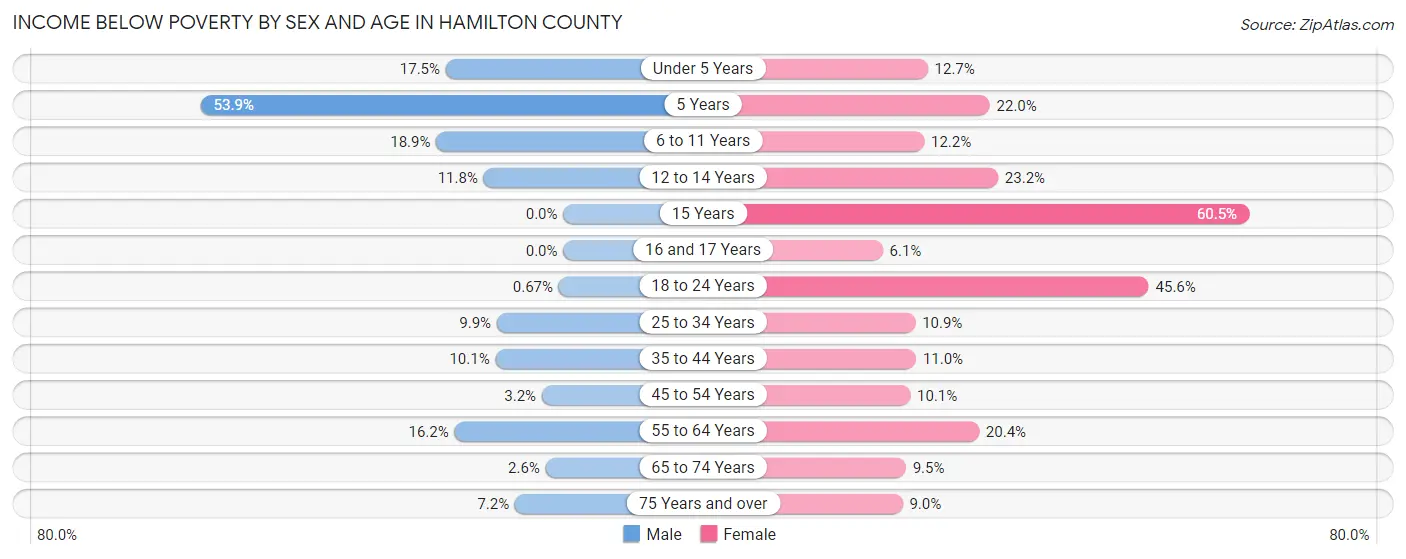
| Age Bracket | Male | Female |
| Under 5 Years | 41 (17.4%) | 27 (12.7%) |
| 5 Years | 14 (53.8%) | 9 (22.0%) |
| 6 to 11 Years | 57 (18.9%) | 37 (12.2%) |
| 12 to 14 Years | 13 (11.8%) | 35 (23.2%) |
| 15 Years | 0 (0.0%) | 81 (60.5%) |
| 16 and 17 Years | 0 (0.0%) | 2 (6.1%) |
| 18 to 24 Years | 2 (0.7%) | 118 (45.6%) |
| 25 to 34 Years | 43 (9.9%) | 51 (10.9%) |
| 35 to 44 Years | 50 (10.1%) | 50 (11.0%) |
| 45 to 54 Years | 15 (3.2%) | 45 (10.1%) |
| 55 to 64 Years | 95 (16.2%) | 114 (20.4%) |
| 65 to 74 Years | 12 (2.6%) | 45 (9.5%) |
| 75 Years and over | 22 (7.2%) | 43 (9.0%) |
| Total | 364 (9.3%) | 657 (16.4%) |
Income Above Poverty by Sex and Age in Hamilton County
According to the poverty statistics in Hamilton County, males aged 15 years and females aged 16 and 17 years are the age groups that are most secure financially, with 100.0% of males and 93.9% of females in these age groups living above the poverty line.
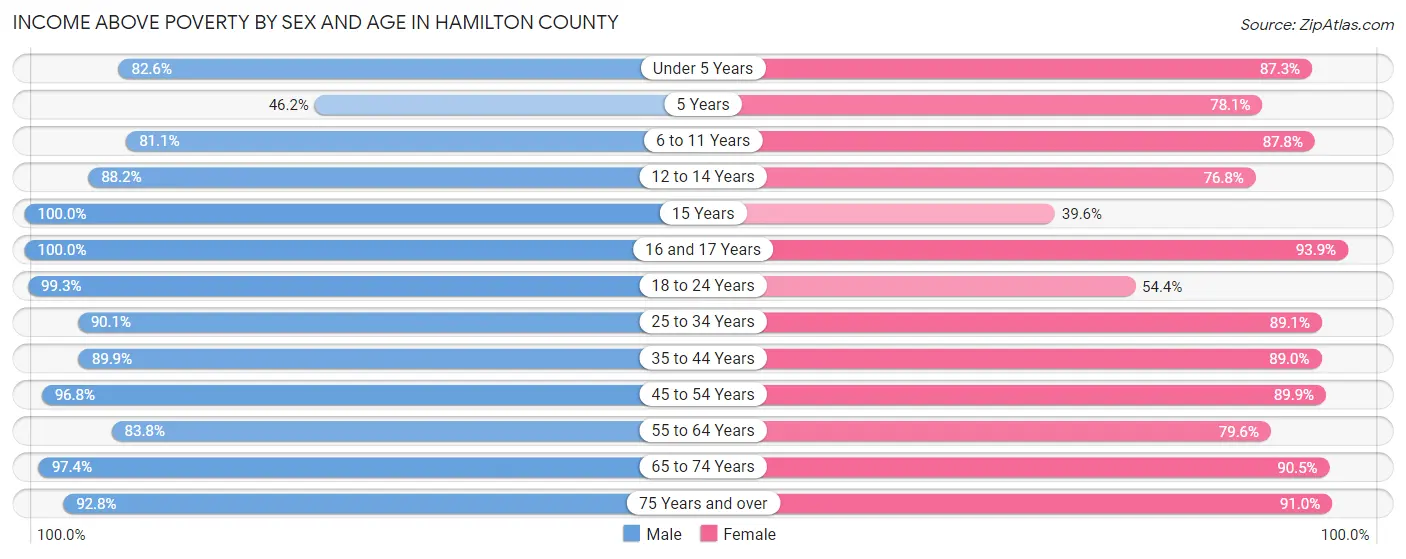
| Age Bracket | Male | Female |
| Under 5 Years | 194 (82.6%) | 185 (87.3%) |
| 5 Years | 12 (46.2%) | 32 (78.0%) |
| 6 to 11 Years | 245 (81.1%) | 266 (87.8%) |
| 12 to 14 Years | 97 (88.2%) | 116 (76.8%) |
| 15 Years | 50 (100.0%) | 53 (39.6%) |
| 16 and 17 Years | 126 (100.0%) | 31 (93.9%) |
| 18 to 24 Years | 296 (99.3%) | 141 (54.4%) |
| 25 to 34 Years | 393 (90.1%) | 417 (89.1%) |
| 35 to 44 Years | 446 (89.9%) | 404 (89.0%) |
| 45 to 54 Years | 456 (96.8%) | 399 (89.9%) |
| 55 to 64 Years | 493 (83.8%) | 446 (79.6%) |
| 65 to 74 Years | 445 (97.4%) | 429 (90.5%) |
| 75 Years and over | 285 (92.8%) | 434 (91.0%) |
| Total | 3,538 (90.7%) | 3,353 (83.6%) |
Income Below Poverty Among Married-Couple Families in Hamilton County
The poverty statistics for married-couple families in Hamilton County show that 3.1% or 50 of the total 1,629 families live below the poverty line. Families with 5 or more children have the highest poverty rate of 88.2%, comprising of 15 families. On the other hand, families with 1 or 2 children have the lowest poverty rate of 0.6%, which includes 3 families.
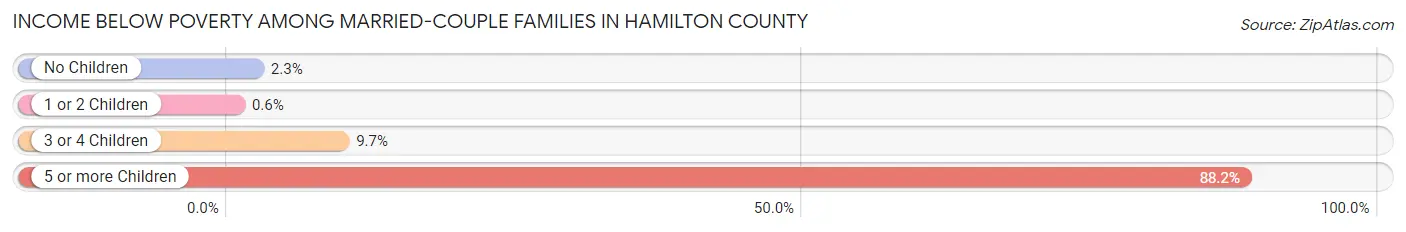
| Children | Above Poverty | Below Poverty |
| No Children | 999 (97.8%) | 23 (2.2%) |
| 1 or 2 Children | 494 (99.4%) | 3 (0.6%) |
| 3 or 4 Children | 84 (90.3%) | 9 (9.7%) |
| 5 or more Children | 2 (11.8%) | 15 (88.2%) |
| Total | 1,579 (96.9%) | 50 (3.1%) |
Income Below Poverty Among Single-Parent Households in Hamilton County
According to the poverty data in Hamilton County, 20.7% or 44 single-father households and 29.7% or 83 single-mother households are living below the poverty line. Among single-father households, those with 1 or 2 children have the highest poverty rate, with 38 households (50.0%) experiencing poverty. Likewise, among single-mother households, those with 1 or 2 children have the highest poverty rate, with 39 households (54.9%) falling below the poverty line.
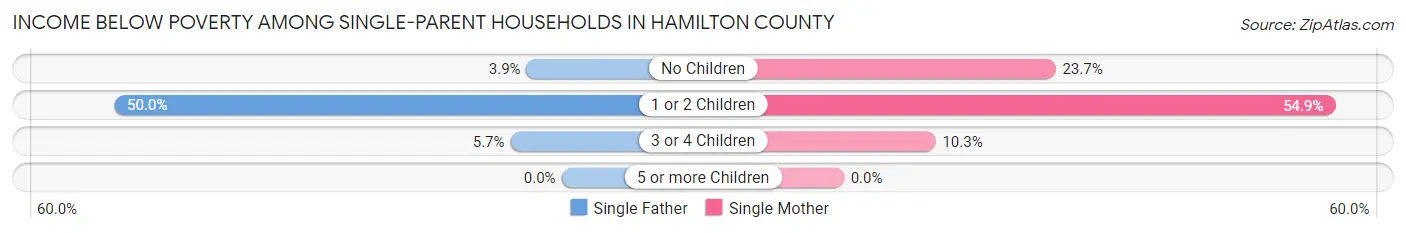
| Children | Single Father | Single Mother |
| No Children | 4 (3.9%) | 40 (23.7%) |
| 1 or 2 Children | 38 (50.0%) | 39 (54.9%) |
| 3 or 4 Children | 2 (5.7%) | 4 (10.3%) |
| 5 or more Children | 0 (0.0%) | 0 (0.0%) |
| Total | 44 (20.7%) | 83 (29.7%) |
Income Below Poverty Among Married-Couple vs Single-Parent Households in Hamilton County
The poverty data for Hamilton County shows that 50 of the married-couple family households (3.1%) and 127 of the single-parent households (25.8%) are living below the poverty level. Within the married-couple family households, those with 5 or more children have the highest poverty rate, with 15 households (88.2%) falling below the poverty line. Among the single-parent households, those with 1 or 2 children have the highest poverty rate, with 77 household (52.4%) living below poverty.
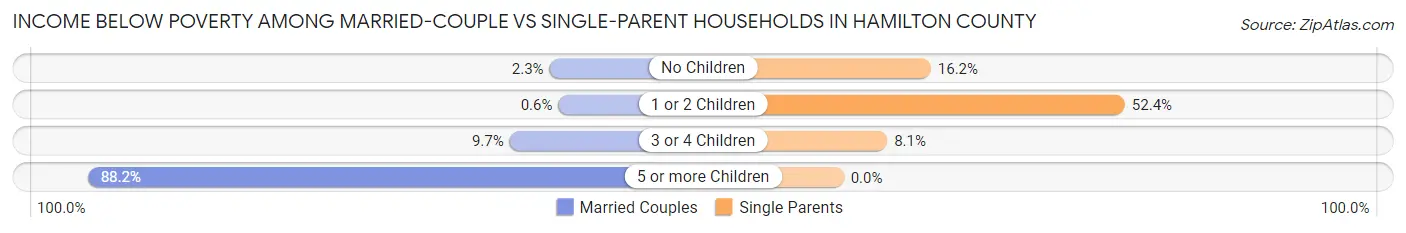
| Children | Married-Couple Families | Single-Parent Households |
| No Children | 23 (2.2%) | 44 (16.2%) |
| 1 or 2 Children | 3 (0.6%) | 77 (52.4%) |
| 3 or 4 Children | 9 (9.7%) | 6 (8.1%) |
| 5 or more Children | 15 (88.2%) | 0 (0.0%) |
| Total | 50 (3.1%) | 127 (25.8%) |
Race in Hamilton County
The most populous races in Hamilton County are White / Caucasian (7,701 | 96.2%), Hispanic or Latino (158 | 2.0%), and Two or more Races (142 | 1.8%).
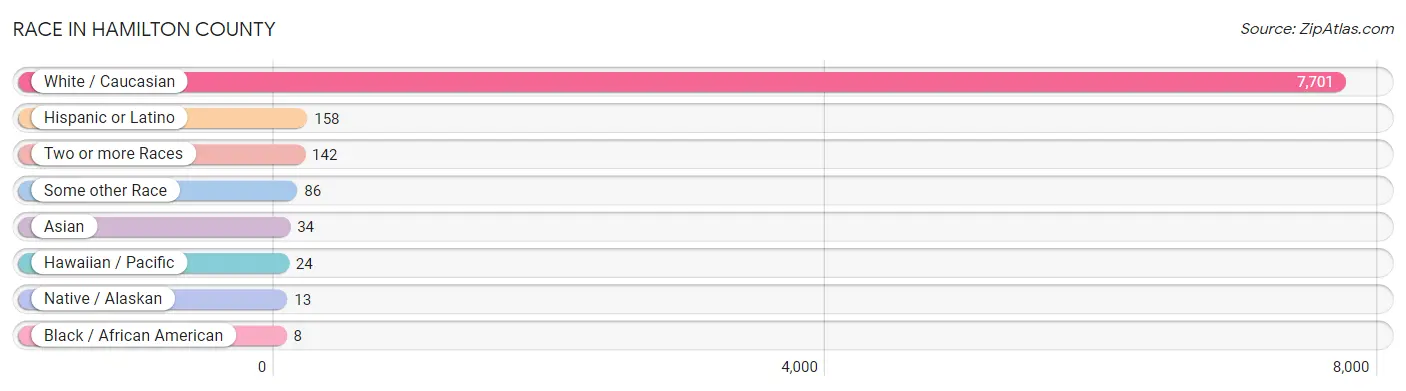
| Race | # Population | % Population |
| Asian | 34 | 0.4% |
| Black / African American | 8 | 0.1% |
| Hawaiian / Pacific | 24 | 0.3% |
| Hispanic or Latino | 158 | 2.0% |
| Native / Alaskan | 13 | 0.2% |
| White / Caucasian | 7,701 | 96.2% |
| Two or more Races | 142 | 1.8% |
| Some other Race | 86 | 1.1% |
| Total | 8,008 | 100.0% |
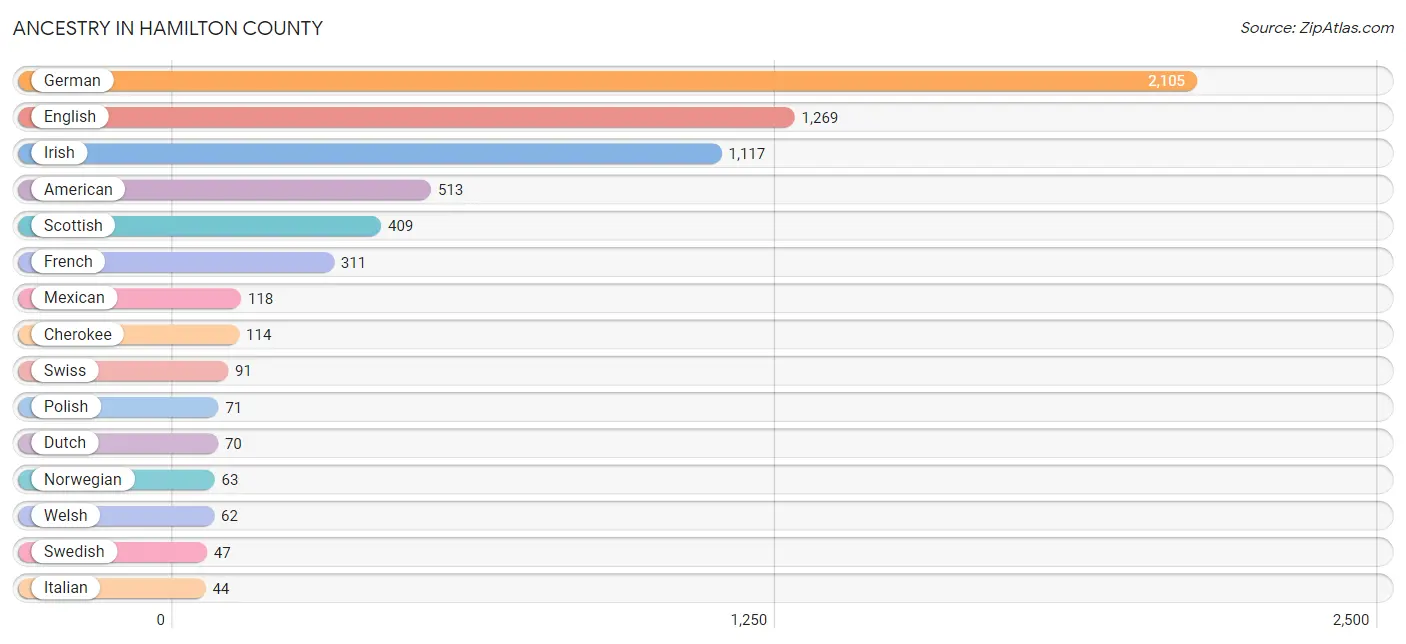
Ancestry in Hamilton County
The most populous ancestries reported in Hamilton County are German (2,105 | 26.3%), English (1,269 | 15.9%), Irish (1,117 | 14.0%), American (513 | 6.4%), and Scottish (409 | 5.1%), together accounting for 67.6% of all Hamilton County residents.
| Ancestry | # Population | % Population |
| American | 513 | 6.4% |
| Belgian | 14 | 0.2% |
| Blackfeet | 22 | 0.3% |
| British | 19 | 0.2% |
| Cherokee | 114 | 1.4% |
| Cuban | 6 | 0.1% |
| Czech | 10 | 0.1% |
| Dutch | 70 | 0.9% |
| English | 1,269 | 15.9% |
| European | 8 | 0.1% |
| French | 311 | 3.9% |
| French Canadian | 25 | 0.3% |
| German | 2,105 | 26.3% |
| Guamanian / Chamorro | 24 | 0.3% |
| Irish | 1,117 | 14.0% |
| Italian | 44 | 0.5% |
| Korean | 25 | 0.3% |
| Lithuanian | 7 | 0.1% |
| Malaysian | 9 | 0.1% |
| Mexican | 118 | 1.5% |
| Navajo | 13 | 0.2% |
| Northern European | 1 | 0.0% |
| Norwegian | 63 | 0.8% |
| Polish | 71 | 0.9% |
| Portuguese | 10 | 0.1% |
| Puerto Rican | 34 | 0.4% |
| Russian | 3 | 0.0% |
| Scotch-Irish | 23 | 0.3% |
| Scottish | 409 | 5.1% |
| Slovak | 28 | 0.4% |
| Swedish | 47 | 0.6% |
| Swiss | 91 | 1.1% |
| Welsh | 62 | 0.8% | View All 33 Rows |
Immigrants in Hamilton County
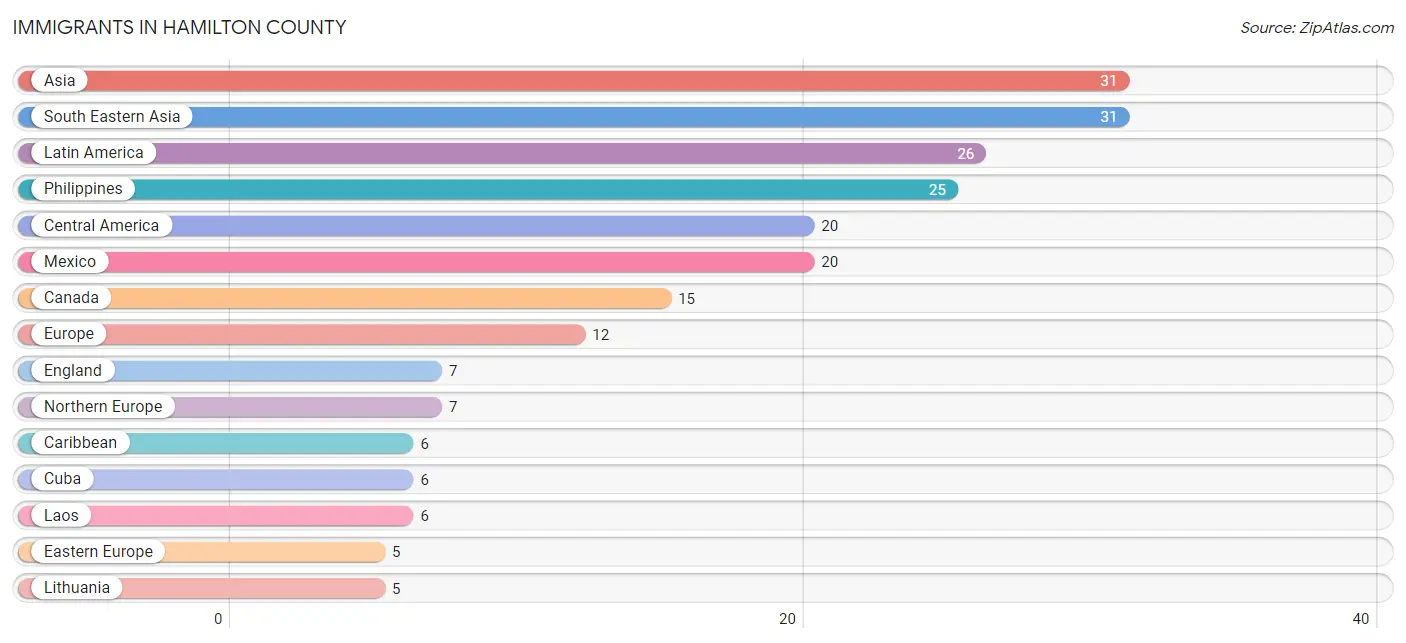
The most numerous immigrant groups reported in Hamilton County came from Asia (31 | 0.4%), South Eastern Asia (31 | 0.4%), Latin America (26 | 0.3%), Philippines (25 | 0.3%), and Central America (20 | 0.3%), together accounting for 1.7% of all Hamilton County residents.
| Immigration Origin | # Population | % Population |
| Asia | 31 | 0.4% |
| Canada | 15 | 0.2% |
| Caribbean | 6 | 0.1% |
| Central America | 20 | 0.3% |
| Cuba | 6 | 0.1% |
| Eastern Europe | 5 | 0.1% |
| England | 7 | 0.1% |
| Europe | 12 | 0.2% |
| Laos | 6 | 0.1% |
| Latin America | 26 | 0.3% |
| Lithuania | 5 | 0.1% |
| Mexico | 20 | 0.3% |
| Northern Europe | 7 | 0.1% |
| Philippines | 25 | 0.3% |
| South Eastern Asia | 31 | 0.4% | View All 15 Rows |
Sex and Age in Hamilton County
Sex and Age in Hamilton County
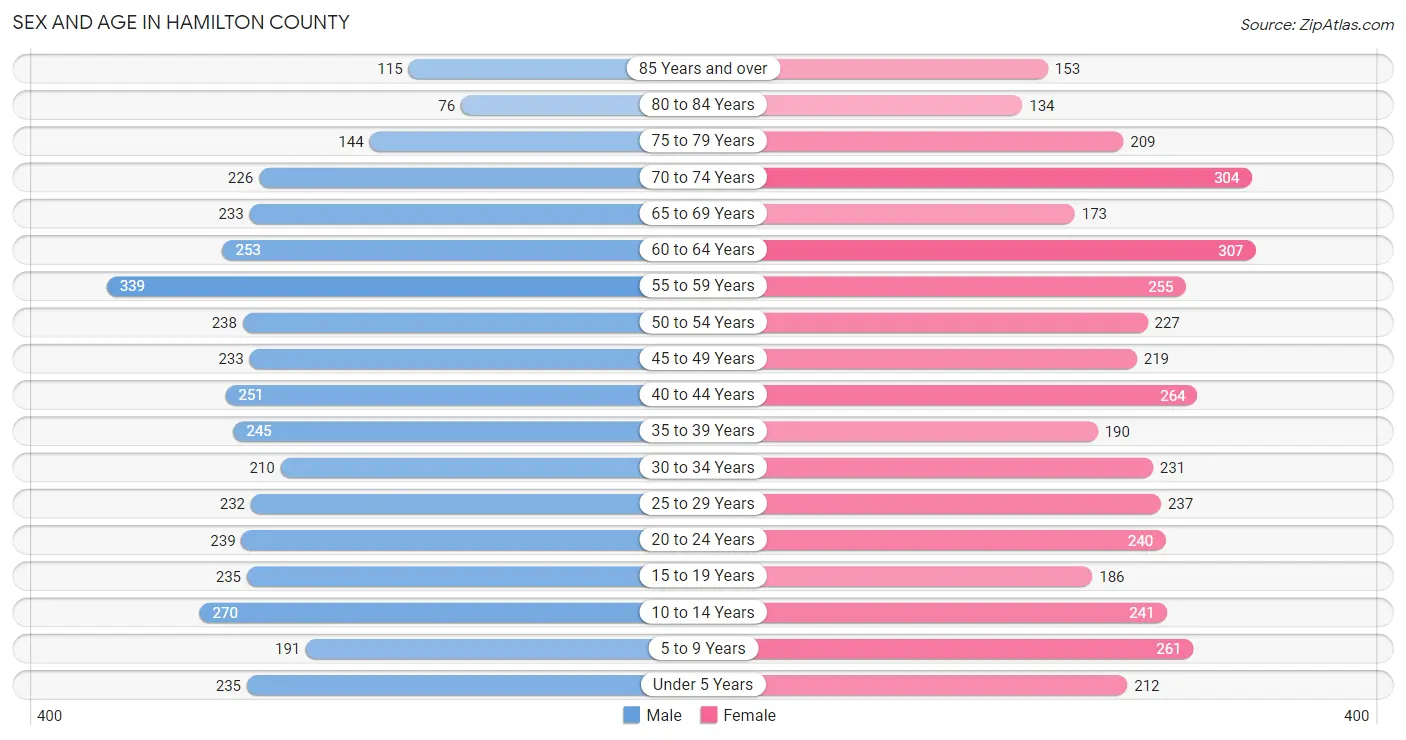
The most populous age groups in Hamilton County are 55 to 59 Years (339 | 8.6%) for men and 60 to 64 Years (307 | 7.6%) for women.
| Age Bracket | Male | Female |
| Under 5 Years | 235 (5.9%) | 212 (5.2%) |
| 5 to 9 Years | 191 (4.8%) | 261 (6.5%) |
| 10 to 14 Years | 270 (6.8%) | 241 (6.0%) |
| 15 to 19 Years | 235 (5.9%) | 186 (4.6%) |
| 20 to 24 Years | 239 (6.0%) | 240 (5.9%) |
| 25 to 29 Years | 232 (5.9%) | 237 (5.9%) |
| 30 to 34 Years | 210 (5.3%) | 231 (5.7%) |
| 35 to 39 Years | 245 (6.2%) | 190 (4.7%) |
| 40 to 44 Years | 251 (6.3%) | 264 (6.5%) |
| 45 to 49 Years | 233 (5.9%) | 219 (5.4%) |
| 50 to 54 Years | 238 (6.0%) | 227 (5.6%) |
| 55 to 59 Years | 339 (8.6%) | 255 (6.3%) |
| 60 to 64 Years | 253 (6.4%) | 307 (7.6%) |
| 65 to 69 Years | 233 (5.9%) | 173 (4.3%) |
| 70 to 74 Years | 226 (5.7%) | 304 (7.5%) |
| 75 to 79 Years | 144 (3.6%) | 209 (5.2%) |
| 80 to 84 Years | 76 (1.9%) | 134 (3.3%) |
| 85 Years and over | 115 (2.9%) | 153 (3.8%) |
| Total | 3,965 (100.0%) | 4,043 (100.0%) |
Families and Households in Hamilton County
Median Family Size in Hamilton County
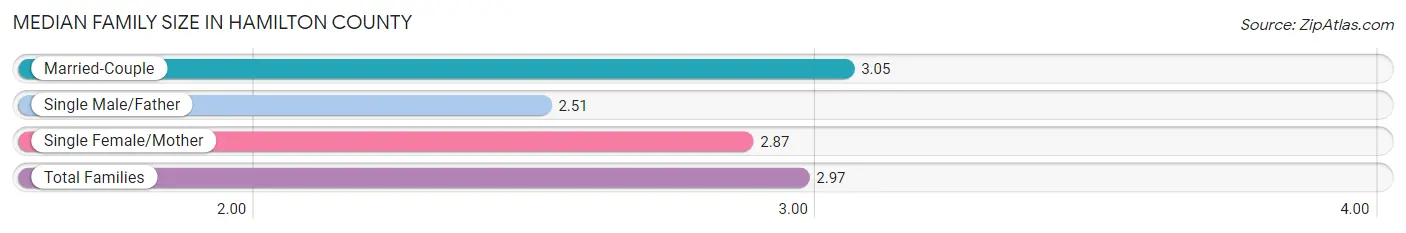
The median family size in Hamilton County is 2.97 persons per family, with married-couple families (1,629 | 76.8%) accounting for the largest median family size of 3.05 persons per family. On the other hand, single male/father families (213 | 10.0%) represent the smallest median family size with 2.51 persons per family.
| Family Type | # Families | Family Size |
| Married-Couple | 1,629 (76.8%) | 3.05 |
| Single Male/Father | 213 (10.0%) | 2.51 |
| Single Female/Mother | 279 (13.2%) | 2.87 |
| Total Families | 2,121 (100.0%) | 2.97 |
Median Household Size in Hamilton County
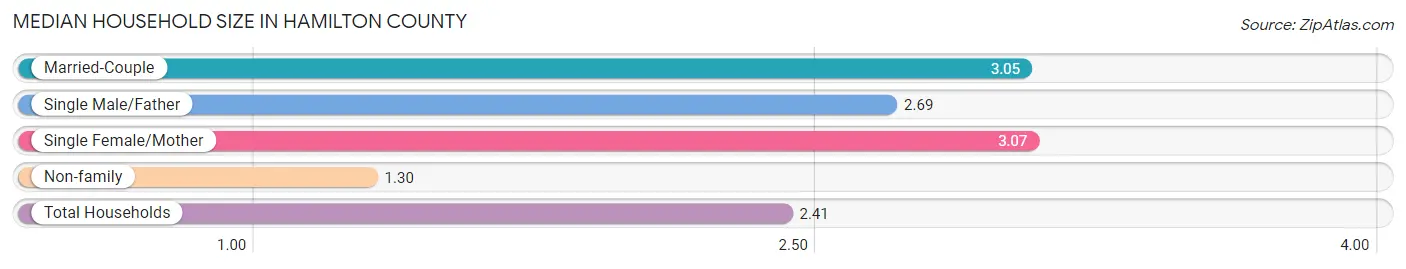
The median household size in Hamilton County is 2.41 persons per household, with single female/mother households (279 | 8.5%) accounting for the largest median household size of 3.07 persons per household. non-family households (1,150 | 35.2%) represent the smallest median household size with 1.30 persons per household.
| Household Type | # Households | Household Size |
| Married-Couple | 1,629 (49.8%) | 3.05 |
| Single Male/Father | 213 (6.5%) | 2.69 |
| Single Female/Mother | 279 (8.5%) | 3.07 |
| Non-family | 1,150 (35.2%) | 1.30 |
| Total Households | 3,271 (100.0%) | 2.41 |
Household Size by Marriage Status in Hamilton County
Out of a total of 3,271 households in Hamilton County, 2,121 (64.8%) are family households, while 1,150 (35.2%) are nonfamily households. The most numerous type of family households are 2-person households, comprising 1,066, and the most common type of nonfamily households are 1-person households, comprising 882.
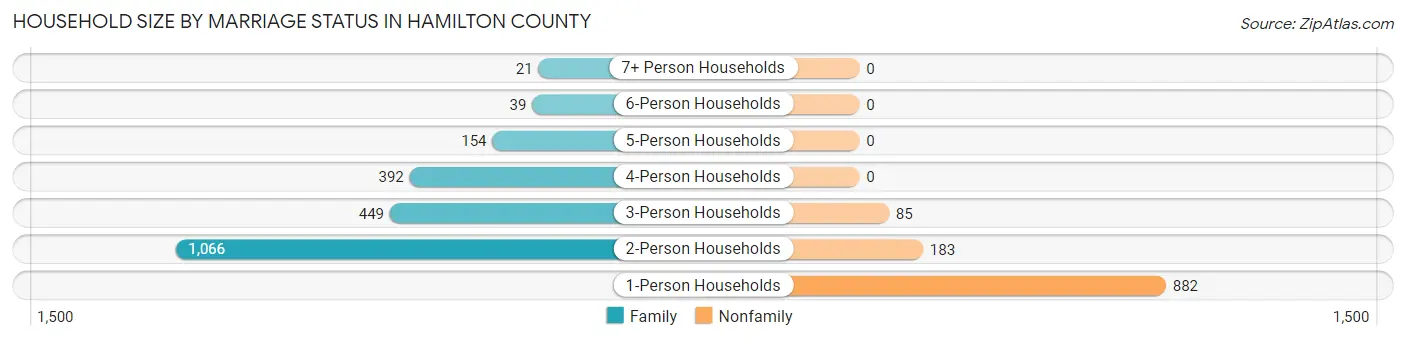
| Household Size | Family Households | Nonfamily Households |
| 1-Person Households | - | 882 (27.0%) |
| 2-Person Households | 1,066 (32.6%) | 183 (5.6%) |
| 3-Person Households | 449 (13.7%) | 85 (2.6%) |
| 4-Person Households | 392 (12.0%) | 0 (0.0%) |
| 5-Person Households | 154 (4.7%) | 0 (0.0%) |
| 6-Person Households | 39 (1.2%) | 0 (0.0%) |
| 7+ Person Households | 21 (0.6%) | 0 (0.0%) |
| Total | 2,121 (64.8%) | 1,150 (35.2%) |
Female Fertility in Hamilton County
Fertility by Age in Hamilton County
Average fertility rate in Hamilton County is 39.0 births per 1,000 women. Women in the age bracket of 20 to 34 years have the highest fertility rate with 79.0 births per 1,000 women. Women in the age bracket of 20 to 34 years acount for 90.3% of all women with births.
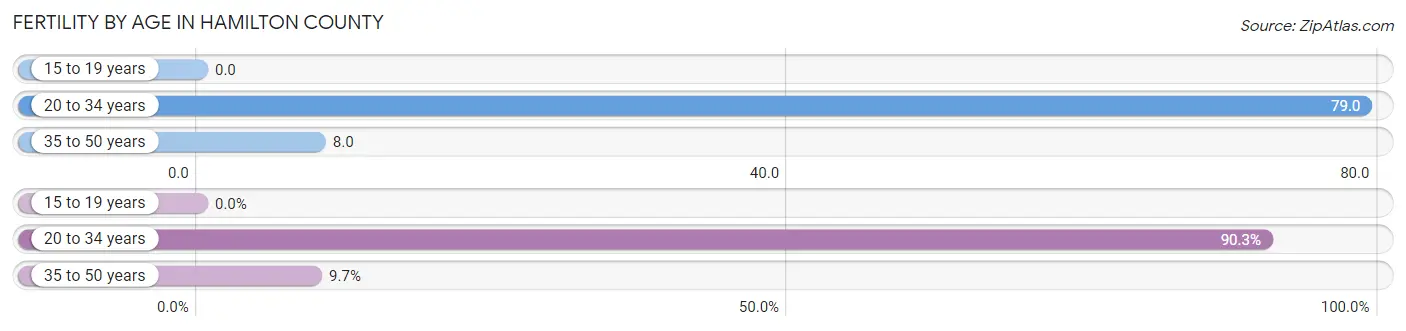
| Age Bracket | Women with Births | Births / 1,000 Women |
| 15 to 19 years | 0 (0.0%) | 0.0 |
| 20 to 34 years | 56 (90.3%) | 79.0 |
| 35 to 50 years | 6 (9.7%) | 8.0 |
| Total | 62 (100.0%) | 39.0 |
Fertility by Age by Marriage Status in Hamilton County
90.3% of women with births (62) in Hamilton County are married. The highest percentage of unmarried women with births falls into 20 to 34 years age bracket with 10.7% of them unmarried at the time of birth, while the lowest percentage of unmarried women with births belong to 35 to 50 years age bracket with 0.0% of them unmarried.
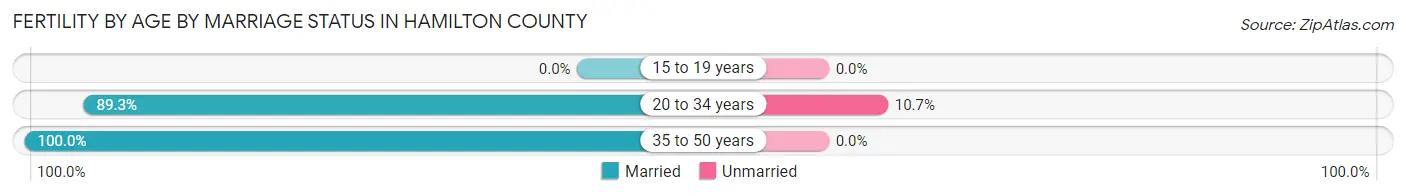
| Age Bracket | Married | Unmarried |
| 15 to 19 years | 0 (0.0%) | 0 (0.0%) |
| 20 to 34 years | 50 (89.3%) | 6 (10.7%) |
| 35 to 50 years | 6 (100.0%) | 0 (0.0%) |
| Total | 56 (90.3%) | 6 (9.7%) |
Fertility by Education in Hamilton County
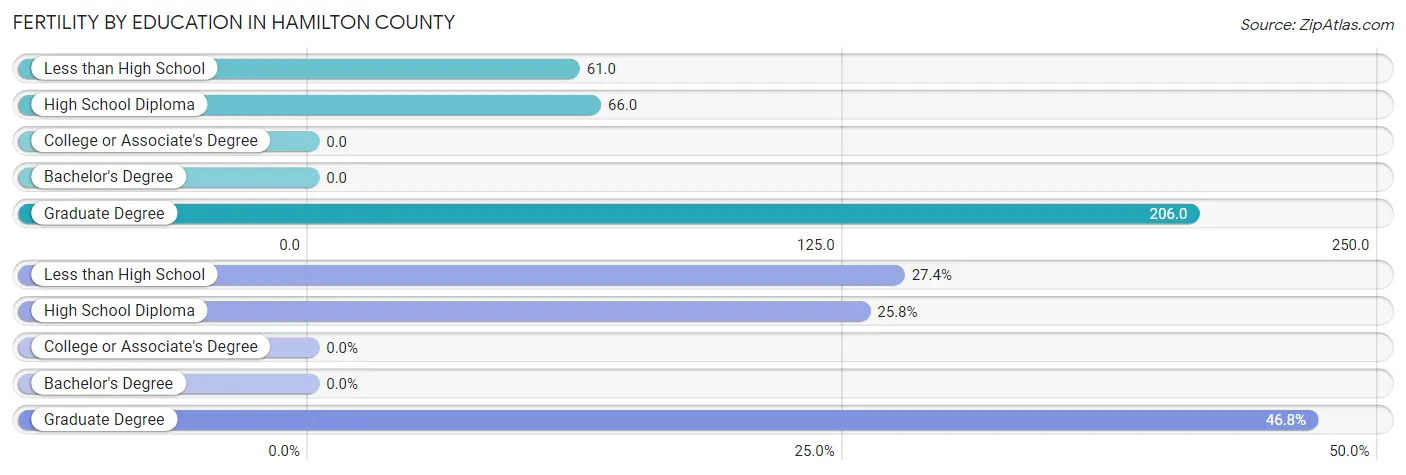
| Educational Attainment | Women with Births | Births / 1,000 Women |
| Less than High School | 17 (27.4%) | 61.0 |
| High School Diploma | 16 (25.8%) | 66.0 |
| College or Associate's Degree | 0 (0.0%) | 0.0 |
| Bachelor's Degree | 0 (0.0%) | 0.0 |
| Graduate Degree | 29 (46.8%) | 206.0 |
| Total | 62 (100.0%) | 39.0 |
Fertility by Education by Marriage Status in Hamilton County
9.7% of women with births in Hamilton County are unmarried. Women with the educational attainment of less than high school are most likely to be married with 100.0% of them married at childbirth, while women with the educational attainment of high school diploma are least likely to be married with 37.5% of them unmarried at childbirth.
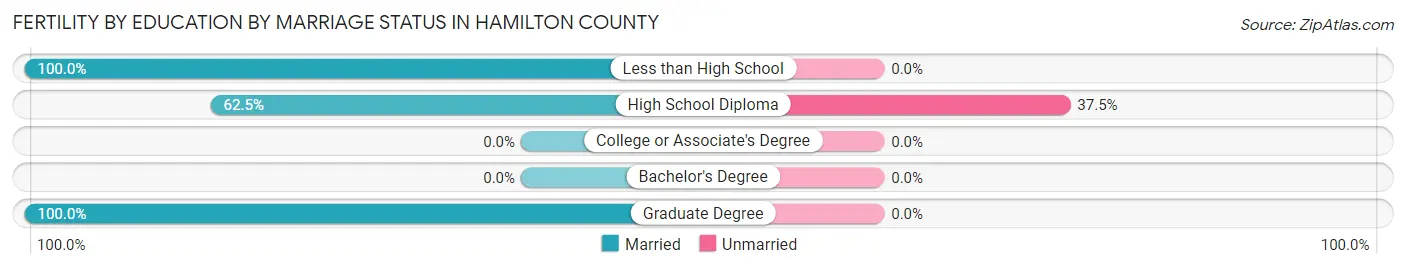
| Educational Attainment | Married | Unmarried |
| Less than High School | 17 (100.0%) | 0 (0.0%) |
| High School Diploma | 10 (62.5%) | 6 (37.5%) |
| College or Associate's Degree | 0 (0.0%) | 0 (0.0%) |
| Bachelor's Degree | 0 (0.0%) | 0 (0.0%) |
| Graduate Degree | 29 (100.0%) | 0 (0.0%) |
| Total | 56 (90.3%) | 6 (9.7%) |
Employment Characteristics in Hamilton County
Employment by Class of Employer in Hamilton County
Among the 3,243 employed individuals in Hamilton County, private company employees (2,191 | 67.6%), local government employees (358 | 11.0%), and self-employed (not incorporated) (297 | 9.2%) make up the most common classes of employment.
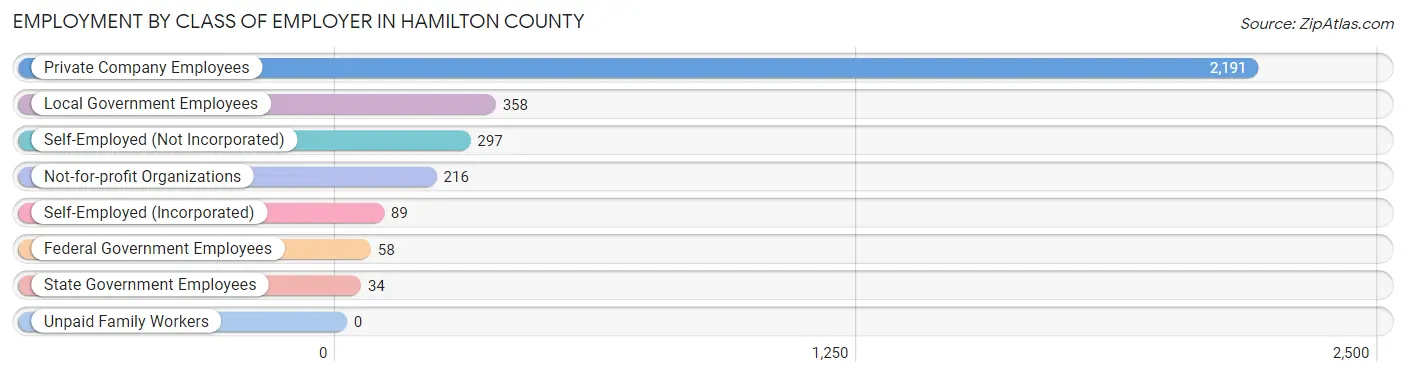
| Employer Class | # Employees | % Employees |
| Private Company Employees | 2,191 | 67.6% |
| Self-Employed (Incorporated) | 89 | 2.7% |
| Self-Employed (Not Incorporated) | 297 | 9.2% |
| Not-for-profit Organizations | 216 | 6.7% |
| Local Government Employees | 358 | 11.0% |
| State Government Employees | 34 | 1.1% |
| Federal Government Employees | 58 | 1.8% |
| Unpaid Family Workers | 0 | 0.0% |
| Total | 3,243 | 100.0% |
Employment Status by Age in Hamilton County
According to the labor force statistics for Hamilton County, out of the total population over 16 years of age (6,414), 55.1% or 3,534 individuals are in the labor force, with 4.4% or 155 of them unemployed. The age group with the highest labor force participation rate is 25 to 29 years, with 79.5% or 373 individuals in the labor force. Within the labor force, the 20 to 24 years age range has the highest percentage of unemployed individuals, with 13.8% or 44 of them being unemployed.
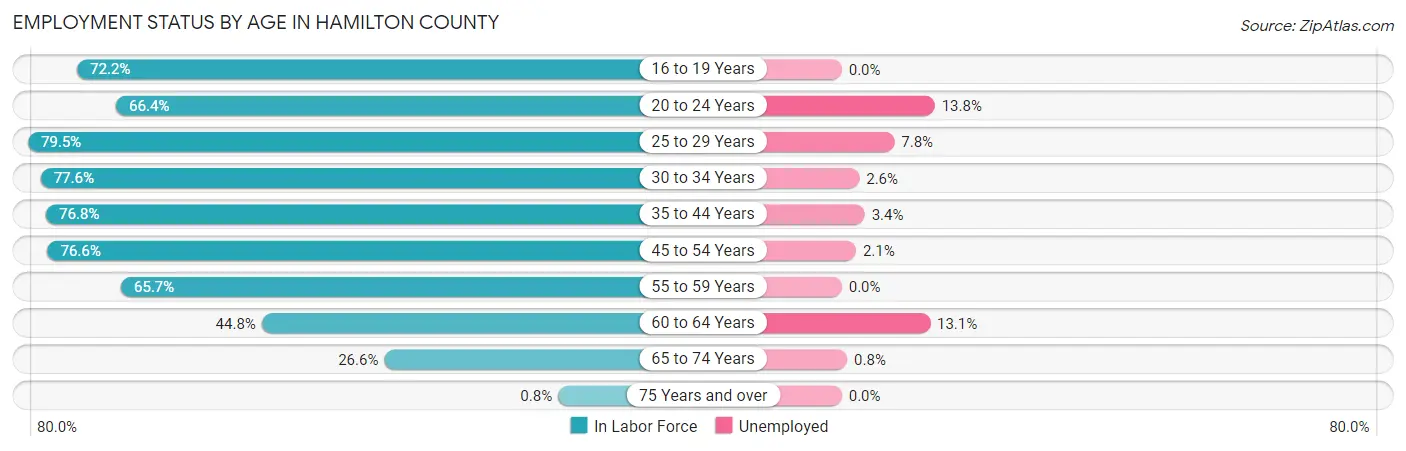
| Age Bracket | In Labor Force | Unemployed |
| 16 to 19 Years | 171 (72.2%) | 0 (0.0%) |
| 20 to 24 Years | 318 (66.4%) | 44 (13.8%) |
| 25 to 29 Years | 373 (79.5%) | 29 (7.8%) |
| 30 to 34 Years | 342 (77.6%) | 9 (2.6%) |
| 35 to 44 Years | 730 (76.8%) | 25 (3.4%) |
| 45 to 54 Years | 702 (76.6%) | 15 (2.1%) |
| 55 to 59 Years | 390 (65.7%) | 0 (0.0%) |
| 60 to 64 Years | 251 (44.8%) | 33 (13.1%) |
| 65 to 74 Years | 249 (26.6%) | 2 (0.8%) |
| 75 Years and over | 7 (0.8%) | 0 (0.0%) |
| Total | 3,534 (55.1%) | 155 (4.4%) |
Employment Status by Educational Attainment in Hamilton County
According to labor force statistics for Hamilton County, 70.9% of individuals (2,787) out of the total population between 25 and 64 years of age (3,931) are in the labor force, with 4.0% or 111 of them being unemployed. The group with the highest labor force participation rate are those with the educational attainment of bachelor's degree or higher, with 87.4% or 620 individuals in the labor force. Within the labor force, individuals with less than high school education have the highest percentage of unemployment, with 9.9% or 13 of them being unemployed.
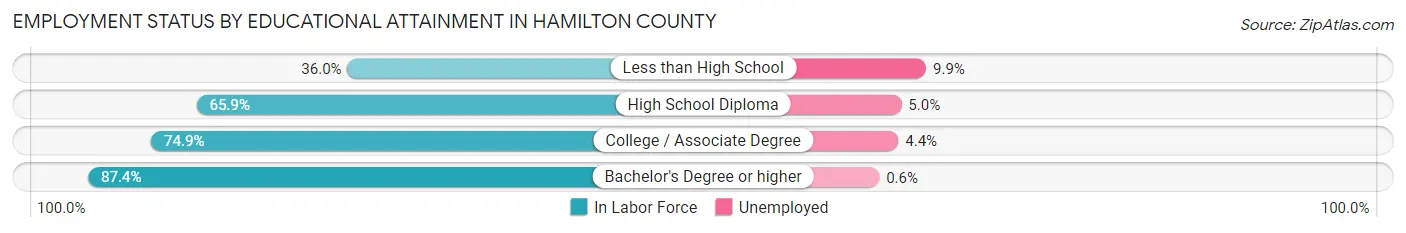
| Educational Attainment | In Labor Force | Unemployed |
| Less than High School | 131 (36.0%) | 36 (9.9%) |
| High School Diploma | 761 (65.9%) | 58 (5.0%) |
| College / Associate Degree | 1,276 (74.9%) | 75 (4.4%) |
| Bachelor's Degree or higher | 620 (87.4%) | 4 (0.6%) |
| Total | 2,787 (70.9%) | 157 (4.0%) |
Employment Occupations by Sex in Hamilton County
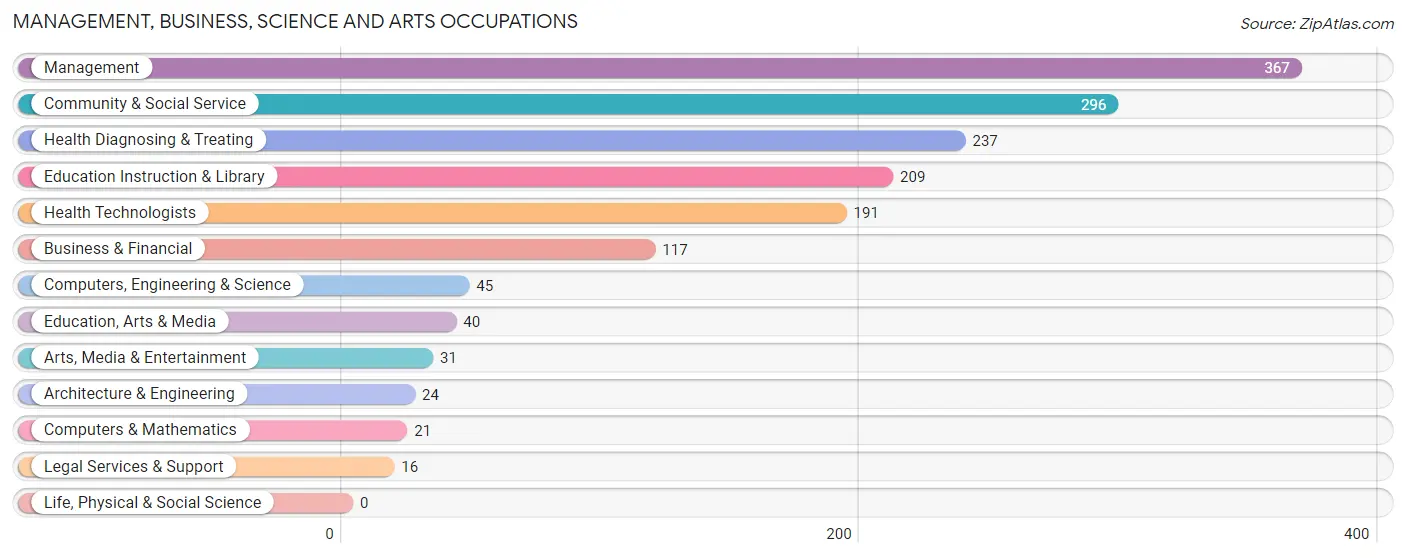
Management, Business, Science and Arts Occupations
The most common Management, Business, Science and Arts occupations in Hamilton County are Management (367 | 10.9%), Community & Social Service (296 | 8.8%), Health Diagnosing & Treating (237 | 7.0%), Education Instruction & Library (209 | 6.2%), and Health Technologists (191 | 5.7%).
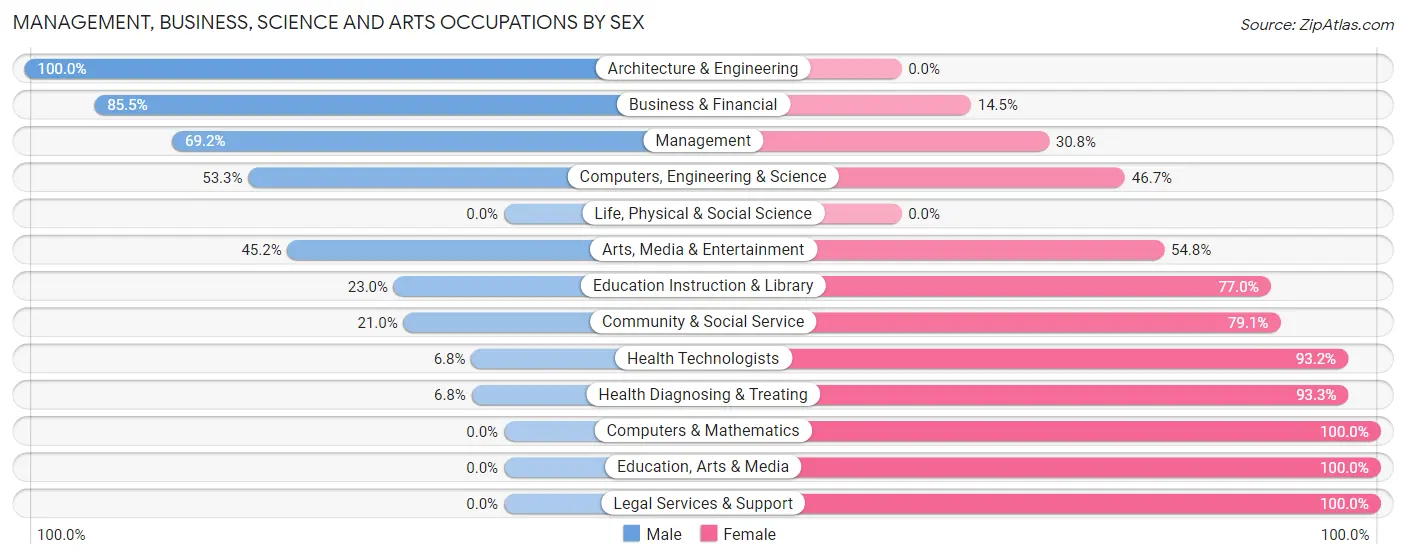
Management, Business, Science and Arts Occupations by Sex
Within the Management, Business, Science and Arts occupations in Hamilton County, the most male-oriented occupations are Architecture & Engineering (100.0%), Business & Financial (85.5%), and Management (69.2%), while the most female-oriented occupations are Computers & Mathematics (100.0%), Education, Arts & Media (100.0%), and Legal Services & Support (100.0%).
| Occupation | Male | Female |
| Management | 254 (69.2%) | 113 (30.8%) |
| Business & Financial | 100 (85.5%) | 17 (14.5%) |
| Computers, Engineering & Science | 24 (53.3%) | 21 (46.7%) |
| Computers & Mathematics | 0 (0.0%) | 21 (100.0%) |
| Architecture & Engineering | 24 (100.0%) | 0 (0.0%) |
| Life, Physical & Social Science | 0 (0.0%) | 0 (0.0%) |
| Community & Social Service | 62 (20.9%) | 234 (79.0%) |
| Education, Arts & Media | 0 (0.0%) | 40 (100.0%) |
| Legal Services & Support | 0 (0.0%) | 16 (100.0%) |
| Education Instruction & Library | 48 (23.0%) | 161 (77.0%) |
| Arts, Media & Entertainment | 14 (45.2%) | 17 (54.8%) |
| Health Diagnosing & Treating | 16 (6.8%) | 221 (93.2%) |
| Health Technologists | 13 (6.8%) | 178 (93.2%) |
| Total (Category) | 456 (42.9%) | 606 (57.1%) |
| Total (Overall) | 1,954 (57.9%) | 1,422 (42.1%) |
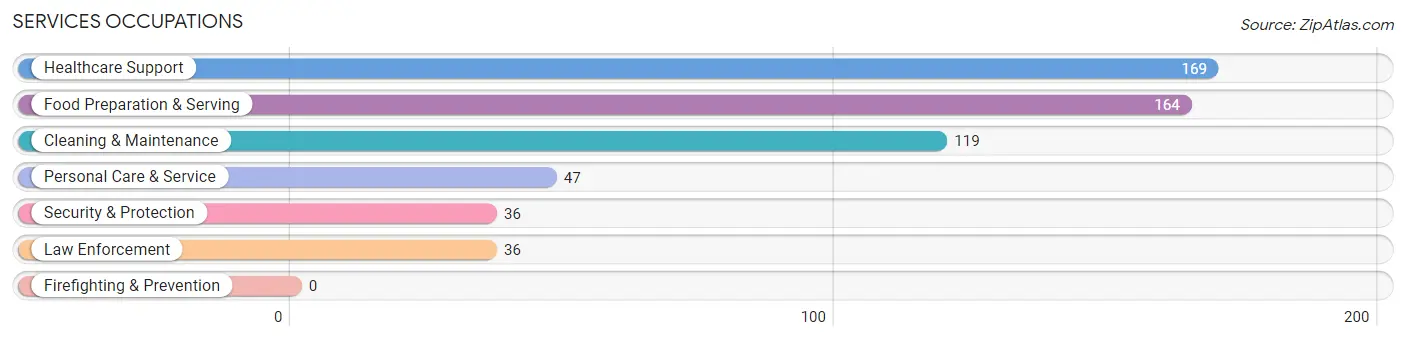
Services Occupations
The most common Services occupations in Hamilton County are Healthcare Support (169 | 5.0%), Food Preparation & Serving (164 | 4.9%), Cleaning & Maintenance (119 | 3.5%), Personal Care & Service (47 | 1.4%), and Security & Protection (36 | 1.1%).
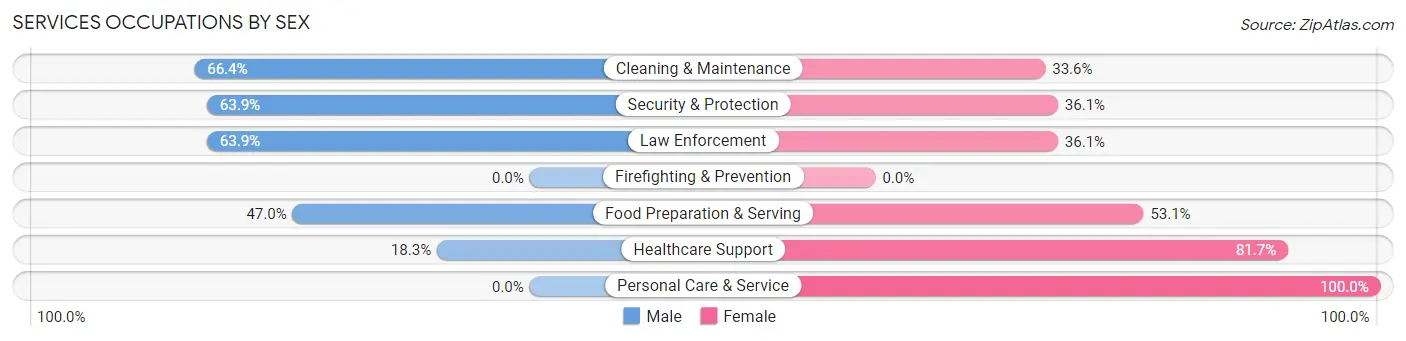
Services Occupations by Sex
Within the Services occupations in Hamilton County, the most male-oriented occupations are Cleaning & Maintenance (66.4%), Security & Protection (63.9%), and Law Enforcement (63.9%), while the most female-oriented occupations are Personal Care & Service (100.0%), Healthcare Support (81.7%), and Food Preparation & Serving (53.0%).
| Occupation | Male | Female |
| Healthcare Support | 31 (18.3%) | 138 (81.7%) |
| Security & Protection | 23 (63.9%) | 13 (36.1%) |
| Firefighting & Prevention | 0 (0.0%) | 0 (0.0%) |
| Law Enforcement | 23 (63.9%) | 13 (36.1%) |
| Food Preparation & Serving | 77 (46.9%) | 87 (53.0%) |
| Cleaning & Maintenance | 79 (66.4%) | 40 (33.6%) |
| Personal Care & Service | 0 (0.0%) | 47 (100.0%) |
| Total (Category) | 210 (39.3%) | 325 (60.8%) |
| Total (Overall) | 1,954 (57.9%) | 1,422 (42.1%) |
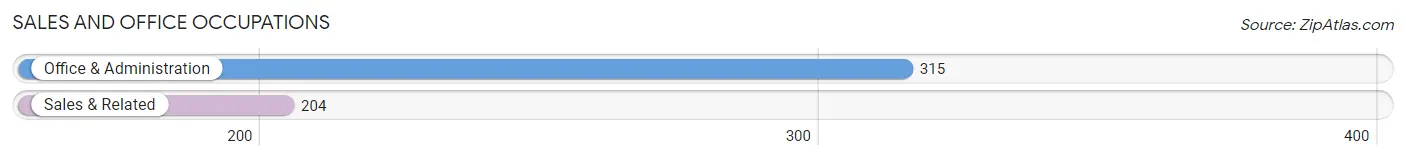
Sales and Office Occupations
The most common Sales and Office occupations in Hamilton County are Office & Administration (315 | 9.3%), and Sales & Related (204 | 6.0%).
Sales and Office Occupations by Sex
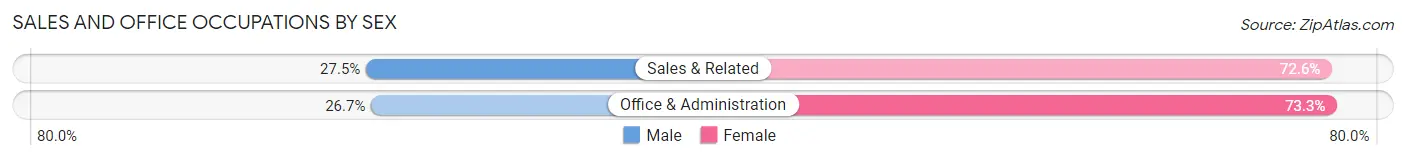
| Occupation | Male | Female |
| Sales & Related | 56 (27.5%) | 148 (72.6%) |
| Office & Administration | 84 (26.7%) | 231 (73.3%) |
| Total (Category) | 140 (27.0%) | 379 (73.0%) |
| Total (Overall) | 1,954 (57.9%) | 1,422 (42.1%) |
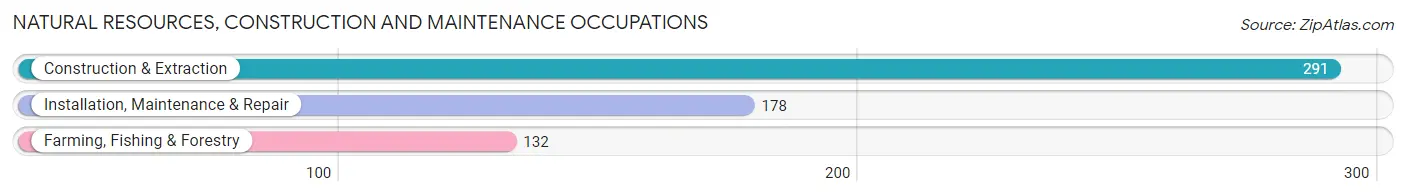
Natural Resources, Construction and Maintenance Occupations
The most common Natural Resources, Construction and Maintenance occupations in Hamilton County are Construction & Extraction (291 | 8.6%), Installation, Maintenance & Repair (178 | 5.3%), and Farming, Fishing & Forestry (132 | 3.9%).
Natural Resources, Construction and Maintenance Occupations by Sex
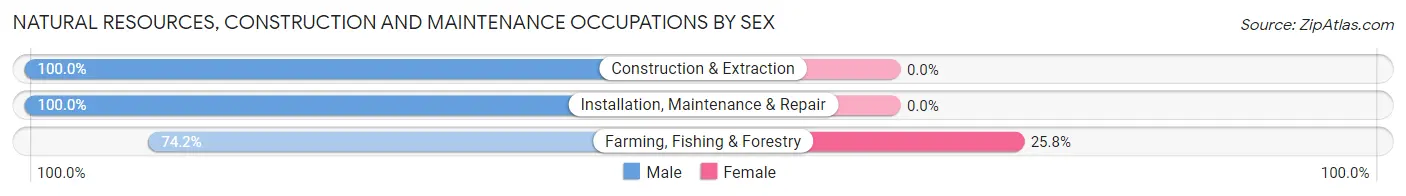
| Occupation | Male | Female |
| Farming, Fishing & Forestry | 98 (74.2%) | 34 (25.8%) |
| Construction & Extraction | 291 (100.0%) | 0 (0.0%) |
| Installation, Maintenance & Repair | 178 (100.0%) | 0 (0.0%) |
| Total (Category) | 567 (94.3%) | 34 (5.7%) |
| Total (Overall) | 1,954 (57.9%) | 1,422 (42.1%) |
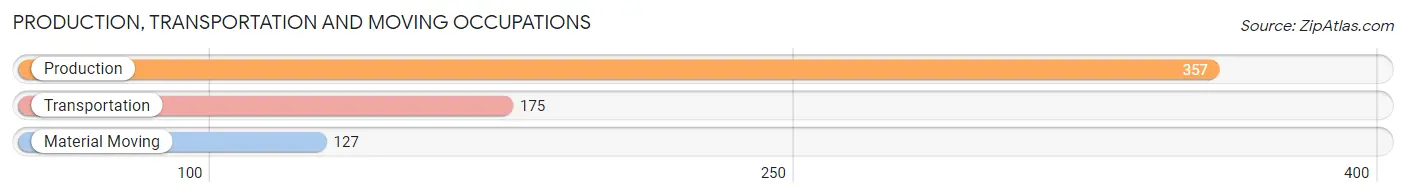
Production, Transportation and Moving Occupations
The most common Production, Transportation and Moving occupations in Hamilton County are Production (357 | 10.6%), Transportation (175 | 5.2%), and Material Moving (127 | 3.8%).
Production, Transportation and Moving Occupations by Sex
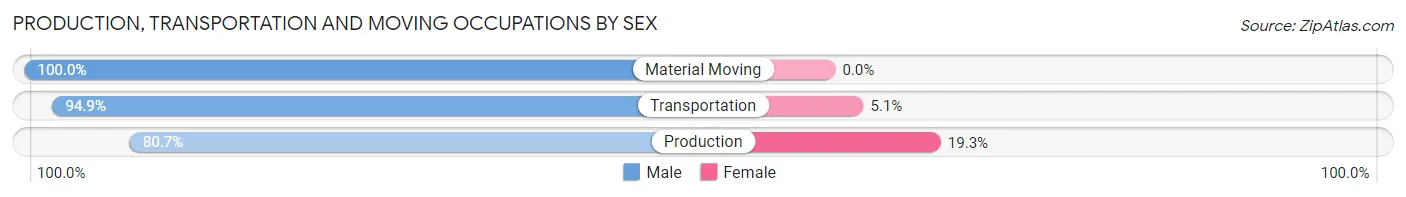
| Occupation | Male | Female |
| Production | 288 (80.7%) | 69 (19.3%) |
| Transportation | 166 (94.9%) | 9 (5.1%) |
| Material Moving | 127 (100.0%) | 0 (0.0%) |
| Total (Category) | 581 (88.2%) | 78 (11.8%) |
| Total (Overall) | 1,954 (57.9%) | 1,422 (42.1%) |
Employment Industries by Sex in Hamilton County
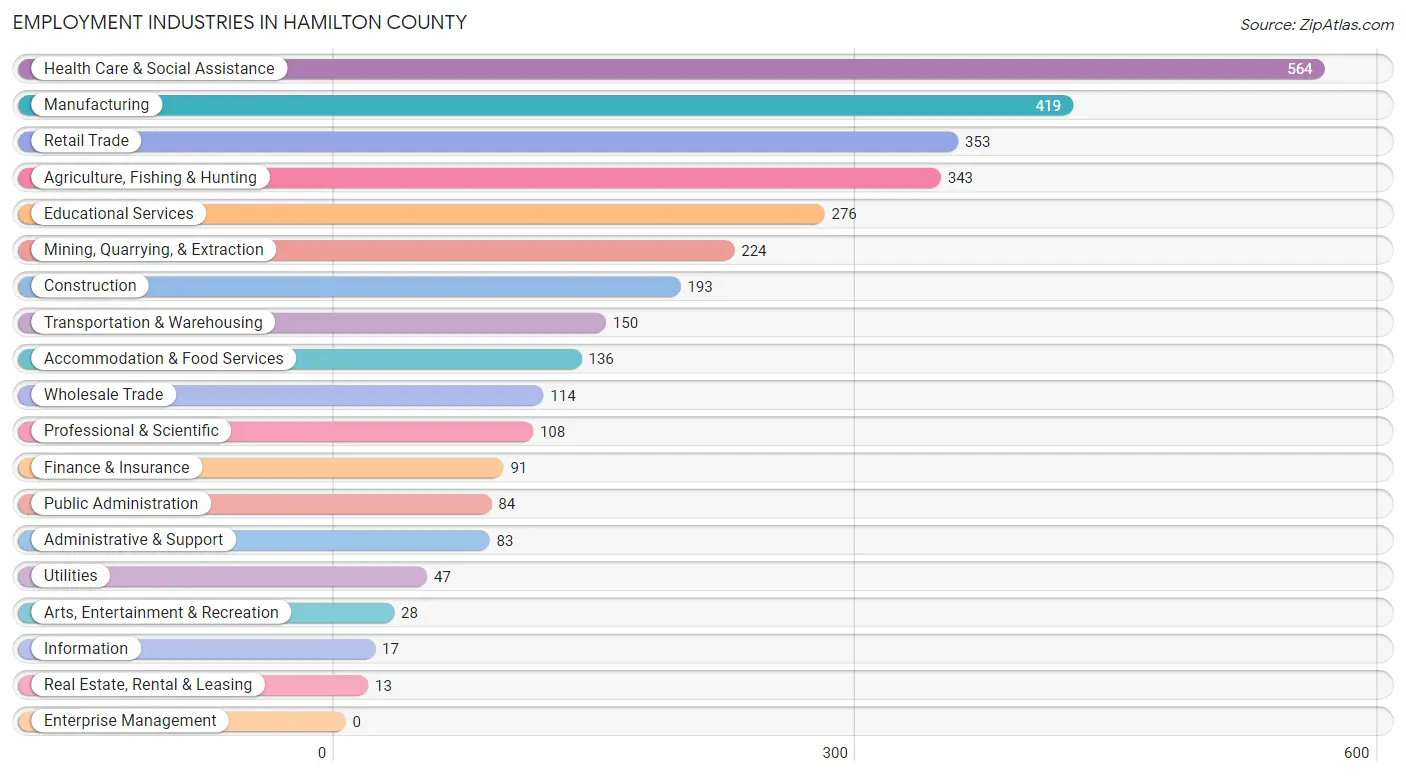
Employment Industries in Hamilton County
The major employment industries in Hamilton County include Health Care & Social Assistance (564 | 16.7%), Manufacturing (419 | 12.4%), Retail Trade (353 | 10.5%), Agriculture, Fishing & Hunting (343 | 10.2%), and Educational Services (276 | 8.2%).
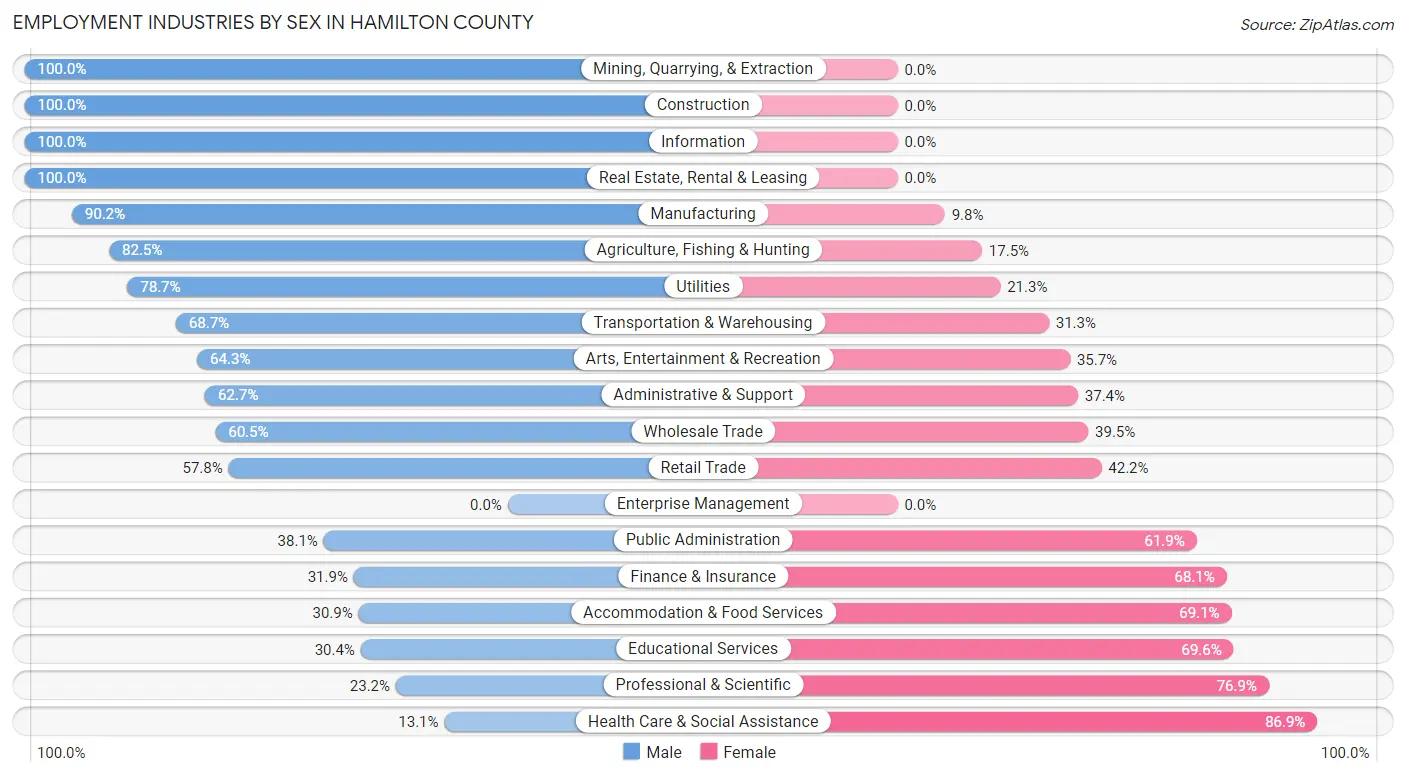
Employment Industries by Sex in Hamilton County
The Hamilton County industries that see more men than women are Mining, Quarrying, & Extraction (100.0%), Construction (100.0%), and Information (100.0%), whereas the industries that tend to have a higher number of women are Health Care & Social Assistance (86.9%), Professional & Scientific (76.8%), and Educational Services (69.6%).
| Industry | Male | Female |
| Agriculture, Fishing & Hunting | 283 (82.5%) | 60 (17.5%) |
| Mining, Quarrying, & Extraction | 224 (100.0%) | 0 (0.0%) |
| Construction | 193 (100.0%) | 0 (0.0%) |
| Manufacturing | 378 (90.2%) | 41 (9.8%) |
| Wholesale Trade | 69 (60.5%) | 45 (39.5%) |
| Retail Trade | 204 (57.8%) | 149 (42.2%) |
| Transportation & Warehousing | 103 (68.7%) | 47 (31.3%) |
| Utilities | 37 (78.7%) | 10 (21.3%) |
| Information | 17 (100.0%) | 0 (0.0%) |
| Finance & Insurance | 29 (31.9%) | 62 (68.1%) |
| Real Estate, Rental & Leasing | 13 (100.0%) | 0 (0.0%) |
| Professional & Scientific | 25 (23.2%) | 83 (76.8%) |
| Enterprise Management | 0 (0.0%) | 0 (0.0%) |
| Administrative & Support | 52 (62.6%) | 31 (37.3%) |
| Educational Services | 84 (30.4%) | 192 (69.6%) |
| Health Care & Social Assistance | 74 (13.1%) | 490 (86.9%) |
| Arts, Entertainment & Recreation | 18 (64.3%) | 10 (35.7%) |
| Accommodation & Food Services | 42 (30.9%) | 94 (69.1%) |
| Public Administration | 32 (38.1%) | 52 (61.9%) |
| Total | 1,954 (57.9%) | 1,422 (42.1%) |
Education in Hamilton County
School Enrollment in Hamilton County
The most common levels of schooling among the 1,749 students in Hamilton County are middle school (447 | 25.6%), high school (418 | 23.9%), and elementary school (411 | 23.5%).
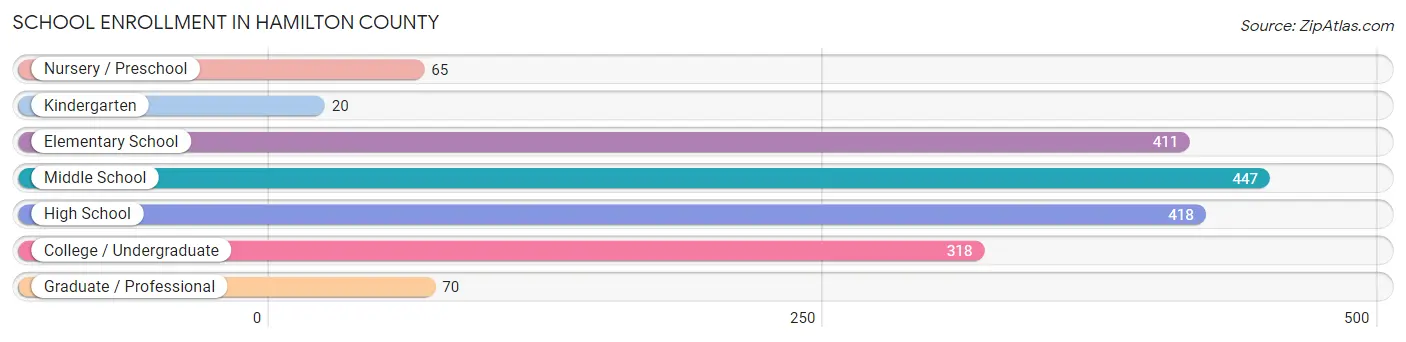
| School Level | # Students | % Students |
| Nursery / Preschool | 65 | 3.7% |
| Kindergarten | 20 | 1.1% |
| Elementary School | 411 | 23.5% |
| Middle School | 447 | 25.6% |
| High School | 418 | 23.9% |
| College / Undergraduate | 318 | 18.2% |
| Graduate / Professional | 70 | 4.0% |
| Total | 1,749 | 100.0% |
School Enrollment by Age by Funding Source in Hamilton County
Out of a total of 1,749 students who are enrolled in schools in Hamilton County, 58 (3.3%) attend a private institution, while the remaining 1,691 (96.7%) are enrolled in public schools. The age group of 35 years and over has the highest likelihood of being enrolled in private schools, with 12 (9.7% in the age bracket) enrolled. Conversely, the age group of 3 to 4 year olds has the lowest likelihood of being enrolled in a private school, with 36 (100.0% in the age bracket) attending a public institution.
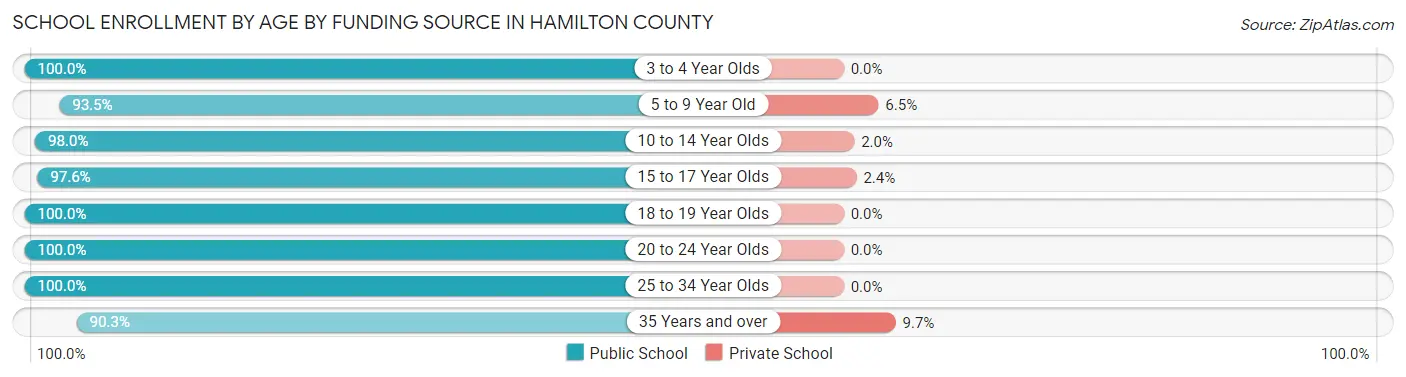
| Age Bracket | Public School | Private School |
| 3 to 4 Year Olds | 36 (100.0%) | 0 (0.0%) |
| 5 to 9 Year Old | 405 (93.5%) | 28 (6.5%) |
| 10 to 14 Year Olds | 500 (98.0%) | 10 (2.0%) |
| 15 to 17 Year Olds | 327 (97.6%) | 8 (2.4%) |
| 18 to 19 Year Olds | 74 (100.0%) | 0 (0.0%) |
| 20 to 24 Year Olds | 190 (100.0%) | 0 (0.0%) |
| 25 to 34 Year Olds | 47 (100.0%) | 0 (0.0%) |
| 35 Years and over | 112 (90.3%) | 12 (9.7%) |
| Total | 1,691 (96.7%) | 58 (3.3%) |
Educational Attainment by Field of Study in Hamilton County
Education (262 | 25.8%), science & technology (159 | 15.7%), arts & humanities (124 | 12.2%), business (118 | 11.6%), and bio, nature & agricultural (113 | 11.1%) are the most common fields of study among 1,016 individuals in Hamilton County who have obtained a bachelor's degree or higher.
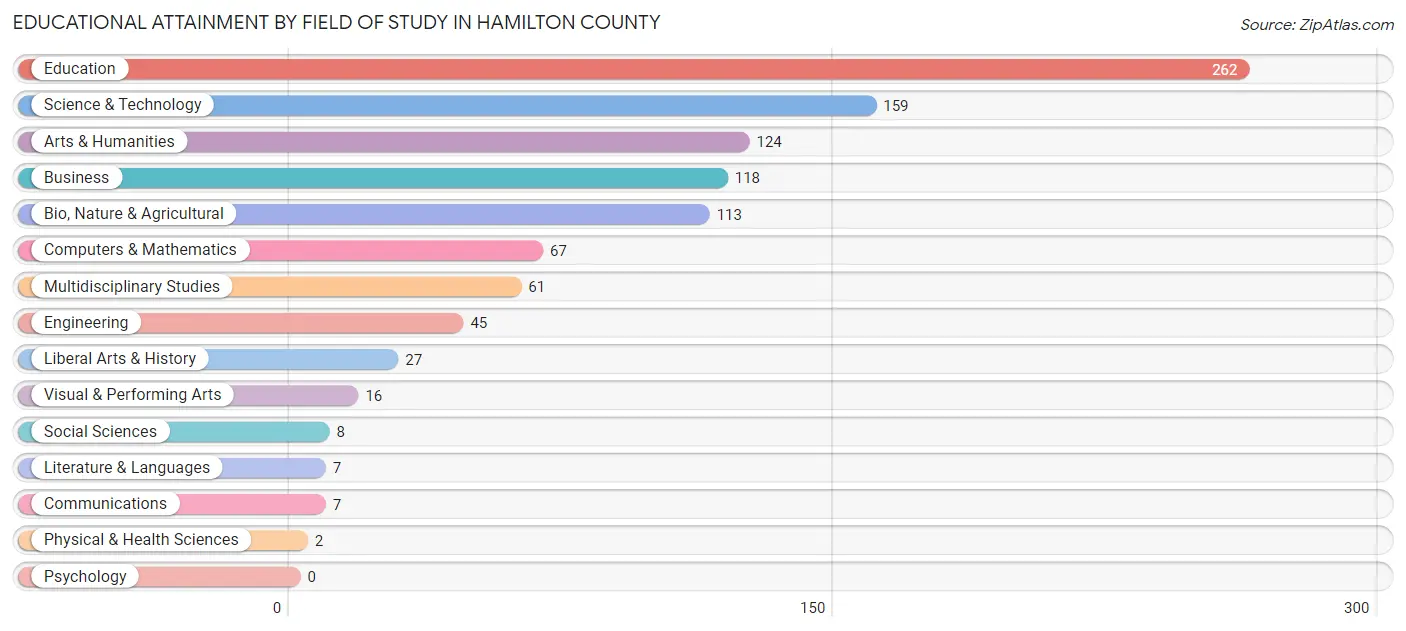
| Field of Study | # Graduates | % Graduates |
| Computers & Mathematics | 67 | 6.6% |
| Bio, Nature & Agricultural | 113 | 11.1% |
| Physical & Health Sciences | 2 | 0.2% |
| Psychology | 0 | 0.0% |
| Social Sciences | 8 | 0.8% |
| Engineering | 45 | 4.4% |
| Multidisciplinary Studies | 61 | 6.0% |
| Science & Technology | 159 | 15.7% |
| Business | 118 | 11.6% |
| Education | 262 | 25.8% |
| Literature & Languages | 7 | 0.7% |
| Liberal Arts & History | 27 | 2.7% |
| Visual & Performing Arts | 16 | 1.6% |
| Communications | 7 | 0.7% |
| Arts & Humanities | 124 | 12.2% |
| Total | 1,016 | 100.0% |
Transportation & Commute in Hamilton County
Vehicle Availability by Sex in Hamilton County
The most prevalent vehicle ownership categories in Hamilton County are males with 2 vehicles (699, accounting for 37.9%) and females with 2 vehicles (587, making up 50.0%).
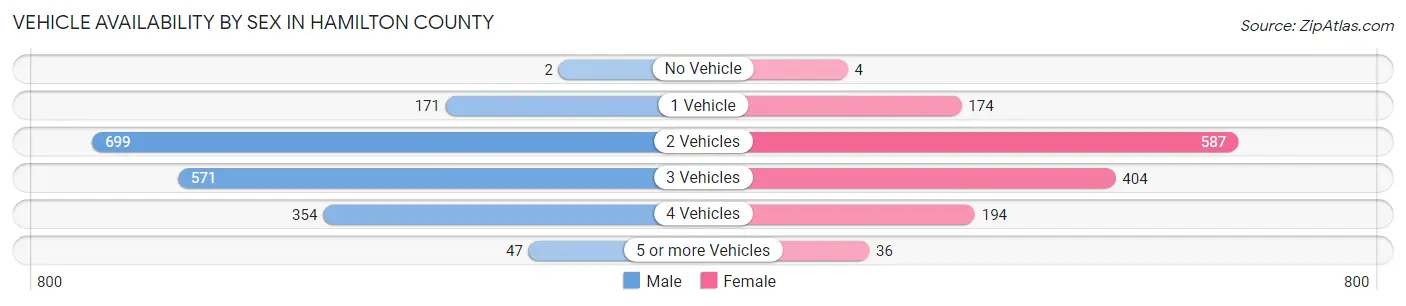
| Vehicles Available | Male | Female |
| No Vehicle | 2 (0.1%) | 4 (0.3%) |
| 1 Vehicle | 171 (9.3%) | 174 (12.4%) |
| 2 Vehicles | 699 (37.9%) | 587 (42.0%) |
| 3 Vehicles | 571 (31.0%) | 404 (28.9%) |
| 4 Vehicles | 354 (19.2%) | 194 (13.9%) |
| 5 or more Vehicles | 47 (2.5%) | 36 (2.6%) |
| Total | 1,844 (100.0%) | 1,399 (100.0%) |
Commute Time in Hamilton County
The most frequently occuring commute durations in Hamilton County are 30 to 34 minutes (488 commuters, 16.1%), 5 to 9 minutes (398 commuters, 13.1%), and 45 to 59 minutes (342 commuters, 11.3%).
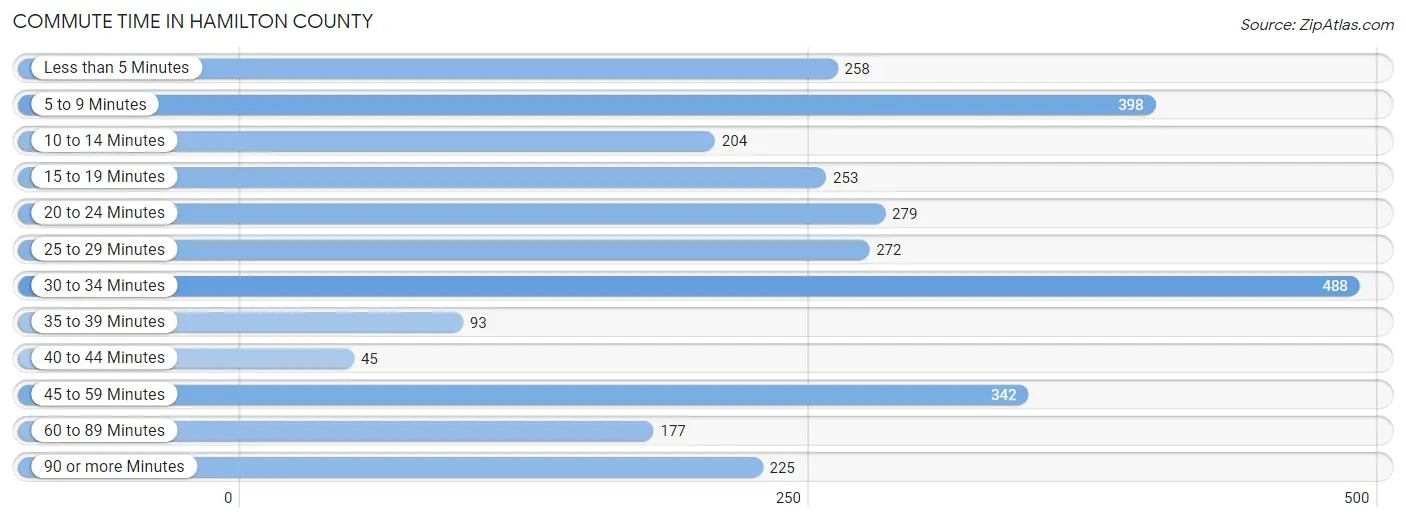
| Commute Time | # Commuters | % Commuters |
| Less than 5 Minutes | 258 | 8.5% |
| 5 to 9 Minutes | 398 | 13.1% |
| 10 to 14 Minutes | 204 | 6.7% |
| 15 to 19 Minutes | 253 | 8.3% |
| 20 to 24 Minutes | 279 | 9.2% |
| 25 to 29 Minutes | 272 | 9.0% |
| 30 to 34 Minutes | 488 | 16.1% |
| 35 to 39 Minutes | 93 | 3.1% |
| 40 to 44 Minutes | 45 | 1.5% |
| 45 to 59 Minutes | 342 | 11.3% |
| 60 to 89 Minutes | 177 | 5.8% |
| 90 or more Minutes | 225 | 7.4% |
Commute Time by Sex in Hamilton County
The most common commute times in Hamilton County are 30 to 34 minutes (270 commuters, 15.9%) for males and 5 to 9 minutes (272 commuters, 20.4%) for females.
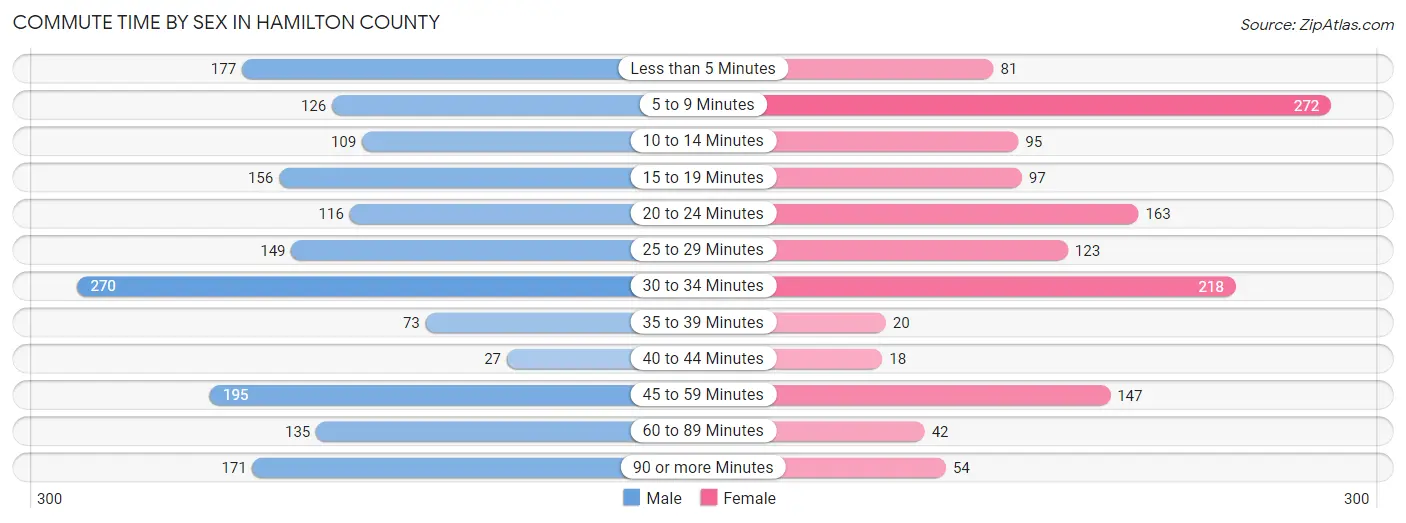
| Commute Time | Male | Female |
| Less than 5 Minutes | 177 (10.4%) | 81 (6.1%) |
| 5 to 9 Minutes | 126 (7.4%) | 272 (20.4%) |
| 10 to 14 Minutes | 109 (6.4%) | 95 (7.1%) |
| 15 to 19 Minutes | 156 (9.1%) | 97 (7.3%) |
| 20 to 24 Minutes | 116 (6.8%) | 163 (12.3%) |
| 25 to 29 Minutes | 149 (8.7%) | 123 (9.2%) |
| 30 to 34 Minutes | 270 (15.9%) | 218 (16.4%) |
| 35 to 39 Minutes | 73 (4.3%) | 20 (1.5%) |
| 40 to 44 Minutes | 27 (1.6%) | 18 (1.3%) |
| 45 to 59 Minutes | 195 (11.4%) | 147 (11.1%) |
| 60 to 89 Minutes | 135 (7.9%) | 42 (3.2%) |
| 90 or more Minutes | 171 (10.0%) | 54 (4.1%) |
Time of Departure to Work by Sex in Hamilton County
The most frequent times of departure to work in Hamilton County are 4:00 PM to 11:59 PM (220, 12.9%) for males and 6:30 AM to 6:59 AM (197, 14.8%) for females.
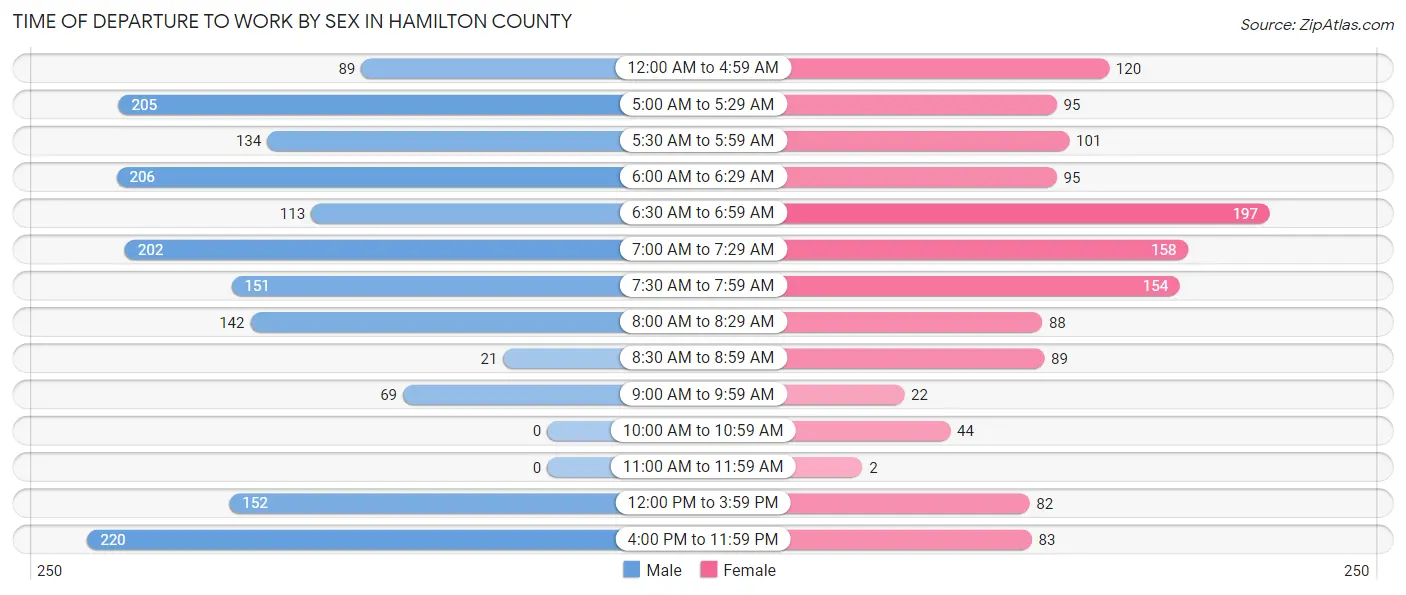
| Time of Departure | Male | Female |
| 12:00 AM to 4:59 AM | 89 (5.2%) | 120 (9.0%) |
| 5:00 AM to 5:29 AM | 205 (12.0%) | 95 (7.1%) |
| 5:30 AM to 5:59 AM | 134 (7.9%) | 101 (7.6%) |
| 6:00 AM to 6:29 AM | 206 (12.1%) | 95 (7.1%) |
| 6:30 AM to 6:59 AM | 113 (6.6%) | 197 (14.8%) |
| 7:00 AM to 7:29 AM | 202 (11.8%) | 158 (11.9%) |
| 7:30 AM to 7:59 AM | 151 (8.9%) | 154 (11.6%) |
| 8:00 AM to 8:29 AM | 142 (8.3%) | 88 (6.6%) |
| 8:30 AM to 8:59 AM | 21 (1.2%) | 89 (6.7%) |
| 9:00 AM to 9:59 AM | 69 (4.1%) | 22 (1.7%) |
| 10:00 AM to 10:59 AM | 0 (0.0%) | 44 (3.3%) |
| 11:00 AM to 11:59 AM | 0 (0.0%) | 2 (0.2%) |
| 12:00 PM to 3:59 PM | 152 (8.9%) | 82 (6.2%) |
| 4:00 PM to 11:59 PM | 220 (12.9%) | 83 (6.2%) |
| Total | 1,704 (100.0%) | 1,330 (100.0%) |
Housing Occupancy in Hamilton County
Occupancy by Ownership in Hamilton County
Of the total 3,271 dwellings in Hamilton County, owner-occupied units account for 2,523 (77.1%), while renter-occupied units make up 748 (22.9%).
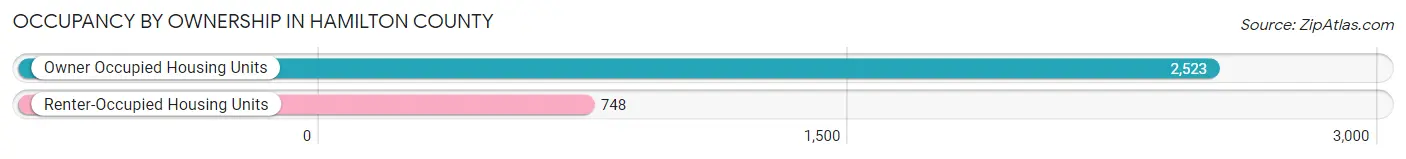
| Occupancy | # Housing Units | % Housing Units |
| Owner Occupied Housing Units | 2,523 | 77.1% |
| Renter-Occupied Housing Units | 748 | 22.9% |
| Total Occupied Housing Units | 3,271 | 100.0% |
Occupancy by Household Size in Hamilton County
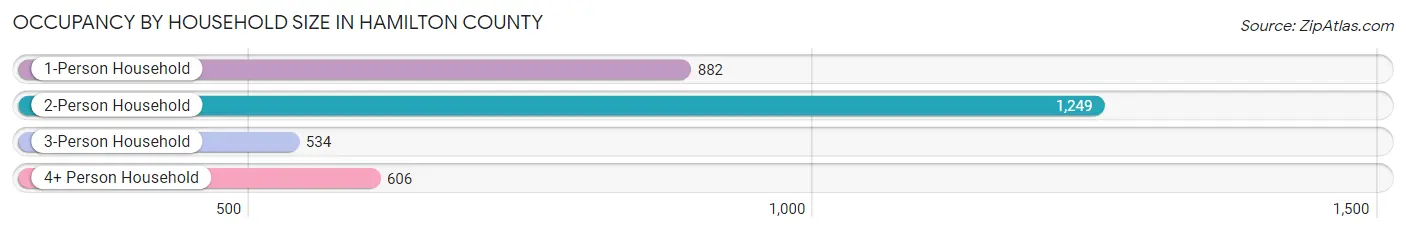
| Household Size | # Housing Units | % Housing Units |
| 1-Person Household | 882 | 27.0% |
| 2-Person Household | 1,249 | 38.2% |
| 3-Person Household | 534 | 16.3% |
| 4+ Person Household | 606 | 18.5% |
| Total Housing Units | 3,271 | 100.0% |
Occupancy by Ownership by Household Size in Hamilton County
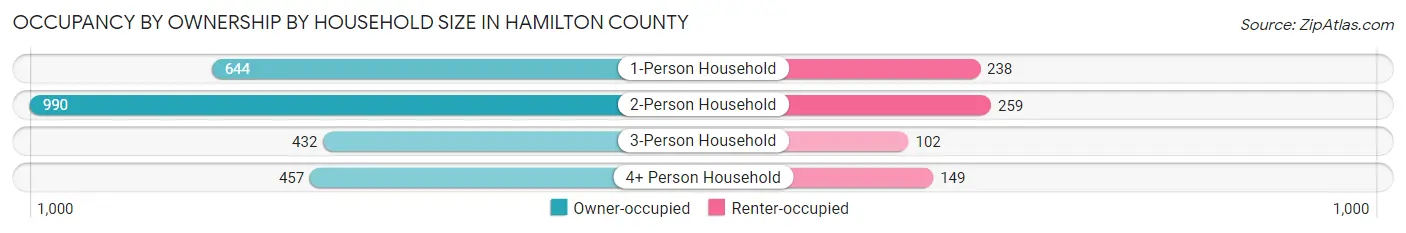
| Household Size | Owner-occupied | Renter-occupied |
| 1-Person Household | 644 (73.0%) | 238 (27.0%) |
| 2-Person Household | 990 (79.3%) | 259 (20.7%) |
| 3-Person Household | 432 (80.9%) | 102 (19.1%) |
| 4+ Person Household | 457 (75.4%) | 149 (24.6%) |
| Total Housing Units | 2,523 (77.1%) | 748 (22.9%) |
Occupancy by Educational Attainment in Hamilton County
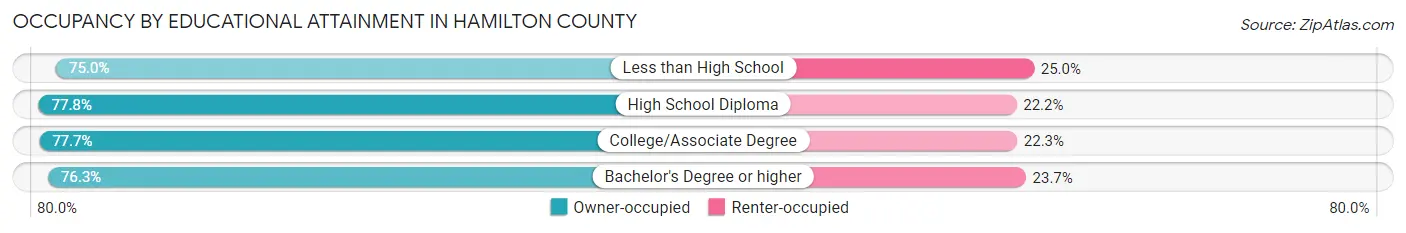
| Household Size | Owner-occupied | Renter-occupied |
| Less than High School | 306 (75.0%) | 102 (25.0%) |
| High School Diploma | 696 (77.8%) | 199 (22.2%) |
| College/Associate Degree | 1,096 (77.7%) | 315 (22.3%) |
| Bachelor's Degree or higher | 425 (76.3%) | 132 (23.7%) |
Occupancy by Age of Householder in Hamilton County
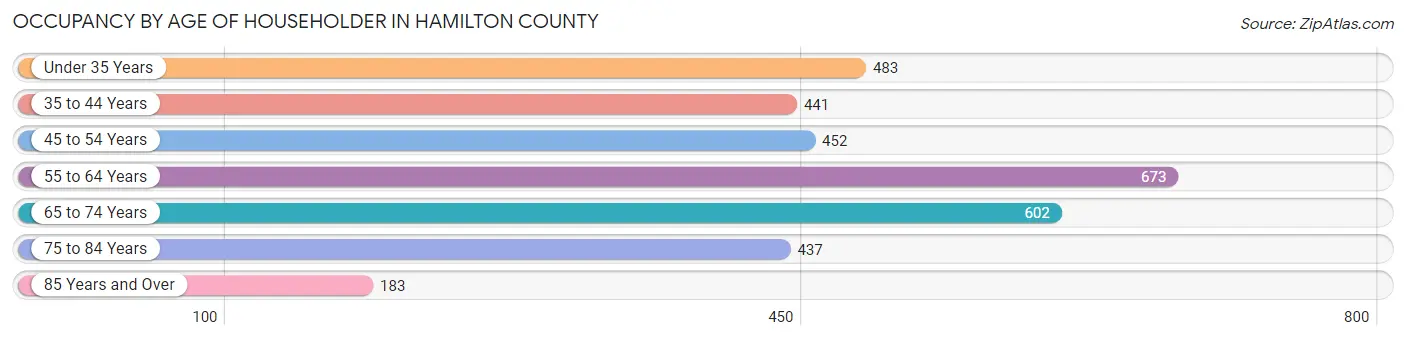
| Age Bracket | # Households | % Households |
| Under 35 Years | 483 | 14.8% |
| 35 to 44 Years | 441 | 13.5% |
| 45 to 54 Years | 452 | 13.8% |
| 55 to 64 Years | 673 | 20.6% |
| 65 to 74 Years | 602 | 18.4% |
| 75 to 84 Years | 437 | 13.4% |
| 85 Years and Over | 183 | 5.6% |
| Total | 3,271 | 100.0% |
Housing Finances in Hamilton County
Median Income by Occupancy in Hamilton County
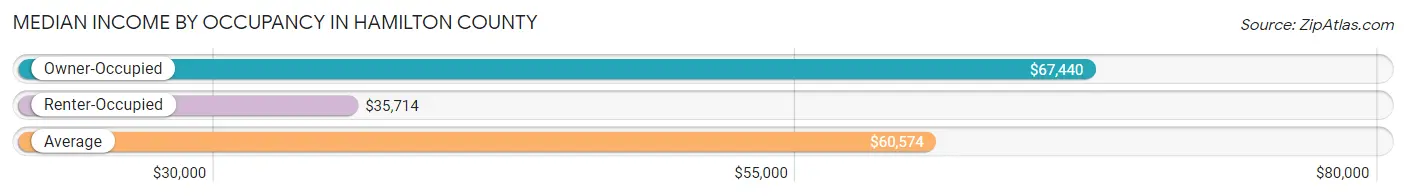
| Occupancy Type | # Households | Median Income |
| Owner-Occupied | 2,523 (77.1%) | $67,440 |
| Renter-Occupied | 748 (22.9%) | $35,714 |
| Average | 3,271 (100.0%) | $60,574 |
Occupancy by Householder Income Bracket in Hamilton County
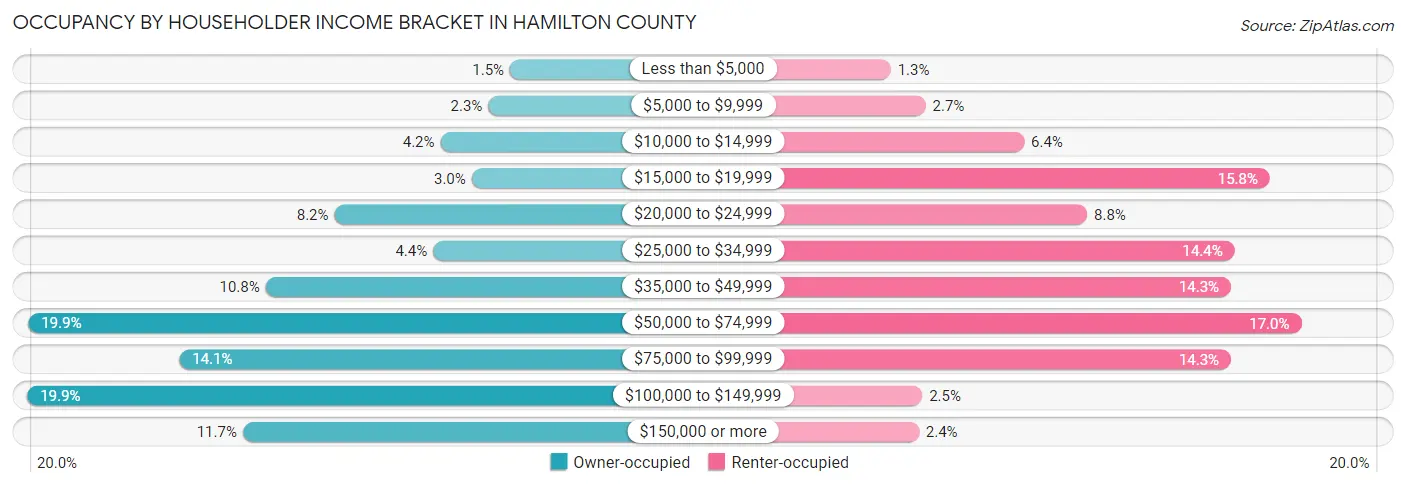
| Income Bracket | Owner-occupied | Renter-occupied |
| Less than $5,000 | 38 (1.5%) | 10 (1.3%) |
| $5,000 to $9,999 | 59 (2.3%) | 20 (2.7%) |
| $10,000 to $14,999 | 105 (4.2%) | 48 (6.4%) |
| $15,000 to $19,999 | 75 (3.0%) | 118 (15.8%) |
| $20,000 to $24,999 | 207 (8.2%) | 66 (8.8%) |
| $25,000 to $34,999 | 112 (4.4%) | 108 (14.4%) |
| $35,000 to $49,999 | 273 (10.8%) | 107 (14.3%) |
| $50,000 to $74,999 | 501 (19.9%) | 127 (17.0%) |
| $75,000 to $99,999 | 356 (14.1%) | 107 (14.3%) |
| $100,000 to $149,999 | 502 (19.9%) | 19 (2.5%) |
| $150,000 or more | 295 (11.7%) | 18 (2.4%) |
| Total | 2,523 (100.0%) | 748 (100.0%) |
Monthly Housing Cost Tiers in Hamilton County
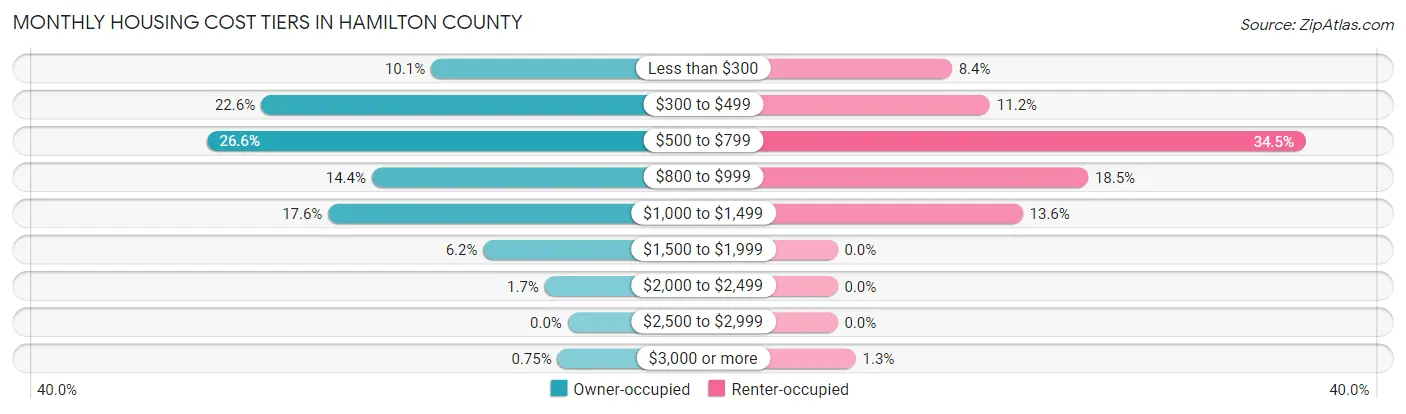
| Monthly Cost | Owner-occupied | Renter-occupied |
| Less than $300 | 254 (10.1%) | 63 (8.4%) |
| $300 to $499 | 570 (22.6%) | 84 (11.2%) |
| $500 to $799 | 671 (26.6%) | 258 (34.5%) |
| $800 to $999 | 364 (14.4%) | 138 (18.4%) |
| $1,000 to $1,499 | 445 (17.6%) | 102 (13.6%) |
| $1,500 to $1,999 | 157 (6.2%) | 0 (0.0%) |
| $2,000 to $2,499 | 43 (1.7%) | 0 (0.0%) |
| $2,500 to $2,999 | 0 (0.0%) | 0 (0.0%) |
| $3,000 or more | 19 (0.7%) | 10 (1.3%) |
| Total | 2,523 (100.0%) | 748 (100.0%) |
Physical Housing Characteristics in Hamilton County
Housing Structures in Hamilton County
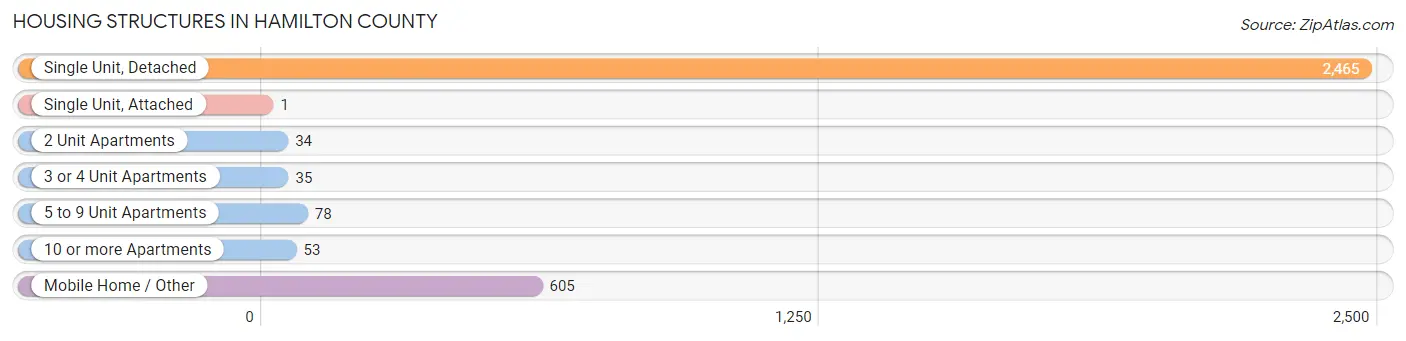
| Structure Type | # Housing Units | % Housing Units |
| Single Unit, Detached | 2,465 | 75.4% |
| Single Unit, Attached | 1 | 0.0% |
| 2 Unit Apartments | 34 | 1.0% |
| 3 or 4 Unit Apartments | 35 | 1.1% |
| 5 to 9 Unit Apartments | 78 | 2.4% |
| 10 or more Apartments | 53 | 1.6% |
| Mobile Home / Other | 605 | 18.5% |
| Total | 3,271 | 100.0% |
Housing Structures by Occupancy in Hamilton County
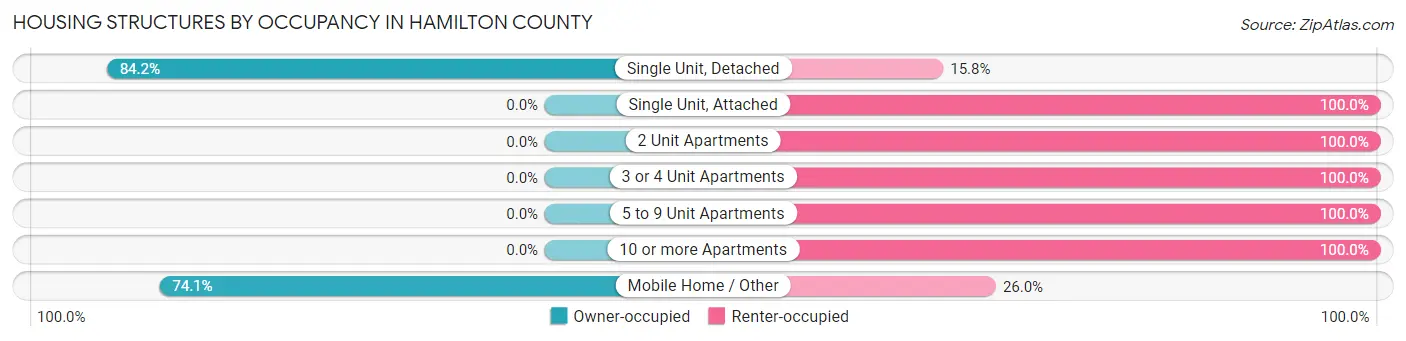
| Structure Type | Owner-occupied | Renter-occupied |
| Single Unit, Detached | 2,075 (84.2%) | 390 (15.8%) |
| Single Unit, Attached | 0 (0.0%) | 1 (100.0%) |
| 2 Unit Apartments | 0 (0.0%) | 34 (100.0%) |
| 3 or 4 Unit Apartments | 0 (0.0%) | 35 (100.0%) |
| 5 to 9 Unit Apartments | 0 (0.0%) | 78 (100.0%) |
| 10 or more Apartments | 0 (0.0%) | 53 (100.0%) |
| Mobile Home / Other | 448 (74.1%) | 157 (26.0%) |
| Total | 2,523 (77.1%) | 748 (22.9%) |
Housing Structures by Number of Rooms in Hamilton County
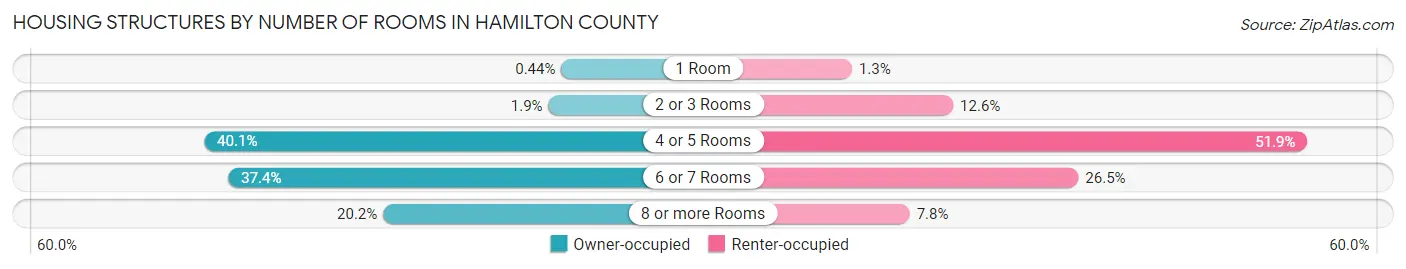
| Number of Rooms | Owner-occupied | Renter-occupied |
| 1 Room | 11 (0.4%) | 10 (1.3%) |
| 2 or 3 Rooms | 47 (1.9%) | 94 (12.6%) |
| 4 or 5 Rooms | 1,011 (40.1%) | 388 (51.9%) |
| 6 or 7 Rooms | 944 (37.4%) | 198 (26.5%) |
| 8 or more Rooms | 510 (20.2%) | 58 (7.7%) |
| Total | 2,523 (100.0%) | 748 (100.0%) |
Housing Structure by Heating Type in Hamilton County
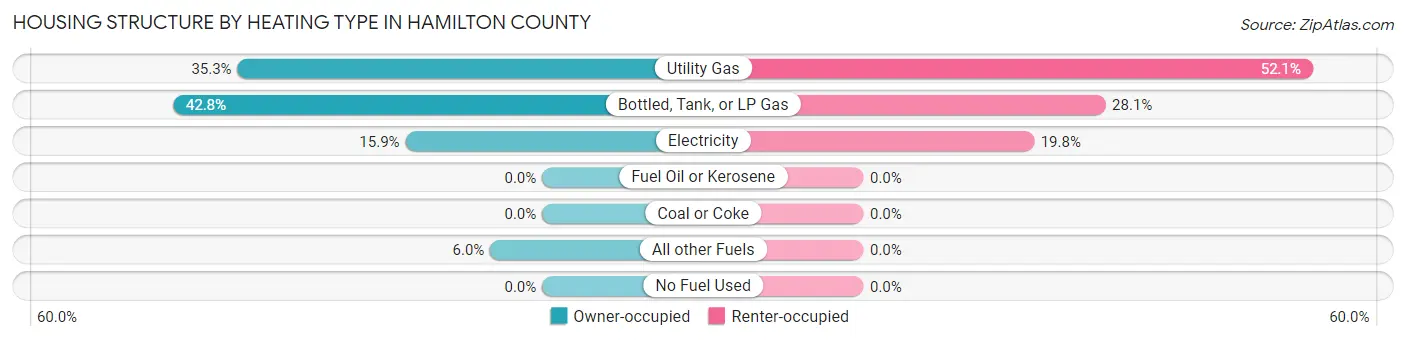
| Heating Type | Owner-occupied | Renter-occupied |
| Utility Gas | 891 (35.3%) | 390 (52.1%) |
| Bottled, Tank, or LP Gas | 1,080 (42.8%) | 210 (28.1%) |
| Electricity | 400 (15.9%) | 148 (19.8%) |
| Fuel Oil or Kerosene | 0 (0.0%) | 0 (0.0%) |
| Coal or Coke | 0 (0.0%) | 0 (0.0%) |
| All other Fuels | 152 (6.0%) | 0 (0.0%) |
| No Fuel Used | 0 (0.0%) | 0 (0.0%) |
| Total | 2,523 (100.0%) | 748 (100.0%) |
Household Vehicle Usage in Hamilton County
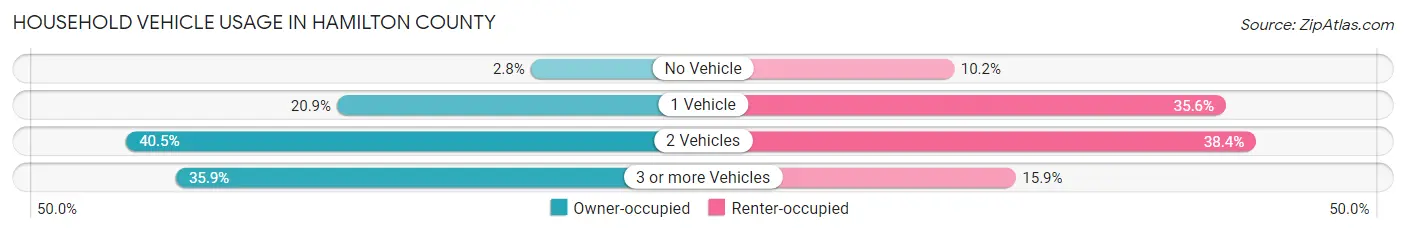
| Vehicles per Household | Owner-occupied | Renter-occupied |
| No Vehicle | 70 (2.8%) | 76 (10.2%) |
| 1 Vehicle | 526 (20.8%) | 266 (35.6%) |
| 2 Vehicles | 1,022 (40.5%) | 287 (38.4%) |
| 3 or more Vehicles | 905 (35.9%) | 119 (15.9%) |
| Total | 2,523 (100.0%) | 748 (100.0%) |
Real Estate & Mortgages in Hamilton County
Real Estate and Mortgage Overview in Hamilton County
| Characteristic | Without Mortgage | With Mortgage |
| Housing Units | 1,633 | 890 |
| Median Property Value | $107,200 | $89,700 |
| Median Household Income | $61,599 | $76 |
| Monthly Housing Costs | $513 | $19 |
| Real Estate Taxes | $1,305 | $2 |
Property Value by Mortgage Status in Hamilton County
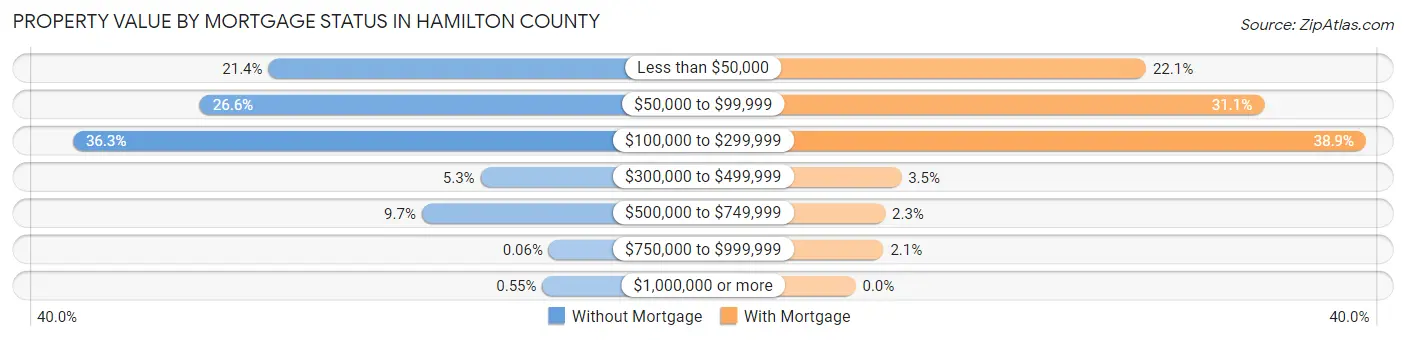
| Property Value | Without Mortgage | With Mortgage |
| Less than $50,000 | 350 (21.4%) | 197 (22.1%) |
| $50,000 to $99,999 | 435 (26.6%) | 277 (31.1%) |
| $100,000 to $299,999 | 593 (36.3%) | 346 (38.9%) |
| $300,000 to $499,999 | 86 (5.3%) | 31 (3.5%) |
| $500,000 to $749,999 | 159 (9.7%) | 20 (2.2%) |
| $750,000 to $999,999 | 1 (0.1%) | 19 (2.1%) |
| $1,000,000 or more | 9 (0.5%) | 0 (0.0%) |
| Total | 1,633 (100.0%) | 890 (100.0%) |
Household Income by Mortgage Status in Hamilton County
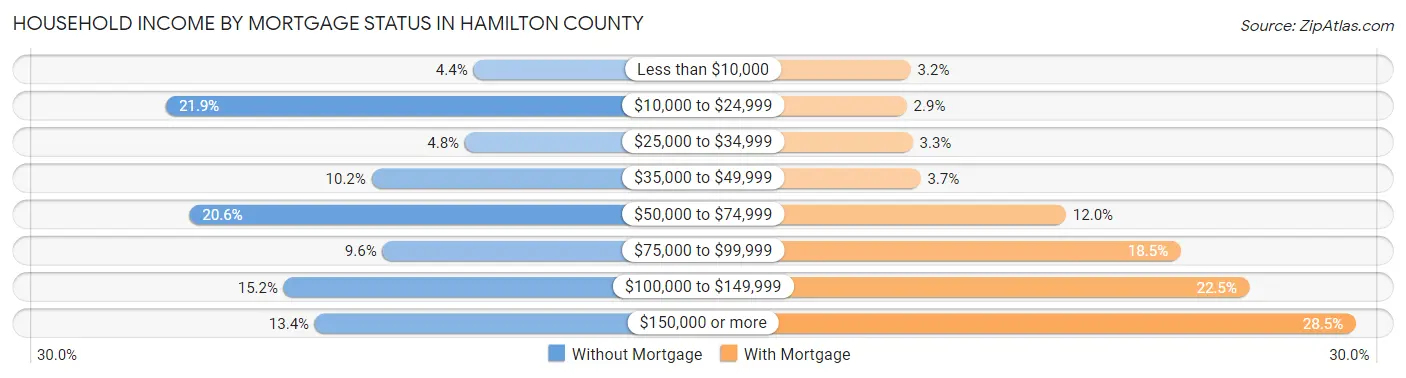
| Household Income | Without Mortgage | With Mortgage |
| Less than $10,000 | 71 (4.3%) | 28 (3.2%) |
| $10,000 to $24,999 | 358 (21.9%) | 26 (2.9%) |
| $25,000 to $34,999 | 79 (4.8%) | 29 (3.3%) |
| $35,000 to $49,999 | 166 (10.2%) | 33 (3.7%) |
| $50,000 to $74,999 | 336 (20.6%) | 107 (12.0%) |
| $75,000 to $99,999 | 156 (9.6%) | 165 (18.5%) |
| $100,000 to $149,999 | 248 (15.2%) | 200 (22.5%) |
| $150,000 or more | 219 (13.4%) | 254 (28.5%) |
| Total | 1,633 (100.0%) | 890 (100.0%) |
Property Value to Household Income Ratio in Hamilton County
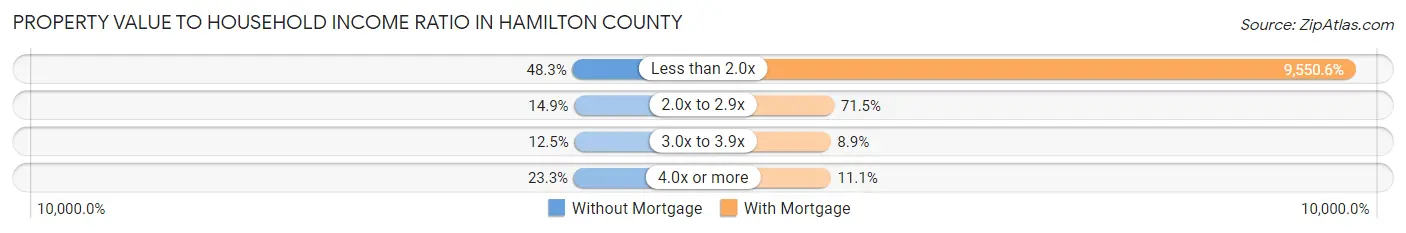
| Value-to-Income Ratio | Without Mortgage | With Mortgage |
| Less than 2.0x | 789 (48.3%) | 85,000 (9,550.6%) |
| 2.0x to 2.9x | 243 (14.9%) | 636 (71.5%) |
| 3.0x to 3.9x | 204 (12.5%) | 79 (8.9%) |
| 4.0x or more | 380 (23.3%) | 99 (11.1%) |
| Total | 1,633 (100.0%) | 890 (100.0%) |
Real Estate Taxes by Mortgage Status in Hamilton County
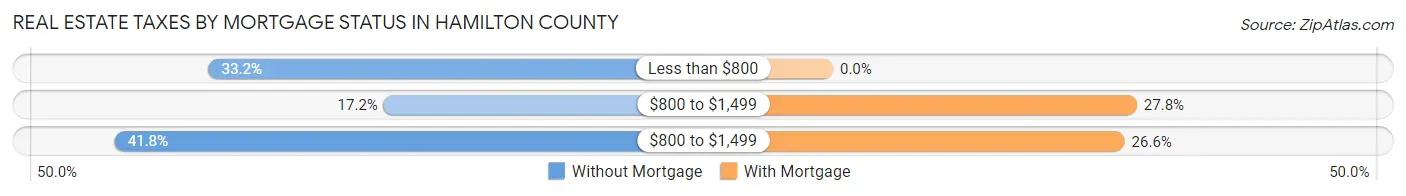
| Property Taxes | Without Mortgage | With Mortgage |
| Less than $800 | 542 (33.2%) | 0 (0.0%) |
| $800 to $1,499 | 281 (17.2%) | 247 (27.8%) |
| $800 to $1,499 | 682 (41.8%) | 237 (26.6%) |
| Total | 1,633 (100.0%) | 890 (100.0%) |
Health & Disability in Hamilton County
Health Insurance Coverage by Age in Hamilton County
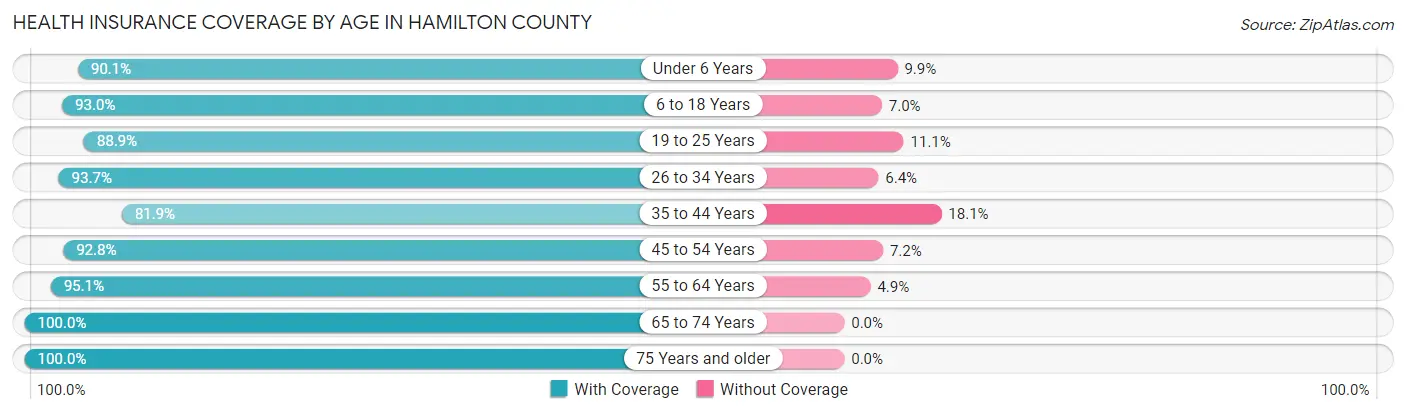
| Age Bracket | With Coverage | Without Coverage |
| Under 6 Years | 463 (90.1%) | 51 (9.9%) |
| 6 to 18 Years | 1,196 (93.0%) | 90 (7.0%) |
| 19 to 25 Years | 571 (88.9%) | 71 (11.1%) |
| 26 to 34 Years | 723 (93.6%) | 49 (6.4%) |
| 35 to 44 Years | 778 (81.9%) | 172 (18.1%) |
| 45 to 54 Years | 849 (92.8%) | 66 (7.2%) |
| 55 to 64 Years | 1,092 (95.1%) | 56 (4.9%) |
| 65 to 74 Years | 931 (100.0%) | 0 (0.0%) |
| 75 Years and older | 784 (100.0%) | 0 (0.0%) |
| Total | 7,387 (93.0%) | 555 (7.0%) |
Health Insurance Coverage by Citizenship Status in Hamilton County
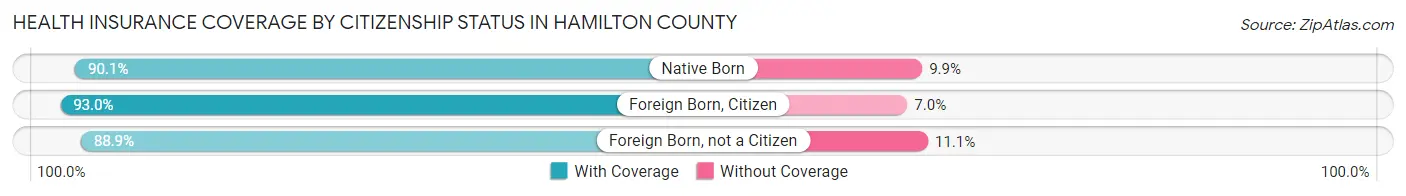
| Citizenship Status | With Coverage | Without Coverage |
| Native Born | 463 (90.1%) | 51 (9.9%) |
| Foreign Born, Citizen | 1,196 (93.0%) | 90 (7.0%) |
| Foreign Born, not a Citizen | 571 (88.9%) | 71 (11.1%) |
Health Insurance Coverage by Household Income in Hamilton County
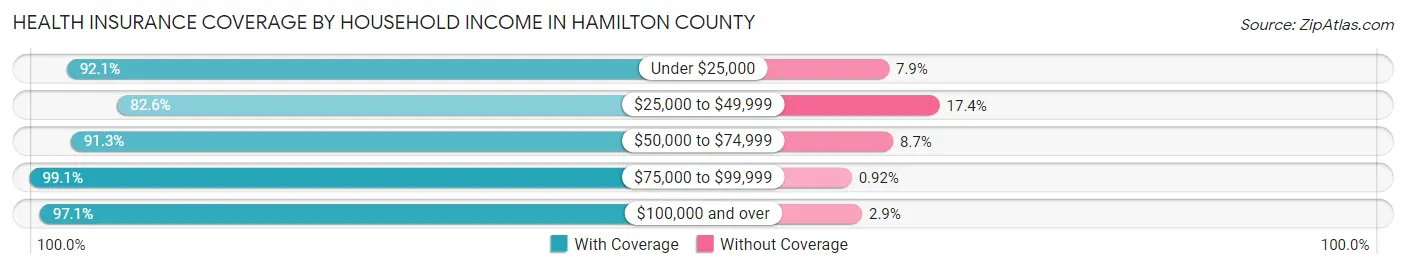
| Household Income | With Coverage | Without Coverage |
| Under $25,000 | 979 (92.1%) | 84 (7.9%) |
| $25,000 to $49,999 | 1,107 (82.6%) | 233 (17.4%) |
| $50,000 to $74,999 | 1,663 (91.3%) | 158 (8.7%) |
| $75,000 to $99,999 | 1,286 (99.1%) | 12 (0.9%) |
| $100,000 and over | 2,306 (97.1%) | 68 (2.9%) |
Public vs Private Health Insurance Coverage by Age in Hamilton County
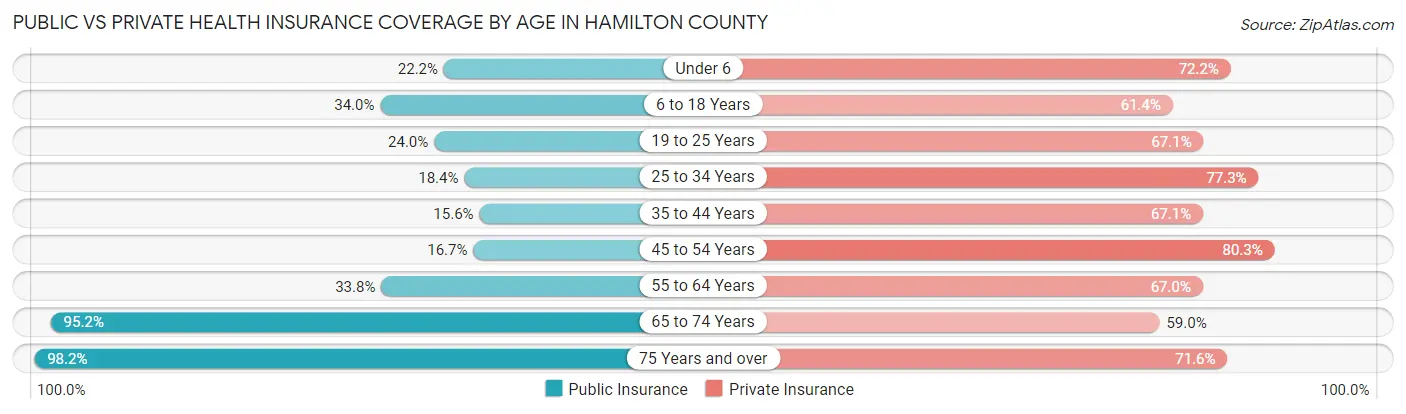
| Age Bracket | Public Insurance | Private Insurance |
| Under 6 | 114 (22.2%) | 371 (72.2%) |
| 6 to 18 Years | 437 (34.0%) | 790 (61.4%) |
| 19 to 25 Years | 154 (24.0%) | 431 (67.1%) |
| 25 to 34 Years | 142 (18.4%) | 597 (77.3%) |
| 35 to 44 Years | 148 (15.6%) | 637 (67.0%) |
| 45 to 54 Years | 153 (16.7%) | 735 (80.3%) |
| 55 to 64 Years | 388 (33.8%) | 769 (67.0%) |
| 65 to 74 Years | 886 (95.2%) | 549 (59.0%) |
| 75 Years and over | 770 (98.2%) | 561 (71.6%) |
| Total | 3,192 (40.2%) | 5,440 (68.5%) |
Disability Status by Sex by Age in Hamilton County
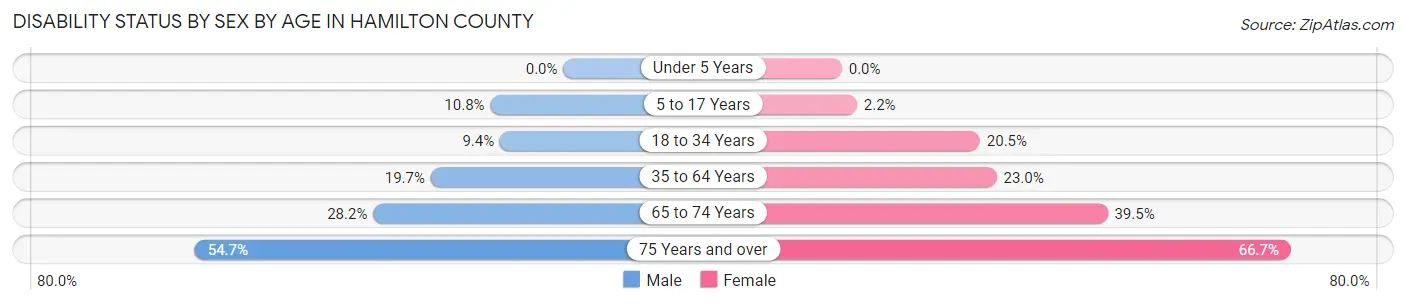
| Age Bracket | Male | Female |
| Under 5 Years | 0 (0.0%) | 0 (0.0%) |
| 5 to 17 Years | 69 (10.8%) | 15 (2.2%) |
| 18 to 34 Years | 69 (9.4%) | 149 (20.5%) |
| 35 to 64 Years | 306 (19.7%) | 335 (23.0%) |
| 65 to 74 Years | 129 (28.2%) | 187 (39.5%) |
| 75 Years and over | 168 (54.7%) | 318 (66.7%) |
Disability Class by Sex by Age in Hamilton County
Disability Class: Hearing Difficulty
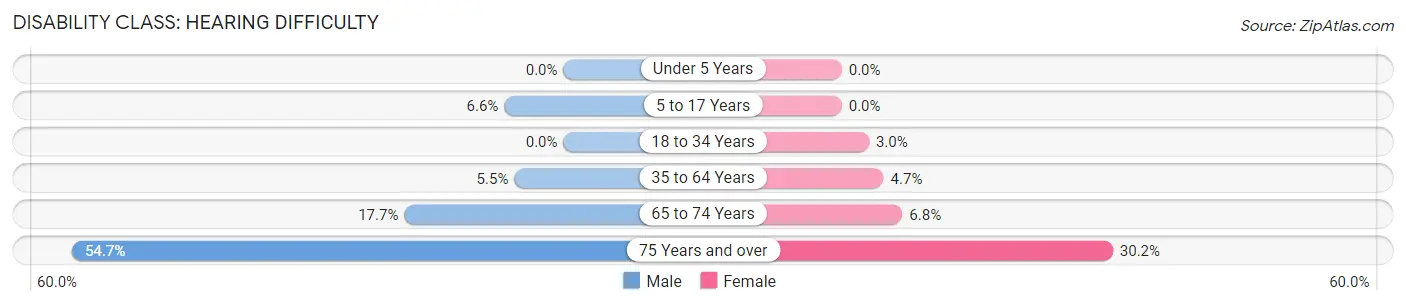
| Age Bracket | Male | Female |
| Under 5 Years | 0 (0.0%) | 0 (0.0%) |
| 5 to 17 Years | 42 (6.6%) | 0 (0.0%) |
| 18 to 34 Years | 0 (0.0%) | 22 (3.0%) |
| 35 to 64 Years | 85 (5.5%) | 68 (4.7%) |
| 65 to 74 Years | 81 (17.7%) | 32 (6.8%) |
| 75 Years and over | 168 (54.7%) | 144 (30.2%) |
Disability Class: Vision Difficulty
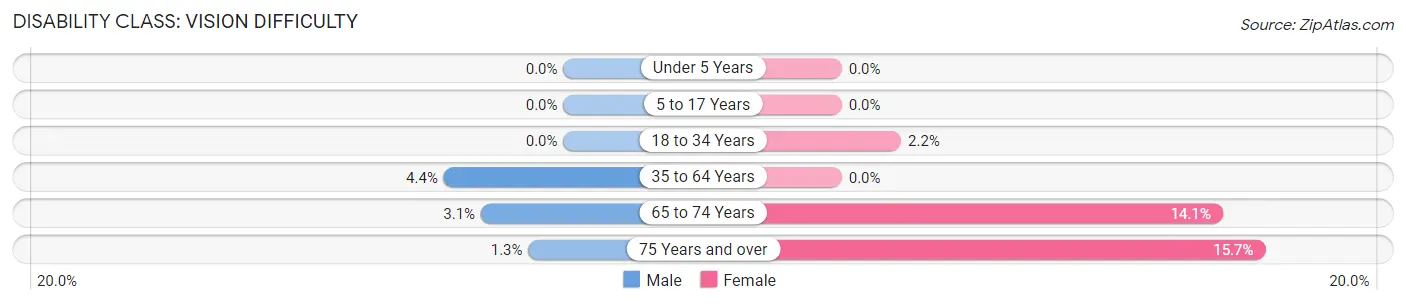
| Age Bracket | Male | Female |
| Under 5 Years | 0 (0.0%) | 0 (0.0%) |
| 5 to 17 Years | 0 (0.0%) | 0 (0.0%) |
| 18 to 34 Years | 0 (0.0%) | 16 (2.2%) |
| 35 to 64 Years | 69 (4.4%) | 0 (0.0%) |
| 65 to 74 Years | 14 (3.1%) | 67 (14.1%) |
| 75 Years and over | 4 (1.3%) | 75 (15.7%) |
Disability Class: Cognitive Difficulty
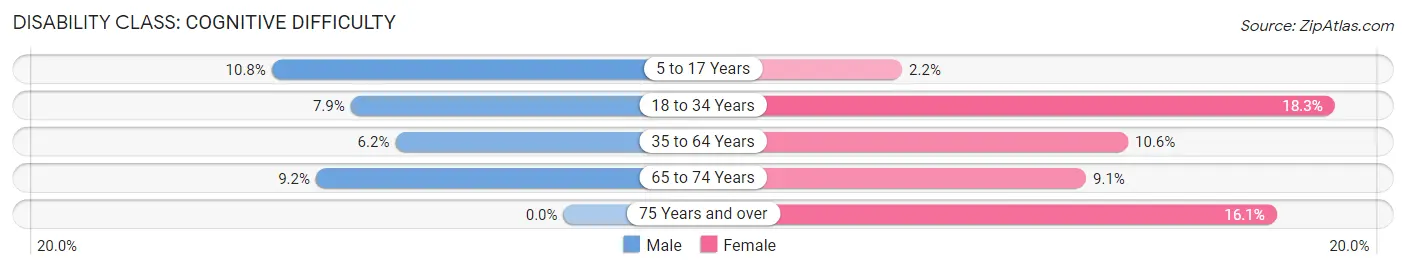
| Age Bracket | Male | Female |
| 5 to 17 Years | 69 (10.8%) | 15 (2.2%) |
| 18 to 34 Years | 58 (7.9%) | 133 (18.3%) |
| 35 to 64 Years | 97 (6.2%) | 155 (10.6%) |
| 65 to 74 Years | 42 (9.2%) | 43 (9.1%) |
| 75 Years and over | 0 (0.0%) | 77 (16.1%) |
Disability Class: Ambulatory Difficulty
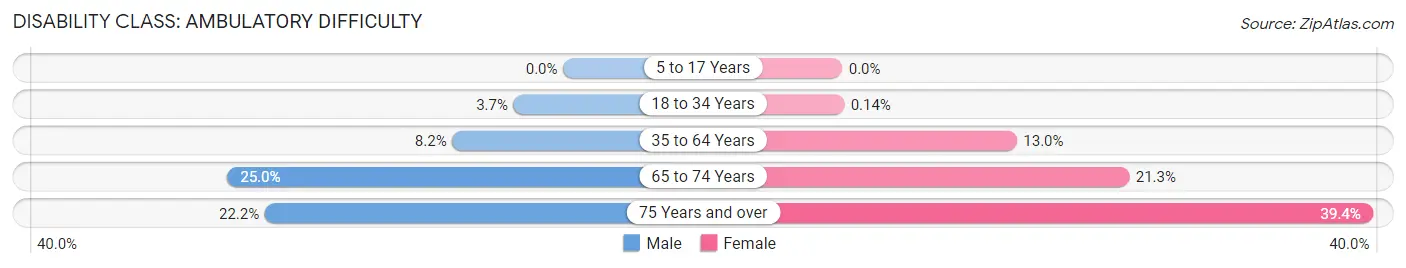
| Age Bracket | Male | Female |
| 5 to 17 Years | 0 (0.0%) | 0 (0.0%) |
| 18 to 34 Years | 27 (3.7%) | 1 (0.1%) |
| 35 to 64 Years | 128 (8.2%) | 189 (13.0%) |
| 65 to 74 Years | 114 (24.9%) | 101 (21.3%) |
| 75 Years and over | 68 (22.2%) | 188 (39.4%) |
Disability Class: Self-Care Difficulty
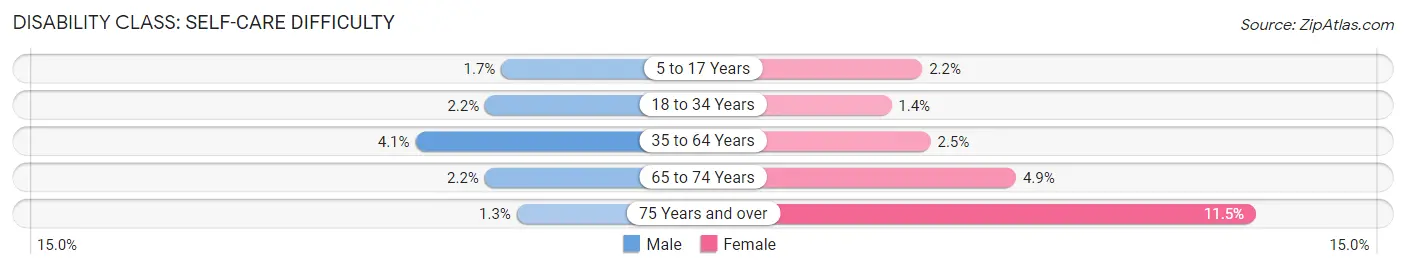
| Age Bracket | Male | Female |
| 5 to 17 Years | 11 (1.7%) | 15 (2.2%) |
| 18 to 34 Years | 16 (2.2%) | 10 (1.4%) |
| 35 to 64 Years | 64 (4.1%) | 36 (2.5%) |
| 65 to 74 Years | 10 (2.2%) | 23 (4.9%) |
| 75 Years and over | 4 (1.3%) | 55 (11.5%) |
Technology Access in Hamilton County
Computing Device Access in Hamilton County
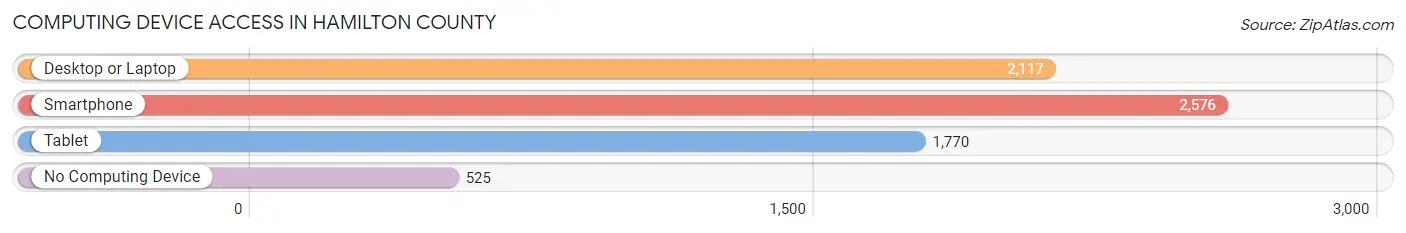
| Device Type | # Households | % Households |
| Desktop or Laptop | 2,117 | 64.7% |
| Smartphone | 2,576 | 78.7% |
| Tablet | 1,770 | 54.1% |
| No Computing Device | 525 | 16.1% |
| Total | 3,271 | 100.0% |
Internet Access in Hamilton County
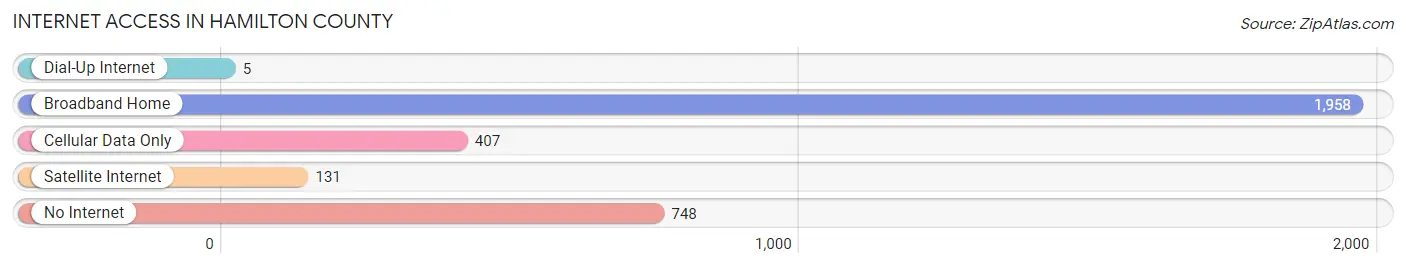
| Internet Type | # Households | % Households |
| Dial-Up Internet | 5 | 0.2% |
| Broadband Home | 1,958 | 59.9% |
| Cellular Data Only | 407 | 12.4% |
| Satellite Internet | 131 | 4.0% |
| No Internet | 748 | 22.9% |
| Total | 3,271 | 100.0% |
Hamilton County Summary
Hamilton County is located in the state of Illinois, in the United States of America. It is located in the southeastern part of the state, and is bordered by White County to the north, Saline County to the east, Gallatin County to the south, and Wayne County to the west. The county seat is McLeansboro, and the county has a total area of 517 square miles.
History
Hamilton County was formed in 1821 from parts of White and Gallatin counties. It was named after Alexander Hamilton, the first Secretary of the Treasury. The county was originally settled by Native Americans, and the first white settlers arrived in the early 1800s. The county was officially organized in 1821, and the first county seat was located in McLeansboro.
Geography
Hamilton County is located in the southeastern part of Illinois, and is bordered by White County to the north, Saline County to the east, Gallatin County to the south, and Wayne County to the west. The county has a total area of 517 square miles, and is mostly rural. The terrain is mostly flat, with some rolling hills in the northern part of the county. The county is drained by the Big Muddy River, which flows through the county from north to south.
Economy
The economy of Hamilton County is largely based on agriculture. The county is home to a variety of crops, including corn, soybeans, wheat, and hay. Livestock production is also important to the county’s economy, with beef cattle, dairy cattle, and hogs being the most common. The county also has a number of manufacturing and service industries, including food processing, metal fabrication, and printing.
Demographics
As of the 2010 census, the population of Hamilton County was 8,457. The population is mostly white (97.2%), with small percentages of African American (1.2%), Native American (0.3%), Asian (0.2%), and other races (1.1%). The median household income is $41,945, and the median family income is $50,945. The per capita income is $20,945. The unemployment rate is 6.2%.
Conclusion
Hamilton County is a rural county located in the southeastern part of Illinois. It has a long history, and is home to a variety of agricultural and manufacturing industries. The population is mostly white, and the median household income is slightly below the state average. The county is a great place to live and work, and offers a variety of opportunities for those looking to make a home in the area.
Common Questions
What is Per Capita Income in Hamilton County?
Per Capita income in Hamilton County is $29,785.
What is the Median Family Income in Hamilton County?
Median Family Income in Hamilton County is $76,893.
What is the Median Household income in Hamilton County?
Median Household Income in Hamilton County is $60,574.
What is Income or Wage Gap in Hamilton County?
Income or Wage Gap in Hamilton County is 26.3%.
Women in Hamilton County earn 73.7 cents for every dollar earned by a man.
What is Family Income Deficit in Hamilton County?
Family Income Deficit in Hamilton County is $8,899.
Families that are below poverty line in Hamilton County earn $8,899 less on average than the poverty threshold level.
What is Inequality or Gini Index in Hamilton County?
Inequality or Gini Index in Hamilton County is 0.40.
What is the Total Population of Hamilton County?
Total Population of Hamilton County is 8,008.
What is the Total Male Population of Hamilton County?
Total Male Population of Hamilton County is 3,965.
What is the Total Female Population of Hamilton County?
Total Female Population of Hamilton County is 4,043.
What is the Ratio of Males per 100 Females in Hamilton County?
There are 98.07 Males per 100 Females in Hamilton County.
What is the Ratio of Females per 100 Males in Hamilton County?
There are 101.97 Females per 100 Males in Hamilton County.
What is the Median Population Age in Hamilton County?
Median Population Age in Hamilton County is 43.0 Years.
What is the Average Family Size in Hamilton County
Average Family Size in Hamilton County is 3.0 People.
What is the Average Household Size in Hamilton County
Average Household Size in Hamilton County is 2.4 People.
How Large is the Labor Force in Hamilton County?
There are 3,534 People in the Labor Forcein in Hamilton County.
What is the Percentage of People in the Labor Force in Hamilton County?
55.1% of People are in the Labor Force in Hamilton County.
What is the Unemployment Rate in Hamilton County?
Unemployment Rate in Hamilton County is 4.4%.