Gallatin County, IL Map & Demographics
Gallatin County Map

Gallatin County Overview
$36,928
PER CAPITA INCOME
$65,833
AVG FAMILY INCOME
$51,868
AVG HOUSEHOLD INCOME
37.0%
WAGE / INCOME GAP [ % ]
63.0¢/ $1
WAGE / INCOME GAP [ $ ]
0.56
INEQUALITY / GINI INDEX
4,967
TOTAL POPULATION
2,498
MALE POPULATION
2,469
FEMALE POPULATION
101.17
MALES / 100 FEMALES
98.84
FEMALES / 100 MALES
46.9
MEDIAN AGE
2.9
AVG FAMILY SIZE
2.3
AVG HOUSEHOLD SIZE
2,304
LABOR FORCE [ PEOPLE ]
55.8%
PERCENT IN LABOR FORCE
7.8%
UNEMPLOYMENT RATE
Gallatin County Area Codes
Income in Gallatin County
Income Overview in Gallatin County
Per Capita Income in Gallatin County is $36,928, while median incomes of families and households are $65,833 and $51,868 respectively.
| Characteristic | Number | Measure |
| Per Capita Income | 4,967 | $36,928 |
| Median Family Income | 1,378 | $65,833 |
| Mean Family Income | 1,378 | $108,644 |
| Median Household Income | 2,155 | $51,868 |
| Mean Household Income | 2,155 | $83,451 |
| Income Deficit | 1,378 | $0 |
| Wage / Income Gap (%) | 4,967 | 37.03% |
| Wage / Income Gap ($) | 4,967 | 62.97¢ per $1 |
| Gini / Inequality Index | 4,967 | 0.56 |
Earnings by Sex in Gallatin County
Average Earnings in Gallatin County are $35,186, $45,455 for men and $28,621 for women, a difference of 37.0%.
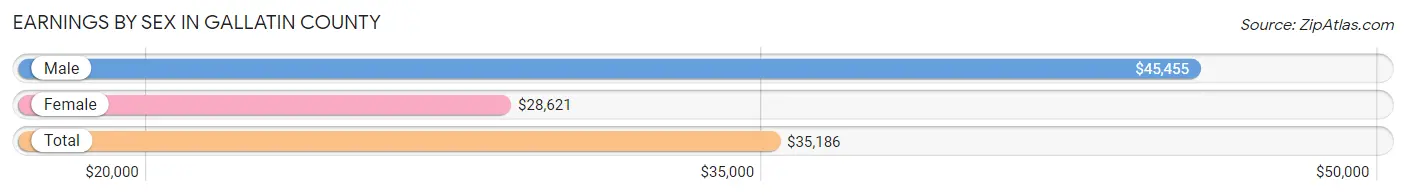
| Sex | Number | Average Earnings |
| Male | 1,418 (59.2%) | $45,455 |
| Female | 977 (40.8%) | $28,621 |
| Total | 2,395 (100.0%) | $35,186 |
Earnings by Sex by Income Bracket in Gallatin County
The most common earnings brackets in Gallatin County are $100,000+ for men (184 | 13.0%) and $30,000 to $34,999 for women (139 | 14.2%).
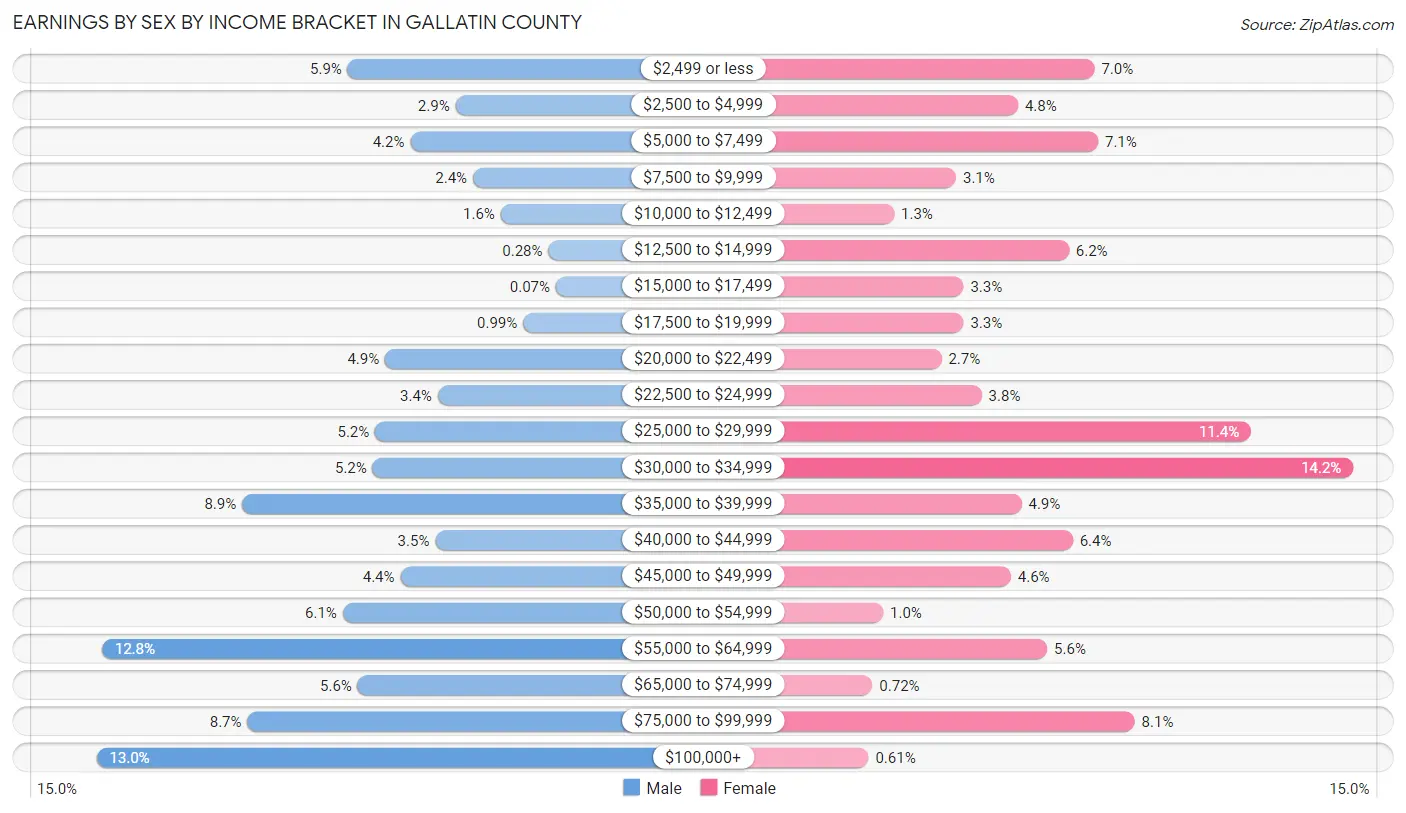
| Income | Male | Female |
| $2,499 or less | 84 (5.9%) | 68 (7.0%) |
| $2,500 to $4,999 | 41 (2.9%) | 47 (4.8%) |
| $5,000 to $7,499 | 59 (4.2%) | 69 (7.1%) |
| $7,500 to $9,999 | 34 (2.4%) | 30 (3.1%) |
| $10,000 to $12,499 | 23 (1.6%) | 13 (1.3%) |
| $12,500 to $14,999 | 4 (0.3%) | 61 (6.2%) |
| $15,000 to $17,499 | 1 (0.1%) | 32 (3.3%) |
| $17,500 to $19,999 | 14 (1.0%) | 32 (3.3%) |
| $20,000 to $22,499 | 69 (4.9%) | 26 (2.7%) |
| $22,500 to $24,999 | 48 (3.4%) | 37 (3.8%) |
| $25,000 to $29,999 | 73 (5.1%) | 111 (11.4%) |
| $30,000 to $34,999 | 74 (5.2%) | 139 (14.2%) |
| $35,000 to $39,999 | 126 (8.9%) | 48 (4.9%) |
| $40,000 to $44,999 | 49 (3.5%) | 62 (6.4%) |
| $45,000 to $49,999 | 63 (4.4%) | 45 (4.6%) |
| $50,000 to $54,999 | 86 (6.1%) | 10 (1.0%) |
| $55,000 to $64,999 | 182 (12.8%) | 55 (5.6%) |
| $65,000 to $74,999 | 80 (5.6%) | 7 (0.7%) |
| $75,000 to $99,999 | 124 (8.7%) | 79 (8.1%) |
| $100,000+ | 184 (13.0%) | 6 (0.6%) |
| Total | 1,418 (100.0%) | 977 (100.0%) |
Earnings by Sex by Educational Attainment in Gallatin County
Average earnings in Gallatin County are $53,092 for men and $30,417 for women, a difference of 42.7%. Men with an educational attainment of graduate degree enjoy the highest average annual earnings of $80,972, while those with less than high school education earn the least with $38,194. Women with an educational attainment of graduate degree earn the most with the average annual earnings of $78,295, while those with less than high school education have the smallest earnings of $15,938.
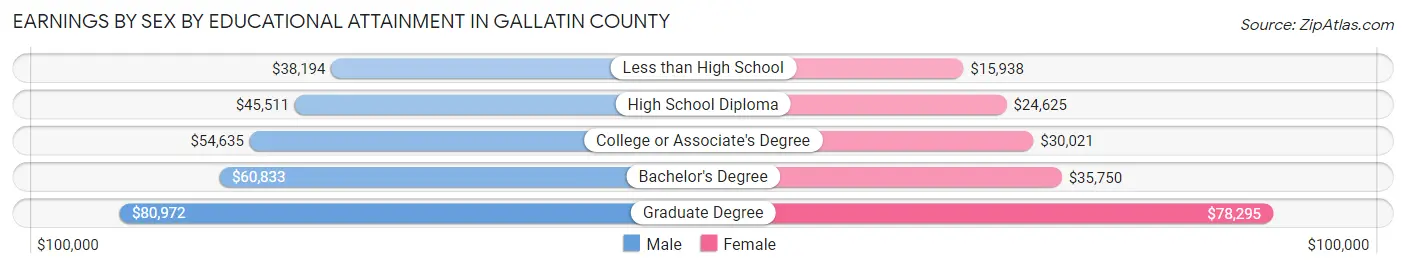
| Educational Attainment | Male Income | Female Income |
| Less than High School | $38,194 | $15,938 |
| High School Diploma | $45,511 | $24,625 |
| College or Associate's Degree | $54,635 | $30,021 |
| Bachelor's Degree | $60,833 | $35,750 |
| Graduate Degree | $80,972 | $78,295 |
| Total | $53,092 | $30,417 |
Family Income in Gallatin County
Family Income Brackets in Gallatin County
According to the Gallatin County family income data, there are 314 families falling into the $50,000 to $74,999 income range, which is the most common income bracket and makes up 22.8% of all families. Conversely, the $150,000 to $199,999 income bracket is the least frequent group with only 47 families (3.4%) belonging to this category.
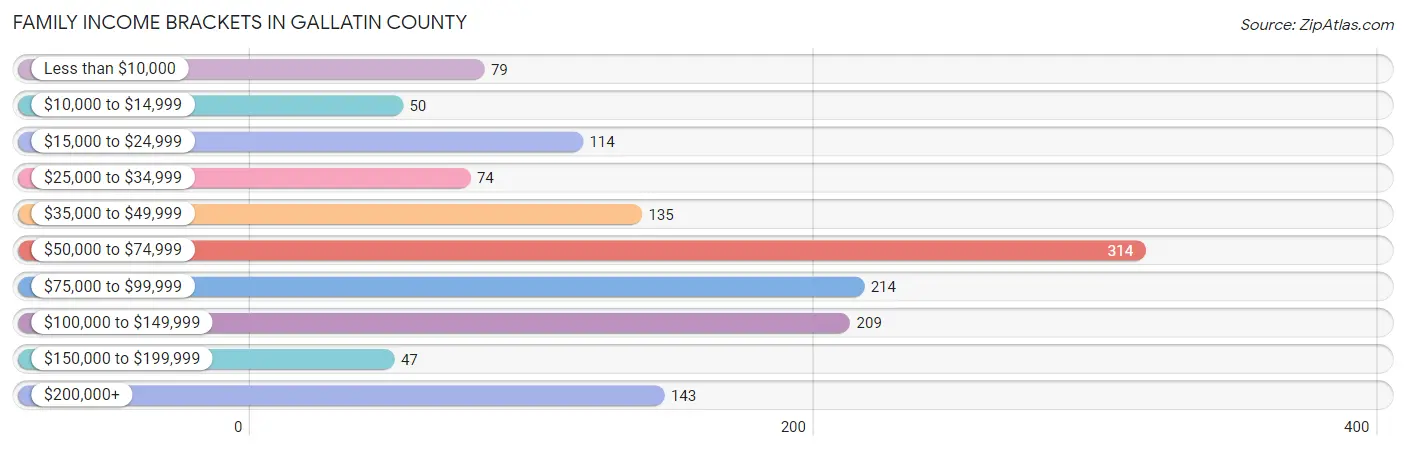
| Income Bracket | # Families | % Families |
| Less than $10,000 | 79 | 5.7% |
| $10,000 to $14,999 | 50 | 3.6% |
| $15,000 to $24,999 | 114 | 8.3% |
| $25,000 to $34,999 | 74 | 5.4% |
| $35,000 to $49,999 | 135 | 9.8% |
| $50,000 to $74,999 | 314 | 22.8% |
| $75,000 to $99,999 | 214 | 15.5% |
| $100,000 to $149,999 | 209 | 15.2% |
| $150,000 to $199,999 | 47 | 3.4% |
| $200,000+ | 143 | 10.4% |
Family Income by Famaliy Size in Gallatin County
7+ person families (23 | 1.7%) account for the highest median family income in Gallatin County with $150,583 per family, while 4-person families (177 | 12.8%) have the highest median income of $30,742 per family member.
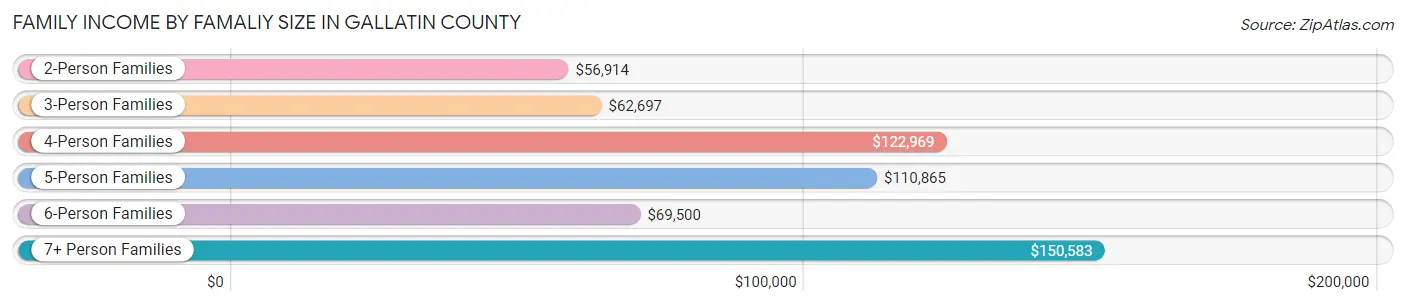
| Income Bracket | # Families | Median Income |
| 2-Person Families | 702 (50.9%) | $56,914 |
| 3-Person Families | 355 (25.8%) | $62,697 |
| 4-Person Families | 177 (12.8%) | $122,969 |
| 5-Person Families | 85 (6.2%) | $110,865 |
| 6-Person Families | 36 (2.6%) | $69,500 |
| 7+ Person Families | 23 (1.7%) | $150,583 |
| Total | 1,378 (100.0%) | $65,833 |
Family Income by Number of Earners in Gallatin County
The median family income in Gallatin County is $65,833, with families comprising 3+ earners (156) having the highest median family income of $151,000, while families with no earners (304) have the lowest median family income of $31,875, accounting for 11.3% and 22.1% of families, respectively.
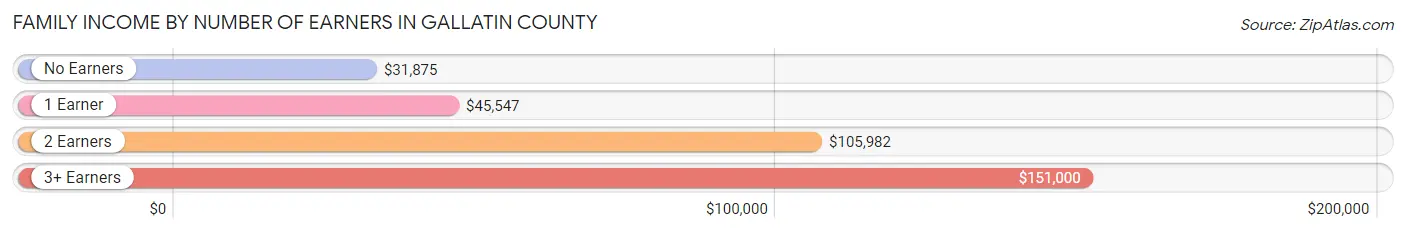
| Number of Earners | # Families | Median Income |
| No Earners | 304 (22.1%) | $31,875 |
| 1 Earner | 465 (33.7%) | $45,547 |
| 2 Earners | 453 (32.9%) | $105,982 |
| 3+ Earners | 156 (11.3%) | $151,000 |
| Total | 1,378 (100.0%) | $65,833 |
Household Income in Gallatin County
Household Income Brackets in Gallatin County
With 450 households falling in the category, the $50,000 to $74,999 income range is the most frequent in Gallatin County, accounting for 20.9% of all households. In contrast, only 62 households (2.9%) fall into the $150,000 to $199,999 income bracket, making it the least populous group.
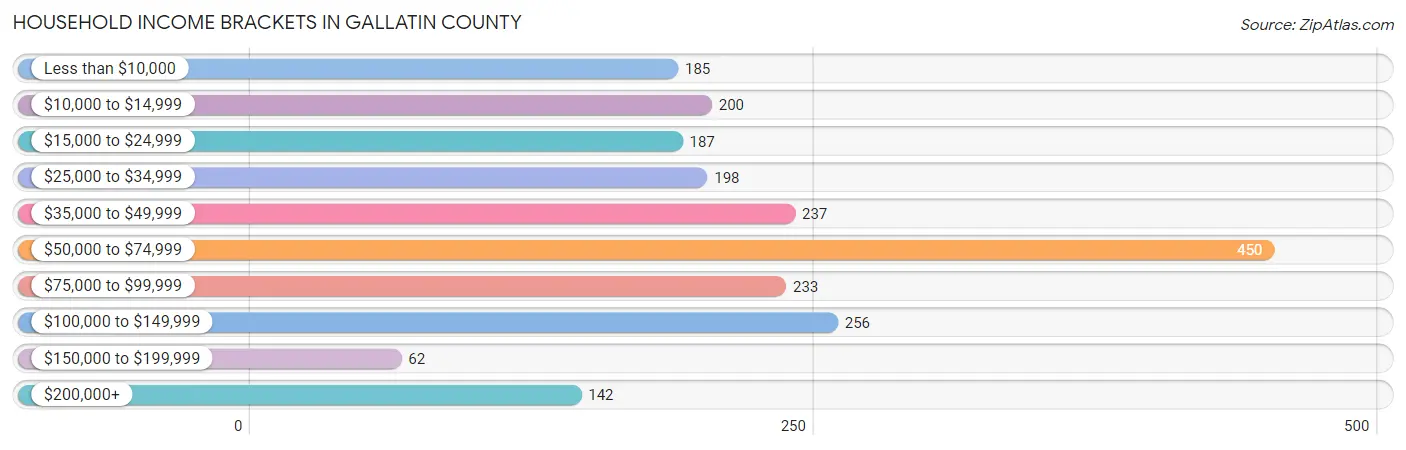
| Income Bracket | # Households | % Households |
| Less than $10,000 | 185 | 8.6% |
| $10,000 to $14,999 | 200 | 9.3% |
| $15,000 to $24,999 | 187 | 8.7% |
| $25,000 to $34,999 | 198 | 9.2% |
| $35,000 to $49,999 | 237 | 11.0% |
| $50,000 to $74,999 | 450 | 20.9% |
| $75,000 to $99,999 | 233 | 10.8% |
| $100,000 to $149,999 | 256 | 11.9% |
| $150,000 to $199,999 | 62 | 2.9% |
| $200,000+ | 142 | 6.6% |
Household Income by Householder Age in Gallatin County
The median household income in Gallatin County is $51,868, with the highest median household income of $64,318 found in the 25 to 44 years age bracket for the primary householder. A total of 486 households (22.6%) fall into this category. Meanwhile, the 15 to 24 years age bracket for the primary householder has the lowest median household income of $38,333, with 24 households (1.1%) in this group.
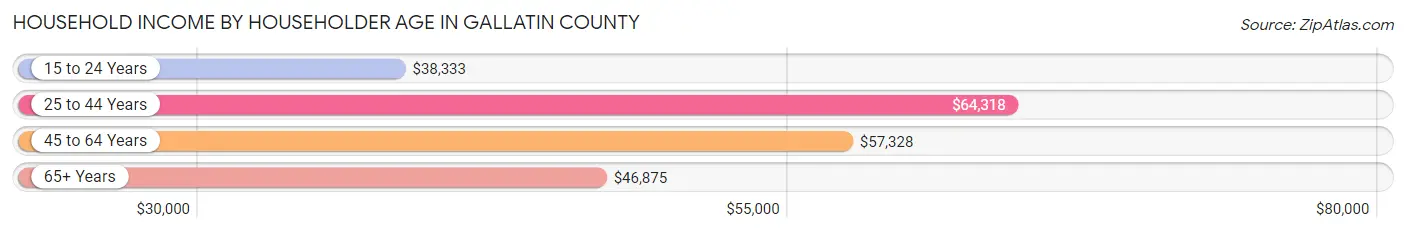
| Income Bracket | # Households | Median Income |
| 15 to 24 Years | 24 (1.1%) | $38,333 |
| 25 to 44 Years | 486 (22.6%) | $64,318 |
| 45 to 64 Years | 796 (36.9%) | $57,328 |
| 65+ Years | 849 (39.4%) | $46,875 |
| Total | 2,155 (100.0%) | $51,868 |
Poverty in Gallatin County
Income Below Poverty by Sex and Age in Gallatin County
With 15.9% poverty level for males and 22.5% for females among the residents of Gallatin County, 16 and 17 year old males and under 5 year old females are the most vulnerable to poverty, with 16 males (38.1%) and 85 females (75.2%) in their respective age groups living below the poverty level.
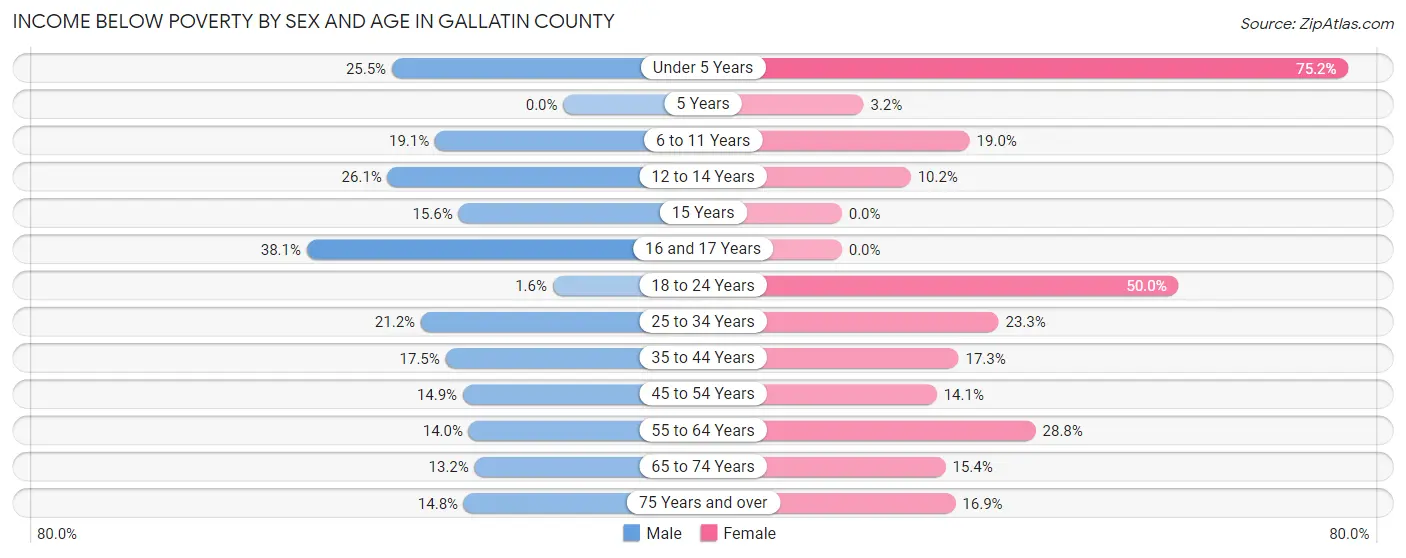
| Age Bracket | Male | Female |
| Under 5 Years | 28 (25.5%) | 85 (75.2%) |
| 5 Years | 0 (0.0%) | 1 (3.2%) |
| 6 to 11 Years | 24 (19.1%) | 30 (19.0%) |
| 12 to 14 Years | 30 (26.1%) | 9 (10.2%) |
| 15 Years | 7 (15.6%) | 0 (0.0%) |
| 16 and 17 Years | 16 (38.1%) | 0 (0.0%) |
| 18 to 24 Years | 3 (1.6%) | 76 (50.0%) |
| 25 to 34 Years | 55 (21.1%) | 54 (23.3%) |
| 35 to 44 Years | 54 (17.5%) | 47 (17.3%) |
| 45 to 54 Years | 48 (14.9%) | 43 (14.1%) |
| 55 to 64 Years | 57 (14.0%) | 99 (28.8%) |
| 65 to 74 Years | 41 (13.2%) | 53 (15.4%) |
| 75 Years and over | 35 (14.8%) | 55 (16.9%) |
| Total | 398 (15.9%) | 552 (22.5%) |
Income Above Poverty by Sex and Age in Gallatin County
According to the poverty statistics in Gallatin County, males aged 5 years and females aged 15 years are the age groups that are most secure financially, with 100.0% of males and 100.0% of females in these age groups living above the poverty line.
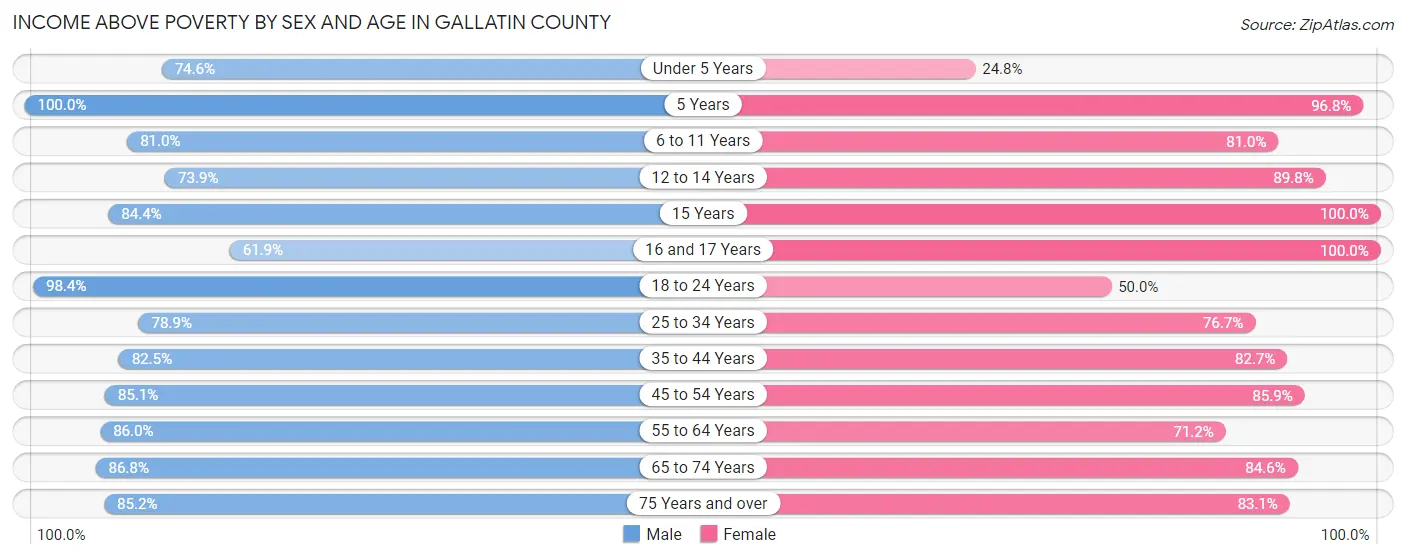
| Age Bracket | Male | Female |
| Under 5 Years | 82 (74.6%) | 28 (24.8%) |
| 5 Years | 24 (100.0%) | 30 (96.8%) |
| 6 to 11 Years | 102 (80.9%) | 128 (81.0%) |
| 12 to 14 Years | 85 (73.9%) | 79 (89.8%) |
| 15 Years | 38 (84.4%) | 25 (100.0%) |
| 16 and 17 Years | 26 (61.9%) | 68 (100.0%) |
| 18 to 24 Years | 188 (98.4%) | 76 (50.0%) |
| 25 to 34 Years | 205 (78.8%) | 178 (76.7%) |
| 35 to 44 Years | 255 (82.5%) | 224 (82.7%) |
| 45 to 54 Years | 274 (85.1%) | 262 (85.9%) |
| 55 to 64 Years | 349 (86.0%) | 245 (71.2%) |
| 65 to 74 Years | 270 (86.8%) | 291 (84.6%) |
| 75 Years and over | 202 (85.2%) | 271 (83.1%) |
| Total | 2,100 (84.1%) | 1,905 (77.5%) |
Income Below Poverty Among Married-Couple Families in Gallatin County
The poverty statistics for married-couple families in Gallatin County show that 5.2% or 51 of the total 981 families live below the poverty line. Families with 5 or more children have the highest poverty rate of 57.1%, comprising of 4 families. On the other hand, families with 1 or 2 children have the lowest poverty rate of 0.7%, which includes 2 families.
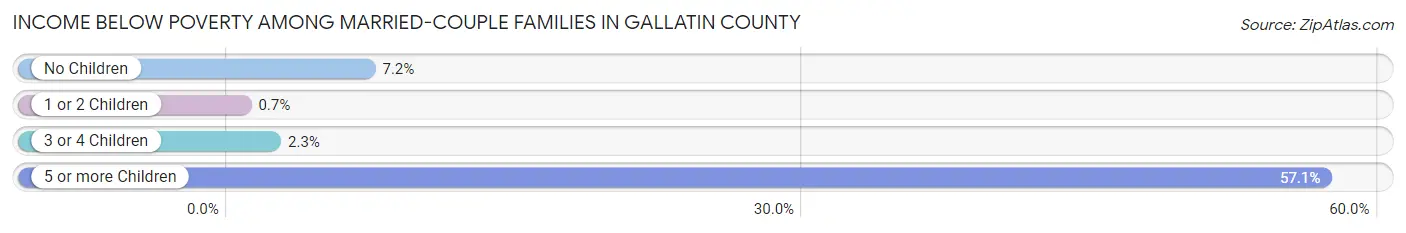
| Children | Above Poverty | Below Poverty |
| No Children | 556 (92.8%) | 43 (7.2%) |
| 1 or 2 Children | 284 (99.3%) | 2 (0.7%) |
| 3 or 4 Children | 87 (97.8%) | 2 (2.2%) |
| 5 or more Children | 3 (42.9%) | 4 (57.1%) |
| Total | 930 (94.8%) | 51 (5.2%) |
Income Below Poverty Among Single-Parent Households in Gallatin County
According to the poverty data in Gallatin County, 8.2% or 9 single-father households and 43.5% or 125 single-mother households are living below the poverty line. Among single-father households, those with 1 or 2 children have the highest poverty rate, with 9 households (14.5%) experiencing poverty. Likewise, among single-mother households, those with 1 or 2 children have the highest poverty rate, with 105 households (52.5%) falling below the poverty line.
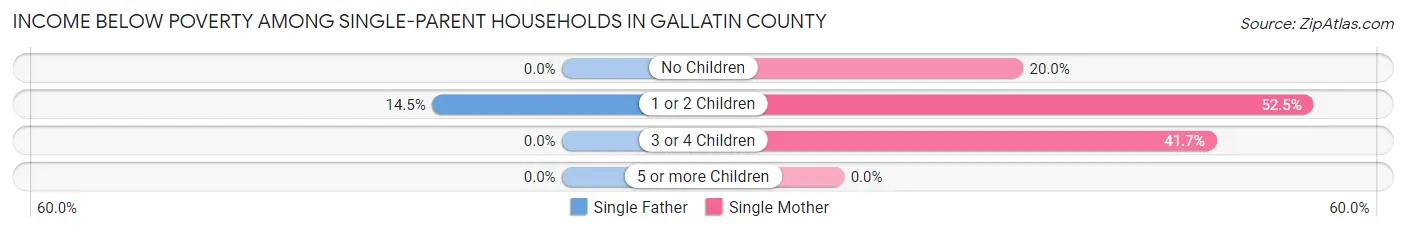
| Children | Single Father | Single Mother |
| No Children | 0 (0.0%) | 15 (20.0%) |
| 1 or 2 Children | 9 (14.5%) | 105 (52.5%) |
| 3 or 4 Children | 0 (0.0%) | 5 (41.7%) |
| 5 or more Children | 0 (0.0%) | 0 (0.0%) |
| Total | 9 (8.2%) | 125 (43.5%) |
Income Below Poverty Among Married-Couple vs Single-Parent Households in Gallatin County
The poverty data for Gallatin County shows that 51 of the married-couple family households (5.2%) and 134 of the single-parent households (33.8%) are living below the poverty level. Within the married-couple family households, those with 5 or more children have the highest poverty rate, with 4 households (57.1%) falling below the poverty line. Among the single-parent households, those with 1 or 2 children have the highest poverty rate, with 114 household (43.5%) living below poverty.
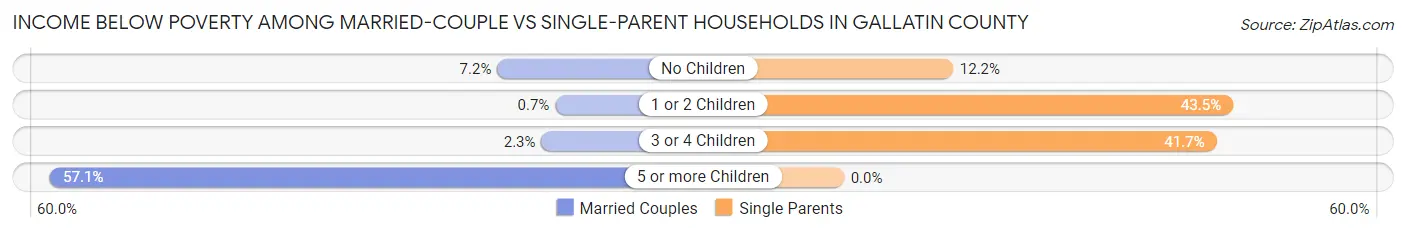
| Children | Married-Couple Families | Single-Parent Households |
| No Children | 43 (7.2%) | 15 (12.2%) |
| 1 or 2 Children | 2 (0.7%) | 114 (43.5%) |
| 3 or 4 Children | 2 (2.2%) | 5 (41.7%) |
| 5 or more Children | 4 (57.1%) | 0 (0.0%) |
| Total | 51 (5.2%) | 134 (33.8%) |
Race in Gallatin County
The most populous races in Gallatin County are White / Caucasian (4,673 | 94.1%), Two or more Races (248 | 5.0%), and Native / Alaskan (21 | 0.4%).
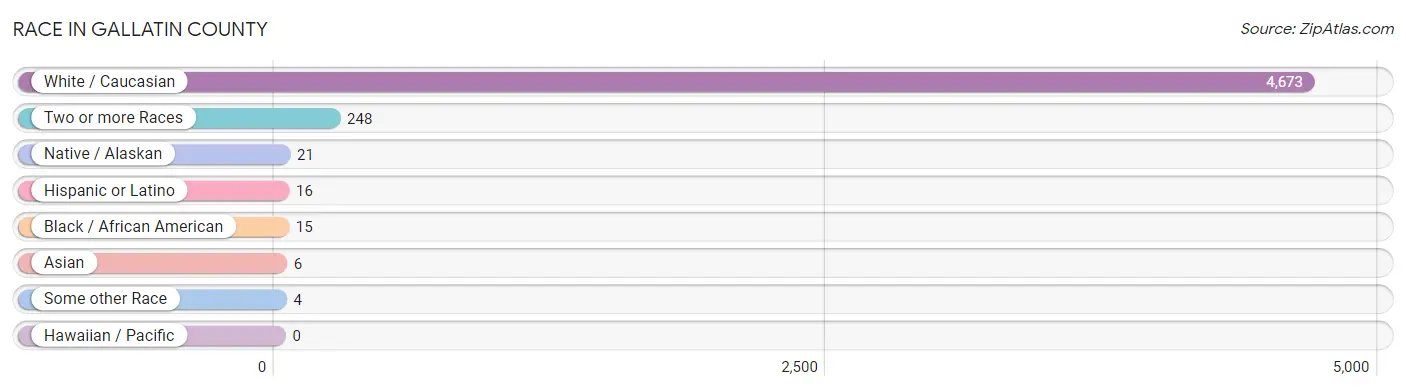
| Race | # Population | % Population |
| Asian | 6 | 0.1% |
| Black / African American | 15 | 0.3% |
| Hawaiian / Pacific | 0 | 0.0% |
| Hispanic or Latino | 16 | 0.3% |
| Native / Alaskan | 21 | 0.4% |
| White / Caucasian | 4,673 | 94.1% |
| Two or more Races | 248 | 5.0% |
| Some other Race | 4 | 0.1% |
| Total | 4,967 | 100.0% |
Ancestry in Gallatin County
The most populous ancestries reported in Gallatin County are German (1,043 | 21.0%), English (728 | 14.7%), Irish (687 | 13.8%), American (255 | 5.1%), and Dutch (190 | 3.8%), together accounting for 58.5% of all Gallatin County residents.
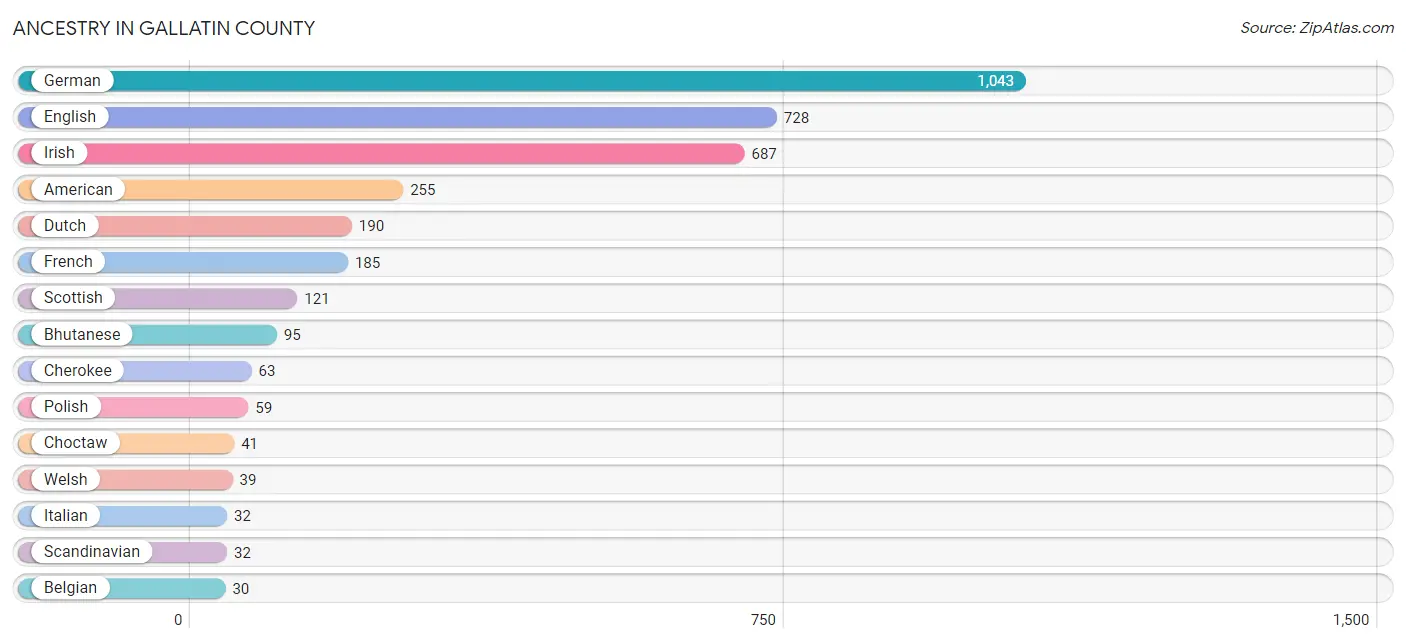
| Ancestry | # Population | % Population |
| American | 255 | 5.1% |
| Arab | 10 | 0.2% |
| Austrian | 1 | 0.0% |
| Belgian | 30 | 0.6% |
| Bhutanese | 95 | 1.9% |
| British | 18 | 0.4% |
| Cherokee | 63 | 1.3% |
| Choctaw | 41 | 0.8% |
| Croatian | 10 | 0.2% |
| Danish | 3 | 0.1% |
| Dutch | 190 | 3.8% |
| Eastern European | 9 | 0.2% |
| English | 728 | 14.7% |
| European | 13 | 0.3% |
| French | 185 | 3.7% |
| German | 1,043 | 21.0% |
| Greek | 6 | 0.1% |
| Hungarian | 15 | 0.3% |
| Irish | 687 | 13.8% |
| Italian | 32 | 0.6% |
| Korean | 6 | 0.1% |
| Lithuanian | 1 | 0.0% |
| Mexican | 14 | 0.3% |
| Palestinian | 10 | 0.2% |
| Polish | 59 | 1.2% |
| Portuguese | 7 | 0.1% |
| Scandinavian | 32 | 0.6% |
| Scotch-Irish | 27 | 0.5% |
| Scottish | 121 | 2.4% |
| Sioux | 4 | 0.1% |
| Welsh | 39 | 0.8% | View All 31 Rows |
Immigrants in Gallatin County
The most numerous immigrant groups reported in Gallatin County came from Asia (15 | 0.3%), Philippines (6 | 0.1%), South Eastern Asia (6 | 0.1%), India (3 | 0.1%), and South Central Asia (3 | 0.1%), together accounting for 0.7% of all Gallatin County residents.
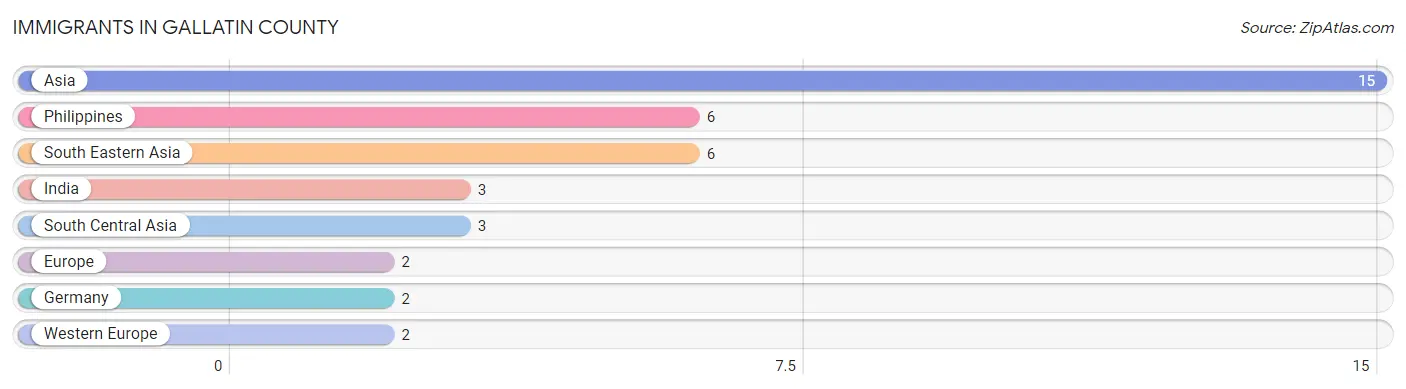
| Immigration Origin | # Population | % Population |
| Asia | 15 | 0.3% |
| Europe | 2 | 0.0% |
| Germany | 2 | 0.0% |
| India | 3 | 0.1% |
| Philippines | 6 | 0.1% |
| South Central Asia | 3 | 0.1% |
| South Eastern Asia | 6 | 0.1% |
| Western Europe | 2 | 0.0% | View All 8 Rows |
Sex and Age in Gallatin County
Sex and Age in Gallatin County
The most populous age groups in Gallatin County are 60 to 64 Years (205 | 8.2%) for men and 65 to 69 Years (225 | 9.1%) for women.
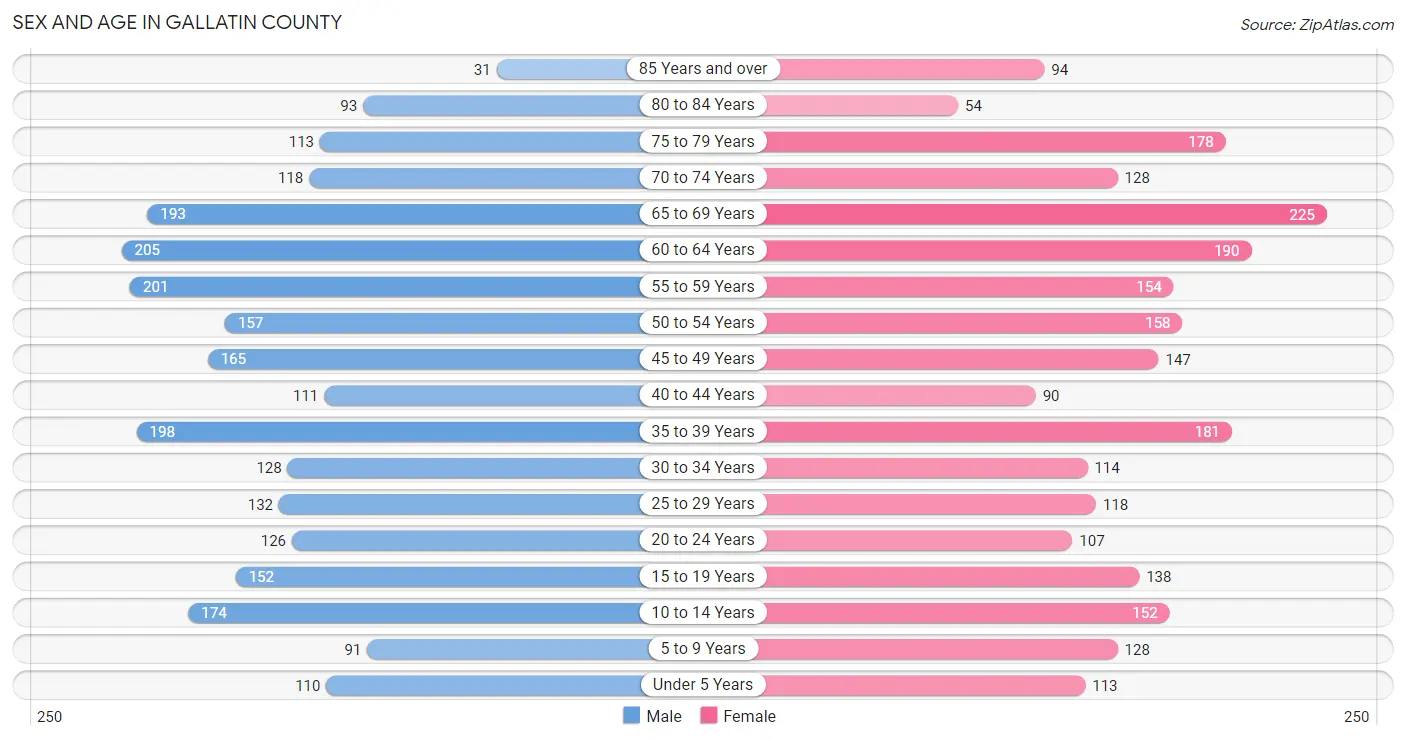
| Age Bracket | Male | Female |
| Under 5 Years | 110 (4.4%) | 113 (4.6%) |
| 5 to 9 Years | 91 (3.6%) | 128 (5.2%) |
| 10 to 14 Years | 174 (7.0%) | 152 (6.2%) |
| 15 to 19 Years | 152 (6.1%) | 138 (5.6%) |
| 20 to 24 Years | 126 (5.0%) | 107 (4.3%) |
| 25 to 29 Years | 132 (5.3%) | 118 (4.8%) |
| 30 to 34 Years | 128 (5.1%) | 114 (4.6%) |
| 35 to 39 Years | 198 (7.9%) | 181 (7.3%) |
| 40 to 44 Years | 111 (4.4%) | 90 (3.6%) |
| 45 to 49 Years | 165 (6.6%) | 147 (5.9%) |
| 50 to 54 Years | 157 (6.3%) | 158 (6.4%) |
| 55 to 59 Years | 201 (8.1%) | 154 (6.2%) |
| 60 to 64 Years | 205 (8.2%) | 190 (7.7%) |
| 65 to 69 Years | 193 (7.7%) | 225 (9.1%) |
| 70 to 74 Years | 118 (4.7%) | 128 (5.2%) |
| 75 to 79 Years | 113 (4.5%) | 178 (7.2%) |
| 80 to 84 Years | 93 (3.7%) | 54 (2.2%) |
| 85 Years and over | 31 (1.2%) | 94 (3.8%) |
| Total | 2,498 (100.0%) | 2,469 (100.0%) |
Families and Households in Gallatin County
Median Family Size in Gallatin County
The median family size in Gallatin County is 2.90 persons per family, with married-couple families (981 | 71.2%) accounting for the largest median family size of 3.01 persons per family. On the other hand, single male/father families (110 | 8.0%) represent the smallest median family size with 2.06 persons per family.
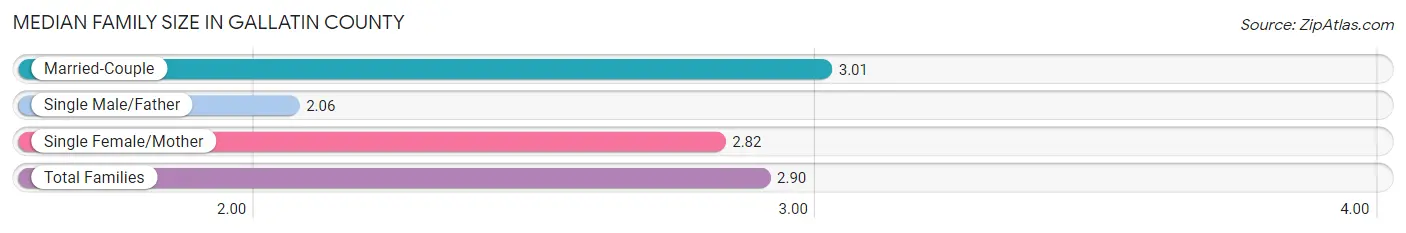
| Family Type | # Families | Family Size |
| Married-Couple | 981 (71.2%) | 3.01 |
| Single Male/Father | 110 (8.0%) | 2.06 |
| Single Female/Mother | 287 (20.8%) | 2.82 |
| Total Families | 1,378 (100.0%) | 2.90 |
Median Household Size in Gallatin County
The median household size in Gallatin County is 2.30 persons per household, with married-couple households (981 | 45.5%) accounting for the largest median household size of 3.06 persons per household. non-family households (777 | 36.1%) represent the smallest median household size with 1.09 persons per household.
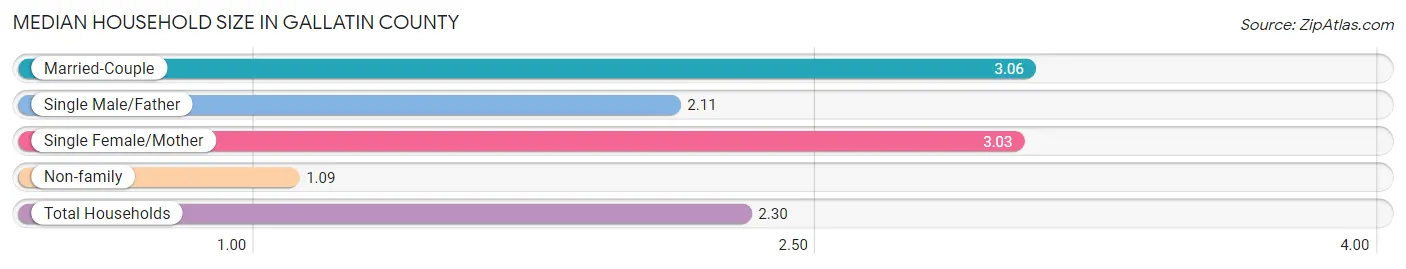
| Household Type | # Households | Household Size |
| Married-Couple | 981 (45.5%) | 3.06 |
| Single Male/Father | 110 (5.1%) | 2.11 |
| Single Female/Mother | 287 (13.3%) | 3.03 |
| Non-family | 777 (36.1%) | 1.09 |
| Total Households | 2,155 (100.0%) | 2.30 |
Household Size by Marriage Status in Gallatin County
Out of a total of 2,155 households in Gallatin County, 1,378 (63.9%) are family households, while 777 (36.1%) are nonfamily households. The most numerous type of family households are 2-person households, comprising 677, and the most common type of nonfamily households are 1-person households, comprising 723.
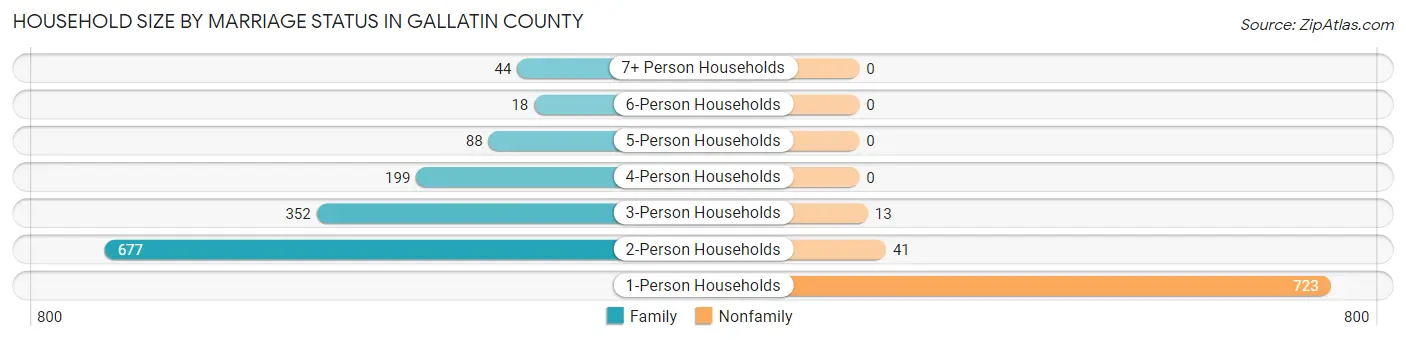
| Household Size | Family Households | Nonfamily Households |
| 1-Person Households | - | 723 (33.6%) |
| 2-Person Households | 677 (31.4%) | 41 (1.9%) |
| 3-Person Households | 352 (16.3%) | 13 (0.6%) |
| 4-Person Households | 199 (9.2%) | 0 (0.0%) |
| 5-Person Households | 88 (4.1%) | 0 (0.0%) |
| 6-Person Households | 18 (0.8%) | 0 (0.0%) |
| 7+ Person Households | 44 (2.0%) | 0 (0.0%) |
| Total | 1,378 (63.9%) | 777 (36.1%) |
Female Fertility in Gallatin County
Fertility by Age in Gallatin County
Average fertility rate in Gallatin County is 49.0 births per 1,000 women. Women in the age bracket of 20 to 34 years have the highest fertility rate with 136.0 births per 1,000 women. Women in the age bracket of 20 to 34 years acount for 100.0% of all women with births.
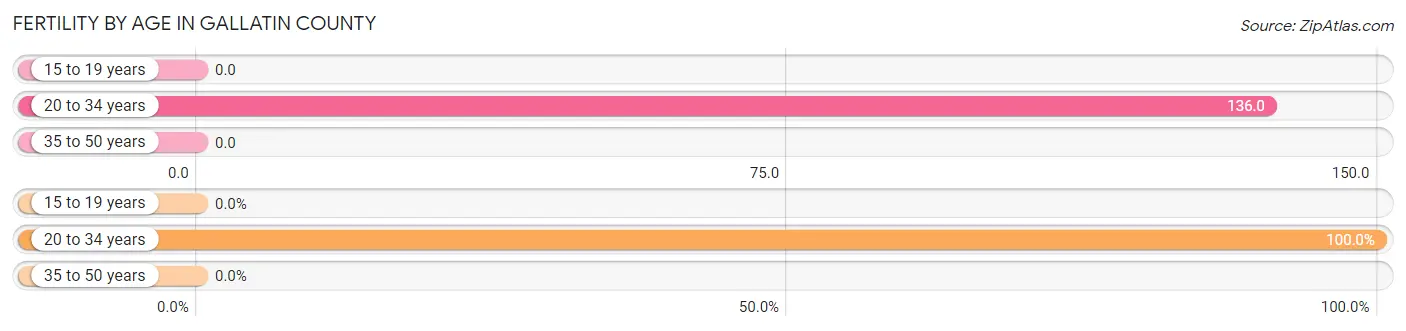
| Age Bracket | Women with Births | Births / 1,000 Women |
| 15 to 19 years | 0 (0.0%) | 0.0 |
| 20 to 34 years | 46 (100.0%) | 136.0 |
| 35 to 50 years | 0 (0.0%) | 0.0 |
| Total | 46 (100.0%) | 49.0 |
Fertility by Age by Marriage Status in Gallatin County
41.3% of women with births (46) in Gallatin County are married. The highest percentage of unmarried women with births falls into 20 to 34 years age bracket with 58.7% of them unmarried at the time of birth, while the lowest percentage of unmarried women with births belong to 20 to 34 years age bracket with 58.7% of them unmarried.
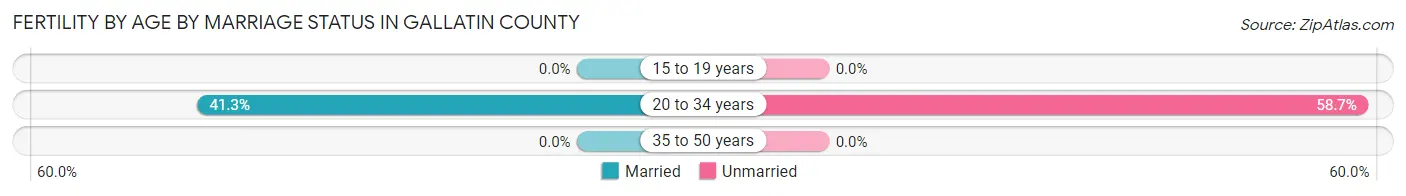
| Age Bracket | Married | Unmarried |
| 15 to 19 years | 0 (0.0%) | 0 (0.0%) |
| 20 to 34 years | 19 (41.3%) | 27 (58.7%) |
| 35 to 50 years | 0 (0.0%) | 0 (0.0%) |
| Total | 19 (41.3%) | 27 (58.7%) |
Fertility by Education in Gallatin County
Average fertility rate in Gallatin County is 49.0 births per 1,000 women. Women with the education attainment of bachelor's degree have the highest fertility rate of 155.0 births per 1,000 women, while women with the education attainment of college or associate's degree have the lowest fertility at 20.0 births per 1,000 women. Women with the education attainment of high school diploma represent 34.8% of all women with births.
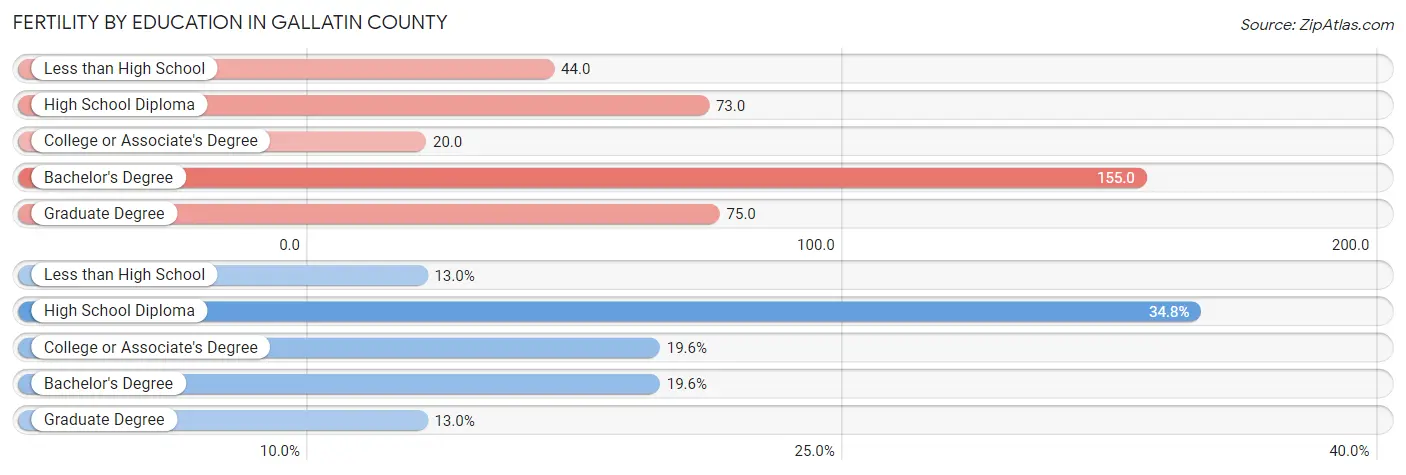
| Educational Attainment | Women with Births | Births / 1,000 Women |
| Less than High School | 6 (13.0%) | 44.0 |
| High School Diploma | 16 (34.8%) | 73.0 |
| College or Associate's Degree | 9 (19.6%) | 20.0 |
| Bachelor's Degree | 9 (19.6%) | 155.0 |
| Graduate Degree | 6 (13.0%) | 75.0 |
| Total | 46 (100.0%) | 49.0 |
Fertility by Education by Marriage Status in Gallatin County
58.7% of women with births in Gallatin County are unmarried. Women with the educational attainment of less than high school are most likely to be married with 100.0% of them married at childbirth, while women with the educational attainment of bachelor's degree are least likely to be married with 100.0% of them unmarried at childbirth.
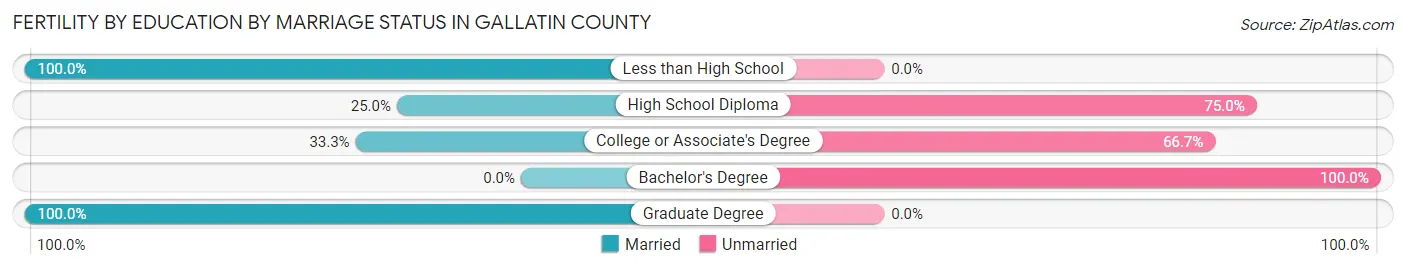
| Educational Attainment | Married | Unmarried |
| Less than High School | 6 (100.0%) | 0 (0.0%) |
| High School Diploma | 4 (25.0%) | 12 (75.0%) |
| College or Associate's Degree | 3 (33.3%) | 6 (66.7%) |
| Bachelor's Degree | 0 (0.0%) | 9 (100.0%) |
| Graduate Degree | 6 (100.0%) | 0 (0.0%) |
| Total | 19 (41.3%) | 27 (58.7%) |
Employment Characteristics in Gallatin County
Employment by Class of Employer in Gallatin County
Among the 2,074 employed individuals in Gallatin County, private company employees (1,508 | 72.7%), local government employees (164 | 7.9%), and not-for-profit organizations (151 | 7.3%) make up the most common classes of employment.
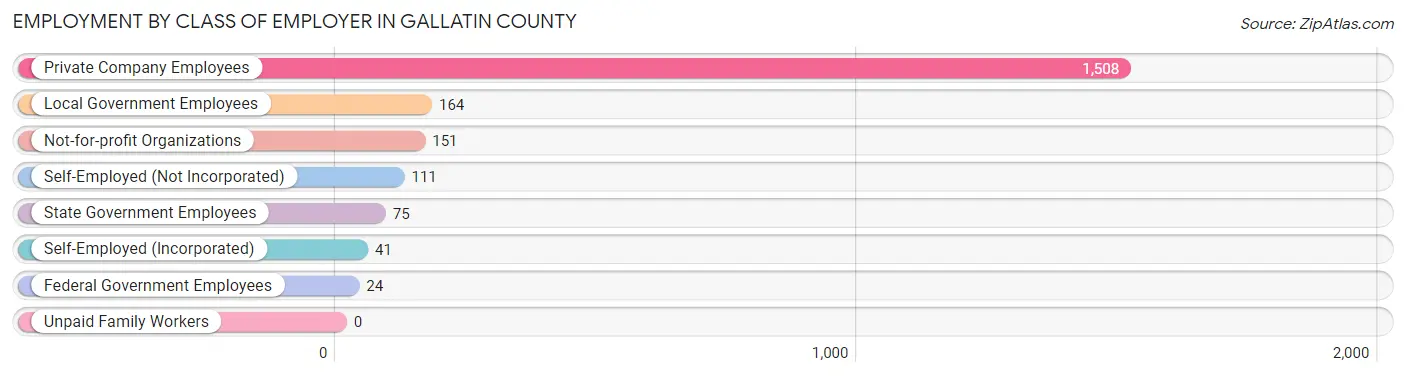
| Employer Class | # Employees | % Employees |
| Private Company Employees | 1,508 | 72.7% |
| Self-Employed (Incorporated) | 41 | 2.0% |
| Self-Employed (Not Incorporated) | 111 | 5.3% |
| Not-for-profit Organizations | 151 | 7.3% |
| Local Government Employees | 164 | 7.9% |
| State Government Employees | 75 | 3.6% |
| Federal Government Employees | 24 | 1.2% |
| Unpaid Family Workers | 0 | 0.0% |
| Total | 2,074 | 100.0% |
Employment Status by Age in Gallatin County
According to the labor force statistics for Gallatin County, out of the total population over 16 years of age (4,129), 55.8% or 2,304 individuals are in the labor force, with 7.8% or 180 of them unemployed. The age group with the highest labor force participation rate is 35 to 44 years, with 86.0% or 499 individuals in the labor force. Within the labor force, the 20 to 24 years age range has the highest percentage of unemployed individuals, with 47.6% or 90 of them being unemployed.
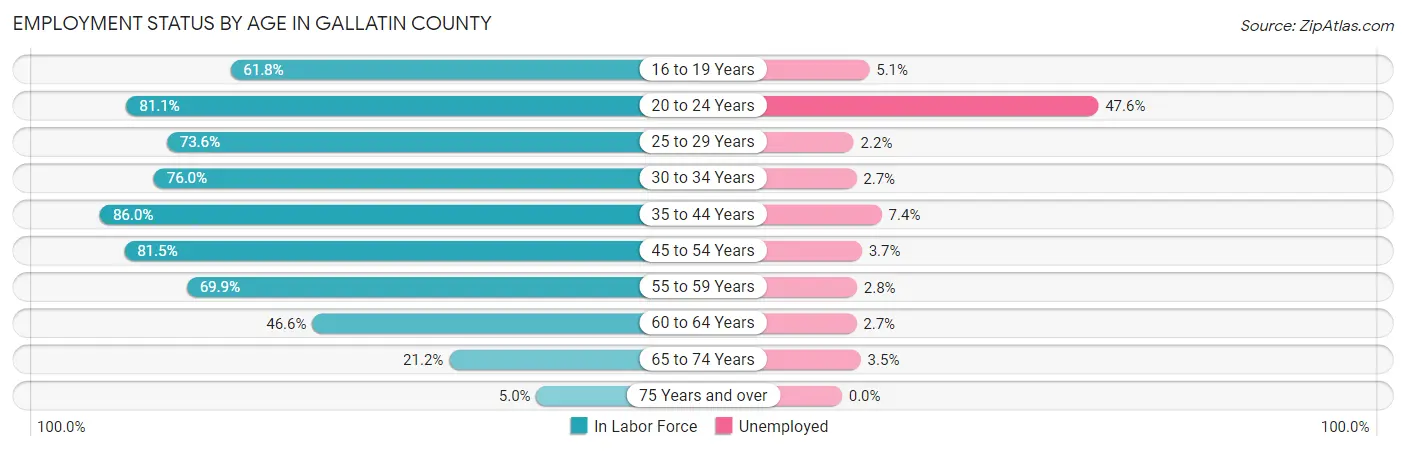
| Age Bracket | In Labor Force | Unemployed |
| 16 to 19 Years | 136 (61.8%) | 7 (5.1%) |
| 20 to 24 Years | 189 (81.1%) | 90 (47.6%) |
| 25 to 29 Years | 184 (73.6%) | 4 (2.2%) |
| 30 to 34 Years | 184 (76.0%) | 5 (2.7%) |
| 35 to 44 Years | 499 (86.0%) | 37 (7.4%) |
| 45 to 54 Years | 511 (81.5%) | 19 (3.7%) |
| 55 to 59 Years | 248 (69.9%) | 7 (2.8%) |
| 60 to 64 Years | 184 (46.6%) | 5 (2.7%) |
| 65 to 74 Years | 141 (21.2%) | 5 (3.5%) |
| 75 Years and over | 28 (5.0%) | 0 (0.0%) |
| Total | 2,304 (55.8%) | 180 (7.8%) |
Employment Status by Educational Attainment in Gallatin County
According to labor force statistics for Gallatin County, 73.9% of individuals (1,810) out of the total population between 25 and 64 years of age (2,449) are in the labor force, with 4.3% or 78 of them being unemployed. The group with the highest labor force participation rate are those with the educational attainment of bachelor's degree or higher, with 81.6% or 252 individuals in the labor force. Within the labor force, individuals with college / associate degree education have the highest percentage of unemployment, with 5.5% or 41 of them being unemployed.
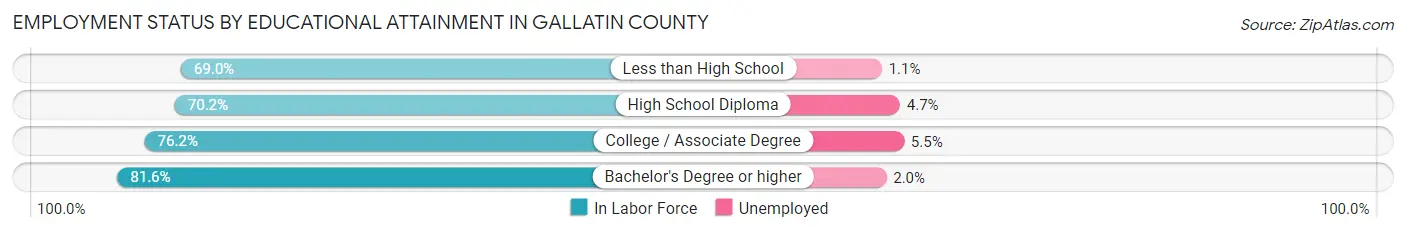
| Educational Attainment | In Labor Force | Unemployed |
| Less than High School | 185 (69.0%) | 3 (1.1%) |
| High School Diploma | 622 (70.2%) | 42 (4.7%) |
| College / Associate Degree | 751 (76.2%) | 54 (5.5%) |
| Bachelor's Degree or higher | 252 (81.6%) | 6 (2.0%) |
| Total | 1,810 (73.9%) | 105 (4.3%) |
Employment Occupations by Sex in Gallatin County
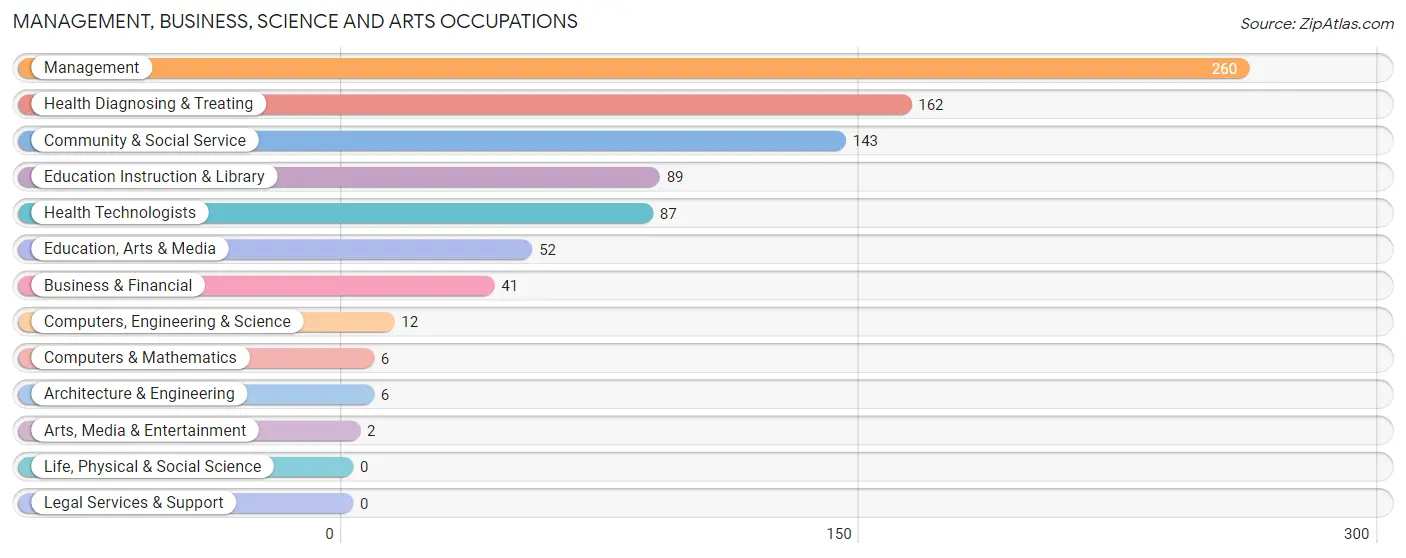
Management, Business, Science and Arts Occupations
The most common Management, Business, Science and Arts occupations in Gallatin County are Management (260 | 12.2%), Health Diagnosing & Treating (162 | 7.6%), Community & Social Service (143 | 6.7%), Education Instruction & Library (89 | 4.2%), and Health Technologists (87 | 4.1%).
Management, Business, Science and Arts Occupations by Sex
Within the Management, Business, Science and Arts occupations in Gallatin County, the most male-oriented occupations are Architecture & Engineering (100.0%), Management (67.7%), and Computers, Engineering & Science (66.7%), while the most female-oriented occupations are Arts, Media & Entertainment (100.0%), Health Diagnosing & Treating (93.8%), and Health Technologists (90.8%).
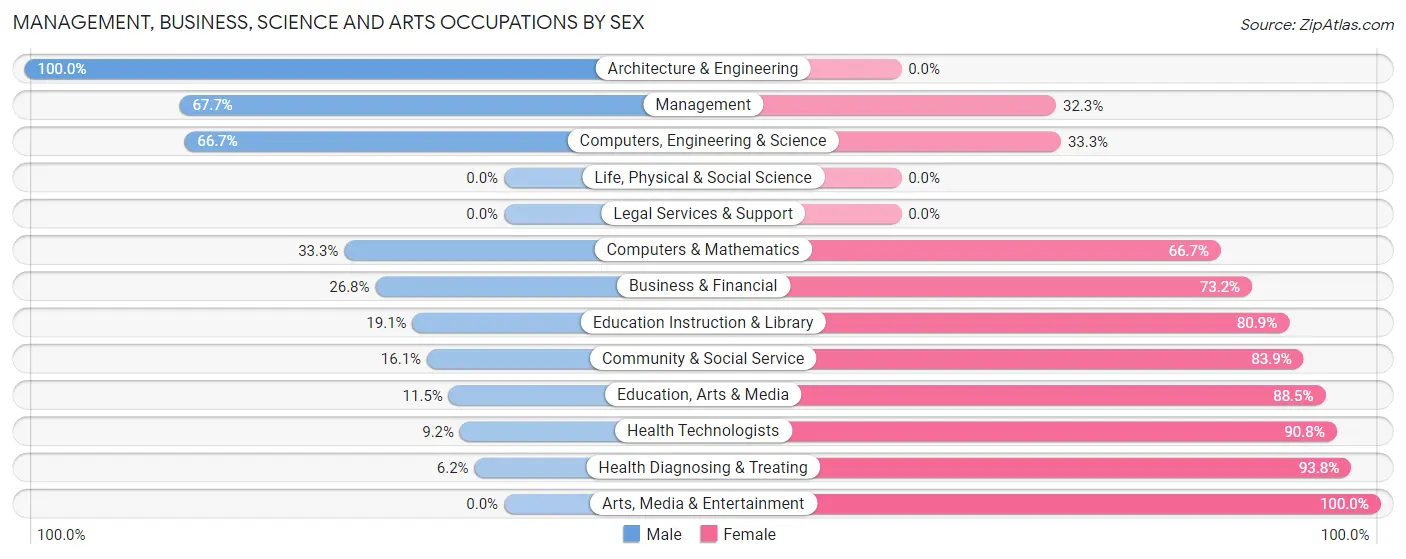
| Occupation | Male | Female |
| Management | 176 (67.7%) | 84 (32.3%) |
| Business & Financial | 11 (26.8%) | 30 (73.2%) |
| Computers, Engineering & Science | 8 (66.7%) | 4 (33.3%) |
| Computers & Mathematics | 2 (33.3%) | 4 (66.7%) |
| Architecture & Engineering | 6 (100.0%) | 0 (0.0%) |
| Life, Physical & Social Science | 0 (0.0%) | 0 (0.0%) |
| Community & Social Service | 23 (16.1%) | 120 (83.9%) |
| Education, Arts & Media | 6 (11.5%) | 46 (88.5%) |
| Legal Services & Support | 0 (0.0%) | 0 (0.0%) |
| Education Instruction & Library | 17 (19.1%) | 72 (80.9%) |
| Arts, Media & Entertainment | 0 (0.0%) | 2 (100.0%) |
| Health Diagnosing & Treating | 10 (6.2%) | 152 (93.8%) |
| Health Technologists | 8 (9.2%) | 79 (90.8%) |
| Total (Category) | 228 (36.9%) | 390 (63.1%) |
| Total (Overall) | 1,301 (61.2%) | 824 (38.8%) |
Services Occupations
The most common Services occupations in Gallatin County are Healthcare Support (99 | 4.7%), Food Preparation & Serving (99 | 4.7%), Cleaning & Maintenance (54 | 2.5%), Security & Protection (29 | 1.4%), and Personal Care & Service (25 | 1.2%).
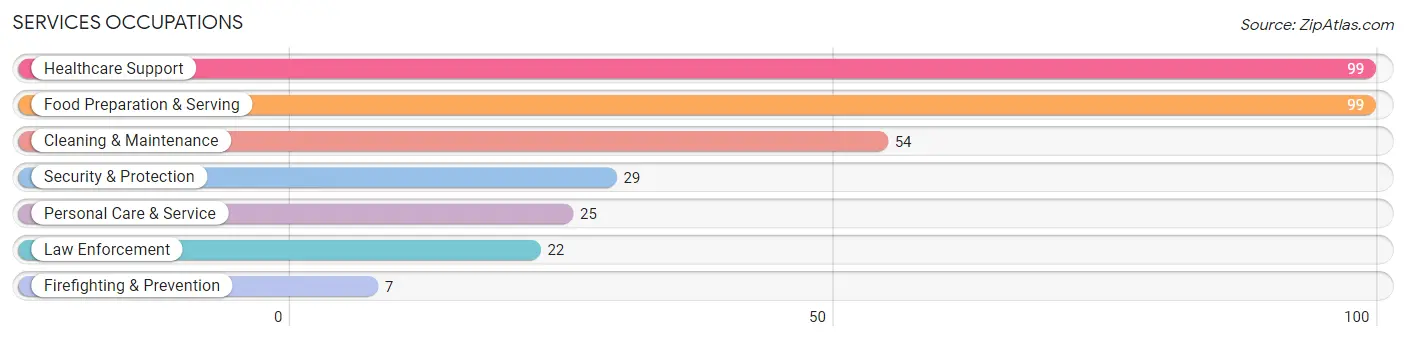
Services Occupations by Sex
Within the Services occupations in Gallatin County, the most male-oriented occupations are Cleaning & Maintenance (94.4%), Law Enforcement (63.6%), and Security & Protection (58.6%), while the most female-oriented occupations are Personal Care & Service (100.0%), Healthcare Support (91.9%), and Food Preparation & Serving (81.8%).
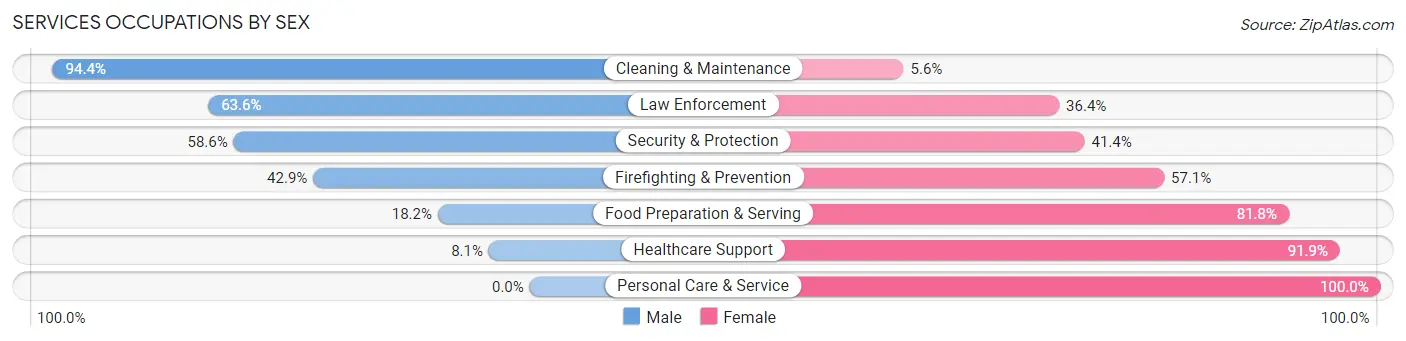
| Occupation | Male | Female |
| Healthcare Support | 8 (8.1%) | 91 (91.9%) |
| Security & Protection | 17 (58.6%) | 12 (41.4%) |
| Firefighting & Prevention | 3 (42.9%) | 4 (57.1%) |
| Law Enforcement | 14 (63.6%) | 8 (36.4%) |
| Food Preparation & Serving | 18 (18.2%) | 81 (81.8%) |
| Cleaning & Maintenance | 51 (94.4%) | 3 (5.6%) |
| Personal Care & Service | 0 (0.0%) | 25 (100.0%) |
| Total (Category) | 94 (30.7%) | 212 (69.3%) |
| Total (Overall) | 1,301 (61.2%) | 824 (38.8%) |
Sales and Office Occupations
The most common Sales and Office occupations in Gallatin County are Office & Administration (194 | 9.1%), and Sales & Related (141 | 6.6%).
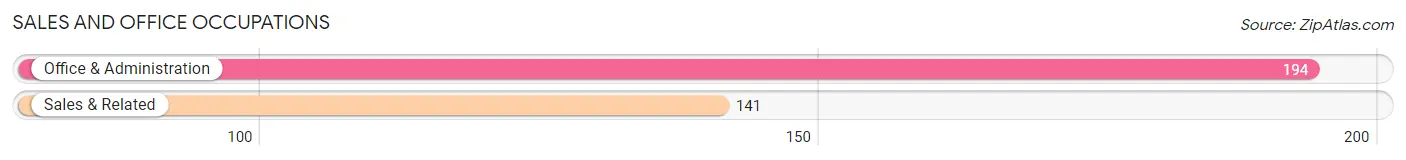
Sales and Office Occupations by Sex
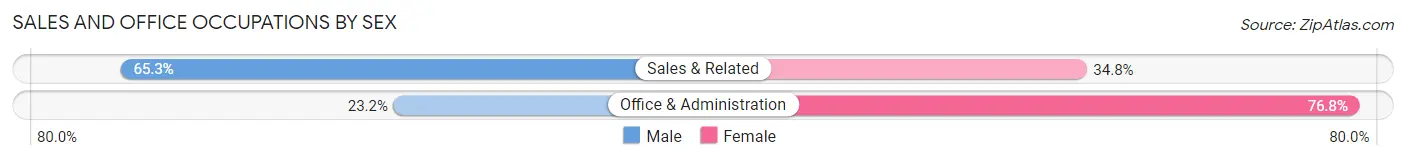
| Occupation | Male | Female |
| Sales & Related | 92 (65.2%) | 49 (34.7%) |
| Office & Administration | 45 (23.2%) | 149 (76.8%) |
| Total (Category) | 137 (40.9%) | 198 (59.1%) |
| Total (Overall) | 1,301 (61.2%) | 824 (38.8%) |
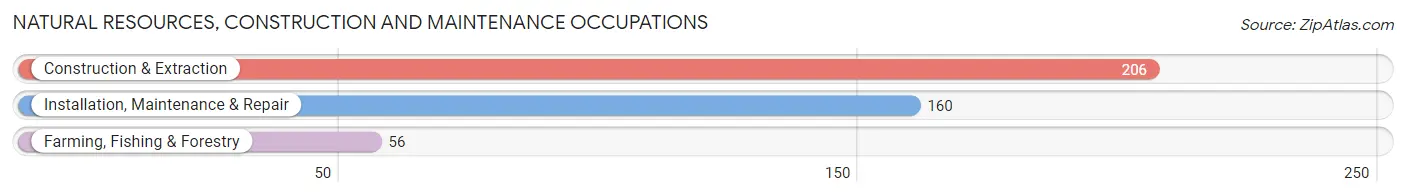
Natural Resources, Construction and Maintenance Occupations
The most common Natural Resources, Construction and Maintenance occupations in Gallatin County are Construction & Extraction (206 | 9.7%), Installation, Maintenance & Repair (160 | 7.5%), and Farming, Fishing & Forestry (56 | 2.6%).
Natural Resources, Construction and Maintenance Occupations by Sex
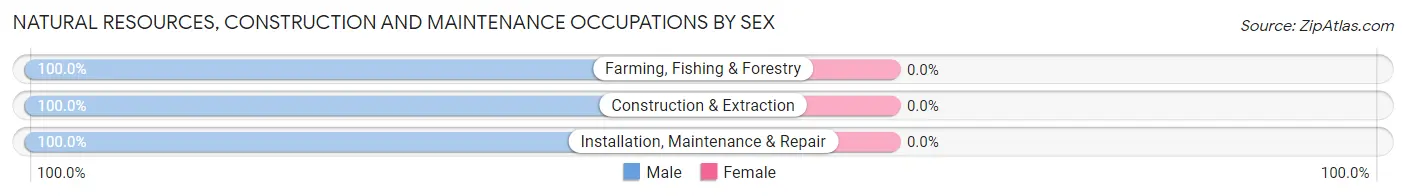
| Occupation | Male | Female |
| Farming, Fishing & Forestry | 56 (100.0%) | 0 (0.0%) |
| Construction & Extraction | 206 (100.0%) | 0 (0.0%) |
| Installation, Maintenance & Repair | 160 (100.0%) | 0 (0.0%) |
| Total (Category) | 422 (100.0%) | 0 (0.0%) |
| Total (Overall) | 1,301 (61.2%) | 824 (38.8%) |
Production, Transportation and Moving Occupations
The most common Production, Transportation and Moving occupations in Gallatin County are Transportation (177 | 8.3%), Production (143 | 6.7%), and Material Moving (124 | 5.8%).
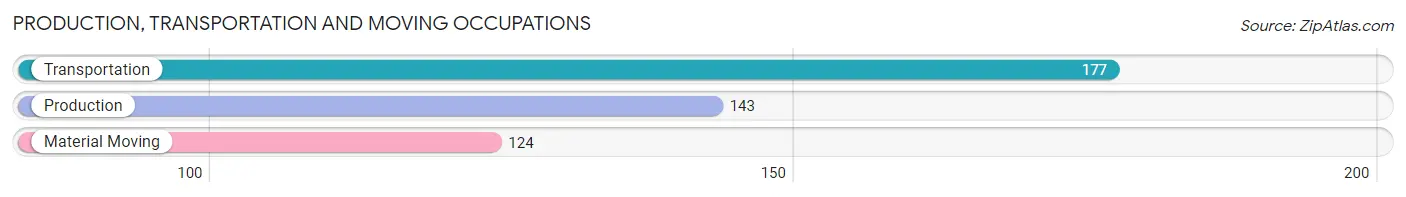
Production, Transportation and Moving Occupations by Sex
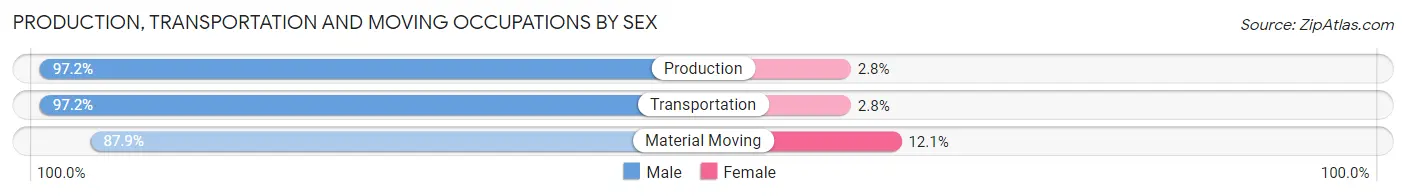
| Occupation | Male | Female |
| Production | 139 (97.2%) | 4 (2.8%) |
| Transportation | 172 (97.2%) | 5 (2.8%) |
| Material Moving | 109 (87.9%) | 15 (12.1%) |
| Total (Category) | 420 (94.6%) | 24 (5.4%) |
| Total (Overall) | 1,301 (61.2%) | 824 (38.8%) |
Employment Industries by Sex in Gallatin County
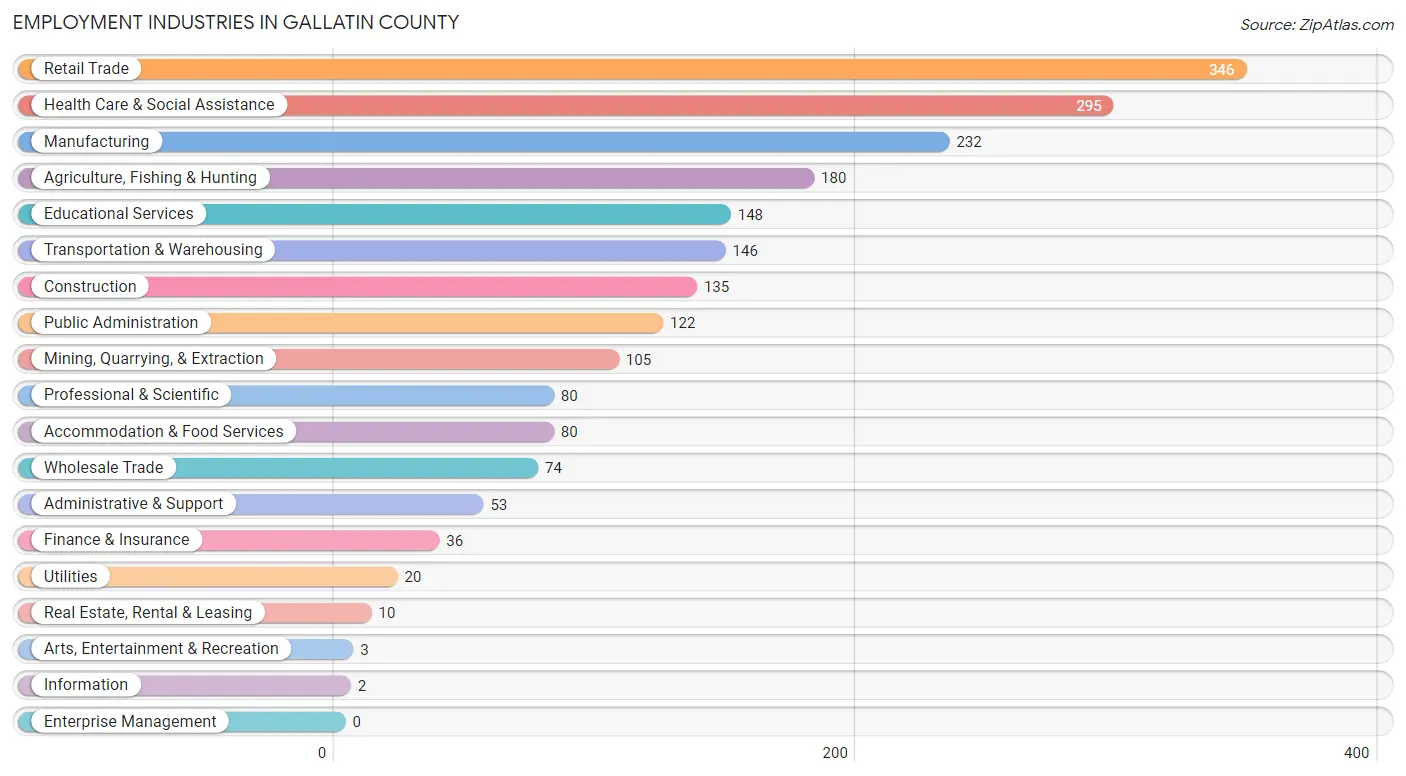
Employment Industries in Gallatin County
The major employment industries in Gallatin County include Retail Trade (346 | 16.3%), Health Care & Social Assistance (295 | 13.9%), Manufacturing (232 | 10.9%), Agriculture, Fishing & Hunting (180 | 8.5%), and Educational Services (148 | 7.0%).
Employment Industries by Sex in Gallatin County
The Gallatin County industries that see more men than women are Mining, Quarrying, & Extraction (100.0%), Wholesale Trade (100.0%), and Real Estate, Rental & Leasing (100.0%), whereas the industries that tend to have a higher number of women are Information (100.0%), Arts, Entertainment & Recreation (100.0%), and Health Care & Social Assistance (89.8%).
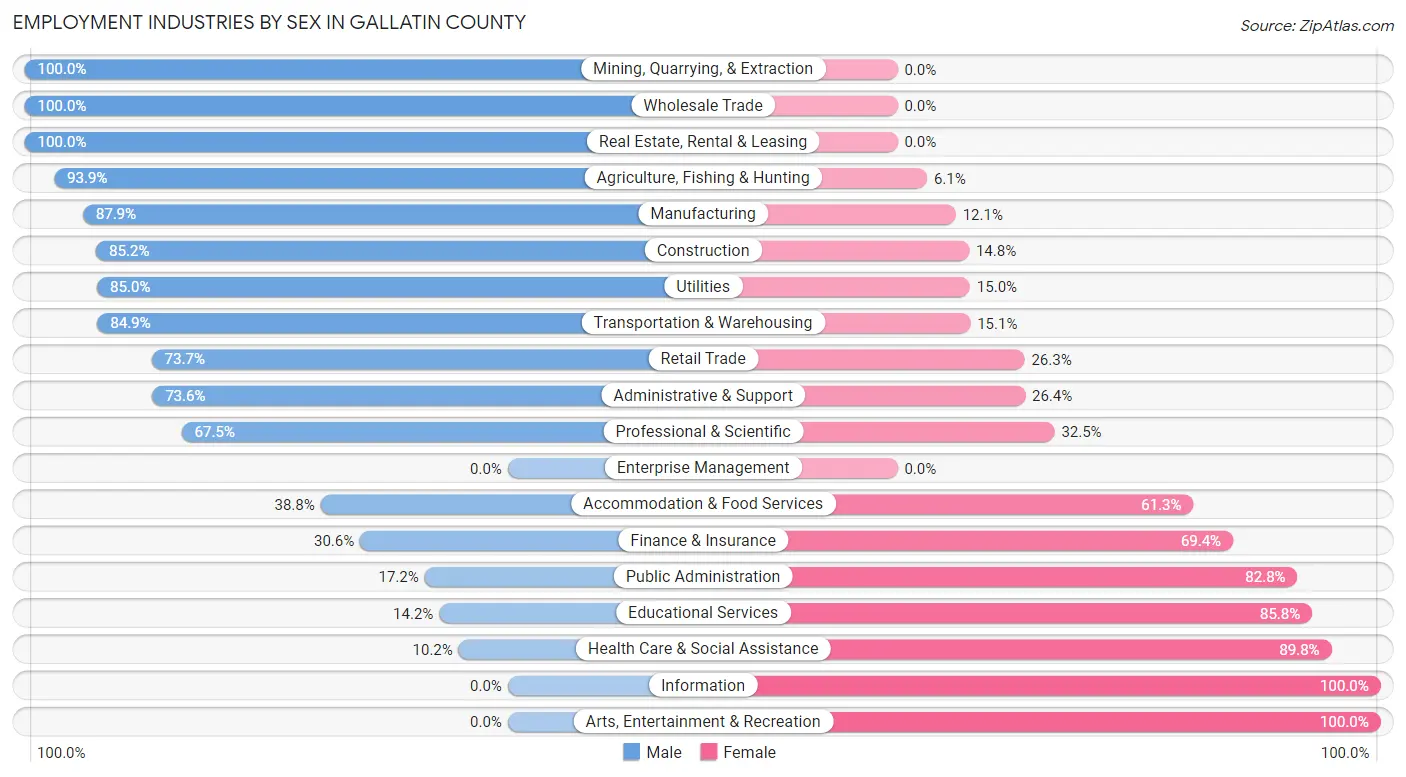
| Industry | Male | Female |
| Agriculture, Fishing & Hunting | 169 (93.9%) | 11 (6.1%) |
| Mining, Quarrying, & Extraction | 105 (100.0%) | 0 (0.0%) |
| Construction | 115 (85.2%) | 20 (14.8%) |
| Manufacturing | 204 (87.9%) | 28 (12.1%) |
| Wholesale Trade | 74 (100.0%) | 0 (0.0%) |
| Retail Trade | 255 (73.7%) | 91 (26.3%) |
| Transportation & Warehousing | 124 (84.9%) | 22 (15.1%) |
| Utilities | 17 (85.0%) | 3 (15.0%) |
| Information | 0 (0.0%) | 2 (100.0%) |
| Finance & Insurance | 11 (30.6%) | 25 (69.4%) |
| Real Estate, Rental & Leasing | 10 (100.0%) | 0 (0.0%) |
| Professional & Scientific | 54 (67.5%) | 26 (32.5%) |
| Enterprise Management | 0 (0.0%) | 0 (0.0%) |
| Administrative & Support | 39 (73.6%) | 14 (26.4%) |
| Educational Services | 21 (14.2%) | 127 (85.8%) |
| Health Care & Social Assistance | 30 (10.2%) | 265 (89.8%) |
| Arts, Entertainment & Recreation | 0 (0.0%) | 3 (100.0%) |
| Accommodation & Food Services | 31 (38.8%) | 49 (61.3%) |
| Public Administration | 21 (17.2%) | 101 (82.8%) |
| Total | 1,301 (61.2%) | 824 (38.8%) |
Education in Gallatin County
School Enrollment in Gallatin County
The most common levels of schooling among the 897 students in Gallatin County are high school (246 | 27.4%), middle school (222 | 24.7%), and elementary school (219 | 24.4%).
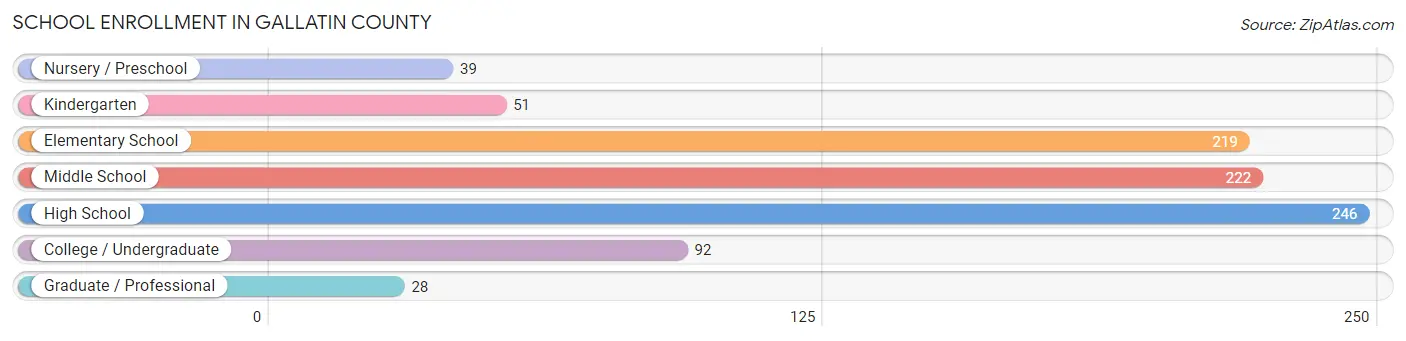
| School Level | # Students | % Students |
| Nursery / Preschool | 39 | 4.3% |
| Kindergarten | 51 | 5.7% |
| Elementary School | 219 | 24.4% |
| Middle School | 222 | 24.7% |
| High School | 246 | 27.4% |
| College / Undergraduate | 92 | 10.3% |
| Graduate / Professional | 28 | 3.1% |
| Total | 897 | 100.0% |
School Enrollment by Age by Funding Source in Gallatin County
Out of a total of 897 students who are enrolled in schools in Gallatin County, 43 (4.8%) attend a private institution, while the remaining 854 (95.2%) are enrolled in public schools. The age group of 35 years and over has the highest likelihood of being enrolled in private schools, with 16 (42.1% in the age bracket) enrolled. Conversely, the age group of 15 to 17 year olds has the lowest likelihood of being enrolled in a private school, with 180 (100.0% in the age bracket) attending a public institution.
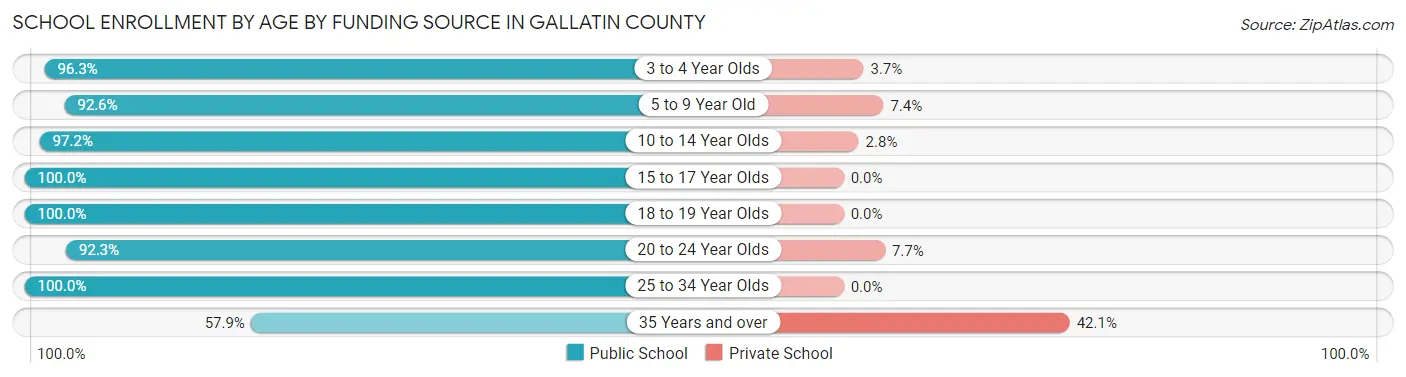
| Age Bracket | Public School | Private School |
| 3 to 4 Year Olds | 26 (96.3%) | 1 (3.7%) |
| 5 to 9 Year Old | 200 (92.6%) | 16 (7.4%) |
| 10 to 14 Year Olds | 314 (97.2%) | 9 (2.8%) |
| 15 to 17 Year Olds | 180 (100.0%) | 0 (0.0%) |
| 18 to 19 Year Olds | 71 (100.0%) | 0 (0.0%) |
| 20 to 24 Year Olds | 12 (92.3%) | 1 (7.7%) |
| 25 to 34 Year Olds | 29 (100.0%) | 0 (0.0%) |
| 35 Years and over | 22 (57.9%) | 16 (42.1%) |
| Total | 854 (95.2%) | 43 (4.8%) |
Educational Attainment by Field of Study in Gallatin County
Education (129 | 27.1%), science & technology (73 | 15.3%), business (55 | 11.6%), physical & health sciences (32 | 6.7%), and arts & humanities (30 | 6.3%) are the most common fields of study among 476 individuals in Gallatin County who have obtained a bachelor's degree or higher.
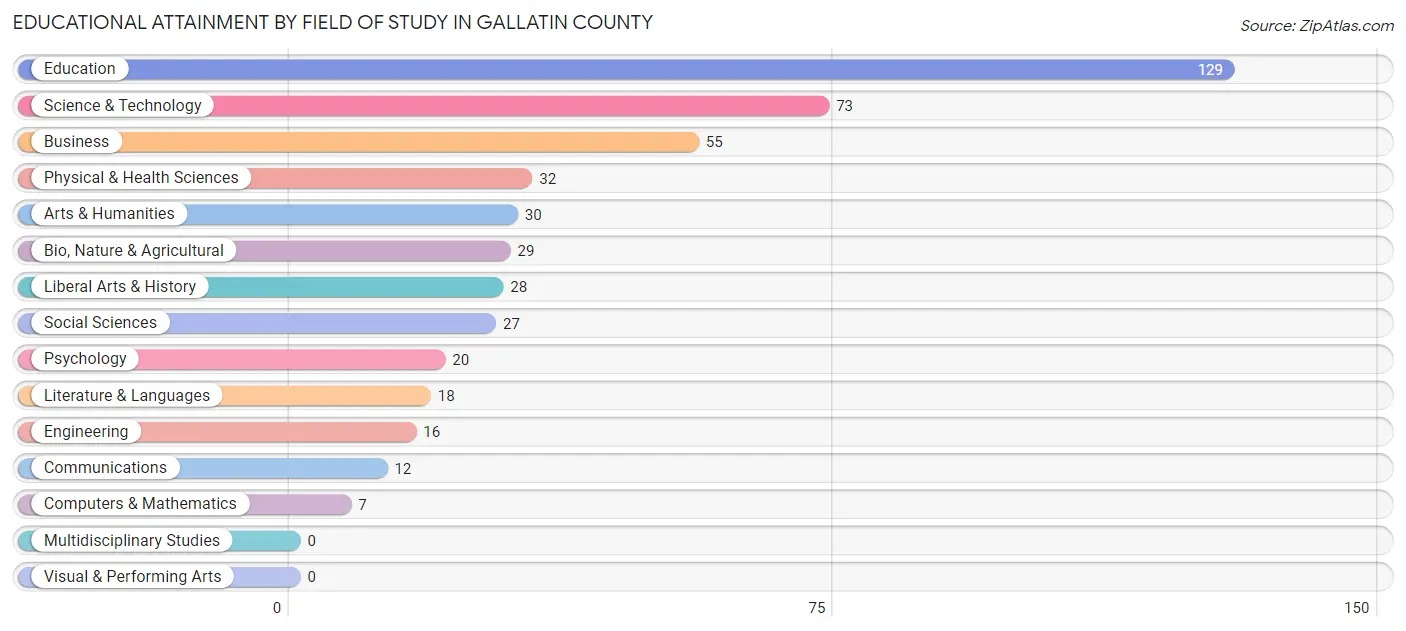
| Field of Study | # Graduates | % Graduates |
| Computers & Mathematics | 7 | 1.5% |
| Bio, Nature & Agricultural | 29 | 6.1% |
| Physical & Health Sciences | 32 | 6.7% |
| Psychology | 20 | 4.2% |
| Social Sciences | 27 | 5.7% |
| Engineering | 16 | 3.4% |
| Multidisciplinary Studies | 0 | 0.0% |
| Science & Technology | 73 | 15.3% |
| Business | 55 | 11.6% |
| Education | 129 | 27.1% |
| Literature & Languages | 18 | 3.8% |
| Liberal Arts & History | 28 | 5.9% |
| Visual & Performing Arts | 0 | 0.0% |
| Communications | 12 | 2.5% |
| Arts & Humanities | 30 | 6.3% |
| Total | 476 | 100.0% |
Transportation & Commute in Gallatin County
Vehicle Availability by Sex in Gallatin County
The most prevalent vehicle ownership categories in Gallatin County are males with 2 vehicles (442, accounting for 34.5%) and females with 2 vehicles (247, making up 55.7%).
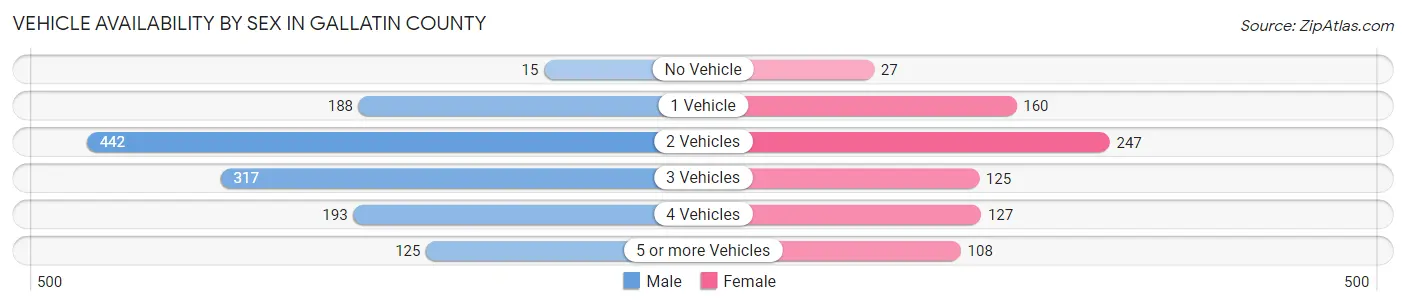
| Vehicles Available | Male | Female |
| No Vehicle | 15 (1.2%) | 27 (3.4%) |
| 1 Vehicle | 188 (14.7%) | 160 (20.2%) |
| 2 Vehicles | 442 (34.5%) | 247 (31.1%) |
| 3 Vehicles | 317 (24.8%) | 125 (15.7%) |
| 4 Vehicles | 193 (15.1%) | 127 (16.0%) |
| 5 or more Vehicles | 125 (9.8%) | 108 (13.6%) |
| Total | 1,280 (100.0%) | 794 (100.0%) |
Commute Time in Gallatin County
The most frequently occuring commute durations in Gallatin County are 30 to 34 minutes (253 commuters, 12.4%), 10 to 14 minutes (250 commuters, 12.3%), and 5 to 9 minutes (240 commuters, 11.8%).
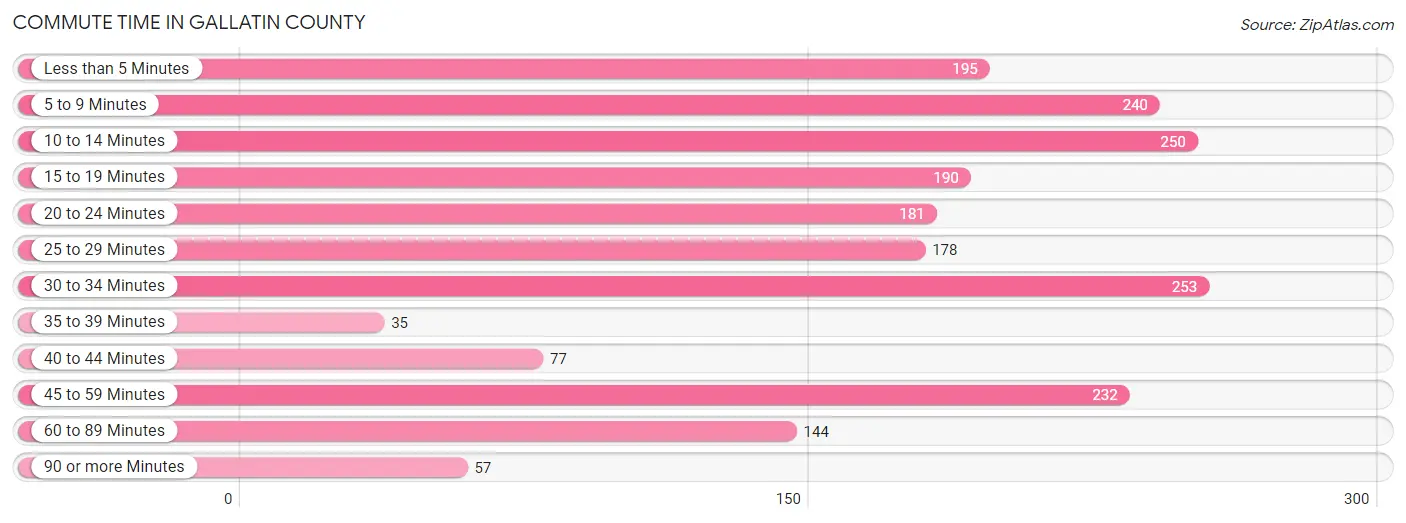
| Commute Time | # Commuters | % Commuters |
| Less than 5 Minutes | 195 | 9.6% |
| 5 to 9 Minutes | 240 | 11.8% |
| 10 to 14 Minutes | 250 | 12.3% |
| 15 to 19 Minutes | 190 | 9.3% |
| 20 to 24 Minutes | 181 | 8.9% |
| 25 to 29 Minutes | 178 | 8.8% |
| 30 to 34 Minutes | 253 | 12.4% |
| 35 to 39 Minutes | 35 | 1.7% |
| 40 to 44 Minutes | 77 | 3.8% |
| 45 to 59 Minutes | 232 | 11.4% |
| 60 to 89 Minutes | 144 | 7.1% |
| 90 or more Minutes | 57 | 2.8% |
Commute Time by Sex in Gallatin County
The most common commute times in Gallatin County are 5 to 9 minutes (193 commuters, 15.2%) for males and 25 to 29 minutes (118 commuters, 15.4%) for females.
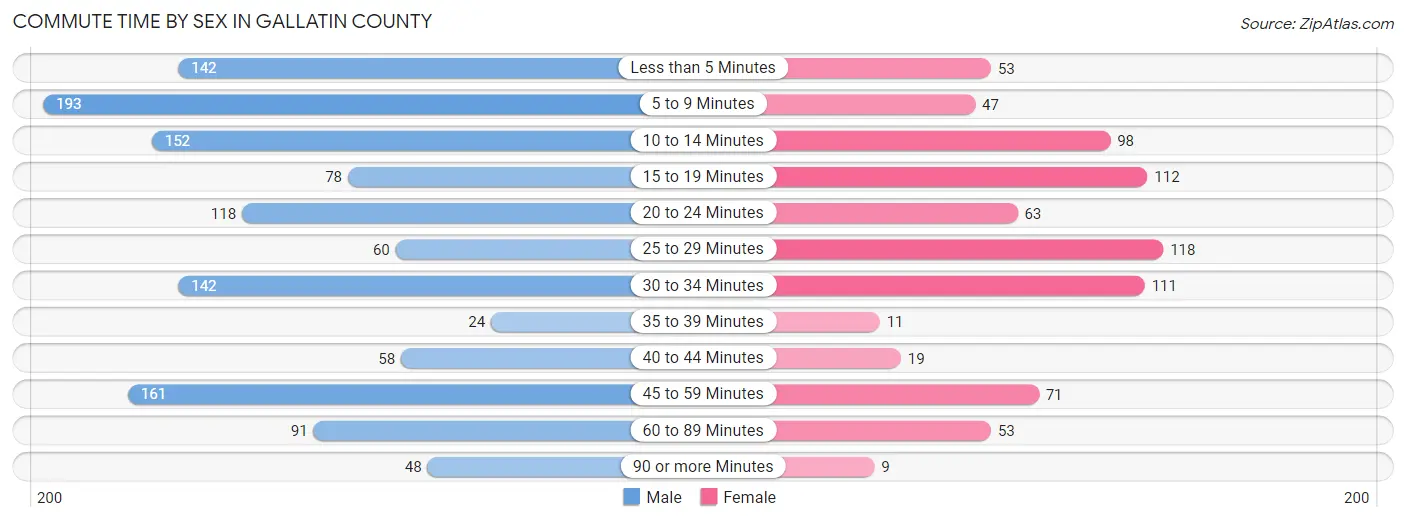
| Commute Time | Male | Female |
| Less than 5 Minutes | 142 (11.2%) | 53 (6.9%) |
| 5 to 9 Minutes | 193 (15.2%) | 47 (6.1%) |
| 10 to 14 Minutes | 152 (12.0%) | 98 (12.8%) |
| 15 to 19 Minutes | 78 (6.2%) | 112 (14.6%) |
| 20 to 24 Minutes | 118 (9.3%) | 63 (8.2%) |
| 25 to 29 Minutes | 60 (4.7%) | 118 (15.4%) |
| 30 to 34 Minutes | 142 (11.2%) | 111 (14.5%) |
| 35 to 39 Minutes | 24 (1.9%) | 11 (1.4%) |
| 40 to 44 Minutes | 58 (4.6%) | 19 (2.5%) |
| 45 to 59 Minutes | 161 (12.7%) | 71 (9.3%) |
| 60 to 89 Minutes | 91 (7.2%) | 53 (6.9%) |
| 90 or more Minutes | 48 (3.8%) | 9 (1.2%) |
Time of Departure to Work by Sex in Gallatin County
The most frequent times of departure to work in Gallatin County are 6:30 AM to 6:59 AM (242, 19.1%) for males and 7:30 AM to 7:59 AM (161, 21.0%) for females.
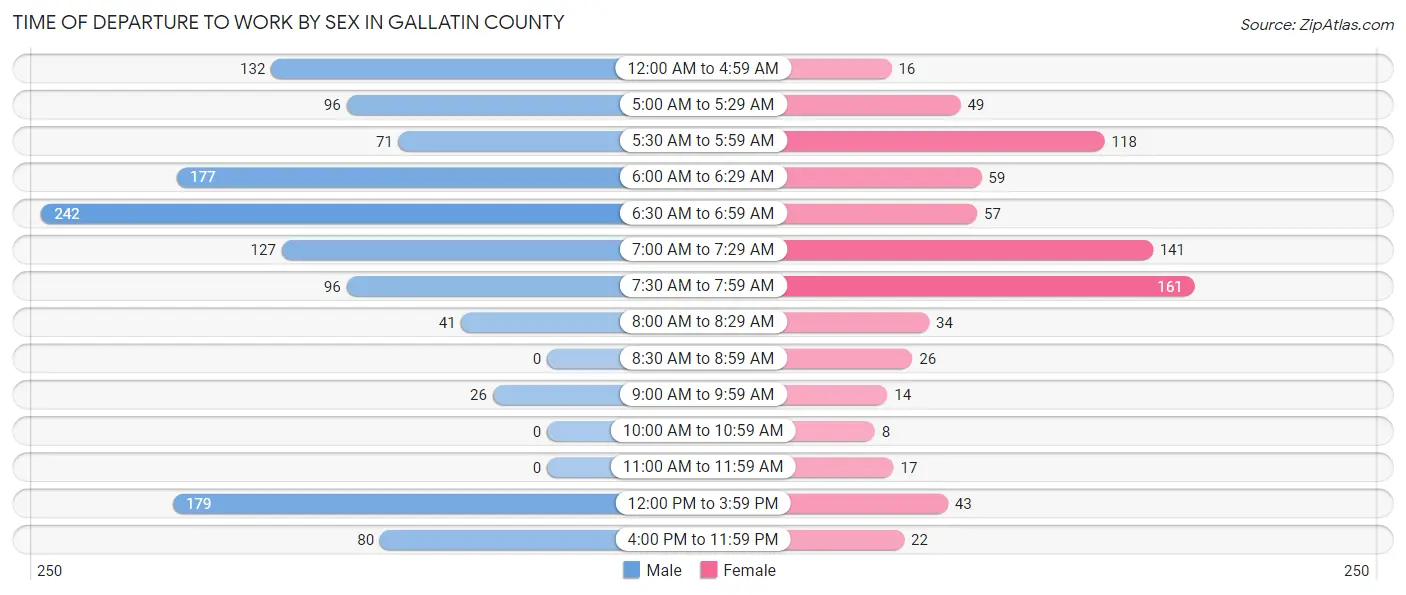
| Time of Departure | Male | Female |
| 12:00 AM to 4:59 AM | 132 (10.4%) | 16 (2.1%) |
| 5:00 AM to 5:29 AM | 96 (7.6%) | 49 (6.4%) |
| 5:30 AM to 5:59 AM | 71 (5.6%) | 118 (15.4%) |
| 6:00 AM to 6:29 AM | 177 (14.0%) | 59 (7.7%) |
| 6:30 AM to 6:59 AM | 242 (19.1%) | 57 (7.4%) |
| 7:00 AM to 7:29 AM | 127 (10.0%) | 141 (18.4%) |
| 7:30 AM to 7:59 AM | 96 (7.6%) | 161 (21.0%) |
| 8:00 AM to 8:29 AM | 41 (3.2%) | 34 (4.4%) |
| 8:30 AM to 8:59 AM | 0 (0.0%) | 26 (3.4%) |
| 9:00 AM to 9:59 AM | 26 (2.1%) | 14 (1.8%) |
| 10:00 AM to 10:59 AM | 0 (0.0%) | 8 (1.1%) |
| 11:00 AM to 11:59 AM | 0 (0.0%) | 17 (2.2%) |
| 12:00 PM to 3:59 PM | 179 (14.1%) | 43 (5.6%) |
| 4:00 PM to 11:59 PM | 80 (6.3%) | 22 (2.9%) |
| Total | 1,267 (100.0%) | 765 (100.0%) |
Housing Occupancy in Gallatin County
Occupancy by Ownership in Gallatin County
Of the total 2,155 dwellings in Gallatin County, owner-occupied units account for 1,653 (76.7%), while renter-occupied units make up 502 (23.3%).
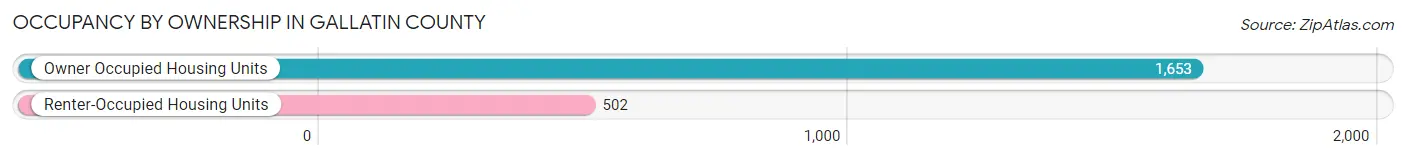
| Occupancy | # Housing Units | % Housing Units |
| Owner Occupied Housing Units | 1,653 | 76.7% |
| Renter-Occupied Housing Units | 502 | 23.3% |
| Total Occupied Housing Units | 2,155 | 100.0% |
Occupancy by Household Size in Gallatin County
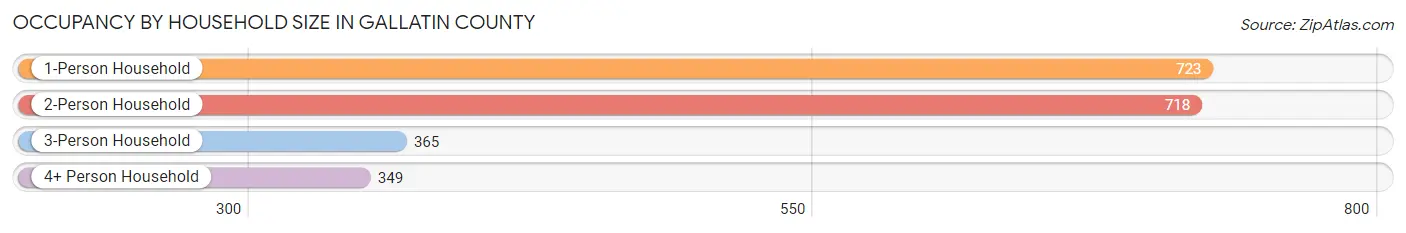
| Household Size | # Housing Units | % Housing Units |
| 1-Person Household | 723 | 33.6% |
| 2-Person Household | 718 | 33.3% |
| 3-Person Household | 365 | 16.9% |
| 4+ Person Household | 349 | 16.2% |
| Total Housing Units | 2,155 | 100.0% |
Occupancy by Ownership by Household Size in Gallatin County
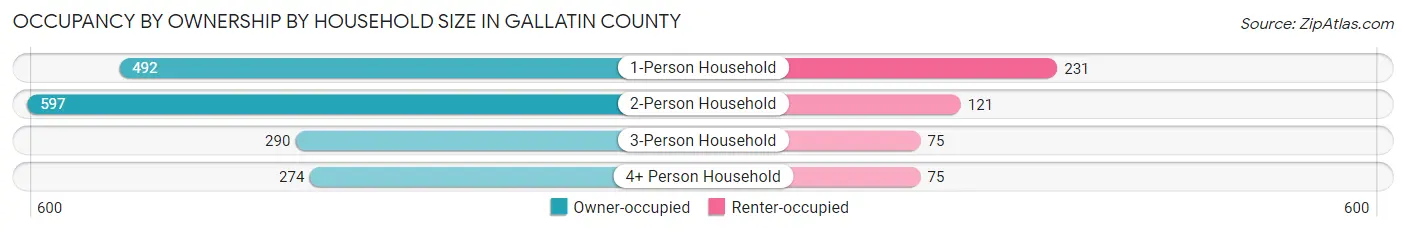
| Household Size | Owner-occupied | Renter-occupied |
| 1-Person Household | 492 (68.0%) | 231 (32.0%) |
| 2-Person Household | 597 (83.2%) | 121 (16.9%) |
| 3-Person Household | 290 (79.4%) | 75 (20.5%) |
| 4+ Person Household | 274 (78.5%) | 75 (21.5%) |
| Total Housing Units | 1,653 (76.7%) | 502 (23.3%) |
Occupancy by Educational Attainment in Gallatin County
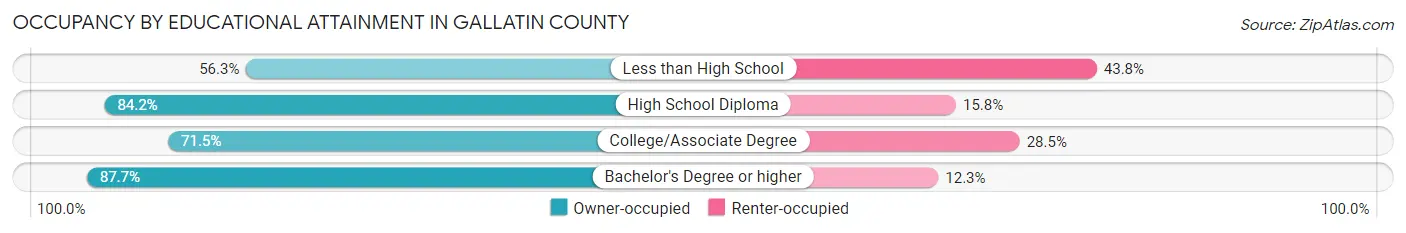
| Household Size | Owner-occupied | Renter-occupied |
| Less than High School | 126 (56.2%) | 98 (43.8%) |
| High School Diploma | 648 (84.2%) | 122 (15.8%) |
| College/Associate Degree | 616 (71.5%) | 245 (28.5%) |
| Bachelor's Degree or higher | 263 (87.7%) | 37 (12.3%) |
Occupancy by Age of Householder in Gallatin County
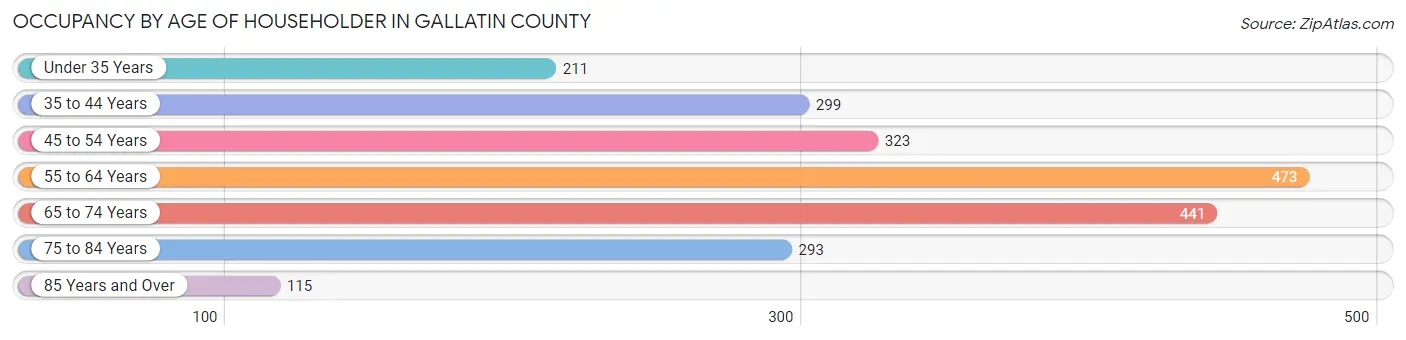
| Age Bracket | # Households | % Households |
| Under 35 Years | 211 | 9.8% |
| 35 to 44 Years | 299 | 13.9% |
| 45 to 54 Years | 323 | 15.0% |
| 55 to 64 Years | 473 | 22.0% |
| 65 to 74 Years | 441 | 20.5% |
| 75 to 84 Years | 293 | 13.6% |
| 85 Years and Over | 115 | 5.3% |
| Total | 2,155 | 100.0% |
Housing Finances in Gallatin County
Median Income by Occupancy in Gallatin County
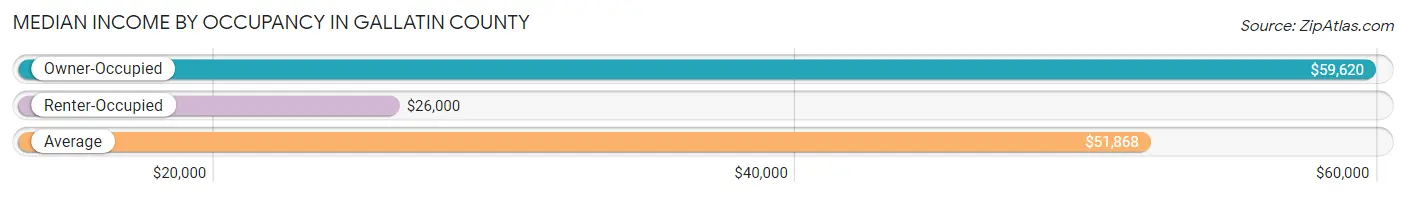
| Occupancy Type | # Households | Median Income |
| Owner-Occupied | 1,653 (76.7%) | $59,620 |
| Renter-Occupied | 502 (23.3%) | $26,000 |
| Average | 2,155 (100.0%) | $51,868 |
Occupancy by Householder Income Bracket in Gallatin County
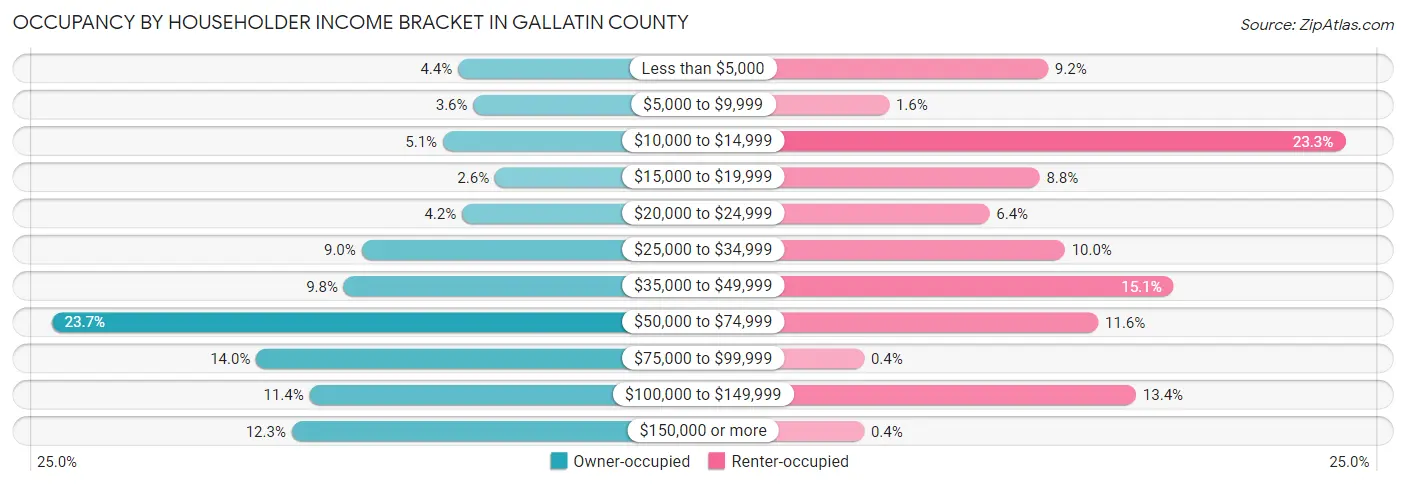
| Income Bracket | Owner-occupied | Renter-occupied |
| Less than $5,000 | 72 (4.4%) | 46 (9.2%) |
| $5,000 to $9,999 | 60 (3.6%) | 8 (1.6%) |
| $10,000 to $14,999 | 84 (5.1%) | 117 (23.3%) |
| $15,000 to $19,999 | 43 (2.6%) | 44 (8.8%) |
| $20,000 to $24,999 | 69 (4.2%) | 32 (6.4%) |
| $25,000 to $34,999 | 148 (8.9%) | 50 (10.0%) |
| $35,000 to $49,999 | 162 (9.8%) | 76 (15.1%) |
| $50,000 to $74,999 | 392 (23.7%) | 58 (11.6%) |
| $75,000 to $99,999 | 231 (14.0%) | 2 (0.4%) |
| $100,000 to $149,999 | 189 (11.4%) | 67 (13.4%) |
| $150,000 or more | 203 (12.3%) | 2 (0.4%) |
| Total | 1,653 (100.0%) | 502 (100.0%) |
Monthly Housing Cost Tiers in Gallatin County
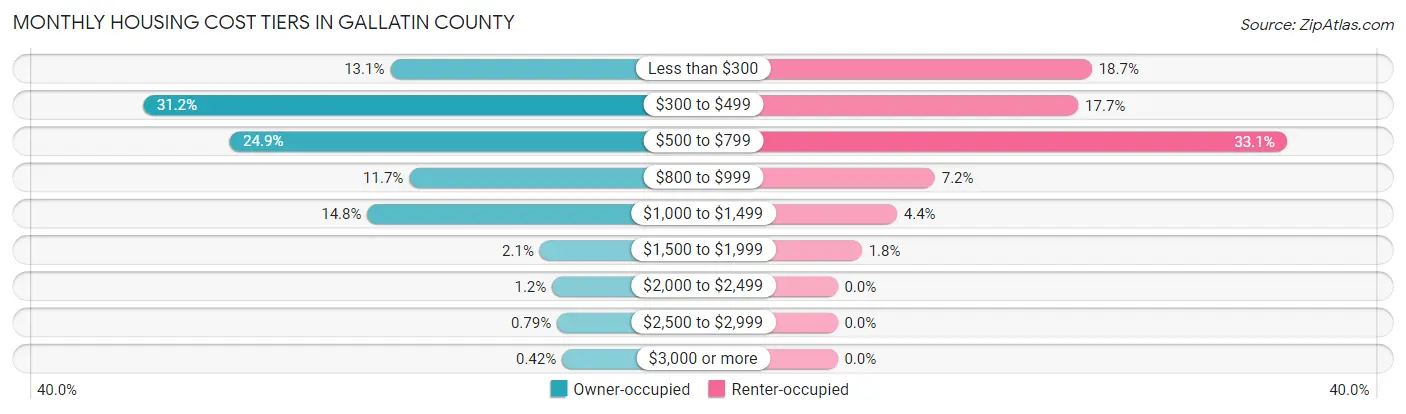
| Monthly Cost | Owner-occupied | Renter-occupied |
| Less than $300 | 216 (13.1%) | 94 (18.7%) |
| $300 to $499 | 516 (31.2%) | 89 (17.7%) |
| $500 to $799 | 411 (24.9%) | 166 (33.1%) |
| $800 to $999 | 193 (11.7%) | 36 (7.2%) |
| $1,000 to $1,499 | 244 (14.8%) | 22 (4.4%) |
| $1,500 to $1,999 | 34 (2.1%) | 9 (1.8%) |
| $2,000 to $2,499 | 19 (1.1%) | 0 (0.0%) |
| $2,500 to $2,999 | 13 (0.8%) | 0 (0.0%) |
| $3,000 or more | 7 (0.4%) | 0 (0.0%) |
| Total | 1,653 (100.0%) | 502 (100.0%) |
Physical Housing Characteristics in Gallatin County
Housing Structures in Gallatin County
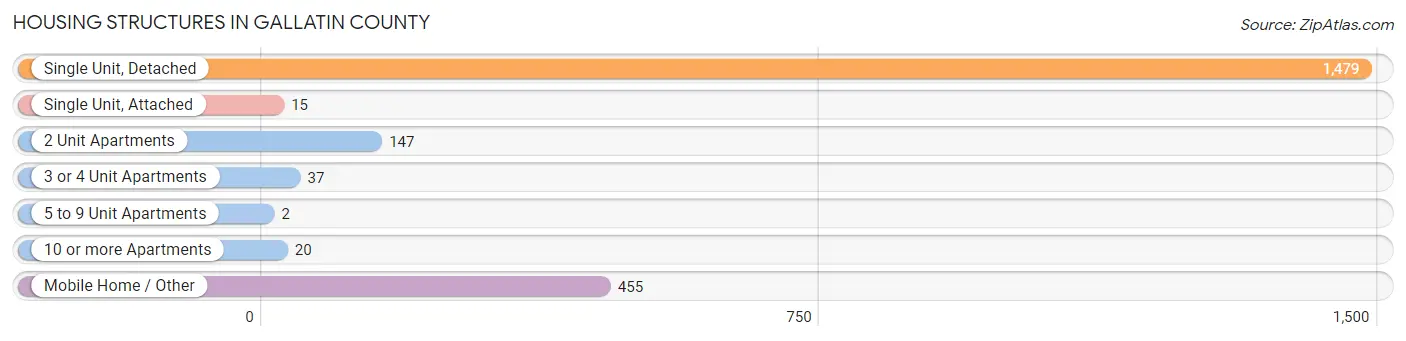
| Structure Type | # Housing Units | % Housing Units |
| Single Unit, Detached | 1,479 | 68.6% |
| Single Unit, Attached | 15 | 0.7% |
| 2 Unit Apartments | 147 | 6.8% |
| 3 or 4 Unit Apartments | 37 | 1.7% |
| 5 to 9 Unit Apartments | 2 | 0.1% |
| 10 or more Apartments | 20 | 0.9% |
| Mobile Home / Other | 455 | 21.1% |
| Total | 2,155 | 100.0% |
Housing Structures by Occupancy in Gallatin County
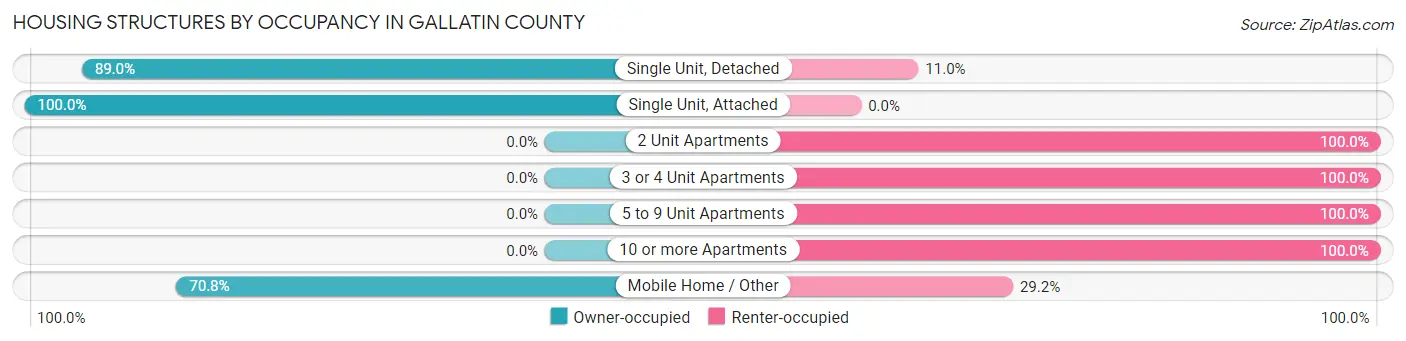
| Structure Type | Owner-occupied | Renter-occupied |
| Single Unit, Detached | 1,316 (89.0%) | 163 (11.0%) |
| Single Unit, Attached | 15 (100.0%) | 0 (0.0%) |
| 2 Unit Apartments | 0 (0.0%) | 147 (100.0%) |
| 3 or 4 Unit Apartments | 0 (0.0%) | 37 (100.0%) |
| 5 to 9 Unit Apartments | 0 (0.0%) | 2 (100.0%) |
| 10 or more Apartments | 0 (0.0%) | 20 (100.0%) |
| Mobile Home / Other | 322 (70.8%) | 133 (29.2%) |
| Total | 1,653 (76.7%) | 502 (23.3%) |
Housing Structures by Number of Rooms in Gallatin County
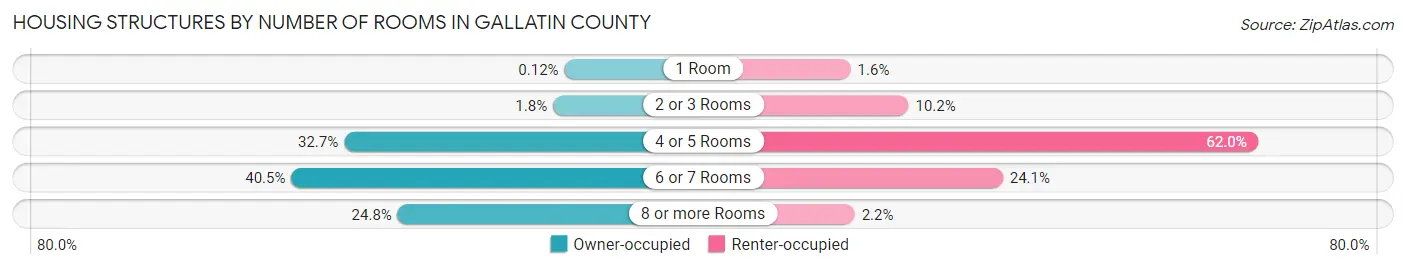
| Number of Rooms | Owner-occupied | Renter-occupied |
| 1 Room | 2 (0.1%) | 8 (1.6%) |
| 2 or 3 Rooms | 30 (1.8%) | 51 (10.2%) |
| 4 or 5 Rooms | 541 (32.7%) | 311 (62.0%) |
| 6 or 7 Rooms | 670 (40.5%) | 121 (24.1%) |
| 8 or more Rooms | 410 (24.8%) | 11 (2.2%) |
| Total | 1,653 (100.0%) | 502 (100.0%) |
Housing Structure by Heating Type in Gallatin County
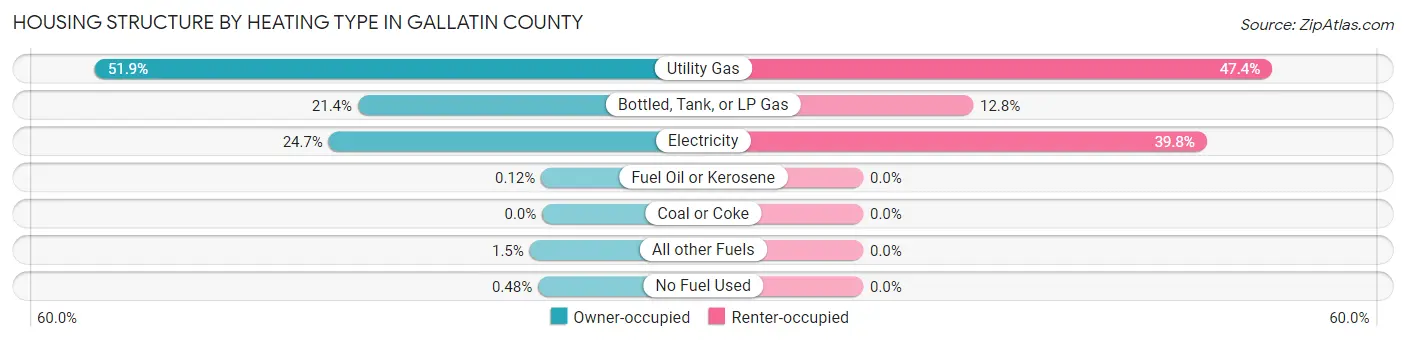
| Heating Type | Owner-occupied | Renter-occupied |
| Utility Gas | 857 (51.8%) | 238 (47.4%) |
| Bottled, Tank, or LP Gas | 353 (21.4%) | 64 (12.8%) |
| Electricity | 409 (24.7%) | 200 (39.8%) |
| Fuel Oil or Kerosene | 2 (0.1%) | 0 (0.0%) |
| Coal or Coke | 0 (0.0%) | 0 (0.0%) |
| All other Fuels | 24 (1.5%) | 0 (0.0%) |
| No Fuel Used | 8 (0.5%) | 0 (0.0%) |
| Total | 1,653 (100.0%) | 502 (100.0%) |
Household Vehicle Usage in Gallatin County
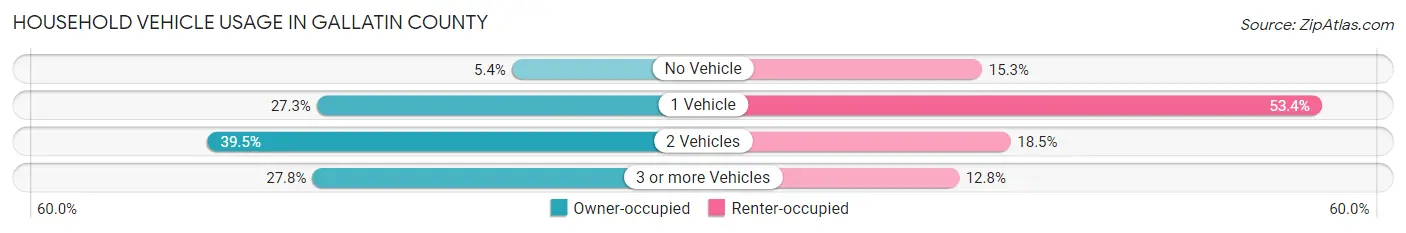
| Vehicles per Household | Owner-occupied | Renter-occupied |
| No Vehicle | 90 (5.4%) | 77 (15.3%) |
| 1 Vehicle | 451 (27.3%) | 268 (53.4%) |
| 2 Vehicles | 653 (39.5%) | 93 (18.5%) |
| 3 or more Vehicles | 459 (27.8%) | 64 (12.8%) |
| Total | 1,653 (100.0%) | 502 (100.0%) |
Real Estate & Mortgages in Gallatin County
Real Estate and Mortgage Overview in Gallatin County
| Characteristic | Without Mortgage | With Mortgage |
| Housing Units | 1,069 | 584 |
| Median Property Value | $75,600 | $86,300 |
| Median Household Income | $50,966 | $125 |
| Monthly Housing Costs | $414 | $7 |
| Real Estate Taxes | $1,111 | $19 |
Property Value by Mortgage Status in Gallatin County
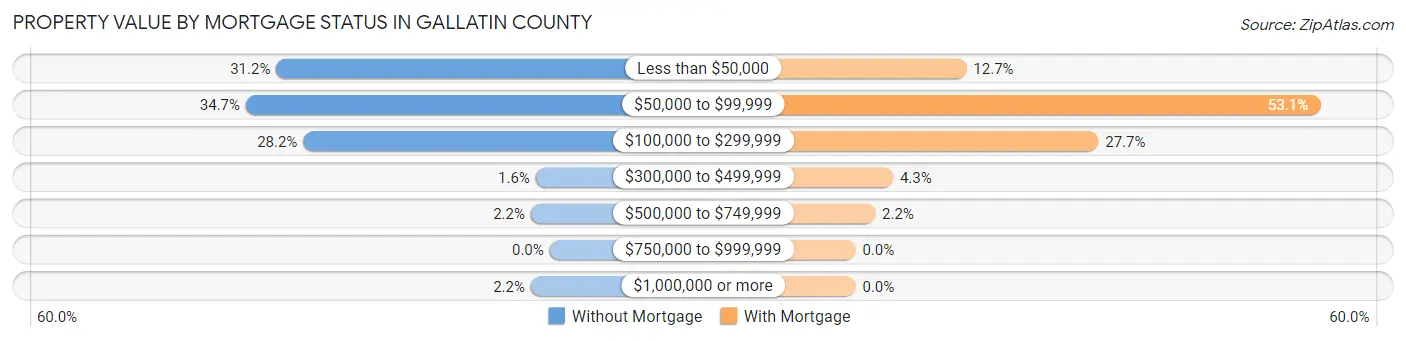
| Property Value | Without Mortgage | With Mortgage |
| Less than $50,000 | 334 (31.2%) | 74 (12.7%) |
| $50,000 to $99,999 | 371 (34.7%) | 310 (53.1%) |
| $100,000 to $299,999 | 301 (28.2%) | 162 (27.7%) |
| $300,000 to $499,999 | 17 (1.6%) | 25 (4.3%) |
| $500,000 to $749,999 | 23 (2.1%) | 13 (2.2%) |
| $750,000 to $999,999 | 0 (0.0%) | 0 (0.0%) |
| $1,000,000 or more | 23 (2.1%) | 0 (0.0%) |
| Total | 1,069 (100.0%) | 584 (100.0%) |
Household Income by Mortgage Status in Gallatin County
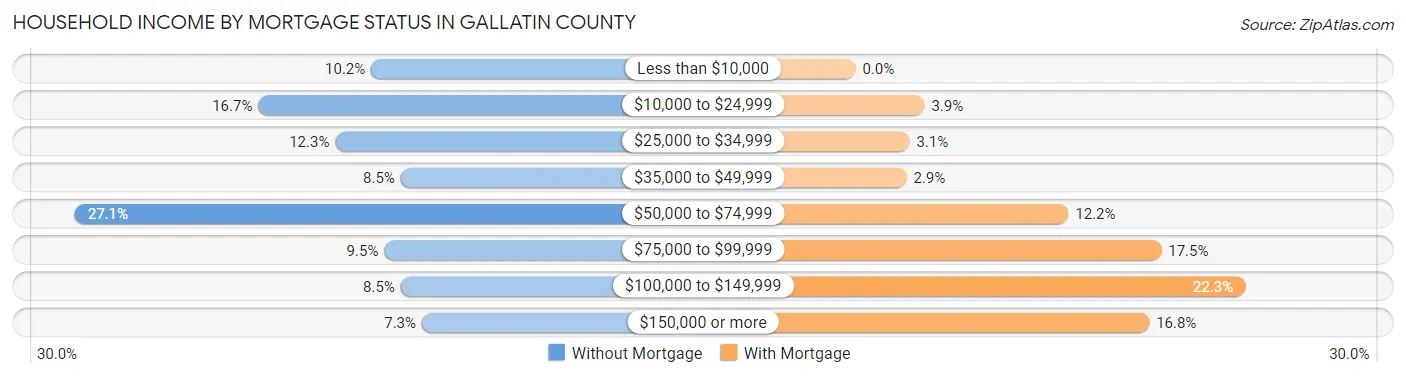
| Household Income | Without Mortgage | With Mortgage |
| Less than $10,000 | 109 (10.2%) | 0 (0.0%) |
| $10,000 to $24,999 | 178 (16.7%) | 23 (3.9%) |
| $25,000 to $34,999 | 131 (12.2%) | 18 (3.1%) |
| $35,000 to $49,999 | 91 (8.5%) | 17 (2.9%) |
| $50,000 to $74,999 | 290 (27.1%) | 71 (12.2%) |
| $75,000 to $99,999 | 101 (9.5%) | 102 (17.5%) |
| $100,000 to $149,999 | 91 (8.5%) | 130 (22.3%) |
| $150,000 or more | 78 (7.3%) | 98 (16.8%) |
| Total | 1,069 (100.0%) | 584 (100.0%) |
Property Value to Household Income Ratio in Gallatin County
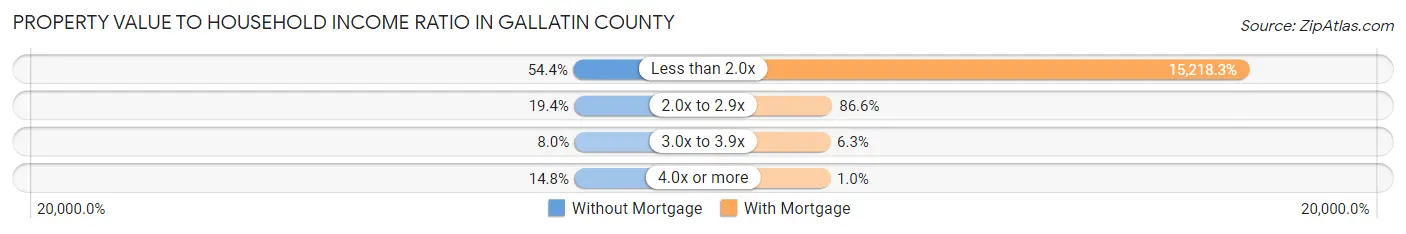
| Value-to-Income Ratio | Without Mortgage | With Mortgage |
| Less than 2.0x | 581 (54.3%) | 88,875 (15,218.3%) |
| 2.0x to 2.9x | 207 (19.4%) | 506 (86.6%) |
| 3.0x to 3.9x | 85 (8.0%) | 37 (6.3%) |
| 4.0x or more | 158 (14.8%) | 6 (1.0%) |
| Total | 1,069 (100.0%) | 584 (100.0%) |
Real Estate Taxes by Mortgage Status in Gallatin County
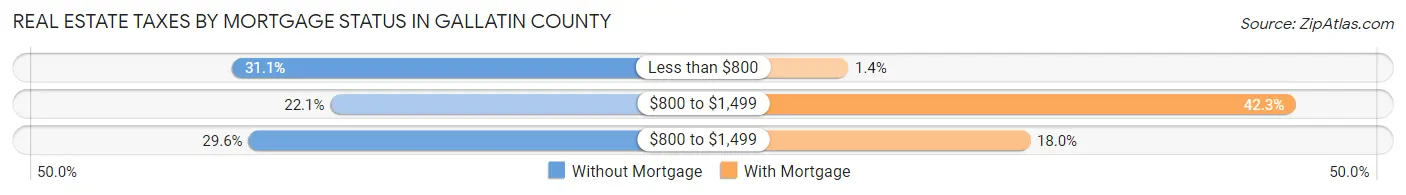
| Property Taxes | Without Mortgage | With Mortgage |
| Less than $800 | 332 (31.1%) | 8 (1.4%) |
| $800 to $1,499 | 236 (22.1%) | 247 (42.3%) |
| $800 to $1,499 | 316 (29.6%) | 105 (18.0%) |
| Total | 1,069 (100.0%) | 584 (100.0%) |
Health & Disability in Gallatin County
Health Insurance Coverage by Age in Gallatin County
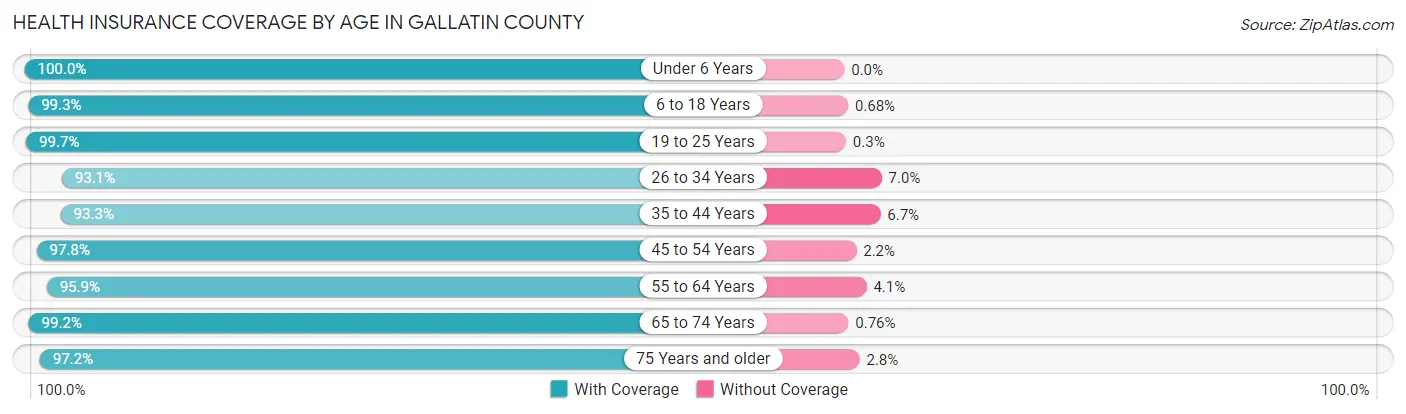
| Age Bracket | With Coverage | Without Coverage |
| Under 6 Years | 278 (100.0%) | 0 (0.0%) |
| 6 to 18 Years | 725 (99.3%) | 5 (0.7%) |
| 19 to 25 Years | 328 (99.7%) | 1 (0.3%) |
| 26 to 34 Years | 415 (93.0%) | 31 (7.0%) |
| 35 to 44 Years | 541 (93.3%) | 39 (6.7%) |
| 45 to 54 Years | 613 (97.8%) | 14 (2.2%) |
| 55 to 64 Years | 719 (95.9%) | 31 (4.1%) |
| 65 to 74 Years | 650 (99.2%) | 5 (0.8%) |
| 75 Years and older | 547 (97.2%) | 16 (2.8%) |
| Total | 4,816 (97.1%) | 142 (2.9%) |
Health Insurance Coverage by Citizenship Status in Gallatin County
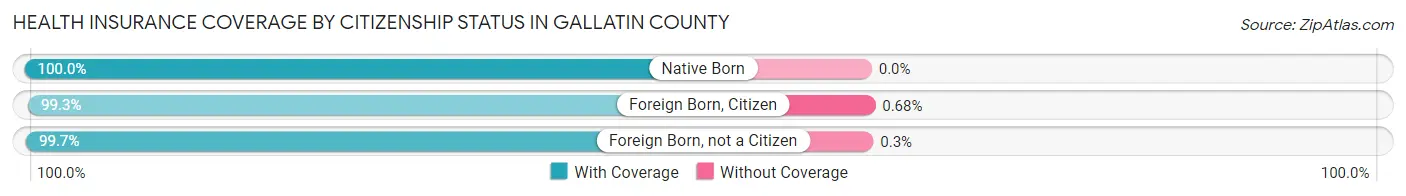
| Citizenship Status | With Coverage | Without Coverage |
| Native Born | 278 (100.0%) | 0 (0.0%) |
| Foreign Born, Citizen | 725 (99.3%) | 5 (0.7%) |
| Foreign Born, not a Citizen | 328 (99.7%) | 1 (0.3%) |
Health Insurance Coverage by Household Income in Gallatin County
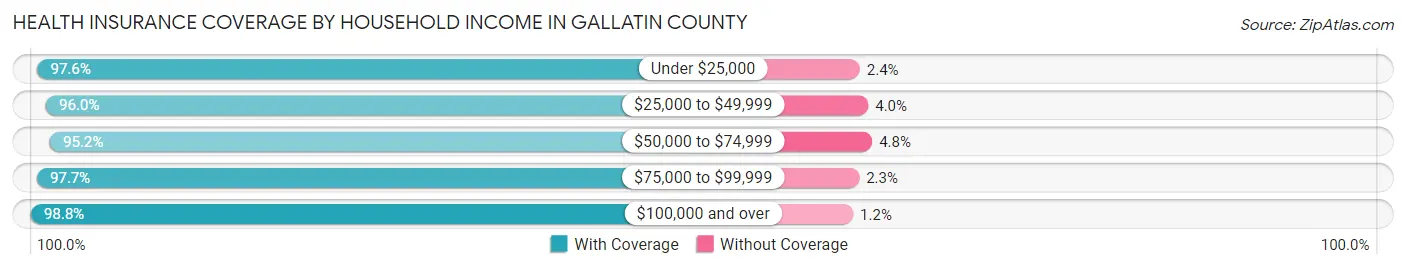
| Household Income | With Coverage | Without Coverage |
| Under $25,000 | 880 (97.6%) | 22 (2.4%) |
| $25,000 to $49,999 | 881 (96.0%) | 37 (4.0%) |
| $50,000 to $74,999 | 999 (95.2%) | 50 (4.8%) |
| $75,000 to $99,999 | 717 (97.7%) | 17 (2.3%) |
| $100,000 and over | 1,334 (98.8%) | 16 (1.2%) |
Public vs Private Health Insurance Coverage by Age in Gallatin County
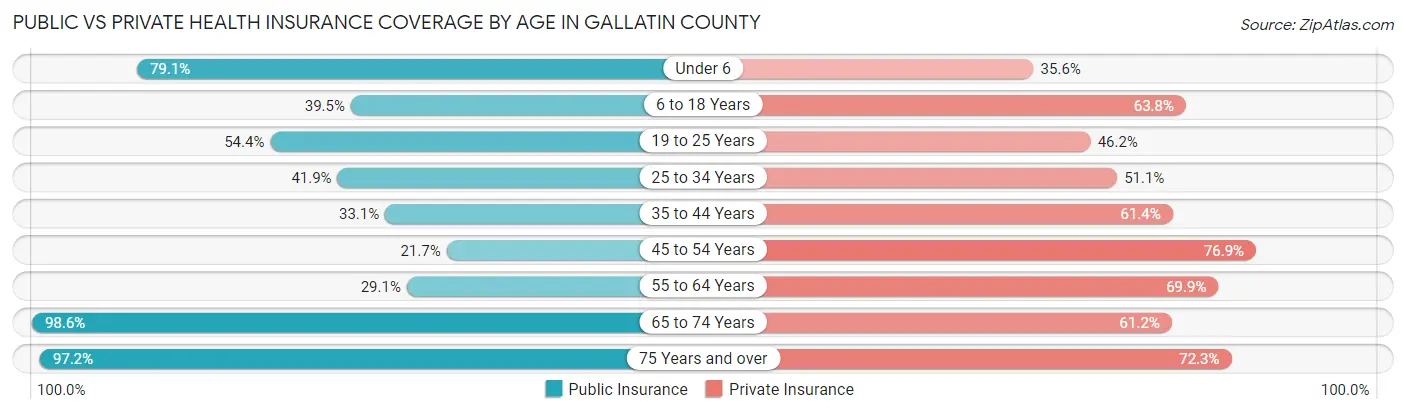
| Age Bracket | Public Insurance | Private Insurance |
| Under 6 | 220 (79.1%) | 99 (35.6%) |
| 6 to 18 Years | 288 (39.5%) | 466 (63.8%) |
| 19 to 25 Years | 179 (54.4%) | 152 (46.2%) |
| 25 to 34 Years | 187 (41.9%) | 228 (51.1%) |
| 35 to 44 Years | 192 (33.1%) | 356 (61.4%) |
| 45 to 54 Years | 136 (21.7%) | 482 (76.9%) |
| 55 to 64 Years | 218 (29.1%) | 524 (69.9%) |
| 65 to 74 Years | 646 (98.6%) | 401 (61.2%) |
| 75 Years and over | 547 (97.2%) | 407 (72.3%) |
| Total | 2,613 (52.7%) | 3,115 (62.8%) |
Disability Status by Sex by Age in Gallatin County
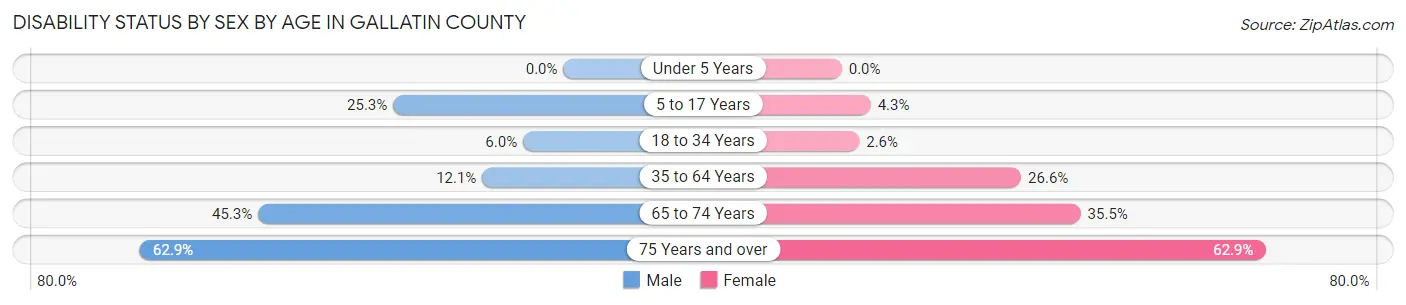
| Age Bracket | Male | Female |
| Under 5 Years | 0 (0.0%) | 0 (0.0%) |
| 5 to 17 Years | 89 (25.3%) | 16 (4.3%) |
| 18 to 34 Years | 27 (6.0%) | 10 (2.6%) |
| 35 to 64 Years | 125 (12.0%) | 245 (26.6%) |
| 65 to 74 Years | 141 (45.3%) | 122 (35.5%) |
| 75 Years and over | 149 (62.9%) | 205 (62.9%) |
Disability Class by Sex by Age in Gallatin County
Disability Class: Hearing Difficulty
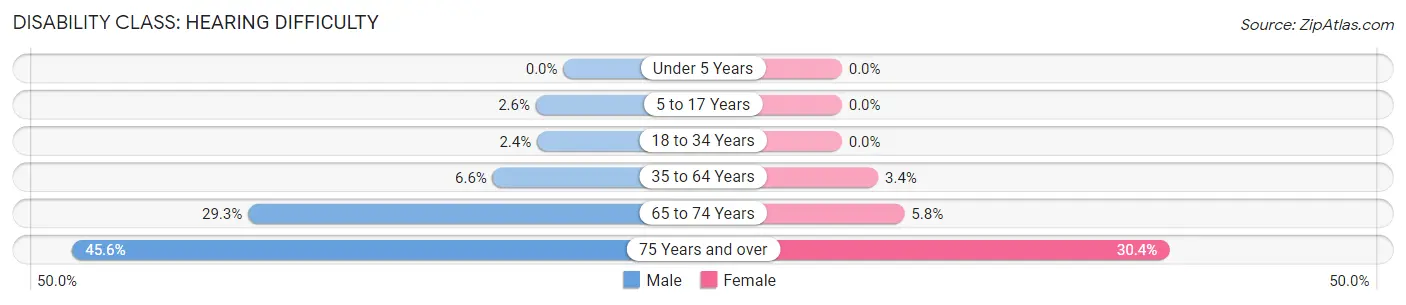
| Age Bracket | Male | Female |
| Under 5 Years | 0 (0.0%) | 0 (0.0%) |
| 5 to 17 Years | 9 (2.6%) | 0 (0.0%) |
| 18 to 34 Years | 11 (2.4%) | 0 (0.0%) |
| 35 to 64 Years | 68 (6.6%) | 31 (3.4%) |
| 65 to 74 Years | 91 (29.3%) | 20 (5.8%) |
| 75 Years and over | 108 (45.6%) | 99 (30.4%) |
Disability Class: Vision Difficulty
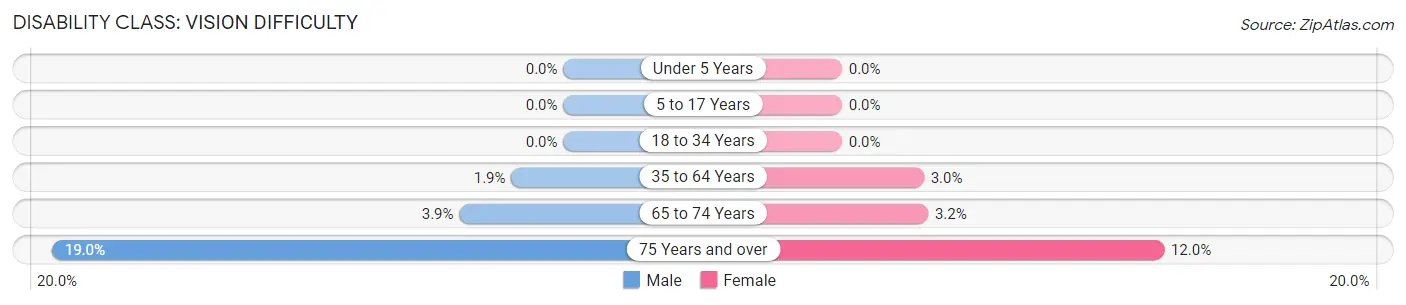
| Age Bracket | Male | Female |
| Under 5 Years | 0 (0.0%) | 0 (0.0%) |
| 5 to 17 Years | 0 (0.0%) | 0 (0.0%) |
| 18 to 34 Years | 0 (0.0%) | 0 (0.0%) |
| 35 to 64 Years | 20 (1.9%) | 28 (3.0%) |
| 65 to 74 Years | 12 (3.9%) | 11 (3.2%) |
| 75 Years and over | 45 (19.0%) | 39 (12.0%) |
Disability Class: Cognitive Difficulty
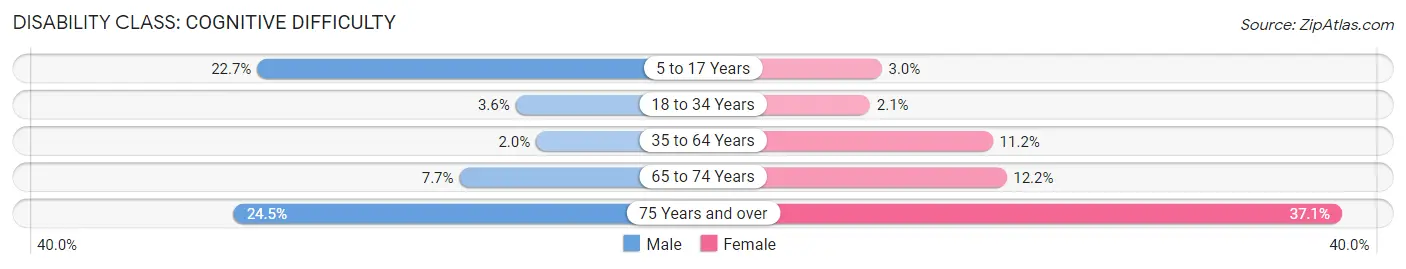
| Age Bracket | Male | Female |
| 5 to 17 Years | 80 (22.7%) | 11 (2.9%) |
| 18 to 34 Years | 16 (3.5%) | 8 (2.1%) |
| 35 to 64 Years | 21 (2.0%) | 103 (11.2%) |
| 65 to 74 Years | 24 (7.7%) | 42 (12.2%) |
| 75 Years and over | 58 (24.5%) | 121 (37.1%) |
Disability Class: Ambulatory Difficulty
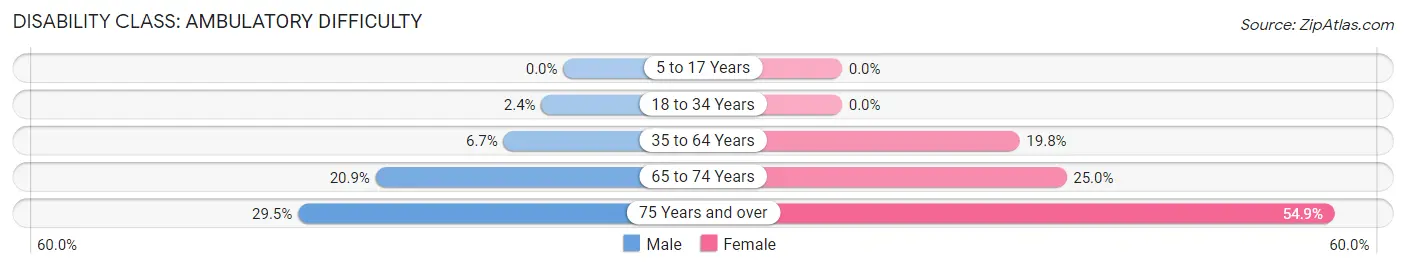
| Age Bracket | Male | Female |
| 5 to 17 Years | 0 (0.0%) | 0 (0.0%) |
| 18 to 34 Years | 11 (2.4%) | 0 (0.0%) |
| 35 to 64 Years | 69 (6.7%) | 182 (19.8%) |
| 65 to 74 Years | 65 (20.9%) | 86 (25.0%) |
| 75 Years and over | 70 (29.5%) | 179 (54.9%) |
Disability Class: Self-Care Difficulty
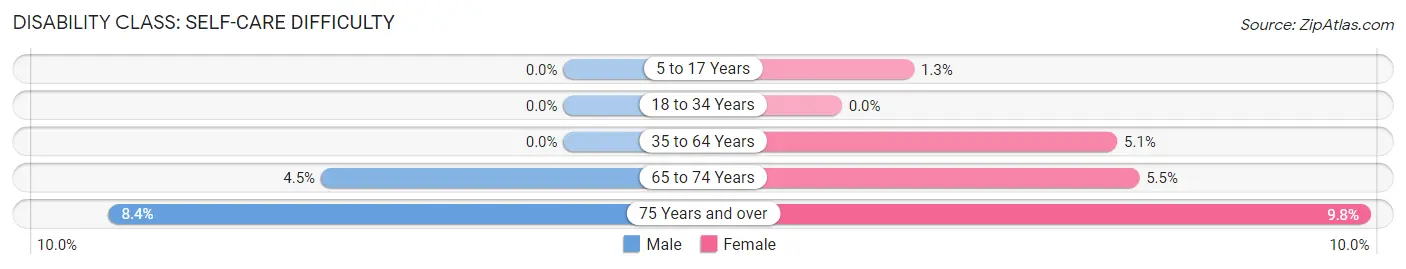
| Age Bracket | Male | Female |
| 5 to 17 Years | 0 (0.0%) | 5 (1.3%) |
| 18 to 34 Years | 0 (0.0%) | 0 (0.0%) |
| 35 to 64 Years | 0 (0.0%) | 47 (5.1%) |
| 65 to 74 Years | 14 (4.5%) | 19 (5.5%) |
| 75 Years and over | 20 (8.4%) | 32 (9.8%) |
Technology Access in Gallatin County
Computing Device Access in Gallatin County
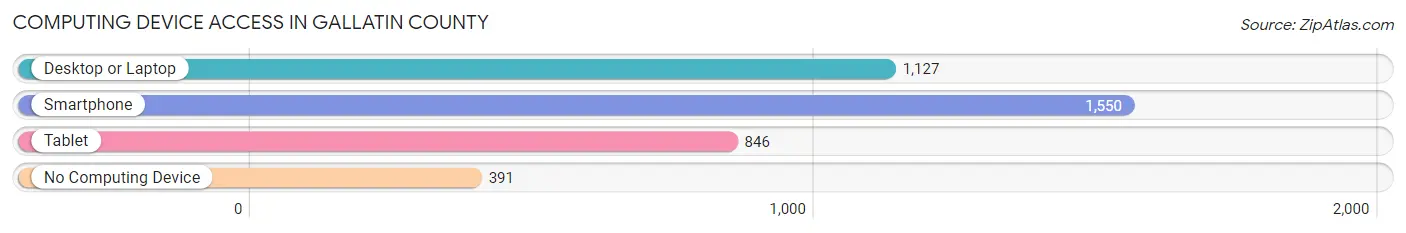
| Device Type | # Households | % Households |
| Desktop or Laptop | 1,127 | 52.3% |
| Smartphone | 1,550 | 71.9% |
| Tablet | 846 | 39.3% |
| No Computing Device | 391 | 18.1% |
| Total | 2,155 | 100.0% |
Internet Access in Gallatin County
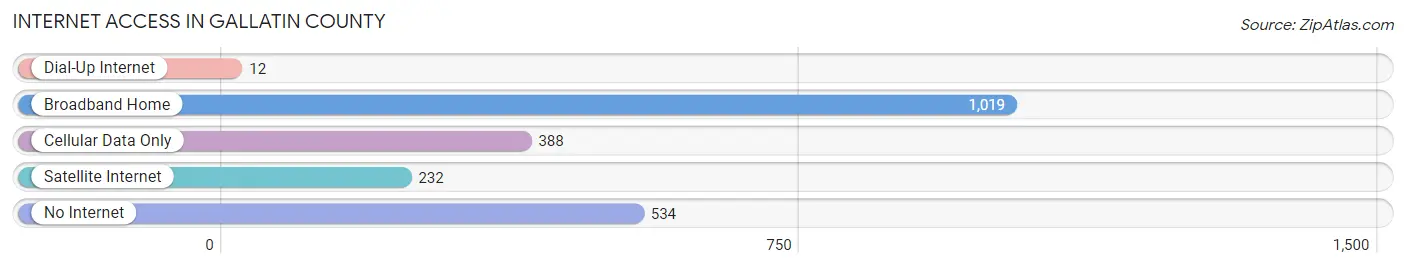
| Internet Type | # Households | % Households |
| Dial-Up Internet | 12 | 0.6% |
| Broadband Home | 1,019 | 47.3% |
| Cellular Data Only | 388 | 18.0% |
| Satellite Internet | 232 | 10.8% |
| No Internet | 534 | 24.8% |
| Total | 2,155 | 100.0% |
Gallatin County Summary
History
The history of Gallatin County, Illinois dates back to the early 1800s when the area was first settled by pioneers. The county was officially established in 1812 and named after Albert Gallatin, the fourth United States Secretary of the Treasury. The county was originally part of Edwards County, but was later divided into its own county in 1812.
The first settlers in the area were mostly of English and German descent. They were attracted to the area due to its fertile soil and abundant natural resources. The first settlers built log cabins and cleared the land for farming. The county was also home to several Native American tribes, including the Shawnee, Kickapoo, and Potawatomi.
The county was an important part of the Underground Railroad, which was a network of secret routes and safe houses used by African-American slaves to escape to freedom in the northern United States and Canada. The county was also home to several Civil War battles, including the Battle of Fort Donelson in 1862.
Geography
Gallatin County is located in the southwestern corner of Illinois, bordering the states of Kentucky and Missouri. The county covers an area of 545 square miles and is home to a population of approximately 8,000 people. The county seat is Shawneetown.
The terrain of the county is mostly flat, with some rolling hills in the northern part of the county. The county is drained by the Ohio River, which forms its western border. The county is also home to several small lakes and streams, including the Little Wabash River, which flows through the county.
The climate of the county is humid continental, with hot summers and cold winters. The average annual temperature is around 50 degrees Fahrenheit. The average annual precipitation is around 40 inches.
Economy
The economy of Gallatin County is largely based on agriculture. The county is home to several large farms, which produce corn, soybeans, wheat, and other crops. The county is also home to several small businesses, including restaurants, retail stores, and service providers.
The county is home to several manufacturing companies, including a paper mill and a furniture factory. The county is also home to several coal mines, which provide jobs for many of the county’s residents.
Demographics
As of the 2010 census, the population of Gallatin County was 8,072. The racial makeup of the county was 97.3% White, 0.7% African American, 0.2% Native American, 0.2% Asian, 0.1% Pacific Islander, 0.7% from other races, and 0.9% from two or more races. Hispanic or Latino of any race were 1.7% of the population.
The median income for a household in the county was $37,945, and the median income for a family was $45,938. The per capita income for the county was $19,845. About 11.2% of families and 14.2% of the population were below the poverty line, including 19.2% of those under age 18 and 8.2% of those age 65 or over.
Common Questions
What is Per Capita Income in Gallatin County?
Per Capita income in Gallatin County is $36,928.
What is the Median Family Income in Gallatin County?
Median Family Income in Gallatin County is $65,833.
What is the Median Household income in Gallatin County?
Median Household Income in Gallatin County is $51,868.
What is Income or Wage Gap in Gallatin County?
Income or Wage Gap in Gallatin County is 37.0%.
Women in Gallatin County earn 63.0 cents for every dollar earned by a man.
What is Inequality or Gini Index in Gallatin County?
Inequality or Gini Index in Gallatin County is 0.56.
What is the Total Population of Gallatin County?
Total Population of Gallatin County is 4,967.
What is the Total Male Population of Gallatin County?
Total Male Population of Gallatin County is 2,498.
What is the Total Female Population of Gallatin County?
Total Female Population of Gallatin County is 2,469.
What is the Ratio of Males per 100 Females in Gallatin County?
There are 101.17 Males per 100 Females in Gallatin County.
What is the Ratio of Females per 100 Males in Gallatin County?
There are 98.84 Females per 100 Males in Gallatin County.
What is the Median Population Age in Gallatin County?
Median Population Age in Gallatin County is 46.9 Years.
What is the Average Family Size in Gallatin County
Average Family Size in Gallatin County is 2.9 People.
What is the Average Household Size in Gallatin County
Average Household Size in Gallatin County is 2.3 People.
How Large is the Labor Force in Gallatin County?
There are 2,304 People in the Labor Forcein in Gallatin County.
What is the Percentage of People in the Labor Force in Gallatin County?
55.8% of People are in the Labor Force in Gallatin County.
What is the Unemployment Rate in Gallatin County?
Unemployment Rate in Gallatin County is 7.8%.